1-510-338-9438 Meeting number (access code) - Grand ...
229
GRAND TRAVERSE COUNTY DEPARTMENT OF HEALTH AND HUMAN SERVICES BOARD 9:00 AM West Bay Beach, a Delamar Resort – Dayclub Room 615 East Front Street, Traverse City, MI 49686 On July 17, 2020 Governor Whitmer signed into effect Executive Order 2020-154. In an effort to reduce the spread of COVID-19 by limiting the number of people at public gatherings, this order suspends the rules and procedures for governmental entities requiring physical presence at meetings and hearings and it temporarily alters the rights of the public to be present at meetings. Due to the Board meeting in a space of 10 or under, a conference phone will be used for public comment and attendance. The Board Chair will announce when it is time for public comment and will give all call-in numbers the opportunity to speak during this time. This meeting will be recorded and saved on upnorthmedia.com and will also be shown on Charter cable channel 189. Conference number for the public Phone: 1-510-338-9438 Meeting number (access code): 126 717 4697 Meeting Password: 33685239 September 25, 2020 AGENDA 1. CALL TO ORDER – 9:00 a.m. Grand Traverse Pavilions – John Rizzo, Chair, Grand Traverse County Department of Health and Human Services Board 2. FIRST PUBLIC COMMENT/INPUT Any person shall be permitted to address a meeting of the Grand Traverse County Department of Health and Human Services Board which is required to be open to the public under the provisions of the Michigan Open Meetings Act, as amended. (MCLA 15.261, et.seq.) Public comment shall be carried out in accordance with the following Board Rules and Procedures: 1. Any person wishing to address the Board shall state his or her name and address. 2. Persons may address the Board on matters which are relevant to Grand Traverse Pavilions issues. 3. No person shall be allowed to speak more than once on the same matter, excluding time needed to answer Board Members questions. The Chairperson shall control the amount of time each person shall be allowed to speak, which shall not exceed three (3) minutes. (1) Chairperson may, at his or her discretion, extend the amount of time any person is allowed to speak. (2) Whenever a group wishes to address the Board, the Chairperson may require that the group designate a spokesperson; the Chairperson shall control the amount of time the spokesperson shall be allowed to speak, which shall not exceed fifteen (15) minutes. 3. COUNTY LIAISON REPORT 4. APPROVAL OF AGENDA 5. CONSENT CALENDAR The purpose of the consent calendar is to expedite business by grouping items to be dealt with by one Board motion without discussion. Any member of the Board, or staff may ask that any item on the consent calendar be removed and placed elsewhere on the agenda for discussion. Such requests will be automatically respected. Page 1 of 229
-
Upload
khangminh22 -
Category
Documents
-
view
0 -
download
0
Transcript of 1-510-338-9438 Meeting number (access code) - Grand ...
GRAND TRAVERSE COUNTY
DEPARTMENT OF HEALTH AND HUMAN SERVICES BOARD 9:00 AM West Bay Beach, a Delamar Resort – Dayclub Room
615 East Front Street, Traverse City, MI 49686
On July 17, 2020 Governor Whitmer signed into effect Executive Order 2020-154. In an effort to reduce the spread of COVID-19 by limiting the number of people at public gatherings, this order suspends the rules and procedures for governmental entities requiring physical presence at meetings and hearings and it temporarily alters the rights of the public to be present at meetings.
Due to the Board meeting in a space of 10 or under, a conference phone will be used for public comment and attendance. The Board Chair will announce when it is time for public comment and will give all call-in numbers the opportunity to speak during this time. This meeting will be recorded and saved on upnorthmedia.com and will also be shown on Charter cable channel 189.
Conference number for the public
Phone: 1-510-338-9438 Meeting number (access code): 126 717 4697
Meeting Password: 33685239
September 25, 2020 AGENDA
1. CALL TO ORDER – 9:00 a.m. Grand Traverse Pavilions – John Rizzo, Chair, Grand Traverse County Department of Health and Human Services Board
2. FIRST PUBLIC COMMENT/INPUT Any person shall be permitted to address a meeting of the Grand Traverse County Department of Health and Human Services Board which is required to be open to the public under the provisions of the Michigan Open Meetings Act, as amended. (MCLA 15.261, et.seq.) Public comment shall be carried out in accordance with the following Board Rules and Procedures: 1. Any person wishing to address the Board shall state his or her name and address. 2. Persons may address the Board on matters which are relevant to Grand Traverse
Pavilions issues. 3. No person shall be allowed to speak more than once on the same matter, excluding time
needed to answer Board Members questions. The Chairperson shall control the amount of time each person shall be allowed to speak, which shall not exceed three (3) minutes. (1) Chairperson may, at his or her discretion, extend the amount of time any person is
allowed to speak. (2) Whenever a group wishes to address the Board, the Chairperson may require that
the group designate a spokesperson; the Chairperson shall control the amount of time the spokesperson shall be allowed to speak, which shall not exceed fifteen (15) minutes.
3. COUNTY LIAISON REPORT
4. APPROVAL OF AGENDA
5. CONSENT CALENDAR
The purpose of the consent calendar is to expedite business by grouping items to be dealt with by
one Board motion without discussion. Any member of the Board, or staff may ask that any item
on the consent calendar be removed and placed elsewhere on the agenda for discussion. Such
requests will be automatically respected.
Page 1 of 229
If any item is not removed from the consent calendar, the item on the agenda is approved by a
single Board action adopting the consent calendar.
A. Review and File HANDOUT#
(1) Minutes of the 9/25/20 Board Meeting 1 (2) Weber Thank You 2 (3) Bagroski Thank You 3 (4) P.E.P. Talk Employee Newsletter – August 4 (5) Media Report – September 5
6. ITEMS REMOVED FROM CONSENT CALENDAR
(1)
7. GRAND TRAVERSE MEDICAL CARE -- Korvyn R. Hansen A. General Information
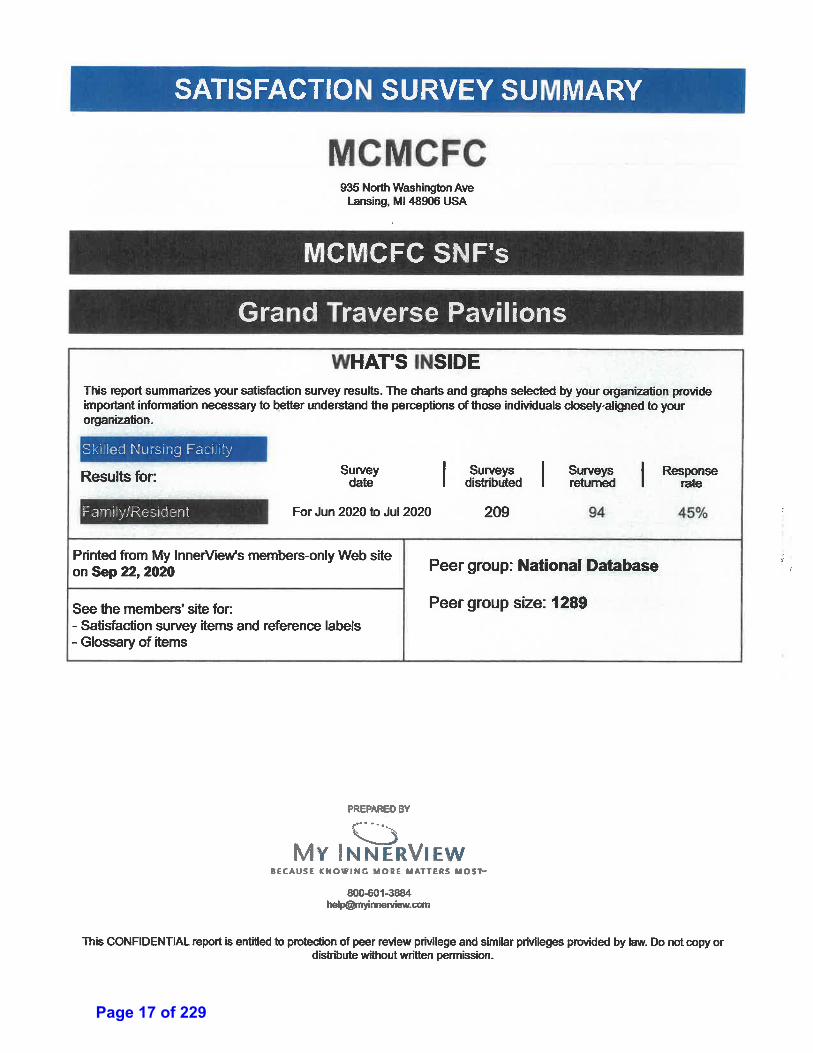
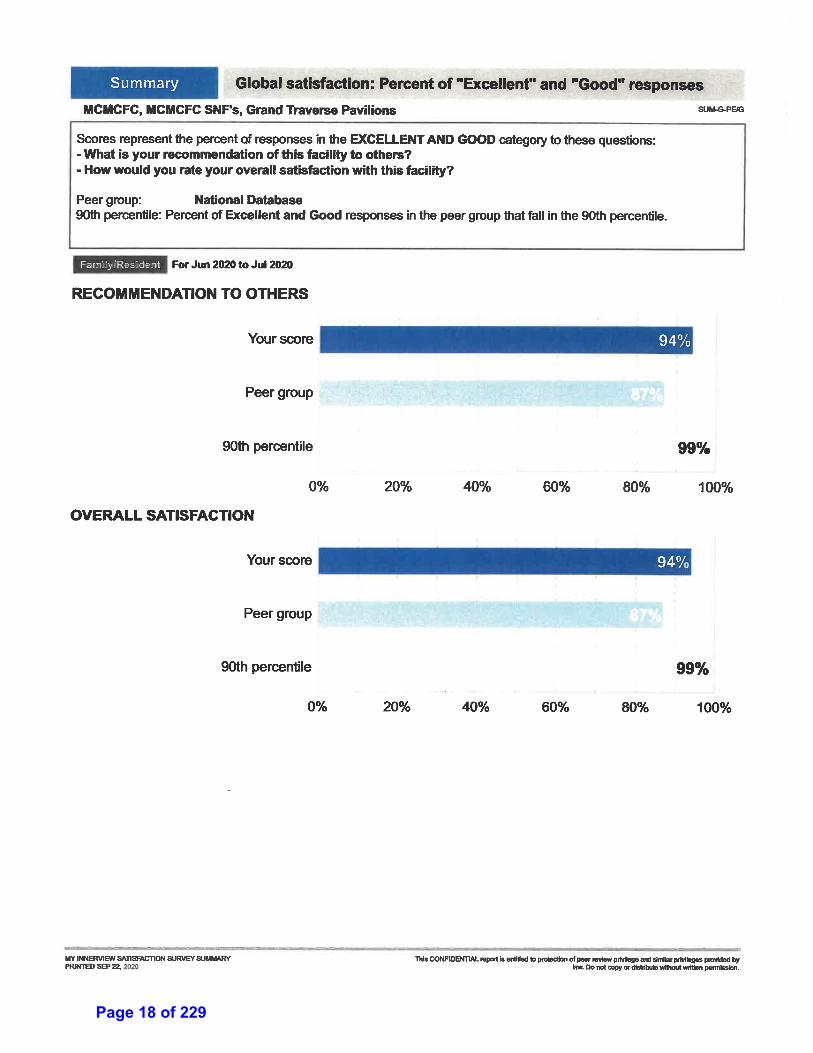
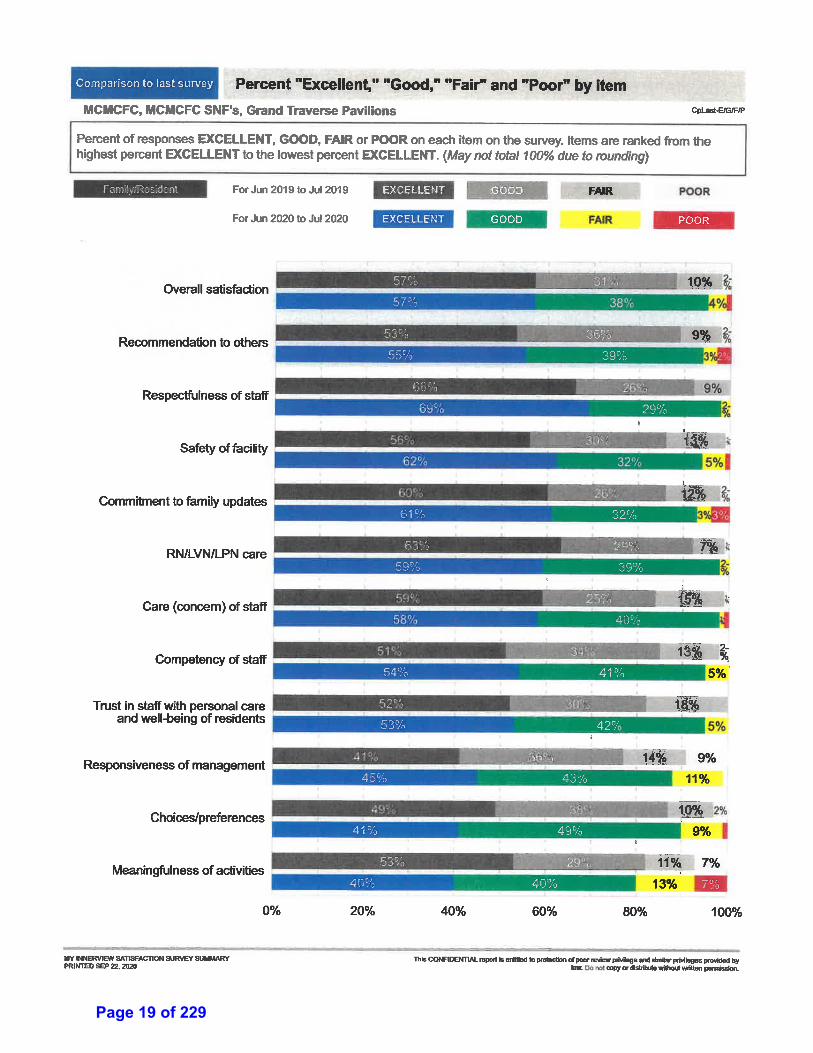
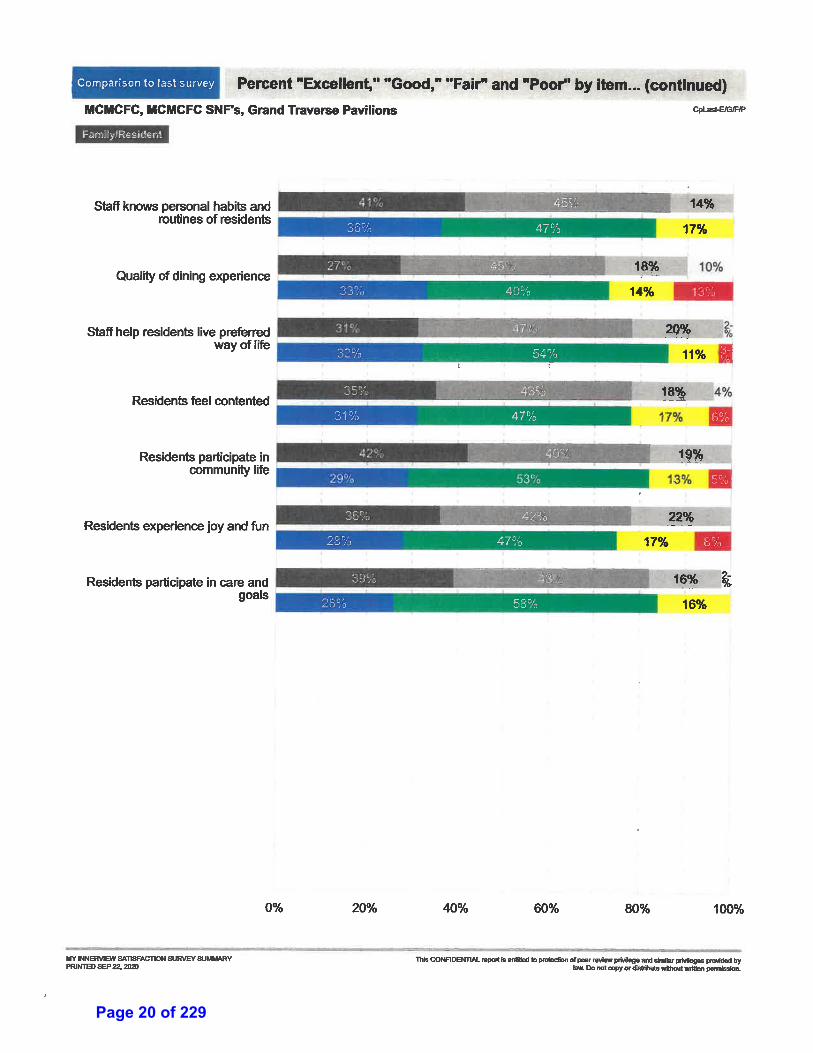
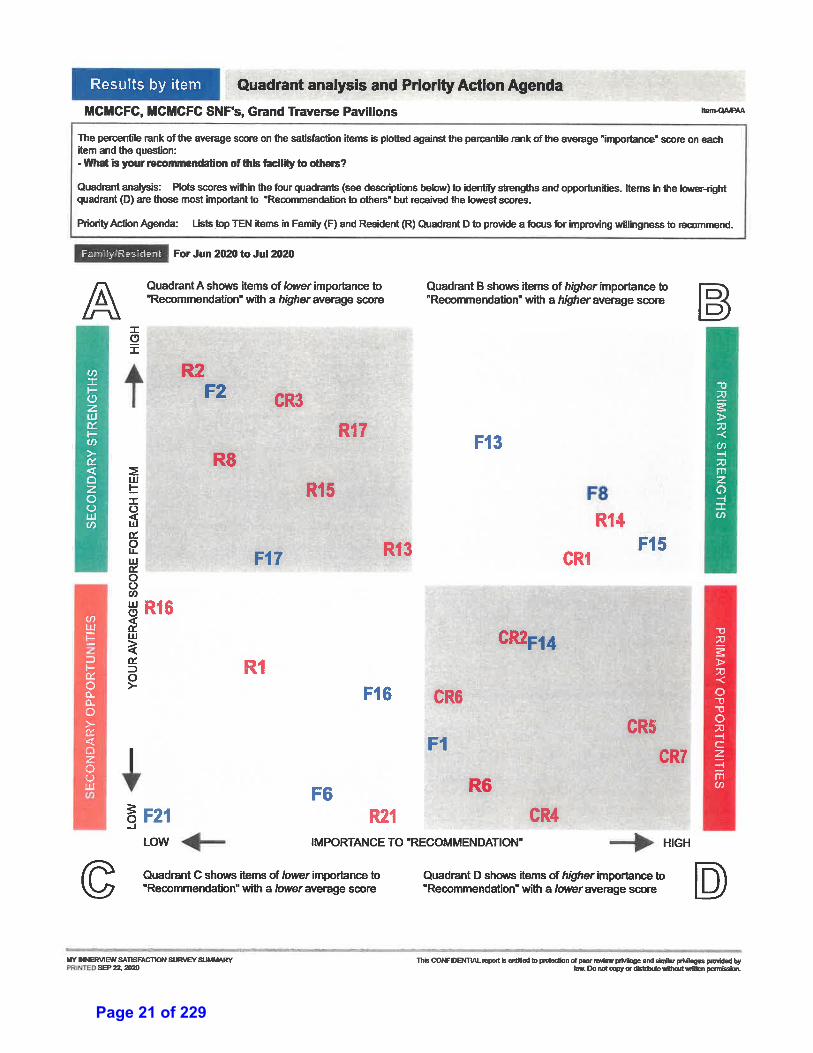
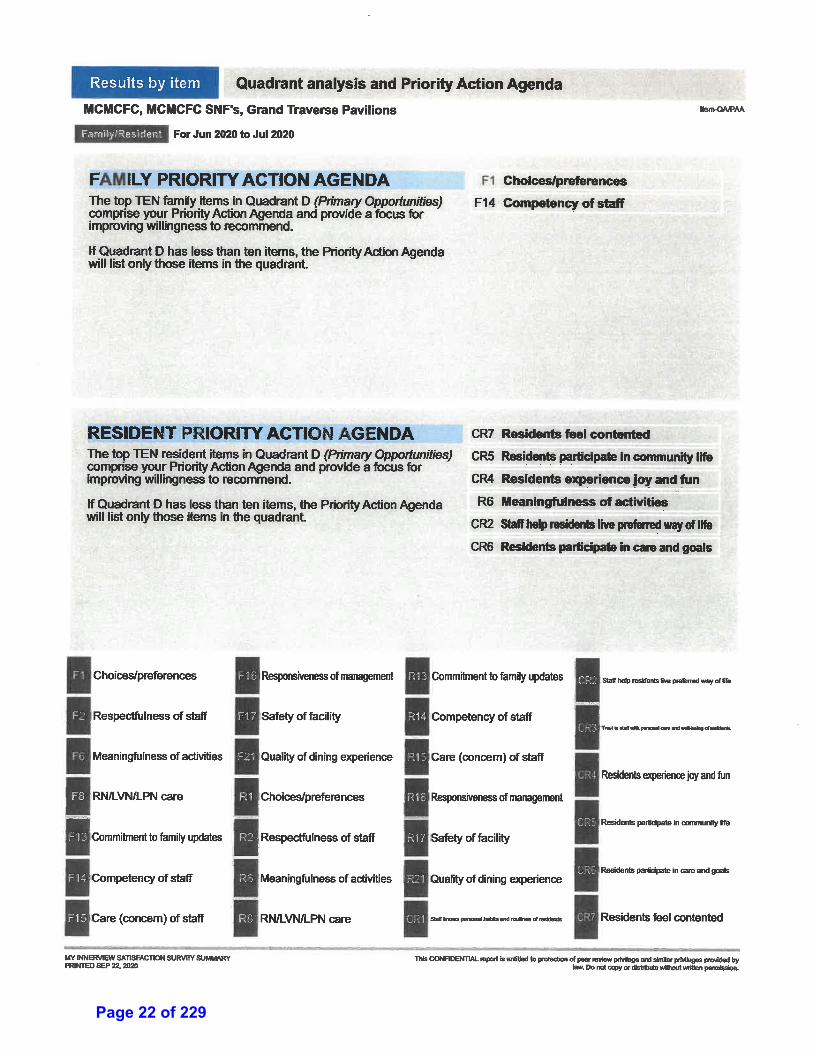
(1) COVID-19 Update 6 (2) Resident/family satisfaction Survey Report 7
B. Chief Executive Officer Board Report 8
C. Business
(1) Pension Bond Resolution 9
(2) Financial Report 10
D. Medical Staff (1)
G.T.P. Announcements
(1) September Service Excellence Award 11
8. SECOND PUBLIC COMMENT/INPUT Refer to Rules under First Public Comment/Input above.
9. CLOSED SESSION
(1)
10. ADJOURNMENT
Page 2 of 229
1
GRAND TRAVERSE COUNTY
DEPARTMENT OF HEALTH AND HUMAN SERVICES BOARD 1000 Pavilions Circle, Traverse City, MI 49684
MINUTES OF THE AUGUST 28, 2020 MEETING PRESENT: John Rizzo, Cecil McNally,Ralph Soffredine Board Kory Hansen, Rose Coleman, Robert Barnes, Lindsey Dood, Darcey Gratton Staff Gordie LaPointe Commission ABSENT: GUESTS: The regular meeting of the Grand Traverse County Department of Health and Human Services Board was called to order at 9:00 am by Board Chair John Rizzo in the Dayclub Room at the West Bay Beach, a Delamar Resort. On July 17, 2020 Governor Whitmer signed into effect Executive Order 2020-154. In an effort to reduce the spread of COVID-19 by limiting the number of people at public gatherings, this order suspends the rules and procedures for governmental entities requiring physical presence at meetings and hearings and it temporarily alters the rights of the public to be present at meetings. Due to the Board meeting in a space of 10 or under, Grand Traverse Pavilions provided a link on its website for public participation. This meeting was recorded and will be saved on upnorthmedia.com and also shown on Charter cable channel 189. Public Comment Andi Gerring Claudia Bruce County Liaison Report – LaPointe shared discussions of the most recent county board of commissioner meetings. Approval of Agenda – Chair Rizzo asked if there were additions, changes or corrections to the agenda. Motion was made by McNally to approve the Agenda as presented, seconded by Soffredine and carried unanimously. The purpose of the Consent Calendar is to expedite business by grouping items to be dealt with by one Board motion without discussion. Any member of the Board or staff may ask that any item on the Consent Calendar be removed and placed elsewhere on the agenda for discussion. Such requests will be automatically respected. REVIEW AND FILE
(1) Minutes of the 7/31/20 Board Meeting (2) Closed Minutes of the 7/31/20 Board Meeting
Page 3 of 229
dgratton
Text Box
1
2
(3) Mullen Thank You (4) P.E.P. Talk Employee Newsletter – August (5) Media Report – July
Motion was made by Soffredine to approve the Consent Calendar as presented. Motion seconded by McNally and carried unanimously. Items Removed From Consent Calendar – none COVID-19 Update – Coleman provided an update on the on-going status of COVID-related topics that affect the operation of the Pavilions. Hansen covered COVID-related relief payments and reimbursement that have been received to date. Reimbursement Update – Hansen shared that CMS issued a final rule that updates the Medicare payment rates and the value-based purchasing program for skilled nursing facilities for FY2021. The aggregate average increase to SNFs for Medicare under the PDPM methodology is 2.2%. Chief Executive Officer Report – Hansen reviewed his monthly report for July and answered board member’s questions. Financial Report – Dood reviewed the financial operations report for July, 2020. Dood outlined revenue and expenses compared to budget for each of the Pavilions’ programs that include the Medical Care Facility (skilled nursing), The Cottages (Assisted and Independent Living) and Adult Day Services. Additional information was provided on respective census and accounts receivable along with the total cash ending balance. Dood summarized the review of vouchers for the month that were in order without exception. The Social Accountability Summary was reviewed indicating the amount of uncompensated care provided and volunteer hours for the month. Motion made by Soffredine to accept the financial operations report as presented. Motion seconded by McNally and carried unanimously. MCACA Grant Submission Resolution 2020 - 2 - Hansen reviewed the Resolution to submit the grant application in the amount of $4,000 from the Michigan Council for the Arts and Cultural Affairs (MCACA) for funding towards the 2021 Concert on the Lawn concert series. Motion was made by McNally to approve the grant application to be submitted in the amount of $4,000 from the MCACA for funding towards the 2021 Concert on the Lawn concert series. Motion was seconded by Soffredine and carried unanimously. Lauren Reynolds, PA - Attending Privileges - Hansen reviewed the request of Lauren Reynolds, PA, to have attending privileges as recommended by Medical Director Dr. April Kirkowski, M.D. Lauren is joining Sound Physicians, to serve nursing homes and assisted living facilities. Motion was made by McNally to approve Lauren Reynolds, PA, for attending privileges, seconded by Soffredine and carried unanimously. Sarah Kristine White, NP - Attending Privileges - Hansen reviewed the request of Sarah Kristine White, NP, to have attending privileges as recommended by Medical Director Dr. April Kirkowski, M.D. Sarah is joining Sound Physicians, to serve nursing homes and assisted living facilities. Motion was made by McNally to approve Sarah Kristine White, NP, for attending privileges, seconded by Soffredine and carried unanimously.
Page 4 of 229
3
Jacob Vaughn White, PH.D - Consulting Privileges - Hansen reviewed the request of Jacob Vaughn White, PH.D, to have consulting privileges for psychology services as recommended by Medical Director Dr. April Kirkowski, M.D. Motion was made by McNally to approve Jacob Vaughn White, PH.D, for consulting privileges, seconded by Soffredine and carried unanimously. Grand Traverse Pavilions Announcements -
(1) July Service Excellence Award - Hansen reviewed weekly winners Public Comment/Input - none Meeting adjourned at 10:00 am Signatures:
John Rizzo – Chair Grand Traverse County Department of Health and Human Services Board
Korvyn R. Hansen, Assistant-Secretary Date: August 28, 2020 Approved Corrected and Approved
Page 5 of 229
Page 6 of 229
dgratton
Text Box
2
dgratton
Text Box
The Record-Eagle - 08/22/2020 Page : B04
Copyright (c)2020 The Record-Eagle, Edition 08/22/2020September 17, 2020 12:54 pm (GMT +4:00) Powered by TECNAVIA
4B Traverse CiTy reCord-eagle Saturday, August 22, 2020food/oBituaries
Elizabeth 'Liz' M. McGrathDied August 18, 2020
PESHAWBESTOWN— Elizabeth "Liz"Marie McGrath, of Pe-shawbestown, diedTuesday Aug. 18,2020, at home,surrounded by herchildren and grand-daughter.
Liz was known forher beautiful smileand her contagious laugh. Sheloved to spend time with herfamily and grandchildren; go-ing to mud bogs, camping andtubing down the river. Sheenjoyed playing bingo, lovedher casino time and going tolisten to her favorite bands, es-pecially Alan Turner, and danc-ing the night away.
Liz held the administrativeassistant position for theGrand Traverse Band HousingDepartment for the last 14years and became more than aworker; she became a lovedand valued member of thecommunity and will be misseddearly.
She is survived by her hus-
band, Paul McGrath,of Peshawbestown;her children, TamraNewton, of Pe-shawbestown, Curtis(Tiffany) Branch, ofGrand Rapids, John(Maria)Steed, of Tra-verse City, SarahSteed, of TraverseCity; grandchildren,
Mariah, Egypt, Jordyn, Kay-den, Ayden, Gunner, Jayden;her "special" grandson, Emit;siblings, Agnes (Charles)Cross, of Goshen, Indiana,Bernice Sineway, of Benzonia,Bertha (Marsh) Spaford, ofDaleville, Alabama, Ginger (Eu-gene) Zambon, of Arbor Vitae,Wisconsin; brother, Fred (Dar-lene) Weissert; and manynieces and nephews.
She was preceded in deathby her parents, John andAgnes Beaver; siblings, JoyceDuford, Bonnie Edinger, JudyKublick, Gerry Pamame, SarahLugg, Nancy Amy, Mike Sper-ling, Clifford Gerou, JohnBeaver and Mose Beaver.
Marian 'Midge' V. RytkonenDied August 12, 2020
CUMMING —Marian "Midge" ViolaRytkonen, 100,passed away,peacefully, on Aug,12, 2020, inCumming, Georgia.
She was born onJan. 1, 1920, to NinaBelle Burley and LeeWyatt, in Finley, Ohio.She lived most of her life inTraverse City, traveling toFlorida during the wintermonths but her last years werespent in Cumming, Georgia.
Marian was passionate aboutpeople, helping others, danc-ing, bowling and lemondonuts.
She joined the Women's Aux-iliary Army Core (WAAC) duringWorld War II, traveling exten-sively as a recruiter and gain-
ing fame by beingphotographed duringa recruitment effort ata Native AmericanReservation.
Consequently, sheproudly served andwas very active at herlocal Veterans ofForeign Wars post.
Midge will be sorelymissed and is survived by hersons, Rusty, Mark, AJ andRobert and their families;grandchildren; and great-grandchildren.
No services are scheduledright now, but in lieu of flowers,we the family, ask that you givegenerously to your local VFW.
Please visitwww.lifestorytc.com to shareyour thoughts and more.
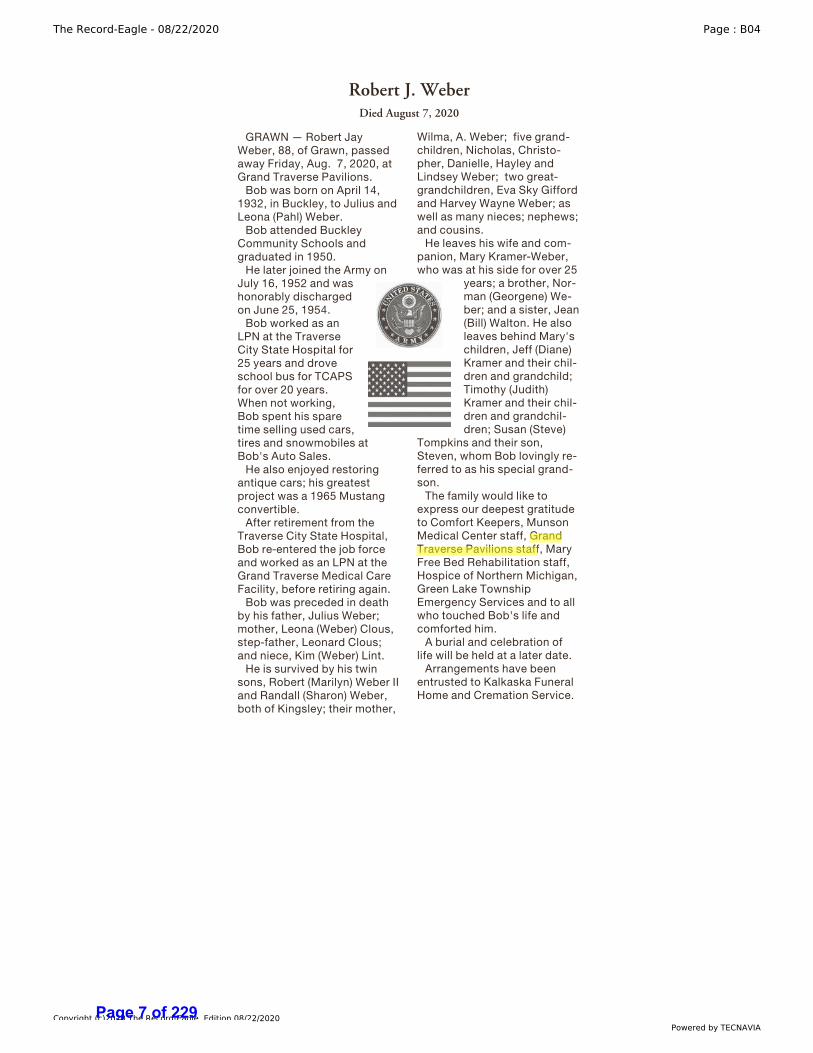
Robert J. WeberDied August 7, 2020
GRAWN — Robert JayWeber, 88, of Grawn, passedaway Friday, Aug. 7, 2020, atGrand Traverse Pavilions.
Bob was born on April 14,1932, in Buckley, to Julius andLeona (Pahl) Weber.
Bob attended BuckleyCommunity Schools andgraduated in 1950.
He later joined the Army onJuly 16, 1952 and washonorably dischargedon June 25, 1954.
Bob worked as anLPN at the TraverseCity State Hospital for25 years and droveschool bus for TCAPSfor over 20 years.When not working,Bob spent his sparetime selling used cars,tires and snowmobiles atBob's Auto Sales.
He also enjoyed restoringantique cars; his greatestproject was a 1965 Mustangconvertible.
After retirement from theTraverse City State Hospital,Bob re-entered the job forceand worked as an LPN at theGrand Traverse Medical CareFacility, before retiring again.
Bob was preceded in deathby his father, Julius Weber;mother, Leona (Weber) Clous,step-father, Leonard Clous;and niece, Kim (Weber) Lint.
He is survived by his twinsons, Robert (Marilyn) Weber IIand Randall (Sharon) Weber,both of Kingsley; their mother,
Wilma, A. Weber; five grand-children, Nicholas, Christo-pher, Danielle, Hayley andLindsey Weber; two great-grandchildren, Eva Sky Giffordand Harvey Wayne Weber; aswell as many nieces; nephews;and cousins.
He leaves his wife and com-panion, Mary Kramer-Weber,who was at his side for over 25
years; a brother, Nor-man (Georgene) We-ber; and a sister, Jean(Bill) Walton. He alsoleaves behind Mary'schildren, Jeff (Diane)Kramer and their chil-dren and grandchild;Timothy (Judith)Kramer and their chil-dren and grandchil-dren; Susan (Steve)
Tompkins and their son,Steven, whom Bob lovingly re-ferred to as his special grand-son.
The family would like toexpress our deepest gratitudeto Comfort Keepers, MunsonMedical Center staff, GrandTraverse Pavilions staff, MaryFree Bed Rehabilitation staff,Hospice of Northern Michigan,Green Lake TownshipEmergency Services and to allwho touched Bob's life andcomforted him.
A burial and celebration oflife will be held at a later date.
Arrangements have beenentrusted to Kalkaska FuneralHome and Cremation Service.
Helene 'June' WhittakerDied August 21, 2020
ELK RAPIDS —Helene "June" Whit-taker, 100, of ElkRapids, passed awayat her home on Aug.21, 2020, with herfamily by her side.
June was born onJune 21, 1920, inMuskegon, to the lateRalph H. and Wadea(Nafe) Cederquist.
June married the love of herlife, James H. Whittaker Jr., onSept. 19, 1941, in St. Johns.They were childhoodsweethearts and united in mar-riage while Jim was on leavefrom the service. Following hishonorable discharge, theymoved from St. Johns toHiggins Lake. Together theyowned and operated the Whit-taker Shady Grove Resort andWhittaker Realty Company for23 years. They were wellknown for their hospitality andmade a lot of lifelong friends atthe resort whom June loveddearly.
After retirement, Jim andJune moved to Elk Rapids,where they have resided forthe last 40 years.
She was a devoted memberof the First PresbyterianChurch of Elk Rapids. Sheloved her church family andgreatly appreciated their con-tinued kindness and friendshipin her later years.
Jim and June traveled exten-sively after retirement and
wintered, at theirhome, in Sedona,Arizona.
June will be greatlymissed by all whoknew her. She trulywas a ray of light to allshe met.
June joins herbeloved husband,Jim, in heaven, who
preceded her in death; alongwith her son, David James; andbrothers, Jack (Shirley) andDavid Cederquist.
June is survived by herdaughter, Sue (Robert) VorBroker; grandchildren, Cynthia(Alan) Dessy, Kurt (Mallory) VorBroker, Scott Whittaker,Deborah (Ken) Camp and Keith(Briana) Whittaker; great-grandchildren, Lauren, Patrick,Benjamin, Brighton, Cielle andBobby; and sister, Mary Alice(Bob) Smith.
Graveside services for thefamily will be held at OakwoodCemetery, in Roscommon, onTuesday, Aug. 25, 2020 at 11a.m.
A memorial service andcelebration of June's life willbe held in June of 2021.
Memorial donations, in lieu offlowers, may be directed to theFirst Presbyterian Church inElk Rapids or to a charity ofyour choice.
Please visit www.reynolds-jonkhoff.com to share yourmemories and condolenceswith the family.
o b i t u a r i e s
To read obituaries online, go to www.record-eagle.com
WASHINGTON (AP) — Sometimes politics gives way to the personal at the White House. It has seen 18 weddings and at least 10 people are known to have died there, including two presidents and three first ladies.
It will serve Friday as a place of mourning for President Donald Trump and his family, with a private memorial service for the president’s young-er brother, Robert, who died last week at 71. The president has described Robert as “not just my brother. He was my best friend.”
Abraham Lincoln and Calvin Coolidge both mourned the loss of a son while serving as presi-dent, Willie Lincoln in 1862 and Calvin Coolidge Jr. in 1924. The memorial services for both children began in the White House.
Unlike Willie Lincoln and Calvin Coolidge Jr., Robert Trump did not live at the White House. Nev-ertheless, it’s completely within the president’s ability to honor him with a service there, said Anita McBride, who served in three presidential ad-ministrations, including as first lady Laura Bush’s chief of staff.
“The White House is a very complex place. It’s an office, it’s a museum and it’s a home,” McBride said. “We loan it to the president for the time he or she is living there. Coming from that per-spective, we need to be understanding of some decisions that they make in a case like this.”
When Trump explained why he wanted to have a
service for his brother at the White House, he said: “I think he’d be greatly honored. He loves our country. He loved our country so much. He was so proud of what we were doing and what we are doing for our country. So I think it would be appro-priate.”
Robert Trump, a busi-nessman, died Saturday after being hospital-ized in New York. The president had visited his brother in the hospital on Friday.
Robert Trump began his career on Wall Street working in corporate fi-nance but later joined the family business, manag-ing real estate holdings as a top executive in the Trump Organization.
“When he worked in the Trump Organization, he was known as the nice Trump,” Gwenda Blair, a Trump family biogra-pher, told The Associated Press. “Robert was the one people would try to get to intervene if there was a problem.”
In the 1980s, Donald Trump tapped Robert Trump to oversee an At-lantic City casino project, calling him the perfect fit for the job. When that project cannibalized his other casinos, though, “he pointed the finger of blame at Robert,” said Blair, author of “The Trumps: Three Genera-tions that Built an Em-pire.”
A Boston University graduate, Robert Trump later managed the Brook-lyn portion of his father Fred Trump’s real estate empire, which was even-tually sold.
White House to host rare memorial
r o b e r t t r u m p
LYNNWOOD, Wash. (AP) — On a warm sum-mer night, two food trucks pulled onto a tree-lined street in a hilltop neigh-borhood outside Seattle. The smell of grilled meat filled the air, and neigh-bors slurped on boba tea drinks. Toddlers, teens, their parents and dogs sat in the grass, chatting behind masks, laughing and mimicking imaginary hugs to stay socially distant while they waited for their food orders.
Long seen as an urban treasure, food trucks are now being saved by the suburbs during the corona-virus pandemic. No longer able to depend on bustling city centers, these small businesses on wheels are venturing out to where people are working and spending most of their time — home.
As food trucks hunt for customers that used to flock to them, they’re find-ing a captive audience thrilled to skip cooking dinner, sample new kinds of cuisines and mingle with neighbors on what feels like a night out while safely staying close to home.
“This is festival season, fun season. All the stuff we typically do as humans, we can’t do anymore,” said Matt Geller, president of the National Food Truck Association. “Walking out to a food truck is a taste of normalcy, and it feels re-ally good.”
YS Street Food Group owner Yuli Shen discov-ered the hilltop Seattle-area neighborhood through Facebook, and she and a friend who runs the Dreamy Drinks boba tea truck went out together re-cently and served custom-ers for three hours.
It’s a change and a relief for Shen. Before the pan-demic, she raked in money by parking at Amazon’s campus near downtown Seattle, where hordes of office workers would line up for lunchtime Chinese rice bowls. By July, she was frantically searching for somewhere to go.
“It’s very hard to find a location to park, and so we have to find a different place and different people. It’s harder to run the busi-ness, but we’re trying,” Shen said.
Weekday lunchtime busi-ness is the bulk of the rev-enue for an average food truck, which may make $800 to $1,200 a day, Geller said. And lucrative appearances at major summer festivals and community events pad-ded them for leaner winter months.
Since stay-at-home orders earlier this year emptied out city centers and can-celed gatherings, many food trucks — like brick-and-mortar restaurants — have gone out of business or aren’t sure when they’ll open again.
Food trucks adjusted their business model as
they headed to the suburbs: They focus on dinner, add-ing kid-friendly options and preparing for larger or-ders. A new neighborhood means being unsure how many customers they’ll get and gambling on how much food to bring. To avoid that, many trucks urge custom-ers to order ahead online.
Geller said the suburban shift has been a boon for food trucks in places like Seattle, Nashville, Tennes-see, and Austin, Texas. He said people in the suburbs have been good at staying connected with neighbors during COVID-19 through Facebook groups, where food truck gatherings are advertised.
B.J. Lofback decided to pivot his Nashville-area food truck and restaurant away from labor-intensive Korean food after laying off most of his staff when business dwindled. He rebranded as Pinchy’s Lobster Co. and now sells lobster rolls, which he can largely prep himself.
Without his usual down-town Nashville lunchtimes and music events, he and other truckers began reaching out to homeown-ers associations in large subdivisions. It’s been such a success, he doesn’t miss the “stressful, expensive” event schedule. Now, he can keep all the money he earns, instead of paying
up to 20% of his revenue in event fees.
“The economics just worked,” Lofback said. “Me personally, I’m hoping that even if a vaccine dropped tomorrow and herd im-munity was accomplished tomorrow, I hope neighbor-hoods still have us out.”
Piroshky Piroshky, a Seattle institution at the iconic Pike Place Market, lost 90% of its brick-and-mortar business when the pandemic hit, operations manager Brian Amaya said.
The bakery pivoted to online sales, home deliver-ies and food truck events. Some events featuring its famous hand pies have been as successful as a modest day in a store. The 28-year-old business is con-sidering adding a second food truck.
“It’s enough to pay our employees and cover the cost of it and make a little bit of revenue for us to keep going,” Amaya said.
The idea was also new to Julie Schwab before she created events that have practically become food truck lore near Lynnwood, Washington, about 16 miles (25 kilometers) north of Seattle.
Business owners ask if it’s true that one truck made $4,000 in one night. She tells them food trucks make between $1,000 to $4,000 a shift. The high school psy-chologist also advises other communities that want in on the food truck circuit.
“You look what’s happen-ing with everybody coming out, and people are get-ting to know each other,” Schwab said, adding that people wear masks and keep their distance. “It’s been really great to build a community despite what’s going on with this pan-demic.”
After hearing how the industry had dried up, Schwab took a stab at organizing an event in June for the only food truck she’d ever tried. Now, she’s scheduling trucks seven days a week and into De-cember.
Thanks to the trucks, Schwab discovered bibim-bap, a Korean rice bowl, and she relishes helping small businesses, many run by people of color.
But there’s been head-aches, too: hours of work scheduling trucks, promot-ing events and responding to neighbors with ques-tions. Occasionally, trucks are late, unprepared or no-shows.
Christine Thai, a hospital program coordinator, was surprised to learn about the food truck scene in her community when she went to one of Schwab’s events recently with her husband and baby. It was a rare out-ing for the family, and she got to enjoy a strawberry matcha latte.
“The suburbs are getting cool because people don’t want to travel anymore,” Thai said.
Saved by suburbs: Food trucks hit by virus find new foodiesf o o d
The Associated Press
Bobby Price, left, and Catherine vogt, right, stand with Catherine’s daughter avery, 8, and their dogs as they wait to order from the ys street Food food truck near the suburb of lynnwood, Wash., north of seattle. long seen as a feature of city living, food trucks are now finding customers in the suburbs during the coronavirus pandemic as people are working and spending most of their time at home.
Page 7 of 229
dgratton
Text Box
dgratton
Text Box
dgratton
Text Box
dgratton
Highlight
Grand TraversePavilionsstaff

Page 8 of 229
dgratton
Text Box
3
P E P T A L K V O L U M E 8 , I S S U E 9 , S E P T E M B E R 2 0 2 0
SEPTEMBER 2020 IN-SERVICES
Due September 30, 2020
Relias: Mandatory – All STAFF: HIPAA Essentials
Relias: Mandatory – All STAFF: COVID-19 Educational Course
Relias: Mandatory – ALL STAFF: All Page and Code Status
Relias: Mandatory – CERTIFIED NURSE AIDES: Range of Motion and Positioning
Relias: Mandatory – LICENSED NURSES: About Stroke
Relias: Mandatory –UNIVERSAL WORKERS: Oral Hygiene: Assisting with Brushing and Flossing
Relias Link: https://gtp.training.reliaslearning.com
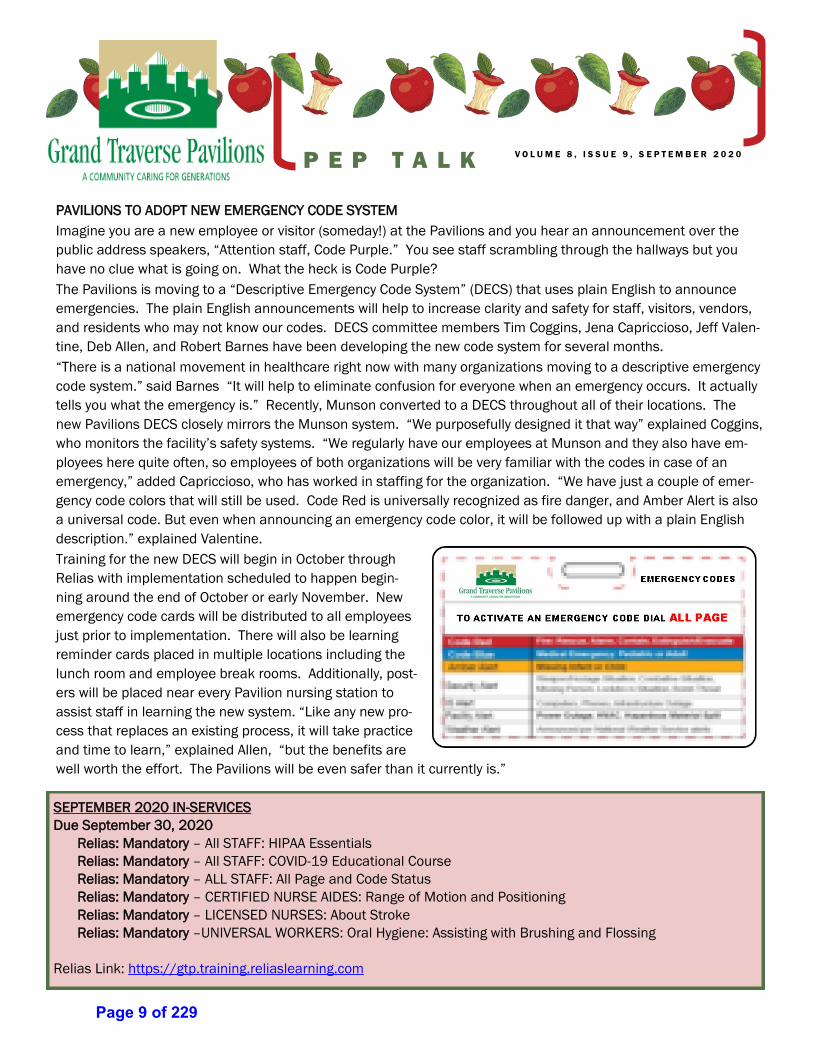
PAVILIONS TO ADOPT NEW EMERGENCY CODE SYSTEM
Imagine you are a new employee or visitor (someday!) at the Pavilions and you hear an announcement over the
public address speakers, “Attention staff, Code Purple.” You see staff scrambling through the hallways but you
have no clue what is going on. What the heck is Code Purple?
The Pavilions is moving to a “Descriptive Emergency Code System” (DECS) that uses plain English to announce
emergencies. The plain English announcements will help to increase clarity and safety for staff, visitors, vendors,
and residents who may not know our codes. DECS committee members Tim Coggins, Jena Capriccioso, Jeff Valen-
tine, Deb Allen, and Robert Barnes have been developing the new code system for several months.
“There is a national movement in healthcare right now with many organizations moving to a descriptive emergency
code system.” said Barnes “It will help to eliminate confusion for everyone when an emergency occurs. It actually
tells you what the emergency is.” Recently, Munson converted to a DECS throughout all of their locations. The
new Pavilions DECS closely mirrors the Munson system. “We purposefully designed it that way” explained Coggins,
who monitors the facility’s safety systems. “We regularly have our employees at Munson and they also have em-
ployees here quite often, so employees of both organizations will be very familiar with the codes in case of an
emergency,” added Capriccioso, who has worked in staffing for the organization. “We have just a couple of emer-
gency code colors that will still be used. Code Red is universally recognized as fire danger, and Amber Alert is also
a universal code. But even when announcing an emergency code color, it will be followed up with a plain English
description.” explained Valentine.
Training for the new DECS will begin in October through
Relias with implementation scheduled to happen begin-
ning around the end of October or early November. New
emergency code cards will be distributed to all employees
just prior to implementation. There will also be learning
reminder cards placed in multiple locations including the
lunch room and employee break rooms. Additionally, post-
ers will be placed near every Pavilion nursing station to
assist staff in learning the new system. “Like any new pro-
cess that replaces an existing process, it will take practice
and time to learn,” explained Allen, “but the benefits are
well worth the effort. The Pavilions will be even safer than it currently is.”
Page 9 of 229
dgratton
Text Box
4

V O L U M E 8 , I S S U E 9 , S E P T E M B E R 2 0 2 0 P A G E 2 P E P T A L K
ATTITUDE IS CONTAGIOUS
IS YOURS WORTH CATCHING?
Calling all Pavilions & Sodexo Employees! Have you been trying to get
healthier? Are you interested in helping your colleagues do the same? Do
you like friendly competition? Join TEAM PAVILIONS in a free, fun, weight-
loss challenge, Win by Losing, sponsored by Blue Care Network. The com-
petition runs from September 21 through November 20, 2020, with a
winner selected based on the team’s total percentage of weight loss at the end of the 9-week challenge. Team
Pavilions will compete against other BCN group customers for the coveted Team Trophy, weekly prizes, and brag-
ging rights. To sign up for the challenge visit the Employee Portal.
Employee Wellness Initiative 2020
Action Step #2: Preventative Dental Visit
Deadline: October 31, 2020
Action Step #3: Complete ONE Option Listed Below
Deadline: October 31, 2020
(1) Participate in a Win By Losing Challenge through Blue Care Network (dates to be announced)
(2) Attend a Wellness Educational Session (dates/times to be announced)
(3) Complete a Wellness Elective course on RELIAS
(4) Participate in 2020 Smart Commute Week—Dates: June 1—June 5, 2020
(5) Attend at least one (1) GTP Wellness Center Class
(6) Participate in a Community Fundraising Event (example: Walk to End Alzheimer’s, 5k walk/run, etc.)
*************************************
************************************* 12 Incredible Health
Benefits of Apples
� Stimulate Weight Loss
� Balance Blood Sugar Levels
� Strengthen Immunity
� Improve Your Eyesight
� Great for Your Teeth and Gums
� Build Stronger Bones
� Give You Energy
� Relieve Muscle Tension
� Improve Fertility in Women
� Improve Cardiovascular Health
� Improve Brain Function
� Incredibly Alkalizing
Page 10 of 229

V O L U M E 8 , I S S U E 9 , S E P T E M B E R 2 0 2 0 P A G E 3 P E P T A L K
THINGS YOU CAN CONTROL
1. Your beliefs
2. Your attitude
3. Your thoughts
4. Your perspective
5. How honest you are
6. Who your friends are
7. What books you read
8. How often you exercise
9. The type of food you eat
10. How many risks you take
11. How you interpret situations
12. How kind you are to others
13. How kind you are to yourself
14. How often you say “I love you”
15. How often you say “thank you”
16. How you express your feelings
17. Whether or not you ask for help
18. How often you practice gratitude
19. How many times you smile today
20. The amount of effort you put forth
21. How you spend/invest your money
22. Ho much time you spend worrying
23. How often you think about your past
24. Whether or not you judge other people
25. Whether or not you try again after a setback
26. How much you appreciate the things you have
Kylie Bennett
Universal Worker
Chris Chargo
Sodexo
Cati Kujawski
ES Admin Secretary Tim Sikovskiy
Sodexo
Welcome
to an
Apple-solutely Great Crop of New Employees!
Discover how you can pursue
your personal dreams and
advance your career at
Michigan.gov/Frontliners
Page 11 of 229
V O L U M E 8 , I S S U E 9 , S E P T E M B E R 2 0 2 0
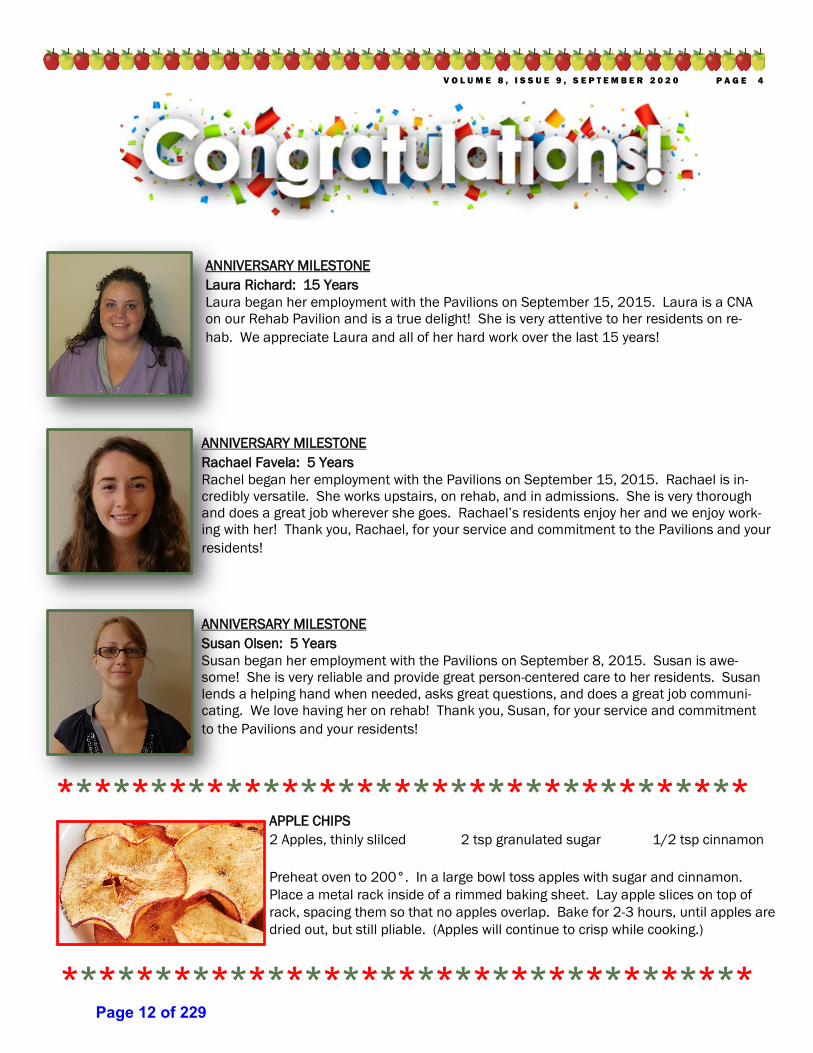
ANNIVERSARY MILESTONE
Laura Richard: 15 Years
Laura began her employment with the Pavilions on September 15, 2015. Laura is a CNA
on our Rehab Pavilion and is a true delight! She is very attentive to her residents on re-
hab. We appreciate Laura and all of her hard work over the last 15 years!
ANNIVERSARY MILESTONE
Rachael Favela: 5 Years
Rachel began her employment with the Pavilions on September 15, 2015. Rachael is in-
credibly versatile. She works upstairs, on rehab, and in admissions. She is very thorough
and does a great job wherever she goes. Rachael’s residents enjoy her and we enjoy work-
ing with her! Thank you, Rachael, for your service and commitment to the Pavilions and your
residents!
P A G E 4
ANNIVERSARY MILESTONE
Susan Olsen: 5 Years
Susan began her employment with the Pavilions on September 8, 2015. Susan is awe-
some! She is very reliable and provide great person-centered care to her residents. Susan
lends a helping hand when needed, asks great questions, and does a great job communi-
cating. We love having her on rehab! Thank you, Susan, for your service and commitment
to the Pavilions and your residents!
APPLE CHIPS
2 Apples, thinly slilced 2 tsp granulated sugar 1/2 tsp cinnamon
Preheat oven to 200°. In a large bowl toss apples with sugar and cinnamon.
Place a metal rack inside of a rimmed baking sheet. Lay apple slices on top of
rack, spacing them so that no apples overlap. Bake for 2-3 hours, until apples are
dried out, but still pliable. (Apples will continue to crisp while cooking.)
*************************************
*************************************Page 12 of 229
August, 2020 Media Report
Broadcast Report:
WTCM-FM:
Wellness Broadcast advertising ran from August 1 - 30, 2020.
Dialysis Services Broadcast advertising ran from August 13 - 30, 2020.
Concerts on the Lawn – Goes Radio Retro Broadcast (gratis) advertising ran from August 3-6, 2020.
Concerts on the Lawn – Goes Radio Retro Broadcast (gratis) advertising ran from August 10-13, 2020.
Concerts on the Lawn – Goes Radio Retro Broadcast (gratis) advertising ran from August 17-20, 2020.
Concerts on the Lawn – Goes Radio Retro Broadcast (gratis) advertising ran from August 24-27, 2020.
WTCM-AM:
Live Read – Wellness Broadcast advertising ran on August 6, 11, 21, and 24 of 2020.
Concerts on the Lawn – Goes Radio Retro Broadcast (gratis) advertising ran from August 3-6, 2020.
Concerts on the Lawn – Goes Radio Retro Broadcast (gratis) advertising ran from August 10-13, 2020.
Concerts on the Lawn – Goes Radio Retro Broadcast (gratis) advertising ran from August 17-20, 2020.
Concerts on the Lawn – Goes Radio Retro Broadcast (gratis) advertising ran from August 24-27, 2020.
WKLT-FM/WBCM-FM:
Wellness Broadcast advertising ran from August 1 - 30, 2020.
Dialysis Services Broadcast advertising ran from August 13 - 30, 2020.
Concerts on the Lawn – Goes Radio Retro Broadcast (gratis) advertising ran from August 3-6, 2020.
Concerts on the Lawn – Goes Radio Retro Broadcast (gratis) advertising ran from August 10-13, 2020.
Concerts on the Lawn – Goes Radio Retro Broadcast (gratis) advertising ran from August 17-20, 2020.
Concerts on the Lawn – Goes Radio Retro Broadcast (gratis) advertising ran from August 24-27, 2020.
WCCW-AM (ESPN):
Concerts on the Lawn – Goes Radio Retro Broadcast (gratis) advertising ran from August 3-6, 2020.
Concerts on the Lawn – Goes Radio Retro Broadcast (gratis) advertising ran from August 10-13, 2020.
Concerts on the Lawn – Goes Radio Retro Broadcast (gratis) advertising ran from August 17-20, 2020.
Concerts on the Lawn – Goes Radio Retro Broadcast (gratis) advertising ran from August 24-27, 2020.
WCCW-FM
Concerts on the Lawn – Goes Radio Retro Broadcast (gratis) advertising ran from August 3-6, 2020.
Concerts on the Lawn – Goes Radio Retro Broadcast (gratis) advertising ran from August 10-13, 2020.
Concerts on the Lawn – Goes Radio Retro Broadcast (gratis) advertising ran from August 17-20, 2020.
Concerts on the Lawn – Goes Radio Retro Broadcast (gratis) advertising ran from August 24-27, 2020.
WJZQ-FM
Concerts on the Lawn – Goes Radio Retro Broadcast (gratis) advertising ran from August 3-6, 2020.
Concerts on the Lawn – Goes Radio Retro Broadcast (gratis) advertising ran from August 10-13, 2020.
Concerts on the Lawn – Goes Radio Retro Broadcast (gratis) advertising ran from August 17-20, 2020.
Concerts on the Lawn – Goes Radio Retro Broadcast (gratis) advertising ran from August 24-27, 2020.
Page 13 of 229
dgratton
Text Box
5
August, 2020 Media Report (CONT.)
Record Eagle:
A Career that Loves you Back.. August 2, 2020.
Concerts on The Lawn – Radio Retro – Jimmy Buffet Tribute August 5, 2020.
Concerts on The Lawn – Radio Retro – The Backroom Gang August 12, 2020.
A Family of Caregivers – Adult Day August 16, 2020.
Concerts on The Lawn – Radio Retro – Dig A Pony: A Beatles Tribute August 19, 2020.
The Convenience of On-Site Dialysis August 23, 2020.
Concerts on The Lawn – Radio Retro – Elvis Tribute Artist Jake Slater August 26, 2020.
Concerts on The Lawn – Radio Retro – Thank you to Sponsors August 30, 2020.
Make it Grand-Parent Video Charity Challenge August 30, 2020.
NorthCoast:
Our team has your back … - Wellness Center August 8, 2020.
The Convenience of On-Site Dialysis August 22, 2020.
Page 14 of 229
COVID 19 Report –September 2020
Testing Results
We are still receiving our COVID results within 48 hours of receipt. We admitted a rehab patient from
Munson this month who was without any symptoms only to be informed after admission that they were
COVID positive. This prompted isolation for this patient and initiated residents weekly testing for 2
weeks. We tested immediately upon learning of the positive COVID status and have tested again on
September 9. Additionally, four staff members were found to be COVID positive with one member
having symptoms and the other three without symptoms. These staff members are unrelated to the
rehab patient admission and with the exception of the two staff members who are roommates, are
unrelated to each other. We completed testing on September 14 and 16 for all staff, SNF residents and
Cottage residents. All tests were negative. Per the requirements we tested all staff and residents on
September 21 and are awaiting results.
Staff Screening
Staff are required to enter the building through the employee tunnel wearing their mask. Employees
have their temperature and photo taken via the thermal camera. If a temperature is outside of the
acceptable range of 94-100 degrees, an alert is sent to the nursing supervisor as well as administration.
An assessment is conducted by nursing at this time. If the temperature is acceptable, the screen on
the thermal camera flashes green. Staff proceeds to the questionnaire kiosk to complete the screening.
Should staff check yes to any symptoms, the system prevents them from completing the screening
process. A nursing assessment is completed at this time as well.
Visitation
We continue with a large volume of electronic visits between the families and their families. Window
visits continue weekly and we are looking at options for when the weather changes. As of now, we
provide golf cart transportation if needed, tents are up at the visit sites and chairs. The State has
published guidance that allows nursing homes to engage in outdoor visits. We are working on the policy
and procedure to offer these types of visits. It is unfortunate that this has taken the State so long to
determine as the weather is turning cooler and we foresee outdoor visits cut short due to dropping
temperatures and snow.
Communication
In addition to phone conferences between families and staff, COVID information and facility happenings
can be found on our website under the Weekly Family Update tab, the Neighborhood News and the
Legacy. In the event that families need to be notified of a positive COVID case a ROBO call is sent out
with information needed and direction to review the facility update page.
Infection Control
Employee and any resident illness is tracked through our infection control processes to ensure that staff
and residents are not exposing otherwise healthy individuals to potential germs. Staff and residents
practice strict hand hygiene. Facility surfaces are disinfected several times daily and as needed. Staff
are continually provided education on infection control practices at work, out in the community, and at
home. Staff are also required to wear eye protection while in the resident areas.
Page 15 of 229
dgratton
Text Box
6
Personal Protection Equipment (PPE)
Currently we have an adequate supply of gowns, face shields and masks. There is a shortage of
gloves in all sizes nationwide. We order continually and sometimes the order is received and others we
are placed on a wait list. We received the additional shipment from FEMA which included masks,
gowns and hand sanitizer. We were not given any gloves as this product ran out prior to distribution to
all facilities. We are (or will be) the recipients of a grant to cover PPE and have been able to place
large orders for masks, goggles and gloves for future use. This will provide a robust inventory through
the influenza season and COVID.
COVID Surveys
We have not had any further COVID Infection Control focused surveys however we are working with
the Quality Improvement Organization as required by CMS on two separate projects. The first project
is regarding antibiotic usage and the second is environmental disinfection practices. This is in its early
stages with no data to report yet. On September 2, during a Facility Reported Incident survey, we
received a citation for isolation procedures. There are conflicting published guidance between the
various regulating bodies regarding admissions and readmissions and the type of PPE that should be
worn. Our policy as a facility, in accordance with the guidance from our medical director, all new
admissions and readmissions were placed in droplet precautions. The state disagreed with this and is
mandating full PPE. This citation resulted in a directed plan of correction per the new CMS
requirements. We are currently working with an approved consultant on the requirements surrounding
a directed plan of correction. As interpreted by MDHHS, all new admissions, readmissions and those
residents who leave the facility for appointments must be quarantined (preferably on the same unit) for
14 days with staff utilizing full PPE regardless of a resident’s COVID status. The Rehab unit is being
utilized for this purpose with three separated areas. One area for admissions/readmissions, one area
for those residents who have left the facility for an appointment and the last area reserved for known
positive COVID residents.
COVID Funding Relief
Since the last board meeting, Grand Traverse Pavilions received a $358,000 distribution from the
Federal CARES Act through CMS, representing the $2.5 billion Phase 1 allocation of Provider Relief
Funds dedicated to Skilled Nursing Facilities. Another $2 billion allocation will be distributed to nursing
homes covering the last four months of 2020 based on infection control incentive outcomes related to
COVID infection and mortality rates. The Pavilions continued to receive reimbursement for COVID-
related costs, including $50,150 from the MDHHS towards the $2/hour wage premium for direct-care
staff; and $52,769 from the MDHHS towards weekly COVID testing administration of residents and
staff. The Pavilions also submitted a $250,000 grant towards PPE through a $25 million grant program
of CARES Act funds made available from the State of Michigan. An additional grant application for
$18,500 was submitted through the Michigan Department of Health and Human Services (MDHHS) for
infection prevention and control equipment. Finally, A Medicare payment advance of $735,000 applied
for back in April, was just approved and distributed in September. The advance payment will be
recouped from future Medicare receipts after 90 days.
Page 16 of 229
Page 17 of 229
dgratton
Text Box
7
Page 18 of 229
Page 19 of 229
Page 20 of 229
Page 21 of 229
Page 22 of 229
September 21, 2020 TO: Grand Traverse County Department of Health and Human Services Board FROM: Korvyn R. Hansen Administrator/CEO RE: August Report Hansen and Rose Coleman, COO-Clinical Services, continue to attend daily/weekly conference calls with Centers for Disease Control, Centers for Medicare and Medicaid, Grand Traverse County, Michigan County Medical Care Facility Council, Leading Age of Michigan and various other entities addressing the issues surrounding the COVID-19 pandemic. On August 4, Hansen attended the Recruiting and Retention committee meeting. Current open positions were identified as 15 CNA, 2 Nurses, 1 Custodians, and 1 Laundry. Universal Worker positions are all filled, however 2 of the UWs will be going back to college in early September. The idea of advertising for open positions on the side of a BATA bus was discussed, as was potentially using a Pavilions bus in the same way. Current media being used for open position advertising is WTCM, WKLT, Record Eagle, Michigan for Hire, The TC Ticker, Facebook, and Instagram. On August 5, Hansen and Holly Kazim, LMSW Dementia Services Director, Social Work supervisor, participated in a webinar with My Innerview to review the report generator features relating to the annual satisfaction survey results. On August 6, 12, 19 & 25, Hansen participated in the state’s Nursing Home Task Force on staffing issues related to COVID. The work groups finding will become part of a larger Task Force report to the Governor. On August 6, Hansen virtually attended the Area Agency on Aging of Northwest Michigan board meeting. On August 20, Hansen and Lindsey Dood, Chief Financial Officer, attended a virtual meeting with representatives of Plante Moran, PLLC (Jon Lanczak, Senior Manager and Megan Schaefer, Senior Consultant) to review analysis based on the cost reports filed for 2019 including projected rates and comparative costs. Also discussed report estimating the Medicaid reimbursement resulting from funding the pension plan with bond proceeds and proposed changes to the reimbursement system that could negatively impact the projected benefits.
Page 23 of 229
dgratton
Text Box
8
2
On August 24, Hansen and Allen met along with members of the Foundation Investment Committee. Huntington Bank representatives attended to provide an update on Foundation investment performance for the first half of 2020. On August 31, Hansen, Dood, Coleman, Robert Barnes, COO-Support Servivces, and Diane Mallory, Human Resources Director, met to review various COVID-19 related grant opportunities, develop an action plan for compiling the information necessary to apply for the grants and prepare a plan for spending grant funds to maximize resident outcomes and staff satisfaction. The monthly Safety Committee meeting was held on August 11. Mallory presented a summary of July’s employee incident/ accident statistics. There were 6 employee incidents during July. There were 89 restricted days and 2 lost time days. On August 3, Deborah Allen, Chief Development and Community Engagement Officer and Kory Hansen, Administrator/CEO for Grand Traverse Pavilions attended the funeral service for long time Pavilions supporter and Foundation Board Member Emeritus, Clara McManus. Clara passed away earlier this year in Florida. Plans were to celebrate her life this past May, but due to COVID-19 restriction the ceremony was postponed to early August. On August 3, Allen and Jessi Weir, Development/Marketing Assistant held a final production meeting with TV 9&10 Marketing Director, Michael Ramsey to discuss the launch of the “Make It Grand-parent Video Charity Challenge” on their Facebook and event platform. On August 7, Allen, Weir and Jena Capriccioso, Development/Marketing Administrative Assistant conducted a phone conference meeting for the Foundation Annual Events Committee. The status of the Concerts on the Lawn Goes Radio Retro and plans for the “Make it GRAND-Parent Video Charity Challenge” were vetted and shared with the committee. On August 11, Allen and Weir met with Jean Derenzy and Downtown TC staff Nick Viox, and Katy McCain to review plans for the Make It GRAND event and to request a $500 donation for the event to match PNC’s $500 contribution for the event to give a GRAND ($1,000) value of Downtown TC gift certificates. The proposals was well received and the staff was able to focus on a more robust promotional effort. On August 11, Hansen, Allen, Barnes, Tim Coggins, Environmental Services Director and Darcey Gratton, Administrative Services Director, reviewed plans for the re-installation of the “To Every Season” Sculpture that was originally dedicated to the Grand Traverse Medical Care Facility. On August 13, Allen submitted the Make it Grand Press Release to the media. On August 13, Allen prerecorded an interview with TV9&10 Anchor for “The Four” to feature the Make it Grand-Parent Video Charity Challenge in partnership with PNC Bank, 9&10 News, and Grand Prize sponsor Downtown TC. On August 14, “The Four” on TV 9&10 featured the Make it Grand promotion.
Page 24 of 229
3
On August 19, Allen was the scheduled presenter for the Bay Area Senior Advocates (BASA) meeting to offer an update on the Pavilions response to COVID-19 and to share information on the Make it Grand event. On August 20, Allen pre-recorded that final “Thank you” interview for the 2020 Concerts on the Lawn Goes Radio Retro Concert season to air on Thursday, August 27, 2020. On August 21, Allen virtually attended the Association of Fundraising Professionals of West Michigan Board meeting. All internal volunteer activity continued to be suspended during August. One hundred and eight three (183) letters were sent to Pavilions volunteers to recruit individuals who would be willing to send notes, messages and letters of good will to Pavilions residents during the pandemic. The total Social media post reach for August was 9,956 individuals. There were 21 “Page Followers” in August. The Facebook announcement featured on August 17: “On Sunday, August 16, 2020 Roseada Bagroski celebrated her 100th birthday here on our Birch Pavilion with her family on the other side of the window!” Had a reach of 2,338 people and 16 shares with an engagement of 836. The Facebook post featured on August 24: “Grand Traverse Pavilions is hiring!! Join the team of Nurses, Certified Nurse Aides, Universal Workers, Custodians and Laundry Service Staff and improve the quality of life for seniors in our community!” had reach of 294 and had 96 engagements. Grand Traverse Pavilions Website received 13,652 visitors (page views) for the month of August. Employment Opportunities page views totaled 1,131 for the month of August. Coleman continues to lead and facilitate the Incident Command Team in efforts to prevent the spread of COVID 19 to our facility. Part of August was spent with the core team comprised of Coleman, Kristen Packard, Director of Nursing, Holly Kazim, Dementia Assessment Coordinator/Social Worker Supervisor, Dan Butler, Director of Information Systems, and Emily Ball, Financial Management Assistant setting up KPI Dashboards through Netsmart. This module will allow staff to monitor key indicators through the electronic medical record system, MyUnity. On August 17, Coleman and Amy Coneset, Wellness Center Director, met with Dr. Jacob White neuropsychologist to review potential services to the Pavilions. In August, there were five facility reported incidents. Throughout the month of August, we had 58 admissions, including re-admissions from Munson Medical Center. Two of those admissions were admitted from our waiting list and one was admitted from our continuum of care. We received 118 referrals from Munson and 6 from other hospitals in the surrounding area. Four of our Rehab Center residents transferred up to long term care.
Page 25 of 229
4
In the month of August there were 57 discharges. Thirty – two residents were discharged to home, 20 to Munson, and 5 residents passed away. There were nine Medical record requests completed in the Month of August for Blue Cross and Blue shield of Michigan and Priority Health PPO insurance, Aetna Medicare advantage, various long-term care insurance carriers and individual record requests. Holly Edmondson, Clinical Case Manager, actively participates in the Incident Command Team as the organizations Infection Preventionist, maintaining daily pre-admission screening for all potential admissions, COVID-19 daily timeline and employee health screening, monitoring and follow up. In August this also included assisting the ICT with resident testing on August 7 and staff COVID-19 required testing on August 3, 10, 17, 24 and 31. The daily interdisciplinary team meetings continue to benefit all involved with discussions of current issues involving resident care in the last 24 hours or 72 hours over a weekend/Holiday. Topics reported include the following: falls, skin incidents, abnormal blood sugars, weight loss, behavioral issues, pressure ulcers, and any other pertinent issues. With each meeting new and current issues with residents are discussed and reviewed and new information is shared. In-services for August include: All Staff: All Page and Code Status, Understanding Alzheimer’s disease and Dementia and In-Person Annual Clinical Skills Competency. Licensed Nurses: Waived Testing: Hemoccult, Uristix, Blood Glucose. Certified Nurse Aides: Safe Transfers. Universal Workers: Assisting with Dressing. Jamie Wilson, Director of Certified Nurse Aids and Katy Leach, Staff Development Coordinator, continue the employee monitoring system with 15 visits to staff that are systematically followed up with during their first 3 months of employment or on an as needed basis. Staff Development created and distributed daily COVID-19 updates, assisted with weekly COVID-19 testing for staff and residents, and created COVID Education for all staff members. In-Person Annual Clinical Skills Competency Evaluations we held for all nurses with the following skills: Handwashing, Isolation, CPR Drill/All Page, Tracheostomy Care, CPAP Machine, Nebulizer Machine, Wound Vac, and Waived Testing: Blood Glucose Machine, Uristix, Hemoccult. All of the in-house clinics in the nursing home were cancelled in August. Restorative and Functional maintenance program monitoring continued including daily Restorative program documentation by the Certified Nurse Aide (CNA) or therapist completing the program. In lieu of Group Exercise, Therapists have been doing Restorative programs and 1:1 exercise programs. Quality Assurance (QA) Studies Completed for August included; monitoring medication storage/ refrigerators, call light response times, infection control and prevention, Nurse All Page system and Independent Safety of Resident. Packard and nursing administration continue to complete weekly COVID-19 testing for
Page 26 of 229

5
staff and residents. In addition, we are completing testing for 48 providers and vendors that are regularly inside the building. A flu vaccine clinic has been scheduled for October 27. Resident rosters have been provided to the ADON’s and letters with consents have been mailed to families. Yearly labs for creatinine clearance are to be obtained shortly in preparation for potential Tamiflu dosing. We continue to condense the admission process and work towards having more nurses familiar with completing admissions. At this time, we are trialing splitting the admission process between CQI and the floor nurses. The sections were divided in a way as to give the nurse a better overview of their new admission while allowing the CQI nurse to build the electronic medical record (EMR) chart while keeping in mind facility policies and the individual needs of each patient. James Hunter Dietary Manager participated in the Nursing Home Task Force Quality of Life workgroup. This committee proposed 13 different recommendations for improved quality of life for our residents including a return to a small level of communal dining for the residents and some small group social gathering activities. It is hopeful that these efforts will lead to a better food consumption experience for snacks and all meals in the near future. Life Enrichment staff continue assisting residents on the pavilions with individual social visits, manicures, reading, playing board games, writing letters and more. During the month of August, Kari Belanger, Linda Burton and Holly Kazim saw approximately 7-8 residents a day (all pavilions, Monday-Friday) to assist them in video chatting with their family members either by FaceTime, Google Duo, Facebook Messenger or ZOOM. In August, we had 227 social video chat visits with family members, 6 video chat visits included hospice visits, court appointments, telehealth, funerals, attorney visits, and counseling appointments with Community Mental Health, and a palliative care consult. Kari worked with IS and the Rehab Department in setting up an iPad (with FaceTime and Google Duo) so that the therapy staff can have a session(s) with Rehab residents and their family members prior to discharging home. Family members continue to contact their pavilion social worker or the recreational therapists to schedule the video chat. Residents continue to share that they are enjoying staying in touch with their family members this way. We have also assisted in celebrating birthdays over video chats. Kari Belanger continues to work on one of the two self-study programs through EVOLVE, that is facilitated by The Eden Alterative. This platform was developed in light of the Eden International Conference that was cancelled in April due to the coronavirus, as a way to offer educational classes for conference compensation. Currently, two classes are being offered with a third class to be launched in August or September. The weekly Prize Bingo continues to be successful for the residents, as approximately 9-13 residents winning each week by utilizing the Osborn Visual Solutions (OVS) television channel. Residents have asked to continue this way of playing bingo even when the COVID restrictions are lifted and they are able to play their beloved game in a group setting again.
Page 27 of 229
6
Social services handed out 36 discharge surveys in August. On August 7, Kazim facilitated telemedicine rounds with Dr Engel. On August 13 and 27, Kazim facilitated Palliative Care rounds with residents. August resident council did not take place however social workers met with residents individually to check in and completed minutes. August family council also did not take place. Social workers continue to conduct follow up phone calls to discharged patients on the rehab pavilion, to proactively reduce hospital readmissions 30-days post-discharge. The Wellness Center saw the following patients this month: Medicare A: 47; Medicare B: Outpatient: 36; Medicare B: Inpatient: 21; Private Insurance: Outpatient: 4; Private Insurance: Inpatient: 4; Work compensation: Outpatient: 0; Private pay: Outpatient: 0; Private pay: Inpatient: 0. Auto: Outpatient: 5; Auto: Inpatient: 1. For the Cottages in August, there were 2 admissions, 4 respite stays, 3 in-house transfers, 5 discharges, and 2 deaths. Ten information packets were mailed and four were handed out. Nurse Practitioner Beth McNutt visited The Cottages on August 4, 11, 18, and 25 with a current case load of 39 patients including, 2 newly acquired in August. A Foot Clinic was held on August 12 with 32 residents participating by individual appointments. Cottage resident meetings resumed in August, one was held at each cottage on separate dates. Residents were able to share suggestions with the Dietary Director. The Adult Day Program had regular participants 3 days a week with 1 new participant enrolled, and 1 information packet was mailed.
On August 4, Dood participated in a call with Roger Swets, Member, Dickinson Write, Warren M. Creamer III, Managing Director-Public Finance, Robert W Baird and Steven Burke, CFA, President, MFCI, LLC to discuss the moving forward to develop an actionable presentation on pension bonding for the DHHS Board and County Board of Commissioners for consideration. On August 21, Dood participated in a conference call with Provinet representatives to review their preliminary assessment of the Pavilions financial configuration of myUnity and the estimated effort to change that configuration to enable the Pavilions to bill all payers using the software. On August 28, Dood participated in another conference call with Provinet representatives. Financial Management staff have reviewed Provinet’s reconsidered opinions and provided details on current process, developed project objectives and requested proposal for assistance in achieving objectives. Objectives identified included dashboard functionality, in source billing, create electronic closing process, receive recommendations on electronic PO and AP approval software and related GL software, electronic cash receipts posting and other process efficiencies as the department prepares for future retirements.
Page 28 of 229
7
On August 26, Dood attended training on the myUnity Dashboard. On August 5, 12 and 19 Dood attended the Safe and Calm webinars by Leading Age. During August, the Descriptive Emergency Call System Committee met to finalize plans for the roll out, tentatively scheduled for September. The committee consists of Jeff Valentine/Residential Services Coordinator, Jena Capriccioso/Marketing Development Administrative Assistant, Tim Coggins/Environmental Services Director, Deb Allen/Chief Development and Community Engagement Officer, and Robert Barnes/COO-Support Services. Capriccioso has been instrumental in developing all the presentation materials needed for the rollout. A review of the new DECS will be presented to the executive staff at the September meeting. On August 6, Barnes attended a Leading Age webinar. A federal judge has struck down several DOL regulations in the FFCRA. Interpretations should be coming out in early September to see if there will be any impact on the Pavilions. During August, the new temperature monitoring system worked very well. It is much quicker than the previous hand held process was. Also, if an employee temperature reading does not fall within the set parameters of the system, a photo of that employee is immediately sent to Nursing Administration and the employee will be evaluated for further determination. On August 25, D. Mallory and R. Barnes attended a Zoom meeting with Smartlinx new Customer Service Manager Xanthia Ellis. After reviewing the needs of Pavilions for employee performance management evaluations, Mallory, Ellis and Barnes all agreed that the Smartlinx performance evaluation module will work for the Pavilions. Ellis will submit a quote to the Pavilions within the next two weeks. Joshua Chubbs, Information Systems Intern, has been working on a new ticket tracking system. This system will allow staff to submit a ticket, track the work being requested and even communicate with the department. This will allow for future troubleshooting and potentially create a knowledge base for end users to use to troubleshoot their own issues. A total of 16 external interviews were scheduled for the month of August. Of the 16 external interviews scheduled in August, 5 individuals were extended conditional offers of employment. Recruitment is underway for the following open positions: 24 CNA; 5 Licensed Nurse; 8 Universal Workers; 2 Child Care; 2 Lauderers and 1 Custodian. Five employees were hired in August. Four (4) New Employee Orientations were held and included 2 Custodians, 1 CNA, 1 Physical Therapist and 1 UW. (78) people have been hired in 2020. In August, Pavilions job opportunities were posted on Michigan4Hire, Awesome Job Alert, Michigan Talent Bank, Black Diamond Broadcasting, Pure Michigan Talent, LinkedIn, Craigslist, Leelanau Enterprise and Indeed.
Page 29 of 229
8
There were 71 applications received in August. Up from 61 in July and up from 57 in June. For the month of August, there were a total of 18 terminations. Of those 18 terminations, 15 were voluntary and 3 were involuntary. There have been 112 terminations in 2020. In the month of July, the CNA Bonus Program yielded payments of $50.00 to 27 CNAs; $100.00 to 2 CNA’s; $150.00 to 17 CNAs that met the requirements. There was one employee referral received through our Employee Referral Bonus Program. To date we have paid the bonus to 35 employees for referring individuals and we have distributed 12 $25 gift cards for referring an applicant who were not considered for employment. In August, 44 employees utilized the Beech Gym. The maintenance team completed 706 separate work orders during June. Additionally, there were 40 wheelchair work orders completed. The monthly fire drill for the main building was August 22 at 6:00 PM. For the Cottages, fire drills occurred August 25 at 10:00 for Evergreen, August 6 at 4:00 PM for Hawthorn and August 19 at 7:00 PM for Willow. There were no actual fire codes in August. There were 56 room preparations at the main building. Of the main building preparations, 47 were for Rehab and 9 were from units Aspen through Elm. In addition, there were 3 room preparations at the cottages due to room vacancies from discharges and residents moving between rooms. During the month of August, there were 116 appointment bus runs and 2 group bus runs. On August 4, Tim Coggins, Environmental Services Director, met with Ashley Curtis of the Grand Traverse Health Department to perform the annual inspection on the therapy pool. There were no issues with the inspection. Ashley also commented that our pool is one of the best that she has inspected. On August 5, Coggins met with Joe Berry, Grand Traverse County Facilities Director, to review the preventive maintenance / work order software they are using for their operations. They are using a software called MVP Plant. We are looking at options to use for our maintenance techs that will be more efficient and accurate than the system we are using now.
Page 30 of 229
4834-6357-6523 v1 [90129-4]
GRAND TRAVERSE COUNTY
DEPARTMENT OF HEALTH AND HUMAN SERVICES BOARD
(Grand Traverse County, Michigan)
RESOLUTION NO. ______
RESOLUTION TO AUTHORIZE ACTIONS WITH RESPECT TO
PENSION BONDS
Minutes of a regular meeting of the Grand Traverse County Department of Health and
Human Services Board, Grand Traverse County, Michigan, held on September ____, 2020, at
_____ p.m., local time.
PRESENT: Members:
ABSENT: Members:
The following resolution was offered by Member ____________________ and supported
by Member ____________________:
WHEREAS, the Grand Traverse County Department of Health and Human Services Board
(the “Board”) deems it to be in the best in interest of the Grand Traverse Pavilions (the “Pavilions”)
for the County of Grand Traverse (the “County”) to issue its limited tax general obligation bonds
(the "Bonds") to finance part of the cost of the Pavilions’ unfunded pension liability for its defined
benefit plan retirement program as authorized by Section 518 of Act 34, Public Acts of Michigan,
2001, as amended (“Act 34”);
WHEREAS, the issuance of the Bonds would significantly fund Division 41 and Division
43 of the defined benefit retirement plan, providing assurance to the participants in such divisions
of their pension benefits thereunder;
WHEREAS, Act 34 requires the preparation of a comprehensive financial plan and other
actions and certain certifications prior to filing an application with the Department of Treasury for
approval for the issuance of Bonds;
WHEREAS, a comprehensive financial plan has been prepared pursuant to Section 518(5)
of Act 34 (the “Comprehensive Financial Plan”) and presented to the Board; and
WHEREAS, the Board has reviewed the Comprehensive Financial Plan and desires to
approve and recommend the Comprehensive Financial Plan to the County, along with a request
that the County consider issuance of the Bonds for the benefit of the Pavilions.
Page 31 of 229
dgratton
Text Box
9
4834-6357-6523 v1 [90129-4]
NOW, THEREFORE, BE IT RESOLVED that:
1. The Board finds that the issuance of the Bonds would be in the best interests of the
Pavilions, hereby approves the form of the Comprehensive Financial Plan as presented to the
Board, with such additions, completions and changes as may be approved by any officer of the
Pavilions and recommends it to the County Board of Commissioners for consideration.
2. The Board requests that the County consider undertaking the issuance of the Bonds
for the purpose of providing funding to Division 41 and Division 43 of the defined benefit
retirement plan and proceed with such actions as are required for that purpose.
3. The officers of the Pavilions are authorized and directed to take all necessary
procedures required to assist in the issuance of the Bonds, should the County determine to proceed.
Such officers, or any one or more of them, are authorized to execute any documents or certificates
necessary to effectuate such issuance.
4. All resolutions and parts of resolutions insofar as they conflict with the provisions
of this resolution be and the same are hereby rescinded.
YEAS:
NAYS:
ABSTAIN:
RESOLUTION DECLARED ADOPTED.
CERTIFICATION
I hereby certify that the foregoing is a true and complete copy of a Resolution adopted by
the Grand Traverse County Department of Health and Human Services Board at a regular meeting
held on September ___, 2020 and that the public notice of the meeting was given pursuant to
Act 267, Public Acts of Michigan, 1976, as amended.
Dated: September ___, 2020
Page 32 of 229
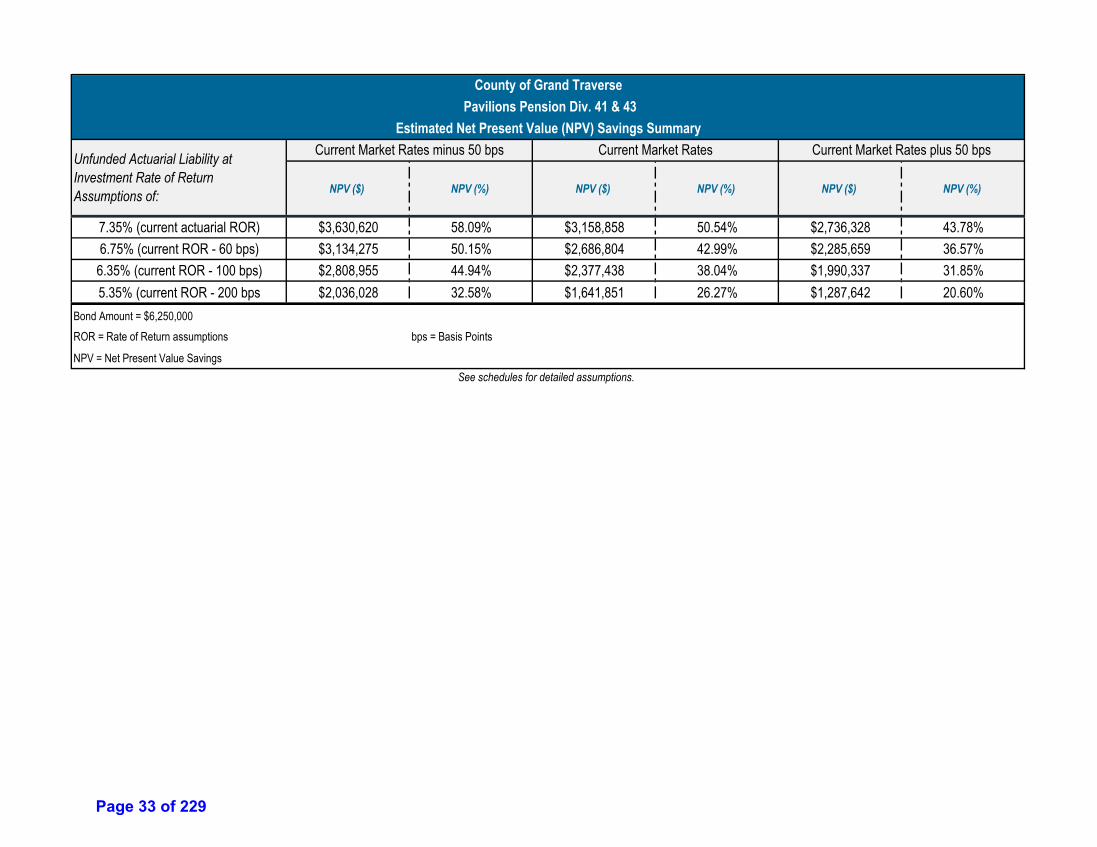
NPV ($) NPV (%) NPV ($) NPV (%) NPV ($) NPV (%)
7.35% (current actuarial ROR) $3,630,620 58.09% $3,158,858 50.54% $2,736,328 43.78%6.75% (current ROR - 60 bps) $3,134,275 50.15% $2,686,804 42.99% $2,285,659 36.57%6.35% (current ROR - 100 bps) $2,808,955 44.94% $2,377,438 38.04% $1,990,337 31.85%5.35% (current ROR - 200 bps $2,036,028 32.58% $1,641,851 26.27% $1,287,642 20.60%
Bond Amount = $6,250,000ROR = Rate of Return assumptions bps = Basis Points
NPV = Net Present Value SavingsSee schedules for detailed assumptions.
County of Grand Traverse Pavilions Pension Div. 41 & 43
Estimated Net Present Value (NPV) Savings Summary
Unfunded Actuarial Liability at Investment Rate of Return Assumptions of:
Current Market Rates minus 50 bps Current Market Rates Current Market Rates plus 50 bps
Page 33 of 229
Grand Traverse County - Comprehensive Financial Plan
Grand Traverse County State of Michigan
Comprehensive Financial Plan for
Pension Bonds (Grand Traverse Pavilions)
October 6, 2020
Page 34 of 229
Grand Traverse County - Comprehensive Financial Plan
Table of Contents
Introduction ....................................................................................................................................................... 1
Application Requirements ............................................................................................................................... 2
Municipal Securities .......................................................................................................................................... 3
Application Documentation, Review and Consideration ........................................................................... 4
Letter Regarding Qualifying Statement ......................................................................................Appendix A
Notice of Intent Resolution .......................................................................................................... Appendix B
Legal Debt Margin ......................................................................................................................... Appendix C
Debt Statement ............................................................................................................................. Appendix D
Direct Debt Detail ......................................................................................................................... Appendix E
Estimated Bond Sizing and Debt Service Calculations ............................................................ Appendix F
Standard & Poor’s Rating Report Dated October 24, 2019 ................................................... Appendix G
Post-Retirement Medical Plan Accounting Report Dated December 31, 2019 .................. Appendix H
Pension Plan Actuarial Report Dated December 31, 2019 ...................................................... Appendix I
Pension Plan Supplemental Actuarial Report Dated September 1, 2020 ............................... Appendix J
Debt Service, UAAL Amortization and Present Value Schedules ........................................ Appendix K
Page 35 of 229
Grand Traverse County – Comprehensive Financial Plan 1
Comprehensive Financial Plan
Introduction Public Act 34 of 2001, the Revised Municipal Finance Act, as amended (the “Act”), requires, among other things, the preparation of a comprehensive financial plan (the “CFP”) in connection with the issuance of bonds to finance all or part of an unfunded pension and/or health care liability. Grand Traverse County (the “County”) is proposing to issue bonds in a not-to-exceed amount of $6,300,000 (the “Bonds”) to fund a portion of the unfunded actuarially accrued pension liability (“UAAL”) of two divisions (“Division 41” and “Division 43,” collectively, the “Divisions”) within the defined benefit pension plan of the Grand Traverse Pavilions (the “Pavilions”). The Pavilions is a medical care facility owned by the County and operated by the Grand Traverse County Department of Health and Human Services Board. The defined benefit pension plan of the Pavilions (the “Pension Plan”) is administered by the Municipal Employees’ Retirement System of Michigan (“MERS”). This CFP has been prepared and approved by the County in accordance with Section 518(5) of the Act. As required by Section 518(5) of the Act, this CFP will be available for review at the office of the County Clerk and on the County’s website. The office of the County Clerk is located on the first floor of the Governmental Center, 400 Boardman Avenue, Traverse City, MI 49684. The County’s website address is www.co.grand-traverse.mi.us. This CFP must satisfy the requirements of subsections (a) through (k) under Section 518(5) of the Act. The requirements of each subsection have been addressed on the following pages of this CFP.
518(5) Subsection
Page
(a) 5 (b) 9 (c) 3 (d) 3 (e) 9 (f) 7 (g) 9 (h) 5 (i) 5 (j) 10 (k) n/a
Page 36 of 229
Grand Traverse County – Comprehensive Financial Plan 2
Application Requirements Section 518(9) of the Act requires municipalities intending to issue bonds to finance all or part of an unfunded pension and/or health care liability to request prior written approval from the Michigan Department of Treasury (the “Department”) before the issuance of the bonds. The Application for State Treasurer’s Approval to Issue Pension or Other Post-Employment Benefits (“OPEB”) Long-Term Securities, Form 5366 (the “Long Form”), will be filed with the Department pursuant to the Act. A $1,950 check payable to the State of Michigan will accompany the Long Form application. Section 518(4) of the Act requires the County to publish a notice of intent (the “Notice of Intent”) to issue the Bonds as proposed herein. The Notice of Intent and the rights of referendum meet the requirements of Section 517(2) of the Act. Pursuant to Section 518(5) of the Act, this CFP has been approved and will be available for review on or before the date of publication of the Notice of Intent. The County has filed a Qualifying Statement for its fiscal year ended December 31, 2019, with the Department. The Department’s letter regarding the Qualifying Statement dated July 7, 2020, has been attached hereto as Appendix A. The Long Form requires a certified copy of the Notice of Intent Resolution, an Affidavit of Publication of the Notice of Intent, a certified copy of a No Referendum Certificate and a certified copy of the Bond Authorizing Resolution. A certified copy of the Notice of Intent Resolution has been attached hereto as Appendix B. The Affidavit of Publication of the Notice of Intent, a certified copy of a No Referendum Certificate and certified copy of the Bond Authorizing Resolution will be filed with the Department pursuant to the Act. The Long Form also requires detailed information about the County’s direct, overlapping and proposed debt as well as a copy of the County’s most recent Official Statement. The County’s most recent Official Statement will be filed with the Department pursuant to the Act. The County’s Legal Debt Margin, Debt Statement and direct debt detail, all as of November 2, 2020, have been attached hereto as Appendix C, Appendix D and Appendix E, respectively. The County’s Legal Debt Margin, Debt Statement and direct debt detail do not include the Bonds as proposed herein. Estimated sizing and debt service calculations for the Bonds as proposed herein have been attached hereto as Appendix F. In addition to the Bonds, the County anticipates the issuance of approximately $3.0 million of drain bonds and $2.2 million of building authority refunding bonds within the next twelve months. Section 518(11) of the Act requires confirmation that the County has an A3 rating or higher from Moody’s or an A- rating or higher from Standard & Poor’s (“S&P”), Fitch or Kroll. The County is currently rated AA with a stable outlook by S&P. S&P’s rating report dated October 24, 2019, has been attached hereto as Appendix G. This is the most recent rating report available. The County will apply for an S&P rating on the Bonds as proposed herein. Documentation of the requisite rating will be provided to the Department prior to approval.
Page 37 of 229
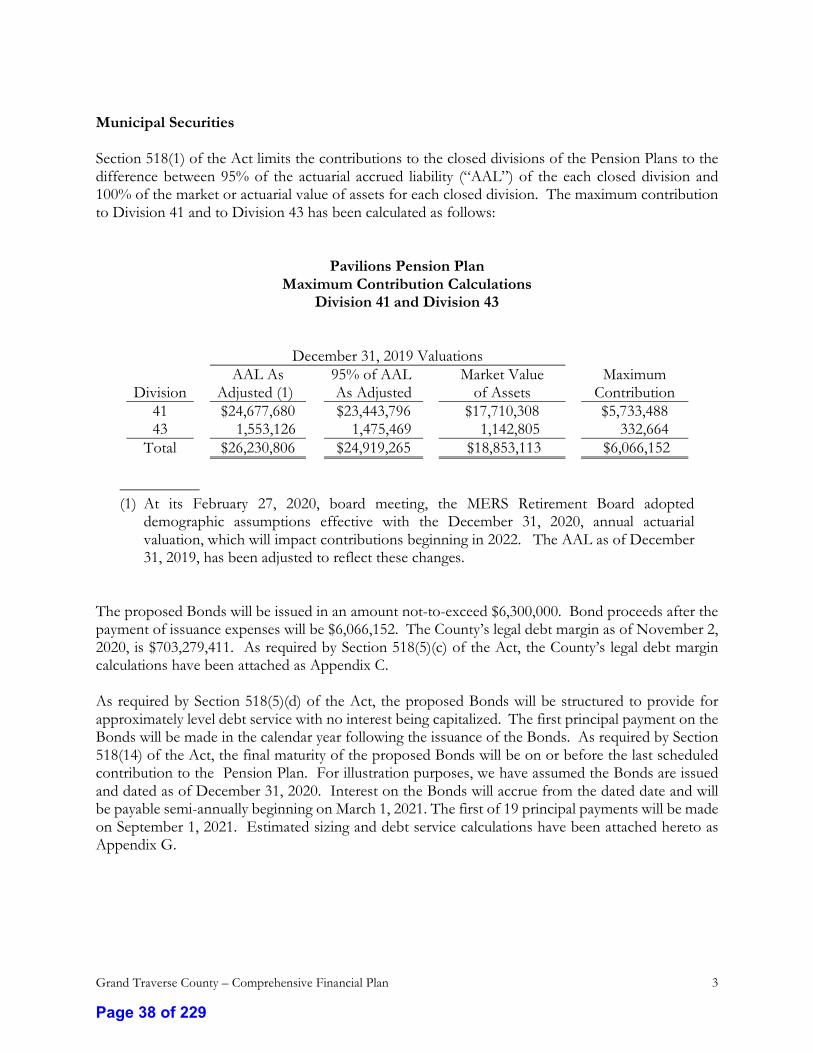
Grand Traverse County – Comprehensive Financial Plan 3
Municipal Securities Section 518(1) of the Act limits the contributions to the closed divisions of the Pension Plans to the difference between 95% of the actuarial accrued liability (“AAL”) of the each closed division and 100% of the market or actuarial value of assets for each closed division. The maximum contribution to Division 41 and to Division 43 has been calculated as follows:
Pavilions Pension Plan Maximum Contribution Calculations
Division 41 and Division 43
December 31, 2019 Valuations AAL As 95% of AAL Market Value Maximum Division Adjusted (1) As Adjusted of Assets Contribution
41 $24,677,680 $23,443,796 $17,710,308 $5,733,488 43 1,553,126 1,475,469 1,142,805 332,664
Total $26,230,806 $24,919,265 $18,853,113 $6,066,152
__________ (1) At its February 27, 2020, board meeting, the MERS Retirement Board adopted
demographic assumptions effective with the December 31, 2020, annual actuarial valuation, which will impact contributions beginning in 2022. The AAL as of December 31, 2019, has been adjusted to reflect these changes.
The proposed Bonds will be issued in an amount not-to-exceed $6,300,000. Bond proceeds after the payment of issuance expenses will be $6,066,152. The County’s legal debt margin as of November 2, 2020, is $703,279,411. As required by Section 518(5)(c) of the Act, the County’s legal debt margin calculations have been attached as Appendix C. As required by Section 518(5)(d) of the Act, the proposed Bonds will be structured to provide for approximately level debt service with no interest being capitalized. The first principal payment on the Bonds will be made in the calendar year following the issuance of the Bonds. As required by Section 518(14) of the Act, the final maturity of the proposed Bonds will be on or before the last scheduled contribution to the Pension Plan. For illustration purposes, we have assumed the Bonds are issued and dated as of December 31, 2020. Interest on the Bonds will accrue from the dated date and will be payable semi-annually beginning on March 1, 2021. The first of 19 principal payments will be made on September 1, 2021. Estimated sizing and debt service calculations have been attached hereto as Appendix G.
Page 38 of 229
Grand Traverse County – Comprehensive Financial Plan 4
Application Documentation, Review and Consideration Retiree Health Care Plan Bonds will not be issued by the County for the Grand Traverse Pavilions Post-Retirement Medical Plan (the “Post-Retirement Medical Plan”). The Post-Retirement Medical Plan is a single employer defined benefit retiree health care plan. The Post-Retirement Medical Plan is administered by the Pavilions and can be amended at its discretion. The Post-Retirement Medical Plan covers all active and retired employees hired before January 1, 2011. Employees hired after January 1, 2011 are not eligible to participate in the Post-Retirement Medical Plan. As of December 31, 2019, 289 active and 34 retirees participated in the Post-Retirement Medical Plan. Participants in the Post-Retirement Medical Plan are eligible for benefits at 62 years of age with 20 years of service. Benefits equal $500 per month until the age of 65 after which they will receive $250 per month. Benefits received by retirees may be changed due to changes in collective bargaining agreements. Contributions to the Post-Retirement Medical Plan by the Pavilions are actuarially determined. As of December 31, 2019, the Post-Retirement Medical Plan was 63.6% funded with an UAAL of $616,349. The actuarial report for the Post-Retirement Medical Plan, dated December 31, 2019, has been attached hereto as Appendix I. Pension Plan The Pension Plan is an agent multiple-employer defined benefit pension plan administered by the Municipal Employees’ Retirement System of Michigan (“MERS”). The Pension Plan provides certain retirement, disability and death benefits to plan members and beneficiaries. Pension benefits vary by division and are calculated as final average compensation (based on a 5-year period) and multipliers ranging from 2.0% to 2.5%. Participants are considered to be fully vested in the plan after 6 years. Normal retirement age is 60 with early retirement at age 50 with 25 years of service, age 55 with 15 years of service. Pension Plan benefits are based on the retiree’s or active employee’s date of employment with the Pavilions as well as the bargaining group by whom they were/are represented. As of December 31, 2019, the Pension Plan had 674 members, with 212 retirees and beneficiaries, 136 former employees that have vested and 326 active plan participants. For pension plans with over 100 members, Section 518(3) of the Act requires the Pavilions to conduct an internal or external review to verify eligible participants in the plan and that they are receiving the appropriate benefits consistent with their plan. As of September 30, 2020, the Pavilions, through an internal review conducted by its Human Resource Director, has confirmed that all plan participants receiving pension benefits are eligible to receive such pension benefits. Such pension benefits have also been deemed to be appropriate under the Pension Plan. The Pavilions is required to make annual contributions to the Pension Plan as established by MERS (the “ARC”). The ARC is the actuarially determined amount necessary to fund the benefits earned by employees during the year (normal costs) as well amortize the UAAL. The Pavilions’ Pension Plan was 76.03% funded as of December 31, 2019, with actuarial assets of $34,923,608 and an actuarial
Page 39 of 229
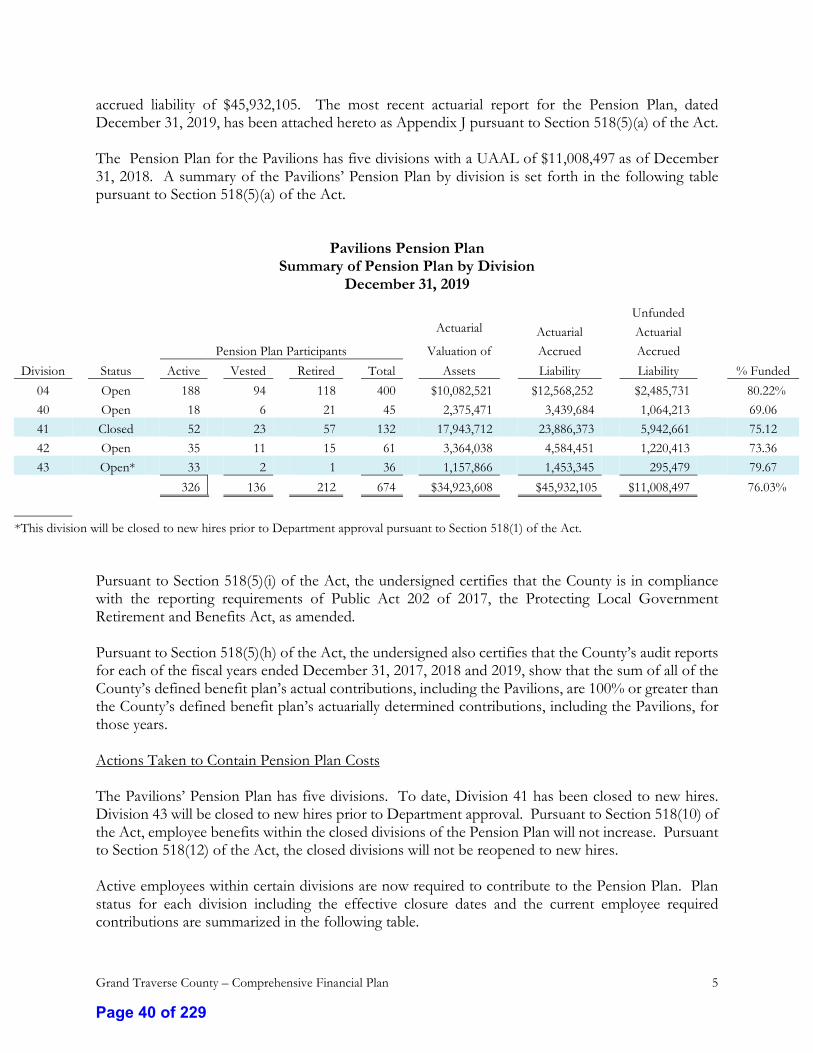
Grand Traverse County – Comprehensive Financial Plan 5
accrued liability of $45,932,105. The most recent actuarial report for the Pension Plan, dated December 31, 2019, has been attached hereto as Appendix J pursuant to Section 518(5)(a) of the Act. The Pension Plan for the Pavilions has five divisions with a UAAL of $11,008,497 as of December 31, 2018. A summary of the Pavilions’ Pension Plan by division is set forth in the following table pursuant to Section 518(5)(a) of the Act.
Pavilions Pension Plan Summary of Pension Plan by Division
December 31, 2019
Pursuant to Section 518(5)(i) of the Act, the undersigned certifies that the County is in compliance with the reporting requirements of Public Act 202 of 2017, the Protecting Local Government Retirement and Benefits Act, as amended. Pursuant to Section 518(5)(h) of the Act, the undersigned also certifies that the County’s audit reports for each of the fiscal years ended December 31, 2017, 2018 and 2019, show that the sum of all of the County’s defined benefit plan’s actual contributions, including the Pavilions, are 100% or greater than the County’s defined benefit plan’s actuarially determined contributions, including the Pavilions, for those years. Actions Taken to Contain Pension Plan Costs The Pavilions’ Pension Plan has five divisions. To date, Division 41 has been closed to new hires. Division 43 will be closed to new hires prior to Department approval. Pursuant to Section 518(10) of the Act, employee benefits within the closed divisions of the Pension Plan will not increase. Pursuant to Section 518(12) of the Act, the closed divisions will not be reopened to new hires. Active employees within certain divisions are now required to contribute to the Pension Plan. Plan status for each division including the effective closure dates and the current employee required contributions are summarized in the following table.
Unfunded Actuarial Actuarial Actuarial Pension Plan Participants Valuation of Accrued Accrued Division Status Active Vested Retired Total Assets Liability Liability % Funded
04 Open 188 94 118 400 $10,082,521 $12,568,252 $2,485,731 80.22% 40 Open 18 6 21 45 2,375,471 3,439,684 1,064,213 69.06 41 Closed 52 23 57 132 17,943,712 23,886,373 5,942,661 75.12 42 Open 35 11 15 61 3,364,038 4,584,451 1,220,413 73.36 43 Open* 33 2 1 36 1,157,866 1,453,345 295,479 79.67
326 136 212 674 $34,923,608 $45,932,105 $11,008,497 76.03%
**This division will be closed to new hires prior to Department approval pursuant to Section 518(1) of the Act.
Page 40 of 229
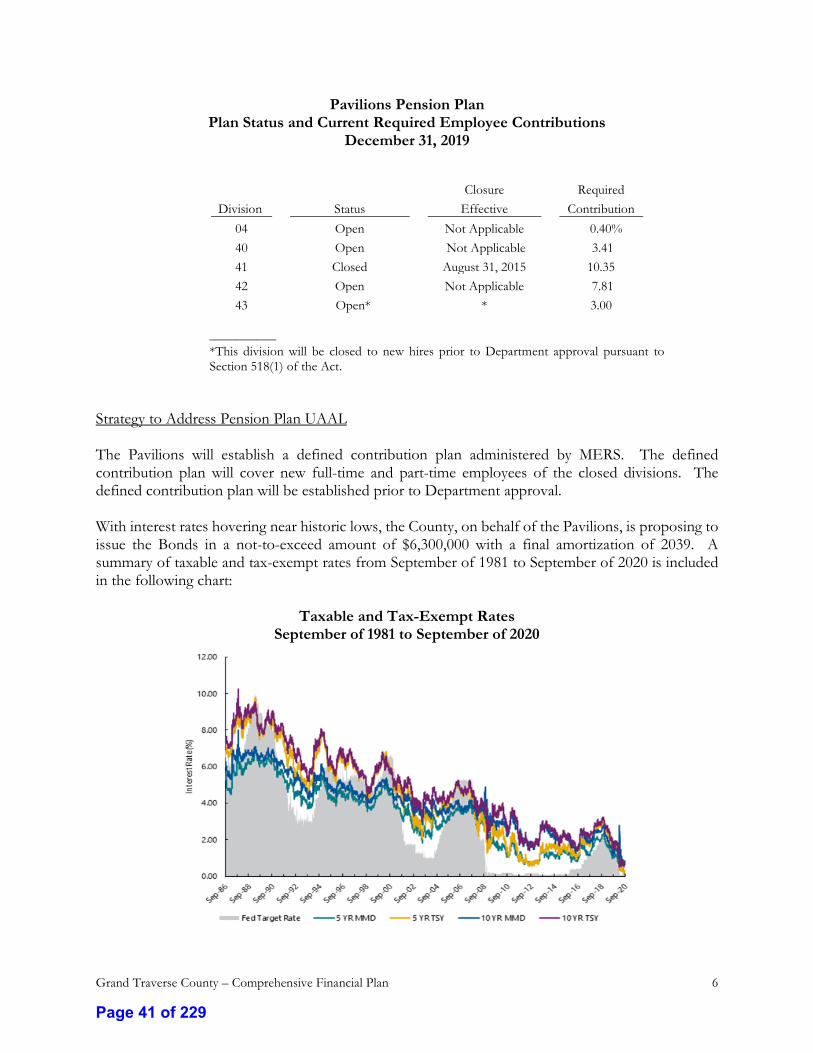
Grand Traverse County – Comprehensive Financial Plan 6
Pavilions Pension Plan Plan Status and Current Required Employee Contributions
December 31, 2019
__________ *This division will be closed to new hires prior to Department approval pursuant to Section 518(1) of the Act.
Strategy to Address Pension Plan UAAL The Pavilions will establish a defined contribution plan administered by MERS. The defined contribution plan will cover new full-time and part-time employees of the closed divisions. The defined contribution plan will be established prior to Department approval. With interest rates hovering near historic lows, the County, on behalf of the Pavilions, is proposing to issue the Bonds in a not-to-exceed amount of $6,300,000 with a final amortization of 2039. A summary of taxable and tax-exempt rates from September of 1981 to September of 2020 is included in the following chart:
Taxable and Tax-Exempt Rates September of 1981 to September of 2020
Closure Required
Division Status Effective Contribution
04 Open Not Applicable 0.40%
40 Open Not Applicable 3.41
41 Closed August 31, 2015 10.35
42 Open Not Applicable 7.81
43 Open* * 3.00
Page 41 of 229
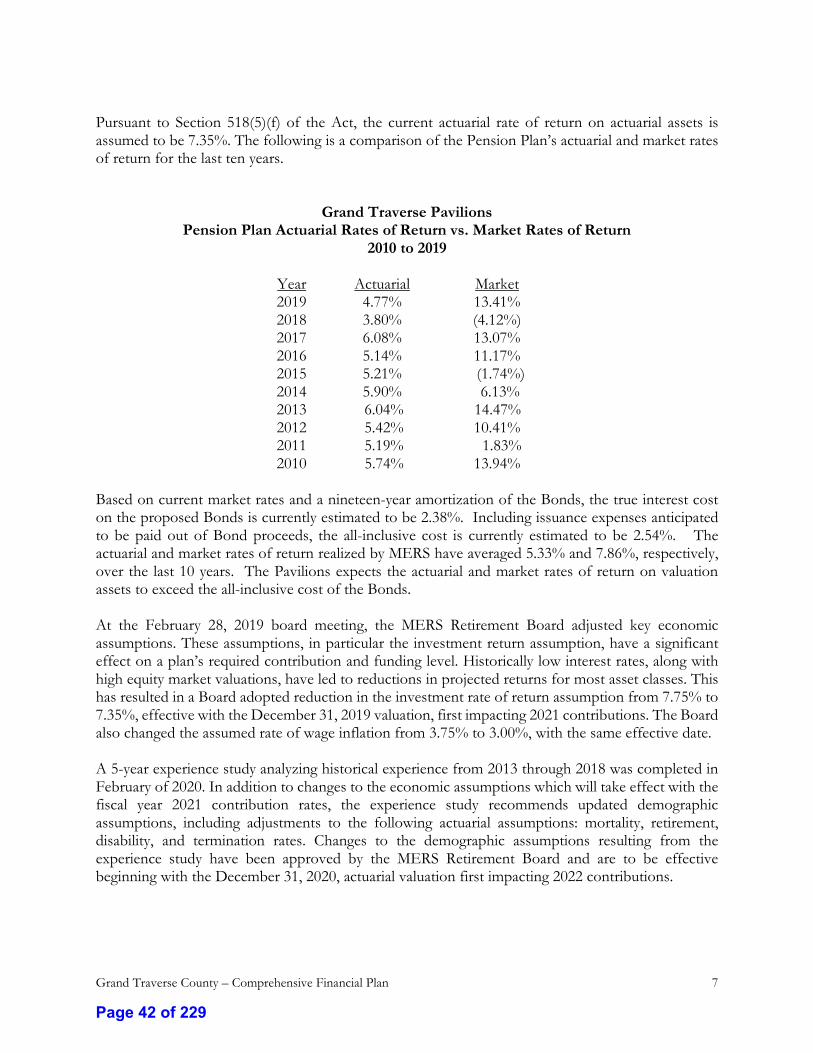
Grand Traverse County – Comprehensive Financial Plan 7
Pursuant to Section 518(5)(f) of the Act, the current actuarial rate of return on actuarial assets is assumed to be 7.35%. The following is a comparison of the Pension Plan’s actuarial and market rates of return for the last ten years.
Grand Traverse Pavilions Pension Plan Actuarial Rates of Return vs. Market Rates of Return
2010 to 2019
Year Actuarial Market 2019 4.77% 13.41% 2018 3.80% (4.12%) 2017 6.08% 13.07% 2016 5.14% 11.17% 2015 5.21% (1.74%) 2014 5.90% 6.13% 2013 6.04% 14.47% 2012 5.42% 10.41% 2011 5.19% 1.83% 2010 5.74% 13.94%
Based on current market rates and a nineteen-year amortization of the Bonds, the true interest cost on the proposed Bonds is currently estimated to be 2.38%. Including issuance expenses anticipated to be paid out of Bond proceeds, the all-inclusive cost is currently estimated to be 2.54%. The actuarial and market rates of return realized by MERS have averaged 5.33% and 7.86%, respectively, over the last 10 years. The Pavilions expects the actuarial and market rates of return on valuation assets to exceed the all-inclusive cost of the Bonds. At the February 28, 2019 board meeting, the MERS Retirement Board adjusted key economic assumptions. These assumptions, in particular the investment return assumption, have a significant effect on a plan’s required contribution and funding level. Historically low interest rates, along with high equity market valuations, have led to reductions in projected returns for most asset classes. This has resulted in a Board adopted reduction in the investment rate of return assumption from 7.75% to 7.35%, effective with the December 31, 2019 valuation, first impacting 2021 contributions. The Board also changed the assumed rate of wage inflation from 3.75% to 3.00%, with the same effective date. A 5-year experience study analyzing historical experience from 2013 through 2018 was completed in February of 2020. In addition to changes to the economic assumptions which will take effect with the fiscal year 2021 contribution rates, the experience study recommends updated demographic assumptions, including adjustments to the following actuarial assumptions: mortality, retirement, disability, and termination rates. Changes to the demographic assumptions resulting from the experience study have been approved by the MERS Retirement Board and are to be effective beginning with the December 31, 2020, actuarial valuation first impacting 2022 contributions.
Page 42 of 229
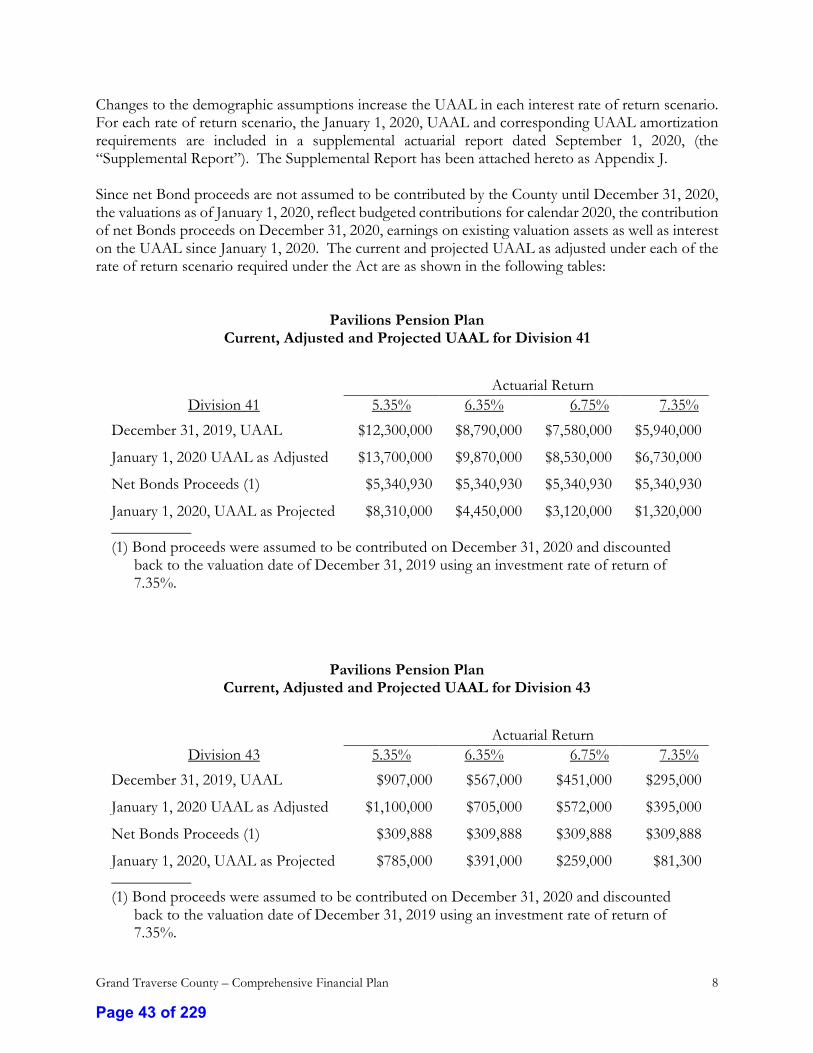
Grand Traverse County – Comprehensive Financial Plan 8
Changes to the demographic assumptions increase the UAAL in each interest rate of return scenario. For each rate of return scenario, the January 1, 2020, UAAL and corresponding UAAL amortization requirements are included in a supplemental actuarial report dated September 1, 2020, (the “Supplemental Report”). The Supplemental Report has been attached hereto as Appendix J. Since net Bond proceeds are not assumed to be contributed by the County until December 31, 2020, the valuations as of January 1, 2020, reflect budgeted contributions for calendar 2020, the contribution of net Bonds proceeds on December 31, 2020, earnings on existing valuation assets as well as interest on the UAAL since January 1, 2020. The current and projected UAAL as adjusted under each of the rate of return scenario required under the Act are as shown in the following tables:
Pavilions Pension Plan Current, Adjusted and Projected UAAL for Division 41
Pavilions Pension Plan Current, Adjusted and Projected UAAL for Division 43
Actuarial Return Division 41 5.35% 6.35% 6.75% 7.35%
December 31, 2019, UAAL $12,300,000 $8,790,000 $7,580,000 $5,940,000
January 1, 2020 UAAL as Adjusted $13,700,000 $9,870,000 $8,530,000 $6,730,000
Net Bonds Proceeds (1) $5,340,930 $5,340,930 $5,340,930 $5,340,930
January 1, 2020, UAAL as Projected $8,310,000 $4,450,000 $3,120,000 $1,320,000 __________ (1) Bond proceeds were assumed to be contributed on December 31, 2020 and discounted
back to the valuation date of December 31, 2019 using an investment rate of return of 7.35%.
Actuarial Return Division 43 5.35% 6.35% 6.75% 7.35%
December 31, 2019, UAAL $907,000 $567,000 $451,000 $295,000
January 1, 2020 UAAL as Adjusted $1,100,000 $705,000 $572,000 $395,000
Net Bonds Proceeds (1) $309,888 $309,888 $309,888 $309,888
January 1, 2020, UAAL as Projected $785,000 $391,000 $259,000 $81,300 __________ (1) Bond proceeds were assumed to be contributed on December 31, 2020 and discounted
back to the valuation date of December 31, 2019 using an investment rate of return of 7.35%.
Page 43 of 229
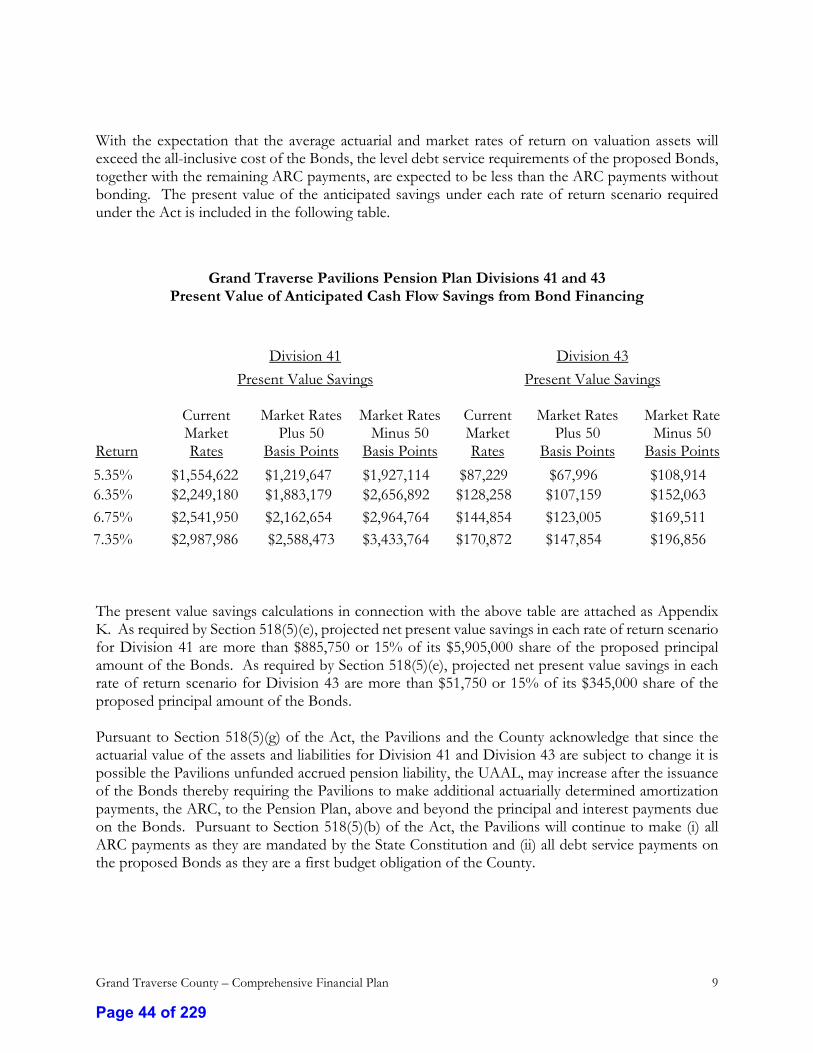
Grand Traverse County – Comprehensive Financial Plan 9
With the expectation that the average actuarial and market rates of return on valuation assets will exceed the all-inclusive cost of the Bonds, the level debt service requirements of the proposed Bonds, together with the remaining ARC payments, are expected to be less than the ARC payments without bonding. The present value of the anticipated savings under each rate of return scenario required under the Act is included in the following table.
Grand Traverse Pavilions Pension Plan Divisions 41 and 43 Present Value of Anticipated Cash Flow Savings from Bond Financing
Division 41 Division 43 Present Value Savings Present Value Savings
Return
Current Market Rates
Market Rates Plus 50
Basis Points
Market Rates Minus 50
Basis Points
Current Market Rates
Market Rates Plus 50
Basis Points
Market Rate Minus 50
Basis Points
5.35% $1,554,622 $1,219,647 $1,927,114 $87,229 $67,996 $108,914 6.35% $2,249,180 $1,883,179 $2,656,892 $128,258 $107,159 $152,063
6.75% $2,541,950 $2,162,654 $2,964,764 $144,854 $123,005 $169,511
7.35% $2,987,986 $2,588,473 $3,433,764 $170,872 $147,854 $196,856
The present value savings calculations in connection with the above table are attached as Appendix K. As required by Section 518(5)(e), projected net present value savings in each rate of return scenario for Division 41 are more than $885,750 or 15% of its $5,905,000 share of the proposed principal amount of the Bonds. As required by Section 518(5)(e), projected net present value savings in each rate of return scenario for Division 43 are more than $51,750 or 15% of its $345,000 share of the proposed principal amount of the Bonds. Pursuant to Section 518(5)(g) of the Act, the Pavilions and the County acknowledge that since the actuarial value of the assets and liabilities for Division 41 and Division 43 are subject to change it is possible the Pavilions unfunded accrued pension liability, the UAAL, may increase after the issuance of the Bonds thereby requiring the Pavilions to make additional actuarially determined amortization payments, the ARC, to the Pension Plan, above and beyond the principal and interest payments due on the Bonds. Pursuant to Section 518(5)(b) of the Act, the Pavilions will continue to make (i) all ARC payments as they are mandated by the State Constitution and (ii) all debt service payments on the proposed Bonds as they are a first budget obligation of the County.
Page 44 of 229
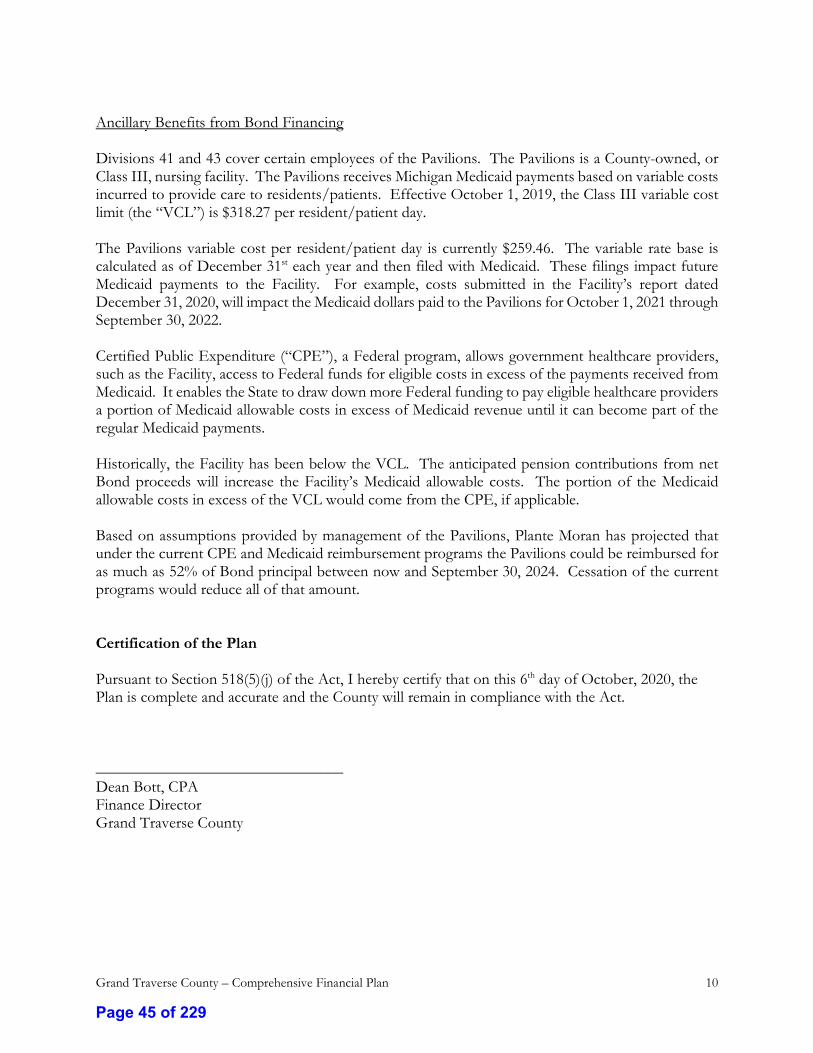
Grand Traverse County – Comprehensive Financial Plan 10
Ancillary Benefits from Bond Financing Divisions 41 and 43 cover certain employees of the Pavilions. The Pavilions is a County-owned, or Class III, nursing facility. The Pavilions receives Michigan Medicaid payments based on variable costs incurred to provide care to residents/patients. Effective October 1, 2019, the Class III variable cost limit (the “VCL”) is $318.27 per resident/patient day. The Pavilions variable cost per resident/patient day is currently $259.46. The variable rate base is calculated as of December 31st each year and then filed with Medicaid. These filings impact future Medicaid payments to the Facility. For example, costs submitted in the Facility’s report dated December 31, 2020, will impact the Medicaid dollars paid to the Pavilions for October 1, 2021 through September 30, 2022. Certified Public Expenditure (“CPE”), a Federal program, allows government healthcare providers, such as the Facility, access to Federal funds for eligible costs in excess of the payments received from Medicaid. It enables the State to draw down more Federal funding to pay eligible healthcare providers a portion of Medicaid allowable costs in excess of Medicaid revenue until it can become part of the regular Medicaid payments. Historically, the Facility has been below the VCL. The anticipated pension contributions from net Bond proceeds will increase the Facility’s Medicaid allowable costs. The portion of the Medicaid allowable costs in excess of the VCL would come from the CPE, if applicable. Based on assumptions provided by management of the Pavilions, Plante Moran has projected that under the current CPE and Medicaid reimbursement programs the Pavilions could be reimbursed for as much as 52% of Bond principal between now and September 30, 2024. Cessation of the current programs would reduce all of that amount. Certification of the Plan Pursuant to Section 518(5)(j) of the Act, I hereby certify that on this 6th day of October, 2020, the Plan is complete and accurate and the County will remain in compliance with the Act. _______________________________ Dean Bott, CPA Finance Director Grand Traverse County
Page 45 of 229

Grand Traverse County – Comprehensive Financial Plan 11
Appendix A Grand Traverse County Letter Regarding Qualifying Statement
Page 46 of 229
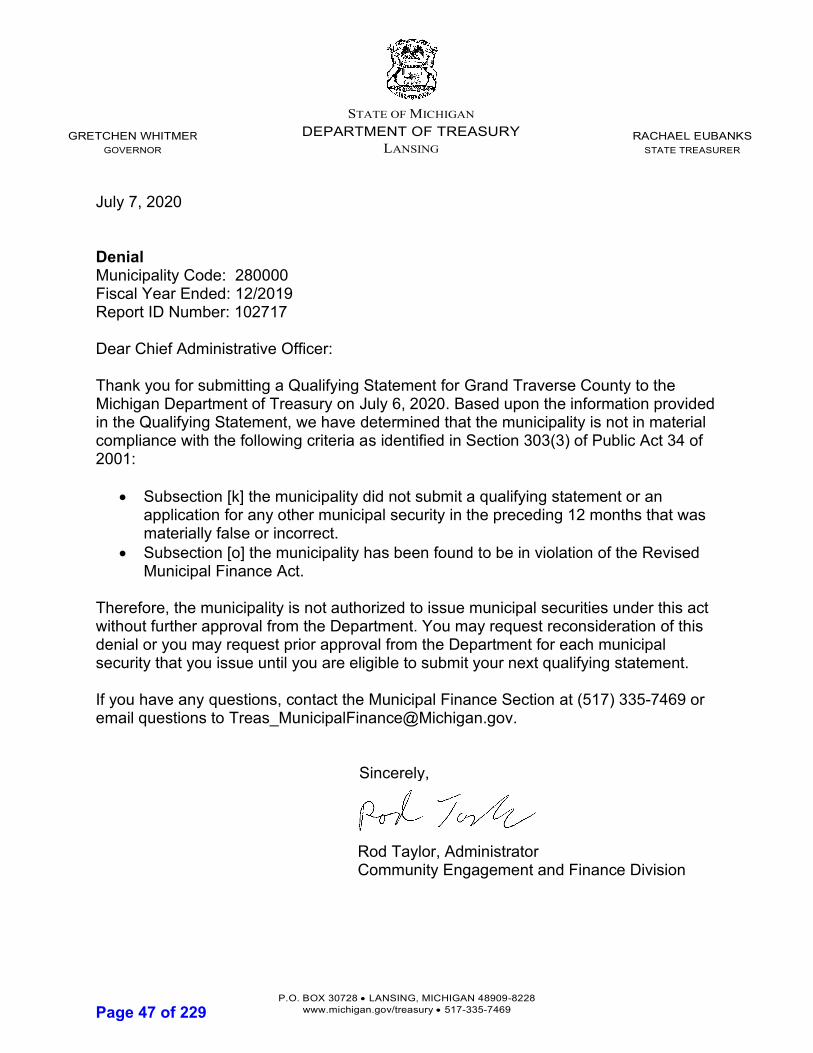
P.O. BOX 30728 • LANSING, MICHIGAN 48909-8228
www.michigan.gov/treasury • 517-335-7469
GRETCHEN WHITMER
GOVERNOR
STATE OF MICHIGAN
DEPARTMENT OF TREASURY
LANSING
RACHAEL EUBANKS
STATE TREASURER
July 7, 2020
Denial Municipality Code: 280000 Fiscal Year Ended: 12/2019 Report ID Number: 102717 Dear Chief Administrative Officer: Thank you for submitting a Qualifying Statement for Grand Traverse County to the Michigan Department of Treasury on July 6, 2020. Based upon the information provided in the Qualifying Statement, we have determined that the municipality is not in material compliance with the following criteria as identified in Section 303(3) of Public Act 34 of 2001:
• Subsection [k] the municipality did not submit a qualifying statement or an application for any other municipal security in the preceding 12 months that was materially false or incorrect.
• Subsection [o] the municipality has been found to be in violation of the Revised Municipal Finance Act.
Therefore, the municipality is not authorized to issue municipal securities under this act without further approval from the Department. You may request reconsideration of this denial or you may request prior approval from the Department for each municipal security that you issue until you are eligible to submit your next qualifying statement. If you have any questions, contact the Municipal Finance Section at (517) 335-7469 or email questions to [email protected].
Sincerely,
Rod Taylor, Administrator Community Engagement and Finance Division
Page 47 of 229

Grand Traverse County – Comprehensive Financial Plan 12
Appendix B Grand Traverse County Notice of Intent Resolution
Page 48 of 229

Grand Traverse County – Comprehensive Financial Plan 13
Appendix C Grand Traverse County Legal Debt Margin November 2, 2020
Page 49 of 229
$ 7,354,713,405 11,968,300
7,366,681,705
736,668,171 33,448,593
$ 703,219,577 Legal Debt Margin
Plus 2020 State Equalized Valuation of Act 198 ExemptionsTotal State Equalized Valuation
Debt Limited (10% of State Equalized Valuation)Amount of Outstanding Debt
Statement of Legal Debt Marginas of November 2, 2020
2020 State Equalized Valuation
County of Grand TraverseState of Michigan
Page 50 of 229

Grand Traverse County – Comprehensive Financial Plan 14
Appendix D Grand Traverse County Debt Statement November 2, 2020
Page 51 of 229
DIRECT DEBT OF COUNTY: Gross
Self-Supporting or Portion Paid by
Benefited Municipalities Net
Sewer & Water Bonds 14,531,000$ 14,531,000$ -$ Brownfield Redevelopment Bonds 2,602,593 2,602,593 - Airport Revenue Bonds 1,320,000 1,320,000 - Building Authority Bonds 12,070,000 - 12,070,000 MTF Bonds 2,925,000 2,925,000 -
Total Direct Debt: 33,448,593$ 21,378,593$ 12,070,000$
OVERLAPPING DEBT OF COUNTY:School Districts 68,550,453$ Cities 14,909,718 Townships 18,520,284 Villages 645,000 Intermediate School Districts - Community Colleges 26,135,000 Library - Authority 2,564,269
Total Overlapping Debt: 131,324,724
Net Direct County and Overlapping Debt: 143,394,724$
Source: County of Grand Traverse and Municipal Advisory Council of Michigan
County of Grand Traverse
Debt Statementas of November 2, 2020
State of Michigan
Page 52 of 229

Grand Traverse County – Comprehensive Financial Plan 15
Appendix E Grand Traverse County Direct Debt Detail
Page 53 of 229
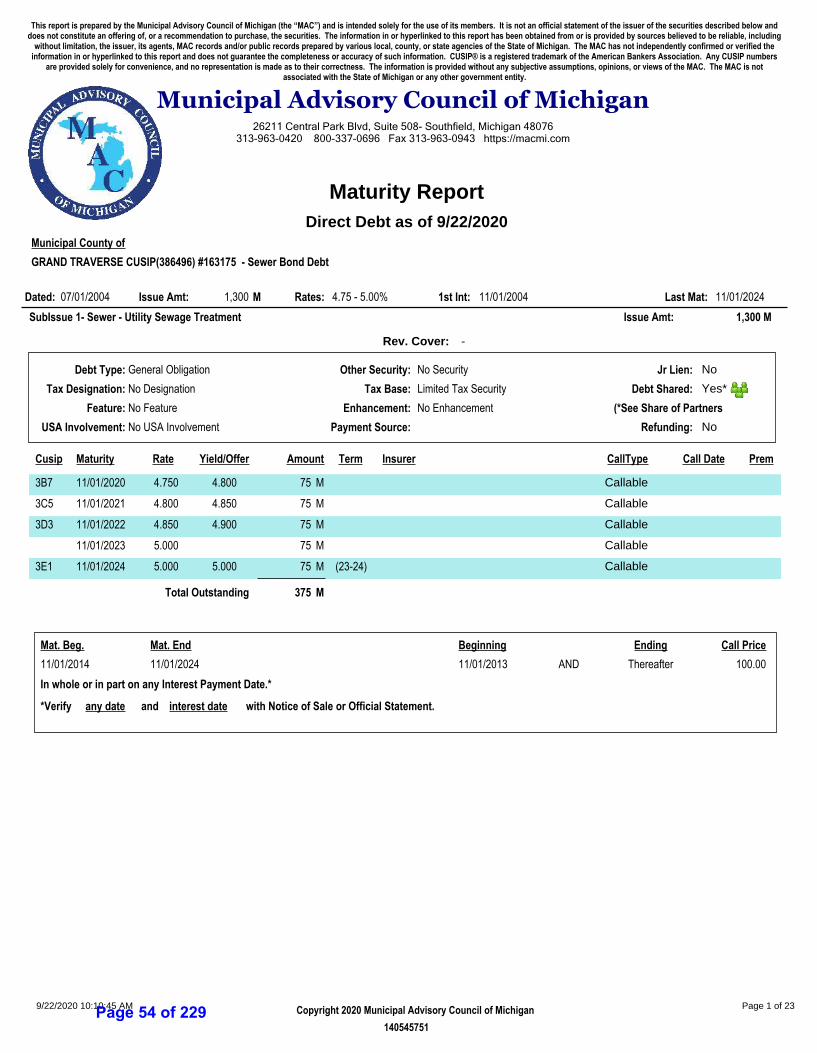
Municipal County of
GRAND TRAVERSE CUSIP(386496) #163175 - Sewer Bond Debt
07/01/2004 4.75 - 5.00% 11/01/2004 11/01/20241,300Dated: Issue Amt: Rates: 1st Int: Last Mat:M
Rev. Cover: -
SubIssue 1- Sewer - Utility Sewage Treatment 1,300Issue Amt: M
General Obligation
No Designation
No Feature
No USA Involvement
No Security
Limited Tax Security
No Enhancement
No
Yes*
No
Debt Type:
Tax Designation:
Feature:
USA Involvement:
Other Security:
Tax Base:
Enhancement:
Payment Source:
Jr Lien:
Debt Shared:
Refunding:
(*See Share of Partners
Cusip Maturity Rate Yield/Offer Amount Term Insurer CallType Call Date Prem
3B7 11/01/2020 4.800 754.750 CallableM
3C5 11/01/2021 4.850 754.800 CallableM
3D3 11/01/2022 4.900 754.850 CallableM
11/01/2023 755.000 CallableM
3E1 11/01/2024 5.000 75 (23-24)5.000 CallableM
Total Outstanding 375 M
Mat. Beg. Mat. End Beginning Ending Call Price
11/01/2014 11/01/2024 11/01/2013 AND Thereafter 100.00
*Verify any date and interest date with Notice of Sale or Official Statement.
In whole or in part on any Interest Payment Date.*
26211 Central Park Blvd, Suite 508- Southfield, Michigan 48076313-963-0420 800-337-0696 Fax 313-963-0943 https://macmi.com
Municipal Advisory Council of Michigan
This report is prepared by the Municipal Advisory Council of Michigan (the “MAC”) and is intended solely for the use of its members. It is not an official statement of the issuer of the securities described below anddoes not constitute an offering of, or a recommendation to purchase, the securities. The information in or hyperlinked to this report has been obtained from or is provided by sources believed to be reliable, including
without limitation, the issuer, its agents, MAC records and/or public records prepared by various local, county, or state agencies of the State of Michigan. The MAC has not independently confirmed or verified theinformation in or hyperlinked to this report and does not guarantee the completeness or accuracy of such information. CUSIP® is a registered trademark of the American Bankers Association. Any CUSIP numbers
are provided solely for convenience, and no representation is made as to their correctness. The information is provided without any subjective assumptions, opinions, or views of the MAC. The MAC is notassociated with the State of Michigan or any other government entity.
Maturity Report
Direct Debt as of 9/22/2020
Copyright 2020 Municipal Advisory Council of Michigan9/22/2020 10:10:45 AM Page 1 of 23
140545751Page 54 of 229

Municipal County of
GRAND TRAVERSE CUSIP(66824A) #163214 - NW Regional Comm. Bond Debt
01/01/2005 4.25 - 4.50% 08/01/2005 02/01/20253,900Dated: Issue Amt: Rates: 1st Int: Last Mat:M
Insur: XLCA Rev. Cover: -
SubIssue 1- - Public Works Airport 3,900Issue Amt: M
Revenue
Alternative Minimum Tax
No Feature
No USA Involvement
GO Pledge
Limited Tax Security
Insured
No
No
No
Debt Type:
Tax Designation:
Feature:
USA Involvement:
Other Security:
Tax Base:
Enhancement:
Payment Source:
Jr Lien:
Debt Shared:
Refunding:
(*See Share of Partners
Cusip Maturity Rate Yield/Offer Amount Term Insurer CallType Call Date Prem
AR3 02/01/2021 100.000 2404.250 CallableM
AS1 02/01/2022 100.000 2504.350 CallableM
AT9 02/01/2023 100.000 2654.400 CallableM
AU6 02/01/2024 100.000 2754.450 CallableM
AV4 02/01/2025 100.000 2904.500 CallableM
Total Outstanding 1,320 M
Mat. Beg. Mat. End Beginning Ending Call Price
02/01/2013 02/01/2025 02/01/2012 AND Thereafter 100.00
*Verify any date and interest date with Notice of Sale or Official Statement.
In whole or in part on any Interest Payment Date.*
26211 Central Park Blvd, Suite 508- Southfield, Michigan 48076313-963-0420 800-337-0696 Fax 313-963-0943 https://macmi.com
Municipal Advisory Council of Michigan
This report is prepared by the Municipal Advisory Council of Michigan (the “MAC”) and is intended solely for the use of its members. It is not an official statement of the issuer of the securities described below anddoes not constitute an offering of, or a recommendation to purchase, the securities. The information in or hyperlinked to this report has been obtained from or is provided by sources believed to be reliable, including
without limitation, the issuer, its agents, MAC records and/or public records prepared by various local, county, or state agencies of the State of Michigan. The MAC has not independently confirmed or verified theinformation in or hyperlinked to this report and does not guarantee the completeness or accuracy of such information. CUSIP® is a registered trademark of the American Bankers Association. Any CUSIP numbers
are provided solely for convenience, and no representation is made as to their correctness. The information is provided without any subjective assumptions, opinions, or views of the MAC. The MAC is notassociated with the State of Michigan or any other government entity.
Maturity Report
Direct Debt as of 9/22/2020
Copyright 2020 Municipal Advisory Council of Michigan9/22/2020 10:10:45 AM Page 2 of 23
140545751Page 55 of 229
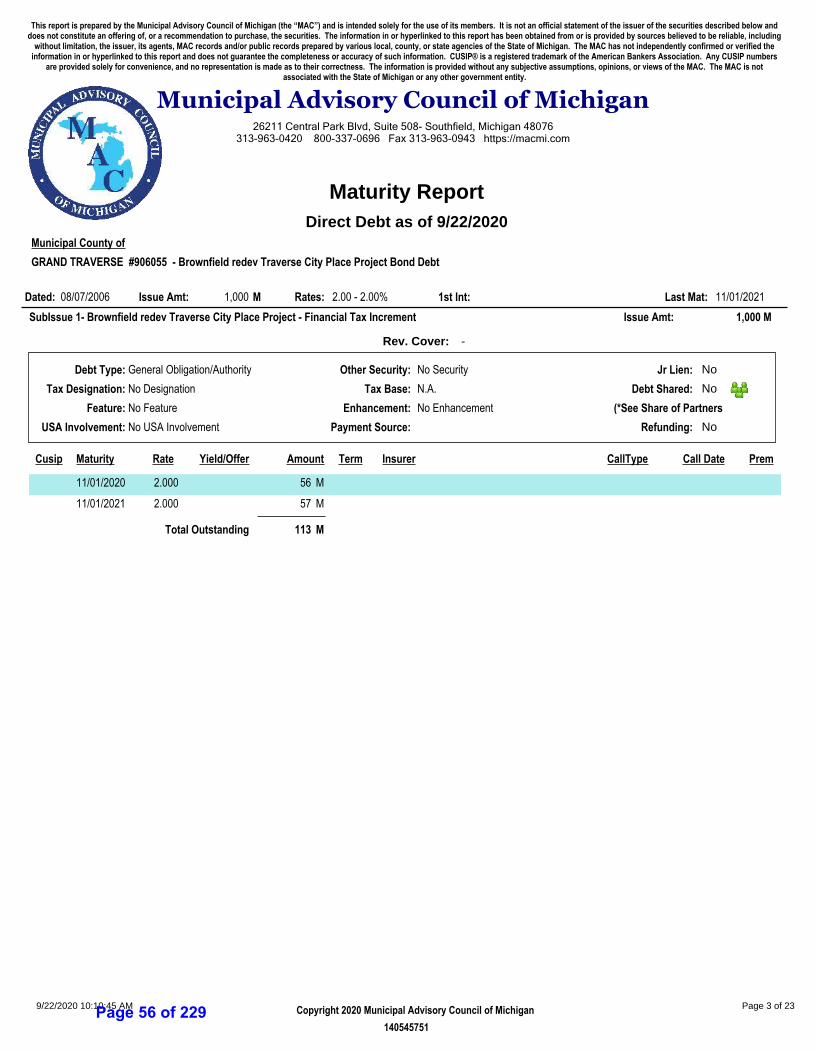
Municipal County of
GRAND TRAVERSE #906055 - Brownfield redev Traverse City Place Project Bond Debt
08/07/2006 2.00 - 2.00% 11/01/20211,000Dated: Issue Amt: Rates: 1st Int: Last Mat:M
Rev. Cover: -
SubIssue 1- Brownfield redev Traverse City Place Project - Financial Tax Increment 1,000Issue Amt: M
General Obligation/Authority
No Designation
No Feature
No USA Involvement
No Security
N.A.
No Enhancement
No
No
No
Debt Type:
Tax Designation:
Feature:
USA Involvement:
Other Security:
Tax Base:
Enhancement:
Payment Source:
Jr Lien:
Debt Shared:
Refunding:
(*See Share of Partners
Cusip Maturity Rate Yield/Offer Amount Term Insurer CallType Call Date Prem
11/01/2020 562.000 M
11/01/2021 572.000 M
Total Outstanding 113 M
26211 Central Park Blvd, Suite 508- Southfield, Michigan 48076313-963-0420 800-337-0696 Fax 313-963-0943 https://macmi.com
Municipal Advisory Council of Michigan
This report is prepared by the Municipal Advisory Council of Michigan (the “MAC”) and is intended solely for the use of its members. It is not an official statement of the issuer of the securities described below anddoes not constitute an offering of, or a recommendation to purchase, the securities. The information in or hyperlinked to this report has been obtained from or is provided by sources believed to be reliable, including
without limitation, the issuer, its agents, MAC records and/or public records prepared by various local, county, or state agencies of the State of Michigan. The MAC has not independently confirmed or verified theinformation in or hyperlinked to this report and does not guarantee the completeness or accuracy of such information. CUSIP® is a registered trademark of the American Bankers Association. Any CUSIP numbers
are provided solely for convenience, and no representation is made as to their correctness. The information is provided without any subjective assumptions, opinions, or views of the MAC. The MAC is notassociated with the State of Michigan or any other government entity.
Maturity Report
Direct Debt as of 9/22/2020
Copyright 2020 Municipal Advisory Council of Michigan9/22/2020 10:10:45 AM Page 3 of 23
140545751Page 56 of 229
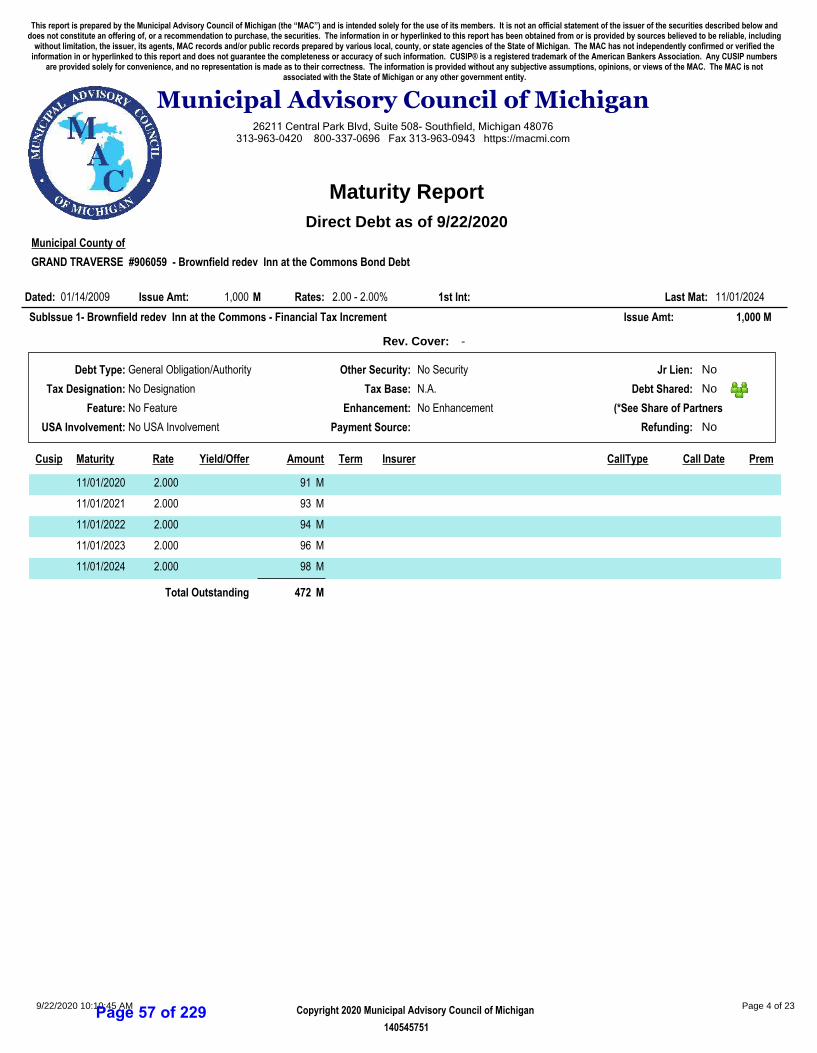
Municipal County of
GRAND TRAVERSE #906059 - Brownfield redev Inn at the Commons Bond Debt
01/14/2009 2.00 - 2.00% 11/01/20241,000Dated: Issue Amt: Rates: 1st Int: Last Mat:M
Rev. Cover: -
SubIssue 1- Brownfield redev Inn at the Commons - Financial Tax Increment 1,000Issue Amt: M
General Obligation/Authority
No Designation
No Feature
No USA Involvement
No Security
N.A.
No Enhancement
No
No
No
Debt Type:
Tax Designation:
Feature:
USA Involvement:
Other Security:
Tax Base:
Enhancement:
Payment Source:
Jr Lien:
Debt Shared:
Refunding:
(*See Share of Partners
Cusip Maturity Rate Yield/Offer Amount Term Insurer CallType Call Date Prem
11/01/2020 912.000 M
11/01/2021 932.000 M
11/01/2022 942.000 M
11/01/2023 962.000 M
11/01/2024 982.000 M
Total Outstanding 472 M
26211 Central Park Blvd, Suite 508- Southfield, Michigan 48076313-963-0420 800-337-0696 Fax 313-963-0943 https://macmi.com
Municipal Advisory Council of Michigan
This report is prepared by the Municipal Advisory Council of Michigan (the “MAC”) and is intended solely for the use of its members. It is not an official statement of the issuer of the securities described below anddoes not constitute an offering of, or a recommendation to purchase, the securities. The information in or hyperlinked to this report has been obtained from or is provided by sources believed to be reliable, including
without limitation, the issuer, its agents, MAC records and/or public records prepared by various local, county, or state agencies of the State of Michigan. The MAC has not independently confirmed or verified theinformation in or hyperlinked to this report and does not guarantee the completeness or accuracy of such information. CUSIP® is a registered trademark of the American Bankers Association. Any CUSIP numbers
are provided solely for convenience, and no representation is made as to their correctness. The information is provided without any subjective assumptions, opinions, or views of the MAC. The MAC is notassociated with the State of Michigan or any other government entity.
Maturity Report
Direct Debt as of 9/22/2020
Copyright 2020 Municipal Advisory Council of Michigan9/22/2020 10:10:45 AM Page 4 of 23
140545751Page 57 of 229
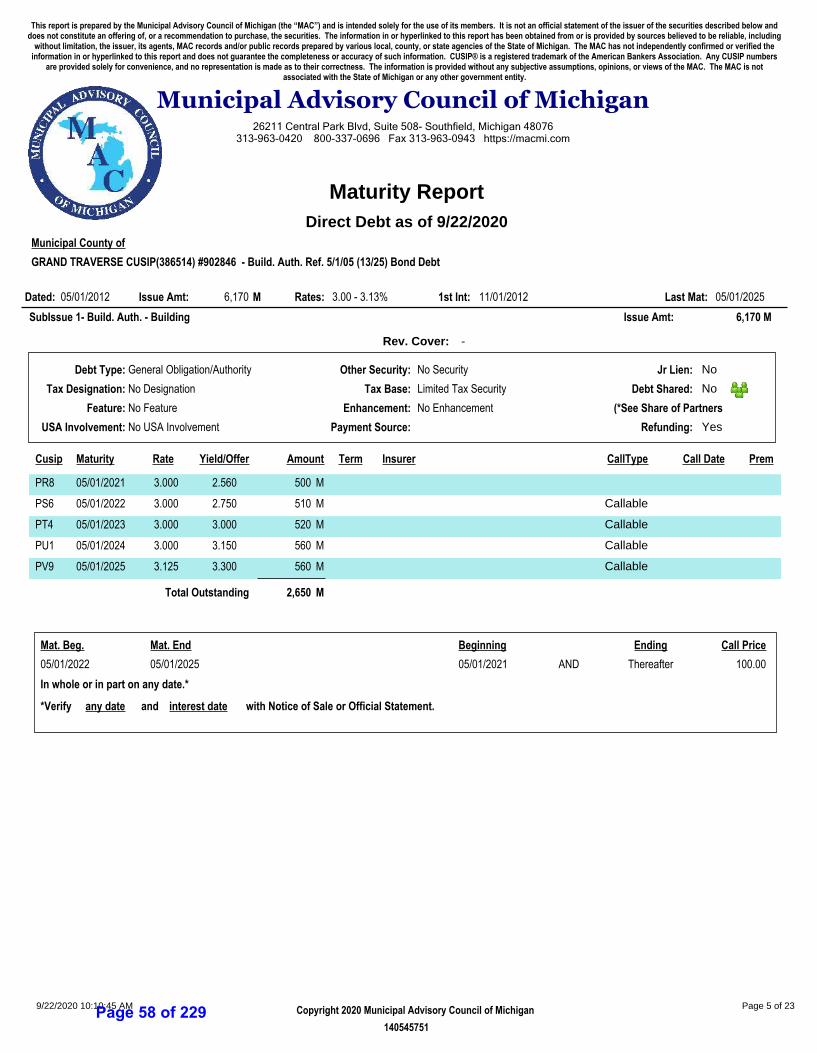
Municipal County of
GRAND TRAVERSE CUSIP(386514) #902846 - Build. Auth. Ref. 5/1/05 (13/25) Bond Debt
05/01/2012 3.00 - 3.13% 11/01/2012 05/01/20256,170Dated: Issue Amt: Rates: 1st Int: Last Mat:M
Rev. Cover: -
SubIssue 1- Build. Auth. - Building 6,170Issue Amt: M
General Obligation/Authority
No Designation
No Feature
No USA Involvement
No Security
Limited Tax Security
No Enhancement
No
No
Yes
Debt Type:
Tax Designation:
Feature:
USA Involvement:
Other Security:
Tax Base:
Enhancement:
Payment Source:
Jr Lien:
Debt Shared:
Refunding:
(*See Share of Partners
Cusip Maturity Rate Yield/Offer Amount Term Insurer CallType Call Date Prem
PR8 05/01/2021 2.560 5003.000 M
PS6 05/01/2022 2.750 5103.000 CallableM
PT4 05/01/2023 3.000 5203.000 CallableM
PU1 05/01/2024 3.150 5603.000 CallableM
PV9 05/01/2025 3.300 5603.125 CallableM
Total Outstanding 2,650 M
Mat. Beg. Mat. End Beginning Ending Call Price
05/01/2022 05/01/2025 05/01/2021 AND Thereafter 100.00
*Verify any date and interest date with Notice of Sale or Official Statement.
In whole or in part on any date.*
26211 Central Park Blvd, Suite 508- Southfield, Michigan 48076313-963-0420 800-337-0696 Fax 313-963-0943 https://macmi.com
Municipal Advisory Council of Michigan
This report is prepared by the Municipal Advisory Council of Michigan (the “MAC”) and is intended solely for the use of its members. It is not an official statement of the issuer of the securities described below anddoes not constitute an offering of, or a recommendation to purchase, the securities. The information in or hyperlinked to this report has been obtained from or is provided by sources believed to be reliable, including
without limitation, the issuer, its agents, MAC records and/or public records prepared by various local, county, or state agencies of the State of Michigan. The MAC has not independently confirmed or verified theinformation in or hyperlinked to this report and does not guarantee the completeness or accuracy of such information. CUSIP® is a registered trademark of the American Bankers Association. Any CUSIP numbers
are provided solely for convenience, and no representation is made as to their correctness. The information is provided without any subjective assumptions, opinions, or views of the MAC. The MAC is notassociated with the State of Michigan or any other government entity.
Maturity Report
Direct Debt as of 9/22/2020
Copyright 2020 Municipal Advisory Council of Michigan9/22/2020 10:10:45 AM Page 5 of 23
140545751Page 58 of 229
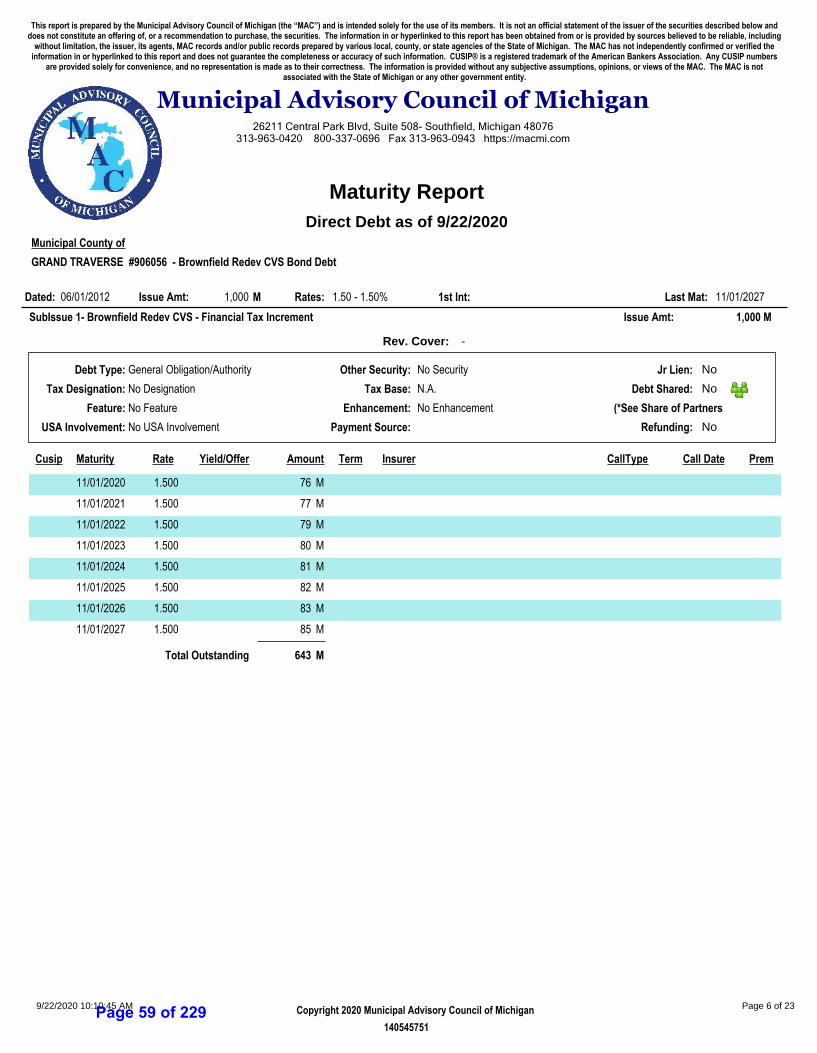
Municipal County of
GRAND TRAVERSE #906056 - Brownfield Redev CVS Bond Debt
06/01/2012 1.50 - 1.50% 11/01/20271,000Dated: Issue Amt: Rates: 1st Int: Last Mat:M
Rev. Cover: -
SubIssue 1- Brownfield Redev CVS - Financial Tax Increment 1,000Issue Amt: M
General Obligation/Authority
No Designation
No Feature
No USA Involvement
No Security
N.A.
No Enhancement
No
No
No
Debt Type:
Tax Designation:
Feature:
USA Involvement:
Other Security:
Tax Base:
Enhancement:
Payment Source:
Jr Lien:
Debt Shared:
Refunding:
(*See Share of Partners
Cusip Maturity Rate Yield/Offer Amount Term Insurer CallType Call Date Prem
11/01/2020 761.500 M
11/01/2021 771.500 M
11/01/2022 791.500 M
11/01/2023 801.500 M
11/01/2024 811.500 M
11/01/2025 821.500 M
11/01/2026 831.500 M
11/01/2027 851.500 M
Total Outstanding 643 M
26211 Central Park Blvd, Suite 508- Southfield, Michigan 48076313-963-0420 800-337-0696 Fax 313-963-0943 https://macmi.com
Municipal Advisory Council of Michigan
This report is prepared by the Municipal Advisory Council of Michigan (the “MAC”) and is intended solely for the use of its members. It is not an official statement of the issuer of the securities described below anddoes not constitute an offering of, or a recommendation to purchase, the securities. The information in or hyperlinked to this report has been obtained from or is provided by sources believed to be reliable, including
without limitation, the issuer, its agents, MAC records and/or public records prepared by various local, county, or state agencies of the State of Michigan. The MAC has not independently confirmed or verified theinformation in or hyperlinked to this report and does not guarantee the completeness or accuracy of such information. CUSIP® is a registered trademark of the American Bankers Association. Any CUSIP numbers
are provided solely for convenience, and no representation is made as to their correctness. The information is provided without any subjective assumptions, opinions, or views of the MAC. The MAC is notassociated with the State of Michigan or any other government entity.
Maturity Report
Direct Debt as of 9/22/2020
Copyright 2020 Municipal Advisory Council of Michigan9/22/2020 10:10:45 AM Page 6 of 23
140545751Page 59 of 229
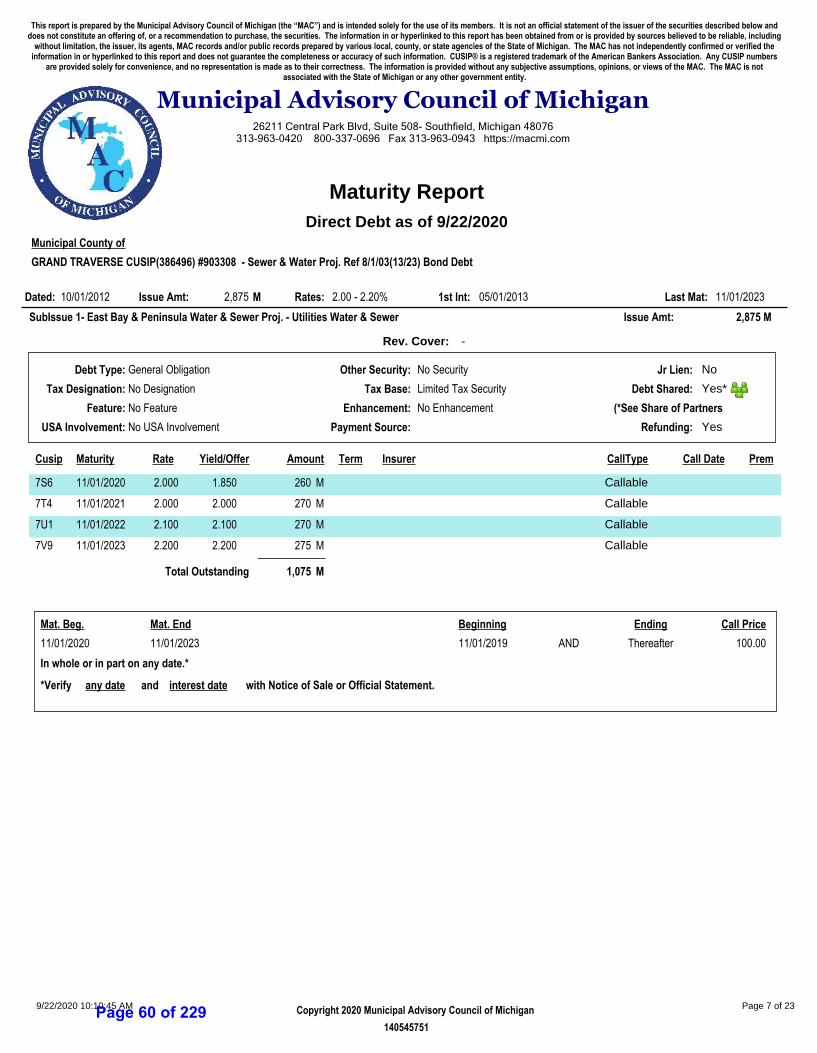
Municipal County of
GRAND TRAVERSE CUSIP(386496) #903308 - Sewer & Water Proj. Ref 8/1/03(13/23) Bond Debt
10/01/2012 2.00 - 2.20% 05/01/2013 11/01/20232,875Dated: Issue Amt: Rates: 1st Int: Last Mat:M
Rev. Cover: -
SubIssue 1- East Bay & Peninsula Water & Sewer Proj. - Utilities Water & Sewer 2,875Issue Amt: M
General Obligation
No Designation
No Feature
No USA Involvement
No Security
Limited Tax Security
No Enhancement
No
Yes*
Yes
Debt Type:
Tax Designation:
Feature:
USA Involvement:
Other Security:
Tax Base:
Enhancement:
Payment Source:
Jr Lien:
Debt Shared:
Refunding:
(*See Share of Partners
Cusip Maturity Rate Yield/Offer Amount Term Insurer CallType Call Date Prem
7S6 11/01/2020 1.850 2602.000 CallableM
7T4 11/01/2021 2.000 2702.000 CallableM
7U1 11/01/2022 2.100 2702.100 CallableM
7V9 11/01/2023 2.200 2752.200 CallableM
Total Outstanding 1,075 M
Mat. Beg. Mat. End Beginning Ending Call Price
11/01/2020 11/01/2023 11/01/2019 AND Thereafter 100.00
*Verify any date and interest date with Notice of Sale or Official Statement.
In whole or in part on any date.*
26211 Central Park Blvd, Suite 508- Southfield, Michigan 48076313-963-0420 800-337-0696 Fax 313-963-0943 https://macmi.com
Municipal Advisory Council of Michigan
This report is prepared by the Municipal Advisory Council of Michigan (the “MAC”) and is intended solely for the use of its members. It is not an official statement of the issuer of the securities described below anddoes not constitute an offering of, or a recommendation to purchase, the securities. The information in or hyperlinked to this report has been obtained from or is provided by sources believed to be reliable, including
without limitation, the issuer, its agents, MAC records and/or public records prepared by various local, county, or state agencies of the State of Michigan. The MAC has not independently confirmed or verified theinformation in or hyperlinked to this report and does not guarantee the completeness or accuracy of such information. CUSIP® is a registered trademark of the American Bankers Association. Any CUSIP numbers
are provided solely for convenience, and no representation is made as to their correctness. The information is provided without any subjective assumptions, opinions, or views of the MAC. The MAC is notassociated with the State of Michigan or any other government entity.
Maturity Report
Direct Debt as of 9/22/2020
Copyright 2020 Municipal Advisory Council of Michigan9/22/2020 10:10:45 AM Page 7 of 23
140545751Page 60 of 229
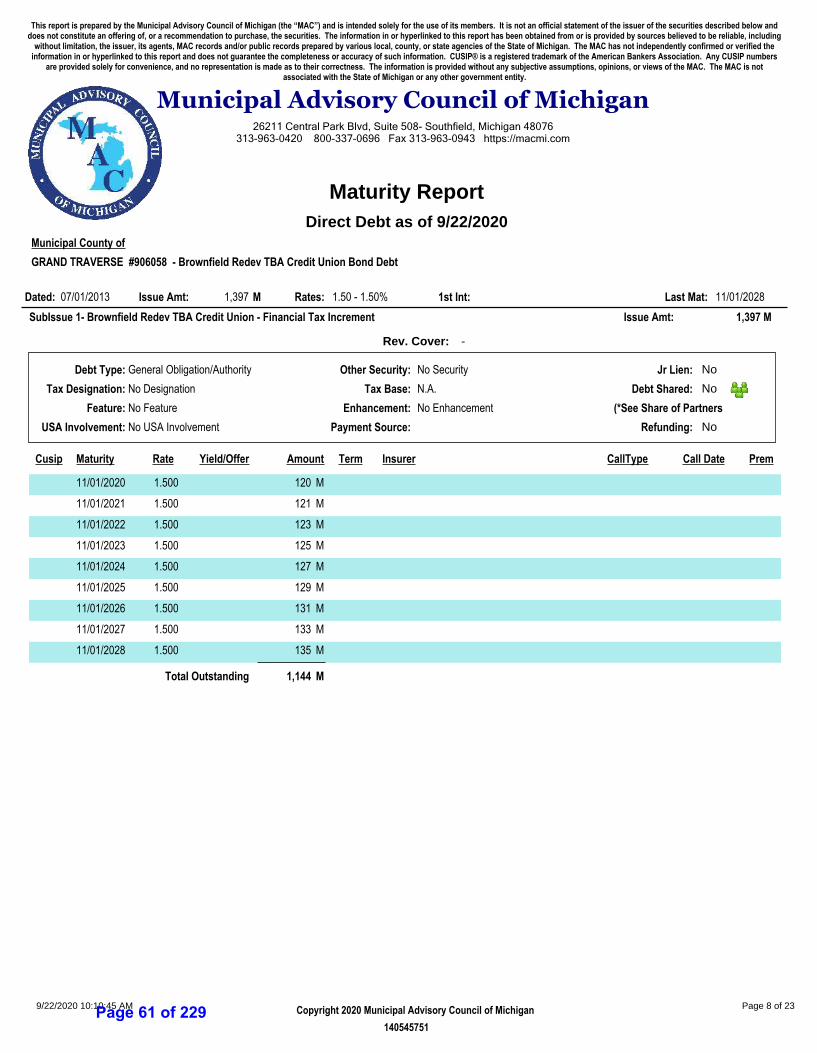
Municipal County of
GRAND TRAVERSE #906058 - Brownfield Redev TBA Credit Union Bond Debt
07/01/2013 1.50 - 1.50% 11/01/20281,397Dated: Issue Amt: Rates: 1st Int: Last Mat:M
Rev. Cover: -
SubIssue 1- Brownfield Redev TBA Credit Union - Financial Tax Increment 1,397Issue Amt: M
General Obligation/Authority
No Designation
No Feature
No USA Involvement
No Security
N.A.
No Enhancement
No
No
No
Debt Type:
Tax Designation:
Feature:
USA Involvement:
Other Security:
Tax Base:
Enhancement:
Payment Source:
Jr Lien:
Debt Shared:
Refunding:
(*See Share of Partners
Cusip Maturity Rate Yield/Offer Amount Term Insurer CallType Call Date Prem
11/01/2020 1201.500 M
11/01/2021 1211.500 M
11/01/2022 1231.500 M
11/01/2023 1251.500 M
11/01/2024 1271.500 M
11/01/2025 1291.500 M
11/01/2026 1311.500 M
11/01/2027 1331.500 M
11/01/2028 1351.500 M
Total Outstanding 1,144 M
26211 Central Park Blvd, Suite 508- Southfield, Michigan 48076313-963-0420 800-337-0696 Fax 313-963-0943 https://macmi.com
Municipal Advisory Council of Michigan
This report is prepared by the Municipal Advisory Council of Michigan (the “MAC”) and is intended solely for the use of its members. It is not an official statement of the issuer of the securities described below anddoes not constitute an offering of, or a recommendation to purchase, the securities. The information in or hyperlinked to this report has been obtained from or is provided by sources believed to be reliable, including
without limitation, the issuer, its agents, MAC records and/or public records prepared by various local, county, or state agencies of the State of Michigan. The MAC has not independently confirmed or verified theinformation in or hyperlinked to this report and does not guarantee the completeness or accuracy of such information. CUSIP® is a registered trademark of the American Bankers Association. Any CUSIP numbers
are provided solely for convenience, and no representation is made as to their correctness. The information is provided without any subjective assumptions, opinions, or views of the MAC. The MAC is notassociated with the State of Michigan or any other government entity.
Maturity Report
Direct Debt as of 9/22/2020
Copyright 2020 Municipal Advisory Council of Michigan9/22/2020 10:10:45 AM Page 8 of 23
140545751Page 61 of 229
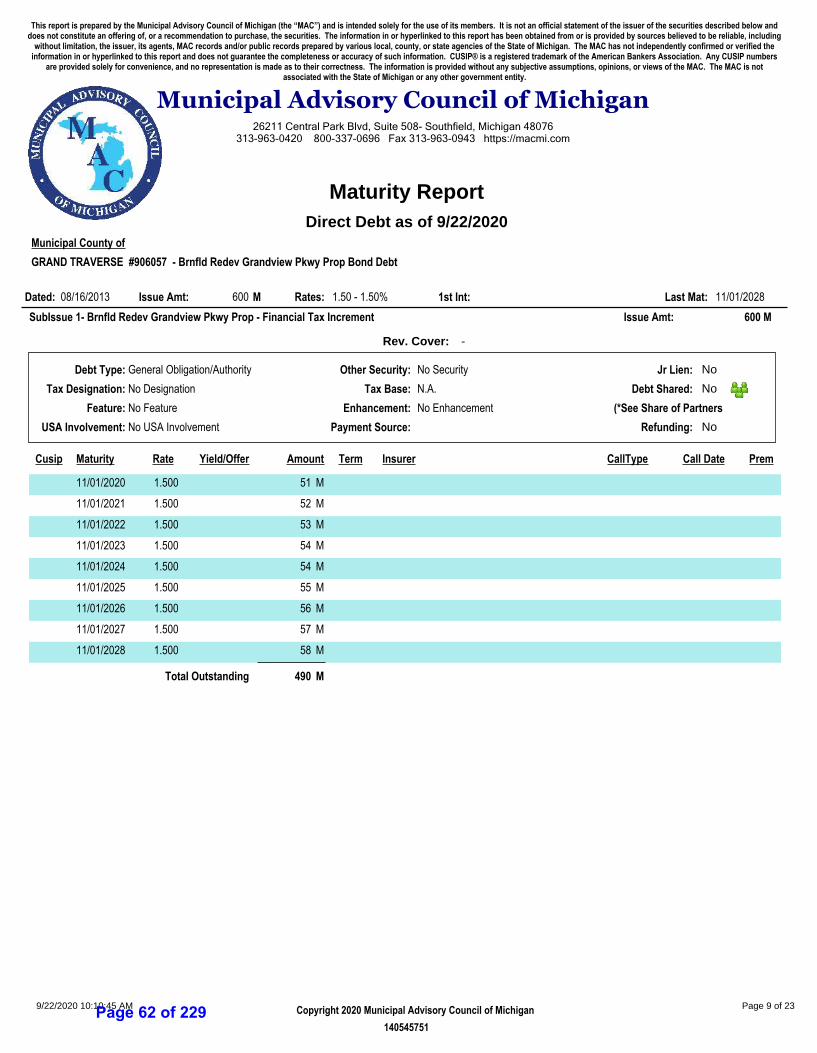
Municipal County of
GRAND TRAVERSE #906057 - Brnfld Redev Grandview Pkwy Prop Bond Debt
08/16/2013 1.50 - 1.50% 11/01/2028600Dated: Issue Amt: Rates: 1st Int: Last Mat:M
Rev. Cover: -
SubIssue 1- Brnfld Redev Grandview Pkwy Prop - Financial Tax Increment 600Issue Amt: M
General Obligation/Authority
No Designation
No Feature
No USA Involvement
No Security
N.A.
No Enhancement
No
No
No
Debt Type:
Tax Designation:
Feature:
USA Involvement:
Other Security:
Tax Base:
Enhancement:
Payment Source:
Jr Lien:
Debt Shared:
Refunding:
(*See Share of Partners
Cusip Maturity Rate Yield/Offer Amount Term Insurer CallType Call Date Prem
11/01/2020 511.500 M
11/01/2021 521.500 M
11/01/2022 531.500 M
11/01/2023 541.500 M
11/01/2024 541.500 M
11/01/2025 551.500 M
11/01/2026 561.500 M
11/01/2027 571.500 M
11/01/2028 581.500 M
Total Outstanding 490 M
26211 Central Park Blvd, Suite 508- Southfield, Michigan 48076313-963-0420 800-337-0696 Fax 313-963-0943 https://macmi.com
Municipal Advisory Council of Michigan
This report is prepared by the Municipal Advisory Council of Michigan (the “MAC”) and is intended solely for the use of its members. It is not an official statement of the issuer of the securities described below anddoes not constitute an offering of, or a recommendation to purchase, the securities. The information in or hyperlinked to this report has been obtained from or is provided by sources believed to be reliable, including
without limitation, the issuer, its agents, MAC records and/or public records prepared by various local, county, or state agencies of the State of Michigan. The MAC has not independently confirmed or verified theinformation in or hyperlinked to this report and does not guarantee the completeness or accuracy of such information. CUSIP® is a registered trademark of the American Bankers Association. Any CUSIP numbers
are provided solely for convenience, and no representation is made as to their correctness. The information is provided without any subjective assumptions, opinions, or views of the MAC. The MAC is notassociated with the State of Michigan or any other government entity.
Maturity Report
Direct Debt as of 9/22/2020
Copyright 2020 Municipal Advisory Council of Michigan9/22/2020 10:10:45 AM Page 9 of 23
140545751Page 62 of 229
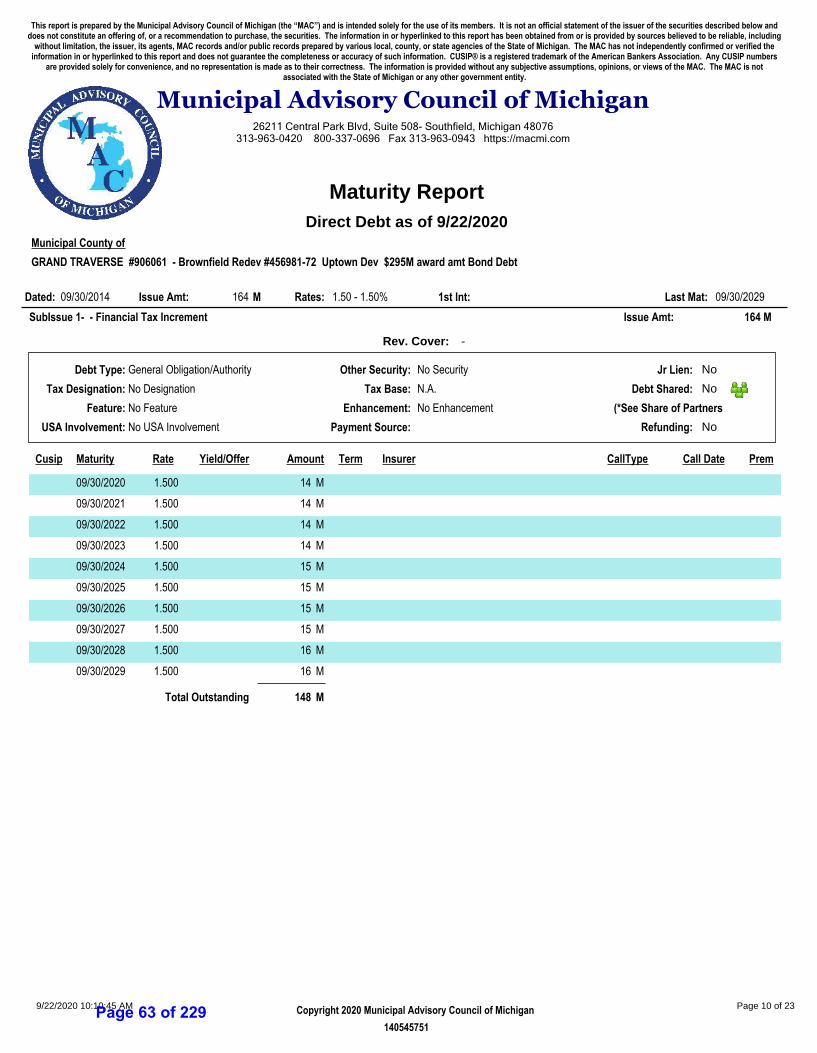
Municipal County of
GRAND TRAVERSE #906061 - Brownfield Redev #456981-72 Uptown Dev $295M award amt Bond Debt
09/30/2014 1.50 - 1.50% 09/30/2029164Dated: Issue Amt: Rates: 1st Int: Last Mat:M
Rev. Cover: -
SubIssue 1- - Financial Tax Increment 164Issue Amt: M
General Obligation/Authority
No Designation
No Feature
No USA Involvement
No Security
N.A.
No Enhancement
No
No
No
Debt Type:
Tax Designation:
Feature:
USA Involvement:
Other Security:
Tax Base:
Enhancement:
Payment Source:
Jr Lien:
Debt Shared:
Refunding:
(*See Share of Partners
Cusip Maturity Rate Yield/Offer Amount Term Insurer CallType Call Date Prem
09/30/2020 141.500 M
09/30/2021 141.500 M
09/30/2022 141.500 M
09/30/2023 141.500 M
09/30/2024 151.500 M
09/30/2025 151.500 M
09/30/2026 151.500 M
09/30/2027 151.500 M
09/30/2028 161.500 M
09/30/2029 161.500 M
Total Outstanding 148 M
26211 Central Park Blvd, Suite 508- Southfield, Michigan 48076313-963-0420 800-337-0696 Fax 313-963-0943 https://macmi.com
Municipal Advisory Council of Michigan
This report is prepared by the Municipal Advisory Council of Michigan (the “MAC”) and is intended solely for the use of its members. It is not an official statement of the issuer of the securities described below anddoes not constitute an offering of, or a recommendation to purchase, the securities. The information in or hyperlinked to this report has been obtained from or is provided by sources believed to be reliable, including
without limitation, the issuer, its agents, MAC records and/or public records prepared by various local, county, or state agencies of the State of Michigan. The MAC has not independently confirmed or verified theinformation in or hyperlinked to this report and does not guarantee the completeness or accuracy of such information. CUSIP® is a registered trademark of the American Bankers Association. Any CUSIP numbers
are provided solely for convenience, and no representation is made as to their correctness. The information is provided without any subjective assumptions, opinions, or views of the MAC. The MAC is notassociated with the State of Michigan or any other government entity.
Maturity Report
Direct Debt as of 9/22/2020
Copyright 2020 Municipal Advisory Council of Michigan9/22/2020 10:10:45 AM Page 10 of 23
140545751Page 63 of 229
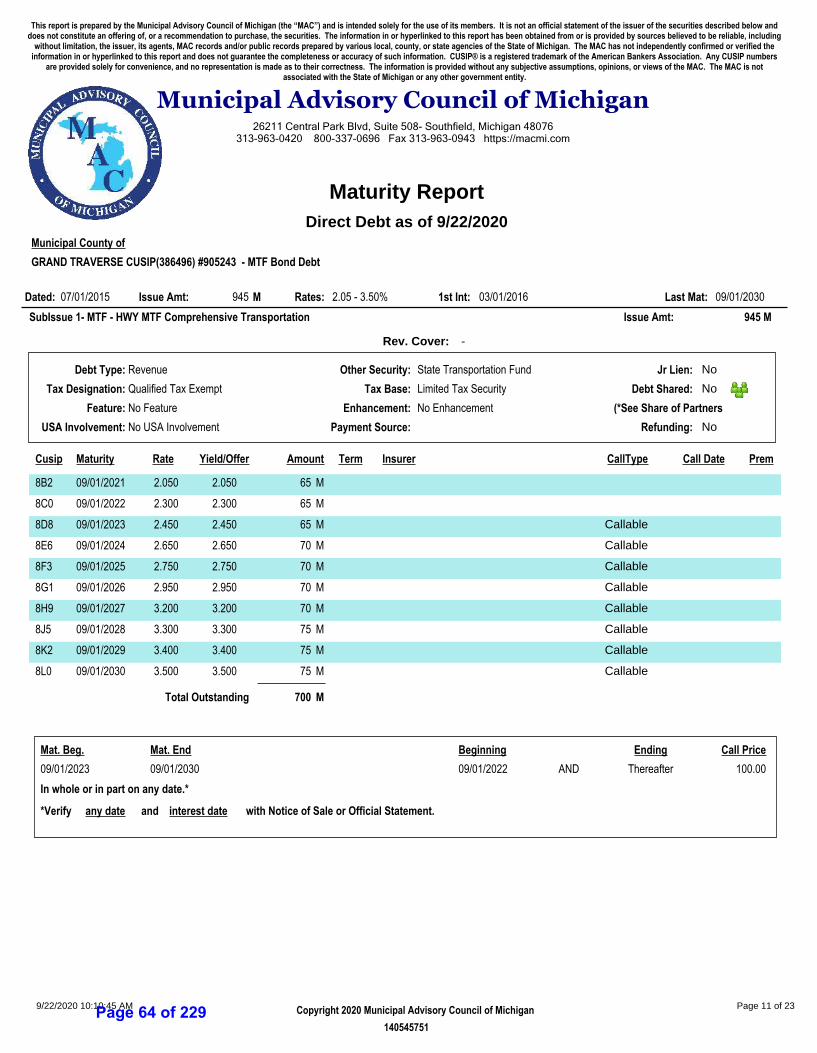
Municipal County of
GRAND TRAVERSE CUSIP(386496) #905243 - MTF Bond Debt
07/01/2015 2.05 - 3.50% 03/01/2016 09/01/2030945Dated: Issue Amt: Rates: 1st Int: Last Mat:M
Rev. Cover: -
SubIssue 1- MTF - HWY MTF Comprehensive Transportation 945Issue Amt: M
Revenue
Qualified Tax Exempt
No Feature
No USA Involvement
State Transportation Fund
Limited Tax Security
No Enhancement
No
No
No
Debt Type:
Tax Designation:
Feature:
USA Involvement:
Other Security:
Tax Base:
Enhancement:
Payment Source:
Jr Lien:
Debt Shared:
Refunding:
(*See Share of Partners
Cusip Maturity Rate Yield/Offer Amount Term Insurer CallType Call Date Prem
8B2 09/01/2021 2.050 652.050 M
8C0 09/01/2022 2.300 652.300 M
8D8 09/01/2023 2.450 652.450 CallableM
8E6 09/01/2024 2.650 702.650 CallableM
8F3 09/01/2025 2.750 702.750 CallableM
8G1 09/01/2026 2.950 702.950 CallableM
8H9 09/01/2027 3.200 703.200 CallableM
8J5 09/01/2028 3.300 753.300 CallableM
8K2 09/01/2029 3.400 753.400 CallableM
8L0 09/01/2030 3.500 753.500 CallableM
Total Outstanding 700 M
Mat. Beg. Mat. End Beginning Ending Call Price
09/01/2023 09/01/2030 09/01/2022 AND Thereafter 100.00
*Verify any date and interest date with Notice of Sale or Official Statement.
In whole or in part on any date.*
26211 Central Park Blvd, Suite 508- Southfield, Michigan 48076313-963-0420 800-337-0696 Fax 313-963-0943 https://macmi.com
Municipal Advisory Council of Michigan
This report is prepared by the Municipal Advisory Council of Michigan (the “MAC”) and is intended solely for the use of its members. It is not an official statement of the issuer of the securities described below anddoes not constitute an offering of, or a recommendation to purchase, the securities. The information in or hyperlinked to this report has been obtained from or is provided by sources believed to be reliable, including
without limitation, the issuer, its agents, MAC records and/or public records prepared by various local, county, or state agencies of the State of Michigan. The MAC has not independently confirmed or verified theinformation in or hyperlinked to this report and does not guarantee the completeness or accuracy of such information. CUSIP® is a registered trademark of the American Bankers Association. Any CUSIP numbers
are provided solely for convenience, and no representation is made as to their correctness. The information is provided without any subjective assumptions, opinions, or views of the MAC. The MAC is notassociated with the State of Michigan or any other government entity.
Maturity Report
Direct Debt as of 9/22/2020
Copyright 2020 Municipal Advisory Council of Michigan9/22/2020 10:10:45 AM Page 11 of 23
140545751Page 64 of 229
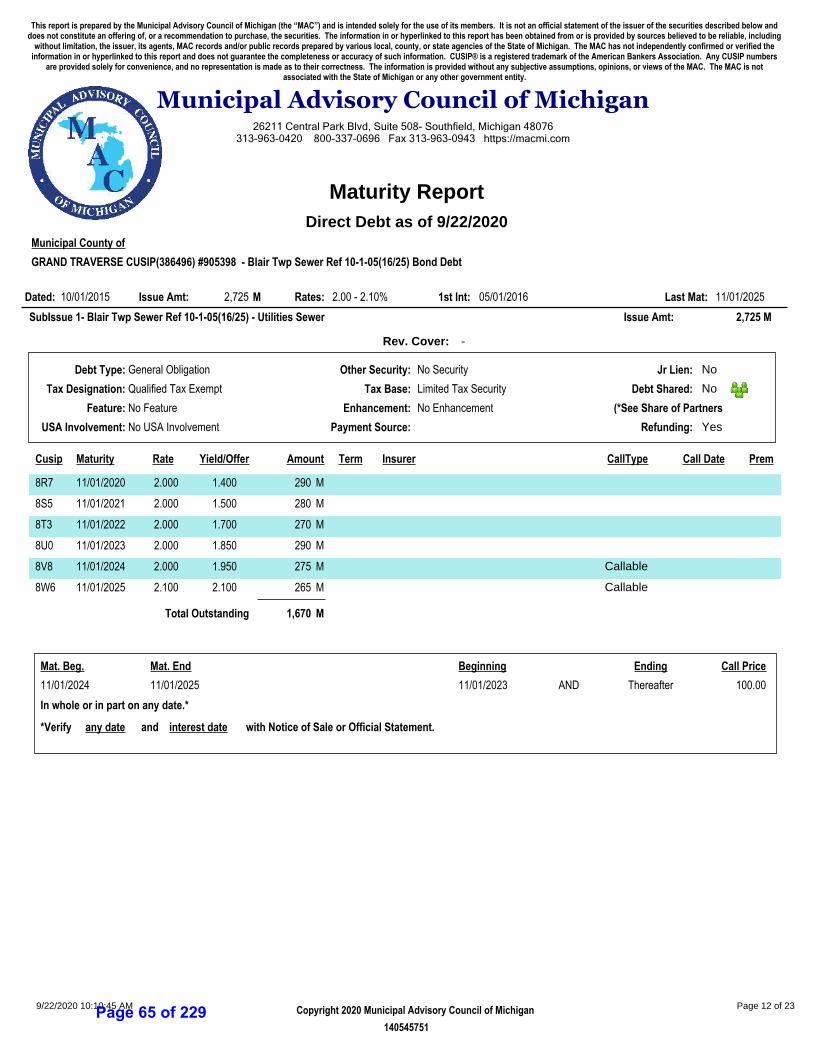
Municipal County of
GRAND TRAVERSE CUSIP(386496) #905398 - Blair Twp Sewer Ref 10-1-05(16/25) Bond Debt
10/01/2015 2.00 - 2.10% 05/01/2016 11/01/20252,725Dated: Issue Amt: Rates: 1st Int: Last Mat:M
Rev. Cover: -
SubIssue 1- Blair Twp Sewer Ref 10-1-05(16/25) - Utilities Sewer 2,725Issue Amt: M
General Obligation
Qualified Tax Exempt
No Feature
No USA Involvement
No Security
Limited Tax Security
No Enhancement
No
No
Yes
Debt Type:
Tax Designation:
Feature:
USA Involvement:
Other Security:
Tax Base:
Enhancement:
Payment Source:
Jr Lien:
Debt Shared:
Refunding:
(*See Share of Partners
Cusip Maturity Rate Yield/Offer Amount Term Insurer CallType Call Date Prem
8R7 11/01/2020 1.400 2902.000 M
8S5 11/01/2021 1.500 2802.000 M
8T3 11/01/2022 1.700 2702.000 M
8U0 11/01/2023 1.850 2902.000 M
8V8 11/01/2024 1.950 2752.000 CallableM
8W6 11/01/2025 2.100 2652.100 CallableM
Total Outstanding 1,670 M
Mat. Beg. Mat. End Beginning Ending Call Price
11/01/2024 11/01/2025 11/01/2023 AND Thereafter 100.00
*Verify any date and interest date with Notice of Sale or Official Statement.
In whole or in part on any date.*
26211 Central Park Blvd, Suite 508- Southfield, Michigan 48076313-963-0420 800-337-0696 Fax 313-963-0943 https://macmi.com
Municipal Advisory Council of Michigan
This report is prepared by the Municipal Advisory Council of Michigan (the “MAC”) and is intended solely for the use of its members. It is not an official statement of the issuer of the securities described below anddoes not constitute an offering of, or a recommendation to purchase, the securities. The information in or hyperlinked to this report has been obtained from or is provided by sources believed to be reliable, including
without limitation, the issuer, its agents, MAC records and/or public records prepared by various local, county, or state agencies of the State of Michigan. The MAC has not independently confirmed or verified theinformation in or hyperlinked to this report and does not guarantee the completeness or accuracy of such information. CUSIP® is a registered trademark of the American Bankers Association. Any CUSIP numbers
are provided solely for convenience, and no representation is made as to their correctness. The information is provided without any subjective assumptions, opinions, or views of the MAC. The MAC is notassociated with the State of Michigan or any other government entity.
Maturity Report
Direct Debt as of 9/22/2020
Copyright 2020 Municipal Advisory Council of Michigan9/22/2020 10:10:45 AM Page 12 of 23
140545751Page 65 of 229
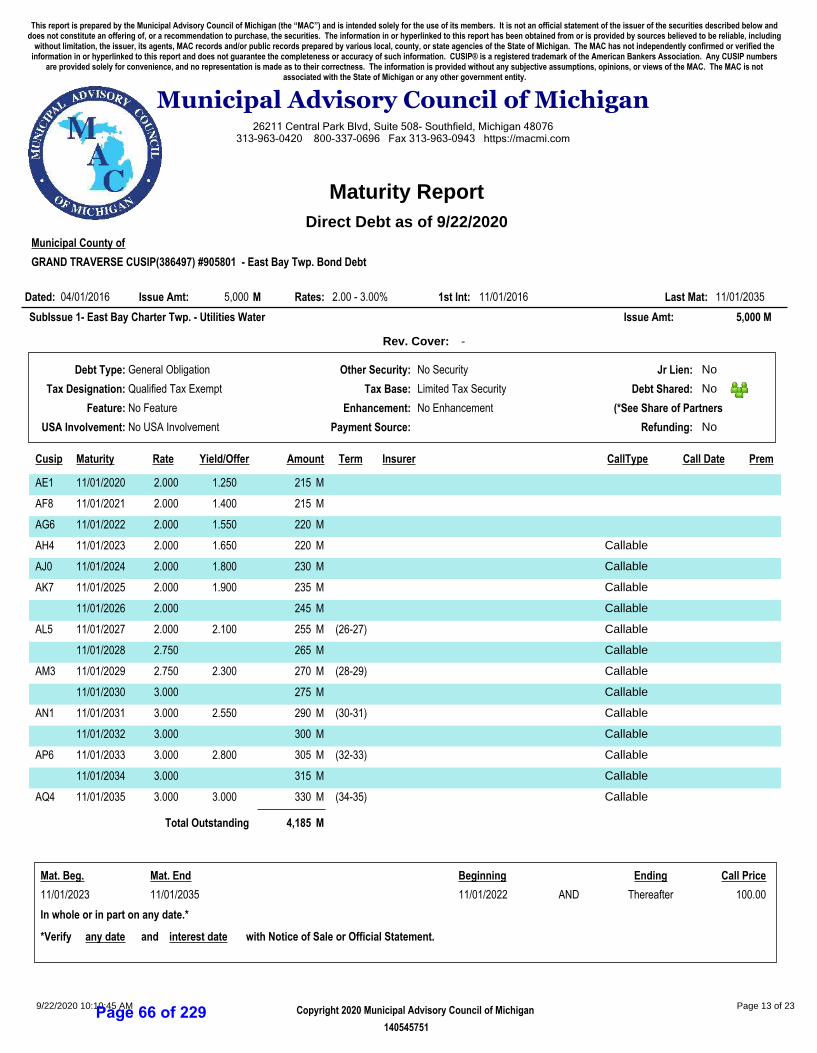
Municipal County of
GRAND TRAVERSE CUSIP(386497) #905801 - East Bay Twp. Bond Debt
04/01/2016 2.00 - 3.00% 11/01/2016 11/01/20355,000Dated: Issue Amt: Rates: 1st Int: Last Mat:M
Rev. Cover: -
SubIssue 1- East Bay Charter Twp. - Utilities Water 5,000Issue Amt: M
General Obligation
Qualified Tax Exempt
No Feature
No USA Involvement
No Security
Limited Tax Security
No Enhancement
No
No
No
Debt Type:
Tax Designation:
Feature:
USA Involvement:
Other Security:
Tax Base:
Enhancement:
Payment Source:
Jr Lien:
Debt Shared:
Refunding:
(*See Share of Partners
Cusip Maturity Rate Yield/Offer Amount Term Insurer CallType Call Date Prem
AE1 11/01/2020 1.250 2152.000 M
AF8 11/01/2021 1.400 2152.000 M
AG6 11/01/2022 1.550 2202.000 M
AH4 11/01/2023 1.650 2202.000 CallableM
AJ0 11/01/2024 1.800 2302.000 CallableM
AK7 11/01/2025 1.900 2352.000 CallableM
11/01/2026 2452.000 CallableM
AL5 11/01/2027 2.100 255 (26-27)2.000 CallableM
11/01/2028 2652.750 CallableM
AM3 11/01/2029 2.300 270 (28-29)2.750 CallableM
11/01/2030 2753.000 CallableM
AN1 11/01/2031 2.550 290 (30-31)3.000 CallableM
11/01/2032 3003.000 CallableM
AP6 11/01/2033 2.800 305 (32-33)3.000 CallableM
11/01/2034 3153.000 CallableM
AQ4 11/01/2035 3.000 330 (34-35)3.000 CallableM
Total Outstanding 4,185 M
Mat. Beg. Mat. End Beginning Ending Call Price
11/01/2023 11/01/2035 11/01/2022 AND Thereafter 100.00
*Verify any date and interest date with Notice of Sale or Official Statement.
In whole or in part on any date.*
26211 Central Park Blvd, Suite 508- Southfield, Michigan 48076313-963-0420 800-337-0696 Fax 313-963-0943 https://macmi.com
Municipal Advisory Council of Michigan
This report is prepared by the Municipal Advisory Council of Michigan (the “MAC”) and is intended solely for the use of its members. It is not an official statement of the issuer of the securities described below anddoes not constitute an offering of, or a recommendation to purchase, the securities. The information in or hyperlinked to this report has been obtained from or is provided by sources believed to be reliable, including
without limitation, the issuer, its agents, MAC records and/or public records prepared by various local, county, or state agencies of the State of Michigan. The MAC has not independently confirmed or verified theinformation in or hyperlinked to this report and does not guarantee the completeness or accuracy of such information. CUSIP® is a registered trademark of the American Bankers Association. Any CUSIP numbers
are provided solely for convenience, and no representation is made as to their correctness. The information is provided without any subjective assumptions, opinions, or views of the MAC. The MAC is notassociated with the State of Michigan or any other government entity.
Maturity Report
Direct Debt as of 9/22/2020
Copyright 2020 Municipal Advisory Council of Michigan9/22/2020 10:10:45 AM Page 13 of 23
140545751Page 66 of 229
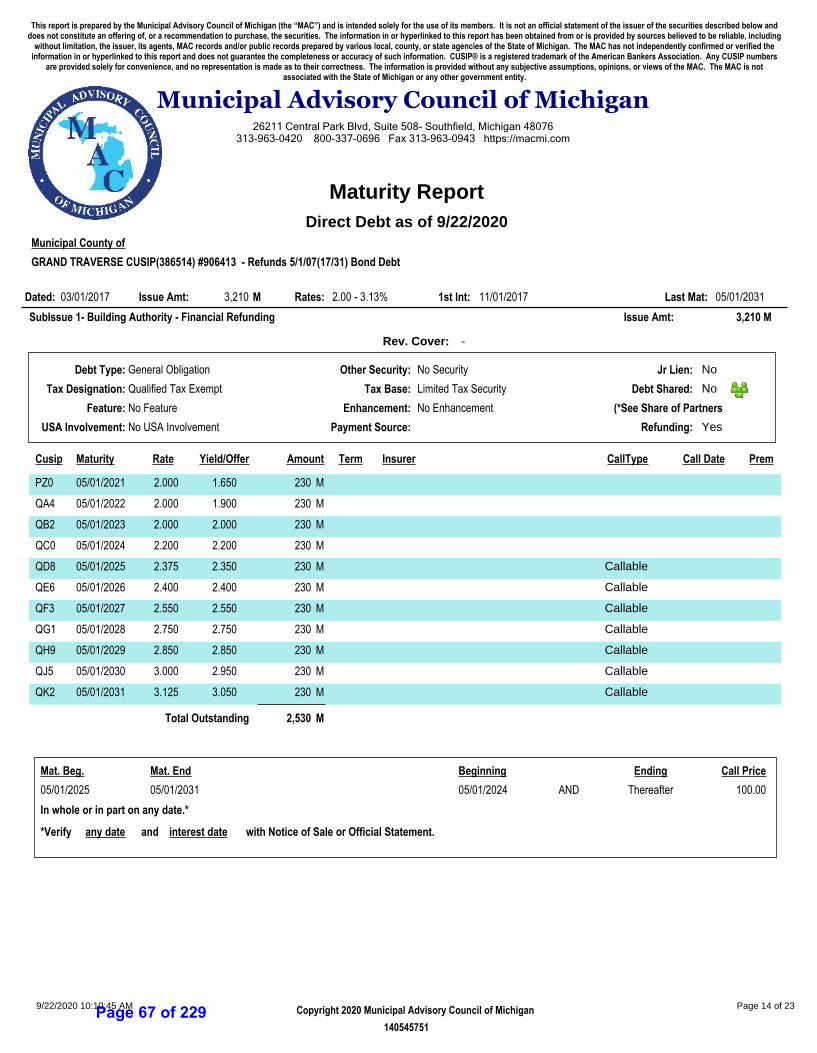
Municipal County of
GRAND TRAVERSE CUSIP(386514) #906413 - Refunds 5/1/07(17/31) Bond Debt
03/01/2017 2.00 - 3.13% 11/01/2017 05/01/20313,210Dated: Issue Amt: Rates: 1st Int: Last Mat:M
Rev. Cover: -
SubIssue 1- Building Authority - Financial Refunding 3,210Issue Amt: M
General Obligation
Qualified Tax Exempt
No Feature
No USA Involvement
No Security
Limited Tax Security
No Enhancement
No
No
Yes
Debt Type:
Tax Designation:
Feature:
USA Involvement:
Other Security:
Tax Base:
Enhancement:
Payment Source:
Jr Lien:
Debt Shared:
Refunding:
(*See Share of Partners
Cusip Maturity Rate Yield/Offer Amount Term Insurer CallType Call Date Prem
PZ0 05/01/2021 1.650 2302.000 M
QA4 05/01/2022 1.900 2302.000 M
QB2 05/01/2023 2.000 2302.000 M
QC0 05/01/2024 2.200 2302.200 M
QD8 05/01/2025 2.350 2302.375 CallableM
QE6 05/01/2026 2.400 2302.400 CallableM
QF3 05/01/2027 2.550 2302.550 CallableM
QG1 05/01/2028 2.750 2302.750 CallableM
QH9 05/01/2029 2.850 2302.850 CallableM
QJ5 05/01/2030 2.950 2303.000 CallableM
QK2 05/01/2031 3.050 2303.125 CallableM
Total Outstanding 2,530 M
Mat. Beg. Mat. End Beginning Ending Call Price
05/01/2025 05/01/2031 05/01/2024 AND Thereafter 100.00
*Verify any date and interest date with Notice of Sale or Official Statement.
In whole or in part on any date.*
26211 Central Park Blvd, Suite 508- Southfield, Michigan 48076313-963-0420 800-337-0696 Fax 313-963-0943 https://macmi.com
Municipal Advisory Council of Michigan
This report is prepared by the Municipal Advisory Council of Michigan (the “MAC”) and is intended solely for the use of its members. It is not an official statement of the issuer of the securities described below anddoes not constitute an offering of, or a recommendation to purchase, the securities. The information in or hyperlinked to this report has been obtained from or is provided by sources believed to be reliable, including
without limitation, the issuer, its agents, MAC records and/or public records prepared by various local, county, or state agencies of the State of Michigan. The MAC has not independently confirmed or verified theinformation in or hyperlinked to this report and does not guarantee the completeness or accuracy of such information. CUSIP® is a registered trademark of the American Bankers Association. Any CUSIP numbers
are provided solely for convenience, and no representation is made as to their correctness. The information is provided without any subjective assumptions, opinions, or views of the MAC. The MAC is notassociated with the State of Michigan or any other government entity.
Maturity Report
Direct Debt as of 9/22/2020
Copyright 2020 Municipal Advisory Council of Michigan9/22/2020 10:10:45 AM Page 14 of 23
140545751Page 67 of 229
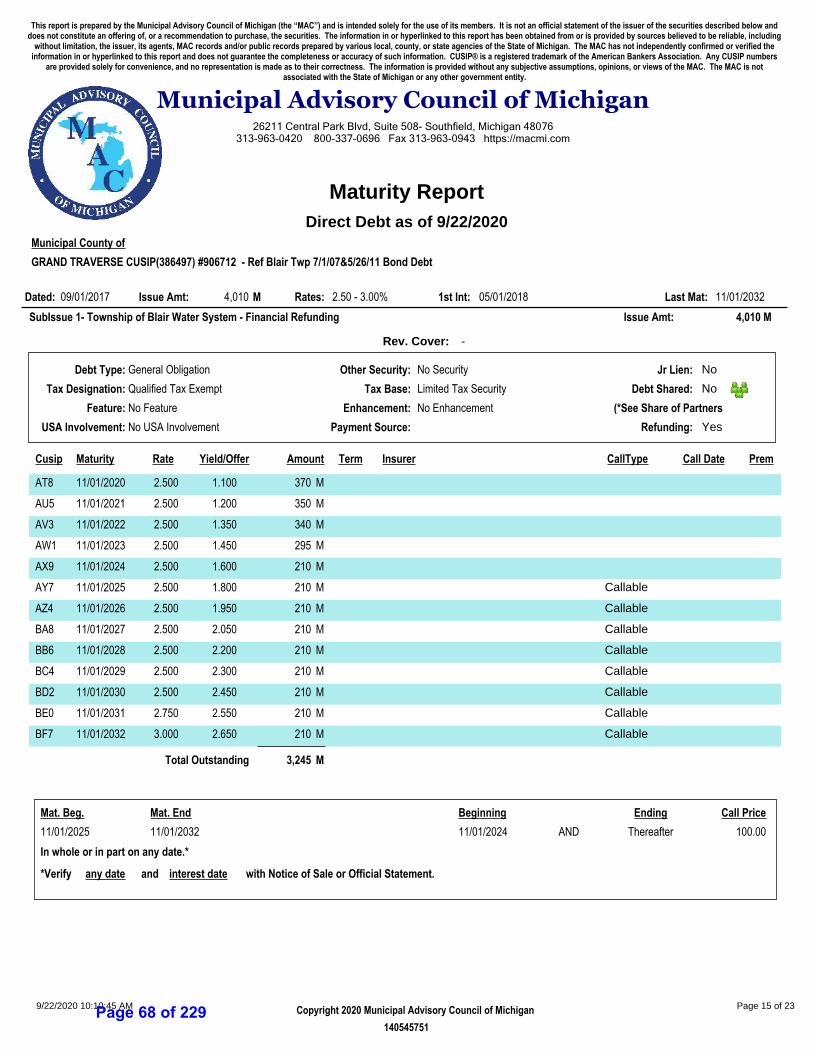
Municipal County of
GRAND TRAVERSE CUSIP(386497) #906712 - Ref Blair Twp 7/1/07&5/26/11 Bond Debt
09/01/2017 2.50 - 3.00% 05/01/2018 11/01/20324,010Dated: Issue Amt: Rates: 1st Int: Last Mat:M
Rev. Cover: -
SubIssue 1- Township of Blair Water System - Financial Refunding 4,010Issue Amt: M
General Obligation
Qualified Tax Exempt
No Feature
No USA Involvement
No Security
Limited Tax Security
No Enhancement
No
No
Yes
Debt Type:
Tax Designation:
Feature:
USA Involvement:
Other Security:
Tax Base:
Enhancement:
Payment Source:
Jr Lien:
Debt Shared:
Refunding:
(*See Share of Partners
Cusip Maturity Rate Yield/Offer Amount Term Insurer CallType Call Date Prem
AT8 11/01/2020 1.100 3702.500 M
AU5 11/01/2021 1.200 3502.500 M
AV3 11/01/2022 1.350 3402.500 M
AW1 11/01/2023 1.450 2952.500 M
AX9 11/01/2024 1.600 2102.500 M
AY7 11/01/2025 1.800 2102.500 CallableM
AZ4 11/01/2026 1.950 2102.500 CallableM
BA8 11/01/2027 2.050 2102.500 CallableM
BB6 11/01/2028 2.200 2102.500 CallableM
BC4 11/01/2029 2.300 2102.500 CallableM
BD2 11/01/2030 2.450 2102.500 CallableM
BE0 11/01/2031 2.550 2102.750 CallableM
BF7 11/01/2032 2.650 2103.000 CallableM
Total Outstanding 3,245 M
Mat. Beg. Mat. End Beginning Ending Call Price
11/01/2025 11/01/2032 11/01/2024 AND Thereafter 100.00
*Verify any date and interest date with Notice of Sale or Official Statement.
In whole or in part on any date.*
26211 Central Park Blvd, Suite 508- Southfield, Michigan 48076313-963-0420 800-337-0696 Fax 313-963-0943 https://macmi.com
Municipal Advisory Council of Michigan
This report is prepared by the Municipal Advisory Council of Michigan (the “MAC”) and is intended solely for the use of its members. It is not an official statement of the issuer of the securities described below anddoes not constitute an offering of, or a recommendation to purchase, the securities. The information in or hyperlinked to this report has been obtained from or is provided by sources believed to be reliable, including
without limitation, the issuer, its agents, MAC records and/or public records prepared by various local, county, or state agencies of the State of Michigan. The MAC has not independently confirmed or verified theinformation in or hyperlinked to this report and does not guarantee the completeness or accuracy of such information. CUSIP® is a registered trademark of the American Bankers Association. Any CUSIP numbers
are provided solely for convenience, and no representation is made as to their correctness. The information is provided without any subjective assumptions, opinions, or views of the MAC. The MAC is notassociated with the State of Michigan or any other government entity.
Maturity Report
Direct Debt as of 9/22/2020
Copyright 2020 Municipal Advisory Council of Michigan9/22/2020 10:10:45 AM Page 15 of 23
140545751Page 68 of 229
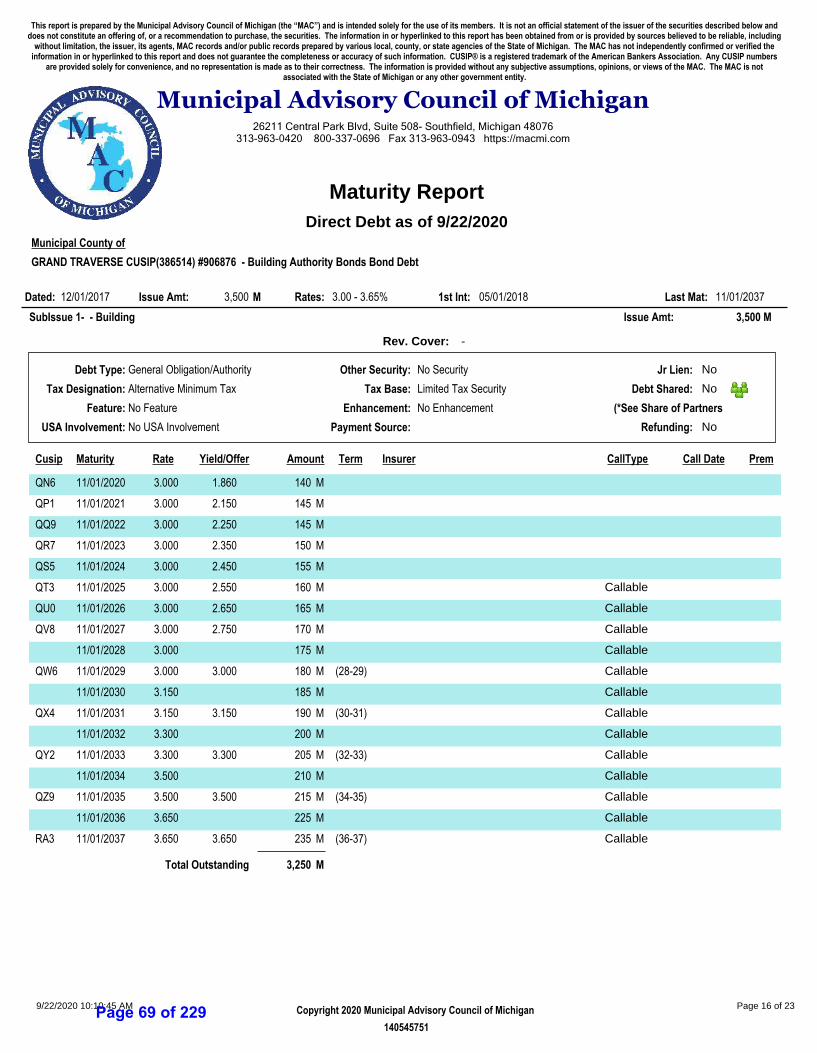
Municipal County of
GRAND TRAVERSE CUSIP(386514) #906876 - Building Authority Bonds Bond Debt
12/01/2017 3.00 - 3.65% 05/01/2018 11/01/20373,500Dated: Issue Amt: Rates: 1st Int: Last Mat:M
Rev. Cover: -
SubIssue 1- - Building 3,500Issue Amt: M
General Obligation/Authority
Alternative Minimum Tax
No Feature
No USA Involvement
No Security
Limited Tax Security
No Enhancement
No
No
No
Debt Type:
Tax Designation:
Feature:
USA Involvement:
Other Security:
Tax Base:
Enhancement:
Payment Source:
Jr Lien:
Debt Shared:
Refunding:
(*See Share of Partners
Cusip Maturity Rate Yield/Offer Amount Term Insurer CallType Call Date Prem
QN6 11/01/2020 1.860 1403.000 M
QP1 11/01/2021 2.150 1453.000 M
QQ9 11/01/2022 2.250 1453.000 M
QR7 11/01/2023 2.350 1503.000 M
QS5 11/01/2024 2.450 1553.000 M
QT3 11/01/2025 2.550 1603.000 CallableM
QU0 11/01/2026 2.650 1653.000 CallableM
QV8 11/01/2027 2.750 1703.000 CallableM
11/01/2028 1753.000 CallableM
QW6 11/01/2029 3.000 180 (28-29)3.000 CallableM
11/01/2030 1853.150 CallableM
QX4 11/01/2031 3.150 190 (30-31)3.150 CallableM
11/01/2032 2003.300 CallableM
QY2 11/01/2033 3.300 205 (32-33)3.300 CallableM
11/01/2034 2103.500 CallableM
QZ9 11/01/2035 3.500 215 (34-35)3.500 CallableM
11/01/2036 2253.650 CallableM
RA3 11/01/2037 3.650 235 (36-37)3.650 CallableM
Total Outstanding 3,250 M
26211 Central Park Blvd, Suite 508- Southfield, Michigan 48076313-963-0420 800-337-0696 Fax 313-963-0943 https://macmi.com
Municipal Advisory Council of Michigan
This report is prepared by the Municipal Advisory Council of Michigan (the “MAC”) and is intended solely for the use of its members. It is not an official statement of the issuer of the securities described below anddoes not constitute an offering of, or a recommendation to purchase, the securities. The information in or hyperlinked to this report has been obtained from or is provided by sources believed to be reliable, including
without limitation, the issuer, its agents, MAC records and/or public records prepared by various local, county, or state agencies of the State of Michigan. The MAC has not independently confirmed or verified theinformation in or hyperlinked to this report and does not guarantee the completeness or accuracy of such information. CUSIP® is a registered trademark of the American Bankers Association. Any CUSIP numbers
are provided solely for convenience, and no representation is made as to their correctness. The information is provided without any subjective assumptions, opinions, or views of the MAC. The MAC is notassociated with the State of Michigan or any other government entity.
Maturity Report
Direct Debt as of 9/22/2020
Copyright 2020 Municipal Advisory Council of Michigan9/22/2020 10:10:45 AM Page 16 of 23
140545751Page 69 of 229
26211 Central Park Blvd, Suite 508- Southfield, Michigan 48076313-963-0420 800-337-0696 Fax 313-963-0943 https://macmi.com
Municipal Advisory Council of Michigan
This report is prepared by the Municipal Advisory Council of Michigan (the “MAC”) and is intended solely for the use of its members. It is not an official statement of the issuer of the securities described below anddoes not constitute an offering of, or a recommendation to purchase, the securities. The information in or hyperlinked to this report has been obtained from or is provided by sources believed to be reliable, including
without limitation, the issuer, its agents, MAC records and/or public records prepared by various local, county, or state agencies of the State of Michigan. The MAC has not independently confirmed or verified theinformation in or hyperlinked to this report and does not guarantee the completeness or accuracy of such information. CUSIP® is a registered trademark of the American Bankers Association. Any CUSIP numbers
are provided solely for convenience, and no representation is made as to their correctness. The information is provided without any subjective assumptions, opinions, or views of the MAC. The MAC is notassociated with the State of Michigan or any other government entity.
Maturity Report
Direct Debt as of 9/22/2020
Mat. Beg. Mat. End Beginning Ending Call Price
11/01/2025 11/01/2037 11/01/2024 AND Thereafter 100.00
*Verify any date and interest date with Notice of Sale or Official Statement.
In whole or in part on any date.*
Copyright 2020 Municipal Advisory Council of Michigan9/22/2020 10:10:45 AM Page 17 of 23
140545751Page 70 of 229
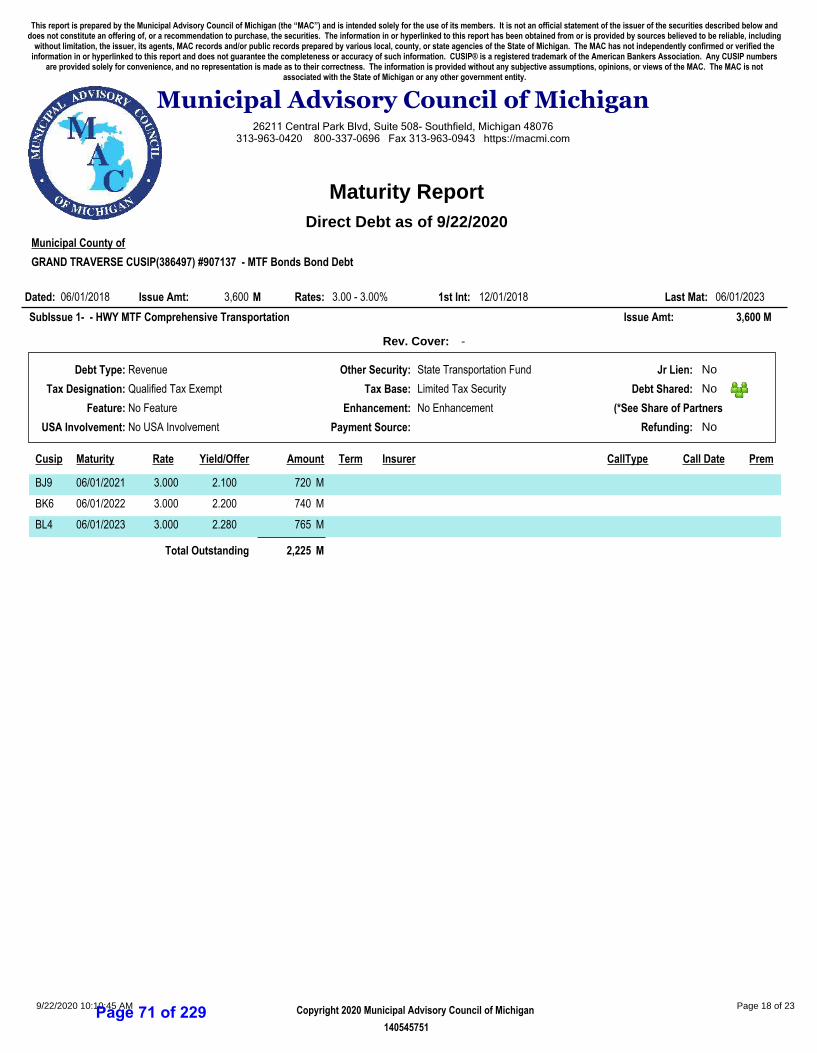
Municipal County of
GRAND TRAVERSE CUSIP(386497) #907137 - MTF Bonds Bond Debt
06/01/2018 3.00 - 3.00% 12/01/2018 06/01/20233,600Dated: Issue Amt: Rates: 1st Int: Last Mat:M
Rev. Cover: -
SubIssue 1- - HWY MTF Comprehensive Transportation 3,600Issue Amt: M
Revenue
Qualified Tax Exempt
No Feature
No USA Involvement
State Transportation Fund
Limited Tax Security
No Enhancement
No
No
No
Debt Type:
Tax Designation:
Feature:
USA Involvement:
Other Security:
Tax Base:
Enhancement:
Payment Source:
Jr Lien:
Debt Shared:
Refunding:
(*See Share of Partners
Cusip Maturity Rate Yield/Offer Amount Term Insurer CallType Call Date Prem
BJ9 06/01/2021 2.100 7203.000 M
BK6 06/01/2022 2.200 7403.000 M
BL4 06/01/2023 2.280 7653.000 M
Total Outstanding 2,225 M
26211 Central Park Blvd, Suite 508- Southfield, Michigan 48076313-963-0420 800-337-0696 Fax 313-963-0943 https://macmi.com
Municipal Advisory Council of Michigan
This report is prepared by the Municipal Advisory Council of Michigan (the “MAC”) and is intended solely for the use of its members. It is not an official statement of the issuer of the securities described below anddoes not constitute an offering of, or a recommendation to purchase, the securities. The information in or hyperlinked to this report has been obtained from or is provided by sources believed to be reliable, including
without limitation, the issuer, its agents, MAC records and/or public records prepared by various local, county, or state agencies of the State of Michigan. The MAC has not independently confirmed or verified theinformation in or hyperlinked to this report and does not guarantee the completeness or accuracy of such information. CUSIP® is a registered trademark of the American Bankers Association. Any CUSIP numbers
are provided solely for convenience, and no representation is made as to their correctness. The information is provided without any subjective assumptions, opinions, or views of the MAC. The MAC is notassociated with the State of Michigan or any other government entity.
Maturity Report
Direct Debt as of 9/22/2020
Copyright 2020 Municipal Advisory Council of Michigan9/22/2020 10:10:45 AM Page 18 of 23
140545751Page 71 of 229
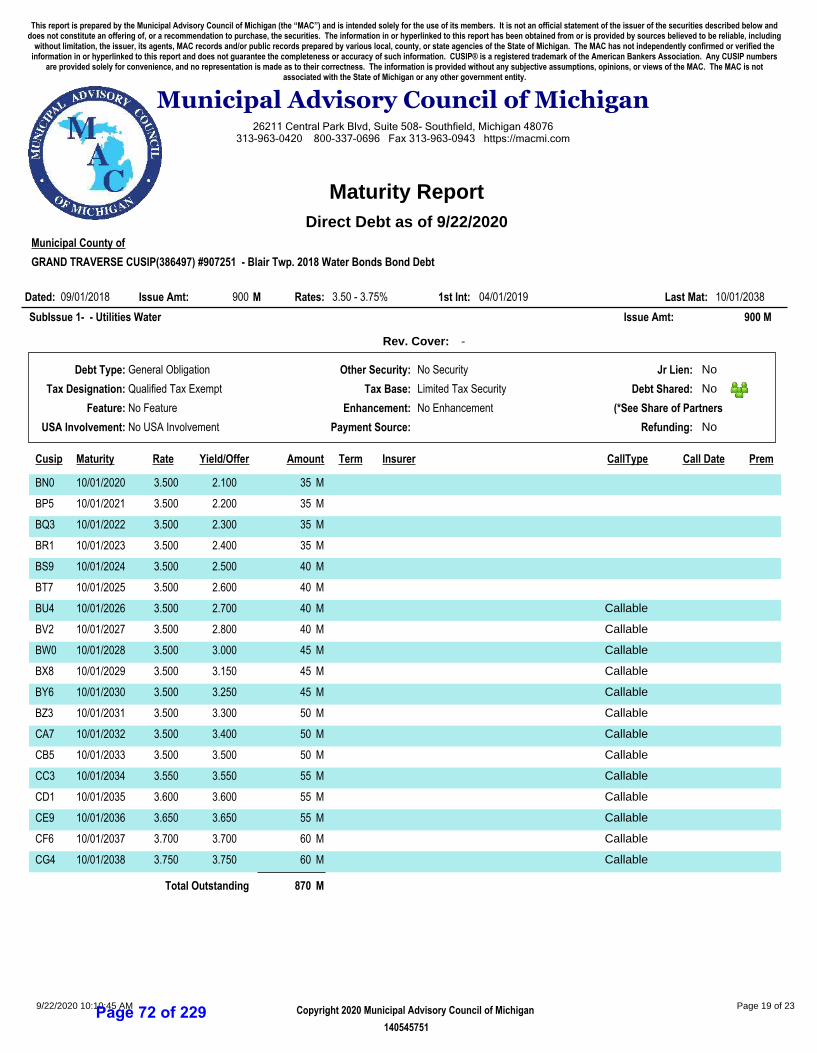
Municipal County of
GRAND TRAVERSE CUSIP(386497) #907251 - Blair Twp. 2018 Water Bonds Bond Debt
09/01/2018 3.50 - 3.75% 04/01/2019 10/01/2038900Dated: Issue Amt: Rates: 1st Int: Last Mat:M
Rev. Cover: -
SubIssue 1- - Utilities Water 900Issue Amt: M
General Obligation
Qualified Tax Exempt
No Feature
No USA Involvement
No Security
Limited Tax Security
No Enhancement
No
No
No
Debt Type:
Tax Designation:
Feature:
USA Involvement:
Other Security:
Tax Base:
Enhancement:
Payment Source:
Jr Lien:
Debt Shared:
Refunding:
(*See Share of Partners
Cusip Maturity Rate Yield/Offer Amount Term Insurer CallType Call Date Prem
BN0 10/01/2020 2.100 353.500 M
BP5 10/01/2021 2.200 353.500 M
BQ3 10/01/2022 2.300 353.500 M
BR1 10/01/2023 2.400 353.500 M
BS9 10/01/2024 2.500 403.500 M
BT7 10/01/2025 2.600 403.500 M
BU4 10/01/2026 2.700 403.500 CallableM
BV2 10/01/2027 2.800 403.500 CallableM
BW0 10/01/2028 3.000 453.500 CallableM
BX8 10/01/2029 3.150 453.500 CallableM
BY6 10/01/2030 3.250 453.500 CallableM
BZ3 10/01/2031 3.300 503.500 CallableM
CA7 10/01/2032 3.400 503.500 CallableM
CB5 10/01/2033 3.500 503.500 CallableM
CC3 10/01/2034 3.550 553.550 CallableM
CD1 10/01/2035 3.600 553.600 CallableM
CE9 10/01/2036 3.650 553.650 CallableM
CF6 10/01/2037 3.700 603.700 CallableM
CG4 10/01/2038 3.750 603.750 CallableM
Total Outstanding 870 M
26211 Central Park Blvd, Suite 508- Southfield, Michigan 48076313-963-0420 800-337-0696 Fax 313-963-0943 https://macmi.com
Municipal Advisory Council of Michigan
This report is prepared by the Municipal Advisory Council of Michigan (the “MAC”) and is intended solely for the use of its members. It is not an official statement of the issuer of the securities described below anddoes not constitute an offering of, or a recommendation to purchase, the securities. The information in or hyperlinked to this report has been obtained from or is provided by sources believed to be reliable, including
without limitation, the issuer, its agents, MAC records and/or public records prepared by various local, county, or state agencies of the State of Michigan. The MAC has not independently confirmed or verified theinformation in or hyperlinked to this report and does not guarantee the completeness or accuracy of such information. CUSIP® is a registered trademark of the American Bankers Association. Any CUSIP numbers
are provided solely for convenience, and no representation is made as to their correctness. The information is provided without any subjective assumptions, opinions, or views of the MAC. The MAC is notassociated with the State of Michigan or any other government entity.
Maturity Report
Direct Debt as of 9/22/2020
Copyright 2020 Municipal Advisory Council of Michigan9/22/2020 10:10:45 AM Page 19 of 23
140545751Page 72 of 229
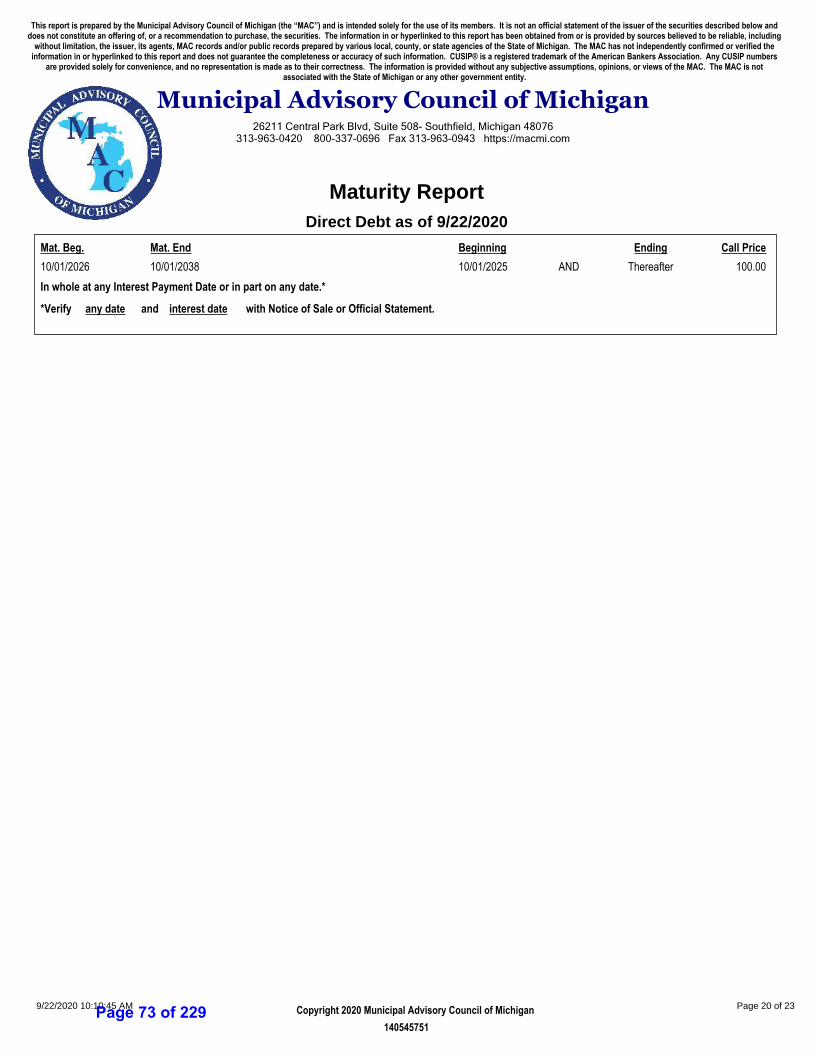
26211 Central Park Blvd, Suite 508- Southfield, Michigan 48076313-963-0420 800-337-0696 Fax 313-963-0943 https://macmi.com
Municipal Advisory Council of Michigan
This report is prepared by the Municipal Advisory Council of Michigan (the “MAC”) and is intended solely for the use of its members. It is not an official statement of the issuer of the securities described below anddoes not constitute an offering of, or a recommendation to purchase, the securities. The information in or hyperlinked to this report has been obtained from or is provided by sources believed to be reliable, including
without limitation, the issuer, its agents, MAC records and/or public records prepared by various local, county, or state agencies of the State of Michigan. The MAC has not independently confirmed or verified theinformation in or hyperlinked to this report and does not guarantee the completeness or accuracy of such information. CUSIP® is a registered trademark of the American Bankers Association. Any CUSIP numbers
are provided solely for convenience, and no representation is made as to their correctness. The information is provided without any subjective assumptions, opinions, or views of the MAC. The MAC is notassociated with the State of Michigan or any other government entity.
Maturity Report
Direct Debt as of 9/22/2020
Mat. Beg. Mat. End Beginning Ending Call Price
10/01/2026 10/01/2038 10/01/2025 AND Thereafter 100.00
*Verify any date and interest date with Notice of Sale or Official Statement.
In whole at any Interest Payment Date or in part on any date.*
Copyright 2020 Municipal Advisory Council of Michigan9/22/2020 10:10:45 AM Page 20 of 23
140545751Page 73 of 229

Municipal County of
GRAND TRAVERSE #907613 - Traverse City WW Treatment Plant Ref 4-1-2011 Bond Debt
03/27/2019 2.36 - 2.36% 11/01/2019 05/01/20226,474Dated: Issue Amt: Rates: 1st Int: Last Mat:M
Rev. Cover: -
SubIssue 1- - Utilities Water Waste 6,474Issue Amt: M
General Obligation
No Designation
No Feature
No USA Involvement
No Security
Limited Tax Security
No Enhancement
No
Yes*
Yes
Debt Type:
Tax Designation:
Feature:
USA Involvement:
Other Security:
Tax Base:
Enhancement:
Payment Source:
Jr Lien:
Debt Shared:
Refunding:
(*See Share of Partners
Cusip Maturity Rate Yield/Offer Amount Term Insurer CallType Call Date Prem
05/01/2021 2.360 2,1592.360 M
05/01/2022 2.360 2,1972.360 M
Total Outstanding 4,356 M
26211 Central Park Blvd, Suite 508- Southfield, Michigan 48076313-963-0420 800-337-0696 Fax 313-963-0943 https://macmi.com
Municipal Advisory Council of Michigan
This report is prepared by the Municipal Advisory Council of Michigan (the “MAC”) and is intended solely for the use of its members. It is not an official statement of the issuer of the securities described below anddoes not constitute an offering of, or a recommendation to purchase, the securities. The information in or hyperlinked to this report has been obtained from or is provided by sources believed to be reliable, including
without limitation, the issuer, its agents, MAC records and/or public records prepared by various local, county, or state agencies of the State of Michigan. The MAC has not independently confirmed or verified theinformation in or hyperlinked to this report and does not guarantee the completeness or accuracy of such information. CUSIP® is a registered trademark of the American Bankers Association. Any CUSIP numbers
are provided solely for convenience, and no representation is made as to their correctness. The information is provided without any subjective assumptions, opinions, or views of the MAC. The MAC is notassociated with the State of Michigan or any other government entity.
Maturity Report
Direct Debt as of 9/22/2020
Copyright 2020 Municipal Advisory Council of Michigan9/22/2020 10:10:45 AM Page 21 of 23
140545751Page 74 of 229
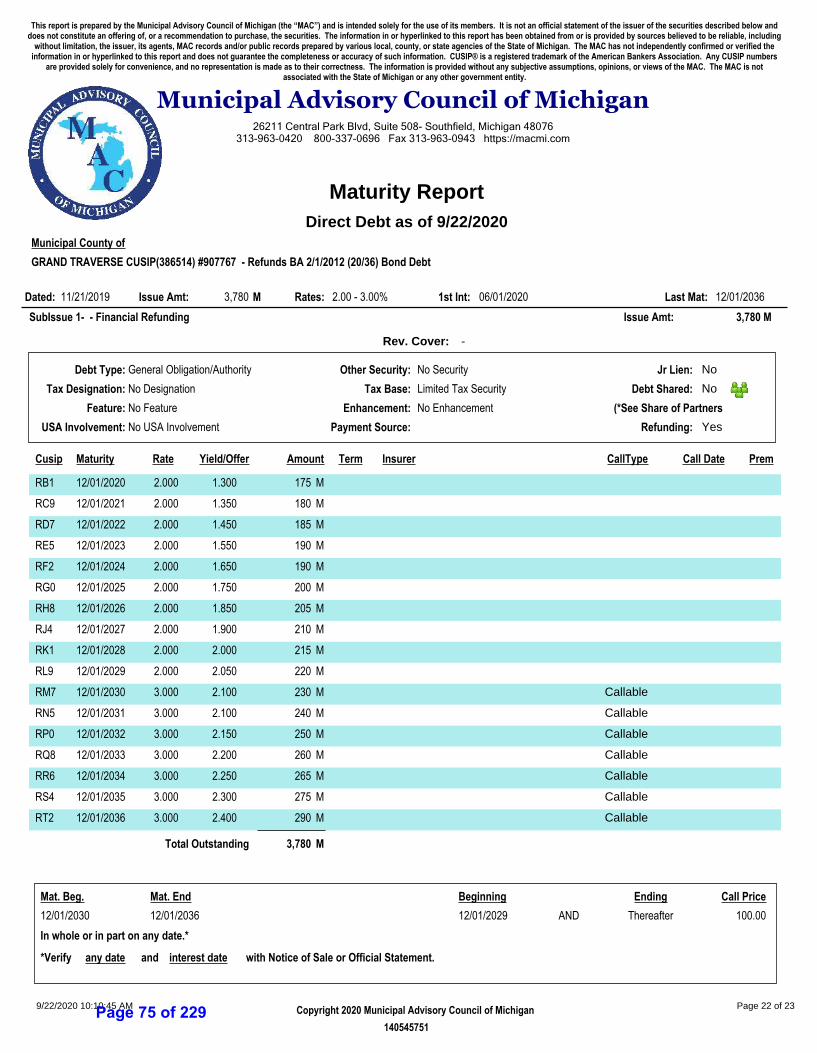
Municipal County of
GRAND TRAVERSE CUSIP(386514) #907767 - Refunds BA 2/1/2012 (20/36) Bond Debt
11/21/2019 2.00 - 3.00% 06/01/2020 12/01/20363,780Dated: Issue Amt: Rates: 1st Int: Last Mat:M
Rev. Cover: -
SubIssue 1- - Financial Refunding 3,780Issue Amt: M
General Obligation/Authority
No Designation
No Feature
No USA Involvement
No Security
Limited Tax Security
No Enhancement
No
No
Yes
Debt Type:
Tax Designation:
Feature:
USA Involvement:
Other Security:
Tax Base:
Enhancement:
Payment Source:
Jr Lien:
Debt Shared:
Refunding:
(*See Share of Partners
Cusip Maturity Rate Yield/Offer Amount Term Insurer CallType Call Date Prem
RB1 12/01/2020 1.300 1752.000 M
RC9 12/01/2021 1.350 1802.000 M
RD7 12/01/2022 1.450 1852.000 M
RE5 12/01/2023 1.550 1902.000 M
RF2 12/01/2024 1.650 1902.000 M
RG0 12/01/2025 1.750 2002.000 M
RH8 12/01/2026 1.850 2052.000 M
RJ4 12/01/2027 1.900 2102.000 M
RK1 12/01/2028 2.000 2152.000 M
RL9 12/01/2029 2.050 2202.000 M
RM7 12/01/2030 2.100 2303.000 CallableM
RN5 12/01/2031 2.100 2403.000 CallableM
RP0 12/01/2032 2.150 2503.000 CallableM
RQ8 12/01/2033 2.200 2603.000 CallableM
RR6 12/01/2034 2.250 2653.000 CallableM
RS4 12/01/2035 2.300 2753.000 CallableM
RT2 12/01/2036 2.400 2903.000 CallableM
Total Outstanding 3,780 M
Mat. Beg. Mat. End Beginning Ending Call Price
12/01/2030 12/01/2036 12/01/2029 AND Thereafter 100.00
*Verify any date and interest date with Notice of Sale or Official Statement.
In whole or in part on any date.*
26211 Central Park Blvd, Suite 508- Southfield, Michigan 48076313-963-0420 800-337-0696 Fax 313-963-0943 https://macmi.com
Municipal Advisory Council of Michigan
This report is prepared by the Municipal Advisory Council of Michigan (the “MAC”) and is intended solely for the use of its members. It is not an official statement of the issuer of the securities described below anddoes not constitute an offering of, or a recommendation to purchase, the securities. The information in or hyperlinked to this report has been obtained from or is provided by sources believed to be reliable, including
without limitation, the issuer, its agents, MAC records and/or public records prepared by various local, county, or state agencies of the State of Michigan. The MAC has not independently confirmed or verified theinformation in or hyperlinked to this report and does not guarantee the completeness or accuracy of such information. CUSIP® is a registered trademark of the American Bankers Association. Any CUSIP numbers
are provided solely for convenience, and no representation is made as to their correctness. The information is provided without any subjective assumptions, opinions, or views of the MAC. The MAC is notassociated with the State of Michigan or any other government entity.
Maturity Report
Direct Debt as of 9/22/2020
Copyright 2020 Municipal Advisory Council of Michigan9/22/2020 10:10:45 AM Page 22 of 23
140545751Page 75 of 229
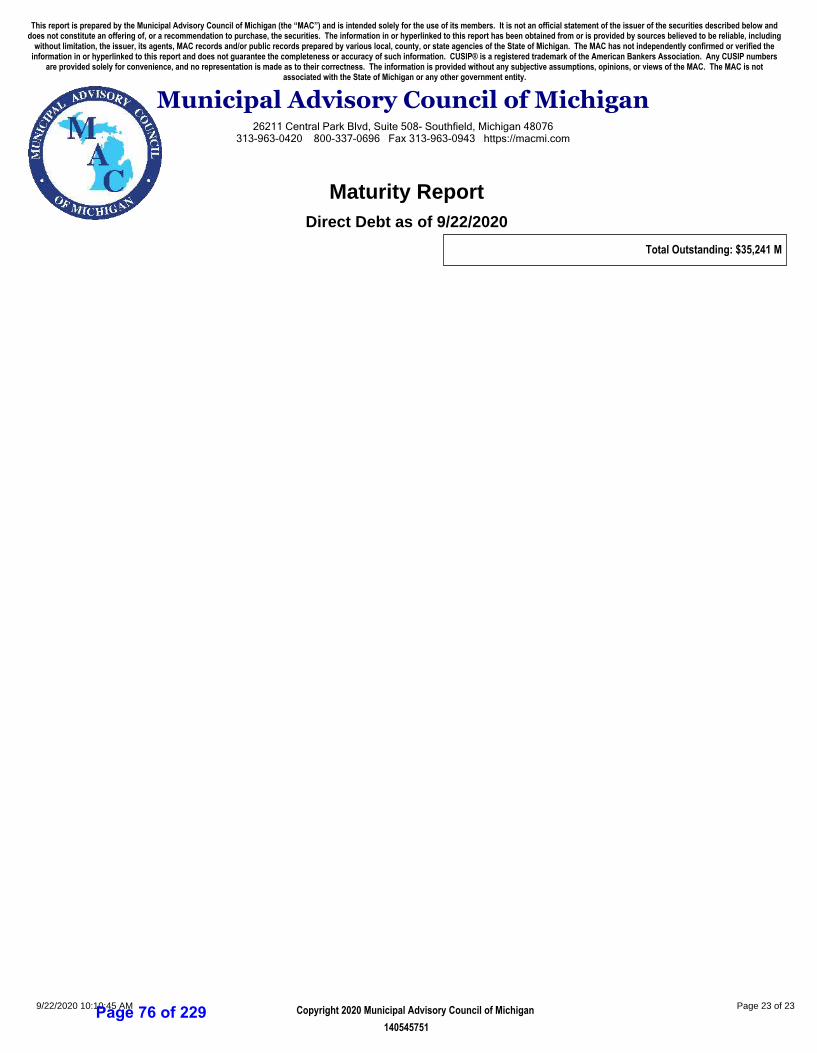
26211 Central Park Blvd, Suite 508- Southfield, Michigan 48076313-963-0420 800-337-0696 Fax 313-963-0943 https://macmi.com
Municipal Advisory Council of Michigan
This report is prepared by the Municipal Advisory Council of Michigan (the “MAC”) and is intended solely for the use of its members. It is not an official statement of the issuer of the securities described below anddoes not constitute an offering of, or a recommendation to purchase, the securities. The information in or hyperlinked to this report has been obtained from or is provided by sources believed to be reliable, including
without limitation, the issuer, its agents, MAC records and/or public records prepared by various local, county, or state agencies of the State of Michigan. The MAC has not independently confirmed or verified theinformation in or hyperlinked to this report and does not guarantee the completeness or accuracy of such information. CUSIP® is a registered trademark of the American Bankers Association. Any CUSIP numbers
are provided solely for convenience, and no representation is made as to their correctness. The information is provided without any subjective assumptions, opinions, or views of the MAC. The MAC is notassociated with the State of Michigan or any other government entity.
Maturity Report
Direct Debt as of 9/22/2020
Total Outstanding: $35,241 M
Copyright 2020 Municipal Advisory Council of Michigan9/22/2020 10:10:45 AM Page 23 of 23
140545751Page 76 of 229

Grand Traverse County – Comprehensive Financial Plan 16
Appendix F Estimated Bond Sizing and Debt Service Calculations
Page 77 of 229
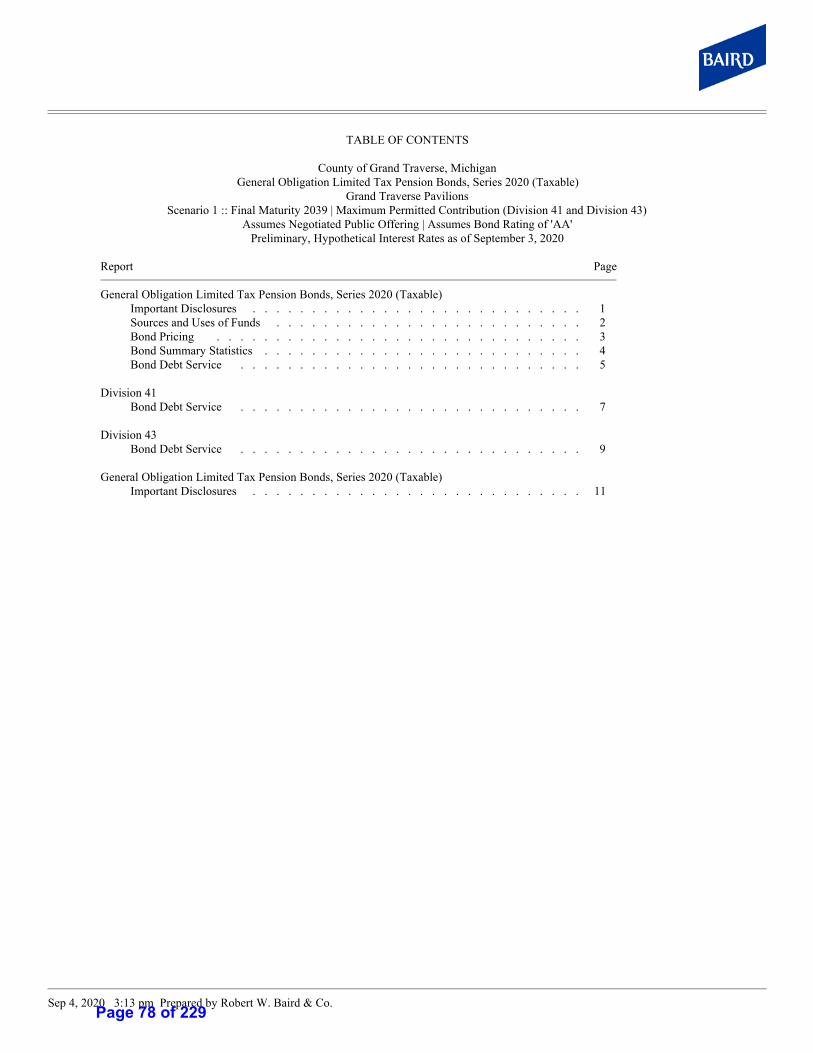
Sep 4, 2020 3:13 pm Prepared by Robert W. Baird & Co.
TABLE OF CONTENTS
County of Grand Traverse, MichiganGeneral Obligation Limited Tax Pension Bonds, Series 2020 (Taxable)
Grand Traverse PavilionsScenario 1 :: Final Maturity 2039 | Maximum Permitted Contribution (Division 41 and Division 43)
Assumes Negotiated Public Offering | Assumes Bond Rating of 'AA'Preliminary, Hypothetical Interest Rates as of September 3, 2020
Report Page
General Obligation Limited Tax Pension Bonds, Series 2020 (Taxable)Important Disclosures ............................ 1Sources and Uses of Funds .......................... 2Bond Pricing ............................... 3Bond Summary Statistics ........................... 4Bond Debt Service ............................. 5
Division 41Bond Debt Service ............................. 7
Division 43Bond Debt Service ............................. 9
General Obligation Limited Tax Pension Bonds, Series 2020 (Taxable)Important Disclosures ............................ 11
Page 78 of 229
Sep 4, 2020 3:13 pm Prepared by Robert W. Baird & Co. Page 1
IMPORTANT DISCLOSURES
County of Grand Traverse, MichiganGeneral Obligation Limited Tax Pension Bonds, Series 2020 (Taxable)
Grand Traverse PavilionsScenario 1 :: Final Maturity 2039 | Maximum Permitted Contribution (Division 41 and Division 43)
Assumes Negotiated Public Offering | Assumes Bond Rating of 'AA'Preliminary, Hypothetical Interest Rates as of September 3, 2020
Robert W. Baird & Co. Incorporated (“Baird”) is not recommending any action to you. Baird is not acting as an advisor to you and does not owe you a fiduciary duty pursuant to Section 15B of the Securities Exchange Act of 1934. Baird is acting for its own interests. You should discuss the information contained herein with any and all internal or external advisors and experts you deem appropriate before acting on the information. Baird seeks to serve as an underwriter (or placement agent) on a future transaction and not as a financial advisor or municipal advisor. The primary role of an underwriter (or placement agent) is to purchase, or arrange for the placement of, securities in an arm’s length commercial transaction with the issuer, and it has financial and other interests that differ from those of the issuer. The information provided is for discussion purposes only, in seeking to serve as underwriter (or placement agent). See “Important Disclosures” contained herein.
Page 79 of 229
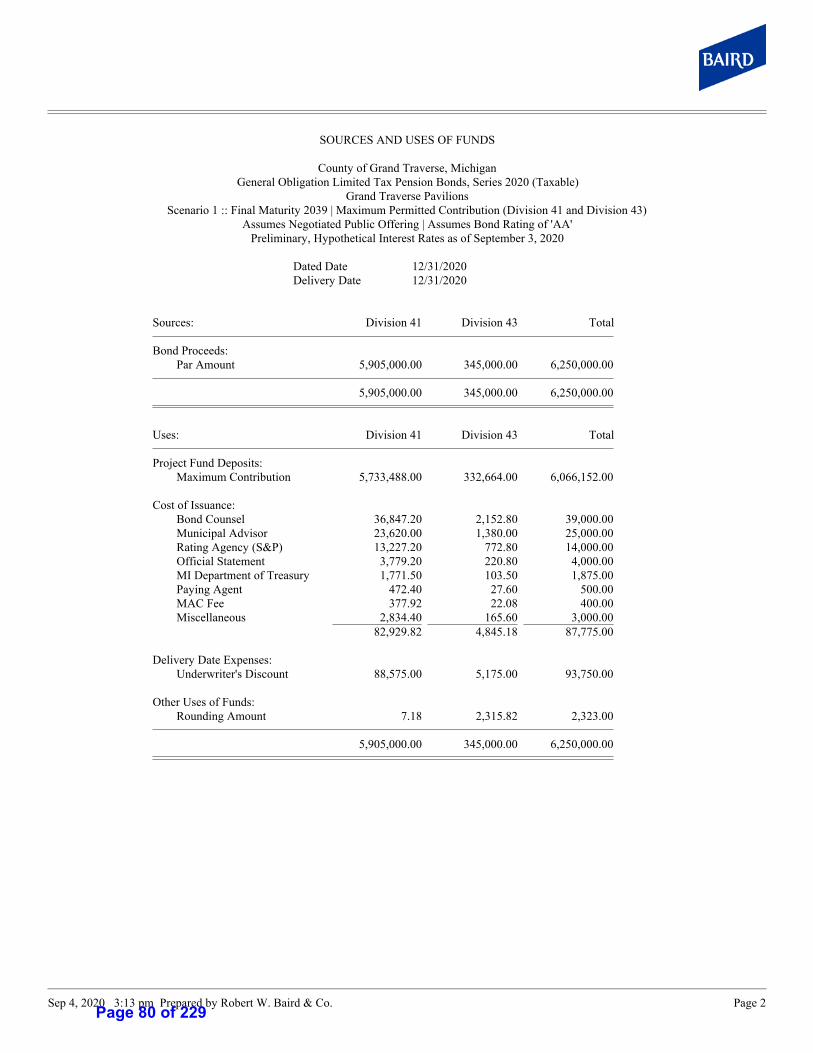
Sep 4, 2020 3:13 pm Prepared by Robert W. Baird & Co. Page 2
SOURCES AND USES OF FUNDS
County of Grand Traverse, MichiganGeneral Obligation Limited Tax Pension Bonds, Series 2020 (Taxable)
Grand Traverse PavilionsScenario 1 :: Final Maturity 2039 | Maximum Permitted Contribution (Division 41 and Division 43)
Assumes Negotiated Public Offering | Assumes Bond Rating of 'AA'Preliminary, Hypothetical Interest Rates as of September 3, 2020
Dated Date 12/31/2020Delivery Date 12/31/2020
Sources: Division 41 Division 43 Total
Bond Proceeds:Par Amount 5,905,000.00 345,000.00 6,250,000.00
5,905,000.00 345,000.00 6,250,000.00
Uses: Division 41 Division 43 Total
Project Fund Deposits:Maximum Contribution 5,733,488.00 332,664.00 6,066,152.00
Cost of Issuance:Bond Counsel 36,847.20 2,152.80 39,000.00Municipal Advisor 23,620.00 1,380.00 25,000.00Rating Agency (S&P) 13,227.20 772.80 14,000.00Official Statement 3,779.20 220.80 4,000.00MI Department of Treasury 1,771.50 103.50 1,875.00Paying Agent 472.40 27.60 500.00MAC Fee 377.92 22.08 400.00Miscellaneous 2,834.40 165.60 3,000.00
82,929.82 4,845.18 87,775.00
Delivery Date Expenses:Underwriter's Discount 88,575.00 5,175.00 93,750.00
Other Uses of Funds:Rounding Amount 7.18 2,315.82 2,323.00
5,905,000.00 345,000.00 6,250,000.00
Page 80 of 229
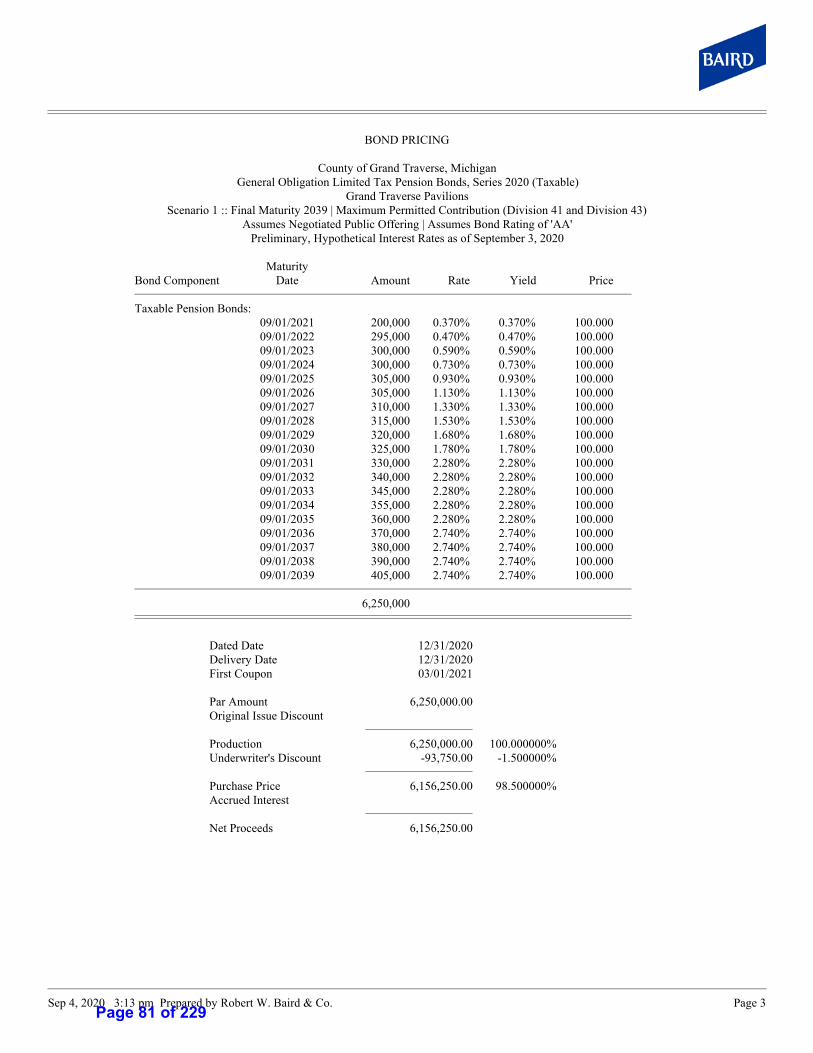
Sep 4, 2020 3:13 pm Prepared by Robert W. Baird & Co. Page 3
BOND PRICING
County of Grand Traverse, MichiganGeneral Obligation Limited Tax Pension Bonds, Series 2020 (Taxable)
Grand Traverse PavilionsScenario 1 :: Final Maturity 2039 | Maximum Permitted Contribution (Division 41 and Division 43)
Assumes Negotiated Public Offering | Assumes Bond Rating of 'AA'Preliminary, Hypothetical Interest Rates as of September 3, 2020
MaturityBond Component Date Amount Rate Yield Price
Taxable Pension Bonds:09/01/2021 200,000 0.370% 0.370% 100.00009/01/2022 295,000 0.470% 0.470% 100.00009/01/2023 300,000 0.590% 0.590% 100.00009/01/2024 300,000 0.730% 0.730% 100.00009/01/2025 305,000 0.930% 0.930% 100.00009/01/2026 305,000 1.130% 1.130% 100.00009/01/2027 310,000 1.330% 1.330% 100.00009/01/2028 315,000 1.530% 1.530% 100.00009/01/2029 320,000 1.680% 1.680% 100.00009/01/2030 325,000 1.780% 1.780% 100.00009/01/2031 330,000 2.280% 2.280% 100.00009/01/2032 340,000 2.280% 2.280% 100.00009/01/2033 345,000 2.280% 2.280% 100.00009/01/2034 355,000 2.280% 2.280% 100.00009/01/2035 360,000 2.280% 2.280% 100.00009/01/2036 370,000 2.740% 2.740% 100.00009/01/2037 380,000 2.740% 2.740% 100.00009/01/2038 390,000 2.740% 2.740% 100.00009/01/2039 405,000 2.740% 2.740% 100.000
6,250,000
Dated Date 12/31/2020Delivery Date 12/31/2020First Coupon 03/01/2021
Par Amount 6,250,000.00Original Issue Discount
Production 6,250,000.00 100.000000%Underwriter's Discount -93,750.00 -1.500000%
Purchase Price 6,156,250.00 98.500000%Accrued Interest
Net Proceeds 6,156,250.00
Page 81 of 229
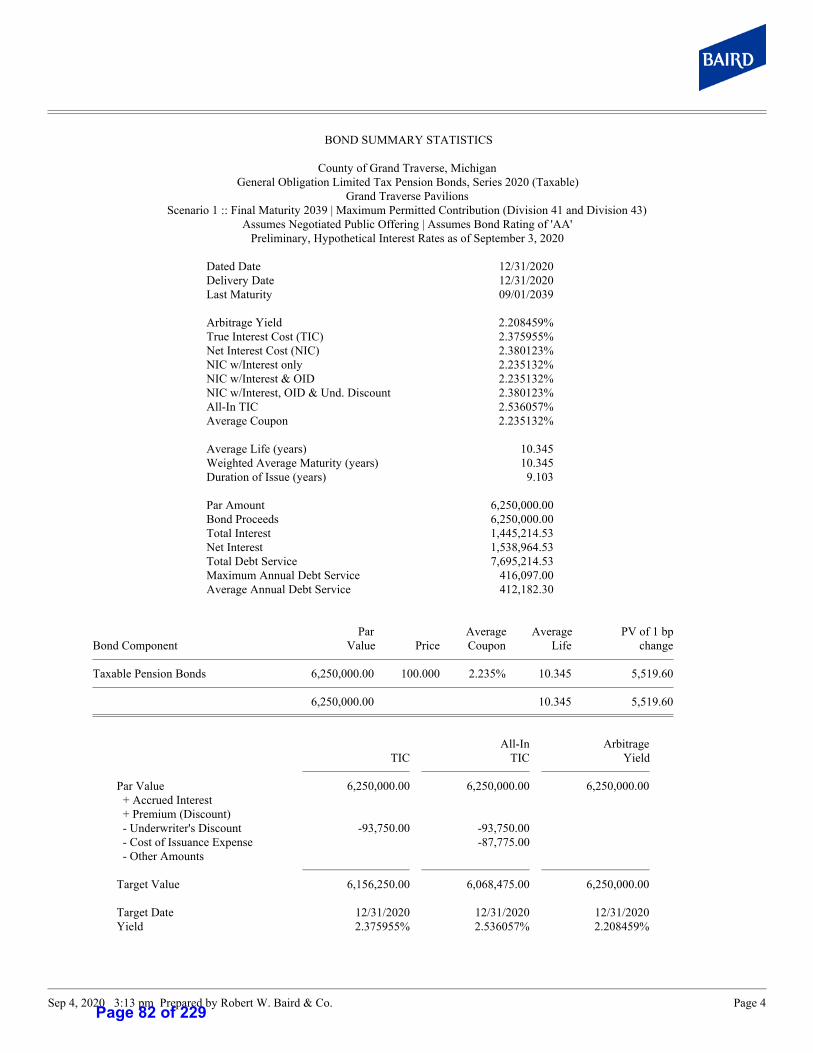
Sep 4, 2020 3:13 pm Prepared by Robert W. Baird & Co. Page 4
BOND SUMMARY STATISTICS
County of Grand Traverse, MichiganGeneral Obligation Limited Tax Pension Bonds, Series 2020 (Taxable)
Grand Traverse PavilionsScenario 1 :: Final Maturity 2039 | Maximum Permitted Contribution (Division 41 and Division 43)
Assumes Negotiated Public Offering | Assumes Bond Rating of 'AA'Preliminary, Hypothetical Interest Rates as of September 3, 2020
Dated Date 12/31/2020Delivery Date 12/31/2020Last Maturity 09/01/2039
Arbitrage Yield 2.208459%True Interest Cost (TIC) 2.375955%Net Interest Cost (NIC) 2.380123%NIC w/Interest only 2.235132%NIC w/Interest & OID 2.235132%NIC w/Interest, OID & Und. Discount 2.380123%All-In TIC 2.536057%Average Coupon 2.235132%
Average Life (years) 10.345Weighted Average Maturity (years) 10.345Duration of Issue (years) 9.103
Par Amount 6,250,000.00Bond Proceeds 6,250,000.00Total Interest 1,445,214.53Net Interest 1,538,964.53Total Debt Service 7,695,214.53Maximum Annual Debt Service 416,097.00Average Annual Debt Service 412,182.30
Par Average Average PV of 1 bpBond Component Value Price Coupon Life change
Taxable Pension Bonds 6,250,000.00 100.000 2.235% 10.345 5,519.60
6,250,000.00 10.345 5,519.60
All-In ArbitrageTIC TIC Yield
Par Value 6,250,000.00 6,250,000.00 6,250,000.00 + Accrued Interest + Premium (Discount) - Underwriter's Discount -93,750.00 -93,750.00 - Cost of Issuance Expense -87,775.00 - Other Amounts
Target Value 6,156,250.00 6,068,475.00 6,250,000.00
Target Date 12/31/2020 12/31/2020 12/31/2020Yield 2.375955% 2.536057% 2.208459%
Page 82 of 229
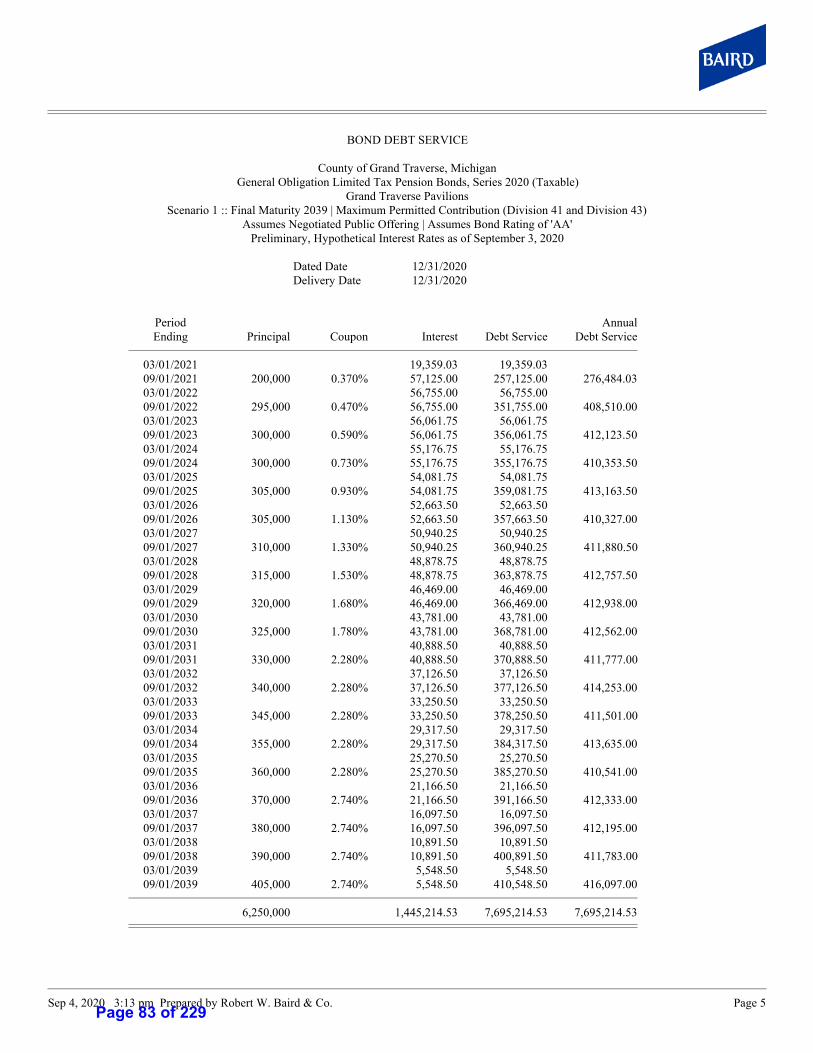
Sep 4, 2020 3:13 pm Prepared by Robert W. Baird & Co. Page 5
BOND DEBT SERVICE
County of Grand Traverse, MichiganGeneral Obligation Limited Tax Pension Bonds, Series 2020 (Taxable)
Grand Traverse PavilionsScenario 1 :: Final Maturity 2039 | Maximum Permitted Contribution (Division 41 and Division 43)
Assumes Negotiated Public Offering | Assumes Bond Rating of 'AA'Preliminary, Hypothetical Interest Rates as of September 3, 2020
Dated Date 12/31/2020Delivery Date 12/31/2020
Period AnnualEnding Principal Coupon Interest Debt Service Debt Service
03/01/2021 19,359.03 19,359.0309/01/2021 200,000 0.370% 57,125.00 257,125.00 276,484.0303/01/2022 56,755.00 56,755.0009/01/2022 295,000 0.470% 56,755.00 351,755.00 408,510.0003/01/2023 56,061.75 56,061.7509/01/2023 300,000 0.590% 56,061.75 356,061.75 412,123.5003/01/2024 55,176.75 55,176.7509/01/2024 300,000 0.730% 55,176.75 355,176.75 410,353.5003/01/2025 54,081.75 54,081.7509/01/2025 305,000 0.930% 54,081.75 359,081.75 413,163.5003/01/2026 52,663.50 52,663.5009/01/2026 305,000 1.130% 52,663.50 357,663.50 410,327.0003/01/2027 50,940.25 50,940.2509/01/2027 310,000 1.330% 50,940.25 360,940.25 411,880.5003/01/2028 48,878.75 48,878.7509/01/2028 315,000 1.530% 48,878.75 363,878.75 412,757.5003/01/2029 46,469.00 46,469.0009/01/2029 320,000 1.680% 46,469.00 366,469.00 412,938.0003/01/2030 43,781.00 43,781.0009/01/2030 325,000 1.780% 43,781.00 368,781.00 412,562.0003/01/2031 40,888.50 40,888.5009/01/2031 330,000 2.280% 40,888.50 370,888.50 411,777.0003/01/2032 37,126.50 37,126.5009/01/2032 340,000 2.280% 37,126.50 377,126.50 414,253.0003/01/2033 33,250.50 33,250.5009/01/2033 345,000 2.280% 33,250.50 378,250.50 411,501.0003/01/2034 29,317.50 29,317.5009/01/2034 355,000 2.280% 29,317.50 384,317.50 413,635.0003/01/2035 25,270.50 25,270.5009/01/2035 360,000 2.280% 25,270.50 385,270.50 410,541.0003/01/2036 21,166.50 21,166.5009/01/2036 370,000 2.740% 21,166.50 391,166.50 412,333.0003/01/2037 16,097.50 16,097.5009/01/2037 380,000 2.740% 16,097.50 396,097.50 412,195.0003/01/2038 10,891.50 10,891.5009/01/2038 390,000 2.740% 10,891.50 400,891.50 411,783.0003/01/2039 5,548.50 5,548.5009/01/2039 405,000 2.740% 5,548.50 410,548.50 416,097.00
6,250,000 1,445,214.53 7,695,214.53 7,695,214.53
Page 83 of 229
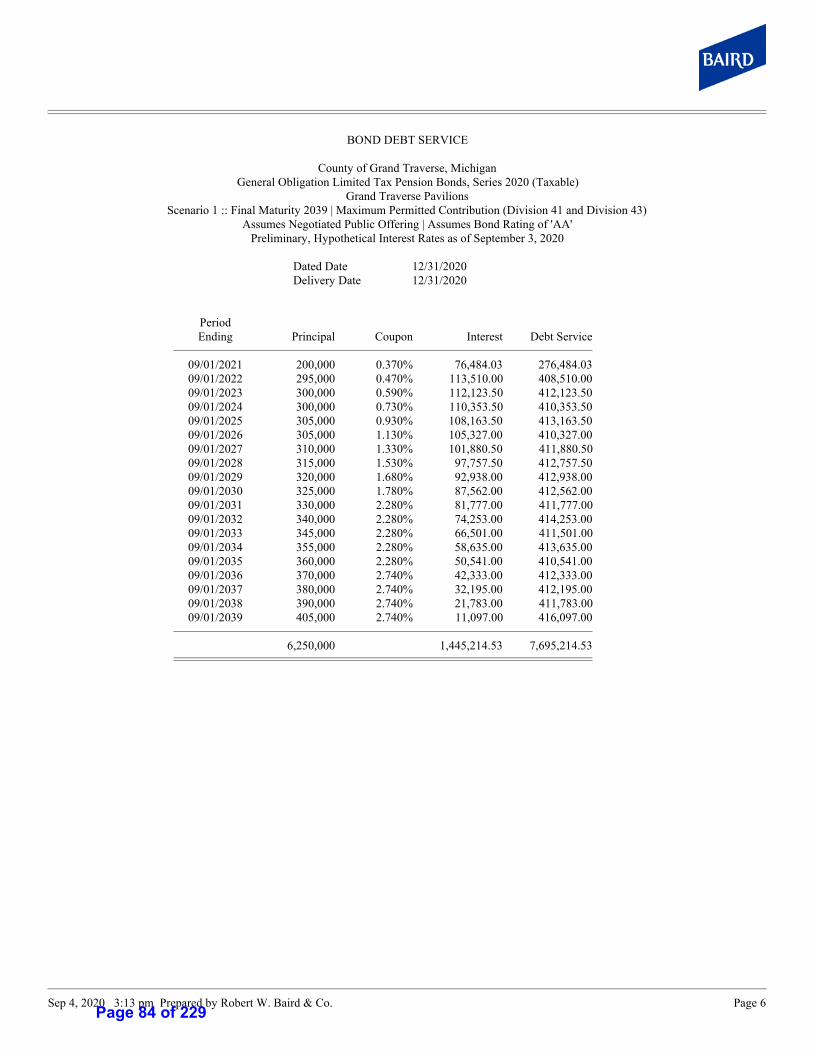
Sep 4, 2020 3:13 pm Prepared by Robert W. Baird & Co. Page 6
BOND DEBT SERVICE
County of Grand Traverse, MichiganGeneral Obligation Limited Tax Pension Bonds, Series 2020 (Taxable)
Grand Traverse PavilionsScenario 1 :: Final Maturity 2039 | Maximum Permitted Contribution (Division 41 and Division 43)
Assumes Negotiated Public Offering | Assumes Bond Rating of 'AA'Preliminary, Hypothetical Interest Rates as of September 3, 2020
Dated Date 12/31/2020Delivery Date 12/31/2020
PeriodEnding Principal Coupon Interest Debt Service
09/01/2021 200,000 0.370% 76,484.03 276,484.0309/01/2022 295,000 0.470% 113,510.00 408,510.0009/01/2023 300,000 0.590% 112,123.50 412,123.5009/01/2024 300,000 0.730% 110,353.50 410,353.5009/01/2025 305,000 0.930% 108,163.50 413,163.5009/01/2026 305,000 1.130% 105,327.00 410,327.0009/01/2027 310,000 1.330% 101,880.50 411,880.5009/01/2028 315,000 1.530% 97,757.50 412,757.5009/01/2029 320,000 1.680% 92,938.00 412,938.0009/01/2030 325,000 1.780% 87,562.00 412,562.0009/01/2031 330,000 2.280% 81,777.00 411,777.0009/01/2032 340,000 2.280% 74,253.00 414,253.0009/01/2033 345,000 2.280% 66,501.00 411,501.0009/01/2034 355,000 2.280% 58,635.00 413,635.0009/01/2035 360,000 2.280% 50,541.00 410,541.0009/01/2036 370,000 2.740% 42,333.00 412,333.0009/01/2037 380,000 2.740% 32,195.00 412,195.0009/01/2038 390,000 2.740% 21,783.00 411,783.0009/01/2039 405,000 2.740% 11,097.00 416,097.00
6,250,000 1,445,214.53 7,695,214.53
Page 84 of 229

Sep 4, 2020 3:13 pm Prepared by Robert W. Baird & Co. Page 7
BOND DEBT SERVICE
County of Grand Traverse, MichiganDivision 41
Dated Date 12/31/2020Delivery Date 12/31/2020
Period AnnualEnding Principal Coupon Interest Debt Service Debt Service
03/01/2021 18,271.03 18,271.0309/01/2021 190,000 0.370% 53,914.50 243,914.50 262,185.5303/01/2022 53,563.00 53,563.0009/01/2022 280,000 0.470% 53,563.00 333,563.00 387,126.0003/01/2023 52,905.00 52,905.0009/01/2023 285,000 0.590% 52,905.00 337,905.00 390,810.0003/01/2024 52,064.25 52,064.2509/01/2024 285,000 0.730% 52,064.25 337,064.25 389,128.5003/01/2025 51,024.00 51,024.0009/01/2025 290,000 0.930% 51,024.00 341,024.00 392,048.0003/01/2026 49,675.50 49,675.5009/01/2026 290,000 1.130% 49,675.50 339,675.50 389,351.0003/01/2027 48,037.00 48,037.0009/01/2027 295,000 1.330% 48,037.00 343,037.00 391,074.0003/01/2028 46,075.25 46,075.2509/01/2028 295,000 1.530% 46,075.25 341,075.25 387,150.5003/01/2029 43,818.50 43,818.5009/01/2029 300,000 1.680% 43,818.50 343,818.50 387,637.0003/01/2030 41,298.50 41,298.5009/01/2030 305,000 1.780% 41,298.50 346,298.50 387,597.0003/01/2031 38,584.00 38,584.0009/01/2031 310,000 2.280% 38,584.00 348,584.00 387,168.0003/01/2032 35,050.00 35,050.0009/01/2032 320,000 2.280% 35,050.00 355,050.00 390,100.0003/01/2033 31,402.00 31,402.0009/01/2033 325,000 2.280% 31,402.00 356,402.00 387,804.0003/01/2034 27,697.00 27,697.0009/01/2034 335,000 2.280% 27,697.00 362,697.00 390,394.0003/01/2035 23,878.00 23,878.0009/01/2035 340,000 2.280% 23,878.00 363,878.00 387,756.0003/01/2036 20,002.00 20,002.0009/01/2036 350,000 2.740% 20,002.00 370,002.00 390,004.0003/01/2037 15,207.00 15,207.0009/01/2037 360,000 2.740% 15,207.00 375,207.00 390,414.0003/01/2038 10,275.00 10,275.0009/01/2038 370,000 2.740% 10,275.00 380,275.00 390,550.0003/01/2039 5,206.00 5,206.0009/01/2039 380,000 2.740% 5,206.00 385,206.00 390,412.00
5,905,000 1,363,709.53 7,268,709.53 7,268,709.53
Page 85 of 229
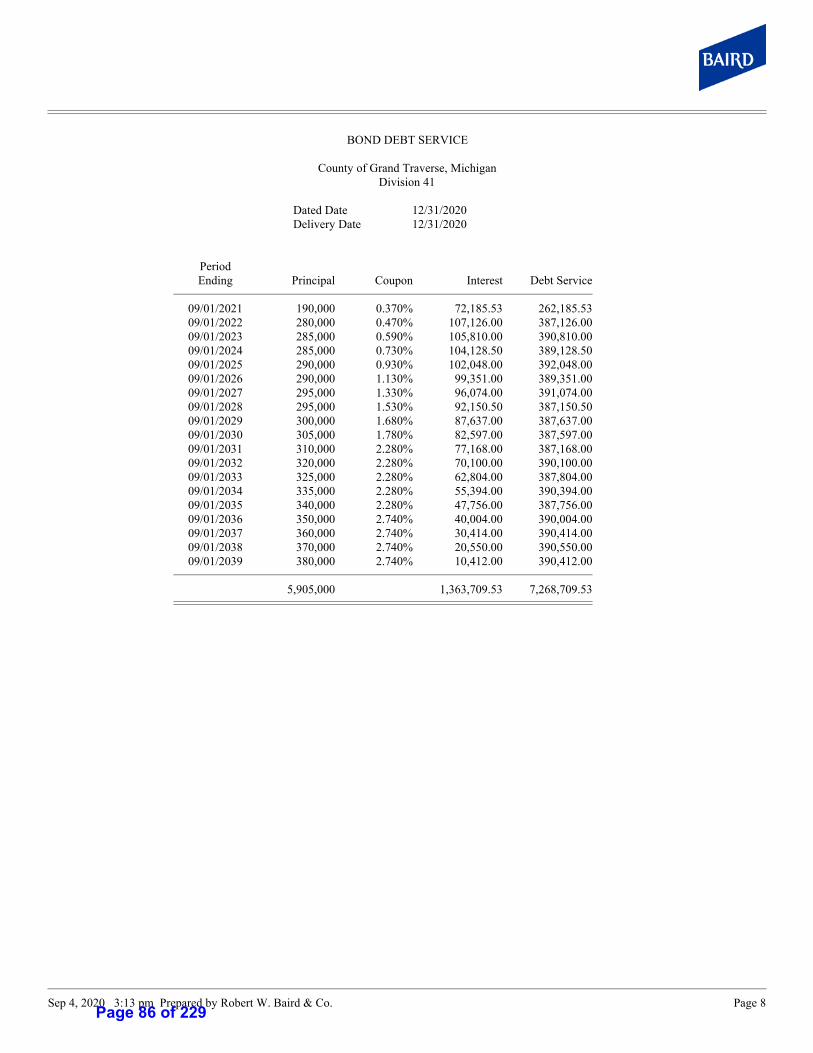
Sep 4, 2020 3:13 pm Prepared by Robert W. Baird & Co. Page 8
BOND DEBT SERVICE
County of Grand Traverse, MichiganDivision 41
Dated Date 12/31/2020Delivery Date 12/31/2020
PeriodEnding Principal Coupon Interest Debt Service
09/01/2021 190,000 0.370% 72,185.53 262,185.5309/01/2022 280,000 0.470% 107,126.00 387,126.0009/01/2023 285,000 0.590% 105,810.00 390,810.0009/01/2024 285,000 0.730% 104,128.50 389,128.5009/01/2025 290,000 0.930% 102,048.00 392,048.0009/01/2026 290,000 1.130% 99,351.00 389,351.0009/01/2027 295,000 1.330% 96,074.00 391,074.0009/01/2028 295,000 1.530% 92,150.50 387,150.5009/01/2029 300,000 1.680% 87,637.00 387,637.0009/01/2030 305,000 1.780% 82,597.00 387,597.0009/01/2031 310,000 2.280% 77,168.00 387,168.0009/01/2032 320,000 2.280% 70,100.00 390,100.0009/01/2033 325,000 2.280% 62,804.00 387,804.0009/01/2034 335,000 2.280% 55,394.00 390,394.0009/01/2035 340,000 2.280% 47,756.00 387,756.0009/01/2036 350,000 2.740% 40,004.00 390,004.0009/01/2037 360,000 2.740% 30,414.00 390,414.0009/01/2038 370,000 2.740% 20,550.00 390,550.0009/01/2039 380,000 2.740% 10,412.00 390,412.00
5,905,000 1,363,709.53 7,268,709.53
Page 86 of 229
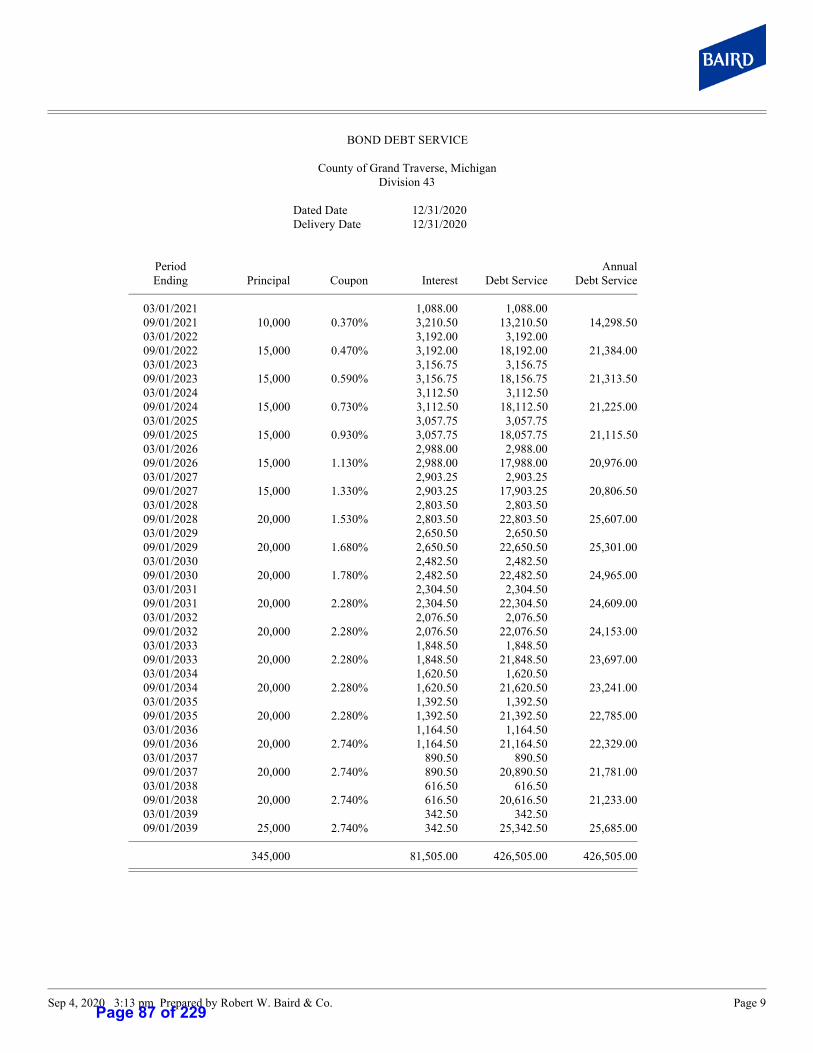
Sep 4, 2020 3:13 pm Prepared by Robert W. Baird & Co. Page 9
BOND DEBT SERVICE
County of Grand Traverse, MichiganDivision 43
Dated Date 12/31/2020Delivery Date 12/31/2020
Period AnnualEnding Principal Coupon Interest Debt Service Debt Service
03/01/2021 1,088.00 1,088.0009/01/2021 10,000 0.370% 3,210.50 13,210.50 14,298.5003/01/2022 3,192.00 3,192.0009/01/2022 15,000 0.470% 3,192.00 18,192.00 21,384.0003/01/2023 3,156.75 3,156.7509/01/2023 15,000 0.590% 3,156.75 18,156.75 21,313.5003/01/2024 3,112.50 3,112.5009/01/2024 15,000 0.730% 3,112.50 18,112.50 21,225.0003/01/2025 3,057.75 3,057.7509/01/2025 15,000 0.930% 3,057.75 18,057.75 21,115.5003/01/2026 2,988.00 2,988.0009/01/2026 15,000 1.130% 2,988.00 17,988.00 20,976.0003/01/2027 2,903.25 2,903.2509/01/2027 15,000 1.330% 2,903.25 17,903.25 20,806.5003/01/2028 2,803.50 2,803.5009/01/2028 20,000 1.530% 2,803.50 22,803.50 25,607.0003/01/2029 2,650.50 2,650.5009/01/2029 20,000 1.680% 2,650.50 22,650.50 25,301.0003/01/2030 2,482.50 2,482.5009/01/2030 20,000 1.780% 2,482.50 22,482.50 24,965.0003/01/2031 2,304.50 2,304.5009/01/2031 20,000 2.280% 2,304.50 22,304.50 24,609.0003/01/2032 2,076.50 2,076.5009/01/2032 20,000 2.280% 2,076.50 22,076.50 24,153.0003/01/2033 1,848.50 1,848.5009/01/2033 20,000 2.280% 1,848.50 21,848.50 23,697.0003/01/2034 1,620.50 1,620.5009/01/2034 20,000 2.280% 1,620.50 21,620.50 23,241.0003/01/2035 1,392.50 1,392.5009/01/2035 20,000 2.280% 1,392.50 21,392.50 22,785.0003/01/2036 1,164.50 1,164.5009/01/2036 20,000 2.740% 1,164.50 21,164.50 22,329.0003/01/2037 890.50 890.5009/01/2037 20,000 2.740% 890.50 20,890.50 21,781.0003/01/2038 616.50 616.5009/01/2038 20,000 2.740% 616.50 20,616.50 21,233.0003/01/2039 342.50 342.5009/01/2039 25,000 2.740% 342.50 25,342.50 25,685.00
345,000 81,505.00 426,505.00 426,505.00
Page 87 of 229

Sep 4, 2020 3:13 pm Prepared by Robert W. Baird & Co. Page 10
BOND DEBT SERVICE
County of Grand Traverse, MichiganDivision 43
Dated Date 12/31/2020Delivery Date 12/31/2020
PeriodEnding Principal Coupon Interest Debt Service
09/01/2021 10,000 0.370% 4,298.50 14,298.5009/01/2022 15,000 0.470% 6,384.00 21,384.0009/01/2023 15,000 0.590% 6,313.50 21,313.5009/01/2024 15,000 0.730% 6,225.00 21,225.0009/01/2025 15,000 0.930% 6,115.50 21,115.5009/01/2026 15,000 1.130% 5,976.00 20,976.0009/01/2027 15,000 1.330% 5,806.50 20,806.5009/01/2028 20,000 1.530% 5,607.00 25,607.0009/01/2029 20,000 1.680% 5,301.00 25,301.0009/01/2030 20,000 1.780% 4,965.00 24,965.0009/01/2031 20,000 2.280% 4,609.00 24,609.0009/01/2032 20,000 2.280% 4,153.00 24,153.0009/01/2033 20,000 2.280% 3,697.00 23,697.0009/01/2034 20,000 2.280% 3,241.00 23,241.0009/01/2035 20,000 2.280% 2,785.00 22,785.0009/01/2036 20,000 2.740% 2,329.00 22,329.0009/01/2037 20,000 2.740% 1,781.00 21,781.0009/01/2038 20,000 2.740% 1,233.00 21,233.0009/01/2039 25,000 2.740% 685.00 25,685.00
345,000 81,505.00 426,505.00
Page 88 of 229
Sep 4, 2020 3:13 pm Prepared by Robert W. Baird & Co. Page 11
IMPORTANT DISCLOSURES
County of Grand Traverse, MichiganGeneral Obligation Limited Tax Pension Bonds, Series 2020 (Taxable)
Grand Traverse PavilionsScenario 1 :: Final Maturity 2039 | Maximum Permitted Contribution (Division 41 and Division 43)
Assumes Negotiated Public Offering | Assumes Bond Rating of 'AA'Preliminary, Hypothetical Interest Rates as of September 3, 2020
Robert W. Baird & Co. Incorporated ('Baird') is not recommending that you take or not take any action. Baird is not acting as financial advisor or municipal advisor to you and does not owe a fiduciary duty pursuant to Section 15B of the Securities Exchange Act of 1934 to you with respect to the information contained herein and/or accompanying materials (collectively, the 'Materials'). Baird is acting for its own interests. You should discuss the Materials with any and all internal or external advisors and experts that you deem appropriate before acting on the Materials.
Baird seeks to serve as underwriter in connection with a possible issuance of municipal securities you may be considering and not as financial advisor or municipal advisor. Baird is providing the Materials for discussion purposes only, in anticipation of being engaged to serve as underwriter (or placement agent).
The role of an underwriter includes the following: Municipal Securities Rulemaking Board Rule G-17 requires an underwriter to deal fairly at all times with both municipal issuers and investors. An underwriter's primary role is to purchase the proposed securities to be issued with a view to distribution in an arm's length commercial transaction with the issuer. An underwriter has financial and other interests that differ from those of the issuer. An underwriter may provide advice to the issuer concerning the structure, timing, terms, and other similar matters for an issuance of municipal securities. Any such advice, however, would be provided in the context of serving as an underwriter and not as municipal advisor, financial advisor or fiduciary. Unlike a municipal advisor, an underwriter does not have a fiduciary duty to the issuer under the federal securities laws and is therefore not required by federal law to act in the best interests of the issuer without regard to its own financial or other interests. An underwriter has a duty to purchase securities from the issuer at a fair and reasonable price but must balance that duty with its duty to sell those securities to investors at prices that are fair and reasonable. An underwriter will review the official statement (if any) applicable to the proposed issuance in accordance with, and as part of, its responsibilities to investors under the federal securities laws, as applied to the facts and circumstances of the proposed issuance.
The Materials do not include any proposals, recommendations or suggestions that you take or refrain from taking any action with regard to an issuance of municipal securities and are not intended to be and should not be construed as ''advice'' within the meaning of Section 15B of the Securities Exchange Act of 1934 or Rule 15Ba1-1 thereunder. The Materials are intended to provide information of a factual, objective or educational nature, as well as general information about Baird (including its Public Finance unit) and its experience, qualifications and capabilities.
Any information or estimates contained in the Materials are based on publicly available data, including information about recent transactions believed to be comparable, and Baird's experience, and are subject to change without notice. Baird has not independently verified the accuracy of such data. Interested parties are advised to contact Baird for more information.
If you have any questions or concerns about the above disclosures, please contact Baird Public Finance.
IRS Circular 230 Disclosure: To ensure compliance with requirements imposed by the IRS, we inform you that the Materials do not constitute tax advice and shall not be used for the purpose of (i) avoiding tax penalties or (ii) promoting, marketing or recommending to another party any transaction or matter addressed herein.
Page 89 of 229

Grand Traverse County – Comprehensive Financial Plan 17
Appendix G Grand Traverse County Standard & Poor’s Rating Report Dated October 24, 2019
Page 90 of 229
Summary:
Grand Traverse County, Michigan
Grand Traverse County BuildingAuthority; General Obligation
Primary Credit Analyst:
Tiffany Tribbitt, New York (1) 212-438-8218; [email protected]
Secondary Contact:
Moreen T Skyers-Gibbs, New York (1) 212-438-1734; [email protected]
Table Of Contents
Rationale
Outlook
Related Research
WWW.STANDARDANDPOORS.COM/RATINGSDIRECT OCTOBER 24, 2019 1Page 91 of 229
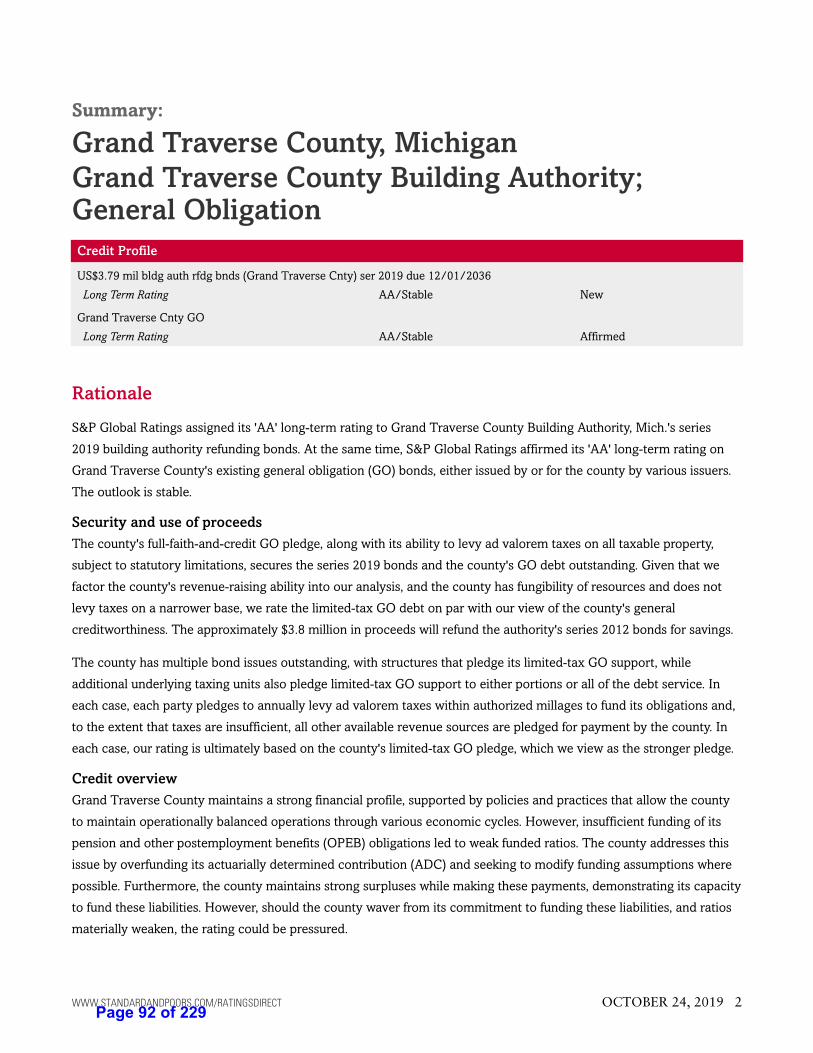
Summary:
Grand Traverse County, Michigan
Grand Traverse County Building Authority;General Obligation
Credit Profile
US$3.79 mil bldg auth rfdg bnds (Grand Traverse Cnty) ser 2019 due 12/01/2036
Long Term Rating AA/Stable New
Grand Traverse Cnty GO
Long Term Rating AA/Stable Affirmed
Rationale
S&P Global Ratings assigned its 'AA' long-term rating to Grand Traverse County Building Authority, Mich.'s series
2019 building authority refunding bonds. At the same time, S&P Global Ratings affirmed its 'AA' long-term rating on
Grand Traverse County's existing general obligation (GO) bonds, either issued by or for the county by various issuers.
The outlook is stable.
Security and use of proceeds
The county's full-faith-and-credit GO pledge, along with its ability to levy ad valorem taxes on all taxable property,
subject to statutory limitations, secures the series 2019 bonds and the county's GO debt outstanding. Given that we
factor the county's revenue-raising ability into our analysis, and the county has fungibility of resources and does not
levy taxes on a narrower base, we rate the limited-tax GO debt on par with our view of the county's general
creditworthiness. The approximately $3.8 million in proceeds will refund the authority's series 2012 bonds for savings.
The county has multiple bond issues outstanding, with structures that pledge its limited-tax GO support, while
additional underlying taxing units also pledge limited-tax GO support to either portions or all of the debt service. In
each case, each party pledges to annually levy ad valorem taxes within authorized millages to fund its obligations and,
to the extent that taxes are insufficient, all other available revenue sources are pledged for payment by the county. In
each case, our rating is ultimately based on the county's limited-tax GO pledge, which we view as the stronger pledge.
Credit overview
Grand Traverse County maintains a strong financial profile, supported by policies and practices that allow the county
to maintain operationally balanced operations through various economic cycles. However, insufficient funding of its
pension and other postemployment benefits (OPEB) obligations led to weak funded ratios. The county addresses this
issue by overfunding its actuarially determined contribution (ADC) and seeking to modify funding assumptions where
possible. Furthermore, the county maintains strong surpluses while making these payments, demonstrating its capacity
to fund these liabilities. However, should the county waver from its commitment to funding these liabilities, and ratios
materially weaken, the rating could be pressured.
WWW.STANDARDANDPOORS.COM/RATINGSDIRECT OCTOBER 24, 2019 2Page 92 of 229
The rating reflect our assessment of the following factors:
• Adequate economy, with market value per capita of $146,874 and projected per capita effective buying income at
103.5% of the national level;
• Strong management, with good financial policies and practices under our Financial Management Assessment (FMA)
methodology;
• Strong budgetary performance, with an operating surplus in the general fund and a slight operating surplus at the
total governmental fund level in fiscal 2018;
• Very strong budgetary flexibility, with an available fund balance in fiscal 2018 of 56% of operating expenditures;
• Very strong liquidity, with total government available cash at 68.8% of total governmental fund expenditures and
36.5x governmental debt service, and access to external liquidity we consider strong;
• Adequate debt and contingent liability profile, with debt service carrying charges at 1.9% of expenditures and net
direct debt that is 72.8% of total governmental fund revenue, as well as low overall net debt at less than 3% of
market value and rapid amortization, with about 80% of debt scheduled to be retired in 10 years, but a large pension
and OPEB obligation and the lack of a plan to sufficiently address the obligation; and
• Strong institutional framework score.
Adequate economy
We consider Grand Traverse County's economy adequate. The county has an estimated population of 93,118. The
county has a projected per capita effective buying income of 103.5% of the national level and per capita market value
of $146,874. Overall, the county's market value grew by 8.1% over the past year to $13.7 billion in 2019. The county
unemployment rate was 3.7% in 2018.
Grand Traverse County is widely recognized as an agricultural and tourist area with year-round recreational activities
and, according to officials, these sectors have generally remained stable. As a result of the tourist business, the county
is a major retail area of northwestern Michigan. Officials report tourism in the region continues to grow, bolstered by
additional nonstop flights into the county. In particular, Traverse City continues to expand, with several multimillion
dollar projects under construction, including additional housing stock. The principal agricultural business is the
growing and processing of cherries, grapes, and other fruit crops. Overall, we expect these trends to continue in the
near term, and do not anticipate changes in our view of Grand Traverse's economy.
Strong management
We view the county's management as strong, with good financial policies and practices under our FMA methodology,
indicating financial practices exist in most areas, but that governance officials might not formalize or monitor all of
them on a regular basis.
Highlights include:
• Strong revenue and expenditure assumptions, with the use of 10 years' history and outside sources of information
when forecasting trends;
• Quarterly detailed budget-to-actual reporting to the board, with budgetary amendments as needed;
• Maintenance of a detailed five-year financial plan used for planning purposes, shared with the board, and updated
WWW.STANDARDANDPOORS.COM/RATINGSDIRECT OCTOBER 24, 2019 3
Summary: Grand Traverse County, Michigan Grand Traverse County Building Authority; General Obligation
Page 93 of 229
annually;
• A five-year capital plan, which identifies project priorities and is updated annually, but does not identify all funding
sources. In addition, the county maintains a long-range capital plan (20-25 years out) for longer-term project
planning, updated every seven-eight years;
• A formal investment management policy that mirrors state guidelines, with quarterly reporting to the board on
investment holdings and earnings; and
• A formal policy of maintaining unassigned reserves in excess of 25% of budgeted expenditures as a sufficient
cushion for budgetary pressures. The board recently updated this policy to ensure sufficient cash flow in the event
of an economic downturn.
The county does not maintain a debt management policy, but adheres to state guidelines. Grand Traverse is compliant
with its policies. Furthermore, management is taking steps to ensure the county mitigates risks associated with
cyber-attacks.
Strong budgetary performance
Grand Traverse County's budgetary performance is strong, in our opinion. The county had surplus operating results in
the general fund of 5.9% of expenditures, and slight surplus results across all governmental funds of 1.3% in fiscal
2018. We included annual transfers in and out of the general fund and total governmental funds in our assessment of
the county's budgetary performance. Our assessment also accounts for the fact that we do not expect budgetary
results will be sustained in excess of 5% of operations.
Historically, the county maintains balanced operations, and recently is making efforts to reduce its net pension
liabilities by making additional payments. To that end, in fiscal 2017 it used reserves to add an additional $4.8 million
contribution to its pension plan. Otherwise, the county continues to outperform its budget, keeping expenditures in line
while revenues outpace projections. With fiscal 2019 nearing its end, officials report performance is in line with
expectations. Despite changes to some state revenues as a result of the nearly adopted state budget, management
expects to absorb any losses without pressuring operations, making necessary expenditure adjustments. In addition to
these changes, the county is implementing a new bailiffs program in November, in an effort to reduce overtime costs at
the county jail. Other than these items, which we expect to have an impact on 2020 as well as the end of 2019,
management does not expect any major changes to the budget. Given its track record and management's ability to
make the necessary budgetary adjustments, we expect the county to maintain at least balanced performance across
operating and total governmental funds for the next few years.
Very strong budgetary flexibility
Grand Traverse County's budgetary flexibility is very strong, in our view, with an available fund balance in fiscal 2018
of 56% of operating expenditures, or $20.7 million. We expect the available fund balance to remain above 30% of
expenditures for the current and next fiscal years, which we view as a positive credit factor. The available fund balance
includes $11.1 million (30.2% of expenditures) in the general fund and $9.6 million (26% of expenditures) of delinquent
tax funds that are outside the general fund but legally available for operations, following council approval. With our
expectation of continued structural balance in operations, and given the updated reserve policy, our view of the
county's flexibility is unlikely to change in the near term.
WWW.STANDARDANDPOORS.COM/RATINGSDIRECT OCTOBER 24, 2019 4
Summary: Grand Traverse County, Michigan Grand Traverse County Building Authority; General Obligation
Page 94 of 229
Very strong liquidity
In our opinion, Grand Traverse County's liquidity is very strong, with total government available cash at 68.8% of total
governmental fund expenditures and 36.5x governmental debt service in 2018. In our view, the county has strong
access to external liquidity, if necessary, based on its issuance of debt over the past 20 years. The county's investment
portfolio is not aggressive, as it is largely in bank deposits, money markets, treasuries, and certificates of deposit. With
stable operations and reserves, we expect the county to maintain its liquidity position.
The county privately placed its series 2019 wastewater treatment plant upgrade refunding bonds with PNC Bank.
Terms are standard and do not contain any non-credit events of default or acceleration provisions that could pressure
liquidity.
Adequate debt and contingent liability profile
In our view, Grand Traverse County's debt and contingent liability profile is adequate. Total governmental fund debt
service is 1.9% of total governmental fund expenditures, and net direct debt is 72.8% of total governmental fund
revenue. Overall net debt is low, at 1.5% of market value, and approximately about 80% of the direct debt is scheduled
to be repaid within 10 years, which are, in our view, positive credit factors. The county does not have any additional
near-term debt plans that would alter our view of its debt profile. Following this issue, the county will have about $42
million of direct debt outstanding, a portion of which is self-supporting.
Pension and other postemployment benefits
• Pensions and OPEB costs remain a credit concern for the county, given what we view as a large pension and OPEB
obligation without a plan in place to sufficiently address the liability; however, the county is committed to improving
the funding of these obligations by overfunding the ADC and adjusting amortization schedules to improve funding
progress. Furthermore, the county closed its defined benefit plan to new entrants.
• Should the steps the county is taking result in improved funding ratios and consistent evidence of funding discipline,
we would likely view this as an indication of the county's efforts are sufficient to address the obligation, improving
our view of its debt and long-term liabilities.
• The county adds an additional $300,000 each year to its OPEB trust and intends to continue funding the full annual
benefits costs, while gradually building up to fully prefunding this liability. We view the commitment to prefunding
as a positive step, but expect it will take some time to fully mitigate this risk.
The county participates in the following plans, funded as follows as of Dec. 31, 2018:
• Municipal Employees Retirement System (MERS) of Michigan: 48.85% funded with a proportionate share of the net
pension liability of $48.6 million.
• Grand Traverse County Retiree Health Care Plan: 33.45% funded with a proportionate share of the net OPEB
liability of $994,784.
• The county also offers defined contribution plans for certain employees.
In our opinion, a credit weakness is Grand Traverse County's large pension and OPEB obligation, without a plan in
place that we think will sufficiently address the obligation. Grand Traverse County's combined required pension and
actual OPEB contributions totaled 14.1% of total governmental fund expenditures in 2018. Of that amount, 12.4%
WWW.STANDARDANDPOORS.COM/RATINGSDIRECT OCTOBER 24, 2019 5
Summary: Grand Traverse County, Michigan Grand Traverse County Building Authority; General Obligation
Page 95 of 229
represented required contributions to pension obligations, and 1.7% represented OPEB payments. The county made
103% of its ADC in 2018, as part of its plan to shore up funding of its long-term liabilities.
MERS is an agent multiple-employer plan, meaning its assets are jointly managed. The plan has used a 7.75% discount
rate since 2015. Starting in 2019, this rate will be reduced to 7.35%, reflecting long-term trends. The plan's elevated
discount rate could lead to contribution volatility. Furthermore, some of the county's amortization methods, including
its open period and level percent of pay assuming 3.75% growth, are likely to lead to increasing ADCs, as well as ADCs
that do not meet our view of minimum funding progress. However, given that the county is currently overfunding its
ADC, we expect it would be able to absorb any resulting cost increases without pressuring operations. Furthermore,
these additional contributions are aiding the county in reaching its minimum funding progress.
Strong institutional framework
The institutional framework score for Michigan counties with a population greater than 4,000 is strong.
Outlook
The stable outlook reflects our expectation that the county will maintain stable budgetary performance, allowing it to
preserve sufficient budgetary flexibility and liquidity. Furthermore, it reflects our expectation that the county will work
toward addressing potential budgetary pressures stemming from its long-term liabilities. Therefore, we do not expect
to change the ratings during the two-year outlook horizon.
Downside scenario
We could lower the GO rating if the county's budgetary performance significantly weakens due to pressures from
increasing pension costs or any other source, causing reserves to materially deteriorate.
Upside scenario
If the county's economic indicators were to improve to levels commensurate with those of its higher-rated peers,
combined with significant pension funding progress, holding all other factors equal, we could raise the rating.
Related Research
• 2019 Update Of Institutional Framework For U.S. Local Governments
• Criteria Guidance: Assessing U.S. Public Finance Pension And Other Postemployment Obligations For GO Debt,
Local Government GO Ratings, And State Ratings, Oct. 7, 2019
• Alternative Financing: Disclosure Is Critical To Credit Analysis In Public Finance, Feb. 18, 2014
• S&P Public Finance Local GO Criteria: How We Adjust Data For Analytic Consistency, Sept. 12, 2013
Ratings Detail (As Of October 24, 2019)
Grand Traverse Cnty blair twp swr sys imp proj rfdg bnds
Long Term Rating AA/Stable Affirmed
Grand Traverse Cnty east bay charter twp wtr sys imp proj bnds ser 2016 dtd 04/01/2016 due 11/01/2035
Long Term Rating AA/Stable Affirmed
WWW.STANDARDANDPOORS.COM/RATINGSDIRECT OCTOBER 24, 2019 6
Summary: Grand Traverse County, Michigan Grand Traverse County Building Authority; General Obligation
Page 96 of 229
Ratings Detail (As Of October 24, 2019) (cont.)
Grand Traverse Cnty swr & wtr proj rfdg bnds ser 2012 dtd 10/01/2012 due 11/01/2013-2023
Long Term Rating AA/Stable Affirmed
Grand Traverse Cnty GO
Unenhanced Rating AA(SPUR)/Stable Affirmed
Grand Traverse Cnty Bldg Auth, Michigan
Grand Traverse Cnty, Michigan
Grand Traverse Cnty Bldg Auth (Grand Traverse Cnty) GO
Long Term Rating AA/Stable Affirmed
Northwestern Regl Arpt Comm, Michigan
Grand Traverse Cnty, Michigan
Northwestern Regl Arpt Comm (Grand Traverse Cnty) GO arpt rev bnds ser 2004 dtd 01/01/2005 due02/01/2006-2025
Unenhanced Rating AA(SPUR)/Stable Affirmed
Many issues are enhanced by bond insurance.
Certain terms used in this report, particularly certain adjectives used to express our view on rating relevant factors, have specific meanings ascribed
to them in our criteria, and should therefore be read in conjunction with such criteria. Please see Ratings Criteria at www.standardandpoors.com for
further information. Complete ratings information is available to subscribers of RatingsDirect at www.capitaliq.com. All ratings affected by this rating
action can be found on S&P Global Ratings' public website at www.standardandpoors.com. Use the Ratings search box located in the left column.
WWW.STANDARDANDPOORS.COM/RATINGSDIRECT OCTOBER 24, 2019 7
Summary: Grand Traverse County, Michigan Grand Traverse County Building Authority; General Obligation
Page 97 of 229
WWW.STANDARDANDPOORS.COM/RATINGSDIRECT OCTOBER 24, 2019 8
STANDARD & POOR’S, S&P and RATINGSDIRECT are registered trademarks of Standard & Poor’s Financial Services LLC.
S&P may receive compensation for its ratings and certain analyses, normally from issuers or underwriters of securities or from obligors. S&P reserves the right to disseminateits opinions and analyses. S&P's public ratings and analyses are made available on its Web sites, www.standardandpoors.com (free of charge), and www.ratingsdirect.com(subscription), and may be distributed through other means, including via S&P publications and third-party redistributors. Additional information about our ratings fees isavailable at www.standardandpoors.com/usratingsfees.
S&P keeps certain activities of its business units separate from each other in order to preserve the independence and objectivity of their respective activities. As a result,certain business units of S&P may have information that is not available to other S&P business units. S&P has established policies and procedures to maintain theconfidentiality of certain non-public information received in connection with each analytical process.
To the extent that regulatory authorities allow a rating agency to acknowledge in one jurisdiction a rating issued in another jurisdiction for certain regulatory purposes, S&Preserves the right to assign, withdraw or suspend such acknowledgment at any time and in its sole discretion. S&P Parties disclaim any duty whatsoever arising out of theassignment, withdrawal or suspension of an acknowledgment as well as any liability for any damage alleged to have been suffered on account thereof.
Credit-related and other analyses, including ratings, and statements in the Content are statements of opinion as of the date they are expressed and not statements of fact.S&P’s opinions, analyses and rating acknowledgment decisions (described below) are not recommendations to purchase, hold, or sell any securities or to make anyinvestment decisions, and do not address the suitability of any security. S&P assumes no obligation to update the Content following publication in any form or format. TheContent should not be relied on and is not a substitute for the skill, judgment and experience of the user, its management, employees, advisors and/or clients when makinginvestment and other business decisions. S&P does not act as a fiduciary or an investment advisor except where registered as such. While S&P has obtained information fromsources it believes to be reliable, S&P does not perform an audit and undertakes no duty of due diligence or independent verification of any information it receives. Rating-related publications may be published for a variety of reasons that are not necessarily dependent on action by rating committees, including, but not limited to, the publicationof a periodic update on a credit rating and related analyses.
No content (including ratings, credit-related analyses and data, valuations, model, software or other application or output therefrom) or any part thereof (Content) may bemodified, reverse engineered, reproduced or distributed in any form by any means, or stored in a database or retrieval system, without the prior written permission ofStandard & Poor’s Financial Services LLC or its affiliates (collectively, S&P). The Content shall not be used for any unlawful or unauthorized purposes. S&P and any third-partyproviders, as well as their directors, officers, shareholders, employees or agents (collectively S&P Parties) do not guarantee the accuracy, completeness, timeliness oravailability of the Content. S&P Parties are not responsible for any errors or omissions (negligent or otherwise), regardless of the cause, for the results obtained from the useof the Content, or for the security or maintenance of any data input by the user. The Content is provided on an “as is” basis. S&P PARTIES DISCLAIM ANY AND ALL EXPRESSOR IMPLIED WARRANTIES, INCLUDING, BUT NOT LIMITED TO, ANY WARRANTIES OF MERCHANTABILITY OR FITNESS FOR A PARTICULAR PURPOSE OR USE, FREEDOMFROM BUGS, SOFTWARE ERRORS OR DEFECTS, THAT THE CONTENT’S FUNCTIONING WILL BE UNINTERRUPTED OR THAT THE CONTENT WILL OPERATE WITH ANYSOFTWARE OR HARDWARE CONFIGURATION. In no event shall S&P Parties be liable to any party for any direct, indirect, incidental, exemplary, compensatory, punitive,special or consequential damages, costs, expenses, legal fees, or losses (including, without limitation, lost income or lost profits and opportunity costs or losses caused bynegligence) in connection with any use of the Content even if advised of the possibility of such damages.
Copyright © 2019 by Standard & Poor’s Financial Services LLC. All rights reserved.
Page 98 of 229

Grand Traverse County – Comprehensive Financial Plan 18
Appendix H Grand Traverse Pavilions Post-Retirement Medical Plan Accounting Report Dated December 31, 2019
Page 99 of 229
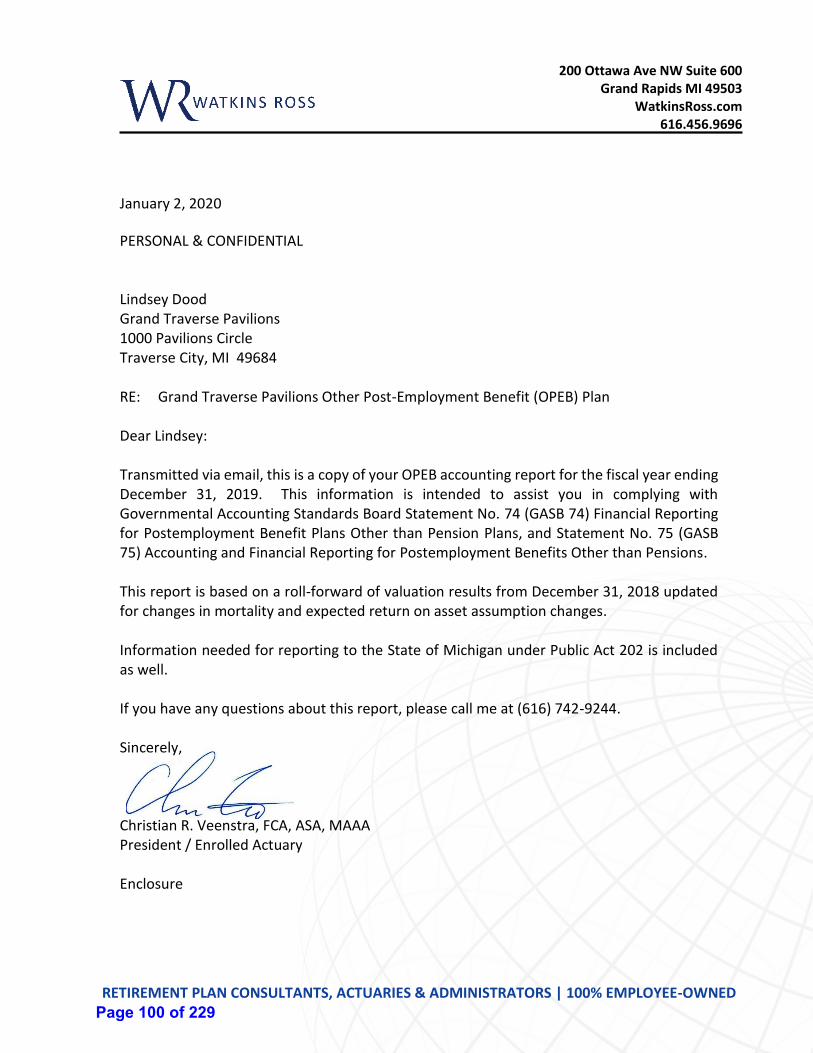
200 Ottawa Ave NW Suite 600 Grand Rapids MI 49503
WatkinsRoss.com 616.456.9696
RETIREMENT PLAN CONSULTANTS, ACTUARIES & ADMINISTRATORS | 100% EMPLOYEE-OWNED
January 2, 2020
PERSONAL & CONFIDENTIAL Lindsey Dood Grand Traverse Pavilions 1000 Pavilions Circle Traverse City, MI 49684 RE: Grand Traverse Pavilions Other Post-Employment Benefit (OPEB) Plan Dear Lindsey: Transmitted via email, this is a copy of your OPEB accounting report for the fiscal year ending December 31, 2019. This information is intended to assist you in complying with Governmental Accounting Standards Board Statement No. 74 (GASB 74) Financial Reporting for Postemployment Benefit Plans Other than Pension Plans, and Statement No. 75 (GASB 75) Accounting and Financial Reporting for Postemployment Benefits Other than Pensions. This report is based on a roll-forward of valuation results from December 31, 2018 updated for changes in mortality and expected return on asset assumption changes. Information needed for reporting to the State of Michigan under Public Act 202 is included as well. If you have any questions about this report, please call me at (616) 742-9244. Sincerely, Christian R. Veenstra, FCA, ASA, MAAA President / Enrolled Actuary Enclosure
Page 100 of 229
Grand Traverse Pavilions Post-Retirement Medical Plan
Accounting Report
for the Period Ending December 31, 2019
under GASB Statements 74 & 75
WATKINS ROSS | 200 OTTAWA AVE N.W. | SUITE 600 | GRAND RAPIDS, MI 49503 | 616.456.9696
Page 101 of 229

Report presented by:
January 2020
Page 102 of 229
CONTENTS
INTRODUCTION AND CERTIFICATION ..................................................................................................1
COMMENTS .......................................................................................................................................2
Description of Actuarially Determined Contributions .............................................................................. 2
PLAN DESCRIPTION ............................................................................................................................3
ASSUMPTIONS AND METHODS ...........................................................................................................4
NET OPEB LIABILITY............................................................................................................................5
Net OPEB Liability at December 31, 2019 ................................................................................................ 5
OPEB Plan Fiduciary Net Position ............................................................................................................. 5
Changes in the Net OPEB Liability ............................................................................................................ 5
Reconciliation of Net OPEB Liability ......................................................................................................... 5
Net OPEB Liability – Discount and Trend Rate Sensitivities ..................................................................... 6
Subsequent events ................................................................................................................................... 6
OPEB EXPENSE ...................................................................................................................................7
Components of OPEB Expense for the Fiscal Year Ending December 31, 2019 ....................................... 7
Deferred Inflows and Outflows of Resources Related to OPEB Plan ....................................................... 7
SCHEDULES OF REQUIRED SUPPLEMENTARY INFORMATION ...............................................................8
Description of Actuarially Determined Contributions .............................................................................. 8
State of Michigan Public Acts 530 and 202 Information .......................................................................... 9
Changes in Net OPEB Liability and Related Ratios ................................................................................. 10
Schedule of Employer Contributions ...................................................................................................... 10
Schedule of Difference between Actual and Expected Experience ....................................................... 13
Schedule of Changes in Assumptions ..................................................................................................... 13
Schedule of Differences between Projected and Actual Earnings on Plan Investments ....................... 13
Total Deferred Outflow (Inflow) of Resources ....................................................................................... 13
SUMMARY OF PLAN PROVISIONS ..................................................................................................... 14
GLOSSARY ....................................................................................................................................... 15
Page 103 of 229
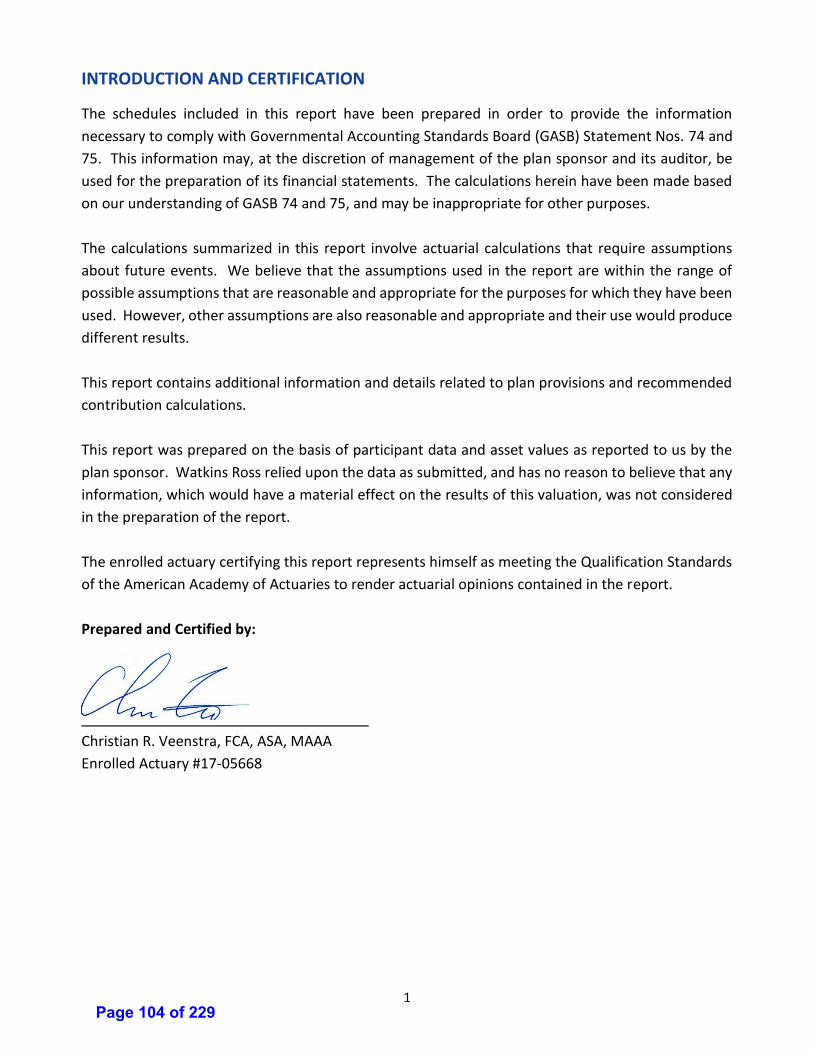
1
INTRODUCTION AND CERTIFICATION
The schedules included in this report have been prepared in order to provide the information
necessary to comply with Governmental Accounting Standards Board (GASB) Statement Nos. 74 and
75. This information may, at the discretion of management of the plan sponsor and its auditor, be
used for the preparation of its financial statements. The calculations herein have been made based
on our understanding of GASB 74 and 75, and may be inappropriate for other purposes.
The calculations summarized in this report involve actuarial calculations that require assumptions
about future events. We believe that the assumptions used in the report are within the range of
possible assumptions that are reasonable and appropriate for the purposes for which they have been
used. However, other assumptions are also reasonable and appropriate and their use would produce
different results.
This report contains additional information and details related to plan provisions and recommended
contribution calculations.
This report was prepared on the basis of participant data and asset values as reported to us by the
plan sponsor. Watkins Ross relied upon the data as submitted, and has no reason to believe that any
information, which would have a material effect on the results of this valuation, was not considered
in the preparation of the report.
The enrolled actuary certifying this report represents himself as meeting the Qualification Standards
of the American Academy of Actuaries to render actuarial opinions contained in the report.
Prepared and Certified by:
Christian R. Veenstra, FCA, ASA, MAAA
Enrolled Actuary #17-05668
Page 104 of 229
2
COMMENTS
Description of Actuarially Determined Contributions
Purpose of Governmental Accounting Standards Board (GASB) Reporting
The objective of GASB is to provide guidelines and requirements for accounting and financial reporting by State
and local governments for postemployment benefits other than pensions (OPEB). This statement establishes
standards for recognizing and measuring liabilities, deferred inflows and outflows of resources and methods
and assumptions that are required to be used to project benefits payments and discount those payments to
their actuarial present value.
The methods and assumptions may or may not be an appropriate measure of the plan’s liability for funding
purposes or for reporting liabilities under Public Act 202 of the State of Michigan. Thus, liabilities and other
values calculated for those purposes may differ from the ones used for GASB reporting.
State of Michigan Public Act 202
Public Act 202 (PA 202) was drafted to address the underfunded status of pension and retiree healthcare plans
of local governments in Michigan. Accordingly, PA 202 included transparency and funding requirements. In
addition, in order that the plans’ funded status of plan sponsors be reported on a consistent basis, Uniform
Assumptions were published. While all of the Uniform Assumptions have a sound and reasonable basis, some
might not be appropriate for each plan so may be different than what is used for funding. Additionally, some
of the assumptions may differ from what is required for reporting under GASB.
Actuarially Determined Contribution for GASB reporting
GASB reporting includes a 10-year history of a comparison of actual annual amounts contributed by an
employer on behalf of the OPEB plan and an Actuarially Determined Contribution (ADC). In addition, the report
includes a summary of assumptions used to determine the ADC. This reporting requirement presumes a
separate funding report is completed. However, for many employers, separate funding studies have not been
solicited. So, in order to provide this information, we have included a contribution section in this report
(Schedules of Required Supplementary Information: Description of Actuarially Determined Contribution) that
provides this information. The assumptions and methods used for these calculations are derived from those
used for GASB reporting and not necessarily consistent with PA 202 unless otherwise indicated. This report
includes an ADC determined using an amortization of the unfunded liability over the average future working
life of your employees for GASB reporting purposes.
Actuarially Determined Contribution under Public Act 202
Public Act 202 also requires a calculation of an ADC using the prescribed Uniform Assumptions. This ADC differs
from the one used for the 10-year reporting history noted in the paragraph above. (Schedules of Required
Supplementary Information: State of Michigan Public Acts 530 and 202 Information)
Changes in Actuarial Assumptions, Plan Changes and Expected Actuarial Experience
Between December 31, 2018 and December 31, 2019 there was a $5,000 actuarial gain due to benefit
payments less than expected. Offsetting this decrease is a $139,000 liability increase attributable to mortality
and discount rate assumption changes as identified in the Summary of Assumptions section of this report.
These assumption changes were done to better model expectations.
Page 105 of 229
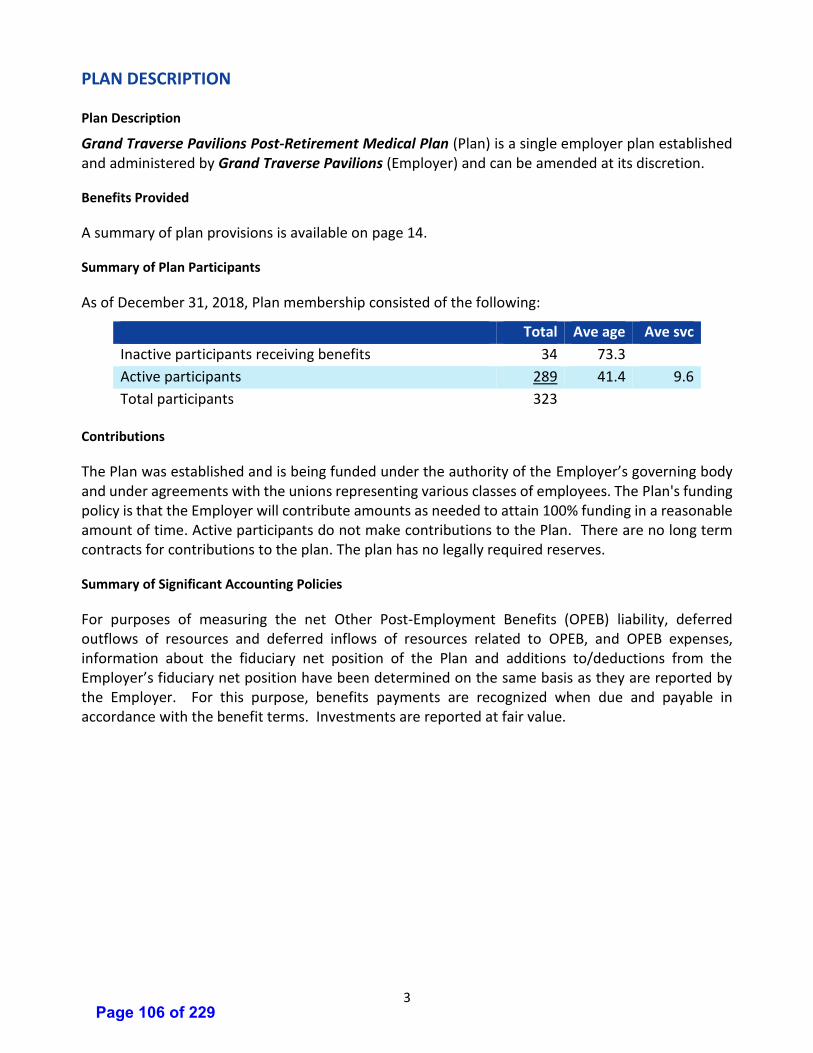
3
PLAN DESCRIPTION
Plan Description
Grand Traverse Pavilions Post-Retirement Medical Plan (Plan) is a single employer plan established and administered by Grand Traverse Pavilions (Employer) and can be amended at its discretion.
Benefits Provided
A summary of plan provisions is available on page 14.
Summary of Plan Participants
As of December 31, 2018, Plan membership consisted of the following:
Total Ave age Ave svc
Inactive participants receiving benefits 34 73.3
Active participants 289 41.4 9.6
Total participants 323
Contributions
The Plan was established and is being funded under the authority of the Employer’s governing body and under agreements with the unions representing various classes of employees. The Plan's funding policy is that the Employer will contribute amounts as needed to attain 100% funding in a reasonable amount of time. Active participants do not make contributions to the Plan. There are no long term contracts for contributions to the plan. The plan has no legally required reserves.
Summary of Significant Accounting Policies
For purposes of measuring the net Other Post-Employment Benefits (OPEB) liability, deferred outflows of resources and deferred inflows of resources related to OPEB, and OPEB expenses, information about the fiduciary net position of the Plan and additions to/deductions from the Employer’s fiduciary net position have been determined on the same basis as they are reported by the Employer. For this purpose, benefits payments are recognized when due and payable in accordance with the benefit terms. Investments are reported at fair value.
Page 106 of 229
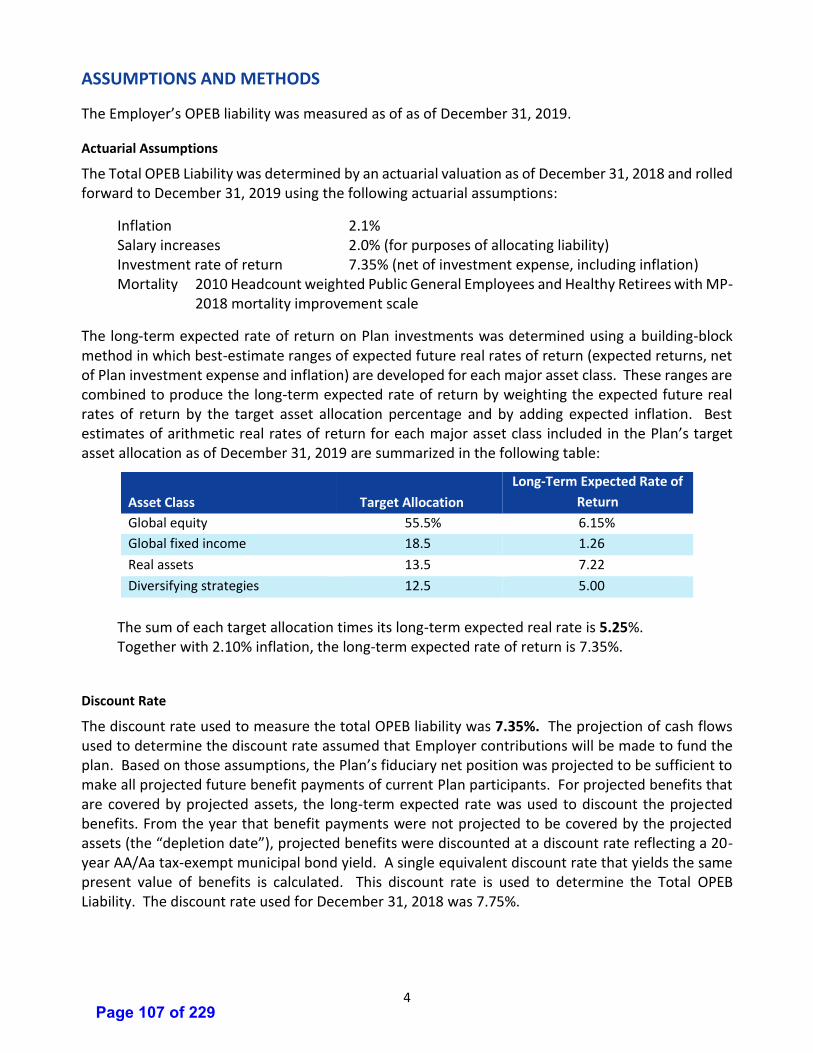
4
ASSUMPTIONS AND METHODS
The Employer’s OPEB liability was measured as of as of December 31, 2019.
Actuarial Assumptions
The Total OPEB Liability was determined by an actuarial valuation as of December 31, 2018 and rolled forward to December 31, 2019 using the following actuarial assumptions:
Inflation 2.1% Salary increases 2.0% (for purposes of allocating liability) Investment rate of return 7.35% (net of investment expense, including inflation) Mortality 2010 Headcount weighted Public General Employees and Healthy Retirees with MP-
2018 mortality improvement scale
The long-term expected rate of return on Plan investments was determined using a building-block method in which best-estimate ranges of expected future real rates of return (expected returns, net of Plan investment expense and inflation) are developed for each major asset class. These ranges are combined to produce the long-term expected rate of return by weighting the expected future real rates of return by the target asset allocation percentage and by adding expected inflation. Best estimates of arithmetic real rates of return for each major asset class included in the Plan’s target asset allocation as of December 31, 2019 are summarized in the following table:
Asset Class Target Allocation
Long-Term Expected Rate of
Return
Global equity 55.5% 6.15%
Global fixed income 18.5 1.26
Real assets 13.5 7.22
Diversifying strategies 12.5 5.00
The sum of each target allocation times its long-term expected real rate is 5.25%. Together with 2.10% inflation, the long-term expected rate of return is 7.35%.
Discount Rate
The discount rate used to measure the total OPEB liability was 7.35%. The projection of cash flows used to determine the discount rate assumed that Employer contributions will be made to fund the plan. Based on those assumptions, the Plan’s fiduciary net position was projected to be sufficient to make all projected future benefit payments of current Plan participants. For projected benefits that are covered by projected assets, the long-term expected rate was used to discount the projected benefits. From the year that benefit payments were not projected to be covered by the projected assets (the “depletion date”), projected benefits were discounted at a discount rate reflecting a 20-year AA/Aa tax-exempt municipal bond yield. A single equivalent discount rate that yields the same present value of benefits is calculated. This discount rate is used to determine the Total OPEB Liability. The discount rate used for December 31, 2018 was 7.75%.
Page 107 of 229
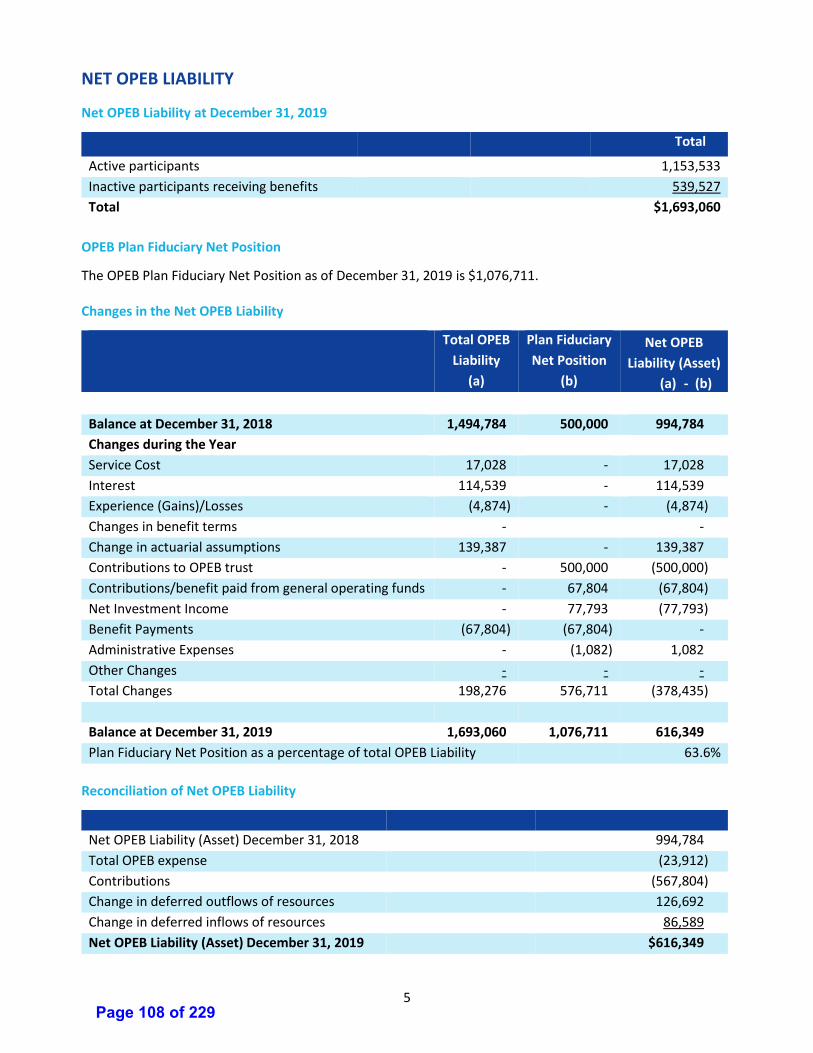
5
NET OPEB LIABILITY
Net OPEB Liability at December 31, 2019
Total
Active participants 1,153,533
Inactive participants receiving benefits 539,527
Total $1,693,060
OPEB Plan Fiduciary Net Position
The OPEB Plan Fiduciary Net Position as of December 31, 2019 is $1,076,711. Changes in the Net OPEB Liability
Total OPEB
Liability
(a)
Plan Fiduciary
Net Position
(b)
Net OPEB
Liability (Asset)
(a) - (b)
Balance at December 31, 2018 1,494,784 500,000 994,784
Changes during the Year
Service Cost 17,028 - 17,028
Interest 114,539 - 114,539
Experience (Gains)/Losses (4,874) - (4,874)
Changes in benefit terms - -
Change in actuarial assumptions 139,387 - 139,387
Contributions to OPEB trust - 500,000 (500,000)
Contributions/benefit paid from general operating funds - 67,804 (67,804)
Net Investment Income - 77,793 (77,793)
Benefit Payments (67,804) (67,804) -
Administrative Expenses - (1,082) 1,082
Other Changes - - -
Total Changes 198,276 576,711 (378,435)
Balance at December 31, 2019 1,693,060 1,076,711 616,349
Plan Fiduciary Net Position as a percentage of total OPEB Liability 63.6%
Reconciliation of Net OPEB Liability
Net OPEB Liability (Asset) December 31, 2018 994,784
Total OPEB expense (23,912)
Contributions (567,804)
Change in deferred outflows of resources 126,692
Change in deferred inflows of resources 86,589
Net OPEB Liability (Asset) December 31, 2019 $616,349
Page 108 of 229
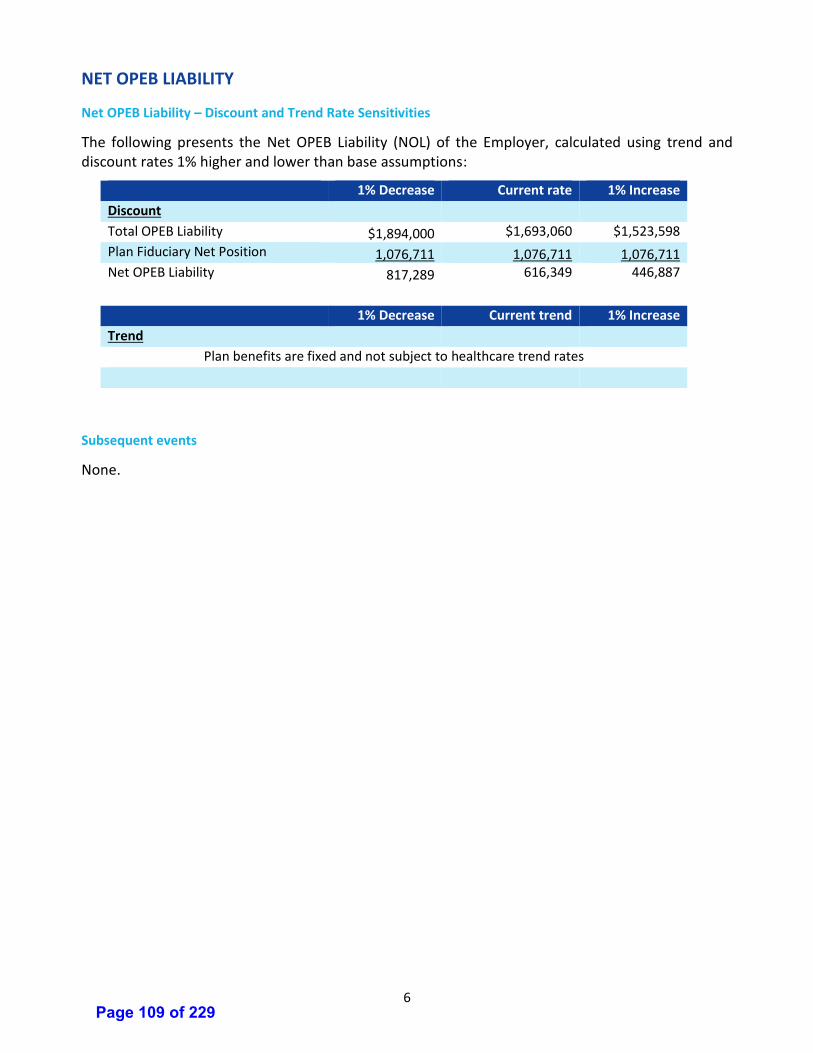
6
NET OPEB LIABILITY
Net OPEB Liability – Discount and Trend Rate Sensitivities
The following presents the Net OPEB Liability (NOL) of the Employer, calculated using trend and discount rates 1% higher and lower than base assumptions:
1% Decrease Current rate 1% Increase
Discount
Total OPEB Liability $1,894,000 $1,693,060 $1,523,598
Plan Fiduciary Net Position 1,076,711 1,076,711 1,076,711
Net OPEB Liability 817,289 616,349 446,887
1% Decrease Current trend 1% Increase
Trend
Plan benefits are fixed and not subject to healthcare trend rates
Subsequent events
None.
Page 109 of 229
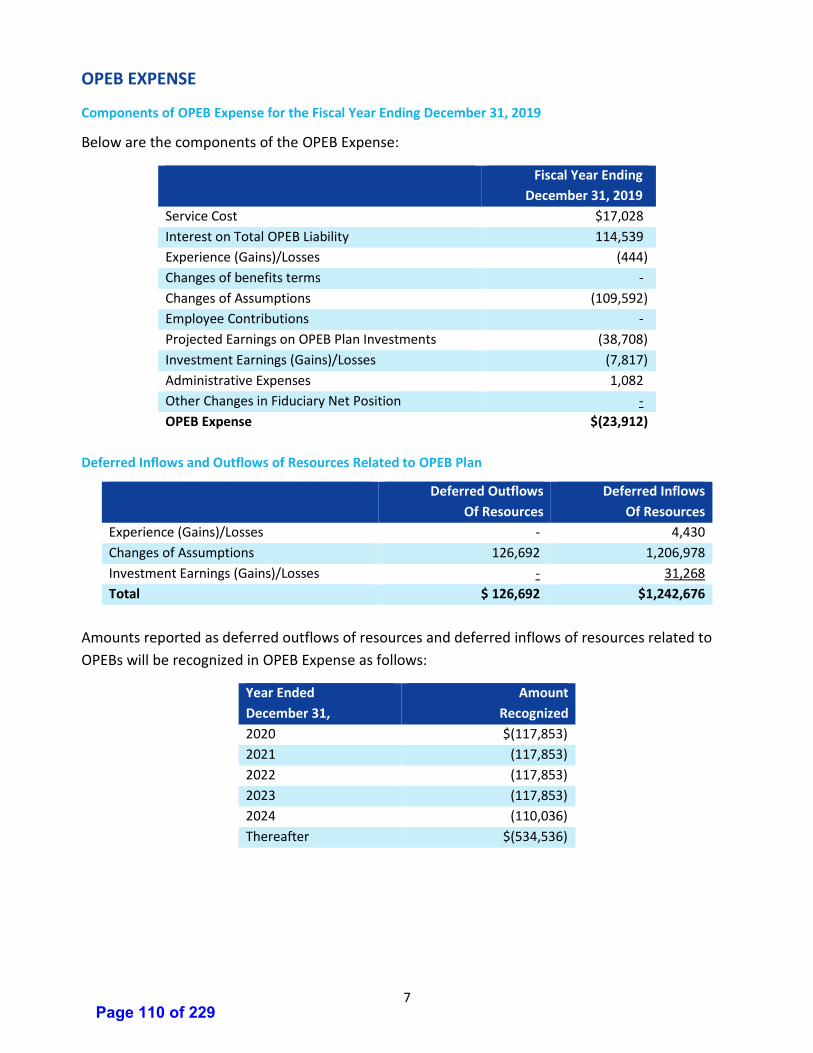
7
OPEB EXPENSE
Components of OPEB Expense for the Fiscal Year Ending December 31, 2019
Below are the components of the OPEB Expense:
Fiscal Year Ending
December 31, 2019
Service Cost $17,028
Interest on Total OPEB Liability 114,539
Experience (Gains)/Losses (444)
Changes of benefits terms -
Changes of Assumptions (109,592)
Employee Contributions -
Projected Earnings on OPEB Plan Investments (38,708)
Investment Earnings (Gains)/Losses (7,817)
Administrative Expenses 1,082
Other Changes in Fiduciary Net Position -
OPEB Expense $(23,912)
Deferred Inflows and Outflows of Resources Related to OPEB Plan
Deferred Outflows
Of Resources
Deferred Inflows
Of Resources
Experience (Gains)/Losses - 4,430
Changes of Assumptions 126,692 1,206,978
Investment Earnings (Gains)/Losses - 31,268
Total $ 126,692 $1,242,676
Amounts reported as deferred outflows of resources and deferred inflows of resources related to
OPEBs will be recognized in OPEB Expense as follows:
Year Ended
December 31,
Amount
Recognized
2020 $(117,853)
2021 (117,853)
2022 (117,853)
2023 (117,853)
2024 (110,036)
Thereafter $(534,536)
Page 110 of 229
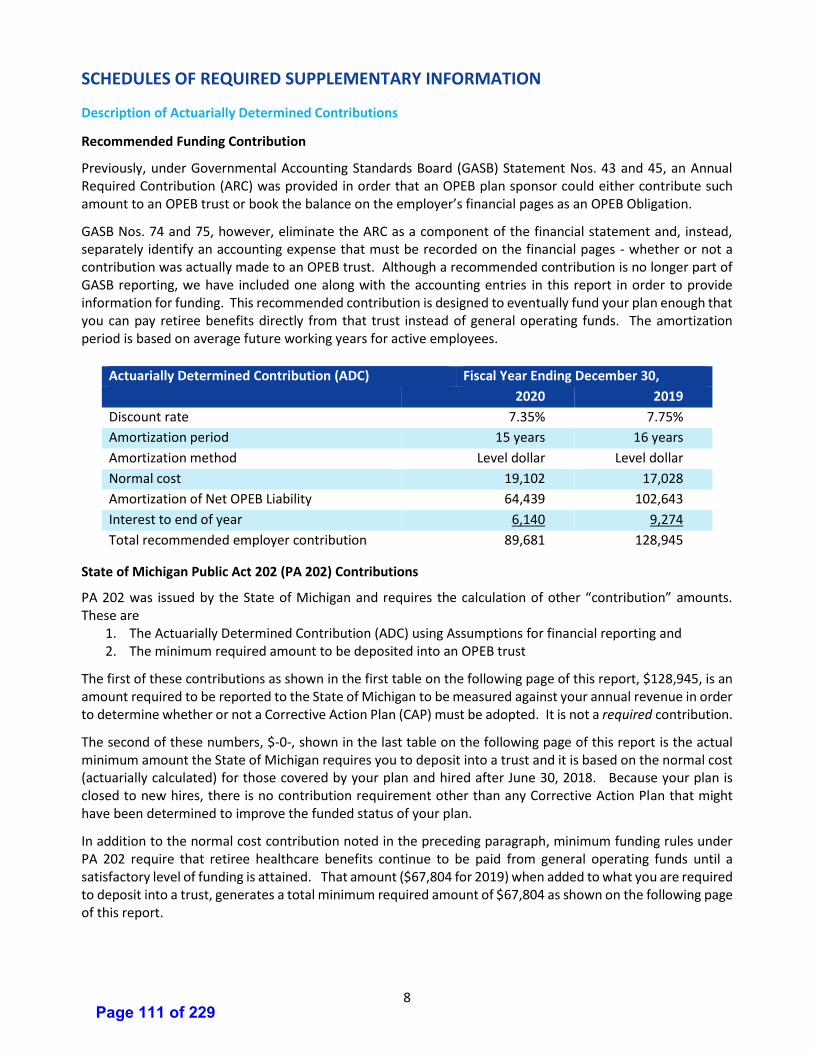
8
SCHEDULES OF REQUIRED SUPPLEMENTARY INFORMATION
Description of Actuarially Determined Contributions
Recommended Funding Contribution
Previously, under Governmental Accounting Standards Board (GASB) Statement Nos. 43 and 45, an Annual Required Contribution (ARC) was provided in order that an OPEB plan sponsor could either contribute such amount to an OPEB trust or book the balance on the employer’s financial pages as an OPEB Obligation.
GASB Nos. 74 and 75, however, eliminate the ARC as a component of the financial statement and, instead, separately identify an accounting expense that must be recorded on the financial pages - whether or not a contribution was actually made to an OPEB trust. Although a recommended contribution is no longer part of GASB reporting, we have included one along with the accounting entries in this report in order to provide information for funding. This recommended contribution is designed to eventually fund your plan enough that you can pay retiree benefits directly from that trust instead of general operating funds. The amortization period is based on average future working years for active employees.
Actuarially Determined Contribution (ADC) Fiscal Year Ending December 30,
2020 2019
Discount rate 7.35% 7.75%
Amortization period 15 years 16 years
Amortization method Level dollar Level dollar
Normal cost 19,102 17,028
Amortization of Net OPEB Liability 64,439 102,643
Interest to end of year 6,140 9,274
Total recommended employer contribution 89,681 128,945
State of Michigan Public Act 202 (PA 202) Contributions
PA 202 was issued by the State of Michigan and requires the calculation of other “contribution” amounts. These are
1. The Actuarially Determined Contribution (ADC) using Assumptions for financial reporting and 2. The minimum required amount to be deposited into an OPEB trust
The first of these contributions as shown in the first table on the following page of this report, $128,945, is an amount required to be reported to the State of Michigan to be measured against your annual revenue in order to determine whether or not a Corrective Action Plan (CAP) must be adopted. It is not a required contribution.
The second of these numbers, $-0-, shown in the last table on the following page of this report is the actual minimum amount the State of Michigan requires you to deposit into a trust and it is based on the normal cost (actuarially calculated) for those covered by your plan and hired after June 30, 2018. Because your plan is closed to new hires, there is no contribution requirement other than any Corrective Action Plan that might have been determined to improve the funded status of your plan.
In addition to the normal cost contribution noted in the preceding paragraph, minimum funding rules under PA 202 require that retiree healthcare benefits continue to be paid from general operating funds until a satisfactory level of funding is attained. That amount ($67,804 for 2019) when added to what you are required to deposit into a trust, generates a total minimum required amount of $67,804 as shown on the following page of this report.
Page 111 of 229
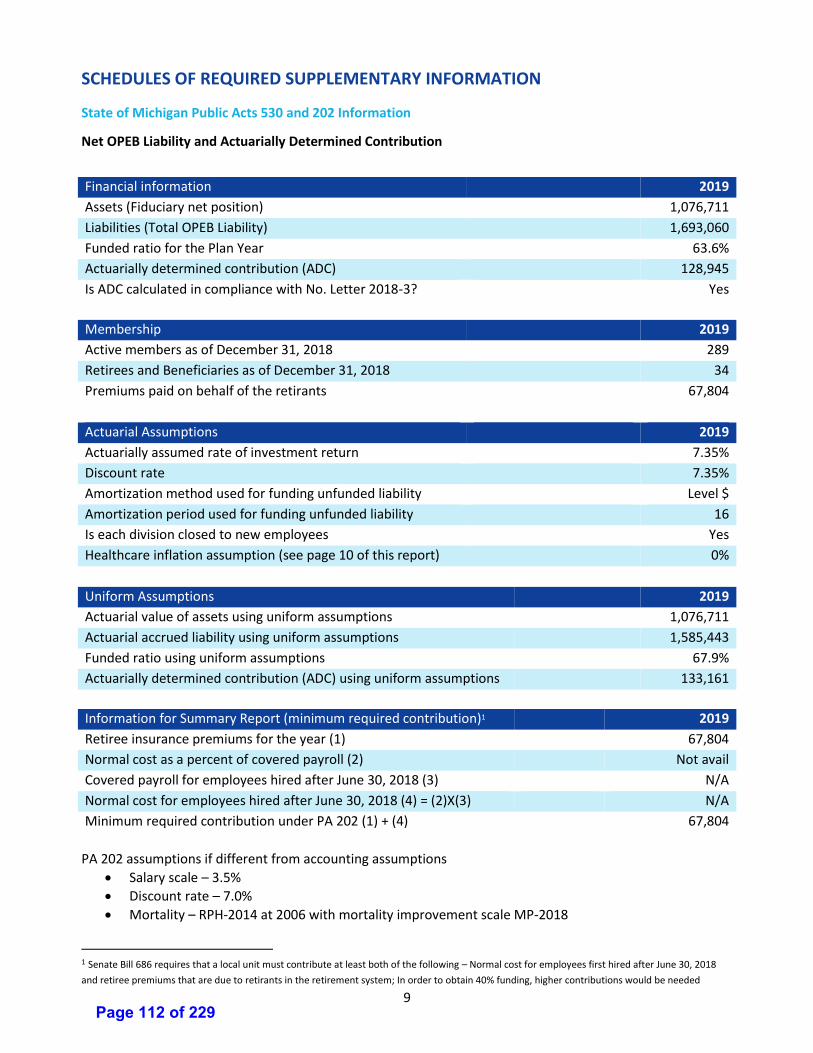
9
SCHEDULES OF REQUIRED SUPPLEMENTARY INFORMATION
State of Michigan Public Acts 530 and 202 Information
Net OPEB Liability and Actuarially Determined Contribution
Financial information 2019
Assets (Fiduciary net position) 1,076,711
Liabilities (Total OPEB Liability) 1,693,060
Funded ratio for the Plan Year 63.6%
Actuarially determined contribution (ADC) 128,945
Is ADC calculated in compliance with No. Letter 2018-3? Yes
Membership 2019
Active members as of December 31, 2018 289
Retirees and Beneficiaries as of December 31, 2018 34
Premiums paid on behalf of the retirants 67,804
Actuarial Assumptions 2019
Actuarially assumed rate of investment return 7.35%
Discount rate 7.35%
Amortization method used for funding unfunded liability Level $
Amortization period used for funding unfunded liability 16
Is each division closed to new employees Yes
Healthcare inflation assumption (see page 10 of this report) 0%
Uniform Assumptions 2019
Actuarial value of assets using uniform assumptions 1,076,711
Actuarial accrued liability using uniform assumptions 1,585,443
Funded ratio using uniform assumptions 67.9%
Actuarially determined contribution (ADC) using uniform assumptions 133,161
Information for Summary Report (minimum required contribution)1 2019
Retiree insurance premiums for the year (1) 67,804
Normal cost as a percent of covered payroll (2) Not avail
Covered payroll for employees hired after June 30, 2018 (3) N/A
Normal cost for employees hired after June 30, 2018 (4) = (2)X(3) N/A
Minimum required contribution under PA 202 (1) + (4) 67,804
PA 202 assumptions if different from accounting assumptions
• Salary scale – 3.5%
• Discount rate – 7.0%
• Mortality – RPH-2014 at 2006 with mortality improvement scale MP-2018
1 Senate Bill 686 requires that a local unit must contribute at least both of the following – Normal cost for employees first hired after June 30, 2018
and retiree premiums that are due to retirants in the retirement system; In order to obtain 40% funding, higher contributions would be needed
Page 112 of 229
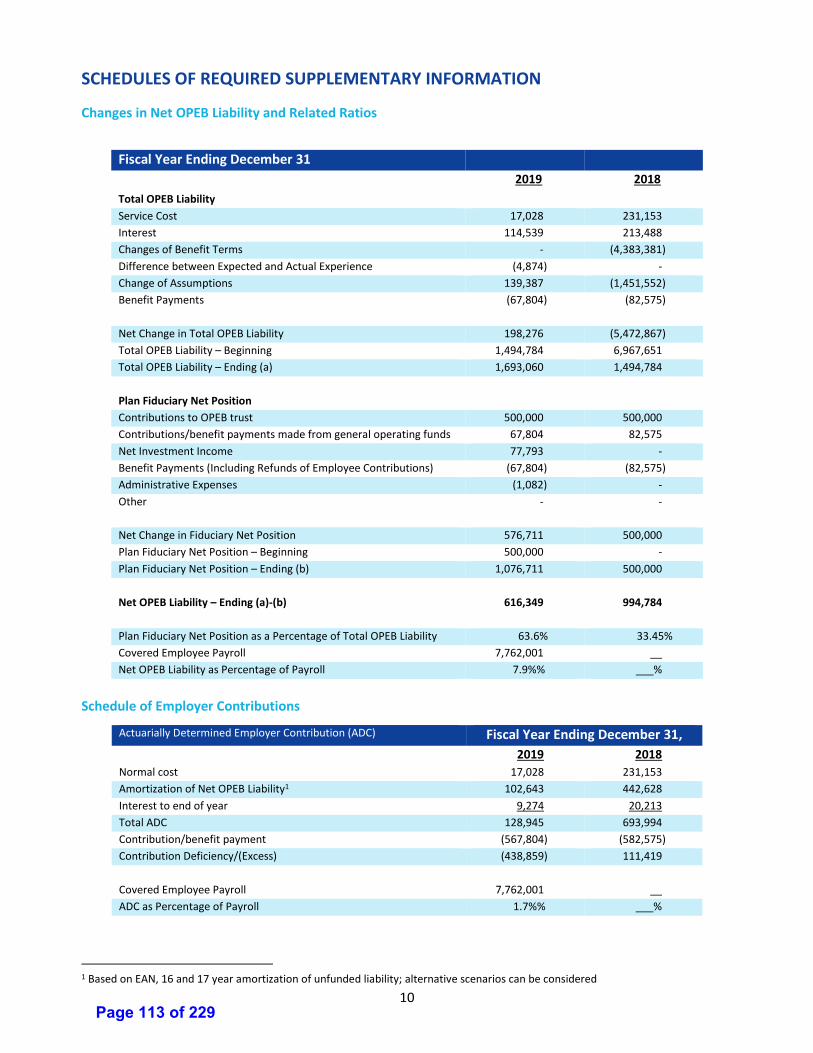
10
SCHEDULES OF REQUIRED SUPPLEMENTARY INFORMATION
Changes in Net OPEB Liability and Related Ratios
Fiscal Year Ending December 31 2019 2018
Total OPEB Liability
Service Cost 17,028 231,153
Interest 114,539 213,488
Changes of Benefit Terms - (4,383,381)
Difference between Expected and Actual Experience (4,874) -
Change of Assumptions 139,387 (1,451,552)
Benefit Payments (67,804) (82,575)
Net Change in Total OPEB Liability 198,276 (5,472,867)
Total OPEB Liability – Beginning 1,494,784 6,967,651
Total OPEB Liability – Ending (a) 1,693,060 1,494,784
Plan Fiduciary Net Position
Contributions to OPEB trust 500,000 500,000
Contributions/benefit payments made from general operating funds 67,804 82,575
Net Investment Income 77,793 -
Benefit Payments (Including Refunds of Employee Contributions) (67,804) (82,575)
Administrative Expenses (1,082) -
Other - -
Net Change in Fiduciary Net Position 576,711 500,000
Plan Fiduciary Net Position – Beginning 500,000 -
Plan Fiduciary Net Position – Ending (b) 1,076,711 500,000
Net OPEB Liability – Ending (a)-(b) 616,349 994,784
Plan Fiduciary Net Position as a Percentage of Total OPEB Liability 63.6% 33.45%
Covered Employee Payroll 7,762,001 __
Net OPEB Liability as Percentage of Payroll 7.9%% ___%
Schedule of Employer Contributions
Actuarially Determined Employer Contribution (ADC) Fiscal Year Ending December 31, 2019 2018
Normal cost 17,028 231,153
Amortization of Net OPEB Liability1 102,643 442,628
Interest to end of year 9,274 20,213
Total ADC 128,945 693,994
Contribution/benefit payment (567,804) (582,575)
Contribution Deficiency/(Excess) (438,859) 111,419
Covered Employee Payroll 7,762,001 __
ADC as Percentage of Payroll 1.7%% ___%
1 Based on EAN, 16 and 17 year amortization of unfunded liability; alternative scenarios can be considered
Page 113 of 229
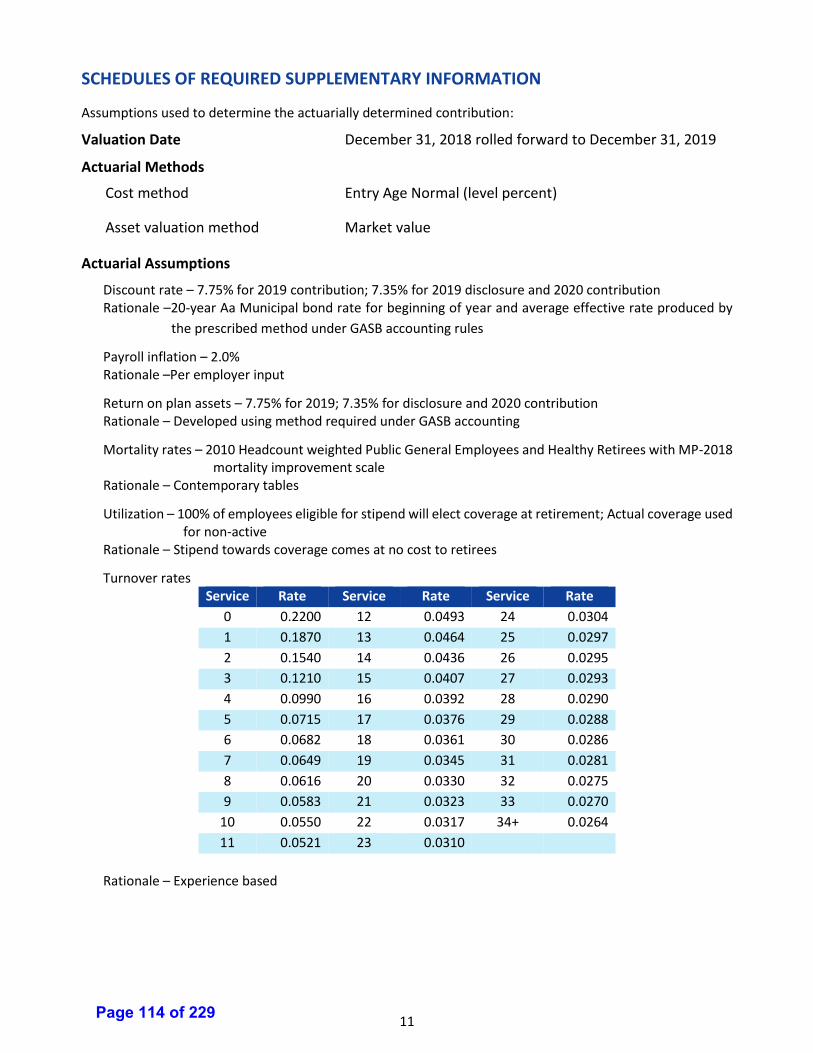
11
SCHEDULES OF REQUIRED SUPPLEMENTARY INFORMATION
Assumptions used to determine the actuarially determined contribution:
Valuation Date December 31, 2018 rolled forward to December 31, 2019
Actuarial Methods
Cost method Entry Age Normal (level percent) Asset valuation method Market value
Actuarial Assumptions
Discount rate – 7.75% for 2019 contribution; 7.35% for 2019 disclosure and 2020 contribution Rationale –20-year Aa Municipal bond rate for beginning of year and average effective rate produced by
the prescribed method under GASB accounting rules
Payroll inflation – 2.0% Rationale –Per employer input
Return on plan assets – 7.75% for 2019; 7.35% for disclosure and 2020 contribution Rationale – Developed using method required under GASB accounting
Mortality rates – 2010 Headcount weighted Public General Employees and Healthy Retirees with MP-2018 mortality improvement scale
Rationale – Contemporary tables
Utilization – 100% of employees eligible for stipend will elect coverage at retirement; Actual coverage used for non-active
Rationale – Stipend towards coverage comes at no cost to retirees
Turnover rates Service Rate Service Rate Service Rate
0 0.2200 12 0.0493 24 0.0304
1 0.1870 13 0.0464 25 0.0297
2 0.1540 14 0.0436 26 0.0295
3 0.1210 15 0.0407 27 0.0293
4 0.0990 16 0.0392 28 0.0290
5 0.0715 17 0.0376 29 0.0288
6 0.0682 18 0.0361 30 0.0286
7 0.0649 19 0.0345 31 0.0281
8 0.0616 20 0.0330 32 0.0275
9 0.0583 21 0.0323 33 0.0270
10 0.0550 22 0.0317 34+ 0.0264
11 0.0521 23 0.0310
Rationale – Experience based
Page 114 of 229
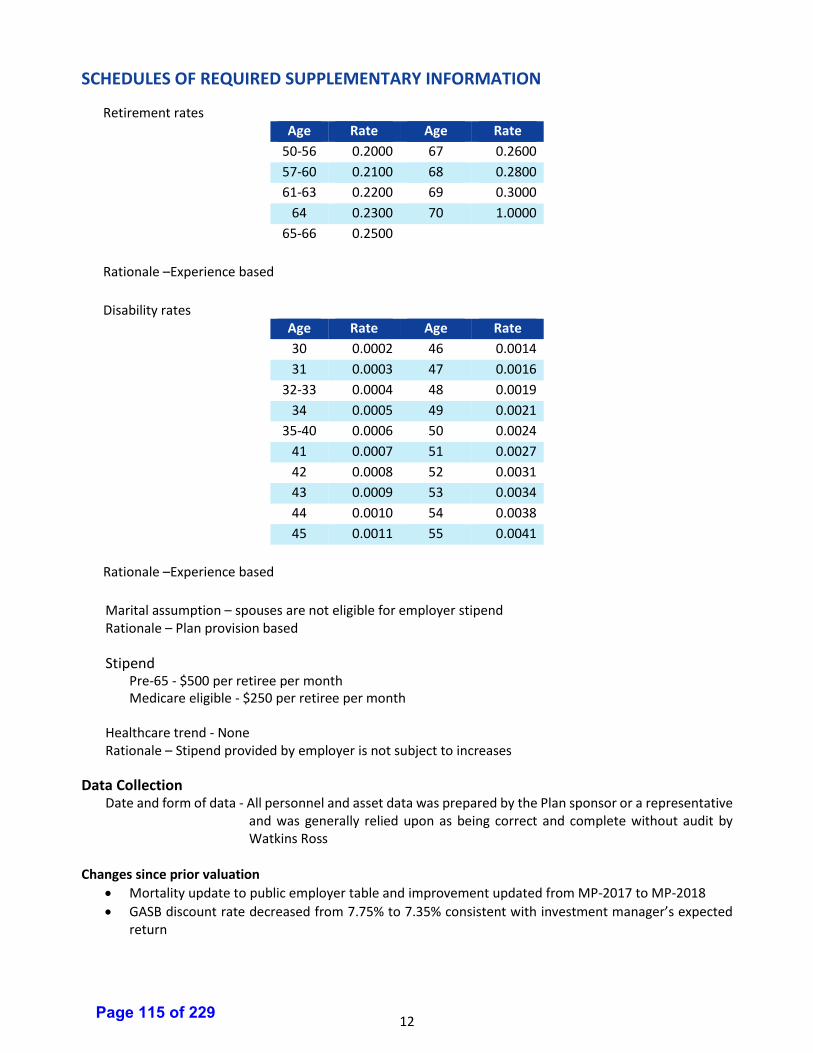
12
SCHEDULES OF REQUIRED SUPPLEMENTARY INFORMATION
Retirement rates Age Rate Age Rate
50-56 0.2000 67 0.2600
57-60 0.2100 68 0.2800
61-63 0.2200 69 0.3000
64 0.2300 70 1.0000
65-66 0.2500
Rationale –Experience based
Disability rates Age Rate Age Rate
30 0.0002 46 0.0014
31 0.0003 47 0.0016
32-33 0.0004 48 0.0019
34 0.0005 49 0.0021
35-40 0.0006 50 0.0024
41 0.0007 51 0.0027
42 0.0008 52 0.0031
43 0.0009 53 0.0034
44 0.0010 54 0.0038
45 0.0011 55 0.0041
Rationale –Experience based
Marital assumption – spouses are not eligible for employer stipend Rationale – Plan provision based Stipend Pre-65 - $500 per retiree per month Medicare eligible - $250 per retiree per month Healthcare trend - None Rationale – Stipend provided by employer is not subject to increases Data Collection
Date and form of data - All personnel and asset data was prepared by the Plan sponsor or a representative and was generally relied upon as being correct and complete without audit by Watkins Ross
Changes since prior valuation
• Mortality update to public employer table and improvement updated from MP-2017 to MP-2018
• GASB discount rate decreased from 7.75% to 7.35% consistent with investment manager’s expected return
Page 115 of 229
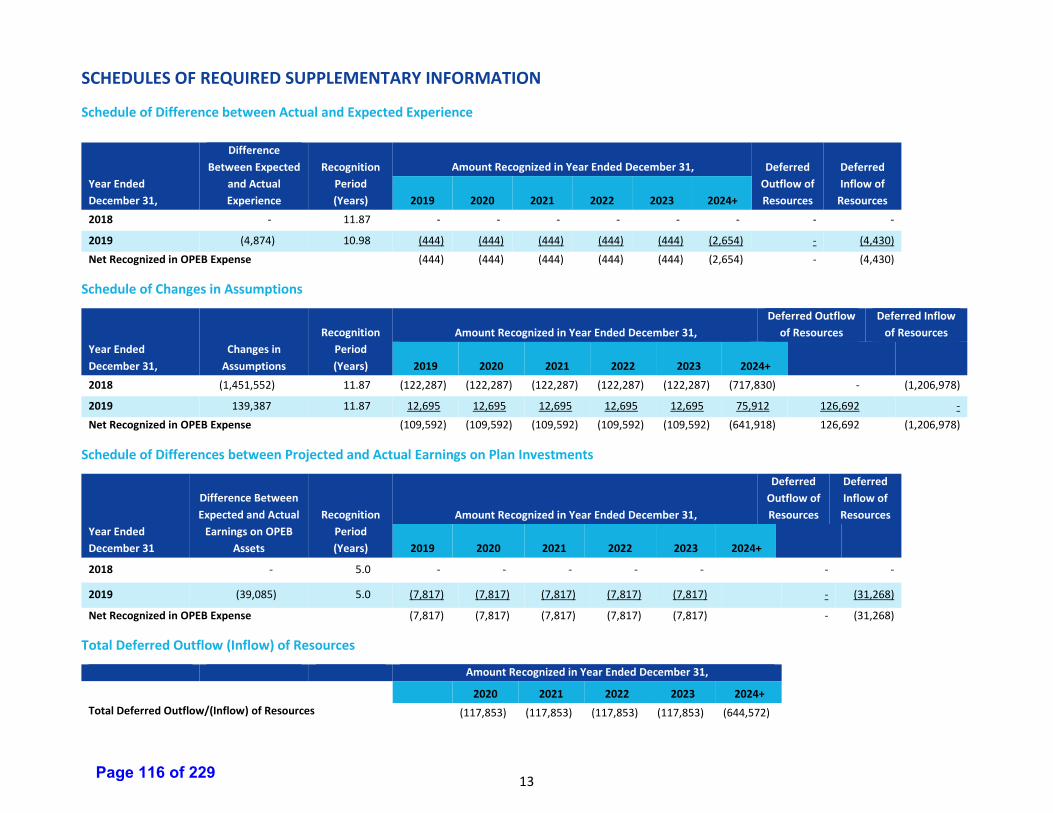
13
SCHEDULES OF REQUIRED SUPPLEMENTARY INFORMATION
Schedule of Difference between Actual and Expected Experience
Year Ended
December 31,
Difference
Between Expected
and Actual
Experience
Recognition
Period
(Years)
Amount Recognized in Year Ended December 31, Deferred
Outflow of
Resources
Deferred
Inflow of
Resources 2019 2020 2021 2022 2023 2024+
2018 - 11.87 - - - - - - - -
2019 (4,874) 10.98 (444) (444) (444) (444) (444) (2,654) - (4,430)
Net Recognized in OPEB Expense (444) (444) (444) (444) (444) (2,654) - (4,430)
Schedule of Changes in Assumptions
Year Ended
December 31,
Changes in
Assumptions
Recognition
Period
(Years)
Amount Recognized in Year Ended December 31,
Deferred Outflow
of Resources
Deferred Inflow
of Resources
2019 2020 2021 2022 2023 2024+
2018 (1,451,552) 11.87 (122,287) (122,287) (122,287) (122,287) (122,287) (717,830) - (1,206,978)
2019 139,387 11.87 12,695 12,695 12,695 12,695 12,695 75,912 126,692 -
Net Recognized in OPEB Expense (109,592) (109,592) (109,592) (109,592) (109,592) (641,918) 126,692 (1,206,978)
Schedule of Differences between Projected and Actual Earnings on Plan Investments
Year Ended
December 31
Difference Between
Expected and Actual
Earnings on OPEB
Assets
Recognition
Period
(Years)
Amount Recognized in Year Ended December 31,
Deferred
Outflow of
Resources
Deferred
Inflow of
Resources
2019 2020 2021 2022 2023 2024+
2018 - 5.0 - - - - - - -
2019 (39,085) 5.0 (7,817) (7,817) (7,817) (7,817) (7,817) - (31,268)
Net Recognized in OPEB Expense (7,817) (7,817) (7,817) (7,817) (7,817) - (31,268)
Total Deferred Outflow (Inflow) of Resources
Amount Recognized in Year Ended December 31,
2020 2021 2022 2023 2024+
Total Deferred Outflow/(Inflow) of Resources (117,853) (117,853) (117,853) (117,853) (644,572)
Page 116 of 229
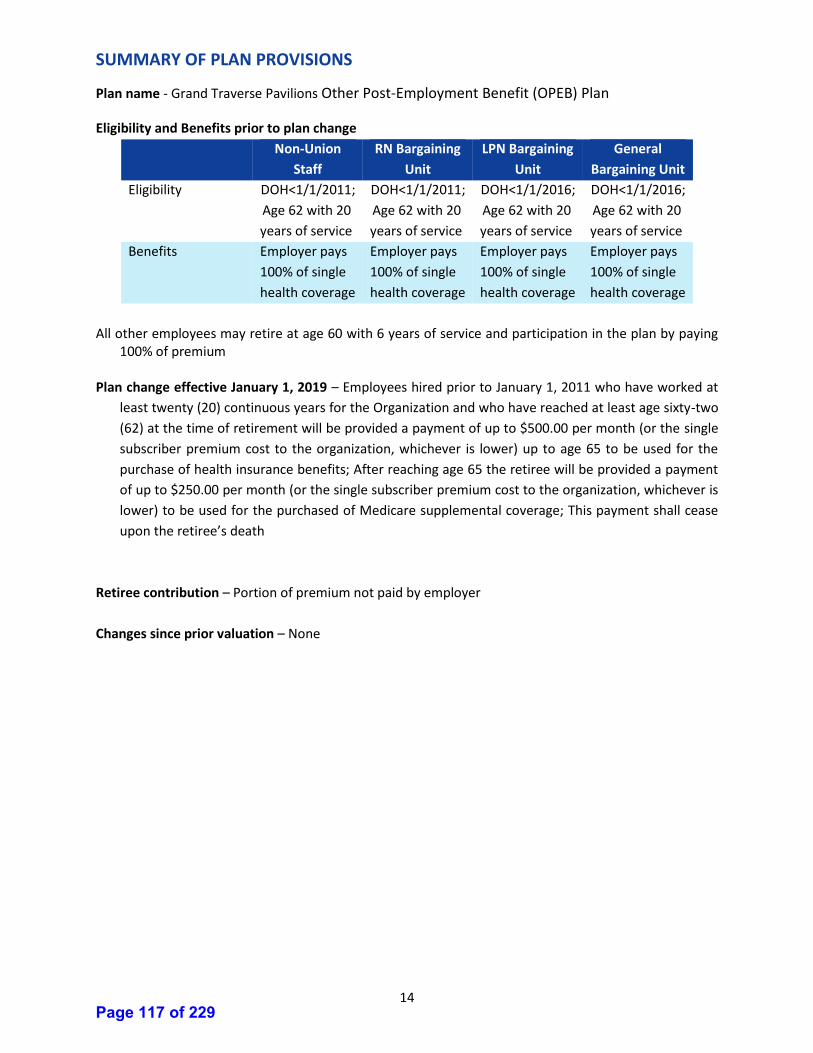
14
SUMMARY OF PLAN PROVISIONS
Plan name - Grand Traverse Pavilions Other Post-Employment Benefit (OPEB) Plan Eligibility and Benefits prior to plan change
Non-Union
Staff
RN Bargaining
Unit
LPN Bargaining
Unit
General
Bargaining Unit
Eligibility DOH<1/1/2011;
Age 62 with 20
years of service
DOH<1/1/2011;
Age 62 with 20
years of service
DOH<1/1/2016;
Age 62 with 20
years of service
DOH<1/1/2016;
Age 62 with 20
years of service
Benefits Employer pays
100% of single
health coverage
Employer pays
100% of single
health coverage
Employer pays
100% of single
health coverage
Employer pays
100% of single
health coverage
All other employees may retire at age 60 with 6 years of service and participation in the plan by paying 100% of premium
Plan change effective January 1, 2019 – Employees hired prior to January 1, 2011 who have worked at
least twenty (20) continuous years for the Organization and who have reached at least age sixty-two
(62) at the time of retirement will be provided a payment of up to $500.00 per month (or the single
subscriber premium cost to the organization, whichever is lower) up to age 65 to be used for the
purchase of health insurance benefits; After reaching age 65 the retiree will be provided a payment
of up to $250.00 per month (or the single subscriber premium cost to the organization, whichever is
lower) to be used for the purchased of Medicare supplemental coverage; This payment shall cease
upon the retiree’s death
Retiree contribution – Portion of premium not paid by employer
Changes since prior valuation – None
Page 117 of 229
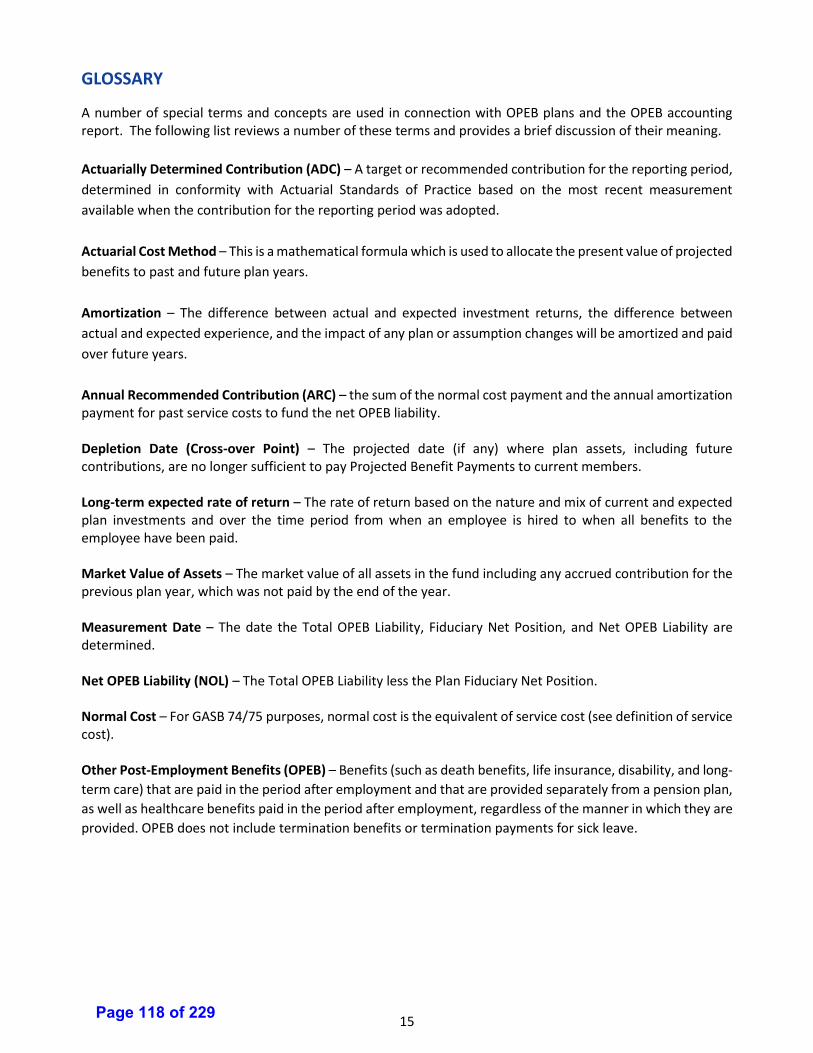
15
GLOSSARY
A number of special terms and concepts are used in connection with OPEB plans and the OPEB accounting report. The following list reviews a number of these terms and provides a brief discussion of their meaning.
Actuarially Determined Contribution (ADC) – A target or recommended contribution for the reporting period,
determined in conformity with Actuarial Standards of Practice based on the most recent measurement
available when the contribution for the reporting period was adopted.
Actuarial Cost Method – This is a mathematical formula which is used to allocate the present value of projected
benefits to past and future plan years.
Amortization – The difference between actual and expected investment returns, the difference between
actual and expected experience, and the impact of any plan or assumption changes will be amortized and paid
over future years.
Annual Recommended Contribution (ARC) – the sum of the normal cost payment and the annual amortization payment for past service costs to fund the net OPEB liability. Depletion Date (Cross-over Point) – The projected date (if any) where plan assets, including future contributions, are no longer sufficient to pay Projected Benefit Payments to current members. Long-term expected rate of return – The rate of return based on the nature and mix of current and expected plan investments and over the time period from when an employee is hired to when all benefits to the employee have been paid. Market Value of Assets – The market value of all assets in the fund including any accrued contribution for the previous plan year, which was not paid by the end of the year. Measurement Date – The date the Total OPEB Liability, Fiduciary Net Position, and Net OPEB Liability are determined. Net OPEB Liability (NOL) – The Total OPEB Liability less the Plan Fiduciary Net Position. Normal Cost – For GASB 74/75 purposes, normal cost is the equivalent of service cost (see definition of service cost). Other Post-Employment Benefits (OPEB) – Benefits (such as death benefits, life insurance, disability, and long-
term care) that are paid in the period after employment and that are provided separately from a pension plan,
as well as healthcare benefits paid in the period after employment, regardless of the manner in which they are
provided. OPEB does not include termination benefits or termination payments for sick leave.
Page 118 of 229
16
GLOSSARY
OPEB Expense (OE) – The change in the Net OPEB Liability (NOL) recognized in the current measurement period. Changes to the NOL not fully recognized in a given year’s OPEB expense will be maintained as deferred inflows and deferred outflows. These will be recognized incrementally in the OPEB expense over time. Plan assets – Stocks, bonds and other investments that have been segregated and restricted (usually in a trust) to provide for post-retirement benefits. Assets not segregated in a trust, or otherwise effectively restricted so that they cannot be used by the employer for other purposes, are not plan assets, even though it may be intended that those assets be used to provide post-retirement benefits. Plan Fiduciary Net Position – The market value of plan assets as of the measurement date. Present Value – The present value of a future payment or a series of payments is the amount of each payment,
discounted to recognize the time value of money, and further reduced for the probability that the payment
might not be made because of death, disability or termination of employment.
Projected Benefit Payments – All benefits projected to be payable to current active and inactive participants as a result of their past service and their expected future service.
Real Rate of Return – The rate of return on an investment after the adjustment to eliminate inflation. Reporting Date – The date that represents the fiscal year end for the plan or employer. Service Cost – The value of portion of Total OPEB Liability earned during the current year computed in accordance with GAAP accounting rules. Single Equivalent Discount Rate – The single rate that gives the same total present value as discounting the Projected Benefit Payments with the long-term expected rate of return until the Depletion Date and discounting any remaining Projected Benefit Payments with the yield on a 20-year AA/Aa tax-exempt municipal bond index. Total OPEB Liability (TOL) – The actuarial present value of the accrued benefit determined under the Entry Age actuarial cost method calculated using the blended Single Equivalent Discount Rate. Valuation Date – The date as of which an actuarial valuation is performed.
Page 119 of 229

Grand Traverse County – Comprehensive Financial Plan 19
Appendix I Grand Traverse Pavilions Pension Plan Actuarial Report Dated December 31, 2019
Page 120 of 229
Annual Actuarial Valuation Report December 31, 2019 - Grand Traverse Pavilions (2809)
Municipal Employees’ Retirement System of Michigan
Page 121 of 229
Spring, 2020 Grand Traverse Pavilions In care of: Municipal Employees' Retirement System of Michigan 1134 Municipal Way Lansing, Michigan 48917 This report presents the results of the Annual Actuarial Valuation, prepared for Grand Traverse Pavilions (2809) as of December 31, 2019. The report includes the determination of liabilities and contribution rates resulting from the participation in the Municipal Employees’ Retirement System of Michigan (“MERS”). This report contains the minimum actuarially determined contribution requirement, in alignment with the MERS Plan Document, Actuarial Policy, and the Michigan Constitution and governing statutes. Grand Traverse Pavilions is responsible for the employer contributions needed to provide MERS benefits for its employees and former employees. The purposes of this valuation are to:
• Measure funding progress as of December 31, 2019,
• Establish contribution requirements for the fiscal year beginning January 1, 2021,
• Provide information regarding the identification and assessment of risk,
• Provide actuarial information in connection with applicable Governmental Accounting Standards Board (GASB) statements, and
• Provide information to assist the local unit of government with state reporting requirements. This valuation assumed the continuing ability of the plan sponsor to make the contributions necessary to fund this plan. A determination regarding whether or not the plan sponsor is actually able to do so is outside our scope of expertise and was not performed. The findings in this report are based on data and other information through December 31, 2019. The valuation was based upon information furnished by MERS concerning Retirement System benefits, financial transactions, plan provisions and active members, terminated members, retirees and beneficiaries. We checked for internal reasonability and year-to-year consistency, but did not audit the data. We are not responsible for the accuracy or completeness of the information provided by MERS.
Page 122 of 229
Grand Traverse Pavilions Spring, 2020 Page 2 The Municipal Employees’ Retirement Act, PA 427 of 1984 and the MERS’ Plan Document Article VI sec. 71 (1)(d), provides the MERS Board with the authority to set actuarial assumptions and methods after consultation with the actuary. As the fiduciary of the plan, MERS Retirement Board sets certain assumptions for funding and GASB purposes. These assumptions are checked regularly through a comprehensive study, called an Experience Study. A study was completed in 2015, as prepared by the prior actuary, and is the basis of the demographic assumptions and methods currently in place. At the February 28, 2019 board meeting, the MERS Retirement Board adopted new economic assumptions effective with the December 31, 2019 annual actuarial valuation, which will impact contributions beginning in 2021. At the February 27, 2020 board meeting, the MERS Retirement Board adopted demographic assumptions effective with the December 31, 2020 annual actuarial valuation, which will impact contributions beginning in 2022. An illustration of the potential impact is found in this report. The Michigan Department of Treasury provides required assumptions to be used for purposes of Public Act 202 reporting. These assumptions are for reporting purposes only and do not impact required contributions. Please refer to the State Reporting page found at the end of this report for information for this filing.
For a full list of all the assumptions used, please refer to the division-specific assumptions described in table(s) in this report, and to the Appendix on the MERS website at: http://www.mersofmich.com/Portals/0/Assets/Resources/AAV-Appendix/MERS-2019AnnualActuarialValuation-Appendix.pdf The actuarial assumptions used for this valuation are reasonable for purposes of the measurement. This report does not reflect the recent and still developing impact of COVID-19, which is likely to influence demographic and economic experience, at least in the short-term. We will continue to monitor these developments and their impact on the MERS Defined Benefit and Hybrid plans. Actual experience will be reflected in each subsequent annual valuation, as experience emerges. This report has been prepared by actuaries who have substantial experience valuing public employee retirement systems. To the best of our knowledge the information contained in this report is accurate and fairly presents the actuarial position of Grand Traverse Pavilions as of the valuation date. All calculations have been made in conformity with generally accepted actuarial principles and practices, with the Actuarial Standards of Practice issued by the Actuarial Standards Board, and with applicable statutes. David T. Kausch, Rebecca L. Stouffer, and Mark Buis are members of the American Academy of Actuaries. These actuaries meet the Academy’s Qualification Standards to render the actuarial opinions contained herein. The signing actuaries are independent of the plan sponsor. GRS maintains independent consulting agreements with certain local units of government for services unrelated to the actuarial consulting services provided in this report. The Retirement Board of the Municipal Employees' Retirement System of Michigan confirms that the System provides for payment of the required employer contribution as described in Section 20m of Act No. 314 of 1965 (MCL 38.1140m).
Page 123 of 229
Grand Traverse Pavilions Spring, 2020 Page 3 This information is purely actuarial in nature. It is not intended to serve as a substitute for legal, accounting or investment advice. This report was prepared at the request of the MERS Retirement Board and may be provided only in its entirety by the municipality to other interested parties (MERS customarily provides the full report on request to associated third parties such as the auditor for the municipality). GRS is not responsible for the consequences of any unauthorized use. This report should not be relied on for any purpose other than the purposes described herein. Determinations of financial results, associated with the benefits described in this report, for purposes other than those identified above may be significantly different. If you have reason to believe that the plan provisions are incorrectly described, that important plan provisions relevant to this valuation are not described, that conditions have changed since the calculations were made, that the information provided in this report is inaccurate or is in anyway incomplete, or if you need further information in order to make an informed decision on the subject matter in this report, please contact your Regional Manager at 1.800.767.MERS (6377). Sincerely, David T. Kausch, FSA, FCA, EA, MAAA Rebecca L. Stouffer, ASA, FCA, MAAA Mark Buis, FSA, FCA, EA, MAAA
Page 124 of 229
Grand Traverse Pavilions (2809) – 2019
Table of Contents
Executive Summary ................................................................................................................................................. 1
Table 1: Employer Contribution Details For the Fiscal Year Beginning January 1, 2021 ........................................ 8
Table 2: Benefit Provisions ...................................................................................................................................... 9
Table 3: Participant Summary ............................................................................................................................... 11
Table 4: Reported Assets (Market Value) ............................................................................................................. 12
Table 5: Flow of Valuation Assets ......................................................................................................................... 13
Table 6: Actuarial Accrued Liabilities and Valuation Assets as of December 31, 2019 ........................................ 14
Table 7: Actuarial Accrued Liabilities - Comparative Schedule ............................................................................. 16
Tables 8 and 9: Division-Based Comparative Schedules ....................................................................................... 17
Table 10: Division-Based Layered Amortization Schedule .................................................................................... 22
GASB 68 Information ............................................................................................................................................. 27
Benefit Provision History ....................................................................................................................................... 29
Plan Provisions, Actuarial Assumptions, and Actuarial Funding Method ............................................................ 31
Risk Commentary .................................................................................................................................................. 32
State Reporting ..................................................................................................................................................... 34
Page 125 of 229
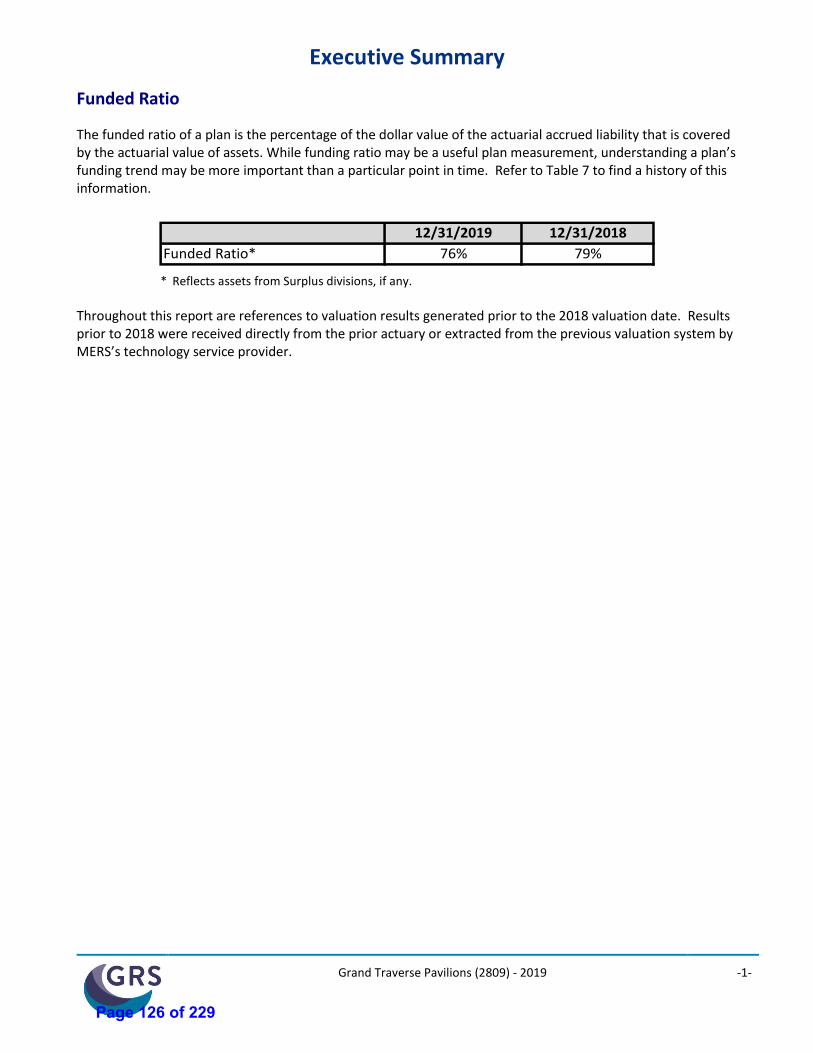
Grand Traverse Pavilions (2809) - 2019 -1-
Executive Summary
Funded Ratio
The funded ratio of a plan is the percentage of the dollar value of the actuarial accrued liability that is covered by the actuarial value of assets. While funding ratio may be a useful plan measurement, understanding a plan’s funding trend may be more important than a particular point in time. Refer to Table 7 to find a history of this information.
12/31/2019 12/31/2018
Funded Ratio* 76% 79%
* Reflects assets from Surplus divisions, if any.
Throughout this report are references to valuation results generated prior to the 2018 valuation date. Results prior to 2018 were received directly from the prior actuary or extracted from the previous valuation system by MERS’s technology service provider.
Page 126 of 229
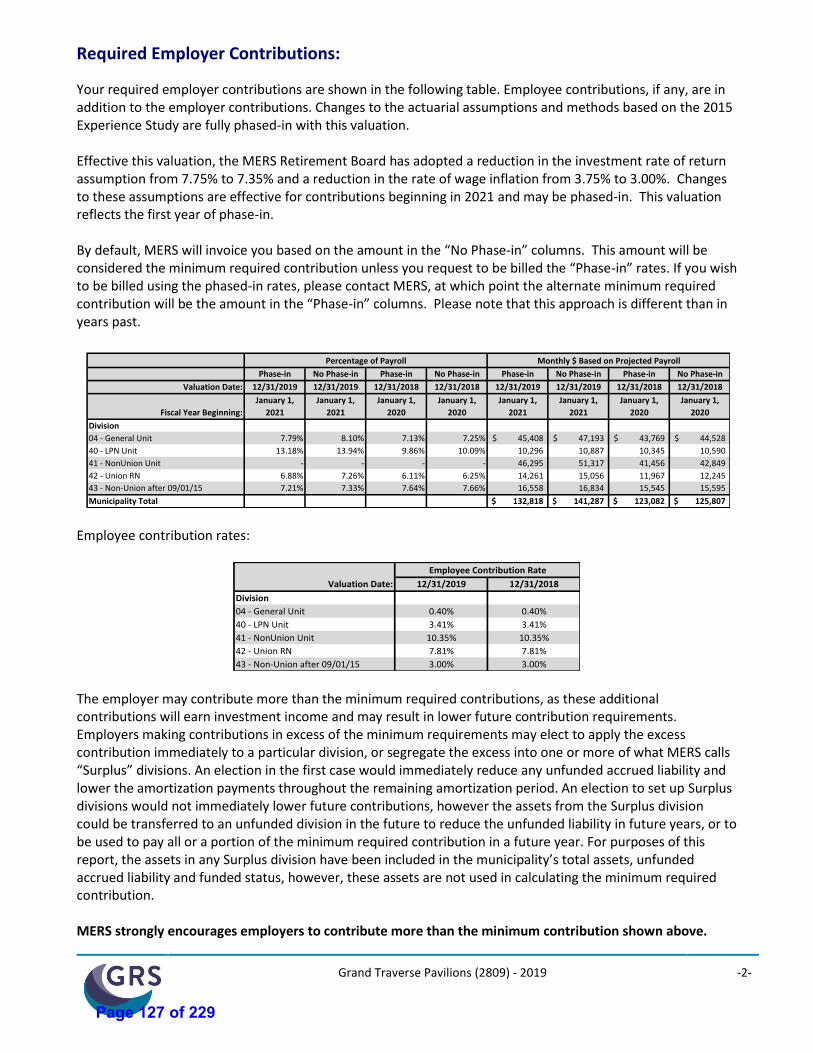
Grand Traverse Pavilions (2809) - 2019 -2-
Required Employer Contributions:
Your required employer contributions are shown in the following table. Employee contributions, if any, are in addition to the employer contributions. Changes to the actuarial assumptions and methods based on the 2015 Experience Study are fully phased-in with this valuation. Effective this valuation, the MERS Retirement Board has adopted a reduction in the investment rate of return assumption from 7.75% to 7.35% and a reduction in the rate of wage inflation from 3.75% to 3.00%. Changes to these assumptions are effective for contributions beginning in 2021 and may be phased-in. This valuation reflects the first year of phase-in. By default, MERS will invoice you based on the amount in the “No Phase-in” columns. This amount will be considered the minimum required contribution unless you request to be billed the “Phase-in” rates. If you wish to be billed using the phased-in rates, please contact MERS, at which point the alternate minimum required contribution will be the amount in the “Phase-in” columns. Please note that this approach is different than in years past.
Phase-in No Phase-in Phase-in No Phase-in Phase-in No Phase-in Phase-in No Phase-in
Valuation Date: 12/31/2019 12/31/2019 12/31/2018 12/31/2018 12/31/2019 12/31/2019 12/31/2018 12/31/2018
January 1, January 1, January 1, January 1, January 1, January 1, January 1, January 1,
Fiscal Year Beginning: 2021 2021 2020 2020 2021 2021 2020 2020
Division
04 - General Unit 7.79% 8.10% 7.13% 7.25% 45,408$ 47,193$ 43,769$ 44,528$
40 - LPN Unit 13.18% 13.94% 9.86% 10.09% 10,296 10,887 10,345 10,590
41 - NonUnion Unit - - - - 46,295 51,317 41,456 42,849
42 - Union RN 6.88% 7.26% 6.11% 6.25% 14,261 15,056 11,967 12,245
43 - Non-Union after 09/01/15 7.21% 7.33% 7.64% 7.66% 16,558 16,834 15,545 15,595
Municipality Total 132,818$ 141,287$ 123,082$ 125,807$
Percentage of Payroll Monthly $ Based on Projected Payroll
Employee contribution rates:
Valuation Date: 12/31/2019 12/31/2018
Division
04 - General Unit 0.40% 0.40%
40 - LPN Unit 3.41% 3.41%
41 - NonUnion Unit 10.35% 10.35%
42 - Union RN 7.81% 7.81%
43 - Non-Union after 09/01/15 3.00% 3.00%
Employee Contribution Rate
The employer may contribute more than the minimum required contributions, as these additional contributions will earn investment income and may result in lower future contribution requirements. Employers making contributions in excess of the minimum requirements may elect to apply the excess contribution immediately to a particular division, or segregate the excess into one or more of what MERS calls “Surplus” divisions. An election in the first case would immediately reduce any unfunded accrued liability and lower the amortization payments throughout the remaining amortization period. An election to set up Surplus divisions would not immediately lower future contributions, however the assets from the Surplus division could be transferred to an unfunded division in the future to reduce the unfunded liability in future years, or to be used to pay all or a portion of the minimum required contribution in a future year. For purposes of this report, the assets in any Surplus division have been included in the municipality’s total assets, unfunded accrued liability and funded status, however, these assets are not used in calculating the minimum required contribution. MERS strongly encourages employers to contribute more than the minimum contribution shown above.
Page 127 of 229
Grand Traverse Pavilions (2809) - 2019 -3-
Assuming that experience of the plan meets actuarial assumptions: • To accelerate to a 100% funding ratio in 10 years, estimated monthly employer contributions for the fiscal year beginning in 2021 for the entire employer would be $184,700, instead of $141,287.
How and Why Do These Numbers Change? In a defined benefit plan contributions vary from one annual actuarial valuation to the next as a result of the following:
• Changes in benefit provisions (see Table 2)
• Changes in actuarial assumptions and methods (see the Appendix)
• Experience of the plan (investment experience and demographic experience); this is the difference between actual experience of the plan and the actuarial assumptions.
Comments on Investment Rate of Return Assumption
A defined benefit plan is funded by employer contributions, participant contributions, and investment earnings. Investment earnings have historically provided a significant portion of the funding. The larger the share of benefits being provided from investment returns, the smaller the required contributions, and vice versa. Determining the contributions required to prefund the promised retirement benefits requires an assumption of what investment earnings are expected to add to the fund over a long period of time. This is called the Investment Return Assumption. The MERS Investment Return Assumption is 7.35% per year. This, along with all of our other actuarial assumptions, is reviewed at least every five years in an Experience Study that compares the assumptions used against actual experience and recommends adjustments if necessary. If your municipality would like to explore contributions at lower assumed investment return assumptions, please review the “what if” projection scenarios later in this report.
Assumption Change in 2019 At the February 28, 2019 board meeting, the MERS Retirement Board adjusted key economic assumptions. These assumptions, in particular the investment return assumption, have a significant effect on a plan’s required contribution and funding level. Historically low interest rates, along with high equity market valuations, have led to reductions in projected returns for most asset classes. This has resulted in a Board adopted reduction in the investment rate of return assumption from 7.75% to 7.35%, effective with the December 31, 2019 valuation, first impacting 2021 contributions. The Board also changed the assumed rate of wage inflation from 3.75% to 3.00%, with the same effective date.
Assumption Change in 2020 A 5-year experience study analyzing historical experience from 2013 through 2018 was completed in February 2020. In addition to changes to the economic assumptions which will take effect with the Fiscal year 2021 contribution rates, the experience study recommends updated demographic assumptions, including adjustments to the following actuarial assumptions: mortality, retirement, disability, and termination rates. A complete description of the proposed assumptions may be found in the Appendix to the valuation. Changes to the demographic assumptions resulting from the experience study have been approved by the MERS Retirement Board and are to be effective beginning with the December 31, 2020 actuarial valuation first
Page 128 of 229
Grand Traverse Pavilions (2809) - 2019 -4-
impacting 2022 contributions. This report includes a “What If” scenario of the approved 2020 assumption changes in an effort to show employers the anticipated impact on contribution rates.
Comments on Asset Smoothing
To avoid dramatic spikes and dips in annual contribution requirements due to short term fluctuations in asset markets, MERS applies a technique called asset smoothing. This spreads out each year’s investment gains or losses over the prior year and the following four years. This smoothing method is used to determine your actuarial value of assets (valuation assets), which is then used to determine both your funded ratio and your required contributions. The (smoothed) actuarial rate of return for 2019 was 4.77%, while the actual market rate of return was 13.41%. To see historical details of the market rate of return, compared to the smoothed actuarial rate of return, refer to this report’s Appendix, or view the “How Smoothing Works” video on the Defined Benefit resource page of the MERS website. As of December 31, 2019, the actuarial value of assets is 101% of market value due to asset smoothing. This means that meeting the actuarial assumption in the next few years will require average annual market returns that exceed the 7.35% investment return assumption, or contribution requirements will continue to increase. If the December 31, 2019 valuation results were based on market value instead of actuarial value:
• The funded percent of your entire municipality would be 75% (instead of 76%); and
• Your total employer contribution requirement for the fiscal year starting January 1, 2021 would be $1,733,052 (instead of $1,695,444).
Alternate Scenarios to Estimate the Potential Volatility of Results ("What If Scenarios")
The calculations in this report are based on assumptions about long-term economic and demographic behavior. These assumptions will never materialize in a given year, except by coincidence. Therefore the results will vary from one year to the next. The volatility of the results depends upon the characteristics of the plan. For example:
• Open divisions that have substantial assets compared to their active employee payroll will have more volatile employer contribution rates due to investment return fluctuations.
• Open divisions that have substantial accrued liability compared to their active employee payroll will have more volatile employer contribution rates due to demographic experience fluctuations.
• Small divisions will have more volatile contribution patterns than larger divisions because statistical fluctuations are relatively larger among small populations.
• Shorter amortization periods result in more volatile contribution patterns. Many assumptions are important in determining the required employer contributions. In the following table, we show the impact of varying the Investment Return assumption and the demographic assumptions. Lower investment returns would result in higher required employer contributions, and vice-versa. Alternate demographic assumptions may result in higher or lower employer contributions depending on the demographic characteristics of the plan participants. The relative impact of the economic and demographic scenarios below will vary from year to year, as the participant demographics change. The impact of each scenario should be analyzed for a given year, not from year to year. The results in the table are based on the December 31, 2019 valuation, and are for the
Page 129 of 229
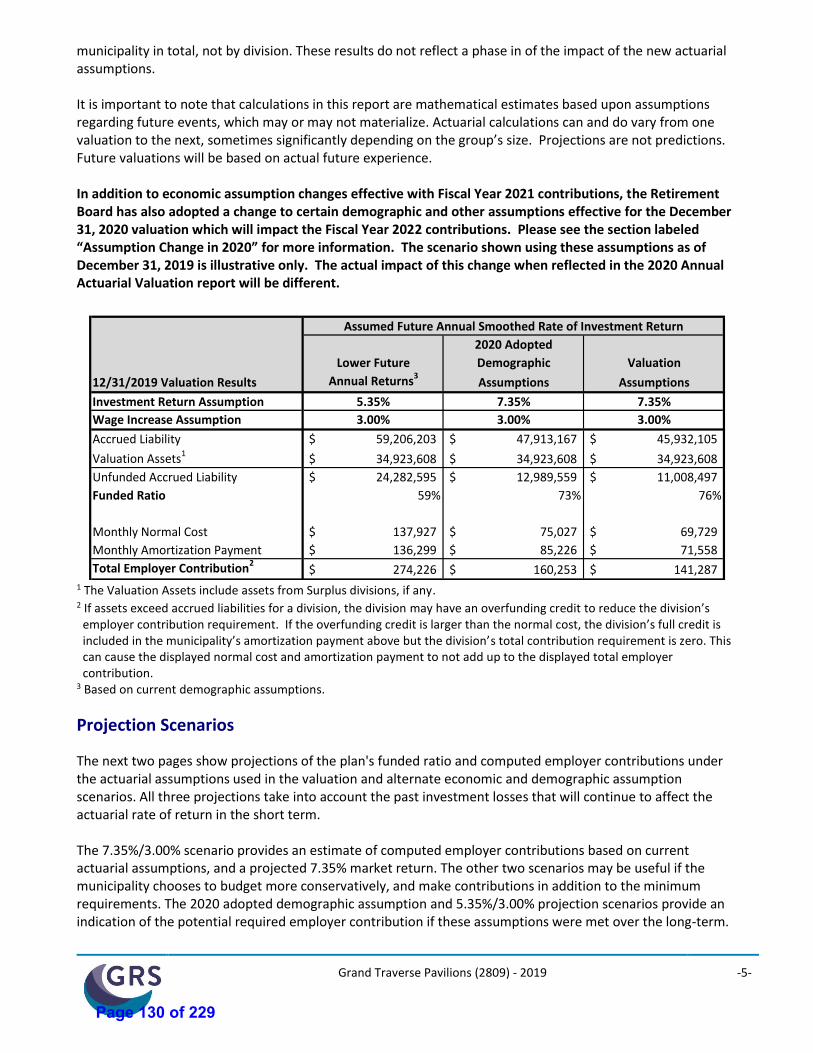
Grand Traverse Pavilions (2809) - 2019 -5-
municipality in total, not by division. These results do not reflect a phase in of the impact of the new actuarial assumptions. It is important to note that calculations in this report are mathematical estimates based upon assumptions regarding future events, which may or may not materialize. Actuarial calculations can and do vary from one valuation to the next, sometimes significantly depending on the group’s size. Projections are not predictions. Future valuations will be based on actual future experience. In addition to economic assumption changes effective with Fiscal Year 2021 contributions, the Retirement Board has also adopted a change to certain demographic and other assumptions effective for the December 31, 2020 valuation which will impact the Fiscal Year 2022 contributions. Please see the section labeled “Assumption Change in 2020” for more information. The scenario shown using these assumptions as of December 31, 2019 is illustrative only. The actual impact of this change when reflected in the 2020 Annual Actuarial Valuation report will be different.
2020 Adopted
Lower Future Demographic Valuation
12/31/2019 Valuation Results Annual Returns3
Assumptions Assumptions
Investment Return Assumption 5.35% 7.35% 7.35%
Wage Increase Assumption 3.00% 3.00% 3.00%
Accrued Liability 59,206,203$ 47,913,167$ 45,932,105$
Valuation Assets134,923,608$ 34,923,608$ 34,923,608$
Unfunded Accrued Liability 24,282,595$ 12,989,559$ 11,008,497$
Funded Ratio 59% 73% 76%
Monthly Normal Cost 137,927$ 75,027$ 69,729$
Monthly Amortization Payment 136,299$ 85,226$ 71,558$
Total Employer Contribution2
274,226$ 160,253$ 141,287$
Assumed Future Annual Smoothed Rate of Investment Return
1 The Valuation Assets include assets from Surplus divisions, if any.
2 If assets exceed accrued liabilities for a division, the division may have an overfunding credit to reduce the division’s employer contribution requirement. If the overfunding credit is larger than the normal cost, the division’s full credit is included in the municipality’s amortization payment above but the division’s total contribution requirement is zero. This can cause the displayed normal cost and amortization payment to not add up to the displayed total employer contribution.
3 Based on current demographic assumptions.
Projection Scenarios
The next two pages show projections of the plan's funded ratio and computed employer contributions under the actuarial assumptions used in the valuation and alternate economic and demographic assumption scenarios. All three projections take into account the past investment losses that will continue to affect the actuarial rate of return in the short term. The 7.35%/3.00% scenario provides an estimate of computed employer contributions based on current actuarial assumptions, and a projected 7.35% market return. The other two scenarios may be useful if the municipality chooses to budget more conservatively, and make contributions in addition to the minimum requirements. The 2020 adopted demographic assumption and 5.35%/3.00% projection scenarios provide an indication of the potential required employer contribution if these assumptions were met over the long-term.
Page 130 of 229
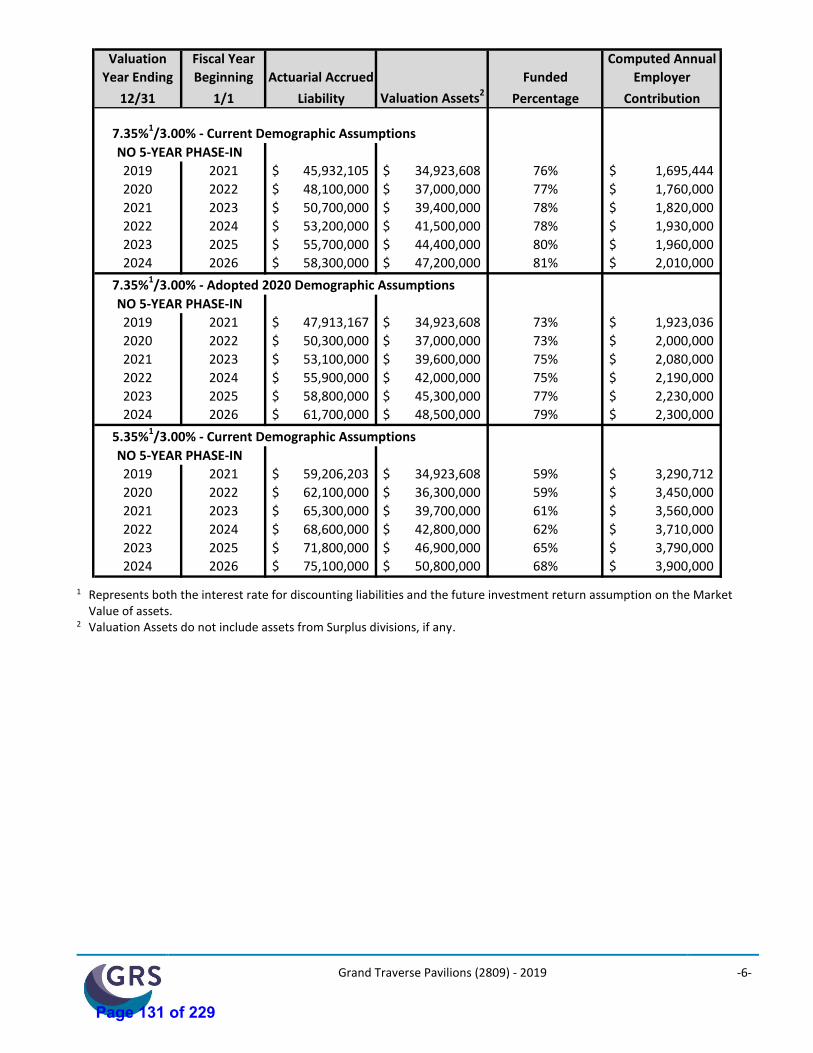
Grand Traverse Pavilions (2809) - 2019 -6-
Valuation Fiscal Year Computed Annual
Year Ending Beginning Actuarial Accrued Funded Employer
12/31 1/1 Liability Valuation Assets2Percentage Contribution
7.35%1/3.00% - Current Demographic Assumptions
2019 2021 45,932,105$ 34,923,608$ 76% 1,695,444$
2020 2022 48,100,000$ 37,000,000$ 77% 1,760,000$
2021 2023 50,700,000$ 39,400,000$ 78% 1,820,000$
2022 2024 53,200,000$ 41,500,000$ 78% 1,930,000$
2023 2025 55,700,000$ 44,400,000$ 80% 1,960,000$
2024 2026 58,300,000$ 47,200,000$ 81% 2,010,000$
7.35%1/3.00% - Adopted 2020 Demographic Assumptions
2019 2021 47,913,167$ 34,923,608$ 73% 1,923,036$
2020 2022 50,300,000$ 37,000,000$ 73% 2,000,000$
2021 2023 53,100,000$ 39,600,000$ 75% 2,080,000$
2022 2024 55,900,000$ 42,000,000$ 75% 2,190,000$
2023 2025 58,800,000$ 45,300,000$ 77% 2,230,000$
2024 2026 61,700,000$ 48,500,000$ 79% 2,300,000$
5.35%1/3.00% - Current Demographic Assumptions
2019 2021 59,206,203$ 34,923,608$ 59% 3,290,712$
2020 2022 62,100,000$ 36,300,000$ 59% 3,450,000$
2021 2023 65,300,000$ 39,700,000$ 61% 3,560,000$
2022 2024 68,600,000$ 42,800,000$ 62% 3,710,000$
2023 2025 71,800,000$ 46,900,000$ 65% 3,790,000$
2024 2026 75,100,000$ 50,800,000$ 68% 3,900,000$
NO 5-YEAR PHASE-IN
NO 5-YEAR PHASE-IN
NO 5-YEAR PHASE-IN
1 Represents both the interest rate for discounting liabilities and the future investment return assumption on the Market Value of assets.
2 Valuation Assets do not include assets from Surplus divisions, if any.
Page 131 of 229

Grand Traverse Pavilions (2809) - 2019 -7-
0%
20%
40%
60%
80%
100%
120%
Calendar Year December 31,
Funded Percentage
7.35%/3.00% - No Surplus 2020 Adopted Dem. Assm. 5.35%/3.00%
Notes: All projected funded percentages are shown with no phase-in. The green indicator lines have been added at 60% funded and 21 years following the valuation date for PA 202 purposes.
$0
$1,000,000
$2,000,000
$3,000,000
$4,000,000
$5,000,000
$6,000,000
Fiscal Year
Computed Annual Employer Contribution
7.35%/3.00% - No Surplus 2020 Adopted Dem. Assm. 5.35%/3.00%
Notes: All projected contributions are shown with no phase-in.
Page 132 of 229
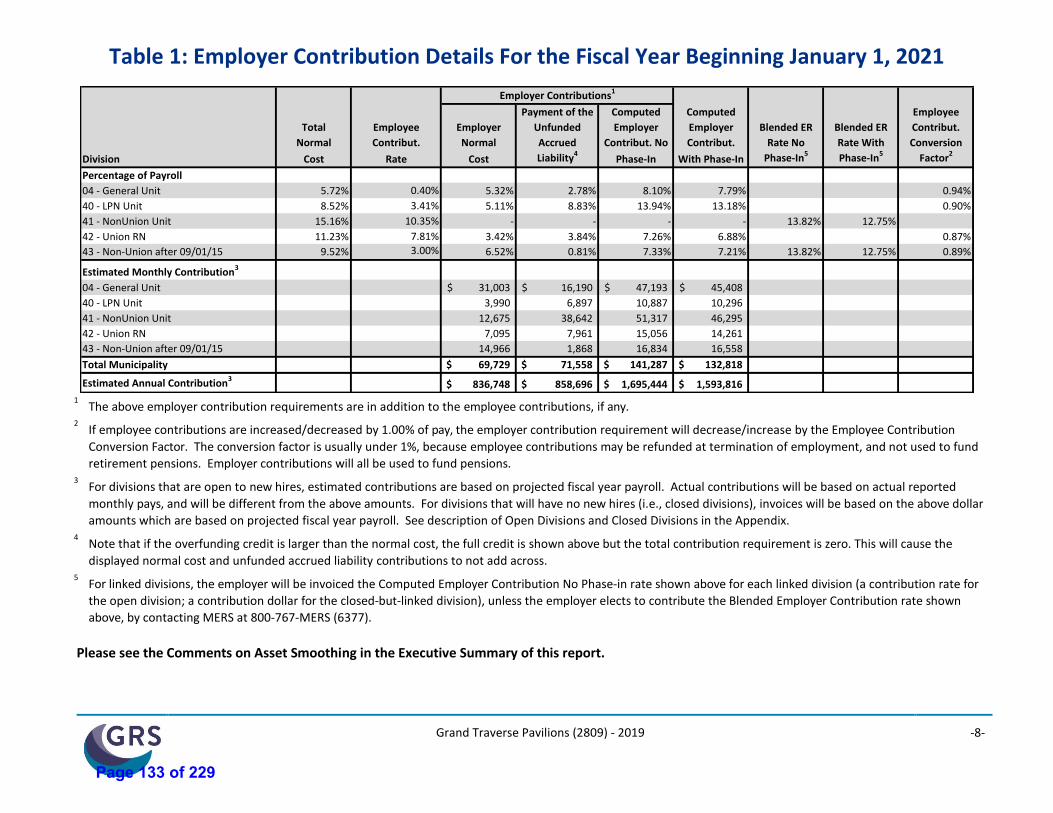
Grand Traverse Pavilions (2809) - 2019 -8-
Table 1: Employer Contribution Details For the Fiscal Year Beginning January 1, 2021
Payment of the Computed Computed Employee
Total Employee Employer Unfunded Employer Employer Blended ER Blended ER Contribut.
Normal Contribut. Normal Accrued Contribut. No Contribut. Rate No Rate With Conversion
Division Cost Rate Cost Liability4
Phase-In With Phase-In Phase-In5
Phase-In5
Factor2
Percentage of Payroll
04 - General Unit 5.72% 0.40% 5.32% 2.78% 8.10% 7.79% 0.94%
40 - LPN Unit 8.52% 3.41% 5.11% 8.83% 13.94% 13.18% 0.90%
41 - NonUnion Unit 15.16% 10.35% - - - - 13.82% 12.75%
42 - Union RN 11.23% 7.81% 3.42% 3.84% 7.26% 6.88% 0.87%
43 - Non-Union after 09/01/15 9.52% 3.00% 6.52% 0.81% 7.33% 7.21% 13.82% 12.75% 0.89%
Estimated Monthly Contribution3
04 - General Unit 31,003$ 16,190$ 47,193$ 45,408$
40 - LPN Unit 3,990 6,897 10,887 10,296
41 - NonUnion Unit 12,675 38,642 51,317 46,295
42 - Union RN 7,095 7,961 15,056 14,261
43 - Non-Union after 09/01/15 14,966 1,868 16,834 16,558
Total Municipality 69,729$ 71,558$ 141,287$ 132,818$
Estimated Annual Contribution3836,748$ 858,696$ 1,695,444$ 1,593,816$
Employer Contributions1
1 The above employer contribution requirements are in addition to the employee contributions, if any. 2 If employee contributions are increased/decreased by 1.00% of pay, the employer contribution requirement will decrease/increase by the Employee Contribution
Conversion Factor. The conversion factor is usually under 1%, because employee contributions may be refunded at termination of employment, and not used to fund
retirement pensions. Employer contributions will all be used to fund pensions. 3 For divisions that are open to new hires, estimated contributions are based on projected fiscal year payroll. Actual contributions will be based on actual reported
monthly pays, and will be different from the above amounts. For divisions that will have no new hires (i.e., closed divisions), invoices will be based on the above dollar
amounts which are based on projected fiscal year payroll. See description of Open Divisions and Closed Divisions in the Appendix. 4 Note that if the overfunding credit is larger than the normal cost, the full credit is shown above but the total contribution requirement is zero. This will cause the
displayed normal cost and unfunded accrued liability contributions to not add across. 5 For linked divisions, the employer will be invoiced the Computed Employer Contribution No Phase-in rate shown above for each linked division (a contribution rate for
the open division; a contribution dollar for the closed-but-linked division), unless the employer elects to contribute the Blended Employer Contribution rate shown
above, by contacting MERS at 800-767-MERS (6377).
Please see the Comments on Asset Smoothing in the Executive Summary of this report.
Page 133 of 229
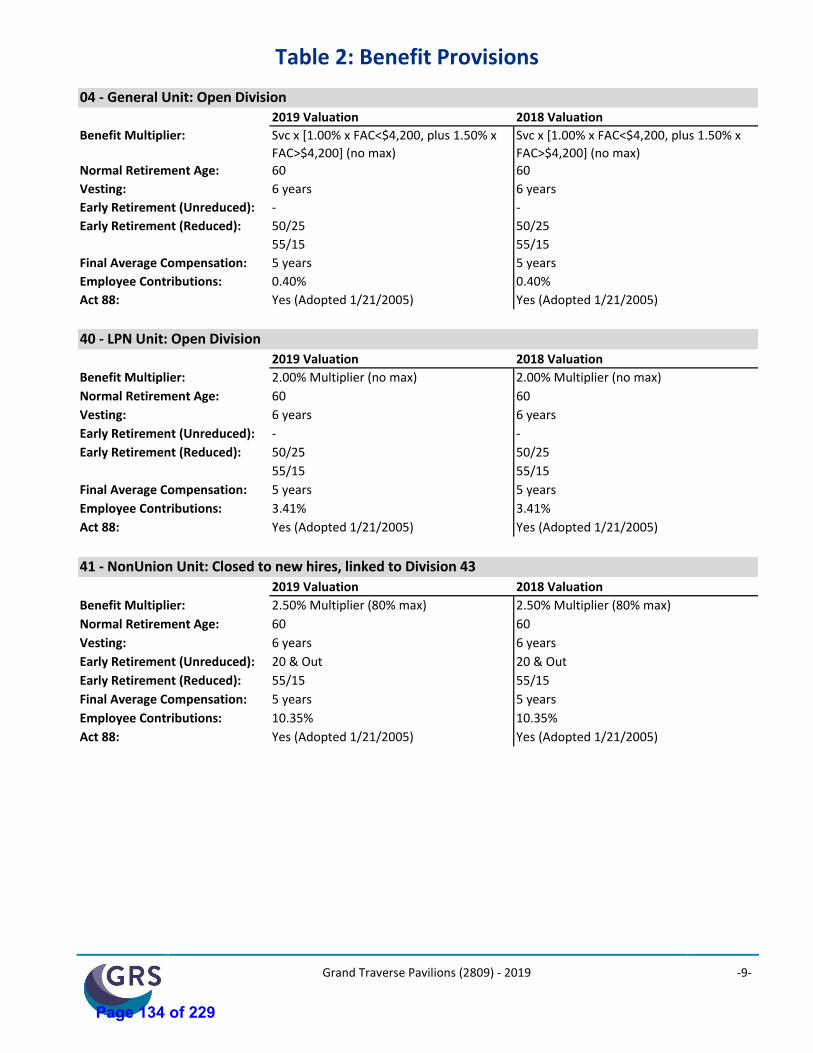
Grand Traverse Pavilions (2809) - 2019 -9-
Table 2: Benefit Provisions
2019 Valuation 2018 Valuation
Benefit Multiplier: Svc x [1.00% x FAC<$4,200, plus 1.50% x
FAC>$4,200] (no max)
Svc x [1.00% x FAC<$4,200, plus 1.50% x
FAC>$4,200] (no max)
Normal Retirement Age: 60 60
Vesting: 6 years 6 years
Early Retirement (Unreduced): - -
Early Retirement (Reduced): 50/25 50/25
55/15 55/15
Final Average Compensation: 5 years 5 years
Employee Contributions: 0.40% 0.40%
Act 88: Yes (Adopted 1/21/2005) Yes (Adopted 1/21/2005)
04 - General Unit: Open Division
2019 Valuation 2018 Valuation
Benefit Multiplier: 2.00% Multiplier (no max) 2.00% Multiplier (no max)
Normal Retirement Age: 60 60
Vesting: 6 years 6 years
Early Retirement (Unreduced): - -
Early Retirement (Reduced): 50/25 50/25
55/15 55/15
Final Average Compensation: 5 years 5 years
Employee Contributions: 3.41% 3.41%
Act 88: Yes (Adopted 1/21/2005) Yes (Adopted 1/21/2005)
40 - LPN Unit: Open Division
2019 Valuation 2018 Valuation
Benefit Multiplier: 2.50% Multiplier (80% max) 2.50% Multiplier (80% max)
Normal Retirement Age: 60 60
Vesting: 6 years 6 years
Early Retirement (Unreduced): 20 & Out 20 & Out
Early Retirement (Reduced): 55/15 55/15
Final Average Compensation: 5 years 5 years
Employee Contributions: 10.35% 10.35%
Act 88: Yes (Adopted 1/21/2005) Yes (Adopted 1/21/2005)
41 - NonUnion Unit: Closed to new hires, linked to Division 43
Page 134 of 229
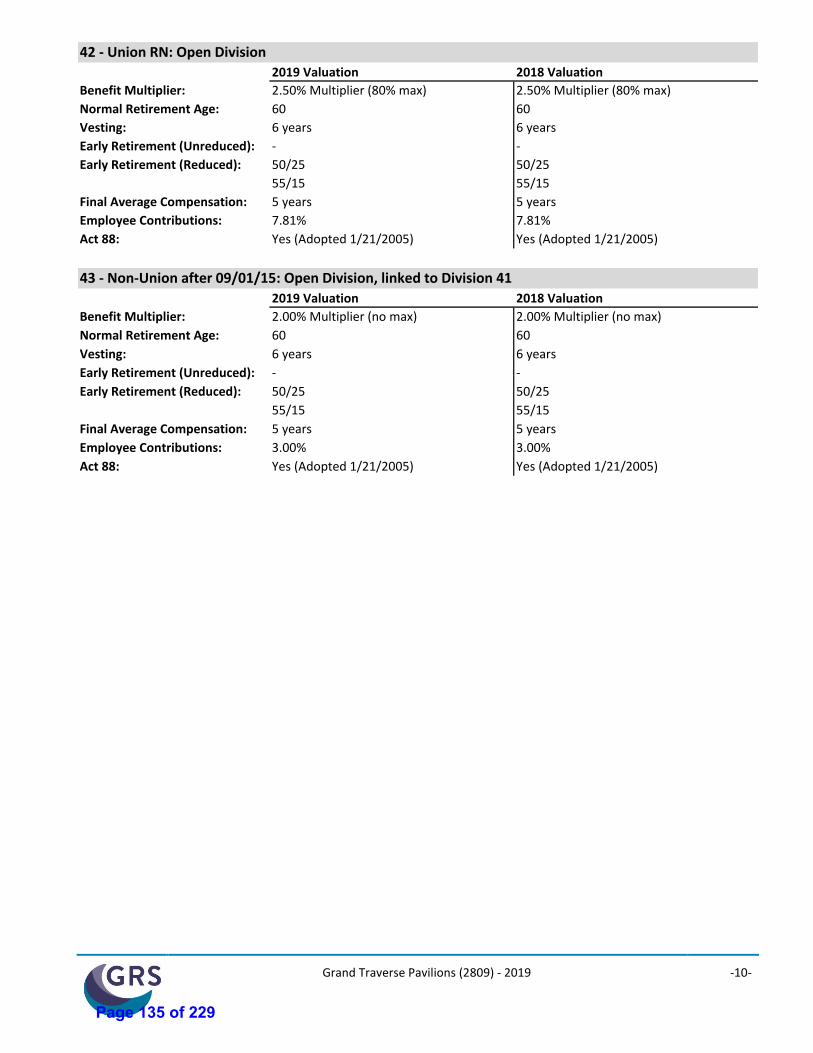
Grand Traverse Pavilions (2809) - 2019 -10-
2019 Valuation 2018 Valuation
Benefit Multiplier: 2.50% Multiplier (80% max) 2.50% Multiplier (80% max)
Normal Retirement Age: 60 60
Vesting: 6 years 6 years
Early Retirement (Unreduced): - -
Early Retirement (Reduced): 50/25 50/25
55/15 55/15
Final Average Compensation: 5 years 5 years
Employee Contributions: 7.81% 7.81%
Act 88: Yes (Adopted 1/21/2005) Yes (Adopted 1/21/2005)
42 - Union RN: Open Division
2019 Valuation 2018 Valuation
Benefit Multiplier: 2.00% Multiplier (no max) 2.00% Multiplier (no max)
Normal Retirement Age: 60 60
Vesting: 6 years 6 years
Early Retirement (Unreduced): - -
Early Retirement (Reduced): 50/25 50/25
55/15 55/15
Final Average Compensation: 5 years 5 years
Employee Contributions: 3.00% 3.00%
Act 88: Yes (Adopted 1/21/2005) Yes (Adopted 1/21/2005)
43 - Non-Union after 09/01/15: Open Division, linked to Division 41
Page 135 of 229
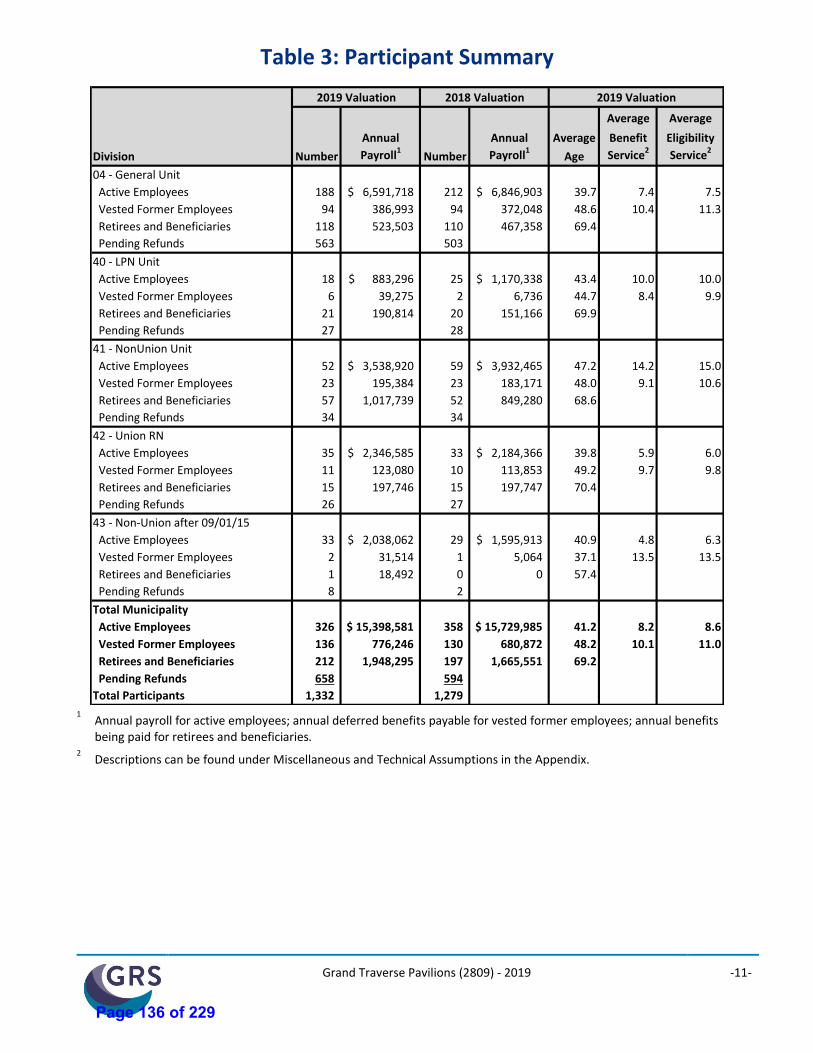
Grand Traverse Pavilions (2809) - 2019 -11-
Table 3: Participant Summary
Average Average
Annual Annual Average Benefit Eligibility
Division Number Payroll1Number Payroll1
Age Service2 Service2
04 - General Unit
Active Employees 188 6,591,718$ 212 6,846,903$ 39.7 7.4 7.5
Vested Former Employees 94 386,993 94 372,048 48.6 10.4 11.3
Retirees and Beneficiaries 118 523,503 110 467,358 69.4
Pending Refunds 563 503
40 - LPN Unit
Active Employees 18 883,296$ 25 1,170,338$ 43.4 10.0 10.0
Vested Former Employees 6 39,275 2 6,736 44.7 8.4 9.9
Retirees and Beneficiaries 21 190,814 20 151,166 69.9
Pending Refunds 27 28
41 - NonUnion Unit
Active Employees 52 3,538,920$ 59 3,932,465$ 47.2 14.2 15.0
Vested Former Employees 23 195,384 23 183,171 48.0 9.1 10.6
Retirees and Beneficiaries 57 1,017,739 52 849,280 68.6
Pending Refunds 34 34
42 - Union RN
Active Employees 35 2,346,585$ 33 2,184,366$ 39.8 5.9 6.0
Vested Former Employees 11 123,080 10 113,853 49.2 9.7 9.8
Retirees and Beneficiaries 15 197,746 15 197,747 70.4
Pending Refunds 26 27
43 - Non-Union after 09/01/15
Active Employees 33 2,038,062$ 29 1,595,913$ 40.9 4.8 6.3
Vested Former Employees 2 31,514 1 5,064 37.1 13.5 13.5
Retirees and Beneficiaries 1 18,492 0 0 57.4
Pending Refunds 8 2
Total Municipality
Active Employees 326 15,398,581$ 358 15,729,985$ 41.2 8.2 8.6
Vested Former Employees 136 776,246 130 680,872 48.2 10.1 11.0
Retirees and Beneficiaries 212 1,948,295 197 1,665,551 69.2
Pending Refunds 658 594
Total Participants 1,332 1,279
2019 Valuation 2018 Valuation 2019 Valuation
1 Annual payroll for active employees; annual deferred benefits payable for vested former employees; annual benefits
being paid for retirees and beneficiaries. 2 Descriptions can be found under Miscellaneous and Technical Assumptions in the Appendix.
Page 136 of 229
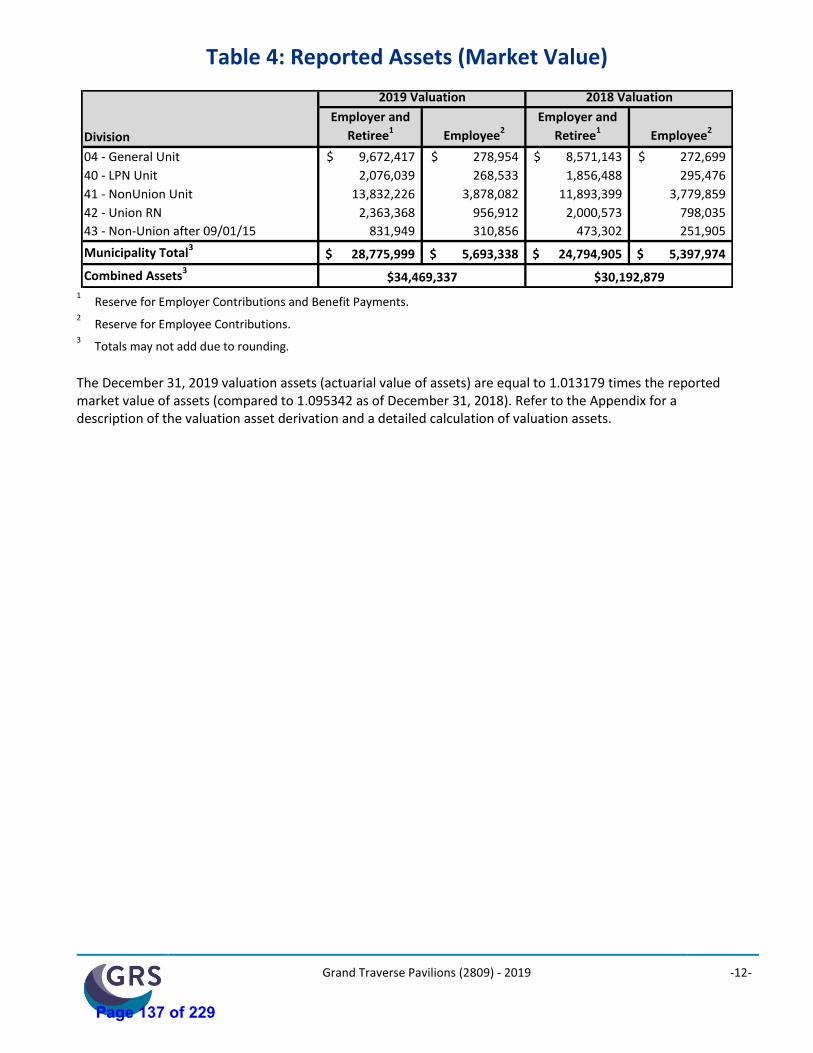
Grand Traverse Pavilions (2809) - 2019 -12-
Table 4: Reported Assets (Market Value)
Employer and Employer and
Division Retiree1
Employee2
Retiree1
Employee2
04 - General Unit 9,672,417$ 278,954$ 8,571,143$ 272,699$
40 - LPN Unit 2,076,039 268,533 1,856,488 295,476
41 - NonUnion Unit 13,832,226 3,878,082 11,893,399 3,779,859
42 - Union RN 2,363,368 956,912 2,000,573 798,035
43 - Non-Union after 09/01/15 831,949 310,856 473,302 251,905
Municipality Total328,775,999$ 5,693,338$ 24,794,905$ 5,397,974$
Combined Assets3
2019 Valuation 2018 Valuation
$34,469,337 $30,192,879
1 Reserve for Employer Contributions and Benefit Payments. 2 Reserve for Employee Contributions. 3 Totals may not add due to rounding.
The December 31, 2019 valuation assets (actuarial value of assets) are equal to 1.013179 times the reported market value of assets (compared to 1.095342 as of December 31, 2018). Refer to the Appendix for a description of the valuation asset derivation and a detailed calculation of valuation assets.
Page 137 of 229
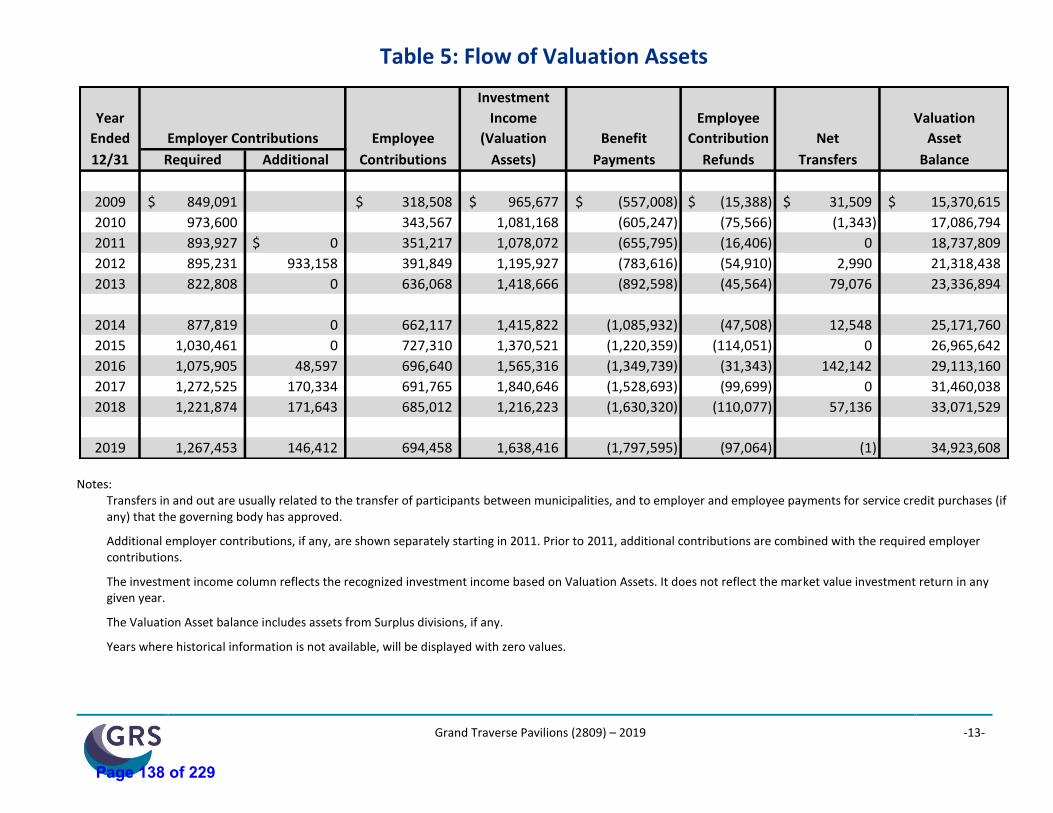
Grand Traverse Pavilions (2809) – 2019 -13-
Table 5: Flow of Valuation Assets
Investment
Year Income Employee Valuation
Ended Employee (Valuation Benefit Contribution Net Asset
12/31 Required Additional Contributions Assets) Payments Refunds Transfers Balance
2009 849,091$ 318,508$ 965,677$ (557,008)$ (15,388)$ 31,509$ 15,370,615$
2010 973,600 343,567 1,081,168 (605,247) (75,566) (1,343) 17,086,794
2011 893,927 0$ 351,217 1,078,072 (655,795) (16,406) 0 18,737,809
2012 895,231 933,158 391,849 1,195,927 (783,616) (54,910) 2,990 21,318,438
2013 822,808 0 636,068 1,418,666 (892,598) (45,564) 79,076 23,336,894
2014 877,819 0 662,117 1,415,822 (1,085,932) (47,508) 12,548 25,171,760
2015 1,030,461 0 727,310 1,370,521 (1,220,359) (114,051) 0 26,965,642
2016 1,075,905 48,597 696,640 1,565,316 (1,349,739) (31,343) 142,142 29,113,160
2017 1,272,525 170,334 691,765 1,840,646 (1,528,693) (99,699) 0 31,460,038
2018 1,221,874 171,643 685,012 1,216,223 (1,630,320) (110,077) 57,136 33,071,529
2019 1,267,453 146,412 694,458 1,638,416 (1,797,595) (97,064) (1) 34,923,608
Employer Contributions
Notes:
Transfers in and out are usually related to the transfer of participants between municipalities, and to employer and employee payments for service credit purchases (if any) that the governing body has approved.
Additional employer contributions, if any, are shown separately starting in 2011. Prior to 2011, additional contributions are combined with the required employer contributions.
The investment income column reflects the recognized investment income based on Valuation Assets. It does not reflect the market value investment return in any given year.
The Valuation Asset balance includes assets from Surplus divisions, if any.
Years where historical information is not available, will be displayed with zero values.
Page 138 of 229
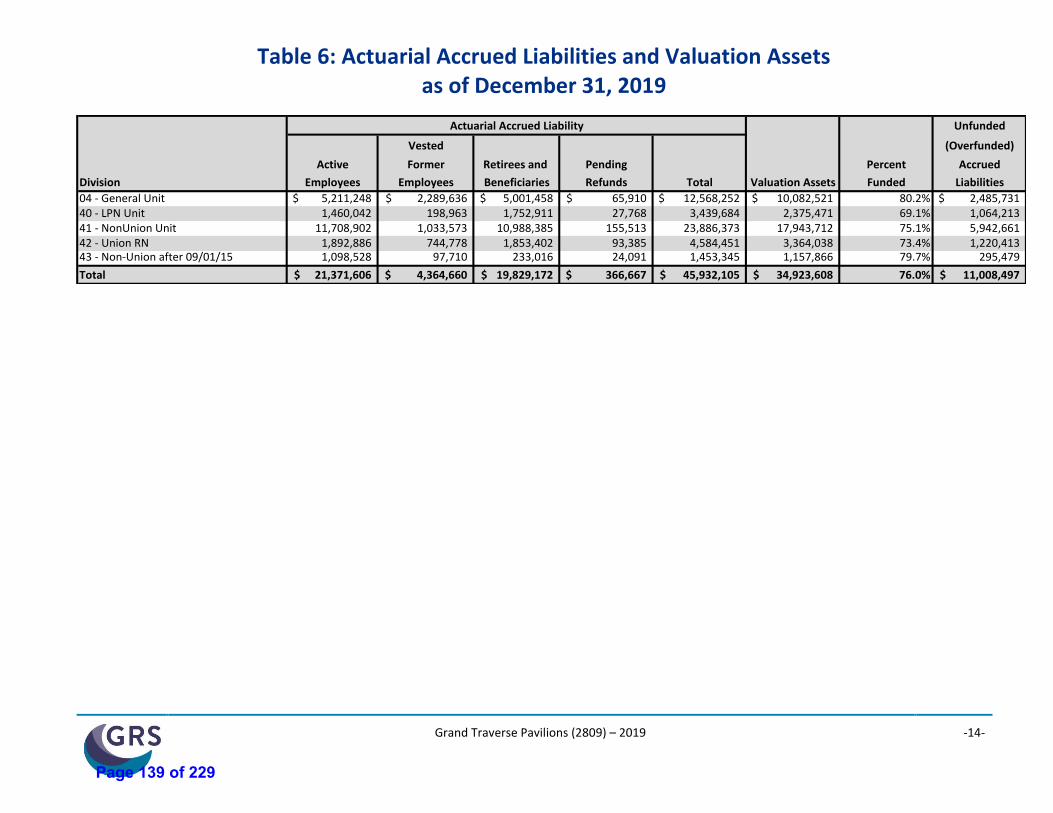
Grand Traverse Pavilions (2809) – 2019 -14-
Table 6: Actuarial Accrued Liabilities and Valuation Assets as of December 31, 2019
Unfunded
Vested (Overfunded)
Active Former Retirees and Pending Percent Accrued
Division Employees Employees Beneficiaries Refunds Total Valuation Assets Funded Liabilities
04 - General Unit 5,211,248$ 2,289,636$ 5,001,458$ 65,910$ 12,568,252$ 10,082,521$ 80.2% 2,485,731$ 40 - LPN Unit 1,460,042 198,963 1,752,911 27,768 3,439,684 2,375,471 69.1% 1,064,21341 - NonUnion Unit 11,708,902 1,033,573 10,988,385 155,513 23,886,373 17,943,712 75.1% 5,942,66142 - Union RN 1,892,886 744,778 1,853,402 93,385 4,584,451 3,364,038 73.4% 1,220,41343 - Non-Union after 09/01/15 1,098,528 97,710 233,016 24,091 1,453,345 1,157,866 79.7% 295,479
Total 21,371,606$ 4,364,660$ 19,829,172$ 366,667$ 45,932,105$ 34,923,608$ 76.0% 11,008,497$
Actuarial Accrued Liability
Page 139 of 229
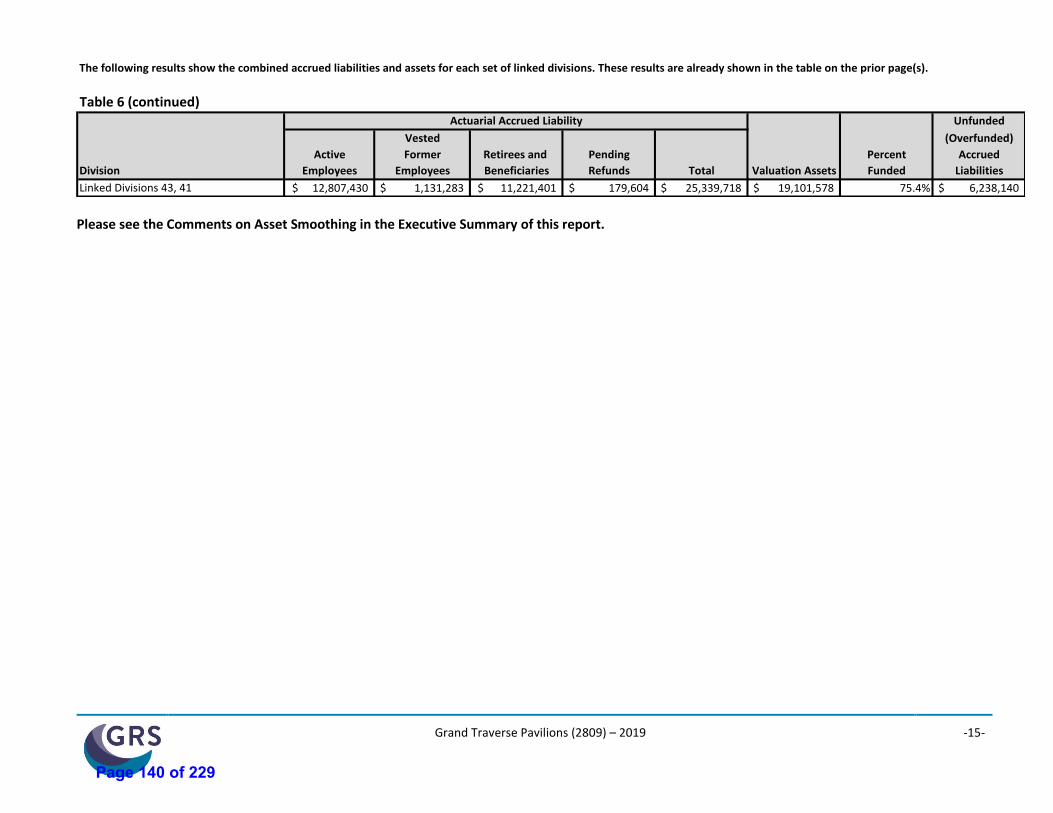
Grand Traverse Pavilions (2809) – 2019 -15-
The following results show the combined accrued liabilities and assets for each set of linked divisions. These results are already shown in the table on the prior page(s).
Table 6 (continued)Unfunded
Vested (Overfunded)
Active Former Retirees and Pending Percent Accrued
Division Employees Employees Beneficiaries Refunds Total Valuation Assets Funded Liabilities
Linked Divisions 43, 41 12,807,430$ 1,131,283$ 11,221,401$ 179,604$ 25,339,718$ 19,101,578$ 75.4% 6,238,140$
Actuarial Accrued Liability
Please see the Comments on Asset Smoothing in the Executive Summary of this report.
Page 140 of 229
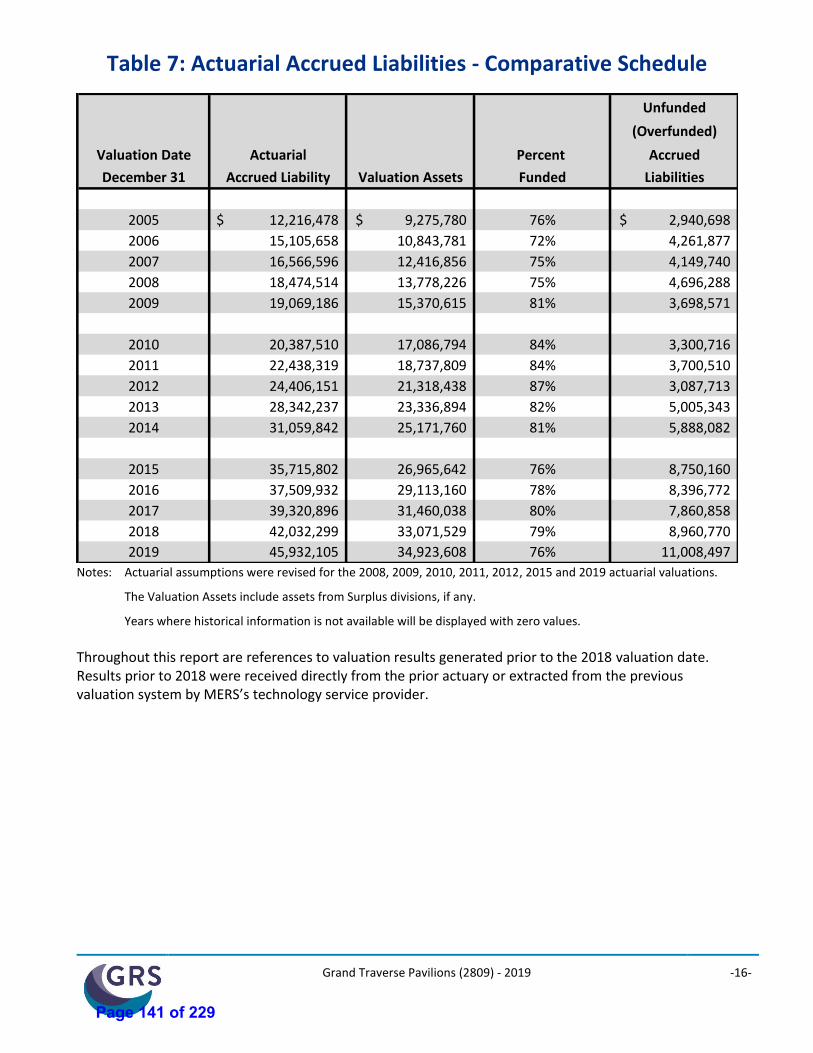
Grand Traverse Pavilions (2809) - 2019 -16-
Table 7: Actuarial Accrued Liabilities - Comparative Schedule
Unfunded
(Overfunded)
Valuation Date Actuarial Percent Accrued
December 31 Accrued Liability Valuation Assets Funded Liabilities
2005 12,216,478$ 9,275,780$ 76% 2,940,698$
2006 15,105,658 10,843,781 72% 4,261,877
2007 16,566,596 12,416,856 75% 4,149,740
2008 18,474,514 13,778,226 75% 4,696,288
2009 19,069,186 15,370,615 81% 3,698,571
2010 20,387,510 17,086,794 84% 3,300,716
2011 22,438,319 18,737,809 84% 3,700,510
2012 24,406,151 21,318,438 87% 3,087,713
2013 28,342,237 23,336,894 82% 5,005,343
2014 31,059,842 25,171,760 81% 5,888,082
2015 35,715,802 26,965,642 76% 8,750,160
2016 37,509,932 29,113,160 78% 8,396,772
2017 39,320,896 31,460,038 80% 7,860,858
2018 42,032,299 33,071,529 79% 8,960,770
2019 45,932,105 34,923,608 76% 11,008,497 Notes: Actuarial assumptions were revised for the 2008, 2009, 2010, 2011, 2012, 2015 and 2019 actuarial valuations.
The Valuation Assets include assets from Surplus divisions, if any.
Years where historical information is not available will be displayed with zero values.
Throughout this report are references to valuation results generated prior to the 2018 valuation date. Results prior to 2018 were received directly from the prior actuary or extracted from the previous valuation system by MERS’s technology service provider.
Page 141 of 229
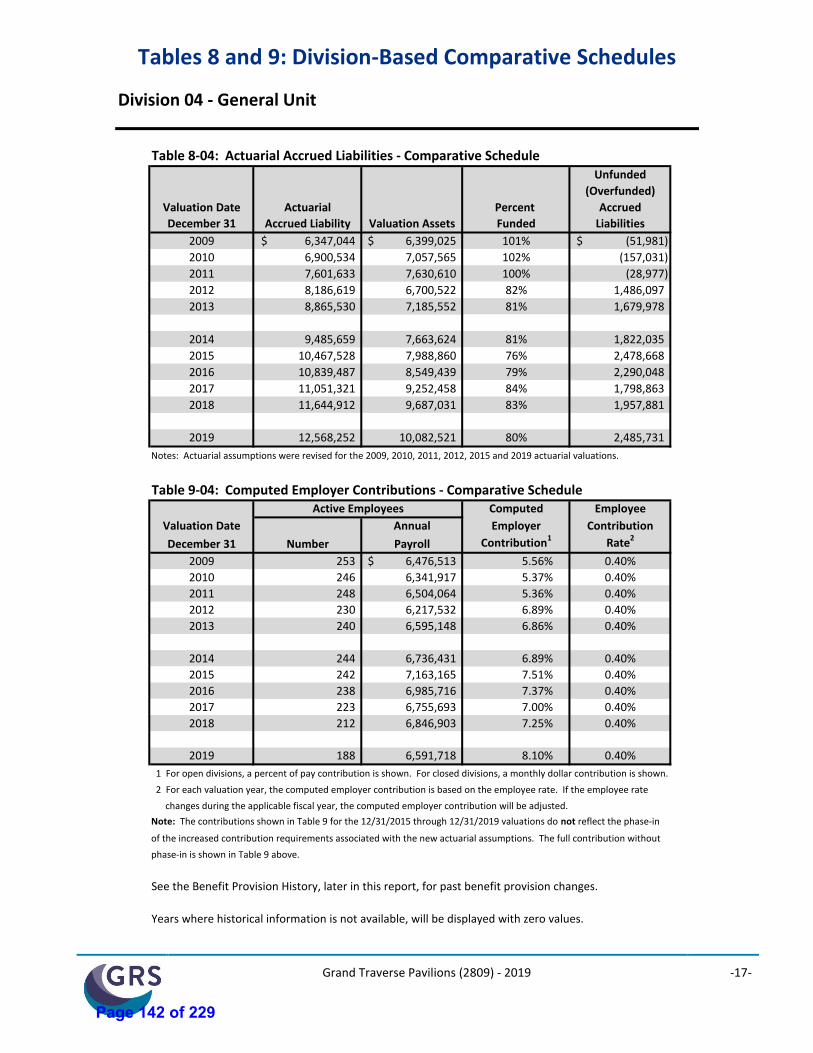
Grand Traverse Pavilions (2809) - 2019 -17-
Tables 8 and 9: Division-Based Comparative Schedules
Division 04 - General Unit
Table 8-04: Actuarial Accrued Liabilities - Comparative ScheduleUnfunded
(Overfunded)
Valuation Date Actuarial Percent Accrued
December 31 Accrued Liability Valuation Assets Funded Liabilities
2009 6,347,044$ 6,399,025$ 101% (51,981)$
2010 6,900,534 7,057,565 102% (157,031)
2011 7,601,633 7,630,610 100% (28,977)
2012 8,186,619 6,700,522 82% 1,486,097
2013 8,865,530 7,185,552 81% 1,679,978
2014 9,485,659 7,663,624 81% 1,822,035
2015 10,467,528 7,988,860 76% 2,478,668
2016 10,839,487 8,549,439 79% 2,290,048
2017 11,051,321 9,252,458 84% 1,798,863
2018 11,644,912 9,687,031 83% 1,957,881
2019 12,568,252 10,082,521 80% 2,485,731
Notes: Actuarial assumptions were revised for the 2009, 2010, 2011, 2012, 2015 and 2019 actuarial valuations.
Table 9-04: Computed Employer Contributions - Comparative ScheduleComputed Employee
Valuation Date Annual Employer Contribution
December 31 Number Payroll Contribution1 Rate2
2009 253 6,476,513$ 5.56% 0.40%
2010 246 6,341,917 5.37% 0.40%
2011 248 6,504,064 5.36% 0.40%
2012 230 6,217,532 6.89% 0.40%
2013 240 6,595,148 6.86% 0.40%
2014 244 6,736,431 6.89% 0.40%
2015 242 7,163,165 7.51% 0.40%
2016 238 6,985,716 7.37% 0.40%
2017 223 6,755,693 7.00% 0.40%
2018 212 6,846,903 7.25% 0.40%
2019 188 6,591,718 8.10% 0.40%
1 For open divisions, a percent of pay contribution is shown. For closed divisions, a monthly dollar contribution is shown.
2 For each valuation year, the computed employer contribution is based on the employee rate. If the employee rate
changes during the applicable fiscal year, the computed employer contribution will be adjusted.
Note: The contributions shown in Table 9 for the 12/31/2015 through 12/31/2019 valuations do not reflect the phase-in
of the increased contribution requirements associated with the new actuarial assumptions. The full contribution without
phase-in is shown in Table 9 above.
See the Benefit Provision History, later in this report, for past benefit provision changes.
Years where historical information is not available, will be displayed with zero values.
Active Employees
Page 142 of 229
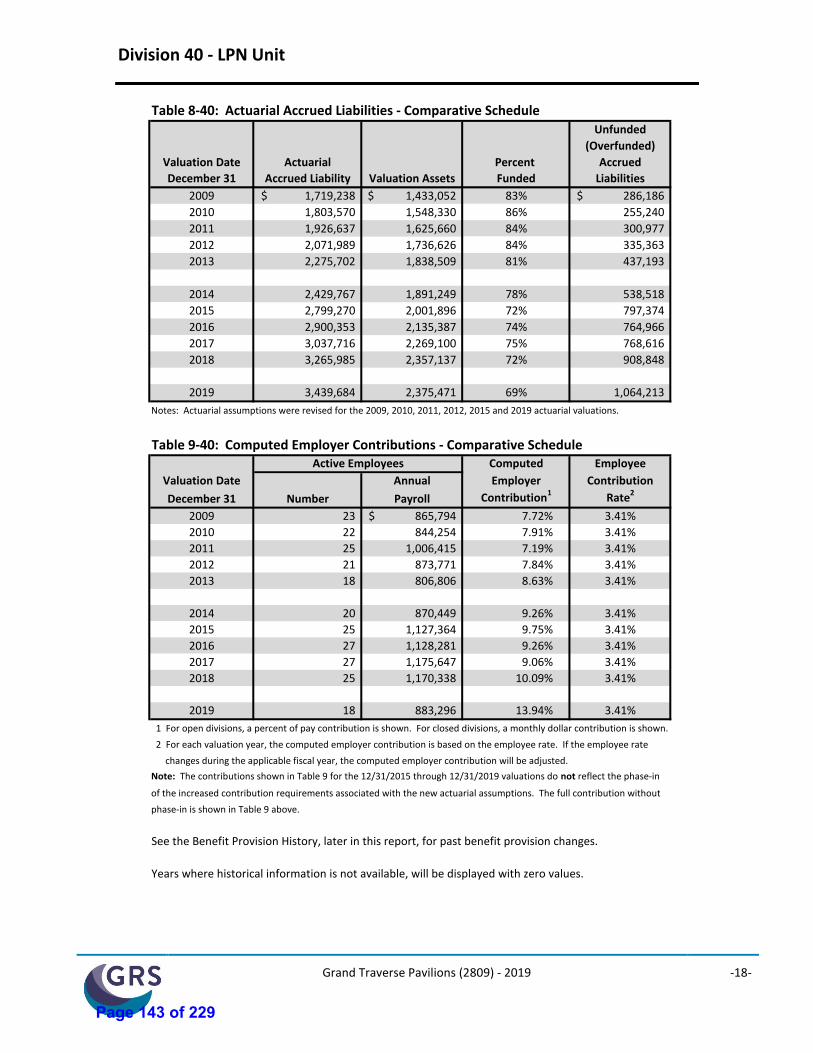
Grand Traverse Pavilions (2809) - 2019 -18-
Division 40 - LPN Unit
Table 8-40: Actuarial Accrued Liabilities - Comparative ScheduleUnfunded
(Overfunded)
Valuation Date Actuarial Percent Accrued
December 31 Accrued Liability Valuation Assets Funded Liabilities
2009 1,719,238$ 1,433,052$ 83% 286,186$
2010 1,803,570 1,548,330 86% 255,240
2011 1,926,637 1,625,660 84% 300,977
2012 2,071,989 1,736,626 84% 335,363
2013 2,275,702 1,838,509 81% 437,193
2014 2,429,767 1,891,249 78% 538,518
2015 2,799,270 2,001,896 72% 797,374
2016 2,900,353 2,135,387 74% 764,966
2017 3,037,716 2,269,100 75% 768,616
2018 3,265,985 2,357,137 72% 908,848
2019 3,439,684 2,375,471 69% 1,064,213
Notes: Actuarial assumptions were revised for the 2009, 2010, 2011, 2012, 2015 and 2019 actuarial valuations.
Table 9-40: Computed Employer Contributions - Comparative ScheduleComputed Employee
Valuation Date Annual Employer Contribution
December 31 Number Payroll Contribution1 Rate2
2009 23 865,794$ 7.72% 3.41%
2010 22 844,254 7.91% 3.41%
2011 25 1,006,415 7.19% 3.41%
2012 21 873,771 7.84% 3.41%
2013 18 806,806 8.63% 3.41%
2014 20 870,449 9.26% 3.41%
2015 25 1,127,364 9.75% 3.41%
2016 27 1,128,281 9.26% 3.41%
2017 27 1,175,647 9.06% 3.41%
2018 25 1,170,338 10.09% 3.41%
2019 18 883,296 13.94% 3.41%
1 For open divisions, a percent of pay contribution is shown. For closed divisions, a monthly dollar contribution is shown.
2 For each valuation year, the computed employer contribution is based on the employee rate. If the employee rate
changes during the applicable fiscal year, the computed employer contribution will be adjusted.
Note: The contributions shown in Table 9 for the 12/31/2015 through 12/31/2019 valuations do not reflect the phase-in
of the increased contribution requirements associated with the new actuarial assumptions. The full contribution without
phase-in is shown in Table 9 above.
See the Benefit Provision History, later in this report, for past benefit provision changes.
Years where historical information is not available, will be displayed with zero values.
Active Employees
Page 143 of 229
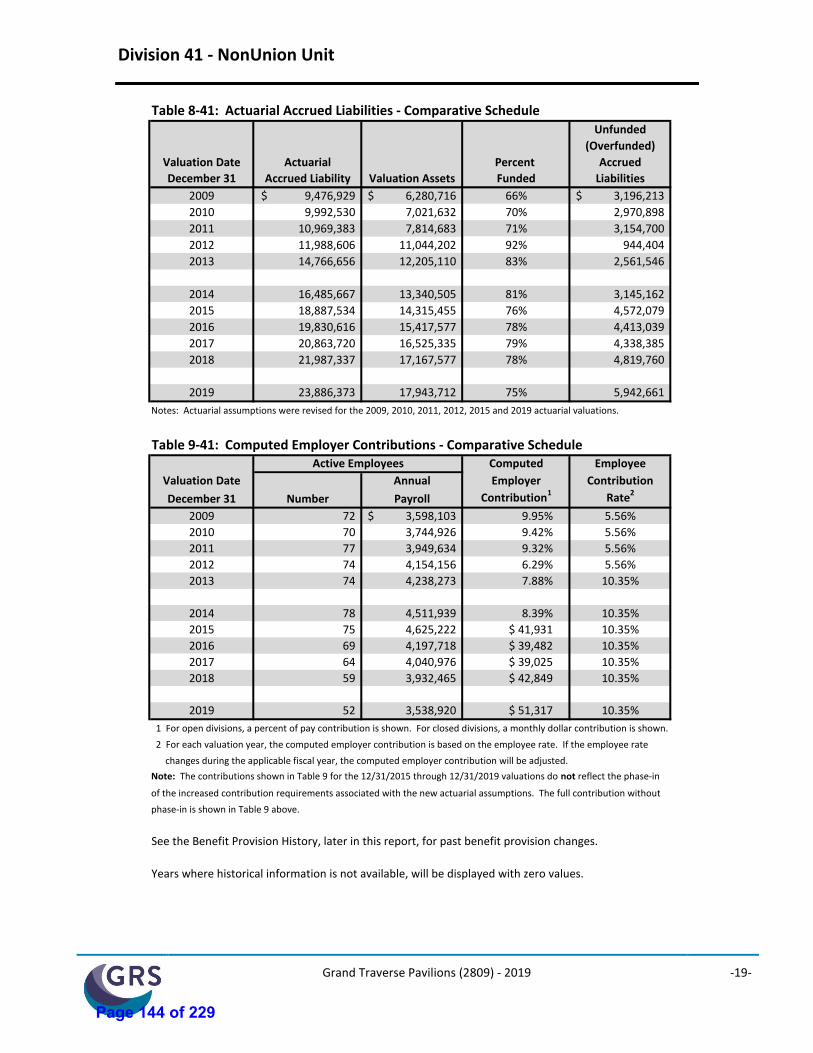
Grand Traverse Pavilions (2809) - 2019 -19-
Division 41 - NonUnion Unit
Table 8-41: Actuarial Accrued Liabilities - Comparative ScheduleUnfunded
(Overfunded)
Valuation Date Actuarial Percent Accrued
December 31 Accrued Liability Valuation Assets Funded Liabilities
2009 9,476,929$ 6,280,716$ 66% 3,196,213$
2010 9,992,530 7,021,632 70% 2,970,898
2011 10,969,383 7,814,683 71% 3,154,700
2012 11,988,606 11,044,202 92% 944,404
2013 14,766,656 12,205,110 83% 2,561,546
2014 16,485,667 13,340,505 81% 3,145,162
2015 18,887,534 14,315,455 76% 4,572,079
2016 19,830,616 15,417,577 78% 4,413,039
2017 20,863,720 16,525,335 79% 4,338,385
2018 21,987,337 17,167,577 78% 4,819,760
2019 23,886,373 17,943,712 75% 5,942,661
Notes: Actuarial assumptions were revised for the 2009, 2010, 2011, 2012, 2015 and 2019 actuarial valuations.
Table 9-41: Computed Employer Contributions - Comparative ScheduleComputed Employee
Valuation Date Annual Employer Contribution
December 31 Number Payroll Contribution1 Rate2
2009 72 3,598,103$ 9.95% 5.56%
2010 70 3,744,926 9.42% 5.56%
2011 77 3,949,634 9.32% 5.56%
2012 74 4,154,156 6.29% 5.56%
2013 74 4,238,273 7.88% 10.35%
2014 78 4,511,939 8.39% 10.35%
2015 75 4,625,222 $ 41,931 10.35%
2016 69 4,197,718 $ 39,482 10.35%
2017 64 4,040,976 $ 39,025 10.35%
2018 59 3,932,465 $ 42,849 10.35%
2019 52 3,538,920 $ 51,317 10.35%
1 For open divisions, a percent of pay contribution is shown. For closed divisions, a monthly dollar contribution is shown.
2 For each valuation year, the computed employer contribution is based on the employee rate. If the employee rate
changes during the applicable fiscal year, the computed employer contribution will be adjusted.
Note: The contributions shown in Table 9 for the 12/31/2015 through 12/31/2019 valuations do not reflect the phase-in
of the increased contribution requirements associated with the new actuarial assumptions. The full contribution without
phase-in is shown in Table 9 above.
See the Benefit Provision History, later in this report, for past benefit provision changes.
Years where historical information is not available, will be displayed with zero values.
Active Employees
Page 144 of 229
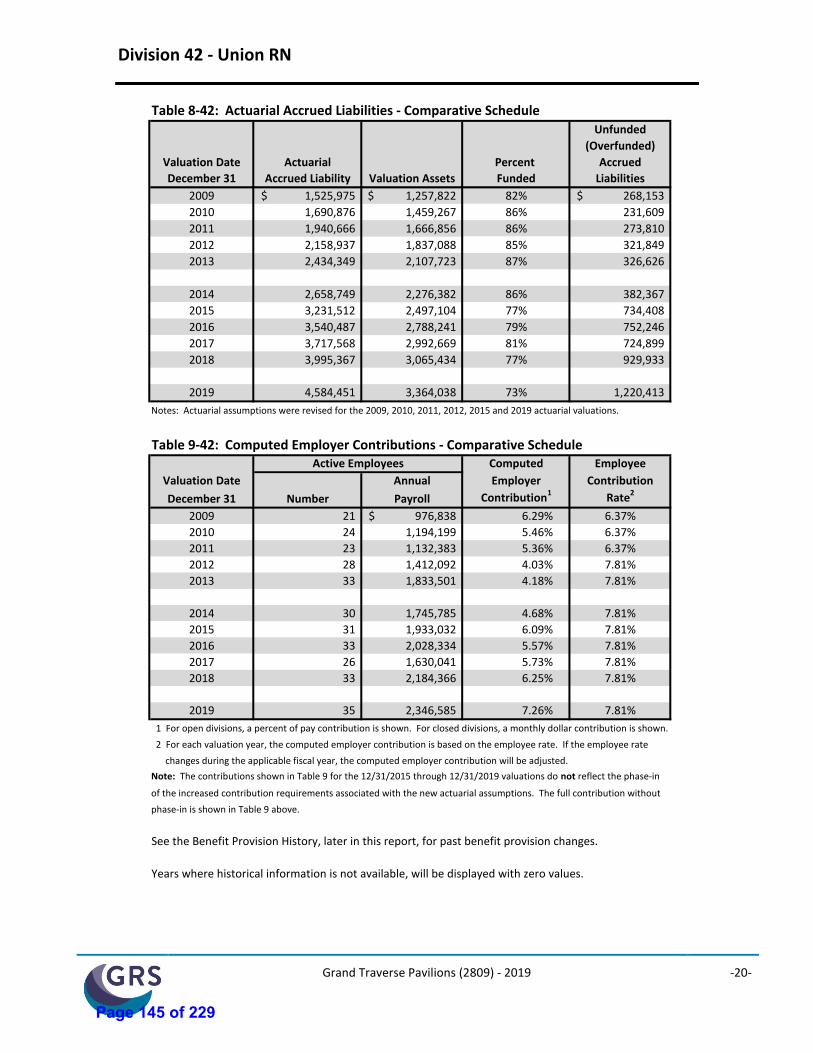
Grand Traverse Pavilions (2809) - 2019 -20-
Division 42 - Union RN
Table 8-42: Actuarial Accrued Liabilities - Comparative ScheduleUnfunded
(Overfunded)
Valuation Date Actuarial Percent Accrued
December 31 Accrued Liability Valuation Assets Funded Liabilities
2009 1,525,975$ 1,257,822$ 82% 268,153$
2010 1,690,876 1,459,267 86% 231,609
2011 1,940,666 1,666,856 86% 273,810
2012 2,158,937 1,837,088 85% 321,849
2013 2,434,349 2,107,723 87% 326,626
2014 2,658,749 2,276,382 86% 382,367
2015 3,231,512 2,497,104 77% 734,408
2016 3,540,487 2,788,241 79% 752,246
2017 3,717,568 2,992,669 81% 724,899
2018 3,995,367 3,065,434 77% 929,933
2019 4,584,451 3,364,038 73% 1,220,413
Notes: Actuarial assumptions were revised for the 2009, 2010, 2011, 2012, 2015 and 2019 actuarial valuations.
Table 9-42: Computed Employer Contributions - Comparative ScheduleComputed Employee
Valuation Date Annual Employer Contribution
December 31 Number Payroll Contribution1 Rate2
2009 21 976,838$ 6.29% 6.37%
2010 24 1,194,199 5.46% 6.37%
2011 23 1,132,383 5.36% 6.37%
2012 28 1,412,092 4.03% 7.81%
2013 33 1,833,501 4.18% 7.81%
2014 30 1,745,785 4.68% 7.81%
2015 31 1,933,032 6.09% 7.81%
2016 33 2,028,334 5.57% 7.81%
2017 26 1,630,041 5.73% 7.81%
2018 33 2,184,366 6.25% 7.81%
2019 35 2,346,585 7.26% 7.81%
1 For open divisions, a percent of pay contribution is shown. For closed divisions, a monthly dollar contribution is shown.
2 For each valuation year, the computed employer contribution is based on the employee rate. If the employee rate
changes during the applicable fiscal year, the computed employer contribution will be adjusted.
Note: The contributions shown in Table 9 for the 12/31/2015 through 12/31/2019 valuations do not reflect the phase-in
of the increased contribution requirements associated with the new actuarial assumptions. The full contribution without
phase-in is shown in Table 9 above.
See the Benefit Provision History, later in this report, for past benefit provision changes.
Years where historical information is not available, will be displayed with zero values.
Active Employees
Page 145 of 229
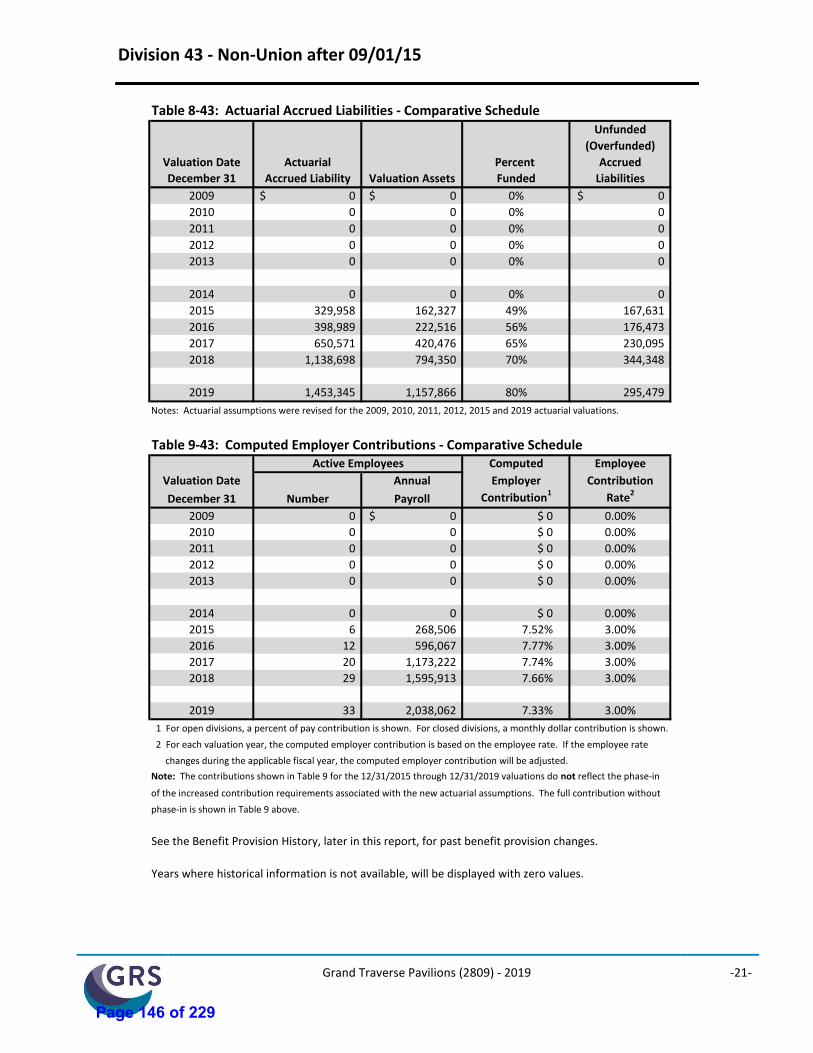
Grand Traverse Pavilions (2809) - 2019 -21-
Division 43 - Non-Union after 09/01/15
Table 8-43: Actuarial Accrued Liabilities - Comparative ScheduleUnfunded
(Overfunded)
Valuation Date Actuarial Percent Accrued
December 31 Accrued Liability Valuation Assets Funded Liabilities
2009 0$ 0$ 0% 0$
2010 0 0 0% 0
2011 0 0 0% 0
2012 0 0 0% 0
2013 0 0 0% 0
2014 0 0 0% 0
2015 329,958 162,327 49% 167,631
2016 398,989 222,516 56% 176,473
2017 650,571 420,476 65% 230,095
2018 1,138,698 794,350 70% 344,348
2019 1,453,345 1,157,866 80% 295,479
Notes: Actuarial assumptions were revised for the 2009, 2010, 2011, 2012, 2015 and 2019 actuarial valuations.
Table 9-43: Computed Employer Contributions - Comparative ScheduleComputed Employee
Valuation Date Annual Employer Contribution
December 31 Number Payroll Contribution1 Rate2
2009 0 0$ $ 0 0.00%
2010 0 0 $ 0 0.00%
2011 0 0 $ 0 0.00%
2012 0 0 $ 0 0.00%
2013 0 0 $ 0 0.00%
2014 0 0 $ 0 0.00%
2015 6 268,506 7.52% 3.00%
2016 12 596,067 7.77% 3.00%
2017 20 1,173,222 7.74% 3.00%
2018 29 1,595,913 7.66% 3.00%
2019 33 2,038,062 7.33% 3.00%
1 For open divisions, a percent of pay contribution is shown. For closed divisions, a monthly dollar contribution is shown.
2 For each valuation year, the computed employer contribution is based on the employee rate. If the employee rate
changes during the applicable fiscal year, the computed employer contribution will be adjusted.
Note: The contributions shown in Table 9 for the 12/31/2015 through 12/31/2019 valuations do not reflect the phase-in
of the increased contribution requirements associated with the new actuarial assumptions. The full contribution without
phase-in is shown in Table 9 above.
See the Benefit Provision History, later in this report, for past benefit provision changes.
Years where historical information is not available, will be displayed with zero values.
Active Employees
Page 146 of 229
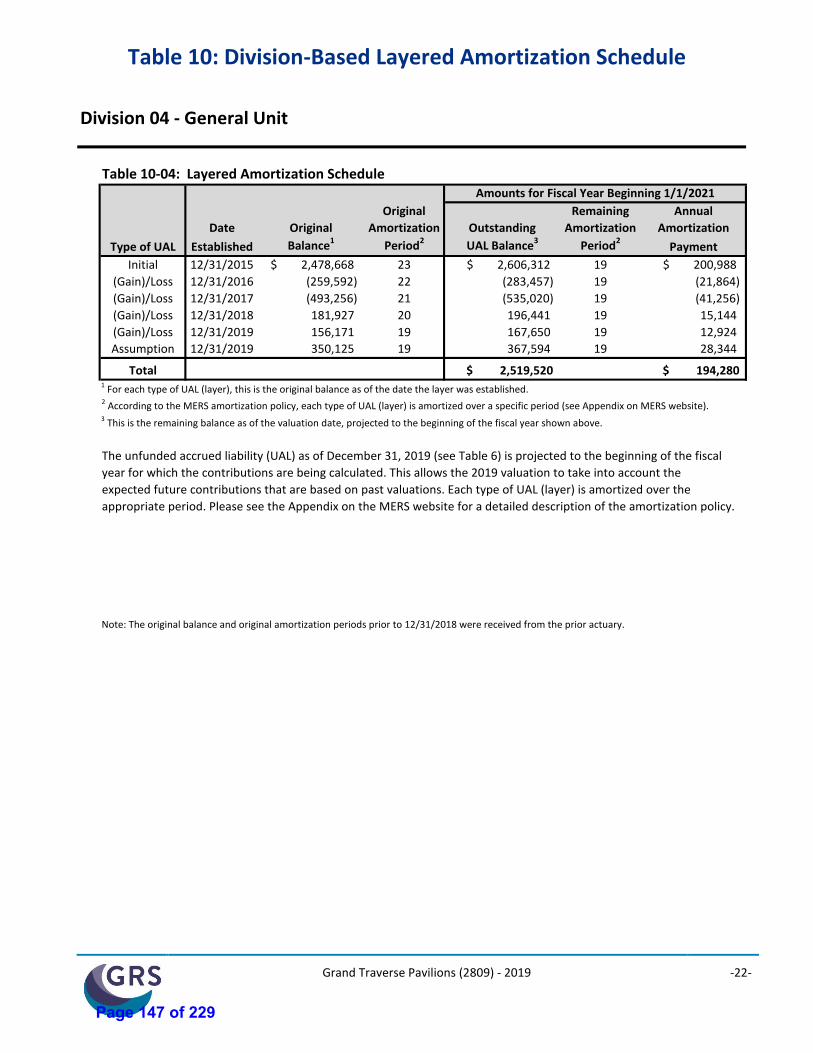
Grand Traverse Pavilions (2809) - 2019 -22-
Table 10: Division-Based Layered Amortization Schedule
Division 04 - General Unit
Table 10-04: Layered Amortization Schedule
Original Remaining Annual
Date Original Amortization Outstanding Amortization Amortization
Type of UAL Established Balance1
Period2
UAL Balance3
Period2
Payment
Initial 12/31/2015 $ 2,478,668 23 $ 2,606,312 19 $ 200,988
(Gain)/Loss 12/31/2016 (259,592) 22 (283,457) 19 (21,864)
(Gain)/Loss 12/31/2017 (493,256) 21 (535,020) 19 (41,256)
(Gain)/Loss 12/31/2018 181,927 20 196,441 19 15,144
(Gain)/Loss 12/31/2019 156,171 19 167,650 19 12,924
Assumption 12/31/2019 350,125 19 367,594 19 28,344
Total $ 2,519,520 $ 194,2801 For each type of UAL (layer), this is the original balance as of the date the layer was established.
3 This is the remaining balance as of the valuation date, projected to the beginning of the fiscal year shown above.
The unfunded accrued liability (UAL) as of December 31, 2019 (see Table 6) is projected to the beginning of the fiscal
appropriate period. Please see the Appendix on the MERS website for a detailed description of the amortization policy.
Note: The original balance and original amortization periods prior to 12/31/2018 were received from the prior actuary.
Amounts for Fiscal Year Beginning 1/1/2021
2 According to the MERS amortization policy, each type of UAL (layer) is amortized over a specific period (see Appendix on MERS website).
year for which the contributions are being calculated. This allows the 2019 valuation to take into account the
expected future contributions that are based on past valuations. Each type of UAL (layer) is amortized over the
Page 147 of 229
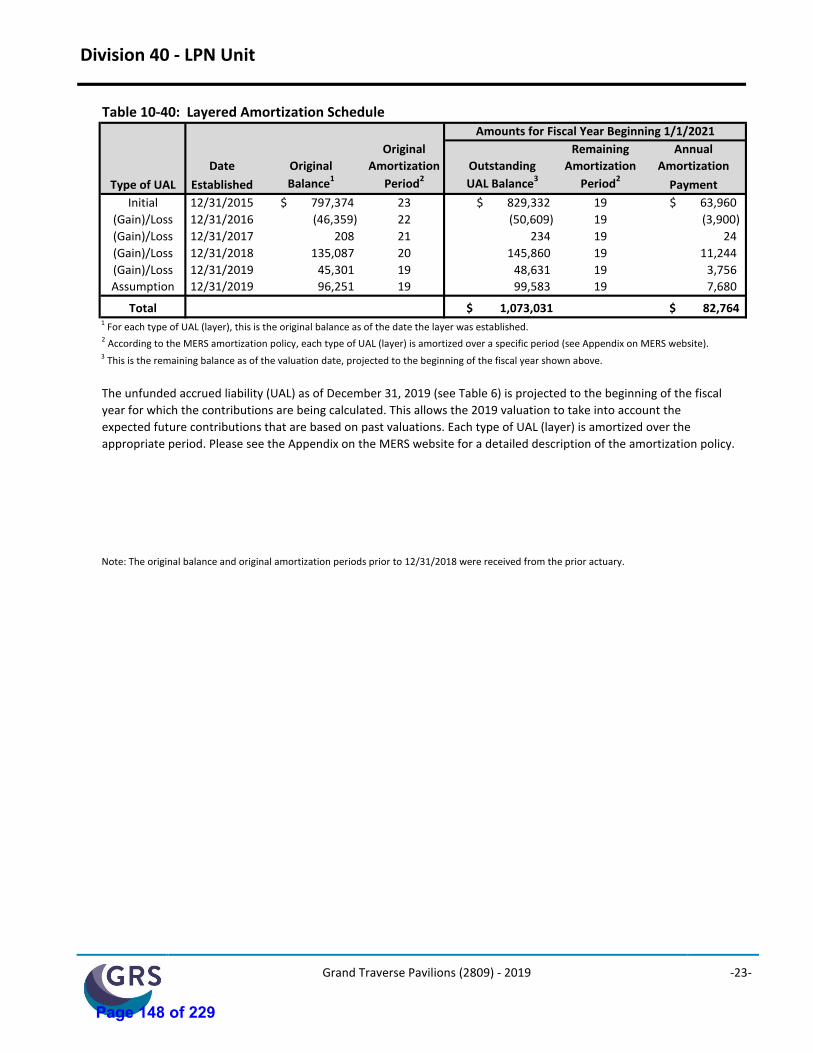
Grand Traverse Pavilions (2809) - 2019 -23-
Division 40 - LPN Unit
Table 10-40: Layered Amortization Schedule
Original Remaining Annual
Date Original Amortization Outstanding Amortization Amortization
Type of UAL Established Balance1 Period2 UAL Balance3 Period2Payment
Initial 12/31/2015 $ 797,374 23 $ 829,332 19 $ 63,960
(Gain)/Loss 12/31/2016 (46,359) 22 (50,609) 19 (3,900)
(Gain)/Loss 12/31/2017 208 21 234 19 24
(Gain)/Loss 12/31/2018 135,087 20 145,860 19 11,244
(Gain)/Loss 12/31/2019 45,301 19 48,631 19 3,756
Assumption 12/31/2019 96,251 19 99,583 19 7,680
Total $ 1,073,031 $ 82,7641 For each type of UAL (layer), this is the original balance as of the date the layer was established.
3 This is the remaining balance as of the valuation date, projected to the beginning of the fiscal year shown above.
The unfunded accrued liability (UAL) as of December 31, 2019 (see Table 6) is projected to the beginning of the fiscal
appropriate period. Please see the Appendix on the MERS website for a detailed description of the amortization policy.
Note: The original balance and original amortization periods prior to 12/31/2018 were received from the prior actuary.
Amounts for Fiscal Year Beginning 1/1/2021
year for which the contributions are being calculated. This allows the 2019 valuation to take into account the
2 According to the MERS amortization policy, each type of UAL (layer) is amortized over a specific period (see Appendix on MERS website).
expected future contributions that are based on past valuations. Each type of UAL (layer) is amortized over the
Page 148 of 229

Grand Traverse Pavilions (2809) - 2019 -24-
Division 41 - NonUnion Unit
Table 10-41: Layered Amortization Schedule
Original Remaining Annual
Date Original Amortization Outstanding Amortization Amortization
Type of UAL Established Balance1 Period2 UAL Balance3 Period2Payment
Initial 12/31/2015 $ 4,572,079 23 $ 4,847,642 19 $ 373,836
(Gain)/Loss 12/31/2016 (329,508) 22 (359,805) 19 (27,744)
(Gain)/Loss 12/31/2017 (90,058) 21 (97,685) 19 (7,536)
(Gain)/Loss 12/31/2018 458,768 20 495,380 19 38,208
(Gain)/Loss 12/31/2019 244,941 19 262,944 19 20,280
Assumption 12/31/2019 823,589 19 864,328 19 66,660
Total $ 6,012,804 $ 463,7041 For each type of UAL (layer), this is the original balance as of the date the layer was established.
3 This is the remaining balance as of the valuation date, projected to the beginning of the fiscal year shown above.
The unfunded accrued liability (UAL) as of December 31, 2019 (see Table 6) is projected to the beginning of the fiscal
appropriate period. Please see the Appendix on the MERS website for a detailed description of the amortization policy.
Note: The original balance and original amortization periods prior to 12/31/2018 were received from the prior actuary.
year for which the contributions are being calculated. This allows the 2019 valuation to take into account the
Amounts for Fiscal Year Beginning 1/1/2021
2 According to the MERS amortization policy, each type of UAL (layer) is amortized over a specific period (see Appendix on MERS website).
expected future contributions that are based on past valuations. Each type of UAL (layer) is amortized over the
Page 149 of 229
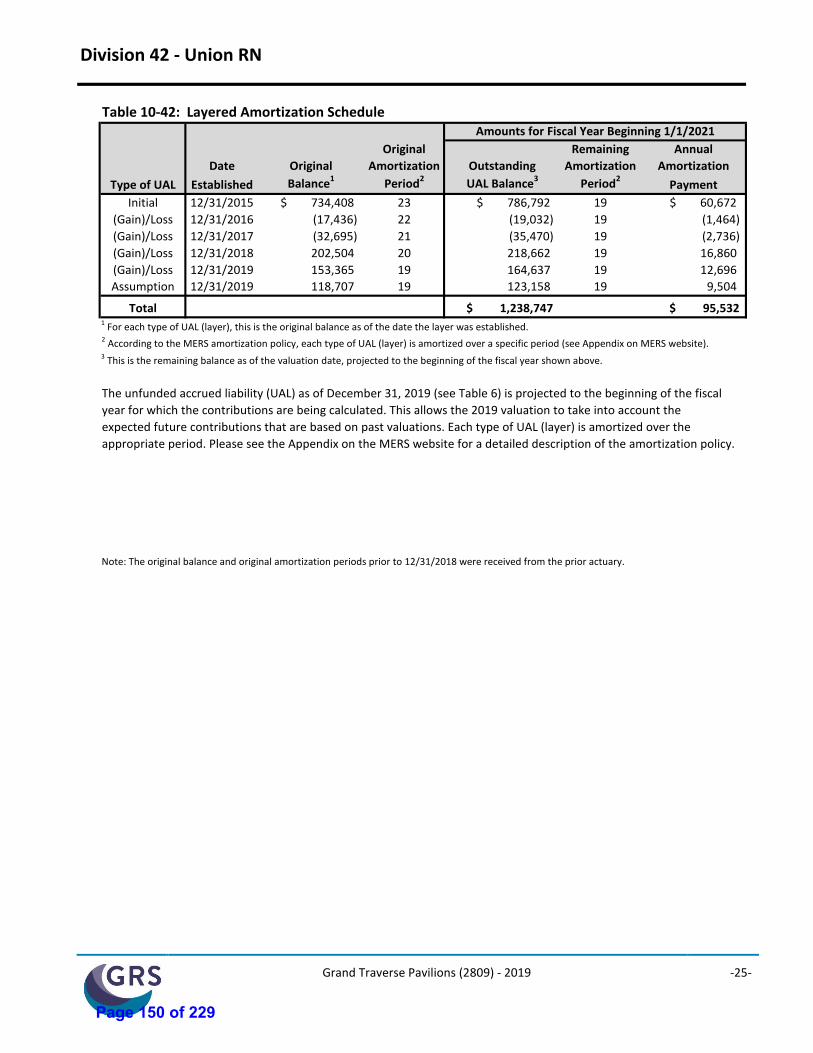
Grand Traverse Pavilions (2809) - 2019 -25-
Division 42 - Union RN
Table 10-42: Layered Amortization Schedule
Original Remaining Annual
Date Original Amortization Outstanding Amortization Amortization
Type of UAL Established Balance1 Period2 UAL Balance3 Period2Payment
Initial 12/31/2015 $ 734,408 23 $ 786,792 19 $ 60,672
(Gain)/Loss 12/31/2016 (17,436) 22 (19,032) 19 (1,464)
(Gain)/Loss 12/31/2017 (32,695) 21 (35,470) 19 (2,736)
(Gain)/Loss 12/31/2018 202,504 20 218,662 19 16,860
(Gain)/Loss 12/31/2019 153,365 19 164,637 19 12,696
Assumption 12/31/2019 118,707 19 123,158 19 9,504
Total $ 1,238,747 $ 95,5321 For each type of UAL (layer), this is the original balance as of the date the layer was established.
3 This is the remaining balance as of the valuation date, projected to the beginning of the fiscal year shown above.
The unfunded accrued liability (UAL) as of December 31, 2019 (see Table 6) is projected to the beginning of the fiscal
appropriate period. Please see the Appendix on the MERS website for a detailed description of the amortization policy.
Note: The original balance and original amortization periods prior to 12/31/2018 were received from the prior actuary.
year for which the contributions are being calculated. This allows the 2019 valuation to take into account the
Amounts for Fiscal Year Beginning 1/1/2021
2 According to the MERS amortization policy, each type of UAL (layer) is amortized over a specific period (see Appendix on MERS website).
expected future contributions that are based on past valuations. Each type of UAL (layer) is amortized over the
Page 150 of 229
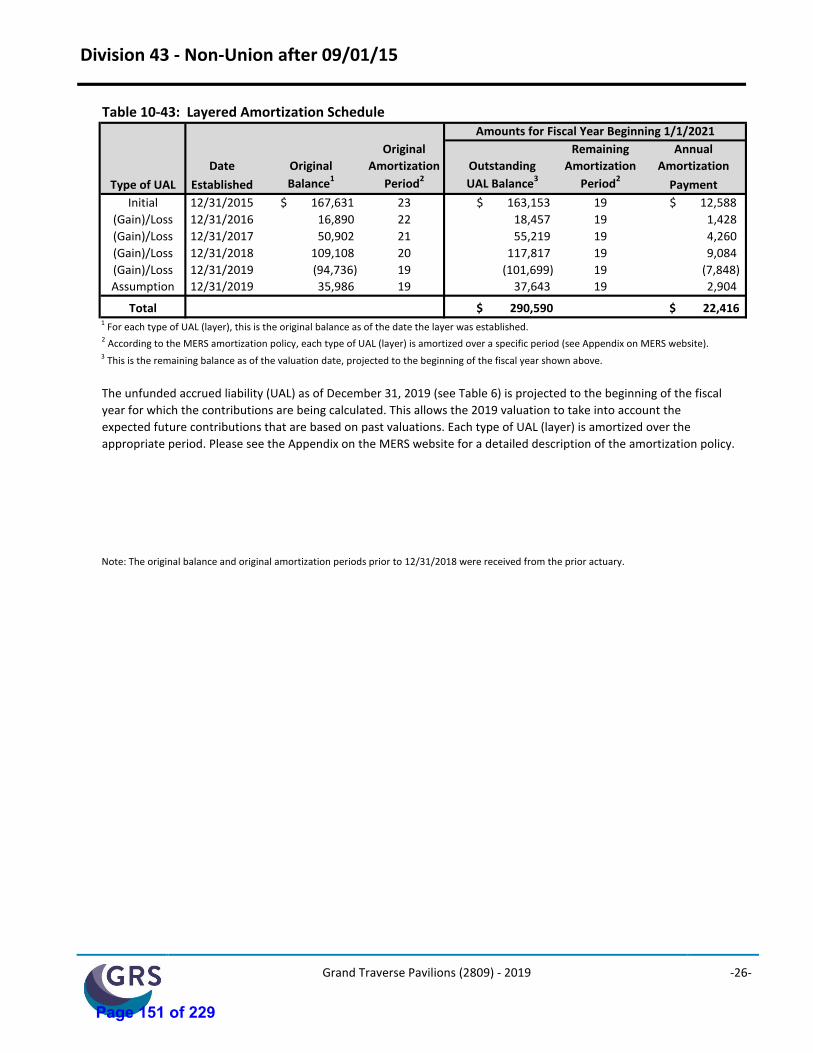
Grand Traverse Pavilions (2809) - 2019 -26-
Division 43 - Non-Union after 09/01/15
Table 10-43: Layered Amortization Schedule
Original Remaining Annual
Date Original Amortization Outstanding Amortization Amortization
Type of UAL Established Balance1 Period2 UAL Balance3 Period2Payment
Initial 12/31/2015 $ 167,631 23 $ 163,153 19 $ 12,588
(Gain)/Loss 12/31/2016 16,890 22 18,457 19 1,428
(Gain)/Loss 12/31/2017 50,902 21 55,219 19 4,260
(Gain)/Loss 12/31/2018 109,108 20 117,817 19 9,084
(Gain)/Loss 12/31/2019 (94,736) 19 (101,699) 19 (7,848)
Assumption 12/31/2019 35,986 19 37,643 19 2,904
Total $ 290,590 $ 22,4161 For each type of UAL (layer), this is the original balance as of the date the layer was established.
3 This is the remaining balance as of the valuation date, projected to the beginning of the fiscal year shown above.
The unfunded accrued liability (UAL) as of December 31, 2019 (see Table 6) is projected to the beginning of the fiscal
appropriate period. Please see the Appendix on the MERS website for a detailed description of the amortization policy.
Note: The original balance and original amortization periods prior to 12/31/2018 were received from the prior actuary.
Amounts for Fiscal Year Beginning 1/1/2021
year for which the contributions are being calculated. This allows the 2019 valuation to take into account the
2 According to the MERS amortization policy, each type of UAL (layer) is amortized over a specific period (see Appendix on MERS website).
expected future contributions that are based on past valuations. Each type of UAL (layer) is amortized over the
Page 151 of 229
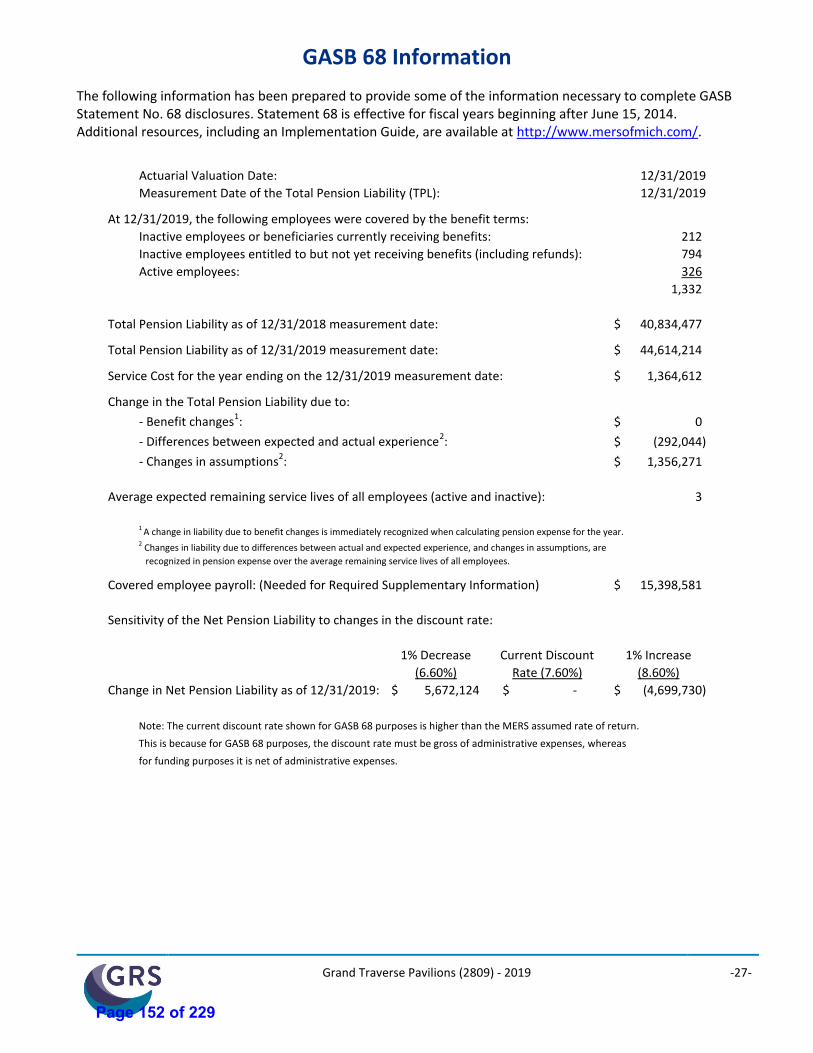
Grand Traverse Pavilions (2809) - 2019 -27-
GASB 68 Information
The following information has been prepared to provide some of the information necessary to complete GASB Statement No. 68 disclosures. Statement 68 is effective for fiscal years beginning after June 15, 2014. Additional resources, including an Implementation Guide, are available at http://www.mersofmich.com/.
Actuarial Valuation Date: 12/31/2019
Measurement Date of the Total Pension Liability (TPL): 12/31/2019
At 12/31/2019, the following employees were covered by the benefit terms:
Inactive employees or beneficiaries currently receiving benefits: 212
Inactive employees entitled to but not yet receiving benefits (including refunds): 794
Active employees: 326
1,332
Total Pension Liability as of 12/31/2018 measurement date: 40,834,477$
Total Pension Liability as of 12/31/2019 measurement date: 44,614,214$
Service Cost for the year ending on the 12/31/2019 measurement date: 1,364,612$
Change in the Total Pension Liability due to:
- Benefit changes1: 0$
- Differences between expected and actual experience2: (292,044)$
- Changes in assumptions2: 1,356,271$
Average expected remaining service lives of all employees (active and inactive): 3
1 A change in liability due to benefit changes is immediately recognized when calculating pension expense for the year.2 Changes in liability due to differences between actual and expected experience, and changes in assumptions, are
recognized in pension expense over the average remaining service lives of all employees.
Covered employee payroll: (Needed for Required Supplementary Information) 15,398,581$
Sensitivity of the Net Pension Liability to changes in the discount rate:
1% Decrease Current Discount 1% Increase
(6.60%) Rate (7.60%) (8.60%)
Change in Net Pension Liability as of 12/31/2019: 5,672,124$ -$ (4,699,730)$
Note: The current discount rate shown for GASB 68 purposes is higher than the MERS assumed rate of return.
This is because for GASB 68 purposes, the discount rate must be gross of administrative expenses, whereas
for funding purposes it is net of administrative expenses.
Page 152 of 229
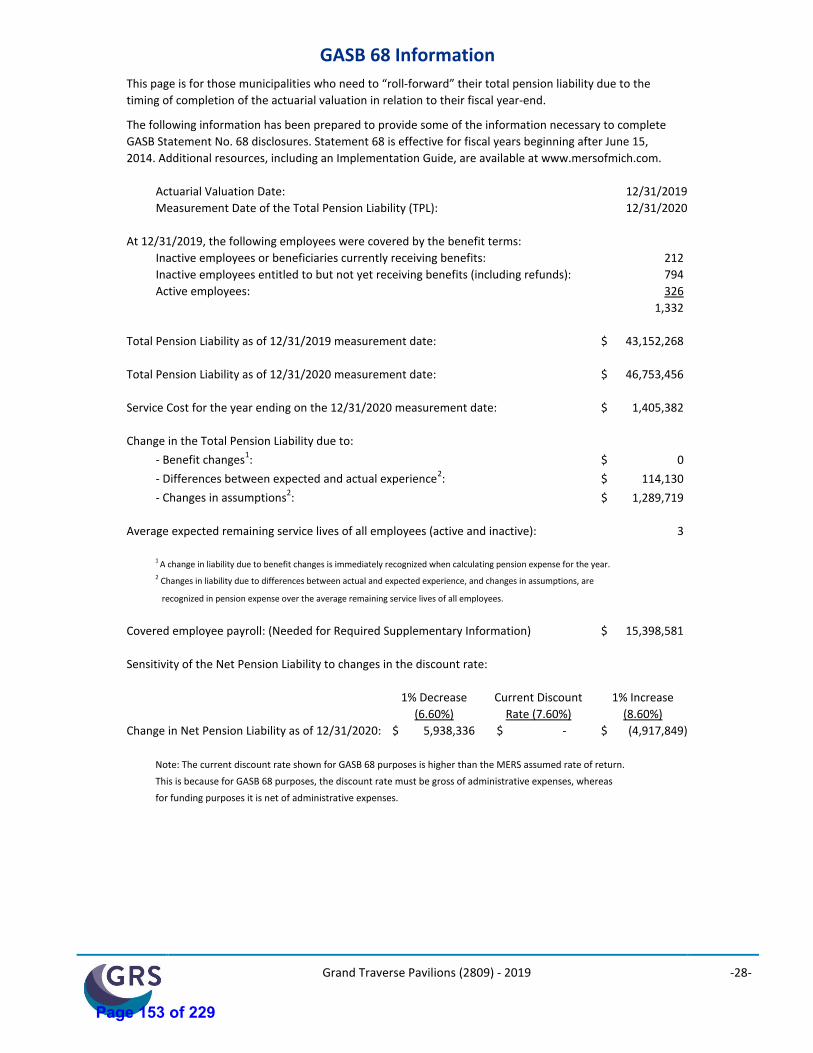
Grand Traverse Pavilions (2809) - 2019 -28-
This page is for those municipalities who need to “roll-forward” their total pension liability due to the
timing of completion of the actuarial valuation in relation to their fiscal year-end.
The following information has been prepared to provide some of the information necessary to complete
GASB Statement No. 68 disclosures. Statement 68 is effective for fiscal years beginning after June 15,
2014. Additional resources, including an Implementation Guide, are available at www.mersofmich.com.
Actuarial Valuation Date: 12/31/2019
Measurement Date of the Total Pension Liability (TPL): 12/31/2020
At 12/31/2019, the following employees were covered by the benefit terms:
Inactive employees or beneficiaries currently receiving benefits: 212
Inactive employees entitled to but not yet receiving benefits (including refunds): 794
Active employees: 326
1,332
Total Pension Liability as of 12/31/2019 measurement date: 43,152,268$
Total Pension Liability as of 12/31/2020 measurement date: 46,753,456$
Service Cost for the year ending on the 12/31/2020 measurement date: 1,405,382$
Change in the Total Pension Liability due to:
- Benefit changes1: 0$
- Differences between expected and actual experience2: 114,130$
- Changes in assumptions2: 1,289,719$
Average expected remaining service lives of all employees (active and inactive): 3
1 A change in liability due to benefit changes is immediately recognized when calculating pension expense for the year.2 Changes in liability due to differences between actual and expected experience, and changes in assumptions, are
recognized in pension expense over the average remaining service lives of all employees.
Covered employee payroll: (Needed for Required Supplementary Information) 15,398,581$
Sensitivity of the Net Pension Liability to changes in the discount rate:
1% Decrease Current Discount 1% Increase
(6.60%) Rate (7.60%) (8.60%)
Change in Net Pension Liability as of 12/31/2020: 5,938,336$ -$ (4,917,849)$
Note: The current discount rate shown for GASB 68 purposes is higher than the MERS assumed rate of return.
This is because for GASB 68 purposes, the discount rate must be gross of administrative expenses, whereas
for funding purposes it is net of administrative expenses.
GASB 68 Information
Page 153 of 229
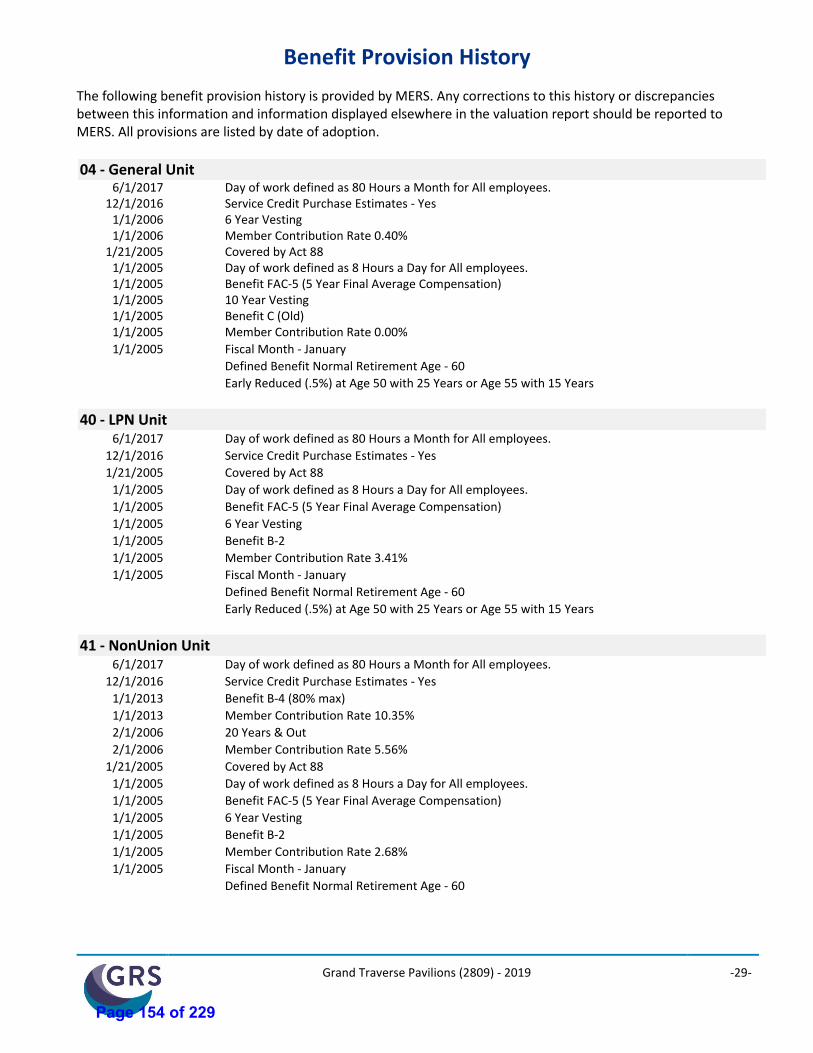
Grand Traverse Pavilions (2809) - 2019 -29-
Benefit Provision History
The following benefit provision history is provided by MERS. Any corrections to this history or discrepancies between this information and information displayed elsewhere in the valuation report should be reported to MERS. All provisions are listed by date of adoption.
04 - General Unit6/1/2017 Day of work defined as 80 Hours a Month for All employees.
12/1/2016 Service Credit Purchase Estimates - Yes1/1/2006 6 Year Vesting1/1/2006 Member Contribution Rate 0.40%
1/21/2005 Covered by Act 881/1/2005 Day of work defined as 8 Hours a Day for All employees.1/1/2005 Benefit FAC-5 (5 Year Final Average Compensation)1/1/2005 10 Year Vesting1/1/2005 Benefit C (Old)1/1/2005 Member Contribution Rate 0.00%
1/1/2005 Fiscal Month - January
Defined Benefit Normal Retirement Age - 60
Early Reduced (.5%) at Age 50 with 25 Years or Age 55 with 15 Years
40 - LPN Unit6/1/2017 Day of work defined as 80 Hours a Month for All employees.
12/1/2016 Service Credit Purchase Estimates - Yes
1/21/2005 Covered by Act 88
1/1/2005 Day of work defined as 8 Hours a Day for All employees.
1/1/2005 Benefit FAC-5 (5 Year Final Average Compensation)
1/1/2005 6 Year Vesting
1/1/2005 Benefit B-2
1/1/2005 Member Contribution Rate 3.41%
1/1/2005 Fiscal Month - January
Defined Benefit Normal Retirement Age - 60
Early Reduced (.5%) at Age 50 with 25 Years or Age 55 with 15 Years
41 - NonUnion Unit6/1/2017 Day of work defined as 80 Hours a Month for All employees.
12/1/2016 Service Credit Purchase Estimates - Yes
1/1/2013 Benefit B-4 (80% max)
1/1/2013 Member Contribution Rate 10.35%
2/1/2006 20 Years & Out
2/1/2006 Member Contribution Rate 5.56%
1/21/2005 Covered by Act 88
1/1/2005 Day of work defined as 8 Hours a Day for All employees.
1/1/2005 Benefit FAC-5 (5 Year Final Average Compensation)
1/1/2005 6 Year Vesting
1/1/2005 Benefit B-2
1/1/2005 Member Contribution Rate 2.68%
1/1/2005 Fiscal Month - January
Defined Benefit Normal Retirement Age - 60
Page 154 of 229
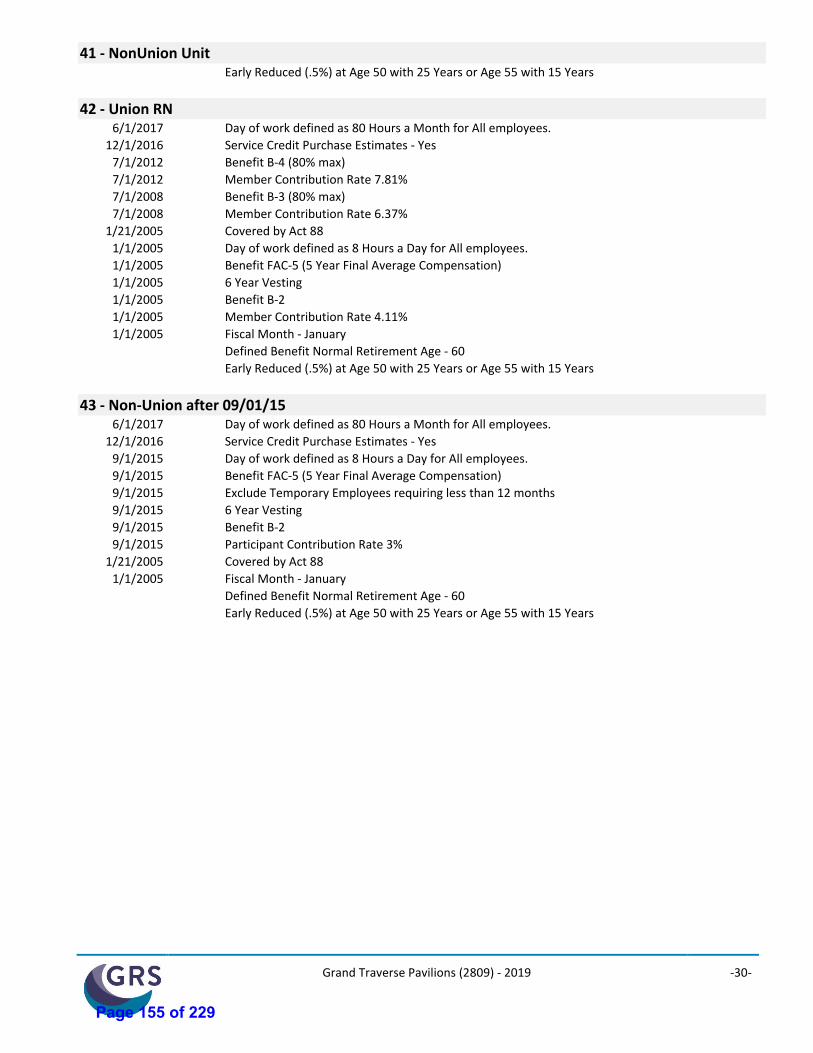
Grand Traverse Pavilions (2809) - 2019 -30-
41 - NonUnion UnitEarly Reduced (.5%) at Age 50 with 25 Years or Age 55 with 15 Years
42 - Union RN6/1/2017 Day of work defined as 80 Hours a Month for All employees.
12/1/2016 Service Credit Purchase Estimates - Yes
7/1/2012 Benefit B-4 (80% max)
7/1/2012 Member Contribution Rate 7.81%
7/1/2008 Benefit B-3 (80% max)
7/1/2008 Member Contribution Rate 6.37%
1/21/2005 Covered by Act 88
1/1/2005 Day of work defined as 8 Hours a Day for All employees.
1/1/2005 Benefit FAC-5 (5 Year Final Average Compensation)
1/1/2005 6 Year Vesting
1/1/2005 Benefit B-2
1/1/2005 Member Contribution Rate 4.11%
1/1/2005 Fiscal Month - January
Defined Benefit Normal Retirement Age - 60
Early Reduced (.5%) at Age 50 with 25 Years or Age 55 with 15 Years
43 - Non-Union after 09/01/156/1/2017 Day of work defined as 80 Hours a Month for All employees.
12/1/2016 Service Credit Purchase Estimates - Yes
9/1/2015 Day of work defined as 8 Hours a Day for All employees.
9/1/2015 Benefit FAC-5 (5 Year Final Average Compensation)
9/1/2015 Exclude Temporary Employees requiring less than 12 months
9/1/2015 6 Year Vesting
9/1/2015 Benefit B-2
9/1/2015 Participant Contribution Rate 3%
1/21/2005 Covered by Act 88
1/1/2005 Fiscal Month - January
Defined Benefit Normal Retirement Age - 60
Early Reduced (.5%) at Age 50 with 25 Years or Age 55 with 15 Years
Page 155 of 229
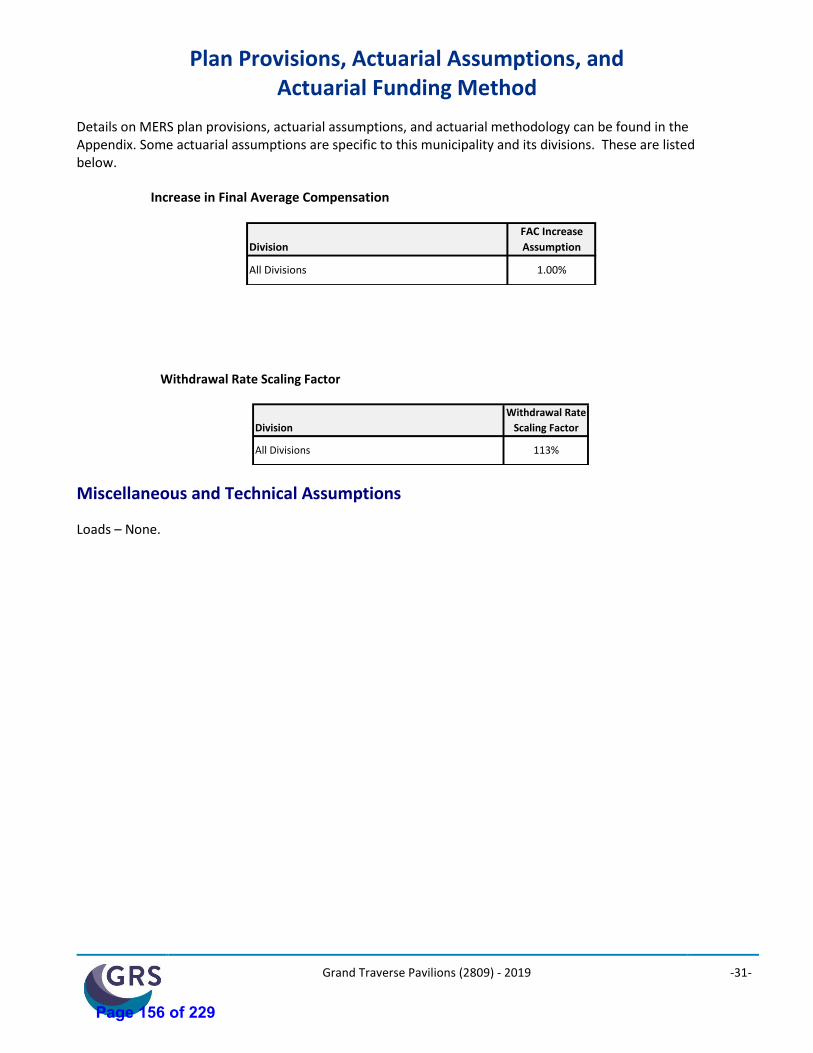
Grand Traverse Pavilions (2809) - 2019 -31-
Plan Provisions, Actuarial Assumptions, and Actuarial Funding Method
Details on MERS plan provisions, actuarial assumptions, and actuarial methodology can be found in the Appendix. Some actuarial assumptions are specific to this municipality and its divisions. These are listed below.
Increase in Final Average Compensation
FAC Increase
Assumption
1.00%
Division
All Divisions
Withdrawal Rate Scaling Factor
Withdrawal Rate
Scaling Factor
113%
Division
All Divisions
Miscellaneous and Technical Assumptions
Loads – None.
Page 156 of 229
Grand Traverse Pavilions (2809) - 2019 -32-
Risk Commentary
Determination of the accrued liability, the employer contribution, and the funded ratio requires the use of assumptions regarding future economic and demographic experience. Risk measures, as illustrated in this report, are intended to aid in the understanding of the effects of future experience differing from the assumptions used in the course of the actuarial valuation. Risk measures may also help with illustrating the potential volatility in the accrued liability, the actuarially determined contribution and the funded ratio that result from the differences between actual experience and the actuarial assumptions. Future actuarial measurements may differ significantly from the current measurements presented in this report due to such factors as the following: plan experience differing from that anticipated by the economic or demographic assumptions; changes in economic or demographic assumptions due to changing conditions; increases or decreases expected as part of the natural operation of the methodology used for these measurements (such as the end of an amortization period, or additional cost or contribution requirements based on the Plan’s funded status); and changes in plan provisions or applicable law. The scope of an actuarial valuation does not include an analysis of the potential range of such future measurements. Examples of risk that may reasonably be anticipated to significantly affect the plan’s future financial condition include:
• Investment Risk – actual investment returns may differ from the expected returns;
• Asset/Liability Mismatch – changes in asset values may not match changes in liabilities, thereby altering the gap between the accrued liability and assets and consequently altering the funded status and contribution requirements;
• Salary and Payroll Risk – actual salaries and total payroll may differ from expected, resulting in actual future accrued liability and contributions differing from expected;
• Longevity Risk – members may live longer or shorter than expected and receive pensions for a period of time other than assumed; and
• Other Demographic Risks – members may terminate, retire or become disabled at times or with benefits other than assumed resulting in actual future accrued liability and contributions differing from expected.
The effects of certain trends in experience can generally be anticipated. For example, if the investment return since the most recent actuarial valuation is less (or more) than the assumed rate, the cost of the plan can be expected to increase (or decrease). Likewise, if longevity is improving (or worsening), increases (or decreases) in cost can be anticipated.
Page 157 of 229
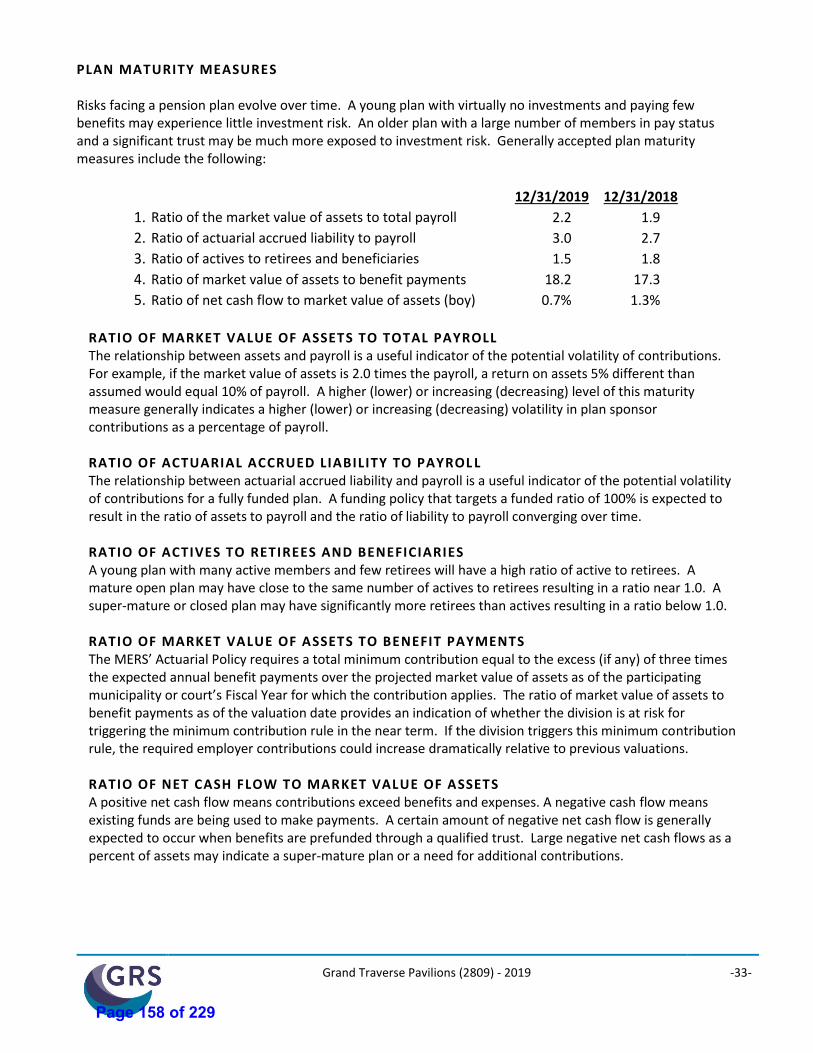
Grand Traverse Pavilions (2809) - 2019 -33-
PLAN MATURITY MEASURES Risks facing a pension plan evolve over time. A young plan with virtually no investments and paying few benefits may experience little investment risk. An older plan with a large number of members in pay status and a significant trust may be much more exposed to investment risk. Generally accepted plan maturity measures include the following:
12/31/2019 12/31/2018
1. Ratio of the market value of assets to total payroll 2.2 1.9
2. Ratio of actuarial accrued liability to payroll 3.0 2.7
3. Ratio of actives to retirees and beneficiaries 1.5 1.8
4. Ratio of market value of assets to benefit payments 18.2 17.3
5. Ratio of net cash flow to market value of assets (boy) 0.7% 1.3%
RATIO OF MARKET VALUE OF ASSETS TO TOTAL PAYROLL The relationship between assets and payroll is a useful indicator of the potential volatility of contributions. For example, if the market value of assets is 2.0 times the payroll, a return on assets 5% different than assumed would equal 10% of payroll. A higher (lower) or increasing (decreasing) level of this maturity measure generally indicates a higher (lower) or increasing (decreasing) volatility in plan sponsor contributions as a percentage of payroll. RATIO OF ACTUARIAL ACCRUED LIABILITY TO PAYROL L The relationship between actuarial accrued liability and payroll is a useful indicator of the potential volatility of contributions for a fully funded plan. A funding policy that targets a funded ratio of 100% is expected to result in the ratio of assets to payroll and the ratio of liability to payroll converging over time. RATIO OF ACTIVES TO RETIREES AND BENEFICIARIES A young plan with many active members and few retirees will have a high ratio of active to retirees. A mature open plan may have close to the same number of actives to retirees resulting in a ratio near 1.0. A super-mature or closed plan may have significantly more retirees than actives resulting in a ratio below 1.0. RATIO OF MARKET VALUE OF ASSETS TO BENEFIT PAYMENTS The MERS’ Actuarial Policy requires a total minimum contribution equal to the excess (if any) of three times the expected annual benefit payments over the projected market value of assets as of the participating municipality or court’s Fiscal Year for which the contribution applies. The ratio of market value of assets to benefit payments as of the valuation date provides an indication of whether the division is at risk for triggering the minimum contribution rule in the near term. If the division triggers this minimum contribution rule, the required employer contributions could increase dramatically relative to previous valuations. RATIO OF NET CASH FLOW TO MARKET VALUE OF ASSETS A positive net cash flow means contributions exceed benefits and expenses. A negative cash flow means existing funds are being used to make payments. A certain amount of negative net cash flow is generally expected to occur when benefits are prefunded through a qualified trust. Large negative net cash flows as a percent of assets may indicate a super-mature plan or a need for additional contributions.
Page 158 of 229
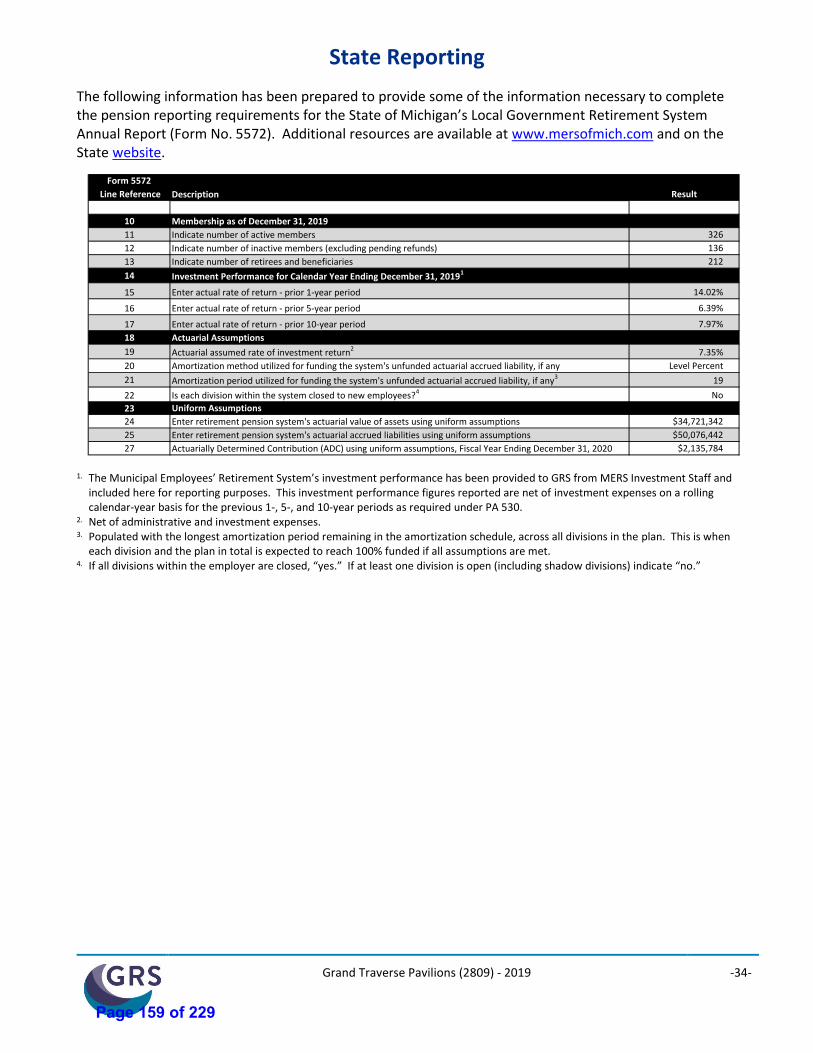
Grand Traverse Pavilions (2809) - 2019 -34-
State Reporting
The following information has been prepared to provide some of the information necessary to complete the pension reporting requirements for the State of Michigan’s Local Government Retirement System Annual Report (Form No. 5572). Additional resources are available at www.mersofmich.com and on the State website.
Form 5572
Line Reference Result
10
11 326
12 136
13 212
14
15 14.02%
16 6.39%
17 7.97%
18
19 7.35%
20 Level Percent
21 19
22 No
23 Uniform Assumptions
24 Enter retirement pension system's actuarial value of assets using uniform assumptions $34,721,342
25 Enter retirement pension system's actuarial accrued liabilities using uniform assumptions $50,076,442
27 Actuarially Determined Contribution (ADC) using uniform assumptions, Fiscal Year Ending December 31, 2020 $2,135,784
Indicate number of inactive members (excluding pending refunds)
Description
Membership as of December 31, 2019
Indicate number of active members
Actuarial assumed rate of investment return2
Amortization method utilized for funding the system's unfunded actuarial accrued liability, if any
Amortization period utilized for funding the system's unfunded actuarial accrued liability, if any3
Is each division within the system closed to new employees?4
Indicate number of retirees and beneficiaries
Investment Performance for Calendar Year Ending December 31, 20191
Enter actual rate of return - prior 1-year period
Enter actual rate of return - prior 5-year period
Enter actual rate of return - prior 10-year period
Actuarial Assumptions
1. The Municipal Employees’ Retirement System’s investment performance has been provided to GRS from MERS Investment Staff and included here for reporting purposes. This investment performance figures reported are net of investment expenses on a rolling calendar-year basis for the previous 1-, 5-, and 10-year periods as required under PA 530.
2. Net of administrative and investment expenses. 3. Populated with the longest amortization period remaining in the amortization schedule, across all divisions in the plan. This is when
each division and the plan in total is expected to reach 100% funded if all assumptions are met. 4. If all divisions within the employer are closed, “yes.” If at least one division is open (including shadow divisions) indicate “no.”
Page 159 of 229

Grand Traverse County – Comprehensive Financial Plan 20
Appendix J Grand Traverse Pavilions Pension Plan Supplemental Actuarial Report Dated September 1, 2020
Page 160 of 229
September 1, 2020
In care of: Municipal Employees’ Retirement System of Michigan 1134 Municipal Way Lansing, Michigan 48917
Re: Grand Traverse Pavilions (2809) – 41, 43 – Projections of Amortization Payment of Unfunded Accrued Liability
The purpose of this letter is to illustrate the pattern of the annual amortization payments to fund the Unfunded Accrued Liability (UAL) as of December 31, 2019, under the amortization policy which would be followed. The results are calculated using a 7.35%, 6.35%, 5.35%, and 6.75% return assumption, all with a 3.00% wage inflation assumption for analysis of application requests to issue Long-Term Securities under PA 575 of 2018. This legislation limits the amount of Unfunded Accrued Liability available for bonding. We recommend consultation with your bond consultant and legal counsel to ensure compliance with this legislation. The report shows these amortization payments of the UAL calculated using both the actuarial value and market value of assets. The report consists of separate sections containing the following additional detail.
• An executive summary that provides a brief explanation of the results.
• Results sections illustrating the pattern in annual amortization payments under the four alternate interest rate scenarios and both the market and actuarial valuation of assets.
• Employer Normal Cost contributions calculated for the Fiscal Year Beginning January 1, 2020, under each alternate interest rate scenario.
This report was prepared at the request of MERS on behalf of the municipality and is intended for use by the municipality and those designated or approved by the municipality. The report may be provided to parties other than the municipality only in its entirety. GRS is not responsible for unauthorized use of this report.
This valuation assumed the continuing ability of the plan sponsor to make the contributions necessary to fund this plan. A determination regarding whether or not the plan sponsor is actually able to do so is outside our scope of expertise and was not performed.
The valuation was based upon information furnished by MERS staff, concerning Retirement System benefits, financial transactions, plan provisions and active members, terminated members, retirees and beneficiaries. We checked for internal reasonability, but did not audit the data. We are not responsible for the accuracy or completeness of the information provided by the municipality and MERS staff.
Page 161 of 229
Municipal Employees’ Retirement System of Michigan September 1, 2020 Page 2
This report does not reflect the recent and still developing impact of COVID-19, which is likely to influence demographic and economic experience, at least in the short-term. We will continue to monitor these developments and their impact on the MERS Defined Benefit and Hybrid plans. Actual experience will be reflected in each subsequent annual valuation, as experience emerges. The estimates from this study should not be used for short term budgeting purposes because the assumptions are designed to be a long-term expectation of future events. These estimates illustrate the long-term pattern of amortization payments under different funding policies. A projection of contribution rates for budgeting purposes would require additional analysis, which is beyond the scope of this study.
The Plan Document Article VI sec. 71 (1)(d), provides the MERS Board with the authority to set actuarial assumptions and methods after consultation with the actuary. This report was prepared using certain assumptions approved by the Board. The MERS Board adopted the actuarial assumptions based on the recommendations of the current and prior actuary. A description of these assumptions and methods can be found as follows:
• Plan Document, v04302020,
• Actuarial Policy, DOC 8062 (2020-06-25), and
• 2019 Appendix to the Annual Actuarial Valuation Report.
On February 27, 2020, the Board adopted new demographic assumptions for use beginning with the December 31, 2020 annual valuation report. These assumptions include a version of the Pub-2010 mortality tables and fully generational mortality improvements with scale MP-2019. Changes resulting from this study will have an impact on the level of calculated employer contributions. The newly adopted demographic assumptions were used in this report.
This report has been prepared by actuaries who have substantial experience valuing public employee retirement systems. To the best of our knowledge, the information contained in this report is accurate and fairly presents the actuarial position of the municipality as of the valuation date. All calculations have been made in conformity with generally accepted actuarial principles and practices and in conformity with the Actuarial Standards of Practice issued by the Actuarial Standards Board.
David T. Kausch and Kurt Dosson are Members of the American Academy of Actuaries (MAAA) and meet the Academy’s Qualification Standards to render the actuarial opinions contained herein.
The signing actuaries are independent of the plan sponsor.
Page 162 of 229
Municipal Employees’ Retirement System of Michigan September 1, 2020 Page 3
If you have any questions or need additional information, please contact your MERS representative at 800-767-MERS.
Sincerely,
David T. Kausch, FSA, EA, FCA, MAAA
Kurt Dosson, ASA, MAAA
Page 163 of 229
Municipal Employees’ Retirement System of Michigan
Table of Contents
Executive Summary ................................................................................................................................................. 1
Supplemental Valuation Results – Division 41 ........................................................................................................ 3
Supplemental Valuation Results – Division 43 ...................................................................................................... 11
Important Comments ............................................................................................................................................ 19
Page 164 of 229

1
EXECUTIVE SUMMARY
Page 165 of 229
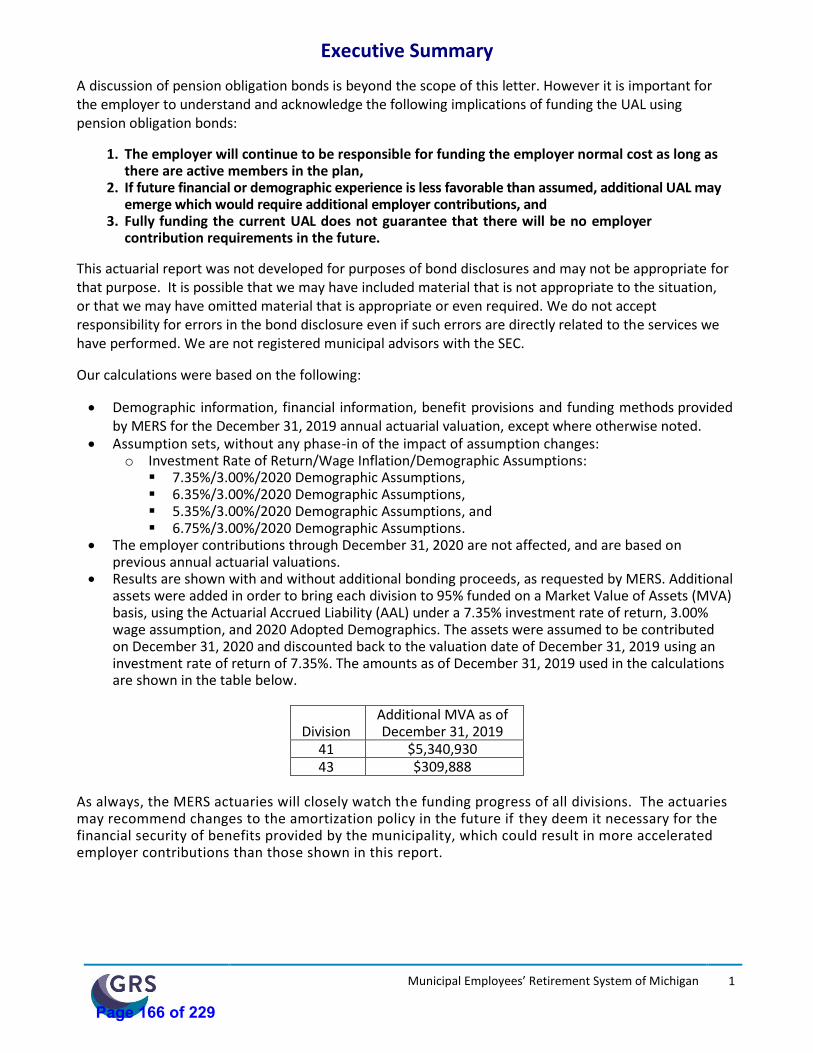
Municipal Employees’ Retirement System of Michigan
1
Executive Summary
A discussion of pension obligation bonds is beyond the scope of this letter. However it is important for the employer to understand and acknowledge the following implications of funding the UAL using pension obligation bonds:
1. The employer will continue to be responsible for funding the employer normal cost as long as there are active members in the plan,
2. If future financial or demographic experience is less favorable than assumed, additional UAL may emerge which would require additional employer contributions, and
3. Fully funding the current UAL does not guarantee that there will be no employer contribution requirements in the future.
This actuarial report was not developed for purposes of bond disclosures and may not be appropriate for that purpose. It is possible that we may have included material that is not appropriate to the situation, or that we may have omitted material that is appropriate or even required. We do not accept responsibility for errors in the bond disclosure even if such errors are directly related to the services we have performed. We are not registered municipal advisors with the SEC.
Our calculations were based on the following:
• Demographic information, financial information, benefit provisions and funding methods provided by MERS for the December 31, 2019 annual actuarial valuation, except where otherwise noted.
• Assumption sets, without any phase-in of the impact of assumption changes: o Investment Rate of Return/Wage Inflation/Demographic Assumptions:
▪ 7.35%/3.00%/2020 Demographic Assumptions, ▪ 6.35%/3.00%/2020 Demographic Assumptions, ▪ 5.35%/3.00%/2020 Demographic Assumptions, and ▪ 6.75%/3.00%/2020 Demographic Assumptions.
• The employer contributions through December 31, 2020 are not affected, and are based on previous annual actuarial valuations.
• Results are shown with and without additional bonding proceeds, as requested by MERS. Additional assets were added in order to bring each division to 95% funded on a Market Value of Assets (MVA) basis, using the Actuarial Accrued Liability (AAL) under a 7.35% investment rate of return, 3.00% wage assumption, and 2020 Adopted Demographics. The assets were assumed to be contributed on December 31, 2020 and discounted back to the valuation date of December 31, 2019 using an investment rate of return of 7.35%. The amounts as of December 31, 2019 used in the calculations are shown in the table below.
Division Additional MVA as of December 31, 2019
41 $5,340,930 43 $309,888
As always, the MERS actuaries will closely watch the funding progress of all divisions. The actuaries may recommend changes to the amortization policy in the future if they deem it necessary for the financial security of benefits provided by the municipality, which could result in more accelerated employer contributions than those shown in this report.
Page 166 of 229
Municipal Employees’ Retirement System of Michigan
2
Issuance of a POB may affect the risk profile of the Plan. Contribution of POB bond proceeds to the plan improves the funded status of the Plan, and also increases the potential for contribution volatility in future annual actuarial valuation reports. At this time, we do not believe additional risk assessment is necessary. Plan maturity risk metrics will be updated in future annual actuarial valuation reports. We projected the annual amortization payments, starting with the amortization periods in effect for the calendar year beginning January 1, 2020, under the amortization policies as amended by the Board on June 25, 2020. Any normal cost payments are in addition to the amortization payment, and are not affected by the amortization policy used. These results are for illustration purposes only. Actual amortization payments will depend on the results of future annual actuarial valuations.
Page 167 of 229

3
SUPPLEMENTAL VALUATION RESULTS – DIVISION 41
Page 168 of 229
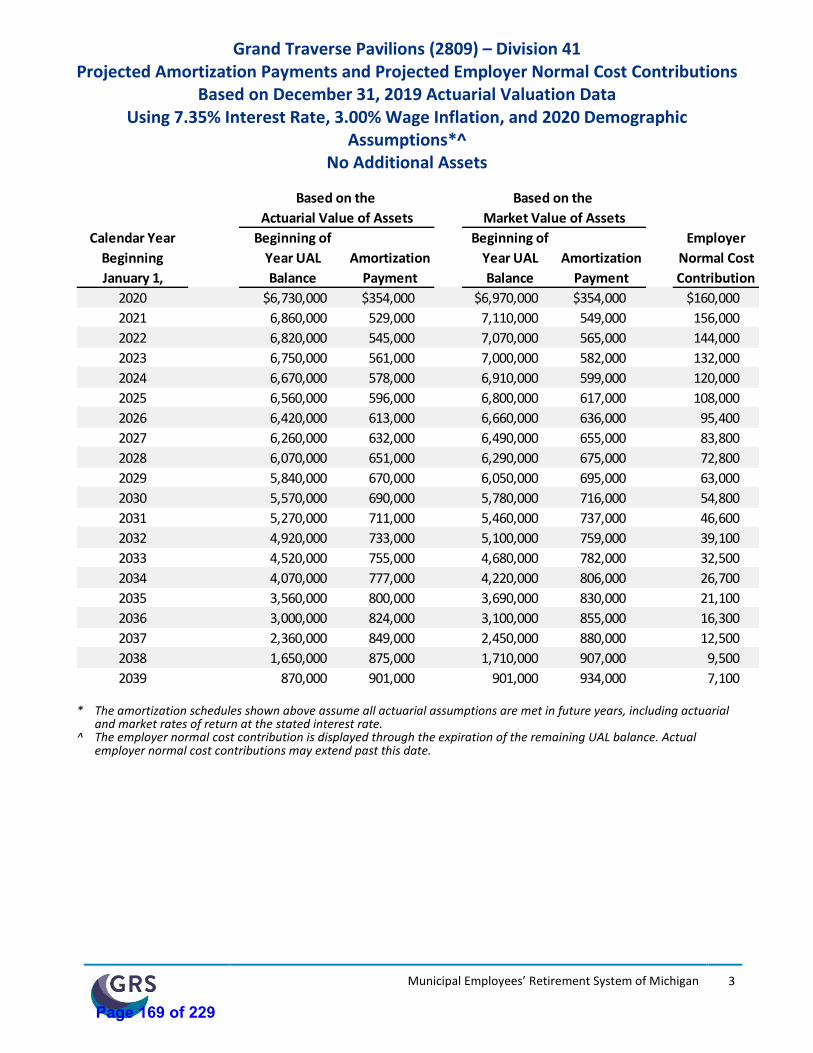
Municipal Employees’ Retirement System of Michigan
3
Grand Traverse Pavilions (2809) – Division 41 Projected Amortization Payments and Projected Employer Normal Cost Contributions
Based on December 31, 2019 Actuarial Valuation Data Using 7.35% Interest Rate, 3.00% Wage Inflation, and 2020 Demographic
Assumptions*^ No Additional Assets
Based on the Based on the
Actuarial Value of Assets Market Value of Assets
Calendar Year Beginning of Beginning of Employer
Beginning Year UAL Amortization Year UAL Amortization Normal Cost
January 1, Balance Payment Balance Payment Contribution
2020 $6,730,000 $354,000 $6,970,000 $354,000 $160,000
2021 6,860,000 529,000 7,110,000 549,000 156,000
2022 6,820,000 545,000 7,070,000 565,000 144,000
2023 6,750,000 561,000 7,000,000 582,000 132,000
2024 6,670,000 578,000 6,910,000 599,000 120,000
2025 6,560,000 596,000 6,800,000 617,000 108,000
2026 6,420,000 613,000 6,660,000 636,000 95,400
2027 6,260,000 632,000 6,490,000 655,000 83,800
2028 6,070,000 651,000 6,290,000 675,000 72,800
2029 5,840,000 670,000 6,050,000 695,000 63,000
2030 5,570,000 690,000 5,780,000 716,000 54,800
2031 5,270,000 711,000 5,460,000 737,000 46,600
2032 4,920,000 733,000 5,100,000 759,000 39,100
2033 4,520,000 755,000 4,680,000 782,000 32,500
2034 4,070,000 777,000 4,220,000 806,000 26,700
2035 3,560,000 800,000 3,690,000 830,000 21,100
2036 3,000,000 824,000 3,100,000 855,000 16,300
2037 2,360,000 849,000 2,450,000 880,000 12,500
2038 1,650,000 875,000 1,710,000 907,000 9,500
2039 870,000 901,000 901,000 934,000 7,100
* The amortization schedules shown above assume all actuarial assumptions are met in future years, including actuarial and market rates of return at the stated interest rate.
^ The employer normal cost contribution is displayed through the expiration of the remaining UAL balance. Actual employer normal cost contributions may extend past this date.
Page 169 of 229
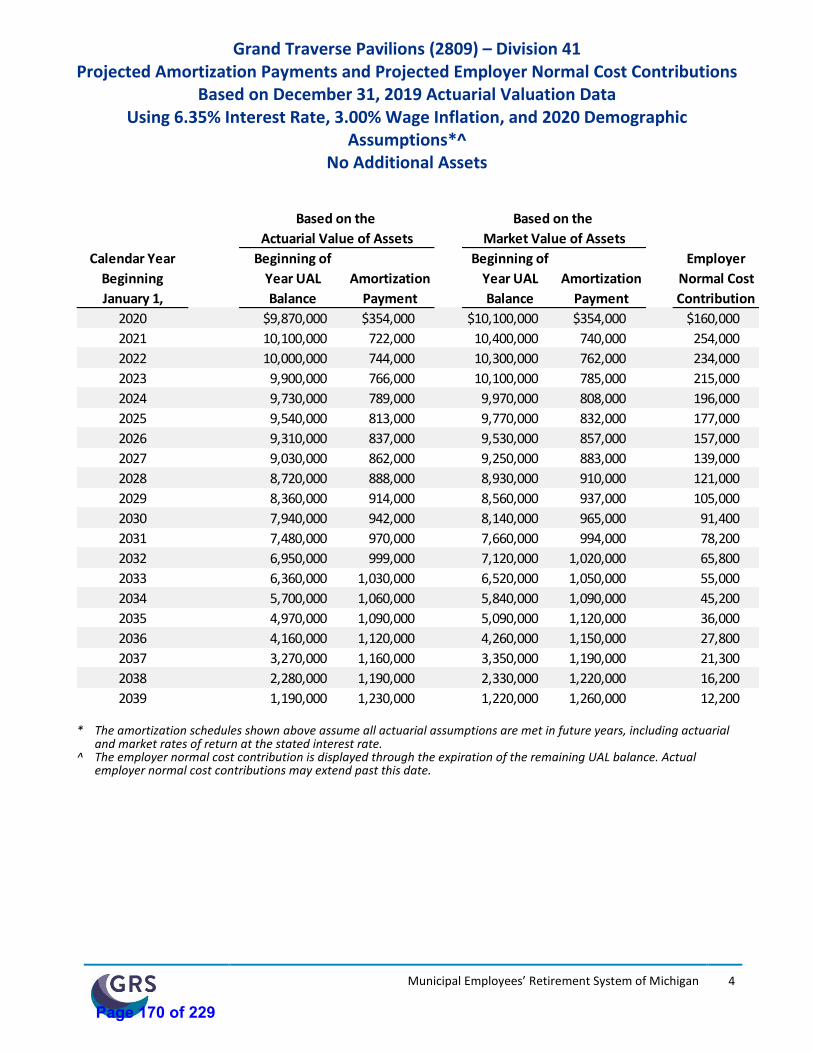
Municipal Employees’ Retirement System of Michigan
4
Grand Traverse Pavilions (2809) – Division 41 Projected Amortization Payments and Projected Employer Normal Cost Contributions
Based on December 31, 2019 Actuarial Valuation Data Using 6.35% Interest Rate, 3.00% Wage Inflation, and 2020 Demographic
Assumptions*^ No Additional Assets
Based on the Based on the
Actuarial Value of Assets Market Value of Assets
Calendar Year Beginning of Beginning of Employer
Beginning Year UAL Amortization Year UAL Amortization Normal Cost
January 1, Balance Payment Balance Payment Contribution
2020 $9,870,000 $354,000 $10,100,000 $354,000 $160,000
2021 10,100,000 722,000 10,400,000 740,000 254,000
2022 10,000,000 744,000 10,300,000 762,000 234,000
2023 9,900,000 766,000 10,100,000 785,000 215,000
2024 9,730,000 789,000 9,970,000 808,000 196,000
2025 9,540,000 813,000 9,770,000 832,000 177,000
2026 9,310,000 837,000 9,530,000 857,000 157,000
2027 9,030,000 862,000 9,250,000 883,000 139,000
2028 8,720,000 888,000 8,930,000 910,000 121,000
2029 8,360,000 914,000 8,560,000 937,000 105,000
2030 7,940,000 942,000 8,140,000 965,000 91,400
2031 7,480,000 970,000 7,660,000 994,000 78,200
2032 6,950,000 999,000 7,120,000 1,020,000 65,800
2033 6,360,000 1,030,000 6,520,000 1,050,000 55,000
2034 5,700,000 1,060,000 5,840,000 1,090,000 45,200
2035 4,970,000 1,090,000 5,090,000 1,120,000 36,000
2036 4,160,000 1,120,000 4,260,000 1,150,000 27,800
2037 3,270,000 1,160,000 3,350,000 1,190,000 21,300
2038 2,280,000 1,190,000 2,330,000 1,220,000 16,200
2039 1,190,000 1,230,000 1,220,000 1,260,000 12,200
* The amortization schedules shown above assume all actuarial assumptions are met in future years, including actuarial and market rates of return at the stated interest rate.
^ The employer normal cost contribution is displayed through the expiration of the remaining UAL balance. Actual employer normal cost contributions may extend past this date.
Page 170 of 229
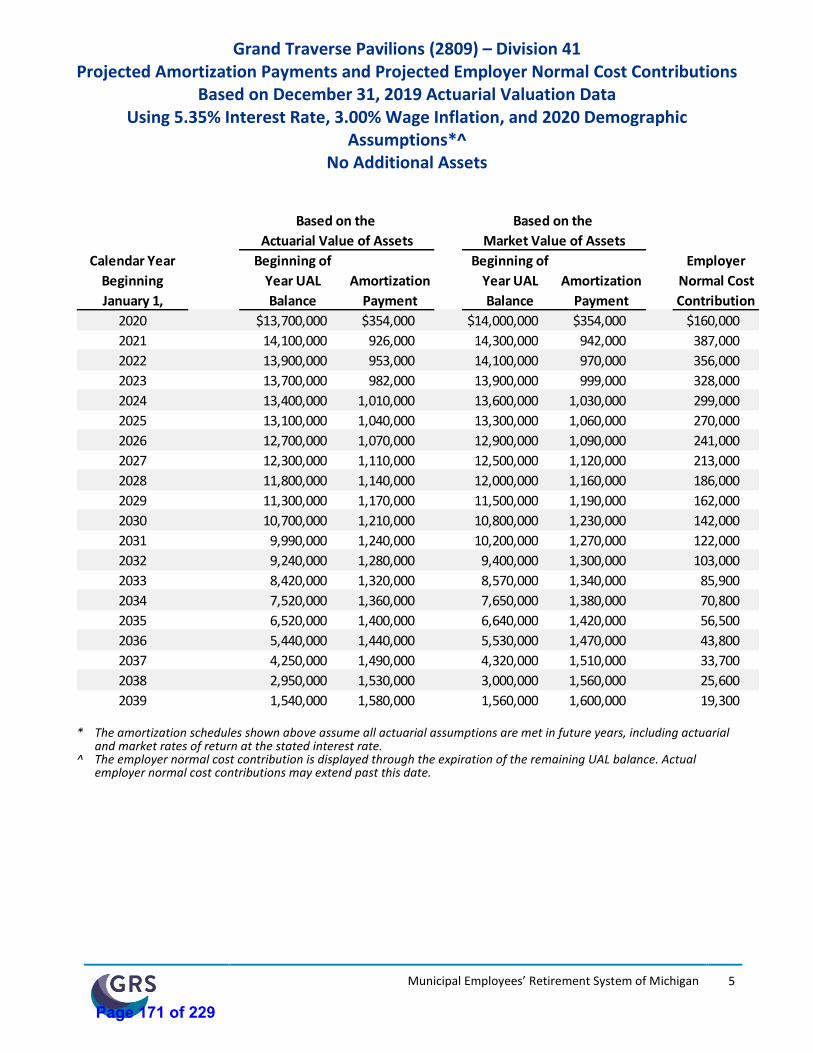
Municipal Employees’ Retirement System of Michigan
5
Grand Traverse Pavilions (2809) – Division 41 Projected Amortization Payments and Projected Employer Normal Cost Contributions
Based on December 31, 2019 Actuarial Valuation Data Using 5.35% Interest Rate, 3.00% Wage Inflation, and 2020 Demographic
Assumptions*^ No Additional Assets
Based on the Based on the
Actuarial Value of Assets Market Value of Assets
Calendar Year Beginning of Beginning of Employer
Beginning Year UAL Amortization Year UAL Amortization Normal Cost
January 1, Balance Payment Balance Payment Contribution
2020 $13,700,000 $354,000 $14,000,000 $354,000 $160,000
2021 14,100,000 926,000 14,300,000 942,000 387,000
2022 13,900,000 953,000 14,100,000 970,000 356,000
2023 13,700,000 982,000 13,900,000 999,000 328,000
2024 13,400,000 1,010,000 13,600,000 1,030,000 299,000
2025 13,100,000 1,040,000 13,300,000 1,060,000 270,000
2026 12,700,000 1,070,000 12,900,000 1,090,000 241,000
2027 12,300,000 1,110,000 12,500,000 1,120,000 213,000
2028 11,800,000 1,140,000 12,000,000 1,160,000 186,000
2029 11,300,000 1,170,000 11,500,000 1,190,000 162,000
2030 10,700,000 1,210,000 10,800,000 1,230,000 142,000
2031 9,990,000 1,240,000 10,200,000 1,270,000 122,000
2032 9,240,000 1,280,000 9,400,000 1,300,000 103,000
2033 8,420,000 1,320,000 8,570,000 1,340,000 85,900
2034 7,520,000 1,360,000 7,650,000 1,380,000 70,800
2035 6,520,000 1,400,000 6,640,000 1,420,000 56,500
2036 5,440,000 1,440,000 5,530,000 1,470,000 43,800
2037 4,250,000 1,490,000 4,320,000 1,510,000 33,700
2038 2,950,000 1,530,000 3,000,000 1,560,000 25,600
2039 1,540,000 1,580,000 1,560,000 1,600,000 19,300
* The amortization schedules shown above assume all actuarial assumptions are met in future years, including actuarial and market rates of return at the stated interest rate.
^ The employer normal cost contribution is displayed through the expiration of the remaining UAL balance. Actual employer normal cost contributions may extend past this date.
Page 171 of 229
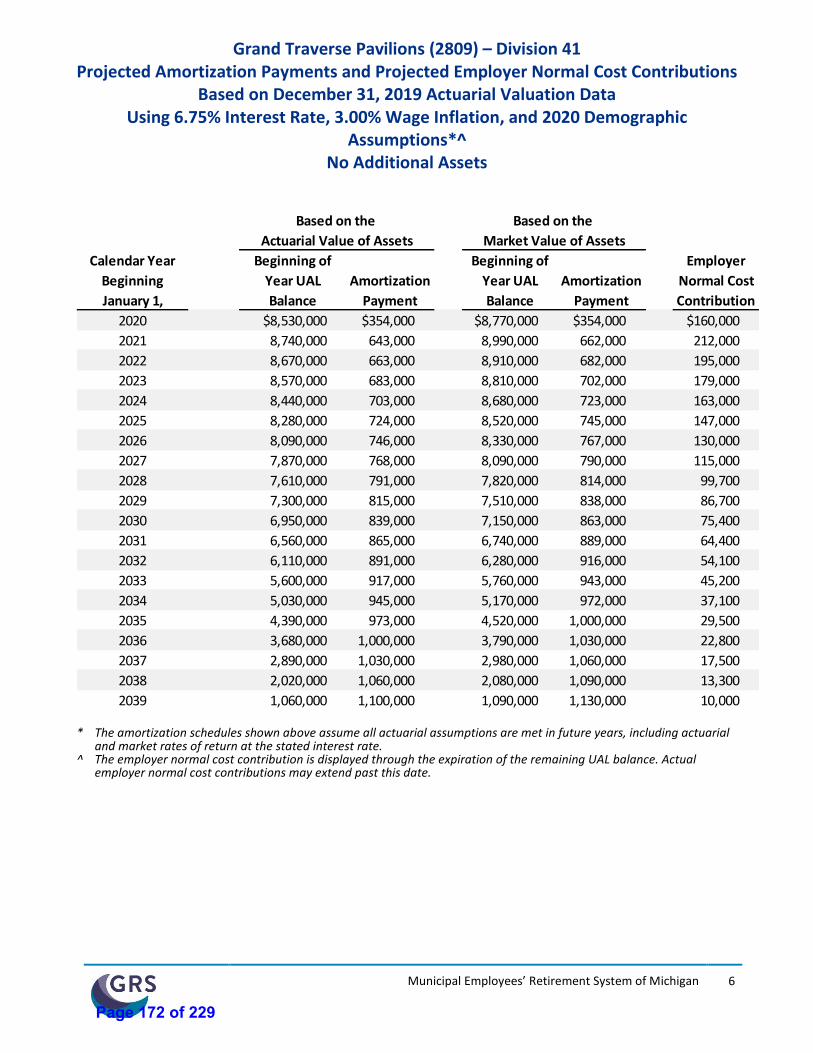
Municipal Employees’ Retirement System of Michigan
6
Grand Traverse Pavilions (2809) – Division 41 Projected Amortization Payments and Projected Employer Normal Cost Contributions
Based on December 31, 2019 Actuarial Valuation Data Using 6.75% Interest Rate, 3.00% Wage Inflation, and 2020 Demographic
Assumptions*^ No Additional Assets
Based on the Based on the
Actuarial Value of Assets Market Value of Assets
Calendar Year Beginning of Beginning of Employer
Beginning Year UAL Amortization Year UAL Amortization Normal Cost
January 1, Balance Payment Balance Payment Contribution
2020 $8,530,000 $354,000 $8,770,000 $354,000 $160,000
2021 8,740,000 643,000 8,990,000 662,000 212,000
2022 8,670,000 663,000 8,910,000 682,000 195,000
2023 8,570,000 683,000 8,810,000 702,000 179,000
2024 8,440,000 703,000 8,680,000 723,000 163,000
2025 8,280,000 724,000 8,520,000 745,000 147,000
2026 8,090,000 746,000 8,330,000 767,000 130,000
2027 7,870,000 768,000 8,090,000 790,000 115,000
2028 7,610,000 791,000 7,820,000 814,000 99,700
2029 7,300,000 815,000 7,510,000 838,000 86,700
2030 6,950,000 839,000 7,150,000 863,000 75,400
2031 6,560,000 865,000 6,740,000 889,000 64,400
2032 6,110,000 891,000 6,280,000 916,000 54,100
2033 5,600,000 917,000 5,760,000 943,000 45,200
2034 5,030,000 945,000 5,170,000 972,000 37,100
2035 4,390,000 973,000 4,520,000 1,000,000 29,500
2036 3,680,000 1,000,000 3,790,000 1,030,000 22,800
2037 2,890,000 1,030,000 2,980,000 1,060,000 17,500
2038 2,020,000 1,060,000 2,080,000 1,090,000 13,300
2039 1,060,000 1,100,000 1,090,000 1,130,000 10,000
* The amortization schedules shown above assume all actuarial assumptions are met in future years, including actuarial and market rates of return at the stated interest rate.
^ The employer normal cost contribution is displayed through the expiration of the remaining UAL balance. Actual employer normal cost contributions may extend past this date.
Page 172 of 229

Municipal Employees’ Retirement System of Michigan
7
Grand Traverse Pavilions (2809) – Division 41 Projected Amortization Payments and Projected Employer Normal Cost Contributions
Based on December 31, 2019 Actuarial Valuation Data Using 7.35% Interest Rate, 3.00% Wage Inflation, and 2020 Demographic
Assumptions*^ With Additional Assets
Based on the Based on the
Actuarial Value of Assets Market Value of Assets
Calendar Year Beginning of Beginning of Employer
Beginning Year UAL Amortization Year UAL Amortization Normal Cost
January 1, Balance Payment Balance Payment Contribution
2020 $1,320,000 $354,000 $1,630,000 $354,000 $160,000
2021 1,050,000 81,200 1,380,000 106,000 156,000
2022 1,050,000 83,700 1,370,000 110,000 144,000
2023 1,040,000 86,200 1,360,000 113,000 132,000
2024 1,020,000 88,800 1,340,000 116,000 120,000
2025 1,010,000 91,400 1,320,000 120,000 108,000
2026 986,000 94,200 1,290,000 123,000 95,400
2027 961,000 97,000 1,260,000 127,000 83,800
2028 931,000 99,900 1,220,000 131,000 72,800
2029 896,000 103,000 1,170,000 135,000 63,000
2030 855,000 106,000 1,120,000 139,000 54,800
2031 808,000 109,000 1,060,000 143,000 46,600
2032 755,000 112,000 988,000 147,000 39,100
2033 694,000 116,000 908,000 152,000 32,500
2034 625,000 119,000 818,000 156,000 26,700
2035 547,000 123,000 716,000 161,000 21,100
2036 460,000 127,000 602,000 166,000 16,300
2037 362,000 130,000 475,000 171,000 12,500
2038 254,000 134,000 333,000 176,000 9,500
2039 133,000 138,000 175,000 181,000 7,100
* The amortization schedules shown above assume all actuarial assumptions are met in future years, including actuarial and market rates of return at the stated interest rate.
^ The employer normal cost contribution is displayed through the expiration of the remaining UAL balance. Actual employer normal cost contributions may extend past this date.
Page 173 of 229
Municipal Employees’ Retirement System of Michigan
8
Grand Traverse Pavilions (2809) – Division 41 Projected Amortization Payments and Projected Employer Normal Cost Contributions
Based on December 31, 2019 Actuarial Valuation Data Using 6.35% Interest Rate, 3.00% Wage Inflation, and 2020 Demographic
Assumptions*^ With Additional Assets
Based on the Based on the
Actuarial Value of Assets Market Value of Assets
Calendar Year Beginning of Beginning of Employer
Beginning Year UAL Amortization Year UAL Amortization Normal Cost
January 1, Balance Payment Balance Payment Contribution
2020 $4,450,000 $354,000 $4,760,000 $354,000 $160,000
2021 4,370,000 312,000 4,700,000 335,000 254,000
2022 4,330,000 321,000 4,650,000 345,000 234,000
2023 4,270,000 331,000 4,590,000 355,000 215,000
2024 4,200,000 341,000 4,510,000 366,000 196,000
2025 4,120,000 351,000 4,420,000 377,000 177,000
2026 4,020,000 361,000 4,310,000 388,000 157,000
2027 3,900,000 372,000 4,190,000 400,000 139,000
2028 3,760,000 383,000 4,040,000 412,000 121,000
2029 3,610,000 395,000 3,870,000 424,000 105,000
2030 3,430,000 407,000 3,680,000 437,000 91,400
2031 3,230,000 419,000 3,470,000 450,000 78,200
2032 3,000,000 431,000 3,220,000 463,000 65,800
2033 2,750,000 444,000 2,950,000 477,000 55,000
2034 2,460,000 458,000 2,640,000 492,000 45,200
2035 2,150,000 471,000 2,310,000 506,000 36,000
2036 1,800,000 486,000 1,930,000 521,000 27,800
2037 1,410,000 500,000 1,510,000 537,000 21,300
2038 983,000 515,000 1,060,000 553,000 16,200
2039 515,000 531,000 553,000 570,000 12,200
* The amortization schedules shown above assume all actuarial assumptions are met in future years, including actuarial and market rates of return at the stated interest rate.
^ The employer normal cost contribution is displayed through the expiration of the remaining UAL balance. Actual employer normal cost contributions may extend past this date.
Page 174 of 229
Municipal Employees’ Retirement System of Michigan
9
Grand Traverse Pavilions (2809) – Division 41 Projected Amortization Payments and Projected Employer Normal Cost Contributions
Based on December 31, 2019 Actuarial Valuation Data Using 5.35% Interest Rate, 3.00% Wage Inflation, and 2020 Demographic
Assumptions*^ With Additional Assets
Based on the Based on the
Actuarial Value of Assets Market Value of Assets
Calendar Year Beginning of Beginning of Employer
Beginning Year UAL Amortization Year UAL Amortization Normal Cost
January 1, Balance Payment Balance Payment Contribution
2020 $8,310,000 $354,000 $8,620,000 $354,000 $160,000
2021 8,400,000 551,000 8,720,000 572,000 387,000
2022 8,280,000 568,000 8,590,000 590,000 356,000
2023 8,140,000 585,000 8,450,000 607,000 328,000
2024 7,970,000 602,000 8,280,000 625,000 299,000
2025 7,780,000 621,000 8,080,000 644,000 270,000
2026 7,560,000 639,000 7,850,000 664,000 241,000
2027 7,310,000 658,000 7,590,000 683,000 213,000
2028 7,020,000 678,000 7,290,000 704,000 186,000
2029 6,700,000 698,000 6,960,000 725,000 162,000
2030 6,350,000 719,000 6,590,000 747,000 142,000
2031 5,950,000 741,000 6,170,000 769,000 122,000
2032 5,500,000 763,000 5,710,000 792,000 103,000
2033 5,020,000 786,000 5,210,000 816,000 85,900
2034 4,480,000 810,000 4,650,000 841,000 70,800
2035 3,890,000 834,000 4,030,000 866,000 56,500
2036 3,240,000 859,000 3,360,000 892,000 43,800
2037 2,530,000 885,000 2,630,000 918,000 33,700
2038 1,760,000 911,000 1,820,000 946,000 25,600
2039 915,000 939,000 949,000 974,000 19,300
* The amortization schedules shown above assume all actuarial assumptions are met in future years, including actuarial and market rates of return at the stated interest rate.
^ The employer normal cost contribution is displayed through the expiration of the remaining UAL balance. Actual employer normal cost contributions may extend past this date.
Page 175 of 229
Municipal Employees’ Retirement System of Michigan
10
Grand Traverse Pavilions (2809) – Division 41 Projected Amortization Payments and Projected Employer Normal Cost Contributions
Based on December 31, 2019 Actuarial Valuation Data Using 6.75% Interest Rate, 3.00% Wage Inflation, and 2020 Demographic
Assumptions*^ With Additional Assets
Based on the Based on the
Actuarial Value of Assets Market Value of Assets
Calendar Year Beginning of Beginning of Employer
Beginning Year UAL Amortization Year UAL Amortization Normal Cost
January 1, Balance Payment Balance Payment Contribution
2020 $3,120,000 $354,000 $3,420,000 $354,000 $160,000
2021 2,970,000 218,000 3,290,000 242,000 212,000
2022 2,940,000 225,000 3,260,000 249,000 195,000
2023 2,910,000 232,000 3,220,000 257,000 179,000
2024 2,860,000 238,000 3,180,000 265,000 163,000
2025 2,810,000 246,000 3,120,000 272,000 147,000
2026 2,750,000 253,000 3,050,000 281,000 130,000
2027 2,670,000 261,000 2,960,000 289,000 115,000
2028 2,580,000 268,000 2,860,000 298,000 99,700
2029 2,480,000 276,000 2,750,000 307,000 86,700
2030 2,360,000 285,000 2,620,000 316,000 75,400
2031 2,220,000 293,000 2,470,000 325,000 64,400
2032 2,070,000 302,000 2,300,000 335,000 54,100
2033 1,900,000 311,000 2,110,000 345,000 45,200
2034 1,710,000 320,000 1,890,000 356,000 37,100
2035 1,490,000 330,000 1,650,000 366,000 29,500
2036 1,250,000 340,000 1,390,000 377,000 22,800
2037 982,000 350,000 1,090,000 389,000 17,500
2038 686,000 361,000 761,000 400,000 13,300
2039 360,000 372,000 399,000 412,000 10,000
* The amortization schedules shown above assume all actuarial assumptions are met in future years, including actuarial and market rates of return at the stated interest rate.
^ The employer normal cost contribution is displayed through the expiration of the remaining UAL balance. Actual employer normal cost contributions may extend past this date.
Page 176 of 229
11
SUPPLEMENTAL VALUATION RESULTS – DIVISION 43
Page 177 of 229

Municipal Employees’ Retirement System of Michigan
11
Grand Traverse Pavilions (2809) – Division 43 Projected Amortization Payments and Projected Employer Normal Cost Contributions
Based on December 31, 2019 Actuarial Valuation Data Using 7.35% Interest Rate, 3.00% Wage Inflation, and 2020 Demographic
Assumptions*^ No Additional Assets
Based on the Based on the
Actuarial Value of Assets Market Value of Assets
Calendar Year Beginning of Beginning of Employer
Beginning Year UAL Amortization Year UAL Amortization Normal Cost
January 1, Balance Payment Balance Payment Contribution
2020 $395,000 $25,700 $410,000 $25,700 $161,000
2021 398,000 30,700 414,000 31,900 136,000
2022 395,000 31,600 411,000 32,900 128,000
2023 391,000 32,500 407,000 33,900 123,000
2024 387,000 33,500 402,000 34,900 118,000
2025 380,000 34,500 396,000 35,900 113,000
2026 372,000 35,600 387,000 37,000 107,000
2027 363,000 36,600 378,000 38,100 101,000
2028 352,000 37,700 366,000 39,300 94,600
2029 338,000 38,900 352,000 40,400 88,700
2030 323,000 40,000 336,000 41,600 83,400
2031 305,000 41,200 318,000 42,900 79,000
2032 285,000 42,500 297,000 44,200 75,300
2033 262,000 43,700 273,000 45,500 71,700
2034 236,000 45,000 245,000 46,900 68,000
2035 206,000 46,400 215,000 48,300 64,200
2036 174,000 47,800 181,000 49,700 60,400
2037 137,000 49,200 142,000 51,200 56,700
2038 95,900 50,700 99,800 52,800 53,000
2039 50,400 52,200 52,500 54,300 49,700
* The amortization schedules shown above assume all actuarial assumptions are met in future years, including actuarial
and market rates of return at the stated interest rate. ^ The employer normal cost contribution is displayed through the expiration of the remaining UAL balance. Actual
employer normal cost contributions may extend past this date.
Page 178 of 229
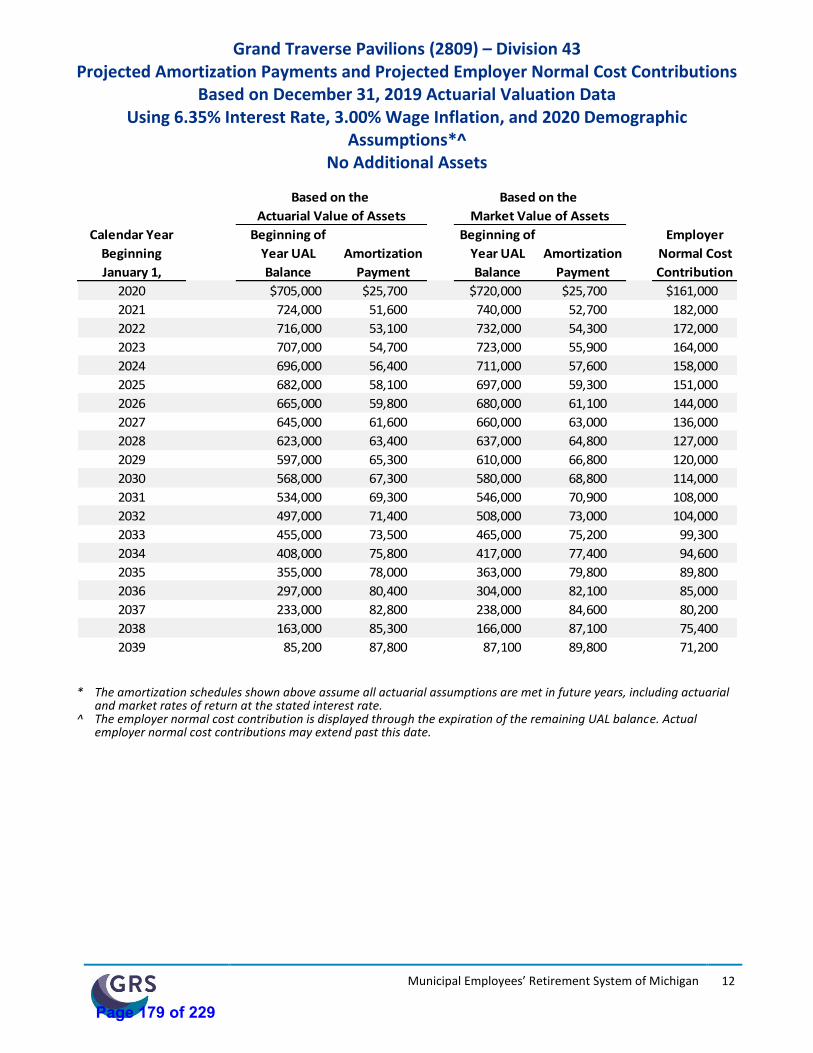
Municipal Employees’ Retirement System of Michigan
12
Grand Traverse Pavilions (2809) – Division 43 Projected Amortization Payments and Projected Employer Normal Cost Contributions
Based on December 31, 2019 Actuarial Valuation Data Using 6.35% Interest Rate, 3.00% Wage Inflation, and 2020 Demographic
Assumptions*^ No Additional Assets
Based on the Based on the
Actuarial Value of Assets Market Value of Assets
Calendar Year Beginning of Beginning of Employer
Beginning Year UAL Amortization Year UAL Amortization Normal Cost
January 1, Balance Payment Balance Payment Contribution
2020 $705,000 $25,700 $720,000 $25,700 $161,000
2021 724,000 51,600 740,000 52,700 182,000
2022 716,000 53,100 732,000 54,300 172,000
2023 707,000 54,700 723,000 55,900 164,000
2024 696,000 56,400 711,000 57,600 158,000
2025 682,000 58,100 697,000 59,300 151,000
2026 665,000 59,800 680,000 61,100 144,000
2027 645,000 61,600 660,000 63,000 136,000
2028 623,000 63,400 637,000 64,800 127,000
2029 597,000 65,300 610,000 66,800 120,000
2030 568,000 67,300 580,000 68,800 114,000
2031 534,000 69,300 546,000 70,900 108,000
2032 497,000 71,400 508,000 73,000 104,000
2033 455,000 73,500 465,000 75,200 99,300
2034 408,000 75,800 417,000 77,400 94,600
2035 355,000 78,000 363,000 79,800 89,800
2036 297,000 80,400 304,000 82,100 85,000
2037 233,000 82,800 238,000 84,600 80,200
2038 163,000 85,300 166,000 87,100 75,400
2039 85,200 87,800 87,100 89,800 71,200
* The amortization schedules shown above assume all actuarial assumptions are met in future years, including actuarial
and market rates of return at the stated interest rate. ^ The employer normal cost contribution is displayed through the expiration of the remaining UAL balance. Actual
employer normal cost contributions may extend past this date.
Page 179 of 229
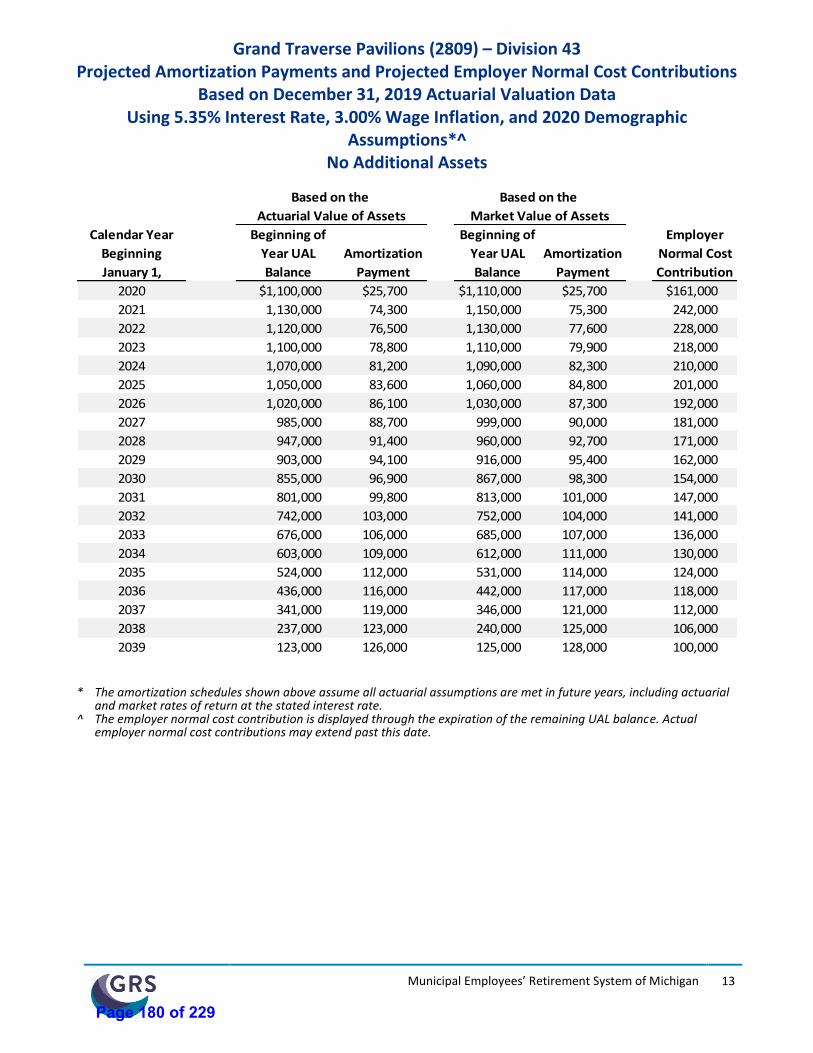
Municipal Employees’ Retirement System of Michigan
13
Grand Traverse Pavilions (2809) – Division 43 Projected Amortization Payments and Projected Employer Normal Cost Contributions
Based on December 31, 2019 Actuarial Valuation Data Using 5.35% Interest Rate, 3.00% Wage Inflation, and 2020 Demographic
Assumptions*^ No Additional Assets
Based on the Based on the
Actuarial Value of Assets Market Value of Assets
Calendar Year Beginning of Beginning of Employer
Beginning Year UAL Amortization Year UAL Amortization Normal Cost
January 1, Balance Payment Balance Payment Contribution
2020 $1,100,000 $25,700 $1,110,000 $25,700 $161,000
2021 1,130,000 74,300 1,150,000 75,300 242,000
2022 1,120,000 76,500 1,130,000 77,600 228,000
2023 1,100,000 78,800 1,110,000 79,900 218,000
2024 1,070,000 81,200 1,090,000 82,300 210,000
2025 1,050,000 83,600 1,060,000 84,800 201,000
2026 1,020,000 86,100 1,030,000 87,300 192,000
2027 985,000 88,700 999,000 90,000 181,000
2028 947,000 91,400 960,000 92,700 171,000
2029 903,000 94,100 916,000 95,400 162,000
2030 855,000 96,900 867,000 98,300 154,000
2031 801,000 99,800 813,000 101,000 147,000
2032 742,000 103,000 752,000 104,000 141,000
2033 676,000 106,000 685,000 107,000 136,000
2034 603,000 109,000 612,000 111,000 130,000
2035 524,000 112,000 531,000 114,000 124,000
2036 436,000 116,000 442,000 117,000 118,000
2037 341,000 119,000 346,000 121,000 112,000
2038 237,000 123,000 240,000 125,000 106,000
2039 123,000 126,000 125,000 128,000 100,000
* The amortization schedules shown above assume all actuarial assumptions are met in future years, including actuarial
and market rates of return at the stated interest rate. ^ The employer normal cost contribution is displayed through the expiration of the remaining UAL balance. Actual
employer normal cost contributions may extend past this date.
Page 180 of 229

Municipal Employees’ Retirement System of Michigan
14
Grand Traverse Pavilions (2809) – Division 43 Projected Amortization Payments and Projected Employer Normal Cost Contributions
Based on December 31, 2019 Actuarial Valuation Data Using 6.75% Interest Rate, 3.00% Wage Inflation, and 2020 Demographic
Assumptions*^ No Additional Assets
Based on the Based on the
Actuarial Value of Assets Market Value of Assets
Calendar Year Beginning of Beginning of Employer
Beginning Year UAL Amortization Year UAL Amortization Normal Cost
January 1, Balance Payment Balance Payment Contribution
2020 $572,000 $25,700 $588,000 $25,700 $161,000
2021 585,000 43,000 601,000 44,200 162,000
2022 580,000 44,300 596,000 45,500 153,000
2023 573,000 45,600 589,000 46,900 146,000
2024 564,000 47,000 580,000 48,300 141,000
2025 554,000 48,400 569,000 49,800 135,000
2026 541,000 49,900 556,000 51,200 128,000
2027 526,000 51,400 541,000 52,800 121,000
2028 509,000 52,900 523,000 54,400 113,000
2029 488,000 54,500 502,000 56,000 106,000
2030 465,000 56,100 478,000 57,700 101,000
2031 438,000 57,800 450,000 59,400 95,500
2032 408,000 59,600 420,000 61,200 91,300
2033 374,000 61,300 385,000 63,000 87,300
2034 336,000 63,200 345,000 64,900 83,100
2035 294,000 65,100 302,000 66,900 78,700
2036 246,000 67,000 253,000 68,900 74,300
2037 194,000 69,000 199,000 70,900 69,900
2038 135,000 71,100 139,000 73,100 65,700
2039 70,900 73,200 72,800 75,300 61,800
* The amortization schedules shown above assume all actuarial assumptions are met in future years, including actuarial
and market rates of return at the stated interest rate. ^ The employer normal cost contribution is displayed through the expiration of the remaining UAL balance. Actual
employer normal cost contributions may extend past this date.
Page 181 of 229
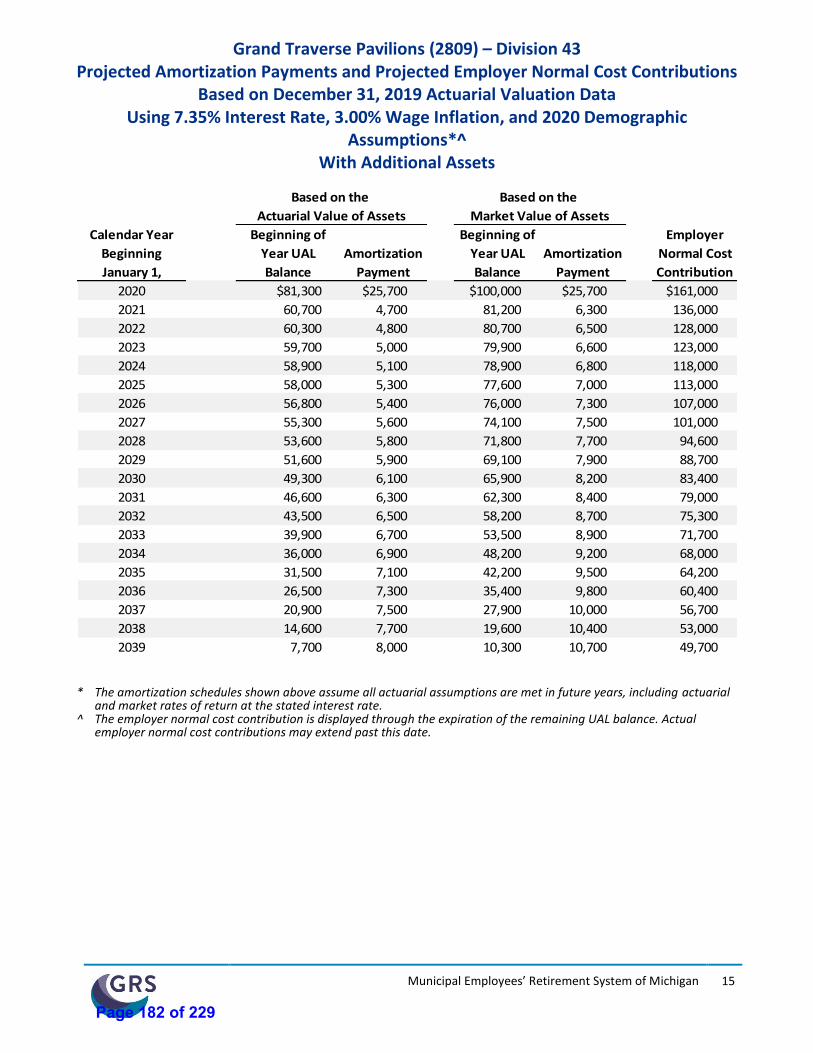
Municipal Employees’ Retirement System of Michigan
15
Grand Traverse Pavilions (2809) – Division 43 Projected Amortization Payments and Projected Employer Normal Cost Contributions
Based on December 31, 2019 Actuarial Valuation Data Using 7.35% Interest Rate, 3.00% Wage Inflation, and 2020 Demographic
Assumptions*^ With Additional Assets
Based on the Based on the
Actuarial Value of Assets Market Value of Assets
Calendar Year Beginning of Beginning of Employer
Beginning Year UAL Amortization Year UAL Amortization Normal Cost
January 1, Balance Payment Balance Payment Contribution
2020 $81,300 $25,700 $100,000 $25,700 $161,000
2021 60,700 4,700 81,200 6,300 136,000
2022 60,300 4,800 80,700 6,500 128,000
2023 59,700 5,000 79,900 6,600 123,000
2024 58,900 5,100 78,900 6,800 118,000
2025 58,000 5,300 77,600 7,000 113,000
2026 56,800 5,400 76,000 7,300 107,000
2027 55,300 5,600 74,100 7,500 101,000
2028 53,600 5,800 71,800 7,700 94,600
2029 51,600 5,900 69,100 7,900 88,700
2030 49,300 6,100 65,900 8,200 83,400
2031 46,600 6,300 62,300 8,400 79,000
2032 43,500 6,500 58,200 8,700 75,300
2033 39,900 6,700 53,500 8,900 71,700
2034 36,000 6,900 48,200 9,200 68,000
2035 31,500 7,100 42,200 9,500 64,200
2036 26,500 7,300 35,400 9,800 60,400
2037 20,900 7,500 27,900 10,000 56,700
2038 14,600 7,700 19,600 10,400 53,000
2039 7,700 8,000 10,300 10,700 49,700
* The amortization schedules shown above assume all actuarial assumptions are met in future years, including actuarial
and market rates of return at the stated interest rate. ^ The employer normal cost contribution is displayed through the expiration of the remaining UAL balance. Actual
employer normal cost contributions may extend past this date.
Page 182 of 229

Municipal Employees’ Retirement System of Michigan
16
Grand Traverse Pavilions (2809) – Division 43 Projected Amortization Payments and Projected Employer Normal Cost Contributions
Based on December 31, 2019 Actuarial Valuation Data Using 6.35% Interest Rate, 3.00% Wage Inflation, and 2020 Demographic
Assumptions*^ With Additional Assets
Based on the Based on the
Actuarial Value of Assets Market Value of Assets
Calendar Year Beginning of Beginning of Employer
Beginning Year UAL Amortization Year UAL Amortization Normal Cost
January 1, Balance Payment Balance Payment Contribution
2020 $391,000 $25,700 $410,000 $25,700 $161,000
2021 390,000 27,800 410,000 29,200 182,000
2022 386,000 28,600 406,000 30,100 172,000
2023 381,000 29,500 401,000 31,000 164,000
2024 375,000 30,400 394,000 31,900 158,000
2025 367,000 31,300 386,000 32,900 151,000
2026 358,000 32,200 377,000 33,900 144,000
2027 348,000 33,200 366,000 34,900 136,000
2028 335,000 34,200 353,000 36,000 127,000
2029 322,000 35,200 338,000 37,000 120,000
2030 306,000 36,200 322,000 38,100 114,000
2031 288,000 37,300 303,000 39,300 108,000
2032 267,000 38,500 281,000 40,500 104,000
2033 245,000 39,600 258,000 41,700 99,300
2034 219,000 40,800 231,000 42,900 94,600
2035 191,000 42,000 201,000 44,200 89,800
2036 160,000 43,300 169,000 45,500 85,000
2037 126,000 44,600 132,000 46,900 80,200
2038 87,700 45,900 92,200 48,300 75,400
2039 45,900 47,300 48,300 49,800 71,200
* The amortization schedules shown above assume all actuarial assumptions are met in future years, including actuarial
and market rates of return at the stated interest rate. ^ The employer normal cost contribution is displayed through the expiration of the remaining UAL balance. Actual
employer normal cost contributions may extend past this date.
Page 183 of 229

Municipal Employees’ Retirement System of Michigan
17
Grand Traverse Pavilions (2809) – Division 43 Projected Amortization Payments and Projected Employer Normal Cost Contributions
Based on December 31, 2019 Actuarial Valuation Data Using 5.35% Interest Rate, 3.00% Wage Inflation, and 2020 Demographic
Assumptions*^ With Additional Assets
Based on the Based on the
Actuarial Value of Assets Market Value of Assets
Calendar Year Beginning of Beginning of Employer
Beginning Year UAL Amortization Year UAL Amortization Normal Cost
January 1, Balance Payment Balance Payment Contribution
2020 $785,000 $25,700 $804,000 $25,700 $161,000
2021 801,000 52,600 821,000 53,900 242,000
2022 789,000 54,200 809,000 55,500 228,000
2023 776,000 55,800 796,000 57,200 218,000
2024 760,000 57,400 779,000 58,900 210,000
2025 742,000 59,200 761,000 60,700 201,000
2026 721,000 60,900 739,000 62,500 192,000
2027 697,000 62,800 715,000 64,400 181,000
2028 670,000 64,700 687,000 66,300 171,000
2029 639,000 66,600 655,000 68,300 162,000
2030 605,000 68,600 620,000 70,300 154,000
2031 567,000 70,700 581,000 72,400 147,000
2032 525,000 72,800 538,000 74,600 141,000
2033 478,000 75,000 490,000 76,800 136,000
2034 427,000 77,200 438,000 79,200 130,000
2035 371,000 79,500 380,000 81,500 124,000
2036 309,000 81,900 316,000 84,000 118,000
2037 241,000 84,400 247,000 86,500 112,000
2038 167,000 86,900 172,000 89,100 106,000
2039 87,200 89,500 89,400 91,800 100,000
* The amortization schedules shown above assume all actuarial assumptions are met in future years, including actuarial
and market rates of return at the stated interest rate. ^ The employer normal cost contribution is displayed through the expiration of the remaining UAL balance. Actual
employer normal cost contributions may extend past this date.
Page 184 of 229
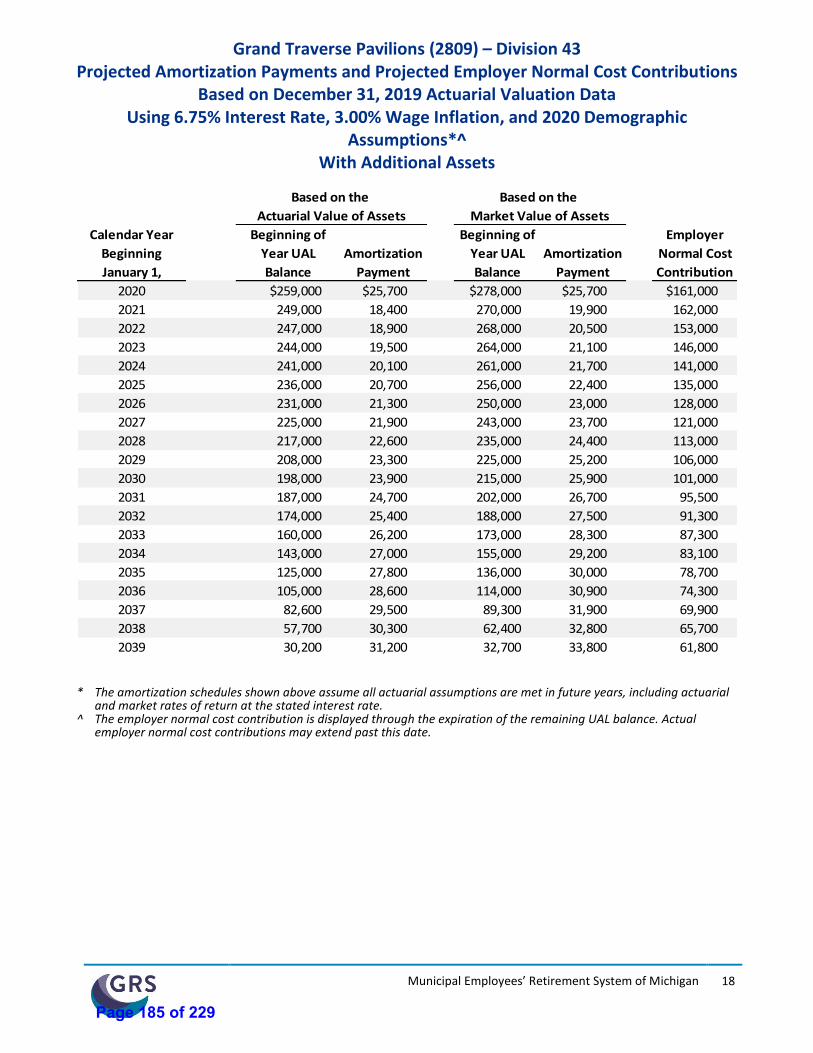
Municipal Employees’ Retirement System of Michigan
18
Grand Traverse Pavilions (2809) – Division 43 Projected Amortization Payments and Projected Employer Normal Cost Contributions
Based on December 31, 2019 Actuarial Valuation Data Using 6.75% Interest Rate, 3.00% Wage Inflation, and 2020 Demographic
Assumptions*^ With Additional Assets
Based on the Based on the
Actuarial Value of Assets Market Value of Assets
Calendar Year Beginning of Beginning of Employer
Beginning Year UAL Amortization Year UAL Amortization Normal Cost
January 1, Balance Payment Balance Payment Contribution
2020 $259,000 $25,700 $278,000 $25,700 $161,000
2021 249,000 18,400 270,000 19,900 162,000
2022 247,000 18,900 268,000 20,500 153,000
2023 244,000 19,500 264,000 21,100 146,000
2024 241,000 20,100 261,000 21,700 141,000
2025 236,000 20,700 256,000 22,400 135,000
2026 231,000 21,300 250,000 23,000 128,000
2027 225,000 21,900 243,000 23,700 121,000
2028 217,000 22,600 235,000 24,400 113,000
2029 208,000 23,300 225,000 25,200 106,000
2030 198,000 23,900 215,000 25,900 101,000
2031 187,000 24,700 202,000 26,700 95,500
2032 174,000 25,400 188,000 27,500 91,300
2033 160,000 26,200 173,000 28,300 87,300
2034 143,000 27,000 155,000 29,200 83,100
2035 125,000 27,800 136,000 30,000 78,700
2036 105,000 28,600 114,000 30,900 74,300
2037 82,600 29,500 89,300 31,900 69,900
2038 57,700 30,300 62,400 32,800 65,700
2039 30,200 31,200 32,700 33,800 61,800
* The amortization schedules shown above assume all actuarial assumptions are met in future years, including actuarial
and market rates of return at the stated interest rate. ^ The employer normal cost contribution is displayed through the expiration of the remaining UAL balance. Actual
employer normal cost contributions may extend past this date.
Page 185 of 229

19
IMPORTANT COMMENTS
Page 186 of 229
Municipal Employees’ Retirement System of Michigan
19
Important Comments
1. The actuarial value of assets used to determine both the funded ratio and the required employer contribution is based on a smoothed value of assets. Only a portion of each year’s investment market gain or loss is recognized in the current actuarial value of assets; the remaining portions of gains and losses will be reflected in future years’ actuarial value of assets. This reduces the asset volatility impact on the determined required employer contribution and funded ratio. The smoothed actuarial rate of return for 2019 was 4.77%.
As of December 31, 2019, the actuarial value of assets is 101% of market value. This means that there is a net outstanding asset loss that is not yet recognized in the actuarial value of assets. Absent future asset gains offsetting the net outstanding asset loss, the net outstanding asset loss will be recognized in future actuarial valuations and is expected to decrease funded ratios and increase employer contribution requirements.
2. Unless otherwise indicated, a funded status measurement is based upon the actuarial accrued liability
and the actuarial value of assets. The measurement is:
a. Inappropriate for assessing the sufficiency of plan assets to cover the estimated cost of settling the plan’s benefit obligations.
b. Inappropriate for assessing benefit security for the membership. c. Dependent upon the actuarial cost method which, in combination with the amortization policy
and asset valuation method, affects the timing and amounts of future contributions. The amounts of future contributions will differ from those assumed due to future actual experience differing from assumed.
A funded status measurement of 100% is not synonymous with no required future contributions. If the funded status were 100%, the Plan would still require future normal cost contributions (i.e., the cost of the active membership accruing an additional year of service credit).
3. The results do not show the potential impact on other post-employment benefits (such as retiree
health care insurance) or ancillary benefits (such as life insurance).
4. The results of separate actuarial valuations generally cannot be added together to produce a correct estimate of the employer contributions. The total can be considerably greater than the sum of the parts due to the interaction of various plan provisions and assumptions used.
5. Future actuarial measurements may differ significantly from the current measurements presented in this report due to such factors as the following: plan experience differing from that anticipated by the economic or demographic assumptions; changes in economic or demographic assumptions due to changing conditions; increases or decreases expected as part of the natural operation of the methodology used for these measurements (such as the end of an amortization period, or additional cost or contribution requirements based on the Plan’s funded status); and changes in plan provisions or applicable law. The scope of this supplemental actuarial valuation does not include an analysis of the potential range of such future measurements.
Page 187 of 229
Grand Traverse County – Comprehensive Financial Plan 21
Appendix K Debt Service, UAAL Amortization and Present Value Schedules
Page 188 of 229
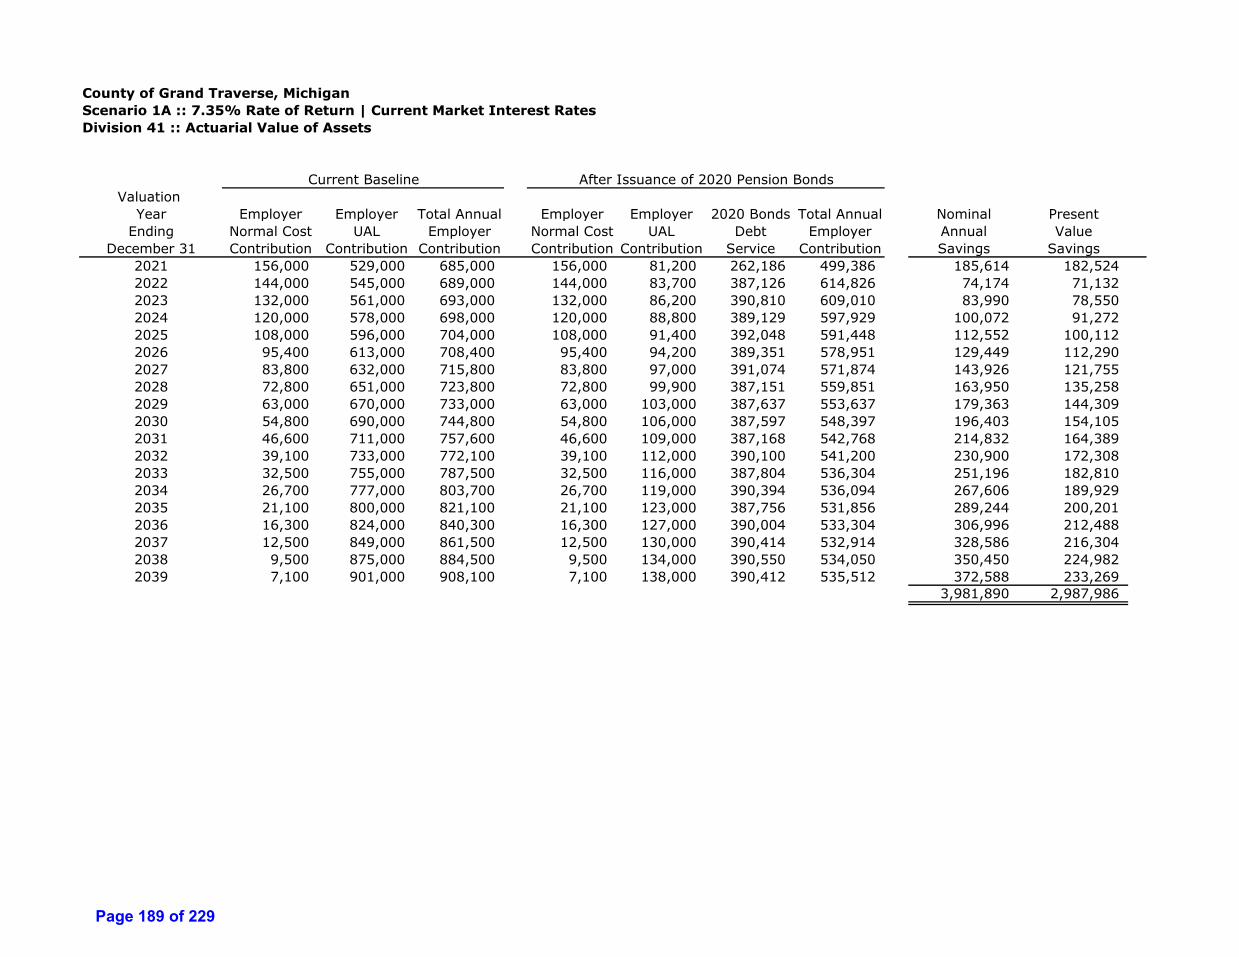
County of Grand Traverse, MichiganScenario 1A :: 7.35% Rate of Return | Current Market Interest RatesDivision 41 :: Actuarial Value of Assets
Valuation Year Employer Employer Total Annual Employer Employer 2020 Bonds Total Annual Nominal Present
Ending Normal Cost UAL Employer Normal Cost UAL Debt Employer Annual ValueDecember 31 Contribution Contribution Contribution Contribution Contribution Service Contribution Savings Savings
2021 156,000 529,000 685,000 156,000 81,200 262,186 499,386 185,614 182,524 2022 144,000 545,000 689,000 144,000 83,700 387,126 614,826 74,174 71,132 2023 132,000 561,000 693,000 132,000 86,200 390,810 609,010 83,990 78,550 2024 120,000 578,000 698,000 120,000 88,800 389,129 597,929 100,072 91,272 2025 108,000 596,000 704,000 108,000 91,400 392,048 591,448 112,552 100,112 2026 95,400 613,000 708,400 95,400 94,200 389,351 578,951 129,449 112,290 2027 83,800 632,000 715,800 83,800 97,000 391,074 571,874 143,926 121,755 2028 72,800 651,000 723,800 72,800 99,900 387,151 559,851 163,950 135,258 2029 63,000 670,000 733,000 63,000 103,000 387,637 553,637 179,363 144,309 2030 54,800 690,000 744,800 54,800 106,000 387,597 548,397 196,403 154,105 2031 46,600 711,000 757,600 46,600 109,000 387,168 542,768 214,832 164,389 2032 39,100 733,000 772,100 39,100 112,000 390,100 541,200 230,900 172,308 2033 32,500 755,000 787,500 32,500 116,000 387,804 536,304 251,196 182,810 2034 26,700 777,000 803,700 26,700 119,000 390,394 536,094 267,606 189,929 2035 21,100 800,000 821,100 21,100 123,000 387,756 531,856 289,244 200,201 2036 16,300 824,000 840,300 16,300 127,000 390,004 533,304 306,996 212,488 2037 12,500 849,000 861,500 12,500 130,000 390,414 532,914 328,586 216,304 2038 9,500 875,000 884,500 9,500 134,000 390,550 534,050 350,450 224,982 2039 7,100 901,000 908,100 7,100 138,000 390,412 535,512 372,588 233,269
3,981,890 2,987,986
Current Baseline After Issuance of 2020 Pension Bonds
Page 189 of 229
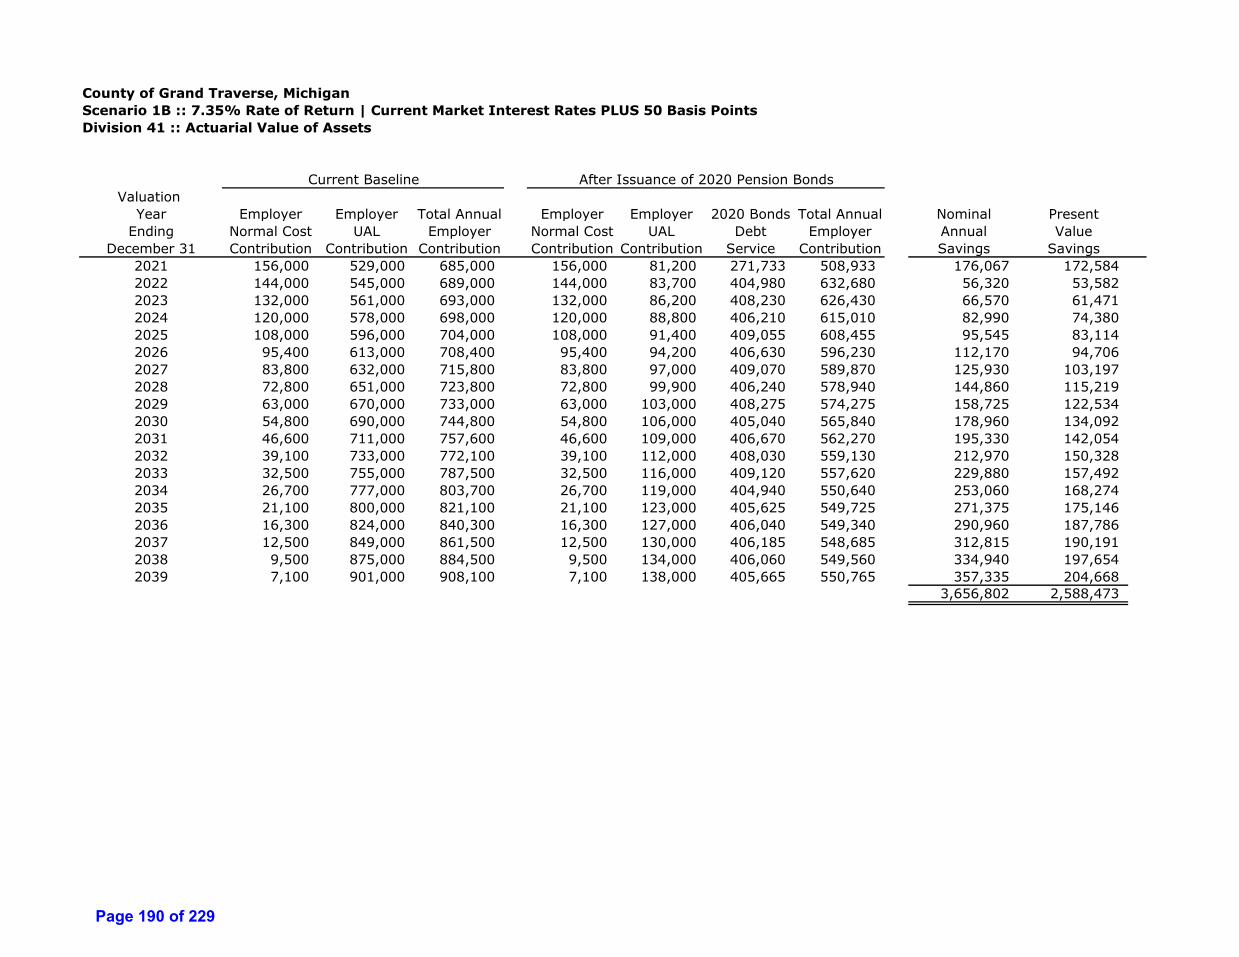
County of Grand Traverse, MichiganScenario 1B :: 7.35% Rate of Return | Current Market Interest Rates PLUS 50 Basis PointsDivision 41 :: Actuarial Value of Assets
Valuation Year Employer Employer Total Annual Employer Employer 2020 Bonds Total Annual Nominal Present
Ending Normal Cost UAL Employer Normal Cost UAL Debt Employer Annual ValueDecember 31 Contribution Contribution Contribution Contribution Contribution Service Contribution Savings Savings
2021 156,000 529,000 685,000 156,000 81,200 271,733 508,933 176,067 172,584 2022 144,000 545,000 689,000 144,000 83,700 404,980 632,680 56,320 53,582 2023 132,000 561,000 693,000 132,000 86,200 408,230 626,430 66,570 61,471 2024 120,000 578,000 698,000 120,000 88,800 406,210 615,010 82,990 74,380 2025 108,000 596,000 704,000 108,000 91,400 409,055 608,455 95,545 83,114 2026 95,400 613,000 708,400 95,400 94,200 406,630 596,230 112,170 94,706 2027 83,800 632,000 715,800 83,800 97,000 409,070 589,870 125,930 103,197 2028 72,800 651,000 723,800 72,800 99,900 406,240 578,940 144,860 115,219 2029 63,000 670,000 733,000 63,000 103,000 408,275 574,275 158,725 122,534 2030 54,800 690,000 744,800 54,800 106,000 405,040 565,840 178,960 134,092 2031 46,600 711,000 757,600 46,600 109,000 406,670 562,270 195,330 142,054 2032 39,100 733,000 772,100 39,100 112,000 408,030 559,130 212,970 150,328 2033 32,500 755,000 787,500 32,500 116,000 409,120 557,620 229,880 157,492 2034 26,700 777,000 803,700 26,700 119,000 404,940 550,640 253,060 168,274 2035 21,100 800,000 821,100 21,100 123,000 405,625 549,725 271,375 175,146 2036 16,300 824,000 840,300 16,300 127,000 406,040 549,340 290,960 187,786 2037 12,500 849,000 861,500 12,500 130,000 406,185 548,685 312,815 190,191 2038 9,500 875,000 884,500 9,500 134,000 406,060 549,560 334,940 197,654 2039 7,100 901,000 908,100 7,100 138,000 405,665 550,765 357,335 204,668
3,656,802 2,588,473
Current Baseline After Issuance of 2020 Pension Bonds
Page 190 of 229
County of Grand Traverse, MichiganScenario 1C :: 7.35% Rate of Return | Current Market Interest Rates LESS 50 Basis PointsDivision 41 :: Actuarial Value of Assets
Valuation Year Employer Employer Total Annual Employer Employer 2020 Bonds Total Annual Nominal Present
Ending Normal Cost UAL Employer Normal Cost UAL Debt Employer Annual ValueDecember 31 Contribution Contribution Contribution Contribution Contribution Service Contribution Savings Savings
2021 156,000 529,000 685,000 156,000 81,200 247,202 484,402 200,598 197,930 2022 144,000 545,000 689,000 144,000 83,700 372,325 600,025 88,975 86,053 2023 132,000 561,000 693,000 132,000 86,200 372,650 590,850 102,150 96,840 2024 120,000 578,000 698,000 120,000 88,800 372,890 581,690 116,310 108,080 2025 108,000 596,000 704,000 108,000 91,400 373,045 572,445 131,555 119,826 2026 95,400 613,000 708,400 95,400 94,200 373,115 562,715 145,685 130,069 2027 83,800 632,000 715,800 83,800 97,000 373,100 553,900 161,900 141,684 2028 72,800 651,000 723,800 72,800 99,900 373,000 545,700 178,100 152,775 2029 63,000 670,000 733,000 63,000 103,000 372,815 538,815 194,185 163,275 2030 54,800 690,000 744,800 54,800 106,000 372,545 533,345 211,455 174,275 2031 46,600 711,000 757,600 46,600 109,000 372,190 527,790 229,810 185,653 2032 39,100 733,000 772,100 39,100 112,000 371,750 522,850 249,250 197,371 2033 32,500 755,000 787,500 32,500 116,000 371,225 519,725 267,775 207,841 2034 26,700 777,000 803,700 26,700 119,000 370,615 516,315 287,385 218,646 2035 21,100 800,000 821,100 21,100 123,000 369,920 514,020 307,080 229,004 2036 16,300 824,000 840,300 16,300 127,000 369,140 512,440 327,860 244,500 2037 12,500 849,000 861,500 12,500 130,000 368,275 510,775 350,725 251,297 2038 9,500 875,000 884,500 9,500 134,000 372,325 515,825 368,675 258,928 2039 7,100 901,000 908,100 7,100 138,000 371,205 516,305 391,795 269,717
4,311,268 3,433,764
Current Baseline After Issuance of 2020 Pension Bonds
Page 191 of 229
County of Grand Traverse, MichiganScenario 2A :: 6.35% Rate of Return | Current Market Interest RatesDivision 41 :: Actuarial Value of Assets
Valuation Year Employer Employer Total Annual Employer Employer 2020 Bonds Total Annual Nominal Present
Ending Normal Cost UAL Employer Normal Cost UAL Debt Employer Annual ValueDecember 31 Contribution Contribution Contribution Contribution Contribution Service Contribution Savings Savings
2021 254,000 722,000 976,000 254,000 312,000 262,186 828,186 147,814 145,353 2022 234,000 744,000 978,000 234,000 321,000 387,126 942,126 35,874 34,403 2023 215,000 766,000 981,000 215,000 331,000 390,810 936,810 44,190 41,328 2024 196,000 789,000 985,000 196,000 341,000 389,129 926,129 58,872 53,695 2025 177,000 813,000 990,000 177,000 351,000 392,048 920,048 69,952 62,221 2026 157,000 837,000 994,000 157,000 361,000 389,351 907,351 86,649 75,163 2027 139,000 862,000 1,001,000 139,000 372,000 391,074 902,074 98,926 83,687 2028 121,000 888,000 1,009,000 121,000 383,000 387,151 891,151 117,850 97,226 2029 105,000 914,000 1,019,000 105,000 395,000 387,637 887,637 131,363 105,690 2030 91,400 942,000 1,033,400 91,400 407,000 387,597 885,997 147,403 115,658 2031 78,200 970,000 1,048,200 78,200 419,000 387,168 884,368 163,832 125,364 2032 65,800 999,000 1,064,800 65,800 431,000 390,100 886,900 177,900 132,757 2033 55,000 1,030,000 1,085,000 55,000 444,000 387,804 886,804 198,196 144,239 2034 45,200 1,060,000 1,105,200 45,200 458,000 390,394 893,594 211,606 150,184 2035 36,000 1,090,000 1,126,000 36,000 471,000 387,756 894,756 231,244 160,056 2036 27,800 1,120,000 1,147,800 27,800 486,000 390,004 903,804 243,996 168,882 2037 21,300 1,160,000 1,181,300 21,300 500,000 390,414 911,714 269,586 177,465 2038 16,200 1,190,000 1,206,200 16,200 515,000 390,550 921,750 284,450 182,611 2039 12,200 1,230,000 1,242,200 12,200 531,000 390,412 933,612 308,588 193,200
3,028,290 2,249,180
Current Baseline After Issuance of 2020 Pension Bonds
Page 192 of 229
County of Grand Traverse, MichiganScenario 2B :: 6.35% Rate of Return | Current Market Interest Rates PLUS 50 Basis PointsDivision 41 :: Actuarial Value of Assets
Valuation Year Employer Employer Total Annual Employer Employer 2020 Bonds Total Annual Nominal Present
Ending Normal Cost UAL Employer Normal Cost UAL Debt Employer Annual ValueDecember 31 Contribution Contribution Contribution Contribution Contribution Service Contribution Savings Savings
2021 254,000 722,000 976,000 254,000 312,000 271,733 837,733 138,267 135,532 2022 234,000 744,000 978,000 234,000 321,000 404,980 959,980 18,020 17,144 2023 215,000 766,000 981,000 215,000 331,000 408,230 954,230 26,770 24,720 2024 196,000 789,000 985,000 196,000 341,000 406,210 943,210 41,790 37,454 2025 177,000 813,000 990,000 177,000 351,000 409,055 937,055 52,945 46,057 2026 157,000 837,000 994,000 157,000 361,000 406,630 924,630 69,370 58,570 2027 139,000 862,000 1,001,000 139,000 372,000 409,070 920,070 80,930 66,321 2028 121,000 888,000 1,009,000 121,000 383,000 406,240 910,240 98,760 78,552 2029 105,000 914,000 1,019,000 105,000 395,000 408,275 908,275 110,725 85,479 2030 91,400 942,000 1,033,400 91,400 407,000 405,040 903,440 129,960 97,377 2031 78,200 970,000 1,048,200 78,200 419,000 406,670 903,870 144,330 104,964 2032 65,800 999,000 1,064,800 65,800 431,000 408,030 904,830 159,970 112,917 2033 55,000 1,030,000 1,085,000 55,000 444,000 409,120 908,120 176,880 121,181 2034 45,200 1,060,000 1,105,200 45,200 458,000 404,940 908,140 197,060 131,036 2035 36,000 1,090,000 1,126,000 36,000 471,000 405,625 912,625 213,375 137,712 2036 27,800 1,120,000 1,147,800 27,800 486,000 406,040 919,840 227,960 147,126 2037 21,300 1,160,000 1,181,300 21,300 500,000 406,185 927,485 253,815 154,319 2038 16,200 1,190,000 1,206,200 16,200 515,000 406,060 937,260 268,940 158,706 2039 12,200 1,230,000 1,242,200 12,200 531,000 405,665 948,865 293,335 168,011
2,703,202 1,883,179
Current Baseline After Issuance of 2020 Pension Bonds
Page 193 of 229
County of Grand Traverse, MichiganScenario 2C :: 6.35% Rate of Return | Current Market Interest Rates LESS 50 Basis PointsDivision 41 :: Actuarial Value of Assets
Valuation Year Employer Employer Total Annual Employer Employer 2020 Bonds Total Annual Nominal Present
Ending Normal Cost UAL Employer Normal Cost UAL Debt Employer Annual ValueDecember 31 Contribution Contribution Contribution Contribution Contribution Service Contribution Savings Savings
2021 254,000 722,000 976,000 254,000 312,000 247,202 813,202 162,798 160,633 2022 234,000 744,000 978,000 234,000 321,000 372,325 927,325 50,675 49,011 2023 215,000 766,000 981,000 215,000 331,000 372,650 918,650 62,350 59,109 2024 196,000 789,000 985,000 196,000 341,000 372,890 909,890 75,110 69,796 2025 177,000 813,000 990,000 177,000 351,000 373,045 901,045 88,955 81,024 2026 157,000 837,000 994,000 157,000 361,000 373,115 891,115 102,885 91,857 2027 139,000 862,000 1,001,000 139,000 372,000 373,100 884,100 116,900 102,303 2028 121,000 888,000 1,009,000 121,000 383,000 373,000 877,000 132,000 113,230 2029 105,000 914,000 1,019,000 105,000 395,000 372,815 872,815 146,185 122,915 2030 91,400 942,000 1,033,400 91,400 407,000 372,545 870,945 162,455 133,891 2031 78,200 970,000 1,048,200 78,200 419,000 372,190 869,390 178,810 144,452 2032 65,800 999,000 1,064,800 65,800 431,000 371,750 868,550 196,250 155,402 2033 55,000 1,030,000 1,085,000 55,000 444,000 371,225 870,225 214,775 166,704 2034 45,200 1,060,000 1,105,200 45,200 458,000 370,615 873,815 231,385 176,040 2035 36,000 1,090,000 1,126,000 36,000 471,000 369,920 876,920 249,080 185,751 2036 27,800 1,120,000 1,147,800 27,800 486,000 369,140 882,940 264,860 197,518 2037 21,300 1,160,000 1,181,300 21,300 500,000 368,275 889,575 291,725 209,023 2038 16,200 1,190,000 1,206,200 16,200 515,000 372,325 903,525 302,675 212,575 2039 12,200 1,230,000 1,242,200 12,200 531,000 371,205 914,405 327,795 225,659
3,357,668 2,656,892
Current Baseline After Issuance of 2020 Pension Bonds
Page 194 of 229
County of Grand Traverse, MichiganScenario 3A :: 5.35% Rate of Return | Current Market Interest RatesDivision 41 :: Actuarial Value of Assets
Valuation Year Employer Employer Total Annual Employer Employer 2020 Bonds Total Annual Nominal Present
Ending Normal Cost UAL Employer Normal Cost UAL Debt Employer Annual ValueDecember 31 Contribution Contribution Contribution Contribution Contribution Service Contribution Savings Savings
2021 387,000 926,000 1,313,000 387,000 551,000 262,186 1,200,186 112,814 110,936 2022 356,000 953,000 1,309,000 356,000 568,000 387,126 1,311,126 (2,126) (2,039) 2023 328,000 982,000 1,310,000 328,000 585,000 390,810 1,303,810 6,190 5,789 2024 299,000 1,010,000 1,309,000 299,000 602,000 389,129 1,290,129 18,872 17,212 2025 270,000 1,040,000 1,310,000 270,000 621,000 392,048 1,283,048 26,952 23,973 2026 241,000 1,070,000 1,311,000 241,000 639,000 389,351 1,269,351 41,649 36,128 2027 213,000 1,110,000 1,323,000 213,000 658,000 391,074 1,262,074 60,926 51,541 2028 186,000 1,140,000 1,326,000 186,000 678,000 387,151 1,251,151 74,850 61,751 2029 162,000 1,170,000 1,332,000 162,000 698,000 387,637 1,247,637 84,363 67,876 2030 142,000 1,210,000 1,352,000 142,000 719,000 387,597 1,248,597 103,403 81,134 2031 122,000 1,240,000 1,362,000 122,000 741,000 387,168 1,250,168 111,832 85,574 2032 103,000 1,280,000 1,383,000 103,000 763,000 390,100 1,256,100 126,900 94,698 2033 85,900 1,320,000 1,405,900 85,900 786,000 387,804 1,259,704 146,196 106,396 2034 70,800 1,360,000 1,430,800 70,800 810,000 390,394 1,271,194 159,606 113,278 2035 56,500 1,400,000 1,456,500 56,500 834,000 387,756 1,278,256 178,244 123,372 2036 43,800 1,440,000 1,483,800 43,800 859,000 390,004 1,292,804 190,996 132,198 2037 33,700 1,490,000 1,523,700 33,700 885,000 390,414 1,309,114 214,586 141,259 2038 25,600 1,530,000 1,555,600 25,600 911,000 390,550 1,327,150 228,450 146,660 2039 19,300 1,580,000 1,599,300 19,300 939,000 390,412 1,348,712 250,588 156,887
2,135,290 1,554,622
Current Baseline After Issuance of 2020 Pension Bonds
Page 195 of 229

County of Grand Traverse, MichiganScenario 3B :: 5.35% Rate of Return | Current Market Interest Rates PLUS 50 Basis PointsDivision 41 :: Actuarial Value of Assets
Valuation Year Employer Employer Total Annual Employer Employer 2020 Bonds Total Annual Nominal Present
Ending Normal Cost UAL Employer Normal Cost UAL Debt Employer Annual ValueDecember 31 Contribution Contribution Contribution Contribution Contribution Service Contribution Savings Savings
2021 387,000 926,000 1,313,000 387,000 551,000 271,733 1,209,733 103,267 101,224 2022 356,000 953,000 1,309,000 356,000 568,000 404,980 1,328,980 (19,980) (19,009) 2023 328,000 982,000 1,310,000 328,000 585,000 408,230 1,321,230 (11,230) (10,370) 2024 299,000 1,010,000 1,309,000 299,000 602,000 406,210 1,307,210 1,790 1,604 2025 270,000 1,040,000 1,310,000 270,000 621,000 409,055 1,300,055 9,945 8,651 2026 241,000 1,070,000 1,311,000 241,000 639,000 406,630 1,286,630 24,370 20,576 2027 213,000 1,110,000 1,323,000 213,000 658,000 409,070 1,280,070 42,930 35,180 2028 186,000 1,140,000 1,326,000 186,000 678,000 406,240 1,270,240 55,760 44,350 2029 162,000 1,170,000 1,332,000 162,000 698,000 408,275 1,268,275 63,725 49,195 2030 142,000 1,210,000 1,352,000 142,000 719,000 405,040 1,266,040 85,960 64,409 2031 122,000 1,240,000 1,362,000 122,000 741,000 406,670 1,269,670 92,330 67,147 2032 103,000 1,280,000 1,383,000 103,000 763,000 408,030 1,274,030 108,970 76,918 2033 85,900 1,320,000 1,405,900 85,900 786,000 409,120 1,281,020 124,880 85,556 2034 70,800 1,360,000 1,430,800 70,800 810,000 404,940 1,285,740 145,060 96,459 2035 56,500 1,400,000 1,456,500 56,500 834,000 405,625 1,296,125 160,375 103,506 2036 43,800 1,440,000 1,483,800 43,800 859,000 406,040 1,308,840 174,960 112,919 2037 33,700 1,490,000 1,523,700 33,700 885,000 406,185 1,324,885 198,815 120,879 2038 25,600 1,530,000 1,555,600 25,600 911,000 406,060 1,342,660 212,940 125,660 2039 19,300 1,580,000 1,599,300 19,300 939,000 405,665 1,363,965 235,335 134,791
1,810,202 1,219,647
Current Baseline After Issuance of 2020 Pension Bonds
Page 196 of 229

County of Grand Traverse, MichiganScenario 3C :: 5.35% Rate of Return | Current Market Interest Rates LESS 50 Basis PointsDivision 41 :: Actuarial Value of Assets
Valuation Year Employer Employer Total Annual Employer Employer 2020 Bonds Total Annual Nominal Present
Ending Normal Cost UAL Employer Normal Cost UAL Debt Employer Annual ValueDecember 31 Contribution Contribution Contribution Contribution Contribution Service Contribution Savings Savings
2021 387,000 926,000 1,313,000 387,000 551,000 247,202 1,185,202 127,798 126,098 2022 356,000 953,000 1,309,000 356,000 568,000 372,325 1,296,325 12,675 12,259 2023 328,000 982,000 1,310,000 328,000 585,000 372,650 1,285,650 24,350 23,084 2024 299,000 1,010,000 1,309,000 299,000 602,000 372,890 1,273,890 35,110 32,626 2025 270,000 1,040,000 1,310,000 270,000 621,000 373,045 1,264,045 45,955 41,858 2026 241,000 1,070,000 1,311,000 241,000 639,000 373,115 1,253,115 57,885 51,680 2027 213,000 1,110,000 1,323,000 213,000 658,000 373,100 1,244,100 78,900 69,048 2028 186,000 1,140,000 1,326,000 186,000 678,000 373,000 1,237,000 89,000 76,345 2029 162,000 1,170,000 1,332,000 162,000 698,000 372,815 1,232,815 99,185 83,397 2030 142,000 1,210,000 1,352,000 142,000 719,000 372,545 1,233,545 118,455 97,627 2031 122,000 1,240,000 1,362,000 122,000 741,000 372,190 1,235,190 126,810 102,444 2032 103,000 1,280,000 1,383,000 103,000 763,000 371,750 1,237,750 145,250 115,017 2033 85,900 1,320,000 1,405,900 85,900 786,000 371,225 1,243,125 162,775 126,343 2034 70,800 1,360,000 1,430,800 70,800 810,000 370,615 1,251,415 179,385 136,478 2035 56,500 1,400,000 1,456,500 56,500 834,000 369,920 1,260,420 196,080 146,226 2036 43,800 1,440,000 1,483,800 43,800 859,000 369,140 1,271,940 211,860 157,994 2037 33,700 1,490,000 1,523,700 33,700 885,000 368,275 1,286,975 236,725 169,615 2038 25,600 1,530,000 1,555,600 25,600 911,000 372,325 1,308,925 246,675 173,245 2039 19,300 1,580,000 1,599,300 19,300 939,000 371,205 1,329,505 269,795 185,731
2,464,668 1,927,114
Current Baseline After Issuance of 2020 Pension Bonds
Page 197 of 229
County of Grand Traverse, MichiganScenario 4A :: 6.75% Rate of Return | Current Market Interest RatesDivision 41 :: Actuarial Value of Assets
Valuation Year Employer Employer Total Annual Employer Employer 2020 Bonds Total Annual Nominal Present
Ending Normal Cost UAL Employer Normal Cost UAL Debt Employer Annual ValueDecember 31 Contribution Contribution Contribution Contribution Contribution Service Contribution Savings Savings
2021 212,000 643,000 855,000 212,000 218,000 262,186 692,186 162,814 160,103 2022 195,000 663,000 858,000 195,000 225,000 387,126 807,126 50,874 48,788 2023 179,000 683,000 862,000 179,000 232,000 390,810 801,810 60,190 56,292 2024 163,000 703,000 866,000 163,000 238,000 389,129 790,129 75,872 69,200 2025 147,000 724,000 871,000 147,000 246,000 392,048 785,048 85,952 76,452 2026 130,000 746,000 876,000 130,000 253,000 389,351 772,351 103,649 89,910 2027 115,000 768,000 883,000 115,000 261,000 391,074 767,074 115,926 98,068 2028 99,700 791,000 890,700 99,700 268,000 387,151 754,851 135,850 112,076 2029 86,700 815,000 901,700 86,700 276,000 387,637 750,337 151,363 121,781 2030 75,400 839,000 914,400 75,400 285,000 387,597 747,997 166,403 130,566 2031 64,400 865,000 929,400 64,400 293,000 387,168 744,568 184,832 141,433 2032 54,100 891,000 945,100 54,100 302,000 390,100 746,200 198,900 148,428 2033 45,200 917,000 962,200 45,200 311,000 387,804 744,004 218,196 158,794 2034 37,100 945,000 982,100 37,100 320,000 390,394 747,494 234,606 166,507 2035 29,500 973,000 1,002,500 29,500 330,000 387,756 747,256 255,244 176,668 2036 22,800 1,000,000 1,022,800 22,800 340,000 390,004 752,804 269,996 186,878 2037 17,500 1,030,000 1,047,500 17,500 350,000 390,414 757,914 289,586 190,630 2038 13,300 1,060,000 1,073,300 13,300 361,000 390,550 764,850 308,450 198,019 2039 10,000 1,100,000 1,110,000 10,000 372,000 390,412 772,412 337,588 211,356
3,406,290 2,541,950
Current Baseline After Issuance of 2020 Pension Bonds
Page 198 of 229
County of Grand Traverse, MichiganScenario 4B :: 6.75% Rate of Return | Current Market Interest Rates PLUS 50 Basis PointsDivision 41 :: Actuarial Value of Assets
Valuation Year Employer Employer Total Annual Employer Employer 2020 Bonds Total Annual Nominal Present
Ending Normal Cost UAL Employer Normal Cost UAL Debt Employer Annual ValueDecember 31 Contribution Contribution Contribution Contribution Contribution Service Contribution Savings Savings
2021 212,000 643,000 855,000 212,000 218,000 271,733 701,733 153,267 150,235 2022 195,000 663,000 858,000 195,000 225,000 404,980 824,980 33,020 31,415 2023 179,000 683,000 862,000 179,000 232,000 408,230 819,230 42,770 39,494 2024 163,000 703,000 866,000 163,000 238,000 406,210 807,210 58,790 52,691 2025 147,000 724,000 871,000 147,000 246,000 409,055 802,055 68,945 59,975 2026 130,000 746,000 876,000 130,000 253,000 406,630 789,630 86,370 72,923 2027 115,000 768,000 883,000 115,000 261,000 409,070 785,070 97,930 80,252 2028 99,700 791,000 890,700 99,700 268,000 406,240 773,940 116,760 92,869 2029 86,700 815,000 901,700 86,700 276,000 408,275 770,975 130,725 100,918 2030 75,400 839,000 914,400 75,400 285,000 405,040 765,440 148,960 111,614 2031 64,400 865,000 929,400 64,400 293,000 406,670 764,070 165,330 120,236 2032 54,100 891,000 945,100 54,100 302,000 408,030 764,130 180,970 127,740 2033 45,200 917,000 962,200 45,200 311,000 409,120 765,320 196,880 134,883 2034 37,100 945,000 982,100 37,100 320,000 404,940 762,040 220,060 146,330 2035 29,500 973,000 1,002,500 29,500 330,000 405,625 765,125 237,375 153,202 2036 22,800 1,000,000 1,022,800 22,800 340,000 406,040 768,840 253,960 163,906 2037 17,500 1,030,000 1,047,500 17,500 350,000 406,185 773,685 273,815 166,479 2038 13,300 1,060,000 1,073,300 13,300 361,000 406,060 780,360 292,940 172,869 2039 10,000 1,100,000 1,110,000 10,000 372,000 405,665 787,665 322,335 184,622
3,081,202 2,162,654
Current Baseline After Issuance of 2020 Pension Bonds
Page 199 of 229

County of Grand Traverse, MichiganScenario 4C :: 6.75% Rate of Return | Current Market Interest Rates LESS 50 Basis PointsDivision 41 :: Actuarial Value of Assets
Valuation Year Employer Employer Total Annual Employer Employer 2020 Bonds Total Annual Nominal Present
Ending Normal Cost UAL Employer Normal Cost UAL Debt Employer Annual ValueDecember 31 Contribution Contribution Contribution Contribution Contribution Service Contribution Savings Savings
2021 212,000 643,000 855,000 212,000 218,000 247,202 677,202 177,798 175,433 2022 195,000 663,000 858,000 195,000 225,000 372,325 792,325 65,675 63,519 2023 179,000 683,000 862,000 179,000 232,000 372,650 783,650 78,350 74,277 2024 163,000 703,000 866,000 163,000 238,000 372,890 773,890 92,110 85,593 2025 147,000 724,000 871,000 147,000 246,000 373,045 766,045 104,955 95,598 2026 130,000 746,000 876,000 130,000 253,000 373,115 756,115 119,885 107,035 2027 115,000 768,000 883,000 115,000 261,000 373,100 749,100 133,900 117,180 2028 99,700 791,000 890,700 99,700 268,000 373,000 740,700 150,000 128,671 2029 86,700 815,000 901,700 86,700 276,000 372,815 735,515 166,185 139,732 2030 75,400 839,000 914,400 75,400 285,000 372,545 732,945 181,455 149,550 2031 64,400 865,000 929,400 64,400 293,000 372,190 729,590 199,810 161,417 2032 54,100 891,000 945,100 54,100 302,000 371,750 727,850 217,250 172,031 2033 45,200 917,000 962,200 45,200 311,000 371,225 727,425 234,775 182,227 2034 37,100 945,000 982,100 37,100 320,000 370,615 727,715 254,385 193,539 2035 29,500 973,000 1,002,500 29,500 330,000 369,920 729,420 273,080 203,648 2036 22,800 1,000,000 1,022,800 22,800 340,000 369,140 731,940 290,860 216,908 2037 17,500 1,030,000 1,047,500 17,500 350,000 368,275 735,775 311,725 223,353 2038 13,300 1,060,000 1,073,300 13,300 361,000 372,325 746,625 326,675 229,430 2039 10,000 1,100,000 1,110,000 10,000 372,000 371,205 753,205 356,795 245,623
3,735,668 2,964,764
Current Baseline After Issuance of 2020 Pension Bonds
Page 200 of 229
County of Grand Traverse, MichiganScenario 1A :: 7.35% Rate of Return | Current Market Interest RatesDivision 43 :: Actuarial Value of Assets
Valuation Year Employer Employer Total Annual Employer Employer 2020 Bonds Total Annual Nominal Present
Ending Normal Cost UAL Employer Normal Cost UAL Debt Employer Annual ValueDecember 31 Contribution Contribution Contribution Contribution Contribution Service Contribution Savings Savings
2021 136,000 30,700 166,700 136,000 4,700 14,299 154,999 11,702 11,507 2022 128,000 31,600 159,600 128,000 4,800 21,384 154,184 5,416 5,194 2023 123,000 32,500 155,500 123,000 5,000 21,314 149,314 6,187 5,786 2024 118,000 33,500 151,500 118,000 5,100 21,225 144,325 7,175 6,544 2025 113,000 34,500 147,500 113,000 5,300 21,116 139,416 8,085 7,191 2026 107,000 35,600 142,600 107,000 5,400 20,976 133,376 9,224 8,001 2027 101,000 36,600 137,600 101,000 5,600 20,807 127,407 10,194 8,623 2028 94,600 37,700 132,300 94,600 5,800 25,607 126,007 6,293 5,192 2029 88,700 38,900 127,600 88,700 5,900 25,301 119,901 7,699 6,194 2030 83,400 40,000 123,400 83,400 6,100 24,965 114,465 8,935 7,011 2031 79,000 41,200 120,200 79,000 6,300 24,609 109,909 10,291 7,875 2032 75,300 42,500 117,800 75,300 6,500 24,153 105,953 11,847 8,841 2033 71,700 43,700 115,400 71,700 6,700 23,697 102,097 13,303 9,681 2034 68,000 45,000 113,000 68,000 6,900 23,241 98,141 14,859 10,546 2035 64,200 46,400 110,600 64,200 7,100 22,785 94,085 16,515 11,431 2036 60,400 47,800 108,200 60,400 7,300 22,329 90,029 18,171 12,577 2037 56,700 49,200 105,900 56,700 7,500 21,781 85,981 19,919 13,112 2038 53,000 50,700 103,700 53,000 7,700 21,233 81,933 21,767 13,974 2039 49,700 52,200 101,900 49,700 8,000 25,685 83,385 18,515 11,592
226,095 170,872
Current Baseline After Issuance of 2020 Pension Bonds
Page 201 of 229
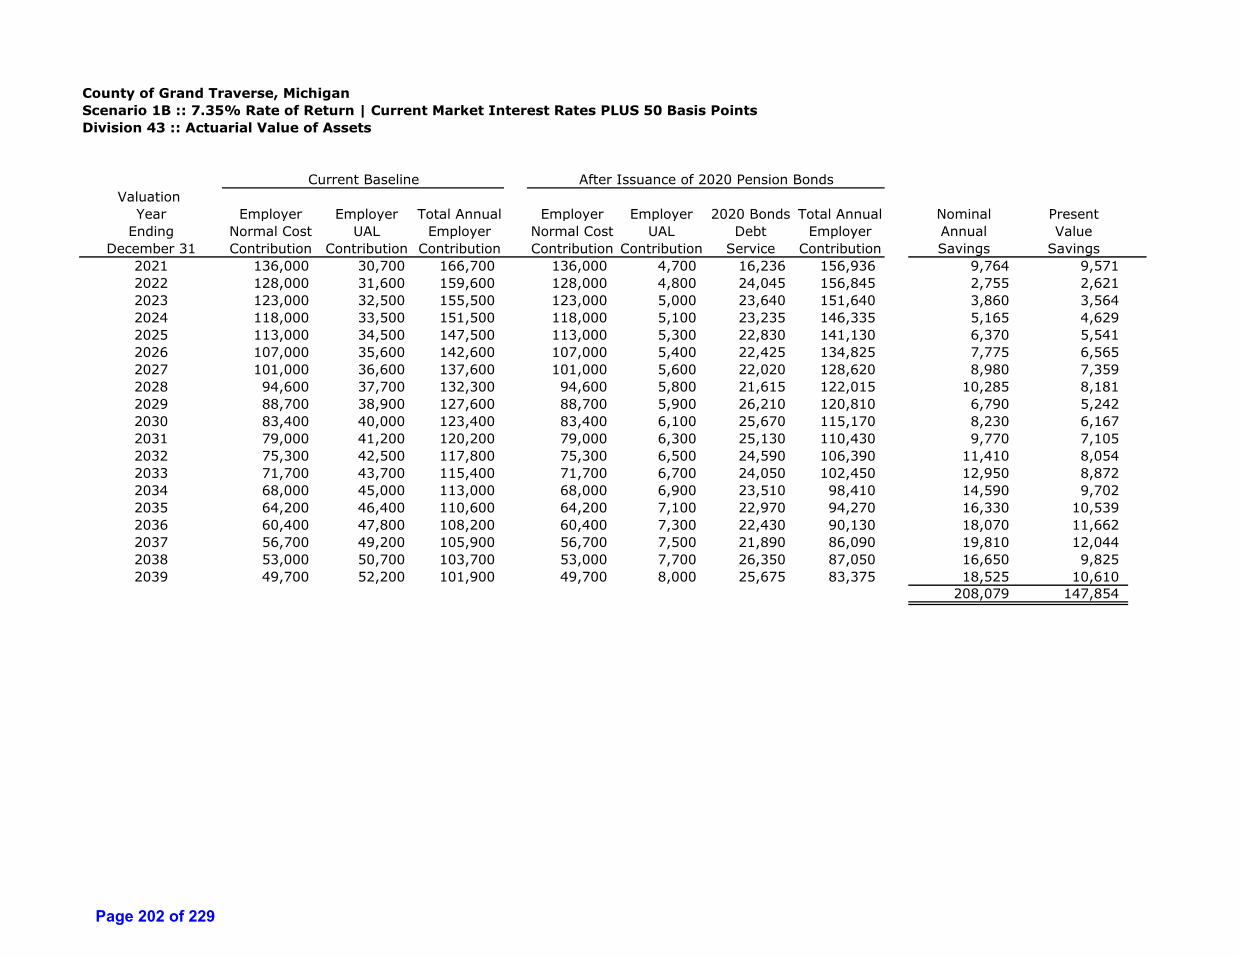
County of Grand Traverse, MichiganScenario 1B :: 7.35% Rate of Return | Current Market Interest Rates PLUS 50 Basis PointsDivision 43 :: Actuarial Value of Assets
Valuation Year Employer Employer Total Annual Employer Employer 2020 Bonds Total Annual Nominal Present
Ending Normal Cost UAL Employer Normal Cost UAL Debt Employer Annual ValueDecember 31 Contribution Contribution Contribution Contribution Contribution Service Contribution Savings Savings
2021 136,000 30,700 166,700 136,000 4,700 16,236 156,936 9,764 9,571 2022 128,000 31,600 159,600 128,000 4,800 24,045 156,845 2,755 2,621 2023 123,000 32,500 155,500 123,000 5,000 23,640 151,640 3,860 3,564 2024 118,000 33,500 151,500 118,000 5,100 23,235 146,335 5,165 4,629 2025 113,000 34,500 147,500 113,000 5,300 22,830 141,130 6,370 5,541 2026 107,000 35,600 142,600 107,000 5,400 22,425 134,825 7,775 6,565 2027 101,000 36,600 137,600 101,000 5,600 22,020 128,620 8,980 7,359 2028 94,600 37,700 132,300 94,600 5,800 21,615 122,015 10,285 8,181 2029 88,700 38,900 127,600 88,700 5,900 26,210 120,810 6,790 5,242 2030 83,400 40,000 123,400 83,400 6,100 25,670 115,170 8,230 6,167 2031 79,000 41,200 120,200 79,000 6,300 25,130 110,430 9,770 7,105 2032 75,300 42,500 117,800 75,300 6,500 24,590 106,390 11,410 8,054 2033 71,700 43,700 115,400 71,700 6,700 24,050 102,450 12,950 8,872 2034 68,000 45,000 113,000 68,000 6,900 23,510 98,410 14,590 9,702 2035 64,200 46,400 110,600 64,200 7,100 22,970 94,270 16,330 10,539 2036 60,400 47,800 108,200 60,400 7,300 22,430 90,130 18,070 11,662 2037 56,700 49,200 105,900 56,700 7,500 21,890 86,090 19,810 12,044 2038 53,000 50,700 103,700 53,000 7,700 26,350 87,050 16,650 9,825 2039 49,700 52,200 101,900 49,700 8,000 25,675 83,375 18,525 10,610
208,079 147,854
Current Baseline After Issuance of 2020 Pension Bonds
Page 202 of 229

County of Grand Traverse, MichiganScenario 1C :: 7.35% Rate of Return | Current Market Interest Rates LESS 50 Basis PointsDivision 43 :: Actuarial Value of Assets
Valuation Year Employer Employer Total Annual Employer Employer 2020 Bonds Total Annual Nominal Present
Ending Normal Cost UAL Employer Normal Cost UAL Debt Employer Annual ValueDecember 31 Contribution Contribution Contribution Contribution Contribution Service Contribution Savings Savings
2021 136,000 30,700 166,700 136,000 4,700 13,926 154,626 12,074 11,913 2022 128,000 31,600 159,600 128,000 4,800 20,695 153,495 6,105 5,905 2023 123,000 32,500 155,500 123,000 5,000 20,440 148,440 7,060 6,693 2024 118,000 33,500 151,500 118,000 5,100 20,185 143,285 8,215 7,634 2025 113,000 34,500 147,500 113,000 5,300 19,930 138,230 9,270 8,444 2026 107,000 35,600 142,600 107,000 5,400 19,675 132,075 10,525 9,397 2027 101,000 36,600 137,600 101,000 5,600 24,420 131,020 6,580 5,758 2028 94,600 37,700 132,300 94,600 5,800 24,080 124,480 7,820 6,708 2029 88,700 38,900 127,600 88,700 5,900 23,740 118,340 9,260 7,786 2030 83,400 40,000 123,400 83,400 6,100 23,400 112,900 10,500 8,654 2031 79,000 41,200 120,200 79,000 6,300 23,060 108,360 11,840 9,565 2032 75,300 42,500 117,800 75,300 6,500 22,720 104,520 13,280 10,516 2033 71,700 43,700 115,400 71,700 6,700 22,380 100,780 14,620 11,348 2034 68,000 45,000 113,000 68,000 6,900 22,040 96,940 16,060 12,219 2035 64,200 46,400 110,600 64,200 7,100 21,700 93,000 17,600 13,125 2036 60,400 47,800 108,200 60,400 7,300 21,360 89,060 19,140 14,274 2037 56,700 49,200 105,900 56,700 7,500 21,020 85,220 20,680 14,817 2038 53,000 50,700 103,700 53,000 7,700 20,680 81,380 22,320 15,676 2039 49,700 52,200 101,900 49,700 8,000 20,340 78,040 23,860 16,426
246,809 196,856
Current Baseline After Issuance of 2020 Pension Bonds
Page 203 of 229
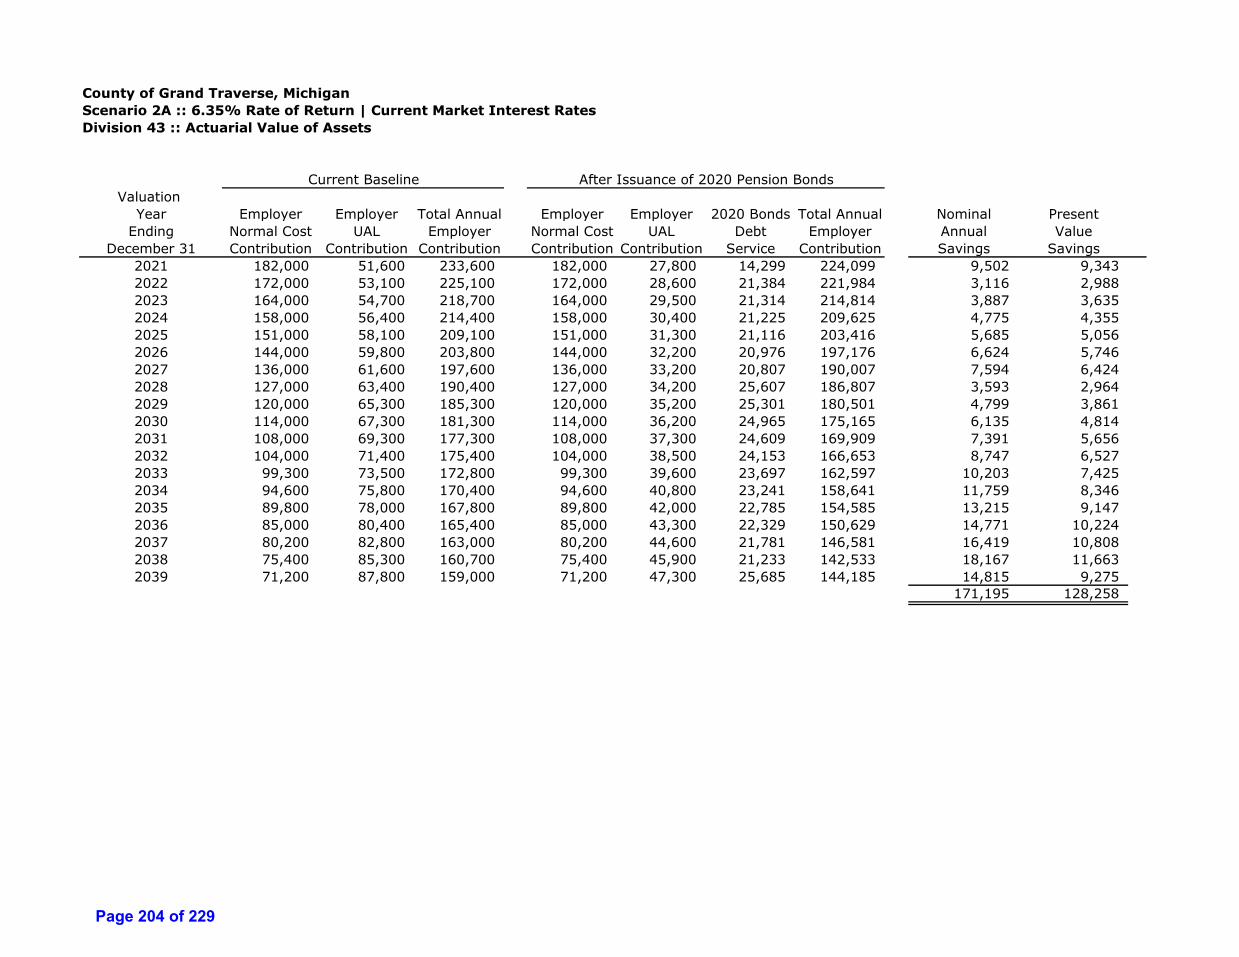
County of Grand Traverse, MichiganScenario 2A :: 6.35% Rate of Return | Current Market Interest RatesDivision 43 :: Actuarial Value of Assets
Valuation Year Employer Employer Total Annual Employer Employer 2020 Bonds Total Annual Nominal Present
Ending Normal Cost UAL Employer Normal Cost UAL Debt Employer Annual ValueDecember 31 Contribution Contribution Contribution Contribution Contribution Service Contribution Savings Savings
2021 182,000 51,600 233,600 182,000 27,800 14,299 224,099 9,502 9,343 2022 172,000 53,100 225,100 172,000 28,600 21,384 221,984 3,116 2,988 2023 164,000 54,700 218,700 164,000 29,500 21,314 214,814 3,887 3,635 2024 158,000 56,400 214,400 158,000 30,400 21,225 209,625 4,775 4,355 2025 151,000 58,100 209,100 151,000 31,300 21,116 203,416 5,685 5,056 2026 144,000 59,800 203,800 144,000 32,200 20,976 197,176 6,624 5,746 2027 136,000 61,600 197,600 136,000 33,200 20,807 190,007 7,594 6,424 2028 127,000 63,400 190,400 127,000 34,200 25,607 186,807 3,593 2,964 2029 120,000 65,300 185,300 120,000 35,200 25,301 180,501 4,799 3,861 2030 114,000 67,300 181,300 114,000 36,200 24,965 175,165 6,135 4,814 2031 108,000 69,300 177,300 108,000 37,300 24,609 169,909 7,391 5,656 2032 104,000 71,400 175,400 104,000 38,500 24,153 166,653 8,747 6,527 2033 99,300 73,500 172,800 99,300 39,600 23,697 162,597 10,203 7,425 2034 94,600 75,800 170,400 94,600 40,800 23,241 158,641 11,759 8,346 2035 89,800 78,000 167,800 89,800 42,000 22,785 154,585 13,215 9,147 2036 85,000 80,400 165,400 85,000 43,300 22,329 150,629 14,771 10,224 2037 80,200 82,800 163,000 80,200 44,600 21,781 146,581 16,419 10,808 2038 75,400 85,300 160,700 75,400 45,900 21,233 142,533 18,167 11,663 2039 71,200 87,800 159,000 71,200 47,300 25,685 144,185 14,815 9,275
171,195 128,258
Current Baseline After Issuance of 2020 Pension Bonds
Page 204 of 229

County of Grand Traverse, MichiganScenario 2B :: 6.35% Rate of Return | Current Market Interest Rates PLUS 50 Basis PointsDivision 43 :: Actuarial Value of Assets
Valuation Year Employer Employer Total Annual Employer Employer 2020 Bonds Total Annual Nominal Present
Ending Normal Cost UAL Employer Normal Cost UAL Debt Employer Annual ValueDecember 31 Contribution Contribution Contribution Contribution Contribution Service Contribution Savings Savings
2021 182,000 51,600 233,600 182,000 27,800 16,236 226,036 7,564 7,414 2022 172,000 53,100 225,100 172,000 28,600 24,045 224,645 455 433 2023 164,000 54,700 218,700 164,000 29,500 23,640 217,140 1,560 1,441 2024 158,000 56,400 214,400 158,000 30,400 23,235 211,635 2,765 2,478 2025 151,000 58,100 209,100 151,000 31,300 22,830 205,130 3,970 3,453 2026 144,000 59,800 203,800 144,000 32,200 22,425 198,625 5,175 4,369 2027 136,000 61,600 197,600 136,000 33,200 22,020 191,220 6,380 5,228 2028 127,000 63,400 190,400 127,000 34,200 21,615 182,815 7,585 6,033 2029 120,000 65,300 185,300 120,000 35,200 26,210 181,410 3,890 3,003 2030 114,000 67,300 181,300 114,000 36,200 25,670 175,870 5,430 4,069 2031 108,000 69,300 177,300 108,000 37,300 25,130 170,430 6,870 4,996 2032 104,000 71,400 175,400 104,000 38,500 24,590 167,090 8,310 5,866 2033 99,300 73,500 172,800 99,300 39,600 24,050 162,950 9,850 6,748 2034 94,600 75,800 170,400 94,600 40,800 23,510 158,910 11,490 7,640 2035 89,800 78,000 167,800 89,800 42,000 22,970 154,770 13,030 8,410 2036 85,000 80,400 165,400 85,000 43,300 22,430 150,730 14,670 9,468 2037 80,200 82,800 163,000 80,200 44,600 21,890 146,690 16,310 9,916 2038 75,400 85,300 160,700 75,400 45,900 26,350 147,650 13,050 7,701 2039 71,200 87,800 159,000 71,200 47,300 25,675 144,175 14,825 8,491
153,179 107,159
Current Baseline After Issuance of 2020 Pension Bonds
Page 205 of 229

County of Grand Traverse, MichiganScenario 2C :: 6.35% Rate of Return | Current Market Interest Rates LESS 50 Basis PointsDivision 43 :: Actuarial Value of Assets
Valuation Year Employer Employer Total Annual Employer Employer 2020 Bonds Total Annual Nominal Present
Ending Normal Cost UAL Employer Normal Cost UAL Debt Employer Annual ValueDecember 31 Contribution Contribution Contribution Contribution Contribution Service Contribution Savings Savings
2021 182,000 51,600 233,600 182,000 27,800 13,926 223,726 9,874 9,742 2022 172,000 53,100 225,100 172,000 28,600 20,695 221,295 3,805 3,680 2023 164,000 54,700 218,700 164,000 29,500 20,440 213,940 4,760 4,513 2024 158,000 56,400 214,400 158,000 30,400 20,185 208,585 5,815 5,404 2025 151,000 58,100 209,100 151,000 31,300 19,930 202,230 6,870 6,258 2026 144,000 59,800 203,800 144,000 32,200 19,675 195,875 7,925 7,076 2027 136,000 61,600 197,600 136,000 33,200 24,420 193,620 3,980 3,483 2028 127,000 63,400 190,400 127,000 34,200 24,080 185,280 5,120 4,392 2029 120,000 65,300 185,300 120,000 35,200 23,740 178,940 6,360 5,348 2030 114,000 67,300 181,300 114,000 36,200 23,400 173,600 7,700 6,346 2031 108,000 69,300 177,300 108,000 37,300 23,060 168,360 8,940 7,222 2032 104,000 71,400 175,400 104,000 38,500 22,720 165,220 10,180 8,061 2033 99,300 73,500 172,800 99,300 39,600 22,380 161,280 11,520 8,942 2034 94,600 75,800 170,400 94,600 40,800 22,040 157,440 12,960 9,860 2035 89,800 78,000 167,800 89,800 42,000 21,700 153,500 14,300 10,664 2036 85,000 80,400 165,400 85,000 43,300 21,360 149,660 15,740 11,738 2037 80,200 82,800 163,000 80,200 44,600 21,020 145,820 17,180 12,310 2038 75,400 85,300 160,700 75,400 45,900 20,680 141,980 18,720 13,147 2039 71,200 87,800 159,000 71,200 47,300 20,340 138,840 20,160 13,878
191,909 152,063
Current Baseline After Issuance of 2020 Pension Bonds
Page 206 of 229

County of Grand Traverse, MichiganScenario 3A :: 5.35% Rate of Return | Current Market Interest RatesDivision 43 :: Actuarial Value of Assets
Valuation Year Employer Employer Total Annual Employer Employer 2020 Bonds Total Annual Nominal Present
Ending Normal Cost UAL Employer Normal Cost UAL Debt Employer Annual ValueDecember 31 Contribution Contribution Contribution Contribution Contribution Service Contribution Savings Savings
2021 242,000 74,300 316,300 242,000 52,600 14,299 308,899 7,402 7,278 2022 228,000 76,500 304,500 228,000 54,200 21,384 303,584 916 878 2023 218,000 78,800 296,800 218,000 55,800 21,314 295,114 1,687 1,577 2024 210,000 81,200 291,200 210,000 57,400 21,225 288,625 2,575 2,349 2025 201,000 83,600 284,600 201,000 59,200 21,116 281,316 3,285 2,921 2026 192,000 86,100 278,100 192,000 60,900 20,976 273,876 4,224 3,664 2027 181,000 88,700 269,700 181,000 62,800 20,807 264,607 5,094 4,309 2028 171,000 91,400 262,400 171,000 64,700 25,607 261,307 1,093 902 2029 162,000 94,100 256,100 162,000 66,600 25,301 253,901 2,199 1,769 2030 154,000 96,900 250,900 154,000 68,600 24,965 247,565 3,335 2,617 2031 147,000 99,800 246,800 147,000 70,700 24,609 242,309 4,491 3,437 2032 141,000 103,000 244,000 141,000 72,800 24,153 237,953 6,047 4,513 2033 136,000 106,000 242,000 136,000 75,000 23,697 234,697 7,303 5,315 2034 130,000 109,000 239,000 130,000 77,200 23,241 230,441 8,559 6,075 2035 124,000 112,000 236,000 124,000 79,500 22,785 226,285 9,715 6,724 2036 118,000 116,000 234,000 118,000 81,900 22,329 222,229 11,771 8,147 2037 112,000 119,000 231,000 112,000 84,400 21,781 218,181 12,819 8,439 2038 106,000 123,000 229,000 106,000 86,900 21,233 214,133 14,867 9,544 2039 100,000 126,000 226,000 100,000 89,500 25,685 215,185 10,815 6,771
118,195 87,229
Current Baseline After Issuance of 2020 Pension Bonds
Page 207 of 229

County of Grand Traverse, MichiganScenario 3B :: 5.35% Rate of Return | Current Market Interest Rates PLUS 50 Basis PointsDivision 43 :: Actuarial Value of Assets
Valuation Year Employer Employer Total Annual Employer Employer 2020 Bonds Total Annual Nominal Present
Ending Normal Cost UAL Employer Normal Cost UAL Debt Employer Annual ValueDecember 31 Contribution Contribution Contribution Contribution Contribution Service Contribution Savings Savings
2021 242,000 74,300 316,300 242,000 52,600 16,236 310,836 5,464 5,356 2022 228,000 76,500 304,500 228,000 54,200 24,045 306,245 (1,745) (1,660) 2023 218,000 78,800 296,800 218,000 55,800 23,640 297,440 (640) (591) 2024 210,000 81,200 291,200 210,000 57,400 23,235 290,635 565 506 2025 201,000 83,600 284,600 201,000 59,200 22,830 283,030 1,570 1,366 2026 192,000 86,100 278,100 192,000 60,900 22,425 275,325 2,775 2,343 2027 181,000 88,700 269,700 181,000 62,800 22,020 265,820 3,880 3,180 2028 171,000 91,400 262,400 171,000 64,700 21,615 257,315 5,085 4,045 2029 162,000 94,100 256,100 162,000 66,600 26,210 254,810 1,290 996 2030 154,000 96,900 250,900 154,000 68,600 25,670 248,270 2,630 1,971 2031 147,000 99,800 246,800 147,000 70,700 25,130 242,830 3,970 2,887 2032 141,000 103,000 244,000 141,000 72,800 24,590 238,390 5,610 3,960 2033 136,000 106,000 242,000 136,000 75,000 24,050 235,050 6,950 4,761 2034 130,000 109,000 239,000 130,000 77,200 23,510 230,710 8,290 5,512 2035 124,000 112,000 236,000 124,000 79,500 22,970 226,470 9,530 6,151 2036 118,000 116,000 234,000 118,000 81,900 22,430 222,330 11,670 7,532 2037 112,000 119,000 231,000 112,000 84,400 21,890 218,290 12,710 7,728 2038 106,000 123,000 229,000 106,000 86,900 26,350 219,250 9,750 5,754 2039 100,000 126,000 226,000 100,000 89,500 25,675 215,175 10,825 6,200
100,179 67,996
Current Baseline After Issuance of 2020 Pension Bonds
Page 208 of 229
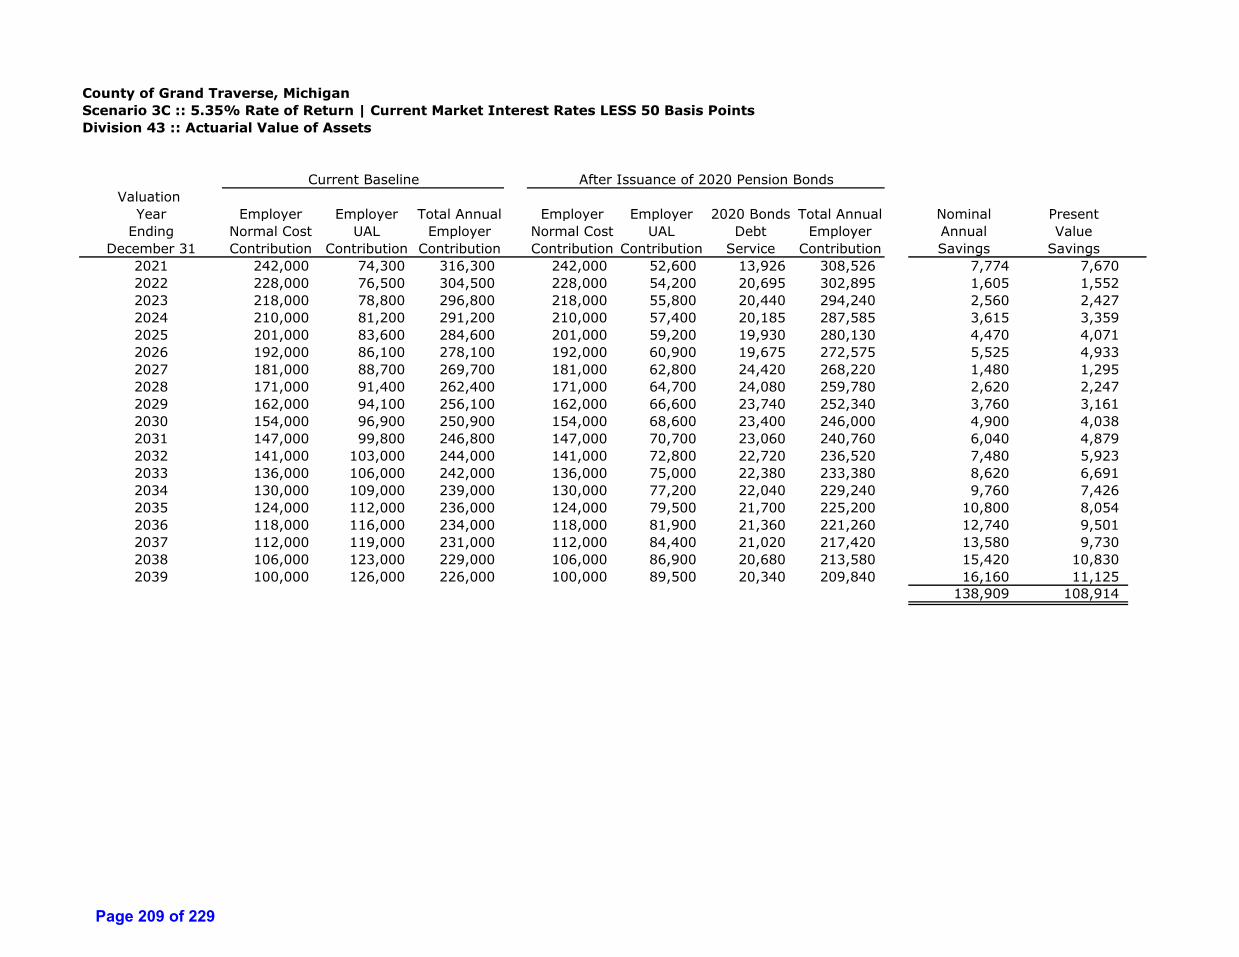
County of Grand Traverse, MichiganScenario 3C :: 5.35% Rate of Return | Current Market Interest Rates LESS 50 Basis PointsDivision 43 :: Actuarial Value of Assets
Valuation Year Employer Employer Total Annual Employer Employer 2020 Bonds Total Annual Nominal Present
Ending Normal Cost UAL Employer Normal Cost UAL Debt Employer Annual ValueDecember 31 Contribution Contribution Contribution Contribution Contribution Service Contribution Savings Savings
2021 242,000 74,300 316,300 242,000 52,600 13,926 308,526 7,774 7,670 2022 228,000 76,500 304,500 228,000 54,200 20,695 302,895 1,605 1,552 2023 218,000 78,800 296,800 218,000 55,800 20,440 294,240 2,560 2,427 2024 210,000 81,200 291,200 210,000 57,400 20,185 287,585 3,615 3,359 2025 201,000 83,600 284,600 201,000 59,200 19,930 280,130 4,470 4,071 2026 192,000 86,100 278,100 192,000 60,900 19,675 272,575 5,525 4,933 2027 181,000 88,700 269,700 181,000 62,800 24,420 268,220 1,480 1,295 2028 171,000 91,400 262,400 171,000 64,700 24,080 259,780 2,620 2,247 2029 162,000 94,100 256,100 162,000 66,600 23,740 252,340 3,760 3,161 2030 154,000 96,900 250,900 154,000 68,600 23,400 246,000 4,900 4,038 2031 147,000 99,800 246,800 147,000 70,700 23,060 240,760 6,040 4,879 2032 141,000 103,000 244,000 141,000 72,800 22,720 236,520 7,480 5,923 2033 136,000 106,000 242,000 136,000 75,000 22,380 233,380 8,620 6,691 2034 130,000 109,000 239,000 130,000 77,200 22,040 229,240 9,760 7,426 2035 124,000 112,000 236,000 124,000 79,500 21,700 225,200 10,800 8,054 2036 118,000 116,000 234,000 118,000 81,900 21,360 221,260 12,740 9,501 2037 112,000 119,000 231,000 112,000 84,400 21,020 217,420 13,580 9,730 2038 106,000 123,000 229,000 106,000 86,900 20,680 213,580 15,420 10,830 2039 100,000 126,000 226,000 100,000 89,500 20,340 209,840 16,160 11,125
138,909 108,914
Current Baseline After Issuance of 2020 Pension Bonds
Page 209 of 229
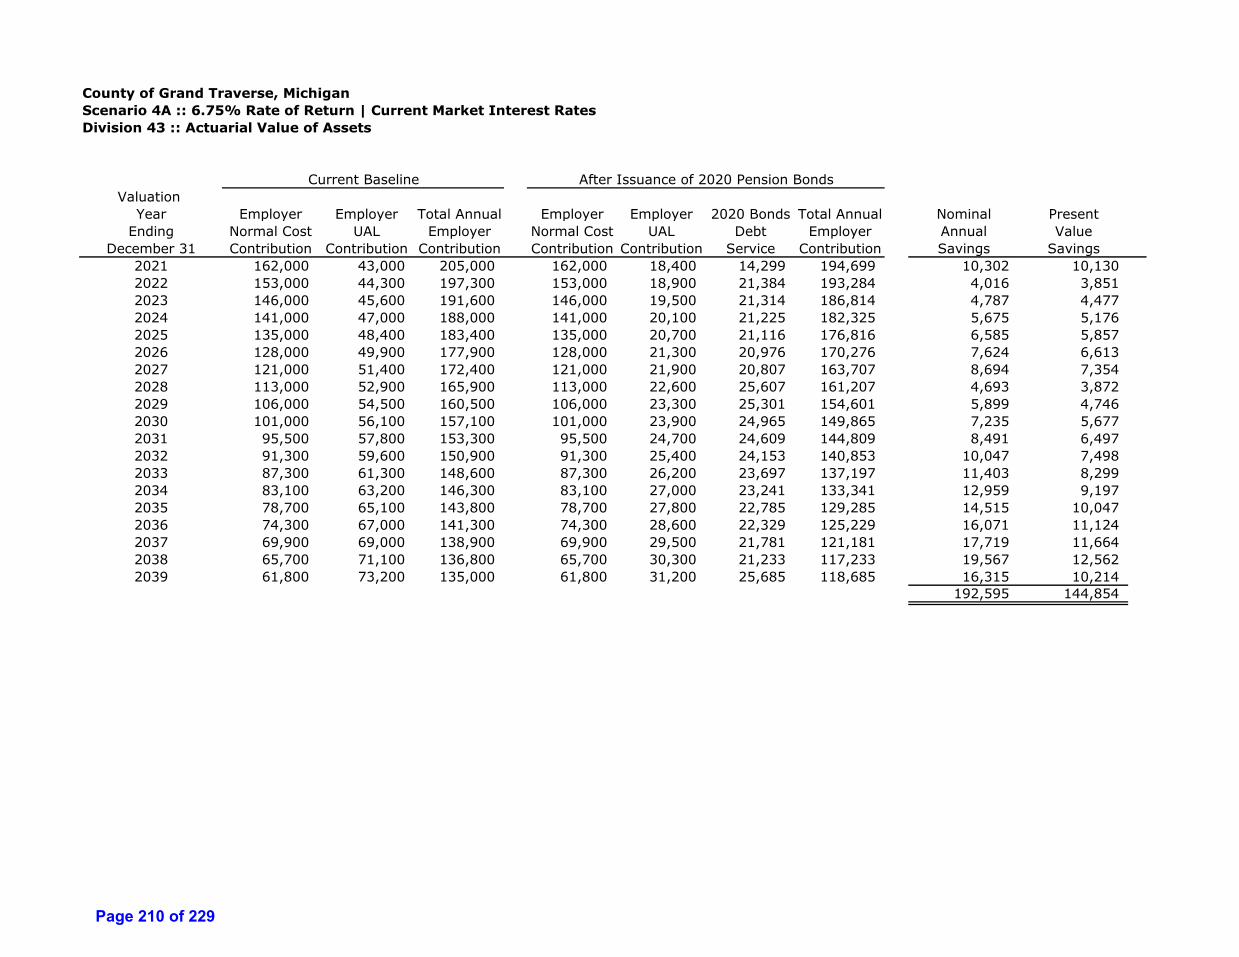
County of Grand Traverse, MichiganScenario 4A :: 6.75% Rate of Return | Current Market Interest RatesDivision 43 :: Actuarial Value of Assets
Valuation Year Employer Employer Total Annual Employer Employer 2020 Bonds Total Annual Nominal Present
Ending Normal Cost UAL Employer Normal Cost UAL Debt Employer Annual ValueDecember 31 Contribution Contribution Contribution Contribution Contribution Service Contribution Savings Savings
2021 162,000 43,000 205,000 162,000 18,400 14,299 194,699 10,302 10,130 2022 153,000 44,300 197,300 153,000 18,900 21,384 193,284 4,016 3,851 2023 146,000 45,600 191,600 146,000 19,500 21,314 186,814 4,787 4,477 2024 141,000 47,000 188,000 141,000 20,100 21,225 182,325 5,675 5,176 2025 135,000 48,400 183,400 135,000 20,700 21,116 176,816 6,585 5,857 2026 128,000 49,900 177,900 128,000 21,300 20,976 170,276 7,624 6,613 2027 121,000 51,400 172,400 121,000 21,900 20,807 163,707 8,694 7,354 2028 113,000 52,900 165,900 113,000 22,600 25,607 161,207 4,693 3,872 2029 106,000 54,500 160,500 106,000 23,300 25,301 154,601 5,899 4,746 2030 101,000 56,100 157,100 101,000 23,900 24,965 149,865 7,235 5,677 2031 95,500 57,800 153,300 95,500 24,700 24,609 144,809 8,491 6,497 2032 91,300 59,600 150,900 91,300 25,400 24,153 140,853 10,047 7,498 2033 87,300 61,300 148,600 87,300 26,200 23,697 137,197 11,403 8,299 2034 83,100 63,200 146,300 83,100 27,000 23,241 133,341 12,959 9,197 2035 78,700 65,100 143,800 78,700 27,800 22,785 129,285 14,515 10,047 2036 74,300 67,000 141,300 74,300 28,600 22,329 125,229 16,071 11,124 2037 69,900 69,000 138,900 69,900 29,500 21,781 121,181 17,719 11,664 2038 65,700 71,100 136,800 65,700 30,300 21,233 117,233 19,567 12,562 2039 61,800 73,200 135,000 61,800 31,200 25,685 118,685 16,315 10,214
192,595 144,854
Current Baseline After Issuance of 2020 Pension Bonds
Page 210 of 229

County of Grand Traverse, MichiganScenario 4B :: 6.75% Rate of Return | Current Market Interest Rates PLUS 50 Basis PointsDivision 43 :: Actuarial Value of Assets
Valuation Year Employer Employer Total Annual Employer Employer 2020 Bonds Total Annual Nominal Present
Ending Normal Cost UAL Employer Normal Cost UAL Debt Employer Annual ValueDecember 31 Contribution Contribution Contribution Contribution Contribution Service Contribution Savings Savings
2021 162,000 43,000 205,000 162,000 18,400 16,236 196,636 8,364 8,199 2022 153,000 44,300 197,300 153,000 18,900 24,045 195,945 1,355 1,289 2023 146,000 45,600 191,600 146,000 19,500 23,640 189,140 2,460 2,272 2024 141,000 47,000 188,000 141,000 20,100 23,235 184,335 3,665 3,285 2025 135,000 48,400 183,400 135,000 20,700 22,830 178,530 4,870 4,236 2026 128,000 49,900 177,900 128,000 21,300 22,425 171,725 6,175 5,214 2027 121,000 51,400 172,400 121,000 21,900 22,020 164,920 7,480 6,130 2028 113,000 52,900 165,900 113,000 22,600 21,615 157,215 8,685 6,908 2029 106,000 54,500 160,500 106,000 23,300 26,210 155,510 4,990 3,852 2030 101,000 56,100 157,100 101,000 23,900 25,670 150,570 6,530 4,893 2031 95,500 57,800 153,300 95,500 24,700 25,130 145,330 7,970 5,796 2032 91,300 59,600 150,900 91,300 25,400 24,590 141,290 9,610 6,783 2033 87,300 61,300 148,600 87,300 26,200 24,050 137,550 11,050 7,570 2034 83,100 63,200 146,300 83,100 27,000 23,510 133,610 12,690 8,438 2035 78,700 65,100 143,800 78,700 27,800 22,970 129,470 14,330 9,249 2036 74,300 67,000 141,300 74,300 28,600 22,430 125,330 15,970 10,307 2037 69,900 69,000 138,900 69,900 29,500 21,890 121,290 17,610 10,707 2038 65,700 71,100 136,800 65,700 30,300 26,350 122,350 14,450 8,527 2039 61,800 73,200 135,000 61,800 31,200 25,675 118,675 16,325 9,350
174,579 123,005
Current Baseline After Issuance of 2020 Pension Bonds
Page 211 of 229
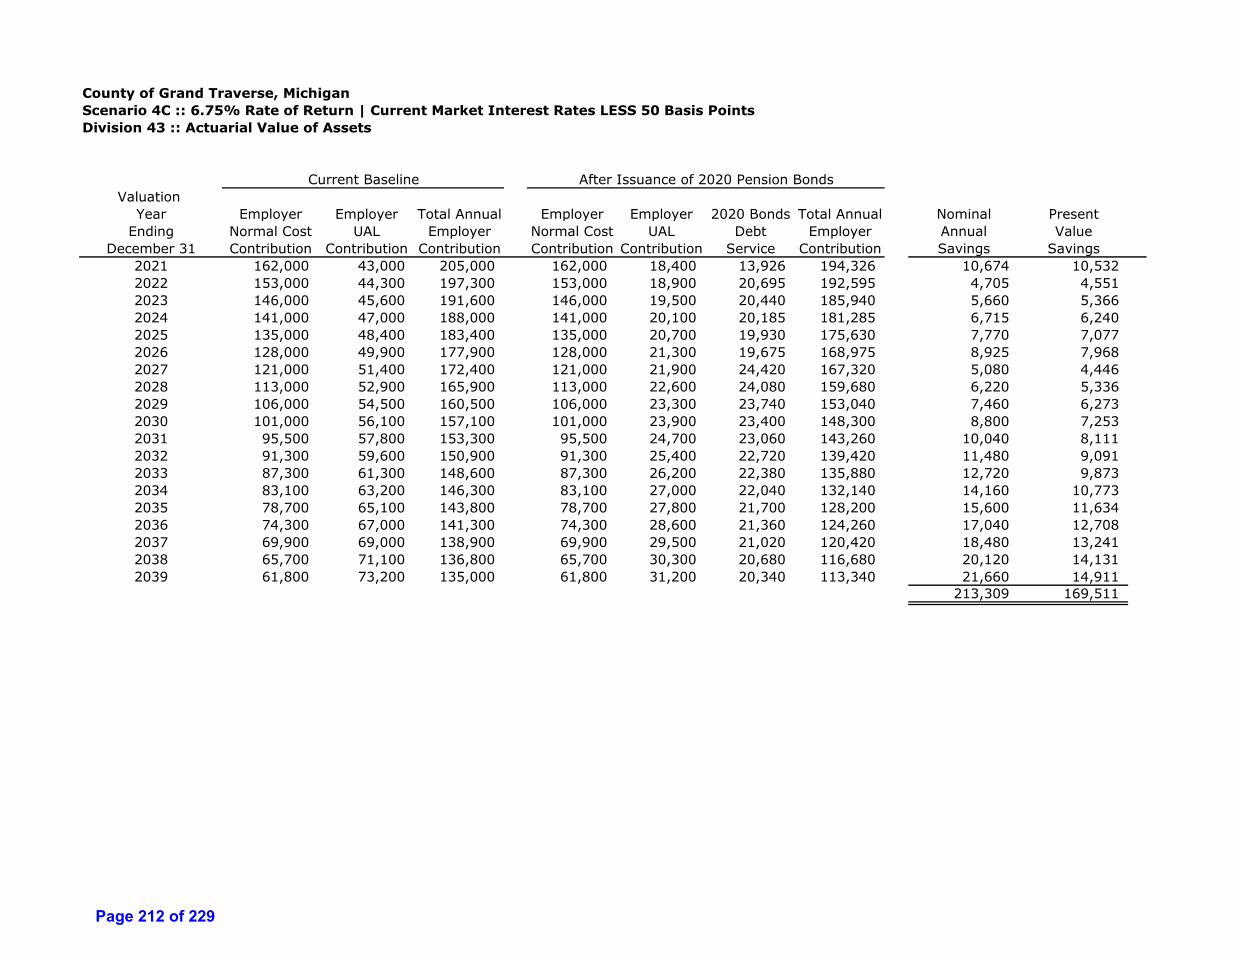
County of Grand Traverse, MichiganScenario 4C :: 6.75% Rate of Return | Current Market Interest Rates LESS 50 Basis PointsDivision 43 :: Actuarial Value of Assets
Valuation Year Employer Employer Total Annual Employer Employer 2020 Bonds Total Annual Nominal Present
Ending Normal Cost UAL Employer Normal Cost UAL Debt Employer Annual ValueDecember 31 Contribution Contribution Contribution Contribution Contribution Service Contribution Savings Savings
2021 162,000 43,000 205,000 162,000 18,400 13,926 194,326 10,674 10,532 2022 153,000 44,300 197,300 153,000 18,900 20,695 192,595 4,705 4,551 2023 146,000 45,600 191,600 146,000 19,500 20,440 185,940 5,660 5,366 2024 141,000 47,000 188,000 141,000 20,100 20,185 181,285 6,715 6,240 2025 135,000 48,400 183,400 135,000 20,700 19,930 175,630 7,770 7,077 2026 128,000 49,900 177,900 128,000 21,300 19,675 168,975 8,925 7,968 2027 121,000 51,400 172,400 121,000 21,900 24,420 167,320 5,080 4,446 2028 113,000 52,900 165,900 113,000 22,600 24,080 159,680 6,220 5,336 2029 106,000 54,500 160,500 106,000 23,300 23,740 153,040 7,460 6,273 2030 101,000 56,100 157,100 101,000 23,900 23,400 148,300 8,800 7,253 2031 95,500 57,800 153,300 95,500 24,700 23,060 143,260 10,040 8,111 2032 91,300 59,600 150,900 91,300 25,400 22,720 139,420 11,480 9,091 2033 87,300 61,300 148,600 87,300 26,200 22,380 135,880 12,720 9,873 2034 83,100 63,200 146,300 83,100 27,000 22,040 132,140 14,160 10,773 2035 78,700 65,100 143,800 78,700 27,800 21,700 128,200 15,600 11,634 2036 74,300 67,000 141,300 74,300 28,600 21,360 124,260 17,040 12,708 2037 69,900 69,000 138,900 69,900 29,500 21,020 120,420 18,480 13,241 2038 65,700 71,100 136,800 65,700 30,300 20,680 116,680 20,120 14,131 2039 61,800 73,200 135,000 61,800 31,200 20,340 113,340 21,660 14,911
213,309 169,511
Current Baseline After Issuance of 2020 Pension Bonds
Page 212 of 229
To: J. Lindsey Dood, Chief Financial Officer, Grand Traverse Pavilions
From: Jon Lanczak, Senior Consulting Manager, Plante Moran, PLLC
RE: Pension Funding Analysis and Reimbursement Considerations
Date: September 22, 2020
Michigan Medicaid Reimbursement System
The Michigan Medicaid reimbursement system for long‐term care nursing facility providers is currently a cost‐based system. In other words, the reimbursement rates for Michigan nursing facility providers are calculated annually using data from a facility’s as filed Medicaid cost report for the fiscal year prior to the year in which the rate is set. For example, the Medicaid per diem rates effective October 1, 2020 are based on a facility’s 2019 as filed cost report.
The per day Medicaid rate is based on a facility’s actual routine (variable) and capital (plant) cost of care, up to the variable cost limit (VCL) and the facility specific plant cost limit (PCL). Variable costs include the routine cost of caring for a resident, which includes the cost of salaries and wages, employee benefits including pension, workers compensation, supplies, and equipment in the nursing, nursing administration, dietary, laundry, housekeeping, social service, activities, and medical records. Plant costs include interest expense on allowable borrowings, property tax expense, and depreciation expense.
The VCL is set each year at the 80th percentile for all providers in the same category (class) of nursing home (Class I or Class III) as defined by the Michigan Department of Community Health (MDHHS). Grand Traverse Pavilion falls into the Class III nursing facility category which includes both County Medical Care Facilities (MCF) and Hospital Long‐Term Care Nursing Facilities (HLTCU). The current VCL for Class III nursing facilities is $318.27 per day but a new VCL for the rate period beginning October 1, 2020 will be issued by MDHHS soon, which will likely be greater than the $318.27 per diem currently in effect for the period from October 1, 2019 through September 30, 2020.
If a facility’s variable cost per day exceeds the VCL, the per diem rate calculation limits the variable rate component to the lesser of the facility’s actual variable cost per day or the VCL. Based on Grand Traverse Pavilion’s as‐filed 2019 Medicaid cost report, the per diem variable cost is approximately $273.89 giving the facility capacity to spend on routine patient care related activities, up to the limit of approximately $44 per day or $3.6 Million on an annual basis. Any additional spending on routine patient care activities would translate into a higher Medicaid reimbursement per diem rate, the following October 1st, under the current system as described above.
Page 213 of 229
Quality Assurance & Assessment Program (QAAP)
Nursing facility providers operating in the State of Michigan are required to pay provider tax which is then used by MDHHS through the federal matching program (FMAP) to draw down funds from the federal government (CMS) to preserve higher Medicaid rates and to fund the Quality Assurance Supplement (QAS) add‐on. Provider taxes are paid based on the number of non‐Medicare days as reported in the most recently filed cost report.
For example, the provider tax assessment for State fiscal year beginning October 1, 2020 was based on the number of non‐Medicare days or Medicare‐like days reported in a provider’s 2019 Medicaid cost report. Providers are assessed in three separate tiers. Facility with less than 40 beds currently pay $2.00 per non‐Medicare day, facilities with more than 51,000 Medicaid days in the most recent cost report pay $20.15 per non‐Medicare day, and all other facilities pay $28.25 per non‐Medicare day and will be updated effective October 1, 2020. Grand Traverse Pavilion has historically had more than 51,000 Medicaid days on an annual basis, which has allowed the facility to be assessed at the lower tax rates.
Providers are required to pay the provider tax on a monthly basis and the provider tax pool after the federal match is then used to pay the QAS rate add‐on. For a Class III MCF, the QAS add‐on is calculated at 21.76% of the lower of the provider’s variable cost per day or the Class I VCL, which is currently $218.35 per day. Since Grand Traverse Pavilion has operated at a cost per day that is greater than the Class I VCL (approx. $273.89/day in FY 2019), the facility is receiving and has historically received the maximum QAS add‐on payment.
Certified Public Expenditure
In addition to the Class III per diem Medicaid rate paid to MCFs such as Grand Traverse Pavilion, for services provided to Medicaid beneficiaries, MCFs are eligible for the Certified Public Expenditure (CPE) program. Like the provider tax program (QAAP), CPE is also a FMAP program that allows the MDHHS to draw down additional funds from CMS to cover any qualified facility expenditures that exceed reimbursement through the normal Medicaid per diem rate as described above.
In order to qualify for CPE in any given fiscal year, the per diem rate including the Quality Assurance Supplement (QAS) add‐on, must be lower than the actual cost per day spent during the year including the provider tax expense (QAAP), as reported in the Medicaid cost report. For example, Provider A’s Medicaid per diem rate paid for the period effective October 1, 2020 through September 30, 2021 is based on the spending on routine direct patient care cost in fiscal year 2019. During 2021, let’s assume Provider A increases its spending by making additional contributions toward the unfunded pension liability, resulting in a significant increase in the cost per day as reported in the 2021 cost report.
Since the Medicaid per diem rate paid for 9 months of 2021 (January 2021 through September 2021), was based on 2019 expenses that did not include the additional pension funding, the total Medicaid reimbursement for this 9‐month period was lower than the actual Medicaid cost
Page 214 of 229
incurred during the same 9‐month period. As such, Provider A would likely qualify for certified public expenditure to cover the Medicaid cost that was not covered through the normal Medicaid per diem rate.
Typically, it is more difficult for providers who are assessed the provider tax at the lower tax rates to qualify for CPE, because a portion of the unreimbursed Medicaid cost not covered through the Medicaid per diem rate is then covered by the QAS add‐on.
Grand Traverse Pavilion Pension Funding Analysis
Plante Moran, PLLC (PM) was engaged by Grand Traverse Pavilion to analyze the Medicaid reimbursement potential if Grand Traverse County were to issue bonds to be used to fund a portion of the current unfunded pension liability. The analysis utilized management assumptions for the various funding levels and the intent of the analysis is to determine the portion (if any) of the additional funding levels that could potentially be recouped through the Medicaid program, whether through the normal Medicaid per diem rate and/or CPE.
Management provided one funding level for analysis in the amount of $6,257,154, but PM also used the total unfunded pension liability as of December 31, 2019 ($8,682,932) to help illustrate how additional funding would potentially result in higher reimbursement through not only the Medicaid per diem rate, but also through the CPE program.
As mentioned previously, it is more difficult for providers who are assessed the provider tax at the lower tax rates to qualify for CPE, because a portion of the unreimbursed Medicaid cost not covered through the Medicaid per diem rate is then covered by the QAS add‐on because the add‐on per diem exceeds the tax expense per day by a greater margin. Based on recent utilization statistics provided by management, it appears that Grand Traverse Pavilion will likely not achieve Medicaid utilization greater than 51,000 Medicaid days for FY 2020, and as a result would likely not qualify for the lower provider tax rates in subsequent periods. For the purposes of the analysis it is assumed that Grand Traverse Pavilion will not be able to benefit of the lower tax rates for having 51,000+ Medicaid patient days on an annual basis, which is a key driver of the CPE reimbursement as previously discussed.
On an annual basis, a provider can include as routine direct patient care expense, the actuarially determined annual required contribution (ARC) in the Medicaid cost report. However, if a provider chooses to make additional contributions toward the unfunded liability in any given year, Medicaid allows providers to amortize the additional contributions over the ARC, over a three‐year period.
For example, if Grand Traverse Pavilion were to fund the full $6,257,154 as an additional contribution in FY 2020 the allowable expense in the Medicaid cost report would be one‐third ($2,085,718) in 2020, one‐third in 2021, and one‐third in 2022. This methodology is supported by Section 8.25 “Rebates Larger Than One Year’s Expense and Extraordinary Expense” of the Nursing Facility Chapter, Cost Reporting & Reimbursement Appendix, of the Medicaid Provider Manual (MPM) and has been audited and accepted by the MDHHS Office of Audit.
Page 215 of 229
In a typical pension funding scenario, as it relates to Medicaid reimbursement, a provider operating under the VCL will qualify for CPE in the first and second year after the additional contributions are made. Then in the third, fourth, and fifth years after, providers will realize increased reimbursement through the per‐diem Medicaid rate. The five‐year period for the purposes of this analysis assumes the additional contribution was made in fiscal year 2020, and the last year of the five‐year period is fiscal year 2024.
The analysis based on the $6.2 Million of additional funding above the ARC resulted in 52% of the total additional contribution or $3,271,060, reimbursed through a combination of CPE and the Medicaid per‐diem rate. In this scenario, only $41,700 of the $3,271,060 is realized through CPE in years one and two (2020 and 2021), while the remainder is realized through the Medicaid per diem rate in years three, four, and five (2022‐2024).
The analysis based on the hypothetical scenario with $8.6 Million of additional funding above the ARC resulted in 55% of the total additional contribution or $4,812,038, reimbursed through a combination of CPE and the Medicaid per‐diem rate. In this scenario, $375,563 of the $4,812,038 is realized through CPE in years one and two (2020 and 2021), while the remainder is realized through the Medicaid per diem rate in years three, four, and five (2022‐2024).
Future of Michigan Medicaid Reimbursement
As described previously, the Michigan Medicaid reimbursement system is cost‐based where a provider’s Medicaid cost report sets the Medicaid per diem rate for the following rate year. Due to the lag in rate setting, an abnormal year like 2020 with COVID‐19 and the complexity and uncertainty that has come with it, can really have an adverse impact on facility occupancy resulting in reductions to both revenues and expenses, and ultimately the Medicaid per diem rates based on the cost reports. As a result, the MDHHS has been considered bypassing the 2020 cost reports for rate setting purposes, and instead would utilize the 2019 cost reports for the normal period effective October 1, 2020 but also October 1, 2021, which would have normally been set based on 2020 cost reports.
This presents potential risk that any additional contributions made in fiscal year 2020 to Grand Traverse Pavilion’s defined benefit pension plan would not result in any additional Medicaid reimbursement through the normal Medicaid per diem rate nor through CPE. The pension analysis described above assumes that the additional pension contributions would be made in fiscal year 2020, which would be utilized for rate setting in the current cost‐based Medicaid reimbursement system for the rate effective October 1, 2021.
Additionally, the COVID‐19 pandemic has resulted in providers receiving an influx of funds through the CARES Act Provider Relief Funding, Paycheck Protection Program forgivable loans (PPP), FEMA Grants, and other various funding sources. Medicare and Medicaid cost reporting instructions and regulations require that grant revenue is offset against related expenses. The guidance received from CMS to date, has indicated that these COVID‐19 related funds are to be considered grants in most cases, and as a result would require an offset against related expenses,
Page 216 of 229
reducing the allowable cost used for Medicaid per diem rate setting purposes and ultimately reducing the per diem Medicaid rate.
Lastly, Michigan is one of very few states that currently utilizes a cost‐based Medicaid reimbursement system for nursing facility providers. Many state Medicaid programs have transitioned to a prospective payment system, like Medicare and many Medicare HMO plans. The MDHHS has not released any official plan for the future of Medicaid reimbursement for nursing facility providers for rates effective October 1, 2021 and beyond, but it is very possible that Michigan will transition from the current cost‐based reimbursement system as soon as October 1, 2021, which may increase the risk associated with the fact that the additional pension contributions as discussed previously, would not result in any additional Medicaid reimbursement regardless of whether the contributions were made in fiscal year 2020 or 2021.
Page 217 of 229
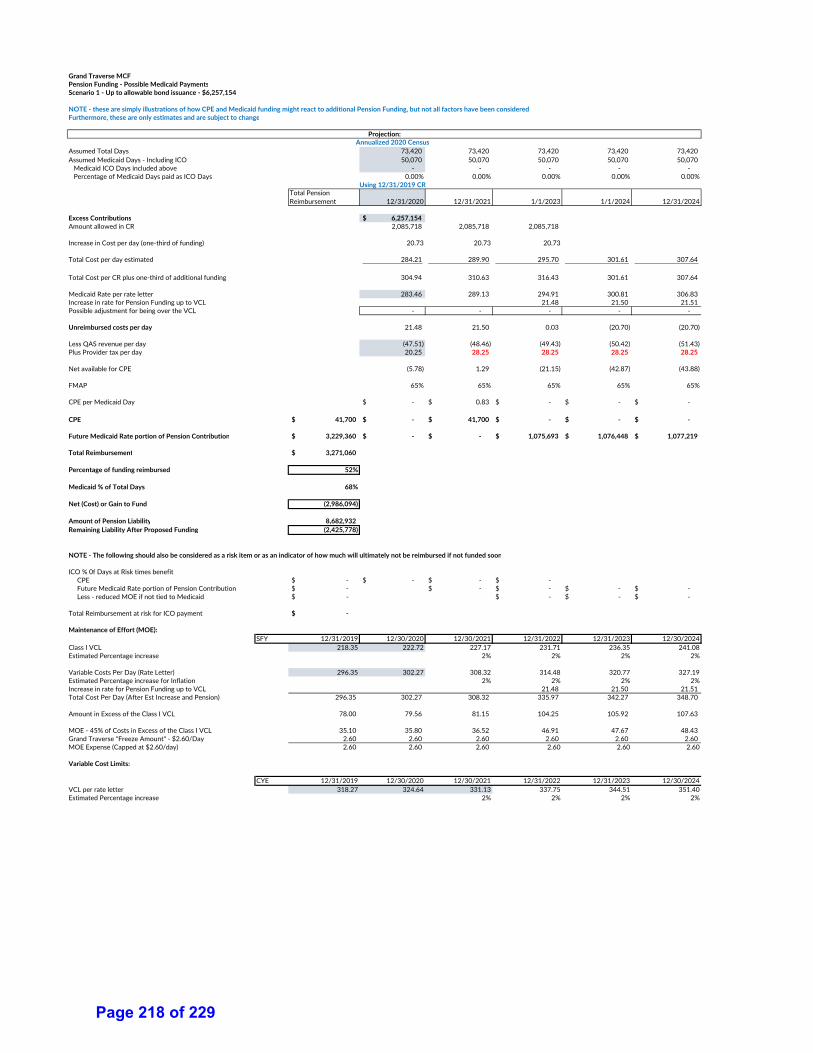
Grand Traverse MCFPension Funding ‐ Possible Medicaid PaymentsScenario 1 ‐ Up to allowable bond issuance ‐ $6,257,154
NOTE ‐ these are simply illustrations of how CPE and Medicaid funding might react to additional Pension Funding, but not all factors have been consideredFurthermore, these are only estimates and are subject to change
Annualized 2020 CensusAssumed Total Days 73,420 73,420 73,420 73,420 73,420 Assumed Medicaid Days ‐ Including ICO 50,070 50,070 50,070 50,070 50,070 Medicaid ICO Days included above ‐ ‐ ‐ ‐ ‐ Percentage of Medicaid Days paid as ICO Days 0.00% 0.00% 0.00% 0.00% 0.00%
Using 12/31/2019 CRTotal Pension Reimbursement 12/31/2020 12/31/2021 1/1/2023 1/1/2024 12/31/2024
Excess Contributions 6,257,154$ Amount allowed in CR 2,085,718 2,085,718 2,085,718
Increase in Cost per day (one‐third of funding) 20.73 20.73 20.73
Total Cost per day estimated 284.21 289.90 295.70 301.61 307.64
Total Cost per CR plus one‐third of additional funding 304.94 310.63 316.43 301.61 307.64
Medicaid Rate per rate letter 283.46 289.13 294.91 300.81 306.83 Increase in rate for Pension Funding up to VCL 21.48 21.50 21.51 Possible adjustment for being over the VCL ‐ ‐ ‐ ‐ ‐
Unreimbursed costs per day 21.48 21.50 0.03 (20.70) (20.70)
Less QAS revenue per day (47.51) (48.46) (49.43) (50.42) (51.43) Plus Provider tax per day 20.25 28.25 28.25 28.25 28.25
Net available for CPE (5.78) 1.29 (21.15) (42.87) (43.88)
FMAP 65% 65% 65% 65% 65%
CPE per Medicaid Day ‐$ 0.83$ ‐$ ‐$ ‐$
CPE 41,700$ ‐$ 41,700$ ‐$ ‐$ ‐$
Future Medicaid Rate portion of Pension Contribution 3,229,360$ ‐$ ‐$ 1,075,693$ 1,076,448$ 1,077,219$
Total Reimbursement 3,271,060$
Percentage of funding reimbursed 52%
Medicaid % of Total Days 68%
Net (Cost) or Gain to Fund (2,986,094)
Amount of Pension Liability 8,682,932 Remaining Liability After Proposed Funding (2,425,778)
NOTE ‐ The following should also be considered as a risk item or as an indicator of how much will ultimately not be reimbursed if not funded soon
ICO % 0f Days at Risk times benefit CPE ‐$ ‐$ ‐$ ‐$ Future Medicaid Rate portion of Pension Contribution ‐$ ‐$ ‐$ ‐$ ‐$ Less ‐ reduced MOE if not tied to Medicaid ‐$ ‐$ ‐$ ‐$
Total Reimbursement at risk for ICO payment ‐$
Maintenance of Effort (MOE):SFY 12/31/2019 12/30/2020 12/30/2021 12/31/2022 12/31/2023 12/30/2024
Class I VCL 218.35 222.72 227.17 231.71 236.35 241.08Estimated Percentage increase 2% 2% 2% 2%
Variable Costs Per Day (Rate Letter) 296.35 302.27 308.32 314.48 320.77 327.19Estimated Percentage increase for Inflation 2% 2% 2% 2%Increase in rate for Pension Funding up to VCL 21.48 21.50 21.51 Total Cost Per Day (After Est Increase and Pension) 296.35 302.27 308.32 335.97 342.27 348.70
Amount in Excess of the Class I VCL 78.00 79.56 81.15 104.25 105.92 107.63
MOE ‐ 45% of Costs in Excess of the Class I VCL 35.10 35.80 36.52 46.91 47.67 48.43 Grand Traverse "Freeze Amount" ‐ $2.60/Day 2.60 2.60 2.60 2.60 2.60 2.60 MOE Expense (Capped at $2.60/day) 2.60 2.60 2.60 2.60 2.60 2.60
Variable Cost Limits:
CYE 12/31/2019 12/30/2020 12/30/2021 12/31/2022 12/31/2023 12/30/2024VCL per rate letter 318.27 324.64 331.13 337.75 344.51 351.40Estimated Percentage increase 2% 2% 2% 2%
Projection:
Page 218 of 229
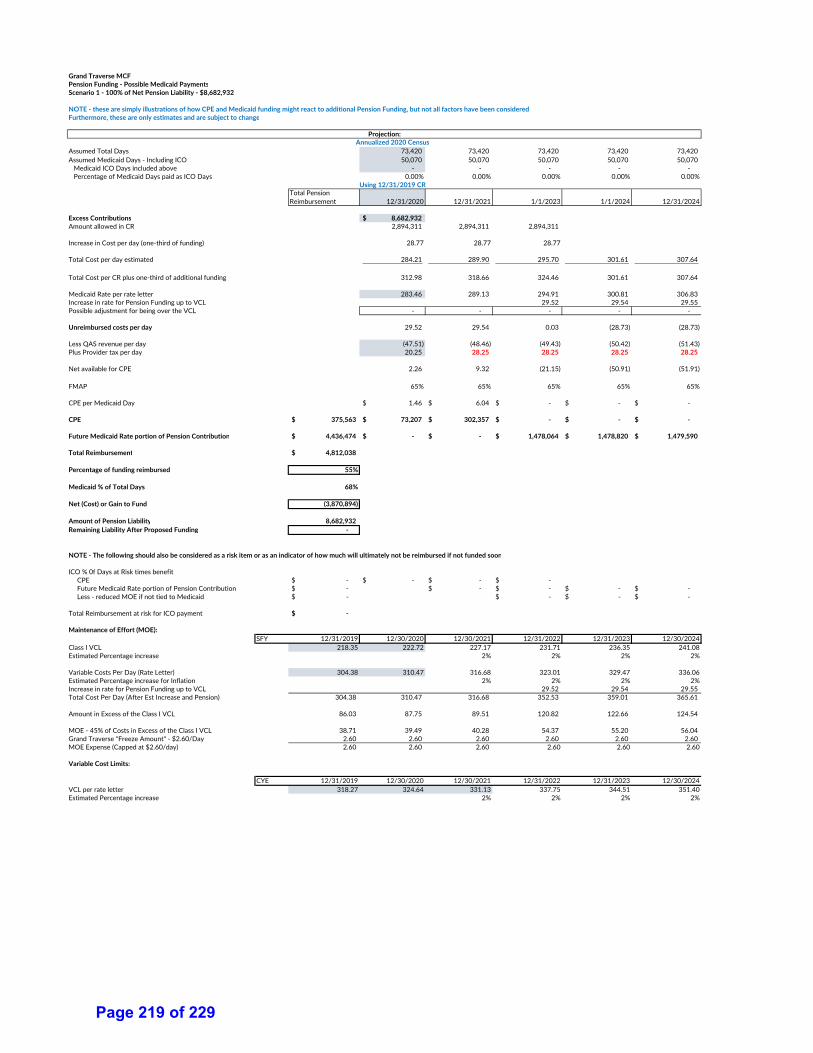
Grand Traverse MCFPension Funding ‐ Possible Medicaid PaymentsScenario 1 ‐ 100% of Net Pension Liability ‐ $8,682,932
NOTE ‐ these are simply illustrations of how CPE and Medicaid funding might react to additional Pension Funding, but not all factors have been consideredFurthermore, these are only estimates and are subject to change
Annualized 2020 CensusAssumed Total Days 73,420 73,420 73,420 73,420 73,420 Assumed Medicaid Days ‐ Including ICO 50,070 50,070 50,070 50,070 50,070 Medicaid ICO Days included above ‐ ‐ ‐ ‐ ‐ Percentage of Medicaid Days paid as ICO Days 0.00% 0.00% 0.00% 0.00% 0.00%
Using 12/31/2019 CRTotal Pension Reimbursement 12/31/2020 12/31/2021 1/1/2023 1/1/2024 12/31/2024
Excess Contributions 8,682,932$ Amount allowed in CR 2,894,311 2,894,311 2,894,311
Increase in Cost per day (one‐third of funding) 28.77 28.77 28.77
Total Cost per day estimated 284.21 289.90 295.70 301.61 307.64
Total Cost per CR plus one‐third of additional funding 312.98 318.66 324.46 301.61 307.64
Medicaid Rate per rate letter 283.46 289.13 294.91 300.81 306.83 Increase in rate for Pension Funding up to VCL 29.52 29.54 29.55 Possible adjustment for being over the VCL ‐ ‐ ‐ ‐ ‐
Unreimbursed costs per day 29.52 29.54 0.03 (28.73) (28.73)
Less QAS revenue per day (47.51) (48.46) (49.43) (50.42) (51.43) Plus Provider tax per day 20.25 28.25 28.25 28.25 28.25
Net available for CPE 2.26 9.32 (21.15) (50.91) (51.91)
FMAP 65% 65% 65% 65% 65%
CPE per Medicaid Day 1.46$ 6.04$ ‐$ ‐$ ‐$
CPE 375,563$ 73,207$ 302,357$ ‐$ ‐$ ‐$
Future Medicaid Rate portion of Pension Contribution 4,436,474$ ‐$ ‐$ 1,478,064$ 1,478,820$ 1,479,590$
Total Reimbursement 4,812,038$
Percentage of funding reimbursed 55%
Medicaid % of Total Days 68%
Net (Cost) or Gain to Fund (3,870,894)
Amount of Pension Liability 8,682,932 Remaining Liability After Proposed Funding ‐
NOTE ‐ The following should also be considered as a risk item or as an indicator of how much will ultimately not be reimbursed if not funded soon
ICO % 0f Days at Risk times benefit CPE ‐$ ‐$ ‐$ ‐$ Future Medicaid Rate portion of Pension Contribution ‐$ ‐$ ‐$ ‐$ ‐$ Less ‐ reduced MOE if not tied to Medicaid ‐$ ‐$ ‐$ ‐$
Total Reimbursement at risk for ICO payment ‐$
Maintenance of Effort (MOE):SFY 12/31/2019 12/30/2020 12/30/2021 12/31/2022 12/31/2023 12/30/2024
Class I VCL 218.35 222.72 227.17 231.71 236.35 241.08Estimated Percentage increase 2% 2% 2% 2%
Variable Costs Per Day (Rate Letter) 304.38 310.47 316.68 323.01 329.47 336.06Estimated Percentage increase for Inflation 2% 2% 2% 2%Increase in rate for Pension Funding up to VCL 29.52 29.54 29.55 Total Cost Per Day (After Est Increase and Pension) 304.38 310.47 316.68 352.53 359.01 365.61
Amount in Excess of the Class I VCL 86.03 87.75 89.51 120.82 122.66 124.54
MOE ‐ 45% of Costs in Excess of the Class I VCL 38.71 39.49 40.28 54.37 55.20 56.04 Grand Traverse "Freeze Amount" ‐ $2.60/Day 2.60 2.60 2.60 2.60 2.60 2.60 MOE Expense (Capped at $2.60/day) 2.60 2.60 2.60 2.60 2.60 2.60
Variable Cost Limits:
CYE 12/31/2019 12/30/2020 12/30/2021 12/31/2022 12/31/2023 12/30/2024VCL per rate letter 318.27 324.64 331.13 337.75 344.51 351.40Estimated Percentage increase 2% 2% 2% 2%
Projection:
Page 219 of 229
Page 220 of 229
dgratton
Text Box
10
Page 221 of 229
Page 222 of 229
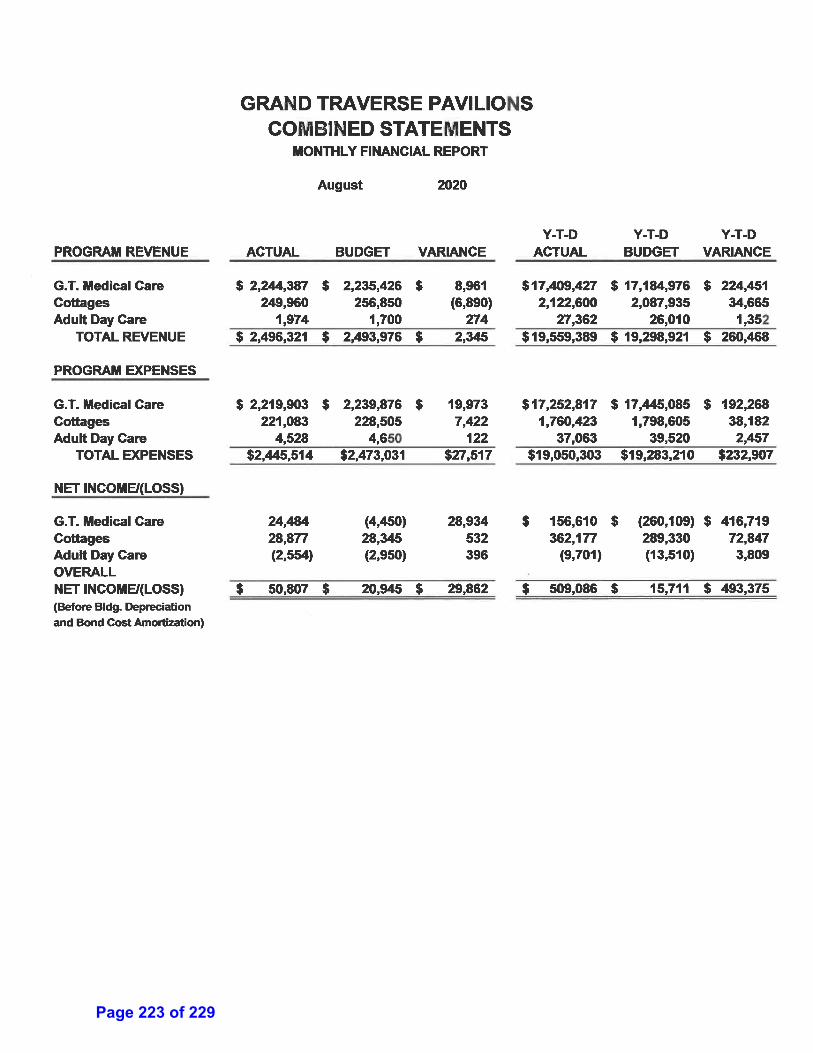
Page 223 of 229
Page 224 of 229
Page 225 of 229
Page 226 of 229
Page 227 of 229
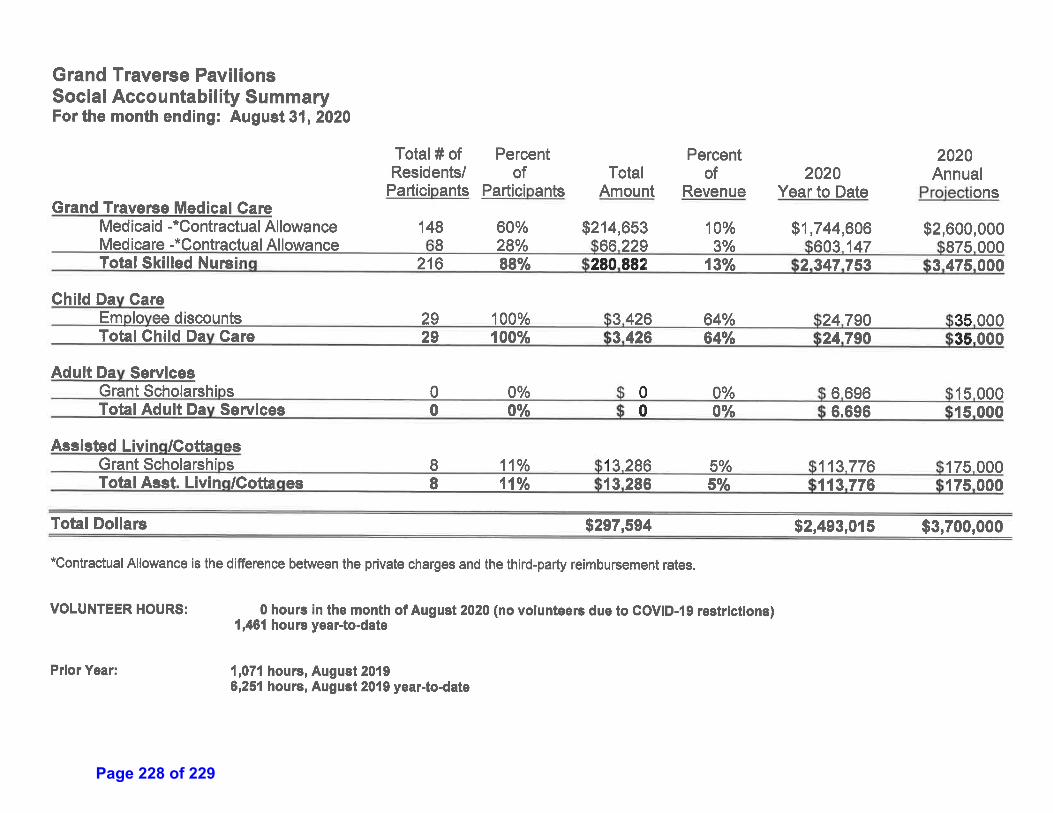
Page 228 of 229
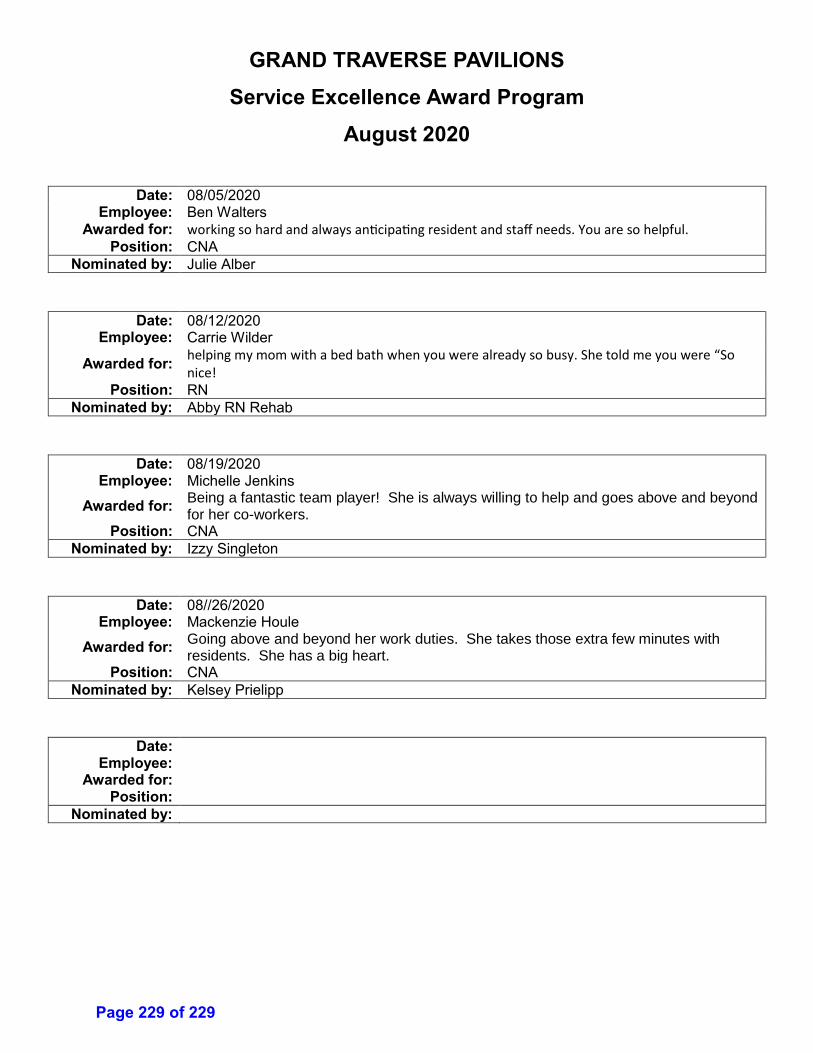
GRAND TRAVERSE PAVILIONS
Service Excellence Award Program
August 2020
Date: 08/05/2020 Employee: Ben Walters
Awarded for: working so hard and always anticipating resident and staff needs. You are so helpful. Position: CNA
Nominated by: Julie Alber
Date: 08/12/2020 Employee: Carrie Wilder
Awarded for: helping my mom with a bed bath when you were already so busy. She told me you were “So nice!
Position: RN
Nominated by: Abby RN Rehab
Date: 08/19/2020 Employee: Michelle Jenkins
Awarded for: Being a fantastic team player! She is always willing to help and goes above and beyond for her co-workers.
Position: CNA
Nominated by: Izzy Singleton
Date: 08//26/2020 Employee: Mackenzie Houle
Awarded for: Going above and beyond her work duties. She takes those extra few minutes with residents. She has a big heart.
Position: CNA
Nominated by: Kelsey Prielipp
Date: Employee:
Awarded for: Position:
Nominated by:
Page 229 of 229
dgratton
Text Box
11