


Bahasa
Halaman
Hukum


ASIA-PACIFICHUMANDEVELOPMENTREPORT 2006
Trade on Human TermsTransforming Trade forHuman Developmentin Asia and the Pacific
Published for theUnited NationsDevelopment Programme
Copyright ©2006by the United Nations Development ProgrammeRegional Centre in Colombo, Human Development Unit
23 Independence Avenue, Colombo 7, Sri Lanka
All rights reserved. No part of this publication may be reproduced ortransmitted, in any form or by any means, without permission.Any person who does any unauthorised act in relation to this publicationmay be liable to criminal prosecution and civil claims for damages.
First published, 2006
Published for UNDP by Macmillan India Ltd.,this book is not for sale through commercial channels.
MACMILLAN INDIA LTD.Delhi Chennai Jaipur Mumbai Patna BangaloreBhopal Chandigarh Coimbatore Cuttack GuwahatiHubli Hyderabad Lucknow Madurai Nagpur PuneRaipur Thiruvananthapuram Visakhapatnam
ISBN CORP-000036
Published by Rajiv Beri for Macmillan India Ltd.2/10 Ansari Road, Daryaganj, New Delhi 110 002
Printed at Sanat Printers312 EPIP, Kundli 131 028

TEAM FOR THE PREPARATION OFAsia-Pacific Human Development Report 2006
Team LeaderAnuradha Rajivan
Core Team: C.P. Chandrasekhar,Ramesh Gampat, Achila Imchen andChune Loong Lum
Editor: Peter StalkerStatistics Advisor: Amitabh KunduStatistics Team: Rashmi Banga, KalpanaChoudhary and Niranjan SarangiCover Design: Rustam VaniaTechnical Editing and Production:Macmillan India Ltd.
The Asia-Pacific Human Development Unit(HDU), Regional Centre in Colombo (RCC)The Asia-Pacific Human DevelopmentReport 2006 is the result of a collaborativeeffort. Other members of the HDU whoworked on the Report include Susan Howesand Renata Rubian. The HDU adminis-trative team who supported the preparationof the Report include Ruwanthi Senarathneand Rehana Cuttilan. Kay Kirby Dorjiprovided assistance for advocacy and mediaoutreach.

International trade has been the engine of
growth for many countries of Asia and the
Pacific. The ‘economic miracle’ of the East
Asian ‘tigers’ is due in large part to their ability
to export to global markets and to develop
production at a scale, and with the technology,
that allows for higher returns. Poverty has
broadly declined in the region, and hundreds of
millions of people have experienced significant
improvement in the quality of their lives.
But some are being left behind. Several
smaller countries in the region, especially the
Least Developed Countries (LDCs), have not yet
experienced significant gains from trade. The
region’s rural poor have languished from
stagnation in agriculture, as the new riches of
the global marketplace fail to reach the
countryside, where most people live. Even in
fast-growing countries, trade has led to widening
disparities among regions, sectors and
households. Many economies, especially in East
Asia, are unable to create enough jobs for their
growing populations, especially for young
people and women.
The launch of the 2006 Asia-Pacific Human
Development Report, Trade on Human Terms,
comes at a critical time, with only a few months
left before the end-of-year deadline for the
completion of the Doha Development Round.
We are at the mid-point of the ten-year Brussels
Programme of Action for Least Developed
Countries, and have less than a decade to
achieve the targets of the Millennium Develop-
ment Goals.
As we see in the Report, daunting challenges
Foreword
remain. The link between trade, human develop-
ment and poverty reduction has weakened.
Incumbent WTO members have at times made
it difficult for developing countries to gain a
share in the benefits of globalization. China’s
stunning economic growth, in so many ways an
inspiration to its Asia-Pacific neighbors, is not
delivering reciprocal benefits to its regional
trading partners – and is in some cases creating
difficulties for them. One of the messages of this
report is that success in the global marketplace
brings with it new opportunities and responsi-
bilities as well, especially toward the least
developed nations.
The Report examines from an Asia-Pacific
perspective the changes required in the world’s
trading system, as envisioned in the Global
Partnership for Development and the Millen-
nium Development Goals. It draws on the
diverse experience of the region to propose a
comprehensive development strategy that
effectively combines trade liberalization with
the promotion of poverty reduction and human
development.
Trade on Human Terms also identifies the
types of national policies needed to ensure that
all people realize the potential benefits of trade.
Such policy recommendations include invest-
ments in infrastructure, higher education and
R&D for competitiveness; adoption of strategic
trade and industrial policies; a renewed focus
on agriculture and rural development; and
measures for combating “jobless growth.” The
ideas in this report can contribute to a better
globalization – a globalization with benefits for
v
all – both in the Asia-Pacific region and around
the world.
The launch of Trade on Human Terms
marks a turning point for UNDP too: the
evolution of Asia-Pacific Human Development
Reports into an annual series. We expect these
annual regional Reports to provide continuing
analysis of critical development issues that will
prove highly relevant at both the national and
international levels.
Kemal DervisAdministrator, UNDP
vi
The analysis and policy recommendations of this Report do not necessarily reflect the views of the UnitedNations Development Programme, its Executive Board or its Member States. The Report is an independentpublication commissioned by UNDP. It is the fruit of a collaborative effort by a team of eminent experts,stakeholders, and the Human Development Unit team of the Regional Centre in Colombo.
In Asia and the Pacific, trade has proved that itcan provide jobs and higher incomes formillions. At the same time, many people haveyet to benefit, including poor farmers margina-lized by trade barriers and distorted agriculturalprices; workers who lose jobs in domestic indus-tries due to the reduction of tariffs on competingimports; women, who deserve higher wages andbetter working conditions but face the risk ofdisplacement following the withdrawal of textilequotas; and overseas workers, who leave theirloved ones behind and face discrimination andexploitation in search of jobs that can lead toimproved lives back home.
The Asia-Pacific Human DevelopmentReport 2006 is by and for the people of the Asia-Pacific region. It seeks to demystify trade-relatedissues, making them more accessible to a widercross-section of people, thereby facilitating moreinformed debate and advocacy. In doing so, ithopes to promote human development in theregion, focusing especially on the attainment ofthe Millennium Development Goals.
I am proud that this Report is the product ofindigenous thinking by hundreds of people in theregion; experts, scholars, government officials,representatives of non-governmental organiza-tions, civil society and the private sector, andmany people from different walks of life.
Preface
The Report not only draws on many issue-and country-based studies and papers commis-sioned by UNDP, it also benefits from thefeedback on the approach and content obtainedfrom a number of regional workshops, stake-holder consultations and technical meetings.Thus, the process of gathering inputs and ideasfrom diverse, informed sources in the region hasbeen very full and rich.
Questions such as these provided themotivation for the Report: How does tradeliberalization affect the conditions of the worse-off sections of the population? Is trade expansioncontributing to higher employment and povertyreduction? The conclusion is that these links arenot automatic, and will need to be engineeredthrough favourable changes in the internationaltrading regime and appropriate domesticpolicies.
World leaders at the recent GlobalSummit of the United Nations resolved to spareno effort to free their fellow human beingsfrom the abject and dehumanizing conditions ofextreme poverty. We can make an enormouscontribution to fulfilling this pledge – and bene-fiting farmers, women, industrial labourers,overseas workers and others left out so far – byensuring that trade is on human terms andpromotes a better life for all.
Hafiz A. PashaDirector
Regional Bureau for Asia and the PacificUNDP
vii

This Report is the outcome of a truly collabora-tive venture. Persons deserving acknowledge-ment are so numerous, and have contributed inso many different ways, that no attempt to fullyrecognize their contribution can ever do justice.Nevertheless, it is necessary to acknowledge thecontribution of as many as possible. Hafiz Pashainspired and guided the work, and also providednumerous substantive inputs. The Report alsobenefited from specific suggestions from KemalDervis, UNDP Administrator. Colleagues inRCC provided ongoing inputs and support tothe process.
Contributors
Numerous background studies, papers, draftsand notes covering a wide range of issuescontributed to the Report. The main contribu-tors were: Ratnakar Adhikari, Homi S. Aibara,Anu Bhasin, Rupa Chanda, C.P. Chandrasekhar,Uttam Deb, Biswajit Dhar, Ramesh Gampat,Jayati Ghosh, Murray Gibbs, Komal Gopalani,Vu Quoc Huy, Sanath Jayanetti, MumtazKeklik, Mohan Kumar, Kamal Malhotra,Sebastian Mathew, Manuel Montes, SyedNawab Haider Naqvi, Omar Noman, PedroOrtega, Thangavel Palanivel, Hafiz Pasha,Minh Pham, Abdul Aziz Rahman, MustafizurRahman, Anuradha Rajivan, Miho Shirotori,Ruangrai Tokrisna, Lam Quoc Tuan, Tereso S.Tullao, Nguyen Viet Vinh and Swarnim Waglé.
Technical Consultations
The Report also draws on feedback and opinionsexpressed in regional technical consultationswhere inputs were obtained from experts within
Acknowledgements
and outside UNDP. Participants were RashmiBanga, Anuradha Bhasin, Elena Borsatti, JavedBurki, Jolita Butkeviciene, Rupa Chanda, C.P.Chandrasekhar, Kay Kirby Dorji, RameshGampat, Jayati Ghosh, Murray Gibbs, CherieHart, Cristina Hernandez, Susan Howes, AchilaImchen, T. Indrani, Mumtaz Keklik, Aileen Kwa,Marie Laberge, David Luke, Kamal Malhotra,Sebastian Mathew, Manuel Montes, B. Murali,Napoleon Navarro, Omar Noman, PedroOrtega, Thangavel Palanivel, Hafiz Pasha, MinhPham, Syed Ayub Qutub, Anuradha Rajivan,K.V. Ramani, Deepali Sharma, MargaritaSongco, Arusha Stanislaus, Trudy Tan, Thiyaga-rajan Velumail, Swarnim Waglé, YumikoYamamoto and Uchita de Zoysa.
Stakeholder Consultations
The Report benefited from views expressed bynumerous stakeholders in a series of focussedconsultations. Stakeholders were drawn fromacademia, government, private sector, CSOs,think tanks, UN entities, representatives ofworkers and consumers. Participants were ShirinAkhter, Primo Amparo, M.C. Arora, MariaFides Bagasao, T. Balan, Rashmi Banga,Anuradha Bhasin, Libran Cabactulan, RicardoCasco, Rupa Chanda, C.P. Chandrasekhar, BipulChatterjee, Wallace Shuaihua Cheng, XieCheng, Hla Phyu Chit, Srey Chanthy, KalpanaChoudhary, Verona Collantes, Michael AngeloCortez, Rodolfo de la Cruz, Pramod Dev,Maurice Dewulf, K. Dharmarajan, RameshGampat, Jayati Ghosh, Nguyen Thanh Giang,Murray Gibbs, K.M. Gopakumar, R. Gopalan,Komal Gopalani, Gopinath, Ganesh Gurung,Kanupriya Gupta, Tahir Hasnain, Minh Chien
ix
Ho, Susan Howes, Vu Quoc Huy, AchilaImchen, T. Indrani, Sanath Jayanetti, MarkusJelitto, Sitanon Jesdapipat, Kamol Kamoltrakul,Mumtaz Keklik, Makmur Keliat, ParasharKulkarni, Nagesh Kumar, Udaya Kumar,Nguyen Thi Phuong Lan, Leeber Leebouapao,Zhongzhou Li, S.H. Mahatre, Abdul Halim binMansor, Rajan Mohapatra, Manuel Montes,Monwer Mostafa, Samsen Neak, ShrawanNigam, Ernesto Ordonez, Pedro Ortega,Thangavel Palanivel, Balaji Pandey, K. SeetaPrabhu, Purnima Purohit, Atiur Rahman,Ananya Raihan, Anuradha Rajivan, SripriyaRanganathan, N.P. Samy, Husein Sawit, DeepaliSharma, Pradeep Sharma, Stanley Simpson,Photong Sliphong, Bounthone Soukavong,Farhana Faruqi Stocker, Indah Suksmanigsigh,Supanee Taneewut, Dikshya Thapa, RizaTjahjadi, Samar Verma, Gautam Vohra,Swarnim Waglé, Dushni Weerakoon, Ng LipYong, Uchita de Zoysa and B.K. Zutshi.
The team also wishes to acknowledge theactive participation of the Consumer Unity andTrust Society (CUTS) through the Centre forInternational Trade, Economics and Environ-ment (CITEE), including facilitation.
Statistical Work
Statistical information was compiled by RashmiBanga and Niranjan Sarangi with assistancefrom Kalpana Choudhary, Iori Kato and ChuneLoong Lum.
Reviewers
The RHDR benefited from expert reviewers
from within and outside of UNDP. Reviewersprovided general and specific inputs. Back-ground papers and draft chapters were putthrough a peer review process. The teamwould like to thank Anuradha Bhasin, JolitaButkeviciene, C.P. Chandrasekhar, CarolynDeere, Cristina Hernandez, Mumtaz Keklik,Aileen Kwa, Richard Leete, David Luke,Victor Ognivtsev, V.R. Panchamukhi, DwijenRangnekar, Miho Shirotori, Jan Vandemoorteleand Josef Yap. Amitabh Kundu, S.K. Nath,R. Ramachandran and Suranjana Vidyaratnereviewed the statistical work for which the Teamexpresses its thanks.
Production
UNDP India Country Office provided valuableoperational support during the production ofthis Report.
The promotion and dissemination of theReport benefited from the support of the UNDP-RCC Programme Advocacy and Media Unit, inparticular, Kay Kirby Dorji.
Suwansawan Baran, Dora Blessich, BarbaraLemoine and Siamak Moghaddam from theUNOPS Asia office, previously located in KualaLumpur and now in Bangkok, providedsupporting administrative services. UNDP-RCCBusiness Services Unit also provided support, inparticular, Lushantha Arsecularatne, ManojBasnyat and Vishwa Khanna.
The Report is the result of leadership anddedication of Anuradha Rajivan, who ablysteered this work through many twists and turns;without her, this work simply would not havebeen completed.
Minh PhamRegional Manager
UNDP Regional Centre in Colombo
x
Foreword v
Preface vii
Acknowledgements ix
Abbreviations xvii
OVERVIEWAn Era of Rapid Growth and Trade Liberalization 3Making Agricultural Trade Work for the Poor 4Adjusting to a New Era for Textiles and Clothing 5Selling Services Across Borders 6Trade Opportunities for the Least Developed Countries 7An Eight-Point Agenda 7Reaching a Different Frontier 11
CHAPTER 1: Using International Trade to Promote Human DevelopmentBalancing Growth and Human Development 16Pursuing Growth through Trade 17The Potential for State Action 18Multilateral, Regional and Bilateral Action 22The Human Development Imperative 25The Contours of the Report 26
CHAPTER 2: Trade and Human Development: The Asia-Pacific ExperienceTrends in International Trade 29The Energy Crunch 37The Implications for Human Development 38The Employment Channel 43
CHAPTER 3: Making Agricultural Trade Work for the PoorThe Pattern of Global Agricultural Trade 52Protectionism in the North 55Distorted Trade and Human Development 58Making Agricultural Trade Work for the Poor 59
Contents
xi
Agricultural Trade Policies of Developing Countries 61Intellectual Property 63Geographical Indications 64Fisheries and Human Development 66Policy Directions for Agricultural Trade 72Policy Priorities 74
CHAPTER 4: Adjusting to a New Era for Textiles and ClothingTrends in Global Trade in Textiles and Clothing 80A Changing Trade Regime 84National Policy Directions 91International Measures to Increase Market Access 94Major Changes Ahead 95
CHAPTER 5: Selling Services Across FrontiersShort-term Migration 99Outsourcing Business Processes 108International Tourism 117The New Trade in Economic Services 123
CHAPTER 6: Trading Opportunities for the Least Developed CountriesWhy do LDCs not Benefit Sufficiently from Trade? 129Experience with Trade Integration 130Human Development Implications of Trade Integration 134Initiatives to Address LDC Vulnerability 136The Way Forward 140
CHAPTER 7: Trade for Human Development: An Eight-Point AgendaInvest for Competitiveness 147Adopt Strategic Trade Policies 148Restore a Focus on Agriculture 149Combat Jobless Growth 149Prepare a New Tax Regime 150Maintain Stable Exchange Rates 150Persist with Multilateralism 151Cooperate with Neighbours 151Reaching a Different Frontier 152
Notes 153
Bibliography 157
xii
BOXES1.1 Country Classifications Used in this Report 151.2 Recovering Revenue Losses from Trade Liberalization in Bangladesh 181.3 State Intervention in Trade – An Age-old Phenomenon 191.4 Strategic International Integration in a Globalizing World 201.5 Export Processing Zones 211.6 The Real Effective Exchange Rate: Regional Experiences 221.7 Varieties of Regional Trade Agreements 231.8 Established Regional Trade Agreements Involving Asia-Pacific Countries 242.1 Asia, the emerging factory of the world 302.2 From Food Surplus to Food Deficit 352.3 The Oil Shock 352.4 Trade and Growth in Malaysia’s Spectacular Poverty Decline 392.5 Including Women in Globalization 423.1 Agricultural Trade Liberalization in Indonesia 593.2 Geographical Indications in Asia 663.3 Food Safety Standards and Small-Scale Fisheries 693.4 CITES, The Shrimp-Turtle Dispute and Indian Fishworkers 714.1 Female Employment in the Bangladesh Garments Industry 834.2 Sweatshop Conditions in Delhi’s Garments Industry 834.3 LDCs: Major Beneficiaries of the Multifibre Arrangement 845.1 Movements of Unskilled Labour in the Asia-Pacific Region 1005.2 Use of Remittances in Bangladesh 1015.3 Discriminatory Work Visas 1025.4 Human Development Outcomes of Migration 1045.5 Government Promotion of Temporary Migration from Viet Nam 1055.6 Migration Options in the General Agreement on Trade in Services 1075.7 Outsourcing Business Processes – Implications for Widening Employment 1085.8 Outsourcing Services along the Value Chain 1085.9 Factors Shaping Competitiveness in Global Outsourcing 110
5.10 Human Development Outcomes of Outsourcing 1145.11 Domestic Measures to Promote Outsourcing 1155.12 Creating Comparative Advantage for Outsourcing in Malaysia 1165.13 The Significance of Domestic Tourism 1175.14 Harnessing Leisure Travel in the Maldives 1215.15 Rapid Tourist Development in a Remote Area: Angkor, Cambodia 1226.1 Nepal’s Cautious Approach to Liberalizing Services 1316.2 Special and Differential Treatment Provisions in the WTO 1326.3 TRIPS and the Looming Public Health Crisis in Cambodia 1336.4 Trade Between Asia-Pacific LDCs and China 1366.5 Aid-for-trade: The Way Forward 1386.6 Niche Products: An Opportunity for Least Developed Countries 140
xiii
TABLES2.1 Regional Growth Performance 292.2 Effective import duties for selected countries, 1990 and 2000 (%) 302.3 Growth Rates of Exports, 1980s and 1990s (%) 312.4 Growth Rates of Imports, 1980s and 1990s (%) 322.5 Composition of Merchandise Exports and Imports 342.6 Growth rates by sector and GDP growth rates 372.7 Trends in the Gini coefficient, 1960s to 1990s 382.8 Growth of Employment and Output, and Employment Elasticity by Sector 442.9 Factors Contributing to Changes in Rate of Employment Growth 44
2.10 Composition of Manufacturing Value-Added in China and Malaysia (%) 452.11 Growth of Output and Employment in the Services Sectors 452.12 Overall Growth of Employment and GDP and Employment Elasticity
in Selected Countries 462.13 Composition of Manufacturing Value-Added in India (%) 462.14 Growth in Total Factor Productivity in Selected Countries 463.1 Valued-Added in Agriculture as Percentage of GDP 513.2 Percentage Employment in Agriculture 513.3 Share of World Production of Selected Agricultural Products Traded
Across Borders 2005 523.4 Leading Agricultural Exporters in the Asia-Pacific Region 2003 543.5 European Union – Estimates of Support to Agriculture, $ Millions 563.6 United States – Estimates of Support to Agriculture, $ Millions 563.7 US Subsidies to Selected Agricultural Products, $ Millions 564.1 World Textiles and Clothing Exports ($ millions) 804.2 Leading Exporters of Textiles 2004 814.3 Leading Exporters of Clothing 2004 814.4 Textiles and Clothing Employment, Selected Asian Countries 824.5 US and EU Imports of Textiles and Clothing 2004 and 2005 864.6 Share in Value in Textiles and Clothing (%) 865.1 Tourist Arrivals in Asia-Pacific Countries, 2005 1185.2 Employment in the Tourist Industry 1196.1 Key Indicators of Asia-Pacific Least Developed Countries 128
FIGURES1.1 Trade and Human Development – A Schematic View 162.1 Import Tariffs, 1980–2000 292.2 The Asia-Pacific Region’s Share in World Trade, 1973-2000 (%) 312.3 Balance of Trade, East Asia and the Pacific, and South Asia, 1980s and 1990s 332.4 Composition of Merchandise Exports and Imports 342.5 Composition of Manufactured Exports, 1980-2000 362.6 Growth of Exports of Goods and Services and GDP in Asia and Pacific Countries 36
xiv
2.7 Income Poverty, 1981–2001, % of People Living on Less than $1 Per Day 392.8 LDCs and Developing Countries, Trade as % of GDP, 1970–2002 402.9 Annual Average Growth Rates, Developing Countries and LDCs, 1970–2000 40
2.10 Regional Unemployment Rates, 1993 and 2003 432.11 Education Level of the Unemployed 472.12 Unemployment Rate by Sex, 1990s 473.1 Commercial Food Import Bills 533.2 Exporter Rankings: A Comparison of those for Merchandise and Agricultural Goods 543.3 Tariffs Levied by Developed Countries on Imports from each Region (%) 574.1 Shifts in the Pattern of Global Exports 1990-2002 804.2 Share of Textiles and Clothing in Total Merchandise Exports in Selected Countries
of Asia 2004 814.3 Women’s Share in Paid Employment in Textiles and Clothing 824.4 Growth in Value of Exports of Textiles and Clothing to the EU and the US 2004-05 875.1 Flows of Remittances to Selected Asian Countries, 1983-2003, $ Billions 1015.2 Female and Male Migration from Sri Lanka 1025.3 Tourist Arrivals per 100 People, 2002 119
STATISTICAL ANNEXESAbout the Data
Table 1. Basic Indicators 174Table 2. Human Development Index – Trends 175Table 3. Indicators of Poverty, Income Inequality and Undernutrition 176Table 4. Indicators of Access to Safe Drinking Water and Sanitation Facilities 177Table 5. Indicators of Maternal and Child Health 178Table 6. Indicators of Health Services 179Table 7. Indicators of Literacy and School Enrolment 180Table 8. Indicators of Gender Development 181Table 9. Indicators of Technology Diffusion 182
Table 10. Indicators of Energy and Environmental Sustainability 183Table 11. Tariffs, Domestic Peaks and International Peaks 184Table 12. MFN Tariffs with Respect to Agriculture 185Table 13. Customs and Other Duty Revenues 186Table 14. Trends in Real Effective Exchange Rate (REER, base 2000=100) 187Table 15. Trends in Real Interest Rates, 1990-2003 188Table 16. Trade and Growth 189Table 17. Merchandise Exports and Imports 190Table 18. Share of Agriculture in Exports and Value Added 191Table 19. Share of Manufacturing in Exports and Value Added 192Table 20. Share of Agriculture and Manufacturing in Imports 193Table 21. Export of Services by Sector 194Table 22. Import of Services by Sector 195Table 23. Growth of Exports, Imports and GDP 196
xv
Table 24. Labour Force and Unemployment Rate 197Table 25. Structure of Employment 198Table 26. Workers’ Home Remittances and Other Receipts 199Table 27. Import of Essential Commodities 200Table 28. Net Barter Terms of Trade 201Table 29. Concentration and Diversification Indices of Exports and Imports by
Country and Country Grouping 202Table 30. Total Foreign Exchange Reserves (without gold) 203Table 31. Trends in Current Account Balance (% GDP) 205Table 32. Trends in Capital Account Balance (% GDP) 206Table 33. Foreign Direct Investment 207Table 34. Official Development Asisstance 208Table 35. Exports by Main Regions of Origin and Destination 209Table 36. Imports by Main Regions of Origin and Destination 210Table 37. Regional and Bilateral Trading Agreements and WTO Membership 211
Definitions of Technical Terms 213
xvi
ACCEC ASEAN-China Comprehensive Economic CooperationADB Asian Development BankAFTA ASEAN Free Trade AreaAFTA-CER CEP AFTA-CER Closer Economic PartnershipAGOA African Growth and Opportunity ActAICEP ASEAN-India Comprehensive Economic PartnershipAJCEC ASEAN-Japan Comprehensive Economic CooperationAKCCP ASEAN-Korea Comprehensive Cooperation PartnershipAMS Aggregate Measure of SupportAO Appellation of OriginAPEC Asia Pacific Economic CooperationARF ASEAN Regional ForumARV Anti-retroviralASCM Agreement on Subsidies and Countervailing MeasuresASEAN Association of Southeast Asian NationsASEAN+3 ASEAN-China-Japan-KoreaATC Agreement on Textiles and ClothingATMI American Textile Manufacturers InstituteBIMSTEC-FTA Bay of Bengal Initiative for Multi-Sectoral Technical and Economic
Cooperation Free Trade AreaBIS Bank of International SettlementBPO Business process outsourcingBTA Bilateral Trade AgreementCAFTA Central American Free Trade AgreementCARP Comprehensive Agrarian Reform ProgrammeCBI Caribbean Basin InitiativeCEPT Agreement on the Common Effective Preferential TariffCER Closer Economic RelationsCET Common External TariffCITES Convention on International Trade in Endangered Species of Wild Flora
and FaunaCU Customs UnionDTIS Diagnostic Trade Integration StudyDAFEL Department of Administration of Foreign Employment Labour ForceDFID UK Department for International DepartmentEAEC East Asian Economic CouncilEAI Enterprise for ASEAN InitiativeEBA Everything But Arms Agreement
Abbreviations
xvii
ECO Economic Cooperation OrganizationEPZ Export Processing ZonesEU European UnionFAO Food and Agriculture Organization of the United NationsFAO-FISHSTAT FAO Fishery StatisticsFAS/USDA Foreign Agricultural Service/United States Department of AgricultureFDI Foreign Direct InvestmentFTA Free Trade AgreementFTAA Free Trade Area of the AmericasG-77 Group of 77GATS General Agreement on Trade in ServicesGATT General Agreement on Trade and TariffsGCI Growth Competitiveness IndexGDP Gross Domestic ProductGI Geographical IndicationsGSP Generalized System of PreferencesGSTP Agreement on Global System of Trade Preferences Among Developing
CountriesHACPP Hazard Analysis and Critical Control PointHIV/AIDS Human Immunodeficiency Virus/Acquired Immunodeficiency SyndromeHPLC High Performance Liquid ChromatographyIATP Institute for Agriculture and Trade PolicyICFTU International Confederation of Free Trade UnionsICSF International Collective in Support of FishworkersICTSD International Centre for Trade and Sustainable DevelopmentIF Integrated FrameworkIGG Inter-Governmental GroupILO International Labour OrganizationIMF International Monetary FundIOM International Organization for MigrationIP Intellectual PropertyIPA Integrated Programme of ActionIPN Integrated production networksIPR Intellectual Property RightsIS Indication of SourceISO International Standards OrganizationIT Information TechnologyITCB International Textiles and Clothing BureauLBD Learning by doingLDC Least Developed CountriesLICs Low Income CountriesMBA Master in Business AdministrationMDG Millennium Development GoalsMEA Multilateral Environmental Agreements
xviii
MFA Multifibre ArrangementMNC Multinational corporationsMOU Memorandum of UnderstandingMRA Mutual Recognition AgreementsNAFTA North American Free Trade AgreementNAMA Non-agricultural market accessNASSCOM National Association of Software and Service CompaniesNET Natural Economic TerritoriesNFIDC Net food importing developing countriesNGO Non-governmental organisationsNIC Newly Industrialised CountriesNIE Newly Industrializing EconomiesODC Other duties and chargesOECD Organisation for Economic Co-operation and DevelopmentOPEC Organization of the Petroleum Exporting CountriesPACER Pacific Agreement on Closer Economic PartnershipPIC Pacific Island CountriesPICTA Pacific Island Countries Trade AgreementPPB Parts per billionPPM Parts per millionPPT Parts per trillionPTA Preferential Trade AgreementPVP Plant Variety ProtectionQR Quantitative restrictionsR&D Research and DevelopmentRCD Regional Cooperation for DevelopmentREER Real Effective Exchange RateROO Rules of originRTA Regional Trade AgreementSAARC South Asian Association for Regional CooperationSAC South Asian CountriesSAFTA South Asian Free Trade AgreementSAPTA South Asian Preferential Trading AgreementSARC Declaration on South Asian Regional CooperationSARS Severe Acute Respiratory SyndromeSDT Special and Differential TreatmentSIDS Small Island Developing StatesSISs Small Island StatesSTD Short-term debtT&C Textiles and ClothingTBT Technical Barriers to TradeTED Turtle Excluder DeviceTFP Total Factor ProductivityTIFA Trade and Investment Framework Agreements
xix
TNC Transnational corporationsTPSEPA Trans-Pacific Strategic Economic Partnership AgreementTRIMs Agreement on Trade Related Investment MeasuresTRIPS Trade-Related Aspects of Intellectual Property RightsTSE Total Support EstimateUN United NationsUNCTAD United Nations Conference on Trade and DevelopmentUNDP United Nations Development ProgrammeUNDP-RCC UNDP Regional Centre in ColomboUNESCAP United Nations Economic and Social Commission for Asia and the PacificUNIDO United Nations Industrial Development OrganizationUPOV Union for the Protection of New Varieties of PlantsUSITC United States International Trade CommissionUSSR Union of Soviet Socialist RepublicsUSTR United States Trade RepresentativeVAT Value Added TaxWDI World Development IndicatorsWTO World Tourism OrganizationWTO World Trade OrganizationWTTC World Travel and Tourism Council$ refers to US dollars, unless otherwise specified¤ refers to the Euro, unless otherwise specified
xx
TRADE ON HUMAN TERMS: OVERVIEW 1
The Asia-Pacific region is at the forefront ofglobalization – with some of the world’s fastestrates of growth in international trade. East Asialed the way, but now South Asia too is makingits presence more strongly felt. Myriad goods,from shirts to footwear to computers, are criss-crossing the region – often in integrated inter-national production systems – before beingdispatched across the globe. Not just merchan-dise goods but services too: from Bangalore toManila, hundreds of thousands of workers areassisting customers and clients in Europe or theUnited States or Japan as though they weresitting in an office just down the street. Whenthe services cannot travel through the electronicether, the service workers are taking to the air,travelling across the region and beyond – asdomestic workers or nurses, construction wor-kers or engineers, factory workers or accoun-tants. Asia and the Pacific is thus rapidlybecoming not just the workshop of the world,but the back office too.
The rest of the world is watching thisprocess with some amazement and not a littleconcern. In the richer countries of the West, theIndustrial Revolution of the nineteenth centurycreated huge new centres of global economicconcentration: now, in the twenty-first century,the balance of power is not so much shifting asbeing far more widely dispersed. This is raisinghuge new questions: who will produce what,where and how? Above all, what impact will thishave on people’s lives – on their incomes, their
The Asia-Pacific region has embraced free trade, but free trade will not embrace the poorunless countries pursue a bold new policy agenda harnessing economic growth topromote human development.
health, their levels of education and their futureprospects, on who they are and what they canbecome? In sum: what will all this mean forhuman development? Looking at it from theother perspective, what contribution can higherstandards of human development make toexpanding trade and economic growth?
This Report responds to these questionsfrom inside Asia and the Pacific. An extensiveprocess of consultation among policymakers,academics, civil society groups, the privatesector and other stakeholders has examined themost recent developments on trade and eco-nomic growth and tried to assess the impact onhuman development – more specifically, theeffects on the region’s poorest countries and onits poorest people.
This is no simple task. This is, after all, ahuge region, accommodating more than 60 percent of the global population. Asia-Pacificcountries are also very diverse, ranging fromthird to 140th out of 177 countries rankedworldwide on the Human Development Indexfor 2003. Since the pace of social and economicchange is so rapid and the processes so complexacross one of the most dynamic regions in theworld, it is hard to encompass all of these.
This Report, therefore, narrows the focus,for although it does consider patterns of tradeand economic growth, it is primarily pre-occupied with the effects these are having onhuman development in the developing countriesof the region. But it goes further – emphasizing
Trade on Human TermsOverview
Asia and thePacific is rapidly
becoming notjust the
workshop of theworld, but the
back office too
ASIA-PACIFIC HUMAN DEVELOPMENT REPORT 20062
that neither trade nor growth can ever be ends inthemselves; instead, they are simply meanstowards the larger goals of expanded humandevelopment and combating poverty anddeprivation.
Trade can certainly enhance human deve-lopment – but it can also hinder it. Trade is, afterall, a profit-driven activity, and there are manyexamples from history that demonstrate whatcan happen when commercial gain takesprecedence over human well-being: slavery,colonialism and apartheid are some extremeforms. Today also, the drive to export andimport more goods and services typically triggersa series of complex and dynamic processes thatproduce both winners and losers. For just astrade liberalization can increase the opportu-nities for exports, it also exposes local producersto foreign competition that, particularly inpoorer countries, they may be unable to with-stand. So as well as creating new opportunities,especially in the modern sector, it can alsodestroy the livelihoods of people working insimple manufacturing processes or in agri-culture.
Faced with this potential damage, economicnationalists may argue for something close toautarchy – erecting higher trade barriers andaiming for national self-reliance; why depend onimports when you can make something verysimilar yourself? This has an emotional appealbut soon runs into practical limits. People in thetwenty-first century have social and economicrights that can only be met through interna-tional trade: some exports will always be neededto generate the foreign exchange for essentialimports, from pharmaceuticals, to food, to oil.
At the other extreme are the proponents offree trade who would opt for no barriers at all –letting the market dictate the most economicallysuitable production locations. This may seemmore seductive and plausible, but this too isfallacious, for it involves trade between unequalpartners, allowing the richest and most powerful
countries and companies to set the terms andleaving the poorer and weaker participants toaccept what they are offered, while riskingfurther inequalities both between countries andwithin countries.
An Active State
It might be thought that the best solution wouldbe a simple division of responsibilities: let freeand liberal markets take care of economicgrowth while requiring governments to addressmarket failure and take responsibility for theimplications of rising inequality – for socialconcerns and for human development prio-rities.
However, this division ignores the fact thattrade, economic growth and human develop-ment have a symbiotic relationship. Each needsthe other. One direct link is through tariffrevenue. Removing or reducing tariffs can havea damaging impact on human development sincemany countries rely on customs and other dutiesfor a high proportion of government income – insome Pacific Island countries, up to 70 per cent.Trade liberalization may thus demand dramaticcuts in public services as revenues fall.
A second link concerns sequencing. Coun-tries may need to achieve certain levels of humandevelopment to prepare the ground for liberali-zation. Boosting international trade requires notonly capital and technology but also a capablelabour force. For this the state needs to takeresponsibility – ensuring that the basic capacitiesare in place to enable the private sector to takefull advantage of liberalization.
Trade has thus never been a matter forprivate industry alone; it has always been subjectto active intervention from the state. Govern-ments usually recognize the value of the privatesector as the main engine for economic growth,but they also know that it needs to be harnessedor guided to some extent if it is truly to servehuman development.
There are manyexamples fromhistory thatdemonstratewhat canhappen whencommercial gaintakesprecedence overhuman well-being. Trade hasnever been amatter forprivate industryalone; it hasalways beensubject to activeinterventionfrom the state
TRADE ON HUMAN TERMS: OVERVIEW 3
An Era of Rapid Growth andTrade Liberalization
Keeping track of trade and economic develop-ment is a challenging task. These are often fast-moving processes, and Asia-Pacific has been theworld’s most rapidly-growing region. During theperiod 1990–2003, GDP grew annually onaverage by more than 7 per cent. Governmentscan take some credit for this since much of thisrapid economic growth has taken place during aperiod of steady trade liberalization. In East Asiaand the Pacific, liberalization started in the1970s, and by 2000 average tariffs had fallen to8 per cent. South Asia was slower to startliberalizing, but did so rapidly during the 1990sso that by 2000 average tariffs had fallen to 18per cent.
The lowering of tariffs has contributed to arapid growth in trade. During the earlier periods,export growth was faster in East Asia and thePacific than in South Asia, but in the 1990s itwas dispersed more across the region. Thus,between 1990 and 2003, while East Asia and thePacific continued to power ahead – and trade asa percentage of GDP increased from 45 to 81per cent – the proportion in South Asia alsoincreased: from 20 to 34 per cent. As a result, allAsian economies have become more open.
Accompanying the increases in volume oftrade have been dramatic transformations in thestructure of trade. Some countries have movedon from merchandise exports and are also sellingmore services. Those exporting primary pro-ducts are now turning more to manufacturedgoods; and within manufacturing many enter-prises are now climbing the technological laddertowards more sophisticated products, thoughthis is a phenomenon more evident in East Asiathan in South Asia.
What effect has the rapid increase in tradehad on human development? One of the mostdisturbing outcomes is that for most developingcountries in the region a greater engagement
with international markets has been accom-panied by a rise in income inequality. On a morepositive note, however, there has neverthelessbeen a substantial decline in poverty: between1990 and 2001, the number of people living onless than $1 a day dropped by nearly a quarter ofa billion.
The slowest progress has been in the LeastDeveloped Countries (LDCs). Despite increasesin trade, many LDCs have had less success inreducing poverty. While in developing countriesof the region the proportion of the populationliving below the $1-per-day poverty line is 22 percent, for the LDCs it is 38 per cent.
Indeed, across the region there is still evi-dence of extreme deprivation. This is clear fromdata on food consumption. Liberalizing agricul-tural markets may have helped reduce the priceof food – particularly of crops produced with thebacking of agriculture subsidies in the US andthe EU. But this does not seem to have led to anyconsistent improvement in food security. Manymore countries now have food deficits, and Asiastill has more hungry people than any otherregion of the world – over 510 million.
On the health front, the picture is generallypositive. The period of trade-led growth has beenaccompanied by improvements in health, thoughthese seem to have slowed in recent years. Onelooming problem, however, is that the WTO-induced agreements on intellectual propertyrights could start to restrict supplies of essentialgeneric drugs.
Trade might have been expected to raiseeducation standards by giving people greaterincentives to improve their skills. But here tooprogress has been inadequate. The greatestproblems are in South Asia, where one child infive fails to enroll in primary school.
Trade has also had a strong influence ongender relations. East Asia’s export drive in the1960s and 1970s relied heavily on the mobili-zation of female workers. By being able to earnan independent income, many women thus
ASIA-PACIFIC HUMAN DEVELOPMENT REPORT 20064
obtained greater personal freedom – but only upto a certain point. Working women the worldover are all too familiar with the double burdenof housework and wage work outside the home.Within the workplace they are often second-classcitizens when it comes to the management andorganization of work, and can also find them-selves exposed to sexual harassment.
Expanding the Employment Channel
Indeed, for both men and women, the mainchannel for all these effects of trade on humandevelopment, for better or for worse, is throughemployment. Ideally, more trade should meanmore jobs and less unemployment. Unfortu-nately, in recent years this has often not been thecase.
Although Asian countries created jobs quiterapidly in the 1980s – 337 million in total – theycreated far fewer, 176 million, in the 1990s. Thishas not provided sufficient jobs for a risingpopulation: between 1993 and 2003 in South-East Asia, unemployment increased from 3.9 to6.3 per cent. Worryingly, the situation is oftenmore serious in some of the most trade-intensivecountries: China and Singapore, for example,have seen unemployment rates increase substan-tially. Most of this burden has fallen on youngpeople: in 2004, while those aged 15 to 24 madeup one-fifth of Asia-Pacific’s labour force, theyconstituted nearly half of the unemployed.Women too have lost out: in most countries theirunemployment rates are higher than men’s.
Why is the region experiencing ‘joblessgrowth’? Most of the problems are in East Asiaand especially in manufacturing, for althoughmanufacturing output increased by almost 180per cent in the 1990s, the associated employ-ment increased by only 3 per cent. This is princi-pally because manufacturing has been movingfrom low-tech, labour-intensive industries, suchas garments, to high-tech and more capital-intensive ones such as electronics – and even
within more labour-intensive manufacturing,companies have continued to invest in labour-saving equipment.
The employment situation is different inSouth Asia. Here, despite a slight deceleration inthe rate of economic growth, employment hascontinued to rise, if only modestly. This isbecause South Asia has yet to experience wide-spread structural change – continuing to rely ontraditional labour-intensive and natural-resource-based industries. This may have led toslower growth, but has at least spread the bene-fits more evenly.
The experience of the Asia-Pacific region hasthus clearly demonstrated that trade by itselfcannot address inequalities; indeed, it may wellmake them worse. Governments are increasinglyrecognizing that they must devise complemen-tary policies to ensure that increased engagementwith international markets also generates jobsand promotes human development.
Making Agricultural Trade Workfor the Poor
These jobs cannot be confined to the modernurban industrial or service sectors; they mustalso be generated in the rural areas and inagriculture. While setting their sights on inter-national trade, many governments in the regionhave been neglecting agriculture and investingfar less in rural development. In fact, tradeliberalization itself has often undermined natio-nal food production by allowing imports ofcheap food; these will benefit low-incomeconsumers, but they can also threaten the live-lihoods of poor farmers and fishing communi-ties, with serious implications for equity.
The most striking evidence of rural neglecthas been a serious deterioration in the balanceof agricultural trade. In the early 1960s, thedeveloping countries had an overall annualagricultural trade surplus of almost $7 billion,but since the beginning of the 1990s they have
The mainchannel for allthese effects oftrade on humandevelopment,for better or forworse, isthroughemployment
TRADE ON HUMAN TERMS: OVERVIEW 5
generally been net importers of agriculturalproducts, with a deficit in 2001, for example, of$11 billion.
Countries in the Asia-Pacific region havecontributed to this rising imbalance. True, inglobal markets they have never been majorplayers. Indeed, of the truly successful Asianexporters only China has earned that successeven partly through agricultural exports –though countries like Malaysia and the Republicof Korea have used surpluses from agricultureto invest in their export sectors. Even today, VietNam has agricultural exports as an importantsource of foreign exchange.
More worrying, however, is that a numberof countries are not just exporting less. They, andparticularly China, are likely to become majorimporters. As a result, global food supplies couldbecome much tighter. This raises questions offood security. Food is not like any other tradablecommodity, and most countries prefer some-thing closer to national self-sufficiency. This willmean, therefore, putting more emphasis on localproduction and giving greater protection forfarmers who find it difficult to compete at worldprices, especially when these are distorted bysubsidies in the US and the EU that have enabledthem to export below the cost of production.
Asia and the Pacific has much to gain bypromoting equitable agricultural trade gene-rally, but this is particularly true in fish trade.Countries in the region account for more thanone-third of global exports of fish and fishproducts. China is now the world’s largestexporter of fish, while Japan is the world’slargest importer, but the fish trade is importantthroughout the region. Indeed, the Asia-Pacificregion is home to 85 per cent of the world’sfishers and 95 per cent of its fish farmers.
In some respects, fishers are in a strongerposition than farmers because they sell a largerproportion of their output on a regular andconsistent basis. In other respects, however, theycan be more vulnerable, whether as a result of
natural factors such as variations in the fishcatch, bad weather, and exposure to cyclones, oras a result of economic factors such as pricefluctuations and variable access to markets.
Many fishing communities already have lowincomes, but their situation could get worse asstocks are exhausted. Intense competition inopen-access fisheries is leading to overfishing inseveral commercially important fisheries. TheAsian fishing sector also faces problems acces-sing markets in developed countries where thereare increasing demands for higher standards offood safety.
Developing countries face some complexchoices for policies on agricultural trade –deciding to what extent they can rely on imports.Some have chosen to invest outside agriculture,or even within agriculture, but have concen-trated on exportable commodities. This mayseem rational from the point of view of econo-mic efficiency, but it may be irrational from theperspective of human development. For whileincreasing agricultural trade might boost econo-mic growth and benefit poor consumers, it is alsolikely to depress local prices and undermine thelivelihoods of poor farmers.
Adjusting to a New Era forTextiles and Clothing
Another area of critical importance to manypoor households is the textiles and clothingindustry, which in so many countries has servedas the launching pad for industrial development.In this case the Asia-Pacific region finds itself inthe midst of a potential upheaval now that theelaborate quota system under the MultifibreArrangement (MFA) has come to an end. TheMFA deliberately constrained imports from theregion’s larger producers, notably China andIndia, but offered quotas to many othercountries such as Bangladesh and Nepal, whichused them as the basis for new industries. Theoutcome was a highly dispersed textiles and
These jobscannot be
confined to themodern urban
industrial orservice sectors;they must also
be generated inthe rural areas
and inagriculture
ASIA-PACIFIC HUMAN DEVELOPMENT REPORT 20066
clothing industry across the region, providingemployment for hundreds of thousands ofdisadvantaged and lower-skilled workers, mostof whom were women – 90 per cent in bothBangladesh and Cambodia and 87 per cent inSri Lanka.
Since that era concluded at the end of 2004,many of these new producers are struggling toadjust to direct competition, particularly withChina. Thus far, the outcome for some countrieshas not been as bad as had been feared. Indeed,Asian producers overall have fared better thanthose in other regions and have increased theirshare of exports to the US and the EU. But, asexpected, the benefits were unequally shared.The main winners have been China and India;the main losers have been Nepal, Philippines,Thailand and Pakistan. Nevertheless, it isnotable that a number of countries that had alsorelied on quotas have been able to maintain oreven increase their shares – Cambodia, VietNam, Indonesia, Sri Lanka and Bangladesh.
Even now, however, it is difficult to envisagethe future shape of the textiles and clothingtrade, since the developed countries have beendefending themselves against rising imports withtemporary restrictions. What is clear, however,is that the only way to survive in a competitiveglobal market is by upgrading the industry andincreasing both the quality and quantity ofoutput. This will also mean improving workingconditions, not least because exporters arecoming under pressure from fair-trade organiza-tions to guarantee that their goods are notproduced under exploitative conditions. Higherlevels of trade in textiles and clothing can pro-mote human development, but only if govern-ments and employers take the necessary action.
Selling Services Across Borders
Asian countries continue to rely on the interna-tional trade in goods. But over the last threedecades they have been taking advantage of the
opportunities to boost the trade in services, andinternational trade has consequently becomemuch more complex. Three forms of cross-border services are discussed: either the sellermoves, as in international labour migration; orthe work moves, as with business outsourcing;or the buyer moves, as with internationaltourism.
All three types of movement have increasedsignificantly. For migration, millions of lower-skilled workers continue to travel abroad onshort-term contracts: an estimated 10 per centof the Philippines labour force and 12 per centof the Sri Lankan labour force now workoverseas. Many labour migrants have improvedtheir standard of life, and even some of thepoorest have earned enough to lift their familiesout of poverty. But they can also work underexploitative conditions and have their home livesseverely disrupted. Both source and destinationcountries can make migration a more productiveand fulfilling experience: source countries canensure that migrants are well-informed, financedand trained before they travel, and destinationcountries can make migration processes simplerand more trans-parent.
Asia has also been a pioneer in the off-shoring of IT and business process services: insome cases IT workers continue to travel over-seas on short-term assignments in developedcountries, but advances in information andcommunications technology, and falling inter-net connectivity costs, have allowed more andmore of these services to be delivered remotely –providing jobs for highly educated young peopleas well as drawing into the workforce othergroups such as retirees. However, this too hashuman costs: for example, long night shifts canlead to adverse health effects and preclude anormal social life, isolating workers from theircommunities. Moreover, the rapid growth of theoutsourcing industry is also widening regionaldisparities. Governments will also be concernedthat they are not producing enough skilled
The only way tosurvive in acompetitiveglobal market isby upgradingindustry andincreasing boththe quality andquantity ofoutput
TRADE ON HUMAN TERMS: OVERVIEW 7
people to keep expanding the industry. They do,however, have a range of policy options that canensure outsourcing makes a stronger contribu-tion to human development, including buildinginfrastructure, training the workforces andensuring the best regulatory and fiscal envi-ronment.
In tourism too, the Asia-Pacific region is oneof the global leaders – increasing its share ofglobal traffic from less than 10 per cent in the1950s to 40 per cent in 2004. Tourism can offernew sources of employment even to the remotestregions. But here too there are potential costs,for example, of cultural dislocation, and of envi-ronmental destruction. Many of the problemscan be resolved or minimized with proper plan-ning and management – for example, buildingthe appropriate infrastructure, providingtraining to people working in smaller enter-prises, and ensuring better economic linksbetween larger tourist operators and poor com-munities.
Trade Opportunities for theLeast Developed Countries
All of these trade issues have a particularresonance in the Least Developed Countries(LDCs). For many LDCs, trade represents asignificant proportion of economic activity. Infact, their trade-to-GDP ratios are often higherthan those in many developing countries, or evendeveloped ones. They also tend to have veryopen trade regimes, with low tariff or non-tariffbarriers.
Unfortunately, integrating with interna-tional trade does not seem to have produced acommensurate reduction in poverty. When itcomes to integrating into international trade, theLDCs are in a very vulnerable position –typically they have small economies, difficulttopographies, and are located far frominternational markets in which they are minorand weak players.
In these circumstances, why would LDCswant to gain access to the World Trade Organi-zation and the further liberalization that thisimplies? Because the likely alternative is worse –marginalization or bilateral control by one ortwo major powers. With all its limitations, themultilateral WTO is still a better option if itoffers some basic and consistent ground rules.
However, later entrents have found theprocess of accession to the WTO very arduous.They lack the trained people needed tounderstand the implications of trade agreements.And because the rules for accession to the WTOare vague, the incumbent members have beenable to exploit acceding members by imposingonerous conditions – generally narrowing theirfreedom of action on issues not just of tariffs butalso intellectual property rights, and even onhow they should run their economies, forexample, on the pace and extent of privatization.
The LDCs of the region can engage morefruitfully with the international trading system,but this will need more determined action atboth national and international levels. This willmean, for example, giving a higher priority totrade issues, increasing investment and buildingstronger alliances. But above all, both the LDCsand the developed countries should ensure thattrade initiatives and negotiations are based lesson reciprocity and more on a human develop-ment perspective, taking advantage of opportu-nities for ‘aid for trade’.
An Eight-Point Agenda
How should the countries of Asia and the Pacificrespond in a demanding new environment forinternational trade? Clearly, there can be nostandard blueprint, especially for such a hugeand diverse region. Nevertheless, there is a wayof encompassing this diversity by viewing tradeissues through a human development lens. Theanalysis in this Report suggests eight prioritiesthat have a degree of general application:
Asia has alsobeen a pioneer
in the offshoringof IT and
business processservices
ASIA-PACIFIC HUMAN DEVELOPMENT REPORT 20068
1. Invest for Competitiveness
In a globalizing world, public investment needsto take into account both national and inter-national considerations. Generally the type ofinvestment will remain much the same, but itmay need adjusting with an eye to internationalcompetitiveness. Thus, when looking at basicinfrastructure, governments will need to ensurethat they have the roads, railways, ports andtelecommunications systems that align withnational needs and also with the requirement ofgetting goods and services quickly and cheaplyto international markets.
But just as important as the physical infra-structure is human capital. The most successfultrading countries have invested heavily in thebasics of human development – generating ahealthy and well-educated workforce that hasthe stamina, the skill and the flexibility to copewith a changing trading environment. Educa-tion has to start with strong and universal pri-mary schooling, but nowadays all countries needto make sure they have sufficient people withtechnical and managerial skills. People withgood primary or secondary education can onlymake use of their potential for internationaltrade if they have the support of others withhigher levels of education, for example, in engi-neering, telecommunications, or accountancy.
At the same time, many countries will needto invest more in research and development thatraises productivity and specifically addresses theneeds of poor people – continually assessing themost appropriate technologies that can capita-lize on national strengths. Some of this can becarried out through public-private partnerships,though most of the research into opportunitiesspecifically for the poor is likely to take place inthe public sector.
2. Adopt Strategic Trade Policies
In a world of giant global players and fiercecompetition, no developing country now has the
luxury of entering global markets and hoping forthe best. Instead, states have to identify a fewsectors and industries that have both short- andlong-term potential in international markets andguide enterprises towards them. The chosenindustries will vary from country to country butshould be those with the greatest potentiallinkages with other industries so that they canalso train more people in essential skills and thusoffer important spillover benefits for the rest ofthe economy.
Picking ‘winners’ is not, of course, a simpletask. The aim should be to achieve a transparentpolicy compact between government and theprivate sector that uses a carrot-and-stickapproach. The carrot will include the opportu-nity to operate behind tariff walls until com-panies are strong enough to compete interna-tionally. The stick is that such industries will beclosely scrutinized to ensure that they are livingup to their side of the bargain and are deve-loping steadily more competitive products andservices for export. Enterprises should also besubject to a domestic competition policydesigned to prevent them from abusing amonopoly position.
The essential requirement for engagement ininternational trade, however, is that the processshould be strategically planned and carefullysequenced. Thus, higher tariffs should be rigidlytime-bound: in order to avoid creating cosymonopolies that never mature into vigorousexport enterprises, tariffs should automaticallybe scaled down after a predetermined period.
3. Restore a Focus on Agriculture
A trade strategy based on human developmenthas to have agriculture at its core. This is notbecause agriculture offers export opportunities,but because in many countries farming is still theprimary source of income for the poor; so notrade strategy that undermines rural livelihoodscan claim to be promoting human development.For food-importing countries in particular, it will
The mostsuccessfultrading countrieshave investedheavily in thebasics of humandevelopment
TRADE ON HUMAN TERMS: OVERVIEW 9
often, make sense to maintain tariffs on foodimports so as to protect poor producers. If thisresults in higher prices that cause hardship forthe poorest consumers, governments will needto prepare appropriate social safety nets. Thisalso has the strategic advantage of preservingnational food security in a world that in just afew years could be moving towards higher foodprices. As well as protection, farmers also needprogress. In many countries investment in ruraldevelopment has been on a steep downwardcurve. This has to be reversed – particularlythrough investment: for example, in irrigation,in village electrification and in farm-to-marketroads.
4. Combat Jobless Growth
Most countries that embark on industrializationtypically do so with labour-intensive productionin industries like garments, textiles and foot-wear that take advantage of ample supplies oflow-cost labour. But as industrialization pro-ceeds, they tend to move higher up the valuechain and also become more capital-intensive.As a result, the most successful trading coun-tries, primarily in East Asia, are now creatingjobs far more slowly – the phenomenon of‘jobless growth’.
To some extent this process is understand-able. Less comprehensible, however, is whygovernments should exacerbate this trend bymaintaining low interest rates – effectively giv-ing capital preference over labour. This mayseem like the best strategy for rapid growth butit is storing up problems for the future. By allmeans allow enterprises to choose the lowest-cost option for production, but this choiceshould not be biased away from labour: interestrates should, therefore, reflect the real price ofcapital, not the rate that industrialists wouldprefer. In a similar vein, states should phase outfiscal incentives to enterprises since these raisethe return on capital and again encouragecapital-intensive investments.
Another reason why enterprises may bereluctant to take on new workers is that labourcontracts can be too rigid. This creates a persis-tent duality – a small and protected group of‘insiders’ with secure employment influenced bynational regulations, and a large casual, andoften exploited, workforce employed on piecerates. Instead, more workers should steadily beabsorbed into formal employment but oncontracts sufficiently flexible that they canreadily be deployed to other sectors or compa-nies as trading conditions change. Governmentscan assist in this process by providing somesupport for workers through health insuranceand social security and by active labour marketpolicies to encourage retraining and redeploy-ment.
5. Prepare a New Tax Regime
Liberalization is a common prescription foreconomic success, but it has a debilitating sideeffect – it means foregoing a predictable andeasy-to-collect source of government revenue.Instead governments need to have an alternativetax regime in place before embarking onliberalization.
Care will need to be taken, however, toensure that these new taxes are progressive anddo not hurt the poor. Customs duties, forexample, are often quite progressive since theyare typically highest on the luxury items that areof greater interest to the rich. Corporate taxestoo can be levied progressively, though manypeople escape the net since the lawyers of thelargest corporations are skilled at techniques oftax planning, while most enterprises in theinformal sector simply evade tax collectors alto-gether. Much the same is true for income tax,which tends to be paid more by middle-incomeworkers in government or the formal sector.
Garnering more income from corporate orincome tax will mean overhauling the tax codesto close loopholes and also considering otheroptions such as ‘withholding taxes’. In addition,
States have toidentify a few
sectors andindustries that
have both short-and long-term
potential ininternationalmarkets and
guideenterprises
toward them
ASIA-PACIFIC HUMAN DEVELOPMENT REPORT 200610
governments can consider taxes on real estate oron capital gains. And the more advanced canadopt value added tax (VAT) – though thisassumes a thoroughly documented economy andneeds to be developed with care; in any case, itshould exempt food and other necessities of thepoor.
The key point is that these new sources ofrevenue should be up and running prior toliberalization or countries face the risk of severecuts in public services that will harm humandevelopment.
6. Maintain Stable andRealistic Exchange Rates
One thing that hampers international trade anddiscourages investment is a volatile exchangerate that makes it difficult for states or enterpri-ses to plan ahead. But it is important too thatthe rate is realistic: too high and it will jeopardizeemployment prospects for the poor by penalizingexporters as well as farmers and other localproducers who will face increased competitionfrom imports; too low and it will raise thedomestic price level and affect the cost of livingof the poor.
Exchange rates are likely to fluctuate,especially in small and open economies that arepowerless against the rise or fall in internationalcommodity prices. With floating exchange rates,these economies are also susceptible to the‘Dutch disease’ in which inflows of capitalwithout sufficient investment opportunities toabsorb them can appreciate the exchange rate tounrealistic levels. This may happen as a result ofrising commodity prices as, for example, withthe oil price for Timor-Leste. But it can also bethe result of inflows of aid, say, or of the arrivalof funds for disaster relief as with the tsunami.
Most of the successful Asian trading coun-tries have benefited from long periods of relativeexchange-rate stability based on active currencymanagement. For this purpose, during the initialprocess of liberalization, rather than having
freely floating exchange rates, countries that arebecoming more involved with internationaltrade can consider ‘managed floats’ that permittheir currencies to depreciate gradually – sincein the early stages of liberalization importstypically rise faster than exports. The overallpriority, however, is to ensure that the exchangerate remains stable and realistic.
7. Persist with Multilateralism
The slow pace of progress in the Doha round ofmultilateral trade negotiations has discouragedmany developing countries. They can see this‘development round’ running into some familiarimpediments, especially the resistance from thedeveloped countries over agricultural subsidies.This is leading at best to pessimism and at worstto a crisis of falling expectations that could causethe developing countries to abandon multilatera-lism altogether.
Despairing of the WTO negotiations, manycountries are also seeking bilateral trade agree-ments with the developed countries. Some wouldargue that in trade terms these are better becausethey give preferential access. But in human deve-lopment terms they may impose high costs:bilateral agreements typically involve muchdeeper tariff concessions from the developingcountries and make demands on issues likeintellectual property rights that go far beyondwhat WTO members require of each other, andcan threaten the health and livelihoods of thepoor.
Many countries of the region would dobetter to resist the immediate temptations of abilateral embrace and build up slower but ulti-mately more productive multilateral relation-ships that can lead to more durable humandevelopment outcomes.
8. Cooperate with Neighbours
Another good alternative is to seek trade andother agreements with other countries in their
Better to resistthe immediatetemptations of abilateralembrace andbuild up slowerbut ultimatelymore productivemultilateralrelationships
TRADE ON HUMAN TERMS: OVERVIEW 11
region or subregion. These could include regio-nal pacts such as the South Asian Free TradeAgreement, the ASEAN Free Trade Agreement,or the Pacific Island Countries Trade Agreement.These have the advantage of being quicker tonegotiate than multilateral agreements whileposing less of a risk to human development thanbilateral ones. In addition, they dovetail wellwith the region’s many integrated cross-nationalproduction systems and lead to trade creation.
Regional trade agreements can also be com-plemented by other forms of cooperation, parti-cularly in the financial area. Many countries inthe region have accumulated vast foreign ex-change reserves – $1.9 trillion in total, half ofwhich is in China – partly to protect themselvesagainst another Asian financial crisis. Thesefunds could be put to better use if they werepooled so that countries facing sudden balanceof payments crises caused, say, by a spike in oilprices could draw on this shared Asian resource.Governments can also consider using thereserves to expand the Asian Development Fund,which could put resources to work for invest-ment in large-scale infrastructure and in humandevelopment priorities such as health and edu-cation.
Reaching a Different Frontier
With or without new multilateral agreements,globalization will continue to power ahead. Andmillions more workers in the Asia-Pacific region
will find themselves producing goods for peopleon the other side of the globe as well as buyingat lower prices goods their parents could scarcelyhave dreamed of.
The main hazard, however, is that millionsof others will fall by the wayside – abandoned inrural areas whose agricultural economies havedrifted into decline, or scratching a living on thefringes of Asia’s megacities as a permanentunderclass. Even those currently in work mayfind themselves later discarded from ever-moresophisticated production systems. This not onlydenies people their basic rights to decent workand a reasonable standard of living, it alsoheightens the risk of future unrest: globalizationdoes not just distribute products; it also dissemi-nates new ideas and information that changepeople’s expectations.
The countries of the Asia-Pacific region arerenowned for the speed at which they havedeveloped economically. Now they find them-selves at a different frontier – trying to combineaccelerated trade-driven economic growth withequally rapid poverty reduction and, morebroadly, human development. In many ways thisis a more complex and difficult task, and just asbefore, they will need to work out their ownsolutions. Some of these are highlighted in thisReport; others will only emerge in the light ofexperience. One thing is certain – that Asia andthe Pacific will remain at the forefront of globaldevelopment and will offer fresh lessons to therest of the world.
Asia and thePacific will
remain at theforefront of
globaldevelopment
and will offerfresh lessons to
the rest of theworld


CHAPTER 1: USING INTERNATIONAL TRADE TO PROMOTE HUMAN DEVELOPMENT 15
The early years of the new millennium havewitnessed a robust expansion in world trade. In2004, global merchandise trade recorded its bestperformance since 2000, growing in volume by9 per cent and in value by 21 per cent.1
Manufacturing took the lead: although globalmanufacturing output grew by only 4 per cent,an increasing proportion of this output is tradedinternationally, and as a result the volume ofmanufactured exports rose by 10 per cent.
Nevertheless, trade in agricultural productsalso grew in value, by 15 per cent. At the sametime, there was a substantial increase in trade incommercial services, which increased in value by18 per cent. These figures build on an alreadycreditable growth performance for 2003.
An increasingly integrated world has clearlybeen expanding the opportunities for globaltrade. But what contribution can trade make todevelopment? The dominant view has been thatengagement with international markets is notjust unavoidable but also beneficial: that tradecan facilitate, promote and sustain the develop-ment process. Indeed, for individual nationstrade is seen as a prerequisite for sustainedgrowth. Governments taking that view havetherefore devised policies to promote trade, andto shape the nature and degree of nationalengagement with the international economy. Thelarger developing countries in the Asia-Pacificregion (Box 1.1) have also made the greatestimpact, but the smaller ones too have been
Deeper integration with international markets can boost economic growth and generatemillions of new jobs. But it also brings new risks – of further marginalizing the LeastDeveloped Countries and undermining the most vulnerable communities. The challengeis to build a trading regime that is not just more balanced and equitable but also activelycombats poverty and promotes human development.
exploiting new opportunities for trade inservices, through tourism, for example, themigration of workers and the outsourcing ofbusiness processes.
This Report argues, however, that tradeneed not be – indeed, should not be – an end initself. Rather, it should realize a broad range ofhuman development objectives, and especially inthe poorest and Least Developed Countries(LDCs) it should help to alleviate poverty andreduce human deprivation. Human developmentin this sense refers to expanding people’s choicesand enabling them to lead longer and healthierlives: by ensuring that they are well-nourished
Chapter
Using International Trade toPromote Human Development
BOX 1.1COUNTRY CLASSIFICATIONS USED IN THIS REPORT
This Report gathers data from a range of sources that often use differentgroupings for regions and subregions. For consistency, the followingclassification has been used in this Report. Overall, the region is referred toas Asia and the Pacific or, for stylistic purposes, the Asia-Pacific region. Themain subregions are South Asia, the Pacific, and East Asia. Whereappropriate, East Asia is subdivided into South-East Asia and North-EastAsia. The countries within these subregions are as follows.
North-East Asia. China, Democratic People’s Republic of Korea, Mongolia,Republic of Korea.
South-East Asia. Cambodia, Indonesia, Lao PDR, Malaysia, Myanmar,Philippines, Timor-Leste, Thailand, Viet Nam.
South Asia. Afghanistan, Bangladesh, Bhutan, India, Iran, Maldives, Nepal,Pakistan, Sri Lanka.
Pacific. Cook Islands, Federated States of Micronesia, Fiji, Kiribati, MarshallIslands, Nauru, Niue, Palau, Papua New Guinea, Samoa, Solomon Islands,Tokelau, Tonga, Tuvalu, Vanuatu.
1
Trade need notbe – indeed,
should not be –an end in itself
ASIA-PACIFIC HUMAN DEVELOPMENT REPORT 200616
and have access to safe drinking water, sanita-tion facilities and shelter; by providing themequal opportunities to participate in economicactivity through education and decent work; andby affording them the freedoms to exercise thesechoices and fulfil their potential.
Trade can certainly enhance human deve-lopment, but it can also hinder it. Trade is, afterall, a profit-driven activity, and there are manyexamples from history that demonstrate whathappens when commercial gain takes precedenceover human well-being – for example, slavery,colonialism and apartheid. Today too the driveto export and import more goods and servicestypically triggers a series of complex and dyna-mic processes that produce both winners andlosers. For just as trade liberalization can incre-ase the opportunities for exports, it also exposes
local producers to foreign competition that, par-ticularly in poorer countries, they may be unableto withstand. So as well as creating new oppor-tunities, particularly in the modern sector, it canalso destroy the livelihoods of people working inbasic manufacturing or in agriculture.
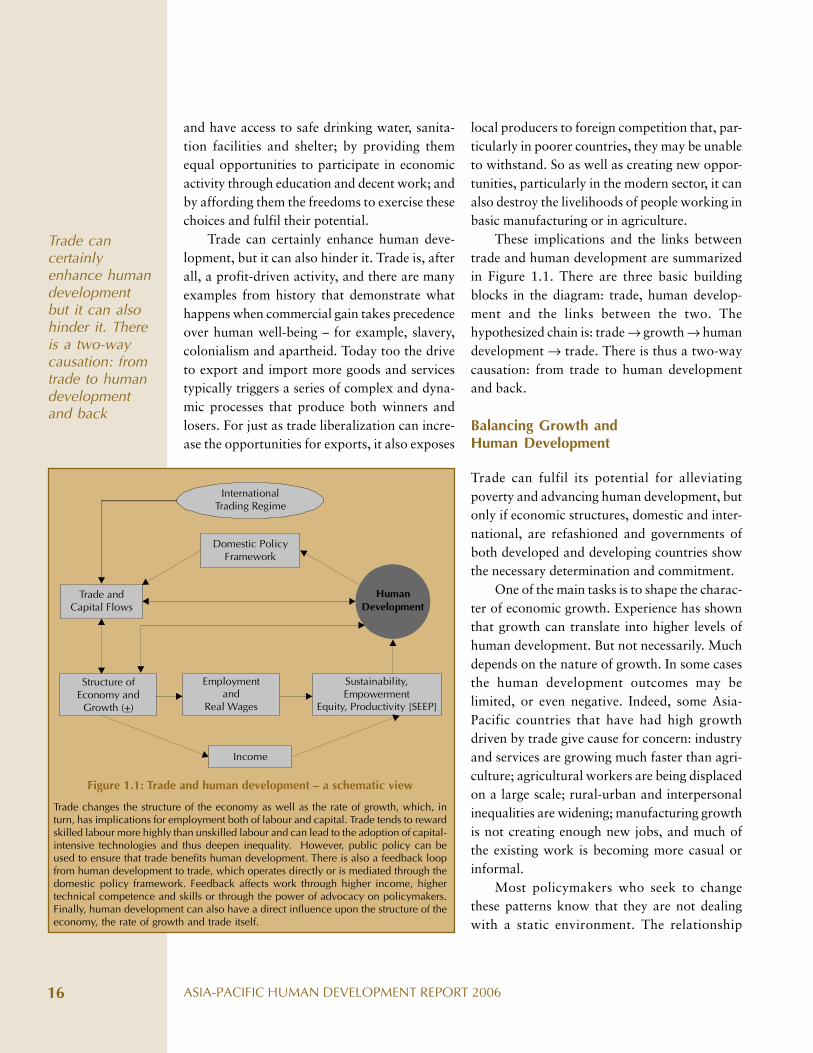
These implications and the links betweentrade and human development are summarizedin Figure 1.1. There are three basic buildingblocks in the diagram: trade, human develop-ment and the links between the two. Thehypothesized chain is: trade → growth → humandevelopment → trade. There is thus a two-waycausation: from trade to human developmentand back.
Balancing Growth andHuman Development
Trade can fulfil its potential for alleviatingpoverty and advancing human development, butonly if economic structures, domestic and inter-national, are refashioned and governments ofboth developed and developing countries showthe necessary determination and commitment.
One of the main tasks is to shape the charac-ter of economic growth. Experience has shownthat growth can translate into higher levels ofhuman development. But not necessarily. Muchdepends on the nature of growth. In some casesthe human development outcomes may belimited, or even negative. Indeed, some Asia-Pacific countries that have had high growthdriven by trade give cause for concern: industryand services are growing much faster than agri-culture; agricultural workers are being displacedon a large scale; rural-urban and interpersonalinequalities are widening; manufacturing growthis not creating enough new jobs, and much ofthe existing work is becoming more casual orinformal.
Most policymakers who seek to changethese patterns know that they are not dealingwith a static environment. The relationship
Figure 1.1: Trade and human development – a schematic view
Trade changes the structure of the economy as well as the rate of growth, which, inturn, has implications for employment both of labour and capital. Trade tends to rewardskilled labour more highly than unskilled labour and can lead to the adoption of capital-intensive technologies and thus deepen inequality. However, public policy can beused to ensure that trade benefits human development. There is also a feedback loopfrom human development to trade, which operates directly or is mediated through thedomestic policy framework. Feedback affects work through higher income, highertechnical competence and skills or through the power of advocacy on policymakers.Finally, human development can also have a direct influence upon the structure of theeconomy, the rate of growth and trade itself.
Trade cancertainlyenhance humandevelopmentbut it can alsohinder it. Thereis a two-waycausation: fromtrade to humandevelopmentand back
InternationalTrading Regime
Domestic PolicyFramework
Structure of Economy and
Growth ( )+
Income
Sustainability, Empowerment
Equity, Productivity [SEEP]
Employmentand
Real Wages
HumanDevelopment
Trade andCapital Flows
CHAPTER 1: USING INTERNATIONAL TRADE TO PROMOTE HUMAN DEVELOPMENT 17
between growth and human development isdynamic, and it works both ways. On the onehand, economic growth provides the resourcesto permit sustained improvements in humandevelopment; on the other hand, human deve-lopment improvements raise people’s capacitiesto boost economic growth.
But there are two alternative paths –‘lopsided’ and ‘balanced’.2 Lopsided strategiescan prioritize either economic growth or humandevelopment. Neither strategy is sustainable.‘Human-development-first’ strategies can runinto fiscal constraints and balance of paymentscrises, while ‘growth-first’ strategies can beconstrained by inadequate domestic supply ofskilled labour or by political instability. Farbetter to take a more balanced approach. But ofthe two lopsided approaches, the ‘human-development-first’ is the least unsatisfactory,since societies pursuing this strategy at least havea much better chance of weathering economiccrises and getting back on track.
Pursuing Growth through Trade
Even if policymakers accept the need forbalanced growth, is boosting trade a good wayto achieve this? The answer is typically: ‘yes’.Proponents of trade liberalization argue thatnowadays autarchy is not an option – that pur-suing a growth strategy that relies on producinglocal substitutes for imports will eventually runinto limits because for many products thenational market will be too small to justify localmanufacture.
Trade liberalization that involves reducingprotective tariffs can therefore lead to a moreefficient outcome – by delinking domesticsupplies from domestic production. A countryaiming for growth may find itself short ofcapital, for example, or of specific intermediategoods, or of skilled labour that it does not havelocally. One way to overcome these bottlenecksis to import the requisite commodity from
abroad. But doing so without triggering abalance of payments crisis will require sufficientforeign exchange. Thus, it may be crucial for acountry to engage in trade merely to earn theforeign exchange to finance imports. EvenChina, which has seen rapid increases in exportsover a long period, did not until recent years runa trade surplus – indeed, occasionally recordeddeficits – because it used export revenue tofinance its growing import bill, particularly foroil and machinery.
Trade liberalization should also enable thepoorer developing countries to make better useof their comparative advantage – an abundantsupply of unskilled and inexpensive labour. Theycan thus at the outset specialize in the productionand export of agricultural products and simplemanufactured goods such as textiles andclothing. This should also increase the demandand wages for unskilled workers and thus helpto reduce poverty.
But beyond these ‘static’ gains from tradeliberalization, there should also be more dynamicbenefits that become evident over time. Forexample, enterprises that are more exposed toforeign competition and markets will be forcedto increase their levels of efficiency. They can alsobenefit from foreign investment that mightinitially be attracted by cheap labour but willalso bring with it new technology and produc-tion processes. Ideally, therefore, trade liberali-zation should help to boost productivity, increaseexports, stimulate more rapid economic growth,and lead to increases in real wages, especially ofunskilled workers.
Unfortunately, many countries have fallenshort of this ideal. Markets often fail, and in par-ticular, in developing countries they may not besufficiently flexible to reallocate workers or capi-tal smoothly to the more productive sectors. Asa result, liberalization will fail to create thehoped-for export enterprises while risking aflood of cheap imports that put local enterprisesout of business.
Proponents oftrade
liberalizationargue thatnowadays
autarchy is notan option

ASIA-PACIFIC HUMAN DEVELOPMENT REPORT 200618
Moreover, even if the new export industriesemerge, there is a risk that these will becomesteadily less labour-intensive. Enterprises thatwant to enhance their competitive edge may tryto do this by shedding excess labour and useautomation to produce high-quality products tointernational standards. Thus, rather thanemploying more unskilled workers the exportindustries may instead further polarize ‘duallabour markets’ – consisting of a small formalsector where wages are influenced by govern-ment regulations and collective bargaining, anda much larger informal economy where wagestend to be linked to a subsistence level of income.
The Potential for State Action
It might be thought that a balanced approachthat would enable trade to promote humandevelopment could be achieved by a cleardivision of responsibilities: let free and liberalmarkets take care of economic growth whilegovernments address market failure and take
responsibility for social concerns and humandevelopment priorities.
However, this ignores the symbiotic rela-tionship between economic growth and progressin human development, and in particular, thatpolicies aimed at maximizing growth may alsoconstrain the potential for public action. Tradeliberalization, for example, will reduce trade-related taxes, which in many countries accountfor a significant share of government revenue. InSouth Asia overall, as a proportion of revenue,taxes on trade fell between 1990 and 2003 from27 to 19 per cent.3 Pakistan is a strikingexample. During the 1990s, import taxes fell byalmost 4 per cent of GDP. This was partiallyoffset by a rise of 1 per cent of GDP in revenuefrom income tax; nevertheless, the overall lossin tax revenue of 3 per cent of GDP clearly hasadverse implications for human development. Inthe Pacific Island countries customs and otherduties can provide up to 70 per cent ofgovernment revenue.4 Bangladesh, on the otherhand, has been able to offset losses, fromreduced tariff rates by rising volumes of importsand by introducing new sources of tax revenuesuch as VAT (Box 1.2).
A second objection to this clear-cut divisionconcerns sequencing – since human developmentmay be needed to advance economic growth. Inthe short run, countries may have to devoteresources to human development, even at theexpense of growth, because they believe thathigher capabilities will, in the longer term, leadto more sustainable growth. Successfulindustrialization requires not only capital andtechnology but also a capable labour force – onethat can manage that capital and technology anddisplay the discipline demanded by factoryproduction. That capability is directly related toliteracy, education, and status of health. In thenow-advanced countries, for example, socialprogrammes in health and education helped tobuttress industrial development and raiseproductivity. If growth limits or reverses human
BOX 1.2RECOVERING REVENUE LOSSES FROM TRADE LIBERALIZATION
IN BANGLADESH
Bangladesh undertook trade liberalization in the early 1990s and over thedecade virtually halved its effective rate of import duties. But revenue losseswere limited to less than 0.5 per cent of the GDP. There were two reasons forthis. First, because as import duties fell the volume of imports increased – 17per cent annually over the decade, in local currency – on the back of fast-growing exports, especially of textiles. Moreover, the tax base widened asexport industries expanded. Second, Bangladesh developed VAT andsupplementary excises which, given a broader tax base, produced rapidlygrowing revenues. Also, special efforts have been made in recent years toraise revenues from taxes on income and profits, primarily by curbing evasion(Table 1).
Table 1: Tax to GDP ratio in Bangladesh (%)
1993-94 1999-2000 2003-04
VAT and supplementary excise 3.1 3.6 4.2Customs duties 2.2 1.8 2.1Tax on income and profits 1.3 1.0 1.4Other taxes 0.6 0.4 0.6Total tax revenue 7.2 6.8 8.2
Source: IMF 2006.
CHAPTER 1: USING INTERNATIONAL TRADE TO PROMOTE HUMAN DEVELOPMENT 19
development gains, then growth itself may notbe sustainable.
Most governments have, therefore, felt theneed to intervene in order to achieve tradingsuccess – a process with deep historical roots(Box 1.3). A good outcome from internationaltrade is thought to depend on three kinds of Stateaction. First, the State must create the capacityto engage successfully in trade: enhancing thequality and competitiveness of the domesticlabour force; easing the cross-border movementof commodities and services; and investing in themarket development that allows for the entryand growth of competitive players.
Second, the State needs to protect thevulnerable. Enhanced trade generates bothwinners and losers: those who get left behindmay lose their livelihoods or see their incomesdrop or suffer from greater food insecurity. Thiserosion of human development is not onlyunacceptable in itself, it may also undermine thesocial consensus needed to pursue a strategy ofenhanced trade engagement. The State must,therefore, also create the safety nets needed toprotect the vulnerable.
Third, the State should be able to guideindustrial strategy. With its broader vision, itshould be able to assess the international contextand changes in the global production system. Itshould therefore be able to identify niche areas,encourage entry into these and invest in theResearch and Development (R&D) needed tobuild competitiveness in emerging sectors.
These three functions are indeed crucial. Butthey may not be sufficient. In a developingcountry, the State may also need to find ways ofcounteracting the imbalances in internationalmarkets. It will need to take account, forexample, of the sharp differences in nationaltrading capabilities, the substantial disparities inthe size, market presence and reserves ofcompeting partners, and the control exercised bya small group of players from a few developedcountries on various frontline technologies.
Faced with these imbalances, some govern-ments experiencing ‘export pessimism’ haveretreated from the unequal struggle and concen-trated on producing for the home market behindhigh tariff barriers. This may have been under-standable, but it is unsustainable; no country cansuccessfully pursue capitalist industrializationwhile insulated from world markets. Instead,as part of the strategy of growth, developingcountries must consciously engage with thosemarkets.
A Proactive Approach
Engaging with international trade does not meanpassively integrating. To address the inequalitiesin the world trading system, developingcountries need to take a more proactive stance.But to do so they need to distinguish betweenoverall policies aimed at a ‘greater involvementin trade’, such as reduce transport costs, andthose concerned simply with ‘openness’, such asreducing tariff barriers. These pose two differentquestions. The first is: ‘does international tradeboost economic growth?’, to which the answerseems to be generally ‘yes’. The second is: ‘docountries that reduce trade barriers grow fasterthan others?’ – a question on which there isconsiderable controversy over the evidence.5
This suggests a more complex package ofmeasures – and a more deliberate and less
BOX 1.3STATE INTERVENTION IN TRADE – AN AGE-OLD PHENOMENON
In around AD 60, a trader coming from what is now Dhaka, Bangladesh,arrived in Rome from Jeddah carrying fine muslin. He provoked a near-riotand was plied with coins, gold and silver and was even offered equallyvaluable horses. The Emperor, Tiberius, became worried because the demandfor these goods was annually depleting the Roman coffers by almost 50million sesterces, the trading bullion. So he banned the sale of ‘woven air’ –the finest muslin. Indeed, he was so concerned that he deployed soldiers tokeep the fabric out of Rome. The flow of commerce across national bordersis an age-old phenomenon – but so too are State policies to control trade forpublic purposes.
Source: Bandyopadhyay 2005.
Mostgovernmentshave felt the
need tointervene in
order to achievetrading success

ASIA-PACIFIC HUMAN DEVELOPMENT REPORT 200620
haphazard approach to removing trade barriers(Box 1.4). One of the most important objectivesshould be to encourage and protect domesticproducers in certain strategic sectors – affordingthem the time and space to expand productionfor the domestic market while strengtheningtheir capacity to compete internationally. Thisstrategy, which is essentially the one previouslyfollowed by Western countries, will typicallymean limiting the import of some finished goodswhile allowing imports of crucial capital, rawmaterials, and intermediate goods that willallow local producers to match the foreigncompetition. Countries pursuing this type ofstrategy will, therefore, need to resist pressuresto converge their tariffs, either across commodi-ty groups or between themselves and the rest ofthe world. At the same time, the State can applyappropriate antidumping duties and ensure that,wherever possible, it procures its own require-ments from national producers. It will be impor-tant, however, to ensure that such protectiondoes not simply breed slothful domestic mono-polies geared to skimming the domestic market.
Then the State needs to encourage expor-ters. Exports cannot constitute the only basis for
growth, but in an interdependent world they arevital for financing essential imports. Initiallycountries will look to fairly simple manufacturedgoods that take advantage of lower wage costs –and perhaps of a less codified legal frameworkor where labour rights are more restricted, as inexport trade zones (Box 1.5). All the successfullate industrializers, including the ‘newly indus-trialized economies’, pursued this kind of‘mercantilist’ strategy – pushing out exports atwhatever cost to establish footholds in inter-national markets.
Measures to promote national industriesalso need to be accompanied by a degree ofdiscipline. When offering industrialists incen-tives, the State must be in a position to enforcecompliance and, where appropriate, to be ableto influence the choice of product – for example,the technology used, the scale of production andthe prices of goods.
The Need for Investment
Gradually, however, industrialists can start tomove up the value chain. This will requiresubstantial investment, not just to expand
BOX 1.4STRATEGIC INTERNATIONAL INTEGRATION IN A GLOBALIZING WORLD
The global environment within which developing countries mustupgrade the productivity of their people is radically different fromthe time when ‘industrial policy’ was successfully applied in thenow-industrialized countries. Developing countries must contendwith new forms of industrial organization, rapid technical change,and diminished economic distance. Lall (2005) lists the followingelements that are critical in the current context:
• Selectivity – Picking on a few sectors at a time to develop, asopposed to indiscriminately promoting all industrialactivities.
• Technology and linkages – Emphasizing activities that havethe greatest technology spillovers and linkages with otherindustries.
• Early entry into world markets – Assisting enterprises toparticipate in international markets early.
• Private sector lead – Assigning the lead role to privateenterprises with support from public enterprises.
• Skill creation and infrastructure – Investing in skills de-manded by sectors which have been selected for promotion.
• Selective use of FDI – Encouraging foreign direct investmentto help build local capabilities and to gain entry into high-technology value chains and foreign markets.
• Good governance – Strengthening the ability of publicagencies to adapt public policies to changes in internationalmarkets and to technological advance, by working closelywith the private sector.
Each country will have a different industrial developmentstrategy consistent with its inherited natural and factorendowments, geographic location, and governance capabi-lities.The heavy hand of the government of the Republic of Korea inimposing export obligations on favoured enterprises is wellknown. Singapore relied heavily on FDI, but never tied itsdevelopment to the performance of any particular multinational.Successful countries applied strategic liberalization of imports atspecific phases of development to improve access to intermediateinputs and technology and to create competitive pressures. Somecountries directed the allocation of credit and inputs to thepreferred sectors.
CHAPTER 1: USING INTERNATIONAL TRADE TO PROMOTE HUMAN DEVELOPMENT 21
output but also to restructure and modernize theproduction base. A convenient measure ofprogress in this direction is the ‘investment rate’,which is the ratio of investment to nationalincome; higher investment should lead to ahigher rate of economic growth.
One analysis of the experience of 25 deve-loping countries over the period 1968-88 founda close correlation between the investment rateand the growth in output.6 In addition, the samestudy found a close correlation between theinvestment rate and the growth in exports.7 Whyshould greater investment lead to a highervolume of exports? For developing countries,this is primarily because they can use investmentto reform the structure of production andexports – moving from commodities, in whichworld trade is fairly stagnant, to manufacturedgoods, in which trade is growing more rapidly.The higher the investment ratio, the faster thetransformation of the production – structure and
hence, the greater the ability to participate in themore dynamic end of world trade.
As well as encouraging investment, however,the State also needs to act as a coordinator,ensuring that investment is directed to priorityareas where it can be used to increase levels oftechnology and achieve economies of scale, andthus enhance international competitiveness.Economies like Japan, the Republic of Korea andTaiwan (China), though in different ways,followed this type of strategic industrial policy –anticipating future opportunities and guidinginvestment in the most promising directions.Interestingly, it was only when they were dis-mantling these industrial policy frameworks thatthey ran into financial crises.
Macroeconomic Policies andExchange Rates
Strategic intervention may also be required inthe realm of macroeconomic policy, and in
As well asencouraging
investment, theState also needs
to act as acoordinator
ensuring thatinvestment is
directed topriority areas
BOX 1.5EXPORT PROCESSING ZONES
Export processing zones (EPZs) have played a significant role increating productive and remunerative employment in severalAsian economies, including Taiwan (China), Republic of Korea,Indonesia, Malaysia, Thailand and the Philippines, and morerecently in China, Viet Nam, Bangladesh and Sri Lanka.
In China, EPZs account for more than 55 per cent of totalexports and have created 40 million jobs (Fong 2006). InBangladesh and Sri Lanka, EPZ-created employment nowaccounts, respectively, for 6 per cent and 10 per cent ofmanufacturing employment.
In January 2006, UNDP undertook a primary survey of threeof the largest EPZs in India – Mumbai, Noida and Chennai –interviewing 229 workers. The survey and related secondary dataindicate the following (Aggarwal 2006):
Women. Women constitute only about 46 per cent of the workersin Indian EPZs, a share that is on the decline as EPZs embracemore advanced technologies.
Training. Indian EPZs have already evolved into the secondphase, where there is a greater demand for skilled workers.Nevertheless, only half the respondents had been given anyformal training.
Labour Laws. Labour laws say that no worker shall be required
to work in a factory for more than 48 hours in any week or formore than nine hours on any given day. In general, this has beenfound to be the case.
Health Facilities. Over 90 per cent of the firms surveyed reportedthat they provided health facilities some 70 per cent said they hadbeen given equipment to protect themselves from hazards.
Working Conditions. Most workers said they joined the zonesfor better working conditions and higher salaries, and 70 per centwere satisfied with the conditions. In general, employers do notprovide accommodation for their workers, but most firms in thezones allow their workers casual, medical and earned leave.
Wages and Incomes. Wages in EPZs are not higher than thoseoutside the zones, according to the survey, but incomes, whichincludes perks, are – and most workers said they were satisfiedwith these.
Poverty. While living conditions of workers in EPZs have improv-ed, the impact on poverty reduction has been marginal becausebackward linkages with the rest of the economy were very weak.
Surveys in Pakistan and Sri Lanka in 2006 had broadly similarfindings (Kemal 2006; Marga Institute 2006).
ASIA-PACIFIC HUMAN DEVELOPMENT REPORT 200622
particular for managing the exchange rate. Theworld is now experiencing rapid cross-borderflows of capital. In periods of economic boom,rapid capital inflows can push up the exchangerate and undermine competitiveness, while rapidoutflows, even if they do not lead to a full-fledged currency crisis, can result in a liquiditycrunch.
In the initial stages of liberalization, thebalance of trade is likely to worsen because, typi-cally, imports rise faster than exports. Tradeliberalization should, therefore, be supported bya number of complementary reforms, includingmanagement of domestic demand and theexchange rate. Rather than having a freelyfloating rate, developing economies are morelikely to benefit from a managed float.
In the early stages of liberalization, the rate
should, if necessary, be allowed to depreciate.This will curb demand for imports and stimulateexports; it also forestalls a precipitous fall ingovernment revenue and can broaden the taxbase, even if it lowers the effective tax rate. Thisshould improve the trade balance – though theoverall effect on the economy will depend onother factors such as the export supply response,structural rigidities and sound fiscal andmonetary policies. The exchange rate experienceof a number of countries in the region issummarized in Box 1.6.
Multilateral, Regional andBilateral Action
Governments can take many of the choices ontrade liberalization unilaterally: ultimately, the
BOX 1.6THE REAL EFFECTIVE EXCHANGE RATE: REGIONAL EXPERIENCES
In the initial stages of liberalization, the balance of trade is likelyto worsen because imports typically rise faster than exports.Trade liberalization should, therefore, be supported bymanagement of the exchange rate. In fact, the empirical evidencesuggests that, rather than having a freely floating exchange rate,developing countries are more likely to benefit from a managedfloat. A number of countries in the region have followed a variantof this strategy.
South Asia. Based on the data in Annex Table 4.4, it appears thatthe real effective exchange rates of most South Asian countrieshave, more or less, moved in synchrony with each other, but thecycles seem to be getting shorter – that is, the real effectiveexchange rate (REER) has moved up or down more frequently.Thus, the REER for Bangladesh, Pakistan and Sri Lankaappreciated during the first half of the 1990s and then depreciateduntil 1998. Thereafter, cycles appeared shorter: the REERdepreciated during 2000 and 2001and then appreciated duringthe next two years. India is an exception, with a real depreciationof the currency for most of the decade of the 1990s. Fluctuationsin the REER appear to be a reflection of underlying changes inthe balance of payments position. Averaging over the cycles, thelong-term trend is one of depreciation of the REER in India,Nepal and Pakistan, appreciation in Sri Lanka, and stability inBangladesh.
East Asia. During the financial crisis of the late 1990s, mostcountries in East Asia witnessed significant depreciation of theircurrencies except Malaysia, which implemented a fixed exchange
rate regime in the post-crisis period. Nevertheless, since tradefundamentals remained sound, depreciation quickly improved thetrade balance, stabilized the balance of payments and enabledcountries in the subregion to recover in a relatively short timefrom the financial crisis. The subsequent switch to a managedfloat has allowed the currencies of these countries to depreciateat a faster rate compared to previous periods. The upshot wasthat East Asian countries have built up massive foreign exchangereserves and are now showing symptoms of the “Dutch disease”currency appreciation resulting from the massive accumulationof foreign exchange reserves. Between 2001 and 2003, theextent of appreciation in REER was 7 per cent in China, 34 percent in Indonesia, 10 per cent in Malaysia and 15 per cent inThailand.
The relatively limited appreciation of the Chinese yuan in thepresence of a massive buildup in foreign exchange reserves hasraised the question: Is the Chinese currency undervalued? In July2005, China ended its hard peg to the US dollar. The yuanimmediately appreciated by 2.1 per cent, and since February 2006has been appreciating (against the US dollar) at an annual rate of4 per cent. At this rate, the currency could attain a realistic andsustainable level by the end of 2008.
Accumulating reserves too rapidly carries certain risks. It raisesthe fiscal costs of sterilizing the implied increases in money supply,fuels speculation in real estate and may exacerbate weakness inthe banking system. Steady appreciation, on the other hand, willprevent a continuing large increase in foreign exchange reserveswhile avoiding shocks to employment if exports fall toodrastically.
CHAPTER 1: USING INTERNATIONAL TRADE TO PROMOTE HUMAN DEVELOPMENT 23
decision to raise or lower tariff or other barriersto trade is a national one. Indeed, the majorityof liberalization measures from developing coun-tries have been the product of unilateral action,even if under the aegis of IMF-led or otherprogrammes of structural adjustment.
Nowadays, however, most of the attentionhas shifted to reciprocal relationships – ascountries agree multilaterally or bilaterally toreduce trade barriers to their mutual advantage.The principal multilateral forum is the WorldTrade Organization (WTO) and its ongoingDoha round of negotiations. Initially there weregrounds for optimism since the developed coun-tries appeared to recognize the specific needs ofdeveloping countries and duly characterised thisas the ‘Doha Development Round’.
Since then, ambition seemed to have beenscaled down substantially. Many people feel thatthe WTO has not proved as favourable to poorcountries as promised8 – indeed, that it putsgreater demands on developing countries andnarrows their options for pursuing their ownhuman development objectives.
Faced with the potential failure of the DohaRound, a number of developing countries havebeen looking for alternatives. In many cases theyhave reached bilateral agreements, typically withthe developed countries. Thailand, for example,has signed bilateral agreements with Australia,Japan and New Zealand, and has also beenconducting lengthy negotiations with the UnitedStates. Whether bilateral agreements are superiorto multilateral ones from the point of view ofhuman development is open to doubt since theyoften demand even greater concessions thanmultilateral ones while providing greater access.
At the same time the countries of Asia andthe Pacific have been promoting trade betweenthemselves through a series of regional tradeagreements (RTAs). This is part of a globalphenomenon: nearly all countries in the worldbelong to at least one type of RTA (Box 1.7).Between 1990 and 2005 the number of agree-
ments notified to the GATT/WTO increasedfrom 27 to more than 180 and the figure seemslikely to rise further. Both bilateral trade agree-ments (BTAs) and RTAs are likely to becomeincreasingly important, for a number of reasons:
Doubts about Multilateralism. Many countriesare looking for alternatives to multilateralagreements. Regional ones are easier to achieve,and they and BTAs may also serve as a threat toforce unwilling parties to negotiate in earnest atthe multilateral level.
The Domino Effect. Once an RTA starts tobecome effective, neighbouring non-memberswill be attracted to join, so as not to be excludedfrom trade flows.
Market Access for Developed Countries. Thedeveloped countries are competing for marketaccess in developing countries. The EuropeanUnion (EU) was the first to do so and has alreadysigned several agreements with EasternEuropean, Mediterranean, African and Asiancountries. Now the US too is expanding Free
Many peoplefeel that the
WTO has notproved as
favourable topoor countries
as promised
BOX 1.7VARIETIES OF REGIONAL TRADE AGREEMENTS
Depending upon their level of integration, the basic form of regionalcooperation, viz., Regional Trade Agreements (RTAs), can be broadly dividedinto five categories: Preferential Trade Agreements (PTAs), Free TradeAgreements (FTAs), Customs Unions (CUs), Common Markets, andEconomic Unions. A PTA is a union in which member countries impose lowertrade barriers on goods produced within the union, with some flexibility foreach member country on the extent of the reduction. An FTA is a special caseof a PTA where member countries completely abolish trade barriers (bothtariff barriers and non-tariff barriers) for goods originating within themember countries. It should be clarified here that in most cases countries donot abolish trade barriers completely even within FTAs. Most agreementstend to exclude sensitive sectors.
A Customs Union is seen as ensuring deeper integration than an FTAbecause unlike FTAs, where member countries are free to maintain theirindividual level of tariff barriers for goods imported from non-membercountries, in a CU member countries also apply a common external tariff(CET) on goods imported from outside countries. The CET can vary acrossgoods, but not across union partners. Overall, however, PTAs, FTAs andCUs are identified as ‘shallow integration’ arrangements in the tradeliterature.
ASIA-PACIFIC HUMAN DEVELOPMENT REPORT 200624
Trade Agreements (FTAs) rapidly – and has afoothold in Asia through the Asia Pacific Eco-nomic Cooperation (APEC) agreement. Deve-loping countries are also contributing to this byseeking asymmetric deals with onerous commit-ments, for example in IPRs, in return for prefe-rential treatment for limited export interests.
Reactions to Regionalism Elsewhere. Asianexporting countries worry that they are becom-ing increasingly vulnerable to the discriminatorypractices of trade agreements in other regions –in the EU, for example, or the proposed FreeTrade Area of the Americas. They are thus res-ponding with greater integration within theirown region.
Opportunities for Deeper Commitment. Deve-loped countries can use BTAs to achieve greaterinfluence over partner countries than is possi-
ble with the WTO. They can thus both choosetheir partners and also require higher invest-ment, labour, environmental and competitionstandards.
Some people argue that RTAs form thebuilding blocks for subsequent multilateralagreements. Since RTAs can be negotiated morequickly, they offer government officials theopportunity for ‘learning by doing’ and pioneernew ideas that can later appear in multilateraltreaties. Others see them more as stumblingblocks that do not promote additional trade butsimply divert existing flows, strengtheningprotectionist lobbies that will then opposemultilateralism. They can also divert the energiesof overstretched officials who have to cope witha ‘spaghetti bowl’ of overlapping tariff schedulesand rules. However, the consensus seems to bethat regionalism and multilateralism could becomplementary.
BOX 1.8ESTABLISHED REGIONAL TRADE AGREEMENTS INVOLVING ASIA-PACIFIC COUNTRIES
RTA Name, and year of enforcement Member countries
AFTA ASEAN Free Trade Area (1993) Brunei Darussalam, Cambodia, Indonesia, Lao PDR,Malaysia, Myanmar, Philippines, Singapore, Thailandand Viet Nam.
SAFTA South Asian Free Trade Area (2006) Bangladesh, Bhutan, India, Maldives, Nepal, Pakistanand Sri Lanka
PICTA Pacific Island Countries Trade Agreement (2001) Cook Islands, Fiji, Kiribati, Nauru, Niue, Pappua NewGuinea, Samoa, Solomon Islands, Tonga, Tuvalu andVanuatu
The ASEAN Free Trade Agreement (AFTA). This has sought toreduce intra-regional tariffs on all manufactured items of ASEANcountries to 5 per cent or less and to remove quantitativerestrictions and non-tariff barriers. This did strengthen intra-ASEAN trade, particularly during the 1990s. Between 1990 and1995, for member countries the share of their exports going toASEAN-10 countries increased from 20 to almost 26 per cent,though following the Asian crisis had fallen to 24 per cent by2002.
South Asian Free Trade Area (SAFTA). Regional tradecooperation in South Asia has been slow to develop. It was notuntil 1995 that the ministers agreed the SAARC PreferentialTrading Arrangement (SAPTA). This was very limited and gaveonly minor concessions so that by 2001 intra-regional trade stillaccounted for less than 5 per cent of the members’ total trade. In
January 2006, SAPTA was effectively replaced by the South AsianFree Trade Area (SAFTA). SAFTA’s Trade LiberalizationProgramme calls for a reduction in import duties to 20 per centby 2006 and to 0-5 per cent by 2013, or 2015 for the LeastDeveloped Countries. This too is limited and may not offer muchmore than the WTO.
Pacific Island Countries Trade Agreement (PICTA). This is a freetrade agreement that should lead to the establishment of a freetrade area. Over a period of 10 to 12 years following itsratification in 2001, PICTA envisages tariffs on all ‘originatinggoods’ falling to zero – with more rapid concessions for the twolargest countries, Papua New Guinea and Fiji. PICTA shouldbring a number of advantages; creating a market of some 7million people, it will permit economies of scale and encourageinvestment.
Both bilateraltrade agreements(BTAs) and RTAsare likely tobecomeincreasinglyimportant.However, theconsensus seemsto be thatregionalism andmultilateralismcould becomplementary
CHAPTER 1: USING INTERNATIONAL TRADE TO PROMOTE HUMAN DEVELOPMENT 25
Regional organizations in a region as vastand heterogeneous as Asia-Pacific tend to bebased on subregions. These include the ASEANFree Trade Area (AFTA), South Asian Free TradeArea (SAFTA) and Pacific Island CountriesTrade Agreement (PICTA) (Box 1.8).
The Human Development Imperative
Many countries in the region are thus deeplyengaged in trade issues. But too often the dis-cussions are restricted to the economic implica-tions. Instead, the countries of the region needto consider trade through a wider-angle, humandevelopment lens. Decisions on trade need to beconsidered not just on economic criteria but onwhat the implications are for human develop-ment – for improving people’s lives and wideningtheir choices. Some questions of interest are:9
Are the benefits sustainable? From theviewpoint of their environmental implications,to what extent, for example, does trade increasethe pressure for marketization of agriculture andfisheries? Could this lead to intensive cultivationand mono-cropping? More broadly, to whatextent can the benefits be sustained over time, inview of, for example, technological change,dynamic comparative advantages or intergene-rational considerations?
Are the benefits equitable? Do some havemore opportunities than others? Which groupsbenefit more than others? Are there losers, andif so, are they the relatively worse off? Doestrade contribute to reducing or widening ofinequalities? How do Least Developed Countriesand those that face trade-related vulnerabilitiesfare? When people and countries at differentstarting points engage in trade, do the better-offbenefit more? Do policies and institutions haveto be ‘unequal’ to promote equity, for example,through special and differential treatmentprovisions?
Are the implications empowering? Does the‘agency’ of some groups get compromised or
enhanced? Can people lead more dignified andempowered lives, say, through better or newemployment opportunities, for example,through the offshoring of business processes? Towhat extent does more open trade destroy jobs,say, for farmers or garment workers of Asia? Arethe new ideas and experiences empowering?
Are there productivity effects? Does theexchange of goods, services, money and ideascontribute to technology improvements? Doesthis happen more in the already more profitablesectors, as against in sectors that employ lower-end workers? Does more income in people’shands lead to better health, with less absen-teeism, less down-time? Do people invest morein education as they see its benefits? Areeducational choices influenced by marketopportunities?
Sustainability – Equity – Empowerment –Productivity. Does human development ‘SEEP’to the bottom? There are also tradeoffs, betweenproductivity, for example, and equity. Whilethese dimensions do not encompass all of humandevelopment, they serve as a tool to assess inter-national trade on human terms.
In these circumstances, the market alonecannot deliver a trade regime that promoteshuman development. The State needs to inform,guide and protect. But this should not just be amatter for ministries of trade or commerce; tradeshould receive close attention from most depart-ments of government: First, because moreproductive trade will require stronger humancapabilities – hence, the need to involve socialsector ministries, such as health or education.Second, because the repercussions of more libe-ralized trade are felt across all sectors and willdemand actionfrom different ministries, whetherto provide safety nets for those who lose theirlivelihoods or to reshape education and trainingsystems to meet the needs of a new economicstructure.
At the same time, the State needs to gatherbroad public support from both the private
ASIA-PACIFIC HUMAN DEVELOPMENT REPORT 200626
sector and from civil society. Governments needto build a stronger political consensus for tradereform. Many individuals and organizations, atboth national and international levels, havebecome more aware of the implications of newtrade regimes and will oppose measures thatdisadvantage the poor.
The Contours of the Report
The following chapters in this Report examinethese and related issues in greater depth –looking at the evidence and identifying the kindsof policies that promote a positive relationshipbetween trade and human development, whilealso protecting those who are likely to loseout from the disruption caused by new traderegimes.
Chapter Two. This chapter looks at theevidence from 20 years of trade liberalization –its impact on economic growth, and particularlyon how it has affected human developmentthrough employment.
Chapter Three. Agriculture accounts for ahigh proportion of employment in developingcountries and is one of the most contentiousareas in multilateral trade negotiations. This
chapter looks at the impact of the expansion ofinternational agricultural trade on poverty andexplores the policies that can be adopted toensure that such trade advances human develop-ment goals.
Chapter Four. Another sector of directinterest to the poor is textiles and clothing. Thischapter examines how the abolition of quotas isaffecting some of the poorest exporting coun-tries, such as Bangladesh and Cambodia.
Chapter Five. This chapter looks at the tradein services and specifically at the internationalmigration of workers, digital outsourcing, andthe flows of international tourists. It examinesthe potential of these activities and the actionsgovernments can take to ensure that they bestfulfil their promise.
Chapter Six. The rapid expansion ofinternational trade affects all countries in theregion, but some of the greatest concerns are forthe Least Developed Countries. This chapterconsiders their best path to trade integration.
Chapter Seven. The final chapter presents aneight-point agenda that developing countries ofthe region could consider in order to use tradeintegration to achieve human developmentgains.
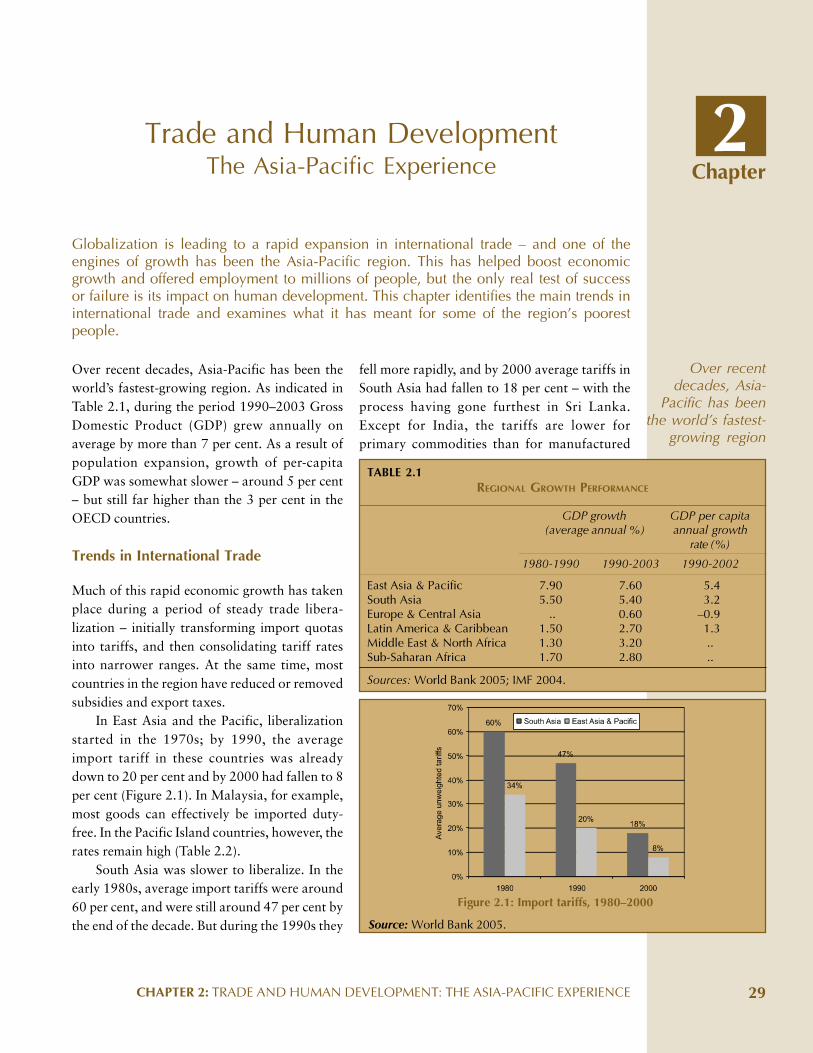
CHAPTER 2: TRADE AND HUMAN DEVELOPMENT: THE ASIA-PACIFIC EXPERIENCE 29
Over recent decades, Asia-Pacific has been theworld’s fastest-growing region. As indicated inTable 2.1, during the period 1990–2003 GrossDomestic Product (GDP) grew annually onaverage by more than 7 per cent. As a result ofpopulation expansion, growth of per-capitaGDP was somewhat slower – around 5 per cent– but still far higher than the 3 per cent in theOECD countries.
Trends in International Trade
Much of this rapid economic growth has takenplace during a period of steady trade libera-lization – initially transforming import quotasinto tariffs, and then consolidating tariff ratesinto narrower ranges. At the same time, mostcountries in the region have reduced or removedsubsidies and export taxes.
In East Asia and the Pacific, liberalizationstarted in the 1970s; by 1990, the averageimport tariff in these countries was alreadydown to 20 per cent and by 2000 had fallen to 8per cent (Figure 2.1). In Malaysia, for example,most goods can effectively be imported duty-free. In the Pacific Island countries, however, therates remain high (Table 2.2).
South Asia was slower to liberalize. In theearly 1980s, average import tariffs were around60 per cent, and were still around 47 per cent bythe end of the decade. But during the 1990s they
Globalization is leading to a rapid expansion in international trade – and one of theengines of growth has been the Asia-Pacific region. This has helped boost economicgrowth and offered employment to millions of people, but the only real test of successor failure is its impact on human development. This chapter identifies the main trends ininternational trade and examines what it has meant for some of the region’s poorestpeople.
fell more rapidly, and by 2000 average tariffs inSouth Asia had fallen to 18 per cent – with theprocess having gone furthest in Sri Lanka.Except for India, the tariffs are lower forprimary commodities than for manufactured
Chapter
Trade and Human DevelopmentThe Asia-Pacific Experience
TABLE 2.1REGIONAL GROWTH PERFORMANCE
GDP growth GDP per capita(average annual %) annual growth
rate (%)
1980-1990 1990-2003 1990-2002
East Asia & Pacific 7.90 7.60 5.4South Asia 5.50 5.40 3.2Europe & Central Asia .. 0.60 –0.9Latin America & Caribbean 1.50 2.70 1.3Middle East & North Africa 1.30 3.20 ..Sub-Saharan Africa 1.70 2.80 ..
Sources: World Bank 2005; IMF 2004.
2
Over recentdecades, Asia-
Pacific has beenthe world’s fastest-
growing region
Figure 2.1: Import tariffs, 1980–2000
Source: World Bank 2005.
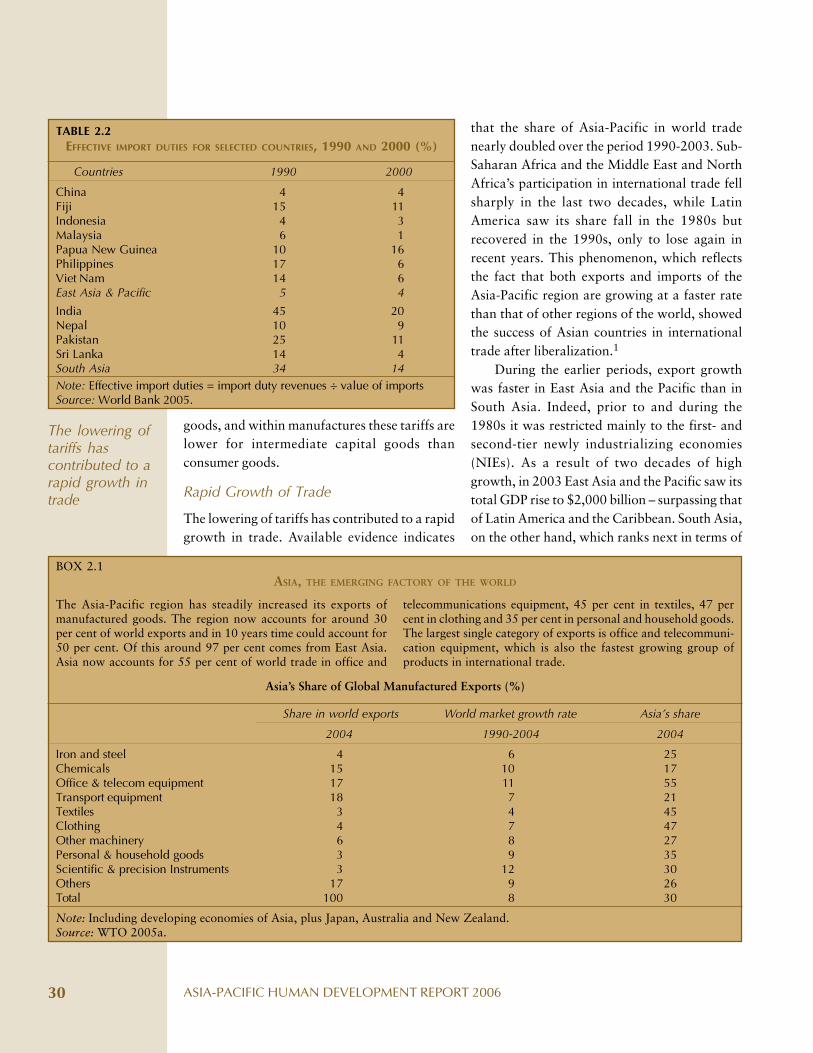
ASIA-PACIFIC HUMAN DEVELOPMENT REPORT 200630
that the share of Asia-Pacific in world tradenearly doubled over the period 1990-2003. Sub-Saharan Africa and the Middle East and NorthAfrica’s participation in international trade fellsharply in the last two decades, while LatinAmerica saw its share fall in the 1980s butrecovered in the 1990s, only to lose again inrecent years. This phenomenon, which reflectsthe fact that both exports and imports of theAsia-Pacific region are growing at a faster ratethan that of other regions of the world, showedthe success of Asian countries in internationaltrade after liberalization.1
During the earlier periods, export growthwas faster in East Asia and the Pacific than inSouth Asia. Indeed, prior to and during the1980s it was restricted mainly to the first- andsecond-tier newly industrializing economies(NIEs). As a result of two decades of highgrowth, in 2003 East Asia and the Pacific saw itstotal GDP rise to $2,000 billion – surpassing thatof Latin America and the Caribbean. South Asia,on the other hand, which ranks next in terms of
TABLE 2.2EFFECTIVE IMPORT DUTIES FOR SELECTED COUNTRIES, 1990 AND 2000 (%)
Countries 1990 2000
China 4 4Fiji 15 11Indonesia 4 3Malaysia 6 1Papua New Guinea 10 16Philippines 17 6Viet Nam 14 6East Asia & Pacific 5 4
India 45 20Nepal 10 9Pakistan 25 11Sri Lanka 14 4South Asia 34 14
Note: Effective import duties = import duty revenues ÷ value of importsSource: World Bank 2005.
The lowering oftariffs hascontributed to arapid growth intrade
BOX 2.1ASIA, THE EMERGING FACTORY OF THE WORLD
goods, and within manufactures these tariffs arelower for intermediate capital goods thanconsumer goods.
Rapid Growth of Trade
The lowering of tariffs has contributed to a rapidgrowth in trade. Available evidence indicates
The Asia-Pacific region has steadily increased its exports ofmanufactured goods. The region now accounts for around 30per cent of world exports and in 10 years time could account for50 per cent. Of this around 97 per cent comes from East Asia.Asia now accounts for 55 per cent of world trade in office and
telecommunications equipment, 45 per cent in textiles, 47 percent in clothing and 35 per cent in personal and household goods.The largest single category of exports is office and telecommuni-cation equipment, which is also the fastest growing group ofproducts in international trade.
Asia’s Share of Global Manufactured Exports (%)
Share in world exports World market growth rate Asia’s share
2004 1990-2004 2004
Iron and steel 4 6 25Chemicals 15 10 17Office & telecom equipment 17 11 55Transport equipment 18 7 21Textiles 3 4 45Clothing 4 7 47Other machinery 6 8 27Personal & household goods 3 9 35Scientific & precision Instruments 3 12 30Others 17 9 26Total 100 8 30
Note: Including developing economies of Asia, plus Japan, Australia and New Zealand.Source: WTO 2005a.
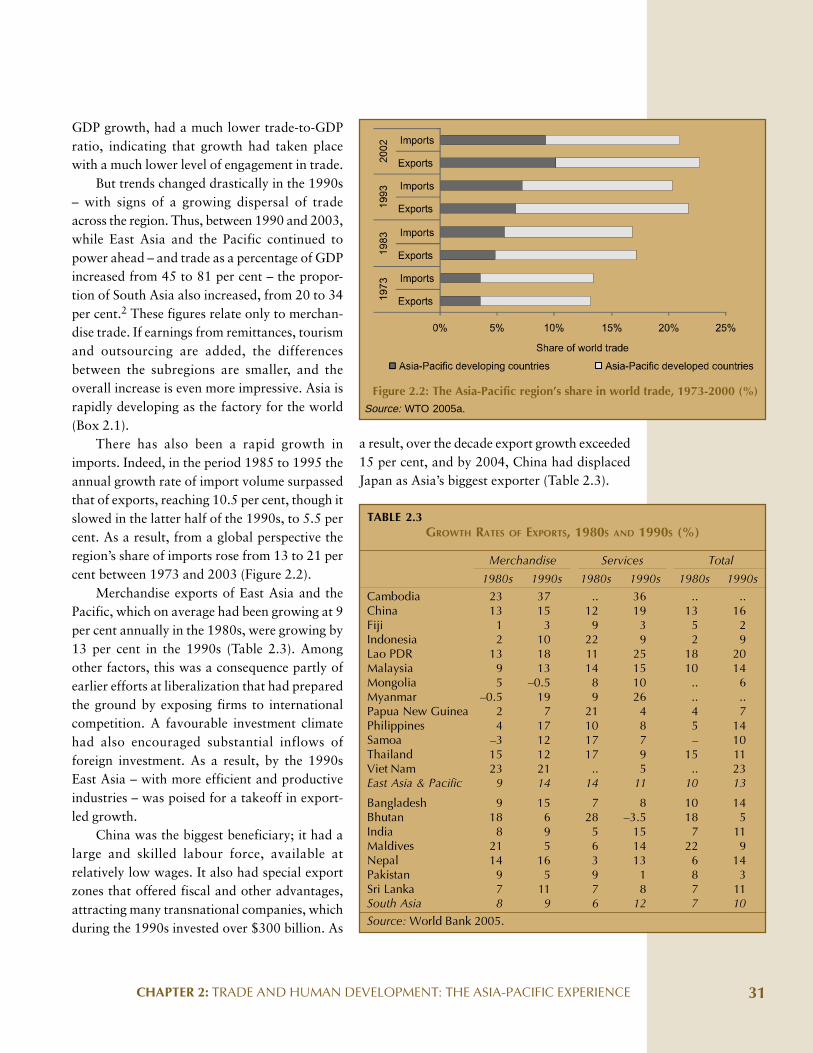
CHAPTER 2: TRADE AND HUMAN DEVELOPMENT: THE ASIA-PACIFIC EXPERIENCE 31
GDP growth, had a much lower trade-to-GDPratio, indicating that growth had taken placewith a much lower level of engagement in trade.
But trends changed drastically in the 1990s– with signs of a growing dispersal of tradeacross the region. Thus, between 1990 and 2003,while East Asia and the Pacific continued topower ahead – and trade as a percentage of GDPincreased from 45 to 81 per cent – the propor-tion of South Asia also increased, from 20 to 34per cent.2 These figures relate only to merchan-dise trade. If earnings from remittances, tourismand outsourcing are added, the differencesbetween the subregions are smaller, and theoverall increase is even more impressive. Asia israpidly developing as the factory for the world(Box 2.1).
There has also been a rapid growth inimports. Indeed, in the period 1985 to 1995 theannual growth rate of import volume surpassedthat of exports, reaching 10.5 per cent, though itslowed in the latter half of the 1990s, to 5.5 percent. As a result, from a global perspective theregion’s share of imports rose from 13 to 21 percent between 1973 and 2003 (Figure 2.2).
Merchandise exports of East Asia and thePacific, which on average had been growing at 9per cent annually in the 1980s, were growing by13 per cent in the 1990s (Table 2.3). Amongother factors, this was a consequence partly ofearlier efforts at liberalization that had preparedthe ground by exposing firms to internationalcompetition. A favourable investment climatehad also encouraged substantial inflows offoreign investment. As a result, by the 1990sEast Asia – with more efficient and productiveindustries – was poised for a takeoff in export-led growth.
China was the biggest beneficiary; it had alarge and skilled labour force, available atrelatively low wages. It also had special exportzones that offered fiscal and other advantages,attracting many transnational companies, whichduring the 1990s invested over $300 billion. As
Figure 2.2: The Asia-Pacific region’s share in world trade, 1973-2000 (%)
Source: WTO 2005a.
TABLE 2.3GROWTH RATES OF EXPORTS, 1980S AND 1990S (%)
Merchandise Services Total
1980s 1990s 1980s 1990s 1980s 1990s
Cambodia 23 37 .. 36 .. ..China 13 15 12 19 13 16Fiji 1 3 9 3 5 2Indonesia 2 10 22 9 2 9Lao PDR 13 18 11 25 18 20Malaysia 9 13 14 15 10 14Mongolia 5 –0.5 8 10 .. 6Myanmar –0.5 19 9 26 .. ..Papua New Guinea 2 7 21 4 4 7Philippines 4 17 10 8 5 14Samoa –3 12 17 7 – 10Thailand 15 12 17 9 15 11Viet Nam 23 21 .. 5 .. 23East Asia & Pacific 9 14 14 11 10 13
Bangladesh 9 15 7 8 10 14Bhutan 18 6 28 –3.5 18 5India 8 9 5 15 7 11Maldives 21 5 6 14 22 9Nepal 14 16 3 13 6 14Pakistan 9 5 9 1 8 3Sri Lanka 7 11 7 8 7 11South Asia 8 9 6 12 7 10
Source: World Bank 2005.
a result, over the decade export growth exceeded15 per cent, and by 2004, China had displacedJapan as Asia’s biggest exporter (Table 2.3).

ASIA-PACIFIC HUMAN DEVELOPMENT REPORT 200632
Other export success stories in East Asiainclude Malaysia and Thailand. Indonesia andthe Philippines have also been performing morestrongly of late. But coming up fastest is VietNam, whose exports have been growing by 20per cent annually since the early 1980s – promis-ing to make this East Asia’s next major middle-income economy.
More surprising, perhaps, has been the per-formance of some of South-East Asia’s LeastDeveloped Countries (LDCs). A number of thesehave been keen globalizers. Starting from a lowbase, Cambodia, for example, has had pheno-menal growth in merchandise exports – 37 percent per annum – mostly of textiles and clothing.Lao PDR and Myanmar have also done well,with export growth rates of 18 per cent and 19per cent.
The situation is different in South Asia. Here
Coming upfastest is VietNam, whoseexports havebeen growingat the rate 20per centannually sincethe early 1980s
the growth in merchandise exports has been lessimpressive. India, the subregion’s largest expor-ter, has been slower to cut tariffs and redirectproduction from import substitution to exportmarkets. Some of the smaller countries, however,have done better, notably Bangladesh and Nepalin textiles and clothing, though this was largelydue to the quota regime, which has now beenphased out. South Asia as a whole has also donemuch better on service exports, with a growthrate in the 1990s higher than that for East Asia.India is the leader here, offering outsourcedservices, particularly in the IT sector, to many ofthe OECD countries.
The growth pattern has been similar forimports (Table 2.4). Rates of importing havealso been rising, partly because tariff reductionshave made imports cheaper relative to home-produced goods, thus displacing some import-substituting industries. But some imports arerequired as inputs to exports, reflecting the moreintegrated networks of global production, asdifferent locations contribute different parts tothe chain of value added. Exports and importscan thus be closely linked: in South Asia in par-ticular, the rising exports, by alleviating foreignexchange constraints, have enabled importliberalization.
Nevertheless, imports have generally beengrowing more slowly than exports, particularlyin South Asia. The main exception is China,whose buoyant demand for imports, growing at17 per cent annually, has pushed East Asia andthe Pacific’s share of global imports from 4 to 7per cent. South Asia’s share, however, hasremained more or less the same.
The combination of rising exports andimports means that virtually all Asian economieshave become more ‘open’. The degree of‘openness’ of the economy, measured as the ratioof international trade (goods and services) toGDP, has risen steadily, as seen above, both, inEast Asia and South Asia between 1990 and2003.
TABLE 2.4GROWTH RATES OF IMPORTS, 1980S AND 1990S (%)
Merchandise Services Total
1980s 1990s 1980s 1990s 1980s 1990s
Cambodia 0 27 .. 25 ..China 12 16 12 28 12 17Fiji 4 2 9 5 5 2Indonesia 9 6 3 11 7 8Lao PDR 8 14 –11 13 2 12Malaysia 12 12 7 13 11 12Mongolia 6 2 45 5 .. 6Myanmar –1 30 4 29 .. ..Papua New Guinea 1 1 4 8 2 4Philippines 6 12 4 18 6 12Samoa 4 4 6 3 .. 2Thailand 16 8 16 11 16 9Viet Nam 8 21 .. 10 .. 21East Asia & Pacific 10 12 9 13 10 12
Bangladesh 4 9 4 10 3 9Bhutan 7 11 2 15 8 13India 5 9 8 13 5 10Maldives 20 11 0 11 22 8Nepal 8 10 7 3 9 7Pakistan 4 5 9 2 4 5Sri Lanka 3 11 6 10 4 10South Asia 4 8 7 10 5 8
Source: World Bank 2005.
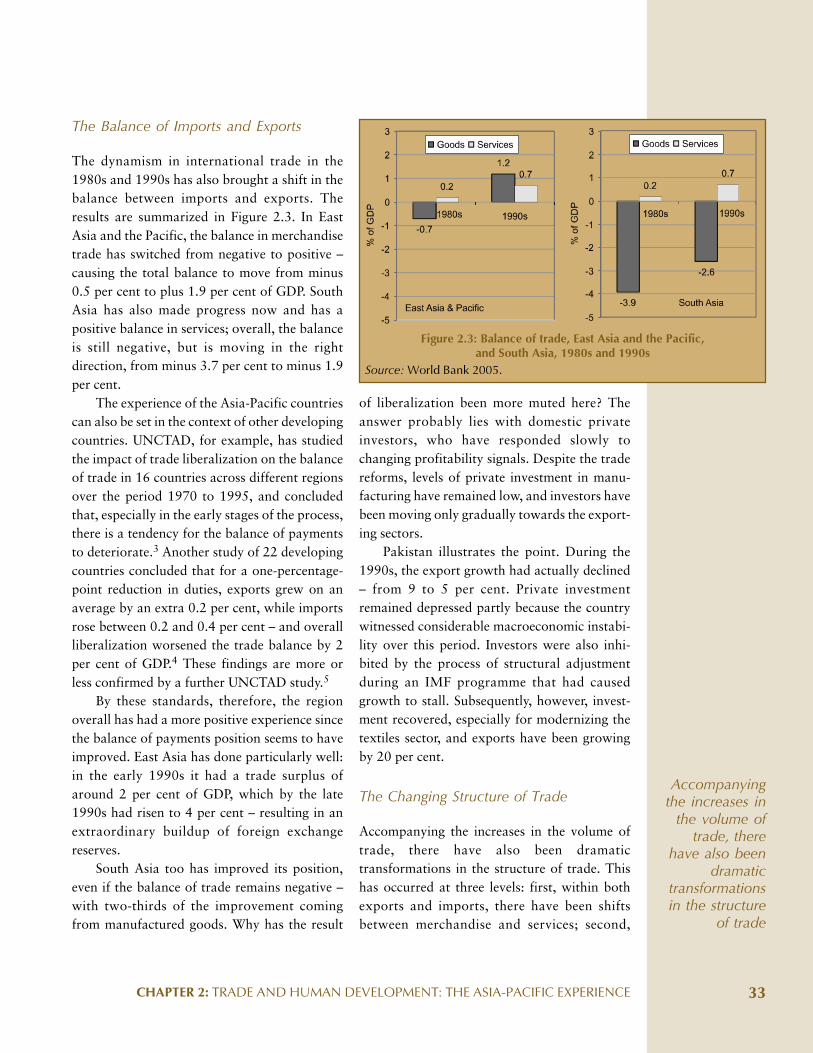
CHAPTER 2: TRADE AND HUMAN DEVELOPMENT: THE ASIA-PACIFIC EXPERIENCE 33
Figure 2.3: Balance of trade, East Asia and the Pacific,and South Asia, 1980s and 1990s
Source: World Bank 2005.
The Balance of Imports and Exports
The dynamism in international trade in the1980s and 1990s has also brought a shift in thebalance between imports and exports. Theresults are summarized in Figure 2.3. In EastAsia and the Pacific, the balance in merchandisetrade has switched from negative to positive –causing the total balance to move from minus0.5 per cent to plus 1.9 per cent of GDP. SouthAsia has also made progress now and has apositive balance in services; overall, the balanceis still negative, but is moving in the rightdirection, from minus 3.7 per cent to minus 1.9per cent.
The experience of the Asia-Pacific countriescan also be set in the context of other developingcountries. UNCTAD, for example, has studiedthe impact of trade liberalization on the balanceof trade in 16 countries across different regionsover the period 1970 to 1995, and concludedthat, especially in the early stages of the process,there is a tendency for the balance of paymentsto deteriorate.3 Another study of 22 developingcountries concluded that for a one-percentage-point reduction in duties, exports grew on anaverage by an extra 0.2 per cent, while importsrose between 0.2 and 0.4 per cent – and overallliberalization worsened the trade balance by 2per cent of GDP.4 These findings are more orless confirmed by a further UNCTAD study.5
By these standards, therefore, the regionoverall has had a more positive experience sincethe balance of payments position seems to haveimproved. East Asia has done particularly well:in the early 1990s it had a trade surplus ofaround 2 per cent of GDP, which by the late1990s had risen to 4 per cent – resulting in anextraordinary buildup of foreign exchangereserves.
South Asia too has improved its position,even if the balance of trade remains negative –with two-thirds of the improvement comingfrom manufactured goods. Why has the result
Accompanyingthe increases in
the volume oftrade, there
have also beendramatic
transformationsin the structure
of trade
of liberalization been more muted here? Theanswer probably lies with domestic privateinvestors, who have responded slowly tochanging profitability signals. Despite the tradereforms, levels of private investment in manu-facturing have remained low, and investors havebeen moving only gradually towards the export-ing sectors.
Pakistan illustrates the point. During the1990s, the export growth had actually declined– from 9 to 5 per cent. Private investmentremained depressed partly because the countrywitnessed considerable macroeconomic instabi-lity over this period. Investors were also inhi-bited by the process of structural adjustmentduring an IMF programme that had causedgrowth to stall. Subsequently, however, invest-ment recovered, especially for modernizing thetextiles sector, and exports have been growingby 20 per cent.
The Changing Structure of Trade
Accompanying the increases in the volume oftrade, there have also been dramatictransformations in the structure of trade. Thishas occurred at three levels: first, within bothexports and imports, there have been shiftsbetween merchandise and services; second,
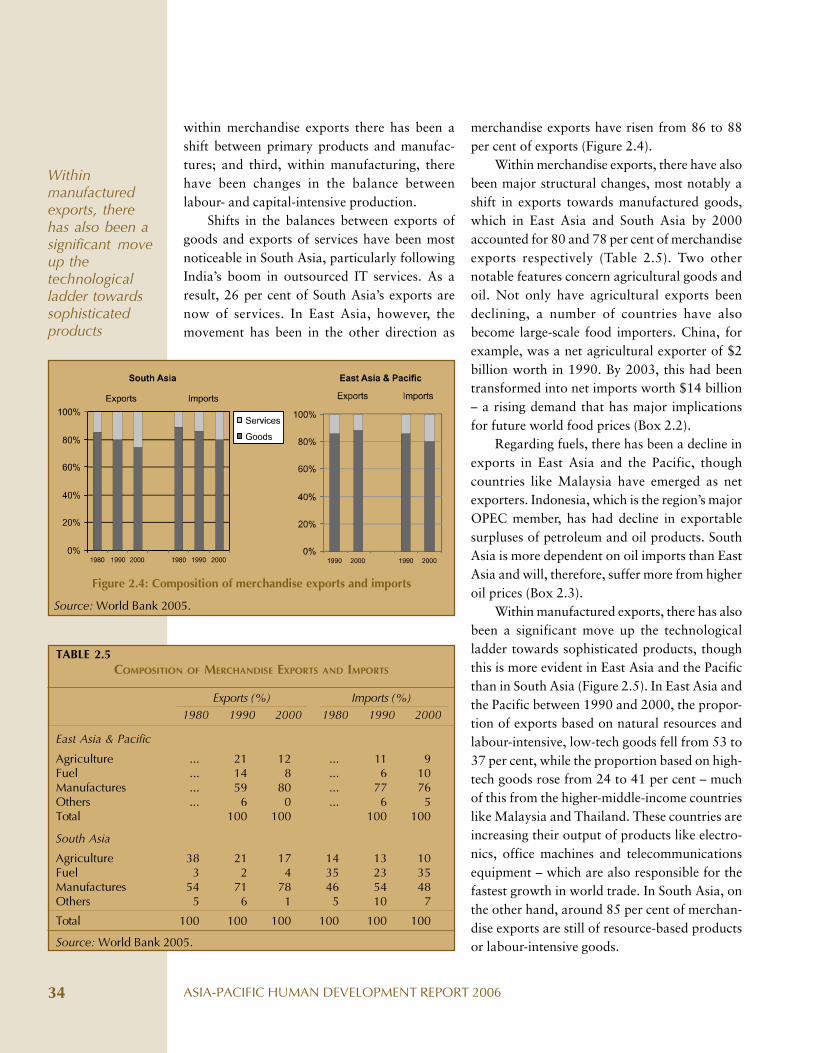
ASIA-PACIFIC HUMAN DEVELOPMENT REPORT 200634
merchandise exports have risen from 86 to 88per cent of exports (Figure 2.4).
Within merchandise exports, there have alsobeen major structural changes, most notably ashift in exports towards manufactured goods,which in East Asia and South Asia by 2000accounted for 80 and 78 per cent of merchandiseexports respectively (Table 2.5). Two othernotable features concern agricultural goods andoil. Not only have agricultural exports beendeclining, a number of countries have alsobecome large-scale food importers. China, forexample, was a net agricultural exporter of $2billion worth in 1990. By 2003, this had beentransformed into net imports worth $14 billion– a rising demand that has major implicationsfor future world food prices (Box 2.2).
Regarding fuels, there has been a decline inexports in East Asia and the Pacific, thoughcountries like Malaysia have emerged as netexporters. Indonesia, which is the region’s majorOPEC member, has had decline in exportablesurpluses of petroleum and oil products. SouthAsia is more dependent on oil imports than EastAsia and will, therefore, suffer more from higheroil prices (Box 2.3).
Within manufactured exports, there has alsobeen a significant move up the technologicalladder towards sophisticated products, thoughthis is more evident in East Asia and the Pacificthan in South Asia (Figure 2.5). In East Asia andthe Pacific between 1990 and 2000, the propor-tion of exports based on natural resources andlabour-intensive, low-tech goods fell from 53 to37 per cent, while the proportion based on high-tech goods rose from 24 to 41 per cent – muchof this from the higher-middle-income countrieslike Malaysia and Thailand. These countries areincreasing their output of products like electro-nics, office machines and telecommunicationsequipment – which are also responsible for thefastest growth in world trade. In South Asia, onthe other hand, around 85 per cent of merchan-dise exports are still of resource-based productsor labour-intensive goods.
TABLE 2.5COMPOSITION OF MERCHANDISE EXPORTS AND IMPORTS
Exports (%) Imports (%)
1980 1990 2000 1980 1990 2000
East Asia & Pacific
Agriculture ... 21 12 ... 11 9Fuel ... 14 8 ... 6 10Manufactures ... 59 80 ... 77 76Others ... 6 0 ... 6 5Total 100 100 100 100
South Asia
Agriculture 38 21 17 14 13 10Fuel 3 2 4 35 23 35Manufactures 54 71 78 46 54 48Others 5 6 1 5 10 7
Total 100 100 100 100 100 100
Source: World Bank 2005.
within merchandise exports there has been ashift between primary products and manufac-tures; and third, within manufacturing, therehave been changes in the balance betweenlabour- and capital-intensive production.
Shifts in the balances between exports ofgoods and exports of services have been mostnoticeable in South Asia, particularly followingIndia’s boom in outsourced IT services. As aresult, 26 per cent of South Asia’s exports arenow of services. In East Asia, however, themovement has been in the other direction as
Figure 2.4: Composition of merchandise exports and imports
Source: World Bank 2005.
Withinmanufacturedexports, therehas also been asignificant moveup thetechnologicalladder towardssophisticatedproducts

CHAPTER 2: TRADE AND HUMAN DEVELOPMENT: THE ASIA-PACIFIC EXPERIENCE 35
Growth or Trade – Which Comes First?
The Asia-Pacific region has thus experiencedsignificant economic growth and a rapid rise inexports, especially in East Asia and to a lesserextent in South Asia. But have the exports havetriggered this growth, or is it the other wayround: are rising exports an outcome of econo-mic growth? This is a question on which therehas been extensive discussion.6
One view is that the main driving force isgrowth: as output rise, there is a surplus that canbe exported. If, for example, a small developingcountry has a good harvest that produces a foodsurplus, then it can sell in international markets– and do so at the prevailing world price sincethe quantities will be relatively small.
The alternative view is that growth needsexports. A country that has a small domesticmarket can only achieve sustained growth byselling into larger world markets. This view issupported by empirical research.7 This isillustrated in Figure 2.6, which for a sample ofthe larger low-to-middle income economies ofAsia and the Pacific plots GDP growth over the1980s and 1990s against export growth. Thissuggests a largely positive relationship. How-ever, this scatter diagram has some outliers:China, for example, in the 1980s had only a
BOX 2.3THE OIL SHOCK
Although Indonesia and Malaysia, as net exporters, havebenefited from the rise in oil prices, many others are sufferingfrom an ‘oil shock’. The extent of the shock can be measured byconsidering the rise in the import bill expressed as a percentage ofthe country’s liquid foreign exchange reserves.
Assuming, say, a 50 per cent rise in crude oil prices between2004 and 2005, then among the larger countries the mostvulnerable would be Pakistan, the Philippines, Sri Lanka and VietNam, where the shock would exceed 20 per cent. Pakistan, forexample, which has foreign exchange reserves of just under $10billion, faces extra costs of $2 billion. China too faces a rapidlyrising import bill – an increase of $24 billion – but the shock issmaller because of its extraordinarily high level of foreignexchange reserves.
Oil shock of the magnitudes sustained by Pakistan, the
Philippines, Sri Lanka and Viet Nam will not just be felt in oneyear; they will persist for some time, depending on structuralrigidities and other factors.
Sources: UNCTAD 2005a; OPEC 2005.
Oil Shock = 20%Pakistan, Philippines, Sri Lanka,Viet Nam
Oil Shock = 10–20%Bangladesh, India, Nepal, Thailand
Oil Shock < 10%China
BOX 2.2FROM FOOD SURPLUS TO FOOD DEFICIT
Four of the ten larger low to middle-income economies in the region nowhave net food deficits. They are Bangladesh, China, Pakistan and thePhilippines. Of these, China had a surplus till as recently as 2003 and thePhilippines up to 1994. The surplus has remained constant in India and alsoin Sri Lanka, where it is very small. In Indonesia, Malaysia and Thailand, thesurpluses have grown.
Net Food Surpluses and Deficits in Selected Countries $ Billions
Country 1990 2000
Bangladesh –0.4 –1.2
China 3.2 –0.3
India 3 3
Indonesia 1.7 4.3
Malaysia 1.4 4.3
Pakistan –0.8 –0.5
Philippines 0.2 –0.6
Sri Lanka 0.1 0.1
Thailand 4.9 7.6
Viet Nam – 3
Source: World Bank 2005.
modest growth in exports but still managed toachieve rapid economic growth. Viet Nam, onthe other hand, had a rapid growth in exportsbut only a modest economic growth.
It is also possible to group countries accord-ing to their performance in the 1990s in relationto the 1980s:
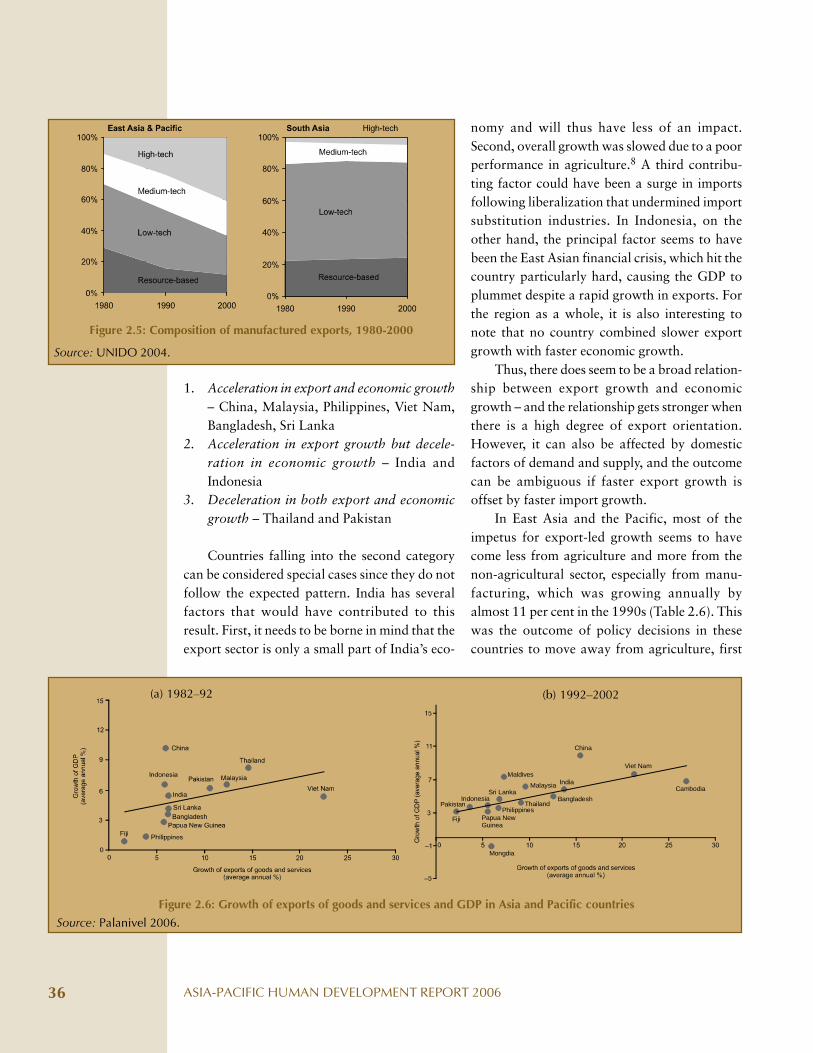
ASIA-PACIFIC HUMAN DEVELOPMENT REPORT 200636
1. Acceleration in export and economic growth– China, Malaysia, Philippines, Viet Nam,Bangladesh, Sri Lanka
2. Acceleration in export growth but decele-ration in economic growth – India andIndonesia
3. Deceleration in both export and economicgrowth – Thailand and Pakistan
Countries falling into the second categorycan be considered special cases since they do notfollow the expected pattern. India has severalfactors that would have contributed to thisresult. First, it needs to be borne in mind that theexport sector is only a small part of India’s eco-
nomy and will thus have less of an impact.Second, overall growth was slowed due to a poorperformance in agriculture.8 A third contribu-ting factor could have been a surge in importsfollowing liberalization that undermined importsubstitution industries. In Indonesia, on theother hand, the principal factor seems to havebeen the East Asian financial crisis, which hit thecountry particularly hard, causing the GDP toplummet despite a rapid growth in exports. Forthe region as a whole, it is also interesting tonote that no country combined slower exportgrowth with faster economic growth.
Thus, there does seem to be a broad relation-ship between export growth and economicgrowth – and the relationship gets stronger whenthere is a high degree of export orientation.However, it can also be affected by domesticfactors of demand and supply, and the outcomecan be ambiguous if faster export growth isoffset by faster import growth.
In East Asia and the Pacific, most of theimpetus for export-led growth seems to havecome less from agriculture and more from thenon-agricultural sector, especially from manu-facturing, which was growing annually byalmost 11 per cent in the 1990s (Table 2.6). Thiswas the outcome of policy decisions in thesecountries to move away from agriculture, first
Figure 2.5: Composition of manufactured exports, 1980-2000
Source: UNIDO 2004.
(a) 1982–92
Figure 2.6: Growth of exports of goods and services and GDP in Asia and Pacific countries
Source: Palanivel 2006.
(b) 1992–2002
Mongdia
Papua NewGuinea
PhilippinesThailand
Bangladesh
India
China
Viet Nam
CambodiaMalaysia
Maldives
Sri Lanka
Fiji
PakistanIndonesia
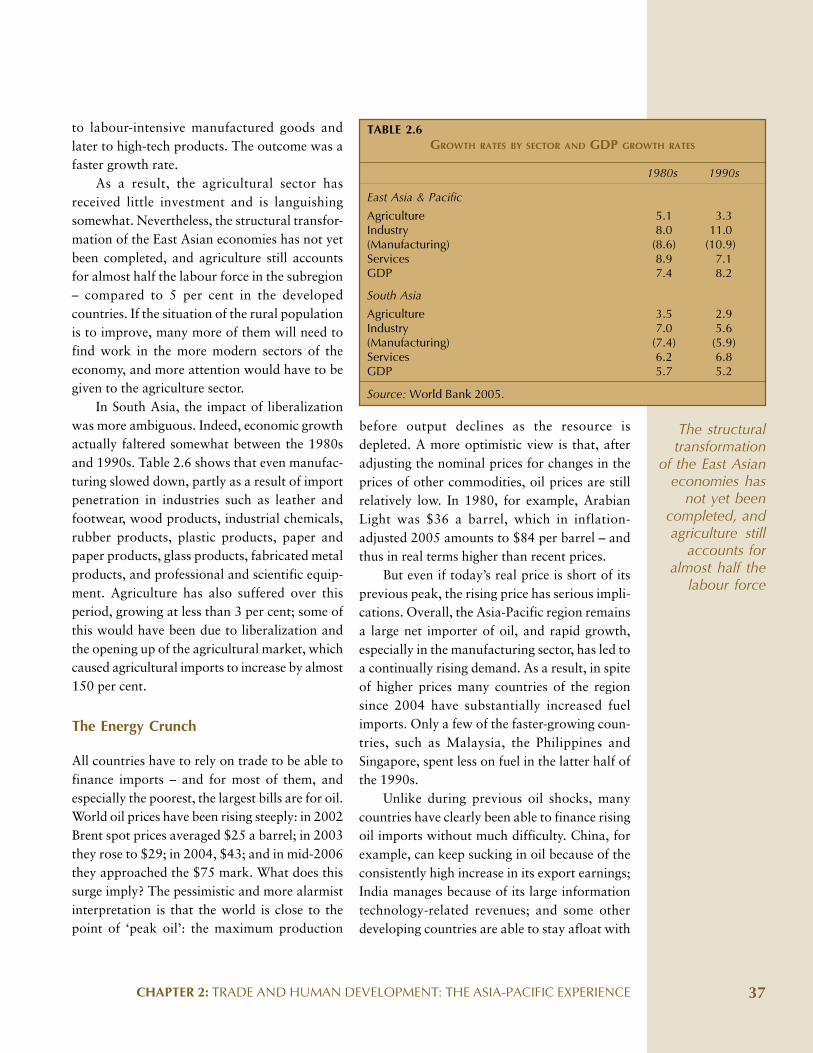
CHAPTER 2: TRADE AND HUMAN DEVELOPMENT: THE ASIA-PACIFIC EXPERIENCE 37
to labour-intensive manufactured goods andlater to high-tech products. The outcome was afaster growth rate.
As a result, the agricultural sector hasreceived little investment and is languishingsomewhat. Nevertheless, the structural transfor-mation of the East Asian economies has not yetbeen completed, and agriculture still accountsfor almost half the labour force in the subregion– compared to 5 per cent in the developedcountries. If the situation of the rural populationis to improve, many more of them will need tofind work in the more modern sectors of theeconomy, and more attention would have to begiven to the agriculture sector.
In South Asia, the impact of liberalizationwas more ambiguous. Indeed, economic growthactually faltered somewhat between the 1980sand 1990s. Table 2.6 shows that even manufac-turing slowed down, partly as a result of importpenetration in industries such as leather andfootwear, wood products, industrial chemicals,rubber products, plastic products, paper andpaper products, glass products, fabricated metalproducts, and professional and scientific equip-ment. Agriculture has also suffered over thisperiod, growing at less than 3 per cent; some ofthis would have been due to liberalization andthe opening up of the agricultural market, whichcaused agricultural imports to increase by almost150 per cent.
The Energy Crunch
All countries have to rely on trade to be able tofinance imports – and for most of them, andespecially the poorest, the largest bills are for oil.World oil prices have been rising steeply: in 2002Brent spot prices averaged $25 a barrel; in 2003they rose to $29; in 2004, $43; and in mid-2006they approached the $75 mark. What does thissurge imply? The pessimistic and more alarmistinterpretation is that the world is close to thepoint of ‘peak oil’: the maximum production
before output declines as the resource isdepleted. A more optimistic view is that, afteradjusting the nominal prices for changes in theprices of other commodities, oil prices are stillrelatively low. In 1980, for example, ArabianLight was $36 a barrel, which in inflation-adjusted 2005 amounts to $84 per barrel – andthus in real terms higher than recent prices.
But even if today’s real price is short of itsprevious peak, the rising price has serious impli-cations. Overall, the Asia-Pacific region remainsa large net importer of oil, and rapid growth,especially in the manufacturing sector, has led toa continually rising demand. As a result, in spiteof higher prices many countries of the regionsince 2004 have substantially increased fuelimports. Only a few of the faster-growing coun-tries, such as Malaysia, the Philippines andSingapore, spent less on fuel in the latter half ofthe 1990s.
Unlike during previous oil shocks, manycountries have clearly been able to finance risingoil imports without much difficulty. China, forexample, can keep sucking in oil because of theconsistently high increase in its export earnings;India manages because of its large informationtechnology-related revenues; and some otherdeveloping countries are able to stay afloat with
TABLE 2.6GROWTH RATES BY SECTOR AND GDP GROWTH RATES
1980s 1990s
East Asia & Pacific
Agriculture 5.1 3.3Industry 8.0 11.0(Manufacturing) (8.6) (10.9)Services 8.9 7.1GDP 7.4 8.2
South Asia
Agriculture 3.5 2.9Industry 7.0 5.6(Manufacturing) (7.4) (5.9)Services 6.2 6.8GDP 5.7 5.2
Source: World Bank 2005.
The structuraltransformation
of the East Asianeconomies has
not yet beencompleted, andagriculture still
accounts foralmost half the
labour force
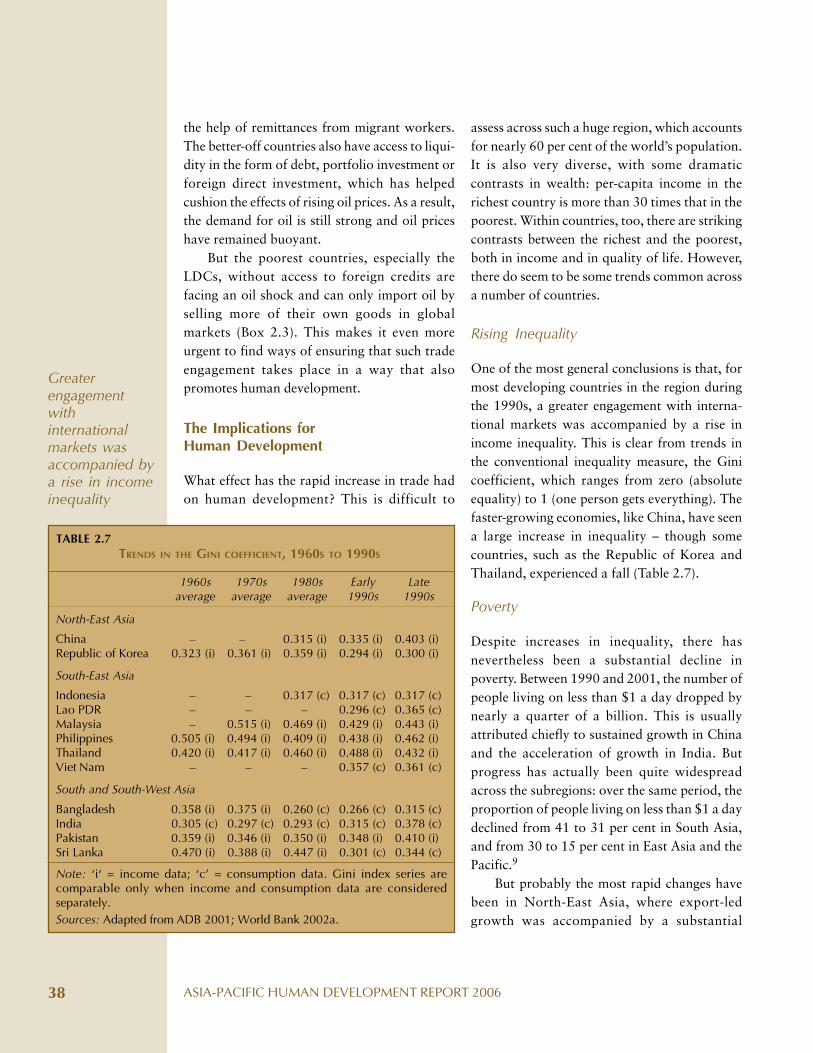
ASIA-PACIFIC HUMAN DEVELOPMENT REPORT 200638
assess across such a huge region, which accountsfor nearly 60 per cent of the world’s population.It is also very diverse, with some dramaticcontrasts in wealth: per-capita income in therichest country is more than 30 times that in thepoorest. Within countries, too, there are strikingcontrasts between the richest and the poorest,both in income and in quality of life. However,there do seem to be some trends common acrossa number of countries.
Rising Inequality
One of the most general conclusions is that, formost developing countries in the region duringthe 1990s, a greater engagement with interna-tional markets was accompanied by a rise inincome inequality. This is clear from trends inthe conventional inequality measure, the Ginicoefficient, which ranges from zero (absoluteequality) to 1 (one person gets everything). Thefaster-growing economies, like China, have seena large increase in inequality – though somecountries, such as the Republic of Korea andThailand, experienced a fall (Table 2.7).
Poverty
Despite increases in inequality, there hasnevertheless been a substantial decline inpoverty. Between 1990 and 2001, the number ofpeople living on less than $1 a day dropped bynearly a quarter of a billion. This is usuallyattributed chiefly to sustained growth in Chinaand the acceleration of growth in India. Butprogress has actually been quite widespreadacross the subregions: over the same period, theproportion of people living on less than $1 a daydeclined from 41 to 31 per cent in South Asia,and from 30 to 15 per cent in East Asia and thePacific.9
But probably the most rapid changes havebeen in North-East Asia, where export-ledgrowth was accompanied by a substantial
the help of remittances from migrant workers.The better-off countries also have access to liqui-dity in the form of debt, portfolio investment orforeign direct investment, which has helpedcushion the effects of rising oil prices. As a result,the demand for oil is still strong and oil priceshave remained buoyant.
But the poorest countries, especially theLDCs, without access to foreign credits arefacing an oil shock and can only import oil byselling more of their own goods in globalmarkets (Box 2.3). This makes it even moreurgent to find ways of ensuring that such tradeengagement takes place in a way that alsopromotes human development.
The Implications forHuman Development
What effect has the rapid increase in trade hadon human development? This is difficult to
TABLE 2.7TRENDS IN THE GINI COEFFICIENT, 1960S TO 1990S
1960s 1970s 1980s Early Lateaverage average average 1990s 1990s
North-East Asia
China – – 0.315 (i) 0.335 (i) 0.403 (i)Republic of Korea 0.323 (i) 0.361 (i) 0.359 (i) 0.294 (i) 0.300 (i)
South-East Asia
Indonesia – – 0.317 (c) 0.317 (c) 0.317 (c)Lao PDR – – – 0.296 (c) 0.365 (c)Malaysia – 0.515 (i) 0.469 (i) 0.429 (i) 0.443 (i)Philippines 0.505 (i) 0.494 (i) 0.409 (i) 0.438 (i) 0.462 (i)Thailand 0.420 (i) 0.417 (i) 0.460 (i) 0.488 (i) 0.432 (i)Viet Nam – – – 0.357 (c) 0.361 (c)
South and South-West Asia
Bangladesh 0.358 (i) 0.375 (i) 0.260 (c) 0.266 (c) 0.315 (c)India 0.305 (c) 0.297 (c) 0.293 (c) 0.315 (c) 0.378 (c)Pakistan 0.359 (i) 0.346 (i) 0.350 (i) 0.348 (i) 0.410 (i)Sri Lanka 0.470 (i) 0.388 (i) 0.447 (i) 0.301 (c) 0.344 (c)
Note: ‘i‘ = income data; ‘c’ = consumption data. Gini index series arecomparable only when income and consumption data are consideredseparately.
Sources: Adapted from ADB 2001; World Bank 2002a.
Greaterengagementwithinternationalmarkets wasaccompanied bya rise in incomeinequality
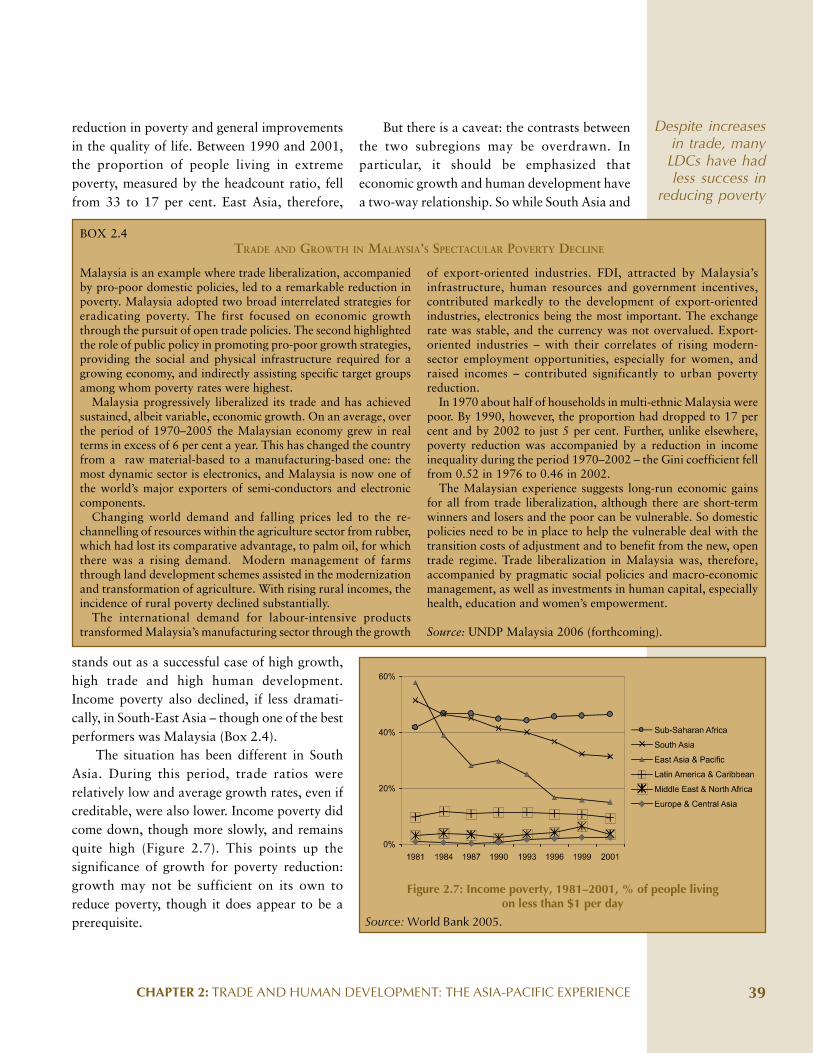
CHAPTER 2: TRADE AND HUMAN DEVELOPMENT: THE ASIA-PACIFIC EXPERIENCE 39
reduction in poverty and general improvementsin the quality of life. Between 1990 and 2001,the proportion of people living in extremepoverty, measured by the headcount ratio, fellfrom 33 to 17 per cent. East Asia, therefore,
Despite increasesin trade, many
LDCs have hadless success in
reducing poverty
stands out as a successful case of high growth,high trade and high human development.Income poverty also declined, if less dramati-cally, in South-East Asia – though one of the bestperformers was Malaysia (Box 2.4).
The situation has been different in SouthAsia. During this period, trade ratios wererelatively low and average growth rates, even ifcreditable, were also lower. Income poverty didcome down, though more slowly, and remainsquite high (Figure 2.7). This points up thesignificance of growth for poverty reduction:growth may not be sufficient on its own toreduce poverty, though it does appear to be aprerequisite.
BOX 2.4TRADE AND GROWTH IN MALAYSIA’S SPECTACULAR POVERTY DECLINE
Malaysia is an example where trade liberalization, accompaniedby pro-poor domestic policies, led to a remarkable reduction inpoverty. Malaysia adopted two broad interrelated strategies foreradicating poverty. The first focused on economic growththrough the pursuit of open trade policies. The second highlightedthe role of public policy in promoting pro-poor growth strategies,providing the social and physical infrastructure required for agrowing economy, and indirectly assisting specific target groupsamong whom poverty rates were highest.
Malaysia progressively liberalized its trade and has achievedsustained, albeit variable, economic growth. On an average, overthe period of 1970–2005 the Malaysian economy grew in realterms in excess of 6 per cent a year. This has changed the countryfrom a raw material-based to a manufacturing-based one: themost dynamic sector is electronics, and Malaysia is now one ofthe world’s major exporters of semi-conductors and electroniccomponents.
Changing world demand and falling prices led to the re-channelling of resources within the agriculture sector from rubber,which had lost its comparative advantage, to palm oil, for whichthere was a rising demand. Modern management of farmsthrough land development schemes assisted in the modernizationand transformation of agriculture. With rising rural incomes, theincidence of rural poverty declined substantially.
The international demand for labour-intensive productstransformed Malaysia’s manufacturing sector through the growth
of export-oriented industries. FDI, attracted by Malaysia’sinfrastructure, human resources and government incentives,contributed markedly to the development of export-orientedindustries, electronics being the most important. The exchangerate was stable, and the currency was not overvalued. Export-oriented industries – with their correlates of rising modern-sector employment opportunities, especially for women, andraised incomes – contributed significantly to urban povertyreduction.
In 1970 about half of households in multi-ethnic Malaysia werepoor. By 1990, however, the proportion had dropped to 17 percent and by 2002 to just 5 per cent. Further, unlike elsewhere,poverty reduction was accompanied by a reduction in incomeinequality during the period 1970–2002 – the Gini coefficient fellfrom 0.52 in 1976 to 0.46 in 2002.
The Malaysian experience suggests long-run economic gainsfor all from trade liberalization, although there are short-termwinners and losers and the poor can be vulnerable. So domesticpolicies need to be in place to help the vulnerable deal with thetransition costs of adjustment and to benefit from the new, opentrade regime. Trade liberalization in Malaysia was, therefore,accompanied by pragmatic social policies and macro-economicmanagement, as well as investments in human capital, especiallyhealth, education and women’s empowerment.
Source: UNDP Malaysia 2006 (forthcoming).
Figure 2.7: Income poverty, 1981–2001, % of people livingon less than $1 per day
Source: World Bank 2005.
But there is a caveat: the contrasts betweenthe two subregions may be overdrawn. Inparticular, it should be emphasized thateconomic growth and human development havea two-way relationship. So while South Asia and
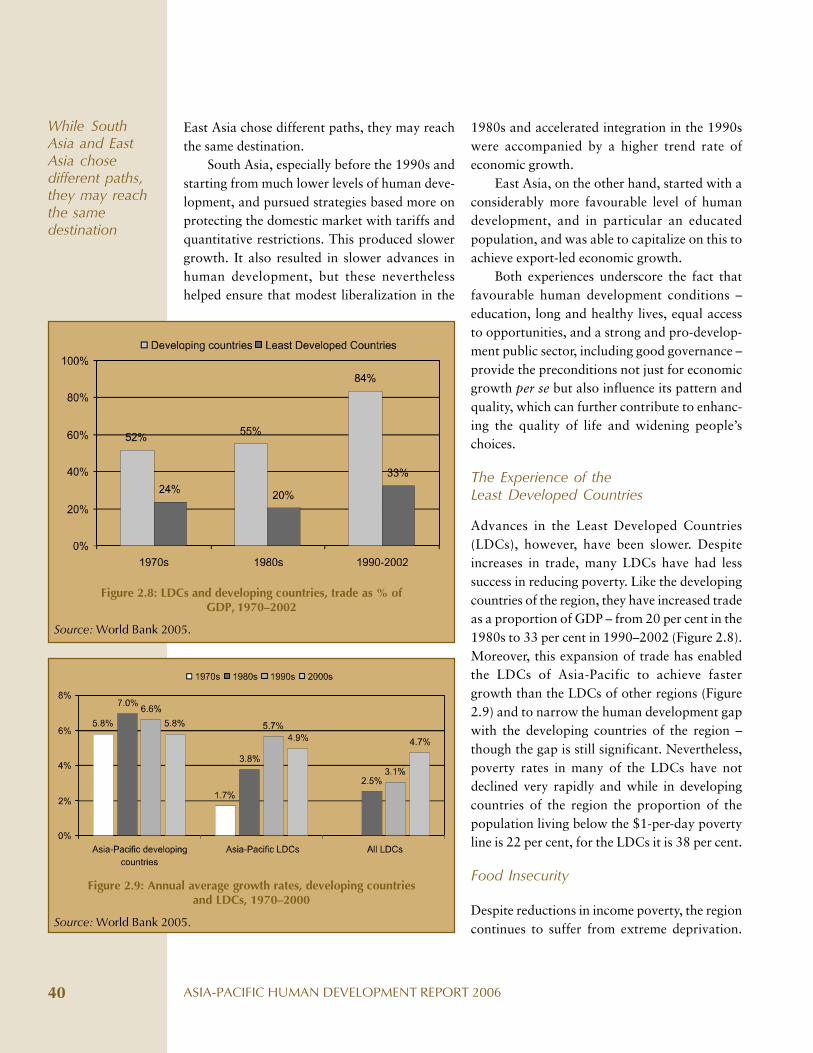
ASIA-PACIFIC HUMAN DEVELOPMENT REPORT 200640
East Asia chose different paths, they may reachthe same destination.
South Asia, especially before the 1990s andstarting from much lower levels of human deve-lopment, and pursued strategies based more onprotecting the domestic market with tariffs andquantitative restrictions. This produced slowergrowth. It also resulted in slower advances inhuman development, but these neverthelesshelped ensure that modest liberalization in the
1980s and accelerated integration in the 1990swere accompanied by a higher trend rate ofeconomic growth.
East Asia, on the other hand, started with aconsiderably more favourable level of humandevelopment, and in particular an educatedpopulation, and was able to capitalize on this toachieve export-led economic growth.
Both experiences underscore the fact thatfavourable human development conditions –education, long and healthy lives, equal accessto opportunities, and a strong and pro-develop-ment public sector, including good governance –provide the preconditions not just for economicgrowth per se but also influence its pattern andquality, which can further contribute to enhanc-ing the quality of life and widening people’schoices.
The Experience of theLeast Developed Countries
Advances in the Least Developed Countries(LDCs), however, have been slower. Despiteincreases in trade, many LDCs have had lesssuccess in reducing poverty. Like the developingcountries of the region, they have increased tradeas a proportion of GDP – from 20 per cent in the1980s to 33 per cent in 1990–2002 (Figure 2.8).Moreover, this expansion of trade has enabledthe LDCs of Asia-Pacific to achieve fastergrowth than the LDCs of other regions (Figure2.9) and to narrow the human development gapwith the developing countries of the region –though the gap is still significant. Nevertheless,poverty rates in many of the LDCs have notdeclined very rapidly and while in developingcountries of the region the proportion of thepopulation living below the $1-per-day povertyline is 22 per cent, for the LDCs it is 38 per cent.
Food Insecurity
Despite reductions in income poverty, the regioncontinues to suffer from extreme deprivation.
Figure 2.9: Annual average growth rates, developing countriesand LDCs, 1970–2000
Source: World Bank 2005.
Figure 2.8: LDCs and developing countries, trade as % ofGDP, 1970–2002
Source: World Bank 2005.
While SouthAsia and EastAsia chosedifferent paths,they may reachthe samedestination
CHAPTER 2: TRADE AND HUMAN DEVELOPMENT: THE ASIA-PACIFIC EXPERIENCE 41
This is evident, for example, in food consump-tion. Liberalizing agricultural markets may havehelped reduce the price of food – particularlyfood produced with the backing of subsidies inthe US and the EU. But this does not seem tohave led to any consistent improvement in foodsecurity. More countries now have food deficits(Box 2.2), and Asia still has more hungry peoplethan in any other region of the world – over 510million in 2002.10 And in recent years thenumber has increased, so that about one in everysix persons was undernourished.11 This wasbecause progress slowed in China, Thailand andViet Nam, and in some countries the advancesof the first half of the 1990s were actuallyreversed – as in India, Indonesia and Pakistan.12
Food deprivation has hampered efforts todeal with malnutrition. Household food insecu-rity, combined with the lack of adequate feedingpractices and the debilitating effects of infectiousdisease, leaves million of children under-nourished – and at greater risk of early death.The proportion of children under five who areunderweight may have been reduced: between1990 and 2003, in South Asia the proportiondeclined from 53 to 47 per cent; in South-EastAsia from 38 to 29 per cent, and in North-EastAsia from 19 to 10 per cent.13 Nevertheless, thisprogress has been far too slow, and in 2003 inSouth-East Asia malnutrition was still sappingthe strength of close to one-third of children, andin South Asia of nearly half.
Health
Trade might be expected to improve health byincreasing employment and income. There isnow the threat that due to the TRIPS agreement,the price of drugs might increase, though this hasyet to take effect. Generally, the period of trade-led growth has been accompanied by improve-ments in health, though this seem to have slowedin recent years. The most rapid progress has beenin South-East Asia, where between 1990 and
2003 the under-five mortality rate per 1,000 livebirths fell from 78 to 46. In North-East Asia itfell from 48 to 37. There has also been progressin the South Asia from 126 to 90, but the rateremains high. A number of subregions also havehigh rates of maternal mortality: in 2000 thesestood at 540 per 100,000 live births in SouthAsia and 210 in South-East Asia, though acreditable 55 in North-East Asia.14
Education
Trade might have been expected to raiseeducation standards by giving people greaterincentives to improve their skills. But progresshas also been inadequate. The greatest problemsare again in South Asia, where one child in fivefails to enrol in primary school. Since 1990-91,when the net enrolment ratio in primaryeducation was 73 per cent, the ratio hasincreased, but by 2001-02 had still only reached79 per cent. Moreover, a high proportion ofchildren who enrol do not complete the fullcourse of primary education. Enrolment ratestend to be higher in the other subregions, buteven here they may be slipping: in South-EastAsia over the same period, enrolment declinedfrom 92 to 91 per cent and in North-East Asiafrom 97 to 95 per cent.15 Children in these twosubregions also do better for completion: inSouth-East Asia 90 per cent of those enrolledreach the final grade of primary school, and inNorth-East Asia all children reportedly completetheir primary schooling.16
As in most other areas, the shortfall is fargreater for girls than boys. In South Asia,between 1990-91 and 2001-02 the number ofgirls enrolled in primary school per 100 boysrose from 76 to 85, but still falls far short ofparity. For South-East and North-East Asia,however, the ratios are more impressive –increasing over the same period from 96 to 97and from 93 to 100 respectively. At thesecondary-school level, patterns of enrolment
In 2003 inSouth-East Asia
malnutrition wasstill sapping thestrength of close
to one-third ofchildren, and in
South Asia ofnearly half
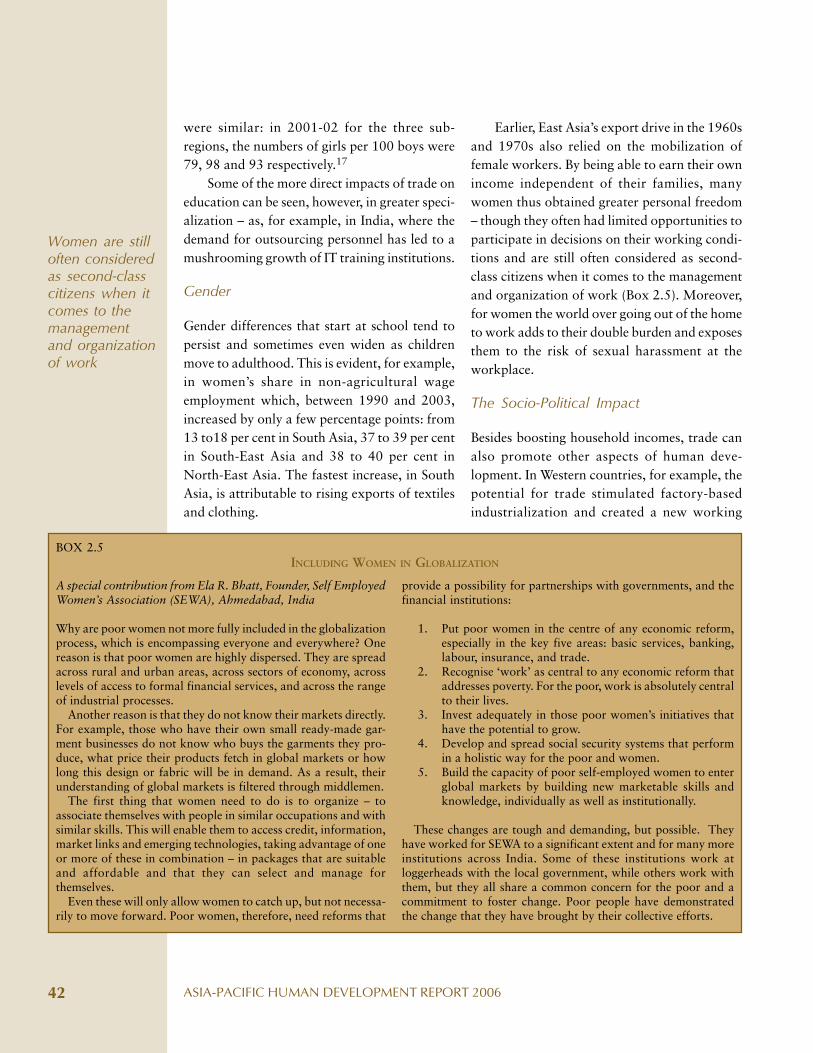
ASIA-PACIFIC HUMAN DEVELOPMENT REPORT 200642
were similar: in 2001-02 for the three sub-regions, the numbers of girls per 100 boys were79, 98 and 93 respectively.17
Some of the more direct impacts of trade oneducation can be seen, however, in greater speci-alization – as, for example, in India, where thedemand for outsourcing personnel has led to amushrooming growth of IT training institutions.
Gender
Gender differences that start at school tend topersist and sometimes even widen as childrenmove to adulthood. This is evident, for example,in women’s share in non-agricultural wageemployment which, between 1990 and 2003,increased by only a few percentage points: from13 to18 per cent in South Asia, 37 to 39 per centin South-East Asia and 38 to 40 per cent inNorth-East Asia. The fastest increase, in SouthAsia, is attributable to rising exports of textilesand clothing.
Earlier, East Asia’s export drive in the 1960sand 1970s also relied on the mobilization offemale workers. By being able to earn their ownincome independent of their families, manywomen thus obtained greater personal freedom– though they often had limited opportunities toparticipate in decisions on their working condi-tions and are still often considered as second-class citizens when it comes to the managementand organization of work (Box 2.5). Moreover,for women the world over going out of the hometo work adds to their double burden and exposesthem to the risk of sexual harassment at theworkplace.
The Socio-Political Impact
Besides boosting household incomes, trade canalso promote other aspects of human deve-lopment. In Western countries, for example, thepotential for trade stimulated factory-basedindustrialization and created a new working
BOX 2.5INCLUDING WOMEN IN GLOBALIZATION
A special contribution from Ela R. Bhatt, Founder, Self EmployedWomen’s Association (SEWA), Ahmedabad, India
Why are poor women not more fully included in the globalizationprocess, which is encompassing everyone and everywhere? Onereason is that poor women are highly dispersed. They are spreadacross rural and urban areas, across sectors of economy, acrosslevels of access to formal financial services, and across the rangeof industrial processes.
Another reason is that they do not know their markets directly.For example, those who have their own small ready-made gar-ment businesses do not know who buys the garments they pro-duce, what price their products fetch in global markets or howlong this design or fabric will be in demand. As a result, theirunderstanding of global markets is filtered through middlemen.
The first thing that women need to do is to organize – toassociate themselves with people in similar occupations and withsimilar skills. This will enable them to access credit, information,market links and emerging technologies, taking advantage of oneor more of these in combination – in packages that are suitableand affordable and that they can select and manage forthemselves.
Even these will only allow women to catch up, but not necessa-rily to move forward. Poor women, therefore, need reforms that
provide a possibility for partnerships with governments, and thefinancial institutions:
1. Put poor women in the centre of any economic reform,especially in the key five areas: basic services, banking,labour, insurance, and trade.
2. Recognise ‘work’ as central to any economic reform thataddresses poverty. For the poor, work is absolutely centralto their lives.
3. Invest adequately in those poor women’s initiatives thathave the potential to grow.
4. Develop and spread social security systems that performin a holistic way for the poor and women.
5. Build the capacity of poor self-employed women to enterglobal markets by building new marketable skills andknowledge, individually as well as institutionally.
These changes are tough and demanding, but possible. Theyhave worked for SEWA to a significant extent and for many moreinstitutions across India. Some of these institutions work atloggerheads with the local government, while others work withthem, but they all share a common concern for the poor and acommitment to foster change. Poor people have demonstratedthe change that they have brought by their collective efforts.
Women are stilloften consideredas second-classcitizens when itcomes to themanagementand organizationof work
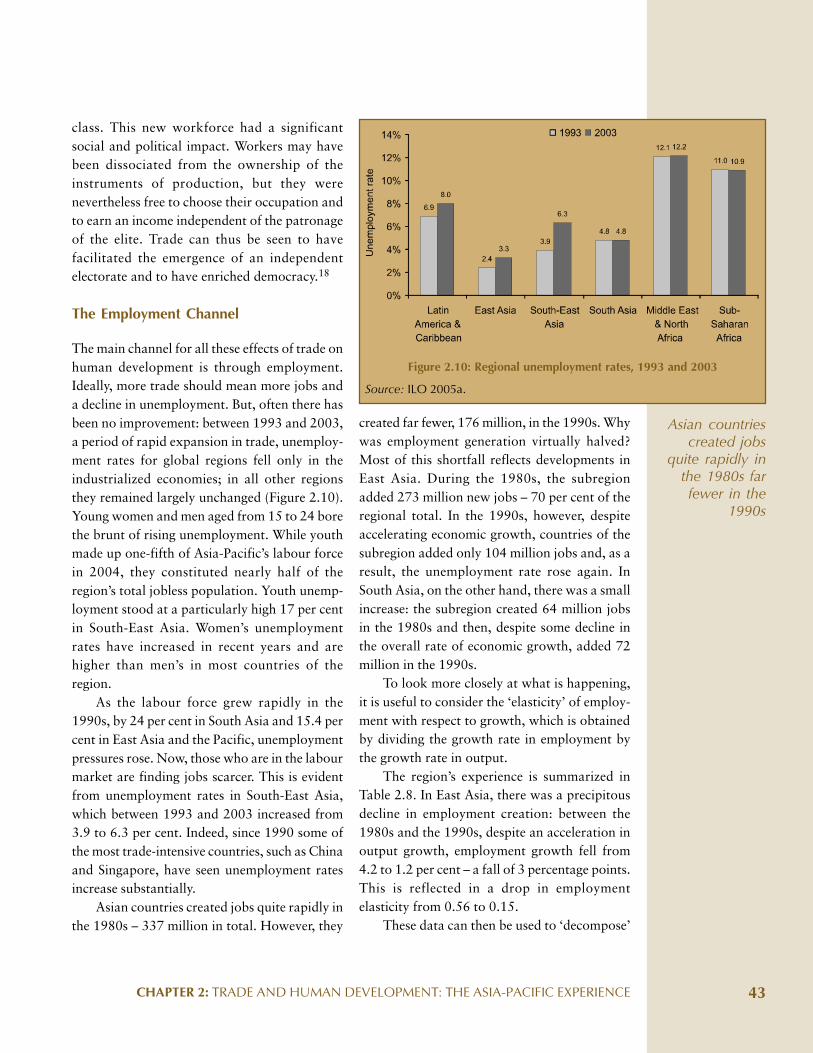
CHAPTER 2: TRADE AND HUMAN DEVELOPMENT: THE ASIA-PACIFIC EXPERIENCE 43
class. This new workforce had a significantsocial and political impact. Workers may havebeen dissociated from the ownership of theinstruments of production, but they werenevertheless free to choose their occupation andto earn an income independent of the patronageof the elite. Trade can thus be seen to havefacilitated the emergence of an independentelectorate and to have enriched democracy.18
The Employment Channel
The main channel for all these effects of trade onhuman development is through employment.Ideally, more trade should mean more jobs anda decline in unemployment. But, often there hasbeen no improvement: between 1993 and 2003,a period of rapid expansion in trade, unemploy-ment rates for global regions fell only in theindustrialized economies; in all other regionsthey remained largely unchanged (Figure 2.10).Young women and men aged from 15 to 24 borethe brunt of rising unemployment. While youthmade up one-fifth of Asia-Pacific’s labour forcein 2004, they constituted nearly half of theregion’s total jobless population. Youth unemp-loyment stood at a particularly high 17 per centin South-East Asia. Women’s unemploymentrates have increased in recent years and arehigher than men’s in most countries of theregion.
As the labour force grew rapidly in the1990s, by 24 per cent in South Asia and 15.4 percent in East Asia and the Pacific, unemploymentpressures rose. Now, those who are in the labourmarket are finding jobs scarcer. This is evidentfrom unemployment rates in South-East Asia,which between 1993 and 2003 increased from3.9 to 6.3 per cent. Indeed, since 1990 some ofthe most trade-intensive countries, such as Chinaand Singapore, have seen unemployment ratesincrease substantially.
Asian countries created jobs quite rapidly inthe 1980s – 337 million in total. However, they
created far fewer, 176 million, in the 1990s. Whywas employment generation virtually halved?Most of this shortfall reflects developments inEast Asia. During the 1980s, the subregionadded 273 million new jobs – 70 per cent of theregional total. In the 1990s, however, despiteaccelerating economic growth, countries of thesubregion added only 104 million jobs and, as aresult, the unemployment rate rose again. InSouth Asia, on the other hand, there was a smallincrease: the subregion created 64 million jobsin the 1980s and then, despite some decline inthe overall rate of economic growth, added 72million in the 1990s.
To look more closely at what is happening,it is useful to consider the ‘elasticity’ of employ-ment with respect to growth, which is obtainedby dividing the growth rate in employment bythe growth rate in output.
The region’s experience is summarized inTable 2.8. In East Asia, there was a precipitousdecline in employment creation: between the1980s and the 1990s, despite an acceleration inoutput growth, employment growth fell from4.2 to 1.2 per cent – a fall of 3 percentage points.This is reflected in a drop in employmentelasticity from 0.56 to 0.15.
These data can then be used to ‘decompose’
Figure 2.10: Regional unemployment rates, 1993 and 2003
Source: ILO 2005a.
Asian countriescreated jobs
quite rapidly inthe 1980s farfewer in the
1990s
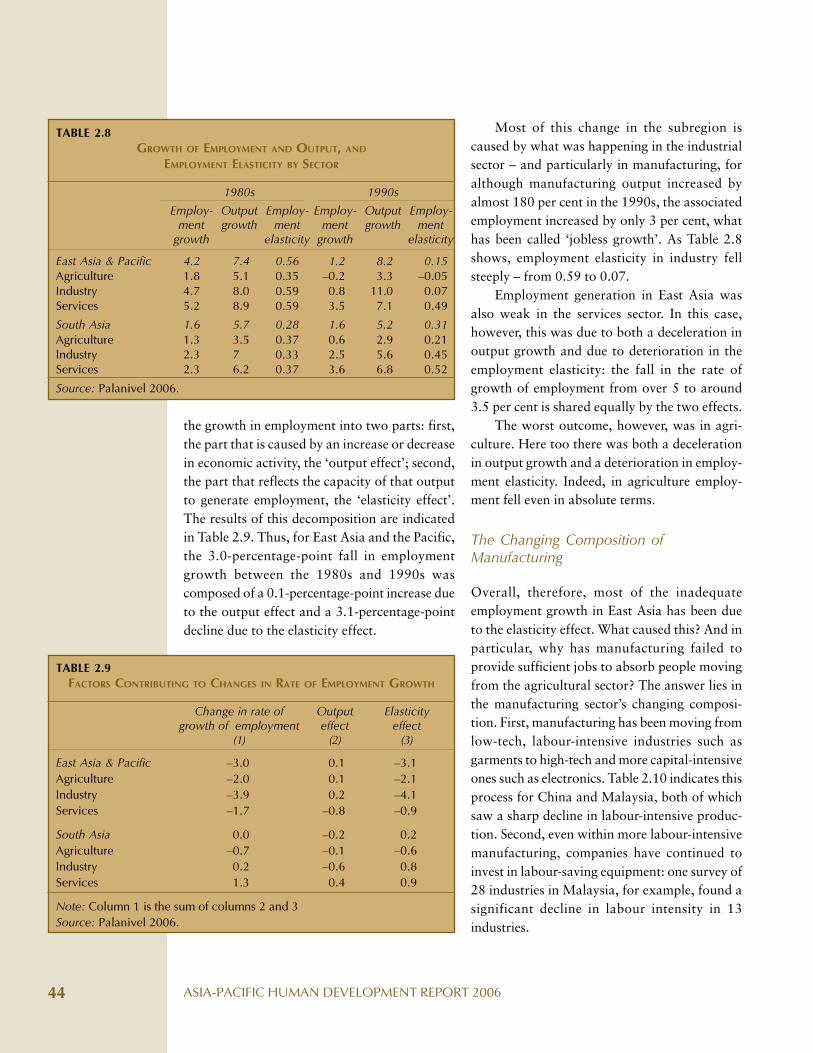
ASIA-PACIFIC HUMAN DEVELOPMENT REPORT 200644
Most of this change in the subregion iscaused by what was happening in the industrialsector – and particularly in manufacturing, foralthough manufacturing output increased byalmost 180 per cent in the 1990s, the associatedemployment increased by only 3 per cent, whathas been called ‘jobless growth’. As Table 2.8shows, employment elasticity in industry fellsteeply – from 0.59 to 0.07.
Employment generation in East Asia wasalso weak in the services sector. In this case,however, this was due to both a deceleration inoutput growth and due to deterioration in theemployment elasticity: the fall in the rate ofgrowth of employment from over 5 to around3.5 per cent is shared equally by the two effects.
The worst outcome, however, was in agri-culture. Here too there was both a decelerationin output growth and a deterioration in employ-ment elasticity. Indeed, in agriculture employ-ment fell even in absolute terms.
The Changing Composition ofManufacturing
Overall, therefore, most of the inadequateemployment growth in East Asia has been dueto the elasticity effect. What caused this? And inparticular, why has manufacturing failed toprovide sufficient jobs to absorb people movingfrom the agricultural sector? The answer lies inthe manufacturing sector’s changing composi-tion. First, manufacturing has been moving fromlow-tech, labour-intensive industries such asgarments to high-tech and more capital-intensiveones such as electronics. Table 2.10 indicates thisprocess for China and Malaysia, both of whichsaw a sharp decline in labour-intensive produc-tion. Second, even within more labour-intensivemanufacturing, companies have continued toinvest in labour-saving equipment: one survey of28 industries in Malaysia, for example, found asignificant decline in labour intensity in 13industries.
TABLE 2.8GROWTH OF EMPLOYMENT AND OUTPUT, AND
EMPLOYMENT ELASTICITY BY SECTOR
1980s 1990s
Employ- Output Employ- Employ- Output Employ-ment growth ment ment growth ment
growth elasticity growth elasticity
East Asia & Pacific 4.2 7.4 0.56 1.2 8.2 0.15Agriculture 1.8 5.1 0.35 –0.2 3.3 –0.05Industry 4.7 8.0 0.59 0.8 11.0 0.07Services 5.2 8.9 0.59 3.5 7.1 0.49
South Asia 1.6 5.7 0.28 1.6 5.2 0.31Agriculture 1.3 3.5 0.37 0.6 2.9 0.21Industry 2.3 7 0.33 2.5 5.6 0.45Services 2.3 6.2 0.37 3.6 6.8 0.52
Source: Palanivel 2006.
TABLE 2.9FACTORS CONTRIBUTING TO CHANGES IN RATE OF EMPLOYMENT GROWTH
Change in rate of Output Elasticitygrowth of employment effect effect
(1) (2) (3)
East Asia & Pacific –3.0 0.1 –3.1Agriculture –2.0 0.1 –2.1Industry –3.9 0.2 –4.1Services –1.7 –0.8 –0.9
South Asia 0.0 –0.2 0.2Agriculture –0.7 –0.1 –0.6Industry 0.2 –0.6 0.8Services 1.3 0.4 0.9
Note: Column 1 is the sum of columns 2 and 3Source: Palanivel 2006.
the growth in employment into two parts: first,the part that is caused by an increase or decreasein economic activity, the ‘output effect’; second,the part that reflects the capacity of that outputto generate employment, the ‘elasticity effect’.The results of this decomposition are indicatedin Table 2.9. Thus, for East Asia and the Pacific,the 3.0-percentage-point fall in employmentgrowth between the 1980s and 1990s wascomposed of a 0.1-percentage-point increase dueto the output effect and a 3.1-percentage-pointdecline due to the elasticity effect.
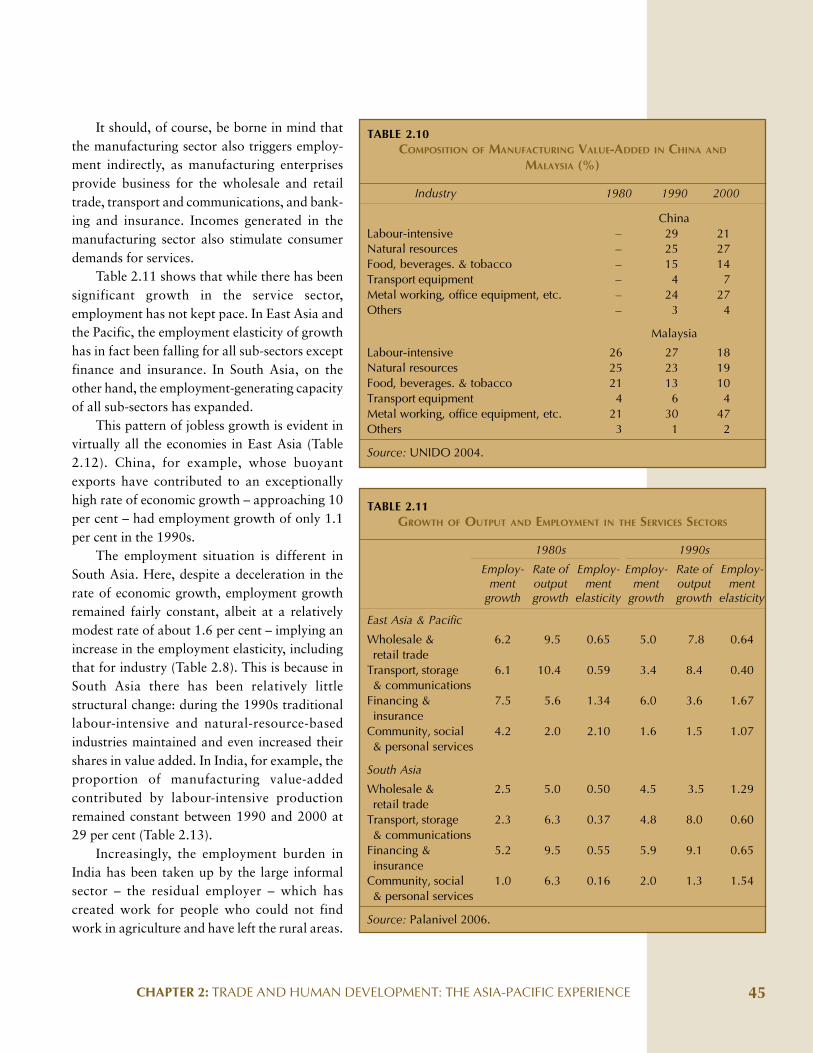
CHAPTER 2: TRADE AND HUMAN DEVELOPMENT: THE ASIA-PACIFIC EXPERIENCE 45
It should, of course, be borne in mind thatthe manufacturing sector also triggers employ-ment indirectly, as manufacturing enterprisesprovide business for the wholesale and retailtrade, transport and communications, and bank-ing and insurance. Incomes generated in themanufacturing sector also stimulate consumerdemands for services.
Table 2.11 shows that while there has beensignificant growth in the service sector,employment has not kept pace. In East Asia andthe Pacific, the employment elasticity of growthhas in fact been falling for all sub-sectors exceptfinance and insurance. In South Asia, on theother hand, the employment-generating capacityof all sub-sectors has expanded.
This pattern of jobless growth is evident invirtually all the economies in East Asia (Table2.12). China, for example, whose buoyantexports have contributed to an exceptionallyhigh rate of economic growth – approaching 10per cent – had employment growth of only 1.1per cent in the 1990s.
The employment situation is different inSouth Asia. Here, despite a deceleration in therate of economic growth, employment growthremained fairly constant, albeit at a relativelymodest rate of about 1.6 per cent – implying anincrease in the employment elasticity, includingthat for industry (Table 2.8). This is because inSouth Asia there has been relatively littlestructural change: during the 1990s traditionallabour-intensive and natural-resource-basedindustries maintained and even increased theirshares in value added. In India, for example, theproportion of manufacturing value-addedcontributed by labour-intensive productionremained constant between 1990 and 2000 at29 per cent (Table 2.13).
Increasingly, the employment burden inIndia has been taken up by the large informalsector – the residual employer – which hascreated work for people who could not findwork in agriculture and have left the rural areas.
TABLE 2.11GROWTH OF OUTPUT AND EMPLOYMENT IN THE SERVICES SECTORS
1980s 1990s
Employ- Rate of Employ- Employ- Rate of Employ-ment output ment ment output ment
growth growth elasticity growth growth elasticity
East Asia & Pacific
Wholesale & 6.2 9.5 0.65 5.0 7.8 0.64retail trade
Transport, storage 6.1 10.4 0.59 3.4 8.4 0.40& communications
Financing & 7.5 5.6 1.34 6.0 3.6 1.67insurance
Community, social 4.2 2.0 2.10 1.6 1.5 1.07& personal services
South Asia
Wholesale & 2.5 5.0 0.50 4.5 3.5 1.29retail trade
Transport, storage 2.3 6.3 0.37 4.8 8.0 0.60& communications
Financing & 5.2 9.5 0.55 5.9 9.1 0.65insurance
Community, social 1.0 6.3 0.16 2.0 1.3 1.54& personal services
Source: Palanivel 2006.
TABLE 2.10COMPOSITION OF MANUFACTURING VALUE-ADDED IN CHINA AND
MALAYSIA (%)
Industry 1980 1990 2000
ChinaLabour-intensive – 29 21Natural resources – 25 27Food, beverages. & tobacco – 15 14Transport equipment – 4 7Metal working, office equipment, etc. – 24 27Others – 3 4
Malaysia
Labour-intensive 26 27 18Natural resources 25 23 19Food, beverages. & tobacco 21 13 10Transport equipment 4 6 4Metal working, office equipment, etc. 21 30 47Others 3 1 2
Source: UNIDO 2004.
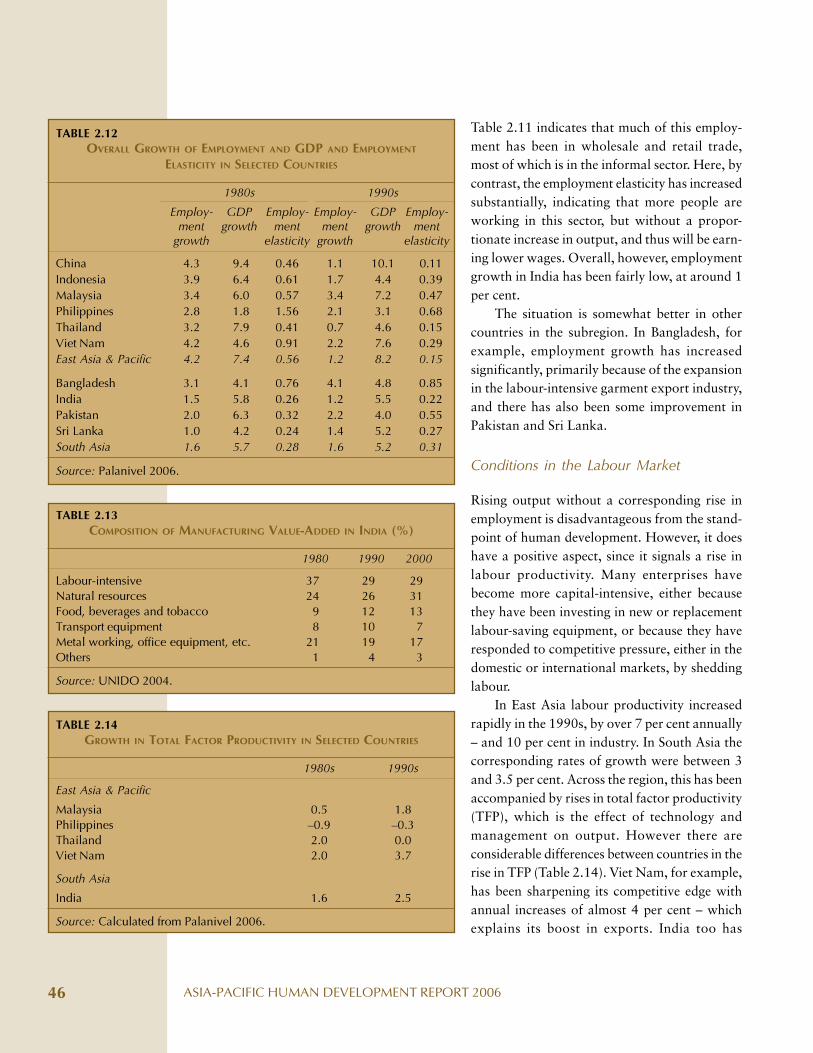
ASIA-PACIFIC HUMAN DEVELOPMENT REPORT 200646
Table 2.11 indicates that much of this employ-ment has been in wholesale and retail trade,most of which is in the informal sector. Here, bycontrast, the employment elasticity has increasedsubstantially, indicating that more people areworking in this sector, but without a propor-tionate increase in output, and thus will be earn-ing lower wages. Overall, however, employmentgrowth in India has been fairly low, at around 1per cent.
The situation is somewhat better in othercountries in the subregion. In Bangladesh, forexample, employment growth has increasedsignificantly, primarily because of the expansionin the labour-intensive garment export industry,and there has also been some improvement inPakistan and Sri Lanka.
Conditions in the Labour Market
Rising output without a corresponding rise inemployment is disadvantageous from the stand-point of human development. However, it doeshave a positive aspect, since it signals a rise inlabour productivity. Many enterprises havebecome more capital-intensive, either becausethey have been investing in new or replacementlabour-saving equipment, or because they haveresponded to competitive pressure, either in thedomestic or international markets, by sheddinglabour.
In East Asia labour productivity increasedrapidly in the 1990s, by over 7 per cent annually– and 10 per cent in industry. In South Asia thecorresponding rates of growth were between 3and 3.5 per cent. Across the region, this has beenaccompanied by rises in total factor productivity(TFP), which is the effect of technology andmanagement on output. However there areconsiderable differences between countries in therise in TFP (Table 2.14). Viet Nam, for example,has been sharpening its competitive edge withannual increases of almost 4 per cent – whichexplains its boost in exports. India too has
TABLE 2.12OVERALL GROWTH OF EMPLOYMENT AND GDP AND EMPLOYMENT
ELASTICITY IN SELECTED COUNTRIES
1980s 1990s
Employ- GDP Employ- Employ- GDP Employ-ment growth ment ment growth ment
growth elasticity growth elasticity
China 4.3 9.4 0.46 1.1 10.1 0.11Indonesia 3.9 6.4 0.61 1.7 4.4 0.39Malaysia 3.4 6.0 0.57 3.4 7.2 0.47Philippines 2.8 1.8 1.56 2.1 3.1 0.68Thailand 3.2 7.9 0.41 0.7 4.6 0.15Viet Nam 4.2 4.6 0.91 2.2 7.6 0.29East Asia & Pacific 4.2 7.4 0.56 1.2 8.2 0.15
Bangladesh 3.1 4.1 0.76 4.1 4.8 0.85India 1.5 5.8 0.26 1.2 5.5 0.22Pakistan 2.0 6.3 0.32 2.2 4.0 0.55Sri Lanka 1.0 4.2 0.24 1.4 5.2 0.27South Asia 1.6 5.7 0.28 1.6 5.2 0.31
Source: Palanivel 2006.
TABLE 2.13COMPOSITION OF MANUFACTURING VALUE-ADDED IN INDIA (%)
1980 1990 2000
Labour-intensive 37 29 29Natural resources 24 26 31Food, beverages and tobacco 9 12 13Transport equipment 8 10 7Metal working, office equipment, etc. 21 19 17Others 1 4 3
Source: UNIDO 2004.
TABLE 2.14GROWTH IN TOTAL FACTOR PRODUCTIVITY IN SELECTED COUNTRIES
1980s 1990s
East Asia & Pacific
Malaysia 0.5 1.8Philippines –0.9 –0.3Thailand 2.0 0.0Viet Nam 2.0 3.7
South Asia
India 1.6 2.5
Source: Calculated from Palanivel 2006.

CHAPTER 2: TRADE AND HUMAN DEVELOPMENT: THE ASIA-PACIFIC EXPERIENCE 47
shown a respectable growth of 2.5 per centin TFP. In Thailand, however, TFP has beenstagnant, and in the Philippines it has beenfalling.
These changes in productivity also have aneffect on wages. In countries that have relativelytight labour markets and low unemployment,rising productivity is likely to lead to increasesin real wages. In East Asia real wages haveindeed been rising rapidly: 7 per cent annually inMalaysia, 11 per cent in China, and 12 per centin Indonesia. In South Asia, on the other hand,where productivity rises have been smaller andunemployment is higher, there was little changein the 1990s: a marginal improvement inBangladesh; flat in India, Nepal and Sri Lanka;and a small decline in Pakistan.19
There have also been changes in the skilllevels of the workforces across the region. Thiscan be seen from the education levels of theunemployed, which tend to be lower as countriesmove to higher levels of technology. As Figure2.11 illustrates, in both Indonesia and Thailand,the proportion of the unemployed who weremore highly educated fell between 1990 and2000. This is not surprising given the shifttowards medium- and high-technology indus-tries and modern formal-sector services liketelecommunications, banking and insurance,which tend to utilize skilled workers more. InIndia and Sri Lanka, on the other hand, theproportion of the more educated among theunemployed has risen – giving rise to the pheno-menon of graduate unemployment.
There are also differences between thesubregions on the employment of women. InEast Asia female participation rates are high,close to 80 per cent, but women are more likelythan men to be unemployed (Figure 2.12). InSouth Asia the participation rates are lower, 30to 70 per cent, but there tend to be smallerdisparities in the unemployment rates. Indeed,in Bangladesh the rate in the 1990s wassignificantly lower for women – a result in part
Figure 2.11: Education level of the unemployed
Source: World Bank 2005.
Figure 2.12: Unemployment rate by sex, 1990s
Source: ILO 2005a.
of their opportunities for work in the garmentsector.
Conclusions
The above discussion demonstrates that therewere fundamental differences between East Asiaand South Asia in the 1990s in the linkagesbetween trade, growth and employment.Looking at South Asia, the process of tradeliberalization really got under-way during the
Many enterpriseshave becomemore capital-
intensive
Male Female
ASIA-PACIFIC HUMAN DEVELOPMENT REPORT 200648
decade. Exports, both of merchandise andservices, responded positively, but there was alsoan upsurge of imports, including those ofagricultural products. The overall growth ratefell somewhat, with the export stimulus beingneutralized possibly by the displacement effectof imports on industry and agriculture.
However, the rate of employment growth,albeit modest, remained unchanged, owingprimarily to three factors: first, stability in theindustrial structure sustained by continuedreliance on labour-intensive manufacturedexports; second, buoyancy of labour-intensiveservices owing again to the rapid growth ofservice exports and role of the informal sectorand; third, limited changes in the choice oftechniques within industries in the presence ofhigh real interest rates, which raised the cost ofcapital, and relative stagnation in real wages.
The impact of trade on poverty was adversewhen judged from the viewpoint of the fall ingrowth, especially of agriculture. However, itwas positive from the viewpoint of faster exportgrowth in labour-intensive manufactures andservices, and some improvement in conditionsin the labour markets for relatively unskilled andfemale workers.
By the beginning of the 1990s, the processof trade liberalization had been under-way forsome time in most East Asian countries.Conditions were ripe for a takeoff to higher ratesof export-led growth. This is what happened:exports showed a double-digit growth rate, thebalance of trade improved substantially and theeconomic growth rate went up appreciably,primarily in the manufacturing sector, but agri-culture lost some of its dynamism. There werebig changes also in the composition of exports.The share of agricultural products fell, while thatof manufactured goods rose sharply. As East
Asia moved up the international division oflabour, the share in manufacturing output andexports of high-tech, skill-intensive productsrose, while that of labour-intensive productsdeclined. Simultaneously, the choice of techniquein individual industries shifted towards greatercapital intensity. These developments werefacilitated by low real interest rates and rapidincreases in real wages, primarily due toincreased labour productivity.
The consequence was that the employmentgrowth rate plummeted, even in the presence offaster growth in output. There was ‘joblessgrowth’ both in agriculture and manufacturing.The overall unemployment rate increased, andlabour market conditions probably deterioratedfor unskilled workers. The rising gaps betweenurban and rural income, between capital andlabour income and between the incomes ofskilled and unskilled workers have led to sharpincreases in inequality. The failure of employ-ment to rise and the growing income disparitiesimply that the ‘trickle down’ effect of fast tradeand income growth on human development andpoverty reduction is limited.
Overall, the linkage between trade andgrowth is strong in East Asia, while the linkagebetween growth and employment is weak. InSouth Asia, the relationship between trade andgrowth is weaker, while that between growthand employment is stronger.
It is interesting to note that in spite of thecontrasting experience of relatively lowergrowth but more pro-poor growth in South Asiain relation to East Asia, both regions have shownvirtually the same rate of decline, of about onepercentage point per annum, in the incidence ofpoverty in the second half of the 1990s. Thebasic lesson is that while growth matters, thenature of this growth also matters.
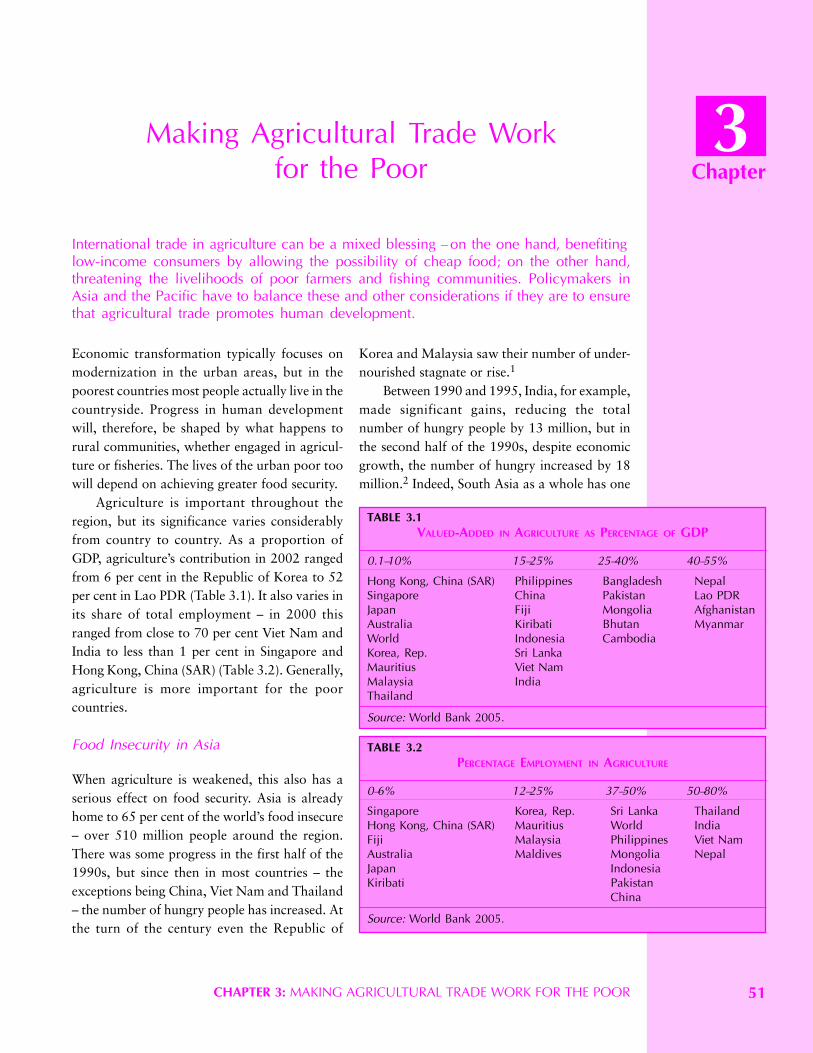
CHAPTER 3: MAKING AGRICULTURAL TRADE WORK FOR THE POOR 51
Economic transformation typically focuses onmodernization in the urban areas, but in thepoorest countries most people actually live in thecountryside. Progress in human developmentwill, therefore, be shaped by what happens torural communities, whether engaged in agricul-ture or fisheries. The lives of the urban poor toowill depend on achieving greater food security.
Agriculture is important throughout theregion, but its significance varies considerablyfrom country to country. As a proportion ofGDP, agriculture’s contribution in 2002 rangedfrom 6 per cent in the Republic of Korea to 52per cent in Lao PDR (Table 3.1). It also varies inits share of total employment – in 2000 thisranged from close to 70 per cent Viet Nam andIndia to less than 1 per cent in Singapore andHong Kong, China (SAR) (Table 3.2). Generally,agriculture is more important for the poorcountries.
Food Insecurity in Asia
When agriculture is weakened, this also has aserious effect on food security. Asia is alreadyhome to 65 per cent of the world’s food insecure– over 510 million people around the region.There was some progress in the first half of the1990s, but since then in most countries – theexceptions being China, Viet Nam and Thailand– the number of hungry people has increased. Atthe turn of the century even the Republic of
International trade in agriculture can be a mixed blessing – on the one hand, benefitinglow-income consumers by allowing the possibility of cheap food; on the other hand,threatening the livelihoods of poor farmers and fishing communities. Policymakers inAsia and the Pacific have to balance these and other considerations if they are to ensurethat agricultural trade promotes human development.
Chapter
Making Agricultural Trade Workfor the Poor
3
TABLE 3.1VALUED-ADDED IN AGRICULTURE AS PERCENTAGE OF GDP
0.1–10% 15–25% 25–40% 40–55%
Hong Kong, China (SAR) Philippines Bangladesh NepalSingapore China Pakistan Lao PDRJapan Fiji Mongolia AfghanistanAustralia Kiribati Bhutan MyanmarWorld Indonesia CambodiaKorea, Rep. Sri LankaMauritius Viet NamMalaysia IndiaThailand
Source: World Bank 2005.
TABLE 3.2PERCENTAGE EMPLOYMENT IN AGRICULTURE
0–6% 12–25% 37–50% 50–80%
Singapore Korea, Rep. Sri Lanka ThailandHong Kong, China (SAR) Mauritius World IndiaFiji Malaysia Philippines Viet NamAustralia Maldives Mongolia NepalJapan IndonesiaKiribati Pakistan
China
Source: World Bank 2005.
Korea and Malaysia saw their number of under-nourished stagnate or rise.1
Between 1990 and 1995, India, for example,made significant gains, reducing the totalnumber of hungry people by 13 million, but inthe second half of the 1990s, despite economicgrowth, the number of hungry increased by 18million.2 Indeed, South Asia as a whole has one
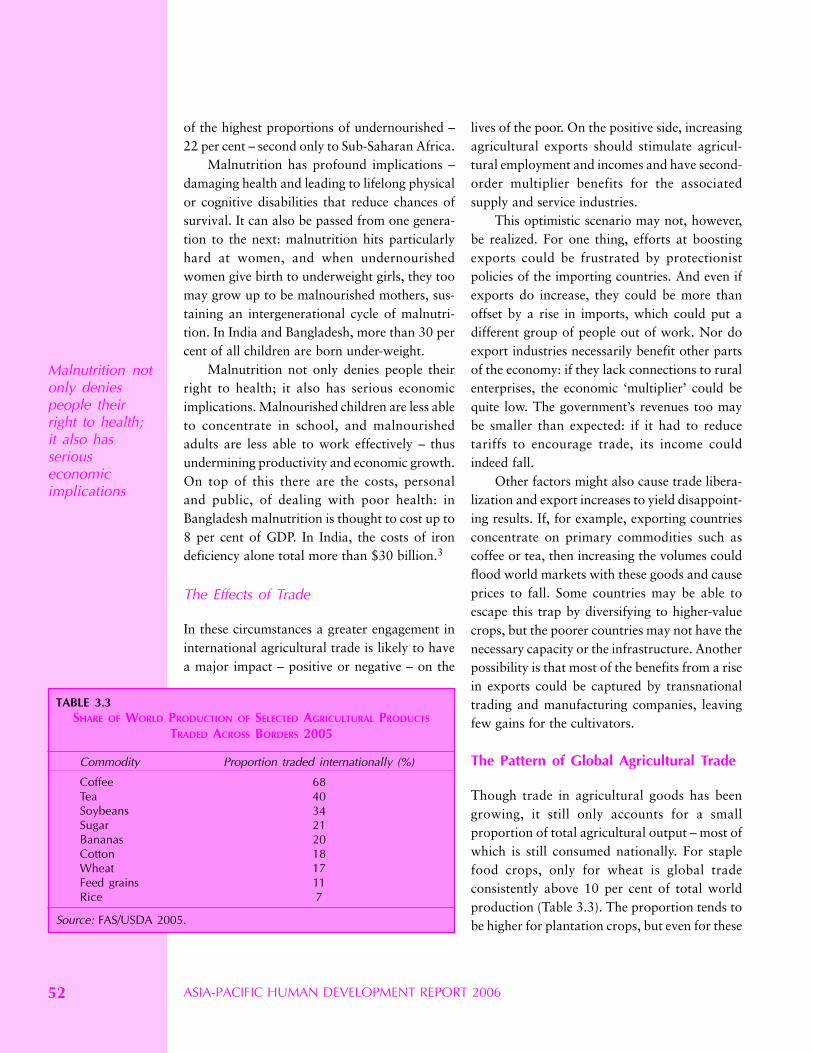
ASIA-PACIFIC HUMAN DEVELOPMENT REPORT 200652
of the highest proportions of undernourished –22 per cent – second only to Sub-Saharan Africa.
Malnutrition has profound implications –damaging health and leading to lifelong physicalor cognitive disabilities that reduce chances ofsurvival. It can also be passed from one genera-tion to the next: malnutrition hits particularlyhard at women, and when undernourishedwomen give birth to underweight girls, they toomay grow up to be malnourished mothers, sus-taining an intergenerational cycle of malnutri-tion. In India and Bangladesh, more than 30 percent of all children are born under-weight.
Malnutrition not only denies people theirright to health; it also has serious economicimplications. Malnourished children are less ableto concentrate in school, and malnourishedadults are less able to work effectively – thusundermining productivity and economic growth.On top of this there are the costs, personaland public, of dealing with poor health: inBangladesh malnutrition is thought to cost up to8 per cent of GDP. In India, the costs of irondeficiency alone total more than $30 billion.3
The Effects of Trade
In these circumstances a greater engagement ininternational agricultural trade is likely to havea major impact – positive or negative – on the
lives of the poor. On the positive side, increasingagricultural exports should stimulate agricul-tural employment and incomes and have second-order multiplier benefits for the associatedsupply and service industries.
This optimistic scenario may not, however,be realized. For one thing, efforts at boostingexports could be frustrated by protectionistpolicies of the importing countries. And even ifexports do increase, they could be more thanoffset by a rise in imports, which could put adifferent group of people out of work. Nor doexport industries necessarily benefit other partsof the economy: if they lack connections to ruralenterprises, the economic ‘multiplier’ could bequite low. The government’s revenues too maybe smaller than expected: if it had to reducetariffs to encourage trade, its income couldindeed fall.
Other factors might also cause trade libera-lization and export increases to yield disappoint-ing results. If, for example, exporting countriesconcentrate on primary commodities such ascoffee or tea, then increasing the volumes couldflood world markets with these goods and causeprices to fall. Some countries may be able toescape this trap by diversifying to higher-valuecrops, but the poorer countries may not have thenecessary capacity or the infrastructure. Anotherpossibility is that most of the benefits from a risein exports could be captured by transnationaltrading and manufacturing companies, leavingfew gains for the cultivators.
The Pattern of Global Agricultural Trade
Though trade in agricultural goods has beengrowing, it still only accounts for a smallproportion of total agricultural output – most ofwhich is still consumed nationally. For staplefood crops, only for wheat is global tradeconsistently above 10 per cent of total worldproduction (Table 3.3). The proportion tends tobe higher for plantation crops, but even for these
Malnutrition notonly deniespeople theirright to health;it also hasseriouseconomicimplications
TABLE 3.3SHARE OF WORLD PRODUCTION OF SELECTED AGRICULTURAL PRODUCTS
TRADED ACROSS BORDERS 2005
Commodity Proportion traded internationally (%)
Coffee 68Tea 40Soybeans 34Sugar 21Bananas 20Cotton 18Wheat 17Feed grains 11Rice 7
Source: FAS/USDA 2005.
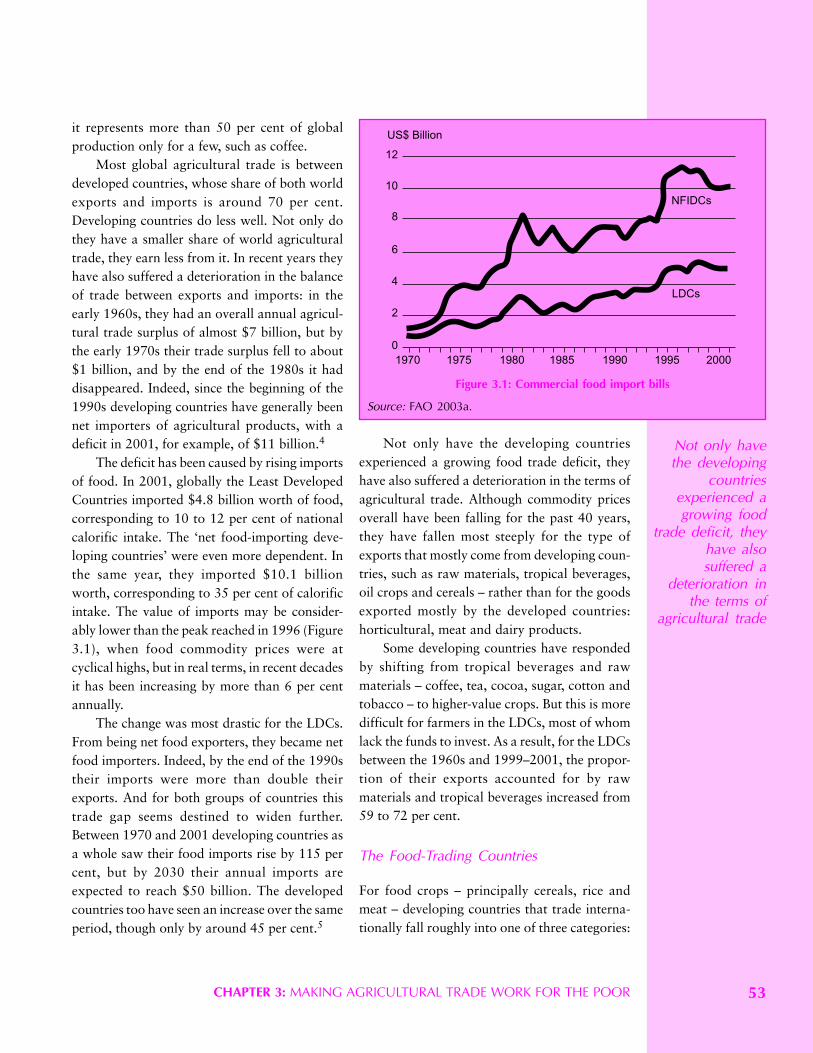
CHAPTER 3: MAKING AGRICULTURAL TRADE WORK FOR THE POOR 53
it represents more than 50 per cent of globalproduction only for a few, such as coffee.
Most global agricultural trade is betweendeveloped countries, whose share of both worldexports and imports is around 70 per cent.Developing countries do less well. Not only dothey have a smaller share of world agriculturaltrade, they earn less from it. In recent years theyhave also suffered a deterioration in the balanceof trade between exports and imports: in theearly 1960s, they had an overall annual agricul-tural trade surplus of almost $7 billion, but bythe early 1970s their trade surplus fell to about$1 billion, and by the end of the 1980s it haddisappeared. Indeed, since the beginning of the1990s developing countries have generally beennet importers of agricultural products, with adeficit in 2001, for example, of $11 billion.4
The deficit has been caused by rising importsof food. In 2001, globally the Least DevelopedCountries imported $4.8 billion worth of food,corresponding to 10 to 12 per cent of nationalcalorific intake. The ‘net food-importing deve-loping countries’ were even more dependent. Inthe same year, they imported $10.1 billionworth, corresponding to 35 per cent of calorificintake. The value of imports may be consider-ably lower than the peak reached in 1996 (Figure3.1), when food commodity prices were atcyclical highs, but in real terms, in recent decadesit has been increasing by more than 6 per centannually.
The change was most drastic for the LDCs.From being net food exporters, they became netfood importers. Indeed, by the end of the 1990stheir imports were more than double theirexports. And for both groups of countries thistrade gap seems destined to widen further.Between 1970 and 2001 developing countries asa whole saw their food imports rise by 115 percent, but by 2030 their annual imports areexpected to reach $50 billion. The developedcountries too have seen an increase over the sameperiod, though only by around 45 per cent.5
Not only have the developing countriesexperienced a growing food trade deficit, theyhave also suffered a deterioration in the terms ofagricultural trade. Although commodity pricesoverall have been falling for the past 40 years,they have fallen most steeply for the type ofexports that mostly come from developing coun-tries, such as raw materials, tropical beverages,oil crops and cereals – rather than for the goodsexported mostly by the developed countries:horticultural, meat and dairy products.
Some developing countries have respondedby shifting from tropical beverages and rawmaterials – coffee, tea, cocoa, sugar, cotton andtobacco – to higher-value crops. But this is moredifficult for farmers in the LDCs, most of whomlack the funds to invest. As a result, for the LDCsbetween the 1960s and 1999–2001, the propor-tion of their exports accounted for by rawmaterials and tropical beverages increased from59 to 72 per cent.
The Food-Trading Countries
For food crops – principally cereals, rice andmeat – developing countries that trade interna-tionally fall roughly into one of three categories:
Figure 3.1: Commercial food import bills
Source: FAO 2003a.
Not only havethe developing
countriesexperienced agrowing food
trade deficit, theyhave alsosuffered a
deterioration inthe terms of
agricultural trade
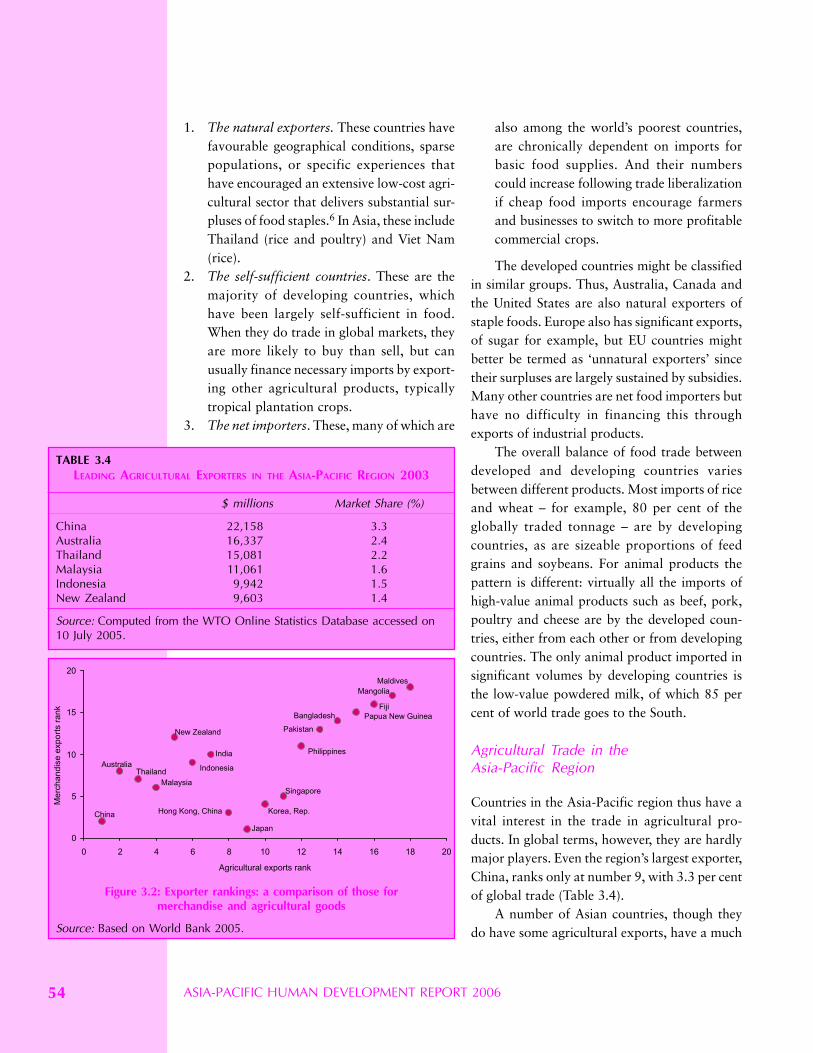
ASIA-PACIFIC HUMAN DEVELOPMENT REPORT 200654
1. The natural exporters. These countries havefavourable geographical conditions, sparsepopulations, or specific experiences thathave encouraged an extensive low-cost agri-cultural sector that delivers substantial sur-pluses of food staples.6 In Asia, these includeThailand (rice and poultry) and Viet Nam(rice).
2. The self-sufficient countries. These are themajority of developing countries, whichhave been largely self-sufficient in food.When they do trade in global markets, theyare more likely to buy than sell, but canusually finance necessary imports by export-ing other agricultural products, typicallytropical plantation crops.
3. The net importers. These, many of which are
also among the world’s poorest countries,are chronically dependent on imports forbasic food supplies. And their numberscould increase following trade liberalizationif cheap food imports encourage farmersand businesses to switch to more profitablecommercial crops.
The developed countries might be classifiedin similar groups. Thus, Australia, Canada andthe United States are also natural exporters ofstaple foods. Europe also has significant exports,of sugar for example, but EU countries mightbetter be termed as ‘unnatural exporters’ sincetheir surpluses are largely sustained by subsidies.Many other countries are net food importers buthave no difficulty in financing this throughexports of industrial products.
The overall balance of food trade betweendeveloped and developing countries variesbetween different products. Most imports of riceand wheat – for example, 80 per cent of theglobally traded tonnage – are by developingcountries, as are sizeable proportions of feedgrains and soybeans. For animal products thepattern is different: virtually all the imports ofhigh-value animal products such as beef, pork,poultry and cheese are by the developed coun-tries, either from each other or from developingcountries. The only animal product imported insignificant volumes by developing countries isthe low-value powdered milk, of which 85 percent of world trade goes to the South.
Agricultural Trade in theAsia-Pacific Region
Countries in the Asia-Pacific region thus have avital interest in the trade in agricultural pro-ducts. In global terms, however, they are hardlymajor players. Even the region’s largest exporter,China, ranks only at number 9, with 3.3 per centof global trade (Table 3.4).
A number of Asian countries, though theydo have some agricultural exports, have a much
TABLE 3.4LEADING AGRICULTURAL EXPORTERS IN THE ASIA-PACIFIC REGION 2003
$ millions Market Share (%)
China 22,158 3.3Australia 16,337 2.4Thailand 15,081 2.2Malaysia 11,061 1.6Indonesia 9,942 1.5New Zealand 9,603 1.4
Source: Computed from the WTO Online Statistics Database accessed on10 July 2005.
Figure 3.2: Exporter rankings: a comparison of those formerchandise and agricultural goods
Source: Based on World Bank 2005.
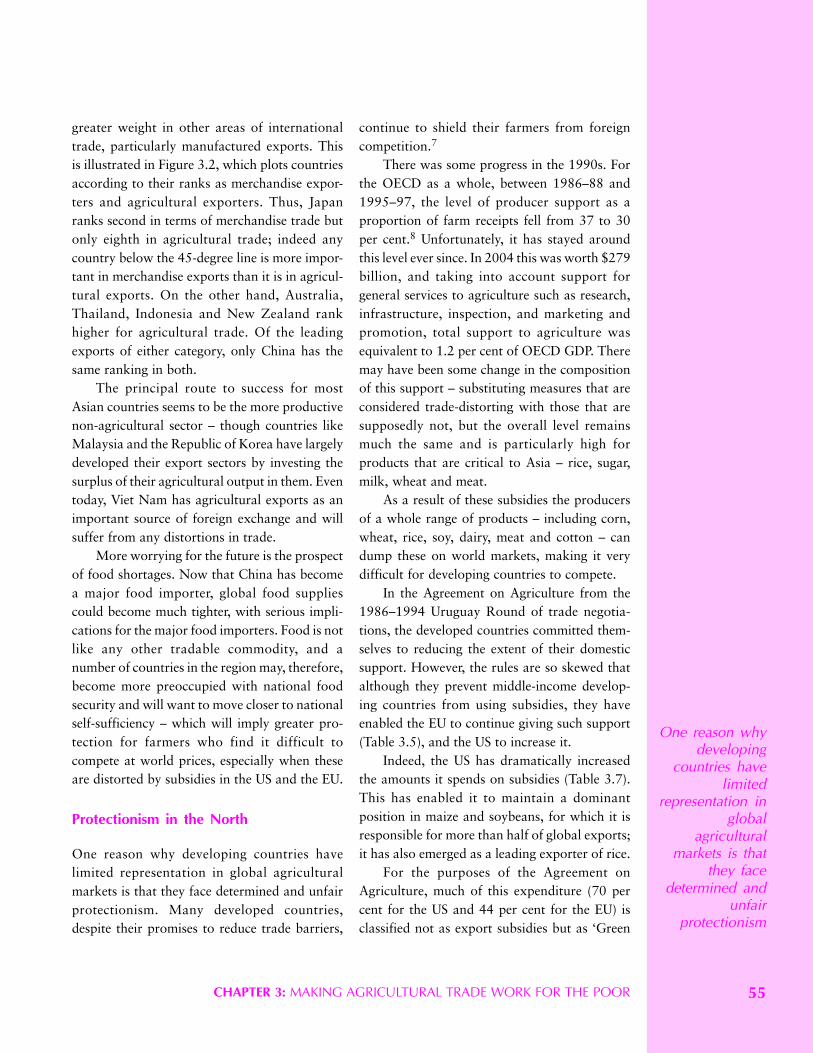
CHAPTER 3: MAKING AGRICULTURAL TRADE WORK FOR THE POOR 55
greater weight in other areas of internationaltrade, particularly manufactured exports. Thisis illustrated in Figure 3.2, which plots countriesaccording to their ranks as merchandise expor-ters and agricultural exporters. Thus, Japanranks second in terms of merchandise trade butonly eighth in agricultural trade; indeed anycountry below the 45-degree line is more impor-tant in merchandise exports than it is in agricul-tural exports. On the other hand, Australia,Thailand, Indonesia and New Zealand rankhigher for agricultural trade. Of the leadingexports of either category, only China has thesame ranking in both.
The principal route to success for mostAsian countries seems to be the more productivenon-agricultural sector – though countries likeMalaysia and the Republic of Korea have largelydeveloped their export sectors by investing thesurplus of their agricultural output in them. Eventoday, Viet Nam has agricultural exports as animportant source of foreign exchange and willsuffer from any distortions in trade.
More worrying for the future is the prospectof food shortages. Now that China has becomea major food importer, global food suppliescould become much tighter, with serious impli-cations for the major food importers. Food is notlike any other tradable commodity, and anumber of countries in the region may, therefore,become more preoccupied with national foodsecurity and will want to move closer to nationalself-sufficiency – which will imply greater pro-tection for farmers who find it difficult tocompete at world prices, especially when theseare distorted by subsidies in the US and the EU.
Protectionism in the North
One reason why developing countries havelimited representation in global agriculturalmarkets is that they face determined and unfairprotectionism. Many developed countries,despite their promises to reduce trade barriers,
continue to shield their farmers from foreigncompetition.7
There was some progress in the 1990s. Forthe OECD as a whole, between 1986–88 and1995–97, the level of producer support as aproportion of farm receipts fell from 37 to 30per cent.8 Unfortunately, it has stayed aroundthis level ever since. In 2004 this was worth $279billion, and taking into account support forgeneral services to agriculture such as research,infrastructure, inspection, and marketing andpromotion, total support to agriculture wasequivalent to 1.2 per cent of OECD GDP. Theremay have been some change in the compositionof this support – substituting measures that areconsidered trade-distorting with those that aresupposedly not, but the overall level remainsmuch the same and is particularly high forproducts that are critical to Asia – rice, sugar,milk, wheat and meat.
As a result of these subsidies the producersof a whole range of products – including corn,wheat, rice, soy, dairy, meat and cotton – candump these on world markets, making it verydifficult for developing countries to compete.
In the Agreement on Agriculture from the1986–1994 Uruguay Round of trade negotia-tions, the developed countries committed them-selves to reducing the extent of their domesticsupport. However, the rules are so skewed thatalthough they prevent middle-income develop-ing countries from using subsidies, they haveenabled the EU to continue giving such support(Table 3.5), and the US to increase it.
Indeed, the US has dramatically increasedthe amounts it spends on subsidies (Table 3.7).This has enabled it to maintain a dominantposition in maize and soybeans, for which it isresponsible for more than half of global exports;it has also emerged as a leading exporter of rice.
For the purposes of the Agreement onAgriculture, much of this expenditure (70 percent for the US and 44 per cent for the EU) isclassified not as export subsidies but as ‘Green
One reason whydeveloping
countries havelimited
representation inglobal
agriculturalmarkets is that
they facedetermined and
unfairprotectionism
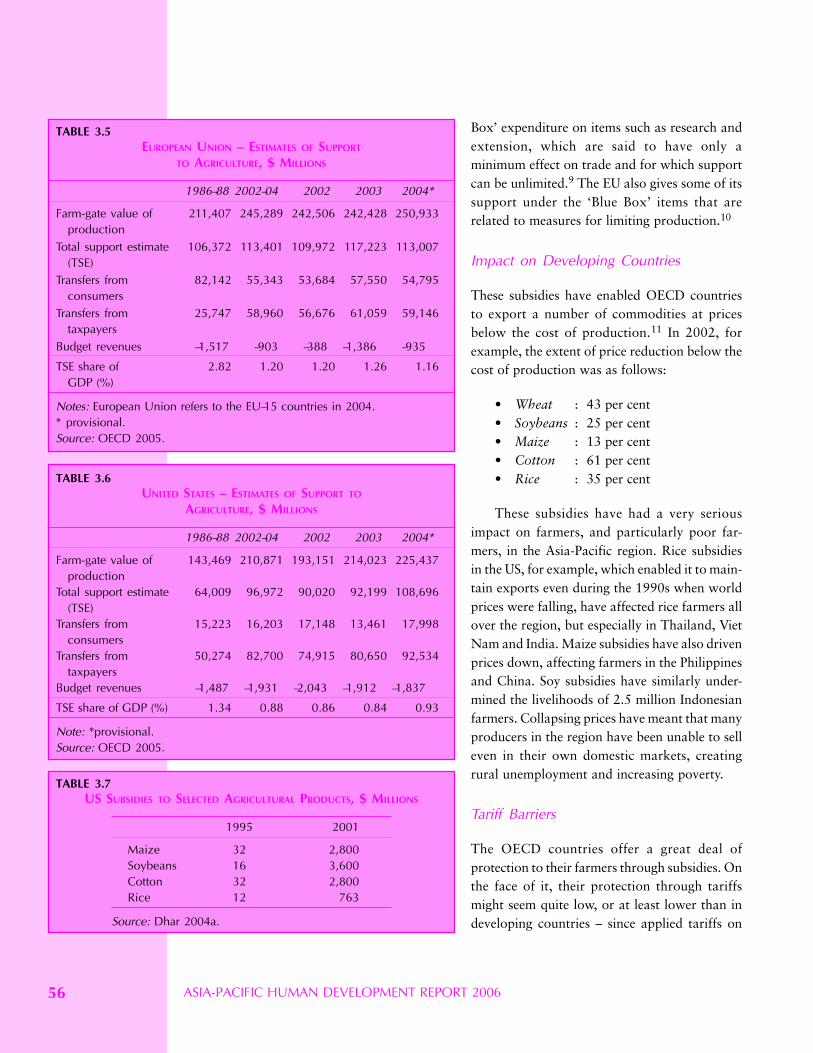
ASIA-PACIFIC HUMAN DEVELOPMENT REPORT 200656
Box’ expenditure on items such as research andextension, which are said to have only aminimum effect on trade and for which supportcan be unlimited.9 The EU also gives some of itssupport under the ‘Blue Box’ items that arerelated to measures for limiting production.10
Impact on Developing Countries
These subsidies have enabled OECD countriesto export a number of commodities at pricesbelow the cost of production.11 In 2002, forexample, the extent of price reduction below thecost of production was as follows:
• Wheat : 43 per cent• Soybeans : 25 per cent• Maize : 13 per cent• Cotton : 61 per cent• Rice : 35 per cent
These subsidies have had a very seriousimpact on farmers, and particularly poor far-mers, in the Asia-Pacific region. Rice subsidiesin the US, for example, which enabled it to main-tain exports even during the 1990s when worldprices were falling, have affected rice farmers allover the region, but especially in Thailand, VietNam and India. Maize subsidies have also drivenprices down, affecting farmers in the Philippinesand China. Soy subsidies have similarly under-mined the livelihoods of 2.5 million Indonesianfarmers. Collapsing prices have meant that manyproducers in the region have been unable to selleven in their own domestic markets, creatingrural unemployment and increasing poverty.
Tariff Barriers
The OECD countries offer a great deal ofprotection to their farmers through subsidies. Onthe face of it, their protection through tariffsmight seem quite low, or at least lower than indeveloping countries – since applied tariffs on
TABLE 3.5EUROPEAN UNION – ESTIMATES OF SUPPORT
TO AGRICULTURE, $ MILLIONS
1986–88 2002–04 2002 2003 2004*
Farm-gate value of 211,407 245,289 242,506 242,428 250,933production
Total support estimate 106,372 113,401 109,972 117,223 113,007(TSE)
Transfers from 82,142 55,343 53,684 57,550 54,795consumers
Transfers from 25,747 58,960 56,676 61,059 59,146taxpayers
Budget revenues –1,517 –903 –388 –1,386 –935
TSE share of 2.82 1.20 1.20 1.26 1.16GDP (%)
Notes: European Union refers to the EU–15 countries in 2004.* provisional.Source: OECD 2005.
TABLE 3.6UNITED STATES – ESTIMATES OF SUPPORT TO
AGRICULTURE, $ MILLIONS
1986–88 2002–04 2002 2003 2004*
Farm-gate value of 143,469 210,871 193,151 214,023 225,437production
Total support estimate 64,009 96,972 90,020 92,199 108,696(TSE)
Transfers from 15,223 16,203 17,148 13,461 17,998consumers
Transfers from 50,274 82,700 74,915 80,650 92,534taxpayers
Budget revenues –1,487 –1,931 –2,043 –1,912 –1,837
TSE share of GDP (%) 1.34 0.88 0.86 0.84 0.93
Note: *provisional.Source: OECD 2005.
TABLE 3.7US SUBSIDIES TO SELECTED AGRICULTURAL PRODUCTS, $ MILLIONS
1995 2001
Maize 32 2,800Soybeans 16 3,600Cotton 32 2,800Rice 12 763
Source: Dhar 2004a.

CHAPTER 3: MAKING AGRICULTURAL TRADE WORK FOR THE POOR 57
imports from developing countries are estimatedat 12 per cent for the US, 20 per cent for the EU,and 18 per cent for Canada.12 But, for severalreasons these averages are misleading. They referto the ad valorem duties. But, a high proportionof tariff lines in agriculture – 44 per cent for theEU and 43 per cent for the US – are non-advalorem duties, which when converted to advalorem equivalents are much higher. Moreover,these are averages across all tariff lines. Forcertain commodity groups that are of particularinterest to developing countries, the rates arevery high. For the OECD countries as a whole,these amount to around 350 per cent fortobacco, 277 per cent for chocolate, 171 per centfor oilseeds, and 134 per cent for poultry.13
The other form of protection is throughtariff escalation – setting low tariffs for rawmaterials but steadily escalating the rates ascommodities are converted to finished goods.Escalation is particularly pronounced on com-modity sectors important to the poorest deve-loping countries: meat, sugar, fruit, coffee,cocoa, hides and skins.14 The US, for example,has tariff rates of zero, 0.2 and 15.3 per cent onraw cocoa, intermediate products and final pro-ducts respectively. Moreover, these are weightedaverages and mask very high peaks: the maxi-mum tariff on final products is 186 per cent. Thesituation is similar for the EU with respect tofruit, for example. The tariff rates are 9.9, 18.5and 18.0 per cent on raw, intermediate andprocessed fruit products, with a maximum forfruit products of 98 per cent. Again, many ofthese rates are non-ad valorem, so the percen-tages underestimate the full scale of the tariffs.15
Tariff escalation will reduce a country’schances of exporting processed products. How-ever, the developed countries seem to be moresuccessful at overcoming this obstacle; overall,they get 68 per cent of their agricultural exportearnings from processed products, while fordeveloping countries the proportion is 57 percent and for the LDCs only 20 per cent.16
As a result of their selective protectionmethods, the developed countries overall applyhigher tariffs to goods from developing countriesthan they do to goods from other developedcountries. As is clear from Figure 3.3, the ratesare highest for goods from East Asia and SouthAsia.
Transnational Companiesand Small Farmers
Market distortions are the result not just ofsubsidies and tariffs, but also of the power of afew vertically integrated transnational compa-nies that dominate the entire food chain – fromdistributing seeds to placing products on super-market shelves. For soybean crushing, forexample, more than 70 per cent of the US marketand around 80 per cent of the European marketis controlled by just three companies.17 Similarlyfor grains: at the global level, trading, storage,processing and milling are dominated by a fewbig companies.
This is worrying for a number of reasons.First, large corporations prefer to deal with a few
Figure 3.3: Tariffs levied by developed countries onimports from each region (%)
Source: FAO 2004a.
Subsidies haveenabled OECD
countries toexport a numberof commoditiesat prices below
the cost ofproduction
ASIA-PACIFIC HUMAN DEVELOPMENT REPORT 200658
large producers, rather than with a multitude ofsmall suppliers, thereby squeezing many smallproducers out of the market. Second, theygreatly influence, or even determine, worldprices – affecting not only food traded interna-tionally but also the prices of products thatappear in the smallest village markets.
This control is most visible to consumers inthe spread of supermarkets. Globally, the top 30supermarkets control almost one-third ofgrocery sales, and they have been expanding at aremarkable pace in the Asia-Pacific region. InEast Asia, for example, over the past decade thesupermarkets’ share of retail food sales hasballooned from less than 20 to more than 50 percent. Supermarkets want to deal with a smallnumber of reliable suppliers who can deliver onschedule large volumes of high-quality produce– which for farmers generally requires substan-tial investments in irrigation, greenhouses,trucks, cooling sheds and packing technology.This is a tall order for small farmers, thoughsome have made a success of contract farming.18
Distorted Trade and HumanDevelopment
All these distortions in global agricultural tradecan adversely affect farmers – eroding theirmeans of livelihood and their security. As aresult, even countries that are successful agricul-tural exporters do not necessarily achieve higherstandards of human development. Thailand, forexample, is Asia’s largest food exporter, but itssmall farmers have gained little from itsincreased exports of rice. Since 2001, Thailandhas exported more than 7 million tonnesannually – about 30 per cent of world riceexports – yet about 40 per cent of ruralhouseholds live below the poverty line. Thegovernment has prioritized commercial riceproduction, while millions of small farmingfamilies have fallen into debt and lost their lands,partly because of low prices for their crops:about 4.7 million of the 5.7 million farming
families have no land, or inadequate land tosustain themselves. Malnutrition is increasing: in2000, 18 per cent of Thai households weremalnourished. Thailand appears to be feedingthe world on the backs of its poor rice farmers.
Similarly, the World Bank found that sinceChina’s accession to the WTO in 2001 and itssubsequent liberalization of agriculture, thepoorest rural households have suffered a 6 percent drop in their living standards due to thecombined effects of a drop in real wages and anincrease in the prices of consumer goods.19 Thestudy also found that liberalization has widenedrural-urban income gaps: since 2001, mosturban dwellers have seen their incomes rise,while rural households have on average seentheir incomes drop, with the poorest being mostseriously affected – a fall that is raising theprospect of some discontent in the rural areas.
Not all these are effects of distorted interna-tional trade patterns. Many are linked to libera-lization measures associated with structuraladjustment and the conditions imposed byWorld Bank and IMF lending. Indeed, theseprogrammes have often required liberalizationon a scale even more sweeping than thoserequired under the Uruguay Round. They havealso required a number of other measures – suchas privatizing state-run enterprises, eliminatingsubsidies and price controls, and abolishingmarketing boards (Box 3.1).
Why should liberalization damage theinterests of poor farmers? There seem to be anumber of interrelated factors.20 These include:
• Falling prices. Liberalization opens localmarkets to imports and thus to low worldprices. Farmers could respond by switchingfrom food to commercial crops, though theywould not necessarily do any better, sincethe prices for these too have fallen as morecountries enter the market.
• Rising cost of inputs. Farmers now have topay more for inputs such as fertilizers –partly because the world prices for these
Marketdistortions arethe result notjust of subsidiesand tariffs, butalso of thepower of a fewverticallyintegratedtransnationalcompanies

CHAPTER 3: MAKING AGRICULTURAL TRADE WORK FOR THE POOR 59
have been rising, but also because govern-ments have been withdrawing subsidies.
• Withdrawal of state services. The removalof services for irrigation, post-harvestfacilities and farm-to-market roads in thePhilippines, for example, has meant thatsmall-scale farmers are unable to improveproductivity levels or get their products tomarket at prices that cover costs.
• Land consolidation. Trade liberalization canmake some land more valuable for mecha-nized farming of certain crops. This leads toland consolidation. Whilst the concentrationof farms can increase productivity andcompetitiveness, it also drives tenants andsmall farmers from their land, and in theabsence of safety nets adds to unemploy-ment and poverty.21 In Cambodia, forexample, following trade liberalization, landwas concentrated into fewer hands, andbetween 1983 and 2003 the proportion ofrural households who were landless rosefrom 3 to 20 per cent.
• Rising gender inequality. Prior to libera-lization, many women sold their produce toparastatals. Now they have to sell to traders,who may take a greater cut. Women are alsoaffected disproportionately by the elimina-
tion of subsidies, the drying up of credit andthe surge of food imports.
• Unsustainability. The international foodmarket encourages farmers to devote largeareas to single crops, with excessive use offertilizers and pesticides, which can causedamage to both land and water supplies.
Trade liberalization does, of course, havepositive effects. Not only does it lower prices forconsumers, it can also enable rural communities,and especially women, to engage in non-agricultural activities through micro- andsmall enterprises, for example. However, thepositive effects are often far outweighed by thenegative.
Making Agricultural Trade Workfor the Poor
Neither economic growth nor an expansion oftrade will necessarily benefit the poor; indeed, itmay harm them. What would it take to maketrade work for the poor? Changing internationaltrade rules will be important, but nationalgovernments can also take measures to changethe context within which trade liberalizationoperates.
BOX 3.1AGRICULTURAL TRADE LIBERALIZATION IN INDONESIA
Following the 1997 Asian financial crisis, the IMF imposedsweeping trade liberalization conditions as part of itsmultimillion-dollar loan to Indonesia. These included loweringtariffs as well as the deregulation of BULOG, the state foodpurchasing and distribution agency, thus providing the majoragricultural exporters, such as the US, with access to a largemarket for their agricultural surpluses.
Indonesia’s applied tariff rates were brought down to 5 percent or less even on staple products. The tariffs on soy and ricewere set at zero and on corn at 5 per cent. Only after social andpolitical chaos and rioting was the rice tariff adjusted to 30 percent (Kwa 2004).
Before deregulation, BULOG had sole control over imports ofthe major food commodities coming into Indonesia, and hencewas able to regulate food supplies and domestic prices. This rolehas been dismantled almost completely. BULOG no longercontrols the quantities being imported, and private traders have
total freedom in this regard. BULOG’s previous role in ensuringdistribution of rice and other staples between regions has alsobeen severely limited.
The results of liberalization have been dramatic. During the1980s Indonesia was at times self-sufficient in rice, but over theperiod 1988–2002 it imported on average 10 per cent of nationalneeds. The US has been the clear winner in this market-openingexercise. US exports to Indonesia, amounting to $411 million in2000, climbed to $720 million in 2001. Since then, imports haveincreased even further (Setiwant 2003).
The impact on rural employment is clearest in soybeans.Where there were 5 million soybean producers in 1996, by 2001there were only 2.5 million. Taking one producer to be supportinga family of four, 10 million people’s lives have been affected.Whilst some soy farmers may have switched to rice or corn, themore likely scenario is that they would have left farmingaltogether.
ASIA-PACIFIC HUMAN DEVELOPMENT REPORT 200660
1. Promote Agricultural Development
Although more than half the region’s populationdepend on agriculture for their livelihoods,relatively little has been done to promoteproductivity and employment. Indeed, publicexpenditure on agriculture has been declining.Between 1990 and 2001, public expenditure onagriculture as a proportion of GDP in fourSouth-East Asian countries fell from 8.4 to 3.8per cent, in three South Asian countries from 1.9to 1.2 per cent, and in two countries of the SouthPacific from 1.0 to 0.8 per cent.22
India is an example where the governmentin the past decade has largely neglected theagricultural sector. Though most of India’s poorlive in the countryside, investment in agriculturehas been in serious decline, between the 1980sand the 1990s falling by 29 per cent. Just asimportant is the shortage of agricultural credit.While consumers can take loans to buy a houseor a car at interest rates of 9 to 11 per cent,farmers wanting crop loans can be charged 17per cent. Even then, most farmers cannot evenaccess government loans and have to rely onmoneylenders who can charge them rates ofseveral hundred per cent.
If governments want broad-based andequitable development, they will need to investmore in agriculture – particularly for capitalformation – while providing price support,affordable loans, assistance with irrigation andmarketing, and help with storage, processingand distribution facilities.
2. Carry Out Land Reform
Governments serious about agricultural deve-lopment will need to make more serious effortsat land reform. In Asia, one-third to one-half ofsmallholders subsist on less than one hectare. InBangladesh, for example, 78 per cent of ruralhousehold are classified as land-poor. In Indiathe proportion is 71 per cent. Elsewhere, the
proportions may be smaller but still significant:more than one-third in Indonesia, the Philippinesand Sri Lanka. If anything, the problem seemsto be getting worse as the concentration onexport agriculture and the growth of cities andindustry combine to push more poor families offtheir land.
Land ownership is particularly difficult forwomen. In Nepal, for example, even thoughtwo-thirds of agricultural labourers are women,until very recently they were permitted to ownland only as part of a married couple, and whencouples separated the land rights went to thehusband. While women can inherit propertysince 2002, it reverts back to the natal familyupon marrriage.23
Recent attempts at land reform have not gotvery far. In the Philippines, for example, thegovernment’s Comprehensive Agrarian ReformProgramme (CARP) has never really beenimplemented. The Philippines has also attempted‘market-assisted land reform’, which involveshelping the landless procure land directly fromlandowners. However, the beneficiary only getshelp if he or she presents a farm plan that isgeared towards commercial cash crops. Theprogramme does not, therefore, promote small-scale farming. Also, the current landholdersobject strongly, and given the scarcity of landare unwilling to sell. The farmers’ movementsare also opposed, because of the unequalbargaining positions of the landholder and thefarmer. All in all, the programme has not beenvery successful.
3. Address Relative Prices
Trade liberalization also alters relative productprices, and therefore, its net impact on povertyreduction depends also on the direction of pricechanges and how they affect input and factorprices and farmers’ incomes. If the price changesare pro-poor, then they will tend to reinforce anypositive growth effects of trade reform on the
Governmentsserious aboutagriculturaldevelopmentwill need tomake moreserious efforts atland reform
CHAPTER 3: MAKING AGRICULTURAL TRADE WORK FOR THE POOR 61
poor. However, the outcome also depends oncomplementary policy changes, specifically onwhether or not they:
• Create new markets that are pro-poor;• Stimulate the poor to respond to altered
prices and new market opportunities;• Provide second-round spillover effects that
are pro-poor;• Minimize any transitional unemployment
that concentrates on the poor;• Raise government revenue that leads to pro-
poor public expenditure; and• Reduce the vulnerability of the poor.24
4. Offer Protection to Poor Producers
At present many poor farmers find it difficult tocompete. Governments will, therefore, need tofind ways of protecting small farmers who areviable food producers but are threatened by lowworld prices either through higher tariffs, pricessupport or subsidies on inputs.
Agricultural Trade Policies ofDeveloping Countries
Given their different patterns of agriculturaltrade, individual developing countries will alsohave different interests, depending on whetherthey are exporters or importers. Producers oftropical beverages and raw materials will aimfor access to global markets and a steadyincome. They want to avoid price volatility andensure that they are not persistent losers in theshifting terms of trade between tropical pro-ducts, food and non-agricultural products. Thus,they would benefit by coordinating their produc-tion programmes so as to maintain steady supp-lies, for example, while also establishing effectiveinsurance systems in case demand dips tempo-rarily. Food exporters too would welcomestability in terms of access and prices; they wouldalso want to adjust their own patterns ofproduction to reduce dependence on imports.
The most significant dilemma for develop-ing countries, however, concerns the impact ofinternational trade on the prices of staple foods.Should governments aim to maintain prices toprovide decent livelihoods to farmers, or shouldthey lower prices so as to help poor urbanconsumers? This is a major issue for Indonesia,for example, which is a large domestic producerof rice but is not self-sufficient and has to importto meet the rice gap. Selling imported riceat low world prices could harm local producersand, therefore, Indonesia applies tariffs onimports.
Some, including the World Bank, argue thatthese tariffs should be removed or should be aslow as possible since the poorest Indonesiansspend 30 per cent of their incomes on rice.25
Others argue that a cheap rice policy is counter-productive. If Indonesian farmers get low farm-gate prices, they are unable to improve theirsituation and are less able to invest in education,which means that Indonesia will remain with anunskilled, low-wage and low-productivity eco-nomy.26 Continuing rural poverty also depresseslocal purchasing power and the demand forother domestic products and thus hampersnational development, sustaining a high degreeof dependence on foreign markets.27
In practice, the trend in agricultural trade istowards greater liberalization. In some cases thisis because countries have entered into bilateral,regional or multilateral agreements that requiremore open trading. In others, however, countrieshave either liberalized unilaterally or have beenrequired to do so by international agencies onwhich they rely for capital inflows to coverbalance of payments deficits.
Unfortunately, much of this liberalizationhas been asymmetric. Developing countries haveliberalized their agricultural trade far more thanthe developed countries, which have maintainedsignificant levels of subsidies to national foodproducers as well as using technical non-tariffbarriers. This asymmetry has been accentuatedby the Uruguay Round agreements on Trade-
Developingcountries have
liberalized theiragricultural
trade far morethan the
developedcountries
ASIA-PACIFIC HUMAN DEVELOPMENT REPORT 200662
Related Aspects of Intellectual Property Rights(TRIPS), within which the clauses on Geogra-phical Indications have so far mostly beenexploited by the developed countries. The deve-loping countries could, however, also use theseas a lever to advance their human developmentagenda.
The Current Negotiations
The current Doha Round of trade negotiationsoffers an opportunity to correct these inequities.But they do not seem to be going in the rightdirection – particularly with respect to the‘Green Box’, which refers to support that can beunrestricted, and the ‘Blue Box’, where there aremore restrictions (see Notes 9 and 10). Early inthe negotiations, the US and the EU managed toensure that they could continue to misuse GreenBox support measures and even maintain andextend the Blue Box measures that should havebeen phased out at the end of the UruguayRound.28
There have been some gains. The meeting ofthe General Council of the WTO in July 2004led to a framework agreement that required thedeveloped countries to reduce and eventuallyeliminate direct and indirect subsidies to agricul-tural exports. It also obtained a promise of asubstantial reduction of domestic support tofarmers.29 However, the text allows for someexemptions – notably, through a provision forlower cuts for an ‘appropriate number’ of‘sensitive products’. This will, for example, allowthe US to protect uncompetitive products suchas sugar.
Even so, the developing countries have madesome gains. The agreement explicitly recognizedthe need for ‘special and differential treatment’for developing countries in terms of the scale oftariff reduction, the number and treatment ofsensitive products and the length of the imple-mentation period. In particular, just as the deve-loped countries can designate certain ‘sensitive
products’, the developing countries can identifyan appropriate number of ‘special products’ thatwill be eligible for more flexible treatment andnot subject to tariff reduction commitments –based on their contribution to food security, forexample, and rural development needs. Theframework also provided for ‘special safeguardmechanisms’ against disruptive imports, importsurges, or sharp price declines in specific agri-cultural products.
How much has really been achieved? Theeventual elimination of export subsidies wouldof course be welcome, but these should alreadyhave been phased out, even under current WTOrules. The main change is that the EU, which isthe primary user of such direct subsidies, hasmade its reductions conditional on parallel re-ductions on the more indirect subsidies, such asexport credits that are primarily used by the US.
The main sticking point, however, is not onsupport for exports but on direct support todomestic producers. Developed countries haveso far offered very little on this, which makes upthe bulk of agricultural support.
This framework agreement was largelyratified at the December 2005 WTO meeting inHong Kong. The EU accepted at this meetingthat it would phase out export subsidies by2013, though this only corresponds to thereduction already envisaged in the reform of theEU Common Agricultural Policy that was to becompleted by 2013. On other agricultural issues,the Hong Kong Declaration reiterates the needto work out ways to reduce tariffs and domesticsupport and says that the greatest reductions willbe expected from countries giving the mostdomestic support and applying the highestimport tariffs. However, these seem unlikely toresult in any significant cuts in support.
For developing countries, Hong Kong has,therefore, produced three limited gains: the EUcommitment to phase out export subsidies by2013; the opportunities to designate certain‘special products’ that will not be subject to tariff
CHAPTER 3: MAKING AGRICULTURAL TRADE WORK FOR THE POOR 63
reduction commitments, and the ‘special safe-guard mechanism’ to deal with import surges orsharp declines in prices.
Intellectual Property
Another contentious feature of the internationaltrade regime instituted through the UruguayRound was the agreement on TRIPS. This aimsto protect the rights of individuals and compa-nies that have invested in research and develop-ment – giving them the opportunity to recouptheir costs on the grounds that, without suchprotection, they will have little incentive to makesimilar investments in the future.
Others argue, however, that such protectionis unnecessary – that the period in which compe-titors try to match their innovations alreadyoffers sufficient opportunities to recoup R&Dcosts. And in some respects nowadays thereshould actually be less need for protection, foras modern products become more complex, thecapital costs increase, which poses barriers toentry and alleviates the risk of failure – thusdeterring competitors. Moreover, many of theinnovations for new products lie less in the pro-ducts themselves than in the way they areproduced; the process of technological change isthus embodied in the firms, which further under-mines the position of potential competitors.
There are also many problems with ambi-guous definitions. At what point, for example,does an increment in human knowledge warrantbeing described as an innovation? And how doesone take into account the fact that much inno-vation builds on common property, for example,drugs derived from natural products? If theinnovator is allowed to charge, should thecountry or community that provided the originalmaterial not also have similar rights?
Despite these and many other objections, thedeveloped countries have been demandingstronger international patent protection, and inparticular have been pressing it through the
trade regime via the TRIPS agreement. Thisbrings a number of advantages: first, because itcreates an opportunity for enforcement; coun-tries that do not respect intellectual propertyrights (IPRs) would face retaliation throughtrade sanctions. Second, it creates an interna-tional body, in the form of the Dispute Settle-ments Panel of the WTO, to which IPRviolations can be referred. Third, it passes theresponsibility for policing the rights to nationalgovernments, who would not want to see allexporters penalized for infractions by a singleenterprise. The Uruguay Round agreement thusnot only forced countries to recognize IPRs, italso created a workable mechanism for enforc-ing those rights.
Until recently, the main implications of thisfor agriculture would have been for inputs likefertilizers, pesticides and machinery. Mattershave changed because of two kinds of techno-logical development. First, since the years of theGreen Revolution many companies have beenproducing hybrids or varieties generated throughscientific research. Second, more recently,researchers have been using genetic engineeringand biotechnology to manipulate genes toproduce crop varieties that have higher yieldsand greater pest resistance, and are moreappropriate for particular conditions of climate,soil and moisture.
Transnational corporations hope, therefore,to apply patents to ‘plant variety protection’,arguing that this will ensure further research.This is doubtful, since in most of the developingworld such research is mainly financed bygovernments, and commercial varieties generallyoffer cosmetic differences using lines or strainsbased on research provided by public insti-tutions.
In fact, some forms of protection will inhibitfuture research. This was evident even during theGreen Revolution, when seed multinationalssuch as Monsanto and Pioneer Hi-Bred Inter-national Inc managed to get patents for plants
Developingcountries canrightly claim
thattransnational
companies areplundering their
resources
ASIA-PACIFIC HUMAN DEVELOPMENT REPORT 200664
that prevented farmers from saving the seeds ofthe resulting crops. This meant that, when theInternational Centre for Maize and WheatImprovement in Mexico developed semi-dwarfimproved varieties of wheat for developingcountries, it could not offer these to India, wherethey were covered by a utility patent in America.As a result, the Green Revolution in India didnot boost the production of maize. Conse-quently, patent protection can create newobstacles to agricultural improvement.
Companies can also reinforce this legal formof protection with a technical one by engineeringvarieties whose ‘terminator seeds’ do not germi-nate, or in which during natural reproduction acertain quality collapses or cannot be trans-mitted through seeds. They can also tailor plantsto ensure that they will not express a particulartrait, such as herbicide resistance, unless they aresprayed with specific chemicals that activate theright gene.
Developing countries can rightly claim thattransnational companies are plundering theirresources. Tropical countries are oceans of bio-diversity and provide most of the original speciesas the basis for research in the developed coun-tries. This has been referred to as ‘biopiracy’,when foreign companies steal and then patentbiological resources and traditional knowledgefrom the developing countries. The US patent onthe use of turmeric for healing wounds is a well-known case in point.
But there have also been other cases wherebiotechnology and patenting are damaging deve-loping countries in a more insidious way. Thusfar, generations of plant breeding in differentcountries have produced distinctive and valuablevarieties. Biotechnology can take these varietiesand engineer them so that they will also grow inother places – as has happened with basmati rice,for which the commercial plant breeder, RiceTec,built on traditional knowledge without havingto pay for it, and managed to differentiate itsproduct to render it ‘novel’ enough to be consi-
dered for a patent. But what constitutes noveltyis generally an arbitrary judgement.
Geographical Indications
Despite these implications, it has been arguedthat developing countries could, even if partially,exploit the TRIPS agreement in their favour. Forexample, by using the system of GeographicalIndications (GIs). These are indications – words,phrases, symbols or images – that identify a goodas originating in a territory, where a givenquality, reputation, or other characteristic of thegood is essentially attributable to its geogra-phical origin.30 Geographical Indications arethus unlike patents in that they do not protectnew creations but simply recognize existingones.
The idea originated in Europe and most GIsrefer to products from developed countries, suchas Champagne, Cognac, Roquefort cheese,Napa Valley wines and Scotch whisky. Examplesof GIs in Asia include: Basmati rice, Phu Quocfish sauce, Long Jing tea, Himalayan waters,Alphonso and Sindhri mangoes, Hunza apricots,Bhutanese red rice, Mongolian Cashmere,Pakistani Shu (windproof woollen fabric) andAjrak (designs from Sindh), Jasmine (Hom Mali)rice and Thai silk, Lao Agar fragrance,Sumatra Mandheling coffee, Shaoxing alcohol,Maotai, Xuancheng art paper; and Ceylon andDarjeeling teas.
Geographical Indications offer an advan-tage for policymakers since they are usuallypublic property. Intellectual property is usuallyowned by individuals or corporations, and 97per cent of all patents worldwide belong to theindustrialized countries.31 But GeographicalIndications are owned publicly by the state, oragencies legally vested by it. Even subsistence-based societies with low levels of technology canthus in principle use GIs to promote theirtraditional products and know-how.
This opens up many development opportu-
Geographicalindications offeran advantage forpolicymakerssince they areusually publicproperty
CHAPTER 3: MAKING AGRICULTURAL TRADE WORK FOR THE POOR 65
nities. Asian nations have a wide range of distin-guished products, but only a few are globallyknown – which means there is a tremendousscope to publicize them at home and abroad.Once a Geographical Indication is recognized,communities and enterprises in the designatedarea can stop other people from using it. Theyare also in a position to charge a premium forwhat have effectively been certified as ‘authentic’products. It might be argued that raising priceswould disadvantage poor consumers, but GIs inmost cases are not usually staple items of basicneeds and consumption; they are generallyspecial products, with high value that are notmuch used by the poor.
There are also indirect benefits. GIs areoften linked with popular tourist regions – whichwidens economic opportunities for local peoplethrough micro-enterprises and could attractadditional investment into the region to developthe place and the product, such as in Viet Nam’sPhu Quoc island.
As well as being valuable for protecting localproducts, GIs also provide a way of protectinglocal knowledge and natural endowments. Thedeveloping countries in Asia and Africa arehome to 90 per cent of the biological resourcesthat are a source of plant-based drugs. In 2004the market value of pharmaceutical derivativesfrom indigenous people’s traditional medicinewas estimated at $60 billion.32 In recent years,some Western pharmaceutical companies haveattempted to seize control of this knowledgethrough patents – as for example, with the natu-ral fungicide in the bark of the Indian neem tree.There are also examples of attempts by outsidersto tap the anti-diabetic properties of the bananaplant in the Philippines. These have the potentialto generate direct, equitable revenue-basedbenefits to the poor and the marginalized.
The TRIPS Agreement and GIs
The TRIPS agreement offers some protection for
GIs. But it has its limitations. It forbids countriesfrom registering a trademark that suggests theproduct originates in a place protected by a GI,but only if it does so in a way that misleads thepublic. Thus, if a sauce were described as a PhuQuoc ‘kind’, ‘type’, ‘style’ or even ‘imitation’, itwould be allowed. This creates areas ofambiguity – since producers can free-ride on thereputation of a product without necessarilymisleading the public, and there can also beuncertainty in deciding whether or not the publicis misled. Moreover, the burden of proof lieswith the GI holder.
The only exceptions to this are products ofparticular value to the developed countries:wines and spirits. Thus, a company that wantedto market, say, a ‘Beaujolais-type wine producedin Viet Nam’ would not be prevented from doingso on the ground of misleading the public, but itwould be caught by a further clause that offersstronger protection for wines and spirits againsteven this kind of encroachment.33
GI Regimes in Asia
Asia has in practice had many GIs for hundredsof years, though only recently have countriesconsidered protecting them through an intellec-tual property regime. Even today, most countriesdo not have a separate legal sui generis instru-ment. Instead, they provide some, though ofteninadequate, protection through two mainchannels: trademark laws or business practicelaws such as those for unfair competition, con-sumer protection or food standards. Often,however, in response to a threat they have triedto produce more specific legislation – as in India,Thailand and China (Box 3.2).
Nevertheless, Asians still have a long way togo when it comes to presenting their cases. Innegotiations the Geneva-based delegations ofAsian countries favour short-term tacticalbargaining, rather than substantiating theirpositions with solid research and information.
ASIA-PACIFIC HUMAN DEVELOPMENT REPORT 200666
trade – worth nearly $60 billion in fish and fishproducts.
Fisheries are particularly important fordeveloping countries. While the share of deve-loping countries in global merchandise exportswas 38 per cent in 2001,34 their share in globalfish exports in 2000 was slightly less than 50 percent. Fish thus provides a valuable source offoreign exchange for developing contries, withnet receipts of around $17 billion a year, morethan from the combined exports of tea, rice andcoffee.35 Of this, the net export trade in seafoodbetween 1990 and 2000 increased from $10billion to $18 billion, an increase in real terms of45 per cent, due to a large extent to the emer-gence of aquaculture.
Asia has much to gain by promoting equit-able agricultural trade generally, but this is parti-cularly true for that in fish. The region accountsfor more than one-third of global exports of fish
As a result, the intrinsic merits of their GIs getdiluted. Some producer associations, like that forThai silk, and new international networks likeORIGIN are working toward collecting factsand information on selected products. Butgovernment departments should take theresponsibility to conduct research – collectinginformation on market share and value, thenumber of people employed, ancillary ruralindustries, actual cases of loss in terms of jobsand incomes through lack of protection, and thepotential for investment and increasing tourism.
Fisheries and Human Development
Fish has become a highly traded commodity.More than 800 fish species are traded interna-tionally in many different forms, shapes, brandsand preparations. By weight, some 38 per centof total fisheries production enters international
BOX 3.2GEOGRAPHICAL INDICATIONS IN ASIA
A number of Asian countries have been developing systems toprotect Geographical Indications:
India. In the late 1990s, India fought a well-publicized battle torescind some US patents on Basmati rice, but it was not until1999 that it belatedly passed the Geographical Indications ofGoods (Protection and Registration) Act, which only came intoeffect on 15 September 2000. This defined GIs more specificallythan TRIPS: in addition to agricultural goods bearinggeographical names, it covers natural goods like coal and bauxite,as well as manufactured goods, like Kanchipuram sarees andKohlapuri slippers. It stipulates that one of the activities of eitherproduction or of processing or preparation of the goodsconcerned should take place in the territory, region or locality.The Indian system is quite elaborate though the alternative ofprotecting GIs through the trademark system is said to be evenmore prohibitive and inadequate (Thual 2003). Either systemcould be daunting to individual and small-scale producers whowant to protect their products.
Thailand. Thailand too sprang into action only in self-defence,when a variant of its famous Jasmine rice was patented in the USas Jasmati. A sui generis Act on GIs was finally passed and cameinto force in April 2004. Known popularly as the ‘ChampagneLaw’, it has standard procedures for registration and penaltiesfor misuse: a fine of up to $5,000. It also provides for cancelling
GIs if, for example, they are contrary to peace and order, goodpublic morals and national policy (Chuenjaipanich 2004).Thailand is using this system as part of its ‘One Tambon, OneProduct’ programme. Launched in 2003, this has selected 60community products for upgrading and quality certification,with the aim of first expanding the domestic market and laterexports.
China. There are two distinct regimes of GI protection. The first,which has operated since China joined the Paris Convention in1985, is through the China Trademark Office (CTMO), and thefirst regulations were introduced in 1993. As of November 2003,100 GIs had been registered with 233 applications pending. Thesecond regime is sui generis, through the Administration forQuality Supervision, Inspection and Quarantine (AQSIQ). In1999, for example, in cooperation with the French government,this recognized GIs for Shaoxing Yellow Wine. As of November2003, 123 GI applications had been made to AQSIQ, of which 49had been approved and 41 were under examination (Li et al.2003). Producers of the most famous Chinese GIs, such as LongJing tea and pottery, who have availed themselves of protection,say that sales of rival counterfeit products have declined whiletheir sales and prices have increased rapidly, enabling them to paymore taxes to state coffers.
Source: Waglé 2003.
CHAPTER 3: MAKING AGRICULTURAL TRADE WORK FOR THE POOR 67
and fish products – 7 million tons annually.36
China is now the world’s largest exporter of fish,while Japan is the world’s largest importer, butthe fish trade is important throughout theregion.
• Viet Nam. Fisheries represent 5 per cent ofGDP, and 40 per cent of total fish produc-tion is exported, with earnings of $2.1billion in 2002 – greater than exports ofagricultural products such as rice andrubber and next only to crude oil andgarments.
• India. Fish is the third-largest export, aftertextiles and cotton. India exports 25 per centof its marine fish production. In 2002-03Indian export earnings from seafood stoodat US$ 1.4 billion.
• Thailand. Fisheries are 4 per cent of GDP,and Thailand exports more than three-quarters of its production.
But fisheries can be even more significant forsmaller developing countries such as Cambodia,where fish accounts for 4 per cent of GDP, andespecially small island developing states, such asFiji and the Maldives, where it contributes 9 percent of GDP.
Employment in Fisheries
Fishing, both for home markets and for theexport trade, employs many millions of people.Indeed, the Asia-Pacific region is home to 85 percent of the world’s fishers and 95 per cent of itsfish farmers. Although marine capture is still thebiggest employer, aquaculture is fast catching upin some of the major fish-producing countries.Marine capture fishing usually employs men, butaquaculture, fish processing and marketingemploy large numbers of women.
• Viet Nam. About 3 million people aredirectly employed in fisheries, and there are
plans to develop aquaculture to employ anadditional 2 million people by 2010.37
• Indonesia. There are more than 2 millionfishers – half full-time, half part-time – aswell as 2 million fish farmers.38
• India. There are 725,000 full-time fishersand an equal number of part-timers. Inaddition, over 1 million people, mainlywomen, are engaged in pre- and post-fishingactivities.
• Thailand. There are over 250,000 fish-workers. Around one-third are employed asworkers in large-scale fisheries, another one-third are owner-operators in large-scale andsmall-scale operations, and most of the restare aquaculture farmers.
In some respects fishers are in a strongerposition than farmers because they sell a largerproportion of their production on a regular andconsistent basis.39 In other respects, however,they can be more vulnerable, whether as a resultof natural factors such as fluctuations in the fishcatch, bad weather, and exposure to cyclones, oras a result of economic factors such as marketprice fluctuations and variable access to markets.This vulnerability was underscored by the 2004Indian Ocean tsunami, which badly affected thelivelihoods of fishers in Indonesia, India and SriLanka.
Incomes in fisheries can also be more equit-ably distributed than in other sectors. In capturefisheries, for example, earnings are typicallyshared between the owners of the boats, equip-ments and the crew. Also, fishers working forthe export market can earn more than thoseworking for the domestic market. Export speciesfetch a higher price than non-export species, andthose workers on board fishing vessels targetingexport species receive a higher share of the catchthan for non-export species. On the other hand,the input costs are generally higher for catchingor rearing high-value species.
Nevertheless, many fishing communities
The regionaccounts for
more than one-third of globalexports of fish
and fishproducts – 7million tons
annually. It ishome to 85 per
cent of theworld’s fishers
and 95 per centof its fish
farmers
ASIA-PACIFIC HUMAN DEVELOPMENT REPORT 200668
remain very poor. Most full- and part-timefishers in the artisanal and small-scale sectors arecompletely dependent on fisheries for theirlivelihood, and nearly 6 million of them, over 80per cent of whom live in Asia, are believed to beearning less than $1 per day.40 Of a furtherestimated 17 million income-poor personsengaged in aquaculture and other related activi-ties (boat-building, net-making, marketing andprocessing), over 14 million are to be found inAsia. Globally, then, around 23 million income-poor people work in the fishery sector; of these,19 million are from Asia.
As a result, fishing communities can havelower levels of human development. In theIndian state of Tamil Nadu, for example, fishingcommunities have a literacy rate of 65 per centcompared with a state average of 74 per cent.Many live in poor housing conditions. Popula-tion growth is also more rapid here than else-where.
Sustainability
Many fishing communities already have lowincomes, but their situation could get worse asstocks are exhausted. Intense competition inopen-access fisheries is leading to overfishing inseveral commercially important fisheries. Unre-gulated coastal industrialisation has also givenrise to problems of coastal pollution, which iskilling fish and threatening the livelihood offishing communities in many Asian countries,including India, China and Thailand. Elsewhere,there have been some successes, as in theMaldives, which has introduced environ-men-tally friendly fishing methods and technology –but it has yet to promote Maldives fish in inter-national markets as coming from sustainablesources.
It might have been thought that aquaculturewould be more sustainable. But in fact, thereverse seems to be true. The emergence of cul-tured shrimp in many parts of the region has not
only caused considerable environmental damagebut also had knock-on effects in marine capturefisheries. This is partly because the volume ofcultured shrimp on international markets hasdepressed prices for wild harvested shrimp –forcing many trawlers to switch over to highopen-bottom trawls, which catch all species offish. This, in turn, has undermined the liveli-hoods of other non-trawling fishers. In addition,the collection of shrimp fry from the wild gathersnot only shrimp fry but other marine fish larvae– further reducing fish stocks.
The Impact of Tariff Measures
The Asian fishing sector also faces problemsaccessing markets in developed countries. Atfirst glance, the barriers do not appear high. TheEU, Japan and the US extend preferential tarifftreatment under the Generalized System ofPreferences (GSP). For unprocessed fish, frozenfish, crustaceans and molluscs, most developedcountries apply fairly low tariffs: Japan, whichis the world’s biggest market for fish and fishproducts, has a tariff of about 4 per cent. TheUS has a nominal tariff of just 1 per cent for fishimports. The EU, on the other hand, appliestariffs on primary shrimp products of 12 to 18per cent and has an average tariff of 10 per cent.
Tariffs are much higher, however, forprocessed fish and fish products. Japan, forexample, applies a tariff rate on fresh/chilled/frozen tuna of 3.5 per cent, but for processedtuna the rate is 9.6 per cent. The developedcountries also typically apply quotas – withhigher tariff rates for deliveries beyond thequota: the US, for example, applies a 6 per centrate to processed Thai tuna within the quota but12.5 per cent for deliveries beyond it. For theEU, tariff rates on processed tuna can reach 25per cent.
Even for unprocessed fish, there can befurther hurdles. The EU discriminates againstimports of fish and fish products from countries
Many fishingcommunitiesalready havelow incomes,but theirsituation couldget worse asstocks areexhausted
CHAPTER 3: MAKING AGRICULTURAL TRADE WORK FOR THE POOR 69
that have not met with their obligations undermultilateral environmental agreements. Therecan also be protests against the arrival of largevolumes of particular products. Viet Nam, forexample, between 1999 and 2002 increased itsexports of frozen catfish fillets to the US from 5million to 34 million pounds. The CatfishFarmers of America, a group representing catfishgrowers and processors, lodged a dumpingcomplaint, and in 2003 the US InternationalTrade Commission ruled that Viet Nam’sexports had hurt the US catfish industry andimposed tariffs of 37 to 64 per cent. As a result,fishermen in Viet Nam suffered a sudden fall inprices and a sharp decline in income.
In addition to tariff barriers, the developedcountries can also restrict imports via non-tariffbarriers. These include food safety standards,environmental measures such as ecolabellingand certification programmes, and requirementsfor compliance with multilateral environmentalagreements.
Food Safety Standards
As a result of the globalization of the fish tradeand the increasing demands for consumers forsafe fish of high quality, developed countriesnow have much more systematic proceduresassuring food safety, using a Hazard Analysisand Critical Control Point (HACCP) system.41
Processors who export to the EU and the USmarkets in particular have to comply with tightimport regulations or face rejections that theycan ill afford (Box 3.3). These standards varyfrom one market to another: the US, forexample, requires that levels of histamine incanned sardines, mackerel and anchovies shouldnot exceed 50 parts per million (ppm), while theEU generally permits up to 150 ppm in cannedfish.
Technological advances in seafood analysisare now such that pesticide and pharmaceuticalresidues can be detected at the parts per billion
(ppb) level, and in some cases at the parts pertrillion (ppt) level. The EU, for example, usesa high-performance liquid chromatography(HPLC) method that can detect antibiotics suchas chloramphenicol at 0.3 ppb and nitrofuran at1 ppb levels. At this level of sensitivity, a ‘safe’product can suddenly become ‘unsafe’.42 On anumber of occasions, the EU has rejected Asianshrimp imports, having detecting traces of prohi-bited carcinogenic antibiotics like nitrofuran andchloramphenicol as well as other bacterial inhi-bitors such as aminoglycosides and macrolides.
The importing countries also have differentcontrol procedures. The EU requires fish impor-ted from a foreign processor to be accompaniedby a certificate from an authorized nationalagency, and it reserves the right to inspect theregulatory process and to decertify a nationalagency until remedial action is taken. In the caseof the US, the individual exporter has to demon-strate an ability to produce seafood according tothe US regulations.
Meeting these regulations and complyingwith the International Organization for Standar-dization’s requirements, especially ISO 9002 forfish processing plants, adds significantly to thecosts for exporters – who have to pay for consul-tants, personnel, record keeping and training. At
BOX 3.3FOOD SAFETY STANDARDS AND SMALL-SCALE FISHERIES
From a small-scale fisheries perspective, in addition to the cost aspects, oneof the main problems in adopting a HACCP plan would be the difficulty inimplementing it at the point where fish is caught, especially for beach landingfishing units like kattumarams and canoes in countries like India. Accordingto EU and the US standards, fish has to be stored in ice or kept in frozenstorage as soon as it is harvested. Storage of fish in iceboxes would be difficulton board traditional fishing craft like kattumarams, which are made of lashedlogs. Yet many kattumarams using long lining and bottom set gillnets areengaged in catching fish for the export market. Strict implementation ofHACCP plans would result in their forced exit from that market.
The fish handling standards of many import markets require that fish isnot exposed to beach sand. Because many of the fishing villages that harvestfish, shrimp and cephalopods for the export market have only the beach forlanding their catch, it would be difficult for them to comply with a HACCPplan unless they invested in iceboxes and maintained them in a hygienicmanner.
Processors whoexport to the EUand US markets
in particularhave to comply
with tightimport
regulations orface rejections
that they can illafford
ASIA-PACIFIC HUMAN DEVELOPMENT REPORT 200670
2002 prices, an HPLC measuring system, forexample, costs around $220,000 per unit. Evencomplying with HACCP is difficult for small-scale operations (Box 3.3). These rising certifi-cation costs are then reflected in falling profits –as reflected in the ‘unit value realization’: forshrimp, for example, this rose from $1 in 1961to $9 in 2001, but by 2002 had fallen backto $7.
The high standards required for exportmarkets also have implications for domesticmarkets. Most exporting countries do not havenational standards for food safety. India, forexample, does not have a quality standard forseafood for its own domestic consumers. Underthe WTO Agreement on Sanitary and Phytosani-tary Measures, however, members are requiredto establish equivalence in the regulations andregulatory processes between importing andexporting nations. For the developed importingnations, this does not represent a problem, sincethe requirements for importing are normally justan extension of their domestic standards. Manydeveloping countries will, however, need tointroduce new systems.
Developing such systems is a nationalresponsibility. But poorer countries should alsobe able to count on support from the developedcountries. This commitment is embodied inMillennium Development Goal 8, which aims todevelop global partnerships for developmentand especially to help build trade capacitytowards greater market access, particularly forthe LDCs.
Ecolabelling
In an effort to ensure that fish and fish productsoriginate from sustainable fisheries, a number ofcountries are now encouraging, or requiring,systems of ecolabelling. Japan, for example, usesecolabelling to control imports of tuna for thelucrative sashimi market. This aims to preventimports that come from illegal, unreported or
unregulated fishing vessels. The EU and the USare also in favour of ecolabelling and certifica-tion. As yet, however, there are no multilateralagreements on this issue, and it is not yet clear towhat extent such labelling systems come underthe WTO Agreement on Technical Barriers toTrade.
Developing countries are worried that evenvoluntary ecolabelling requirements wouldeffectively exclude imports from artisanal andsmall-scale fisheries. They have a number ofconcerns:
• Costs. Ecolabelling will add to the expensesfor the fishing industry, with no guaranteethat these increases will be offset by higherincomes for certified products.
• Loss of autonomy. Small-scale artisanalfishers are anxious that they will lose theirautonomy if they have to comply withstandards that are developed and applied byexternal agencies – standards that may nottake into account specific aspects of theirfisheries.
• Practicability. Certification is likely to begiven for a fishery in its entirety. Forexample, the ecolabelling programme ‘Fishfor Ever’, established in 1997 by the MarineStewardship Council, provides a label notto a firm, but to a whole industry, and thusrequires collaboration from all its fishingunits. In fact, one of the main problems inAsian fisheries is the conflict betweenbottom trawlers and other small-scale,passive-gear groups who compete for thesame space and resources. Cooperationacross fisheries is hard to achieve.
Even if ecolabelling systems could be app-lied, they might have perverse outcomes. If, forexample, certified fish commanded higher prices,this could intensify catching of those fish – espe-cially in fisheries where it is difficult to imposelimitations on fishing effort.43 On the other
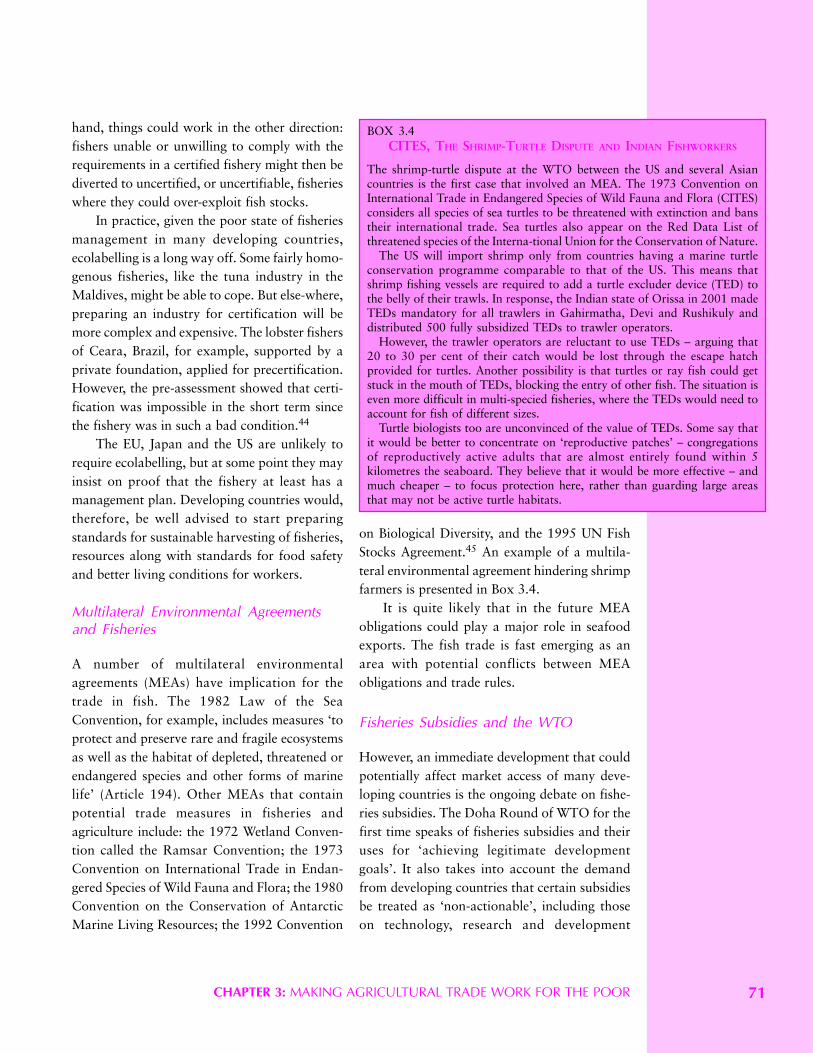
CHAPTER 3: MAKING AGRICULTURAL TRADE WORK FOR THE POOR 71
hand, things could work in the other direction:fishers unable or unwilling to comply with therequirements in a certified fishery might then bediverted to uncertified, or uncertifiable, fisherieswhere they could over-exploit fish stocks.
In practice, given the poor state of fisheriesmanagement in many developing countries,ecolabelling is a long way off. Some fairly homo-genous fisheries, like the tuna industry in theMaldives, might be able to cope. But else-where,preparing an industry for certification will bemore complex and expensive. The lobster fishersof Ceara, Brazil, for example, supported by aprivate foundation, applied for precertification.However, the pre-assessment showed that certi-fication was impossible in the short term sincethe fishery was in such a bad condition.44
The EU, Japan and the US are unlikely torequire ecolabelling, but at some point they mayinsist on proof that the fishery at least has amanagement plan. Developing countries would,therefore, be well advised to start preparingstandards for sustainable harvesting of fisheries,resources along with standards for food safetyand better living conditions for workers.
Multilateral Environmental Agreementsand Fisheries
A number of multilateral environmentalagreements (MEAs) have implication for thetrade in fish. The 1982 Law of the SeaConvention, for example, includes measures ‘toprotect and preserve rare and fragile ecosystemsas well as the habitat of depleted, threatened orendangered species and other forms of marinelife’ (Article 194). Other MEAs that containpotential trade measures in fisheries andagriculture include: the 1972 Wetland Conven-tion called the Ramsar Convention; the 1973Convention on International Trade in Endan-gered Species of Wild Fauna and Flora; the 1980Convention on the Conservation of AntarcticMarine Living Resources; the 1992 Convention
on Biological Diversity, and the 1995 UN FishStocks Agreement.45 An example of a multila-teral environmental agreement hindering shrimpfarmers is presented in Box 3.4.
It is quite likely that in the future MEAobligations could play a major role in seafoodexports. The fish trade is fast emerging as anarea with potential conflicts between MEAobligations and trade rules.
Fisheries Subsidies and the WTO
However, an immediate development that couldpotentially affect market access of many deve-loping countries is the ongoing debate on fishe-ries subsidies. The Doha Round of WTO for thefirst time speaks of fisheries subsidies and theiruses for ‘achieving legitimate developmentgoals’. It also takes into account the demandfrom developing countries that certain subsidiesbe treated as ‘non-actionable’, including thoseon technology, research and development
BOX 3.4CITES, THE SHRIMP-TURTLE DISPUTE AND INDIAN FISHWORKERS
The shrimp-turtle dispute at the WTO between the US and several Asiancountries is the first case that involved an MEA. The 1973 Convention onInternational Trade in Endangered Species of Wild Fauna and Flora (CITES)considers all species of sea turtles to be threatened with extinction and banstheir international trade. Sea turtles also appear on the Red Data List ofthreatened species of the Interna-tional Union for the Conservation of Nature.
The US will import shrimp only from countries having a marine turtleconservation programme comparable to that of the US. This means thatshrimp fishing vessels are required to add a turtle excluder device (TED) tothe belly of their trawls. In response, the Indian state of Orissa in 2001 madeTEDs mandatory for all trawlers in Gahirmatha, Devi and Rushikuly anddistributed 500 fully subsidized TEDs to trawler operators.
However, the trawler operators are reluctant to use TEDs – arguing that20 to 30 per cent of their catch would be lost through the escape hatchprovided for turtles. Another possibility is that turtles or ray fish could getstuck in the mouth of TEDs, blocking the entry of other fish. The situation iseven more difficult in multi-specied fisheries, where the TEDs would need toaccount for fish of different sizes.
Turtle biologists too are unconvinced of the value of TEDs. Some say thatit would be better to concentrate on ‘reproductive patches’ – congregationsof reproductively active adults that are almost entirely found within 5kilometres the seaboard. They believe that it would be more effective – andmuch cheaper – to focus protection here, rather than guarding large areasthat may not be active turtle habitats.
ASIA-PACIFIC HUMAN DEVELOPMENT REPORT 200672
funding, production diversification and develop-ment, and implementation of environmentallysound methods of production.
This is a vital issue for many developingcountries where small-scale fisheries are a crucialsource of livelihoods. Some have expressedreservations about discussing fisheries subsidiesat the WTO. Several small-island developingstates (SIDS), including Fiji, the SolomonIslands, Papua New Guinea and the Maldives,proposed ‘special and differential’ treatment infisheries for developing coastal states in generaland for SIDS in particular. The SIDS were alsothe first to attempt a broader definition of‘artisanal fishers’ and proposed that any newdisciplines on fisheries subsidies should exemptgovernment programmes aimed at raisingincome levels of artisanal fishers.
Phasing out subsidies designed to enhancecapacity will have major social implications forthe fisheries sector in several developingcountries and result in significant unemploymentin coastal fisheries. Ways of providing alterna-tive employment, either in fisheries or aquacul-ture or in other economic activities, have to beexplored. Any investments toward developingsuch alternatives should certainly be treated asnon-actionable subsidies.
Policy Directions for Agricultural Trade
Developing countries face some complex choicesfor policies on agricultural trade. They have toconsider the impact of such trade on differentgroups in the population, and examine especiallythe effect on the most vulnerable groups.
Most countries want to maximize exportsto earn the foreign exchange needed to financecritical imports. The choice is simpler for thosethat can produce enough food locally while alsobeing able to export commodities, includingfood, in order to earn foreign exchange. But evencountries that do not have enough good land orother agricultural resources to feed their own
populations could conclude that it is economi-cally more efficient to devote some of theseresources to high-value commercial crops forexport and then use the foreign exchange toimport food. This may seem rational from thepoint of view of economic efficiency, but it maybe irrational from the perspective of humandevelopment. For while increasing trade in thisway might boost economic growth – and benefitpoor consumers – it is also likely to depress localprices and undermine the livelihoods of poorfarmers.
Such a policy would also weaken nationalfood security. In principle, all countries should,if necessary, be able to buy food from worldmarkets. But in practice, most countries preferto reduce future vulnerability by sustainingdomestic production of staples. They may, there-fore, prefer to restrict liberalization, fearing thatan external shock, like a sharp increase in oilprices or a rise in interest rates, would leave themunable to import sufficient to meet nationalneeds.
These different circumstances and scenariosimply that each country is likely to have its ownpriorities, which will colour its stance in tradenegotiations. Exporters like Australia, NewZealand, Thailand and Viet Nam will favourmost elements of liberalization, whether thisconcerns widening market access, reducing sub-sidies or generally increasing competition. Othercountries will be more interested in limitingagricultural trade liberalization in order toensure food security and protect domestic liveli-hoods. These differences are understandable, sodonors or international agencies should resist thetemptation to straitjacket countries into a singlecommon policy on agricultural trade.
Nevertheless, even if all developing countryinterests do not fully coincide, they may overlapto a certain extent. As a result, there is usuallysome degree of solidarity in the developing-country camp. This suggests three general stra-tegies:
CHAPTER 3: MAKING AGRICULTURAL TRADE WORK FOR THE POOR 73
• Highlighting inconsistency by the developedcountries. The richer countries are oftendemanding greater access to markets in thedeveloping countries while also demandingthe right to protect their own farmers;
• Protecting sensitive products. Agreementsshould include safeguard measures, especi-ally for ‘sensitive’ products, in order toprotect livelihoods and ensure food security;
• Arguing for differential treatment. Develop-ing countries believe that they, and thepoorest countries in particular, should beable to count on a degree of differentialtreatment.
In these circumstances, a number of deve-loping countries will need to maintain agricul-tural tariffs to protect their small farmers andensure that they can still compete on localmarkets. But at the same time, they muststrengthen the future position of such farmersthrough land reforms and investment in ruraldevelopment infrastructure, processing andstorage facilities and inputs and, where neces-sary, offer price support. This may seem toprivilege farmers over poor urban consumers,and therefore, governments should also ensurethe availability of basic foods at affordableprices – which implies a continuing role for statetrading enterprises or the establishment oftargeted safety nets.
But there can be no ideal common package.Each country will have to fashion its own set ofpolicies, depending on whether it is a foodimporter or exporter, on the mix of small andcommercial farmers and the competing demandsof rural and urban areas. No cookie-cutter set ofrules will meet the human development needsof all.
Harnessing Intellectual Property
For intellectual property protection, much moreresearch has gone into the legal and adminis-
trative aspects than into its economic benefits.Indeed, the TRIPS agreement itself was drawnup with ‘remarkably little analysis of its expectedeconomic impacts’.46 This could be costly fordeveloping countries. For most poor countries,this would represent a substantial proportion ofthe development budget and might more fruit-fully be invested elsewhere. Again, however,there can be no standard model of IPR protec-tion; countries will choose the model thatmatches their resources and their developmentprospects and fears over costs.
Geographical Indications
There is a much stronger case for strengtheningprotection for well-known GIs – which tends tocost less than protecting Intellectual PropertyRights.47 For most Asian countries that areembarking on this enterprise, the first task is anational effort, ideally at the grassroots, tocatalogue what they have and what they mightwish to protect and develop. This would includefoods, beverages, clothing and crafts, forexample, as well as bioresources like plants,herbs and trees.
They should also estimate the value of out-put and how it could increase, given sufficientlegal, marketing and technological investments.They should also be able to indicate how manypeople will benefit from the increased output,disaggregated by gender, ethnicity, and income-group.
A Fisheries Policy Framework
Just as developing countries, and particularly theLDCs, should have some leeway for protectingtheir poorest farmers, they should also be ableto protect fishing communities. This woulddemand action from both the importing and theexporting countries. The importing developedcountries would need to avoid support orsubsidies on exports to their own producers, and

ASIA-PACIFIC HUMAN DEVELOPMENT REPORT 200674
resist efforts to protect them from fair compe-tition from developing countries.
But much more also needs to be done in thedeveloping countries that export fish. First, theyneed to introduce management measures toprevent fisheries in their national waters frombeing overfished or fished to their biologicallimits. This would include regulations on mini-mum mesh sizes, establishing closed areas/seasons, and prohibitions on catching certainspecies and listing species that cannot beexported below a minimum size. In some cases itshould also be possible to redirect the fishingeffort to other areas. A number of Asia-Pacificcountries are already taking such steps, but theseneed to be generalized and strengthened.
A second option is to produce more of theoutput through aquaculture. China, forexample, has a zero-growth policy for marinecapture from its inshore and offshore waters andintends to further boost output from aquacultureand distant water fishing. But because aquacul-ture can be environmentally destructive, Chinahas also introduced what it calls ‘ecologicalaquaculture’, to incorporate principles of naturaland social ecology, planning for ‘communitydevelopment and concerns for the wider social,economic, and environmental contexts of aqua-culture’.48
Other priority fisheries areas are:
• Food safety standards. Develop effectiveand enforceable national food safety stan-dards and establish their equivalence withthose prevailing in import markets. For thispurpose, the LDCs in particular should beable to rely on international developmentassistance.
• Catch certification. As a precursor to inter-national ecolabelling schemes, some deve-loping countries should be able to embarkon national certification programmes –pooling the efforts of national- or state-levelfisheries authorities, together with fish-
worker organizations and the scientificcommunity. With this experience, Asiancountries could be involved in establishingan ISO Technical Committee on fisheriesthat could work towards an international‘ecolabel’ protocol.
• Negotiations on subsidies. In the long run,subsidies should be phased out in mostcountries. But in the WTO debates onsubsidies the Asian countries should pressfor this to happen more rapidly in thedeveloped and higher-income developingcountries. For capacity-enhancing subsidies– they could argue for complete exemptionfor the LDCs.
Policy Priorities
In summary, the key areas for policy are asfollows:
1. Ensure a consistent focus on agriculture.Most of the world’s poorest depend onagriculture and on access to secure suppliesof food. Effective policies on agriculturaltrade are, therefore, crucial to humandevelopment and should be kept at theforefront of public debate.
2. Promote solidarity among developingcountries. In agricultural trade, developingcountries have many interests in common.They can unite, for example, in exposing theinconsistencies of developed country poli-cies. They can also together argue for diffe-rential treatment for the most vulnerablecountries, especially LDCs. And as a groupthey will want to ensure stable prices forfood and non-food agricultural products.
3. Accommodate different national interests.Each country must, however, also fashion itsown set of policies, depending on whether itis a net food importer or exporter, forexample, on the mix of small and commer-cial farmers and on the competing demands
CHAPTER 3: MAKING AGRICULTURAL TRADE WORK FOR THE POOR 75
of rural and urban areas. These inherentdifferences and conflicts of interest need tobe recognized and discussed in an open andtransparent fashion at national andinternational levels.
4. Promote the interests of the poor. Tradeliberalization is not an end in itself; it is ofvalue only if it benefits the poor. Tradepolicy must, therefore, incorporate a com-prehensive range of instruments, includingtariffs and various types of support forweaker groups. Without this more inclusiveapproach, public support for any type ofliberalization is likely to collapse andprovoke wide-scale protectionism.
5. Harness geographical indications andintellectual property rights. One priorityshould be to establish and protectGeographical Indications, thoroughlycataloguing national assets and the benefitsthat can be derived from them. Somedeveloping countries could also create
national systems for protecting intellectualproperty rights, though for many this couldprove too expensive.
6. Reform national fisheries. Developingcountries need to defend the interests ofsmall-scale fishing communities andpromote sustainable fisheries in both marinecapture and aquaculture, through moreeffective management. But they also need torespond to current and future internationaldevelopments by establishing food safetystandards, for example, and developing newforms of catch certification.
7. Invest in rural development. In the longterm, international agricultural trade islikely to increase. Developing countriesshould, therefore, help rural communities tobe more resilient, by promoting equitablerural development through land reform andcarrying out other measures that increaseproductivity with equity while promotinghuman development.

CHAPTER 4: ADJUSTING TO A NEW ERA FOR TEXTILES AND CLOTHING 79
Developing countries now account for half of theworld’s exports of textiles and almost three-quarters of exports of clothing.1 This representsa dramatic turnaround: the sector used to bedominated by the developed countries, but bythe 1980s the developing countries had over-taken them and now rely on textiles and clothing(T&C) for a substantial proportion of theirindustrial production and employment.
Many economies in East and South-EastAsia have been very prominent in this trade,using the T&C sectors as industrial launchingpads: Hong Kong (China), Singapore, Taiwan(China), the Republic of Korea, and Malaysialed the way, to be followed later by China, VietNam, Thailand, and Indonesia.
Even this expansion falls far short of the fullpotential. The developed countries, worriedabout the speed of the decline in their ownindustries, had established strict quotas bycountry on imports from developing countries.Under the auspices of the GATT in 1962 theynegotiated a Long-Term Arrangement Regard-ing International Trade in Cotton Textiles andSubstitutes, which was extended in 1974 tobecome the Multifibre Arrangement (MFA).This reduced aggregate imports and restrictedexports from large producers such as China andIndia, but it also benefited smaller countries suchas Bangladesh and Nepal, whose quotas weresufficient for them to establish new industries.
Many countries in Asia, like the developed countries before them, embarked on large-scale trading in industrial goods through textiles and clothing. And from the 1960sseveral poorer countries in the region were able to capitalize on a quota system thatoffered preferential access to markets in developed countries. Now that era is over, anda number of countries are struggling to adjust to the prospect of fierce competition,particularly from China.
Chapter
Adjusting to a New Era forTextiles and Clothing
4
The outcome was a highly dispersed T&Cindustry that provided employment forthousands of disadvantaged and lower-skilledworkers all across the region. Women in parti-cular seized these new opportunities. Even intraditionally secluded societies, many morewomen were able to enter the workforce. Thiscould be an empowering experience: for the firsttime many women had independent incomes anda greater say in household decision-making.Apart from promoting gender equality, thisbrought positive benefits for society as a whole– as women were more likely to use this newincome to invest in the education and health oftheir families.
These new industries also brought widereconomic benefits. They gave the exportingeconomies the opportunities to acquire newskills and raise productivity and also diffusedknowledge and technology and stimulated otherindustries and services that grew up around thenew factories and their workforces. A healthytextiles and clothing sector in a country has beenshown by cross-national statistical analysis to beassociated with a higher-than-average income.2
But this economic advance also had socialcosts. Working conditions in the T&C sector canbe harsh and exploitative. The demand forclothing is seasonal and unpredictable, so theindustry employs a high proportion of its work-force on a part-time or piece-rate basis without
Developingcountries now
account for halfthe world’sexports of
textiles andalmost three-
quarters ofexports of
clothing

ASIA-PACIFIC HUMAN DEVELOPMENT REPORT 200680
offering job contracts or health or other employ-ment benefits. Women have been especiallyvulnerable: they might have gained a degree ofindependence by working outside the home, butthey often face discrimination within thefactories being paid less than men and obliged totake non-managerial jobs with little opportunityto enhance their skills.
Now the era of quotas has come to an end,and the global T&C sector is in the midst of adramatic upheaval. The smaller exportingcountries can no longer rely on the quota regimethat favoured them for 40 years and are exposedto much tougher international competition. Thischapter examines the implications of thesechanges and explores ways in which the textilesand clothing sector can better contribute tohuman development.
Trends in Global Trade inTextiles and Clothing
Over the past 40 years the global trade in textilesand clothing has grown 60-fold. Between 1962and 2004, it increased from $6 billion per yearto over $450 billion (Table 4.1). Today, textilesand clothing is one of the most dynamic productsectors, representing about 7 per cent of totalworld exports of manufactures. Clothing is thelarger of the two, representing 57 per cent oftotal T&C trade. It is also growing faster:between 1997 and 2004 textiles exports grewon average by only 3 per cent per year butclothing exports grew by about 6 per cent.3
This trade is also strikingly international:around 130 countries produce and exporttextiles or clothing. However, fewer countrieshave substantial imports, around 30, the largestbeing the United States, the EU and Japan.4,5
Shifts in the Pattern of Exports
The most rapid shift in the balance of exportsoccurred between the early 1980s and 2000.Over this period, the developing countries’ sharein world textile exports increased from 8 to 46per cent, and their share in world clothingexports increased from 9 to 60 per cent.6 By theearly 2000s, not only did the value of developingcountries exports in textile and clothingincreased, but also transition economies beganto register a presence on the global scene (Figure4.1). The leading developing-country exportersof clothing are China, Hong Kong (China),Mexico, India, Bangladesh and Indonesia. Fortextiles, the leading developing country expor-ters are China, Hong Kong (China), Taiwan(China), India and Pakistan.
Recent trends for major exporting countriesare summarized in Table 4.2 and 4.3. Theseshow, for example, that the developed countriesmaintain a strong interest in this sector; indeed,in textiles they still have the edge since
TABLE 4.1WORLD TEXTILES AND CLOTHING EXPORTS ($ MILLIONS)
Years Textiles Clothing Total T&C
1980 54,990 40,590 95,5801990 104,354 108,129 212,4832000 154,180 197,029 351,2092002 152,151 200,851 353,0022003 169,000 226,000 395,0002004 195,000 258,000 453,000
Source: UN Comtrade and WTO 2002b, 2003a, 2004, 2005a.
Figure 4.1: Shifts in the pattern of global exports 1990-2002
Source: UN Comtrade.
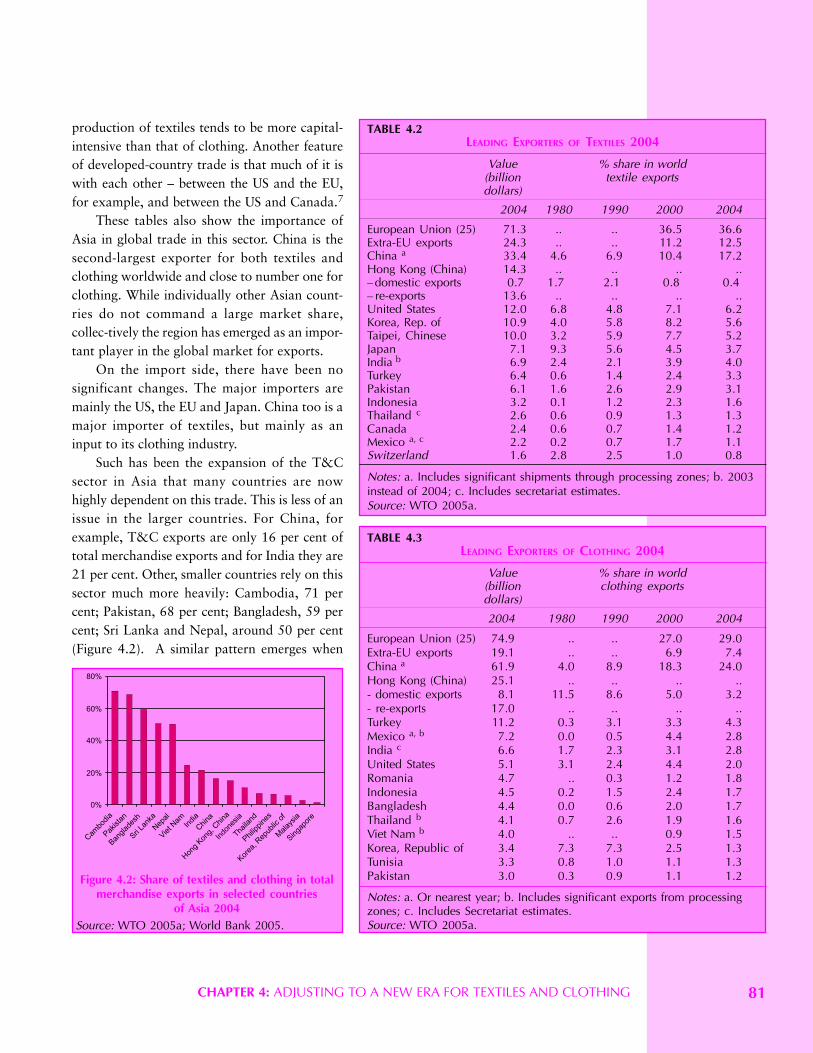
CHAPTER 4: ADJUSTING TO A NEW ERA FOR TEXTILES AND CLOTHING 81
production of textiles tends to be more capital-intensive than that of clothing. Another featureof developed-country trade is that much of it iswith each other – between the US and the EU,for example, and between the US and Canada.7
These tables also show the importance ofAsia in global trade in this sector. China is thesecond-largest exporter for both textiles andclothing worldwide and close to number one forclothing. While individually other Asian count-ries do not command a large market share,collec-tively the region has emerged as an impor-tant player in the global market for exports.
On the import side, there have been nosignificant changes. The major importers aremainly the US, the EU and Japan. China too is amajor importer of textiles, but mainly as aninput to its clothing industry.
Such has been the expansion of the T&Csector in Asia that many countries are nowhighly dependent on this trade. This is less of anissue in the larger countries. For China, forexample, T&C exports are only 16 per cent oftotal merchandise exports and for India they are21 per cent. Other, smaller countries rely on thissector much more heavily: Cambodia, 71 percent; Pakistan, 68 per cent; Bangladesh, 59 percent; Sri Lanka and Nepal, around 50 per cent(Figure 4.2). A similar pattern emerges when
TABLE 4.2LEADING EXPORTERS OF TEXTILES 2004
Value % share in world(billion textile exportsdollars)
2004 1980 1990 2000 2004
European Union (25) 71.3 .. .. 36.5 36.6Extra-EU exports 24.3 .. .. 11.2 12.5China a 33.4 4.6 6.9 10.4 17.2Hong Kong (China) 14.3 .. .. .. ..– domestic exports 0.7 1.7 2.1 0.8 0.4– re-exports 13.6 .. .. .. ..United States 12.0 6.8 4.8 7.1 6.2Korea, Rep. of 10.9 4.0 5.8 8.2 5.6Taipei, Chinese 10.0 3.2 5.9 7.7 5.2Japan 7.1 9.3 5.6 4.5 3.7India b 6.9 2.4 2.1 3.9 4.0Turkey 6.4 0.6 1.4 2.4 3.3Pakistan 6.1 1.6 2.6 2.9 3.1Indonesia 3.2 0.1 1.2 2.3 1.6Thailand c 2.6 0.6 0.9 1.3 1.3Canada 2.4 0.6 0.7 1.4 1.2Mexico a, c 2.2 0.2 0.7 1.7 1.1Switzerland 1.6 2.8 2.5 1.0 0.8
Notes: a. Includes significant shipments through processing zones; b. 2003instead of 2004; c. Includes secretariat estimates.Source: WTO 2005a.
TABLE 4.3LEADING EXPORTERS OF CLOTHING 2004
Value % share in world(billion clothing exportsdollars)
2004 1980 1990 2000 2004
European Union (25) 74.9 .. .. 27.0 29.0Extra-EU exports 19.1 .. .. 6.9 7.4China a 61.9 4.0 8.9 18.3 24.0Hong Kong (China) 25.1 .. .. .. ..- domestic exports 8.1 11.5 8.6 5.0 3.2- re-exports 17.0 .. .. .. ..Turkey 11.2 0.3 3.1 3.3 4.3Mexico a, b 7.2 0.0 0.5 4.4 2.8India c 6.6 1.7 2.3 3.1 2.8United States 5.1 3.1 2.4 4.4 2.0Romania 4.7 .. 0.3 1.2 1.8Indonesia 4.5 0.2 1.5 2.4 1.7Bangladesh 4.4 0.0 0.6 2.0 1.7Thailand b 4.1 0.7 2.6 1.9 1.6Viet Nam b 4.0 .. .. 0.9 1.5Korea, Republic of 3.4 7.3 7.3 2.5 1.3Tunisia 3.3 0.8 1.0 1.1 1.3Pakistan 3.0 0.3 0.9 1.1 1.2
Notes: a. Or nearest year; b. Includes significant exports from processingzones; c. Includes Secretariat estimates.Source: WTO 2005a.
Figure 4.2: Share of textiles and clothing in totalmerchandise exports in selected countries
of Asia 2004Source: WTO 2005a; World Bank 2005.
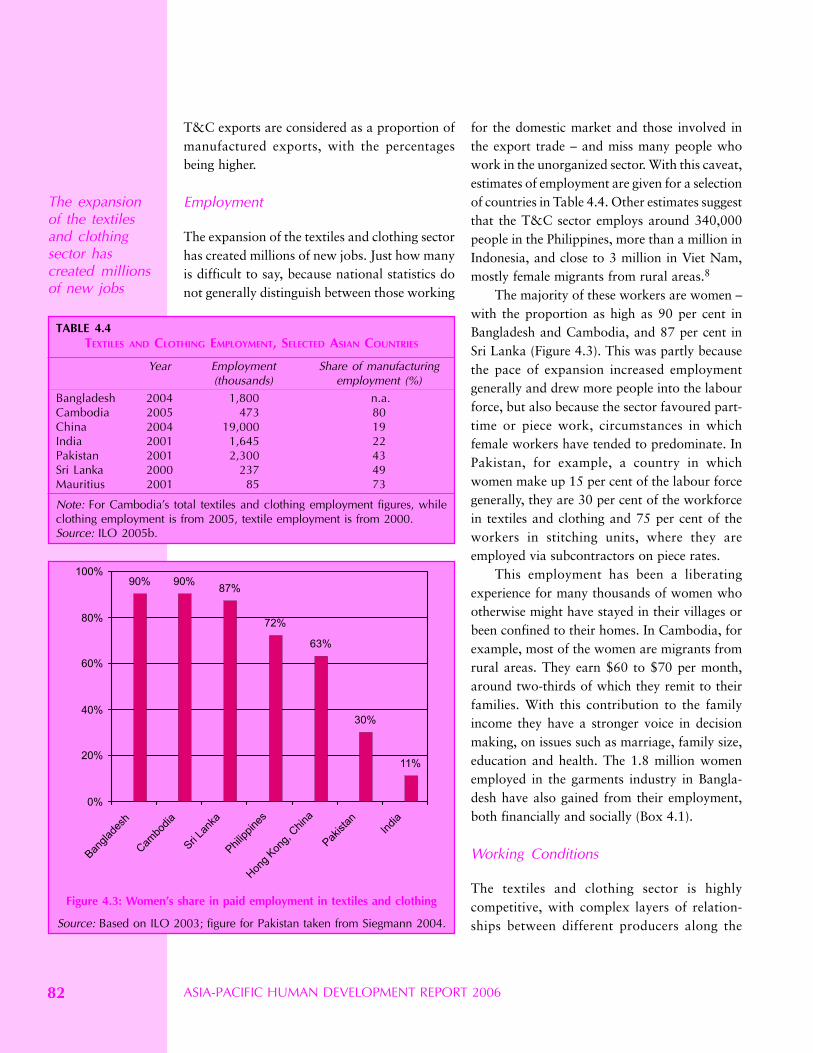
ASIA-PACIFIC HUMAN DEVELOPMENT REPORT 200682
T&C exports are considered as a proportion ofmanufactured exports, with the percentagesbeing higher.
Employment
The expansion of the textiles and clothing sectorhas created millions of new jobs. Just how manyis difficult to say, because national statistics donot generally distinguish between those working
for the domestic market and those involved inthe export trade – and miss many people whowork in the unorganized sector. With this caveat,estimates of employment are given for a selectionof countries in Table 4.4. Other estimates suggestthat the T&C sector employs around 340,000people in the Philippines, more than a million inIndonesia, and close to 3 million in Viet Nam,mostly female migrants from rural areas.8
The majority of these workers are women –with the proportion as high as 90 per cent inBangladesh and Cambodia, and 87 per cent inSri Lanka (Figure 4.3). This was partly becausethe pace of expansion increased employmentgenerally and drew more people into the labourforce, but also because the sector favoured part-time or piece work, circumstances in whichfemale workers have tended to predominate. InPakistan, for example, a country in whichwomen make up 15 per cent of the labour forcegenerally, they are 30 per cent of the workforcein textiles and clothing and 75 per cent of theworkers in stitching units, where they areemployed via subcontractors on piece rates.
This employment has been a liberatingexperience for many thousands of women whootherwise might have stayed in their villages orbeen confined to their homes. In Cambodia, forexample, most of the women are migrants fromrural areas. They earn $60 to $70 per month,around two-thirds of which they remit to theirfamilies. With this contribution to the familyincome they have a stronger voice in decisionmaking, on issues such as marriage, family size,education and health. The 1.8 million womenemployed in the garments industry in Bangla-desh have also gained from their employment,both financially and socially (Box 4.1).
Working Conditions
The textiles and clothing sector is highlycompetitive, with complex layers of relation-ships between different producers along the
The expansionof the textilesand clothingsector hascreated millionsof new jobs
TABLE 4.4TEXTILES AND CLOTHING EMPLOYMENT, SELECTED ASIAN COUNTRIES
Year Employment Share of manufacturing(thousands) employment (%)
Bangladesh 2004 1,800 n.a.Cambodia 2005 473 80China 2004 19,000 19India 2001 1,645 22Pakistan 2001 2,300 43Sri Lanka 2000 237 49Mauritius 2001 85 73
Note: For Cambodia’s total textiles and clothing employment figures, whileclothing employment is from 2005, textile employment is from 2000.Source: ILO 2005b.
Figure 4.3: Women’s share in paid employment in textiles and clothing
Source: Based on ILO 2003; figure for Pakistan taken from Siegmann 2004.
CHAPTER 4: ADJUSTING TO A NEW ERA FOR TEXTILES AND CLOTHING 83
BOX 4.1FEMALE EMPLOYMENT IN THE BANGLADESH GARMENTS INDUSTRY
value chain, and employers are under constantpressure to cut costs. This has frequently led to avery exploitative and hazardous working envi-ronment, including excessively long hours, lackof freedom of association, continuous exposureto toxic substances and the prohibition of restbreaks9 – well-illustrated by the treatment ofgarment workers in some Delhi production units(Box 4.2). In addition to poor working condi-tions, parts of the industry have a poor environ-
mental record. For instance, the textile industryuses solvents, pesticides, dyes and bleaches in itsproduction processes, but often makes littleeffort to treat effluents, leading to waterpollution.
Gender-related Disparities
Women are employed in large numbers in theT&C industry, but they are still far from being
The expansion of clothing exports from Bangladesh resulted inincreased employment opportunities for Bangladeshi women,who now comprise 80 per cent of the 1.8 million workforces inthe sector. Women’s incomes have effectively risen, as their dailywage rates in the garments industry are twice as high as theagricultural and construction wages. As with all femaleemployment, there are positive ripple effects on the family:Women employed in export-oriented garment productioncontribute around 46 per cent to the family income, and theirearnings have been instrumental in keeping a large number oftheir families above the poverty level. Also, by having somecontrol over part of their income, women invest in health,education, and tend to save more.
Rising incomes in this industry have also had a positive effecton women’s education levels: survey results show that 78 per centof women had at least one year of formal schooling in 1997,compared to 65 per cent in 1990 (Paul-Majumder and Begum2000). Economic independence and opportunities to improveeducational levels have increased their empowerment within thehousehold (Bhattarcharya and Rahman 1999).
Nevertheless, within the industry, women are still subject togender discrimination:
Wage Disparities. Even though nominal as well as real wages in
the T&C sector have increased over the last 20 years, womenhave benefited substantially less than men. Wages have risen mostfor skilled workers, who are usually men. Between 1990 and1997, the gender-related wage gap widened: Female wages fellfrom the equivalent of 66 per cent of male wages in 1990 to 59per cent in 1997. Even after controlling for skills, the gender-related wage gap persisted.
Assignment to Lower-skilled Jobs. Women are typically employedin the lower-skilled jobs, as production workers or helpers,with few prospects of transition to higher-skilled andbetter-paid positions in the supervisory or managerialfields. Moreover, women workers often are bypassed whennew technologies are introduced, as they are not trained to usethem.
Medical Benefits and Leave. Survey results also reveal thatwomen do not receive medical treatment for about 40 per cent ofillnesses and diseases afflicting them, while for men theproportion is 33 per cent. Only 35 per cent of female workerswho asked for it were granted paid leave, compared to 60 percent of male workers.
Source: Tran-Nguyen and Zampetti 2004.
BOX 4.2SWEATSHOP CONDITIONS IN DELHI’S GARMENTS INDUSTRY
In north India, an overwhelming 90 per cent of the garment unitsproducing for the export market are located in the Delhimetropolitan area. These units employ nearly 103,000 workers –6 per cent of the total industry workforce – and in 2001 theycontributed 35 per cent to the country’s earnings from garmentexports.
The industry is highly diverse. Large mechanized factoriesproducing standardized products coexist with a wide network ofsubcontractors producing labour-intensive items, only 20 per centof which are registered in the ‘formal’ sector. Irrespective ofwhether they are large factories or smaller karkhanas
(workshops), these units try to offset the high overheads bycutting operating costs. They are run like sweatshops, whereworkers are bound by informal contracts, have to work longhours with limited break, and use outdated machinery. Costs arekept low by keeping wages low and circumventing the obligationsrequired of employers in the formal sector. Flexible productionsystems have also led the de-skilling of workers, which haseffectively weakened the traditional caste-based system of skillformation.
Source: Verma, 2004.
ASIA-PACIFIC HUMAN DEVELOPMENT REPORT 200684
treated on a par with their male counterparts(Box 4.1). In most countries women are paid lessthan male workers for the same work, and theyare usually employed on the lower-skilled, andconsequently lower-paid, rungs of the industry,such as weaving and spinning, with few oppor-tunities for skill enhancement. Even in the SriLankan industry, where gender-related wage dis-parities are not as high, female workers endureother forms of hardship such as harassment,problems in commuting to and from work, andthe dual responsibilities of family and work.
Women workers are also subject to otherforms of maltreatment. In India, for example, asmore women enter the labour force there seemsto have been a rise in domestic violence. In somepatriarchal societies this could be becausewomen who move beyond their domestic role tobecome family breadwinners are perceived asthreats. Even outside their family and social
settings, female workers have often been thevictims of exploitation, oppression and harass-ment at their workplace.
A Changing Trade Regime
The Multifibre Arrangement (MFA) controlledimports of textiles and clothing by assigningquotas for exporting countries. Large producerssuch as China and India soon reached the limitof their quotas, but a number of other countriesfound themselves with quotas they were notfilling, and developed T&C industries to takeadvantage of them. The Philippines, forexample, which had not previously been asignificant exporter, rapidly expanded itsindustry, which by 2004 was sending more than80 per cent of its total garment exports to quotamarkets in Europe and the US. LDCs such asBangladesh and Cambodia had a furtheradvantage, since their LDC status entitled themto both quota-free and duty-free access to theEU (Box 4.3).
That era is now over. As a result of pressurefrom some of the larger exporting countries, aswell as from retailers in the importing countries,the WTO in 1994 set up the Agreement onTextiles and Clothing (ATC), under which from1995 onwards, the MFA quota restrictionswould be lifted in a series of stages. By 31December 2004, quotas in product categories ofinterest to poor-country exporters disappearedcompletely, and textiles and clothing were fullyintegrated into the WTO system of free trade.10
However, the full force of the ATC has beenoffset by number of factors that have continuedto constrain imports from some Asian countries:
Protection from disruption by China. WhenChina entered the WTO in 2001, the accessionagreement included a safeguard to protectimporting countries from possible ‘marketdisruptions’. This allowed importing countriesto request a ‘restraint limit’ that would be in
BOX 4.3LDCS: MAJOR BENEFICIARIES OF THE MULTIFIBRE ARRANGEMENT
The Multifibre Arrangement was particularly advantageous to a number ofLDCs.
Bangladesh. From 1981 onwards the Bangladeshi garment industry grew at20 per cent per year, with the number of producing units increasing from 70to around 3,000. Garment exports which in 1983 accounted for 3.9 per centof total exports, by 2002 had reached 86 per cent.
Nepal. The Nepali clothing industry grew as a direct result of restraints onIndian exports. Garment exports were the most lucrative export items andbrought in $162 million in 2003, although this declined by 18 per cent in thefirst eight months of 2004 (EIU 2004). At its peak in the early 1990s, theNepali textile sector employed more than 100,000 people.
Cambodia. Over the past decade the quota regime for garment exportsallowed Cambodia to become one of the fastest-growing garment exporters:between 1995 and 2003, export earnings rose from $26 million to $1.6billion, by which time they accounted for 90 per cent of the country’smerchandise exports. The industry has become the largest sectoral employerin the country. Around 90 per cent of workers are from rural areas.Remittances are typically around two-thirds of their monthly incomes of $60-70. These remittances have had a tremendous impact on rural poverty, asthey often are the family’s only source of cash, and help generate peripheraland supporting jobs in the rural areas. As 90 per cent of the workers in thesefactories are women, the expansion of this industry has also had anempowering effect.
CHAPTER 4: ADJUSTING TO A NEW ERA FOR TEXTILES AND CLOTHING 85
place until the end of 2008. This applied to allproducts, but the effect was likely to be greatestfor textiles and clothing.
Import tariffs. The importing countries nolonger apply quotas, but they do discriminatebetween exporting countries through tariffs.This is a powerful tool, because tariffs are farhigher on textiles and clothing than for otherindustrial products. In the US, for example, theaverage industrial tariff is 3.5 per cent but fortextiles and clothing it is 14.6 per cent. For theEU the figures are 3.6 and 9.1 per cent respec-tively, and for Japan 1.7 and 7.6 per cent. How-ever, the importing countries offer concessionson these tariffs to certain favoured countries.The US, for example, offers lower tariffs tocountries in the North American Free TradeAgreement (NAFTA) and the Central AmericanFree Trade Agreement (CAFTA), and also offerspreferential rates to a number of Africancountries through the African Growth andOpportunity Act (AGOA). The EU similarlyoffers tariff-free entry to exports from allmember countries, which includes severalCentral and East European countries that pro-duce textiles and clothing. Also, through itsEverything But Arms Agreement (EBA), the EUoffers tariff-free access to goods from all LDCs.
Anti-Dumping Legislation. Importing countriesmay also decide to stop imports from countriesthat appear to be off-loading goods at very lowprices, even below the cost of production. TheEU, for example, has repeatedly initiated anti-dumping measures. Between 1993 and 1998 ittook action against cotton fabric items fromIndia, Indonesia and Pakistan. Often such actionhas been based on spurious information.11 Itseems unlikely that such actions will diminishfollowing the removal of quotas.12
Technical barriers. Countries can also introducenew technical standards. The clauses in the
Uruguay Round leave considerable scope forambiguity, saying merely that technical stan-dards have to be applied in a way that does notprove to be discriminatory between foreign anddomestic buyers. So far, however, there does notseem to have been any increase in their use forprotectionism.13
Winners and Losers
The changes to the international trade regime,and the range of ways in which importing coun-tries can shape the pattern of imports, havecreated uncertainty in the global textiles andclothing industry. Among the winners in this newenvironment are the T&C buyers in the import-ing countries, who now have greater freedom tosource from countries or suppliers that offer thebest combination of price, quality and speed ofdelivery. Also likely to gain are the larger export-ing countries that previously were constrainedby quotas; here the more efficient producersshould be able to expand their operations –employing more people and benefitingconsumers through lower prices.
The losers will be some of the smallercountries that exploited quotas within the MFA.While they might have been able to takeadvantage of the window of opportunity, theirtextiles and clothing industries may still not beinternationally competitive, so they are likely tolose export markets – with severe economicramifications for employment and incomes.
A number of studies have attempted toassess the overall impact of this new environ-ment. They differed in a number of respects, butthey did agree that overall there would be anincrease in exports from Asia and that thebenefits would be shared unequally. The mainwinners would be China and India, which werein a position to deliver competitively at everylevel of price and quality. The losers wouldinclude the smaller exporting countries, whichhad benefited from the quota.
Among thewinners are theT&C buyers inthe importing
countries. Alsolikely to gainare the larger
exportingcountries that
previously wereconstrained by
quotas. Thelosers will be
some of thesmaller
countries thatexploited quotaswithin the MFA
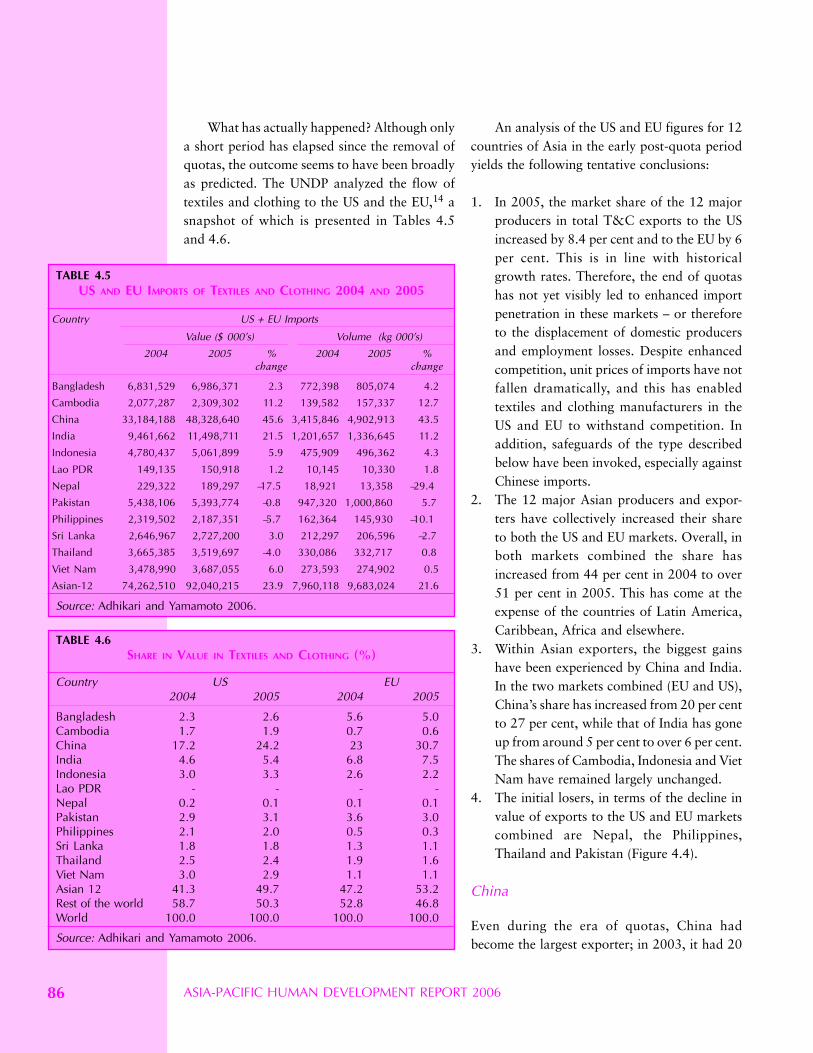
ASIA-PACIFIC HUMAN DEVELOPMENT REPORT 200686
What has actually happened? Although onlya short period has elapsed since the removal ofquotas, the outcome seems to have been broadlyas predicted. The UNDP analyzed the flow oftextiles and clothing to the US and the EU,14 asnapshot of which is presented in Tables 4.5and 4.6.
An analysis of the US and EU figures for 12countries of Asia in the early post-quota periodyields the following tentative conclusions:
1. In 2005, the market share of the 12 majorproducers in total T&C exports to the USincreased by 8.4 per cent and to the EU by 6per cent. This is in line with historicalgrowth rates. Therefore, the end of quotashas not yet visibly led to enhanced importpenetration in these markets – or thereforeto the displacement of domestic producersand employment losses. Despite enhancedcompetition, unit prices of imports have notfallen dramatically, and this has enabledtextiles and clothing manufacturers in theUS and EU to withstand competition. Inaddition, safeguards of the type describedbelow have been invoked, especially againstChinese imports.
2. The 12 major Asian producers and expor-ters have collectively increased their shareto both the US and EU markets. Overall, inboth markets combined the share hasincreased from 44 per cent in 2004 to over51 per cent in 2005. This has come at theexpense of the countries of Latin America,Caribbean, Africa and elsewhere.
3. Within Asian exporters, the biggest gainshave been experienced by China and India.In the two markets combined (EU and US),China’s share has increased from 20 per centto 27 per cent, while that of India has goneup from around 5 per cent to over 6 per cent.The shares of Cambodia, Indonesia and VietNam have remained largely unchanged.
4. The initial losers, in terms of the decline invalue of exports to the US and EU marketscombined are Nepal, the Philippines,Thailand and Pakistan (Figure 4.4).
China
Even during the era of quotas, China hadbecome the largest exporter; in 2003, it had 20
TABLE 4.6SHARE IN VALUE IN TEXTILES AND CLOTHING (%)
Country US EU2004 2005 2004 2005
Bangladesh 2.3 2.6 5.6 5.0Cambodia 1.7 1.9 0.7 0.6China 17.2 24.2 23 30.7India 4.6 5.4 6.8 7.5Indonesia 3.0 3.3 2.6 2.2Lao PDR - - - -Nepal 0.2 0.1 0.1 0.1Pakistan 2.9 3.1 3.6 3.0Philippines 2.1 2.0 0.5 0.3Sri Lanka 1.8 1.8 1.3 1.1Thailand 2.5 2.4 1.9 1.6Viet Nam 3.0 2.9 1.1 1.1Asian 12 41.3 49.7 47.2 53.2Rest of the world 58.7 50.3 52.8 46.8World 100.0 100.0 100.0 100.0
Source: Adhikari and Yamamoto 2006.
TABLE 4.5US AND EU IMPORTS OF TEXTILES AND CLOTHING 2004 AND 2005
Country US + EU Imports
Value ($ 000’s) Volume (kg 000’s)
2004 2005 % 2004 2005 %change change
Bangladesh 6,831,529 6,986,371 2.3 772,398 805,074 4.2
Cambodia 2,077,287 2,309,302 11.2 139,582 157,337 12.7
China 33,184,188 48,328,640 45.6 3,415,846 4,902,913 43.5
India 9,461,662 11,498,711 21.5 1,201,657 1,336,645 11.2
Indonesia 4,780,437 5,061,899 5.9 475,909 496,362 4.3
Lao PDR 149,135 150,918 1.2 10,145 10,330 1.8
Nepal 229,322 189,297 –17.5 18,921 13,358 –29.4
Pakistan 5,438,106 5,393,774 –0.8 947,320 1,000,860 5.7
Philippines 2,319,502 2,187,351 –5.7 162,364 145,930 –10.1
Sri Lanka 2,646,967 2,727,200 3.0 212,297 206,596 –2.7
Thailand 3,665,385 3,519,697 –4.0 330,086 332,717 0.8
Viet Nam 3,478,990 3,687,055 6.0 273,593 274,902 0.5
Asian-12 74,262,510 92,040,215 23.9 7,960,118 9,683,024 21.6
Source: Adhikari and Yamamoto 2006.
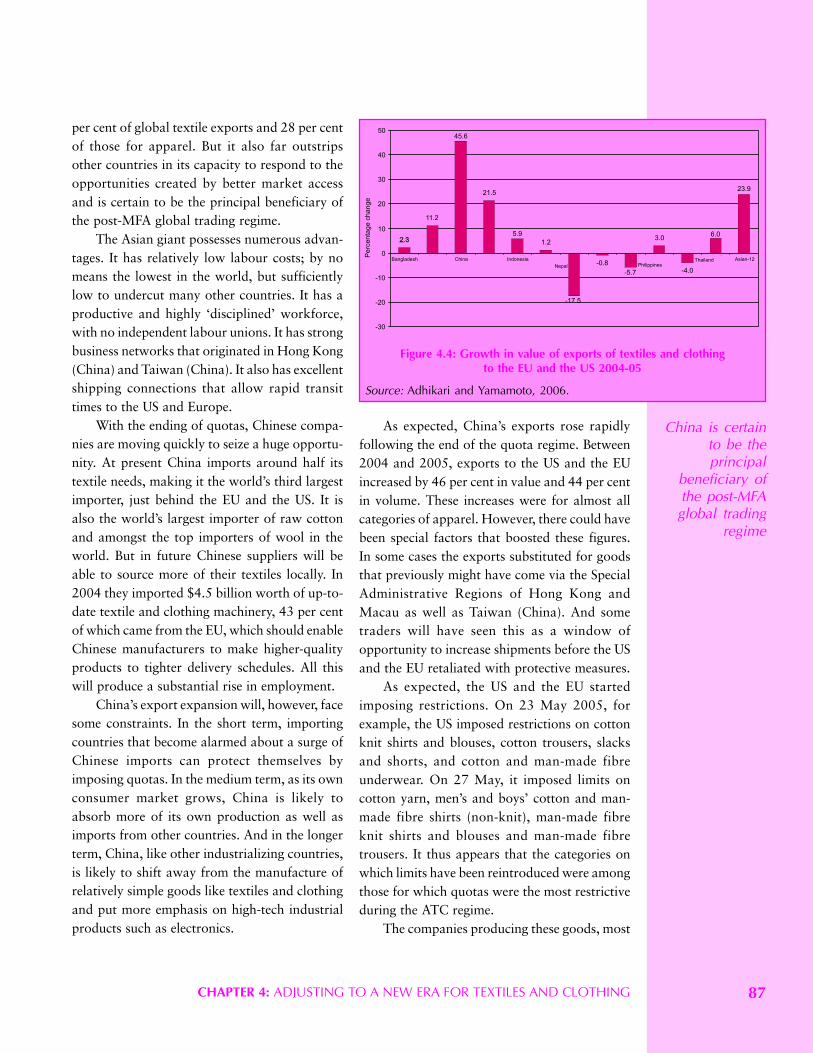
CHAPTER 4: ADJUSTING TO A NEW ERA FOR TEXTILES AND CLOTHING 87
per cent of global textile exports and 28 per centof those for apparel. But it also far outstripsother countries in its capacity to respond to theopportunities created by better market accessand is certain to be the principal beneficiary ofthe post-MFA global trading regime.
The Asian giant possesses numerous advan-tages. It has relatively low labour costs; by nomeans the lowest in the world, but sufficientlylow to undercut many other countries. It has aproductive and highly ‘disciplined’ workforce,with no independent labour unions. It has strongbusiness networks that originated in Hong Kong(China) and Taiwan (China). It also has excellentshipping connections that allow rapid transittimes to the US and Europe.
With the ending of quotas, Chinese compa-nies are moving quickly to seize a huge opportu-nity. At present China imports around half itstextile needs, making it the world’s third largestimporter, just behind the EU and the US. It isalso the world’s largest importer of raw cottonand amongst the top importers of wool in theworld. But in future Chinese suppliers will beable to source more of their textiles locally. In2004 they imported $4.5 billion worth of up-to-date textile and clothing machinery, 43 per centof which came from the EU, which should enableChinese manufacturers to make higher-qualityproducts to tighter delivery schedules. All thiswill produce a substantial rise in employment.
China’s export expansion will, however, facesome constraints. In the short term, importingcountries that become alarmed about a surge ofChinese imports can protect themselves byimposing quotas. In the medium term, as its ownconsumer market grows, China is likely toabsorb more of its own production as well asimports from other countries. And in the longerterm, China, like other industrializing countries,is likely to shift away from the manufacture ofrelatively simple goods like textiles and clothingand put more emphasis on high-tech industrialproducts such as electronics.
As expected, China’s exports rose rapidlyfollowing the end of the quota regime. Between2004 and 2005, exports to the US and the EUincreased by 46 per cent in value and 44 per centin volume. These increases were for almost allcategories of apparel. However, there could havebeen special factors that boosted these figures.In some cases the exports substituted for goodsthat previously might have come via the SpecialAdministrative Regions of Hong Kong andMacau as well as Taiwan (China). And sometraders will have seen this as a window ofopportunity to increase shipments before the USand the EU retaliated with protective measures.
As expected, the US and the EU startedimposing restrictions. On 23 May 2005, forexample, the US imposed restrictions on cottonknit shirts and blouses, cotton trousers, slacksand shorts, and cotton and man-made fibreunderwear. On 27 May, it imposed limits oncotton yarn, men’s and boys’ cotton and man-made fibre shirts (non-knit), man-made fibreknit shirts and blouses and man-made fibretrousers. It thus appears that the categories onwhich limits have been reintroduced were amongthose for which quotas were the most restrictiveduring the ATC regime.
The companies producing these goods, most
China is certainto be theprincipal
beneficiary ofthe post-MFAglobal trading
regime
Figure 4.4: Growth in value of exports of textiles and clothingto the EU and the US 2004-05
Source: Adhikari and Yamamoto, 2006.
ASIA-PACIFIC HUMAN DEVELOPMENT REPORT 200688
of which are small and medium enterprises, willbe severely affected. Since they filled their newquotas within a couple of months, they had tostop production for the rest of the year. Thisaffected some 140,000 jobs, most of which areoccupied by young girls or women from ruralareas who are not covered by China’s limitedsocial safety net.
Following these measures and subsequentadditional requests for safeguard action, inNovember 2005 the US and China arrived at abroad pact. In exchange for guaranteed accessto the US, China agreed for three years to limitits exports for 34 categories of clothing, account-ing for 46 per cent of Chinese textile importsinto the US. The agreement allows an annualaverage growth of 11 per cent – considerablylower than the Chinese demand of 20-30 percent.
On 29 April 2005, the EU too launchedinvestigations into Chinese imports – T-shirts,pullovers, men’s trousers, blouses, stockings andsocks, women’s overcoats, brassieres, flax yarnand woven fabrics of flax. The surge in importsof T-shirts was of particular concern: during theperiod January–April 2005, T-shirt importvolumes from China had increased by 187 percent compared with the same period in 2004,increasing China’s market share from 7 to 15 percent and leading to a fall in import prices of 36per cent. These imports had replaced productionin a number of EU countries, including Greece,Portugal and Slovenia, and also displacedimports from traditional suppliers such asMorocco, Tunisia, Romania, Sri Lanka, andBangladesh.
On 10 June 2005, the EU and Chinaconcluded a Memorandum of Understanding(MOU) that covered imports from China in tencategories of products, setting a quota limit forthe remainder of 2005 and for 2006 and 2007 –allowing for an increase in import volume of 10per cent per annum. But by late August 2005,Chinese manufacturers had already met or
exceeded these quotas, and since the above-quota goods had already been despatched theywere impounded in Europe – more than 75million garments. After further negotiations theEuropean Commission agreed to allow half ofthese goods to enter, and China agreed that therest would be deducted either from its 2006textile quota or switched to other unfilled-quotacategories.
In addition to its agreements with the USand the EU, China has undertaken its ownunilateral measures to dampen down exports. Ithas, for example, lowered the VAT rebate rateon T&C exports and imposed export duties ona number of lines to encourage Chineseenterprises to switch to higher value-addedproducts – although it later revoked some ofthese following the US and EU restrictions, toprevent Chinese textile exporters from beingdoubly penalized.15
Bangladesh
Bangladesh had expanded its T&C exports veryrapidly under the quota regime. This was largelybased on having some of the world’s lowestwages – although offset by low productivity. In2004, 500,000 workers were employed inknitwear and 1.3 million in woven apparel;16 80per cent of the workers are women.
In recent years Bangladeshi enterprises hadmade considerable improvements, reducinglead times, increasing the value added, andbecoming more price-competitive. Nevertheless,Bangladesh remained highly reliant on quotas,sending 98 per cent of its exports to the US andthe EU. Most analysts assumed that withoutthese quotas its T&C sector would collapse.
The result has been more mixed – with astronger performance in the US and a weakerone in the EU. What appears to be happening isthat, for woven garments, EU’s stringent rules oforigin appear to be more constraining than US’stariff barriers.
CHAPTER 4: ADJUSTING TO A NEW ERA FOR TEXTILES AND CLOTHING 89
So far there has been no evidence of signi-ficant factory closures or retrenchment ofworkers; indeed, one survey found that 19 outof 35 firms had increased the number ofworkers,17 while employment in the rest wasunchanged.
There could also be improvements inworking conditions, since another survey foundincreasing pressure to meet the different codesof conduct and social standards set by differentbuyers.18 However, these burdens fall uponemployers’ and then workers’ shoulders, withouttoo much support from buyers or fromgovernment. The demands will also differ fromone buyer to another; one buyer may requireworkers to be provided with sandals, whileanother requires work shoes. Work hours havealso been reduced as buyers demand thatfactories meet the legal limit of 60 hours a week.Though this is an advance in one respect, it alsomeans people now earn less income and miss outon snacks provided for overtime workers.
Cambodia
Cambodia too had fared well under the quotaregime. Investors from Hong Kong (China),Taiwan (China), and Singapore, along with localbusinessmen, many of Chinese origin, had builtup an industry with 200 clothing factories thatin 2004 exported $1.9 billion worth of goods.But Cambodia appeared vulnerable to theremoval of quotas. Some 40 per cent of itsexports were to a US retailer, Gap, which alsosourced about one-sixth of its clothing in China.Since Cambodia’s production costs were around25 per cent higher than those in China, andtransportation to foreign ports took far longer,it was feared that much of this production wouldmigrate to China.
In the event the outcome has been betterthan expected, as exports to the US and EUincreased by over 11 per cent in value and 13per cent in volume in 2005. This appears to be
the fruit of Cambodia’s efforts to improvefactory conditions and its participation in anILO inspection programme that made thecountry more acceptable to foreign buyers.Cambodian workers have the right to strike.Many are organized into independent unions. Arecent report found no forced labour, childlabour, or discrimination. Apparently because ofthese better working conditions, the US providedCambodia with preferential treatment in theform of higher quotas and lower tariffs.19 How-ever an ILO report cautions against bureaucraticpractices and rampant corruption, and a reportfrom the International Confederation of FreeTrade Unions shows increasing pressure on tradeunion rights that threatens to tarnish thecountry’s image.20
India
India’s T&C industry accounts for 14 per centof total industrial production and nearly 30 percent of total exports. In the 1960s India exportedabout half of its products to the USSR andEastern Europe, but from the late 1970s shiftedmore towards the US and European markets,where it ran into quota restrictions. Most studieshave concluded that India would benefit fromthe lifting of quotas, and some consider thatIndia alone has the ability to be competitive withChina. Potential revenue gains have been put at$2 billion annually.21
India seems to have gained in both textilesand clothing. Between 2004 and 2005, exportsto the US and EU grew by 22 per cent in valueand over 11 per cent in volume. In absoluteterms, the value of exports grew by almost $2billion, as anticipated. But India has lost marketshare in cotton trousers, though gaining incotton fibre dresses and men’s cotton knit shirts.Although no job losses have been reported yet,many female workers are expected to lose theirjobs when the textile industry replaceshandlooms by machine looms.
Because ofbetter workingconditions, the
US providedCambodia with
preferentialtreatment in the
form of higherquotas and
lower tariffs
ASIA-PACIFIC HUMAN DEVELOPMENT REPORT 200690
Indonesia
Indonesia’s T&C sector is the country’s majorcontributor of non-oil and gas exports. Directlyand indirectly, about 3.5 million people are nowworking in the sector. According to the 2004National Labour Force Survey, 1.1 millionpeople were officially employed in the sector in2004, down from 1.4 million in the previousyear. In addition to factory workers, the T&Csector, especially ready-made garments, hiresmany informal workers. In Bali, for example,sewing is contracted out to village groups. Wagesare among the lowest in the region, averaging$0.27 per hour. In export processing zones thebasic wages for females workers in the garmentsector were found to be $55 to $74 per month,when the minimum wage was around $74. Thus,women are not earning above minimum wage inthe garment industry.22
Between 2004 and 2005, the sector incre-ased its output: exports to the US and EU, whichaccount for about two-thirds of exports, showan increase in value of 6 per cent. Nevertheless,there is evidence of factories laying workers offas a result of falling orders and rising costs.
Nepal
In the early 1980s Indian exporters, constrainedby the system of quotas, turned to Nepal andestablished export-oriented garment manufac-ture there. Output of ready-made garmentspeaked in 2000 then declined over the next twoyears in anticipation of the end of the quotaregime. The value of exports declined sharply,by 18 per cent in value and 29 per cent involume, to the US and EU markets in 2005.
Pakistan
Overall, the T&C sector accounts for 60 per centof exports. In 2000 it employed 2.3 millionpeople, including informal workers – 43 per cent
of manufacturing employment – and is thesecond-largest employer of women, after agri-culture. This is mostly a cottage industry: around90 per cent of work is subcontracted to small-and medium-sized enterprises.
Between 2004 and 2005, Pakistan lost someof its exports to the EU while expanding in theUnited States. Overall, however, there are somedoubts about the growth of the sector followingthe removal of quotas. The value of exportdeclined by 1 per cent, while volume increasedby around 6 per cent. The impact on employ-ment is not yet clear, though there are signs ofmale production workers being replaced byfemale ones.23
Sri Lanka
Sri Lanka’s success has been partly achievedthrough supportive government policies – lowercorporate taxes, duty-free imports of machineryand raw materials, and subsidies and duty rebateschemes. But Sri Lanka has also had a parti-cularly large share of export quotas and enjoyedrelatively secure markets through bilateralagreements with the US, the EU, Canada, andNorway. Most of the T&C sector here is inclothing, since there is no significant textileindustry. But even before the quota regime wasdisbanded, labour costs had been rising andgarment exports had been shrinking. With theending of quotas some analysts estimated thatas much as half the local industry would have toclose.24
In a 2005 survey there were 733 apparel fac-tories, and employment seems to have been fall-ing, from 340,367 in 2003 to 273,600 in 2005.Some 85 per cent of these are women. Some ofthis reduction has been due to the consolida-tion of the industry, though other factorieshave closed abruptly, without paying anycompensation.
In 2005, the combined exports to the US andthe EU rose by 3 per cent in value and fell by an
CHAPTER 4: ADJUSTING TO A NEW ERA FOR TEXTILES AND CLOTHING 91
equal percentage in volume. The EU granted SriLanka GSP-plus benefits in 2005. But without astrong textile processing sector, the country willnot benefit much from the scheme.
Viet Nam
Viet Nam had also seemed likely to be a loserfrom the reduction in quotas. So far, the resultsdo not appear to have been negative; exports invalue to the US and the EU increased by around6 per cent in value and half of 1 per cent involume in 2005. Nevertheless, there is a climateof uncertainty among national producers. VietNam has benefited from the reintroduction ofrestrictions against China, which increased VietNam’s sales somewhat. However, according togovernment sources, the outlook is not verypromising – not just because of the removal ofquotas, but also because of relatively highproduction costs.25
Impact on Workers and Communities
If countries and suppliers are to survive in thenew global trading environment, they will haveto become more competitive. In efforts to do so,however, they could pass on the pressure to theirworkers – reducing wages and demanding moreunpaid overtime and threatening to close ormove if workers do not comply. Increased com-petition could also lead to less-secure forms ofemployment, such as piece-rate jobs – whichwould mean greater health and safety risks forworkers as well as a loss of benefits such asmedical insurance.
However, there may also be pressures toimprove working conditions. Consumers in theimporting countries are asking retailers to provethat goods are not produced by sweatshops. Thiscould improve standards for many workers,though there is also the risk that retailers’ de-mands will be so stringent that they drive somedeveloping-country suppliers out of business.
A decline in the garment industry in anycountry will see job losses, especially for women.Even in countries that maintain production,women’s employment may fall because ofincreased mechanization and the transfer ofwork to larger factories that employ more men.The introduction of new technologies often leadsto greater redundancies among women: first,because the new technologies will replace jobssuch as weaving, traditionally performed bywomen; and second, because women, with theirlower access to skills, often lack the knowledgeto operate the new equipment.
Women working on piece rates in the infor-mal sectors could also be particularly vulnerableif better working conditions moves more pro-duction into factories; unable to find work inmore modernized garment factories, thesewomen are more likely to turn to marginalmicro-enterprises, such as taking in laundry andstreet vending.
National Policy Directions
The textiles and clothing industry worldwide ison the threshold of major changes, with gains insome countries offset by losses in others asfactories close and unemployment increases. Buteven countries that manage to boost their exportearnings will not necessarily provide more workor better labour conditions. Higher levels oftrade in textiles and clothing can lead to higherlevels of human development, but only ifgovernments and employers take the necessaryaction. In the long run, the only way to survivein a competitive global market is by upgradingthe industry and removing some of the barriersto increasing both the quality and quantity ofoutput.
Decent Work
Countries that do not have legislation shouldenact labour laws to guarantee the rights of
ASIA-PACIFIC HUMAN DEVELOPMENT REPORT 200692
workers, particularly women. Such guidelines,following ILO recommendations, should capweekly working hours, while offering firmsincentives to attain competitiveness throughincreased labour productivity. Meanwhile, coun-tries that have already enacted such legislationneed to be more proactive in ensuring compli-ance and in taking punitive action against off-ending enterprises.
In the current climate, international retailersand garment manufacturers are closely scruti-nized in their home countries with regard to thelabour conditions in the factories of theirsuppliers. Cambodia, for example, has alreadydemonstrated how improved working condi-tions can help boost exports. It is important,however, that developed countries do notuse such requirements as a substitute or pretextfor increasing tariffs and other forms of pro-tection.
Exporting countries can take advantage ofsuch concerns by following the codes of conductdeveloped by some major retailers to protectbasic labour rights in their contracted factories.These typically include adequate wages andwork hours, job security, health and safetyguarantees, and the right to form independentlabour unions. Countries that have labour lawsconsistent with these codes of conduct – and themeans to enforce them – could then marketthemselves to the socially more conscious US andEU retailers and manufacturers.
Environmental Protection
The textiles and clothing sector can only pro-mote sustainable human development if it isenvironmentally responsible. All developingcountries need relevant and enforceable domes-tic regulatory frameworks that can mitigate theindustry’s negative effects on the environment –using cleaner technologies, reducing waterusage, avoiding pollution and promoting moreefficient use of process chemicals.
Offsetting the Effects ofQuota Elimination
In countries where job losses are anticipated, theStates need to ensure protection and rehabili-tation of affected workers. To manage this, theycould set up cells in government departments totrack changes in the sector.
The most vulnerable countries are thosewith inefficient and low-productivity industriesthat produce poor-quality goods. These areunlikely to survive. In a quota-free world, enter-prises have to compete on grounds other thancheap labour. Governments must, therefore, helpcreate the conditions for alternative employ-ment: for example, by improving infrastructure,particularly telecommunications. Governmentsalso need to negotiate new beneficial tradeagreements for other products – possibly work-ing through groupings and trading blocs wherethey can share resources and information.
At the same time, government and industrywill need to work together to find ways of mov-ing up the value chain – diversifying productlines, developing indigenous sources of textilesand other inputs.
• Responsible closure of units. Governmentsneed to adopt responsible closure guidelines,including notification requirements andphased implementation of closure. All firms– including large retailers that source pro-duction in Asia – should have social safetynets to protect workers who are laid off.These workers should also be paid beforeother creditors. Most countries have laws toprotect workers against summary dismissal,but enforcement is unreliable and factoryclosures will need to be carefully monitoredto ensure that workers receive due severancepay, social security and pension payments,along with social safety nets and trainingand programmes for reemployment.
• Labour restructuring programmes. Dis-
Countries thatdo not havelegislationshould enactlabour laws toguarantee therights ofworkers,particularlywomen
CHAPTER 4: ADJUSTING TO A NEW ERA FOR TEXTILES AND CLOTHING 93
placed workers can be helped to gain newemployment through labour market adjust-ment programmes. These can includedisseminating labour market information,creating job banks, providing employmentsubsidies and training, and retraining inalternative skills for employment in sectorsakin to textiles and clothing. Particularattention needs to be paid to informalworkers, and especially to women, whoshould be given opportunities to upgradetheir skills.
But these programmes need to go beyondclassrooms to provide skill-specific and on-the-job training. For this purpose, somegovernments have entered into partnershipswith private-sector and community orga-nizations. In Bangladesh, for example,the Nari Udyug Kendra – the Centre forWomen’s Initiatives – has conducted a studyof worker retraining needs, and the govern-ment plans to improve the skills of 40,000garment workers in partnership with theNGO BRAC (previously known as theBangladesh Rural Advancement Commi-ttee). This type of training can help diversi-fication into higher-value-added productionsuch as fashion-sensitive women’s wear.Some countries have already initiated theprocess: in Sri Lanka, for example, thegovernment has levied a garment tax to fundtechnological upgrading and skills enhance-ment. Credit schemes could also be set up tohelp retrenched workers begin their ownsmall businesses.
• Improving infrastructure. Many garment-exporting countries are hampered by poorinfrastructure, inadequate power supplies,high telecommunication costs, poor roadsand rail networks, and high turnaroundtimes at ports. According to World Bankestimates, the average customs clearancetime for sea cargo is more than ten days inSouth Asia, compared with only two days in
developed countries. This is a serious handi-cap for fashion-sensitive items. Countriesneed to invest in dry ports and new exportprocessing zones while developing suppor-tive services and industries and removingshipping and customs bottlenecks. Electro-nic data interchanges at ports and customshouses, for example, can ensure fasterclearance.
• Raising levels of skill. Training is especiallyimportant at the entry level, particularly incountries such as Cambodia, which haveweak education systems that severely limitworkers’ productivity. Training is necessaryat two levels: First, for the workers, with aview to enhancing their skills, speeding upthe production process and minimisingwaste; Second, for mid-level managers toenable them to supervise works more effec-tively, communicate well with buyers ortheir agents, and process the ordersefficiently. This is an area where there iswide scope for public-private partnership.
• Upgrading technology. T&C is generally alow-tech sector. Even so, enterprises in mostLDCs and low-income countries arehampered by their inability to invest in latesttechnologies – including computer-aideddesign and computer-aided manufacture –not just to increase their efficiency but alsoenhance quality and respond to buyers’requirements. These technologies arecommon in middle-income countries, andlarger exporters in Bangladesh have instal-led them. In other LDCs and low-incomecountries, however, such facilities may notbe feasible. Here one possibility is for firmsto work together as groups to use suchequipment. Another option would be tomake use of foreign direct investmentthrough South-South cooperation.
• Fiscal support. In some countries fullyexport-oriented enterprises are accordedspecial privileges, such as full-duty
ASIA-PACIFIC HUMAN DEVELOPMENT REPORT 200694
drawbacks and exemptions from importtaxes. These fiscal incentives could also beextended to firms that export only a part oftheir output. Other incentives could include:reducing or eliminating tariffs on keyintermediate inputs; allowing garmentexporters the freedom to choose betweenusing local and imported fabric, as in Chinaand Pakistan; lowering taxes on the sale of‘export-reject’ T&C products in the localmarket; reforming export credit guaranteeschemes covering pre- and post-shipmentrisks and financing needs; and extending thetime limit for repayment of export credits.In Bangladesh, for example, the governmentis eliminating taxes on electricity andutilities used by garment factories.
• Promoting reputations and brands. Govern-ments can help smaller enterprises buildreputations for quality, reliability, andcompliance with product and processstandards. They might, for example, targetquality niche products such as bed linen or,as Cambodia has done, seek an advantagethrough well-publicized compliance withinternational labour and environmentalstandards. They can do some of this workthrough trade fairs and missions abroad, aswell as by helping domestic producersestablish contact with the largest retailers.
International Measures toIncrease Market Access
At the same time, governments in both exportingand importing countries will need to take actionat the international level to ensure that the tradein textiles and clothing promotes humandevelopment in the poorest countries.
The developing countries need to ensure thathuman development considerations are includedin trade agreements. Apart from trying topreserve access to markets, they also need tomaintain advantages where they have indi-
genous manufacturing capabilities. As part of itsterms of accession to the WTO, Mongolia, forexample, had to eliminate its export restrictionson raw cashmere. This has undermined thecompetitiveness of its clothing enterprises, sincetheir main competitors in China can nowpurchase high-quality Mongolian cashmere.Despite a per-capita GDP of less than $1,000,Mongolia was not permitted to maintain exportsubsidies, a provision that WTO members atsimilar levels of development enjoy.
The objective should be to seek greatermarket access along with margins of preferencefor the LDCs – but without requiring reciprocalreductions that would undermine indigenousmanufacturing, especially in the traditionalhandloom and handicraft sectors that employsubstantial numbers of women.
Anti-Dumping and Countervailing Duties
The T&C sector has long been affected by anti-dumping measures. Between 1994 and 2001, theEU, initiated 53 anti-dumping and counter-vailing actions in the textile sector, while the USinvoked 28 safeguard measures under the ATCbetween 1995 and 2001.26 In the more libera-lized trade regime for textiles and clothing, thereis a general expectation that developed countriesmay increasingly resort to such measures. Dis-cussions on WTO rules should, therefore, aim atreducing the scope for this – with a moratoriumon actions against producers in the LDCs.
Promoting South-South Cooperation
Traditional markets such as the EU, the US,Japan and Canada still account for almost 80per cent of world imports, but their futuregrowth is expected to be marginal. In contrast,the markets of the larger developing countriesare growing very fast: China is already theworld’s fourth-largest market for apparel,accounting for 5 per cent of demand. Brazil and
CHAPTER 4: ADJUSTING TO A NEW ERA FOR TEXTILES AND CLOTHING 95
South Africa are also growing, although at aslower pace.
Asian countries thus have an opportunity toboost T&C trade though regional agreementsthat promote South-South trade and thus reducedependence on northern markets. This can bedone on three levels: selling to developingcountry markets; sourcing intermediary pro-ducts from developing countries and buildingrelations with their investors; and increasingtechnical cooperation between developingcountries.
Moving in this direction will need a consi-derable investment in resources and time –learning about unfamiliar cultures, marketstructures and distribution channels. But oneproblem that can be addressed quickly is tariffprotection. Many of these markets have hightariffs; in India and Mexico, for example, theaverage import tariff for textiles and clothing is35 per cent. One option is to use the Agreementon Global System of Trade Preferences amongDeveloping Countries (GSTP), administered byUNCTAD, to help deepen the scope of tariffpreferences amongst the G-77. Larger and moreadvanced developing countries could use this togive preferential market access to LDCs, helpingthem find new outlets that might compensate forlosses in traditional markets.
Preferences for the LDCs
The developed countries grant unrestrictedmarket access to T&C exports from some, butnot all, LDCs. The US offers this to LDCs in sub-Saharan Africa under the AGOA, but not toany Asian T&C-producing LDCs such asBangladesh, Cambodia, Lao PDR and Nepal.The EU, in contrast, provides duty-free access to
exports from all LDCs under its ‘Everything ButArms’ (EBA) initiative, though exporters wouldbe able to make better use of this if the EUharmonized the rules of origin so that benefi-ciaries do not have to fulfil different criteria indifferent preferential schemes. But even largedeveloping countries, such as China and India,could consider extending such preferences toAsian LDCs.
Addressing these issues would have verybeneficial human development outcomes,especially since many women in LDCs areemployed in this industry.
Major Changes Ahead
The textile and clothing industry worldwidecould be on the threshold of major changes. Inthe long term, trade liberalization through theremoval of quotas could provide more jobs incertain countries and improve human develop-ment. At the same time, vulnerable countriescould face disruptions if factories close andunemployment increases.
But market access is not sufficient. Export-ing countries also need to improve competi-tiveness, including investing in developing skills,upgrading technology, diversifying products andmarkets, and integrating better into globalsupply chains.
Moreover, increasing volumes of trade andexpanded export earnings do not necessarilytranslate into increased employment and, giventhe sweatshop conditions in many garment units,increased employment does not automaticallytranslate into higher standards of humandevelopment. With so many women workers inthis sector in Asia, there are also significantgender implications, both positive and negative.
CHAPTER 5: SELLING SERVICES ACROSS FRONTIERS 99
Asian countries continue to rely on the inter-national trade in goods. But over the last threedecades they have been taking advantage of theopportunities to boost the trade in services, andas a result international trade has become muchmore complex and diverse. This chapter focuseson three forms of cross-border movement: in thefirst type, the seller moves, as in internationallabour migration; in the second type, the workmoves, as with business outsourcing; and in thethird type, the buyer moves, as with interna-tional tourism.1,2
All three types of movement have increasedsignificantly. For migration, millions of lower-skilled workers continue to travel abroadon short-term contracts, especially fromBangladesh, Cambodia, China, Nepal, thePhilippines, and Sri Lanka. An estimated 10 percent of the Filipino labour force and 12 per centof the Sri Lankan labour force now work over-seas. Labour migrants have improved theirquality of life, and even some of the poorest haveearned enough to lift their families out ofpoverty.
Asia has also been a pioneer in the off-shoring of IT and business process services. Insome cases IT workers continue to travel over-seas on short-term assignments in developedcountries, but advances in information andcommunications technology and falling Internet
Economic development in all countries has involved shifting the focus from agricultureor manufacturing to the service sector. The same is true at the international level – astechnological advance and falling transport costs have made it easier to trade servicesacross national borders. The Asia-Pacific region has been at the forefront of thesechanges – particularly through labour migration, outsourcing and the tourist industry. Butpolicy makers will need to take firm action if the international trade in services is to offermore benefits to the poor.
ChapterSelling Services Across Frontiers5
connectivity costs have allowed more and moreof these services to be delivered remotely –providing jobs for highly educated young people,who might otherwise have struggled to findwork that took advantage of their skills.
In tourism too, the Asia-Pacific region is oneof the global leaders – increasing its share ofglobal traffic from less than 10 per cent in the1950s to 40 per cent in 2004. Tourism can offernew sources of employment even to the remotestregions.
There are, of course, many other servicesthat are traded across borders, including healthservices, financial services and environmentservices. In the sections that follow, this chapterlooks specifically at three of the main forms ofeconomic service.
Short-term Migration
Asia has long been subject to large migrationflows – both within and beyond the region. Inthe nineteenth century, for example, millions ofindentured workers left countries in South Asiaand China – some to other parts of Asia, othersto North America, the Caribbean and Africa. Inthe twentieth century, many people left theregion for long-term settlement in Europe andNorth America.
Nowadays migration flows are often more
Asia has longbeen subject tolarge migration
flows
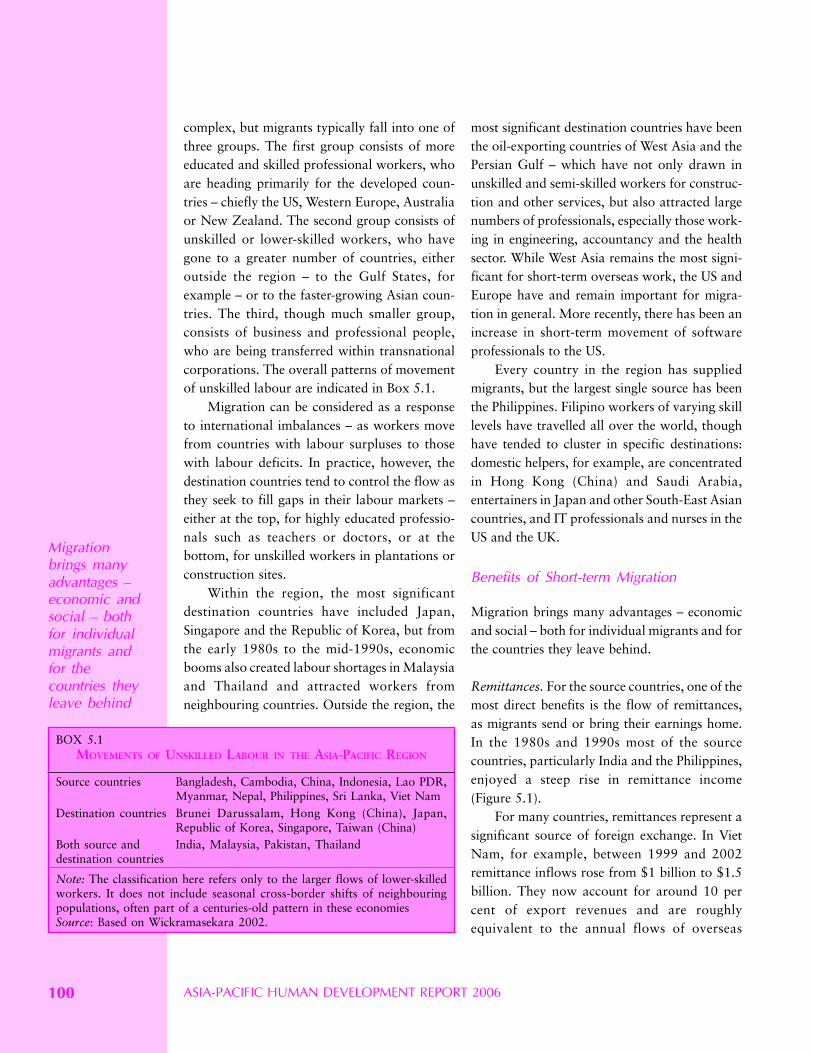
ASIA-PACIFIC HUMAN DEVELOPMENT REPORT 2006100
complex, but migrants typically fall into one ofthree groups. The first group consists of moreeducated and skilled professional workers, whoare heading primarily for the developed coun-tries – chiefly the US, Western Europe, Australiaor New Zealand. The second group consists ofunskilled or lower-skilled workers, who havegone to a greater number of countries, eitheroutside the region – to the Gulf States, forexample – or to the faster-growing Asian coun-tries. The third, though much smaller group,consists of business and professional people,who are being transferred within transnationalcorporations. The overall patterns of movementof unskilled labour are indicated in Box 5.1.
Migration can be considered as a responseto international imbalances – as workers movefrom countries with labour surpluses to thosewith labour deficits. In practice, however, thedestination countries tend to control the flow asthey seek to fill gaps in their labour markets –either at the top, for highly educated professio-nals such as teachers or doctors, or at thebottom, for unskilled workers in plantations orconstruction sites.
Within the region, the most significantdestination countries have included Japan,Singapore and the Republic of Korea, but fromthe early 1980s to the mid-1990s, economicbooms also created labour shortages in Malaysiaand Thailand and attracted workers fromneighbouring countries. Outside the region, the
most significant destination countries have beenthe oil-exporting countries of West Asia and thePersian Gulf – which have not only drawn inunskilled and semi-skilled workers for construc-tion and other services, but also attracted largenumbers of professionals, especially those work-ing in engineering, accountancy and the healthsector. While West Asia remains the most signi-ficant for short-term overseas work, the US andEurope have and remain important for migra-tion in general. More recently, there has been anincrease in short-term movement of softwareprofessionals to the US.
Every country in the region has suppliedmigrants, but the largest single source has beenthe Philippines. Filipino workers of varying skilllevels have travelled all over the world, thoughhave tended to cluster in specific destinations:domestic helpers, for example, are concentratedin Hong Kong (China) and Saudi Arabia,entertainers in Japan and other South-East Asiancountries, and IT professionals and nurses in theUS and the UK.
Benefits of Short-term Migration
Migration brings many advantages – economicand social – both for individual migrants and forthe countries they leave behind.
Remittances. For the source countries, one of themost direct benefits is the flow of remittances,as migrants send or bring their earnings home.In the 1980s and 1990s most of the sourcecountries, particularly India and the Philippines,enjoyed a steep rise in remittance income(Figure 5.1).
For many countries, remittances represent asignificant source of foreign exchange. In VietNam, for example, between 1999 and 2002remittance inflows rose from $1 billion to $1.5billion. They now account for around 10 percent of export revenues and are roughlyequivalent to the annual flows of overseas
BOX 5.1MOVEMENTS OF UNSKILLED LABOUR IN THE ASIA-PACIFIC REGION
Source countries Bangladesh, Cambodia, China, Indonesia, Lao PDR,Myanmar, Nepal, Philippines, Sri Lanka, Viet Nam
Destination countries Brunei Darussalam, Hong Kong (China), Japan,Republic of Korea, Singapore, Taiwan (China)
Both source and India, Malaysia, Pakistan, Thailanddestination countries
Note: The classification here refers only to the larger flows of lower-skilledworkers. It does not include seasonal cross-border shifts of neighbouringpopulations, often part of a centuries-old pattern in these economiesSource: Based on Wickramasekara 2002.
Migrationbrings manyadvantages –economic andsocial – bothfor individualmigrants andfor thecountries theyleave behind
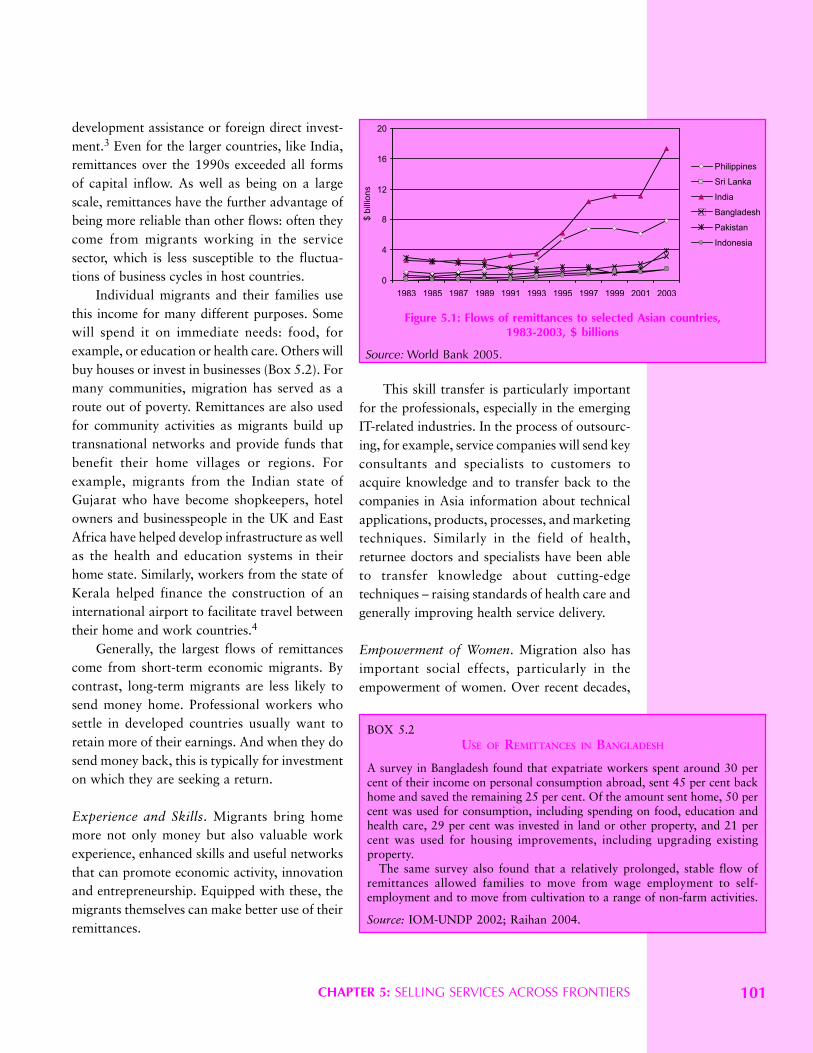
CHAPTER 5: SELLING SERVICES ACROSS FRONTIERS 101
development assistance or foreign direct invest-ment.3 Even for the larger countries, like India,remittances over the 1990s exceeded all formsof capital inflow. As well as being on a largescale, remittances have the further advantage ofbeing more reliable than other flows: often theycome from migrants working in the servicesector, which is less susceptible to the fluctua-tions of business cycles in host countries.
Individual migrants and their families usethis income for many different purposes. Somewill spend it on immediate needs: food, forexample, or education or health care. Others willbuy houses or invest in businesses (Box 5.2). Formany communities, migration has served as aroute out of poverty. Remittances are also usedfor community activities as migrants build uptransnational networks and provide funds thatbenefit their home villages or regions. Forexample, migrants from the Indian state ofGujarat who have become shopkeepers, hotelowners and businesspeople in the UK and EastAfrica have helped develop infrastructure as wellas the health and education systems in theirhome state. Similarly, workers from the state ofKerala helped finance the construction of aninternational airport to facilitate travel betweentheir home and work countries.4
Generally, the largest flows of remittancescome from short-term economic migrants. Bycontrast, long-term migrants are less likely tosend money home. Professional workers whosettle in developed countries usually want toretain more of their earnings. And when they dosend money back, this is typically for investmenton which they are seeking a return.
Experience and Skills. Migrants bring homemore not only money but also valuable workexperience, enhanced skills and useful networksthat can promote economic activity, innovationand entrepreneurship. Equipped with these, themigrants themselves can make better use of theirremittances.
This skill transfer is particularly importantfor the professionals, especially in the emergingIT-related industries. In the process of outsourc-ing, for example, service companies will send keyconsultants and specialists to customers toacquire knowledge and to transfer back to thecompanies in Asia information about technicalapplications, products, processes, and marketingtechniques. Similarly in the field of health,returnee doctors and specialists have been ableto transfer knowledge about cutting-edgetechniques – raising standards of health care andgenerally improving health service delivery.
Empowerment of Women. Migration also hasimportant social effects, particularly in theempowerment of women. Over recent decades,
Figure 5.1: Flows of remittances to selected Asian countries,1983-2003, $ billions
Source: World Bank 2005.
BOX 5.2USE OF REMITTANCES IN BANGLADESH
A survey in Bangladesh found that expatriate workers spent around 30 percent of their income on personal consumption abroad, sent 45 per cent backhome and saved the remaining 25 per cent. Of the amount sent home, 50 percent was used for consumption, including spending on food, education andhealth care, 29 per cent was invested in land or other property, and 21 percent was used for housing improvements, including upgrading existingproperty.
The same survey also found that a relatively prolonged, stable flow ofremittances allowed families to move from wage employment to self-employment and to move from cultivation to a range of non-farm activities.
Source: IOM-UNDP 2002; Raihan 2004.
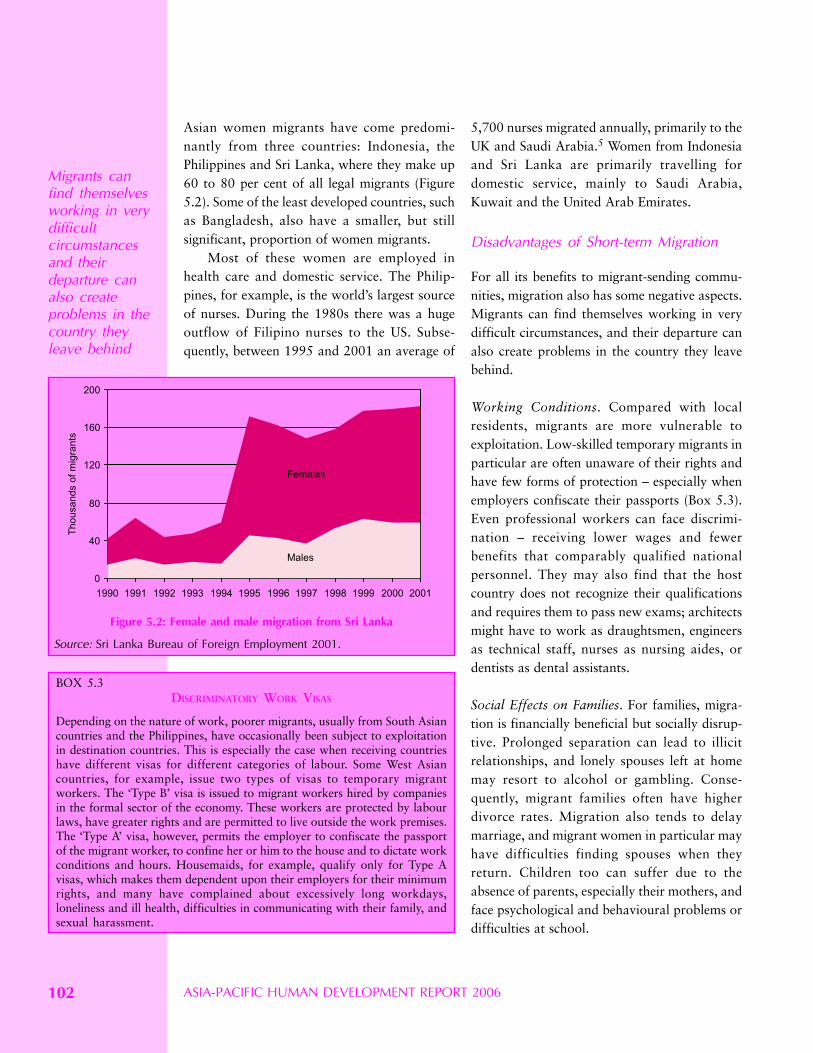
ASIA-PACIFIC HUMAN DEVELOPMENT REPORT 2006102
Asian women migrants have come predomi-nantly from three countries: Indonesia, thePhilippines and Sri Lanka, where they make up60 to 80 per cent of all legal migrants (Figure5.2). Some of the least developed countries, suchas Bangladesh, also have a smaller, but stillsignificant, proportion of women migrants.
Most of these women are employed inhealth care and domestic service. The Philip-pines, for example, is the world’s largest sourceof nurses. During the 1980s there was a hugeoutflow of Filipino nurses to the US. Subse-quently, between 1995 and 2001 an average of
5,700 nurses migrated annually, primarily to theUK and Saudi Arabia.5 Women from Indonesiaand Sri Lanka are primarily travelling fordomestic service, mainly to Saudi Arabia,Kuwait and the United Arab Emirates.
Disadvantages of Short-term Migration
For all its benefits to migrant-sending commu-nities, migration also has some negative aspects.Migrants can find themselves working in verydifficult circumstances, and their departure canalso create problems in the country they leavebehind.
Working Conditions. Compared with localresidents, migrants are more vulnerable toexploitation. Low-skilled temporary migrants inparticular are often unaware of their rights andhave few forms of protection – especially whenemployers confiscate their passports (Box 5.3).Even professional workers can face discrimi-nation – receiving lower wages and fewerbenefits that comparably qualified nationalpersonnel. They may also find that the hostcountry does not recognize their qualificationsand requires them to pass new exams; architectsmight have to work as draughtsmen, engineersas technical staff, nurses as nursing aides, ordentists as dental assistants.
Social Effects on Families. For families, migra-tion is financially beneficial but socially disrup-tive. Prolonged separation can lead to illicitrelationships, and lonely spouses left at homemay resort to alcohol or gambling. Conse-quently, migrant families often have higherdivorce rates. Migration also tends to delaymarriage, and migrant women in particular mayhave difficulties finding spouses when theyreturn. Children too can suffer due to theabsence of parents, especially their mothers, andface psychological and behavioural problems ordifficulties at school.
BOX 5.3DISCRIMINATORY WORK VISAS
Depending on the nature of work, poorer migrants, usually from South Asiancountries and the Philippines, have occasionally been subject to exploitationin destination countries. This is especially the case when receiving countrieshave different visas for different categories of labour. Some West Asiancountries, for example, issue two types of visas to temporary migrantworkers. The ‘Type B’ visa is issued to migrant workers hired by companiesin the formal sector of the economy. These workers are protected by labourlaws, have greater rights and are permitted to live outside the work premises.The ‘Type A’ visa, however, permits the employer to confiscate the passportof the migrant worker, to confine her or him to the house and to dictate workconditions and hours. Housemaids, for example, qualify only for Type Avisas, which makes them dependent upon their employers for their minimumrights, and many have complained about excessively long workdays,loneliness and ill health, difficulties in communicating with their family, andsexual harassment.
Figure 5.2: Female and male migration from Sri Lanka
Source: Sri Lanka Bureau of Foreign Employment 2001.
Migrants canfind themselvesworking in verydifficultcircumstancesand theirdeparture canalso createproblems in thecountry theyleave behind

CHAPTER 5: SELLING SERVICES ACROSS FRONTIERS 103
Increasing Inequalities. Migration can dramati-cally boost the income of a small number offamilies – making them richer than their neigh-bours and generally giving rise to skewedpatterns of income and consumption. In thePhilippines, for example, remittance inflowshave been found to increase local incomeinequalities.6
Reintegration. Returnee migrants can also facesocial and economic problems when they comehome. In Sri Lanka, for example, both male andfemale migrants generally reintegrate fairlysmoothly. However, because of their low level ofeducation, some people may not find the kind ofwork that they aspire to: those who have workedoverseas as housemaids, for example, may beunwilling to do such work in Sri Lanka, where ithas a low social status. And their work experi-ence in more developed countries can give themunrealistic salary expectations.
Brain Drain. The destination country may gainthe skill of migrants, but for the source countriesthis can represent a significant loss. In thePhilippines, for example, where more than one-third of migrants are professional or technicalworkers, their departure has led to serious staffshortages in the health sector and to driving upof wages. Between 1995 and 2000, the numberof registered nurses in the country fellfrom 27,272 to 5,874. Many doctors havealso migrated, particularly to the US andCanada.
Migration and Meeting the MDGs
Migration can thus have positive and negativeeffects. These can also be considered in relationto the MDGs.
MDG1: Poverty. Higher incomes from remitt-ances cannot only help reduce poverty andhunger, but also accentuate existing inequalities
and perpetuate poverty among unskilled andpowerless migrants.
MDG2: Education. Migration can help parentspay for education, but if it splits up families, itmay also serve to remove children from school.
MDG3: Gender Equality. Women may beempowered if they get independent incomes, butcan also be vulnerable to exploitation.
MDG4: Child Mortality. Higher incomes andmore knowledge about health should makechildren healthier, but some may lose out if theytoo have to migrate to more difficult envi-ronments.
MDG5: Maternal Health. Women workingoverseas can have more opportunities to bebetter informed, which could lead to health-seeking behaviour. However, they could facerestrictions on their movements and other formsof exploitation, which inhibit this health seekingbehaviour.
MDG6: Combating HIV/AIDS and OtherDiseases. Remittance incomes can be spent oncontrolling infectious disease, but migrationitself can help spread HIV/AIDS infection.
MDG7: Environmental sustainability. Migra-tion from highly populous countries can relievepressures on land and other resources. However,the migrants can live in overcrowded, unsanitaryconditions that can worsen environmentalconditions in the host country.
MDG8: Global Partnerships. Migration mayresult in a better understanding among culturesand societies, leading to greater possibilities ofcreating a global partnership for development.But unregulated migration can also result in abacklash against migrants among local popu-lations.
For families,migration is
financiallybeneficial but
sociallydisruptive
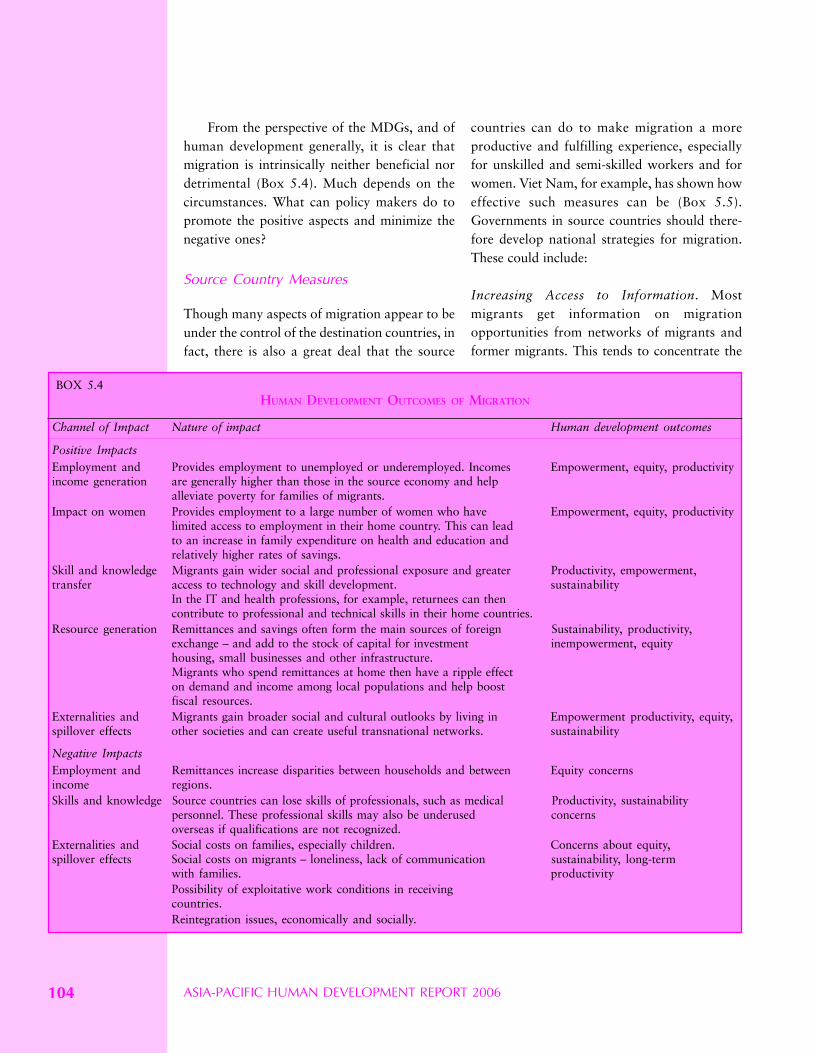
ASIA-PACIFIC HUMAN DEVELOPMENT REPORT 2006104
From the perspective of the MDGs, and ofhuman development generally, it is clear thatmigration is intrinsically neither beneficial nordetrimental (Box 5.4). Much depends on thecircumstances. What can policy makers do topromote the positive aspects and minimize thenegative ones?
Source Country Measures
Though many aspects of migration appear to beunder the control of the destination countries, infact, there is also a great deal that the source
countries can do to make migration a moreproductive and fulfilling experience, especiallyfor unskilled and semi-skilled workers and forwomen. Viet Nam, for example, has shown howeffective such measures can be (Box 5.5).Governments in source countries should there-fore develop national strategies for migration.These could include:
Increasing Access to Information. Mostmigrants get information on migrationopportunities from networks of migrants andformer migrants. This tends to concentrate the
BOX 5.4HUMAN DEVELOPMENT OUTCOMES OF MIGRATION
Channel of Impact Nature of impact Human development outcomes
Positive ImpactsEmployment and Provides employment to unemployed or underemployed. Incomes Empowerment, equity, productivityincome generation are generally higher than those in the source economy and help
alleviate poverty for families of migrants.Impact on women Provides employment to a large number of women who have Empowerment, equity, productivity
limited access to employment in their home country. This can leadto an increase in family expenditure on health and education andrelatively higher rates of savings.
Skill and knowledge Migrants gain wider social and professional exposure and greater Productivity, empowerment,transfer access to technology and skill development. sustainability
In the IT and health professions, for example, returnees can thencontribute to professional and technical skills in their home countries.
Resource generation Remittances and savings often form the main sources of foreign Sustainability, productivity,exchange – and add to the stock of capital for investment inempowerment, equityhousing, small businesses and other infrastructure.Migrants who spend remittances at home then have a ripple effecton demand and income among local populations and help boostfiscal resources.
Externalities and Migrants gain broader social and cultural outlooks by living in Empowerment productivity, equity,spillover effects other societies and can create useful transnational networks. sustainability
Negative ImpactsEmployment and Remittances increase disparities between households and between Equity concernsincome regions.Skills and knowledge Source countries can lose skills of professionals, such as medical Productivity, sustainability
personnel. These professional skills may also be underused concernsoverseas if qualifications are not recognized.
Externalities and Social costs on families, especially children. Concerns about equity,spillover effects Social costs on migrants – loneliness, lack of communication sustainability, long-term
with families. productivityPossibility of exploitative work conditions in receivingcountries.Reintegration issues, economically and socially.
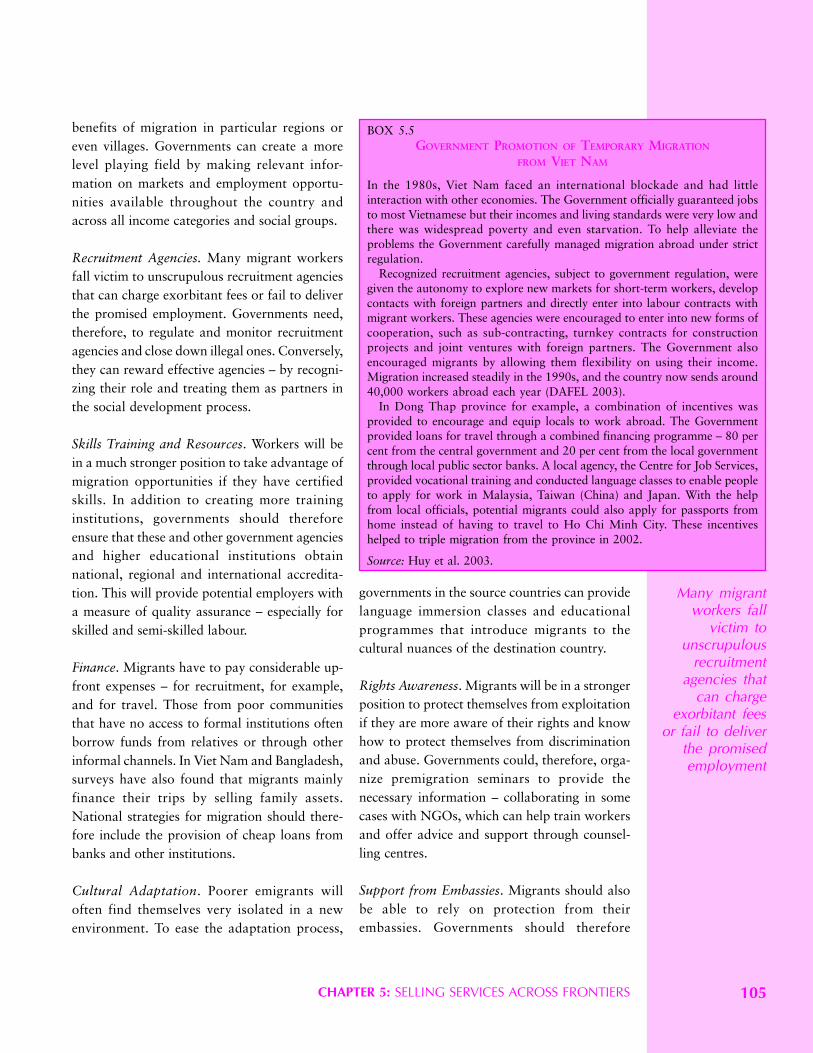
CHAPTER 5: SELLING SERVICES ACROSS FRONTIERS 105
benefits of migration in particular regions oreven villages. Governments can create a morelevel playing field by making relevant infor-mation on markets and employment opportu-nities available throughout the country andacross all income categories and social groups.
Recruitment Agencies. Many migrant workersfall victim to unscrupulous recruitment agenciesthat can charge exorbitant fees or fail to deliverthe promised employment. Governments need,therefore, to regulate and monitor recruitmentagencies and close down illegal ones. Conversely,they can reward effective agencies – by recogni-zing their role and treating them as partners inthe social development process.
Skills Training and Resources. Workers will bein a much stronger position to take advantage ofmigration opportunities if they have certifiedskills. In addition to creating more traininginstitutions, governments should thereforeensure that these and other government agenciesand higher educational institutions obtainnational, regional and international accredita-tion. This will provide potential employers witha measure of quality assurance – especially forskilled and semi-skilled labour.
Finance. Migrants have to pay considerable up-front expenses – for recruitment, for example,and for travel. Those from poor communitiesthat have no access to formal institutions oftenborrow funds from relatives or through otherinformal channels. In Viet Nam and Bangladesh,surveys have also found that migrants mainlyfinance their trips by selling family assets.National strategies for migration should there-fore include the provision of cheap loans frombanks and other institutions.
Cultural Adaptation. Poorer emigrants willoften find themselves very isolated in a newenvironment. To ease the adaptation process,
governments in the source countries can providelanguage immersion classes and educationalprogrammes that introduce migrants to thecultural nuances of the destination country.
Rights Awareness. Migrants will be in a strongerposition to protect themselves from exploitationif they are more aware of their rights and knowhow to protect themselves from discriminationand abuse. Governments could, therefore, orga-nize premigration seminars to provide thenecessary information – collaborating in somecases with NGOs, which can help train workersand offer advice and support through counsel-ling centres.
Support from Embassies. Migrants should alsobe able to rely on protection from theirembassies. Governments should therefore
Many migrantworkers fall
victim tounscrupulous
recruitmentagencies that
can chargeexorbitant fees
or fail to deliverthe promisedemployment
BOX 5.5GOVERNMENT PROMOTION OF TEMPORARY MIGRATION
FROM VIET NAM
In the 1980s, Viet Nam faced an international blockade and had littleinteraction with other economies. The Government officially guaranteed jobsto most Vietnamese but their incomes and living standards were very low andthere was widespread poverty and even starvation. To help alleviate theproblems the Government carefully managed migration abroad under strictregulation.
Recognized recruitment agencies, subject to government regulation, weregiven the autonomy to explore new markets for short-term workers, developcontacts with foreign partners and directly enter into labour contracts withmigrant workers. These agencies were encouraged to enter into new forms ofcooperation, such as sub-contracting, turnkey contracts for constructionprojects and joint ventures with foreign partners. The Government alsoencouraged migrants by allowing them flexibility on using their income.Migration increased steadily in the 1990s, and the country now sends around40,000 workers abroad each year (DAFEL 2003).
In Dong Thap province for example, a combination of incentives wasprovided to encourage and equip locals to work abroad. The Governmentprovided loans for travel through a combined financing programme – 80 percent from the central government and 20 per cent from the local governmentthrough local public sector banks. A local agency, the Centre for Job Services,provided vocational training and conducted language classes to enable peopleto apply for work in Malaysia, Taiwan (China) and Japan. With the helpfrom local officials, potential migrants could also apply for passports fromhome instead of having to travel to Ho Chi Minh City. These incentiveshelped to triple migration from the province in 2002.
Source: Huy et al. 2003.
ASIA-PACIFIC HUMAN DEVELOPMENT REPORT 2006106
strengthen embassies in countries that employsignificant numbers of their migrant workers, byoffering the necessary support through theposting of labour officers experienced in hand-ling worker welfare and legal issues.
Channelling Remittances. So far, governments inthe source countries have done relatively little tochannel foreign exchange remittances intospecific development projects – such as buildinglocal infrastructure or improving health andeducation services. Governments could thereforeencourage the financial sector to develop theappropriate instruments and financial products.
Return Migration. Few Asian source countriesoffer any support to returnees to help them dealwith the social, economic and psychologicaleffects of return, sometimes after a relativelylong period abroad into what could be verychanged societies. Government agencies coulddo more to counsel returnees and help themsettle. For migrants who have returned withsignificant funds, the government can provideseminars on entrepreneurship and other self-employment opportunities. For migrants withmore limited resources, the government canprovide soft loans and offer skills training pro-grammes to help them establish small businesses.
Destination Country Measures
The destination countries have security andother concerns about immigration. They there-fore control the arrival of different types ofmigrants and limit their rights. Recently, theyhave been increasing these protectionistmeasures – restricting the number of arrivals,introducing administrative and proceduraldelays in processing visa applications and workpermits, and making renewals and extensionsmore difficult and expensive. They have alsobeen less willing to recognize the qualificationsand experience of such workers. In the IT sector,
for example, there are no formal accreditationprocedures, and the outcome can often beopaque and discretionary.
One particular area of concern is the appli-cation of an ‘economic needs test’ for the arrivalof certain professionals. Some governmentsoblige employers who propose employing amigrant to demonstrate that they have failed torecruit a comparable national worker. However,in many cases it would be more efficient simplyto designate certain clearly identifiable catego-ries of professionals – all of whom would beentitled to enter and seek work.
Migration could also proceed more effi-ciently if recipient and source countries arrive atmutual recognition agreements (MRAs). Theymight start, for example, with less contentiousareas like the accreditation of higher educationalinstitutions – establishing equivalences in educa-tion levels, degrees, and the quality of graduates.Subsequently, they could move on to the recog-nition of licenses, professional certificates andexperience. The private sector, particularly pro-fessional associations, can help here.
MRAs can be negotiated at a multilaterallevel, but this process is often difficult, lengthyand tedious, and therefore bilateral or regionalagreements might be more feasible for specificprofessions and occupations. ASEAN, forexample, has lifted visa requirements for itsmember countries to increase movement ofcitizens, a precedent that could be extendedacross the region.
Destination country governments could alsoreduce the number of temporary migration visaover-stayers by working more closely withemployers. Under such schemes, the sponsoringemployers cooperate with governments moni-toring of their employees and also take responsi-bility for workers’ return travel – and face thepossibility of sanctions if found in breach of therequirements. Evidence suggests that the mostsustainable temporary migration programmesare those that are appropriately regulated and
Governmentagencies coulddo more tocounselreturnees andhelp them settle
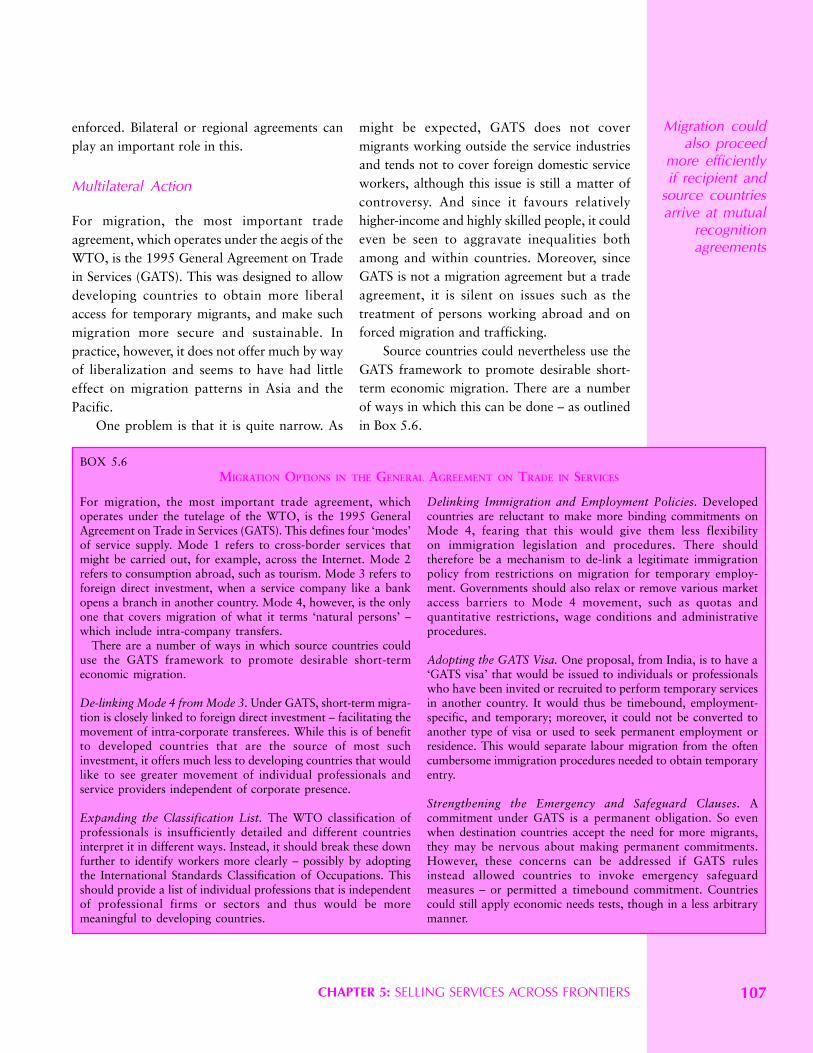
CHAPTER 5: SELLING SERVICES ACROSS FRONTIERS 107
enforced. Bilateral or regional agreements canplay an important role in this.
Multilateral Action
For migration, the most important tradeagreement, which operates under the aegis of theWTO, is the 1995 General Agreement on Tradein Services (GATS). This was designed to allowdeveloping countries to obtain more liberalaccess for temporary migrants, and make suchmigration more secure and sustainable. Inpractice, however, it does not offer much by wayof liberalization and seems to have had littleeffect on migration patterns in Asia and thePacific.
One problem is that it is quite narrow. As
might be expected, GATS does not covermigrants working outside the service industriesand tends not to cover foreign domestic serviceworkers, although this issue is still a matter ofcontroversy. And since it favours relativelyhigher-income and highly skilled people, it couldeven be seen to aggravate inequalities bothamong and within countries. Moreover, sinceGATS is not a migration agreement but a tradeagreement, it is silent on issues such as thetreatment of persons working abroad and onforced migration and trafficking.
Source countries could nevertheless use theGATS framework to promote desirable short-term economic migration. There are a numberof ways in which this can be done – as outlinedin Box 5.6.
Migration couldalso proceed
more efficientlyif recipient and
source countriesarrive at mutual
recognitionagreements
BOX 5.6MIGRATION OPTIONS IN THE GENERAL AGREEMENT ON TRADE IN SERVICES
Delinking Immigration and Employment Policies. Developedcountries are reluctant to make more binding commitments onMode 4, fearing that this would give them less flexibilityon immigration legislation and procedures. There shouldtherefore be a mechanism to de-link a legitimate immigrationpolicy from restrictions on migration for temporary employ-ment. Governments should also relax or remove various marketaccess barriers to Mode 4 movement, such as quotas andquantitative restrictions, wage conditions and administrativeprocedures.
Adopting the GATS Visa. One proposal, from India, is to have a‘GATS visa’ that would be issued to individuals or professionalswho have been invited or recruited to perform temporary servicesin another country. It would thus be timebound, employment-specific, and temporary; moreover, it could not be converted toanother type of visa or used to seek permanent employment orresidence. This would separate labour migration from the oftencumbersome immigration procedures needed to obtain temporaryentry.
Strengthening the Emergency and Safeguard Clauses. Acommitment under GATS is a permanent obligation. So evenwhen destination countries accept the need for more migrants,they may be nervous about making permanent commitments.However, these concerns can be addressed if GATS rulesinstead allowed countries to invoke emergency safeguardmeasures – or permitted a timebound commitment. Countriescould still apply economic needs tests, though in a less arbitrarymanner.
For migration, the most important trade agreement, whichoperates under the tutelage of the WTO, is the 1995 GeneralAgreement on Trade in Services (GATS). This defines four ‘modes’of service supply. Mode 1 refers to cross-border services thatmight be carried out, for example, across the Internet. Mode 2refers to consumption abroad, such as tourism. Mode 3 refers toforeign direct investment, when a service company like a bankopens a branch in another country. Mode 4, however, is the onlyone that covers migration of what it terms ‘natural persons’ –which include intra-company transfers.
There are a number of ways in which source countries coulduse the GATS framework to promote desirable short-termeconomic migration.
De-linking Mode 4 from Mode 3. Under GATS, short-term migra-tion is closely linked to foreign direct investment – facilitating themovement of intra-corporate transferees. While this is of benefitto developed countries that are the source of most suchinvestment, it offers much less to developing countries that wouldlike to see greater movement of individual professionals andservice providers independent of corporate presence.
Expanding the Classification List. The WTO classification ofprofessionals is insufficiently detailed and different countriesinterpret it in different ways. Instead, it should break these downfurther to identify workers more clearly – possibly by adoptingthe International Standards Classification of Occupations. Thisshould provide a list of individual professions that is independentof professional firms or sectors and thus would be moremeaningful to developing countries.
ASIA-PACIFIC HUMAN DEVELOPMENT REPORT 2006108
phenomenon is growing rapidly (Box 5.7). Oneestimate suggested that between 2002 and 2006business process outsourcing (BPO) alone wouldhave risen from $570 billion to $1,200 billion.9
Outsourcing typically involves shiftingfunctions from higher-wage to lower-wageeconomies in efforts to increase efficiency andlower costs, enabling the company to concen-trate more on its core operations. Thus, compa-nies in the US and Europe started to outsourceto countries such as India, China, Israel,Malaysia, Mexico, the Philippines, South Africaand Viet Nam. Initially, the work they sent wasprimarily concerned with data entry and themaintenance, delivery and management of ITfunctions. Since then the range and complexityof services has expanded rapidly – and blurs theboundaries between sectors and activities.Services are now provided all along the valuechain, from data entry to highly skilled taskssuch as 3D modelling (Box 5.8).
Outsourcing Business Processes
Nowadays many more companies are passingsome of their non-core operations to third-partyservice providers. Such outsourcing of businessprocesses occurs both within a country andoutside. Cross-border outsourcing, or offshor-ing, is a new form of trade in services that isenabled by information and communicationstechnologies. Typically, companies use this formof ‘global outsourcing’ for business processesand back-office functions. This takes advantageof technological advances and falling costs ininformation and communications technologythat now permit delivery over the telephone andthe Internet of a wide variety of services at alllevels of skill and complexity.7
The current scale of outsourcing is difficultto assess, but OECD estimates that in 2001, ITand business process services outsourcing wasworth around $260 billion.8 Undoubtedly, the
BOX 5.7OUTSOURCING BUSINESS PROCESSES – IMPLICATIONS FOR WIDENING EMPLOYMENT
A special contribution from Narayana Murthy, Chairman of oneof India’s largest outsourcing companies, Infosys.
The global business process outsourcing (BPO) industry todayperforms services that range from human resources, research andfinancial activities, to design and engineering functions.Worldwide, BPO revenues were expected to touch $133.7billion in 2005, an 8 per cent growth from $123.8 billionin 2004.
The BPO industry in Asia is estimated to grow by over 13.8 percent annually through 2008, and job creation is expected toaccelerate, resulting in up to 6 million new jobs by 2015. Asia’soutsourcing advantage stems from its growing pool of highlyskilled, low-cost workers – in India, around 3,000 educationalinstitutions train more than 200,000 software professionals andan equal number of non-engineering English-speaking graduatesevery year. China trains an estimated 400,000 graduates a year.At the same time, aging populations and falling fertility rates inWestern Europe and the US mean emerging labour shortages indeveloped countries. It is estimated that at present productivitylevels, the US alone will need 15.6 million more workers by 2015to maintain current living standards.
India accounts for over 40 per cent of the global BPO market;from 2000 to 2004, the country saw an estimated 260,000 jobscreated within the sector. The industry has also seen competing,
low-cost destinations emerge across Asia – the Philippines, China,Malaysia, Thailand, and Viet Nam. However, to take advantageof the opportunities from outsourcing, countries must removeexisting impediments to growth.
The outsourcing industry is driven as much by the availabilityof skilled labour as by lower costs. Consequently, Asia’s long-term success as an offshore destination will depend on how bestcountries can leverage their intellectual capital. In India today, anestimated 40 per cent of children drop out of school by the age often; across Asia, 46 million children are out of school. Clearly,countries must expand the reach of elementary education;academic institutions must focus on modernizing curriculum andaligning higher education with the needs of the industry. Inaddition, we must establish innovation systems of industry,science and research centres, and universities, to create newknowledge and technology.
China’s reformist leader Deng Xiaoping once said, “To get rich,you must first build a road.” This adage holds as true in theInformation Age as in the Industrial Age. To fully realize the gainsof the outsourcing industry, countries must concentrate onupgrading their infrastructure to support industry clusters –modernizing their power facilities, technological infrastructure,airports, highways, and shipping ports. Additionally, effectivelegal and regulatory frameworks are essential to address securityand privacy concerns of outsourcing firms.
Outsourcingtypicallyinvolves shiftingfunctions fromhigher-wage tolower-wageeconomies inefforts toincreaseefficiency andlower costs
CHAPTER 5: SELLING SERVICES ACROSS FRONTIERS 109
As a result, the outsourcing flows betweencountries are becoming more complex. Forinstance, several Indian IT firms and some inde-pendent BPO providers are outsourcing toother developing countries like China and thePhilippines that offer special skills, or to deve-loped countries like Canada that offer proximityto US clients. Singaporean companies such asSingapore Computer Systems are in turn estab-lishing their own outsourcing facilities in Indiaand China. These new patterns of outsourcingare driven by the need to diversify productionbases, pool risks and take advantage of indivi-dual country strengths.
A number of Asian countries have beenseizing these opportunities. According to onestudy, five of the top ten outsourcing destina-tions are in Asia. In 2001, for business processoperations, for example, India was the leaderwith $7.7 billion, while China accounted for$1.1 billion. This compares with $3 billion inIsrael, $0.5 billion in Mexico and $0.4 billion in
Eastern Europe. But many other countries havebeen establishing themselves as outsourcingdestinations.10
Bangladesh is a host to medical transcriptionservices such as Digital Divide Data.
Cambodia provides outsourced data services tobusiness and public customers both at home andabroad, and is at present engaged in the task ofdigitizing Harvard University’s archives.
China is a key product development centre forGE, Intel, Microsoft, Phillips, and other largeelectronics firms, for hardware design andembedded software.
India has IT companies such as Infosys, TCS,Wipro, and Satyam that provide IT support,technical help desks, web support, andinfrastructure services to overseas companies.There are also companies working in product
BOX 5.8OUTSOURCING SERVICES ALONG THE VALUE CHAIN
Global outsourcing of services can be classified into five broadcategories, based on their contribution to value and their skillrequirements:
1. Data entry, digitization, conversion, transcription. At thelowest end of the value and skill chain are back-officefunctions such as data entry, digitization, and conversionactivities, and basic clerical services that do not requiredomain knowledge or specialized expertise. One of the mostcommon of these is transcription services, whereby dictationsby doctors or lawyers are converted to written medical orlegal records.
2. Rule-based processing and simple support services. Next inthe value chain are teleworking services, which involve rule-based processing and simple voice and on-line customerrelations services, based on rules set by the client. Theseinclude call-centre services, email-processing, dataprocessing, billing and payments, account opening, andscreening of credit card applications – all at rates as low as$10 per hour.
3. Activities involving problem solving and decision making.Slightly higher up the value chain are activities that involveproblem solving and decision making, such as developing
solutions for improving processes or streamlining systems.In developing countries like India these command rates of$10 to $15 per hour.
4. Complex multimedia support services. Next on the valuechain are teleworking services that involve direct interactionwith customers and more elaborate transactions with theclient, but moving beyond pure voice-based support tomixed media-based support services and beyond writingroutine software applications to the remote management ofsophisticated networks. These include activities like websupport, telemarketing, providing customer help desks,technical back office processing, e-customer relationshipmanagement, website design, software development forentire business processes, and hardware support services.
5. Specialized services requiring domain knowledge and skills.At the top end of the value chain are services that involvedomain expertise and specialized skills. These includeresearch and engineering services such as 3-D modelling,drawing up technical specifications for tenders, plantengineering, piloting prototypes, testing and optimization,redesigning for improving cost-performance ratios, financialanalysis, risk management, equity research services, andconsulting and advisory services.
ASIA-PACIFIC HUMAN DEVELOPMENT REPORT 2006110
development, engineering design, testing, andtechnical analysis.
Philippines is a host to outsourced work by some8,000 foreign companies, covering services suchas graphic design, architectural blueprints,telemarketing, accounting, and software codewriting.
Singapore has service providers engaged inleading-edge functions like remote roboticsmanagement, health care, and genetic diag-nostics.
Viet Nam carries out simple coding jobs forIBM, Cisco, Sony, Nortel Networks, and NTT,but is also increasingly engaging in higher-valueactivities connected to geographic informa-tion systems, computer-aided design, finance,factory automation, healthcare and computeranimation.
Clearly, there could also be opportunities foroutsourcing in geographically isolated states –landlocked countries, for example, and smallisland developing states – especially in those,such as Bhutan and Mongolia, that have a
significant English-speaking population orrelatively high education levels.
Reasons for Outsourcing
Global outsourcing is driven by many differentfactors. In some cases, companies will outsourceto an overseas company that provides specificskills. But generally enterprises are seeking to cutcosts on more basic activities, and so they willbe looking to countries and companies that canprovide low-wage, highly-educated workerswho offer a broad range of skills – and can do sothrough good low-cost, high-bandwidth tele-communications infrastructure. Other factors –in both the buying and selling countries – thatinfluence the choice of outsourcing partners areindicated in Box 5.9.
The principal reason for outsourcing isusually to cut costs, and therefore most out-sourcing goes to low-wage economies. Forexample, in the US telephone operators andmedical transcribers earn around $13 per hour,while in India they would receive less than $2per hour.11 Similarly, in the US a financialanalyst might earn around $35 per hour while acounterpart in the India might get $6 to $15 perhour. One survey concluded that the monthlycost of keeping one high-tech employee in SiliconValley is $15,000 per worker, while someone inNew Delhi with the same skills, responsibilitiesand job package would cost $2,500 a month.This translates into savings of $12,500 permonth, or $150,000 for a year. By outsourcing10 jobs to India, a start-up in the US can thuscut payroll costs by $1.5 million. Initial invest-ment costs are also far lower: setting up a callcentre in Delhi, for example, costs only aroundone-third of what it might cost in the US.12
Many outsourcing firms have realized,however, that they are saving even more as aresult of productivity gains – fewer errors in dataprocessing, for example, or fewer defects incomputer programs, or a higher quality of
Manyoutsourcingfirms haverealized thatthey are savingeven more as aresult ofproductivitygains
BOX 5.9FACTORS SHAPING COMPETITIVENESS IN GLOBAL OUTSOURCING
In the service-providing country
• Availability of labour and skills,the quality manpower andrelated educational investments
• Competitive wages• Strength of domestic IT industry
and its export orientation• Physical infrastructure• Government incentives and
support• The business environment• Intellectual property legislation• State of regulation in supporting
areas such as telecoms and theInternet
In the purchasing countries
• Business cycle conditions• Availability of skills and labour• Relative wages• The need for diversification, risk
pooling, and cost reduction• Technological developments and
possibilities for dis-intermedia-ting services
• Legislation concerning outsourc-ing
• Data protection and intellectualproperty requirements
• Legislation on immigration• International certification for
quality• Diaspora and others with con-
tacts in the providing country
CHAPTER 5: SELLING SERVICES ACROSS FRONTIERS 111
transcription. Outsourcing also allows compa-nies to mitigate risk by diversifying operationsacross a number of centres. At the same time,they can reshape their activities at home to con-centrate their energies on their core compe-tencies.
Constraints on Outsourcing
Not all countries have been able to take advan-tage of outsourcing opportunities. The mainconstraints are:
Lack of Infrastructure. Some of the poorer coun-tries, for example, do not have the necessarytelecommunications systems or reliable powersupplies.
Lack of Skilled Manpower. Only a few countriesin the region have enough educated people withthe right skills, including computer literacy andknowledge of foreign languages, especiallyEnglish.
Weak Legal and Regulatory Frameworks. Out-sourcing companies demand strong legal systemscovering data protection and privacy, particu-larly in areas like health care and financialservices. Similarly, they demand a robust regula-tory framework to protect online payments andtransactions. Many developing countries in theregion do not have legal systems that can meetinternational standards in these areas.
Even countries with considerable experiencein outsourcing can run into problems. India, forexample, is now having difficulty recruitingenough skilled people: the education pipeline isnot producing sufficient educated young people;turnover rates are high, wages are rising andservice providers are poaching among them-selves.
In addition, there are constraints imposedby the outsourcing countries. Some of thesemight be indirect, such as greater restrictions on
temporary work visas for professionals whoneed to spend time overseas preparing and main-taining outsourcing contracts. Other constraintsare more direct, as workers in the outsourcingcountries object to a loss of jobs. In the US,labour unions, like the Communication Workersof America, are lobbying against outsourcing byUS companies or demanding parity in wages bet-ween developing and developed country serviceproviders. In December 2002, for example,22,000 engineers in Seattle threatened to walkout to protest Boeing’s decision to outsourcework to Russian engineers – as a result of whichBoeing halved its employment of Russians.
In response to such pressures, several stateshave been restricting outsourcing by publicbodies. In 2002, New Jersey, for example, passeda bill banning the outsourcing of governmentcontracts to other countries. It is difficult togauge the net impact of such protectionistpressures. Bans on government outsourcing arenot likely to have a major impact, since incountries like India such projects constitute 1 percent or less of outsourcing. However, the protec-tionist challenges could grow and start affectingthe volume and type of business outsourcing.
Employment Impact of Global Outsourcing.Outsourcing employs relatively small numbersof people at the top end of the labour marketand might be thought unlikely to affect povertydirectly. India, for example, has just over amillion people working in software and IT-enabled services, but this amounts to just one-quarter of 1 per cent of all workers. Even if thesector were to grow fourfold over the next fewyears, it would still account for only 1 per centof the work force, and the opportunities wouldbe limited to those who have basic literacy andcomputer skills and access to training oppor-tunities.
However, such work does have someadvantages for human development. First, itdraws in a wider social spectrum than many
Outsourcingemploys
relatively smallnumbers of
people at thetop end of thelabour market;the availability
of relativelyhigh-paid jobshelps to stem
the ‘brain drain’
ASIA-PACIFIC HUMAN DEVELOPMENT REPORT 2006112
other forms of employment. Call centres, forexample, which employ around 50,000 peoplein the Philippines and 150,000 in India, havequite inclusive employment policies: in countriesfacing shortages of skilled labour, companies arehappy to hire people who might traditionallyhave been outside the labour force, includingwomen and retirees. In India, for example,Wipro has 5,000 employees, of whom almosthalf are women; and for ICICI One Source andDakshIndia the proportion of female employeesis around 60 per cent.
Some companies are also experimentingwith locating data centres and telecentres closerto residential areas, or allowing people to workfrom their homes – making it easier for home-makers and retirees to participate. Others havedeliberately focused on expanding employmentopportunities beyond the usual target group ofgraduates and the economically well-off. TheCambodian NGO-initiated enterprise, DigitalData Divide, a digitization and data-entry ser-vices provider, offers jobs to physically chal-lenged people, those affected by land mines andpolio, and orphans, at monthly rates ($65) thatare higher than those in manufacturing ($40).Half of the company’s workforce of a staff of 93are females.13 Thus, global outsourcing canenable less visible and even marginalized groupsto integrate with the labour market. Moreover,as wage rates in this business tend to be higherthan elsewhere, it can provide them with a bigimprovement in their standards of living.
Outsourcing can also help boost nationallevels of skill. This can happen both overseasand at home. Overseas employees can take inworkers to learn about their technical applica-tions, products, processes, and marketing tech-niques. But even the workers who stay at homewill acquire many skills in customer relationshipmanagement – thus learning to focus on qualityand timeliness. The workforce thus acquiresgreater discipline, a more professional workculture, and a greater sense of accountability.
The availability of relatively high-paid jobsalso helps to stem the ‘brain drain’. Outsourcingby multinationals like GE and IBM in developingcountries like India and China has been accom-panied by a significant upward movement insalary levels that reduces the incentive for skilledpeople to emigrate. Indeed, there is some evi-dence of reverse migration: a number of compa-nies are relocating expatriates to offshoreoperations, and many senior professionals andmanagers are also returning voluntarily to theircountry – attracted by the internationally com-parable salaries, improved working conditionsand changing image of their countries.
However, not all the employment effects arepositive, and there is some evidence thatoutsourcing can also lead to de-skilling. This isbecause outsourcing companies can tempt evenhighly trained people to take lower-skilled buthighly paid jobs. In Bangladesh, for example,doctors are accepting work as medical tran-scribers; and engineering and science graduatesare often employed in routine tasks such assoftware programming and web applicationsdesign and support. As well as underutilizingskills, this also risks skewing national educationand training policies towards meeting short-termneeds for lower-skilled people and away fromeducation in more fundamental disciplines andthe longer-term research and development thatwill be needed to help build indigenousmanufacturing capabilities.
Spillover Employment Effects
The benefits of outsourcing are not just, ofcourse, felt by people directly employed. Theseworkers will spend their wages and produceimportant externalities and spillover effects.Most outsourcing employees tend to be in their20s and 30s, an age group that stimulatesdemand for consumer durables and otherservices. The Gurgaon district of Delhi, one ofIndia’s main outsourcing hubs, has seen a rapid
CHAPTER 5: SELLING SERVICES ACROSS FRONTIERS 113
expansion in shopping centres and related infra-structure in response to demand from employeesin the BPO industry.
Outsourcing workers also stimulate a widerange of ancillary services – in housekeeping,security, catering, transport, real estate, tele-coms, and computer equipment provision andmaintenance. Caterers are required for shiftcatering services. Cleaners, janitors, and othersupport staff are required to maintain world-class premises. In the absence of reliable publictransport, fleets of vehicles and drivers are hiredto ferry call centre employees to and from theirhomes. Thus, while the sector itself may bedirectly geared to a certain kind of employeeprofile, it can indirectly create equitable employ-ment opportunities, which are neutral to gender,type of business, and skill level.
Outsourcing also triggers the creation ofnew training institutions and infrastructure, suchas computer technical schools, diploma progra-mmes, and IT training and applications coursesin colleges and universities. As outsourcingproviders look further afield, these institutionsare now appearing beyond the metropolises inthe smaller cities and towns – helping todistribute income and employment benefits.
Social Impact of Outsourcing
Outsourcing can have many positive socialbenefits – by providing age- and gender-neutralemployment to many thousands of people. Butit can also have social costs. Some of these arerelated to difficult working conditions. Theseinclude adverse health effects due to workingnight shifts, the sedentary nature of the jobs, andthe constant use of computers. Long night shiftsat call centres can also prevent young employeesfrom having a normal social life and may isolatethem from their communities.
The rapid growth of the outsourcingindustry is also widening disparities. In India, forexample, Bangalore’s explosive growth has
aggravated inequalities between cities and ruralareas and small towns. Within the city, too,while some special enclaves are being developedfor teleworking establishments, other areas arebeing neglected. Meanwhile, the urban poor aresuffering from rising costs, deteriorating civicamenities, and an influx of migrants. Out-sourcing can thus contribute to a labour marketand information divide that cannot be in theinterests of sustainable long-term development.
Fiscal and Trade Impact
Given its scale, outsourcing might be an impor-tant source of tax revenue that could enabledeveloping-country governments to spend moreon social services. Often, however, the fiscalbenefits are fairly limited. In order to encouragesuch activities, many governments haveexempted them from taxes – or from importduties on hardware and telecoms equipment.Indeed, the government may have spent consi-derable amounts in building communicationsinfrastructure for teleworking establishments.As a result, in fiscal terms outsourcing firms maynot be net contributors but net recipients.
Likewise, on the trade front, although out-sourcing contributes to export earnings, there isalso a significant foreign exchange outflow fromoutsourcing providers – buying bandwidth fromtelecommunication firms, for example, orpurchasing hardware from the outsourcingeconomies.
Domestic Strategies on Outsourcing
Outsourcing can have many effects, bothpositive and negative, for human development(Box 5.10). The challenge for governments is,therefore, to create an environment that isconducive for outsourcing while integrating itwith the rest of the economy, so as to capture theassociated developmental benefits. This cancover a range of policy areas (Box 5.11).
The rapidgrowth of the
outsourcingindustry is also
wideningdisparities
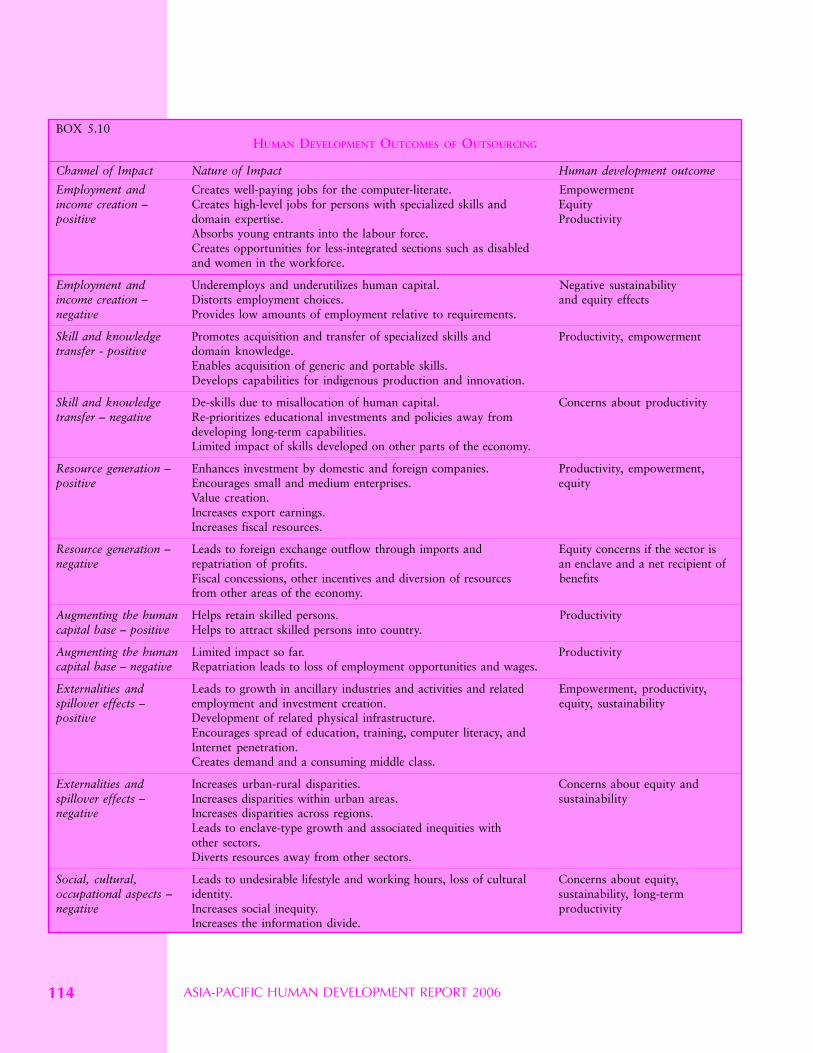
ASIA-PACIFIC HUMAN DEVELOPMENT REPORT 2006114
BOX 5.10HUMAN DEVELOPMENT OUTCOMES OF OUTSOURCING
Channel of Impact Nature of Impact Human development outcome
Employment and Creates well-paying jobs for the computer-literate. Empowermentincome creation – Creates high-level jobs for persons with specialized skills and Equitypositive domain expertise. Productivity
Absorbs young entrants into the labour force.Creates opportunities for less-integrated sections such as disabledand women in the workforce.
Employment and Underemploys and underutilizes human capital. Negative sustainabilityincome creation – Distorts employment choices. and equity effectsnegative Provides low amounts of employment relative to requirements.
Skill and knowledge Promotes acquisition and transfer of specialized skills and Productivity, empowermenttransfer - positive domain knowledge.
Enables acquisition of generic and portable skills.Develops capabilities for indigenous production and innovation.
Skill and knowledge De-skills due to misallocation of human capital. Concerns about productivitytransfer – negative Re-prioritizes educational investments and policies away from
developing long-term capabilities.Limited impact of skills developed on other parts of the economy.
Resource generation – Enhances investment by domestic and foreign companies. Productivity, empowerment,positive Encourages small and medium enterprises. equity
Value creation.Increases export earnings.Increases fiscal resources.
Resource generation – Leads to foreign exchange outflow through imports and Equity concerns if the sector isnegative repatriation of profits. an enclave and a net recipient of
Fiscal concessions, other incentives and diversion of resources benefitsfrom other areas of the economy.
Augmenting the human Helps retain skilled persons. Productivitycapital base – positive Helps to attract skilled persons into country.
Augmenting the human Limited impact so far. Productivitycapital base – negative Repatriation leads to loss of employment opportunities and wages.
Externalities and Leads to growth in ancillary industries and activities and related Empowerment, productivity,spillover effects – employment and investment creation. equity, sustainabilitypositive Development of related physical infrastructure.
Encourages spread of education, training, computer literacy, andInternet penetration.Creates demand and a consuming middle class.
Externalities and Increases urban-rural disparities. Concerns about equity andspillover effects – Increases disparities within urban areas. sustainabilitynegative Increases disparities across regions.
Leads to enclave-type growth and associated inequities withother sectors.Diverts resources away from other sectors.
Social, cultural, Leads to undesirable lifestyle and working hours, loss of cultural Concerns about equity,occupational aspects – identity. sustainability, long-termnegative Increases social inequity. productivity
Increases the information divide.
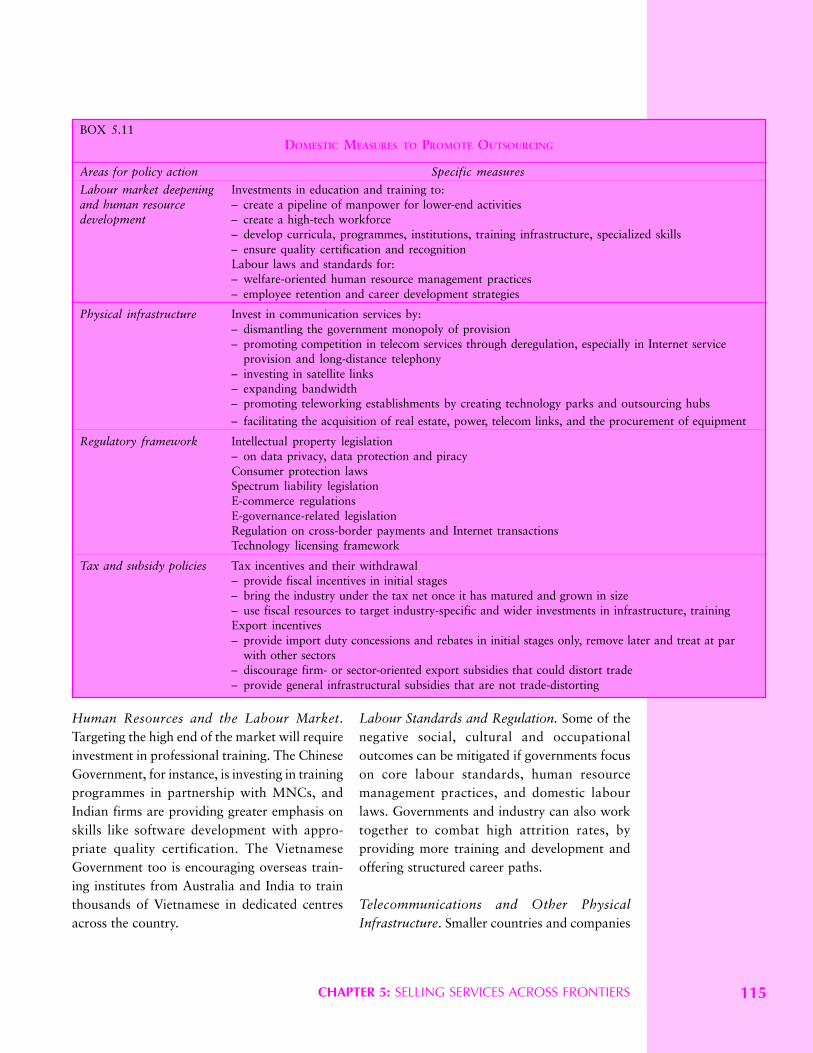
CHAPTER 5: SELLING SERVICES ACROSS FRONTIERS 115
Human Resources and the Labour Market.Targeting the high end of the market will requireinvestment in professional training. The ChineseGovernment, for instance, is investing in trainingprogrammes in partnership with MNCs, andIndian firms are providing greater emphasis onskills like software development with appro-priate quality certification. The VietnameseGovernment too is encouraging overseas train-ing institutes from Australia and India to trainthousands of Vietnamese in dedicated centresacross the country.
Labour Standards and Regulation. Some of thenegative social, cultural and occupationaloutcomes can be mitigated if governments focuson core labour standards, human resourcemanagement practices, and domestic labourlaws. Governments and industry can also worktogether to combat high attrition rates, byproviding more training and development andoffering structured career paths.
Telecommunications and Other PhysicalInfrastructure. Smaller countries and companies
BOX 5.11DOMESTIC MEASURES TO PROMOTE OUTSOURCING
Areas for policy action Specific measures
Labour market deepening Investments in education and training to:and human resource – create a pipeline of manpower for lower-end activitiesdevelopment – create a high-tech workforce
– develop curricula, programmes, institutions, training infrastructure, specialized skills– ensure quality certification and recognitionLabour laws and standards for:– welfare-oriented human resource management practices– employee retention and career development strategies
Physical infrastructure Invest in communication services by:– dismantling the government monopoly of provision– promoting competition in telecom services through deregulation, especially in Internet service
provision and long-distance telephony– investing in satellite links– expanding bandwidth– promoting teleworking establishments by creating technology parks and outsourcing hubs
– facilitating the acquisition of real estate, power, telecom links, and the procurement of equipment
Regulatory framework Intellectual property legislation– on data privacy, data protection and piracyConsumer protection lawsSpectrum liability legislationE-commerce regulationsE-governance-related legislationRegulation on cross-border payments and Internet transactionsTechnology licensing framework
Tax and subsidy policies Tax incentives and their withdrawal– provide fiscal incentives in initial stages– bring the industry under the tax net once it has matured and grown in size– use fiscal resources to target industry-specific and wider investments in infrastructure, trainingExport incentives– provide import duty concessions and rebates in initial stages only, remove later and treat at par
with other sectors– discourage firm- or sector-oriented export subsidies that could distort trade– provide general infrastructural subsidies that are not trade-distorting
ASIA-PACIFIC HUMAN DEVELOPMENT REPORT 2006116
will need to develop their infrastructure. Theycan, for example, deregulate telecoms and Inter-net services and eliminate public monopolies soas to bring down costs. Viet Nam, for example,is planning to dismantle the state monopoly inInternet services, and to allow foreign equityparticipation in the telecom sector. Malaysia hasinvested heavily in IT infrastructure (Box 5.12).
Regulatory Framework. Governments may needto introduce internationally compatible laws andregulations concerning the protection of intellec-tual property rights and Internet transactions,data privacy, consumer protection, e-gover-nance, and spectrum liability.
Fiscal Policy and Incentives. While tax breaksmay be necessary to encourage growth in theinitial stages of a business, the long-term aimshould be to bring the outsourcing providers intothe tax net, so that part of their profits arereinvested in the society.
Negotiation through GATS
Domestic strategies need to be supplementedwith international action. The recent surge inopposition to global outsourcing in key marketslike the US and the UK makes it all the more
important to address this issue through multi-lateral, regional, and bilateral negotiations andagreements.
Currently, the electronic marketplace islargely free of explicit trade barriers and WTOmembers have agreed to temporarily exemptelectronic commerce from customs duties andtaxes. These commitments now need to bebound into agreements to preclude the introduc-tion of new barriers to e-commerce.
Some of the most important opportunitiesfor multilateral action on outsourcing should bethrough the negotiations on the General Agree-ment on Trade in Services (GATS). However, inareas such as distribution, advertising, architec-ture, legal work, accountancy, and computer andrelated services, less than half of the commit-ments in the relevant clauses of GATS are full orunrestricted – mainly due to the lack of commit-ments by developing countries. This kind ofliberalization is best addressed through a‘positive list’ to allow countries to pace thedegree and scope of liberalization in accordancewith their needs and their ability to preparesupporting domestic regulations.
Countries can also pursue their interests inoutsourcing through regional and bilateral tradeand investment agreements, which can preparethe ground for regulatory frameworks that canlater be extended to the multilateral level.
Partnerships
Governments should also be able to rely onsupport from bilateral aid organizations, variousparts of the UN System, and the World Bank –for developing infrastructure, organizingtraining and providing policy advice. They canalso help in improving national statistics onoutsourcing.
In addition, private enterprises, national andmultinational, and their industry associationscan assist in efforts to liberalize markets andcounter protectionist threats. In India, for
BOX 5.12CREATING COMPARATIVE ADVANTAGE FOR OUTSOURCING IN MALAYSIA
Labour costs are far higher in Malaysia than in China and India. Neverthelesswell-developed infrastructure and government support have made it anattractive outsourcing destination. As part of its multimedia Super Corridorproject, the Government has invested around $10 billion in setting up two ITcities – Cyberjaya and Putrajaya – with hi-tech parks, fibre-optic networks,new roads, and laws promoting e-commerce.
Malaysia is also emerging as a hub for research and clinical services inbiotechnology. Based on local capabilities in a variety of Asian languages,like Mandarin, Cantonese, Hokkien, Bahasa Malay, Bahasa Indonesia, Tamil,Hindi, Thai, and Japanese, the Government is promoting the country as ahigh-end contact centre for customer services in the Asia-Pacific region and apan-Asian hub. Outsourcing is expected to provide employment to 50,000persons in the corridor cities by 2011. However, the country faces ashortage of skilled IT workers, and currently imports these from India andChina.
Some of themost importantopportunities formultilateralaction onoutsourcingshould bethrough thenegotiations onthe GeneralAgreement onTrade inServices (GATS)
CHAPTER 5: SELLING SERVICES ACROSS FRONTIERS 117
example, the National Association of SoftwareService Companies (NASSCOM) has helped tohighlight the mutual benefits from outsourcingand dispel misconceptions. Domestic firmsengaged in outsourcing may also want to estab-lish some local presence in their export markets,to enable them to lobby more effectively withconcerned governments and industry bodies.
A New International Division of Labour
Global outsourcing represents a new interna-tional division of labour. While in manufacturingproduction was split across countries based oncompetitive advantage, in outsourcing differentcountries will occupy different parts of theglobal services space.
For many developing countries, this can bea valuable source of growth and economic andhuman development – creating employment andincomes, and empowering many sections ofsociety and promoting growth with equity. It canalso transfer new skills, technologies, andprocesses.
Realizing the potential of outsourcing will,however, require determined and focusedgovernment action to spread the benefits beyondsmall enclaves and ensure that it stimulatesbroad-based growth by integrating outsourcingactivities with the rest of the economy. Toaccomplish this government will need to investin physical and social capital and try to ensurethat enterprises move steadily up the value chain.Overall, global outsourcing must be seen not asa single engine of growth but as another poten-tial avenue for promoting economic and humandevelopment.
International Tourism
After oil and petroleum, the world’s second-largest industry is travel and tourism. Globally,in 2005 this was expected to generate $6.4trillion of economic activity, equivalent to 3.8
per cent of global GDP, though if one alsoconsiders the many other parts of the economythat also depend on tourism, the ‘travel &tourism economy’, the proportion rises to 10.6per cent. Directly the sector employs 74 millionpeople, 2.8 per cent of total world employment;indirectly it employs 222 million people, 8.3 percent of total employment.
A tourist, according to the United Nationsand World Tourism Organization definition, issomeone who is staying outside his or her usualenvironment for not more than one consecutiveyear for leisure, business or other purposes.Some of these people may not travel very far;others will traverse half the globe. Since thisreport is about international trade, it is con-cerned specifically with tourism across inter-national frontiers, though many of the sameconsiderations apply to domestic tourism, whichcan often make a more significant contributionto human development (Box 5.13).
In 2004 there were 763 million internationaltourists, spending around $623 billion. But bythe year 2020, WTO predicts that the number ofinternational arrivals will reach 1.6 billion –spending a total of $2 trillion per year.14 Of theseworldwide arrivals in 2020, 1.2 billion will bethose of intra-regional travellers and 0.4 billionwill be of long-haul travellers.
BOX 5.13THE SIGNIFICANCE OF DOMESTIC TOURISM
With the recent decline in long-haul travel post-9/11, SARS, the Iraq war andthe Asian tsunami, many destinations, especially in the larger countries, havecome to place greater reliance on the domestic market. This has significantadvantages over international tourism: domestic visitors are more likely tosupport smaller local enterprises, help even out the seasonality patterns – andhelp conserve foreign exchange.
China has the world’s largest domestic tourism market. In 2004, thenumber of domestic tourists reached 1.1 billion, and domestic tourismrevenues totalled $57 billion, accounting for 67 per cent of China’s grosstourism revenue.
India too has a huge domestic market. Unconfirmed estimates suggest morethan 350 million domestic tourists, around one-quarter of which is pilgrimagetraffic. Although national tourists spend less than international tourists, theytravel in large numbers and tend to stay longer, and thus help create morejobs (Aibara and Gopalani 2005).
After oil andpetroleum, theworld’s secondlargest industry
is travel andtourism
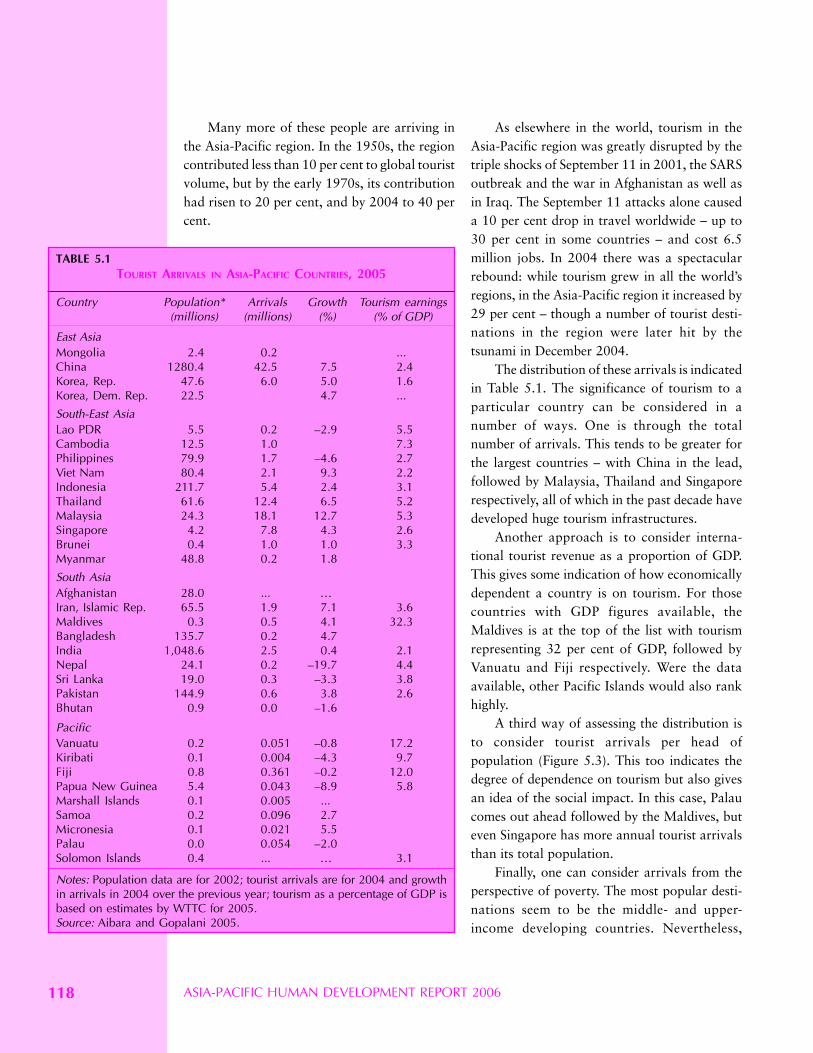
ASIA-PACIFIC HUMAN DEVELOPMENT REPORT 2006118
As elsewhere in the world, tourism in theAsia-Pacific region was greatly disrupted by thetriple shocks of September 11 in 2001, the SARSoutbreak and the war in Afghanistan as well asin Iraq. The September 11 attacks alone causeda 10 per cent drop in travel worldwide – up to30 per cent in some countries – and cost 6.5million jobs. In 2004 there was a spectacularrebound: while tourism grew in all the world’sregions, in the Asia-Pacific region it increased by29 per cent – though a number of tourist desti-nations in the region were later hit by thetsunami in December 2004.
The distribution of these arrivals is indicatedin Table 5.1. The significance of tourism to aparticular country can be considered in anumber of ways. One is through the totalnumber of arrivals. This tends to be greater forthe largest countries – with China in the lead,followed by Malaysia, Thailand and Singaporerespectively, all of which in the past decade havedeveloped huge tourism infrastructures.
Another approach is to consider interna-tional tourist revenue as a proportion of GDP.This gives some indication of how economicallydependent a country is on tourism. For thosecountries with GDP figures available, theMaldives is at the top of the list with tourismrepresenting 32 per cent of GDP, followed byVanuatu and Fiji respectively. Were the dataavailable, other Pacific Islands would also rankhighly.
A third way of assessing the distribution isto consider tourist arrivals per head ofpopulation (Figure 5.3). This too indicates thedegree of dependence on tourism but also givesan idea of the social impact. In this case, Palaucomes out ahead followed by the Maldives, buteven Singapore has more annual tourist arrivalsthan its total population.
Finally, one can consider arrivals from theperspective of poverty. The most popular desti-nations seem to be the middle- and upper-income developing countries. Nevertheless,
Many more of these people are arriving inthe Asia-Pacific region. In the 1950s, the regioncontributed less than 10 per cent to global touristvolume, but by the early 1970s, its contributionhad risen to 20 per cent, and by 2004 to 40 percent.
TABLE 5.1TOURIST ARRIVALS IN ASIA-PACIFIC COUNTRIES, 2005
Country Population* Arrivals Growth Tourism earnings(millions) (millions) (%) (% of GDP)
East Asia Mongolia 2.4 0.2 ...China 1280.4 42.5 7.5 2.4Korea, Rep. 47.6 6.0 5.0 1.6Korea, Dem. Rep. 22.5 4.7 ...
South-East AsiaLao PDR 5.5 0.2 – 2.9 5.5Cambodia 12.5 1.0 7.3Philippines 79.9 1.7 – 4.6 2.7Viet Nam 80.4 2.1 9.3 2.2Indonesia 211.7 5.4 2.4 3.1Thailand 61.6 12.4 6.5 5.2Malaysia 24.3 18.1 12.7 5.3Singapore 4.2 7.8 4.3 2.6Brunei 0.4 1.0 1.0 3.3Myanmar 48.8 0.2 1.8
South Asia Afghanistan 28.0 ... … Iran, Islamic Rep. 65.5 1.9 7.1 3.6Maldives 0.3 0.5 4.1 32.3Bangladesh 135.7 0.2 4.7 India 1,048.6 2.5 0.4 2.1Nepal 24.1 0.2 – 19.7 4.4Sri Lanka 19.0 0.3 – 3.3 3.8Pakistan 144.9 0.6 3.8 2.6Bhutan 0.9 0.0 – 1.6
Pacific Vanuatu 0.2 0.051 – 0.8 17.2Kiribati 0.1 0.004 – 4.3 9.7Fiji 0.8 0.361 – 0.2 12.0Papua New Guinea 5.4 0.043 – 8.9 5.8Marshall Islands 0.1 0.005 ... Samoa 0.2 0.096 2.7 Micronesia 0.1 0.021 5.5 Palau 0.0 0.054 – 2.0 Solomon Islands 0.4 ... … 3.1
Notes: Population data are for 2002; tourist arrivals are for 2004 and growthin arrivals in 2004 over the previous year; tourism as a percentage of GDP isbased on estimates by WTTC for 2005.Source: Aibara and Gopalani 2005.
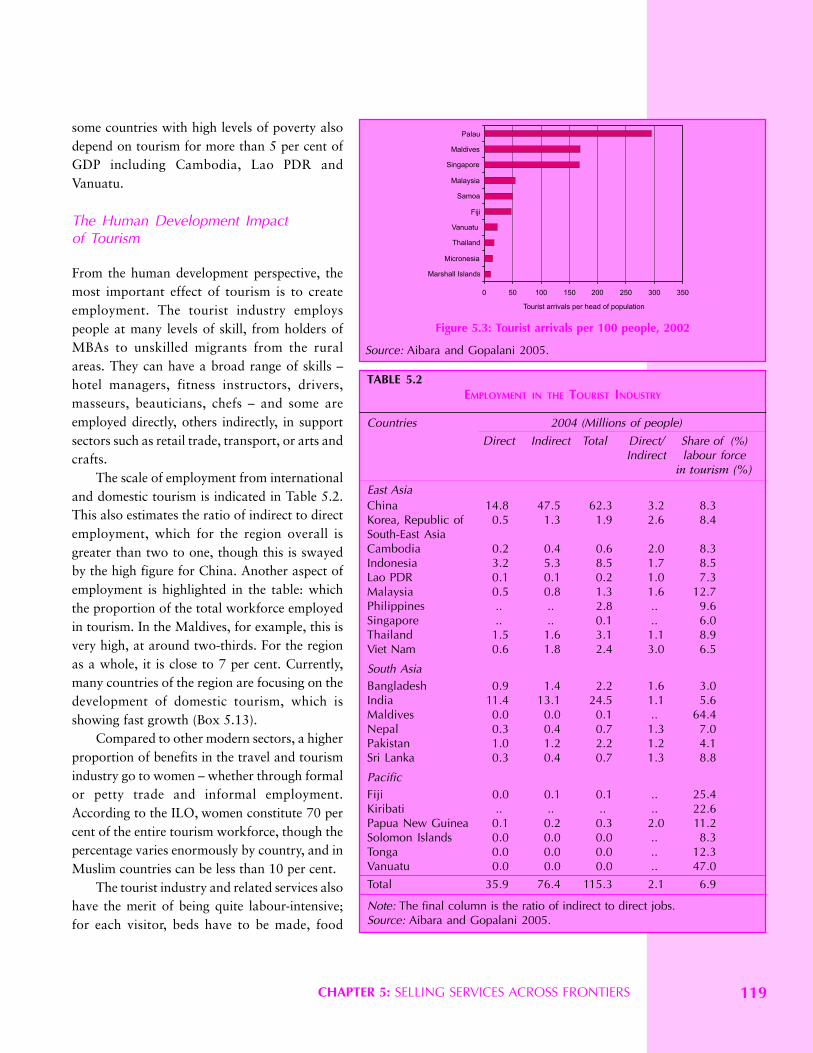
CHAPTER 5: SELLING SERVICES ACROSS FRONTIERS 119
some countries with high levels of poverty alsodepend on tourism for more than 5 per cent ofGDP including Cambodia, Lao PDR andVanuatu.
The Human Development Impactof Tourism
From the human development perspective, themost important effect of tourism is to createemployment. The tourist industry employspeople at many levels of skill, from holders ofMBAs to unskilled migrants from the ruralareas. They can have a broad range of skills –hotel managers, fitness instructors, drivers,masseurs, beauticians, chefs – and some areemployed directly, others indirectly, in supportsectors such as retail trade, transport, or arts andcrafts.
The scale of employment from internationaland domestic tourism is indicated in Table 5.2.This also estimates the ratio of indirect to directemployment, which for the region overall isgreater than two to one, though this is swayedby the high figure for China. Another aspect ofemployment is highlighted in the table: whichthe proportion of the total workforce employedin tourism. In the Maldives, for example, this isvery high, at around two-thirds. For the regionas a whole, it is close to 7 per cent. Currently,many countries of the region are focusing on thedevelopment of domestic tourism, which isshowing fast growth (Box 5.13).
Compared to other modern sectors, a higherproportion of benefits in the travel and tourismindustry go to women – whether through formalor petty trade and informal employment.According to the ILO, women constitute 70 percent of the entire tourism workforce, though thepercentage varies enormously by country, and inMuslim countries can be less than 10 per cent.
The tourist industry and related services alsohave the merit of being quite labour-intensive;for each visitor, beds have to be made, food
Figure 5.3: Tourist arrivals per 100 people, 2002
Source: Aibara and Gopalani 2005.
TABLE 5.2EMPLOYMENT IN THE TOURIST INDUSTRY
Countries 2004 (Millions of people)Direct Indirect Total Direct/ Share of (%)
Indirect labour forcein tourism (%)
East Asia China 14.8 47.5 62.3 3.2 8.3Korea, Republic of 0.5 1.3 1.9 2.6 8.4South-East Asia Cambodia 0.2 0.4 0.6 2.0 8.3Indonesia 3.2 5.3 8.5 1.7 8.5Lao PDR 0.1 0.1 0.2 1.0 7.3Malaysia 0.5 0.8 1.3 1.6 12.7Philippines .. .. 2.8 .. 9.6Singapore .. .. 0.1 .. 6.0Thailand 1.5 1.6 3.1 1.1 8.9Viet Nam 0.6 1.8 2.4 3.0 6.5
South AsiaBangladesh 0.9 1.4 2.2 1.6 3.0India 11.4 13.1 24.5 1.1 5.6Maldives 0.0 0.0 0.1 .. 64.4Nepal 0.3 0.4 0.7 1.3 7.0Pakistan 1.0 1.2 2.2 1.2 4.1Sri Lanka 0.3 0.4 0.7 1.3 8.8
PacificFiji 0.0 0.1 0.1 .. 25.4Kiribati .. .. .. .. 22.6Papua New Guinea 0.1 0.2 0.3 2.0 11.2Solomon Islands 0.0 0.0 0.0 .. 8.3Tonga 0.0 0.0 0.0 .. 12.3Vanuatu 0.0 0.0 0.0 .. 47.0
Total 35.9 76.4 115.3 2.1 6.9
Note: The final column is the ratio of indirect to direct jobs.Source: Aibara and Gopalani 2005.
ASIA-PACIFIC HUMAN DEVELOPMENT REPORT 2006120
cooked and floors swabbed. In India, forexample, it has been calculated that a $23,000investment will generate 89 jobs in the hotel andrestaurant industry, compared with 45 in agri-culture and only 13 in manufacturing.15
Many of these jobs are low-paid and seaso-nal, but they do offer low-skilled workers oppor-tunities to move up the income ladder. Manypoor people, who have lost work in agricultureas a result of more liberalized and competitiveglobal food markets, have been transferred tothe tourist industry either to work permanentlyor as part-time or casual labourers during thehigh season.
The poor can have a direct stake in thetourism industry not just through jobs but alsothrough many business opportunities, particu-larly in the informal sector, where there are manysmall-scale, locally run tourism enterprises.These benefits can also be geographically dis-persed. Although high-volume tourism can beconcentrated in beach resorts, cities or famoussites, there are also opportunities to createtourism-related jobs in remote areas that havefew other options.
In addition to its contribution to povertyreduction through employment, tourism alsohelps boost government revenues through taxa-tion. This can be generated directly through atourism tax that is paid either to the local ornational authorities, or through taxes on the pro-fits of tourist-related businesses. These revenuescan then be invested in public services. Moreindirectly, by boosting foreign exchange earningstourism supports macro-economic stability,which again contributes to poverty reduction.
However, it should also be noted that muchtourist revenue leaves the country – throughpayments to foreign-owned hotel chains,imports of goods for the tourism industries, orrevenues accruing to foreign airlines. In smallisland nations these ‘leakages’ can be quite large– though not necessarily higher than for othersectors such as manufacturing.
For its contribution to poverty reduction,tourism can be considered in three mainsegments: business travel, leisure travel, andnature-based eco-tourism.
Business Travel. In the Asia-Pacific region,business travellers are most likely to go to largeurban centres like Bangkok, Hong Kong,Mumbai, Shanghai and Singapore. Here they,like other travellers, create a demand forservices, though the extent to which theseservices are provided by the poor will differ fromcity to city – greater in Mumbai and Shanghai,for example, which have millions of poor peopleliving in urban slums, than in wealthierSingapore. In addition, business travellers canhelp combat poverty since they further their ownbusinesses; this should in the longer term boosteconomic growth, which, if equitablydistributed, will expand opportunities for all.
Leisure Travel. As with business travellers, theimpact of leisure travellers on poverty willdepend on their choice of destination. Alsoimportant, however, is how they interact withthe local environment. People travelling onpackage tours, especially those going to enclavedevelopments or all-inclusive resorts, or who arearriving on cruise ships, may meet very few localpeople. They will certainly encounter waiters orreceptionists, or others formally employed in thetourist industry, but they will generate less workfor informal businesses. Budget tourists, on theother hand, although they spend less in total ontheir trip, may spend more on local goods andservices. Nevertheless even the income fromhigh-end tourism can help combat poverty if it isredistributed through government spending. Anumber of Asian countries, such as Bhutan andthe Maldives, have pursued this low-volume,high-yield route (Box 5.14).
Nature-based and Eco-tourism. Leisure visitorflows continue to be driven by mass tourism, but
From the humandevelopmentperspective, themost importanteffect of tourismis to createemployment.The poor canhave a directstake in thetourism industry,not just throughjobs but alsothrough manybusinessopportunities
CHAPTER 5: SELLING SERVICES ACROSS FRONTIERS 121
BOX 5.14HARNESSING LEISURE TRAVEL IN THE MALDIVES
The Maldives has been extremely successful in developing a viable tourismindustry, which directly and indirectly is responsible for over 70 per cent ofGDP. And with an economically active population of 88,000 people, thisprovides 25,000 jobs, though 6,800 of these are held by expatriates.
In the late 1970s and early 1980s, the Maldives had no choice but topromote the mid-scale tourist segment – till such time as the islands attainedthe critical mass required to sustain and encourage commercial air traffic andthe requisite infrastructure. Lately, however, given the small size of thecountry and its fragile ecosystems, the Government has taken a consciousdecision to focus on high-end tourism and has encouraged the growth ofboutique-style, luxury resort developments. This approach has helpedmaximize revenues generated for both government and private sectorinvestors while maintaining environmental and social sustainability. TheMaldives does still offer a mix of properties to cater to different groups, butit also hosts some of the world’s top resorts. These are clearly attractive sincethe visitor repeat rate is 20–30 per cent. These are also very profitable, andthe high rates of return for most projects are encouraging many investors andtop hotel chains to establish a presence.Source: World Bank, ADB and UN 2005.
there has been a noticeable shift towards niche,special-interest and experiential tourism. Leisurevisitors are increasingly seeking to spend timeon understanding the culture, heritage andnatural environment of the places they visit – atrend that bodes well many rural and remoteareas. The fastest-growing form of special-interest tourism is eco-tourism – which refers totravel to natural areas in responsible ways thatconserve the environment and sustain the well-being of local people. Bhutan and Nepal, forexample, and the relatively underdevelopedNorth-East region of India, are uniquely placedto build on their comparative advantage in thisarea. Indeed, Asia as a whole has many of theworld’s major Buddhist heritage sites. Nature-based tourism offers many advantages forpoverty elimination. It takes place in remoteareas where residents are likely to be poor. Itinvolves a higher proportion of independenttravellers who may spend more locally. It alsocontributes to the conservation of the localheritage and to biodiversity. But it also bringsrisks. Nature-based tourism does not necessarilyhave low impact, particularly if it occurs infragile areas. It can also suffer from high‘leakage’ if it requires importing supplies andskills.
Potential Negative Impacts of Tourism
As with other components of economic growthand globalization, tourism can also have somenegative effects.
Inflation. Investment in tourist destinations canpush up prices of land, accommodation and food– in some cases driving poor people out.
Resource Conflicts. Tourist enterprises can alsoharm many livelihoods by taking over naturalassets such as land or beaches or by pollutingwaterways. People in coastal communities inmany Pacific Islands, for example, rely on fish
for their main source of protein and income andcan see their food security and livelihoodsundermined by tourist development.
Burden on Services. New tourist enterprises putpressure on water supplies, for example, and onwaste management services – burdens that areoften passed on to other local residents andbusinesses.
Environmental Destruction. Mass tourism isgenerally associated with high consumption ofwater and energy. Hotels are often concentratedin small areas, and they contribute to theincreasing traffic congestion and air and waterpollution. In some cases tourists who areattracted by the remoteness or beauty oflocations can effectively destroy what they havecome to visit – as roads and hotels intrude onnatural vistas, for example, or trekkers erodepaths. And in coastal areas, activities such assnorkelling and scuba diving can endangerfragile marine ecosystems.
Spread of Disease. There is no establishedcorrelation between AIDS and tourism, but it
Touristenterprises can
also harm manylivelihoods by
taking overnatural assets
such as land orbeaches or by
pollutingwaterways
ASIA-PACIFIC HUMAN DEVELOPMENT REPORT 2006122
BOX 5.15RAPID TOURIST DEVELOPMENT IN A REMOTE AREA:
ANGKOR, CAMBODIA
The Angkor temples near Siem Reap in Cambodia are perhaps the singlelargest cultural tourism ‘discovery’ in the last decade for Buddhist heritage.After the fall of the Khmer Rouge and the installation of a democraticgovernment and the subsequent opening up of the country, the temples ofAngkor caught the attention of the international culture tourist. Fromscarcely any in the early 1990s, annual international visitor arrivals rose to561,000 in 2004.
Tourism has changed the economics of the entire region. The town of SiemReap has seen phenomenal growth in roads and air connectivity. Over theperiod 1998-2003 the number of hotel rooms increased by 29 per cent peryear. Tourism has also spawned hitherto-forgotten industries in stone carvingand handicrafts – and boosted many other local enterprises.
This success is attributed to the quality of the temples themselves, theambience of the area, with its tall leafy trees, and the combined efforts of theGovernment, the private sector and NGOs. Now a region that had beenexporting workers to the rest of the country is importing labour.
Source: Ministry of Tourism, Cambodia 2004; Mahajan and Aibara, 2001.
does seem that in many countries, such asThailand, the HIV prevalence rate is particularlyhigh in tourist areas, and the continuing increasein tourist numbers can aggravate the problem.
Cultural Issues. Many tourists, who are typicallyricher than the local population, can undermineage-old cultures by introducing consumeristvalues. Their hedonistic lifestyles can also offendthe sensibilities of conservative communities. Inaddition, adapting local culture to tourism,through special performances, for example, canlead to a loss of identity and authenticity.
Exploitation of Women. Women may while gainnew jobs in the tourism industry, here, as in mostother sectors, they are often at a disadvantage.Since they have less control over land and otherproperties, they find it more difficult to take fulladvantage of economic opportunities. Beingvulnerable, women can also be subject to sexualexploitation.
Pro-poor Tourist Development
While tourism can lead to developmental
problems, these can be resolved or minimizedwith proper planning and management. Amongthe priorities should be:
Planning and Support. Governments need to beinvolved in establishing national and regionalparameters for the industry as well as in creatingsupport institutions, such as tourist boards andtraining institutes.
Infrastructure. This is particularly important inremote regions, where tourism represents one ofthe few economic development opportunities –though in some cases the lack of infrastructuremay be beneficial if it deters mass tourism toenvironmentally sensitive destinations.
Cultural Diversity. Governments need to protectcultural diversity – allowing local people toparticipate in the economic benefits of tourism,while protecting their cultural heritage. One ofthe most remarkable examples of rapid develop-ment of infrastructure for tourism is at Angkorin Cambodia (Box 5.15).
Training. Jobs in the industry do not normallyrequire academic qualifications, and in manycountries the major hotel groups and travel com-panies tend to rely on their own inhouse trainingfacilities. This puts smaller enterprises at adisadvantage. Government agencies may, there-fore, work with the private sector on training,mentoring and short education courses that willhelp more people benefit.
Linkages for the Poor. Economic ‘leakages’ needto be examined and, where possible, counte-racted. Large tourist operators can, for example,build partnerships with local small- andmedium-size enterprises – purchasing localmaterials, outsourcing laundry and other suchservices, showcasing handicrafts and creatingpackages of local excursions. The operators canthus take into account commercial returns, while
While tourismcan lead todevelopmentalproblems, thesecan be resolvedor minimizedwith properplanning andmanagement
CHAPTER 5: SELLING SERVICES ACROSS FRONTIERS 123
simultaneously seeking to optimize benefits forthe marginalized.
The New Trade in Economic Services
The Asia-Pacific region is in the forefront of theinternational trade in services – in particular,through international migration, businessoutsourcing and tourism. But in all these areaspolicy makers will need to take firm and wide-ranging action to ensure that these dynamicsectors fulfil their potential to promote humandevelopment.
For migration, both source country anddestination countries can do more to makemigration a more productive and fulfillingexperience. Source countries can ensure that
migrants are well informed, financed and trainedbefore they depart, and destination countries canmake the migration process simpler and moretransparent.
For business process outsourcing, Govern-ments have a range of policy options to ensurethat it makes a stronger contribution to humandevelopment, including building infrastructure,training the workforces and ensuring the bestregulatory and fiscal environment.
Regarding tourism, many of the problemscan be resolved or minimized with proper plan-ning and management – building the appropriateinfrastructure, for example, providing trainingto people working in smaller enterprises, andensuring better economic links between largertourist operators and poor communities.
CHAPTER 6: TRADING OPPORTUNITIES FOR THE LEAST DEVELOPED COUNTRIES 127
In principle, all countries should be able to usetheir comparative advantages to benefit frominternational markets and free trade. In practice,the scales are heavily weighted in favour of thelarger and more advanced countries. Thedeveloping countries, and particularly the LeastDeveloped Countries (LDCs), find themselves ina much weaker position.
The Asia-Pacific region is home to 37 percent of the world’s LDC population, with14 of the 50 LDCs. They are: Afghanistan,Bangladesh, Bhutan, Cambodia, Kiribati, LaoPDR, Maldives, Myanmar, Nepal, Samoa,Solomon Islands, Timor-Leste, Tuvalu andVanuatu. All qualify as LDCs because they satis-fy three criteria: low incomes, human resourceweakness and economic vulnerability.1 Even so,they are clearly a very diverse group. Indeed, theregion is home to the world’s most populousLDC, Bangladesh, and the least, Tuvalu.Geographically too they can be very different:four are landlocked countries, for example,while seven are island states2 (Table 6.1).
The LDCs are vulnerable on many fronts:
• Economic. Exposure to exogenous shocksthat adversely affect incomes, employment,domestic production, distribution, markets,consumption, and the stock of wealth. LDCsalso have a limited capacity to deal withsuch shocks.
When it comes to integrating into international trade, the Least Developed Countries arein a very vulnerable position. They typically have small economies, difficult topographies,and are located far from international markets, in which they are minor and weakplayers. They do benefit from some concessions from the developed countries, but willneed fairer treatment at the WTO, as well as international assistance, if they are to useinternational trade to promote human development.
Chapter
Trading Opportunities for theLeast Developed Countries
6
• Environmental. Exposure to calamitiesinduced by natural or human-made factors.Small island states of the Pacific, forexample, are often hit by droughts, floods,hurricanes, and volcanoes and earthquakes,while mountainous countries in Asia areprone to flashfloods, volcanic eruptions andearthquakes.
• Social. Exposure to factors that underminesocial cohesion, introduce systemic socialpathologies, and erode social capital.Because the LDCs have little capacity torespond, these events tend to recur.
• Institutional. Limited capacity of domesticinstitutions, including the State, to respondto the complexity and intensity of pressuresflowing from globalization.
As a group, the region’s LDCs have madesignificant progress. During the period 1990–2000, they increased their average per-capitaGDP by one and a half times and their exportsthree times. Social indicators also improved.Over the same period the adult literacy rateincreased from 60 to 71 per cent, life expectancyrose from 58 to 62 years, and the infantmortality rate per 1,000 live births rate droppedfrom 77 to 55.
Nevertheless, they were starting from quitelow levels and still have high rates of povertyand hunger. In 2003 the average per-capita GDP
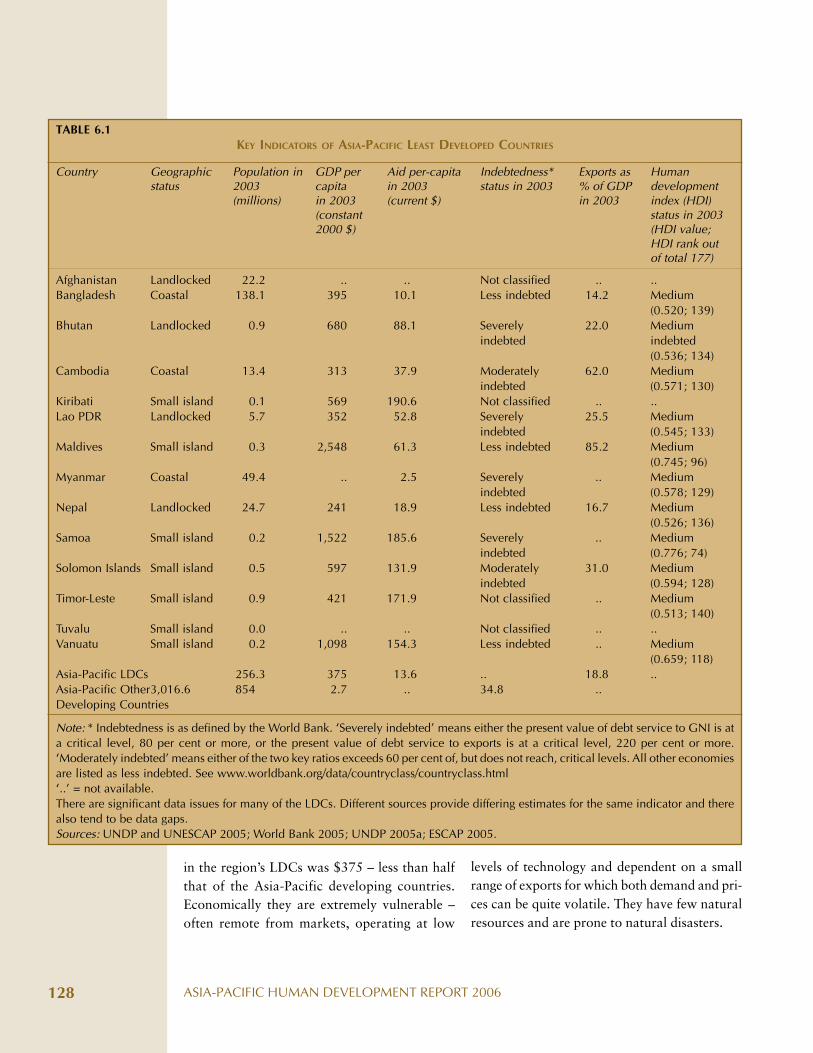
ASIA-PACIFIC HUMAN DEVELOPMENT REPORT 2006128
in the region’s LDCs was $375 – less than halfthat of the Asia-Pacific developing countries.Economically they are extremely vulnerable –often remote from markets, operating at low
TABLE 6.1KEY INDICATORS OF ASIA-PACIFIC LEAST DEVELOPED COUNTRIES
Country Geographic Population in GDP per Aid per-capita Indebtedness* Exports as Humanstatus 2003 capita in 2003 status in 2003 % of GDP development
(millions) in 2003 (current $) in 2003 index (HDI)(constant status in 20032000 $) (HDI value;
HDI rank outof total 177)
Afghanistan Landlocked 22.2 .. .. Not classified .. ..Bangladesh Coastal 138.1 395 10.1 Less indebted 14.2 Medium
(0.520; 139)Bhutan Landlocked 0.9 680 88.1 Severely 22.0 Medium
indebted indebted(0.536; 134)
Cambodia Coastal 13.4 313 37.9 Moderately 62.0 Mediumindebted (0.571; 130)
Kiribati Small island 0.1 569 190.6 Not classified .. ..Lao PDR Landlocked 5.7 352 52.8 Severely 25.5 Medium
indebted (0.545; 133)Maldives Small island 0.3 2,548 61.3 Less indebted 85.2 Medium
(0.745; 96)Myanmar Coastal 49.4 .. 2.5 Severely .. Medium
indebted (0.578; 129)Nepal Landlocked 24.7 241 18.9 Less indebted 16.7 Medium
(0.526; 136)Samoa Small island 0.2 1,522 185.6 Severely .. Medium
indebted (0.776; 74)Solomon Islands Small island 0.5 597 131.9 Moderately 31.0 Medium
indebted (0.594; 128)Timor-Leste Small island 0.9 421 171.9 Not classified .. Medium
(0.513; 140)Tuvalu Small island 0.0 .. .. Not classified .. ..Vanuatu Small island 0.2 1,098 154.3 Less indebted .. Medium
(0.659; 118)Asia-Pacific LDCs 256.3 375 13.6 .. 18.8 ..Asia-Pacific Other3,016.6 854 2.7 .. 34.8 ..Developing Countries
Note: * Indebtedness is as defined by the World Bank. ‘Severely indebted’ means either the present value of debt service to GNI is ata critical level, 80 per cent or more, or the present value of debt service to exports is at a critical level, 220 per cent or more.‘Moderately indebted’ means either of the two key ratios exceeds 60 per cent of, but does not reach, critical levels. All other economiesare listed as less indebted. See www.worldbank.org/data/countryclass/countryclass.html‘..’ = not available.There are significant data issues for many of the LDCs. Different sources provide differing estimates for the same indicator and therealso tend to be data gaps.Sources: UNDP and UNESCAP 2005; World Bank 2005; UNDP 2005a; ESCAP 2005.
levels of technology and dependent on a smallrange of exports for which both demand and pri-ces can be quite volatile. They have few naturalresources and are prone to natural disasters.
CHAPTER 6: TRADING OPPORTUNITIES FOR THE LEAST DEVELOPED COUNTRIES 129
LDCs and Liberalization
One area where LDCs are especially exposed isinternational trade. For many LDCs trade –exports plus imports – represents a significantproportion of economic activity. In fact, theirtrade-to-GDP ratios are often higher than thoseof many developing countries, or even developedones: 127 per cent for Cambodia in 2002, forexample, and 152 per cent for Maldives. Theyalso tend to have very open trade regimes, withlow tariff or non-tariff barriers. According to theIMF’s index of trade restrictiveness, of the 46LDCs around the world for which data wereavailable in 2004, only four had average tariffrates above 25 per cent. Moreover, for 29countries their non-tariff barriers were eitherlow or minor.3
However, these open trade regimes are notprimarily the result of multilateral commitmentsnegotiated during the Uruguay Round or withthe WTO. More often, LDCs have takenunilateral steps to open up their economies aspart of broader programmes of domestic reform.Of the 21-percentage-point cut in averageweighted tariffs of all developing countriesbetween 1983 and 2003, two-thirds was theresult of autonomous liberalization.4
Why do LDCs not Benefit Sufficientlyfrom Trade?
Conventional wisdom suggests that increasingexports of any kind should be beneficial – pro-viding much-needed foreign exchange to investin economic development and alleviate poverty.Unfortunately, although LDCs have often haddynamic export sectors since the late 1980s, theyhave not achieved commensurate economicgrowth, or a significant reduction in poverty.
Why have the LDCs not been able to usetrade to boost economic growth? Many of theconstraints are the same as those that hold backeconomic development generally: low levels of
skill and technology that lead to low produc-tivity; poor infrastructure; few linkages betweenproductive sectors; and the lack of a financialsector that can provide capital at reasonableinterest rates.
Many also face serious geographic obsta-cles. Afghanistan, Bhutan, Nepal and Myanmar,for example, have some very inaccessiblemountainous terrain. Since road construction isexpensive, these countries can link many of theirregions only by air transport or tortuous,winding roads, adding greatly to the cost ofdoing business. Economic development can alsobe slowed if populations are very scatteredacross the landscape – whether over mountainranges, or widely separated islands, as in theMaldives, for example, or the Solomon Islands.This not only makes it more difficult to pro-vide social services but also slows economicintegration.
Geography hampers not just nationaleconomic development but also internationaltrade. Many landlocked countries face hightransport costs that eat into the revenue fromexports, and also add to the costs of imports.These countries are also vulnerable to policychanges in the neighbouring countries throughwhich their goods have to transit.
But geography can impede trade even forcountries with their own coastlines. The poorestcountries tend to have only a few major ports,so exporters located far from those ports are atsevere cost disadvantages. Indeed, if their exportvolumes do not justify regular ship calls, expor-ters might have to use ports in neighbouringcountries.5
LDCs with small economies can thus findthemselves with multiple cost disadvantages.One estimate suggests that telephone services,electricity services and personal travel in micro-states cost around twice as much as in theaverage country and are particularly damagingto trade – sea freight costs can be three times ashigh.6
Trade representsa significant
proportion ofeconomic
activity
LDCs with smalleconomies canfind themselves
with multipledisadvantages
ASIA-PACIFIC HUMAN DEVELOPMENT REPORT 2006130
LDCs also suffer in international tradebecause they are minor players. For individualcommodities, they typically make only a smallcontribution to the global market so they cannotinfluence international prices. This means theybecome ‘price takers’ and have to accept whatthey are offered. If other producers increase theiroutput, this can push down international prices,wiping out the LDCs’ already-low profitmargins. In the short term, this can deliver asharp economic shock or in the longer term,push them into a ‘poverty trap’.7
They are also vulnerable if they have alimited range of exports. LDCs have to specializein products in which they have a comparativeadvantage, and as a result, many still rely onagricultural goods: for Kiribati, for example,agricultural products account for nearly 89 percent of exports, and for Vanuatu 54 per cent.8
Even countries that export manufactured goodstend to concentrate on one sector such as textilesand clothing – which in 2003 accounted for 40per cent of exports from Nepal, 76 per cent ofthose from Bangladesh, and 95 per cent of thosefrom Cambodia. Of the 4,162 products exportedby the LDCs to 30 major trading partners in2000, 127 accounted for 90 per cent of theirtotal export trade.9 For all LDCs, the exportconcentration ratio – the share of the principalexport product in the total export value – hasremained high and largely unchanged since1980.10
Trade integration has also had a limitedimpact on poverty because it encourages an‘enclave-type’ growth pattern. Certain sectors doreasonably well, but leave the rest behind. Eventhe agricultural export sector tends to have fewlinks with the subsistence agrarian activities onwhich most people depend for their livelihoods.
In these circumstances, it may not beobvious why LDCs would want to gain accessto the World Trade Organization and the furtherliberalization that this implies. For most,however, the alternative is worse – margina-
lization or bilateral control by one or two majorpowers. The multilateral WTO is still a betteroption if it offers some consistent basic groundrules.11 Accession to the WTO can offer:
• Binding commitments to stable policies• Predictability of market access• Shelter against unilateral pressures from
powerful countries• Access to a powerful dispute settlement
mechanism• Expectations of a role in shaping the future
of world trade
Experience with Trade Integration
In the past, most LDCs have liberalized tradeunilaterally. In future, however, they are morelikely to do so on a reciprocal basis, multilateral,regional or bilateral. Their main multilateraloption is the WTO which currently has 149members. Of the 50 LDCs, 32 are now WTOmembers, and 8 others are in the process ofaccession. A few Asian LDCs, such as Bangla-desh, were founder members of the WTO whenit was signed into existence in 1994, but othersjoined later. Of the Asia-Pacific LDCs, Bangla-desh, Cambodia, the Maldives, Myanmar, Nepaland the Solomon Islands are now members,while Bhutan, Lao PDR, Samoa and Vanuatu arein the process of joining.
Many LDCs find this accession process verydifficult. They lack the trained people needed tounderstand the implications of trade agreements– either the commitments or the policy flexibi-lities. Even the few Asia Pacific LDCs that havemissions in Geneva can devote only a few staffmembers to participate in WTO negotiations. Asa result, even well-meaning officials may be un-able to exploit opportunities during negotiationsand can sign agreements that compromise natio-nal interests and human development priorities.
The same limitations are evident in civilsociety organizations. They too lack the
Trade integrationhas had alimited impacton povertybecause itencourages an‘enclave-type’growth pattern
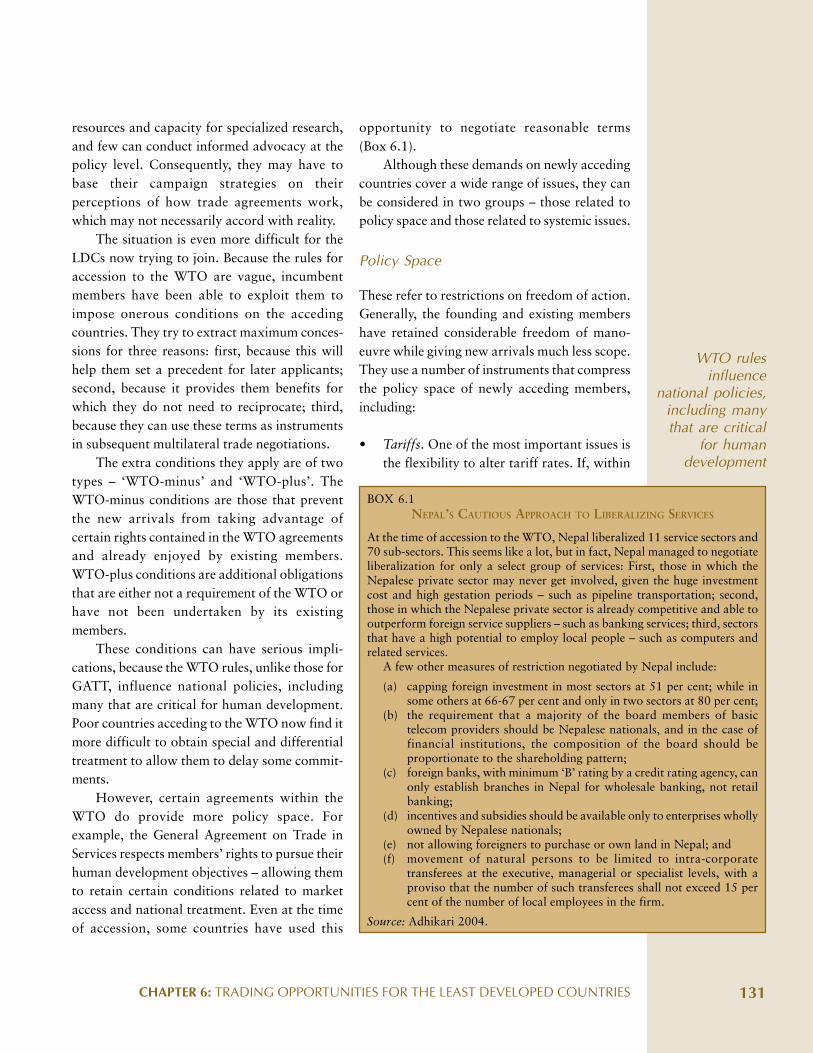
CHAPTER 6: TRADING OPPORTUNITIES FOR THE LEAST DEVELOPED COUNTRIES 131
resources and capacity for specialized research,and few can conduct informed advocacy at thepolicy level. Consequently, they may have tobase their campaign strategies on theirperceptions of how trade agreements work,which may not necessarily accord with reality.
The situation is even more difficult for theLDCs now trying to join. Because the rules foraccession to the WTO are vague, incumbentmembers have been able to exploit them toimpose onerous conditions on the accedingcountries. They try to extract maximum conces-sions for three reasons: first, because this willhelp them set a precedent for later applicants;second, because it provides them benefits forwhich they do not need to reciprocate; third,because they can use these terms as instrumentsin subsequent multilateral trade negotiations.
The extra conditions they apply are of twotypes – ‘WTO-minus’ and ‘WTO-plus’. TheWTO-minus conditions are those that preventthe new arrivals from taking advantage ofcertain rights contained in the WTO agreementsand already enjoyed by existing members.WTO-plus conditions are additional obligationsthat are either not a requirement of the WTO orhave not been undertaken by its existingmembers.
These conditions can have serious impli-cations, because the WTO rules, unlike those forGATT, influence national policies, includingmany that are critical for human development.Poor countries acceding to the WTO now find itmore difficult to obtain special and differentialtreatment to allow them to delay some commit-ments.
However, certain agreements within theWTO do provide more policy space. Forexample, the General Agreement on Trade inServices respects members’ rights to pursue theirhuman development objectives – allowing themto retain certain conditions related to marketaccess and national treatment. Even at the timeof accession, some countries have used this
opportunity to negotiate reasonable terms(Box 6.1).
Although these demands on newly accedingcountries cover a wide range of issues, they canbe considered in two groups – those related topolicy space and those related to systemic issues.
Policy Space
These refer to restrictions on freedom of action.Generally, the founding and existing membershave retained considerable freedom of mano-euvre while giving new arrivals much less scope.They use a number of instruments that compressthe policy space of newly acceding members,including:
• Tariffs. One of the most important issues isthe flexibility to alter tariff rates. If, within
BOX 6.1NEPAL’S CAUTIOUS APPROACH TO LIBERALIZING SERVICES
At the time of accession to the WTO, Nepal liberalized 11 service sectors and70 sub-sectors. This seems like a lot, but in fact, Nepal managed to negotiateliberalization for only a select group of services: First, those in which theNepalese private sector may never get involved, given the huge investmentcost and high gestation periods – such as pipeline transportation; second,those in which the Nepalese private sector is already competitive and able tooutperform foreign service suppliers – such as banking services; third, sectorsthat have a high potential to employ local people – such as computers andrelated services.
A few other measures of restriction negotiated by Nepal include:
(a) capping foreign investment in most sectors at 51 per cent; while insome others at 66-67 per cent and only in two sectors at 80 per cent;
(b) the requirement that a majority of the board members of basictelecom providers should be Nepalese nationals, and in the case offinancial institutions, the composition of the board should beproportionate to the shareholding pattern;
(c) foreign banks, with minimum ‘B’ rating by a credit rating agency, canonly establish branches in Nepal for wholesale banking, not retailbanking;
(d) incentives and subsidies should be available only to enterprises whollyowned by Nepalese nationals;
(e) not allowing foreigners to purchase or own land in Nepal; and(f) movement of natural persons to be limited to intra-corporate
transferees at the executive, managerial or specialist levels, with aproviso that the number of such transferees shall not exceed 15 percent of the number of local employees in the firm.
Source: Adhikari 2004.
WTO rulesinfluence
national policies,including manythat are critical
for humandevelopment
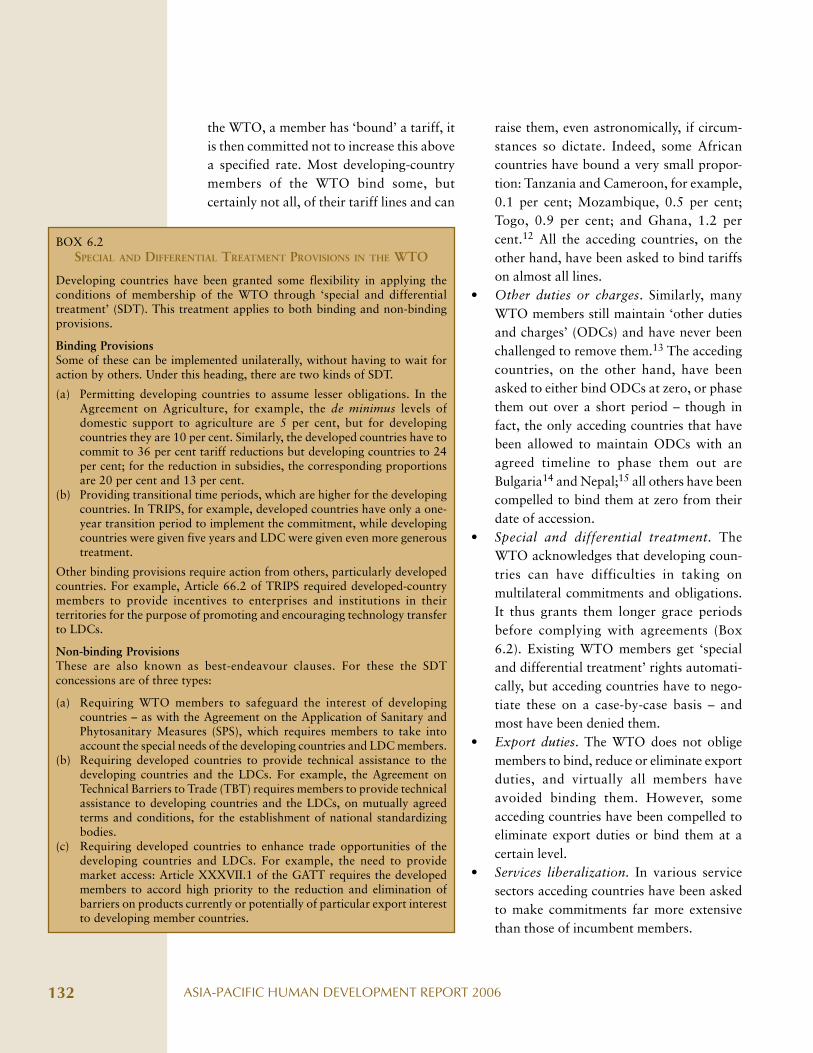
ASIA-PACIFIC HUMAN DEVELOPMENT REPORT 2006132
the WTO, a member has ‘bound’ a tariff, itis then committed not to increase this abovea specified rate. Most developing-countrymembers of the WTO bind some, butcertainly not all, of their tariff lines and can
raise them, even astronomically, if circum-stances so dictate. Indeed, some Africancountries have bound a very small propor-tion: Tanzania and Cameroon, for example,0.1 per cent; Mozambique, 0.5 per cent;Togo, 0.9 per cent; and Ghana, 1.2 percent.12 All the acceding countries, on theother hand, have been asked to bind tariffson almost all lines.
• Other duties or charges. Similarly, manyWTO members still maintain ‘other dutiesand charges’ (ODCs) and have never beenchallenged to remove them.13 The accedingcountries, on the other hand, have beenasked to either bind ODCs at zero, or phasethem out over a short period – though infact, the only acceding countries that havebeen allowed to maintain ODCs with anagreed timeline to phase them out areBulgaria14 and Nepal;15 all others have beencompelled to bind them at zero from theirdate of accession.
• Special and differential treatment. TheWTO acknowledges that developing coun-tries can have difficulties in taking onmultilateral commitments and obligations.It thus grants them longer grace periodsbefore complying with agreements (Box6.2). Existing WTO members get ‘specialand differential treatment’ rights automati-cally, but acceding countries have to nego-tiate these on a case-by-case basis – andmost have been denied them.
• Export duties. The WTO does not obligemembers to bind, reduce or eliminate exportduties, and virtually all members haveavoided binding them. However, someacceding countries have been compelled toeliminate export duties or bind them at acertain level.
• Services liberalization. In various servicesectors acceding countries have been askedto make commitments far more extensivethan those of incumbent members.
BOX 6.2SPECIAL AND DIFFERENTIAL TREATMENT PROVISIONS IN THE WTO
Developing countries have been granted some flexibility in applying theconditions of membership of the WTO through ‘special and differentialtreatment’ (SDT). This treatment applies to both binding and non-bindingprovisions.
Binding ProvisionsSome of these can be implemented unilaterally, without having to wait foraction by others. Under this heading, there are two kinds of SDT.
(a) Permitting developing countries to assume lesser obligations. In theAgreement on Agriculture, for example, the de minimus levels ofdomestic support to agriculture are 5 per cent, but for developingcountries they are 10 per cent. Similarly, the developed countries have tocommit to 36 per cent tariff reductions but developing countries to 24per cent; for the reduction in subsidies, the corresponding proportionsare 20 per cent and 13 per cent.
(b) Providing transitional time periods, which are higher for the developingcountries. In TRIPS, for example, developed countries have only a one-year transition period to implement the commitment, while developingcountries were given five years and LDC were given even more generoustreatment.
Other binding provisions require action from others, particularly developedcountries. For example, Article 66.2 of TRIPS required developed-countrymembers to provide incentives to enterprises and institutions in theirterritories for the purpose of promoting and encouraging technology transferto LDCs.
Non-binding ProvisionsThese are also known as best-endeavour clauses. For these the SDTconcessions are of three types:
(a) Requiring WTO members to safeguard the interest of developingcountries – as with the Agreement on the Application of Sanitary andPhytosanitary Measures (SPS), which requires members to take intoaccount the special needs of the developing countries and LDC members.
(b) Requiring developed countries to provide technical assistance to thedeveloping countries and the LDCs. For example, the Agreement onTechnical Barriers to Trade (TBT) requires members to provide technicalassistance to developing countries and the LDCs, on mutually agreedterms and conditions, for the establishment of national standardizingbodies.
(c) Requiring developed countries to enhance trade opportunities of thedeveloping countries and LDCs. For example, the need to providemarket access: Article XXXVII.1 of the GATT requires the developedmembers to accord high priority to the reduction and elimination ofbarriers on products currently or potentially of particular export interestto developing member countries.
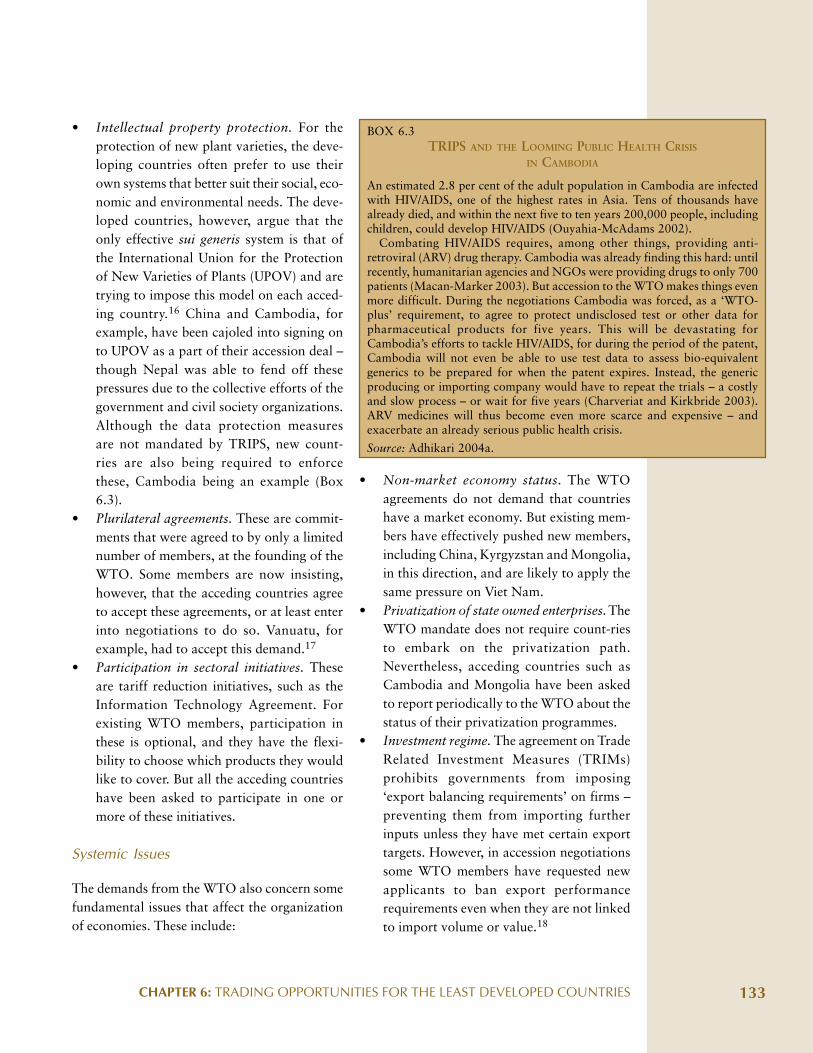
CHAPTER 6: TRADING OPPORTUNITIES FOR THE LEAST DEVELOPED COUNTRIES 133
• Intellectual property protection. For theprotection of new plant varieties, the deve-loping countries often prefer to use theirown systems that better suit their social, eco-nomic and environmental needs. The deve-loped countries, however, argue that theonly effective sui generis system is that ofthe International Union for the Protectionof New Varieties of Plants (UPOV) and aretrying to impose this model on each acced-ing country.16 China and Cambodia, forexample, have been cajoled into signing onto UPOV as a part of their accession deal –though Nepal was able to fend off thesepressures due to the collective efforts of thegovernment and civil society organizations.Although the data protection measuresare not mandated by TRIPS, new count-ries are also being required to enforcethese, Cambodia being an example (Box6.3).
• Plurilateral agreements. These are commit-ments that were agreed to by only a limitednumber of members, at the founding of theWTO. Some members are now insisting,however, that the acceding countries agreeto accept these agreements, or at least enterinto negotiations to do so. Vanuatu, forexample, had to accept this demand.17
• Participation in sectoral initiatives. Theseare tariff reduction initiatives, such as theInformation Technology Agreement. Forexisting WTO members, participation inthese is optional, and they have the flexi-bility to choose which products they wouldlike to cover. But all the acceding countrieshave been asked to participate in one ormore of these initiatives.
Systemic Issues
The demands from the WTO also concern somefundamental issues that affect the organizationof economies. These include:
• Non-market economy status. The WTOagreements do not demand that countrieshave a market economy. But existing mem-bers have effectively pushed new members,including China, Kyrgyzstan and Mongolia,in this direction, and are likely to apply thesame pressure on Viet Nam.
• Privatization of state owned enterprises. TheWTO mandate does not require count-riesto embark on the privatization path.Nevertheless, acceding countries such asCambodia and Mongolia have been askedto report periodically to the WTO about thestatus of their privatization programmes.
• Investment regime. The agreement on TradeRelated Investment Measures (TRIMs)prohibits governments from imposing‘export balancing requirements’ on firms –preventing them from importing furtherinputs unless they have met certain exporttargets. However, in accession negotiationssome WTO members have requested newapplicants to ban export performancerequirements even when they are not linkedto import volume or value.18
BOX 6.3TRIPS AND THE LOOMING PUBLIC HEALTH CRISIS
IN CAMBODIA
An estimated 2.8 per cent of the adult population in Cambodia are infectedwith HIV/AIDS, one of the highest rates in Asia. Tens of thousands havealready died, and within the next five to ten years 200,000 people, includingchildren, could develop HIV/AIDS (Ouyahia-McAdams 2002).
Combating HIV/AIDS requires, among other things, providing anti-retroviral (ARV) drug therapy. Cambodia was already finding this hard: untilrecently, humanitarian agencies and NGOs were providing drugs to only 700patients (Macan-Marker 2003). But accession to the WTO makes things evenmore difficult. During the negotiations Cambodia was forced, as a ‘WTO-plus’ requirement, to agree to protect undisclosed test or other data forpharmaceutical products for five years. This will be devastating forCambodia’s efforts to tackle HIV/AIDS, for during the period of the patent,Cambodia will not even be able to use test data to assess bio-equivalentgenerics to be prepared for when the patent expires. Instead, the genericproducing or importing company would have to repeat the trials – a costlyand slow process – or wait for five years (Charveriat and Kirkbride 2003).ARV medicines will thus become even more scarce and expensive – andexacerbate an already serious public health crisis.
Source: Adhikari 2004a.

ASIA-PACIFIC HUMAN DEVELOPMENT REPORT 2006134
Implementation Problems
A number of LDCs have had problems imple-menting their WTO agreements. This is partlybecause, for the accession countries in particular,these agreements are often onerous and unre-asonable. But LDCs can also have a limitedcapacity to fulfil even the normal conditions.Some agreements are easy and cheap to imple-ment: tariffs, for example, can be reduced by thestroke of a minister’s or a legislator’s pen. Butothers require a huge investment – in the pur-chase and installation of equipment and proce-dures and the training of staff – as with customsvaluation, and intellectual property rights andstandards.19 In addition, LDCs may not have theadministrative capacity or the funds to create therequisite institutions.
Human Development Implications ofTrade Integration
Assessing the impact of trade integration onhuman development for LDCs is a challengingtask. It is difficult enough to determine whetherintegration even increases trade, let alone whatare its precise effects on different segments ofsociety.20 At the most general level, however, itis clear that trade integration does create winnersand losers. The winners are usually those whocan best organize themselves in the privatesector, or occasionally in trade unions – who canpress for their interests during trade discussions,and if they think they will be disadvantaged,bargain for compensation payments. The losersare less organized, and usually more numerous –small farming households, for example, or work-ers in import-competing industries who will losethe protection of high tariffs – not to mentiontaxpayers who have to fill the gaps left in gover-nment budgets by cuts in customs revenues.
Institutions and Governance
Governments need to support those who suffer
from trade liberalization. One priority should beto build social safety nets – offering unemploy-ment allowances and facilities for retraining,while helping businesses make any necessarysocial adjustments. Some governments havedone this quite successfully and provided exten-sive protection. Indeed, there is often a strikingcorrelation between a country’s exposure toforeign trade and the size of its welfare state: themost open countries such as Sweden, Denmarkand the Netherlands have also seen the greatestboosts in spending on income transfers.21
Unsurprisingly, these countries also have someof the best human development achievements.
But these enlightened policies need not belimited to richer countries. Ecuador, for exam-ple, a middle-income developing country, hasmade similar efforts. In 2001 after acceding tothe WTO and signing several regional tradeagreements, it enacted a new Social Security Lawthat provides for an unemployment allowanceto those losing jobs in the private and publicsectors. Mongolia too, after accession to theWTO, and with the help of a loan from the AsianDevelopment Bank, strengthened its socialsecurity programme so that, among other things,it could help the unemployed and underemp-loyed to find jobs.
Public Health
Trade liberalization can affect public health in anumber of ways. One is by accepting intellectualproperty regimes that influence the availabilityand pricing of drugs. Previously, developingcountries that did not operate patents systemscould produce generic drugs similar to, but farcheaper than, the original branded versions.India, for example, built up a sophisticated andefficient pharmaceutical industry to producegeneric drugs for both local consumption andexport. Neighbouring Pakistan, on the otherhand, which also had a sizable pharmaceuticalindustry, but which did respect patents, hadprices from 3 to 14 times higher.22
Governmentsneed to supportthose who sufferfrom tradeliberalization
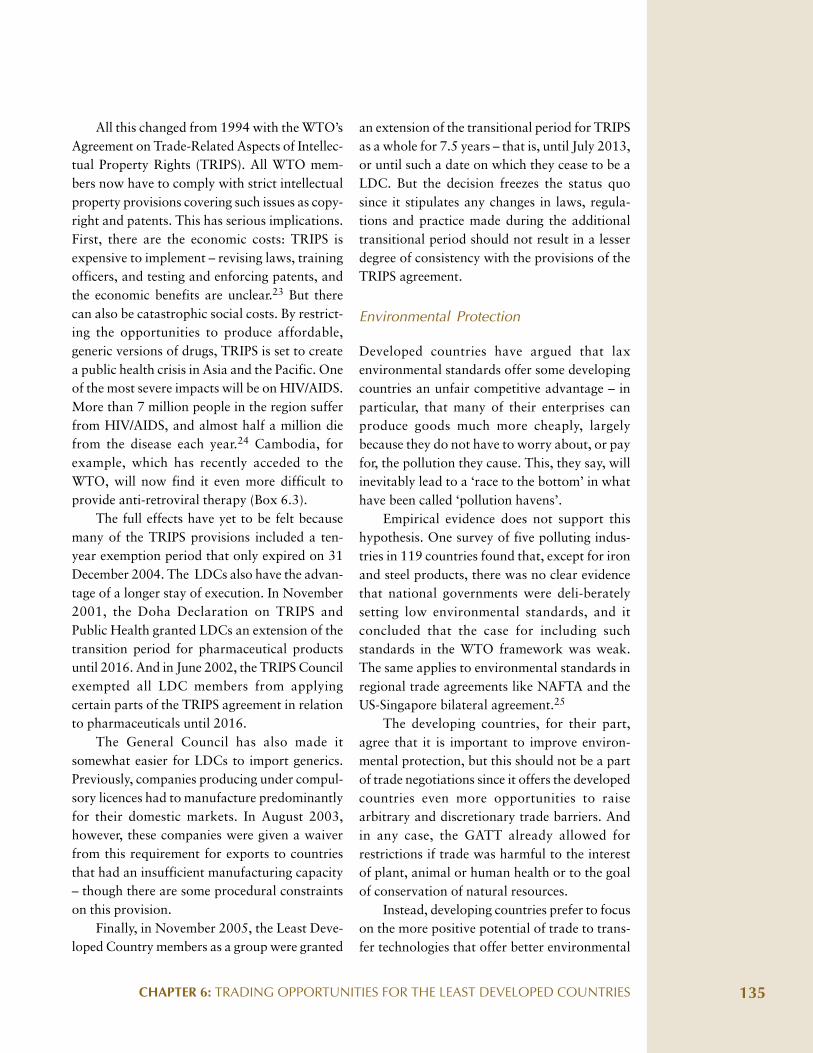
CHAPTER 6: TRADING OPPORTUNITIES FOR THE LEAST DEVELOPED COUNTRIES 135
All this changed from 1994 with the WTO’sAgreement on Trade-Related Aspects of Intellec-tual Property Rights (TRIPS). All WTO mem-bers now have to comply with strict intellectualproperty provisions covering such issues as copy-right and patents. This has serious implications.First, there are the economic costs: TRIPS isexpensive to implement – revising laws, trainingofficers, and testing and enforcing patents, andthe economic benefits are unclear.23 But therecan also be catastrophic social costs. By restrict-ing the opportunities to produce affordable,generic versions of drugs, TRIPS is set to createa public health crisis in Asia and the Pacific. Oneof the most severe impacts will be on HIV/AIDS.More than 7 million people in the region sufferfrom HIV/AIDS, and almost half a million diefrom the disease each year.24 Cambodia, forexample, which has recently acceded to theWTO, will now find it even more difficult toprovide anti-retroviral therapy (Box 6.3).
The full effects have yet to be felt becausemany of the TRIPS provisions included a ten-year exemption period that only expired on 31December 2004. The LDCs also have the advan-tage of a longer stay of execution. In November2001, the Doha Declaration on TRIPS andPublic Health granted LDCs an extension of thetransition period for pharmaceutical productsuntil 2016. And in June 2002, the TRIPS Councilexempted all LDC members from applyingcertain parts of the TRIPS agreement in relationto pharmaceuticals until 2016.
The General Council has also made itsomewhat easier for LDCs to import generics.Previously, companies producing under compul-sory licences had to manufacture predominantlyfor their domestic markets. In August 2003,however, these companies were given a waiverfrom this requirement for exports to countriesthat had an insufficient manufacturing capacity– though there are some procedural constraintson this provision.
Finally, in November 2005, the Least Deve-loped Country members as a group were granted
an extension of the transitional period for TRIPSas a whole for 7.5 years – that is, until July 2013,or until such a date on which they cease to be aLDC. But the decision freezes the status quosince it stipulates any changes in laws, regula-tions and practice made during the additionaltransitional period should not result in a lesserdegree of consistency with the provisions of theTRIPS agreement.
Environmental Protection
Developed countries have argued that laxenvironmental standards offer some developingcountries an unfair competitive advantage – inparticular, that many of their enterprises canproduce goods much more cheaply, largelybecause they do not have to worry about, or payfor, the pollution they cause. This, they say, willinevitably lead to a ‘race to the bottom’ in whathave been called ‘pollution havens’.
Empirical evidence does not support thishypothesis. One survey of five polluting indus-tries in 119 countries found that, except for ironand steel products, there was no clear evidencethat national governments were deli-beratelysetting low environmental standards, and itconcluded that the case for including suchstandards in the WTO framework was weak.The same applies to environmental standards inregional trade agreements like NAFTA and theUS-Singapore bilateral agreement.25
The developing countries, for their part,agree that it is important to improve environ-mental protection, but this should not be a partof trade negotiations since it offers the developedcountries even more opportunities to raisearbitrary and discretionary trade barriers. Andin any case, the GATT already allowed forrestrictions if trade was harmful to the interestof plant, animal or human health or to the goalof conservation of natural resources.
Instead, developing countries prefer to focuson the more positive potential of trade to trans-fer technologies that offer better environmental
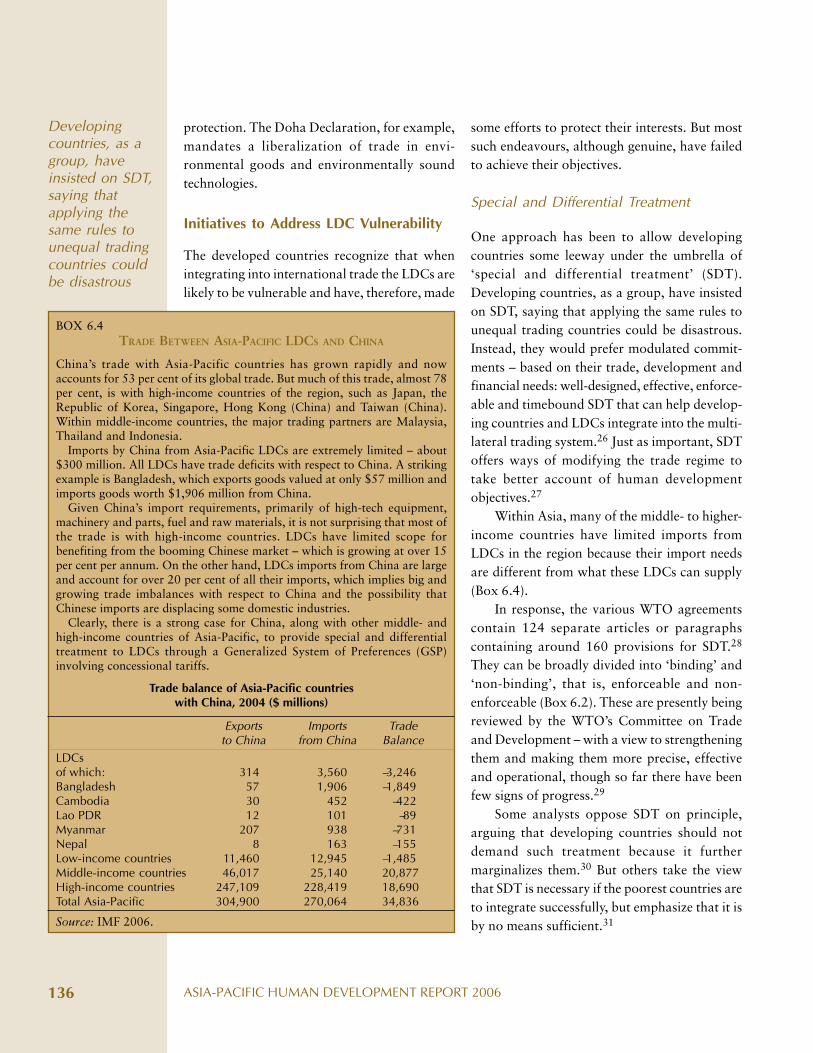
ASIA-PACIFIC HUMAN DEVELOPMENT REPORT 2006136
some efforts to protect their interests. But mostsuch endeavours, although genuine, have failedto achieve their objectives.
Special and Differential Treatment
One approach has been to allow developingcountries some leeway under the umbrella of‘special and differential treatment’ (SDT).Developing countries, as a group, have insistedon SDT, saying that applying the same rules tounequal trading countries could be disastrous.Instead, they would prefer modulated commit-ments – based on their trade, development andfinancial needs: well-designed, effective, enforce-able and timebound SDT that can help develop-ing countries and LDCs integrate into the multi-lateral trading system.26 Just as important, SDToffers ways of modifying the trade regime totake better account of human developmentobjectives.27
Within Asia, many of the middle- to higher-income countries have limited imports fromLDCs in the region because their import needsare different from what these LDCs can supply(Box 6.4).
In response, the various WTO agreementscontain 124 separate articles or paragraphscontaining around 160 provisions for SDT.28
They can be broadly divided into ‘binding’ and‘non-binding’, that is, enforceable and non-enforceable (Box 6.2). These are presently beingreviewed by the WTO’s Committee on Tradeand Development – with a view to strengtheningthem and making them more precise, effectiveand operational, though so far there have beenfew signs of progress.29
Some analysts oppose SDT on principle,arguing that developing countries should notdemand such treatment because it furthermarginalizes them.30 But others take the viewthat SDT is necessary if the poorest countries areto integrate successfully, but emphasize that it isby no means sufficient.31
protection. The Doha Declaration, for example,mandates a liberalization of trade in envi-ronmental goods and environmentally soundtechnologies.
Initiatives to Address LDC Vulnerability
The developed countries recognize that whenintegrating into international trade the LDCs arelikely to be vulnerable and have, therefore, made
BOX 6.4TRADE BETWEEN ASIA-PACIFIC LDCS AND CHINA
China’s trade with Asia-Pacific countries has grown rapidly and nowaccounts for 53 per cent of its global trade. But much of this trade, almost 78per cent, is with high-income countries of the region, such as Japan, theRepublic of Korea, Singapore, Hong Kong (China) and Taiwan (China).Within middle-income countries, the major trading partners are Malaysia,Thailand and Indonesia.
Imports by China from Asia-Pacific LDCs are extremely limited – about$300 million. All LDCs have trade deficits with respect to China. A strikingexample is Bangladesh, which exports goods valued at only $57 million andimports goods worth $1,906 million from China.
Given China’s import requirements, primarily of high-tech equipment,machinery and parts, fuel and raw materials, it is not surprising that most ofthe trade is with high-income countries. LDCs have limited scope forbenefiting from the booming Chinese market – which is growing at over 15per cent per annum. On the other hand, LDCs imports from China are largeand account for over 20 per cent of all their imports, which implies big andgrowing trade imbalances with respect to China and the possibility thatChinese imports are displacing some domestic industries.
Clearly, there is a strong case for China, along with other middle- andhigh-income countries of Asia-Pacific, to provide special and differentialtreatment to LDCs through a Generalized System of Preferences (GSP)involving concessional tariffs.
Trade balance of Asia-Pacific countrieswith China, 2004 ($ millions)
Exports Imports Tradeto China from China Balance
LDCsof which: 314 3,560 –3,246Bangladesh 57 1,906 –1,849Cambodia 30 452 –422Lao PDR 12 101 –89Myanmar 207 938 –731Nepal 8 163 –155Low-income countries 11,460 12,945 –1,485Middle-income countries 46,017 25,140 20,877High-income countries 247,109 228,419 18,690Total Asia-Pacific 304,900 270,064 34,836
Source: IMF 2006.
Developingcountries, as agroup, haveinsisted on SDT,saying thatapplying thesame rules tounequal tradingcountries couldbe disastrous
CHAPTER 6: TRADING OPPORTUNITIES FOR THE LEAST DEVELOPED COUNTRIES 137
Preferential Market Access
This refers to various concessions that allowduty-free access for certain goods for developingcountries. Preferential access could also beconsidered a subset of SDT, though thisparticular form of special treatment has deeperhistorical roots. In 1965 the members of theGATT added articles to give preference to goodsfrom developing countries. Then in the 1970sseveral advanced economies introduced theGeneralized System of Preferences (GSP), volun-tarily offering unilateral preferential tariff ratesto imports from developing countries. From1979, this was instituted as a permanent featureof the multilateral trading system. Subsequently,in the 1980s many other developed countriesintroduced bilateral schemes.
In 1979 the EU provided a second preferen-tial market access scheme under the LoméConvention – now the Contonou Agreement –offering their former colonies, including thePacific countries, far deeper preferences thanthose in the GSP schemes. Then in 2001 the EUpresented a new agreement with special termsfor LDCs – the ‘Everything But Arms’ (EBA)initiative – which provides duty- and quota-freeaccess to the EU market for all products otherthan arms and munitions, although three pro-ducts were to be phased in later: bananas in2006, and rice and sugar in 2009. Similarly, 27other countries have either offered some form ofpreferential market access to the LDCs or are inthe process of doing so.32 These include:
Canada. In January 2003, Canada introduced anew GSP scheme. This is very liberal, though itexcludes dairy products, eggs and poultry. It alsohas an innovative approach for rules of origin,using a cumulative system that allows access toproducts that include inputs from any of thebeneficiary countries.
Japan. Japan has extended its GSP scheme until
2014, and in 2003 further improved it byallowing LDCs duty-free entry not only forindustrial goods but also for a few agriculturalproducts, such as prawn and frozen fish fillets.
United States. In addition to the concessions itoffers through its regular GSP scheme, the USprovides deeper preferences to selected Africancountries through the African Growth andOpportunity Act (AGOA) and to Caribbeancountries through the Caribbean Basin Initiative.However, the US GSP scheme offers lessfavourable treatment to countries in Asia and thePacific.
Nevertheless, the take-up of these prefere-nces has been disappointing. The developedcountries still take a very small proportion oftheir imports from LDCs: 0.6 per cent for theEU; 0.2 per cent for Canada; 0.4 per cent forJapan; and 0.8 per cent for the US.33 Thesefigures have remained unchanged since 1992;indeed, for Japan the figure has declined.
There have been a number of explanationsfor this. One is that exporting countries do notwant to invest in building new markets in thesecountries, since the preferences are unilateraland optional and could be eliminated at anytime. They also point out that the schemesexclude certain ‘sensitive’ sectors and oftenapply excessively stringent rules of origin,making it difficult for industrial products thatincorporate materials from several othercountries. Moreover, many enterprises do notreally understand these rules or are generallyunaware of the preferences available.34
Another problem is that the developedcountries are increasingly protecting theirmarkets using non-tariff barriers. The EU andthe US, for example, have been using theAgreement on the Application of Sanitary andPhytosanitary Measures to keep out someexports of agriculture, livestock, horticultureand floriculture. These measures are ofteninappropriate for the circumstances of producers
The take-up ofpreferences
has beendisappointing
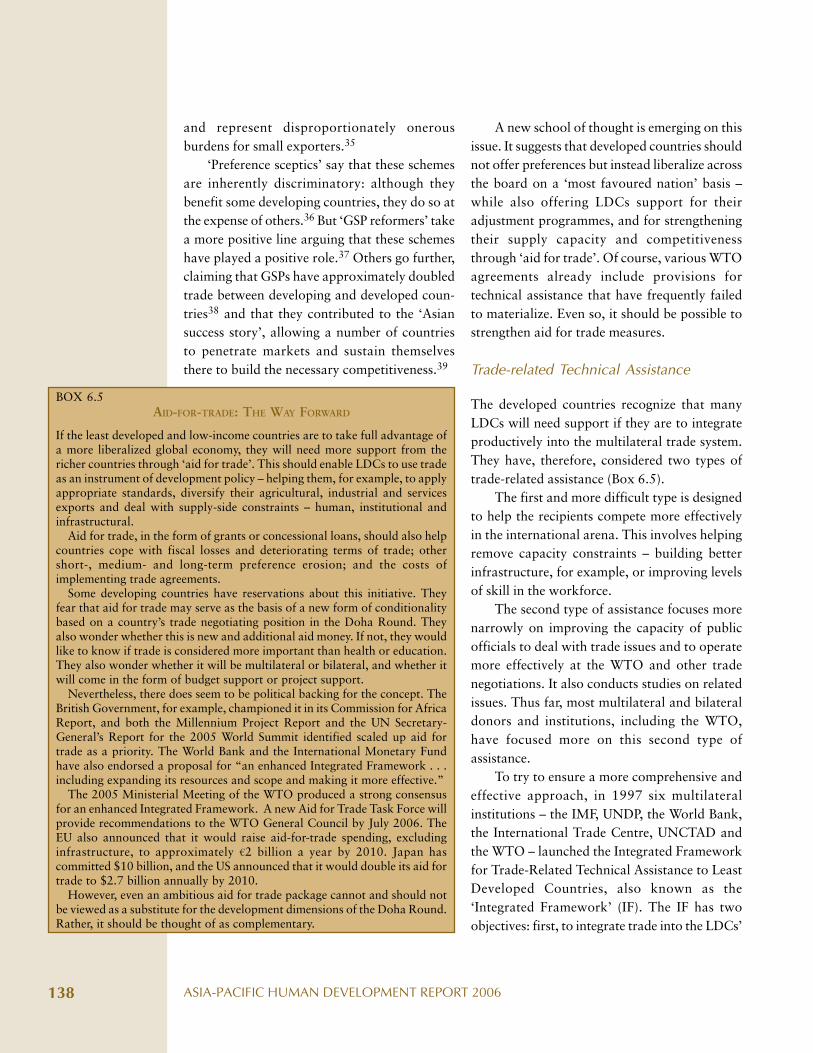
ASIA-PACIFIC HUMAN DEVELOPMENT REPORT 2006138
and represent disproportionately onerousburdens for small exporters.35
‘Preference sceptics’ say that these schemesare inherently discriminatory: although theybenefit some developing countries, they do so atthe expense of others.36 But ‘GSP reformers’ takea more positive line arguing that these schemeshave played a positive role.37 Others go further,claiming that GSPs have approximately doubledtrade between developing and developed coun-tries38 and that they contributed to the ‘Asiansuccess story’, allowing a number of countriesto penetrate markets and sustain themselvesthere to build the necessary competitiveness.39
A new school of thought is emerging on thisissue. It suggests that developed countries shouldnot offer preferences but instead liberalize acrossthe board on a ‘most favoured nation’ basis –while also offering LDCs support for theiradjustment programmes, and for strengtheningtheir supply capacity and competitivenessthrough ‘aid for trade’. Of course, various WTOagreements already include provisions fortechnical assistance that have frequently failedto materialize. Even so, it should be possible tostrengthen aid for trade measures.
Trade-related Technical Assistance
The developed countries recognize that manyLDCs will need support if they are to integrateproductively into the multilateral trade system.They have, therefore, considered two types oftrade-related assistance (Box 6.5).
The first and more difficult type is designedto help the recipients compete more effectivelyin the international arena. This involves helpingremove capacity constraints – building betterinfrastructure, for example, or improving levelsof skill in the workforce.
The second type of assistance focuses morenarrowly on improving the capacity of publicofficials to deal with trade issues and to operatemore effectively at the WTO and other tradenegotiations. It also conducts studies on relatedissues. Thus far, most multilateral and bilateraldonors and institutions, including the WTO,have focused more on this second type ofassistance.
To try to ensure a more comprehensive andeffective approach, in 1997 six multilateralinstitutions – the IMF, UNDP, the World Bank,the International Trade Centre, UNCTAD andthe WTO – launched the Integrated Frameworkfor Trade-Related Technical Assistance to LeastDeveloped Countries, also known as the‘Integrated Framework’ (IF). The IF has twoobjectives: first, to integrate trade into the LDCs’
BOX 6.5AID-FOR-TRADE: THE WAY FORWARD
If the least developed and low-income countries are to take full advantage ofa more liberalized global economy, they will need more support from thericher countries through ‘aid for trade’. This should enable LDCs to use tradeas an instrument of development policy – helping them, for example, to applyappropriate standards, diversify their agricultural, industrial and servicesexports and deal with supply-side constraints – human, institutional andinfrastructural.
Aid for trade, in the form of grants or concessional loans, should also helpcountries cope with fiscal losses and deteriorating terms of trade; othershort-, medium- and long-term preference erosion; and the costs ofimplementing trade agreements.
Some developing countries have reservations about this initiative. Theyfear that aid for trade may serve as the basis of a new form of conditionalitybased on a country’s trade negotiating position in the Doha Round. Theyalso wonder whether this is new and additional aid money. If not, they wouldlike to know if trade is considered more important than health or education.They also wonder whether it will be multilateral or bilateral, and whether itwill come in the form of budget support or project support.
Nevertheless, there does seem to be political backing for the concept. TheBritish Government, for example, championed it in its Commission for AfricaReport, and both the Millennium Project Report and the UN Secretary-General’s Report for the 2005 World Summit identified scaled up aid fortrade as a priority. The World Bank and the International Monetary Fundhave also endorsed a proposal for “an enhanced Integrated Framework . . .including expanding its resources and scope and making it more effective.”
The 2005 Ministerial Meeting of the WTO produced a strong consensusfor an enhanced Integrated Framework. A new Aid for Trade Task Force willprovide recommendations to the WTO General Council by July 2006. TheEU also announced that it would raise aid-for-trade spending, excludinginfrastructure, to approximately ¤2 billion a year by 2010. Japan hascommitted $10 billion, and the US announced that it would double its aid fortrade to $2.7 billion annually by 2010.
However, even an ambitious aid for trade package cannot and should notbe viewed as a substitute for the development dimensions of the Doha Round.Rather, it should be thought of as complementary.

CHAPTER 6: TRADING OPPORTUNITIES FOR THE LEAST DEVELOPED COUNTRIES 139
national development plans such as the PovertyReduction Strategy Papers; second, to respondto needs identified by the LDCs with a coordi-nated delivery of trade-related technicalassistance. In order to finance the IF activities,donors have established a Trust Fund that hastwo main ‘windows’: one to finance the Diag-nostic Trade Integration Study (DTIS) and theother, created in 2003, to finance capacitybuilding projects identified by the DTIS.40
The IF has received support from bothdevelopment and trade communities. In July2003, for example, the heads of the six IFagencies and their representatives issued a jointcommuniqué underscoring their commitment tothe IF model. Then, in December 2003 in Doha,the WTO Ministers endorsed the IF as a viablemodel for the LDCs’ trade development. Despitethis support, the IF seems to be having a limitedimpact, and critical trade infrastructure remainsunfunded. Some of the problems are common tomany multilateral ventures. One is a lack offunds: the budget per country under Window IIis only $1 million. The DTIS has had littleinfluence on the allocation of donor funds.41
Recent Developments
The current round of trade negotiations, theDoha Development Agenda, recognized thespecial needs of the Least Developed Countrieswithin the multilateral trading system. The DohaMinisterial Declaration spoke not just of theimportance of speedy accession of the LDCs intothe WTO, but also of the need for technicalassistance and capacity building.
Since then, however, there has been littleeffort to convert this political commitment intopractical action. In 2004, following the failureof the Cancun Ministerial Conference of theWTO, a group of influential developing anddeveloped countries, with limited participationof LDCs, hammered out the ‘July Framework’.But even this failed to address most of the
concerns relating to LDC integration into themultilateral trading system. The language isweak on a number of issues. For example, ratherthan obliging the developed countries to giveSDT to the poorer developing countries, it onlysays that ‘disciplines on export support will bedeveloped with consideration of the impacts onleast-developed and net food-importingdeveloping countries’. The language is similarlynon-committal when it comes to ways ofachieving fuller integration of small, vulnerableeconomies into the multilateral trading system.
The Hong Kong Ministerial Meeting inDecember 2005 made more progress. Membersagreed that developed-country members shall,and developing-country members declaringthemselves in a position to do so should, provideduty-free and quota-free market access on alasting basis, for all products originating fromall LDCs by 2008, or no later than the start ofthe implementation period of the Doha Roundin a manner that ensures stability, security andpredictability. However, members who find thisdifficult would be allowed to permit duty-freeand quota-free market access for only 97 percent of products originating from LDCs. Anddeveloping-country members would be allowedto phase in their commitments and enjoyappropriate flexibility in coverage.
Following the Hong Kong Ministerial, theLDCs were also allowed to maintain, on atemporary basis, existing measures that deviatefrom their obligations under the TRIMsagreement.42 They would also be able to takenew measures, if they obtained approval fromthe WTO’s Council, for Trade in Goods. Thesecan last for five years and are renewable, buthave to be phased out by 2020.
Finally, it was reaffirmed that LDC memberswill only be required to undertake commitmentsand concessions to an extent consistent withtheir individual development, financial or tradeneeds, or their administrative and institutionalcapacities.
There has beenlittle effort to
convert thispolitical
commitmentinto practical
action
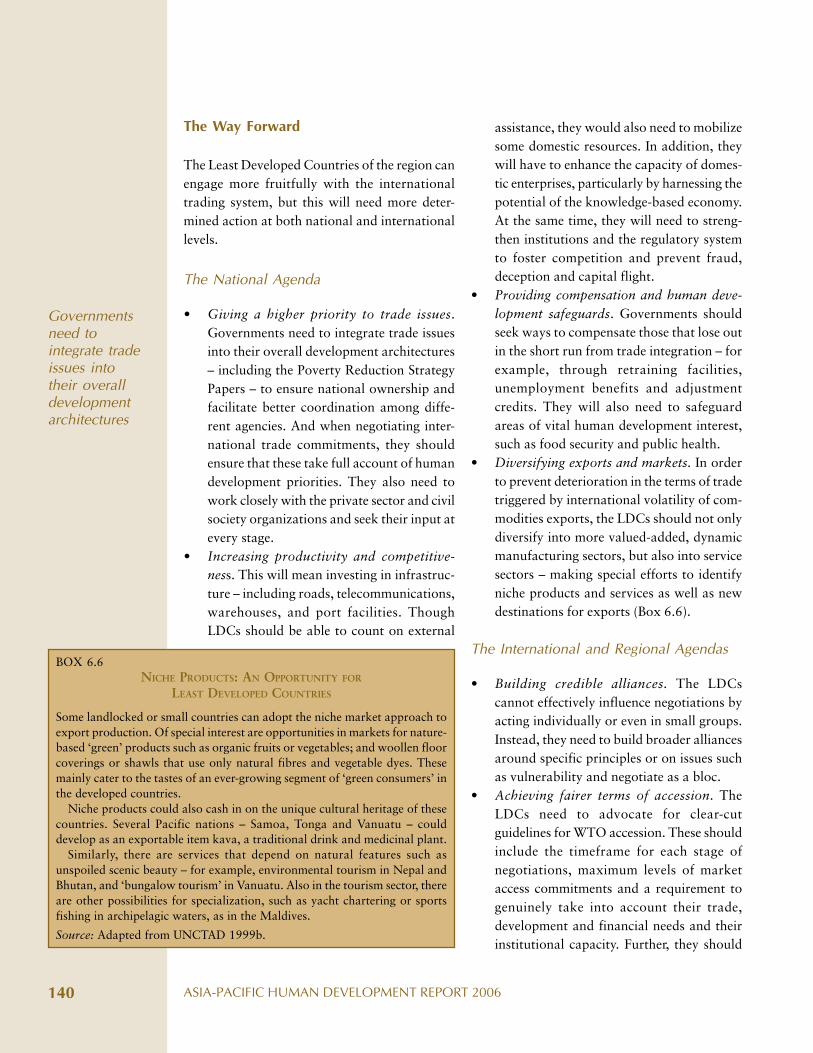
ASIA-PACIFIC HUMAN DEVELOPMENT REPORT 2006140
The Way Forward
The Least Developed Countries of the region canengage more fruitfully with the internationaltrading system, but this will need more deter-mined action at both national and internationallevels.
The National Agenda
• Giving a higher priority to trade issues.Governments need to integrate trade issuesinto their overall development architectures– including the Poverty Reduction StrategyPapers – to ensure national ownership andfacilitate better coordination among diffe-rent agencies. And when negotiating inter-national trade commitments, they shouldensure that these take full account of humandevelopment priorities. They also need towork closely with the private sector and civilsociety organizations and seek their input atevery stage.
• Increasing productivity and competitive-ness. This will mean investing in infrastruc-ture – including roads, telecommunications,warehouses, and port facilities. ThoughLDCs should be able to count on external
BOX 6.6NICHE PRODUCTS: AN OPPORTUNITY FOR
LEAST DEVELOPED COUNTRIES
Some landlocked or small countries can adopt the niche market approach toexport production. Of special interest are opportunities in markets for nature-based ‘green’ products such as organic fruits or vegetables; and woollen floorcoverings or shawls that use only natural fibres and vegetable dyes. Thesemainly cater to the tastes of an ever-growing segment of ‘green consumers’ inthe developed countries.
Niche products could also cash in on the unique cultural heritage of thesecountries. Several Pacific nations – Samoa, Tonga and Vanuatu – coulddevelop as an exportable item kava, a traditional drink and medicinal plant.
Similarly, there are services that depend on natural features such asunspoiled scenic beauty – for example, environmental tourism in Nepal andBhutan, and ‘bungalow tourism’ in Vanuatu. Also in the tourism sector, thereare other possibilities for specialization, such as yacht chartering or sportsfishing in archipelagic waters, as in the Maldives.
Source: Adapted from UNCTAD 1999b.
assistance, they would also need to mobilizesome domestic resources. In addition, theywill have to enhance the capacity of domes-tic enterprises, particularly by harnessing thepotential of the knowledge-based economy.At the same time, they will need to streng-then institutions and the regulatory systemto foster competition and prevent fraud,deception and capital flight.
• Providing compensation and human deve-lopment safeguards. Governments shouldseek ways to compensate those that lose outin the short run from trade integration – forexample, through retraining facilities,unemployment benefits and adjustmentcredits. They will also need to safeguardareas of vital human development interest,such as food security and public health.
• Diversifying exports and markets. In orderto prevent deterioration in the terms of tradetriggered by international volatility of com-modities exports, the LDCs should not onlydiversify into more valued-added, dynamicmanufacturing sectors, but also into servicesectors – making special efforts to identifyniche products and services as well as newdestinations for exports (Box 6.6).
The International and Regional Agendas
• Building credible alliances. The LDCscannot effectively influence negotiations byacting individually or even in small groups.Instead, they need to build broader alliancesaround specific principles or on issues suchas vulnerability and negotiate as a bloc.
• Achieving fairer terms of accession. TheLDCs need to advocate for clear-cutguidelines for WTO accession. These shouldinclude the timeframe for each stage ofnegotiations, maximum levels of marketaccess commitments and a requirement togenuinely take into account their trade,development and financial needs and theirinstitutional capacity. Further, they should
Governmentsneed tointegrate tradeissues intotheir overalldevelopmentarchitectures
CHAPTER 6: TRADING OPPORTUNITIES FOR THE LEAST DEVELOPED COUNTRIES 141
All tradeinitiatives and
negotiationsshould be based
on a humandevelopment
perspective
tie implementation of their commitmentsto the availability of technical assistance.‘WTO-plus’ conditions should be stopped.
• Targeting technical assistance. Many of thetrade participants, including industry,farmers and service providers, would benefitfrom carefully targeted technical assistanceprogrammes. Such external assistancewould free government resources for thesocial sector investment that is crucial forachieving human development objectives.
• Strengthening SDT provisions. SDT shouldbe made operational, effective and enforce-able. This means not just including suchprovisions in the WTO architecture, but alsobuilding mechanisms to monitor theirimplementation. For this purpose, thevarious committees in the WTO should berequired to submit regular reports.
• Offering aid for trade. The potential lossesof trade integration for LDCs suggest a newrole for aid – compensating for losses andoffering help for restructuring. Aid shouldalso be provided to develop the capacity ofcountry negotiators and build strongerinstitutions. In addition, it should addresssupply-side constraints that inhibit exportresponsiveness.
• Focusing on human development. Trade isnot an end in itself; it is a means to an end.All trade initiatives and negotiationsshould, therefore, be based on a humandevelopment perspective. The focus shouldbe not merely on market access, but onachieving improved human developmentoutcomes – through trade rules that allowfor diversity in national institutions andstandards.
CHAPTER 7: TRADE FOR HUMAN DEVELOPMENT: AN EIGHT-POINT AGENDA 145
The rest of the world sees the Asia-Pacific regionas a key player when it comes to globalization.But these other countries, and particularly therichest, have a fairly single-minded view: that ina more liberalized trading environment the otherglobal regions face a threat from Asia and thePacific, which is emerging as the factory of theworld and is capable of under-cutting the deve-loped countries in the production of everythingfrom clothing to footwear to electronic goods.
The picture looks different within theregion. In one sense it mirrors the global one,though in this case it is the poorest countries ofthe region who look towards China with sometrepidation – perceiving their giant neighbour asa strong competitor capable not just of capturingsome of their export markets for textiles andgarments, for example, but also of displacingeven some of their humbler domestic industries.Nor do they see many offsetting opportunitiesfor exporting to China – which mainly requiresraw materials, machinery and high-techequipment.
Within the region the trade flows also lookmuch more complex, and in many respects evenmore crucial, because the new patterns of tradeare not just directing flows of goods and money,they are also reshaping national development.Workers across the Asia-Pacific region, fromNepal to Nauru, are rapidly learning that the
The Asia Pacific region has often performed spectacularly well on trade and made goodprogress in human development. But more recent trends are disturbing, with seriousimplications for the Least Developed Countries and even for the poorest people in thelarger and more dynamic economies, where trade is accompanied by inadequate jobcreation and rising inequality. How can trade best serve human development? Thischapter summarises the main policy recommendations of the Report for nationalgovernments and proposes an eight-point agenda.
Chapter
Trade for Human Development:An Eight-Point Agenda
7
acronym WTO means something, for better orfor worse, in their everyday lives.
For the poorest people in the poorestcountries, these are matters not just of strategybut of survival. A call-centre worker in theUnited Kingdom or the United States, say, whosejob migrates to Delhi or Manila can be rapidlyredeployed elsewhere or can use the cushion ofthe social security system to search for a suitablealternative job. But a Bangladeshi woman mak-ing shirts on piece rates for a garment manu-facturer may have little or nothing to fall backon when told she is suddenly surplus to require-ments.
That is why this Report has embeddedhuman development concerns within the heartof international trade. First, pointing out themultiple ways in which trade shapes people’slives – affecting how they live, what they do andwhat they can be. Second, showing how humandevelopment and international trade havemultiple links; in some senses a two-way street,in others a multi-lane intersection.
Some people wish to avoid this complexityby shying away from the subject altogether. Atone extreme, there are those who would preferto erect higher trade barriers and aim fornational self-reliance; why depend on importswhen you can make something similar yourself?At the other extreme are the proponents of free
Workers acrossthe Asia-Pacific
region arerapidly learning
that theacronym WTO
meanssomething, for
better or forworse, in theireveryday lives

ASIA-PACIFIC HUMAN DEVELOPMENT REPORT 2006146
trade who would opt for no barriers at all; whytry to manipulate trade flows when a free flowof goods or people would allow global produc-tion to reach its natural levels – letting themarket dictate the most economically suitablelocation?
Neither extreme makes much sense. Totalnational self-reliance – autarchy – has an emo-tional appeal but soon runs into practicaldifficulties. Does this mean that every smallcountry should have its own pharmaceuticalindustry or try to survive without vaccines formeasles, or treatment for HIV/AIDS? People inthe twenty-first century have social and econo-mic rights that can only be met through inter-national trade.
More seductive and plausible is the free-trade option. But this too is fallacious – for itinvolves trade between unequal partners.Perhaps it appeals because it has appropriatedthe trigger-word ‘free’. Look more closely,however, and it is clear that this is freedom forgoods and for money, not freedom for people.No small farmer in Indonesia who has been toldthat she will get 30 per cent less for the crop thisyear because free trade has let in unlimitedquantities of subsidized rice from the US will feelany sense of liberation. Maybe ‘unleashed trade’would be a more realistic description of a tariff-free world – indicating that for safety’s sake atcertain times the leash should be carefully inplace.
That is why this Report has argued forpolicies more grounded in reality. It recognizesthe value of the private sector as the main enginefor economic growth but says that some of thisenergy needs to be harnessed or guided if it is toserve human development. This should come asno surprise in a region which in the latter part ofthe twenteeth century set the template formodern trade-led economic growth. Anyonetracing the footsteps of the ‘Asian Tigers’ willrecognize that they took a very strategic position– choosing which infant industries to nurse and
when to liberalize – before taking the world bystorm with their flow of goods. And no need toselect only Asian examples: look further back tothe nineteenth century at the ‘mercantilist’policies of the now-developed countries for arecord of restrictions on trade, including ontextile imports from Asia, which gave thesecountries the breathing space before their infantindustries were mature enough to sell their goodsacross the world.
Trade has never been a matter for privateindustry alone. It has always been subject toactive intervention from the State. This centralrole for the state may not seem an encouragingprospect. Can it be trusted? Trade regulation,after all, offers both politicians and publicofficials considerable authority and discretion.At the very least, this risks overloading peoplewho have limited capacity or time to deal withcomplex commercial matters that are typicallyladen with impenetrable acronyms and jargon.At worst, it opens wider the doors to venalityand corruption.
However, there are more promising signs.Civil society groups and the media at bothinternational and national levels are nowshedding greater light on trade negotiations thatonly a few years ago would have taken placebehind closed doors. They rightly demand fargreater transparency, consistency and fairness.There is still secrecy, and many of the doorsremain closed, but at least nowadays tradeofficials who emerge blinking into the dawnfrom all-night negotiations know that they willfrequently have to cope with the glare of tele-vision cameras.
Many people are now asking hard questionsabout the direction and momentum of interna-tional trade. If the developed countries are sokeen on free trade why, for example, do the EUand the US persist with huge market-distortingsubsidies on agriculture? Why are they enthu-siastic about free flows of capital into poorcountries but suddenly switch gears when
Trade hasalways beensubject to activeinterventionfrom the state

CHAPTER 7: TRADE FOR HUMAN DEVELOPMENT: AN EIGHT-POINT AGENDA 147
discussing the opportunities for the flows oflabour into their own? And why are they nowbecoming more reluctant to allow Asian coun-tries to demonstrate the remarkable potential ofthe Internet to allow people all over the world towork together by outsourcing software produc-tion or call centres or back-office adminis-tration?
Meanwhile the new global trade regime islimiting the freedom of developing countries tomanage their own economies. A decade or soago, under the previous regime, the GATT,countries were more free to choose tariff levelsand import quotas and apply foreign exchangecontrols. Now IMF conditions and the rules ofthe WTO have narrowed the options – especiallyfor the newcomers to the WTO club, the LDCs,who remarkably have to sign up to an even moreintrusive list of rules than the existing members.
This makes life much more difficult for themany countries that are now simultaneouslytrying to pursue export-led growth. Indeed, itraises the question of whether we may now bereaching the limits of a model that has servedmany Asian countries so well.
How should the countries of Asia and thePacific respond in this demanding new environ-ment? Clearly, there can be no standard blue-print – especially for such a huge and diverseregion. Each country has its own priorities andwill pursue its own agenda; in internationalnegotiations countries may, therefore, have notjust different priorities but even opposinginterests. The food-exporting countries, forexample, will see things differently from the foodimporters; Indonesia will take a differentposition from that of Thailand or Viet Nam. Themore highly developed countries will feel moreat ease with global competition than the poorerones.
Nevertheless, there is a way of encom-passing this diversity – by viewing trade issuesthrough a human development lens. This helpsfocus attention on the issues that matter for the
poorest people, and especially those in the LeastDeveloped Countries. In earlier chapters, thisReport has followed this philosophy as it hasidentified some of the detailed issues inagriculture, manufacturing and services. Some ofthese will appear common sense, and many willalready be part of the human developmentconsensus. Others may be less obvious, andapparently more technical, but could still makea huge difference to the lives of poor people.Rather than be driven by commercial lobbies,the centrality of human development shouldinform national priorities.1 Eight that have someof the most general application are as follows.
1. Invest for Competitiveness
In a globalizing world, public investment needsto take into account both national andinternational considerations. Generally the typeof investment will remain much the same, but itmay need adjusting with an eye to boostinginternational competitiveness. Thus, whenlooking at basic infrastructure, governments willneed to ensure that they have the roads, rail-ways, ports and telecommunications systemsthat align with national needs and also with therequirement of getting goods and servicesquickly and cheaply to international markets.
The physical infrastructure is just as impor-tant as human capital. The most successfultrading countries have invested heavily in humandevelopment – generating a healthy and well-educated workforce that has the stamina, theskill and the flexibility to cope with a changingtrading environment. China, for example, longbefore it started opening up to the world at theend of the 1970s, already had good basic humandevelopment indicators. Education has to startwith strong and universal primary schooling, butnowadays all countries need to make sure theyhave sufficient people with technical andmanagerial skills. India’s success in selling ITservices is a reward for heavy investment in
The mostsuccessful
trading countrieshave invested
heavily inhuman
development
ASIA-PACIFIC HUMAN DEVELOPMENT REPORT 2006148
technical education, almost all of it funded bythe government. Few smaller countries will beable to match this, but at the least, all should beaiming at least at a balance of skills. People withgood primary or secondary education can onlymake use of their potential for internationaltrade if they have the support of others withhigher levels of education, in engineering, forexample, telecommunications, or accountancy.Men and women alike should have equalopportunities to realize their full potential.
At the same time, many countries will needto invest more in R&D that specificallyaddresses the needs of poor people. The Republicof Korea, for example, has reaped the benefitsof a huge investment in technological infrastruc-ture and by 2004 had the world’s highestuniversity enrolment rates. At the broadest level,R&D can include ‘foresight studies’, as havetaken place in Thailand, for example, to anti-cipate future demands and link science andtechnology to economic and social needs. Butcompetitive countries also need to continuallyexplore the most appropriate current tech-nologies that will capitalize on nationalstrengths. Some of this can be carried outthrough public-private partnerships, perhapscombining venture-capital funds and govern-ment equity, though most of the R&D intoopportunities specifically for the poor is likely totake place in the public sector.
2. Adopt Strategic Trade Policies
In a world of giant global players and fiercecompetition, no developing country now has theluxury of entering global markets and hoping forthe best. Instead, just as the OECD states andthose of the Asian tigers did before them, stateshave to identify a few sectors and industries thathave long-term potential in international mar-kets and guide enterprises towards them. Asia’smiracle economies – as well as those of China orIndia, which are now being lauded as success
stories – only liberalized after they had estab-lished the basis for diversified export industries.
The chosen industries will vary fromcountry to country. But they could include, forexample, those such as basic engineering goodsthat have the greatest potential linkages withother industries and will train more people inessential skills and thus have important spilloverbenefits for the rest of the economy.
Picking ‘winners’ is not, of course, a simpletask and will demand much stronger capacitywithin a government. And it will be importantnot to foster collusion between public officialsand company bosses – reproducing more of the‘crony capitalism’ whose shallow foundationscollapsed during the Asian financial crisis.Instead, the aim should be to achieve a trans-parent policy compact between government andthe private sector, by using a carrot-and-stickapproach.
The carrot will include the opportunity tooperate behind tariff walls until companies arestrong enough to compete internationally.China, for example, until it started to open up tothe outside world had an average tariff rate ofaround 40 per cent. Tariffs should be low onessential imports such as raw materials and high-tech capital goods, higher on goods that competewith the selected strategic industries.
The stick is that such industries will beclosely scrutinized to see that they are living upto their side of the bargain and developingsteadily more competitive products and servicesfor export. They will also be subject to adomestic competition policy designed to preventthem abusing a monopoly position.
The essential requirement for engagement ininternational trade, however, is that the processshould be strategically planned and carefullysequenced. Thus, higher tariffs should be rigidlytime-bound. In order to avoid creating cosymonopolies that never mature into vigorousexport enterprises, tariffs should automaticallybe scaled down after a predetermined period.
The essentialrequirement forengagement ininternationaltrade is that theprocess shouldbe strategicallyplanned andcarefullysequenced
CHAPTER 7: TRADE FOR HUMAN DEVELOPMENT: AN EIGHT-POINT AGENDA 149
3. Restore a Focus on Agriculture
Many countries with ambitions to boost theirpresence in international markets have concen-trated most of their energies on industry in urbanareas – leaving the rural areas to cope as bestthey can. A trade strategy based on human deve-lopment, however, must have agriculture at itscore. This is not because agriculture offersexport opportunities, but because in many coun-tries farming is still the primary source of incomefor the poor; so no trade strategy that under-mines rural livelihoods can claim to bepromoting human development.
For food-importing countries in particular,it will often make sense to maintain tariffs onfood imports so as to protect poor producers. InWTO negotiations, therefore, developingcountries should insist on the right to protect‘special products’, including safeguard mecha-nisms that will be triggered when food importsreach certain prices or volumes.
This also has the strategic advantage ofpreserving national food security in a world thatin just a few years down the line could be movingtowards food shortages – precisely becauselarger developing countries like China have letagriculture stagnate and have become netimporters. Tariff protection, or if necessary pricesupport, should, however, be designed specifi-cally to protect farmers rather than simply offerhigher profits for traders or for the food industry.And if this results in higher prices that causehardship for the poorest consumers, govern-ments will need to prepare appropriate socialsafety nets.
As well as protection, farmers also needprogress. In many countries investment in ruraldevelopment has been on a steep downwardcurve. This has to be reversed, particularlythrough investment: for example, in irrigation,in village electrification and in farm-to-marketroads.
4. Combat Jobless Growth
Most countries that embark on industrializationtypically do so with labour-intensive productionin industries like garments, textiles and footwearthat take advantage of ample supplies of low-cost labour. But as industrialization proceeds,competitive pressures, greater ambitions andchanging market conditions start to push themhigher up the value chain. In addition,enterprises often prefer to mechanize if they findmachines easier to cope with than people. As aresult, the most successful trading countries,primarily in East Asia, are now creating jobs farmore slowly – the phenomenon of ‘joblessgrowth’.
To some extent, this process is understand-able. Less comprehensible, however, is whygovernments should exacerbate this trend bymaintaining low real interest rates – effectivelygiving capital preference over labour. That mayseem like the best strategy for rapid growth, butit is storing up problems for the future. By allmeans allow enterprises to choose the lowest-cost option for production, but this choiceshould not be biased away from labour: interestrates should, therefore, reflect the real price ofcapital, not the rate that industrialists wouldprefer. In a similar vein, states should phase outfiscal incentives to enterprises; these may attractinvestment, but not necessarily in businesses thatmaximise human development potential becausesuch tax breaks artificially raise the return oncapital and again encourage capital-intensiveinvestments.
Another reason why enterprises may bereluctant to take on new workers is that labourcontracts can be too rigid. In rapidly changingmarkets, companies that find it difficult topredict future demands may prefer to invest inmachinery rather than commit themselves to alarger permanent workforce. This creates apersistent duality – a small and protected group
ASIA-PACIFIC HUMAN DEVELOPMENT REPORT 2006150
of ‘insiders’ with secure employment influencedby national regulations, and a large casual, andoften exploited, workforce working on piecerates. Instead, more workers should steadily beabsorbed into formal employment but oncontracts sufficiently flexible that they canreadily be deployed to other sectors or compa-nies as trading conditions change.
Governments can assist in this process byproviding some support to workers throughhealth insurance and social security and byactive labour market policies to encourageretraining and redeployment.
5. Prepare a New Tax Regime
Liberalization is a common prescription for eco-nomic success, but it has a debilitating side effect– it means foregoing a predictable and easy-to-collect source of government revenue. Many ofthe poorest countries have relied on customsduties for a high proportion of public income, insome cases up to 70 per cent. If they suddenlydrop tariff rates, they will lose vital revenue.
It might be argued that economic growthitself would take care of this problem, as corpo-rate and income taxes would automatically riseto fill the fiscal gap. But this is unlikely, andcertainly not in the short term, when both localand foreign enterprises may have been givengenerous tax breaks as an incentive to invest.Instead, governments need to have an alternativetax regime in place before embarking on libera-lization.
Care will need to be taken, however, toensure that these new taxes are progressive anddo not hurt the poor. Customs duties, forexample, are often quite progressive since theyare typically highest on the luxury items that areof greater interest to the rich. Corporate taxestoo can be levied progressively, though manypeople escape the net since the lawyers of thelargest corporations are skilled at techniques oftax planning, while most enterprises in the
informal sector simply evade tax collectorsaltogether. Much the same is true for income tax,which tends to be paid more by middle-incomeworkers in government or the formal sector.
Garnering more income from corporate orincome tax will mean overhauling the tax codesto close loopholes and considering other optionssuch as ‘withholding taxes’ at points whereinformal entrepreneurs have no choice but toprovide documentation, as when commerciallyimporting inputs.
Governments can also consider taxes on realestate or on capital gains. They can also adoptthe value added tax (VAT), for example, whichcan generate quite high and predictable revenuesbut assumes a well-documented economy andneeds to be developed with care; in any case, itshould exempt food and other necessities of thepoor.
The key point is that these new sources ofrevenue should be up and running prior toliberalization, or falling revenues could lead tosevere cuts in public services that will harmhuman development.
6. Maintain Stable Exchange Rates
One thing that hampers international trade anddiscourages investment is a volatile exchangerate that makes it difficult for states orenterprises to plan ahead. It is important thatthe rate is realistic: too high, and it willjeopardize employment by penalizing exportersas well as farmers and other local producers whowill face more competition from imports; toolow, and there is a risk of a rise in the domesticprice level, with adverse impact on the cost ofliving of the poor.
Exchange rates are likely to fluctuate,especially in small and open economies that arepowerless against the rise or fall in internationalcommodity prices. With floating exchange rates,these economies are also susceptible to the‘Dutch disease’, in which inflows of capital
Governmentsneed to havean alternativetax regime inplace beforeembarking onliberalization
CHAPTER 7: TRADE FOR HUMAN DEVELOPMENT: AN EIGHT-POINT AGENDA 151
without sufficient investment opportunities toabsorb them can push the exchange rate tounrealistic levels. This can happen as a result ofrising commodity prices, as with the oil price forTimor-Leste. But it can also be a consequenceinflows of aid, for example, or as a result of thearrival of funds for disaster relief as with thetsunami.
Currency devaluations, while seeming tooffer a short-term boost, have generally beenineffective. Most of the successful Asian tradingcountries, compared with those in LatinAmerica, for example, have benefited from longperiods of relative exchange rate stability basedon active currency management.
Initially, rather than having a freely floatingexchange rate, countries that are becoming moreinvolved with international trade can consider a‘managed float’ that permits their currency todepreciate slowly. Many countries havecombined trade liberalization with a gradualdepreciation of the currency that prevented anunsustainable buildup of trade deficits. Theoverall priority, however, is to ensure that therate remains relatively stable and realistic.
7. Persist with Multilateralism
The slow pace of progress in the Doha Round ofmultilateral trade negotiations has discouragedmany developing countries. They can see this‘development round’ running into some familiarimpediments, especially the resistance from thedeveloped countries over agricultural subsidies.This is leading at best to pessimism, and at worstto a crisis of falling expectations that could causethe developing countries to abandon multila-teralism altogether.
Despairing of the WTO negotiations, manycountries are also seeking bilateral tradeagreements with the developed countries. Somewould argue that in terms of trade these arebetter because they give preferential access. Butin terms of human development, they may
impose high costs. Bilateral agreements typicallyinvolve much deeper tariff concessions from thedeveloping countries and make demands onissues like intellectual property rights that go farbeyond what WTO members require of eachother – and can threaten the health and live-lihoods of the poor.
Many countries of the region would dobetter to resist the immediate temptations of abilateral embrace and build up slower, butultimately more productive, multilateralrelationships that can lead to more durablehuman development outcomes.
8. Cooperate with Neighbours
Rather than seeking bilateral agreements,governments would do better to seek trade andother agreements with other countries in theirregion or subregion. These could include regio-nal pacts such as the South Asian Free TradeAgreement, the ASEAN Free Trade Agreement,or the Pacific Island Countries Trade Agreement.These have the advantage of being quicker tonegotiate than multilateral agreements whileposing less of a risk to human development thanbilateral ones. In addition, they dovetail wellwith the region’s many integrated cross-nationalproduction systems and lead to trade creation.
Regional trade agreements can also becomplemented by other forms of cooperation,particularly in the financial area. Many countriesin the region have accumulated vast foreignexchange reserves – $1.9 trillion in total, half ofwhich is in China – partly to protect themselvesagainst another Asian financial crisis. Thesefunds could be put to better use if they werepooled so that countries facing sudden balanceof payments crises caused, say, by a spike in oilprices could draw on this shared Asian resource.Governments can also consider using thereserves to expand the Asian Development Fund,which could put resources to work forinvestment in large-scale infrastructure and in
Better to resistthe immediatetemptations of
a bilateralembrace and
build up slowerbut ultimately
moreproductive
multilateralrelationship
ASIA-PACIFIC HUMAN DEVELOPMENT REPORT 2006152
human development priorities such as health andeducation.
Reaching a Different Frontier
With or without new multilateral agreements,globalization will continue to power ahead. Andmillions more workers in the Asia Pacific regionwill find themselves producing goods for peopleon the other side of the globe – as well as buyingat lower prices goods their parents could scarcelyhave dreamed of.
The main hazard, however, is that millionsof others will fall by the wayside – abandoned inrural areas where agricultural economies havedrifted into decline, or scratching a living on thefringes of Asia’s mega-cities as a permanentunderclass. Even those currently in work mayfind themselves later discarded from ever moresophisticated production systems. This not onlydenies people their basic rights to decent work
and a reasonable standard of living; it alsoheightens the risk of future unrest. Globalizationdoes not just distribute products but alsodisseminates new ideas and information thatchange people’s expectations.
The countries of the Asia-Pacific region arerenowned for the speed at which they havedeveloped economically. Now they findthemselves at a different frontier – trying tocombine accelerated trade-driven economicgrowth with equally rapid poverty reductionand, more broadly, human development. Inmany ways, this is a more complex and difficulttask, and just as before, they will need to workout their own solutions. Some of these havealready been highlighted in this Report; otherswill only emerge in the light of experience. Onething is certain – that Asia and the Pacific willremain at the forefront of global developmentand will offer fresh lessons to the rest of theworld.
Asia and thePacific willoffer freshlessons to therest of theworld
BIBLIOGRAPHY 157
AccountAbility. 2004. “Managing the Transition to a
Responsible Global Textiles and Garment Industry:
An Integrated Study of Research by Account-
Ability, Business for Social Responsibility, and The
World Bank for the MFA Forum”. London. [http:/
/www.accountability.org.uk/uploadstore/cms/docs/
Managing%20the%20Transition%20(2).pdf].
Last accessed May 2006.
Acharya, S.S., and D.P. Chaudhri. 2001. Indian Agricul-
tural Policy at the Cross Roads: Priorities and
Agenda. New Delhi: Rawat Publications.
ADB [Asian Development Bank]. (Various issues). Asian
Development Outlook. Manila: Asian Develop-
ment Bank.
———. 2001. Key Indicators of Developing Asian and
Pacific Countries 2001. Manila: Asian Develop-
ment Bank.
ADB/UNAIDS. 2004. “Asia Pacific’s Opportunity:
Investing to Avert and HIV/AIDS Crisis”.
———. Study Series. [http://www.adb.org/Documents/
Reports/Asia-Pacific/APO-HIV.pdf]. Last accessed
May 2006.
Adhikari, R. 2003. “Impact of Withdrawing Local
Development Fees on Decentralisation Process in
Nepal”. Background Paper. Hanoi: UNDP Asia
Trade Initiative.
———. 2004. “WTO Accession of Least Developed
and Low Income Countries of Asia and the Pacific:
A Human Development Perspective”. Background
Paper. Colombo: UNDP Asia Pacific Regional
HDR Initiative, Regional Centre in Colombo.
———. 2005a. “LDCs in the Multilateral Trading
System”. In Patrick Macrory, F.J., Arthur E.
Appleton, and Michael G. Plummer, eds. The
World Trade Organization: Legal, Economic and
Political Analysis. New York: Springer.
———. 2005b. “Vulnerability, Trade Integration and
Human Development”. Background Paper.
Colombo: UNDP Asia Pacific Regional HDR
Initiative, Regional Centre in Colombo.
Adhikari, R., and Yumiko Yamamoto. 2005. Flying
Colours, Broken Threads: One Year of Evidence
Bibliography
from Asia after the Phasing Out of Textiles and
Clothing Quotas. Colombo: UNDP Asia Trade and
Investment Initiative, Regional Centre in Colombo.
———. 2006. Sewing Thoughts: How to Realise
Human Development Gains in the Post-Quota
World. Colombo: UNDP Asia Trade and
Investment Initiative, Regional Centre in Colombo.
Aggarwal, A. 2006. Export Processing Zones and
Human Development. The Case of India. Mimeo.
April. Colombo: UNDP Regional Centre in
Colombo.
Ahmad, Munir. 2004. “Post-ATC Scenario – Trade
Projections and Multilateral Initiatives”. Back-
ground Paper. Hanoi: UNDP Asia Trade Initiative.
Ahmed, Iftekhar, Atiur Rahman, and Farooq Sobhan.
2005. Impact of Trade Changes on Labour
Standards – Lessons to be Learned from the
Response to the MFA Phase Out in Bangladesh. A
study prepared for the UK Department for
International Development (DFID).
Aibara, Homi. S., and K. Gopalani. 2005. “Tourism
and Human Development”. Background Paper.
Colombo: UNDP Asia-Pacific Regional HDR
Initiative, Regional Centre in Colombo.
Aksoy, Ataman. 2005. “Global Agricultural Trade
Policies”. In A. Aksoy, and J. Beghin, eds. Global
Agricultural Trade and Developing Countries.
Washington, DC: World Bank.
Akyüz, Yilmaz. 2003. Developing Countries and World
Trade: Performance and Prospects. UNCTAD,
TWN and Zed Books.
———. 2005a. Trade, Growth and Industrialization:
Issues, Experience and Policy Challenges. Third
World Network (TWN) Trade and Development
Series No. 28. Penang: TWN.
———. 2005b. The WTO Negotiations on Industrial
Tariffs: What is at stake for Developing Countries.
May. Geneva: TWN.
Amsden, Alice H. 1989. Asia’s Next Giant: South Korea
and Late Industrialization. New York: Oxford
University Press.
Anderson, K. 2003. “Trade Liberalization, Agriculture,
ASIA-PACIFIC HUMAN DEVELOPMENT REPORT 2006158
and Poverty in Low-income Countries”. UNU/
WIDER Discussion Paper No. 2003/25. Helsinki:
UNU/WIDER.
———. 2004. Agricultural Trade Reform and Poverty
Reduction in Developing Countries. Policy
Research Working Paper 3396. Washington, DC:
World Bank.
Arndt, Channing, Paul Dorosh, Marzia Fontana, and
Sajjad Zohir. 2002. Opportunities and Challenges
in Agriculture and Garments: A General
Equilibrium Analysis of the Bangladesh Economy.
Washington, DC: International Food Policy
Research Institute (IFPRI).
ATMI (American Textile Manufacturers Institute).
2003. The China Threat to World Textile and
Apparel Trade. Washington, DC: ATMI. [http://
www.ncto.org/textilecrisis/china.pdf].
Baffes, John, and Harry de Gorter. 2005. “Experience
with Decoupling Agricultural Support”. In A.
Aksoy, and J. Beghin, eds. Global Agricultural
Trade and Developing Countries. Washington, DC:
World Bank.
Baldwin, R.E. 1969. “The Case Against Infant Industry
Tariff Protection”. Journal of Political Economy
77, May/June.
Bales, S. 2000. “Vietnam’s Labour Situation and Trends:
Analysis based on 1992–93 and 1997–98”.
Vietnam Living Standards Survey Data. Back-
ground Paper for the Vietnam Development Report
2000. Hanoi: World Bank.
Bandyopadhyay, J. 2005. “How We Patterned the
World”. Darpan. Nov-Dec.
Bardhan, Pranab. 1971. “On Optimum Subsidy to a
Learning Industry: An Aspect of the Theory of
Infant-Industry Protection”. International Econo-
mic Review 12.
Belau, Dirk. 2003. New Threats to Employment in the
Travel & Tourism Industry – 2003. Geneva: Inter-
national Labour Organization. [http:/www.ilo.org/
public/english/bureau/inf/features/03tourism1.
html].
Beneria, Lourdes. 2003. Gender, Development and
Globalization: Economics as if People Mattered.
New York: Routledge.
Bergsten, F. 1997. “Open Regionalism”. Working Paper
97-3. Washington, DC: Institute for International
Economics.
Bhagwati, Jagdish. 1999. “Regionalism and Multi-
lateralism: An Overview”. In Jagdish Bhagwati,
Pravin Krishna, and Arvind Panagariya, eds.
Trading Blocs: Alternative Approaches to Analyz-
ing Preferential Trade Agreements. Cambridge:
MIT Press.
———. 2002. “The Poor’s Best Hope – Trading for
Development”. The Economist, 22 June.
———. 2004. In Defense of Globalization. London:
Oxford University Press.
Bhattacharya, D., and M. Rahman. 1999a. “The Least
Developed Countries in The WTO: Strengthening
Participation Capacities”. Paper prepared for the
Meeting of Senior Officials on Future WTO Trade
Agenda and Developing Countries organised by
UNESCAP, 23-25 August, Bangkok. [http://
www.unescap.org/tid/publication/chap4_2047.
pdf].
———. 1999b. “Female Employment under Export-
Propelled Industrialization: Prospects for Inter-
nalizing Global Opportunities in the Apparel
Sector in Bangladesh”. UNRISD Occasional Paper
10. July. Geneva.
Bhattasali, Deepak, Li Shantong, and Will Martin.
2004. “China’s Accession to the World Trade
Organization, Policy Reform, and Poverty
Reduction: An Introduction”. World Bank
Economic Review 18: 1-2.
Bhuyan, A.R. 1996. “Regional Cooperation in South
Asia: Outlook and Prospects under SAPTA”. South
Asian Survey 3(1 & 2): 197-217.
Blecker, Robert, and Razmi, Arslan. 2005. Relative
Prices and the Fallacy of Composition in Manufac-
turing-Based, Export-Led Growth: An Empirical
Investigation. Working Paper. 2005-13. American
University, Department of Economics, Washington,
DC. [http://www.american.edu/academic.depts/
cas/econ/workingpapers/2005-13.pdf].
Brenton, P. 2003. “Integrating the Least Developed
Countries into the World Trading System: The
Current Impact of EU Preferences under
Everything but Arms”. Policy Research Working
Paper. Washington, DC: World Bank.
Brooke, J. 2004. “A Year of Worry for Cambodia’s
Garment Makers”. The New York Times, 24
January.
Buchan, P., and J. Sochalski. 2003. International Nurse
Mobility: Trends and Policy Implications. Geneva:
World Health Organization. [http://www.icn.ch/
Int_Nurse_mobility%20final.pdf].
Busse, Matthias. 2004. “Trade, Environmental Regu-
BIBLIOGRAPHY 159
lations and the World Trade Organization: New
Empirical Evidence”. Policy Research Working
Paper 3361. July. Washington, DC: World Bank.
Butkeviciene, Jolita, Michiko Hayashi, Victor
Ognivtsev, and Tokio Yamaoka. 2001. “Terms of
WTO Accession”. In General Issues in WTO
Accession and Development Policies. New York
and Geneva: United Nations/UNCTAD. [http://
www.unctad.org/en/docs/ditctncd11_en.pdf].
Chanda, Rupa. 2003a. “Trade in Services: Movement
of Natural Persons and Human Development (IT
and Health). Case Study – India”. Background
Paper. Hanoi: UNDP Asia Trade Initiative.
———. 2003b. “Cross Border Supply and Movement
of Natural Persons: Complementary Approaches
to Liberalization”. Paper presented at the
UNCTAD Expert Meeting on Movement of
Natural Persons, 29-31 July, Geneva.
———. 2004. “Global Outsourcing of Services and
Human Development”. Background Paper. New
Delhi: UNDP Asia-Pacific Regional HDR
Initiative.
Chandrasekhar, C.P., and Jayati Ghosh. 1999.
“Seattle and the Smaller Countries”. New Delhi:
Macroscan. [http://www.macroscan. org/fet/dec99/
fet141299Seattle_3.htm].
———. 2005. The Market That Failed. New Delhi:
Leftword Books.
Chang, Ha-Joon. 1996. The Political Economy of
Industrial Policy. London: Macmillan Press.
———. 2002. Kicking Away the Ladder: Policies and
Institutions for Economic Development in
Historical Perspective. London: Anthem Press.
Charveriat, C., and M. Kirkbride. 2003. “Cambodia’s
Accession to the WTO: How the Law of the Jungle
is Applied to One of the World’s Poorest Count-
ries”. Briefing Note. Oxford: Oxfam International.
Chomthongdi, J. 2004. “Challenging the Market Access
Agenda: A Case Study on Rice from Thailand”.
Bangkok: Focus on the Global South.
Chuenjaipanich, Vipa. 2004. “Champagne Law Comes
into Effect”. Bangkok Post Business News. 23
April.
Commonwealth Secretariat, and UNCTAD. 2001. Duty
and Quota Free Market Access for LDCs: An
Analysis of Quad Initiatives. UNCTAD/DITC/
TAB/Misc.7. London and Geneva: Commonwealth
and the United Nations Conference on Trade and
Development (UNCTAD).
Consumer International. 2005. “Asian Conference on
Traditional and Complementary Medicine”.
[www.consumerinternational.org].
Conroy, M.E., D.L. Murray, and P. Rosset. 1996. A
Cautionary Tale: Failed US Development Policy in
Central America. London: Rienner Publishers.
Costa-Pierce, B.A. 2002. “Ecology as the Paradigm for
the Future of Aquaculture”. In B.A. Costa-Pierce,
ed. Ecological Aquaculture: The Evolution of the
Blue Revolution. Malden, Massachusetts:
Blackwell Science.
DAFEL (Department of Administration of Foreign
Employment Labour Force). 2003. “Temporary
Overseas Employment In Viet Nam”. Hanoi:
DAFEL.
Das, Dilip. 2001. “Regional Trading Arrangements and
the Global Economy: An Asia-Pacific Perspective”.
Monograph. Cambridge: Harvard University,
Centre for International Development. [http://
www2.cid.harvard.edu/cidtrade/Issues/das5.pdf].
Deardorff, A.V., and R.M. Stern. 2004. “Globalization’s
Bystanders: Does Globalization Hurt Countries
that Do Not Participate?” Paper prepared for the
UNU/WIDER Project Meeting on The Impact of
Globalization on the World’s Poor, 29-30 October,
Helsinki.
Deb, Uttam. 2003. “Trade Liberalization and Agri-
cultural Development in Bhutan”. Background
Paper. Hanoi: UNDP Asia Trade Initiative.
DFID (UK Department for International Department).
1998. “Sustainable Tourism and Poverty Elimina-
tion”. Background Study for DFID/DETR Work-
shop on Sustainable Tourism and Poverty, 13
October. [www.propoortourism.org.uk/dfid_paper.
pdf].
Dhar, B. 2003. “Trade in Agriculture, Food Security
and Human Development: Country Case Study
for India”. Hanoi: UNDP Asia Trade Initiative.
———. 2004a. “Trade Liberalisation and the Agricul-
tural Sector: Experience of Developing Countries
in Asia”. Background Paper. New Delhi: UNDP
Asia Pacific Regional HDR Initiative.
———. 2004b. “Synthesis Paper on Agriculture, Food
Security and Human Development”. Hanoi: UNDP
Asia Trade Initiative.
Diao, X., and A. Somwaru. 2001. “Unraveling the
Multi-Fibre Agreement (MFA): Impact of the MFA
Phase-out on the World Economy – An
Intertemporal Global General Equilibrium
ASIA-PACIFIC HUMAN DEVELOPMENT REPORT 2006160
Analysis”. TMD Discussion Paper No. 79.
Washington, DC: IFPRI Trade and Macro-
economic Division.
Dillon, H. 2001. “The Crisis and Agriculture Policy”.
In A. Smith, ed. Gus Dur and the Indonesian
Economy. Singapore: Institute of Southeast Asia
Studies.
DOLE (Philippine Department of Labour and Employ-
ment). 2001. Press Release. 29 May. Manila.
Dollar, D., and A. Kraay. 2000. “Growth is Good for
the Poor”. Journal of Economic Growth, 7(3):
195-225.
———. 2001. Trade, Growth and Poverty. Working
Paper No. 2615. Washington, DC: World Bank.
Downes, D., and S. Laird. 1999. Community Registries
of Biodiversity-Related Knowledge. Paper pre-
pared for UNCTAD Biotrade Initiative. [http://
www.ciel.org/Publications/CommunityRegistries.
pdf].
Economic Times. 2002. “International Business”. Delhi:
Indiatimes.
Economist Intelligence Unit (EIU). 2004. Country
Report on Nepal. August. London: The Economist
Intelligence Unit.
Einarsson, P. 2001. “The Disagreement on Agriculture”.
Seedling 18(1): 5–15, March.
Ethier, W. 1998. “The New Regionalism”. The Econo-
mic Journal 108: 1149-1161.
European Commission. 2003. “Evolution of Trade in
Textile and Clothing World-wide: Trade Figures
and Structural Data”. Background Paper. Prepared
for the Conference on the Future of Textiles and
Clothing Trade after 2005, 5–6 May. Brussels.
Evenett, S., and J. Gage. 2005. Evaluating WTO
Accession: The Effect of WTO Accession on
National Trade Flows. Working Paper. 22 January.
[http: / /www.evenett .com/working/evalua-
tingWTOaccessions.pdf].
FAO (Food and Agricultural Organization). FISHSTAT
PLUS. Universal software for fishery statistical
time series. [http://www.fao.org/fi/statist/FISOFT/
FISHPLUS.asp]. Last accessed March 2006.
———. 1998. Report of the Technical Consultation on
the Feasibility of Developing Non-Discriminatory
Technical Guidelines for Eco-Labelling of Products
from Marine Capture Fisheries. Rome: FAO.
———. 1999a. Cambodia – Fishery Country Profile.
Rome: FAO. [http://www.fao.org/fi/fcp/fcp.asp].
Last accessed July 2005.
———. 1999b. Vietnam – Fishery Country Profile.
Rome: FAO. [http://www.fao.org/fi/fcp/fcp.asp].
———. 2000. Indonesia – Fishery Country Profile.
Rome: FAO. [http://www.fao.org/fi/fcp/fcp.asp].
———. 2002. The State of World Fisheries and
Aquaculture. Rome: FAO.
———. 2003a. “Food Import Bills of Least Developed
Countries (LDCs) and Net Food Importing
Developing Countries (NFIDCs)”. Rome: FAO.
[http://www.fao.org/documents/show_cdr.asp?url_
file=/docrep/005/y4852e/y4852e06.htm]. Last
accessed May 2006.
———. 2003b. WTO Agreement on Agriculture: The
Implementation Experience – Developing Country
Case Studies. Rome: FAO.
———. 2003c. The State of World Fisheries and
Aquaculture 2002. Rome: FAO.
———. 2004a. The State of Food Insecurity in the
World 2004: Monitoring Progress towards the
World Food Summit and Millennium Development
Goals. Rome: FAO.
———. 2004b. “Follow-up to the World Food Summit
and the World Food Summit Five Years Later:
Regional Dimensions”. Twenty-seventh FAO
Regional Conference for Asia and the Pacific.
Beijing, PR of China, 17-21 May. Rome: FAO.
[http://www.fao.org/DOCREP/MEETING/007/
Y6450E.HTM]. Last accessed June 2005.
———. 2004c. The State of Agricultural Commodity
Markets. Rome: FAO.
———. 2004d. “Safety and Quality with Particular
Emphasis on Fishmeal and BSE”. Committee on
Fisheries, Sub-Committee on Fish Trade, Ninth
Session, Bremen. COFI: FT/IX/2004/4. Rome:
FAO.
———. 2005. The State of World Fisheries and
Aquaculture 2004. Rome: FAO.
FAS/USDA (Foreign Agriculture Service/United States
Department of Agriculture). 2005. FAS Reference
Guide to World Horticultural Trade. October.
Washington, DC: FAS, USDA.
Finger, Michael. 2000. “The WTO’s Special Burden on
Less Developed Countries”. Cato Journal (19)3.
Finger, J. Michael, and Philip Schuler. 1999.
Implementation of Uruguay Round Commitments:
The Development Challenge. Policy Research
Working Paper 2215. Trade Development
Research Group. Washington, DC: World Bank.
Fong, Cai. 2006. “Towards a Labour Market in China
BIBLIOGRAPHY 161
by John Knight and Lina Song”. Asian-Pacific
Economic Literature, 20: 71-71.
Francis, Smitha. 2005. Regionalism in South East Asia:
The Old and the New. Working Paper. New Delhi:
International Development Economics Associates.
[www.networkideas.org].
Frankel, Jeffrey, and David Romer. 1999. “Does Trade
Cause Growth?”. American Economic Review, 89
(3): 379-399.
Garcia, Pablo, and Claudio Soto. 2004. Large
Hoardings of International Reserves: Are they
worth it?. Working Paper No. 299. Santiago:
Banco Centrale de Chile.
Ghosh, Jayati. 2004a. Thematic Summary Report:
External Trade Policies and the Macroeconomics
of Poverty Reduction. Preliminary Draft.
Colombo: UNDP Asia Pacific Regional Programme
on the Macroeconomics of Poverty Reduction,
Regional Centre in Colombo.
———. 2004b. “Migration, GATS and Human
Development”. Background Paper. New Delhi:
UNDP Asia-Pacific Regional HDR Initiative.
Greenwald, Bruce, and Joseph Stiglitz. 2006. “Helping
Infant Economies Grow: Foundations of Trade
Policies for Developing Countries”. Paper
presented at the Allied Social Sciences Association
Annual Conference. 6 January. Boston.
Haggard, Stephan. 2004. “Institutions and Growth in
East Asia”. Studies in Comparative International
Development 38 (4): 3-82.
Harada, Y. 2002. “Tuning Tuna”. SAMUDRA Report
No. 33. Chennai: International Collective in
Support of Fishworkers (ICSF).
Hausmann, R., J. Hwang, and D. Rodrik. 2006. “What
You Export Matters”. CEPR Discussion Paper
5444. London: Centre for Economic Policy
Research.
Higgott, Richard. 1998. “The International Political
Economy of Regionalism: The Asia-Pacific and
Europe Compared”. In William D. Coleman, and
Geoffrey R.D. Underhill, eds. Regionalism and
Global Economic Integration, Europe, Asia and
the Americas. New York: Routledge.
Hirantha, Seekkuwa Wasam. 2004. “From SAPTA to
SAFTA: Gravity Analysis of South Asian Free
Trade”. Paper presented at the European Trade
Study Group ETSG 2004 Programme. September.
Nottingham.
Hoekman, B., Philip English, and Aditya Mattoo, eds.
2002. Development, Trade, and WTO: A
Handbook. Washington, DC: World Bank.
Hoekman, Bernard M., and Michel M. Kostecki. 2001.
The Political Economy of the World Trading
System. The WTO and Beyond. Oxford: Oxford
University Press.
Hossain, M.A. 2001. “On Export-Led Growth”.
Discussion Paper No. 297. University of Queens-
land Australia, School of Economics.
Humpal, D., and P. Guenette. 2000. “Processed Food
Safety in Developing Economies”. 2000 Agri-
business Forum Paper. Texas: International Food
and Agribusiness Management Association. [http:/
/www.ifama.org/conferences/2000Congress/
Forum%20-%20Final%20PAPERS/Area%20IV/
Guenette_Paul.PDF].
Huy, Vu Quoc, Cu Chi Loi, Dao Quang Vinh, and
Nguyen Gia Liem. 2003. “Trade in Services:
Movement of Natural Persons and Human
Development. County Case Study – Vietnam”.
Hanoi: UNDP Asia Trade Initiative.
IATP (Institute for Agricultural and Trade Policy).
2003. “The TRIPS Agreement: Who Owns and
Controls Knowledge and Resources”. WTO
Cancun Series Paper No. 5. Minneapolis: IATP.
———. 2004. “United States Dumping on World
Agricultural Markets: February 2004 Update”.
Cancun Series Paper No. 1. Minneapolis. Inter-
national Collective in Support of Fishworkers
(ICSF). 1998. Fish Stakes. Chennai: ICSF.
ICFTU (International Confederation of Free Trade
Unions). 2005. Annual Survey of Violations of
Trade Union Rights. Brussels: ICFTU.
ICSF (International Collective in Support of
Fishworkers). 2003. Report on Coastal Fisheries
and Poverty: The Case of India. Chennai: ICSF.
ICTSD (International Centre for Trade and Sustainable
Development). 2003. “Cancun Collapsed: Where
There’s No There’s No Way”. Bridges Daily
Update. Issue 6. 15 September. Geneva: ICTSD.
ILO (International Labour Organization). 2001. World
Employment Report: Life at Work in the
Information Economy. Geneva: ILO.
———. 2003. Yearbook of Labour Statistics 2003.
Geneva: ILO.
———. 2005a. Labor and Social Trends in Asia and
the Pacific 2005. Bangkok: ILO Regional Office
of Asia and the Pacific.
———. 2005b. Promoting Fair Globalisation in
ASIA-PACIFIC HUMAN DEVELOPMENT REPORT 2006162
Textiles and Clothing in a Post-MFA Environment:
Report for Discussion at the Tripartite Meeting on
Promoting Fair Globalisation in Textiles and
Clothing in a Post-MFA Environment. TMTC-
PMFA/2005. Geneva: International Labour Office.
[http://www.ilo.org/public/english/dialogue/sector/
techmeet/tmtc-pmfa05/tmtc-pmfa-r.pdf].
———. 2005c. Facts on The Hotel, Catering &
Tourism Industry. Geneva: ILO. [www.ilo.org/
public/english/bureau/inf/download/wssd/pdf/
tourism.pdf].
IMF (International Monetary Fund). 2004. World
Economic Outlook. Washington, DC: IMF.
———. 2006. International Financial Statistics website.
[http://.ifs.apdi.net/imf]. Accessed May 2006.
IMF, and World Bank. 2002. “Market Access for
Developing Country Exports: Selected Issues”.
mimeo. Washington, DC: IMF/World Bank.
Inama, Stefano. 2002. “Improving Market Access for
Least Developed Countries”. UNCTAD/DITC/
TNCD/4. Geneva: UNCTAD.
IOM (International Organization for Migration)-
UNDP. 2002. Contribution of Returnees: An
Analytical Survey of Post Return Experience.
Dhaka: IOM.
Ismail, F. 2005. “Mainstreaming Development in the
World Trade Organization”. Journal of World
Trade 30(1).
ITCB (International Textiles and Clothing Bureau).
2003. “Anti-Dumping Actions in the Area of
Textiles and Clothing: Developing Members’
Experiences and Concerns”. Submission to WTO
Negotiating Group on Rules. February 2003.
Iyengar, J. 2004. “India-China: Plagued by the
Peasants’ Plight”. Asia Times Online. 15 July.
[www.atimes.com/atimes/China/FG15Ad03.html].
Jahan, Selim. 2000. “Economic Growth and Human
Development: Issues Revisited”. Keynote speech
at a conference hosted by the St. Mary’s University
Institute for International Development, Halifax,
Canada. 2000.
Jayanetti, Sanath. 2003. “Trade in Services: Movement
of Natural Persons and its Human Development
Implications. County Case Study (Housemaids and
Unskilled Migrant Workers) – Sri Lanka”. Hanoi:
UNDP Asia-Pacific Initiative on Trade, Economic
Governance and Human Development.
Jha, V., ed. 2003. Trade, Globalization and Gender-
Evidence from South Asia. New Delhi: UNIFEM/
United Nations.
Joshua Aizenman, and Jaewoo Lee. 2005. International
Reserves: Precautionary versus Mercantilist Views,
Theory and Evidence. April. University of
California Santa Cruz, Economics Department.
[http: / /econ.ucsc.edu/faculty / ja izen/pubs/
PreMercAp06.pdf].
Kanniah, Rajeswari. 2003. “TRIPS, Farmers’ Rights
and Food Security: The Issues at Stake”. Kuala
Lumpur: Consumers International Asia Pacific
Office.
Kathuria, Sanjay, Will Martin, and Anjali Bhardwaj.
2001. Implications for South Asian Countries of
Abolishing the Multifibre Arrangement. World
Bank Policy Research Working Paper 2721.
Washington DC: World Bank.
Kearney, A.T. 2004. Making Offshore Decisions: A.T.
Kearney’s 2004 Offshore Location Attractiveness
Index. Chicago: A.T. Kearney, Inc. [http://www.
atkearney.com/shared_res/pdf/Making_Offshore_
S.pdf].
Kelegama, S. 2003. “Sri Lanka’s Exports to India:
Impact of the Free Trade Agreement”. Economic
and Political Weekly XXXVIII (30), 26 July.
Kelegama, S., and R. Adhikari. 2005. “Repositioning
SAFTA in the Regionalism Debate”. South Asian
Journal (7).
Kelsey, Jane. 2004. “A People’s Guide to PACER: The
Implications for the Pacific Islands of the Pacific
Agreement on Closer Economic Relations
(PACER)”. Final Report commissioned by the
Pacific Network on Globalisation (PANG).
Canada: Victoria, BC.
Kemal, A.R. 2006. “Export-oriented Industrial Cluster
and Human Development. The Case of Sialkot in
Pakistan”. Mimeo. Colombo: UNDP Regional
Centre in Colombo.
Keong, Choong Chee, Zulkornain B. Yusup, and Venus
Khim-Sen Liew. 2003. “Export-Led Growth
Hypothesis in Malaysia: An Application of Two-
Stage Least Square Technique”. International
Finance Series 0308002, in EconWPA. [http://
129.3.20.41].
Khondker, Bazlul H., Abdul Razzaque, and Nazneen
Ahmed. 2005. “Exports, Employment and Work-
ing Conditions in the Post-MFA RMG Industry”.
Mimeo. International Labour Office. [http://
training.itcilo.org/decentwork/StaffConf2005/
resources/session%20VI/S6%20Bazlul-Issue-
Paper.pdf].
Khundkar, Nasreen. 2001. “Garment Industry in
BIBLIOGRAPHY 163
Bangladesh”. Presentation on Bangladesh at the
Sub-regional Meeting on Productivity, Competi-
tiveness and Job Quality in the Garment Industry
in South Asia, 25-26 September, Kathmandu. New
Delhi: ILO. [http://www-ilo-mirror.cornell.edu/
public/english/region/asro/newdelhi/download/
garment.pdf].
Konandreas, P, and J. Greenfield. 1996. Policy Options
for Developing Countries to Support Food Security
in the Post-Uruguay Round Period. Rome: FAO.
Kumar, Mohan. 2003. “Protection of Geographical
Indications”. Background Paper. Hanoi: UNDP
Asia Trade Initiative.
Kwa, A. 2004. “Indonesia and the WTO Agricultural
Negotiations: Heading in the Wrong Direction?”
Focus on the Global South, Bangkok. July.
Kwon, Huck-Ju, ed. 2005. Transforming the Develop-
mental Welfare State in East Asia. New York:
Palgrave Macmillan.
Lall, Sanjaya. 2004. “Reinventing Industrial Strategy:
The Role of Government Policy in Building
Industrial Competitiveness”. G-24 Discussion
Paper Series No. 28, April. New York and Geneva:
United Nations. [http://www.unctad.org/en/docs/
gdsmdpbg2420044_en.pdf].
———. 2005. “Rethinking Industrial Strategy: The
Role of the State in the Face of Globalization”. In
Kevin Gallagher, ed. Putting Development First:
The Importance of Policy Space in the WTO and
the IFIs. London: Zed Books.
Lamberte, Mario B. 2005. “An Overview of Economic
Cooperation and Integration in Asia”. In Asia
Economic Cooperation and Integration: Progress,
Prospects, and Challenges. Manila: Asian
Development Bank.
Levine, Ross, and David Renelt. 1992. “A Sensitivity
Analysis of Cross Country Growth Regressions”.
American Economic Review 82: 942-963.
Li, Quan, R. Kynda, Jill J. McCluskey, and Thomas I.
Wahl. 2003. Consumer Attitudes Toward
Genetically Modified Foods in China. IMPACT
Center Working Paper. Washington State
University, Pullman, Washington, DC.
Macan-Markar, Marwaan. 2003. “The Price of
Cambodia’s WTO Entry”. Asia Times, 16 Sep-
tember.
Madeley, John. 2000. “Trade and Hunger”. Seedling.
December. [http://www.grain.org/seedling/index.
cfm?id=12].
Mahajan & Aibara 2001. Field Survey in Cambodia on
Tourism and Hotel Acquisition Opportunities.
Mumbai: Business Consulting Division.
Mahbub ul Haq Human Development Centre (MHDC).
2004. Human Development in South Asia 2003:
The Employment Challenge. Islamabad: MHDC.
Malhotra, Kamal. 2006. “National Trade and
Development Strategies: Suggested Policy
Directions”. Background Paper. Colombo: UNDP
Asia-Pacific Regional HDR Initiative.
Manalansan, M. 2002. “Biyuti in Everyday Life: Per-
formance, Citizenship and Survival among
Filipinos in the U.S.”. In Karen Shimakawa, and
Kandice Chuh, eds. Disciplining Asia: Theorising
Studies in the Asian Diaspora. Durham: Duke
University Press.
Marga Institute. 2006. “Export Processing Zones and
Human Development. The Case Study of Sri
Lanka”. Mimeo. Colombo: UNDP Regional
Centre in Colombo.
Matthew, Sebastian. 2005. “Trade and Human
Development in Asia: Fish and Fish Products”.
Background Paper. Hanoi: UNDP Asia Trade
Initiative.
McCulloch, N. 2004. “Trade and Poverty in Indonesia:
What are the Links”. Paper presented at Workshop
on Why Trade and Industry Policy Matters?,
14-15 January, Jakarta.
Messerlin, P.A. 2004. “China in the WTO: Anti-
dumping and Safeguards”. In D. Bhattasali, S. Li,
and W.J. Martin, eds. China and the WTO
Accession, Policy Reform, and Poverty Reduction
Strategies. Washington, DC: World Bank.
Ministry of Tourism, Cambodia. 2004. Tourist
Statistical Report. Executive Summary. Jan-Dec.
[http://www.mot.gov.kh].
Mohanty, S.K. 2003. “Regional Trade Liberalisation
under SAPTA and India’s Trade Linkages with
South Asia: An Empirical Assessment”. RIS
Discussion Paper No. 48. New Delhi: Research
and Information System for Developing Countries
(RIS).
Montes, Manuel F., and Emel Memis. 2005. “People,
Trade and Development: Learning from Asia-
Pacific”. Policy Paper. Colombo: UNDP Asia-
Pacific Trade and Investment Initiative.
Moran, W. 1993. “Rural Space as Intellectual
Property”. Political Geography 12: 263-277.
Mukherji, Indra Nath. 2004. “Towards a Free Trade
Area in South Asia: Charting a Feasible Course for
Trade Liberalisation with Reference to India’s
ASIA-PACIFIC HUMAN DEVELOPMENT REPORT 2006164
Role”. RIS Discussion Paper No. 86. New Delhi:
Research and Information System for Developing
Countries (RIS).
Muller, A.R., and R. Patel. 2004. “Shining India?
Economic Liberalisation and Rural Poverty in the
1990s”. Policy Brief No 10. Food First/Institute
for Food and Development Policy, Oakland, CA.
[http://www.foodfirst.org/pb10].
Naqvi, Syed Nawab Haider. 2004. “International Trade
and Economic Governance in Asia”. Background
Paper. New Delhi: UNDP Asia Pacific Regional
HDR Initiative.
Narsey, Wadan. 2004. PICTA, PACER and EPAs:
Where Are We Going? Tales of Fags, Booze and
Rugby. Employment and Labour Market Studies
Working Paper No. 6/2004. University of South
Pacific, Pacific Institute of Advanced Studies in
Development and Governance, Suva, Fiji.
NASSCOM (National Association of Software and
Service Companies)-Hewitt. 2003. Total Rewards
Study: IT Enabled Services Industry Report. New
Delhi.
Nelson, Richard R. 2004. “The Changing Institutional
Requirements for Technological and Economic
Catch Up”. Paper presented at the DRUID
Summer Conference on Industrial Dynamics,
Innovation and Development, 1 June, Elsinore,
Denmark.
Nguyen, Thi Hoa, Kirsty Sutherland, and John
Thoburn. 2002. “Globalisation and the Impact of
Restructuring in the Textiles Sector on Households
in Vietnam”. Paper presented at the DFID
Workshop on Globalisation and Poverty in
Vietnam, 23-24 September, Hanoi.
Nordås, Hildegunn Kyvik. 2004. “The Global Textile
and Clothing Industry Post the Agreement on
Textiles and Clothing”. Geneva: World Trade
Organization.
OECD (Organisation for Economic Cooperation and
Development). 2001. The DAC Guidelines: Stren-
gthening Trade Capacity for Development.
Paris.
———. 2005. “Agricultural Policies in OECD Coun-
tries: Monitoring and Evaluation”. Paris: OECD.
Ognivtsev, Victor, Eila Jounela, and Tang Xiaobing.
2001. “Accession to the WTO: The Process and
Selected Issues”. In WTO Accessions and Develop-
ment Policies. New York and Geneva: UNCTAD.
OPEC (Organization of the Petroleum Exporting
Countries). 2005. Annual Statistical Bulletin.
Vienna.
Ouyahia-McAdams, D.A. 2002. “Foreword”. In
Cambodia Human Development Report: Societal
Aspects of the HIV/AIDS Epidemic in Cambodia
Progress Report, 2001. Phnom Penh: UNDP.
Pack, Howard, and Larry E. Westphal. 1986.
“Industrial Strategy and Technological Change:
Theory versus Reality”. Journal of Development
Economics 22(1).
Pack, Howard, and Saggi, Kamal. 2006. “The Case for
Industrial Policy: A Critical Survey”. Policy
Research Working Paper. Washington, DC: World
Bank. [http://www-wds.worldbank.org/servlet/
WDS_IBank_Servlet?pcont=details&eid=000016406
_20060131160754].
Pal, Parhtapratim. 2005. Regional Trade Agreements in
a Multilateral Trade Regime. IDEAs Working
Paper. International Development Economics
Associates, New Delhi [www.networkideas.
org].
Palanivel, T. 2006. “Linkages between International
Trade and Employment”. Background Paper.
Colombo: UNDP Regional Centre in Colombo.
Palley, Thomas I. 2003. “Export-Led Growth: Evidence
of Developing Country Crowding-out”. In P.
Arestis, M. Baddeley, and J. McCombie, eds.
Globalisation, Regionalism, and Economic
Activity. Cheltenham: Edward Elgar.
———. 2006. “Thinking Outside the Box about Trade,
Development, and Poverty Reduction”. Policy
Paper 1. Economics for Democratic and Open
Societies Project: Washington, DC.
Palma, G. 2003. Three origins of the process of “de-
industrialization” and a new concept of the
“Dutch Disease”. Mimeo. Geneva: UNCTAD.
Panagariya, Arvind. 1999. “The Regionalism Debate:
An Overview”. The World Economy 22(4).
Pandey, P. 2004. “Indo-Nepal Treaty: Better if it Dies
its Natural Death” (in Nepali). Himal Khabar-
patrika, 17-31 August.
Patnaik, Prabhat, and C.P. Chandrasekhar. 1996.
“Investment, Exports and Growth: A Cross-
Country Analysis”. Economic and Political Weekly
31(1).
Paul-Majumder, P., and A. Begum. 2000. The Gender
Imbalances in the Export Oriented Garment
Industry in Bangladesh. World Bank Policy
Research Report on Gender and Development,
BIBLIOGRAPHY 165
Working Paper Series No. 12. Washington, DC:
World Bank.
Puri, L. 2005. “Towards a New Trade ‘Marshall Plan’
For The Least Developed Countries: How to
Deliver on the Doha Developement Promise and
Help Realize the UN Millenniumm Development
Goals”. UNCTAD Trade, Poverty and Cross-
Cutting Development Issues Study Series No. 1.
New York and Geneva: United Nations.
Purohit, P. 2004. “Special and Differential Treatment:
Issues for South Asia”. Briefing Paper 3.
Kathmandu: South Asia Watch on Trade,
Economics, and Environment (SAWTEE).
Rahman, Abdul Aziz. 2003. “Trade in Agriculture,
Food Security and Human Development: Country
Case Study for Malaysia”. Hanoi: UNDP Asia
Trade Initiative.
Rahman, Mustafizur, and Uttam Kumar Deb. 2003.
“Trade in Agriculture, Food Security and Human
Development: Country Case Study for
Bangladesh”. Hanoi: UNDP Asia Trade Initiative.
Rahman, R.I., and K.M.N. Islam. 2003. “Employment-
Poverty Linkages: Bangladesh”. Issues in Employ-
ment and Poverty Discussion Paper 10. Geneva:
ILO.
Raihan, Ananya. 2004. “Temporary Movement of
Natural Persons: Making Liberalisation in Services
Trade Work for Poor”. Paper presented at World
Bank Annual Bank Conference on Development
Economics, 10-11 May, Brussels.
Rajivan, Anuradha. 2004. “Movement of Natural
Persons: Implications for Human Development in
Asia”. Discussion Paper. New Delhi: UNDP Asia-
Pacific Regional HDR Initiative.
———. 2005. “Business Processes Outsourcing Across
National Boundries: Implications for Human
Development in Asia”. Discussion Paper. New
Delhi: UNDP Asia-Pacific Regional HDR
Initiative.
Rangnekar, D. 2003. “Geographical Indications: A
Review of Proposals at the TRIPS Council”. Issue
Paper No. 4. Geneva: ICTSD and UNCTAD.
Ranis, Gustav, and Frances Stewart. 2005. Dynamic
Links between the Economy and Human
Development. DESA Working Paper No. 8 ST/
ESA/2005/DWP/8. New York: United Nations,
Department of Economic and Social Affairs.
Ravi, V. 2003. “Protection of GIs in India”. Presen-
tation at WIPO Asia Pacific Symposium on GIs,
18-20 November, Delhi.
Reinert, Erik. 2003. “Increasing Poverty in a Globalized
World: Marshall Plans and Morgenthau Plans as
Mechanisms of Polarization of World Incomes”.
In Ha-Joon Chang, ed. Rethinking Development
Economics. London: Anthem Press.
———. 2005. “Development and Social Goals:
Balancing Aid and Development to Prevent
Welfare Colonialism”. Paper presented at the
Development Forum, UNDESA. 14 March 2005.
New York.
Richards, Craig, and Lori Margolis. 2004. “US:
Outsourcing Threatens One in Six Jobs in Silicon
Valley”. World Socialist Website. [http://
www.wsws.org/articles/2004/may2004/sili-
m05_prn.shtml].
RIS (Research and Information System for Develop-
ing Countries). 2002. South Asia Development
and Cooperation Report 2001/02. New Delhi:
RIS.
Rodriguez, F., and Rodrik, D. 1999. Trade Policy and
Economic Growth: A Skeptic’s Guide to the Cross-
National Evidence. NBER Working Paper W7081.
Cambridge, MA: National Bureau of Economic
Research.
Rodrik, Dani. 1993. Taking Trade Policy Seriously:
Export Subsidization as a Case Study in Policy
Effectiveness. NBER Working Paper Series,
Working Paper No. 4567. December. Cambridge,
MA: National Bureau of Economic Research.
———. 1997. Has Globalisation Gone too Far?
Washington, DC: Institute for International
Economics.
———. 2001. “The Global Governance of Trade As if
Development Really Mattered”. Background paper
for Trade and Sustainable Human Development
Project. New York: UNDP.
———. 2002. “Trade Policy Reform as Institutional
Reform”. In Bernard Hoekman, Aaditya Mattoo,
and Philip English, eds. Development, Trade, and
the WTO. Washington, DC: World Bank.
———. 2004. “Industrial Policy for the Twenty-First
Century”. CEPR Discussion Paper No. 4767.
November. London: Center for Economic Policy
Research.
———. 2006a. “What’s So Special about China’s
Exports?” CEPR Discussion Paper No. 5484.
London: Centre for Economics and Business
Research.
———. 2006b. “The Social Cost of Foreign Exchange
Reserves.” CEPR Discussion Paper No. 5483.
ASIA-PACIFIC HUMAN DEVELOPMENT REPORT 2006166
London: Centre for Economics and Business
Research.
Romalis, J. 2003. “Would Rich Country Trade
Preferences To Help Poor Countries Grow?
Evidence from the Generalized System of
Preferences”. Mimeo.
Rose, A. 2004. “Do We Really Know that WTO
Increases Trade?” American Economic Review
94(1): 98–114.
Sachs, J. 2005. The End of Poverty: Economic Possibi-
lities for our Time. New York: The Penguin Press.
Sachs, J., and A. Warner. 1995. “Economic Reform and
the Process of Global Integration”. Brookings
Papers on Economic Activity 1: 1-118.
Washington, DC: Brookings Institution.
Saggi, K. 2002. “International Technology Transfer and
Economic Development”. In Bernard Hoekman,
Aaditya Mattoo, and Philip English, eds.
Development, Trade and the WTO: A Handbook.
World Bank Trade and Development Series.
Washington, DC: World Bank.
Santos-Paulino, A., and A.P. Thirlwall. 2004. “The
Impact of Trade Liberalisation on Exports, Imports
and the Balance of Payments of Developing Coun-
tries”. The Economic Journal 114(493): 50-72.
Scharer, R. 2001. “MSC Certification, A Small Start”.
SAMUDRA Report 29, August 2001. Chennai:
International Collective in Support of Fishworkers
(ICSF).
Setiawan, B. 2003. Globalisasi Pertanian: Ancaman
atas Kedaulatan Bangsa dan Kesejahteraan Petani
(Agricultural Globalisation: The Threat over the
National Sovereignty and the Welfare of Farmers).
Jakarta: The Institute for Global Justice (IGJ).
Siegmann, Karin Astrid. 2004. “Prospects for Women
Textile and Clothing Workers in the Post-quota
Era”. SDPI Research Bulletin 2(2-5), March-
October. Islamabad: Sustainable Development
Policy Institute.
———. 2006. Gendered Employment in the Post-
Quota Era: The Case of Pakistan. Working Paper.
January. Islamabad: Sustainable Development
Policy Institute.
Sri Lanka Bureau of Foreign Employment. 2001.
Statistical Hand Book on Migration. Colombo:
SBFE. [http://www.slbfe.lk/feb/stat_main.html].
Last accessed May 2006.
Srinivasan, T.N. 1997. “Regionalism and the World
Trade Organization: Is Non-Discrimination
Passe?” In A.O. Krueger, ed. The World Trade
Organization as an International Institute.
Chicago: University of Chicago Press.
———. 1999. “Developing Countries in the World
Trading System: From GATT, 1947 to the third
Ministerial Meeting of the WTO, 1999”. The
World Economy 22(8).
Srinivasan, T.N, and J. Bhagwati. 1999. “Outward
Orientation and Development; Are Revisionists
Right?” Discussion Paper No. 806. Yale University,
Economic Growth Centre, New Haven.
Stevens, C., and J. Kennan. 2004. “Making Trade
Preferences More Effective”. Briefing Paper.
Institute of Development Studies, Brighton.
Stevens, C., and M. McQueen. 1999. Regional Trade
Agreements. Background Briefing No. 2. Brighton:
Institute of Development Studies.
Stiglitz, J. 2003. “Poverty, Globalization and Growth:
Perspectives on Some of the Statistical Links”. In
UNDP Human Development Report 2003,
Millennium Development Goals: A compact
among nations to end human poverty. New York:
Oxford University Press.
Subramanian, A., and S. Wei. 2003. The WTO
Promotes Trade, Strongly but Unevenly. IMF
Working Paper WP/03/185. Washington, DC.
Succar, Patricia. 1987. “The Need for Industrial Policy
in LDC’s – A Re-statement of the Infant Industry
Argument”. International Economic Review 28(2).
June.
Summers, L. 1991. “Regionalism and the World
Trading System”. In Policy Implications of Trade
and Currency Zones. Wyoming: Federal Reserve
Bank of Kansas City.
Thomas, C.Y. 2005. The Concerns of Small States in
the Global Trade Regime: Making Global Trade
Work for People. New York: UNDP.
Thomas, Steve. 2004. “Euphoria in the Pacific?
Regional Economic Partnership Agreements –
Implications for the Pacific”. Paper presented at
the New Zealand Asia Pacific European Studies
Association Conference “Outside Looking In”,
9-11 September, Christchurch. [http://www.europe.
canterbury.ac.nz/conferences/apeu2004/papers/
thomas.pdf].
Thondavadi, N., and G. Albert. 2004. Offshore
Outsourcing: Path to New Efficiencies in IT and
Business Processing. Bloomington: 1st Books.
Thual, D. 2003. “Sui Generis Protection versus
BIBLIOGRAPHY 167
Trademark Registrations: The Parma Ham
Experience”. Draft paper presented at the EU-
China WTO Programme, Beijing, December.
Tokrisna, R. 2003. “Trade in Fisheries and Human
Development: Country Case Study – Thailand”.
Hanoi: UNDP Asia Trade Initiative. [http://www.
undprcc.lk/web_trade/tradegeneva/03Fisheries/
Thailand%20Fisheries.pdf].
Tran-Nguyen, Anh-Nga, and Americo Beviglia
Zampetti, eds. 2004. Trade and Gender: Opportu-
nities and Challenges for Developing Countries.
UNCTAD, UN Inter-Agency Network on
Women and Gender Equality, Task force on
Gender and Trade. Geneva and New York: United
Nations.
Tuan, Lam Quoc. 2003. “Trade in Fisheries and Human
Development: Country Case Study – Vietnam”.
Hanoi: UNDP Asia Trade Initiative. [http://
library.enaca.org/AquaMarkets/presentations/
OtherPapers/VietnamCaseStudy.pdf].
Udagedara, Saman. 2003. “Written Statement of Sri
Lanka ITC Study to Assess the Textile and Apparel
Industries of Foreign Suppliers Pertinent to their
Adjustment to Final Phaseout of Quotas on
January 2005”. (From Sri Lankan Commercial
Minister; revised statement), USITC Investigation,
332-448, Competitiveness of the Textile and
Apparel Industries. [http://63.173.254.11/
pub3671/ main.html].
ul Haq, Mahbub. 1995. Reflections on Human
Development. New York: Oxford University Press.
UN (United Nations) ComTrade. “UN Commodity
Trade Statistics Database (UN Comtrade)”. New
York: United Nations. [http://unstats.un.org/unsd/
comtrade/]. Last accessed May 2006.
UN Millennium Project. 2005. Investing in Develop-
ment: A Practical Plan to Achieve the Millennium
Development Goals. London: Earthscan. [http://
www.unmillenniumproject.org/documents/
MainReportComplete-lowres.pdf].
UNCTAD (United Nations Conference on Trade and
Development) and Commonwealth Secretariat.
1999a. Trade and Development Report 1999:
Fragile Recovery and Risks – Trade Finance and
Growth. Geneva: UNCTAD. [http://www.unctad.
org/en/docs/tdr1999_en.pdf].
———. 1999b. The Least Developed Countries Report
1999. Geneva: UNCTAD. [http://www.unctad.org/
en/docs/ldc1999_en.pdf].
———. 2001. “Duty and Quota Free Market Access
for LDCs: An Analysis of Quad Initiative”. New
York: UNCTAD and London: Commonwealth
Secretariat. [http://www.unctad.org/en/docs//
poditctabm7.en.pdf].
———. 2002. The Least Developed Countries Report
2002: Escaping the Poverty Trap. Geneva:
UNCTAD. [http://www.unctad.org/en/docs/ldc
2002_en.pdf].
_______. 2003a. E-Commerce and Development Report
2003. Geneva.
_______. 2003b. Trade and Development Report 2003:
Capital Accumulation, Growth, and Structural
Change. Geneva.
———. 2004a. Trade and Development Report 2004:
Policy Coherence, Development Strategies and
Integration into the World Economy. Geneva:
UNCTAD. [http://www.unctad.org/en/docs/
tdr2004_en.pdf].
———. 2004b. The Least Developed Countries Report
2004: Linking International Trade With Poverty
Reduction. Geneva: UNCTAD. [http://www.
unctad.org/en/docs/ldc2004_en.pdf].
———. 2005a. Handbook of Statistics 2005.
Geneva: UNCTAD. [http://www.unctad.org/en/
docs/tdstat30_en.pdf]. Last accessed May 2006.
———. 2005b. Trade and Development Report 2005.
New Features of Global Interdependence. Geneva:
UNCTAD.
UNDP and UNESCAP (United Nations Economic and
Social Commission for Asia and the Pacific). 2005.
Voices of the Least Developed Countries of Asia
and the Pacific: Achieving the Millennium
Development Goals Through a Global Partner-
ship. New Delhi: Elsevier. [http://www.undprcc.lk/
web_common/LDC-MDGAsiaP.pdf].
UNDP Malaysia. 2006. “International Trades, Growth,
Poverty Reduction and Human Development”.
Kuala Lumpur: UNDP. (Forthcoming).
UNDP. 1992. Human Development Report 1992.
Global Dimensions of Human Development. New
York: Oxford University Press.
———. 1996. Human Development Report 1996.
Economic Growth and Human Development. New
York: Oxford University Press.
———. 1999. Human Development Report 1999.
Globalization with a Human Face. New York:
Oxford University Press.
———. 2001. Human Development Report 2001.
ASIA-PACIFIC HUMAN DEVELOPMENT REPORT 2006168
Making New Technologies Work for Human
Development. New York: Oxford University Press.
———. 2003a. Human Development Report 2003.
Millennium Development Goals: A Compact
among Nations to End Human Poverty. New
York: Oxford University Press.
———. 2003b. Making Global Trade Work for People.
London: Earthscan.
———. 2003c. “The Macroeconomics of Poverty
Reduction: Initial Findings of the UNDP Asia-
Pacific Regional Programme”. Discussion Paper.
UNDP Bureau for Development Policy, New York.
[ht tp: / /www.undp.org/poverty /docs /Asia-
Pacific%20Initial%20Findings08-03-tmck.doc].
———. 2004. The Macroeconomics of Poverty
Reduction: The Case of China. May 2004. Beijing:
UNDP.
———. 2005a. Human Development Report 2005.
International Cooperation at a Crossroad: Aid,
Trade and Security in an Unequal World. New
York: Oxford University Press.
———. 2005b. “The Great Maze: Regional and
Bilateral Free Trade Agreements in Asia”. Policy
Paper. Colombo: UNDP Regional Centre in
Colombo. [http://www.undprcc.lk/web_trade/pub-
lications/Policy%20Paper%20Book% 203.pdf].
———. 2006a. “Regional Economic Integration and
Cooperation in South East Asia: Deepening and
Broadening the Benefits for Human Develop-
ment”. Colombo: UNDP Regional Centre in
Colombo (Forthcoming).
———. 2006b. “The Macroeconomics of Aid”. UNDP,
Dakar. [http://www.undp.org/surf-wa/Newsletter
0106/nw0106.htm].
UNESCAP (United Nations Economic and Social
Commission for Asia and the Pacific). 2004.
“Meeting the Challenges in an Era of Globali-
zation by Strengthening Regional Development
Cooperation”. Bangkok: UNESCAP. [http://
www.unescap.org/pdd/publications/regcoop/
regcoop_full.pdf].
———. 2005. Statistical Indicators for Asia and the
Pacific Volume XXXV, Quarter 4, December.
Bangkok: UNESCAP.
UNIDO (United Nations Industrial Development
Organisation). 2004. Industrial Development
Report 2004: Industrialisation, Environment and
the Millennium Development Goals in Sub-
Saharan Africa – The New Frontier in the Fight
Against Poverty. Vienna: UNIDO.
United Nations. 2005. The Millennium Development
Goals Report 2005. New York: United Nations.
[http://www.un.org/summit2005/MDGBook.
pdf].
USITC (United States International Trade Commission).
2004. “Textile and Apparel: Assessment of the
Competitiveness of Certain Foreign Suppliers to
the US Market”. Publication 3671. Washington,
DC: USITC.
Verma, Samar. 2004. “Trade in Textiles and Clothing
and Human Development in the Context of the
Full Implementation of the ATC”. Background
Paper. Hanoi: UNDP Asia Trade Initiative.
Vijayabaskar, M. 2002. “Garment Industry in India”.
In Joshi Gopal, ed. Garment Industry in South
Asia: Rags or Riches? Competitiveness, Producti-
vity and Job Quality in the Post MFA Environ-
ment. South Asia Multidisciplinary Advisory
Team. New Delhi: ILO.
Vinh, Nguyen Viet. 2003. Trade in Agriculture, Food
Security and Human Development: Country Case
Study for Viet Nam. Hanoi: UNDP Asia Trade
Initiative.
Wacziarg, Romain. 2001. “Measuring the Dynamic
Gains from Trade”. World Bank Economic Review
15: 393-429.
Wade, Robert. 1990. Governing the Market: Economic
Theory and the Role of Government in East Asian
Industrialization. New Jersey: Princeton University
Press.
———. 2004. “Is Globalization Reducing Poverty and
Inequality?” World Development 32 (4): 567-89.
Waglé, Swarnim. 2003. “A Tale of Two Asias: How
Human Development and Economic Integration
Can Reinforce Each Other”. Hanoi: UNDP Asia
Trade Initiative.
———. 2005. “International Trade in Textiles and
Clothing and Development Policy Options: After
the full implementation of the WTO Agreement
on Textiles and Clothing (ATC) on 1 January
2005”. Policy Paper. Colombo: UNDP Regional
Centre in Colombo. [http://www.undprcc.lk/
web_common/T&CPolicyPaper.pdf].
Waglé, Swarnim, and Murray Gibbs. 2003. Trade,
Economic Growth and Human Development: A
Primer. Hanoi: UNDP Asia Trade Initiative.
Walmsley, T.L., and A. Winters. 2003. “Relaxing the
Restrictions on the Temporary Movements of
Natural Persons: A Simulation Analysis”. CEPR
Discussion Paper No. 3719. Center for Economic
BIBLIOGRAPHY 169
Policy Research, London. [www.cepr.org/pubs/dps/
DP3719.asp].
WCSDG (World Commission on the Social Dimensions
of Globalization). 2004. A Fair Globalization:
Creating Opportunities for All. Geneva: Interna-
tional Labour Organization. [http://www.ilo.org/
public/english/wcsdg/docs/report.pdf].
Whalley, J. 1990. “Non-Discriminatory Discrimination:
Special and Differential Treatment under the
GATT for Developing Countries”. Economic
Journal 100 (403): 1318–28.
Wickramasekera, P. 2002. “Asian Labour Migration:
Issues and Challenges in an Era of Globalization”.
International Migration Paper No. 57, Interna-
tional Migration Programme. International Labour
Office, Geneva.
Winters, A.L, and P.M.G. Martins. 2004. Beautiful but
Costly: Business Costs in Small Economies.
London: Commonwealth Secretariat.
Winters, L. Alan, Terrie L. Walmsley, Zhen Kun Wang,
and Roman Grynberg. 2002. “Negotiating the
Liberalisation of the Temporary Movement of
Natural Persons”. In Economics Discussion Paper
No. 87. University of Sussex, Brighton.
Wood, Adrian. 1995. “How Trade Hurt Unskilled
Workers”. Journal of Economic Perspectives 9(3):
15-32.
———. 1997. “Openness and Wage Inequality in
Developing Countries: The Latin American
Challenge to East Asian Conventional Wisdom”.
World Bank Economic Review 11(1): 33-57.
Oxford: Oxford University Press. [http://
www.worldbank.org/research/journals/wber/
revjan97/pdf/artcle~3.pdf].
World Bank, ADB and UN. 2005. Maldives Tsunami:
Impact and Recovery. Joint Needs Assessment by
World Bank, Asian Development Bank and UN
System. [http://www.un.int/maldives/World%20
Bank%20Report.pdf].
World Bank. 2000. “Poverty in an Age of Globali-
zation”. Washington, DC: World Bank. [http://
www1.worldbank.org/economicpolicy/globali-
zation/documents/povertyglobalization. pdf].
———. 2002a. World Development Indicators 2002.
Washington, DC: World Bank.
———. 2002b. Embarking on a Global Voyage: Trade
Liberalization and Complementary Reforms in the
Pacific. Pacific Islands Regional Economic Report,
Washington, DC.
———. 2003. “World Fisheries: Coping with a Global
Crisis”. Washington, DC: World Bank. [http://
s i t e r e s o u r c e s . w o r l d b a n k . o r g / I N TA R D /
2145761112347900561/20424246/fish.pdf].
———. 2004. Global Economic Prospects 2005: Trade,
Regionalism and Development. Washington, DC:
World Bank.
———. 2005. World Development Indicators 2005.
Washington, DC: World Bank.
———. 2006. World Development Report 2005: A
Better Investment Climate for Everyone.
Washington, DC: World Bank.
World Tourism Organization. 2005a. Tourism High-
lights. 2005 Edition. [http://www.worldtourism.
org/facts/eng/highlights.htm].
———. 2005b. Annual Report 2005. Madrid: World
Tourism Organization.
———. 2005c. WTO in Asia and the Pacific 1998.
Madrid: World Tourism Organization. [www.
world-tourism.org/regional/east_ asia_&_pacific/
PDF/wto_asia_pacific_1998.pdf].
WTO (World Trade Organisation). Statistics Database.
[ h t tp : / / s t a t .w to .o rg / S t a t i s t i c a lP rog ram/
WSDBStatProgramHome.aspx?Language=E]. Last
accessed 10 July 2005.
———. 2001a. “Matrix on Trade Measures Pursuant
to Selected Multilateral Environmental
Agreements”. Note by the Secretariat, WT/CTE/
W/160/Rev.1 dated 14 June 2001. Geneva: WTO.
———. 2001b. “Technical Note on the Accession
Process”. Note by the Secretariat, WT/ACC/10,
21 December 2001. Geneva: WTO.
———. 2001c. “Doha Ministerial Declaration”, WT/
MIN(01). DEC/1. 20 November. Geneva: WTO.
———. 2001d. “Market Access Conditions for Least
Developed Countries”. WT/LDC/SWG/IF/14/
Rev.1/Add.1/. Geneva: WTO.
———. 2002a. World Trade Report 2002. Geneva:
WTO.
———. 2002b. International Trade Statistics 2002.
[h t tp : / /www.wto .or g / eng l i sh / re s_e / s ta t i s
_e/its2002_e/its02_toc_e.htm]. Last accessed May
2006.
———. 2002c. “Doha Ministerial Decision on Imple-
mentation-Related Issues and Concerns: CTG
examination of proposals contained in paras. 4.4
and 4.5 relating to the Agreement on Textiles and
Clothing – Request by the United States”. G/C/W/
366. WTO Council for Trade in Goods. Geneva:
WTO.
———. 2002d. “Trade Policy Review: Maldives”.
ASIA-PACIFIC HUMAN DEVELOPMENT REPORT 2006170
Report by the Secretariat, WT/TPR/S/110 dated
13 December 2002. Geneva: WTO. [http://
www.wto.org/english/tratop_e/tpr_e/tp209
_e.htm].
———. 2003a. International Trade Statistics 2003.
Geneva: WTO. [http://www.wto.org/english/res_e/
statis_e/its2003_e/section4_e/iv01.xls]. Last acces-
sed May 2006.
———. 2003b. “Draft Report of the Working Party on
the Accession of the Kingdom of Nepal to the
World Trade Organisation”. WT/ACC/NPL/16, 28
August. Geneva: WTO. [http://www.moics.gov.np/
wto_&_nepal/wto/protocol_on_the_accession_of_
the_kingdom_nepal/1_report_of_the_working
_party_on_the_accesSION%20OF%20the%
20kin..pdf].
———. 2004a. International Trade Statistics 2004.
Geneva: WTO. [http://www.wto.org/english/res_e/
statis_e/its2004_e/its04_toc_e.htm]. Last accessed
May 2006.
———. 2004b. Doha Work Programme: Decision
Adopted by the General Council on 1 August.
WT/L/579. Geneva: WHO.
———. 2005a. International Trade Statistics 2005.
Geneva: WTO. [http://www.wto.org/english/res_e/
statis_e/statis_e.htm]. Last accessed May 2006.
———. 2005b. World Trade Report 2005: Trade,
Standards and the WTO. Geneva: WTO.
———. 2005c. “Agriculture Negotiations – Status
Report: Key Issues to be Addressed by 31 July
2005”. Assessment by the Chairman, Committee
on Agriculture, 27 June 2005, Special Session. JOB
(05)/126. [http://www.tradeobservatory.org/
library.cfm?refID=73333].
STATISTICAL ANNEXES 171
Statistical Annexes
About the Data
Table 1. Basic Indicators 174Table 2. Human Development Index – Trends 175Table 3. Indicators of Poverty, Income Inequality and Undernutrition 176Table 4. Indicators of Access to Safe Drinking Water and Sanitation Facilities 177Table 5. Indicators of Maternal and Child Health 178Table 6. Indicators of Health Services 179Table 7. Indicators of Literacy and School Enrolment 180Table 8. Indicators of Gender Development 181Table 9. Indicators of Technology Diffusion 182
Table 10. Indicators of Energy and Environmental Sustainability 183Table 11. Tariffs, Domestic Peaks and International Peaks 184Table 12. MFN Tariffs with Respect to Agriculture 185Table 13. Customs and Other Duty Revenues 186Table 14. Trends in Real Effective Exchange Rate (REER, base 2000=100) 187Table 15. Trends in Real Interest Rates, 1990-2003 188Table 16. Trade and Growth 189Table 17. Merchandise Exports and Imports 190Table 18. Share of Agriculture in Exports and Value Added 191Table 19. Share of Manufacturing in Exports and Value Added 192Table 20. Share of Agriculture and Manufacturing in Imports 193Table 21. Export of Services by Sector 194Table 22. Import of Services by Sector 195Table 23. Growth of Exports, Imports and GDP 196Table 24. Labour Force and Unemployment Rate 197Table 25. Structure of Employment 198Table 26. Workers’ Home Remittances and Other Receipts 199Table 27. Import of Essential Commodities 200Table 28. Net Barter Terms of Trade 201Table 29. Concentration and Diversification Indices of Exports and Imports by Country
and Country Grouping 202Table 30. Total Foreign Exchange Reserves (without gold) 203Table 31. Trends in Current Account balance (% GDP) 205Table 32. Trends in Capital Account Balance (% GDP) 206Table 33. Foreign Direct Investment 207Table 34. Official Development Asisstance 208Table 35. Exports by Main Regions of Origin and Destination 209Table 36. Imports by Main Regions of Origin and Destination 210Table 37. Regional and Bilateral Trading Agreements and WTO Membership 211

ASIA-PACIFIC HUMAN DEVELOPMENT REPORT 2006172
STATISTICAL ANNEXES 173
About the Data
The Asia-Pacific HDR presents statistics on international trade and human development for the countries of Asia andthe Pacific and, for comparative purposes, other regions of the world. The grouping of countries into regions followsthe classification of the World Bank’s World Development Indicators. The data are presented for three points of time– 1982, 1992 and 2002 – a period during which trade liberalization deepened in the countries of Asia-Pacific.
Using these three data points helps to capture trends in social and economic indicators over a relatively longperiod. The latest year for which most of the countries of the Asia-Pacific have data on most indicators is 2002,although for some countries later data are available for 2003. Where data for some indicators are not available forthe exact time points, the nearest reference points are reported and footnoted in teh tables.
Developing countries covered and regional classifications are as below:
East Asia & Pacific1 Cambodia2 China3 Fiji4 Indonesia5 Malaysia6 Mongolia7 Papua New Guinea8 Philippines9 Thailand
10 Viet NamSouth Asia11 Bangladesh12 Bhutan13 India14 Maldives15 Nepal16 Pakistan17 Sri LankaRegions
1 East Asia & Pacific2 Europe & Central Asia3 Latin America & Caribbean4 Middle East & North Africa5 South Asia6 Sub-Saharan Africa7 Least Developed Countries (UN classification)8 World
Note: Countries of the Asia-Pacific region that are not covered in the Annexures because of unavailability of data onmost indicators include Afghanistan, Brunei, Cook Islands, Democratic People’s Republic of Korea, Iran IslamicRepublic, Kiribati, Lao PDR, Myanmar, Nauru, Niue, Palau, Marshall Islands, Federated States of Micronesia,Samoa, Solomon Islands, Timor-Leste, Tokelau, Tonga, Tuvalu and Vanuatu.

ASIA-PACIFIC HUMAN DEVELOPMENT REPORT 2006174
Table 1: Basic Indicators
Subregions/Countries/Regions Total population Rural population GDP per capita(millions) (% of total) (constant 2000 US $)
1982 1992 2002 1982 1992 2002 1982 1992 2002
East Asia and Pacific
1. Cambodia 7.2 10.4 13.2 87.5 86.8 82.0 .. .. 305.9
2. China 1008.6 1165.0 1280.4 79.0 71.0 62.3 208.2 475.9 1106.0
3. Fiji 0.7 0.7 0.8 61.9 56.8 49.1 1773.1 1885.5 2142.5
4. Indonesia 154.2 184.3 211.8 76.2 67.4 56.9 417.0 691.6 844.3
5. Malaysia 14.5 18.8 24.3 56.4 47.9 41.2 1989.7 2881.6 3944.4
6 Mongolia 1.8 2.2 2.4 46.7 43.0 43.3 314.8 300.0 406.2
7 Papua New Guinea 3.2 4.3 5.4 86.6 86.8 82.1 555.3 616.0 598.1
8 Philippines 50.4 64.0 79.9 60.3 49.1 39.8 1009.1 876.6 1024.0
9 Thailand 48.6 56.2 61.6 82.6 81.1 79.8 864.3 1657.6 2110.0
10 Viet Nam 55.7 69.0 80.4 80.6 79.0 75.0 .. 250.6 443.7
South Asia
11 Bangladesh 89.9 108.9 135.7 84.1 79.5 73.8 243.4 283.9 373.4
12 Bhutan 0.5 0.6 0.9 95.9 94.1 92.3 293.6 449.5 654.0
13 India 718.4 882.8 1048.6 76.4 74.0 71.9 234.2 322.5 477.4
14 Maldives 0.2 0.2 0.3 76.3 74.2 71.5 .. .. 2237.7
15 Nepal 15.2 20.1 24.1 93.0 90.2 87.4 150.5 186.1 225.8
16 Pakistan 87.4 113.6 144.9 71.4 68.9 66.2 356.2 496.4 532.0
17 Sri Lanka 15.0 17.4 19.0 78.5 78.7 76.5 472.0 615.6 879.5
Regions
1. East Asia & Pacific 1402.5 1643.5 1839.2 77.5 69.7 61.8 297.2 562.1 1075.4
2. Europe & Central Asia 434.1 465.7 471.9 40.5 37.0 36.3 .. 1921.3 2159.2
3. Latin America & Caribbean 372.4 453.3 525.3 33.7 28.1 23.8 3386.7 3424.9 3720.6
4. Middle East & North Africa 185.1 236.5 305.8 50.7 47.6 41.4 1355.0 1414.7 1660.5
5. South Asia 942.6 1160.5 1401.5 77.1 74.5 72.0 247.0 335.8 468.7
6. Sub-Saharan Africa 403.8 543.3 689.2 76.4 70.9 64.2 559.3 490.0 514.6
7. Least Developed Countries 423.4 550.1 660.4 84.1 78.3 75.6 251.9 240.5 283.3
8. World 4585.4 5423.6 6199.7 60.0 56.1 51.7 3921.1 4585.1 5282.4
Note: Blanks refer to non-availability of data for the countries/regions.Source: World Bank 2005.
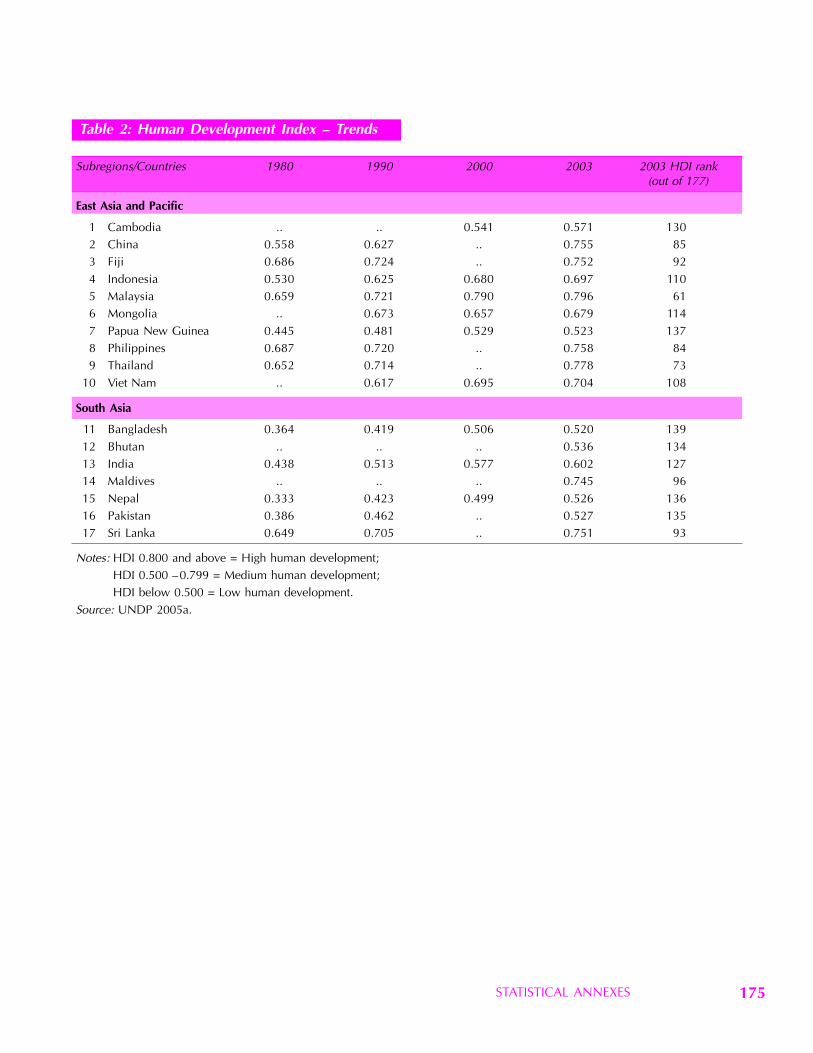
STATISTICAL ANNEXES 175
Table 2: Human Development Index – Trends
Subregions/Countries 1980 1990 2000 2003 2003 HDI rank(out of 177)
East Asia and Pacific
1 Cambodia .. .. 0.541 0.571 1302 China 0.558 0.627 .. 0.755 853 Fiji 0.686 0.724 .. 0.752 924 Indonesia 0.530 0.625 0.680 0.697 1105 Malaysia 0.659 0.721 0.790 0.796 616 Mongolia .. 0.673 0.657 0.679 1147 Papua New Guinea 0.445 0.481 0.529 0.523 1378 Philippines 0.687 0.720 .. 0.758 849 Thailand 0.652 0.714 .. 0.778 73
10 Viet Nam .. 0.617 0.695 0.704 108
South Asia
11 Bangladesh 0.364 0.419 0.506 0.520 13912 Bhutan .. .. .. 0.536 13413 India 0.438 0.513 0.577 0.602 12714 Maldives .. .. .. 0.745 9615 Nepal 0.333 0.423 0.499 0.526 13616 Pakistan 0.386 0.462 .. 0.527 13517 Sri Lanka 0.649 0.705 .. 0.751 93
Notes: HDI 0.800 and above = High human development;HDI 0.500 – 0.799 = Medium human development;HDI below 0.500 = Low human development.
Source: UNDP 2005a.
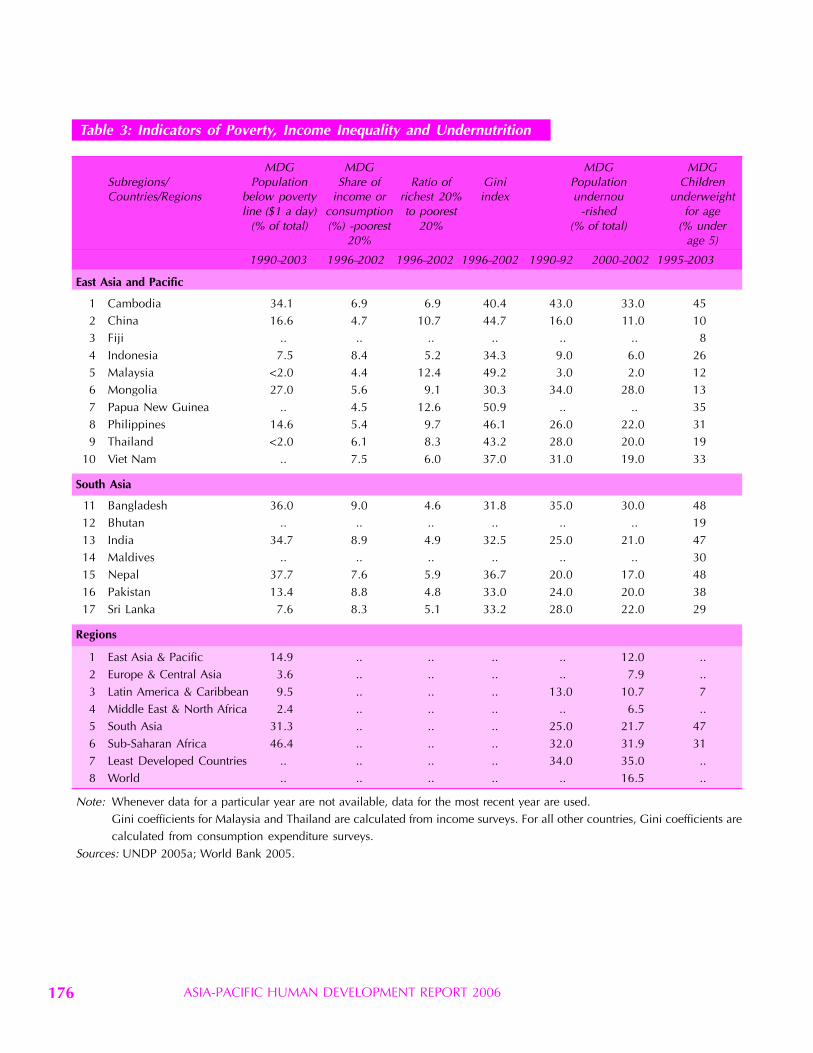
ASIA-PACIFIC HUMAN DEVELOPMENT REPORT 2006176
Table 3: Indicators of Poverty, Income Inequality and Undernutrition
MDG MDG MDG MDGSubregions/ Population Share of Ratio of Gini Population ChildrenCountries/Regions below poverty income or richest 20% index undernou underweight
line ($1 a day) consumption to poorest -rished for age(% of total) (%) -poorest 20% (% of total) (% under
20% age 5)
1990–2003 1996–2002 1996–2002 1996–2002 1990–92 2000–2002 1995–2003
East Asia and Pacific
1 Cambodia 34.1 6.9 6.9 40.4 43.0 33.0 452 China 16.6 4.7 10.7 44.7 16.0 11.0 103 Fiji .. .. .. .. .. .. 84 Indonesia 7.5 8.4 5.2 34.3 9.0 6.0 265 Malaysia <2.0 4.4 12.4 49.2 3.0 2.0 126 Mongolia 27.0 5.6 9.1 30.3 34.0 28.0 137 Papua New Guinea .. 4.5 12.6 50.9 .. .. 358 Philippines 14.6 5.4 9.7 46.1 26.0 22.0 319 Thailand <2.0 6.1 8.3 43.2 28.0 20.0 19
10 Viet Nam .. 7.5 6.0 37.0 31.0 19.0 33
South Asia
11 Bangladesh 36.0 9.0 4.6 31.8 35.0 30.0 4812 Bhutan .. .. .. .. .. .. 1913 India 34.7 8.9 4.9 32.5 25.0 21.0 4714 Maldives .. .. .. .. .. .. 3015 Nepal 37.7 7.6 5.9 36.7 20.0 17.0 4816 Pakistan 13.4 8.8 4.8 33.0 24.0 20.0 3817 Sri Lanka 7.6 8.3 5.1 33.2 28.0 22.0 29
Regions
1 East Asia & Pacific 14.9 .. .. .. .. 12.0 ..2 Europe & Central Asia 3.6 .. .. .. .. 7.9 ..3 Latin America & Caribbean 9.5 .. .. .. 13.0 10.7 74 Middle East & North Africa 2.4 .. .. .. .. 6.5 ..5 South Asia 31.3 .. .. .. 25.0 21.7 476 Sub-Saharan Africa 46.4 .. .. .. 32.0 31.9 317 Least Developed Countries .. .. .. .. 34.0 35.0 ..8 World .. .. .. .. .. 16.5 ..
Note: Whenever data for a particular year are not available, data for the most recent year are used.Gini coefficients for Malaysia and Thailand are calculated from income surveys. For all other countries, Gini coefficients arecalculated from consumption expenditure surveys.
Sources: UNDP 2005a; World Bank 2005.
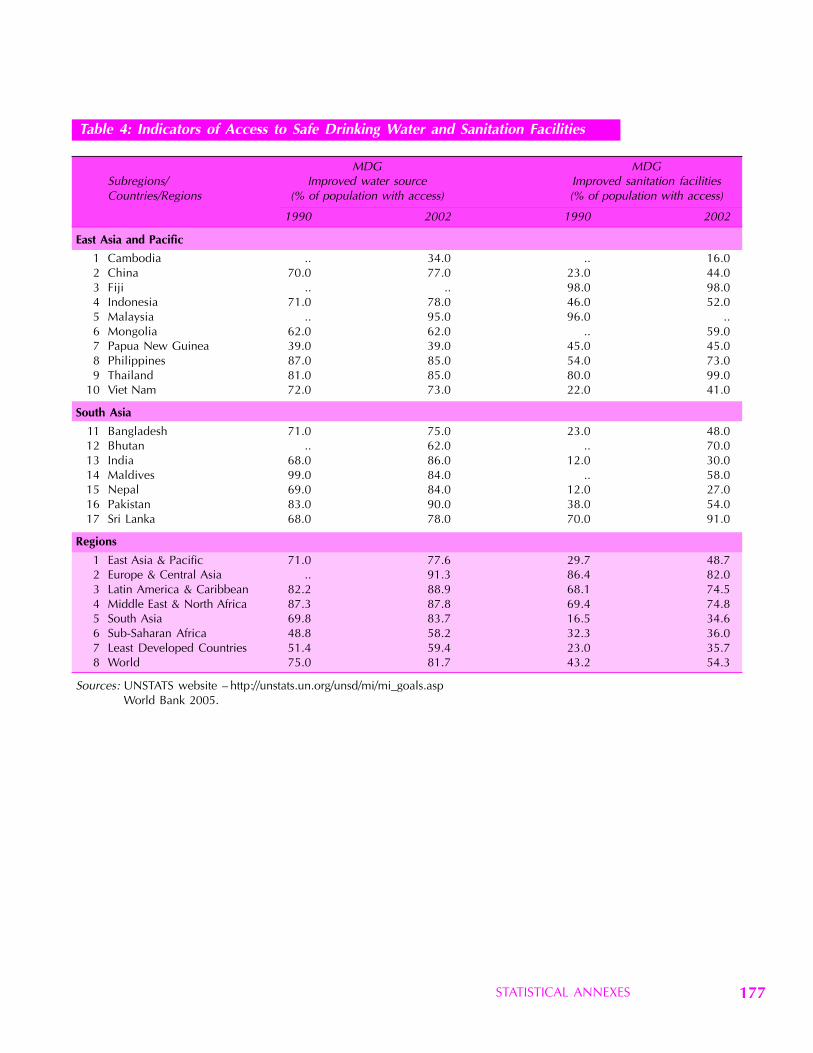
STATISTICAL ANNEXES 177
Table 4: Indicators of Access to Safe Drinking Water and Sanitation Facilities
MDG MDGSubregions/ Improved water source Improved sanitation facilitiesCountries/Regions (% of population with access) (% of population with access)
1990 2002 1990 2002
East Asia and Pacific
1 Cambodia .. 34.0 .. 16.02 China 70.0 77.0 23.0 44.03 Fiji .. .. 98.0 98.04 Indonesia 71.0 78.0 46.0 52.05 Malaysia .. 95.0 96.0 ..6 Mongolia 62.0 62.0 .. 59.07 Papua New Guinea 39.0 39.0 45.0 45.08 Philippines 87.0 85.0 54.0 73.09 Thailand 81.0 85.0 80.0 99.0
10 Viet Nam 72.0 73.0 22.0 41.0
South Asia
11 Bangladesh 71.0 75.0 23.0 48.012 Bhutan .. 62.0 .. 70.013 India 68.0 86.0 12.0 30.014 Maldives 99.0 84.0 .. 58.015 Nepal 69.0 84.0 12.0 27.016 Pakistan 83.0 90.0 38.0 54.017 Sri Lanka 68.0 78.0 70.0 91.0
Regions
1 East Asia & Pacific 71.0 77.6 29.7 48.72 Europe & Central Asia .. 91.3 86.4 82.03 Latin America & Caribbean 82.2 88.9 68.1 74.54 Middle East & North Africa 87.3 87.8 69.4 74.85 South Asia 69.8 83.7 16.5 34.66 Sub-Saharan Africa 48.8 58.2 32.3 36.07 Least Developed Countries 51.4 59.4 23.0 35.78 World 75.0 81.7 43.2 54.3
Sources: UNSTATS website – http://unstats.un.org/unsd/mi/mi_goals.aspWorld Bank 2005.
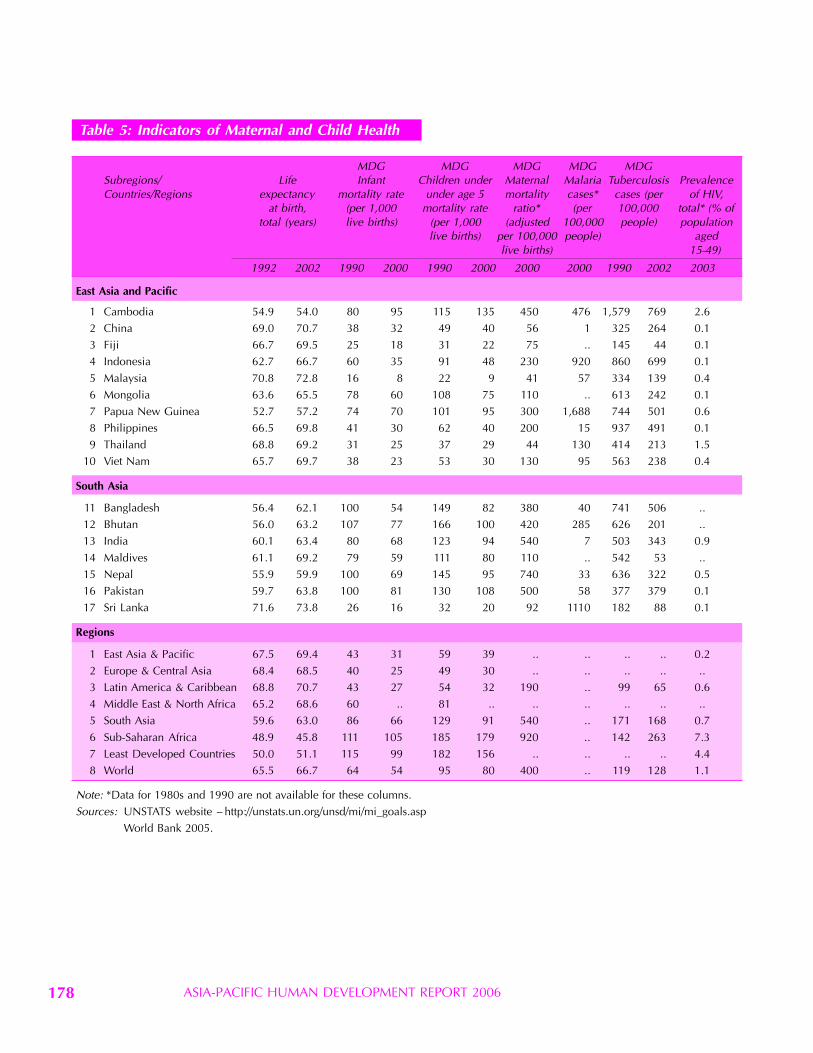
ASIA-PACIFIC HUMAN DEVELOPMENT REPORT 2006178
Table 5: Indicators of Maternal and Child Health
MDG MDG MDG MDG MDGSubregions/ Life Infant Children under Maternal Malaria Tuberculosis PrevalenceCountries/Regions expectancy mortality rate under age 5 mortality cases* cases (per of HIV,
at birth, (per 1,000 mortality rate ratio* (per 100,000 total* (% oftotal (years) live births) (per 1,000 (adjusted 100,000 people) population
live births) per 100,000 people) agedlive births) 15–49)
1992 2002 1990 2000 1990 2000 2000 2000 1990 2002 2003
East Asia and Pacific
1 Cambodia 54.9 54.0 80 95 115 135 450 476 1,579 769 2.62 China 69.0 70.7 38 32 49 40 56 1 325 264 0.13 Fiji 66.7 69.5 25 18 31 22 75 .. 145 44 0.14 Indonesia 62.7 66.7 60 35 91 48 230 920 860 699 0.15 Malaysia 70.8 72.8 16 8 22 9 41 57 334 139 0.46 Mongolia 63.6 65.5 78 60 108 75 110 .. 613 242 0.17 Papua New Guinea 52.7 57.2 74 70 101 95 300 1,688 744 501 0.68 Philippines 66.5 69.8 41 30 62 40 200 15 937 491 0.19 Thailand 68.8 69.2 31 25 37 29 44 130 414 213 1.5
10 Viet Nam 65.7 69.7 38 23 53 30 130 95 563 238 0.4
South Asia
11 Bangladesh 56.4 62.1 100 54 149 82 380 40 741 506 ..12 Bhutan 56.0 63.2 107 77 166 100 420 285 626 201 ..13 India 60.1 63.4 80 68 123 94 540 7 503 343 0.914 Maldives 61.1 69.2 79 59 111 80 110 .. 542 53 ..15 Nepal 55.9 59.9 100 69 145 95 740 33 636 322 0.516 Pakistan 59.7 63.8 100 81 130 108 500 58 377 379 0.117 Sri Lanka 71.6 73.8 26 16 32 20 92 1110 182 88 0.1
Regions
1 East Asia & Pacific 67.5 69.4 43 31 59 39 .. .. .. .. 0.22 Europe & Central Asia 68.4 68.5 40 25 49 30 .. .. .. .. ..3 Latin America & Caribbean 68.8 70.7 43 27 54 32 190 .. 99 65 0.64 Middle East & North Africa 65.2 68.6 60 .. 81 .. .. .. .. .. ..5 South Asia 59.6 63.0 86 66 129 91 540 .. 171 168 0.76 Sub-Saharan Africa 48.9 45.8 111 105 185 179 920 .. 142 263 7.37 Least Developed Countries 50.0 51.1 115 99 182 156 .. .. .. .. 4.48 World 65.5 66.7 64 54 95 80 400 .. 119 128 1.1
Note: *Data for 1980s and 1990 are not available for these columns.Sources: UNSTATS website – http://unstats.un.org/unsd/mi/mi_goals.asp
World Bank 2005.
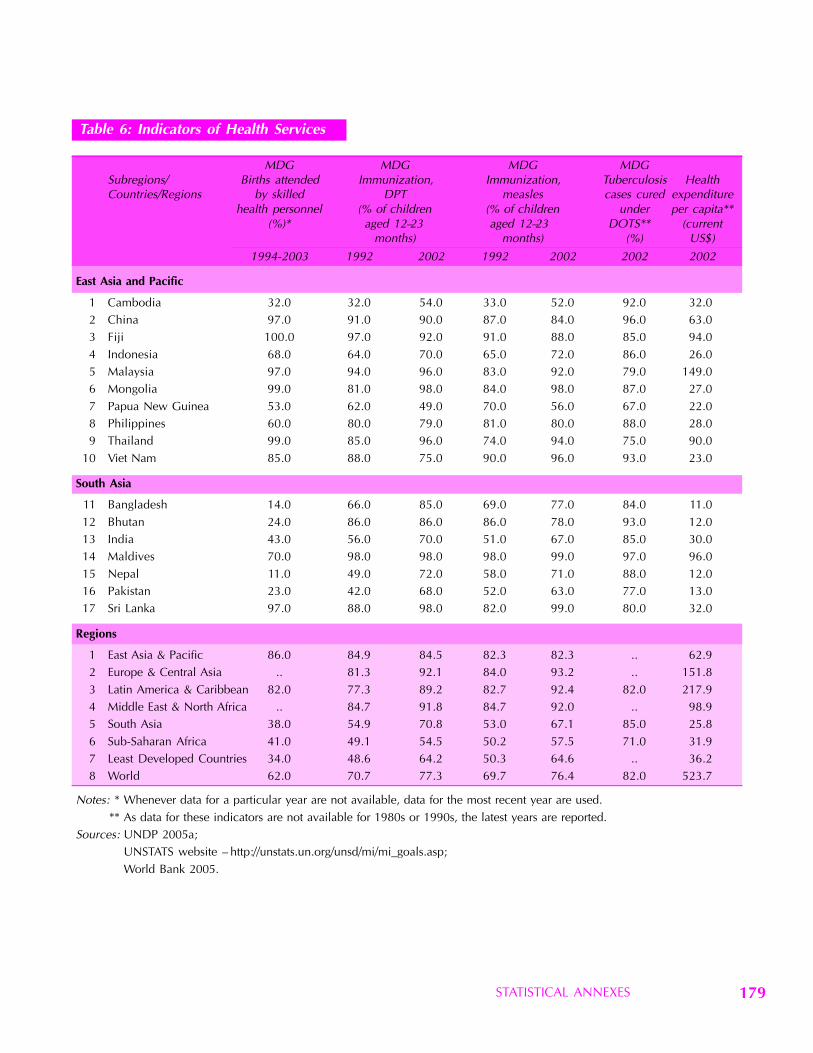
STATISTICAL ANNEXES 179
Table 6: Indicators of Health Services
MDG MDG MDG MDGSubregions/ Births attended Immunization, Immunization, Tuberculosis HealthCountries/Regions by skilled DPT measles cases cured expenditure
health personnel (% of children (% of children under per capita**(%)* aged 12–23 aged 12–23 DOTS** (current
months) months) (%) US$)
1994-2003 1992 2002 1992 2002 2002 2002
East Asia and Pacific
1 Cambodia 32.0 32.0 54.0 33.0 52.0 92.0 32.02 China 97.0 91.0 90.0 87.0 84.0 96.0 63.03 Fiji 100.0 97.0 92.0 91.0 88.0 85.0 94.04 Indonesia 68.0 64.0 70.0 65.0 72.0 86.0 26.05 Malaysia 97.0 94.0 96.0 83.0 92.0 79.0 149.06 Mongolia 99.0 81.0 98.0 84.0 98.0 87.0 27.07 Papua New Guinea 53.0 62.0 49.0 70.0 56.0 67.0 22.08 Philippines 60.0 80.0 79.0 81.0 80.0 88.0 28.09 Thailand 99.0 85.0 96.0 74.0 94.0 75.0 90.0
10 Viet Nam 85.0 88.0 75.0 90.0 96.0 93.0 23.0
South Asia
11 Bangladesh 14.0 66.0 85.0 69.0 77.0 84.0 11.012 Bhutan 24.0 86.0 86.0 86.0 78.0 93.0 12.013 India 43.0 56.0 70.0 51.0 67.0 85.0 30.014 Maldives 70.0 98.0 98.0 98.0 99.0 97.0 96.015 Nepal 11.0 49.0 72.0 58.0 71.0 88.0 12.016 Pakistan 23.0 42.0 68.0 52.0 63.0 77.0 13.017 Sri Lanka 97.0 88.0 98.0 82.0 99.0 80.0 32.0
Regions
1 East Asia & Pacific 86.0 84.9 84.5 82.3 82.3 .. 62.92 Europe & Central Asia .. 81.3 92.1 84.0 93.2 .. 151.83 Latin America & Caribbean 82.0 77.3 89.2 82.7 92.4 82.0 217.94 Middle East & North Africa .. 84.7 91.8 84.7 92.0 .. 98.95 South Asia 38.0 54.9 70.8 53.0 67.1 85.0 25.86 Sub-Saharan Africa 41.0 49.1 54.5 50.2 57.5 71.0 31.97 Least Developed Countries 34.0 48.6 64.2 50.3 64.6 .. 36.28 World 62.0 70.7 77.3 69.7 76.4 82.0 523.7
Notes: * Whenever data for a particular year are not available, data for the most recent year are used.** As data for these indicators are not available for 1980s or 1990s, the latest years are reported.
Sources: UNDP 2005a;UNSTATS website – http://unstats.un.org/unsd/mi/mi_goals.asp;World Bank 2005.
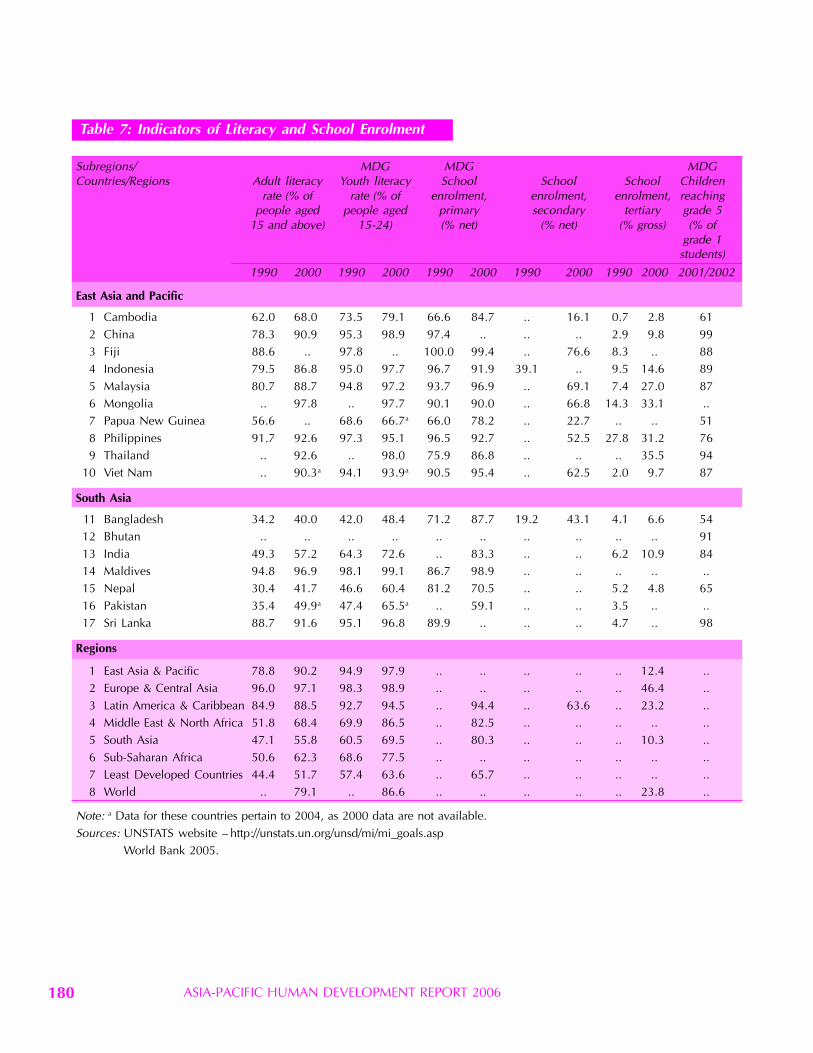
ASIA-PACIFIC HUMAN DEVELOPMENT REPORT 2006180
Table 7: Indicators of Literacy and School Enrolment
Subregions/ MDG MDG MDGCountries/Regions Adult literacy Youth literacy School School School Children
rate (% of rate (% of enrolment, enrolment, enrolment, reachingpeople aged people aged primary secondary tertiary grade 5
15 and above) 15-24) (% net) (% net) (% gross) (% ofgrade 1students)
1990 2000 1990 2000 1990 2000 1990 2000 1990 2000 2001/2002
East Asia and Pacific
1 Cambodia 62.0 68.0 73.5 79.1 66.6 84.7 .. 16.1 0.7 2.8 612 China 78.3 90.9 95.3 98.9 97.4 .. .. .. 2.9 9.8 993 Fiji 88.6 .. 97.8 .. 100.0 99.4 .. 76.6 8.3 .. 884 Indonesia 79.5 86.8 95.0 97.7 96.7 91.9 39.1 .. 9.5 14.6 895 Malaysia 80.7 88.7 94.8 97.2 93.7 96.9 .. 69.1 7.4 27.0 876 Mongolia .. 97.8 .. 97.7 90.1 90.0 .. 66.8 14.3 33.1 ..7 Papua New Guinea 56.6 .. 68.6 66.7a 66.0 78.2 .. 22.7 .. .. 518 Philippines 91.7 92.6 97.3 95.1 96.5 92.7 .. 52.5 27.8 31.2 769 Thailand .. 92.6 .. 98.0 75.9 86.8 .. .. .. 35.5 94
10 Viet Nam .. 90.3a 94.1 93.9a 90.5 95.4 .. 62.5 2.0 9.7 87
South Asia
11 Bangladesh 34.2 40.0 42.0 48.4 71.2 87.7 19.2 43.1 4.1 6.6 5412 Bhutan .. .. .. .. .. .. .. .. .. .. 9113 India 49.3 57.2 64.3 72.6 .. 83.3 .. .. 6.2 10.9 8414 Maldives 94.8 96.9 98.1 99.1 86.7 98.9 .. .. .. .. ..15 Nepal 30.4 41.7 46.6 60.4 81.2 70.5 .. .. 5.2 4.8 6516 Pakistan 35.4 49.9a 47.4 65.5a .. 59.1 .. .. 3.5 .. ..17 Sri Lanka 88.7 91.6 95.1 96.8 89.9 .. .. .. 4.7 .. 98
Regions
1 East Asia & Pacific 78.8 90.2 94.9 97.9 .. .. .. .. .. 12.4 ..2 Europe & Central Asia 96.0 97.1 98.3 98.9 .. .. .. .. .. 46.4 ..3 Latin America & Caribbean 84.9 88.5 92.7 94.5 .. 94.4 .. 63.6 .. 23.2 ..4 Middle East & North Africa 51.8 68.4 69.9 86.5 .. 82.5 .. .. .. .. ..5 South Asia 47.1 55.8 60.5 69.5 .. 80.3 .. .. .. 10.3 ..6 Sub-Saharan Africa 50.6 62.3 68.6 77.5 .. .. .. .. .. .. ..7 Least Developed Countries 44.4 51.7 57.4 63.6 .. 65.7 .. .. .. .. ..8 World .. 79.1 .. 86.6 .. .. .. .. .. 23.8 ..
Note: a Data for these countries pertain to 2004, as 2000 data are not available.Sources: UNSTATS website – http://unstats.un.org/unsd/mi/mi_goals.asp
World Bank 2005.

STATISTICAL ANNEXES 181
Tabl
e 8:
Ind
icat
ors
of G
ende
r D
evel
opm
ent
MD
GM
DG
MD
GM
DG
MD
GSu
breg
ions
/Se
ats
inFe
mal
eFe
mal
eR
atio
of
Scho
olR
atio
Scho
olR
atio
Scho
olR
atio
Ratio
of
girls
Cou
ntri
es/R
egio
nspa
rlia
men
tle
gisl
a-pr
ofes
-yo
ung
enro
llmen
t,of
enro
lmen
t,of
enro
l- o
f %to
boy
s in
held
by
tors
, se
nior
sion
allit
erat
ePr
imar
y,fe
mal
esse
con-
fem
ales
men
t,fe
mal
espr
imar
y an
dw
omen
offic
ials
and
fem
ales
fem
ales
**to
%da
ryto
%te
rtia
ry,
to %
seco
ndar
y(a
s %
of
and
Tech
ni-
to m
ales
(net
) %
mal
es i
nfe
mal
es**
mal
esfe
mal
es**
mal
esed
ucat
ion*
*to
tal)
man
ager
s*ca
l(%
age
spr
imar
y(n
et)
%in
(gro
ss)
%in
(%)
(as
% o
fw
orke
rs*
15-2
4)en
rol-
seco
n-te
rtia
ryto
tal)
(as
%m
ent*
*da
ryen
rol-
of t
otal
)en
rollm
ent
men
t**
1990
2002
1992
-19
92-
1990
2002
2000
2000
2000
2000
2000
2000
1990
2000
2003
2003
East
Asi
a an
d Pa
cific
1C
ambo
dia
..7.
414
3380
.689
.881
.40.
911
.90.
61.
50.
472
.882
.82
Chi
na21
.321
.8..
..95
.599
.3a
....
....
....
87.0
97.2
3Fi
ji..
5.7
519
99.6
100.
3a99
.31.
080
.11.
1..
....
102.
94
Indo
nesi
a12
.48.
0..
..96
.799
.091
.31.
0..
12.6
0.8
93.3
97.7
5M
alay
sia
5.1
10.4
2340
98.8
100.
1a97
.11.
072
.81.
128
.11.
110
2.0
104.
66
Mon
golia
24.9
10.5
3066
..10
1.5a
91.7
1.0
73.3
1.2
42.1
1.7
109.
411
2.3
7Pa
pua
New
0.0
1.8
....
83.9
90.2
74.1
0.9
19.9
0.8
....
78.7
88.8
Gui
nea
8Ph
ilipp
ines
9.1
17.8
5862
100.
410
1.3a
93.3
1.0
57.0
1.2
....
100.
410
2.6
9Th
aila
nd2.
89.
226
52..
99.7
a85
.41.
0..
..37
.51.
195
.395
.410
Vie
t N
am17
.726
.0..
..99
.199
.4a
92.2
0.9
....
8.2
0.7
..92
.5
Sout
h A
sia
11B
angl
ades
h10
.3..
825
65.5
71.1
88.2
1.0
44.0
1.0
4.6
0.5
77.1
102.
312
Bhu
tan
2.0
9.3
....
....
....
....
....
..85
.613
Indi
a5.
08.
8..
..73
.980
.5a
75.6
0.8
..8.
80.
770
.178
.614
Mal
dive
s6.
36.
015
4010
0.0
100.
199
.21.
0..
....
....
100.
915
Nep
al6.
15.
9..
..40
.758
.966
.00.
9..
..2.
00.
357
.381
.216
Paki
stan
10.1
..2
2649
.072
.2a
50.0
0.7
....
....
71.7
17Sr
i La
nka
4.9
..21
4698
.399
.7..
....
....
..10
2.2
..
Reg
ions
1Ea
st A
sia
....
....
95.8
99.2
....
....
....
88.9
97.2
& P
acifi
c2
Euro
pe &
....
....
98.1
99.1
....
....
49.1
1.2
98.5
..C
entr
al A
sia
3La
tin A
mer
ica
11.9
19.0
....
100.
110
0.8
93.5
1.0
65.0
1.1
24.7
1.2
..10
1.7
& C
arib
bean
4M
iddl
e Ea
st &
....
....
72.4
83.7
82.4
1.0
....
....
81.7
89.4
Nor
th A
fric
a5
Sout
h A
sia
5.7
8.3
....
70.5
79.6
73.8
0.8
....
8.1
0.7
71.1
80.3
6Su
b-Sa
hara
n7.
214
.2..
..77
.786
.9..
....
....
..79
.0..
Afr
ica
7Le
ast
Dev
elop
ed7.
312
.7..
..69
.678
.066
.30.
9..
....
..76
.386
.0C
ount
ries
8W
orld
12.4
15.9
....
..91
.7..
....
....
..87
.292
.9
Not
es:
*W
hene
ver
data
for
a p
artic
ular
yea
r ar
e no
t av
aila
ble,
dat
a fo
r th
e m
ost
rece
nt y
ear
are
used
.**
As
data
for
the
se i
ndic
ator
s ar
e no
t av
aila
ble
for
1980
s or
199
0s,
the
late
st y
ears
are
rep
orte
d.a
Dat
a fo
r th
ese
coun
trie
s pe
rtai
n to
200
4, a
s 20
00 d
ata
are
not
avai
labl
e.So
urce
s:U
NST
ATS
web
site
– h
ttp://
unst
ats.
un.o
rg/u
nsd/
mi/m
i_go
als.
asp
Wor
ld B
ank
2005
.
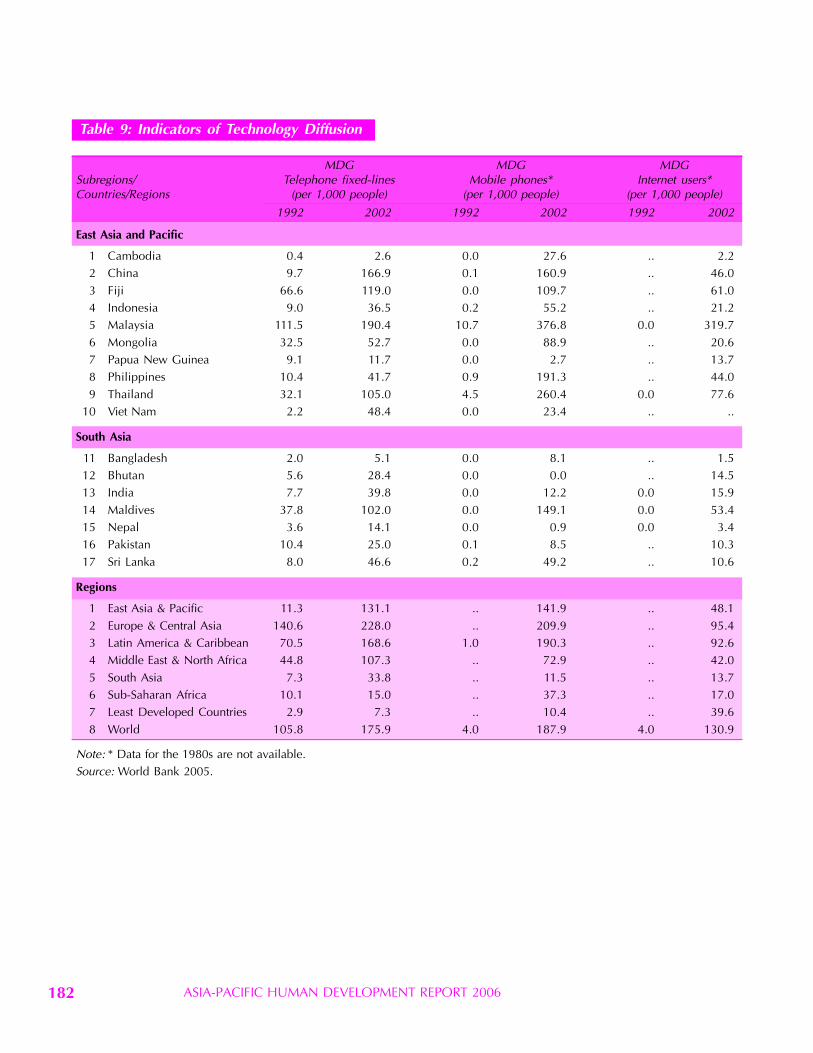
ASIA-PACIFIC HUMAN DEVELOPMENT REPORT 2006182
Table 9: Indicators of Technology Diffusion
MDG MDG MDGSubregions/ Telephone fixed-lines Mobile phones* Internet users*Countries/Regions (per 1,000 people) (per 1,000 people) (per 1,000 people)
1992 2002 1992 2002 1992 2002
East Asia and Pacific
1 Cambodia 0.4 2.6 0.0 27.6 .. 2.22 China 9.7 166.9 0.1 160.9 .. 46.03 Fiji 66.6 119.0 0.0 109.7 .. 61.04 Indonesia 9.0 36.5 0.2 55.2 .. 21.25 Malaysia 111.5 190.4 10.7 376.8 0.0 319.76 Mongolia 32.5 52.7 0.0 88.9 .. 20.67 Papua New Guinea 9.1 11.7 0.0 2.7 .. 13.78 Philippines 10.4 41.7 0.9 191.3 .. 44.09 Thailand 32.1 105.0 4.5 260.4 0.0 77.6
10 Viet Nam 2.2 48.4 0.0 23.4 .. ..
South Asia
11 Bangladesh 2.0 5.1 0.0 8.1 .. 1.512 Bhutan 5.6 28.4 0.0 0.0 .. 14.513 India 7.7 39.8 0.0 12.2 0.0 15.914 Maldives 37.8 102.0 0.0 149.1 0.0 53.415 Nepal 3.6 14.1 0.0 0.9 0.0 3.416 Pakistan 10.4 25.0 0.1 8.5 .. 10.317 Sri Lanka 8.0 46.6 0.2 49.2 .. 10.6
Regions
1 East Asia & Pacific 11.3 131.1 .. 141.9 .. 48.12 Europe & Central Asia 140.6 228.0 .. 209.9 .. 95.43 Latin America & Caribbean 70.5 168.6 1.0 190.3 .. 92.64 Middle East & North Africa 44.8 107.3 .. 72.9 .. 42.05 South Asia 7.3 33.8 .. 11.5 .. 13.76 Sub-Saharan Africa 10.1 15.0 .. 37.3 .. 17.07 Least Developed Countries 2.9 7.3 .. 10.4 .. 39.68 World 105.8 175.9 4.0 187.9 4.0 130.9
Note: * Data for the 1980s are not available.Source: World Bank 2005.
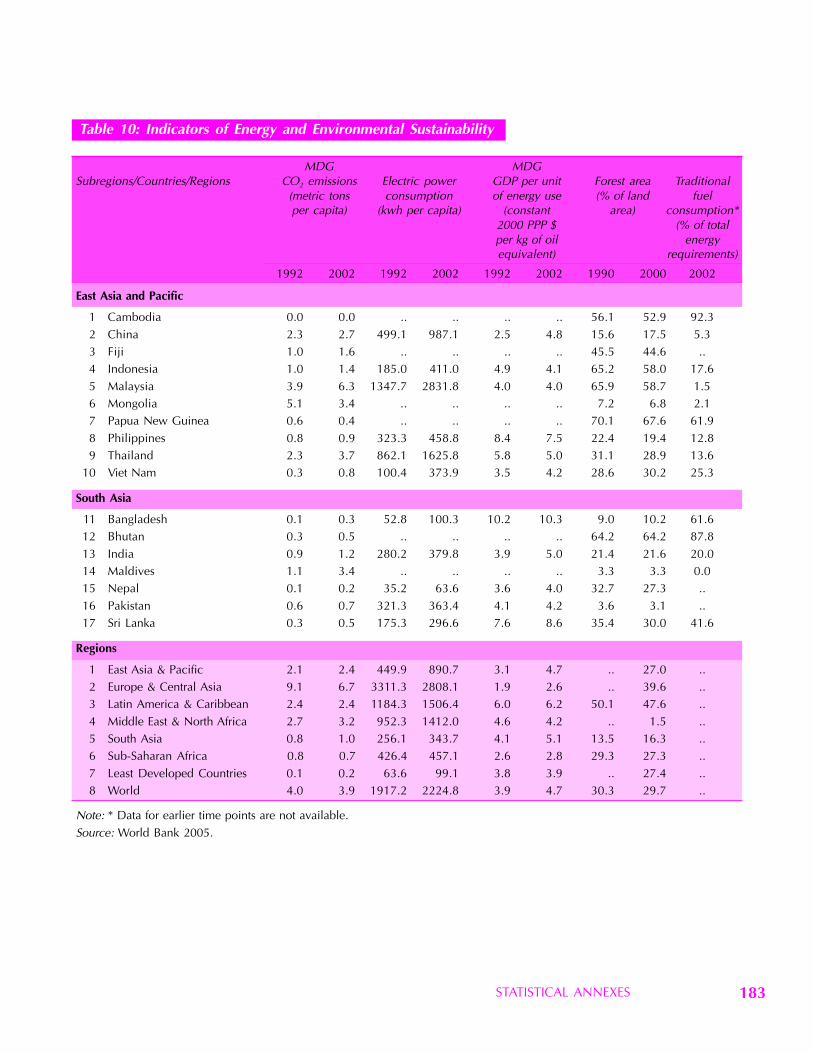
STATISTICAL ANNEXES 183
Table 10: Indicators of Energy and Environmental Sustainability
MDG MDGSubregions/Countries/Regions CO2 emissions Electric power GDP per unit Forest area Traditional
(metric tons consumption of energy use (% of land fuelper capita) (kwh per capita) (constant area) consumption*
2000 PPP $ (% of totalper kg of oil energyequivalent) requirements)
1992 2002 1992 2002 1992 2002 1990 2000 2002
East Asia and Pacific
1 Cambodia 0.0 0.0 .. .. .. .. 56.1 52.9 92.32 China 2.3 2.7 499.1 987.1 2.5 4.8 15.6 17.5 5.33 Fiji 1.0 1.6 .. .. .. .. 45.5 44.6 ..4 Indonesia 1.0 1.4 185.0 411.0 4.9 4.1 65.2 58.0 17.65 Malaysia 3.9 6.3 1347.7 2831.8 4.0 4.0 65.9 58.7 1.56 Mongolia 5.1 3.4 .. .. .. .. 7.2 6.8 2.17 Papua New Guinea 0.6 0.4 .. .. .. .. 70.1 67.6 61.98 Philippines 0.8 0.9 323.3 458.8 8.4 7.5 22.4 19.4 12.89 Thailand 2.3 3.7 862.1 1625.8 5.8 5.0 31.1 28.9 13.6
10 Viet Nam 0.3 0.8 100.4 373.9 3.5 4.2 28.6 30.2 25.3
South Asia
11 Bangladesh 0.1 0.3 52.8 100.3 10.2 10.3 9.0 10.2 61.612 Bhutan 0.3 0.5 .. .. .. .. 64.2 64.2 87.813 India 0.9 1.2 280.2 379.8 3.9 5.0 21.4 21.6 20.014 Maldives 1.1 3.4 .. .. .. .. 3.3 3.3 0.015 Nepal 0.1 0.2 35.2 63.6 3.6 4.0 32.7 27.3 ..16 Pakistan 0.6 0.7 321.3 363.4 4.1 4.2 3.6 3.1 ..17 Sri Lanka 0.3 0.5 175.3 296.6 7.6 8.6 35.4 30.0 41.6
Regions
1 East Asia & Pacific 2.1 2.4 449.9 890.7 3.1 4.7 .. 27.0 ..2 Europe & Central Asia 9.1 6.7 3311.3 2808.1 1.9 2.6 .. 39.6 ..3 Latin America & Caribbean 2.4 2.4 1184.3 1506.4 6.0 6.2 50.1 47.6 ..4 Middle East & North Africa 2.7 3.2 952.3 1412.0 4.6 4.2 .. 1.5 ..5 South Asia 0.8 1.0 256.1 343.7 4.1 5.1 13.5 16.3 ..6 Sub-Saharan Africa 0.8 0.7 426.4 457.1 2.6 2.8 29.3 27.3 ..7 Least Developed Countries 0.1 0.2 63.6 99.1 3.8 3.9 .. 27.4 ..8 World 4.0 3.9 1917.2 2224.8 3.9 4.7 30.3 29.7 ..
Note: * Data for earlier time points are not available.Source: World Bank 2005.

ASIA-PACIFIC HUMAN DEVELOPMENT REPORT 2006184
Table 11: Tariffs, Domestic Peaks and International Peaks
Subregions/Countries Tariff year Simple tariff Simple Weighted Number Number of Number ofline average average average of total domestic International
tariff tariff tariff lines peaks peaks
East Asia and Pacific
1 Cambodia 2003 17.3 16.4 16.5 6,805 12 1,9142 China 2004 10.4 10.5 6.0 7,475 150 1,4133 Fiji .. .. .. .. .. .. ..4 Indonesia 2004 9.9 7.0 6.2 11,153 526 1,1735 Malaysia 2005 8.1 7.3 4.2 10,581 1,470 2,4766 Mongolia .. .. .. .. .. .. ..7 Papua New Guinea 2005 6.3 6.0 2.2 5,590 1,268 1,2688 Philippines 2003 5.1 4.7 2.6 5,641 160 1609 Thailand 2005 12.0 11.9 6.2 5,504 341 1,453
10 Viet Nam 2004 18.6 16.8 15.2 10,620 330 4,421
South Asia
11 Bangladesh 2004 18.9 18.4 15.4 6,792 0 3,54712 Bhutan .. .. .. .. .. .. ..13 India 2005 18.9 18.3 14.6 11,693 314 2,13714 Maldives 2004 21.5 20.2 19.8 8,768 143 5,63815 Nepal 2004 13.8 13.7 14.3 5,351 33 89316 Pakistan 2005 14.4 14.2 11.3 6,336 70 2,53617 Sri Lanka 2005 11.6 10.9 7.4 6,406 9 1,434
Note: A tariff peak is a high tariff on a particular product within a given tariff line. Tariff peaks refer to the ratio of lines for which thetariff rates exceed a reference level to the total number of lines. A 15 per cent ratio is referred to as a “international peak ” andthree times the national mean tariff is referred to as a “domestic peak”.
Source: World Integrated Trade Solutions (WITS), See website http://wits.worldbank.org/witsweb/
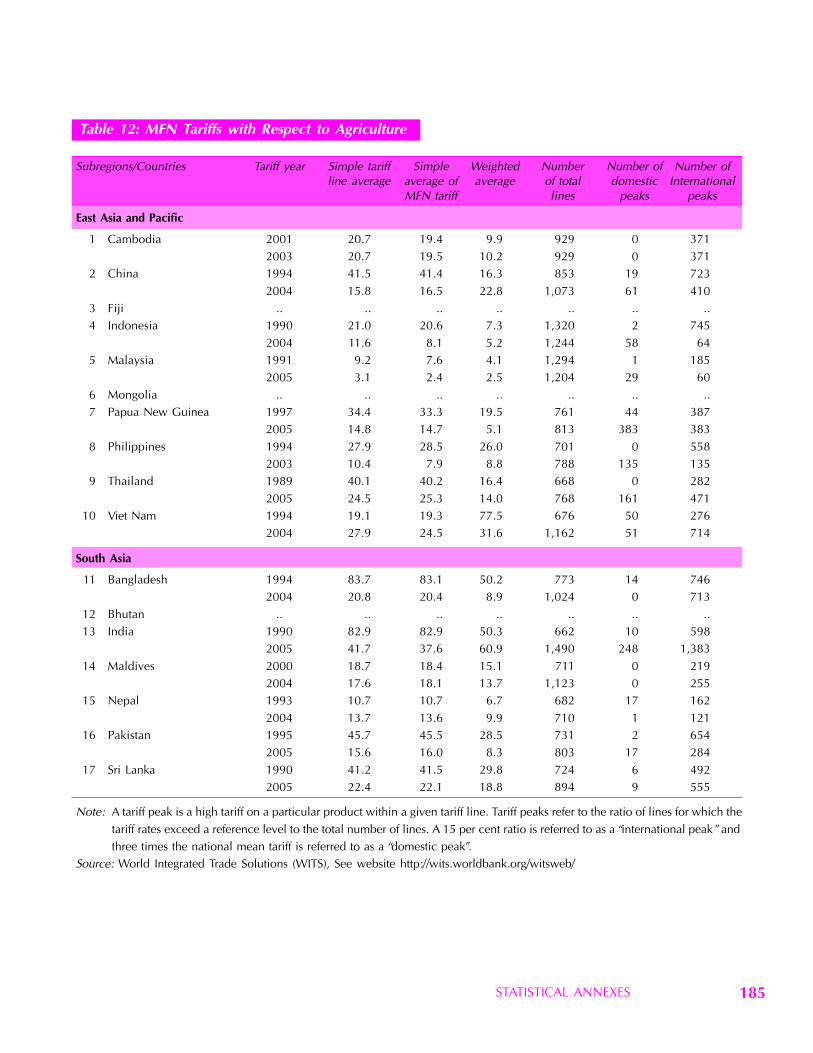
STATISTICAL ANNEXES 185
Table 12: MFN Tariffs with Respect to Agriculture
Subregions/Countries Tariff year Simple tariff Simple Weighted Number Number of Number ofline average average of average of total domestic International
MFN tariff lines peaks peaks
East Asia and Pacific
1 Cambodia 2001 20.7 19.4 9.9 929 0 3712003 20.7 19.5 10.2 929 0 371
2 China 1994 41.5 41.4 16.3 853 19 7232004 15.8 16.5 22.8 1,073 61 410
3 Fiji .. .. .. .. .. .. ..4 Indonesia 1990 21.0 20.6 7.3 1,320 2 745
2004 11.6 8.1 5.2 1,244 58 645 Malaysia 1991 9.2 7.6 4.1 1,294 1 185
2005 3.1 2.4 2.5 1,204 29 606 Mongolia .. .. .. .. .. .. ..7 Papua New Guinea 1997 34.4 33.3 19.5 761 44 387
2005 14.8 14.7 5.1 813 383 3838 Philippines 1994 27.9 28.5 26.0 701 0 558
2003 10.4 7.9 8.8 788 135 1359 Thailand 1989 40.1 40.2 16.4 668 0 282
2005 24.5 25.3 14.0 768 161 47110 Viet Nam 1994 19.1 19.3 77.5 676 50 276
2004 27.9 24.5 31.6 1,162 51 714
South Asia
11 Bangladesh 1994 83.7 83.1 50.2 773 14 7462004 20.8 20.4 8.9 1,024 0 713
12 Bhutan .. .. .. .. .. .. ..13 India 1990 82.9 82.9 50.3 662 10 598
2005 41.7 37.6 60.9 1,490 248 1,38314 Maldives 2000 18.7 18.4 15.1 711 0 219
2004 17.6 18.1 13.7 1,123 0 25515 Nepal 1993 10.7 10.7 6.7 682 17 162
2004 13.7 13.6 9.9 710 1 12116 Pakistan 1995 45.7 45.5 28.5 731 2 654
2005 15.6 16.0 8.3 803 17 28417 Sri Lanka 1990 41.2 41.5 29.8 724 6 492
2005 22.4 22.1 18.8 894 9 555
Note: A tariff peak is a high tariff on a particular product within a given tariff line. Tariff peaks refer to the ratio of lines for which thetariff rates exceed a reference level to the total number of lines. A 15 per cent ratio is referred to as a “international peak ” andthree times the national mean tariff is referred to as a “domestic peak”.
Source: World Integrated Trade Solutions (WITS), See website http://wits.worldbank.org/witsweb/
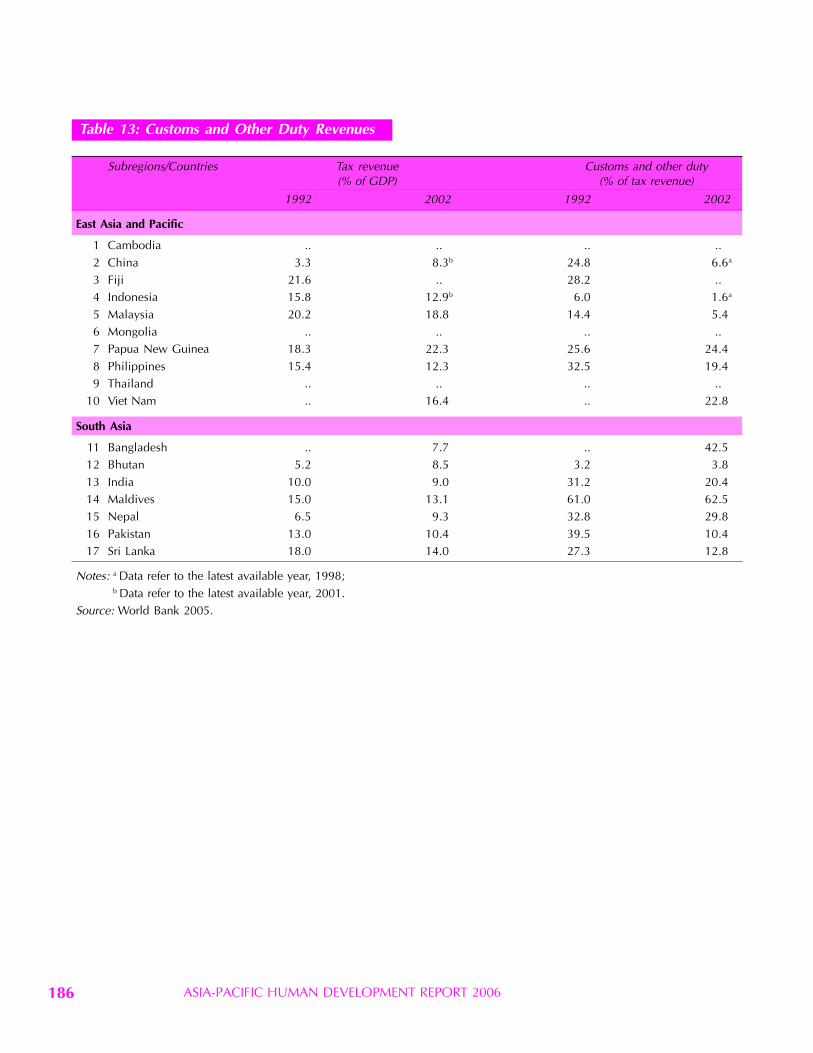
ASIA-PACIFIC HUMAN DEVELOPMENT REPORT 2006186
Table 13: Customs and Other Duty Revenues
Subregions/Countries Tax revenue Customs and other duty(% of GDP) (% of tax revenue)
1992 2002 1992 2002
East Asia and Pacific
1 Cambodia .. .. .. ..2 China 3.3 8.3b 24.8 6.6a
3 Fiji 21.6 .. 28.2 ..4 Indonesia 15.8 12.9b 6.0 1.6a
5 Malaysia 20.2 18.8 14.4 5.46 Mongolia .. .. .. ..7 Papua New Guinea 18.3 22.3 25.6 24.48 Philippines 15.4 12.3 32.5 19.49 Thailand .. .. .. ..
10 Viet Nam .. 16.4 .. 22.8
South Asia
11 Bangladesh .. 7.7 .. 42.512 Bhutan 5.2 8.5 3.2 3.813 India 10.0 9.0 31.2 20.414 Maldives 15.0 13.1 61.0 62.515 Nepal 6.5 9.3 32.8 29.816 Pakistan 13.0 10.4 39.5 10.417 Sri Lanka 18.0 14.0 27.3 12.8
Notes: a Data refer to the latest available year, 1998;b Data refer to the latest available year, 2001.
Source: World Bank 2005.
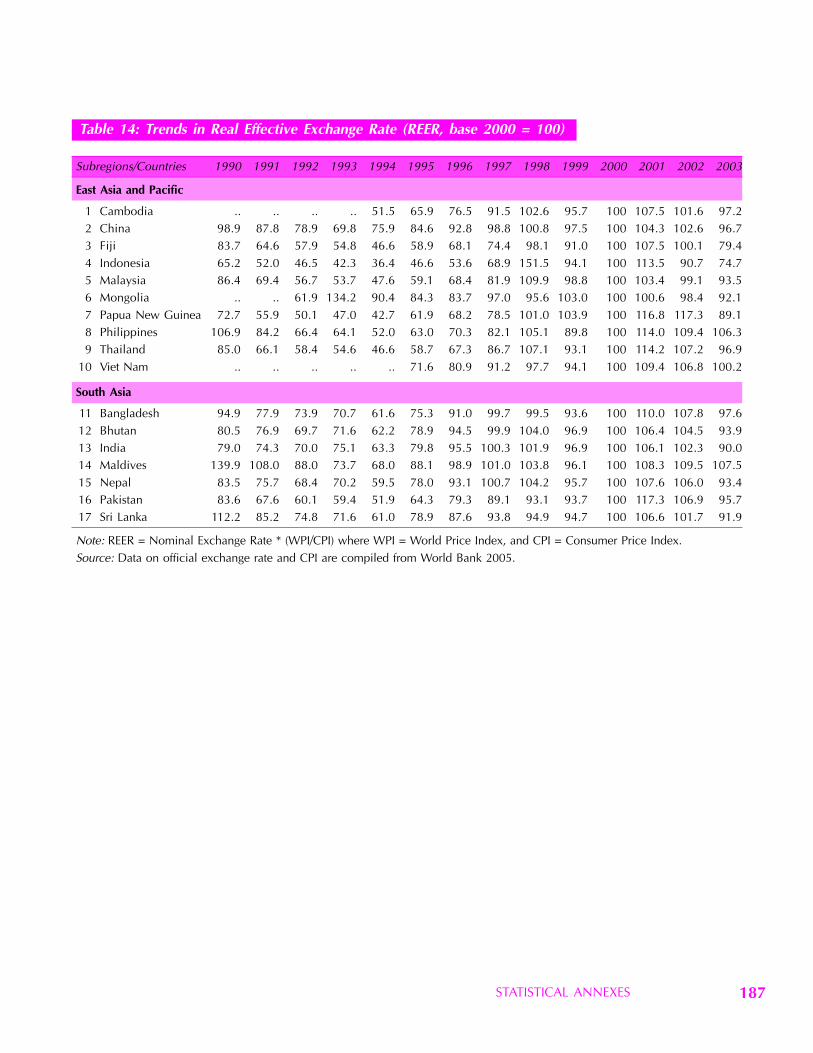
STATISTICAL ANNEXES 187
Table 14: Trends in Real Effective Exchange Rate (REER, base 2000 = 100)
Subregions/Countries 1990 1991 1992 1993 1994 1995 1996 1997 1998 1999 2000 2001 2002 2003
East Asia and Pacific
1 Cambodia .. .. .. .. 51.5 65.9 76.5 91.5 102.6 95.7 100 107.5 101.6 97.22 China 98.9 87.8 78.9 69.8 75.9 84.6 92.8 98.8 100.8 97.5 100 104.3 102.6 96.73 Fiji 83.7 64.6 57.9 54.8 46.6 58.9 68.1 74.4 98.1 91.0 100 107.5 100.1 79.44 Indonesia 65.2 52.0 46.5 42.3 36.4 46.6 53.6 68.9 151.5 94.1 100 113.5 90.7 74.75 Malaysia 86.4 69.4 56.7 53.7 47.6 59.1 68.4 81.9 109.9 98.8 100 103.4 99.1 93.56 Mongolia .. .. 61.9 134.2 90.4 84.3 83.7 97.0 95.6 103.0 100 100.6 98.4 92.17 Papua New Guinea 72.7 55.9 50.1 47.0 42.7 61.9 68.2 78.5 101.0 103.9 100 116.8 117.3 89.18 Philippines 106.9 84.2 66.4 64.1 52.0 63.0 70.3 82.1 105.1 89.8 100 114.0 109.4 106.39 Thailand 85.0 66.1 58.4 54.6 46.6 58.7 67.3 86.7 107.1 93.1 100 114.2 107.2 96.9
10 Viet Nam .. .. .. .. .. 71.6 80.9 91.2 97.7 94.1 100 109.4 106.8 100.2
South Asia
11 Bangladesh 94.9 77.9 73.9 70.7 61.6 75.3 91.0 99.7 99.5 93.6 100 110.0 107.8 97.612 Bhutan 80.5 76.9 69.7 71.6 62.2 78.9 94.5 99.9 104.0 96.9 100 106.4 104.5 93.913 India 79.0 74.3 70.0 75.1 63.3 79.8 95.5 100.3 101.9 96.9 100 106.1 102.3 90.014 Maldives 139.9 108.0 88.0 73.7 68.0 88.1 98.9 101.0 103.8 96.1 100 108.3 109.5 107.515 Nepal 83.5 75.7 68.4 70.2 59.5 78.0 93.1 100.7 104.2 95.7 100 107.6 106.0 93.416 Pakistan 83.6 67.6 60.1 59.4 51.9 64.3 79.3 89.1 93.1 93.7 100 117.3 106.9 95.717 Sri Lanka 112.2 85.2 74.8 71.6 61.0 78.9 87.6 93.8 94.9 94.7 100 106.6 101.7 91.9
Note: REER = Nominal Exchange Rate * (WPI/CPI) where WPI = World Price Index, and CPI = Consumer Price Index.Source: Data on official exchange rate and CPI are compiled from World Bank 2005.
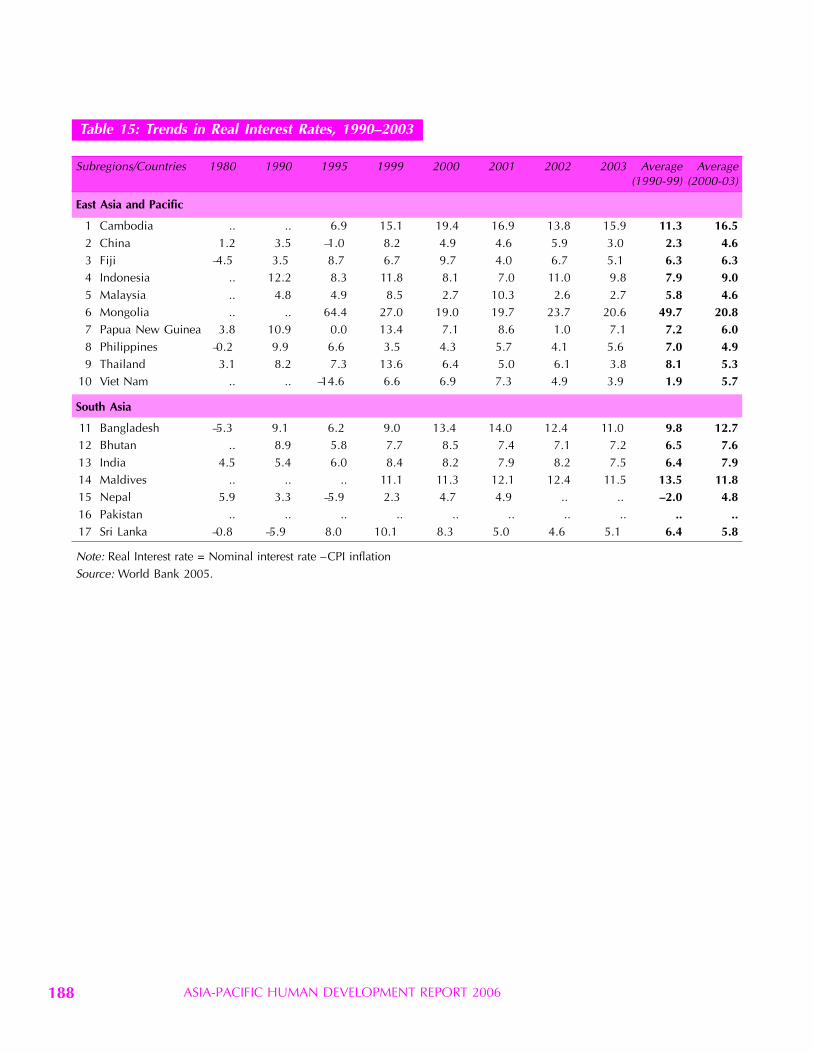
ASIA-PACIFIC HUMAN DEVELOPMENT REPORT 2006188
Table 15: Trends in Real Interest Rates, 1990–2003
Subregions/Countries 1980 1990 1995 1999 2000 2001 2002 2003 Average Average(1990-99) (2000-03)
East Asia and Pacific
1 Cambodia .. .. 6.9 15.1 19.4 16.9 13.8 15.9 11.3 16.52 China 1.2 3.5 –1.0 8.2 4.9 4.6 5.9 3.0 2.3 4.63 Fiji –4.5 3.5 8.7 6.7 9.7 4.0 6.7 5.1 6.3 6.34 Indonesia .. 12.2 8.3 11.8 8.1 7.0 11.0 9.8 7.9 9.05 Malaysia .. 4.8 4.9 8.5 2.7 10.3 2.6 2.7 5.8 4.66 Mongolia .. .. 64.4 27.0 19.0 19.7 23.7 20.6 49.7 20.87 Papua New Guinea 3.8 10.9 0.0 13.4 7.1 8.6 1.0 7.1 7.2 6.08 Philippines –0.2 9.9 6.6 3.5 4.3 5.7 4.1 5.6 7.0 4.99 Thailand 3.1 8.2 7.3 13.6 6.4 5.0 6.1 3.8 8.1 5.3
10 Viet Nam .. .. –14.6 6.6 6.9 7.3 4.9 3.9 1.9 5.7
South Asia
11 Bangladesh –5.3 9.1 6.2 9.0 13.4 14.0 12.4 11.0 9.8 12.712 Bhutan .. 8.9 5.8 7.7 8.5 7.4 7.1 7.2 6.5 7.613 India 4.5 5.4 6.0 8.4 8.2 7.9 8.2 7.5 6.4 7.914 Maldives .. .. .. 11.1 11.3 12.1 12.4 11.5 13.5 11.815 Nepal 5.9 3.3 –5.9 2.3 4.7 4.9 .. .. –2.0 4.816 Pakistan .. .. .. .. .. .. .. .. .. ..17 Sri Lanka –0.8 –5.9 8.0 10.1 8.3 5.0 4.6 5.1 6.4 5.8
Note: Real Interest rate = Nominal interest rate – CPI inflationSource: World Bank 2005.
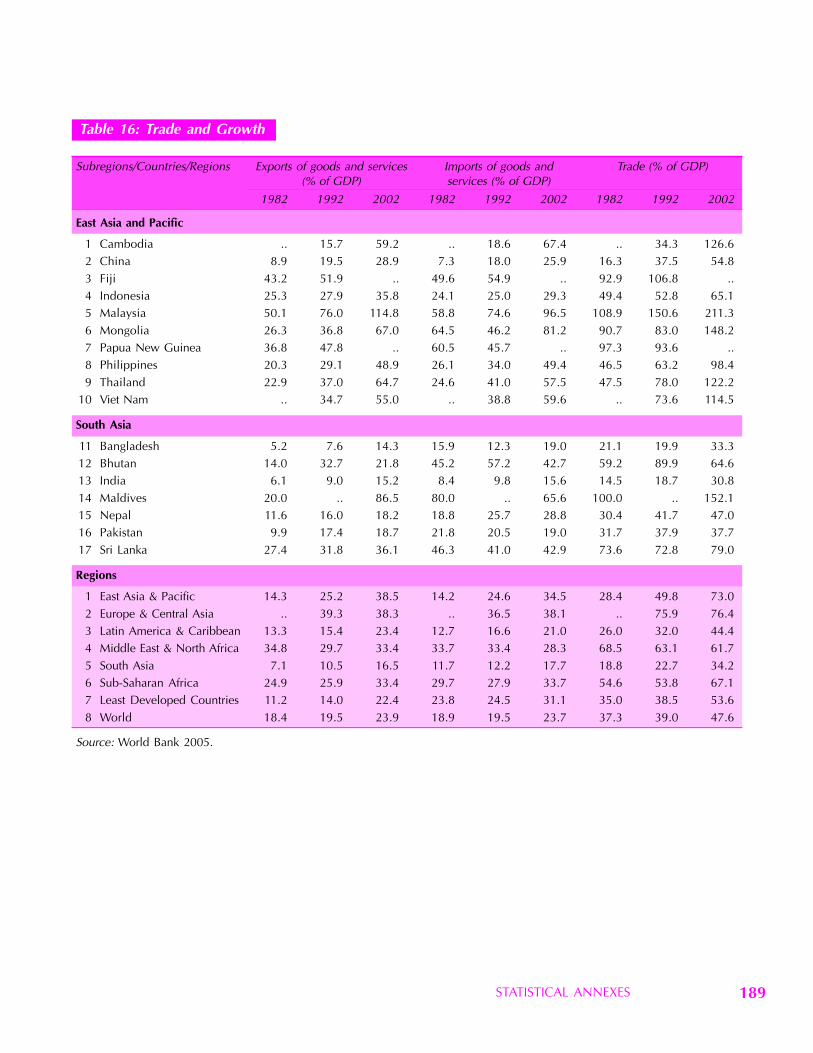
STATISTICAL ANNEXES 189
Table 16: Trade and Growth
Subregions/Countries/Regions Exports of goods and services Imports of goods and Trade (% of GDP)(% of GDP) services (% of GDP)
1982 1992 2002 1982 1992 2002 1982 1992 2002
East Asia and Pacific
1 Cambodia .. 15.7 59.2 .. 18.6 67.4 .. 34.3 126.62 China 8.9 19.5 28.9 7.3 18.0 25.9 16.3 37.5 54.83 Fiji 43.2 51.9 .. 49.6 54.9 .. 92.9 106.8 ..4 Indonesia 25.3 27.9 35.8 24.1 25.0 29.3 49.4 52.8 65.15 Malaysia 50.1 76.0 114.8 58.8 74.6 96.5 108.9 150.6 211.36 Mongolia 26.3 36.8 67.0 64.5 46.2 81.2 90.7 83.0 148.27 Papua New Guinea 36.8 47.8 .. 60.5 45.7 .. 97.3 93.6 ..8 Philippines 20.3 29.1 48.9 26.1 34.0 49.4 46.5 63.2 98.49 Thailand 22.9 37.0 64.7 24.6 41.0 57.5 47.5 78.0 122.2
10 Viet Nam .. 34.7 55.0 .. 38.8 59.6 .. 73.6 114.5
South Asia
11 Bangladesh 5.2 7.6 14.3 15.9 12.3 19.0 21.1 19.9 33.312 Bhutan 14.0 32.7 21.8 45.2 57.2 42.7 59.2 89.9 64.613 India 6.1 9.0 15.2 8.4 9.8 15.6 14.5 18.7 30.814 Maldives 20.0 .. 86.5 80.0 .. 65.6 100.0 .. 152.115 Nepal 11.6 16.0 18.2 18.8 25.7 28.8 30.4 41.7 47.016 Pakistan 9.9 17.4 18.7 21.8 20.5 19.0 31.7 37.9 37.717 Sri Lanka 27.4 31.8 36.1 46.3 41.0 42.9 73.6 72.8 79.0
Regions
1 East Asia & Pacific 14.3 25.2 38.5 14.2 24.6 34.5 28.4 49.8 73.02 Europe & Central Asia .. 39.3 38.3 .. 36.5 38.1 .. 75.9 76.43 Latin America & Caribbean 13.3 15.4 23.4 12.7 16.6 21.0 26.0 32.0 44.44 Middle East & North Africa 34.8 29.7 33.4 33.7 33.4 28.3 68.5 63.1 61.75 South Asia 7.1 10.5 16.5 11.7 12.2 17.7 18.8 22.7 34.26 Sub-Saharan Africa 24.9 25.9 33.4 29.7 27.9 33.7 54.6 53.8 67.17 Least Developed Countries 11.2 14.0 22.4 23.8 24.5 31.1 35.0 38.5 53.68 World 18.4 19.5 23.9 18.9 19.5 23.7 37.3 39.0 47.6
Source: World Bank 2005.
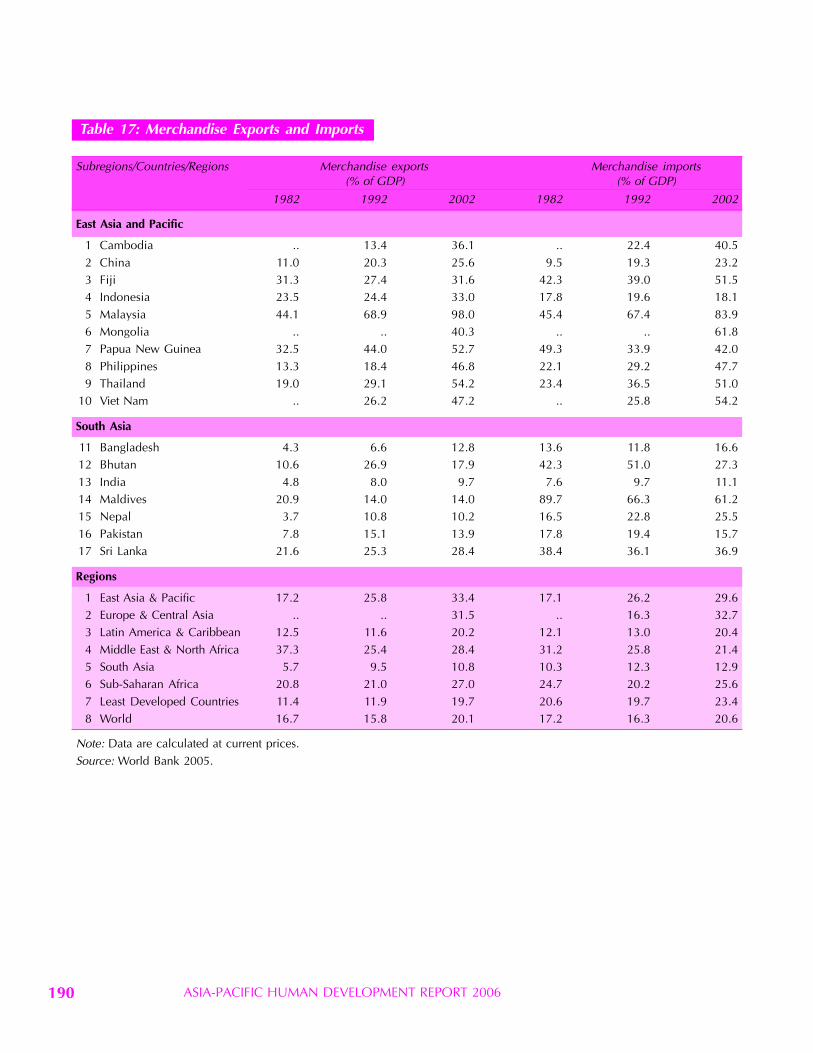
ASIA-PACIFIC HUMAN DEVELOPMENT REPORT 2006190
Table 17: Merchandise Exports and Imports
Subregions/Countries/Regions Merchandise exports Merchandise imports(% of GDP) (% of GDP)
1982 1992 2002 1982 1992 2002
East Asia and Pacific
1 Cambodia .. 13.4 36.1 .. 22.4 40.52 China 11.0 20.3 25.6 9.5 19.3 23.23 Fiji 31.3 27.4 31.6 42.3 39.0 51.54 Indonesia 23.5 24.4 33.0 17.8 19.6 18.15 Malaysia 44.1 68.9 98.0 45.4 67.4 83.96 Mongolia .. .. 40.3 .. .. 61.87 Papua New Guinea 32.5 44.0 52.7 49.3 33.9 42.08 Philippines 13.3 18.4 46.8 22.1 29.2 47.79 Thailand 19.0 29.1 54.2 23.4 36.5 51.0
10 Viet Nam .. 26.2 47.2 .. 25.8 54.2
South Asia
11 Bangladesh 4.3 6.6 12.8 13.6 11.8 16.612 Bhutan 10.6 26.9 17.9 42.3 51.0 27.313 India 4.8 8.0 9.7 7.6 9.7 11.114 Maldives 20.9 14.0 14.0 89.7 66.3 61.215 Nepal 3.7 10.8 10.2 16.5 22.8 25.516 Pakistan 7.8 15.1 13.9 17.8 19.4 15.717 Sri Lanka 21.6 25.3 28.4 38.4 36.1 36.9
Regions
1 East Asia & Pacific 17.2 25.8 33.4 17.1 26.2 29.62 Europe & Central Asia .. .. 31.5 .. 16.3 32.73 Latin America & Caribbean 12.5 11.6 20.2 12.1 13.0 20.44 Middle East & North Africa 37.3 25.4 28.4 31.2 25.8 21.45 South Asia 5.7 9.5 10.8 10.3 12.3 12.96 Sub-Saharan Africa 20.8 21.0 27.0 24.7 20.2 25.67 Least Developed Countries 11.4 11.9 19.7 20.6 19.7 23.48 World 16.7 15.8 20.1 17.2 16.3 20.6
Note: Data are calculated at current prices.Source: World Bank 2005.

STATISTICAL ANNEXES 191
Table 18: Share of Agriculture in Exports and Value Added
Subregions/Countries/Regions Agricultural raw materials and Agriculture, value addedfood exports (% of merchandise exports) (% of GDP)
1982 1992 2002 1982 1992 2002
East Asia and Pacific
1 Cambodia .. .. 99.3 .. .. 35.62 China .. 13.6 5.8 33.3 21.8 15.43 Fiji 94.7 61.8 55.2 20.3 20.1 16.24 Indonesia 10.7 14.8 15.8 23.9 18.7 17.15 Malaysia 41.9 20.7 9.7 21.1 14.6 9.26 Mongolia .. .. 20.5 18.0 34.5 29.77 Papua New Guinea 39.9 36.5 27.7 32.4 24.5 27.28 Philippines 38.2 18.8 5.7 23.3 21.8 14.79 Thailand 65.5 30.6 .. 18.5 12.3 9.4
10 Viet Nam .. .. 27.6 .. 33.9 23.0
South Asia
11 Bangladesh 35.6 15.7 .. 31.2 29.4 22.712 Bhutan .. 34.3 .. 53.7 39.8 33.713 India 30.2 17.8 13.4 35.9 30.9 22.714 Maldives .. .. 61.7 .. .. ..15 Nepal 64.7 15.5 .. 61.0 44.9 40.716 Pakistan 34.2 19.6 12.3 31.6 26.3 23.217 Sri Lanka 59.9 26.7 22.7 26.4 25.9 20.5
Regions
1 East Asia & Pacific .. 17.9 9.0 30.2 21.0 14.92 Europe & Central Asia .. .. 8.8 .. 11.9 8.43 Latin America & Caribbean 27.7 23.9 20.6 9.8 8.1 7.14 Middle East & North Africa 6.4 6.1 5.3 11.0 14.0 10.85 South Asia 33.7 18.4 14.3 35.0 30.3 23.06 Sub-Saharan Africa .. .. .. 19.9 18.1 18.57 Least Developed Countries .. .. .. 37.4 36.5 30.28 World 16.8 13.1 9.8 6.4 4.9 ..
Source: World Bank 2005.
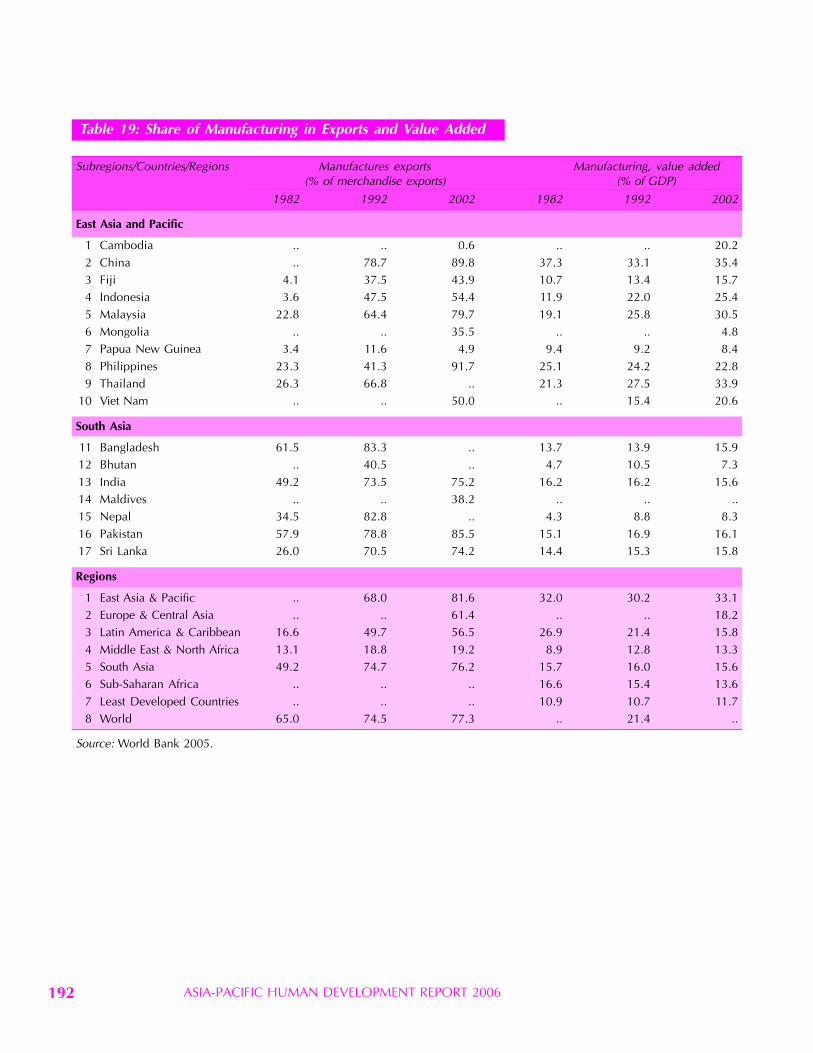
ASIA-PACIFIC HUMAN DEVELOPMENT REPORT 2006192
Table 19: Share of Manufacturing in Exports and Value Added
Subregions/Countries/Regions Manufactures exports Manufacturing, value added(% of merchandise exports) (% of GDP)
1982 1992 2002 1982 1992 2002
East Asia and Pacific
1 Cambodia .. .. 0.6 .. .. 20.22 China .. 78.7 89.8 37.3 33.1 35.43 Fiji 4.1 37.5 43.9 10.7 13.4 15.74 Indonesia 3.6 47.5 54.4 11.9 22.0 25.45 Malaysia 22.8 64.4 79.7 19.1 25.8 30.56 Mongolia .. .. 35.5 .. .. 4.87 Papua New Guinea 3.4 11.6 4.9 9.4 9.2 8.48 Philippines 23.3 41.3 91.7 25.1 24.2 22.89 Thailand 26.3 66.8 .. 21.3 27.5 33.9
10 Viet Nam .. .. 50.0 .. 15.4 20.6
South Asia
11 Bangladesh 61.5 83.3 .. 13.7 13.9 15.912 Bhutan .. 40.5 .. 4.7 10.5 7.313 India 49.2 73.5 75.2 16.2 16.2 15.614 Maldives .. .. 38.2 .. .. ..15 Nepal 34.5 82.8 .. 4.3 8.8 8.316 Pakistan 57.9 78.8 85.5 15.1 16.9 16.117 Sri Lanka 26.0 70.5 74.2 14.4 15.3 15.8
Regions
1 East Asia & Pacific .. 68.0 81.6 32.0 30.2 33.12 Europe & Central Asia .. .. 61.4 .. .. 18.23 Latin America & Caribbean 16.6 49.7 56.5 26.9 21.4 15.84 Middle East & North Africa 13.1 18.8 19.2 8.9 12.8 13.35 South Asia 49.2 74.7 76.2 15.7 16.0 15.66 Sub-Saharan Africa .. .. .. 16.6 15.4 13.67 Least Developed Countries .. .. .. 10.9 10.7 11.78 World 65.0 74.5 77.3 .. 21.4 ..
Source: World Bank 2005.
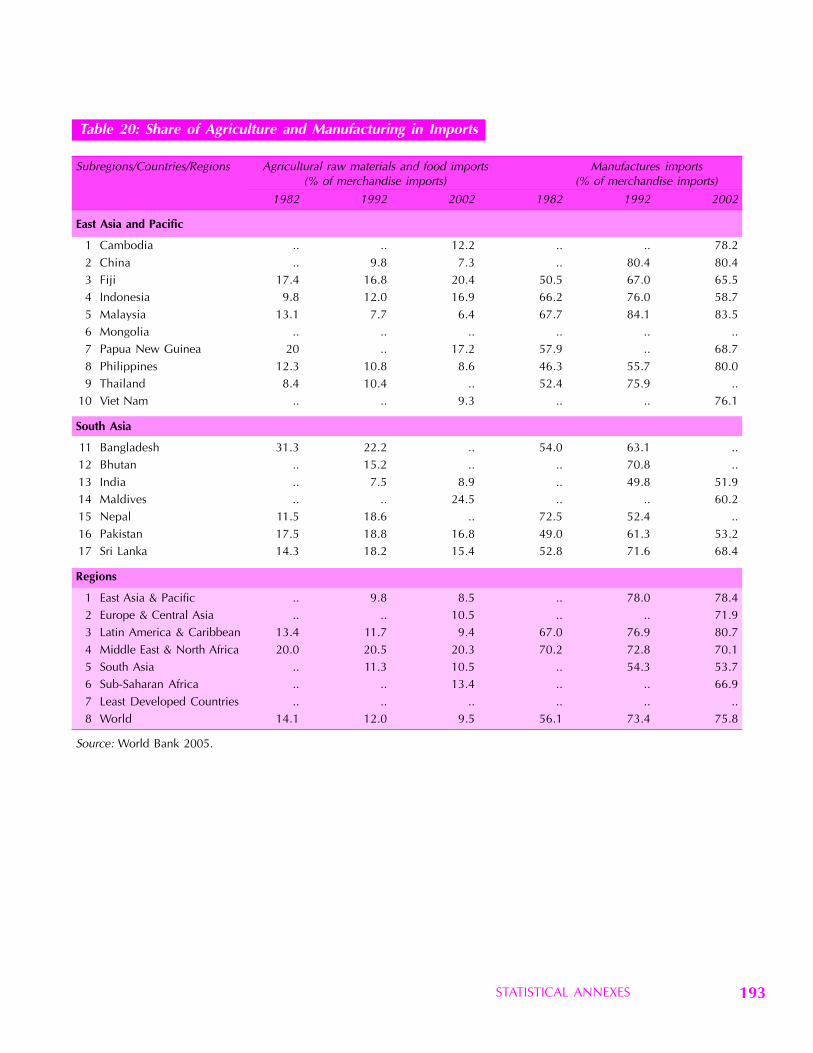
STATISTICAL ANNEXES 193
Table 20: Share of Agriculture and Manufacturing in Imports
Subregions/Countries/Regions Agricultural raw materials and food imports Manufactures imports(% of merchandise imports) (% of merchandise imports)
1982 1992 2002 1982 1992 2002
East Asia and Pacific
1 Cambodia .. .. 12.2 .. .. 78.22 China .. 9.8 7.3 .. 80.4 80.43 Fiji 17.4 16.8 20.4 50.5 67.0 65.54 Indonesia 9.8 12.0 16.9 66.2 76.0 58.75 Malaysia 13.1 7.7 6.4 67.7 84.1 83.56 Mongolia .. .. .. .. .. ..7 Papua New Guinea 20 .. 17.2 57.9 .. 68.78 Philippines 12.3 10.8 8.6 46.3 55.7 80.09 Thailand 8.4 10.4 .. 52.4 75.9 ..
10 Viet Nam .. .. 9.3 .. .. 76.1
South Asia
11 Bangladesh 31.3 22.2 .. 54.0 63.1 ..12 Bhutan .. 15.2 .. .. 70.8 ..13 India .. 7.5 8.9 .. 49.8 51.914 Maldives .. .. 24.5 .. .. 60.215 Nepal 11.5 18.6 .. 72.5 52.4 ..16 Pakistan 17.5 18.8 16.8 49.0 61.3 53.217 Sri Lanka 14.3 18.2 15.4 52.8 71.6 68.4
Regions
1 East Asia & Pacific .. 9.8 8.5 .. 78.0 78.42 Europe & Central Asia .. .. 10.5 .. .. 71.93 Latin America & Caribbean 13.4 11.7 9.4 67.0 76.9 80.74 Middle East & North Africa 20.0 20.5 20.3 70.2 72.8 70.15 South Asia .. 11.3 10.5 .. 54.3 53.76 Sub-Saharan Africa .. .. 13.4 .. .. 66.97 Least Developed Countries .. .. .. .. .. ..8 World 14.1 12.0 9.5 56.1 73.4 75.8
Source: World Bank 2005.
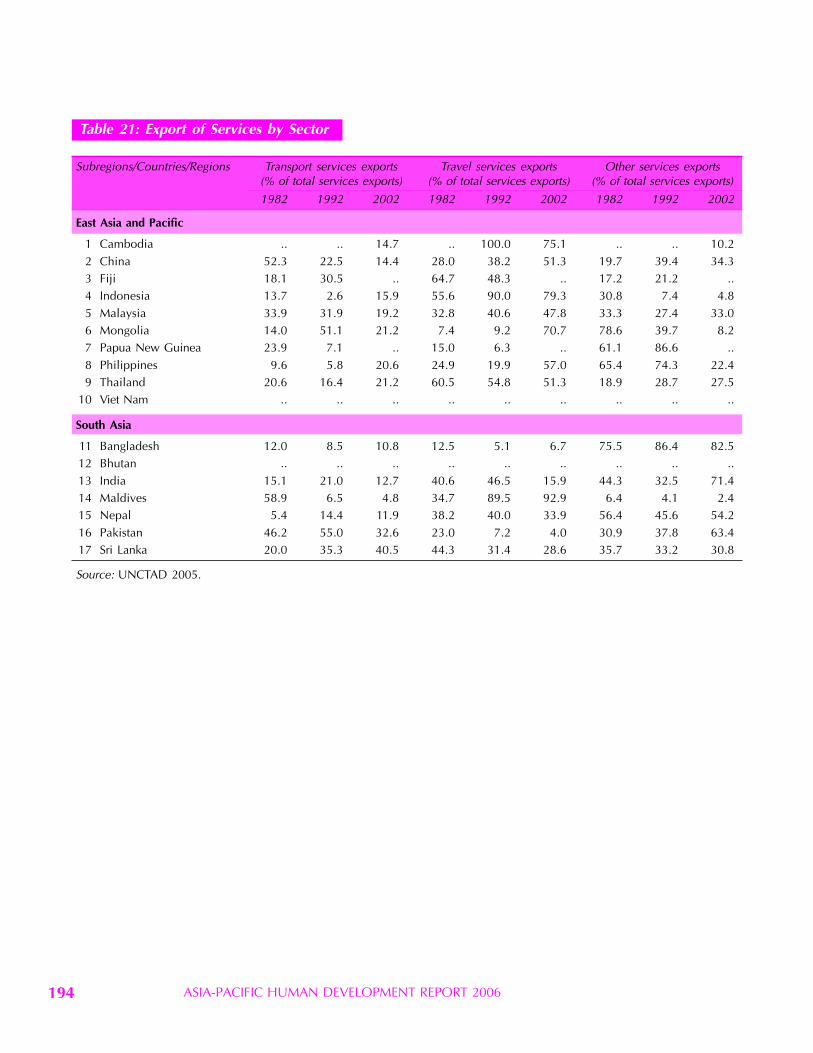
ASIA-PACIFIC HUMAN DEVELOPMENT REPORT 2006194
Table 21: Export of Services by Sector
Subregions/Countries/Regions Transport services exports Travel services exports Other services exports(% of total services exports) (% of total services exports) (% of total services exports)
1982 1992 2002 1982 1992 2002 1982 1992 2002
East Asia and Pacific
1 Cambodia .. .. 14.7 .. 100.0 75.1 .. .. 10.22 China 52.3 22.5 14.4 28.0 38.2 51.3 19.7 39.4 34.33 Fiji 18.1 30.5 .. 64.7 48.3 .. 17.2 21.2 ..4 Indonesia 13.7 2.6 15.9 55.6 90.0 79.3 30.8 7.4 4.85 Malaysia 33.9 31.9 19.2 32.8 40.6 47.8 33.3 27.4 33.06 Mongolia 14.0 51.1 21.2 7.4 9.2 70.7 78.6 39.7 8.27 Papua New Guinea 23.9 7.1 .. 15.0 6.3 .. 61.1 86.6 ..8 Philippines 9.6 5.8 20.6 24.9 19.9 57.0 65.4 74.3 22.49 Thailand 20.6 16.4 21.2 60.5 54.8 51.3 18.9 28.7 27.5
10 Viet Nam .. .. .. .. .. .. .. .. ..
South Asia
11 Bangladesh 12.0 8.5 10.8 12.5 5.1 6.7 75.5 86.4 82.512 Bhutan .. .. .. .. .. .. .. .. ..13 India 15.1 21.0 12.7 40.6 46.5 15.9 44.3 32.5 71.414 Maldives 58.9 6.5 4.8 34.7 89.5 92.9 6.4 4.1 2.415 Nepal 5.4 14.4 11.9 38.2 40.0 33.9 56.4 45.6 54.216 Pakistan 46.2 55.0 32.6 23.0 7.2 4.0 30.9 37.8 63.417 Sri Lanka 20.0 35.3 40.5 44.3 31.4 28.6 35.7 33.2 30.8
Source: UNCTAD 2005.
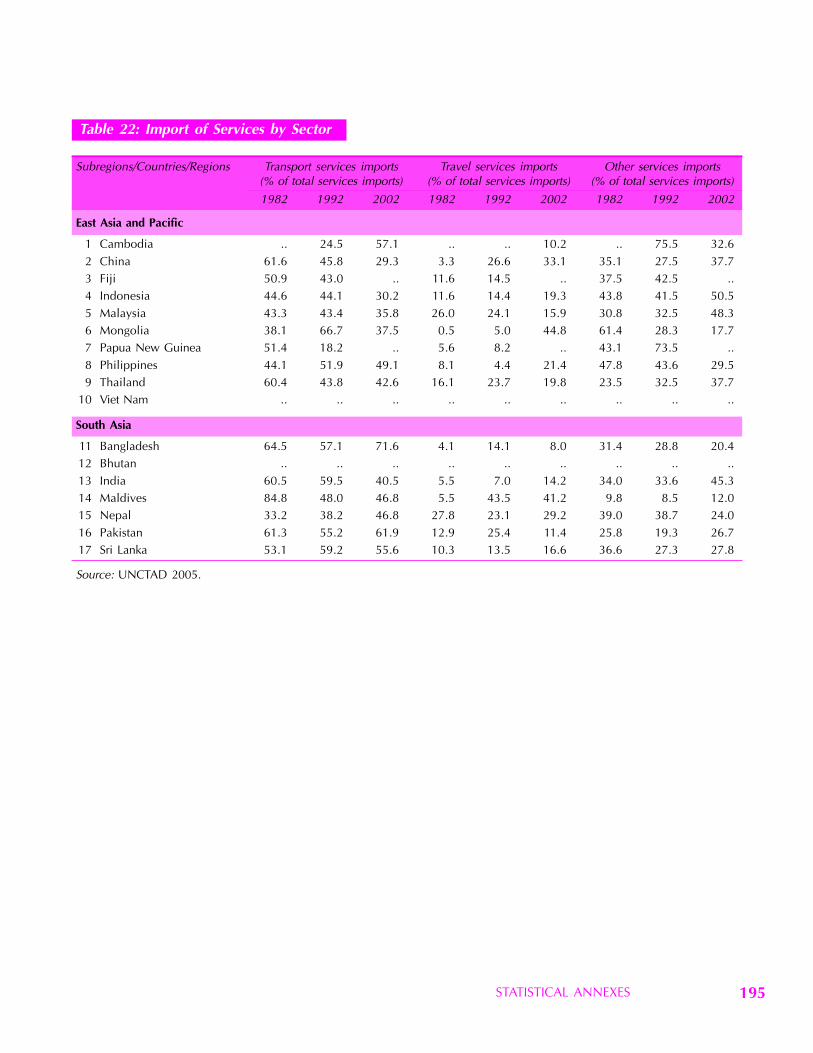
STATISTICAL ANNEXES 195
Table 22: Import of Services by Sector
Subregions/Countries/Regions Transport services imports Travel services imports Other services imports(% of total services imports) (% of total services imports) (% of total services imports)
1982 1992 2002 1982 1992 2002 1982 1992 2002
East Asia and Pacific
1 Cambodia .. 24.5 57.1 .. .. 10.2 .. 75.5 32.62 China 61.6 45.8 29.3 3.3 26.6 33.1 35.1 27.5 37.73 Fiji 50.9 43.0 .. 11.6 14.5 .. 37.5 42.5 ..4 Indonesia 44.6 44.1 30.2 11.6 14.4 19.3 43.8 41.5 50.55 Malaysia 43.3 43.4 35.8 26.0 24.1 15.9 30.8 32.5 48.36 Mongolia 38.1 66.7 37.5 0.5 5.0 44.8 61.4 28.3 17.77 Papua New Guinea 51.4 18.2 .. 5.6 8.2 .. 43.1 73.5 ..8 Philippines 44.1 51.9 49.1 8.1 4.4 21.4 47.8 43.6 29.59 Thailand 60.4 43.8 42.6 16.1 23.7 19.8 23.5 32.5 37.7
10 Viet Nam .. .. .. .. .. .. .. .. ..
South Asia
11 Bangladesh 64.5 57.1 71.6 4.1 14.1 8.0 31.4 28.8 20.412 Bhutan .. .. .. .. .. .. .. .. ..13 India 60.5 59.5 40.5 5.5 7.0 14.2 34.0 33.6 45.314 Maldives 84.8 48.0 46.8 5.5 43.5 41.2 9.8 8.5 12.015 Nepal 33.2 38.2 46.8 27.8 23.1 29.2 39.0 38.7 24.016 Pakistan 61.3 55.2 61.9 12.9 25.4 11.4 25.8 19.3 26.717 Sri Lanka 53.1 59.2 55.6 10.3 13.5 16.6 36.6 27.3 27.8
Source: UNCTAD 2005.
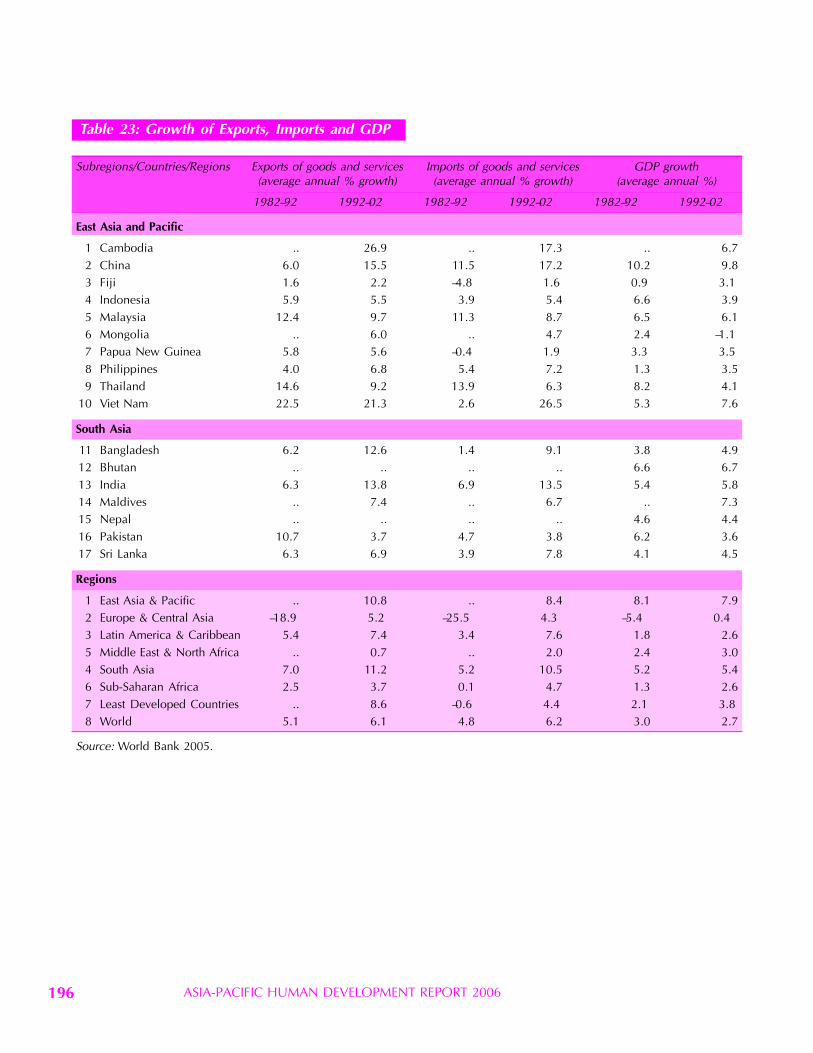
ASIA-PACIFIC HUMAN DEVELOPMENT REPORT 2006196
Table 23: Growth of Exports, Imports and GDP
Subregions/Countries/Regions Exports of goods and services Imports of goods and services GDP growth(average annual % growth) (average annual % growth) (average annual %)
1982–92 1992–02 1982–92 1992–02 1982–92 1992–02
East Asia and Pacific
1 Cambodia .. 26.9 .. 17.3 .. 6.72 China 6.0 15.5 11.5 17.2 10.2 9.83 Fiji 1.6 2.2 –4.8 1.6 0.9 3.14 Indonesia 5.9 5.5 3.9 5.4 6.6 3.95 Malaysia 12.4 9.7 11.3 8.7 6.5 6.16 Mongolia .. 6.0 .. 4.7 2.4 –1.17 Papua New Guinea 5.8 5.6 –0.4 1.9 3.3 3.58 Philippines 4.0 6.8 5.4 7.2 1.3 3.59 Thailand 14.6 9.2 13.9 6.3 8.2 4.1
10 Viet Nam 22.5 21.3 2.6 26.5 5.3 7.6
South Asia
11 Bangladesh 6.2 12.6 1.4 9.1 3.8 4.912 Bhutan .. .. .. .. 6.6 6.713 India 6.3 13.8 6.9 13.5 5.4 5.814 Maldives .. 7.4 .. 6.7 .. 7.315 Nepal .. .. .. .. 4.6 4.416 Pakistan 10.7 3.7 4.7 3.8 6.2 3.617 Sri Lanka 6.3 6.9 3.9 7.8 4.1 4.5
Regions
1 East Asia & Pacific .. 10.8 .. 8.4 8.1 7.92 Europe & Central Asia –18.9 5.2 –25.5 4.3 –5.4 0.43 Latin America & Caribbean 5.4 7.4 3.4 7.6 1.8 2.65 Middle East & North Africa .. 0.7 .. 2.0 2.4 3.04 South Asia 7.0 11.2 5.2 10.5 5.2 5.46 Sub-Saharan Africa 2.5 3.7 0.1 4.7 1.3 2.67 Least Developed Countries .. 8.6 –0.6 4.4 2.1 3.88 World 5.1 6.1 4.8 6.2 3.0 2.7
Source: World Bank 2005.
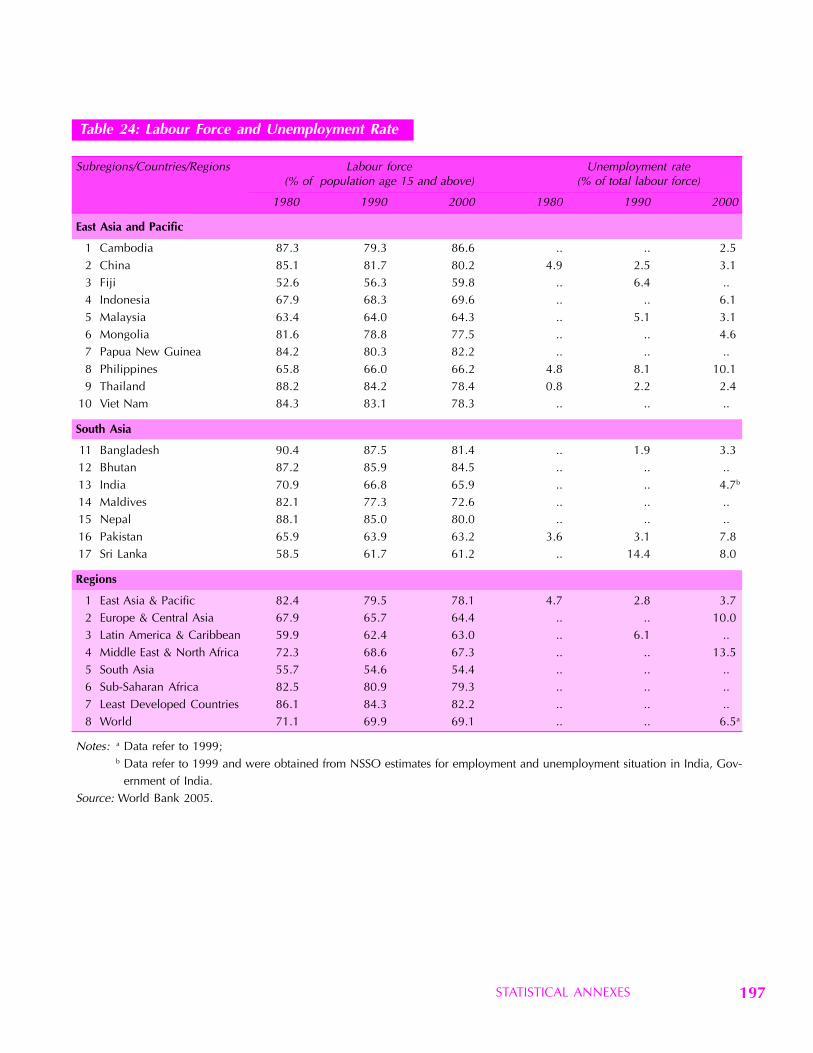
STATISTICAL ANNEXES 197
Table 24: Labour Force and Unemployment Rate
Subregions/Countries/Regions Labour force Unemployment rate(% of population age 15 and above) (% of total labour force)
1980 1990 2000 1980 1990 2000
East Asia and Pacific
1 Cambodia 87.3 79.3 86.6 .. .. 2.52 China 85.1 81.7 80.2 4.9 2.5 3.13 Fiji 52.6 56.3 59.8 .. 6.4 ..4 Indonesia 67.9 68.3 69.6 .. .. 6.15 Malaysia 63.4 64.0 64.3 .. 5.1 3.16 Mongolia 81.6 78.8 77.5 .. .. 4.67 Papua New Guinea 84.2 80.3 82.2 .. .. ..8 Philippines 65.8 66.0 66.2 4.8 8.1 10.19 Thailand 88.2 84.2 78.4 0.8 2.2 2.4
10 Viet Nam 84.3 83.1 78.3 .. .. ..
South Asia
11 Bangladesh 90.4 87.5 81.4 .. 1.9 3.312 Bhutan 87.2 85.9 84.5 .. .. ..13 India 70.9 66.8 65.9 .. .. 4.7b
14 Maldives 82.1 77.3 72.6 .. .. ..15 Nepal 88.1 85.0 80.0 .. .. ..16 Pakistan 65.9 63.9 63.2 3.6 3.1 7.817 Sri Lanka 58.5 61.7 61.2 .. 14.4 8.0
Regions
1 East Asia & Pacific 82.4 79.5 78.1 4.7 2.8 3.72 Europe & Central Asia 67.9 65.7 64.4 .. .. 10.03 Latin America & Caribbean 59.9 62.4 63.0 .. 6.1 ..4 Middle East & North Africa 72.3 68.6 67.3 .. .. 13.55 South Asia 55.7 54.6 54.4 .. .. ..6 Sub-Saharan Africa 82.5 80.9 79.3 .. .. ..7 Least Developed Countries 86.1 84.3 82.2 .. .. ..8 World 71.1 69.9 69.1 .. .. 6.5a
Notes: a Data refer to 1999;b Data refer to 1999 and were obtained from NSSO estimates for employment and unemployment situation in India, Gov-
ernment of India.Source: World Bank 2005.

ASIA-PACIFIC HUMAN DEVELOPMENT REPORT 2006198
Table 25: Structure of Employment
Subregions/Countries/Regions Employment in Employment in Employment in Employment inagriculture (% of industry (% of services (% of others (% of
total employment) total employment) total employment) total employment)
1980 1990 2000 1980 1990 2000 1980 1990 2000 1980 1990 2000
East Asia and Pacific
1 Cambodia .. .. .. .. .. .. .. .. .. .. .. ..2 China 68.7 53.5 46.9 18.2 19.0 17.5 11.7 9.5 12.9 1.4 18.0 22.73 Fiji .. 2.6 .. .. 34.5 .. .. 62.9 .. .. 0.0 ..4 Indonesia 55.9 55.9 45.3 13.2 13.7 17.3 30.2 30.2 37.3 0.7 0.2 0.15 Malaysia 37.2 26.0 18.4 24.1 27.5 32.2 38.7 46.5 49.5 0.0 0.0 0.06 Mongolia .. 33.0 48.9 .. 25.2 14.1 .. 14.3 14.6 .. 27.5 22.47 Papua New Guinea 82.4 79.1 .. 5.8 6.5 .. 11.8 14.3 .. 0.0 0.1 ..8 Philippines 51.8 45.2 37.4 15.4 15.0 16.0 32.8 39.7 46.5 0.0 0.1 0.19 Thailand 70.8 64.0 48.8 10.3 14.0 19.0 18.9 22.0 32.2 0.0 0.0 0.0
10 Viet Nam .. .. .. .. .. .. .. .. .. .. .. ..
South Asia
11 Bangladesh .. 66.4 62.1 .. 13.0 10.3 .. 16.2 23.5 .. 4.4 4.112 Bhutan 94.4 94.2 .. 1.4 0.9 .. 4.2 5.0 .. 0.0 0.0 ..13 India .. 69.1 .. .. 13.6 .. .. 17.3 .. .. 0.0 ..14 Maldives .. 25.2 13.7 .. 22.4 19.0 .. 48.5 50.2 .. 3.9 17.115 Nepal .. 83.3 .. .. 2.3 .. .. 13.7 .. .. 0.7 ..16 Pakistan 52.7 51.1 48.4 20.3 19.8 18.0 26.8 28.9 33.5 0.2 0.2 0.117 Sri Lanka .. 47.8 .. .. 20.6 .. .. 30.0 .. .. 1.6 ..
Regions
1 East Asia & Pacific 66.7 53.9 46.2 17.3 18.1 17.6 14.7 13.5 17.8 1.3 14.4 18.42 Europe & Central Asia .. 22.8 .. .. 35.9 .. .. 36.6 .. .. 4.6 ..3 Latin America & Caribbean .. 18.2 .. .. 25.4 .. .. 54.4 .. .. 2.0 ..4 Middle East & North Africa .. 26.9 .. .. 25.6 .. .. 47.4 .. .. 0.1 ..5 South Asia .. 67.3 .. .. 13.9 .. .. 18.3 .. .. 0.5 ..6 Sub-Saharan Africa .. .. .. .. .. .. .. .. .. .. .. ..7 Least Developed Countries .. 72.3 .. .. 9.6 .. .. 16.0 .. .. 2.1 ..8 World .. 43.3 .. .. 21.0 .. .. 29.4 .. .. 6.4 ..
Note: The sum total of sectoral employment should be equal to 100. However, in the cases of China, Mongolia, Bangladesh andMaldives, the total is less than 100. This simply implies that some workers are not classified into any of the sectors.Source: World Bank 2005.
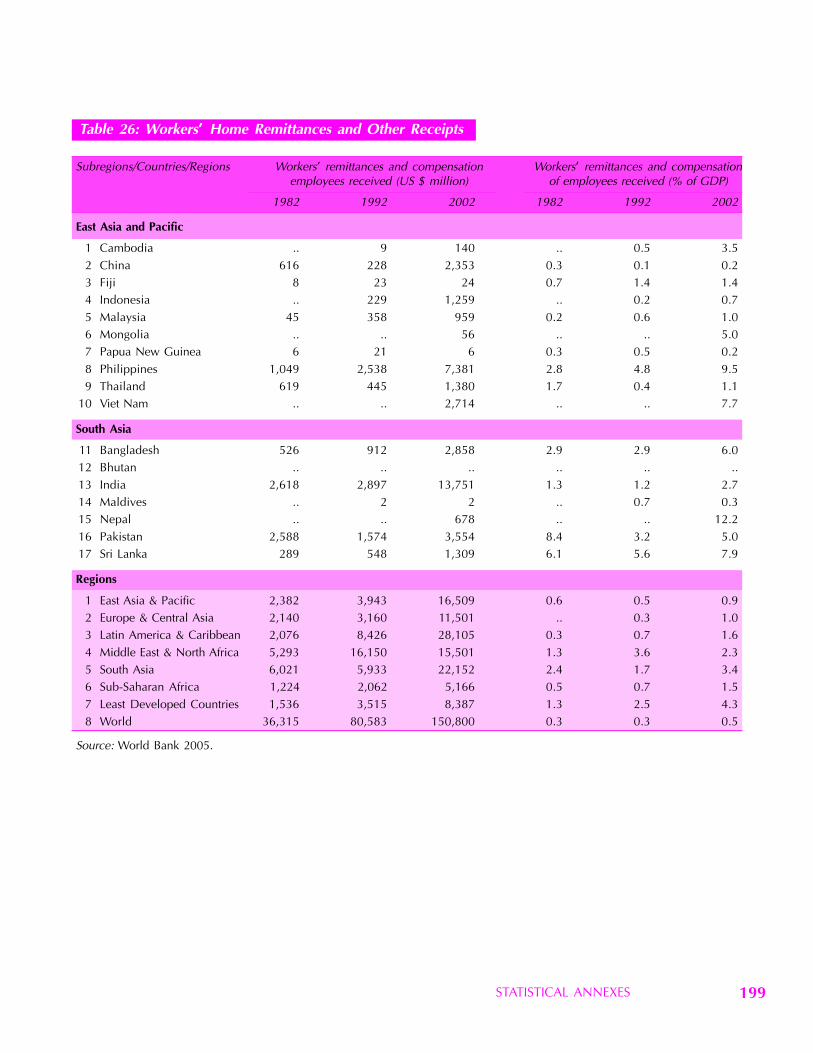
STATISTICAL ANNEXES 199
Table 26: Workers’ ’ ’ ’ ’ Home Remittances and Other Receipts
Subregions/Countries/Regions Workers’ remittances and compensation Workers’ remittances and compensationemployees received (US $ million) of employees received (% of GDP)
1982 1992 2002 1982 1992 2002
East Asia and Pacific
1 Cambodia .. 9 140 .. 0.5 3.52 China 616 228 2,353 0.3 0.1 0.23 Fiji 8 23 24 0.7 1.4 1.44 Indonesia .. 229 1,259 .. 0.2 0.75 Malaysia 45 358 959 0.2 0.6 1.06 Mongolia .. .. 56 .. .. 5.07 Papua New Guinea 6 21 6 0.3 0.5 0.28 Philippines 1,049 2,538 7,381 2.8 4.8 9.59 Thailand 619 445 1,380 1.7 0.4 1.1
10 Viet Nam .. .. 2,714 .. .. 7.7
South Asia
11 Bangladesh 526 912 2,858 2.9 2.9 6.012 Bhutan .. .. .. .. .. ..13 India 2,618 2,897 13,751 1.3 1.2 2.714 Maldives .. 2 2 .. 0.7 0.315 Nepal .. .. 678 .. .. 12.216 Pakistan 2,588 1,574 3,554 8.4 3.2 5.017 Sri Lanka 289 548 1,309 6.1 5.6 7.9
Regions
1 East Asia & Pacific 2,382 3,943 16,509 0.6 0.5 0.92 Europe & Central Asia 2,140 3,160 11,501 .. 0.3 1.03 Latin America & Caribbean 2,076 8,426 28,105 0.3 0.7 1.64 Middle East & North Africa 5,293 16,150 15,501 1.3 3.6 2.35 South Asia 6,021 5,933 22,152 2.4 1.7 3.46 Sub-Saharan Africa 1,224 2,062 5,166 0.5 0.7 1.57 Least Developed Countries 1,536 3,515 8,387 1.3 2.5 4.38 World 36,315 80,583 150,800 0.3 0.3 0.5
Source: World Bank 2005.
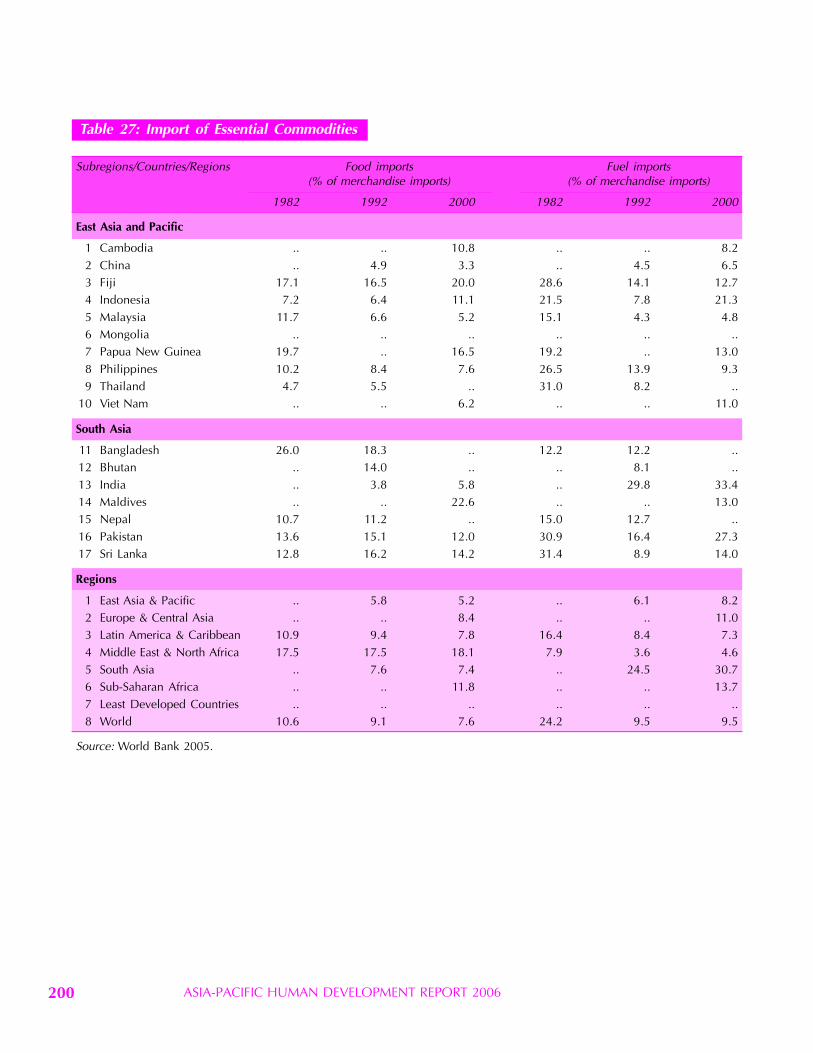
ASIA-PACIFIC HUMAN DEVELOPMENT REPORT 2006200
Table 27: Import of Essential Commodities
Subregions/Countries/Regions Food imports Fuel imports(% of merchandise imports) (% of merchandise imports)
1982 1992 2000 1982 1992 2000
East Asia and Pacific
1 Cambodia .. .. 10.8 .. .. 8.22 China .. 4.9 3.3 .. 4.5 6.53 Fiji 17.1 16.5 20.0 28.6 14.1 12.74 Indonesia 7.2 6.4 11.1 21.5 7.8 21.35 Malaysia 11.7 6.6 5.2 15.1 4.3 4.86 Mongolia .. .. .. .. .. ..7 Papua New Guinea 19.7 .. 16.5 19.2 .. 13.08 Philippines 10.2 8.4 7.6 26.5 13.9 9.39 Thailand 4.7 5.5 .. 31.0 8.2 ..
10 Viet Nam .. .. 6.2 .. .. 11.0
South Asia
11 Bangladesh 26.0 18.3 .. 12.2 12.2 ..12 Bhutan .. 14.0 .. .. 8.1 ..13 India .. 3.8 5.8 .. 29.8 33.414 Maldives .. .. 22.6 .. .. 13.015 Nepal 10.7 11.2 .. 15.0 12.7 ..16 Pakistan 13.6 15.1 12.0 30.9 16.4 27.317 Sri Lanka 12.8 16.2 14.2 31.4 8.9 14.0
Regions
1 East Asia & Pacific .. 5.8 5.2 .. 6.1 8.22 Europe & Central Asia .. .. 8.4 .. .. 11.03 Latin America & Caribbean 10.9 9.4 7.8 16.4 8.4 7.34 Middle East & North Africa 17.5 17.5 18.1 7.9 3.6 4.65 South Asia .. 7.6 7.4 .. 24.5 30.76 Sub-Saharan Africa .. .. 11.8 .. .. 13.77 Least Developed Countries .. .. .. .. .. ..8 World 10.6 9.1 7.6 24.2 9.5 9.5
Source: World Bank 2005.
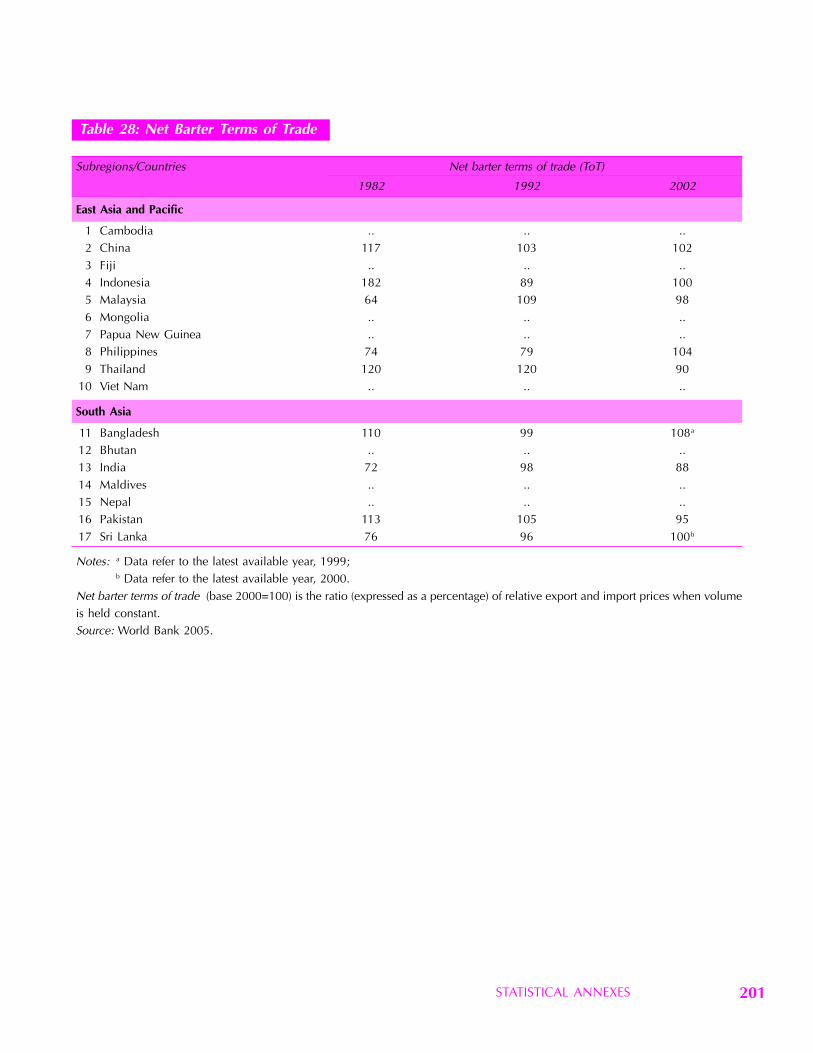
STATISTICAL ANNEXES 201
Table 28: Net Barter Terms of Trade
Subregions/Countries Net barter terms of trade (ToT)
1982 1992 2002
East Asia and Pacific
1 Cambodia .. .. ..2 China 117 103 1023 Fiji .. .. ..4 Indonesia 182 89 1005 Malaysia 64 109 986 Mongolia .. .. ..7 Papua New Guinea .. .. ..8 Philippines 74 79 1049 Thailand 120 120 90
10 Viet Nam .. .. ..
South Asia
11 Bangladesh 110 99 108a
12 Bhutan .. .. ..13 India 72 98 8814 Maldives .. .. ..15 Nepal .. .. ..16 Pakistan 113 105 9517 Sri Lanka 76 96 100b
Notes: a Data refer to the latest available year, 1999;b Data refer to the latest available year, 2000.
Net barter terms of trade (base 2000=100) is the ratio (expressed as a percentage) of relative export and import prices when volumeis held constant.Source: World Bank 2005.
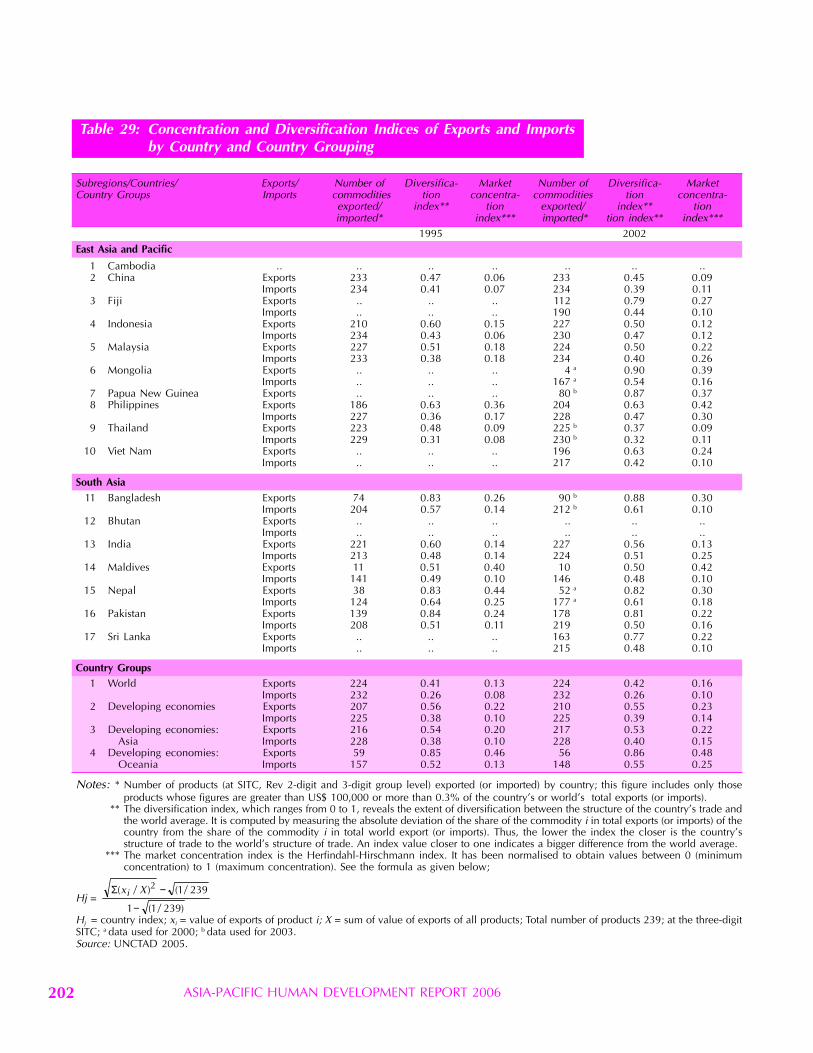
ASIA-PACIFIC HUMAN DEVELOPMENT REPORT 2006202
Table 29: Concentration and Diversification Indices of Exports and Importsby Country and Country Grouping
Subregions/Countries/ Exports/ Number of Diversifica- Market Number of Diversifica- MarketCountry Groups Imports commodities tion concentra- commodities tion concentra-
exported/ index** tion exported/ index** tionimported* index*** imported* tion index** index***
1995 2002East Asia and Pacific
1 Cambodia .. .. .. .. .. .. ..2 China Exports 233 0.47 0.06 233 0.45 0.09
Imports 234 0.41 0.07 234 0.39 0.113 Fiji Exports .. .. .. 112 0.79 0.27
Imports .. .. .. 190 0.44 0.104 Indonesia Exports 210 0.60 0.15 227 0.50 0.12
Imports 234 0.43 0.06 230 0.47 0.125 Malaysia Exports 227 0.51 0.18 224 0.50 0.22
Imports 233 0.38 0.18 234 0.40 0.266 Mongolia Exports .. .. .. 4 a 0.90 0.39
Imports .. .. .. 167 a 0.54 0.167 Papua New Guinea Exports .. .. .. 80 b 0.87 0.378 Philippines Exports 186 0.63 0.36 204 0.63 0.42
Imports 227 0.36 0.17 228 0.47 0.309 Thailand Exports 223 0.48 0.09 225 b 0.37 0.09
Imports 229 0.31 0.08 230 b 0.32 0.1110 Viet Nam Exports .. .. .. 196 0.63 0.24
Imports .. .. .. 217 0.42 0.10
South Asia11 Bangladesh Exports 74 0.83 0.26 90 b 0.88 0.30
Imports 204 0.57 0.14 212 b 0.61 0.1012 Bhutan Exports .. .. .. .. .. ..
Imports .. .. .. .. .. ..13 India Exports 221 0.60 0.14 227 0.56 0.13
Imports 213 0.48 0.14 224 0.51 0.2514 Maldives Exports 11 0.51 0.40 10 0.50 0.42
Imports 141 0.49 0.10 146 0.48 0.1015 Nepal Exports 38 0.83 0.44 52 a 0.82 0.30
Imports 124 0.64 0.25 177 a 0.61 0.1816 Pakistan Exports 139 0.84 0.24 178 0.81 0.22
Imports 208 0.51 0.11 219 0.50 0.1617 Sri Lanka Exports .. .. .. 163 0.77 0.22
Imports .. .. .. 215 0.48 0.10
Country Groups1 World Exports 224 0.41 0.13 224 0.42 0.16
Imports 232 0.26 0.08 232 0.26 0.102 Developing economies Exports 207 0.56 0.22 210 0.55 0.23
Imports 225 0.38 0.10 225 0.39 0.143 Developing economies: Exports 216 0.54 0.20 217 0.53 0.22
Asia Imports 228 0.38 0.10 228 0.40 0.154 Developing economies: Exports 59 0.85 0.46 56 0.86 0.48
Oceania Imports 157 0.52 0.13 148 0.55 0.25
Notes: * Number of products (at SITC, Rev 2-digit and 3-digit group level) exported (or imported) by country; this figure includes only thoseproducts whose figures are greater than US$ 100,000 or more than 0.3% of the country’s or world’s total exports (or imports).
** The diversification index, which ranges from 0 to 1, reveals the extent of diversification between the structure of the country’s trade andthe world average. It is computed by measuring the absolute deviation of the share of the commodity i in total exports (or imports) of thecountry from the share of the commodity i in total world export (or imports). Thus, the lower the index the closer is the country’sstructure of trade to the world’s structure of trade. An index value closer to one indicates a bigger difference from the world average.
*** The market concentration index is the Herfindahl-Hirschmann index. It has been normalised to obtain values between 0 (minimumconcentration) to 1 (maximum concentration). See the formula as given below;
Hj = Σ( / ) ( /
( / )
x Xi2 1 239
1 1 239
−
−Hj = country index; xi = value of exports of product i; X = sum of value of exports of all products; Total number of products 239; at the three-digitSITC; a data used for 2000; b data used for 2003.Source: UNCTAD 2005.
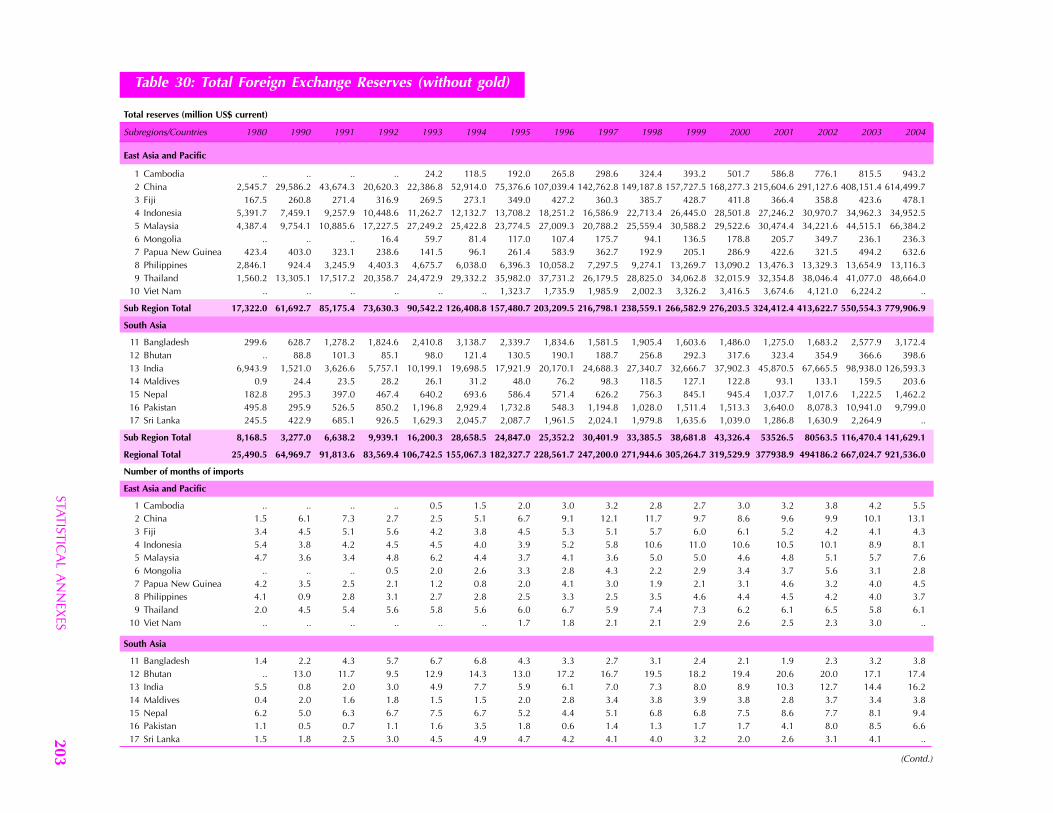
STATISTICA
L AN
NEX
ES203
Table 30: Total Foreign Exchange Reserves (without gold)
Total reserves (million US$ current)
Subregions/Countries 1980 1990 1991 1992 1993 1994 1995 1996 1997 1998 1999 2000 2001 2002 2003 2004
East Asia and Pacific
1 Cambodia .. .. .. .. 24.2 118.5 192.0 265.8 298.6 324.4 393.2 501.7 586.8 776.1 815.5 943.22 China 2,545.7 29,586.2 43,674.3 20,620.3 22,386.8 52,914.0 75,376.6 107,039.4 142,762.8 149,187.8 157,727.5 168,277.3 215,604.6 291,127.6 408,151.4 614,499.73 Fiji 167.5 260.8 271.4 316.9 269.5 273.1 349.0 427.2 360.3 385.7 428.7 411.8 366.4 358.8 423.6 478.14 Indonesia 5,391.7 7,459.1 9,257.9 10,448.6 11,262.7 12,132.7 13,708.2 18,251.2 16,586.9 22,713.4 26,445.0 28,501.8 27,246.2 30,970.7 34,962.3 34,952.55 Malaysia 4,387.4 9,754.1 10,885.6 17,227.5 27,249.2 25,422.8 23,774.5 27,009.3 20,788.2 25,559.4 30,588.2 29,522.6 30,474.4 34,221.6 44,515.1 66,384.26 Mongolia .. .. .. 16.4 59.7 81.4 117.0 107.4 175.7 94.1 136.5 178.8 205.7 349.7 236.1 236.37 Papua New Guinea 423.4 403.0 323.1 238.6 141.5 96.1 261.4 583.9 362.7 192.9 205.1 286.9 422.6 321.5 494.2 632.68 Philippines 2,846.1 924.4 3,245.9 4,403.3 4,675.7 6,038.0 6,396.3 10,058.2 7,297.5 9,274.1 13,269.7 13,090.2 13,476.3 13,329.3 13,654.9 13,116.39 Thailand 1,560.2 13,305.1 17,517.2 20,358.7 24,472.9 29,332.2 35,982.0 37,731.2 26,179.5 28,825.0 34,062.8 32,015.9 32,354.8 38,046.4 41,077.0 48,664.0
10 Viet Nam .. .. .. .. .. .. 1,323.7 1,735.9 1,985.9 2,002.3 3,326.2 3,416.5 3,674.6 4,121.0 6,224.2 ..
Sub Region Total 17,322.0 61,692.7 85,175.4 73,630.3 90,542.2 126,408.8 157,480.7 203,209.5 216,798.1 238,559.1 266,582.9 276,203.5 324,412.4 413,622.7 550,554.3 779,906.9
South Asia
11 Bangladesh 299.6 628.7 1,278.2 1,824.6 2,410.8 3,138.7 2,339.7 1,834.6 1,581.5 1,905.4 1,603.6 1,486.0 1,275.0 1,683.2 2,577.9 3,172.412 Bhutan .. 88.8 101.3 85.1 98.0 121.4 130.5 190.1 188.7 256.8 292.3 317.6 323.4 354.9 366.6 398.613 India 6,943.9 1,521.0 3,626.6 5,757.1 10,199.1 19,698.5 17,921.9 20,170.1 24,688.3 27,340.7 32,666.7 37,902.3 45,870.5 67,665.5 98,938.0 126,593.314 Maldives 0.9 24.4 23.5 28.2 26.1 31.2 48.0 76.2 98.3 118.5 127.1 122.8 93.1 133.1 159.5 203.615 Nepal 182.8 295.3 397.0 467.4 640.2 693.6 586.4 571.4 626.2 756.3 845.1 945.4 1,037.7 1,017.6 1,222.5 1,462.216 Pakistan 495.8 295.9 526.5 850.2 1,196.8 2,929.4 1,732.8 548.3 1,194.8 1,028.0 1,511.4 1,513.3 3,640.0 8,078.3 10,941.0 9,799.017 Sri Lanka 245.5 422.9 685.1 926.5 1,629.3 2,045.7 2,087.7 1,961.5 2,024.1 1,979.8 1,635.6 1,039.0 1,286.8 1,630.9 2,264.9 ..
Sub Region Total 8,168.5 3,277.0 6,638.2 9,939.1 16,200.3 28,658.5 24,847.0 25,352.2 30,401.9 33,385.5 38,681.8 43,326.4 53526.5 80563.5 116,470.4 141,629.1
Regional Total 25,490.5 64,969.7 91,813.6 83,569.4 106,742.5 155,067.3 182,327.7 228,561.7 247,200.0 271,944.6 305,264.7 319,529.9 377938.9 494186.2 667,024.7 921,536.0
Number of months of imports
East Asia and Pacific
1 Cambodia .. .. .. .. 0.5 1.5 2.0 3.0 3.2 2.8 2.7 3.0 3.2 3.8 4.2 5.52 China 1.5 6.1 7.3 2.7 2.5 5.1 6.7 9.1 12.1 11.7 9.7 8.6 9.6 9.9 10.1 13.13 Fiji 3.4 4.5 5.1 5.6 4.2 3.8 4.5 5.3 5.1 5.7 6.0 6.1 5.2 4.2 4.1 4.34 Indonesia 5.4 3.8 4.2 4.5 4.5 4.0 3.9 5.2 5.8 10.6 11.0 10.6 10.5 10.1 8.9 8.15 Malaysia 4.7 3.6 3.4 4.8 6.2 4.4 3.7 4.1 3.6 5.0 5.0 4.6 4.8 5.1 5.7 7.66 Mongolia .. .. .. 0.5 2.0 2.6 3.3 2.8 4.3 2.2 2.9 3.4 3.7 5.6 3.1 2.87 Papua New Guinea 4.2 3.5 2.5 2.1 1.2 0.8 2.0 4.1 3.0 1.9 2.1 3.1 4.6 3.2 4.0 4.58 Philippines 4.1 0.9 2.8 3.1 2.7 2.8 2.5 3.3 2.5 3.5 4.6 4.4 4.5 4.2 4.0 3.79 Thailand 2.0 4.5 5.4 5.6 5.8 5.6 6.0 6.7 5.9 7.4 7.3 6.2 6.1 6.5 5.8 6.1
10 Viet Nam .. .. .. .. .. .. 1.7 1.8 2.1 2.1 2.9 2.6 2.5 2.3 3.0 ..
South Asia
11 Bangladesh 1.4 2.2 4.3 5.7 6.7 6.8 4.3 3.3 2.7 3.1 2.4 2.1 1.9 2.3 3.2 3.812 Bhutan .. 13.0 11.7 9.5 12.9 14.3 13.0 17.2 16.7 19.5 18.2 19.4 20.6 20.0 17.1 17.413 India 5.5 0.8 2.0 3.0 4.9 7.7 5.9 6.1 7.0 7.3 8.0 8.9 10.3 12.7 14.4 16.214 Maldives 0.4 2.0 1.6 1.8 1.5 1.5 2.0 2.8 3.4 3.8 3.9 3.8 2.8 3.7 3.4 3.815 Nepal 6.2 5.0 6.3 6.7 7.5 6.7 5.2 4.4 5.1 6.8 6.8 7.5 8.6 7.7 8.1 9.416 Pakistan 1.1 0.5 0.7 1.1 1.6 3.5 1.8 0.6 1.4 1.3 1.7 1.7 4.1 8.0 8.5 6.617 Sri Lanka 1.5 1.8 2.5 3.0 4.5 4.9 4.7 4.2 4.1 4.0 3.2 2.0 2.6 3.1 4.1 ..
(Contd.)
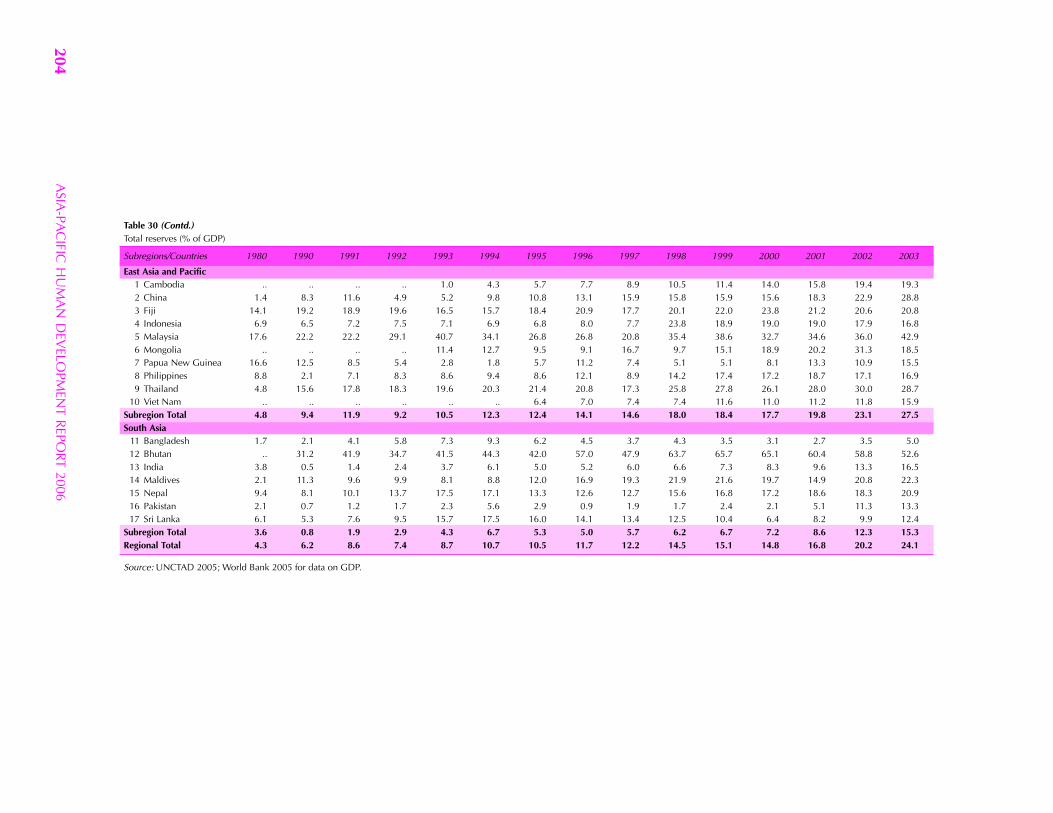
ASIA
-PAC
IFIC H
UM
AN
DEV
ELOPM
ENT R
EPORT 2006
204
Table 30 (Contd.)Total reserves (% of GDP)
Subregions/Countries 1980 1990 1991 1992 1993 1994 1995 1996 1997 1998 1999 2000 2001 2002 2003
East Asia and Pacific1 Cambodia .. .. .. .. 1.0 4.3 5.7 7.7 8.9 10.5 11.4 14.0 15.8 19.4 19.32 China 1.4 8.3 11.6 4.9 5.2 9.8 10.8 13.1 15.9 15.8 15.9 15.6 18.3 22.9 28.83 Fiji 14.1 19.2 18.9 19.6 16.5 15.7 18.4 20.9 17.7 20.1 22.0 23.8 21.2 20.6 20.84 Indonesia 6.9 6.5 7.2 7.5 7.1 6.9 6.8 8.0 7.7 23.8 18.9 19.0 19.0 17.9 16.85 Malaysia 17.6 22.2 22.2 29.1 40.7 34.1 26.8 26.8 20.8 35.4 38.6 32.7 34.6 36.0 42.96 Mongolia .. .. .. .. 11.4 12.7 9.5 9.1 16.7 9.7 15.1 18.9 20.2 31.3 18.57 Papua New Guinea 16.6 12.5 8.5 5.4 2.8 1.8 5.7 11.2 7.4 5.1 5.1 8.1 13.3 10.9 15.58 Philippines 8.8 2.1 7.1 8.3 8.6 9.4 8.6 12.1 8.9 14.2 17.4 17.2 18.7 17.1 16.99 Thailand 4.8 15.6 17.8 18.3 19.6 20.3 21.4 20.8 17.3 25.8 27.8 26.1 28.0 30.0 28.7
10 Viet Nam .. .. .. .. .. .. 6.4 7.0 7.4 7.4 11.6 11.0 11.2 11.8 15.9Subregion Total 4.8 9.4 11.9 9.2 10.5 12.3 12.4 14.1 14.6 18.0 18.4 17.7 19.8 23.1 27.5South Asia
11 Bangladesh 1.7 2.1 4.1 5.8 7.3 9.3 6.2 4.5 3.7 4.3 3.5 3.1 2.7 3.5 5.012 Bhutan .. 31.2 41.9 34.7 41.5 44.3 42.0 57.0 47.9 63.7 65.7 65.1 60.4 58.8 52.613 India 3.8 0.5 1.4 2.4 3.7 6.1 5.0 5.2 6.0 6.6 7.3 8.3 9.6 13.3 16.514 Maldives 2.1 11.3 9.6 9.9 8.1 8.8 12.0 16.9 19.3 21.9 21.6 19.7 14.9 20.8 22.315 Nepal 9.4 8.1 10.1 13.7 17.5 17.1 13.3 12.6 12.7 15.6 16.8 17.2 18.6 18.3 20.916 Pakistan 2.1 0.7 1.2 1.7 2.3 5.6 2.9 0.9 1.9 1.7 2.4 2.1 5.1 11.3 13.317 Sri Lanka 6.1 5.3 7.6 9.5 15.7 17.5 16.0 14.1 13.4 12.5 10.4 6.4 8.2 9.9 12.4
Subregion Total 3.6 0.8 1.9 2.9 4.3 6.7 5.3 5.0 5.7 6.2 6.7 7.2 8.6 12.3 15.3Regional Total 4.3 6.2 8.6 7.4 8.7 10.7 10.5 11.7 12.2 14.5 15.1 14.8 16.8 20.2 24.1
Source: UNCTAD 2005; World Bank 2005 for data on GDP.
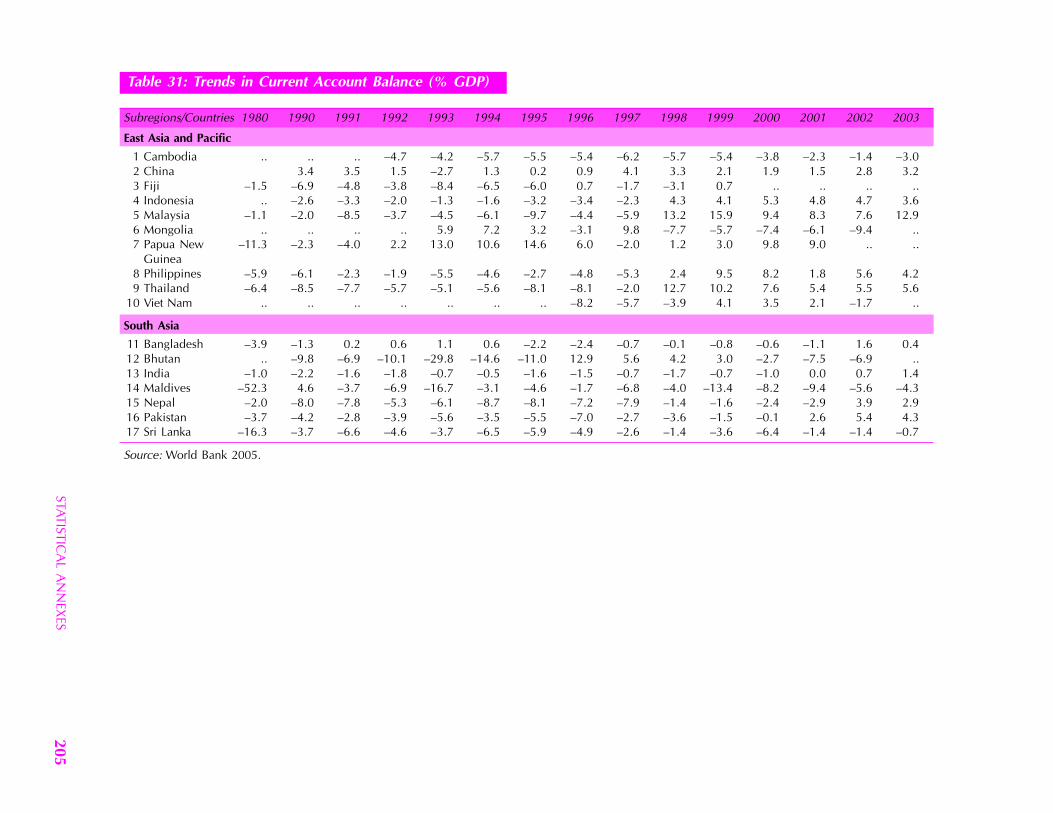
STATISTICA
L AN
NEX
ES205
Table 31: Trends in Current Account Balance (% GDP)
Subregions/Countries 1980 1990 1991 1992 1993 1994 1995 1996 1997 1998 1999 2000 2001 2002 2003
East Asia and Pacific
1 Cambodia .. .. .. – 4.7 – 4.2 – 5.7 – 5.5 – 5.4 – 6.2 – 5.7 – 5.4 – 3.8 – 2.3 – 1.4 – 3.02 China 3.4 3.5 1.5 – 2.7 1.3 0.2 0.9 4.1 3.3 2.1 1.9 1.5 2.8 3.23 Fiji – 1.5 – 6.9 – 4.8 – 3.8 – 8.4 – 6.5 – 6.0 0.7 – 1.7 – 3.1 0.7 .. .. .. ..4 Indonesia .. – 2.6 – 3.3 – 2.0 – 1.3 – 1.6 – 3.2 – 3.4 – 2.3 4.3 4.1 5.3 4.8 4.7 3.65 Malaysia – 1.1 – 2.0 – 8.5 – 3.7 – 4.5 – 6.1 – 9.7 – 4.4 – 5.9 13.2 15.9 9.4 8.3 7.6 12.96 Mongolia .. .. .. .. 5.9 7.2 3.2 – 3.1 9.8 – 7.7 – 5.7 – 7.4 – 6.1 – 9.4 ..7 Papua New – 11.3 – 2.3 – 4.0 2.2 13.0 10.6 14.6 6.0 – 2.0 1.2 3.0 9.8 9.0 .. ..
Guinea8 Philippines – 5.9 – 6.1 – 2.3 – 1.9 – 5.5 – 4.6 – 2.7 – 4.8 – 5.3 2.4 9.5 8.2 1.8 5.6 4.29 Thailand – 6.4 – 8.5 – 7.7 – 5.7 – 5.1 – 5.6 – 8.1 – 8.1 – 2.0 12.7 10.2 7.6 5.4 5.5 5.6
10 Viet Nam .. .. .. .. .. .. .. – 8.2 – 5.7 – 3.9 4.1 3.5 2.1 – 1.7 ..
South Asia
11 Bangladesh – 3.9 – 1.3 0.2 0.6 1.1 0.6 – 2.2 – 2.4 – 0.7 – 0.1 – 0.8 – 0.6 – 1.1 1.6 0.412 Bhutan .. – 9.8 – 6.9 – 10.1 – 29.8 – 14.6 – 11.0 12.9 5.6 4.2 3.0 – 2.7 – 7.5 – 6.9 ..13 India – 1.0 – 2.2 – 1.6 – 1.8 – 0.7 – 0.5 – 1.6 – 1.5 – 0.7 – 1.7 – 0.7 – 1.0 0.0 0.7 1.414 Maldives – 52.3 4.6 – 3.7 – 6.9 – 16.7 – 3.1 – 4.6 – 1.7 – 6.8 – 4.0 – 13.4 – 8.2 – 9.4 – 5.6 – 4.315 Nepal – 2.0 – 8.0 – 7.8 – 5.3 – 6.1 – 8.7 – 8.1 – 7.2 – 7.9 – 1.4 – 1.6 – 2.4 – 2.9 3.9 2.916 Pakistan – 3.7 – 4.2 – 2.8 – 3.9 – 5.6 – 3.5 – 5.5 – 7.0 – 2.7 – 3.6 – 1.5 – 0.1 2.6 5.4 4.317 Sri Lanka – 16.3 – 3.7 – 6.6 – 4.6 – 3.7 – 6.5 – 5.9 – 4.9 – 2.6 – 1.4 – 3.6 – 6.4 – 1.4 – 1.4 – 0.7
Source: World Bank 2005.
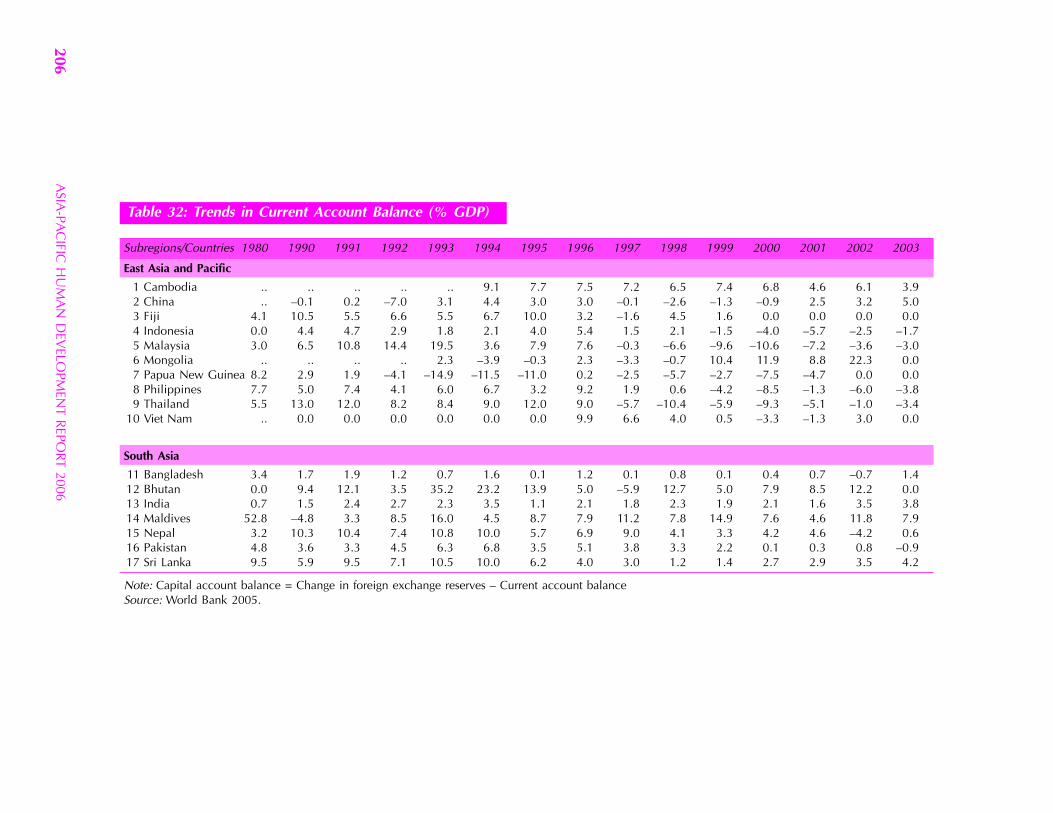
ASIA
-PAC
IFIC H
UM
AN
DEV
ELOPM
ENT R
EPORT 2006
206
Table 32: Trends in Current Account Balance (% GDP)
Subregions/Countries 1980 1990 1991 1992 1993 1994 1995 1996 1997 1998 1999 2000 2001 2002 2003
East Asia and Pacific
1 Cambodia .. .. .. .. .. 9.1 7.7 7.5 7.2 6.5 7.4 6.8 4.6 6.1 3.92 China .. – 0.1 0.2 – 7.0 3.1 4.4 3.0 3.0 – 0.1 – 2.6 – 1.3 – 0.9 2.5 3.2 5.03 Fiji 4.1 10.5 5.5 6.6 5.5 6.7 10.0 3.2 – 1.6 4.5 1.6 0.0 0.0 0.0 0.04 Indonesia 0.0 4.4 4.7 2.9 1.8 2.1 4.0 5.4 1.5 2.1 – 1.5 – 4.0 – 5.7 – 2.5 – 1.75 Malaysia 3.0 6.5 10.8 14.4 19.5 3.6 7.9 7.6 – 0.3 – 6.6 – 9.6 – 10.6 – 7.2 – 3.6 – 3.06 Mongolia .. .. .. .. 2.3 – 3.9 – 0.3 2.3 – 3.3 – 0.7 10.4 11.9 8.8 22.3 0.07 Papua New Guinea 8.2 2.9 1.9 – 4.1 – 14.9 – 11.5 – 11.0 0.2 – 2.5 – 5.7 – 2.7 – 7.5 – 4.7 0.0 0.08 Philippines 7.7 5.0 7.4 4.1 6.0 6.7 3.2 9.2 1.9 0.6 – 4.2 – 8.5 – 1.3 – 6.0 – 3.89 Thailand 5.5 13.0 12.0 8.2 8.4 9.0 12.0 9.0 – 5.7 – 10.4 – 5.9 – 9.3 – 5.1 – 1.0 – 3.4
10 Viet Nam .. 0.0 0.0 0.0 0.0 0.0 0.0 9.9 6.6 4.0 0.5 – 3.3 – 1.3 3.0 0.0
South Asia
11 Bangladesh 3.4 1.7 1.9 1.2 0.7 1.6 0.1 1.2 0.1 0.8 0.1 0.4 0.7 – 0.7 1.412 Bhutan 0.0 9.4 12.1 3.5 35.2 23.2 13.9 5.0 – 5.9 12.7 5.0 7.9 8.5 12.2 0.013 India 0.7 1.5 2.4 2.7 2.3 3.5 1.1 2.1 1.8 2.3 1.9 2.1 1.6 3.5 3.814 Maldives 52.8 – 4.8 3.3 8.5 16.0 4.5 8.7 7.9 11.2 7.8 14.9 7.6 4.6 11.8 7.915 Nepal 3.2 10.3 10.4 7.4 10.8 10.0 5.7 6.9 9.0 4.1 3.3 4.2 4.6 – 4.2 0.616 Pakistan 4.8 3.6 3.3 4.5 6.3 6.8 3.5 5.1 3.8 3.3 2.2 0.1 0.3 0.8 – 0.917 Sri Lanka 9.5 5.9 9.5 7.1 10.5 10.0 6.2 4.0 3.0 1.2 1.4 2.7 2.9 3.5 4.2
Note: Capital account balance = Change in foreign exchange reserves – Current account balanceSource: World Bank 2005.
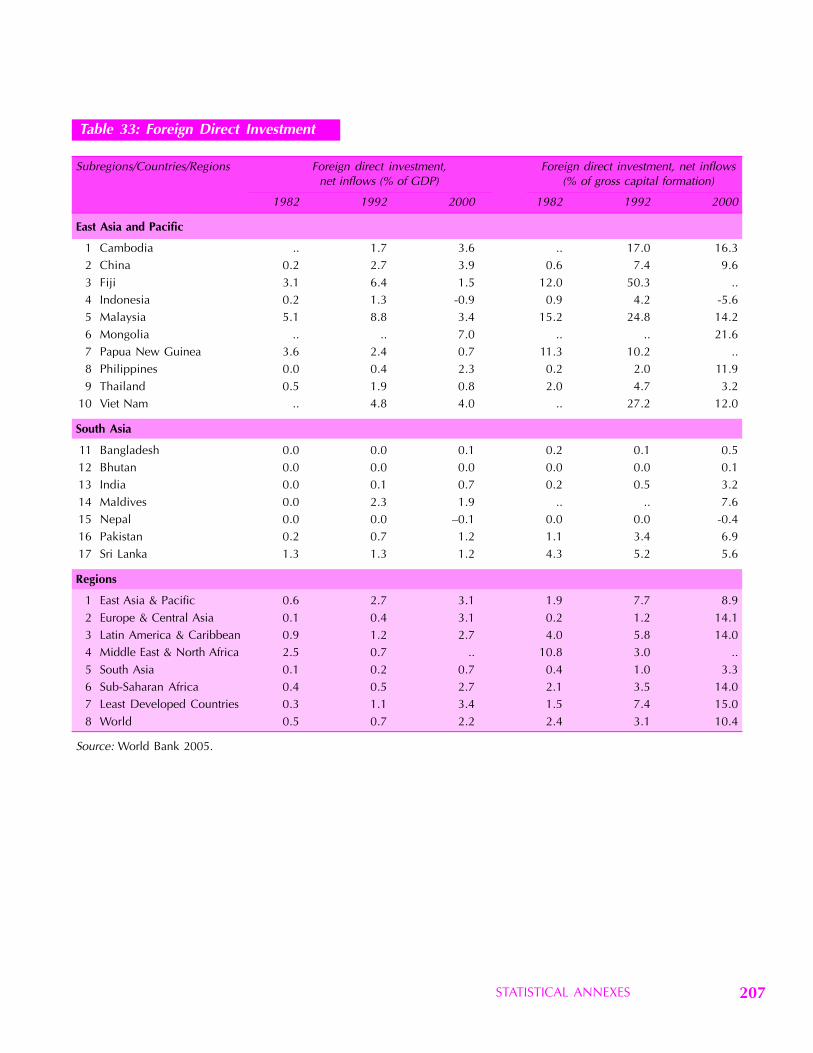
STATISTICAL ANNEXES 207
Table 33: Foreign Direct Investment
Subregions/Countries/Regions Foreign direct investment, Foreign direct investment, net inflowsnet inflows (% of GDP) (% of gross capital formation)
1982 1992 2000 1982 1992 2000
East Asia and Pacific
1 Cambodia .. 1.7 3.6 .. 17.0 16.32 China 0.2 2.7 3.9 0.6 7.4 9.63 Fiji 3.1 6.4 1.5 12.0 50.3 ..4 Indonesia 0.2 1.3 -0.9 0.9 4.2 -5.65 Malaysia 5.1 8.8 3.4 15.2 24.8 14.26 Mongolia .. .. 7.0 .. .. 21.67 Papua New Guinea 3.6 2.4 0.7 11.3 10.2 ..8 Philippines 0.0 0.4 2.3 0.2 2.0 11.99 Thailand 0.5 1.9 0.8 2.0 4.7 3.2
10 Viet Nam .. 4.8 4.0 .. 27.2 12.0
South Asia
11 Bangladesh 0.0 0.0 0.1 0.2 0.1 0.512 Bhutan 0.0 0.0 0.0 0.0 0.0 0.113 India 0.0 0.1 0.7 0.2 0.5 3.214 Maldives 0.0 2.3 1.9 .. .. 7.615 Nepal 0.0 0.0 – 0.1 0.0 0.0 -0.416 Pakistan 0.2 0.7 1.2 1.1 3.4 6.917 Sri Lanka 1.3 1.3 1.2 4.3 5.2 5.6
Regions
1 East Asia & Pacific 0.6 2.7 3.1 1.9 7.7 8.92 Europe & Central Asia 0.1 0.4 3.1 0.2 1.2 14.13 Latin America & Caribbean 0.9 1.2 2.7 4.0 5.8 14.04 Middle East & North Africa 2.5 0.7 .. 10.8 3.0 ..5 South Asia 0.1 0.2 0.7 0.4 1.0 3.36 Sub-Saharan Africa 0.4 0.5 2.7 2.1 3.5 14.07 Least Developed Countries 0.3 1.1 3.4 1.5 7.4 15.08 World 0.5 0.7 2.2 2.4 3.1 10.4
Source: World Bank 2005.
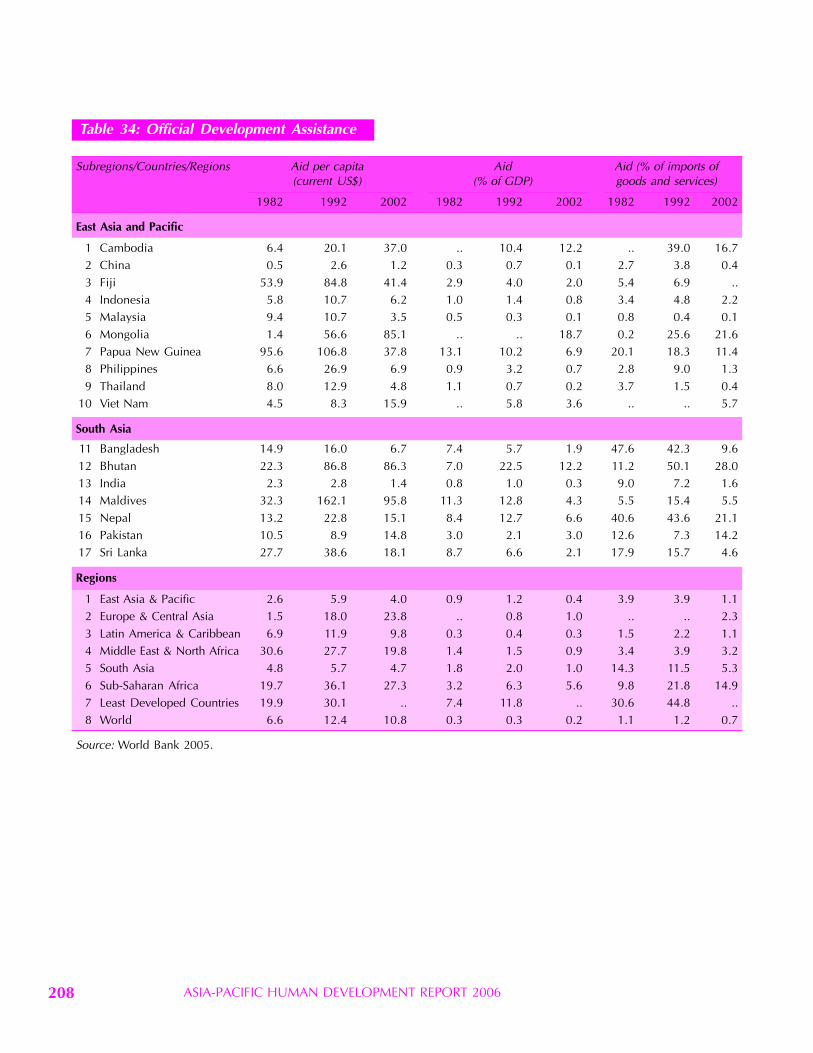
ASIA-PACIFIC HUMAN DEVELOPMENT REPORT 2006208
Table 34: Official Development Assistance
Subregions/Countries/Regions Aid per capita Aid Aid (% of imports of(current US$) (% of GDP) goods and services)
1982 1992 2002 1982 1992 2002 1982 1992 2002
East Asia and Pacific
1 Cambodia 6.4 20.1 37.0 .. 10.4 12.2 .. 39.0 16.72 China 0.5 2.6 1.2 0.3 0.7 0.1 2.7 3.8 0.43 Fiji 53.9 84.8 41.4 2.9 4.0 2.0 5.4 6.9 ..4 Indonesia 5.8 10.7 6.2 1.0 1.4 0.8 3.4 4.8 2.25 Malaysia 9.4 10.7 3.5 0.5 0.3 0.1 0.8 0.4 0.16 Mongolia 1.4 56.6 85.1 .. .. 18.7 0.2 25.6 21.67 Papua New Guinea 95.6 106.8 37.8 13.1 10.2 6.9 20.1 18.3 11.48 Philippines 6.6 26.9 6.9 0.9 3.2 0.7 2.8 9.0 1.39 Thailand 8.0 12.9 4.8 1.1 0.7 0.2 3.7 1.5 0.4
10 Viet Nam 4.5 8.3 15.9 .. 5.8 3.6 .. .. 5.7
South Asia
11 Bangladesh 14.9 16.0 6.7 7.4 5.7 1.9 47.6 42.3 9.612 Bhutan 22.3 86.8 86.3 7.0 22.5 12.2 11.2 50.1 28.013 India 2.3 2.8 1.4 0.8 1.0 0.3 9.0 7.2 1.614 Maldives 32.3 162.1 95.8 11.3 12.8 4.3 5.5 15.4 5.515 Nepal 13.2 22.8 15.1 8.4 12.7 6.6 40.6 43.6 21.116 Pakistan 10.5 8.9 14.8 3.0 2.1 3.0 12.6 7.3 14.217 Sri Lanka 27.7 38.6 18.1 8.7 6.6 2.1 17.9 15.7 4.6
Regions
1 East Asia & Pacific 2.6 5.9 4.0 0.9 1.2 0.4 3.9 3.9 1.12 Europe & Central Asia 1.5 18.0 23.8 .. 0.8 1.0 .. .. 2.33 Latin America & Caribbean 6.9 11.9 9.8 0.3 0.4 0.3 1.5 2.2 1.14 Middle East & North Africa 30.6 27.7 19.8 1.4 1.5 0.9 3.4 3.9 3.25 South Asia 4.8 5.7 4.7 1.8 2.0 1.0 14.3 11.5 5.36 Sub-Saharan Africa 19.7 36.1 27.3 3.2 6.3 5.6 9.8 21.8 14.97 Least Developed Countries 19.9 30.1 .. 7.4 11.8 .. 30.6 44.8 ..8 World 6.6 12.4 10.8 0.3 0.3 0.2 1.1 1.2 0.7
Source: World Bank 2005.
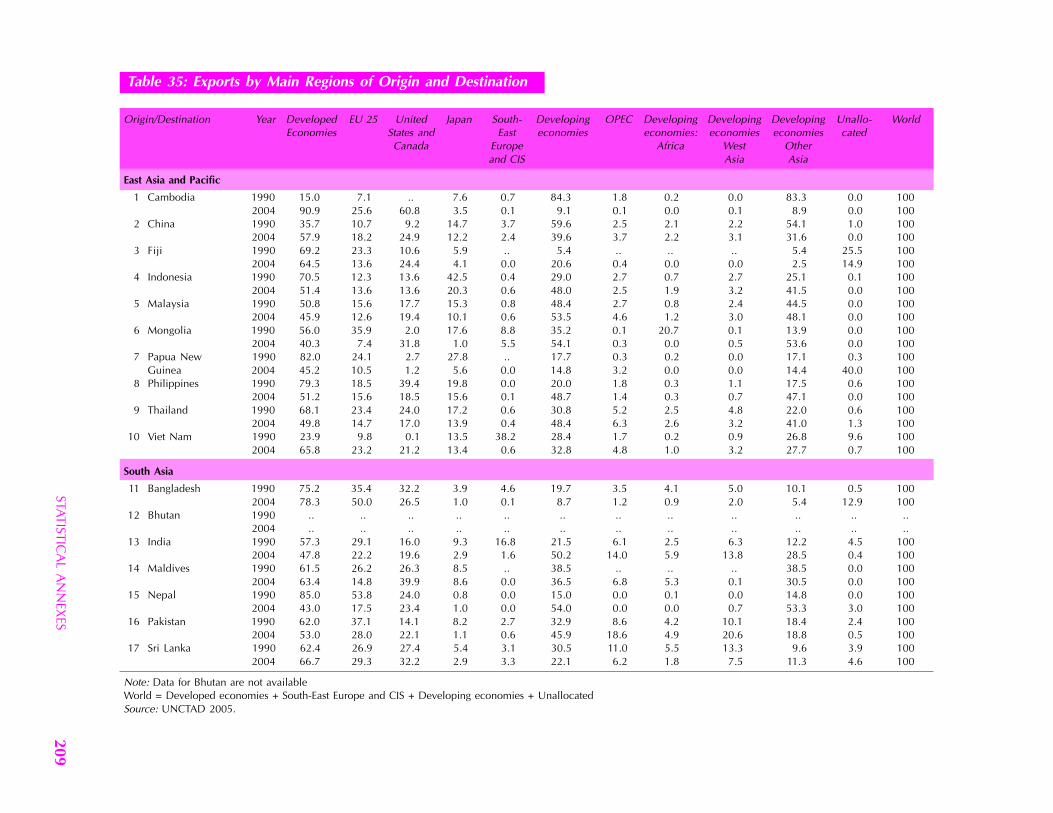
STATISTICA
L AN
NEX
ES209
Table 35: Exports by Main Regions of Origin and Destination
Origin/Destination Year Developed EU 25 United Japan South- Developing OPEC Developing Developing Developing Unallo- WorldEconomies States and East economies economies: economies economies cated
Canada Europe Africa West Otherand CIS Asia Asia
East Asia and Pacific
1 Cambodia 1990 15.0 7.1 .. 7.6 0.7 84.3 1.8 0.2 0.0 83.3 0.0 1002004 90.9 25.6 60.8 3.5 0.1 9.1 0.1 0.0 0.1 8.9 0.0 100
2 China 1990 35.7 10.7 9.2 14.7 3.7 59.6 2.5 2.1 2.2 54.1 1.0 1002004 57.9 18.2 24.9 12.2 2.4 39.6 3.7 2.2 3.1 31.6 0.0 100
3 Fiji 1990 69.2 23.3 10.6 5.9 .. 5.4 .. .. .. 5.4 25.5 1002004 64.5 13.6 24.4 4.1 0.0 20.6 0.4 0.0 0.0 2.5 14.9 100
4 Indonesia 1990 70.5 12.3 13.6 42.5 0.4 29.0 2.7 0.7 2.7 25.1 0.1 1002004 51.4 13.6 13.6 20.3 0.6 48.0 2.5 1.9 3.2 41.5 0.0 100
5 Malaysia 1990 50.8 15.6 17.7 15.3 0.8 48.4 2.7 0.8 2.4 44.5 0.0 1002004 45.9 12.6 19.4 10.1 0.6 53.5 4.6 1.2 3.0 48.1 0.0 100
6 Mongolia 1990 56.0 35.9 2.0 17.6 8.8 35.2 0.1 20.7 0.1 13.9 0.0 1002004 40.3 7.4 31.8 1.0 5.5 54.1 0.3 0.0 0.5 53.6 0.0 100
7 Papua New 1990 82.0 24.1 2.7 27.8 .. 17.7 0.3 0.2 0.0 17.1 0.3 100Guinea 2004 45.2 10.5 1.2 5.6 0.0 14.8 3.2 0.0 0.0 14.4 40.0 100
8 Philippines 1990 79.3 18.5 39.4 19.8 0.0 20.0 1.8 0.3 1.1 17.5 0.6 1002004 51.2 15.6 18.5 15.6 0.1 48.7 1.4 0.3 0.7 47.1 0.0 100
9 Thailand 1990 68.1 23.4 24.0 17.2 0.6 30.8 5.2 2.5 4.8 22.0 0.6 1002004 49.8 14.7 17.0 13.9 0.4 48.4 6.3 2.6 3.2 41.0 1.3 100
10 Viet Nam 1990 23.9 9.8 0.1 13.5 38.2 28.4 1.7 0.2 0.9 26.8 9.6 1002004 65.8 23.2 21.2 13.4 0.6 32.8 4.8 1.0 3.2 27.7 0.7 100
South Asia
11 Bangladesh 1990 75.2 35.4 32.2 3.9 4.6 19.7 3.5 4.1 5.0 10.1 0.5 1002004 78.3 50.0 26.5 1.0 0.1 8.7 1.2 0.9 2.0 5.4 12.9 100
12 Bhutan 1990 .. .. .. .. .. .. .. .. .. .. .. ..2004 .. .. .. .. .. .. .. .. .. .. .. ..
13 India 1990 57.3 29.1 16.0 9.3 16.8 21.5 6.1 2.5 6.3 12.2 4.5 1002004 47.8 22.2 19.6 2.9 1.6 50.2 14.0 5.9 13.8 28.5 0.4 100
14 Maldives 1990 61.5 26.2 26.3 8.5 .. 38.5 .. .. .. 38.5 0.0 1002004 63.4 14.8 39.9 8.6 0.0 36.5 6.8 5.3 0.1 30.5 0.0 100
15 Nepal 1990 85.0 53.8 24.0 0.8 0.0 15.0 0.0 0.1 0.0 14.8 0.0 1002004 43.0 17.5 23.4 1.0 0.0 54.0 0.0 0.0 0.7 53.3 3.0 100
16 Pakistan 1990 62.0 37.1 14.1 8.2 2.7 32.9 8.6 4.2 10.1 18.4 2.4 1002004 53.0 28.0 22.1 1.1 0.6 45.9 18.6 4.9 20.6 18.8 0.5 100
17 Sri Lanka 1990 62.4 26.9 27.4 5.4 3.1 30.5 11.0 5.5 13.3 9.6 3.9 1002004 66.7 29.3 32.2 2.9 3.3 22.1 6.2 1.8 7.5 11.3 4.6 100
Note: Data for Bhutan are not availableWorld = Developed economies + South-East Europe and CIS + Developing economies + UnallocatedSource: UNCTAD 2005.
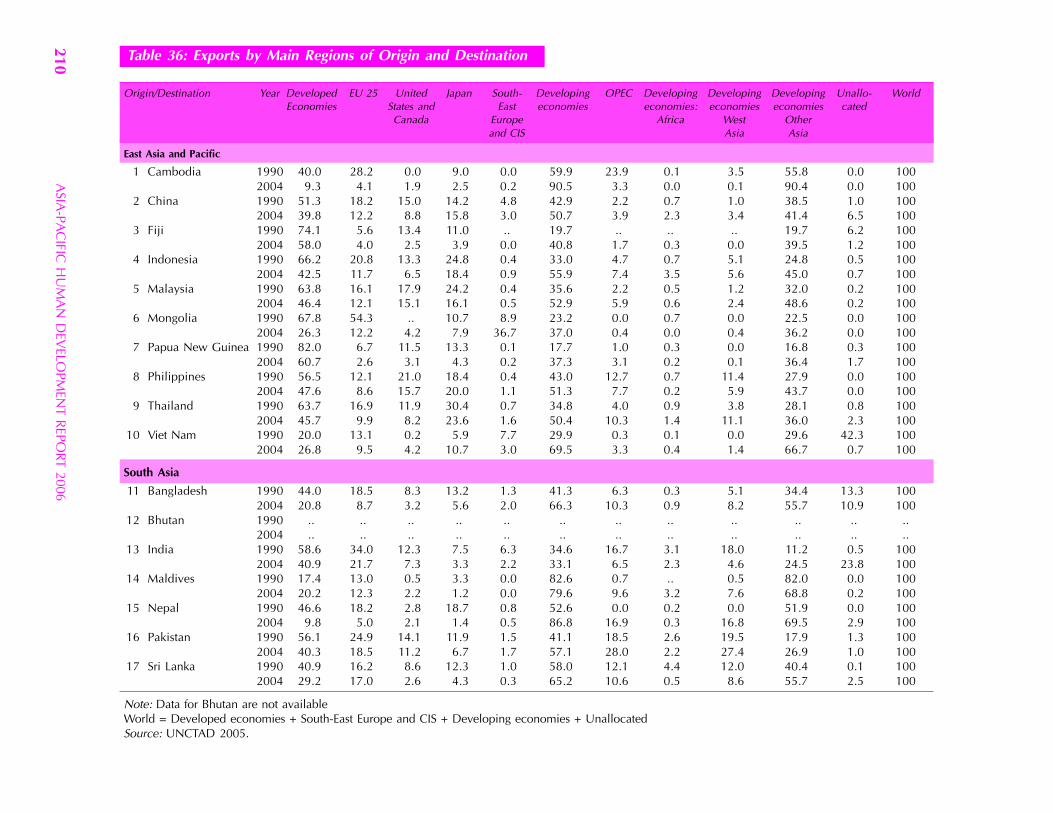
ASIA
-PAC
IFIC H
UM
AN
DEV
ELOPM
ENT R
EPORT 2006
210 Table 36: Exports by Main Regions of Origin and Destination
Origin/Destination Year Developed EU 25 United Japan South- Developing OPEC Developing Developing Developing Unallo- WorldEconomies States and East economies economies: economies economies cated
Canada Europe Africa West Otherand CIS Asia Asia
East Asia and Pacific
1 Cambodia 1990 40.0 28.2 0.0 9.0 0.0 59.9 23.9 0.1 3.5 55.8 0.0 1002004 9.3 4.1 1.9 2.5 0.2 90.5 3.3 0.0 0.1 90.4 0.0 100
2 China 1990 51.3 18.2 15.0 14.2 4.8 42.9 2.2 0.7 1.0 38.5 1.0 1002004 39.8 12.2 8.8 15.8 3.0 50.7 3.9 2.3 3.4 41.4 6.5 100
3 Fiji 1990 74.1 5.6 13.4 11.0 .. 19.7 .. .. .. 19.7 6.2 1002004 58.0 4.0 2.5 3.9 0.0 40.8 1.7 0.3 0.0 39.5 1.2 100
4 Indonesia 1990 66.2 20.8 13.3 24.8 0.4 33.0 4.7 0.7 5.1 24.8 0.5 1002004 42.5 11.7 6.5 18.4 0.9 55.9 7.4 3.5 5.6 45.0 0.7 100
5 Malaysia 1990 63.8 16.1 17.9 24.2 0.4 35.6 2.2 0.5 1.2 32.0 0.2 1002004 46.4 12.1 15.1 16.1 0.5 52.9 5.9 0.6 2.4 48.6 0.2 100
6 Mongolia 1990 67.8 54.3 .. 10.7 8.9 23.2 0.0 0.7 0.0 22.5 0.0 1002004 26.3 12.2 4.2 7.9 36.7 37.0 0.4 0.0 0.4 36.2 0.0 100
7 Papua New Guinea 1990 82.0 6.7 11.5 13.3 0.1 17.7 1.0 0.3 0.0 16.8 0.3 1002004 60.7 2.6 3.1 4.3 0.2 37.3 3.1 0.2 0.1 36.4 1.7 100
8 Philippines 1990 56.5 12.1 21.0 18.4 0.4 43.0 12.7 0.7 11.4 27.9 0.0 1002004 47.6 8.6 15.7 20.0 1.1 51.3 7.7 0.2 5.9 43.7 0.0 100
9 Thailand 1990 63.7 16.9 11.9 30.4 0.7 34.8 4.0 0.9 3.8 28.1 0.8 1002004 45.7 9.9 8.2 23.6 1.6 50.4 10.3 1.4 11.1 36.0 2.3 100
10 Viet Nam 1990 20.0 13.1 0.2 5.9 7.7 29.9 0.3 0.1 0.0 29.6 42.3 1002004 26.8 9.5 4.2 10.7 3.0 69.5 3.3 0.4 1.4 66.7 0.7 100
South Asia
11 Bangladesh 1990 44.0 18.5 8.3 13.2 1.3 41.3 6.3 0.3 5.1 34.4 13.3 1002004 20.8 8.7 3.2 5.6 2.0 66.3 10.3 0.9 8.2 55.7 10.9 100
12 Bhutan 1990 .. .. .. .. .. .. .. .. .. .. .. ..2004 .. .. .. .. .. .. .. .. .. .. .. ..
13 India 1990 58.6 34.0 12.3 7.5 6.3 34.6 16.7 3.1 18.0 11.2 0.5 1002004 40.9 21.7 7.3 3.3 2.2 33.1 6.5 2.3 4.6 24.5 23.8 100
14 Maldives 1990 17.4 13.0 0.5 3.3 0.0 82.6 0.7 .. 0.5 82.0 0.0 1002004 20.2 12.3 2.2 1.2 0.0 79.6 9.6 3.2 7.6 68.8 0.2 100
15 Nepal 1990 46.6 18.2 2.8 18.7 0.8 52.6 0.0 0.2 0.0 51.9 0.0 1002004 9.8 5.0 2.1 1.4 0.5 86.8 16.9 0.3 16.8 69.5 2.9 100
16 Pakistan 1990 56.1 24.9 14.1 11.9 1.5 41.1 18.5 2.6 19.5 17.9 1.3 1002004 40.3 18.5 11.2 6.7 1.7 57.1 28.0 2.2 27.4 26.9 1.0 100
17 Sri Lanka 1990 40.9 16.2 8.6 12.3 1.0 58.0 12.1 4.4 12.0 40.4 0.1 1002004 29.2 17.0 2.6 4.3 0.3 65.2 10.6 0.5 8.6 55.7 2.5 100
Note: Data for Bhutan are not availableWorld = Developed economies + South-East Europe and CIS + Developing economies + UnallocatedSource: UNCTAD 2005.
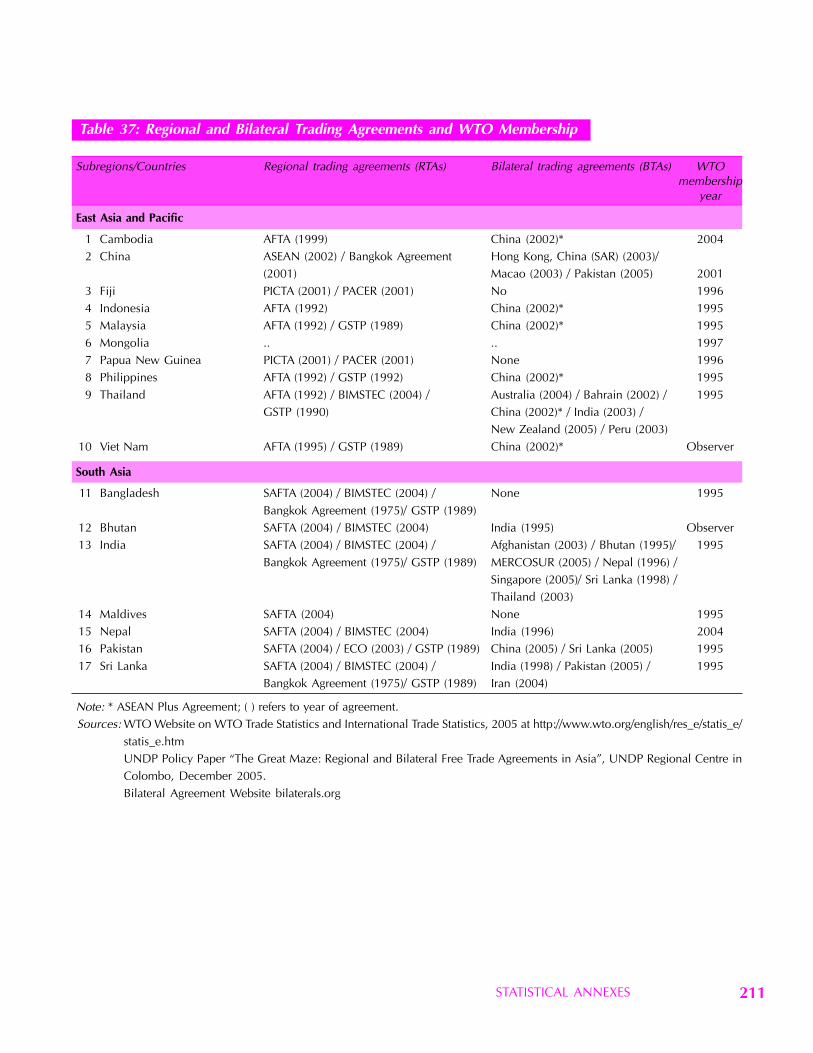
STATISTICAL ANNEXES 211
Table 37: Regional and Bilateral Trading Agreements and WTO Membership
Subregions/Countries Regional trading agreements (RTAs) Bilateral trading agreements (BTAs) WTOmembership
year
East Asia and Pacific
1 Cambodia AFTA (1999) China (2002)* 20042 China ASEAN (2002) / Bangkok Agreement Hong Kong, China (SAR) (2003)/
(2001) Macao (2003) / Pakistan (2005) 20013 Fiji PICTA (2001) / PACER (2001) No 19964 Indonesia AFTA (1992) China (2002)* 19955 Malaysia AFTA (1992) / GSTP (1989) China (2002)* 19956 Mongolia .. .. 19977 Papua New Guinea PICTA (2001) / PACER (2001) None 19968 Philippines AFTA (1992) / GSTP (1992) China (2002)* 19959 Thailand AFTA (1992) / BIMSTEC (2004) / Australia (2004) / Bahrain (2002) / 1995
GSTP (1990) China (2002)* / India (2003) /New Zealand (2005) / Peru (2003)
10 Viet Nam AFTA (1995) / GSTP (1989) China (2002)* Observer
South Asia
11 Bangladesh SAFTA (2004) / BIMSTEC (2004) / None 1995Bangkok Agreement (1975)/ GSTP (1989)
12 Bhutan SAFTA (2004) / BIMSTEC (2004) India (1995) Observer13 India SAFTA (2004) / BIMSTEC (2004) / Afghanistan (2003) / Bhutan (1995)/ 1995
Bangkok Agreement (1975)/ GSTP (1989) MERCOSUR (2005) / Nepal (1996) /Singapore (2005)/ Sri Lanka (1998) /Thailand (2003)
14 Maldives SAFTA (2004) None 199515 Nepal SAFTA (2004) / BIMSTEC (2004) India (1996) 200416 Pakistan SAFTA (2004) / ECO (2003) / GSTP (1989) China (2005) / Sri Lanka (2005) 199517 Sri Lanka SAFTA (2004) / BIMSTEC (2004) / India (1998) / Pakistan (2005) / 1995
Bangkok Agreement (1975)/ GSTP (1989) Iran (2004)
Note: * ASEAN Plus Agreement; ( ) refers to year of agreement.Sources: WTO Website on WTO Trade Statistics and International Trade Statistics, 2005 at http://www.wto.org/english/res_e/statis_e/
statis_e.htmUNDP Policy Paper “ The Great Maze: Regional and Bilateral Free Trade Agreements in Asia” , UNDP Regional Centre inColombo, December 2005.Bilateral Agreement Website bilaterals.org
DEFINITIONS OF TECHNICAL TERMS 215
Ad valorem duties (tariffs) Is calculated as apercentage of the value of the dutiable items.Contrasts with a specific tariff.
Anti-dumping duties May be imposed ifexport dumping causes injury to producers ofcompeting goods in an importing country. Theduties should be equal to the difference betweenthe export price and the normal value of thedumped goods.
Balance of trade Refers to the differencebetween the value of exports and imports. It iscalculated as the value of exports of goods andservices minus the value of imports of goodsand services.
Balance of payments Records all flows ofmoney in and out of a given country. Theseflows might result from the sale of exports (aninflow or credit) or from the country’s purchaseof imports from overseas (an outflow or debit).They might also arise from other countriesinvesting in the country (inward investment – acredit), or from country’s companies investingabroad (a debit). All flows of money are addedtogether and grouped according to their type.The overall account is then called the balanceof payments – principally because the total ofoutflows must be equivalent to the total ofinflows. The balance of payments thereforebalances.
Blue Box Comprises measures regarded asexceptions to the general rule that all subsidieslinked to production must be reduced or keptwithin defined minimal levels. Covers paymentsdirectly linked to land size or livestock as longas the activity being supported limitsproduction.
Common external tariff Refers to a tariff rateapplied by a regional grouping of countries as aunit.
Definitions of Technical Terms
Dumping Occurs when goods are exported ata price less than their normal value, generallymeaning that they are exported for less thanthey are sold in the domestic market or third-country markets, or at less than cost ofproduction.
Employment elasticity Is the percentagechange in employment resulting from a one percent change in economic growth.
EU Common Agricultural Policy Refers to thesystem of European Union agricultural subsidiesthat guarantees a minimum price to producersand pays a subsidy for crops planted.
An export processing zone (EPZ) Eases taxand labour restrictions. Its primary purpose isto generate export revenues in poor developingcountries. It is largely identical to a free tradezone.
Extreme poverty Is the most severe state ofpoverty, where people have minimal or verylimited access to basic necessities, such as food,clothing, shelter, education and health care. TheWorld Bank defines extreme poverty as livingon $1 or less per day, and estimates that 1.1billion people currently live under theseconditions. Eradication of extreme poverty andhunger by 2015 is a Millennium DevelopmentGoal.
Financial liberalization Refers to a series ofregulatory changes that allow foreign investorsto buy domestic assets and allows domesticcitizens to invest in foreign assets which makethe domestic securities market an integral partof the world market. The process is mainlydefined as a series of regulatory changes thatopen up the capital markets to foreign investorswith the introduction of depository receipts,country funds or equity capital flows to theemerging economy.
ASIA-PACIFIC HUMAN DEVELOPMENT REPORT 2006216
GATS framework Is the General Agreementof Trade in Services. It covers four ‘modes ofsupply” for the delivery of services in cross-border trade:
• Mode 1, cross border trade – which isdefined as delivery of a service from theterritory of one country into the territoryof the other country;
• Mode 2, consumption abroad – whichcovers supply of a service of one country tothe service consumer of any other country;
• Mode 3, commercial presence – whichcovers services provided by a servicesupplier of one country in the territory ofany other country; and
• Mode 4, presence of natural persons –which covers services provided by a servicesupplier of one country through thepresence of natural persons in the territoryof any other country.
A ‘Natural Person’ is a human being, as distinctfrom a legal person such as a company ororganization. Countries can freely decide whereto liberalize on a sector-by-sector basis,including which specific mode of supply theywant to cover for a given sector.
Gross Domestic Product (GDP) Is gross valueadded, at purchasers’ prices, by all residentproducers in the economy plus any taxes andminus any subsidies not included in the value ofthe products. It is calculated without deductingfor depreciation of fabricated assets or fordepletion or degradation of natural resources.Value added is the net output of an industryafter adding up all outputs and subtractingintermediate inputs.
Gender Is a social construct regarding culture-bound conventions, roles and behaviours for, aswell as relationships between and among,women and men and boys and girls.
Generalized System of Preferences (GSP) Aimsto encourage developing countries’ exports byallowing their products preferential access tothe markets of developed countries. Althoughdonor countries are under no obligation in inter-national law to give preferences, almost all
developed countries operate GSP schemes; how-ever, the schemes they offer vary significantly.
Green Box Contains income support andsubsidies that are expected to cause little or notrade distortion. Subsidies have to be funded bygovernments but must not involve pricesupport. Environmental protection subsidies areincluded. No limits or reductions are requiredfor such income support or subsidies.
Gini coefficient (index) Measures the extentto which the distribution of income (orconsumption) among individuals or householdswithin a country deviates from a perfectly equaldistribution. A value of ‘zero’ represents perfectequality, while a value of ‘one’ representsperfect inequality.
Globalization For the purposes of this report,refers to the generalized expansion ofinternational economic activity, which includesincreased international trade, growth ofinternational investment (foreign investment)and international migration, and increasedproliferation of technology among countries.Globalization is thus the increasing worldwideintegration of markets for goods, services,labour, and capital.
Headcount ratio Is also known as the povertyincidence or headcount index. It measures theshare of the total population in a given areawhose consumption is below the poverty line.In other words, it is the proportion of thepopulation who cannot afford to purchase thebasic basket of goods and services.
Infant mortality rate Is the probability ofdying between birth and exactly one year ofage, expressed in terms of per 1,000 live births.
Intellectual property rights Is a generic phraseencompassing intangible property rights,including, among others, patents, trade andservice marks, copyrights, industrial designs,rights in semiconductor chip layout designs, andrights in trade secrets.
Least Developed Countries (LDCs) Arecountries which, according to the United
DEFINITIONS OF TECHNICAL TERMS 217
Nations, exhibit the lowest indicators ofsocioeconomic development. A country isclassified as a Least Developed Country if itmeets three criteria based on:
• Low-income (GNI per capita of less than$750)
• Human resource weakness (based onindicators of nutrition, health, educationand adult literacy)
• Economic vulnerability (based on instabilityof agricultural production, instability ofexports of goods and services, economicimportance of non-traditional activities,merchandise export concentration, andhandicap of economic smallness, and thepercentage of population displaced bynatural disasters).
Life expectancy at birth Is the number of yearsa newborn infant would live if prevailingpatterns of age-specific mortality rates at thetime of birth were to stay the same throughoutthe child’s life.
Low- and middle-income developing countriesAre defined on the basis of per capita grossnational income (GNI), based on the approachused by the World Bank. Based on GNI percapita for 2004, the groups are: low-income,$825 or less; lower middle-income, $826–$3,255; upper middle-income, $3,256–$10,065;and high income, $10,066 or more.
Maternal mortality ratio Is the annual numberof deaths of women from pregnancy-relatedcauses per 100,000 live births.
Multifibre Arrangement (MFA) Also knownas Agreement on Textile and Clothing (ATC),governed the world trade in textiles andgarments from 1974 through 2004, imposingquotas on the amount developing countriescould export to developed countries. It expiredon 1 January 2005.
Most-favoured-nation (MFN) Is a commit-ment that a country will extend to anothercountry the lowest tariff rates it applies to anyother country. All WTO contracting partiesundertake to apply such treatment to one
another under A`rticle I of the GATT. When acountry agrees to cut tariffs on a particularproduct imported from one country, the tariffreduction automatically applies to imports ofthat product from any other country eligible formost-favoured-nation treatment.
Newly industrializing economies (NIEs) Aterm originated by the Organization forEconomic Cooperation and Development(OECD), describes economies of the ThirdWorld that have enjoyed rapid economicgrowth and can be described as ‘middle-income’economies. The term was first applied to HongKong (China), Singapore, the Republic ofKorea, and Taiwan (China), but it is oftenextended to other economies.
Outsourcing of business processes Is theleveraging of third party technology or specialistprocess vendors to provide and manage anorganisation’s enterprise processes andapplications. In these contracts the provider isresponsible for performing and managing theoutsourced function or process on behalf of thecustomer. Business process outsourcingcontracts generally involve the provider takingoverall responsibility for the business processand not just supplying IT applications orservices to facilitate the process. Throughbusiness process outsourcing, vendors provideand manage a company’s critical and/or non-critical enterprise applications. The mostcommon examples of such arrangements arecall-centres, human resources, accounting andpayroll outsourcing. Business processoutsourcing may involve the use of off-shoreresources.
Plant variety protection (PVP) Is a synonymfor plant breeders’ rights (PBR). It is the legalprotection of a new plant variety granted to thebreeder or his successor in title. The effect ofPBR is that prior authorization is requiredbefore the material can be used for commercialpurposes.
Poverty gap Provides information on how farthe consumption of poor people is from thepoverty line – i.e. the depth of poverty. Moretechnically, the measure captures the average
ASIA-PACIFIC HUMAN DEVELOPMENT REPORT 2006218
expenditure shortfall, or gap. It is obtained byadding up all the shortfalls of the poor (ignoringthe non-poor) and dividing this total by thenumber of poor. The poverty gap thus measuresthe consumption deficit of the population, orthe resources that would be needed to lift allthe poor out of poverty through perfectlytargeted cash transfers.
Preferential treatment Refers to tradepreferences that have long been an instrumentof foreign and commercial policy, employed toestablish closer relations, both economic andpolitical, between the countries concerned.Preferential treatment by developed countriesof imports from developing countries has, inaddition, become a firm element ofdevelopment-oriented policies. The variousexisting regimes of trade preferences fordeveloping countries can be classified into threemajor categories: (i) the Generalized System ofPreferences (GSP); (ii) special preferentialregimes for groups of developing countries; and(iii) regional free-trade arrangements betweenindividual developed countries and given groupsof developing countries.
Regional integration Refers to the formationof closer economic linkages among countriesthat are geographically near each other, especi-ally by forming preferential trade agreements.
Small-island developing states (SIDS) Includelow-lying coastal countries that share similarsustainable-development challenges, includingsmall populations, lack of resources, remote-ness, susceptibility to natural disasters, excessivedependence on international trade and vulner-ability to global developments. In addition, theysuffer from lack of economies of scale, hightransportation and communication costs, andcostly public administration and infrastructure.
Special and differential treatment Is theprinciple in the WTO that developing countriesbe accorded special privileges, either exemptingthem from some WTO rules or granting thempreferential treatment in the application ofWTO rules.
Tax-to-GDP ratio Refers to taxes and social
security contributions as a percentage of GDP.This indicator is widely used to measure theoverall tax burden.
Total factor productivity (TFP) Often referredto as the ‘Solow residual’, addresses any effectsin total output not caused by inputs orproductivity. In terms of a standard Cobb-Douglas production function –
Y = AKαL1 – α
where Y represents total output as a function oftotal-factor productivity (A), capital input (K),labour input (L), and the two inputs’ respectiveshares of output. Technology growth andefficiency are regarded as two of the biggestfactors affecting TFP, the former possessing‘special’ inherent features such as positiveexternalities and non-rivalness which enhanceits position as a driver of economic growth.TFP is seen as the real driver of growth withinan economy, and studies reveal that whilstlabour and investment are important contri-butors, TFP accounts for up to as much as 60per cent of growth within economies.
Trade diversion Occurs when a trade reformmeasure discriminates between different tradingpartners and a less efficient (higher cost) sourcedisplaces a more efficient (lower cost) one. Canarise whenever some preferred suppliers arefreed from barriers but others are not.
Tradable goods Are goods that have exportor import potential. The possibility of theirbeing traded abroad sets up a continuouscomparison between their price and that of theiroverseas competitors.
Trade liberalization Is the removal of barriersto free trade, such as tariffs, quotas, nominaland effective rates of protection and exchangecontrols.
Trade Related Investment Measures (TRIMs)Is one of Agreements covered under Annex IAto the Marrakech Agreement, signed at the endof the Uruguay Round negotiations. TheAgreement addresses investment measures thatare trade related and that also violate Article III
DEFINITIONS OF TECHNICAL TERMS 219
(National treatment) or Article XI (generalelimination of quantitative restrictions) of theGeneral Agreement on Tariffs and Trade.
Trade-Related Aspects of Intellectual PropertyRights (TRIPS) Is an international treatyunder the World Trade Organization (WTO),which sets down minimum standards ofintellectual property for all products andservices, covering copyrights, trademarks,geographical indications, industrial designs,integrated circuits, patents and trade secrets.
Trade-to-GDP ratio Is the sum of imports andexports as a proportion of GDP.
Value added tax Is similar to a sales tax in
that it is levied at the time of the sale of goodsand services. In some countries, includingAustralia, Canada, New Zealand, andSingapore, this tax is known as ‘goods andservices tax’ or GST; and in Japan it is knownas ‘consumption tax’. VAT is an indirect tax, inthat the tax is collected from someone otherthan the person who actually bears the cost ofthe tax (namely the seller rather than theconsumer).
Venture Capital Fund Is a pooled investmentvehicle (often a partnership) that primarilyinvests the financial capital of third-partyinvestors in enterprises that are too riskyfor the standard capital markets or bankloans.
NOTES 153
Chapter 1
1. WTO 2005a.
2. Ranis and Stewart 2005.
3. World Bank 2005.
4. Kelsey 2004.
5. Rodriguez and Rodrik 1999.
6. Patnaik and Chandrasekhar 1996.
7. Other studies also confirm this. For example, see
Levine and Renelt (1992) and Wacziarg (2001).
8. The distinctions between the roles of the WTO
Secretariat, the limitations of the Agreements and
the rigid positions of some of the WTO members
are not always well understood.
9. An earlier, very similar conceptualization in the
context of trade may be seen in Waglé and Gibbs
(2003), which was later incorporated in Montes
and Memis (2005). The idea originates from
Mahbub ul-Haq (1995).
Chapter 2
1. World Bank 2005.
2. World Bank 2005.
3. UNCTAD 1999a; 1999b.
4. Santos-Paulino and Thirlwall 2004.
5. UNCTAD 2004a.
6. Dollar and Kraay 2001; Rodriguez and Rodrik
1999.
7. Hossain 2001; Keong et al. 2003.
8. Acharya and Chaudhri 2001.
9. World Bank 2005.
10. This slow progress has contributed to slow pro-
gress at the international level. In 2002, there were
815 million hungry people in the world, according
to the United Nations (2005). FAO estimates show
that since the World Food Summit benchmark
period of 1990-92, the number of hungry in the
world has declined by only 9 million. ‘More alarm-
ing still, the number has actually increased over
the most recent five years for which numbers are
available. In three of the four developing regions,
more people were undernourished in 2000–2002
Notes
than had been the case in 1995–97. Only Latin
America and the Caribbean registered a modest
reduction in the number of hungry people’ (FAO
2004a).
11. FAO 2004a; 2004b.
12. Over the 1990–92 to 2000–02 period as a whole,
the proportion of people living with insufficient
food declined from 25 to 22 per cent in South
Asia, from 18 to 13 per cent in South-East Asia
and from 16 to 11 per cent in East Asia. As a
result, in East and South-East Asia the number of
hungry people declined by 47 and 12 million
respectively, while in South Asia it rose by 15
million. (United Nations 2005).
13. United Nations 2005.
14. United Nations 2005.
15. United Nations 2005.
16. United Nations 2005.
17. United Nations 2005.
18. Reinert 2005.
19. Palanivel 2006.
Chapter 3
1. FAO 2004b.
2. FAO 2004a.
3. FAO 2004a.
4. FAO 2004a.
5. FAO 2004a.
6. Einarsson 2001.
7. Aksoy 2005.
8. OECD 2005.
9. The ‘Green Box’ is the term used to denote domes-
tic support policies that are not subject to reduc-
tion commitments under the Agreement on
Agriculture. These policies are said to affect trade
minimally, and include support such as research,
extension, food security stocks, disaster payments,
and structural adjustment programmes. Direct
payments to producers delinked from production
(decoupled payments) also fall under the Green
Box.
ASIA-PACIFIC HUMAN DEVELOPMENT REPORT 2006154
10. The ‘Blue Box’ denotes the set of provisions in the
Agreement on Agriculture that exempts from
reduction commitments those payments to
producers received under production limiting
programmes – if they are based on fixed area and
yields or a fixed number of head of livestock, or if
they are made on 85 per cent or less of base level
of production.
11. The full cost of production for soybeans was $7.34
per bushel in 2002, but the product was exported
at $5.48 per bushel. Maize, which cost $3.08 per
bushel to produce, was exported at $2.69 per
bushel, and rice was exported at $11.80 though it
was produced at a cost of $18.26 per bushel (IATP
2004).
12. FAO 2004c.
13. FAO 2004c.
14. Dhar 2004a.
15. Aksoy 2005.
16. FAO 2004c.
17. FAO 2004a.
18. FAO 2003a.
19. Bhattasali, Li and Martin 2004.
20. Madeley 2000; FAO 1999a.
21. FAO 1999a.
22. FAO 2004b.
23. It was only recently, in 2002, that Nepal’s civil
code of 1963 was amended giving women better
property rights, like allowing them to inherit an
equal share in their husband’s property without
qualification of age or duration of marriage and
retention of rights after widowhood or remarriage.
24. Anderson 2003.
25. McCulloch 2004.
26. Dillon 2001.
27. Conroy, Murray and Rosset 1996.
28. Following trade negotiations crafted by the
General Council of the WTO in July 2004, the
‘basic concepts, principles and effectiveness’ of the
Green Box remain untouched, subject to a review
to ensure that its trade-distorting effects are
‘minimal’. Further, not only were members allowed
to take recourse to existing forms of Blue Box
support, but new measures were to be negotiated
subject to the condition that such payments will be
less trade-distorting than aggregate measure of
support measures.
29. This primarily came in the form of an agreement
to substantially reduce, based on negotiations, the
sum total of Final Bound levels of the Aggregate
Measure of Support (AMS), de minimis (or
minimal acceptable) support and Blue Box
measures. Such reduction was to occur through a
tiered formula involving larger reductions by those
currently providing higher levels of support,
leading to some ‘harmonization’ of support levels.
In particular, the framework required that there
would be a minimal reduction in such support to
80 per cent of preexisting levels in the first year
and throughout the period of implementation.
Finally, while a major compromise in the form of
the continuation of the Blue Box had been made,
a promise to cap Blue Box support at 5 per cent of
the value of production had been included.
30. This definition draws on two established concepts,
Indication of Source (IS) and Appellation of Origin
(AO), which trace their formal origins to the 1893
Paris Convention and the 1958 Lisbon Convention
on Appellations of Origin and their Registration
respectively. IS refers generally to any expression
or sign used to indicate that a product originates
in a country, or a specific place (e.g., Made in
Mongolia), while AO refers to the geographical
name of a country or locality (e.g., Champagne),
which serves to designate a product originating
therein whose characteristics are exclusively or
essentially due to that geographical environment.
While all Appellations of Origin are clearly
Indications of Source, the converse is not
necessarily true.
31. UNDP 1999.
32. Consumers International 2005.
33. This imbalance in the TRIPS agreement was a
result of deals done between major players at the
1990 Brussels Ministerial Conference. At that
point, few developing countries showed much
interest in GIs. A coalition of developing and
developed countries is now, therefore, seeking to
redress this imbalance by extending additional
protection to products other than wines and
spirits. They clearly have equity and logic on their
side, though they are struggling to prove that
weaker protection has actually caused economic
losses (Rangnekar 2003).
34. WTO 2002a.
35. FAO 2005.
36. FAO, FISHSTAT Online Database.
37. FAO 1999b.
NOTES 155
38. FAO 2000.
39. FAO 2003b.
40. FAO 2002.
41. They now use the Hazard Analysis and Critical
Control Point (HACCP) systems. The international
regulatory framework for fish safety and quality is
embodied in the WTO agreements on the
application of Sanitary and Phytosanitary (SPS)
Measures and Technical Barriers to Trade (TBT),
and the standards, guidelines and
recommendations developed by the relevant
committees of the Codex Alimentarius. These
safety and quality concepts are also enshrined in
the Code of Conduct for Responsible Fisheries,
particularly Articles 6 and 11 (FAO 2004). The
HACCP-based food safety and quality system has
been fully enforced from December 1999 in the US
and is also part of the EU food safety standard. In
December 2000, the EU introduced residue-
monitoring requirements for veterinary medicines
in fisheries products from third countries. In
March 2001, it further introduced requirements
for monitoring heavy metal contamination in a
wide range of foods, including fish products.
42. Humpal and Guenette 2000.
43. FAO 1998.
44. Scharer 2001.
45. WTO 2001a.
46. UNDP 1999.
47. While enforcing GI provisions will cost much less,
the fact that GIs are part of the IP parcel (together
with patents, trade-marks, and copyrights) means
that an isolated assessment of its separate
implementation is difficult. It has been noted,
however, within TRIPS it is the enforcement of IPs
like patents and copyrights that are more expensive
(and more likely to be foreign-owned) than GIs.
48. Costa-Pierce 2002.
Chapter 4
1. European Commission 2003.
2. Diao and Somwaru 2001.
3. ILO 2005b.
4. ATMI 2003.
5. Since the publication of the ATMI report, the EU
membership has expanded with the accession of
10 new member states. The enlarged EU spends
more on imports of textile and clothing than the
US as a study by Adhikari and Yamamoto (2006)
illustrates.
6. UNCTAD WITS-TRAINS Database.
7. Diao and Somwaru 2001.
8. Waglé 2005.
9. Jha 2003.
10. The process of abolishing quotas and freeing trade
in textiles and clothing was in fact ‘end-loaded’,
defeating the purpose of the ten-year transitional
period.
11. Jahan 2000.
12. ITCB 2003.
13. Jahan 2000.
14. Adhikari and Yamamoto 2006.
15. ILO 2005b.
16. Khondker et al. 2005.
17. Khondker et al. 2005.
18. Ahmed et al. 2005.
19. Brooke 2004.
20. ICFTU 2005.
21. Kathuria, Martin and Bhardwaj 2001.
22. Adhikari and Yamamoto 2006.
23. Siegmann 2006.
24. Udagedara 2003.
25. ILO 2005b.
26. WTO 2003a.
Chapter 5
1. Rajivan 2004; 2005.
2. This chapter focuses on the human development
implications of three types of service – involving
movement of the seller, the buyer or the services
themselves. Of course, there are other types of
services, such as environmental services (water and
sanitation, telcom, energy services, health services,
education and financial services, etc.), many of
which also have positive and negative human
development implications. Due to limitations of
space and time, a collective decision was taken to
limit the scope of this chapter. The human
development implications of these other services
could be a useful area for research.
3. Huy et al. 2003.
4. Chanda 2003a; Ghosh 2004.
5. DOLE 2001; Buchan and Sochalski 2003.
6. Manalansan 2002.
7. Chanda 2004.
8. WTO 2005b.
ASIA-PACIFIC HUMAN DEVELOPMENT REPORT 2006156
9. NASSCOM-Hewitt 2003.
10. Kearney 2004.
11. Richards and Margolis 2004.
12. Economic Times 2002.
13. UNCTAD 2003a.
14. World Tourism Organisation 2005a; 2005b.
15. ILO 2005c.
Chapter 6
1. The precise definition for an LDC is available in
Voices of the Least Developed Countries of Asia
and the Pacific, UNDP/UNESCAP, 2005.
2. UNDP and UNESCAP 2005.
3. UNCTAD 2004a.
4. World Bank 2004a.
5. UNCTAD 2004a.
6. Winters and Martins 2004.
7. Thomas 2004.
8. UNDP 2005a.
9. WTO 2001d.
10. The export concentration index takes a value
between zero and 1, where zero represents the
lowest concentration and 1 represents the highest.
While the non-LDC world average is 0.2 for the
1990s, Kiribati had a concentration index of 0.73
in 1995. See Commonwealth Secretariat and
UNCTAD (2001).
11. Adhikari 2004.
12. WTO 2005b.
13. Adhikari 2003.
14. WTO 2001a.
15. WTO 2003a.
16. Kanniah 2003.
17. Ognivtsev et al. 2001.
18. Butkeviciene et al. 2001.
19. Finger and Schuler 1999.
20. The existing literature on the impact of WTO
accession is not only scarce, but also highly
specialized and not necessarily relevant from a
human development perspective. For example,
Evenett and Gage (2005) only focus on the impact
on trade flows of four countries after WTO
membership and fails to establish any clear cut
linkage between WTO membership and increased
trade flow – mainly exports; Rose (2004)
challenges the argument that GATT/WTO
membership could actually increase trade; and
Subramanian and Wei (2003) conclude that the
WTO promotes trade, strongly but unevenly. Due
to these limitations, much of the analysis in this
section deals with prospective impact, based on
the available literature.
21. Rodrik 1997.
22. UNDP 1999.
23. UNDP 1999.
24. ADB/UNAIDS 2004.
25. Busse 2004.
26. Adhikari 2005a.
27. Waglé and Gibbs 2003.
28. UNCTAD 2004b.
29. The Committee is at present discussing five LDC
Agreement-specific proposals including greater
flexibility for LDCs to take up commitments,
consistent with their level of economic
development; improved access for LDCs to
temporary waivers regarding one or more of their
obligations; duty-free and quota-free market access
for goods originating from LDCs; and greater
flexibility to use trade-related investment measures
as a development tool.
30. Srinivasan 1999.
31. Ismail 2005.
32. UNCTAD 2004b.
33. Brenton 2003.
34. Inama 2002; Brenton 2003.
35. Stevens and Kennan 2004.
36. Anderson 2004; UN Millennium Project 2005.
37. Romalis 2003.
38. Rose 2004.
49. Puri 2005.
40. Puri 2005.
41. Puri 2005.
42. For this purpose, LDCs shall notify the Council
for Trade in Goods (CTG) of such measures within
two years, starting 30 days after the date of the
Hong Kong declaration. If notified, LDCs will be
allowed to maintain these existing measures until
the end of a new transition period, lasting seven
years.
Chapter 7
1. Malhotra 2006.
NEW FROM APRI, HUMAN DEVELOPMENT UNIT, RCC
UNDP Human Development Fellowships, 2006
AcademicObjective: To encourage young Ph.D. students to analyze development issues from a humandevelopment perspective, contributing to cutting edge research on theory, applications andpolicies.For whom: Ph.D. students from Asia-Pacific at the stage of their dissertations.
MediaObjective: To support policy advocacy and communicating research in order to bring peopleto the centre of the development concerns.For whom: Mid-career media professionals from Asia-Pacific, interested in “InternationalTrade and Human Poverty”.
Themes of Previous Asia-Pacific HDRs
2005: Promoting ICT for Human Development in Asia 2004: Realizing the MillenniumDevelopment Goals
2003: HIV/AIDS and Development in South Asia
Other Publications Relating to MDGs and Human Development
2006: Pursuing Gender Equality through the MDGs in Asia and the Pacific (with ADB andUNESCAP). Technical Paper.
2006: Asia Water Watch 2015: Are Countries in Asia on Track to Meet Target 10 of theMillennium Development Goals? (with ADB, UNESCAP and WHO). Technical Paper.
2005: A Future within Reach: Reshaping Institutions in a Region of Disparities to Meet theMillennium Development Goals in Asia and the Pacific (with ADB and UNESCAP).Regional MDG Report.
2005: Voices of the Least Developed Countries of Asia and the Pacific: Achieving the MillenniumDevelopment Goals Through a Global Partnership (with UNESCAP). Thematic Reportand Video.
2004: ICT for Human Development: Towards Building a Composite Index for Asia. TechnicalPaper.
Tools
2005: Cracking the HDI: Human Development Indexing Exercise2005: Surviving the Publication Process: Prepkit for Publications2005: From Development to Human Development: Tool for Examining Themes from a Human
Development Perspective2005: Tool for Credit Rating of Micro Credit Recipients
For more information visit: http://www.undprcc.lk
Top Related
Copyright © 2022 FDOKUMEN

