The commodity terms of trade and their strategic implications for development
31
THE COMMODITY TERMS OF TRADE AND THEIR STRATEGIC IMPLICATIONS FOR DEVELOPMENT José Antonio Ocampo and María Angela Parra * More than half a century after Prebisch and Singer first hypothesized that the terms of trade for commodities (i.e., their real price or their price relative to manufactures) 1 exhibits a downward trend, the issue continues to be a subject of heated economic debate. The primary reason for this interest is that the trend has important implications for countries’ development strategies and, in particular, for the identification of the relative virtues of encouraging a country to specialize in primary commodities versus manufactures. What is more, because of the “fallacy of composition,” the sum of the countries’ individual efforts to promote commodity exports intensifies the downward trend of commodity prices. Consequently, these strategies are less effective for developing countries as a group than they are for any one country on its own. This fact has not been taken into account in the structural adjustment programmes implemented in developing countries during recent decades. 2 Thus, if this is the case, multilateral intervention in the market may be necessary in order to prevent this trend from hurting the interests of developing countries. As noted by Ardeni and Wright (1992), “This debate acquired renewed urgency in the 1980s, as historic lows 3 in the real prices of many primary commodities raised questions about the wisdom of further encouragement by institutions such as the World Ba nk (WB) of long-term primary sector projects in less developed countries”. Paradoxically, however, these low terms of trade were “accompanied by an equally marked shift in international commodity policy away from positive intervention, and in favour of free market solutions to the commodity problems of developing countries” (Maizels, 1994). * Executive Secretary of the Economic Commission for Latin America and the Caribbean (ECLAC) and Adviser to the Executive Secretary, respectively. 1 For definitions of the various types of terms of trade or relative prices involved in the debate, see Scandizzo and Diakosawas (1988). This study will consider the terms of trade for commodities, rather than of countries. 2 See Lutz and Singer (1994). 3 These authors are in agreement on this point with Borensztein and Reinhart (1994) of the International Monetary Fund (IMF).
-
Upload
independent -
Category
Documents
-
view
0 -
download
0
Transcript of The commodity terms of trade and their strategic implications for development
THE COMMODITY TERMS OF TRADE AND
THEIR STRATEGIC IMPLICATIONS FOR DEVELOPMENT
José Antonio Ocampo and María Angela Parra *
More than half a century after Prebisch and Singer first hypothesized that the terms of
trade for commodities (i.e., their real price or their price relative to manufactures)1 exhibits a
downward trend, the issue continues to be a subject of heated economic debate. The primary
reason for this interest is that the trend has important implications for countries’ development
strategies and, in particular, for the identification of the relative virtues of encouraging a country
to specialize in primary commodities versus manufactures. What is more, because of the “fallacy
of composition,” the sum of the countries’ individual efforts to promote commodity exports
intensifies the downward trend of commodity prices. Consequently, these strategies are less
effective for developing countries as a group than they are for any one country on its own. This
fact has not been taken into account in the structural adjustment programmes implemented in
developing countries during recent decades.2 Thus, if this is the case, multilateral intervention in
the market may be necessary in order to prevent this trend from hurting the interests of
developing countries.
As noted by Ardeni and Wright (1992), “This debate acquired renewed urgency in the
1980s, as historic lows3 in the real prices of many primary commodities raised questions about
the wisdom of further encouragement by institutions such as the World Bank (WB) of long-term
primary sector projects in less developed countries”. Paradoxically, however, these low terms of
trade were “accompanied by an equally marked shift in international commodity policy away
from positive intervention, and in favour of free market solutions to the commodity problems of
developing countries” (Maizels, 1994).
* Executive Secretary of the Economic Commission for Latin America and the Caribbean (ECLAC) and Adviser to the Executive Secretary, respectively. 1 For definitions of the various types of terms of trade or relative prices involved in the debate, see Scandizzo and Diakosawas (1988). This study will consider the terms of trade for commodities, rather than of countries. 2 See Lutz and Singer (1994). 3 These authors are in agreement on this point with Borensztein and Reinhart (1994) of the International Monetary Fund (IMF).
2
The controversy about development strategies and market intervention underlie this
debate on commodity price trends. A majority of the writings on the subject offer evidence of a
downward trend in the terms of trade and set out national and/or international policy options for
dealing with the negative effects it has on developing countries. Advocates of the opposing view,
who find no evidence of such a deterioration or who see it as being less of a problem than
commodity price volatility,4 generally belong to schools of thought that do not espouse market
intervention (Sapsford and Balasubramanyam, 1994).
Although the empirical literature is not unanimous about the existence of a continuous
long-term deterioration in the terms of trade for commodities (the original and most common
formulation of the Prebisch-Singer hypothesis) and, hence, about the possibility of inferring their
future behaviour on this basis, there is a consensus as to the sharp drop in the barter terms of
trade, especially from the 1920s on. This paper presents a critical review of the theoretical and
empirical literature on the subject and the implications for development strategies. The first
section briefly outlines the different theoretical arguments. The second reviews the empirical
debate and, in so doing, looks at the more traditional statistical exercises practised up to the
1980s, the more recent literature based on statistical time series techniques, and structural models
of terms-of-trade determinants. The third traces the movements in these prices throughout the
twentieth century and uses a number of statistical exercises to analyse these price dynamics. The
fourth and final section presents an interpretation of the findings within the context of the debate
on the development agenda.
I. THE THEORETICAL DEBATE
Until the mid-twentieth century, the classical view of the effects of diminishing returns to
scale on commodity prices prevailed. In this view, assuming a fixed endowment of land,
population growth will generate a greater demand for foodstuffs, and their relative price will
4 Cashin and McDermott (2002), for example, found a downward trend without structural breaks of 1.3% per year over a period of 140 years. Oddly enough, they interpret this as being “small” compared to the variability of prices, even though it translates into a cumulative decline of 75% over the period they analysed.
3
therefore tend to rise.5 In 1950, this classical interpretation was challenged by both Prebisch and
Singer, who used the available evidence on the terms of trade for commodities as a basis for the
hypothesis that these terms would tend to deteriorate over time. In his seminal article, Prebisch
(1950) studied the Board of Trade’s mean price indices for British imports and exports, which he
took to be representative of world prices for primary goods and manufactures. Based on those
data, he argued that from the 1860s to the years leading up to the Second World War, the terms
of trade had continually moved against commodity producers. Along the same lines, Singer
(1950)6 claimed it was a historical fact that, since 1870, price trends had moved sharply against
vendors of foodstuffs and raw materials and in favour of enterprises selling manufactures.
The original formulation of the Prebisch-Singer (P-S) hypothesis combined two different,
but clearly complementary, variants whose theoretical development proceeded along parallel
lines in the subsequent economic literature. On the one hand, there was the negative effect which
the income-inelasticity of demand for raw materials had on the terms of trade for developing
countries; on the other, there were the asymmetries present in the conditions underlying price
formation mechanisms for primary commodities and manufactures and, in turn, the functioning
of labour markets in the “centre” and the “periphery” of the world economy. The fundamental
conceptual difference between these two variants is that, in the first case, the downward pressure
on real commodity prices is generated through product markets (i.e., via the barter terms of
trade),7 whereas in the second it is generated through factor markets (i.e., via factoral terms of
trade)8 and only indirectly --by the effects that production costs have-- on the barter terms of
trade. Another difference is that, as a consequence of the above, the first variant of the P-S
5 It should be emphasized, however, that, as pointed out by Singer (1991): “The classical view does not argue improving factoral terms of trade for primary commodity producers. The improvement in barter terms of trade is due to diminishing productivity --both absolutely and even more so relative to manufacturing-- in the production of primary commodities, because of limitations of land, natural resources and other causes for diminishing returns. Thus, Adam Smith and the classics do not in any way argue that producers of primary commodities get a better share of the benefits from trade than producers of manufactured goods; quite the contrary. It is the countries specializing in manufactures which reap the main benefits of the increasing returns, improvements in skills, technological innovations, etc. which are associated with manufacturing.” 6 The source used was a study conducted by the Economic Affairs Department of the United Nations entitled “Relative Prices of Exports and Imports of Under-developed Countries”, New York, United Nations, 1949. 7 Ratio between export prices and the prices paid for imported products. 8 Ratio between the relative income of the factors of production embodied in exports versus imports. One way of estimating this variable is to adjust the barter terms of trade to take into account the productivities of the factors used to produce tradable goods. A more straightforward option is to analyse relative trends in the prices of factors of production (especially labour) in developing and developed countries.
4
hypothesis applies only to commodities (or, more generally, to products for which the income-
elasticity of demand is low), whereas the second affects all goods and services produced in
developing countries, regardless of the characteristics of those goods and services or of their
final demand.
The first variant of the hypothesis was based on the well-known observation that
economic growth tends to trigger changes in the production structure over time and, in particular,
generates a tendency towards a relative reduction in the size of the primary sector. As is widely
recognized, this structural break is associated not only with the characteristics of final demand
(especially the low income-elasticity of the demand for foodstuffs) but also with the fact that, in
many cases, technological change in the production of manufactures entails the production of
synthetic materials. These variations in the production structure have important implications at
the world level if the international division of labour is such that developing countries specialize
in the production of raw materials while industrialized nations specialize in manufactures.9
Under these circumstances, it is to be expected that either the former will grow more slowly or
the surplus primary commodities which they produce will tend to push down the relative world
prices of those commodities. The pressure towards unequal rates of growth will be greater if the
externalities generated by the production of manufactures (the generation of demand multipliers
and the externalities associated with technical progress) are greater than those that characterize
primary production.
The second variant was formulated by both authors –although perhaps more clearly by
Singer– in terms of an unequal distribution of the fruits of technological progress in primary
versus manufacturing production. According to this variant, in the case of manufactures, these
benefits are distributed to producers in the form of higher incomes, but in the case of
commodities they are reflected in lower prices. This asymmetry is a result of the way in which
both goods markets (greater market power for setting manufacturing prices) and labour markets
9 Singer (1991) states that, although developing countries cannot be identified with commodity exports in the same way as they could be in 1950, even today it remains true that the developing countries as a whole are net exporters of primary commodities and net importers of manufactures. A 1% deterioration in the terms of trade for primary versus manufactured commo dities still translates into a 0.3% deterioration in the terms of trade of developing countries.
5
(greater organization of industrial workers) operate. At the international level, however, it is also
a reflection of the international division of labour.
In relation to the international terms of trade, the more precise formulation was made by
Prebisch. He stated that, because of the weaker long-term demand for raw materials, the relative
surplus of labour displaced from primary activities tends to concentrate in developing countries,
which, in turn, have more difficulty in putting that surplus labour to work in new production
sectors. The problems they face include political restrictions on labour migration to
industrialized nations and the obstacles hindering late industrialization, which, in their view, are
associated with the striking disparities between the countries of the “centre” and the “periphery”
in terms of technological capabilities and the availability of capital. This situation generates a
surplus of labour which leads to a relative decline in the wages of developing-country workers
and, hence, in those countries’ terms of trade.10
The history of the controversy surrounding developing countries’ terms of trade can
largely be written by tracing the development of these two variants of the P-S hypothesis (see
Ocampo, 1986 and 1993). The neoclassical and Keynesian literature of the 1950s and 1960s
focused on the first of these mechanisms. According to Johnson (1954), the lower income-
elasticity of the demand for raw materials ought to be reflected in slower economic growth in the
countries specializing in those products or in a tendency for raw material prices to decline. This
effect depends entirely on income-elasticity, but the lower the price-elasticity of the demand for
raw materials is, the larger the decrease will be. It should be emphasized, however, that this type
of model is incapable of generating asymmetries in the transmission of technical progress and
thus cannot be used to validate the second variant of the P-S hypothesis.
In a neoclassical (Heckscher-Ohlin) trade model, any factor that increases the supply of a
given good will result in a decrease in its relative price. Thus, in countries or regions that are
10 Prebisch believed that this asymmetry was particularly evident during downswings in the business cycle. In his view, workers in countries of the centre were not only able to secure wage increases during booms, but were also able to defend their wages during world recessions. In contrast, because of the surplus supply of —and, hence, the marked cyclical deterioration in— raw material prices, workers in the periphery were unable to prevent the deterioration of their income levels during recessions.
6
large enough to influence international prices, technological change in export industries will be
reflected in a deterioration in their barter terms of trade. On the other hand, technological change
in import-substitution industries will have just the opposite effect, since it will cause factors of
production to be transferred to those sectors, thereby reducing the supply of exports and thus
inducing an improvement in the terms of trade.
An interesting variation on this type of model can be constructed by taking into account
the fact that developing countries’capital goods (machinery and equipment, in particular) are
imported. In this case, low income and price elasticities will tend to dampen growth in
developing countries not only due to their direct impact on incomes but also because the
resulting deterioration in the terms of trade diminishes these countries’ ability to transform
export products into capital goods.11 Another way of expressing this point is to say that a
deterioration in the terms of trade is equivalent to an overall reduction in productivity for
countries that are capital-goods importers.
Unlike this line of reasoning, in which the fundamental determinant of the terms of trade
is the gap between the income and price elasticities of different types of products, the “unequal
exchange” literature sees the international trend in the terms of trade as reflecting the relationship
between labour income trends in developed and developing countries.12 This type of analysis fits
in extremely well with Lewis’ terms-of-trade theory (1977), according to which the international
terms of trade are determined by relative wages in developing versus developed countries and
this variable, in its turn, is determined by the levels of productivity attained in the production of
food (or of subsistence goods in general) in the two groups of countries. Both types of models
can be viewed as a return to Prebisch’s seminal idea that developing countries’ terms of trade are
determined by asymmetries in the operation of labour markets in the countries of the “centre”
and the “periphery”.
The central idea underlying these theories is that, as rates of return tend to level out
across countries due to the international mobility of capital, the international terms of trade are
11 See Ziesemer (1998). 12 See, for example, Emmanuel (1972), appendix IV, and Braun (1973).
7
determined by relative wages and labour productivities in export sectors. Hence, the trend in the
terms of trade is not associated with the types of goods produced by one region or another but
rather with which region produces them. In Lewis’ (1977) words: “The terms of trade are bad
only for tropical products, whether agricultural or industrial, and are bad because the market pays
tropical unskilled labor, whatever it may be producing, a wage that is based on an unlimited
reservoir of low-productivity food producers”.
Thus, according to this type of analysis, an increase in labour productivity that boosts real
wages (the production of manufactures in industrialized countries, in many models, and the
productivity of agricultural production, in Lewis’ model) will have a positive effect on the terms
of trade for the region where it takes place. On the other hand, the entire impact of technological
change in export sectors is transmitted (“exported”) to the rest of the world via a deterioration in
the terms of trade.
The North-South models developed in the 1980s fit in very well with this type of
analysis. In these models, the terms of trade are determined by structural differences between
developing and developed economies. As in the literature on unequal trade, the focus of attention
in these models is on the characteristics of given countries or regions rather than on the goods
they produce. The most comprehensive treatments of this subject are based on the models
developed by Findlay (1980 and 1981) and Taylor (1983, chapter 10) in the early 1980s (for a
comparison of these and other models, see Ocampo, 1986).13 In both cases, the economy being
modelled is one in which the North determines the pace of the world economy’s growth and in
which the South adapts to that pace.
The essential element of this kind of model is the recognition of the asymmetries existing
in the economic structures of the two regions. Thus, the North has a neoclassical economic
structure in Findlay’s model and a Keynesian (or, more accurately, Kaleckian) structure in
Taylor’s, while in both formulations the South functions as a Lewis-type surplus- labour
economy. These asymmetries give rise to a pattern that fits in perfectly with the second variant
13 Subsequent contributions to this body of literature include those of Darity (1990) and of Molana and Vines (1989).
8
of the P-S hypothesis, i.e., in the long run, the North appropriates the full benefits of its own
process of technical change, while the South’s productivity gains lead to a commensurate
deterioration in its barter terms of trade (its technical changes are “exported”). This is a reflection
of the asymmetrical effects that technological change has on real wages. While in the North
wage increases are proportional to increases in productivity, in the South real wages are not
affected by technological change. The corresponding effect is transmitted through production
costs and is therefore unrelated to the type of good being produced or the demand for it.14
II. THE EMPIRICAL LITERATURE
A. Early developments
As we have seen, the hypothesis developed by Prebisch and Singer marked a historic
turning point in the analysis of the trend in the commodity terms of trade and gave rise to a wide
array of empirical studies which did not, however, reach a consensus on the matter. Of the 70
analyses written after 1949 that are summarized in Scandizzo and Diakosawas (1987),15 nearly
half support the P-S hypothesis and about 40% fail to detect empirically convincing or
analytically justifiable trends; the remainder find the trend to be positive.
Among the recurrent criticisms that have been made of the empirical evidence on which
the P-S hypothesis was based, Spraos (1980) includes the following issues: (i) the relevance of
the series that were analysed; (ii) the inclusion of primary commodity imports coming from
developed countries; (iii) the bias introduced by the use of f.o.b. values for exports and c.i.f.
values for imports and the associated influence of transport costs; and (iv) the increasing quality
and variety of manufactured products. Scandizzo and Diakosawas (1987) also include: (i) the
difference in the periods analysed and the arbitrariness of their selection; (ii) the omission of
productivity as a consideration; and (iii) the statistical procedures used.
While the findings presented in the empirical literature written up to the end of the 1970s
were ambivalent, most of the studies done in the 1980s tended to corroborate the P-S hypothesis
14 Consequently, contrary to the argument made by Hadaas and Williamson (2001), this effect should be modelled under the assumption of equivalent (unitary) income elasticities for goods produced by the two regions. 15 See also Nguyen (1981).
9
(Spraos, 1980 and 1983; Sapsford, 1985; Sarkar, 1986; Evans, 1987; Scandizzo and Diakosawas,
1987). Although the trend could not be confirmed for certain subperiods and products, the
evidence indicated that, on average, real raw material prices had trended downward throughout
the twentieth century. This trend was also found to exist for raw materials (other than petroleum)
as a group and for most products in the years after the Second World War (Ocampo, 1993).
This downward trend is a hallmark of the twentieth century, not the nineteenth. In fact, in
keeping with the recent observations of Hadaas and Williamson (2001), and contrary to the
empirical evidence used by both Prebisch and Singer, recent series actually point to an
improvement in real raw material prices in the late nineteenth and early twentieth centuries.
These authors have also said that the sharp reduction in shipping costs that occurred during those
years benefited all countries. This is reflected in the improvement observed in the terms of trade
for this period when prices are measured in a given location (i.e., f.o.b. export prices versus c.i.f.
import prices).
After several decades of discussions regarding the relevance of the data used by Prebisch
and Singer, and given the absence of a consistent series that could be used to conduct a long-term
analysis,16 Grilli and Yang (1988) constructed price series for 24 commodities and published the
results for seven indices that were built using those series. This was a milestone in the debate.
Since then most studies have used these same series, which cover the period from 1900 to 1986
(updated to 2000 by Ocampo and Parra, 2003). Using this new evidence, Grilli and Yang
corroborated the existence of a negative trend in the terms of trade for commodities, although it
was less steep than the trend posited by Prebisch.
B. Recent contributions
The development of modern time-series econometrics was another milestone in this
debate. Until its inception, a constant time trend model (a linear logarithmic model), estimated
using the more traditional econometric technique of ordinary least squares, had been used to test
the P-S hypothesis. Since the late 1980s, however, estimates based on this method have had to be
16 The series used by The Economist covers a long period of time but both the number of products and the weightings used in it have been modified over time.
10
revised in this and many other areas of economics because it has been found that traditional
econometric methods can generate spurious results.
The main problem is the possibility of non-stationarity, which means that sharp changes
in a time series become permanent features and, as a result, inferences about the future level of
the corresponding variable cannot be drawn from past observations. Since then, a large number
of studies have been devoted to analysing the real commodity price series developed by Grilli
and Yang, either individually or as aggregate indices, in order to check the stationarity or non-
stationarity of the price dynamics, and then assess the presence or absence of a trend. A pivotal
component of this analysis has been the identification of structural breaks in commodity price
dynamics at certain crucial points in time during the twentieth century.
Cuddington and Urzúa (1988), who did pioneering work in this field, found that the series
developed by Grilli and Yang17 were non-stationary. This finding indicates that a logarithmic
trend model (or deterministic trend, DT) for use in analysing commodity price movements
cannot be estimated; instead, a model that estimates the pattern of variations in those prices (or a
stochastic trend, ST) must be used (see Box 1). When this is done using a dummy variable to
capture the steep drop in prices that occurred in 1921 (which should be interpreted as a
permanent, or structural, adverse shock since there was no subsequent reversal of that downturn),
the resulting trend in the terms of trade for commodities is not significantly different from zero.18
Meanwhile, Powell (1991) found that the terms of trade for commodities did not exhibit any
definite long-term trend, but that they do reflect three permanent (structural) adverse shocks that
occurred in 1921, 1938 and 1975.19 The author thus concluded that “although these [i.e., non-oil
producing developing] countries do not face a ‘stable declining terms of trade’, they face the
even more serious problem of infrequent booms and sharp negative ‘jumps’ in their terms of
trade”.
17 They chose the GYCPI index, which weights the different products according to the value of world trade in each product for the period 1977-1979. 18 In their analyses they also include the positive structural break which Sapsford (1985) found to have occurred in 1950, but they determine that it is not statistically significant. 19 Powell (1991) finds that “taking into account three negative jumps this century, non-oil commodity prices and manufactured good prices are cointegrated”.
11
Box 1
Models for estimating commodity price dynamics
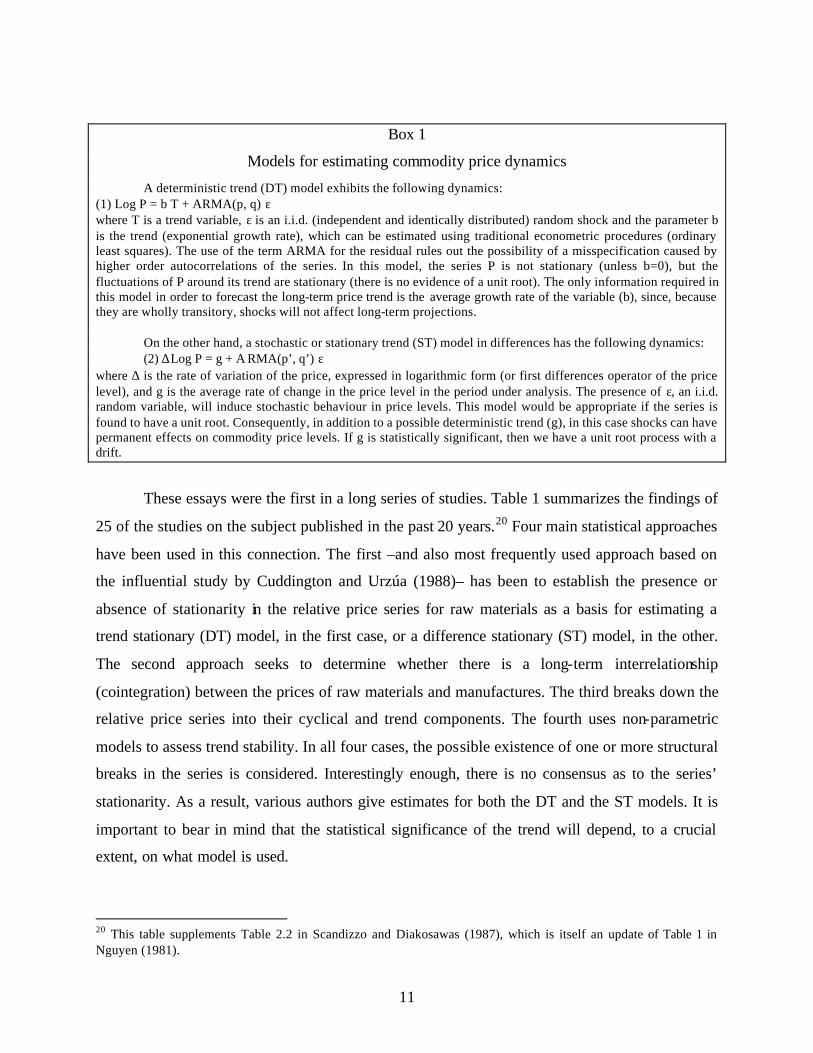
A deterministic trend (DT) model exhibits the following dynamics: (1) Log P = b T + ARMA(p, q) ε where T is a trend variable, ε is an i.i.d. (independent and identically distributed) random shock and the parameter b is the trend (exponential growth rate), which can be estimated using traditional econometric procedures (ordinary least squares). The use of the term ARMA for the residual rules out the possibility of a misspecification caused by higher order autocorrelations of the series. In this model, the series P is not stationary (unless b=0), but the fluctuations of P around its trend are stationary (there is no evidence of a unit root). The only information required in this model in order to forecast the long-term price trend is the average growth rate of the variable (b), since, because they are wholly transitory, shocks will not affect long-term projections.
On the other hand, a stochastic or stationary trend (ST) model in differences has the following dynamics: (2) ∆Log P = g + A RMA(p’, q’) ε where ∆ is the rate of variation of the price, expressed in logarithmic form (or first differences operator of the price level), and g is the average rate of change in the price level in the period under analysis. The presence of ε, an i.i.d. random variable, will induce stochastic behaviour in price levels. This model would be appropriate if the series is found to have a unit root. Consequently, in addition to a possible deterministic trend (g), in this case shocks can have permanent effects on commodity price levels. If g is statistically significant, then we have a unit root process with a drift.
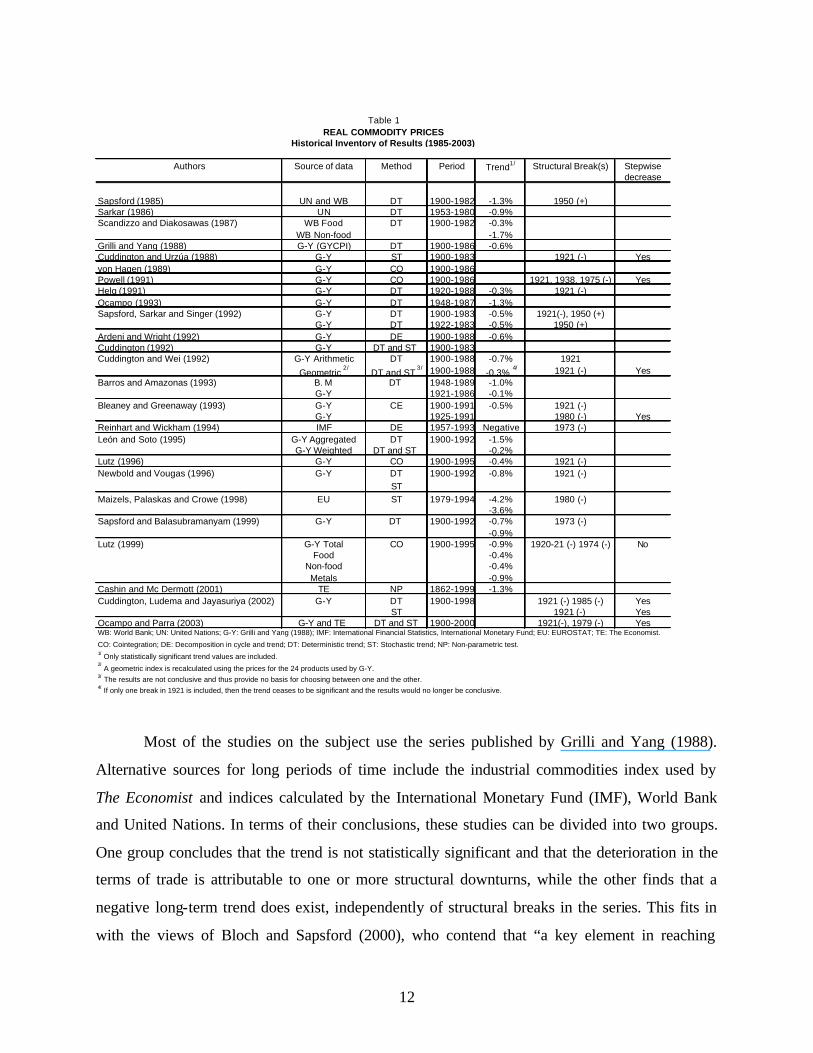
These essays were the first in a long series of studies. Table 1 summarizes the findings of
25 of the studies on the subject published in the past 20 years.20 Four main statistical approaches
have been used in this connection. The first –and also most frequently used approach based on
the influential study by Cuddington and Urzúa (1988)– has been to establish the presence or
absence of stationarity in the relative price series for raw materials as a basis for estimating a
trend stationary (DT) model, in the first case, or a difference stationary (ST) model, in the other.
The second approach seeks to determine whether there is a long-term interrelationship
(cointegration) between the prices of raw materials and manufactures. The third breaks down the
relative price series into their cyclical and trend components. The fourth uses non-parametric
models to assess trend stability. In all four cases, the possible existence of one or more structural
breaks in the series is considered. Interestingly enough, there is no consensus as to the series’
stationarity. As a result, various authors give estimates for both the DT and the ST models. It is
important to bear in mind that the statistical significance of the trend will depend, to a crucial
extent, on what model is used.
20 This table supplements Table 2.2 in Scandizzo and Diakosawas (1987), which is itself an update of Table 1 in Nguyen (1981).
12
Most of the studies on the subject use the series published by Grilli and Yang (1988).
Alternative sources for long periods of time include the industrial commodities index used by
The Economist and indices calculated by the International Monetary Fund (IMF), World Bank
and United Nations. In terms of their conclusions, these studies can be divided into two groups.
One group concludes that the trend is not statistically significant and that the deterioration in the
terms of trade is attributable to one or more structural downturns, while the other finds that a
negative long-term trend does exist, independently of structural breaks in the series. This fits in
with the views of Bloch and Sapsford (2000), who contend that “a key element in reaching
Authors Source of data Method Period Trend1/ Structural Break(s) Stepwise decrease
Sapsford (1985) UN and WB DT 1900-1982 -1.3% 1950 (+)Sarkar (1986) UN DT 1953-1980 -0.9%Scandizzo and Diakosawas (1987) WB Food DT 1900-1982 -0.3%
WB Non-food -1.7%Grilli and Yang (1988) G-Y (GYCPI) DT 1900-1986 -0.6%Cuddington and Urzúa (1988) G-Y ST 1900-1983 1921 (-) Yesvon Hagen (1989) G-Y CO 1900-1986Powell (1991) G-Y CO 1900-1986 1921, 1938, 1975 (-) YesHelg (1991) G-Y DT 1920-1988 -0.3% 1921 (-)Ocampo (1993) G-Y DT 1948-1987 -1.3%Sapsford, Sarkar and Singer (1992) G-Y DT 1900-1983 -0.5% 1921(-), 1950 (+)
G-Y DT 1922-1983 -0.5% 1950 (+)Ardeni and Wright (1992) G-Y DE 1900-1988 -0.6%Cuddington (1992) G-Y DT and ST 1900-1983Cuddington and Wei (1992) G-Y Arithmetic DT 1900-1988 -0.7% 1921
Geometric 2/
DT and ST 3/ 1900-1988 -0.3%
4/ 1921 (-) YesBarros and Amazonas (1993) B. M DT 1948-1989 -1.0%
G-Y 1921-1986 -0.1%Bleaney and Greenaway (1993) G-Y CE 1900-1991 -0.5% 1921 (-)
G-Y 1925-1991 1980 (-) YesReinhart and Wickham (1994) IMF DE 1957-1993 Negative 1973 (-)León and Soto (1995) G-Y Aggregated DT 1900-1992 -1.5%
G-Y Weighted DT and ST -0.2%Lutz (1996) G-Y CO 1900-1995 -0.4% 1921 (-)Newbold and Vougas (1996) G-Y DT 1900-1992 -0.8% 1921 (-)
STMaizels, Palaskas and Crowe (1998) EU ST 1979-1994 -4.2% 1980 (-)
-3.6%Sapsford and Balasubramanyam (1999) G-Y DT 1900-1992 -0.7% 1973 (-)
-0.9%Lutz (1999) G-Y Total CO 1900-1995 -0.9% 1920-21 (-) 1974 (-) No
Food -0.4%Non-food -0.4%Metals -0.9%
Cashin and Mc Dermott (2001) TE NP 1862-1999 -1.3%Cuddington, Ludema and Jayasuriya (2002) G-Y DT 1900-1998 1921 (-) 1985 (-) Yes
ST 1921 (-) YesOcampo and Parra (2003) G-Y and TE DT and ST 1900-2000 1921(-), 1979 (-) YesWB: World Bank; UN: United Nations; G-Y: Grilli and Yang (1988); IMF: International Financial Statistics, International Monetary Fund; EU: EUROSTAT; TE: The Economist.
CO: Cointegration; DE: Decomposition in cycle and trend; DT: Deterministic trend; ST: Stochastic trend; NP: Non-parametric test.
3/ The results are not conclusive and thus provide no basis for choosing between one and the other.4/ If only one break in 1921 is included, then the trend ceases to be significant and the results would no longer be conclusive.
REAL COMMODITY PRICESTable 1
Historical Inventory of Results (1985-2003)
1/ Only statistically significant trend values are included.2/ A geometric index is recalculated using the prices for the 24 products used by G-Y.
13
different conclusions (on the P-S hypothesis) is the inclusion of breaks or jumps in the data when
estimating the trend relationship”.
The structural breaks identified in the first group of studies are clustered around the end
of the First World War and in the 1970s. According to Bloch and Sapsford (2000), “these breaks
tend to occur at times of dramatic changes in the rate of growth of manufacturing output”. This is
in line with the results for the structural models to be considered later on, according to which
world industrial output is a basic determinant of commodity prices. In the second case, the
magnitude of the long-term trend ranges from –0.3% to –1.3%, depending on the period analysed
and the data source.
It can thus be seen that most of the studies provide evidence of a long-term deterioration
in the barter terms of trade, whether as the result of structural breaks, a persistent trend, or a
combination of the two. Whatever the specific nature of the price dynamics involved, the recent
literature can be regarded as providing proof for the P-S hypothesis, although not necessarily for
its original version. As categorically stated by Sapsford and Balasubramanyam (1994): “There
can be few hypotheses in economics that have stood the test of both time and new statistical
techniques so well”.
C. Structural models
Another line of empirical research has focused on identifying the underlying causes of
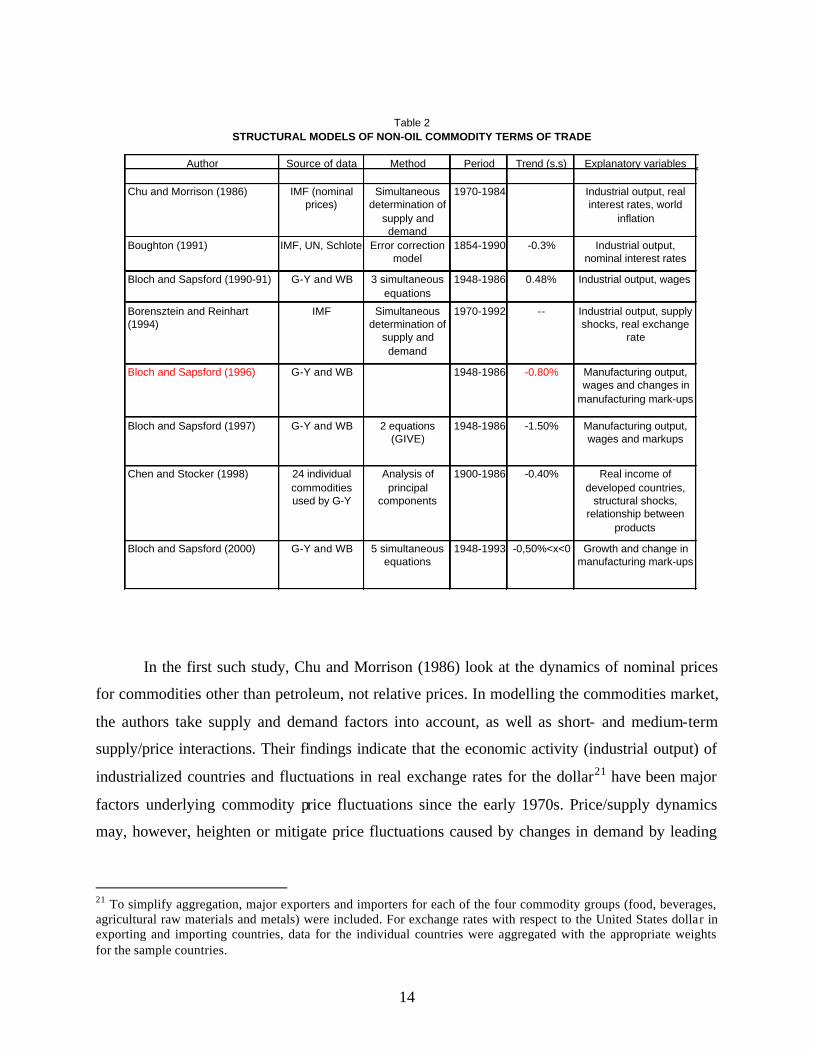
the behaviour of relative commodity prices by developing various “structural” models. Table 2
summarizes the findings of eight studies that have used this approach. Most of these studies
construct a model of supply and demand that incorporate the structural differences in the ways
that prices are set for manufactures and commodities and in the ways that wage levels are
established in the two sectors. Thus, the starting point for many of these studies is the second
variant of the P-S hypothesis (see Section I).
14
In the first such study, Chu and Morrison (1986) look at the dynamics of nominal prices
for commodities other than petroleum, not relative prices. In modelling the commodities market,
the authors take supply and demand factors into account, as well as short- and medium-term
supply/price interactions. Their findings indicate that the economic activity (industrial output) of
industrialized countries and fluctuations in real exchange rates for the dollar21 have been major
factors underlying commodity price fluctuations since the early 1970s. Price/supply dynamics
may, however, heighten or mitigate price fluctuations caused by changes in demand by leading
21 To simplify aggregation, major exporters and importers for each of the four commodity groups (food, beverages, agricultural raw materials and metals) were included. For exchange rates with respect to the United States dollar in exporting and importing countries, data for the individual countries were aggregated with the appropriate weights for the sample countries.
Author Source of data Method Period Trend (s.s) Explanatory variables
Chu and Morrison (1986) IMF (nominal prices)
Simultaneous determination of
supply and demand
1970-1984 Industrial output, real interest rates, world
inflation
Boughton (1991) IMF, UN, Schlote Error correction model
1854-1990 -0.3% Industrial output, nominal interest rates
Bloch and Sapsford (1990-91) G-Y and WB 3 simultaneous equations
1948-1986 0.48% Industrial output, wages
Borensztein and Reinhart (1994)
IMF Simultaneous determination of
supply and demand
1970-1992 -- Industrial output, supply shocks, real exchange
rate
Bloch and Sapsford (1996) G-Y and WB 1948-1986 -0.80% Manufacturing output, wages and changes in
manufacturing mark-ups
Bloch and Sapsford (1997) G-Y and WB 2 equations (GIVE)
1948-1986 -1.50% Manufacturing output, wages and markups
Chen and Stocker (1998) 24 individual commodities used by G-Y
Analysis of principal
components
1900-1986 -0.40% Real income of developed countries,
structural shocks, relationship between
products
Bloch and Sapsford (2000) G-Y and WB 5 simultaneous equations
1948-1993 -0,50%<x<0 Growth and change in manufacturing mark-ups
STRUCTURAL MODELS OF NON-OIL COMMODITY TERMS OF TRADETable 2
15
to an increase (or decrease) in the use of production capacity, in the short run, and in potential
production, in the medium term.
Borensztein and Reinhart (1994) argue that models of this type, in which demand factors
play a crucial role,22 have been unable to explain the marked and sustained weakness in these
prices during the 1980s and 1990s. In their model, they expand this analysis to include the effect
that supply has on prices. In addition, within aggregate demand, they include transition
economies as well as the major industrialized countries. This model thus captures the negative
impact on prices generated by the steep increase in commodity exports by developing countries
during the 1980s debt crisis.23
This last effect has been particularly important in recent years. Singer (1999) observes
that the developing countries’ external debt burdens have forced them to export and generate
foreign exchange earnings at any cost. The overall effect of this has, however, been a
deterioration in the prices commanded by the exports of these countries as a group. He thus notes
that: “The ‘fallacy of composition’ ensures that the efforts of each country individually to
improve its income terms of trade by increasing its own market shares must be at the expense of
other countries under similar pressure which simultaneously try to increase their own individual
market share”.
Meanwhile, Bloch and Sapsford (1990-1991, 1996, 1997 y 2000)24 have focused their
attention on the hypothesis put forward by Prebisch and Singer concerning the differing
dynamics of manufactures and primary commodity price determination. They thus estimate a
model in which wages and prices in primary production are competitively determined, while
prices and wages in manufacturing are determined by mark-up pricing and union-employer
bargaining, respectively.
22 See also Sapsford (1987). 23 Reinhart and Wickham (1994) also emphasize the impact of the dissolution of most international commodity price agreements. 24 The first two deal, respectively, with cycles and trends in the terms of trade over the period 1948-1986. The last two specify and test primary commodity and manufactures price equations over the same period.
16
These authors’ estimates for the post-war period support the second variant of the P-S
hypothesis, according to which the differences existing between the competitive structures of the
primary-commodity-producing sector, on the one hand, and manufacturing, on the other, exert a
strong negative effect on real commodity prices (on the order of –6% per annum in 1948-1993,
according to the most recent of their papers) which is compounded by the adverse effects of
rising manufacturing mark-ups. However, their estimates also suggest that the effects of
asymmetric competitive structures has been largely counterbalanced, over the period they
analyse as a whole, by the positive effects that manufacturing production has on commodity
prices. In particular, according to the estimated coefficients, an increase in manufacturing output
on the order of 5% is necessary to counterbalance these negative effects. If the rate of growth of
manufacturing is higher, then there would be a net improvement in the terms of trade for primary
producers; however, slower rates of growth (such as those experienced in recent decades)
generate a net tendency towards a deterioration in their terms of trade.
III. TREND OR A STEPWISE DECREASE?
A. Initial considerations
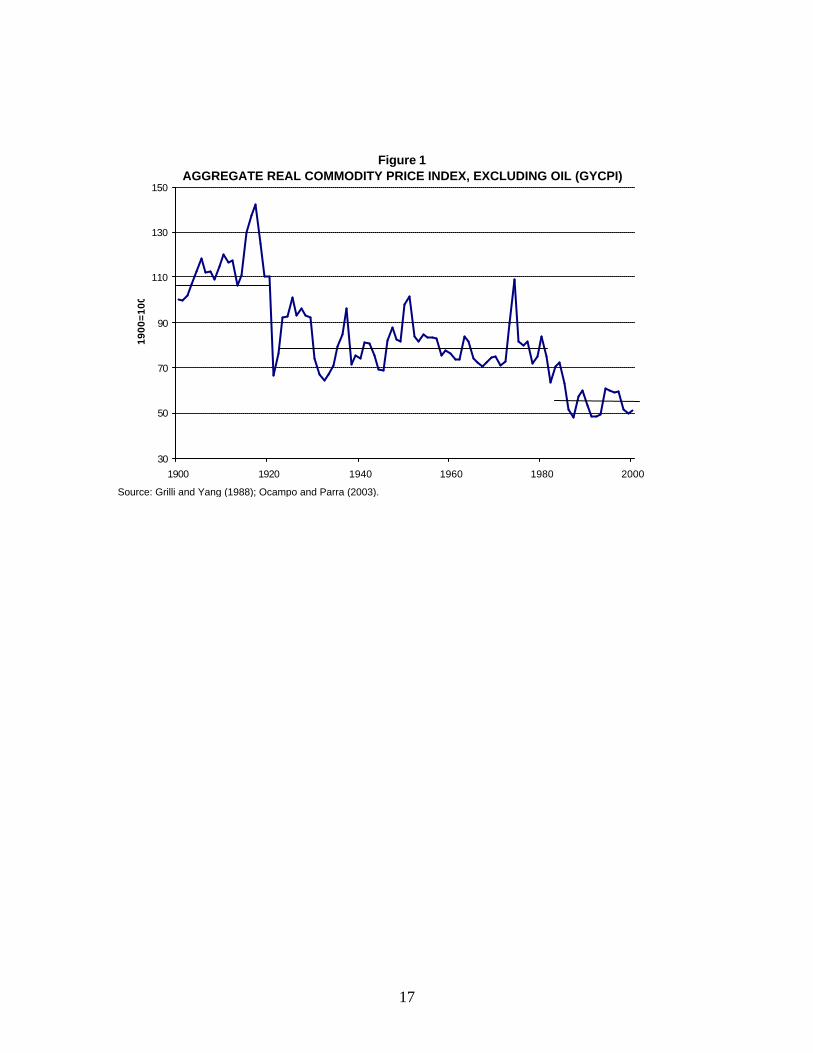
As may be seen from Figure 1, rather than following a steady downward trend during the
twentieth century, at an aggregate level the terms of trade for commodities exhibit two major
downward shifts: one after the First World War and the other in the early 1980s. In both cases,
these decreases represent the delayed effects of the sharp slowdowns in the world economy that
took place following the First World War and after the first oil shock of the 1970s, which marked
the end of the post-Second World War “golden age” of the industrialized economies (Madisson,
1995). In contrast, the acceleration of the industrialized economies’ growth rates that occurred
after the Second World War did not have a favourable effect on the commodity terms of trade.
This asymmetry in the response of commodity prices to major changes in the world economy
during the twentieth century therefore accounts for their long-term downward trend. Taken
together, the cumulative decrease is very large, since between 1920 and 2000, all aggregate
indices –including that of The Economist– showed a loss of between 50% and 60% in value
relative to manufactures.
17
Source: Grilli and Yang (1988); Ocampo and Parra (2003).
Figure 1AGGREGATE REAL COMMODITY PRICE INDEX, EXCLUDING OIL (GYCPI)
30
50
70
90
110
130
150
1900 1920 1940 1960 1980 2000
1900
=10
0
18
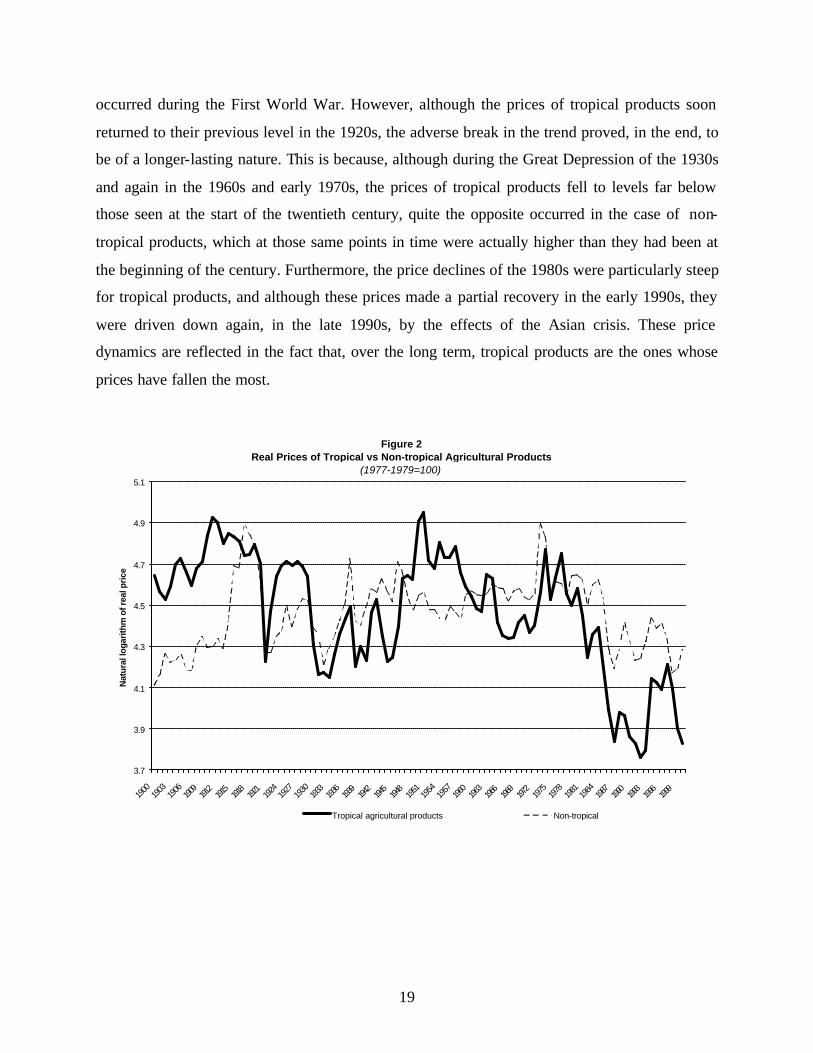
Figure 2 illustrates the price dynamics of agricultural products grown only in tropical
zones as compared to those of goods produced mainly in temperate zones or in both types of
climates (which, for the sake of simplicity, we will refer to as “non-tropical”). As the figure
shows, one of the most obvious effects of the steep drop in commodity prices that occurred
around 1920 was the reversal of the upturn in the prices of non-tropical agricultural products that
1920-1930 1980-1990 1900-2000 Model OrientationAnnual Cumulative
Beef -0.2 -6.6 1.0 0.9 134.6 DT ++Coffee 0.4 -8.3 -0.1 0.4 45.3 DTCopper 1.4 -1.1 -0.7 -0.6 -46.0 DTJute -0.9 0.6 -0.4 -0.7 -30.4 DT ----Lamb -0.1 -3.9 1.6 1.7 399.3 DT ++Maize -1.2 -5.3 -0.8 1.2 -61.9 DT ----Timber -2.2 -1.5 1.1 -1.5 208.1 DT ++Tin 0.1 -10.2 0.1 0.2 15.4 DTAluminium 1.8 2.8 -1.1 -1.3 -71.7 ST -Bananas 5.8 0.1 0.0 -0.1 -7.5 ST -Cocoa -0.7 -9.5 -1.3 -1.0 -61.8 ST -Cotton -3.0 -6.1 -1.0 -1.1 -66.0 ST -Silver -5.3 -16.2 -0.3 -1.0 -23.8 ST -Tea 7.6 -4.0 -0.7 0.7 -56.2 ST -Tobacco -2.7 -0.4 0.8 -0.7 100.4 ST +Wool -3.1 -5.5 -1.2 -0.4 -76.6 ST -Hides -4.7 1.3 -0.8 -1.1 -63.6 SB --Lead 0.7 -4.2 -0.8 -0.3 -48.0 SB --Palm oil -2.3 -2.8 -0.3 0.0 -1.3 SB --Rice 3.7 -6.9 -1.3 -1.2 -66.9 SB --Rubber -9.5 -7.6 -2.8 -2.8 -93.4 SB --Sugar -16.8 -10.5 -1.3 -1.1 -65.4 SB --Wheat -4.5 -3.1 -0.6 -0.9 -46.4 SB --Zinc -0.9 4.7 0.3 0.1 5.9 SB ++Indices GYCPI -3.9 -4.4 -0.7 -0.7 -47.8 SB ----GYCPI' -3.7 -4.2 -0.8 -0.8 -55.4 SB ----GYCPI" -4.9 -6.5 -0.9 -1.0 -60.2 SB ----Agricultural products Tropical -4.3 -5.6 -0.8 -0.6 -43.8 SB ---- Non-tropical -3.5 -2.9 0.2 0.1 8.6 SBMetals 5.5 0.9 -0.1 -0.1 -7.1 SB ----The Economist -3.4 -2.5 -1.0 -1.0 -60.1 SB ----Source: Ocampo and Parra (2003).
----: Statistically significant negative trend.--: Negative trend with (sistematically negative) structural breaks.-: Negative drift (not significant).++: Statistically significant positive trend.+: Positive drift (not significant).
DT: deterministic trend model; ST: stochastic trend model; SB: trend stationary model with structural break.
1900/04 -1996/2000
Table 3NON-OIL COMMODITY PRICES AND INDICES
DEFLATED BY THE MUV(Average annual growth rates, percentages)
19
occurred during the First World War. However, although the prices of tropical products soon
returned to their previous level in the 1920s, the adverse break in the trend proved, in the end, to
be of a longer-lasting nature. This is because, although during the Great Depression of the 1930s
and again in the 1960s and early 1970s, the prices of tropical products fell to levels far below
those seen at the start of the twentieth century, quite the opposite occurred in the case of non-
tropical products, which at those same points in time were actually higher than they had been at
the beginning of the century. Furthermore, the price declines of the 1980s were particularly steep
for tropical products, and although these prices made a partial recovery in the early 1990s, they
were driven down again, in the late 1990s, by the effects of the Asian crisis. These price
dynamics are reflected in the fact that, over the long term, tropical products are the ones whose
prices have fallen the most.
Figure 2Real Prices of Tropical vs Non-tropical Agricultural Products
(1977-1979=100)
3.7
3.9
4.1
4.3
4.5
4.7
4.9
5.1
1900
1903
1906
1909
1912
1915
1918
1921
1924
1927
1930
1933
1936
1939
1942
1945
1948
1951
1954
1957
1960
1963
1966
1969
1972
1975
1978
1981
1984
1987
1990
1993
1996
1999
Nat
ural
loga
rith
m o
f rea
l pri
ce
Tropical agricultural products Non-tropical
20
B. Price dynamics25
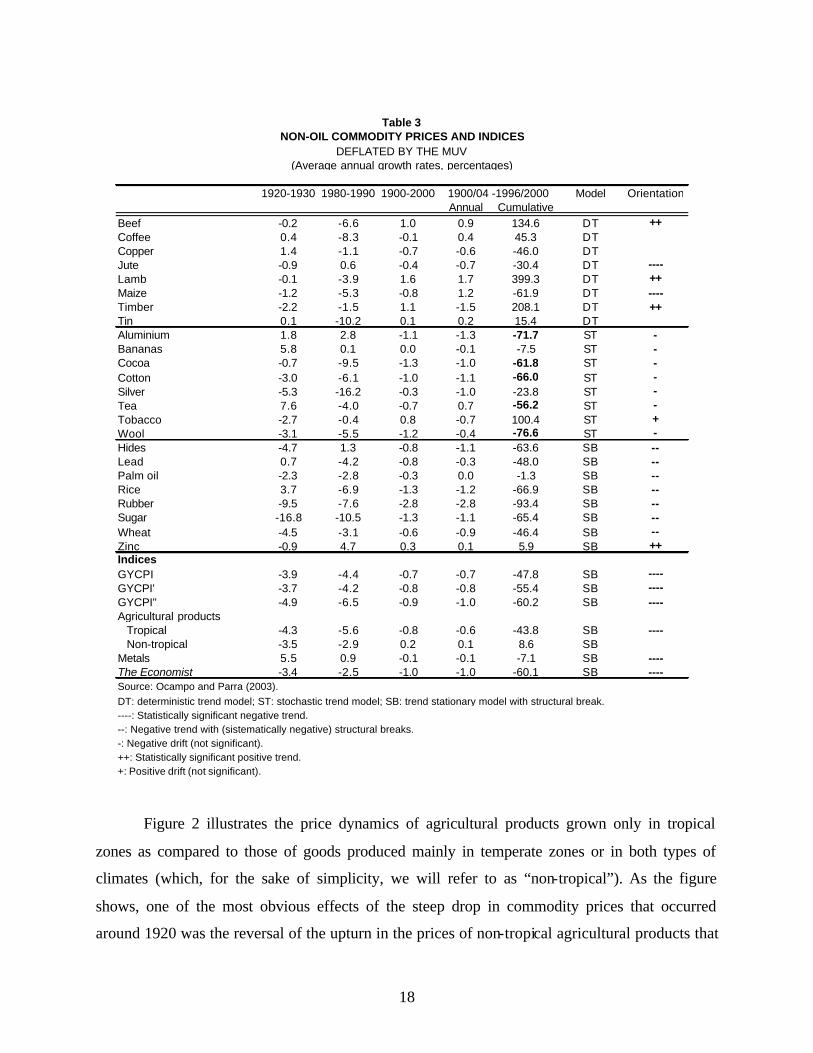
As shown in the last columns of Table 3,26 the price dynamics for these different
categories of products is quite heterogeneous. As we shall see, overall, there is a strong negative
trend of one sort or another for 13 of the 24 products that were analysed, while only four
products exhibit a strong positive trend and the remainder do not display a very definite trend in
either direction. Moreover, in the aggregate, commodities with negative trends or shocks prevail
and, thus, all the indices exhibit a systematic tendency to deteriorate.
Based on these differing dynamics, the products can be divided into three categories,
each of which is composed of eight commodities. The first group is made up of products whose
prices exhibit the simplest kind of trend throughout the twentieth century, i.e., a persistent trend
that shows no sign of structural breaks. In this group, a negative trend is displayed by two
products (maize and jute), a positive one by three (beef, mutton/lamb and wood) and no
statistically significant trend in either direction by three others (coffee, copper and tin).
The second group is made up of eight commodities that manifest non-stationarity. In
view of their wide variability, it is unsurprising that none of the drifts is statistically significant.27
The sign, however, is negative for all of these commodities except tobacco. Furthermore, the five
goods that show a drift close to –1% accumulated a real price decline of nearly 60% between
1900-1904 and 1996-2000 (aluminium, cocoa, cotton, tea and wool). For these commodities,
then, the frequency of negative shocks has clearly outweighed the effects of positive ones, with
the result that real prices have deteriorated significantly. The opposite is true of only one
commodity (tobacco).
The third group encompasses eight commodities that show at least one structural break in
price trends in the course of the twentieth century. This is also true of all price indices. These
25 In Ocampo and Parra (2003), the initial methodology is similar to the first one listed in section II.B. Thus, various parametric and non-parametric methods are used to establish the presence or absence of stationarity. A trend stationary (DT) model is then estimated for the stationary series and a difference stationary (ST) model is estimated for the non-stationary ones. Finally, the possible existence of structural breaks in the stationary series is then explored. 26 Table 3 summarizes the data given in Tables 3, 4, 5 and 6 of Ocampo and Parra (2003). 27 Cuddington and others reach the same conclusion using the stochastic trend model for the GYCPI series.
21
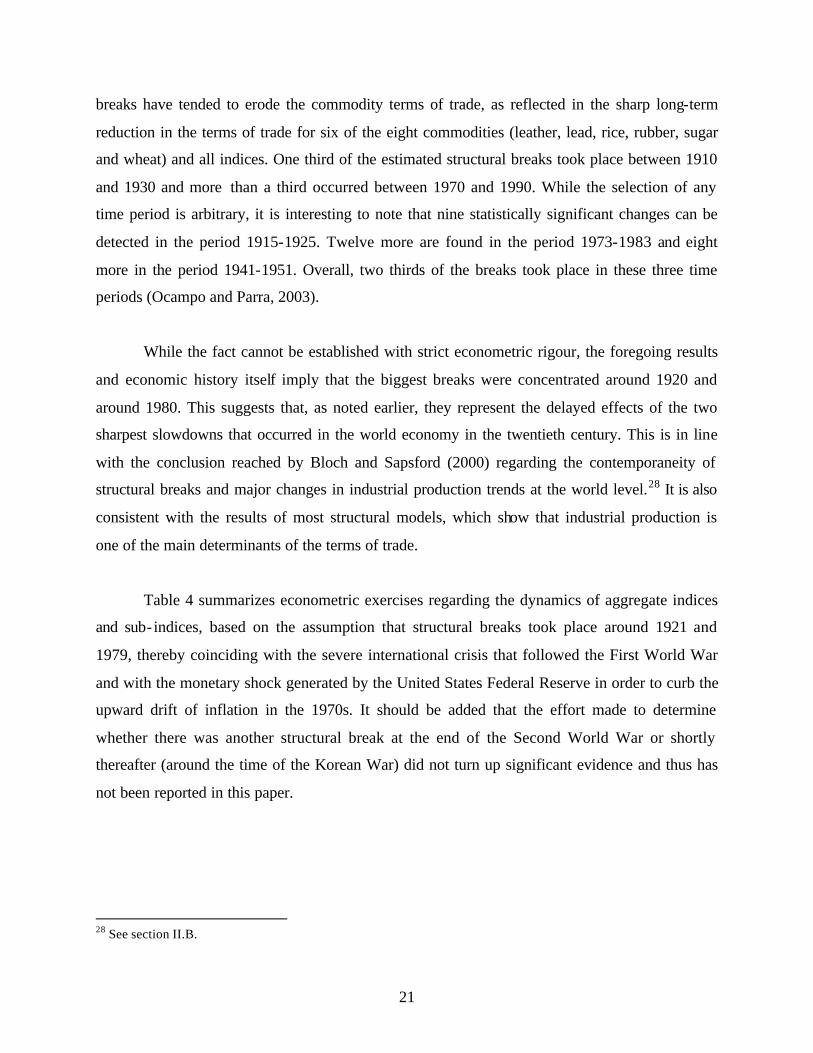
breaks have tended to erode the commodity terms of trade, as reflected in the sharp long-term
reduction in the terms of trade for six of the eight commodities (leather, lead, rice, rubber, sugar
and wheat) and all indices. One third of the estimated structural breaks took place between 1910
and 1930 and more than a third occurred between 1970 and 1990. While the selection of any
time period is arbitrary, it is interesting to note that nine statistically significant changes can be
detected in the period 1915-1925. Twelve more are found in the period 1973-1983 and eight
more in the period 1941-1951. Overall, two thirds of the breaks took place in these three time
periods (Ocampo and Parra, 2003).
While the fact cannot be established with strict econometric rigour, the foregoing results
and economic history itself imply that the biggest breaks were concentrated around 1920 and
around 1980. This suggests that, as noted earlier, they represent the delayed effects of the two
sharpest slowdowns that occurred in the world economy in the twentieth century. This is in line
with the conclusion reached by Bloch and Sapsford (2000) regarding the contemporaneity of
structural breaks and major changes in industrial production trends at the world level.28 It is also
consistent with the results of most structural models, which show that industrial production is
one of the main determinants of the terms of trade.
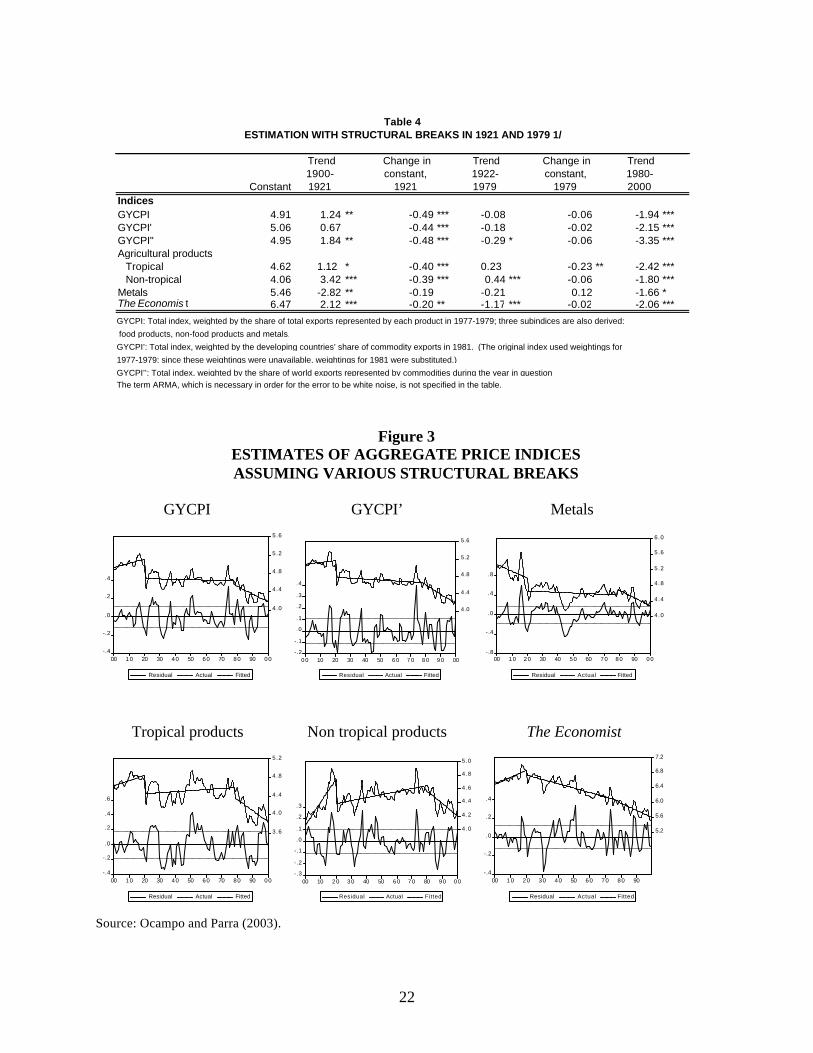
Table 4 summarizes econometric exercises regarding the dynamics of aggregate indices
and sub- indices, based on the assumption that structural breaks took place around 1921 and
1979, thereby coinciding with the severe international crisis that followed the First World War
and with the monetary shock generated by the United States Federal Reserve in order to curb the
upward drift of inflation in the 1970s. It should be added that the effort made to determine
whether there was another structural break at the end of the Second World War or shortly
thereafter (around the time of the Korean War) did not turn up significant evidence and thus has
not been reported in this paper.
28 See section II.B.
22
Figure 3 ESTIMATES OF AGGREGATE PRICE INDICES ASSUMING VARIOUS STRUCTURAL BREAKS
GYCPI GYCPI’ Metals
-.4
-.2
.0
.2
.4
4.0
4.4
4.8
5.2
5.6
00 10 20 30 40 50 60 70 80 90 00
Residual Actual Fitted
-.2
-.1
.0
.1
.2
.3
.4
4.0
4.4
4.8
5.2
5.6
0 0 10 20 30 40 50 6 0 7 0 8 0 9 0 00
Residual Actual Fitted
-.8
-.4
.0
.4
.8
4.0
4.4
4.8
5.2
5.6
6.0
00 10 20 30 40 50 60 70 80 90 00
Residual Actual Fitted
Tropical products Non tropical products The Economist
-.4
-.2
.0
.2
.4
.6
3.6
4.0
4.4
4.8
5.2
00 10 20 30 40 50 60 70 80 90 00
Residual Actual Fitted
-.3
-.2
-.1
.0
.1
.2
.3
4.0
4.2
4.4
4.6
4.8
5.0
00 10 2 0 3 0 40 50 6 0 7 0 80 9 0 0 0
Residual Actual Fitted
-.4
-.2
.0
.2
.4
5.2
5.6
6.0
6.4
6.8
7.2
00 10 20 30 40 50 60 70 80 90
Residual Actual Fitted Source: Ocampo and Parra (2003).
Constant
Trend 1900-1921
Change in constant,
1921
Trend 1922-1979
Change in constant,
1979
Trend 1980-2000
IndicesGYCPI 4.91 1.24 ** -0.49 *** -0.08 -0.06 -1.94 ***GYCPI' 5.06 0.67 -0.44 *** -0.18 -0.02 -2.15 ***GYCPI" 4.95 1.84 ** -0.48 *** -0.29 * -0.06 -3.35 ***Agricultural products Tropical 4.62 1.12 * -0.40 *** 0.23 -0.23 ** -2.42 *** Non-tropical 4.06 3.42 *** -0.39 *** 0.44 *** -0.06 -1.80 ***Metals 5.46 -2.82 ** -0.19 -0.21 0.12 -1.66 *The Economis t 6.47 2.12 *** -0.20 ** -1.17 *** -0.02 -2.06 ***
The term ARMA, which is necessary in order for the error to be white noise, is not specified in the table.
GYCPI’: Total index, weighted by the developing countries’ share of commodity exports in 1981. (The original index used weightings for
1977-1979; since these weightings were unavailable, weightings for 1981 were substituted.)
GYCPI’’: Total index, weighted by the share of world exports represented by commodities during the year in question.
Table 4ESTIMATION WITH STRUCTURAL BREAKS IN 1921 AND 1979 1/
GYCPI: Total index, weighted by the share of total exports represented by each product in 1977-1979; three subindices are also derived:
food products, non-food products and metals.
23
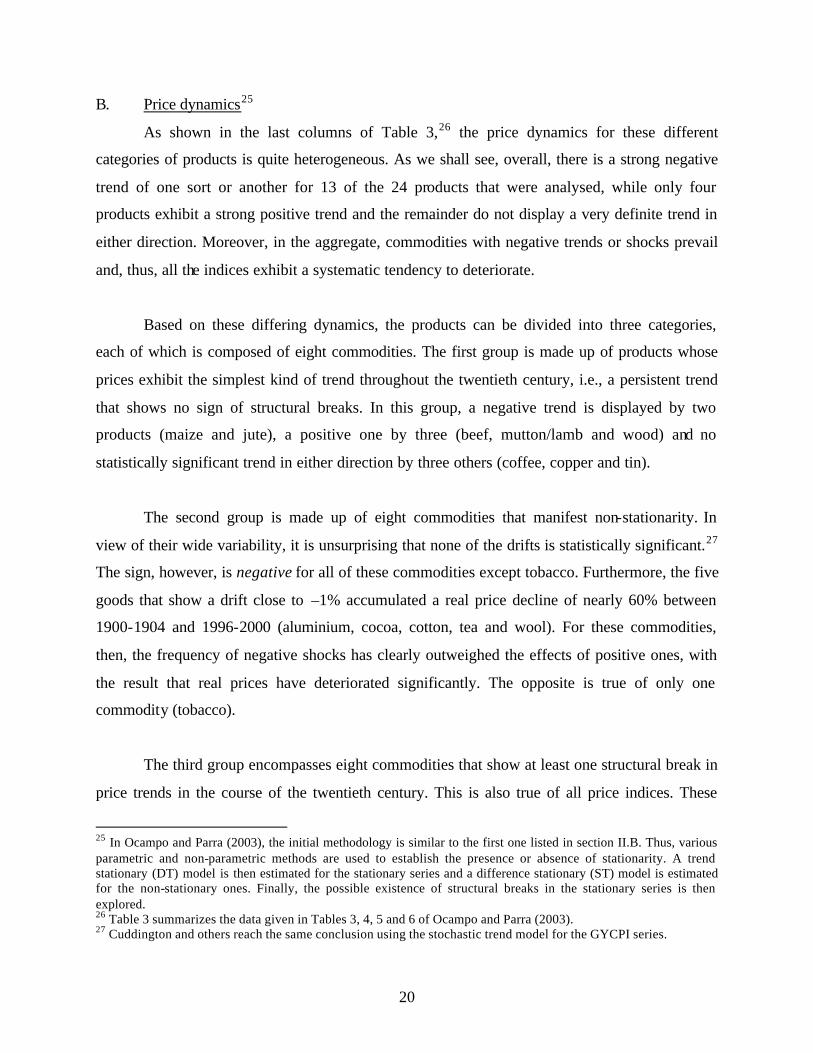
Figure 3 shows the dynamics of the various price indices in respect of the estimated trend
(including the structural breaks noted). As these estimates indicate, all agricultural (particularly
non-tropical) products became considerably more expensive up until the First World War,
whereas metals lost value.
In 1921 all the Grilli-Yang indices experienced a strong and sudden decline29 (of between
44% and 52%, depending on the aggregate index used), from which they failed to recover in
subsequent decades. In terms of product groups, metals --which had been declining in previous
decades-- were the only exception to this rule. Interestingly, this drop was followed by a long
period (1922-1979) in which aggregate price indices followed no statistically significant trend,
with the exception of non-tropical agriculture, which exhibited an upward trend. The lack of any
overall trend reflected the fact that different prices moved in opposite directions.
Finally, in contrast to what had happened in 1921, in 1979 there was no sudden drop in
prices, but rather a change in the price trend, which became strongly negative from then on (with
declines of between 2% and 3% a year for the various sub- indices). This trend was very
pronounced for tropical agricultural products, which in fact experienced a mix of a sudden drop
in prices and a downward trend thereafter. The decrease was concentrated in the early 1980s,30
which indicates that this phenomenon may have been more similar to what took place in 1921,
although it was more gradual over time.31
Lastly, it should be pointed out that the behaviour of The Economist series also involves
structural shifts, although they differ from those of the Grilli-Yang indices. In particular, the
1921 adjustment is smaller (20%), but the series shows a strong, statistically significant negative
29 Sapsford, Sarkar and Singer (1992) used the series constructed by Schlote to show that the 1921 downturn was smaller than indicated by the results obtained by Grilli and Yang (1988). This does nothing to change the fact that a structural break is found in that year or the negative character of the trend in the terms of trade, however. 30 See Maizels (1992) for an analysis of changes in raw materials prices in the 1980s. 31 This can be confirmed by means of a similar statistical exercise using the GYCPIR index, but with the addition of another structural break in 1986. In this case, a strongly negative coefficient (-5.77) is obtained for 1980-1986; a negative (-0.23) but not statistically significant coefficient is obtained for the rest of the period being analysed.
24
trend in the period 1922-1979 (-1.2% per year) which picked up speed after 1979. Thus, this
series follows a much more secular trend towards deterioration starting in the 1920s.
IV. INTERPRETATION OF THE FINDINGS IN THE LIGHT OF THE
CONTROVERSIES SURROUNDING DEVELOPMENT STRATEGIES
In a thought-provoking article, Sapsford y Chen (1998) develop a “knowledge-based
terms of trade index” that takes its initial base value as of 195032 and is thereafter increased by
one unit for the remainder of the sample period each time a major study finds evidence which is
not consistent with the P-S hypothesis and is decreased by one unit each time evidence consistent
with the P-S hypothesis emerges from a major study. An index drawn from an analysis of 12
studies (all of which are included in Table 1) shows an unmistakable decline. This indicates that
there has been a cumulative acquisition of knowledge that proves the validity of the P-S
hypothesis. The conclusion they draw is clear: “There can surely be very few hypotheses in
economics that could pass this knowledge-based sort of test with such flying colours!”
In addition, price volatility has increased in recent decades. “The twin issues of trend and
volatility in the terms of trade need to be seen if not as Siamese twin problems at least as twin
pillars of the same fundamental problem faced by less developed countries as a consequence of
their heavy dependence on primary commodities (or more recently upon components and parts
of manufactured goods) as a source of export revenue” (Sapsford y Balasubramanyam, 1999).
In a number of their papers, IMF and the World Bank have acknowledged that the terms
of trade have deteriorated,33 and two of the most prominent analysts of commodity price trends
have consequently praised these influential institutions for their awareness of this situation
(Sapsford and Singer, 1998). These two organizations’ recognition of the problem has not been
consistent, however. Some IMF writings (Cashin and McDermott, 2002, for example) contend
that the importance of terms-of-trade trends is greatly overshadowed by their marked volatility,
32 The index is “derived by taking 1950 as base (set arbitrarily equal to 10, just to be a little different)”. 33 Sapsford and Singer (1998) cite an IMF paper authored by Wilson (1994) which says: “commodity prices have been trending downward over most of the past 95 years” and “most of the commodity price declines have been too persistent to be cyclical and, for purposes of policy design, can be assumed to be permanent”.
25
while a recent World Bank essay (de Ferranti et al., 2002) asserts that “the worsening term-of-
trade effect was probably a false alarm”.
The existing body of empirical evidence, however, shows not only that this alarm is by
no means false, but that should continue to be sounded. The combination of the evidence
provided by time series analyses and by structural models provides grounds for the postulate
that, even if no persistent long-term trend can be discerned, there was in any event a stepped
decline during the twentieth century that was associated with major downturns in the world
economy.
Given the absence of a steady trend, inferences34 cannot be drawn regarding the future
behaviour of the terms of trade. However, “it does not matter very much whether the data are
interpreted as a persistent decline trend or as essentially stationary with intermittent downward
breaks. The general policy conclusion would be to emphasize the importance for developing
countries of diversification of exports into manufactures as intensively and rapidly as possible –
in other words industrialization” (Singer, 1999).
Viewed from an international vantage point, this would also indicate that policies should
be aimed at blocking growth in the supply of commodities and reducing volatility. Ironically,
however, the steps that have been taken have helped to move the market in quite the opposite
direction. Indeed, the policies of the Bretton Woods institutions have, whether intentionally or
not, promoted the production and exportation of commodities by developing countries, thereby
contributing to the deterioration of commodity prices (Lutz and Singer, 1994). These policies
have, therefore, suffered from a serious “fallacy of composition”. What is more, the move
towards free-market policies at the international level has led to the dismantlement of commodity
agreements and this, too, has heightened volatility and perhaps contributed to the decline in the
terms of trade.
Promoting the industrialization of developing countries is now –just as it was half a
century ago– the best way to avert a downward trend in the terms of trade. The effects of such
34 In the econometric sense of the term.
26
policies are not so straightforward, however, due to the implications of the second variant of the
P-S hypothesis. In effect, a number of studies on developing-country exports of manufactures
have concluded that the trend in prices for manufactured products may also be adverse. Sarkar
and Singer (1991), for example, have found evidence of a drop (of 1% per annum) in the unit
value of manufactures exported by countries in the periphery relative to those in the centre for
the period 1970-1987. Maizels, Palaskas and Crowe (1998) have concluded that the rate of
deterioration in the manufactures-manufactures net barter terms of trade (NBTT) of developing
countries has been substantially greater since 1980 than in earlier post-war decades (though
significantly lower than the corresponding rate of deterioration in the commodities-manufactures
NBTT).35 Furthermore, they show that the deterioration in the NBTT since 1980 has been
significantly less for the East Asian newly industrialized countries (NICs) and Asian near-NICs
than for Latin America and other developing regions. These authors observe that, “this difference
may well reflect, inter alia, the higher proportion of technology–intensive goods in manufactures
exports from the NICs and near NICs than in exports from other regions”. Nonetheless, both
papers indicate that the deterioration in the manufactures-manufactures NBTT of developing
countries has been more than offset by the expansion in the volume of imports of manufactures
from developing countries.
During the past 50 years, both variants of the P-S hypothesis have therefore been backed
up by compelling empirical evidence. Moreover, it has become clear that the downward trend in
the prices of commodities and even in the prices of developing countries’ manufactured exports
is one of the factors contributing to the divergence in levels of development at the world level
(Singer, 1999). Today, as in the past, industrialization seems to be the only way out for
developing countries as a group, but the available evidence also indicates that they will reap
greater benefits from this process if they manage to penetrate the market for technology-
intensive manufactures.
35 This assumes that the trends in the NBTT between the European Community and developing countries are reasonably representative of total trade in manufactures between developed and developing countries.
27
References
Ardeni, Giorgio Pier and Brian D. Wright (1992), “The Prebisch-Singer Hypothesis: A
Reappraisal Independent of Stationary Hypothesis”, Economic Journal, vol. 102. Barros, Alexandre Rands and Analice Amazonas, (1993), “On the Deterioration of the Net Barter
Terms of Trade for Primary Commodities”, UNCTAD Review, Geneve. Bleaney, Michael and David Greenaway (1993), “Long-Run Trends in the Relative Price of
Primary Commodities and in the Terms of Trade of Developing Countries”, Oxford Economic Papers 45, Oxford University Press.
Block, Harry and David Sapsford (2000), “Whither the Terms of Trade? An Elaboration of the
Prebisch-Singer Hypothesis”, Cambridge Journal of Economics, 24. (1997), “Some Estimates of Prebisch and Singer Effects on the Terms of Trade Between
Primary Producers and Manufacturers, World Development, vol. 25. (1996), “Trend in the International Terms of Trade Between Primary Producers and
Manufacturers”, Journal of International Development, vol. 8, No. 1, Wiley, January-February.
(1990-1991), “Post-War Movements in Prices of Primary Products and Manufactured
Goods”, Journal of Post Keynesian Economics, vol. 14. Borensztein, Eduardo and Carmen M. Reinhart (1994), “The Macroeconomic Determinants of
Commodity Prices”, IMF Staff Papers, vol. 41, No. 2, Washington, D.C., June. Boughton, James M. (1991), “Commodity and Manufactures Prices in the Long Run”, IMF
Working Paper WP/91/47, Washington, D.C., International Monetary Fund, May. Braun, Oscar (1973), Comercio internacional e imperialismo, Buenos Aires, Siglo XX. Cashin, Paul and C. John McDermott (2001), “The Long-Run Behavior of Commodity Prices:
Small Trends and Big Variability”, IMF Working Paper WP/01/68, Washington, D.C., May.
Chen, John-ren and Herbert Stocker (1998), “A Contribution to Empirical Research on the
Prebish-Singer Thesis”, in David Sapsford and John-ren Chen (eds.), Development Economics and Policy, London and New York, MacMillan/St. Martin’s Press.
Chu, Ke-Young and Thomas K. Morrison (1986), “World Non-Oil Primary Commodity
Markets: A Medium-Term Framework of Analysis”, IMF Staff Papers, vol. 33, No. 1.
28
Cuddington, John T. (1992), “Long-Run Trends in 26 Primary Commodity Prices”, Journal of Development Economics, 39, North-Holland.
and Hong Wei (1992), “An Empirical Analysis of Real Commodity Price Trends:
Aggregation, Model Selection, and Implications”, Estudios Económicos 7, 2, July-December.
and Carlos M. Urzúa (1988), “Ciclos y tendencias en los términos netos de intercambio:
un nuevo enfoque”, Estudios Económicos, vol. 3, No. 2, El Colegio de México, Mexico, July-December.
, Rodney Ludema and Shamila Jayasuriya (2002), “Reassessing the Prebisch-Singer
Hypothesis: Long-Run Trends with Possible Structural Breaks at Unknown Dates”, Georgetown University Working Paper, October.
Darity, William (1990), “The Fundamental Determinants of the Terms of Trade Reconsidered:
Long-Run and Long-Period Equilibrium”, American Economic Review, 80. De Ferranti, David, Guillermo E. Perry, Daniel Lederman, and William F. Maloney (2002),
From Natural Resources to the Knowledge Economy: Trade and Job Quality, Washington, D.C., World Bank Latin American and Caribbean Studies, Viewpoints.
Emmanuel, Arghiri (1972), Unequal Exchange, New York, Monthly Review Press. Evans, David (1987), “The Long-Run Determinants of North-South Terms of Trade and Some
Recent Empirical Evidence”, World Development, vol. 15. Findlay, Ronald (1981), “The Fundamental Determinants of the Terms of Trade”, in Sven
Grassman and Erik Lündberg (eds.), The World Economic Order: Past and Prospects, London, Macmillan.
(1980), “The Terms of Trade and Equilibrium Growth in the World Economy”, American
Economic Review, 70. Grilli, Enzo R. and Maw Cheng Yang (1988), “Primary Commodity Prices, Manufactured Goods
Prices, and the Terms of Trade of Developing Countries: What the Long Run Shows”, The World Bank Economic Review, vol. 2, No. 1, January.
Hadass, Yael S. and Jeffrey G. Williamson (2001), “Terms of Trade Shocks and Economic
Performance 1870-1940: Prebisch and Singer Revisited”, NBER Working Paper Series 8188, Cambridge, MA., March.
Helg, Rodolfo (1991), “A Note on the Stationarity of the Primary Commodities Relative Price
Index”, Economics Letters 36, North-Holland.
29
Johnson, Harry G. (1954), “Increasing Productivity, Income-Price Trends and the Trade Balance”, reprinted in International Trade and Economic Growth, Cambridge, MA., Harvard University Press (1967).
León, Javier and Raimundo Soto (1995), “Structural Breaks and Long-Run Trends in
Commodity Prices”, Policy Research Working Paper 1406, The World Bank, January. Lewis, W. Arthur (1977), The Evolution of the International Economic Order, Princeton, N.J.,
Princeton University Press. Lutz, Matthias G. (1999), “A General Test of the Prebisch-Singer Hypothesis”, Review of
Development Economics, vol. 3. (1996), “Primary Commodity and Manufactured Goods Prices in the Long Run: New
Evidence on the Prebisch-Singer Hypothesis”, Discussion Papers in Economics, Department of Economics, University of Sussex, March.
Lutz, Matthias G. and H. W. Singer (1994), “The Link Between Increased Trade Openness and
the Terms of Trade: An Empirical Investigation”, World Development, vol. 22, No. 11. Maddison, Angus (1995), Monitoring the World Economy 1820-1992, París, OECD
Development Centre. Maizels, Alfred (1994), “Commodity Market Trends and Instabilities: Policy options for
Developing Countries”, UNCTAD Review. (1992), “The Commodity Price Collapse of the 1980s” and “The Impact on the
Developing Countries’”, Commodities in Crisis: The Commodity Crisis of the 1980s and the Political Economy of International Commodity Policies, chapters 1 and 2, Oxford, Oxford University Press.
, Theodosios B. Palaskas and Trevor Crowe (1998), “The Raúl Prebisch-Singer
Hypothesis Revisited”, in David Sapsford and John-ren Chen (eds.), Development Economics and Policy, London and New York, MacMillan/St. Martin’s Press.
Molana, Hassan and David Vines (1989), “North-South Growth and the Terms of Trade: A
Model on Kaldorian Lines”, The Economic Journal, 99, June. Newbold, Paul and Dimitros Vougas (1996), “Drift in the Relative Price of Primary
Commodities: A Case Where we Care About Unit Roots”, Applied Economics, 28, Chapman & Hall.
Nguyen, The-Hiep (1981), “Trends in Terms of Trade of LDCs”, Journal of Economic Studies,
vol. 8, No. 2.
30
Ocampo, José Antonio (1993), "Terms of Trade and Center-Periphery Relations", in Osvaldo Sunkel (ed.), Development from Within: Toward a Neostructuralist Approach for Latin America, Boulder and London, Lynne Rienner Publishers.
(1986), “New Developments in Trade Theory and LDCs”, Journal of Development
Economics, 22, North-Holland. and María Angela Parra (2003), “Returning to an Eternal Debate: The Terms of Trade for
Commodities in the Twentieth Century”, ECLAC, Serie Informes y Estudios Especiales, No. 5, Santiago, February.
Powell, Andrew (1991), “Commodity and Developing Country Terms of Trade: What Does the
Long Run Show?”, The Economic Journal, 101, November. Prebisch, Raúl (1950), The Economic Development of Latin America and its Principal Problems,
New York, United Nations. Reprinted in Economic Bulletin for Latin America, 7 (1962). Reinhart, Carmen and Peter Wickham (1994), “Commodity Prices: Cyclical Weakness or
Secular Decline?”, IMF Staff Papers, vol. 41, No. 2. Sapsford, David (1985), “The Statistical Debate on the Net Barter Terms of Trade Between
Primary Commodities and Manufactures: A Comment and Some Additional Evidence”, The Economic Journal, 95, September.
_____ (1987), A Simple Model of Primary Commodity Price Determination: 1900-80, in The
Journal of Development Studies, vol. 23, No 2. and V. N. Balasubramanyam (1999), “Trend and Volatility in the Net Barter Terms of
Trade: New Results From the Application of a (Not So) New Method”, Journal of International Development, vol. 11, No. 6.
(1994), “The Long-Run Behavior of the Relative Price of Primary Commodities:
Statistical Evidence and Policy Implications”, World Development, vol. 22, No. 11. ______ and Hans W. Singer (1998), “The IMF, the World Bank and Commodity Prices: A Case
of Shifting Sands?, World Development, Vol. 26, No 9. and John-ren Chen (1998), “The Prebisch-Singer Terms of Trade Hypothesis: Some
(Very) New Evidence”, in David Sapsford and John-ren Chen (eds.), Development Economics and Policy, London and New York, MacMillan/St. Martin’s Press.
, Prabirjit Sarkar and Hans W. Singer (1992), “The Prebisch-Singer Terms of Trade
Controversy Revisited”, Journal of International Development, vol. 4, No. 3. Sarkar, Prabirjit (1986), “The Singer-Prebisch Hypothesis: A Statistical Evaluation”, Cambridge
Journal of Economics, 10.
31
and Hans W. Singer (1991), “Manufactured Exports of Developing Countries and their
Terms of Trade Since 1965”, World Development 19 (4). Scandizzo, Pasquale L. and Dimitris Diakosawas (1987), “Instability in the Terms of Trade of
Primary Commodities, 1900-1982”, FAO Economic and Social Development Paper 64. Singer, Hans W. (1999), “Beyond Terms of Trade – Convergence and Divergence”, Journal of
International Development, vol. 11, No. 6, September-October. _____ (1991), “Terms of Trade: New Wine and New Bottles?”, Development Policy Review,
Vol. 9. (1950), “The Distribution of Gains Between Investing and Borrowing Countries”,
American Economic Review, 40. Also published in David Greenaway and C.W. Morgan (eds.), The Economics of Commodity Markets, Cheltenham, Edward Elgar, 1999.
Spraos, John (1983), “El deterioro de la relación de intercambio: algunas perspectivas”, Estudios
Internacionales, Año XVI, No 62, Santiago, April-June. (1980), “The Statistical Debate on the Net Barter Terms of Trade Between Primary
Commodities and Manufactures”, The Economic Journal, 90. Taylor, Lance (1983), Structuralist Macroeconomics, New York, Basic Books. Thirlwall, A. P. and J. Bergevin (1985), “Trends, Cycles and Asymmetries in the Terms of Trade
of Primary Commodities from Developed and Less Developed Countries”, World Development, Vol. 13 No. 7.
Von Hagen, Juergen (1989), “Relative Commodity Prices and Cointegration”, Journal of
Business and Economic Statistics, vol. 7, No. 4, American Economic Association, October.
Wilson, S. (1994) “Adjustment, Not Resistance, the Key to Dealing with Low Commodity Prices
IMF Survey, October. Ziesemer, Thomas (1998), “Economic Development and Endogenous Terms-of-Trade
Determination: Review and Reinterpretation of the Raúl Prebisch-Hans W. Singer Thesis”, in UNCTAD Review, 1995.