


Bahasa
Halaman
Hukum


Selected Conference Proceedings Editors: Professor Helena Titheridge and Dr Priti Parikh
3rd International Conference on Urban Sustainability and Resilience
13-14 June 2017 UCL, London
1
LIST OF CONTENTS
PRACTICE PAPERS
1 . Sustainable and Resilient Infrastructure: How an integrated, plan-led approach is vital for long-
term and inclusive outcomes. ......................................................................................................... 2
2. Child-centred hazard, vulnerability and capacity assessment and planning in urban settings .... 17
3. Using rural post-disaster recovery experiences to reflect on research opportunities for
understanding self-recovery in urban environments ................................................................... 26
RESEARCH PAPERS
4. Infrastructure Interdependencies: Opportunities from Complexity ............................................. 40
5. Assessing the ‘governance grip’ of combined authorities for integrated infrastructure provision
in the UK ........................................................................................................................................ 52
6. Articulating circular economy dimensions in space: six case studies ........................................... 65
7. A methodological proposal to evaluate the enviromental footprint of cities .............................. 80
8. Human waste management, storage and disposal in Nigeria: Implications to residential
apartments in Ikeja, Lagos ............................................................................................................ 92
9. Development of social capital management approach with resident participation using
improved resource generator method ....................................................................................... 107
10. Towards resilient offshore wind farms ....................................................................................... 117
11. A new approach to prediction of satisfaction: A means to improve sustainability and resilience
of public services ......................................................................................................................... 130
12. Microbial fuel cells for the micro generation of electricity and biomethane from organic
waste...........................................................................................................................................143
List of Authors ..................................................................................................................................... 151
2
1. SUSTAINABLE AND RESILIENT INFRASTRUCTURE: HOW AN INTEGRATED, PLAN-LED APPROACH IS VITAL FOR LONG-TERM AND INCLUSIVE OUTCOMES.
Jonathan Essex1 1 IMC Worldwide, 64-68 London Road, Redhill, Surrey, RH1 6HG, UK
ABSTRACT. This paper starts by exploring how resilience relates to infrastructure.
Resilience is both a property of something, but also what it connects to: what it is
for. This wider context extends from an individual structure such as a bridge, to
whole infrastructure systems and how they interact. These connections are affected
by climate change, which is increasing disaster risks and other slow-onset impacts.
Longer-term resilience requires economic pathways to prioritise sustainability and
inclusiveness over infrastructure-led growth, which increasingly, due to resource
constraints, tends to increase inequality. This requires positive plan-led approaches
that constrain infrastructure within carbon and resource budgets, and link to spatial
planning. Resilience is then responding not just to disasters but climate and
environmental limits. And in the realism of accepting that increasing future disasters
are inevitable but maximising equitable carbon emissions reduction needed to avoid
overall climate catastrophe it is a concept that can engender hope.
Keywords: Resilience, Infrastructure, Climate, Sustainability, Development, Hope.
1. INTRODUCTION
As I write this Hurricanes Harvey, Irma and Jose are breaking records as they leave a string
of destruction in their wake. Climate change is magnifying the severity and impact of natural
hazards now – and as we continue to stoke global warming most likely to cause even greater
impacts in the future. This requires a response that results in a different approach to how we
make long-term decisions around what kind of future we invest in and build. How can
investment in a bridge, designed to last 120 years be resilient over its whole design life? How
does resilience to the vision for a city and its linked infrastructure and development plans?
Can rapid urbanisation of a city in a coastal flood plain be resilient as sea levels rise? How
can urban areas be resilient as they concentrate and consume resources and energy on a
global scale? In this context, what does resilience, in relation to infrastructure really mean?
The rest of this paper is structured as follows:
Section 2 proposes that there is a danger of too narrow a consideration of resilience.
In the context of infrastructure there is a need to ensure that this is not just the
resilience of infrastructure but also what infrastructure development is for.
Section 3 explores the impact of considering resilience over the longer-term, and how
this implies a close relationship between resilience and sustainability.
Finally, section 4 explores the consequences of planning infrastructure development
that is both sustainable and resilient. This highlights the need for different investment
choices, spatial planning to link economic decisions to social and environmental
outcomes and for redirecting overall development pathways.
3
This paper builds on research to summarise and signpost overall approaches to
resilience internationally for the UK Department for International Development [1].
2. THE RESILIENCE OF INFRASTRUCTURE INVESTMENT
2.1 Distinguishing between the resilience of infrastructure and what it’s for
Resilience brings together disaster risks and climate risks. The widely accepted UN definition
for resilience is:
“The ability of a system, community or society exposed to hazards to resist, absorb,
accommodate to and recover from the effects of a hazard in a timely and efficient manner,
including through the preservation and restoration of its essential basic structures and
functions”. [2]
The resilience of infrastructure is reflected in the Sustainable Development Goals, notably
Goal 11, which sets a target for provision of resilient infrastructure and Goal 9, which aims to
make cities and human settlements inclusive, safe, resilient and sustainable [3]. These goals
require infrastructure to be resilient in two ways:
Firstly, the resilience of the infrastructure itself – and how it contributes to economic
benefits; and
Secondly, what does infrastructure affect and what is it for. This considers how
infrastructure affects the wider resilience of other infrastructure systems, as well as the
sustainability, resilience and livelihood options of individuals, households and
communities: directly and indirectly, now and into the future.
This paper explores the importance of both these aspects. How these two aspects are applied
to different scales of infrastructure are explored in section 2.2, before exploring wider aspects
of resilience in section 3 below.
2.2 Resilience of infrastructure: from infrastructure elements to a nexus of infrastructure systems.
Firstly, for infrastructure, and wider infrastructure systems, to be resilient, they must be
resilient in and of themselves. This depends on different aspects, including:
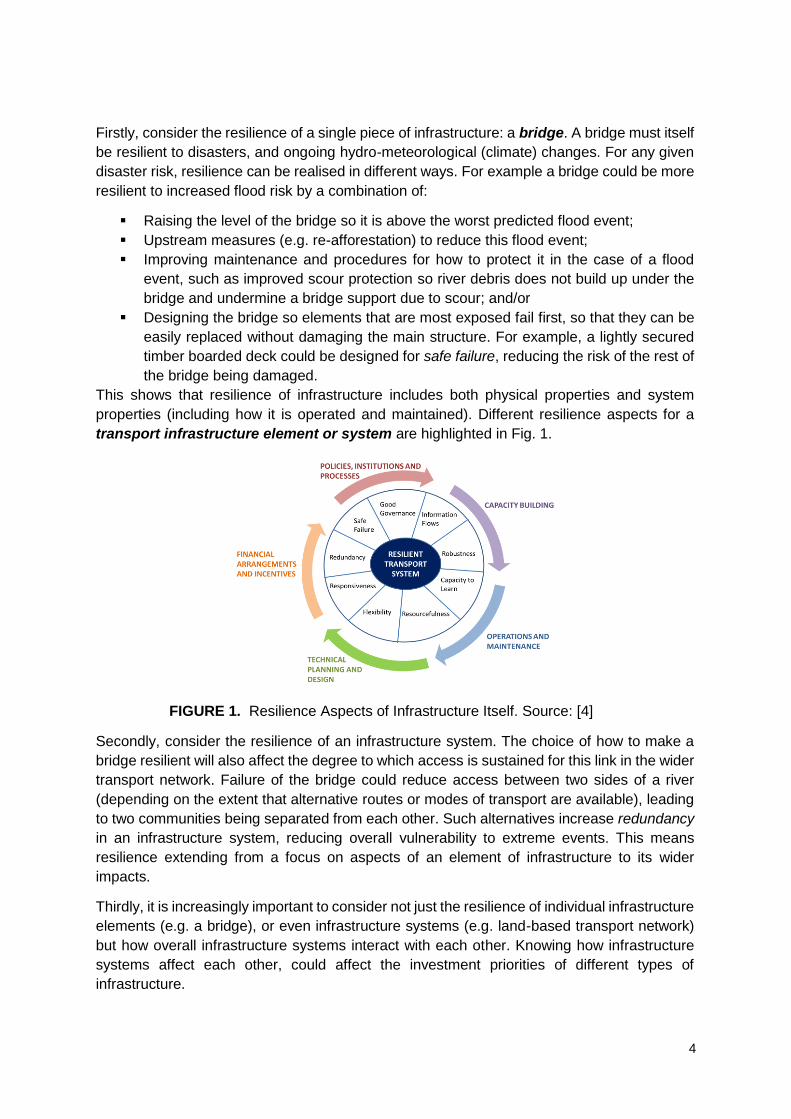
Technical specification. This is reflected in its design and construction;
Serviceability. Infrastructure systems should be planned to be operational at an
appropriate level of serviceability, such as during or immediately after a disaster (which
could entail a shift in performance specifications). Also it is vital to ensure that existing
assets are properly maintained – and improved to cope with increased shocks and
stresses over their lifetime; and
Institutional support. The institutions that are responsible for building and
maintaining this infrastructure should have the capacity and skills needed.
These aspects are highlighted for transport infrastructure in Fig. 1.
These aspects of resilience apply at different scales, such as:
An infrastructure element – a bridge;
An infrastructure system – a transport network; and
Connected infrastructure systems – how different systems interact.
4
Firstly, consider the resilience of a single piece of infrastructure: a bridge. A bridge must itself
be resilient to disasters, and ongoing hydro-meteorological (climate) changes. For any given
disaster risk, resilience can be realised in different ways. For example a bridge could be more
resilient to increased flood risk by a combination of:
Raising the level of the bridge so it is above the worst predicted flood event;
Upstream measures (e.g. re-afforestation) to reduce this flood event;
Improving maintenance and procedures for how to protect it in the case of a flood
event, such as improved scour protection so river debris does not build up under the
bridge and undermine a bridge support due to scour; and/or
Designing the bridge so elements that are most exposed fail first, so that they can be
easily replaced without damaging the main structure. For example, a lightly secured
timber boarded deck could be designed for safe failure, reducing the risk of the rest of
the bridge being damaged.
This shows that resilience of infrastructure includes both physical properties and system
properties (including how it is operated and maintained). Different resilience aspects for a
transport infrastructure element or system are highlighted in Fig. 1.
FIGURE 1. Resilience Aspects of Infrastructure Itself. Source: [4]
Secondly, consider the resilience of an infrastructure system. The choice of how to make a
bridge resilient will also affect the degree to which access is sustained for this link in the wider
transport network. Failure of the bridge could reduce access between two sides of a river
(depending on the extent that alternative routes or modes of transport are available), leading
to two communities being separated from each other. Such alternatives increase redundancy
in an infrastructure system, reducing overall vulnerability to extreme events. This means
resilience extending from a focus on aspects of an element of infrastructure to its wider
impacts.
Thirdly, it is increasingly important to consider not just the resilience of individual infrastructure
elements (e.g. a bridge), or even infrastructure systems (e.g. land-based transport network)
but how overall infrastructure systems interact with each other. Knowing how infrastructure
systems affect each other, could affect the investment priorities of different types of
infrastructure.

5
Savage et al [5] highlight the way that energy, water and land systems are interconnected.
This is also reflected in ways in which different infrastructure types interact, when faced with
disasters and climate change. For example, in 2015, flooding in Lancaster of an electricity
sub-station led to a mobile phone black-out and power outages across the city. The hinges of
electronic entrance doors into student accommodation had to be cut using handsaws to gain
entry. Some hotel rooms were not able to be used as temporary accommodation for people
whose homes were flooded as they had electronic card-operated doors. Meanwhile, the wind
turbine at Lancaster University continued to turn and generate electricity but this could not be
used as there was no local off-grid system to provide back-up power. This is reflected in this
extract [6].
“The impacts [following the flood event on 5-8 December 2015] strike me as being
quite different from the power blackouts I experienced as a child during the 1970s and
1980s, perhaps because they were less anticipated, perhaps because our
dependence these days on the internet and telecommunications is profound, or
perhaps because one impact led to another in a cascade.”
This leads to a consideration not just of the resilience of infrastructure itself, but how this
affects the sustainability and resilience of the wider society and environment. For example,
increasing the resilience of ‘critical infrastructure’1 to flooding may increase flood risk in other
areas. Therefore, a focus on the climate (and disaster) resilience of infrastructure may not
only change the nature of infrastructure itself, but lead to a shift in the mix of infrastructure
needed for sustainable communities.
Similarly, there are interconnections in how different infrastructure sectors contribute to
carbon emissions, and impact long-term sustainability and overall resilience of built
environments, such as cities in vulnerable areas. The IPCC working group 3 chapter on
human settlements, infrastructure and spatial planning [7] notes that:
The global expansion of infrastructure used to support urbanisation is a key driver of
[greenhouse gas] emissions across multiple sectors. Due to the high capital costs,
increasing returns, and network externalities related to infrastructures that provide
fundamental services to cities, emissions associated with infrastructure systems are
particularly prone to lock-in … especially for energy and transportation Infrastructure.
OECD funded research [8] sets out the need to focus not just on the climate resilience of
infrastructure, but to prioritise infrastructure for low-carbon and climate resilient development.
For example, investment that is climate resilient and low-carbon will shift investment priorities
between sectors, increasing (renewable) energy and water investment. Increasing overall built
environment resilience (e.g. for a rural and/or urban area) will require new solutions, to
leapfrog current infrastructure solutions or provide resilience where it is lacking. For example,
renewable energy is both a more resilient and sustainable energy solution (and also more
cost-effective) than the diesel generator sets used by the UN in most refugee camps. Similarly
off-grid and decentralised renewable energy systems can now run at lower unit costs than
large-scale thermal power plants.
1 Critical infrastructure is defined as [2]: ‘The primary physical structures, technical facilities and systems which are socially, economically or operationally essential to the functioning of a society or community, both in routine circumstances and in the extremes of an emergency’.

6
This focus of not just the resilience of an investment but how it interconnects with the existing
built (and natural) environment, communities and ways of life: what development is for. This
means that resilience does not just require changes to the specification of the physical new
(and existing) built environment, but a completely different approach to planning and
investment, and one that addresses disaster and climate resilience together. This is explored
below, and requires long-term thinking.
3. LONG-TERM RESILIENCE
3.1 How does climate change impact the disaster management cycle?
The traditional disaster management cycle, sets out how disaster preparedness, relief and
recovery are needed – for one disaster at a time (see Fig 2.).
FIGURE 2. Disaster Management Cycle (Recovery from Shock). Source: Author
Best practice considers how this cycle should increase resilience as households ‘bounce back
better’ [9] and infrastructure is ‘built back better [10]. But this focus on disasters alone, does
not recognise the increasing frequency, severity and unpredictability of climate-related
disasters, or slow-onset climate impacts such as temperature rise and sea level rise. A climate
disaster cycle must look further into the future. Climate change will progressively reduce
resilience. Increasing recovery costs (in social and environmental, as well as financial terms)
will change what infrastructure is affordable. The IPCC [11] highlights that a focus on
improving financial resilience (such as through insurance) can neglect wider resilience,
especially as climate impacts become more widespread, and not drive the transformation
needed to improve longer-term resilience.
3.2 Longer term thinking.
Longer term thinking changes decision making. Ranger [12] cites the Thames 2100 project
[13], which found that climate risk varies significantly with time. This means that extending the
infrastructure design life changes the preferred infrastructure choice (see Fig. 3). The
researchers (UK Met Office) also highlighted that as climate projections will (also) change, the
solutions chosen should be adaptable.

7
FIGURE 3. Sufficiency of Solutions Depends on Design Life. Source [12].
This conclusion should be applied to physical (including urban) planning. Longer-term
planning is needed for both the location and type of infrastructure, housing and wider built
environment choices. In most places planning is not sufficiently long-term (or enforced). For
example, dredging for real estate development in the flood plain on one side of Dhaka, whilst
a dyke only protects the other side from flooding is not sustainable. Dasgupta et al [14],
studying how Bangladesh’s infrastructure might be climate proofed, concluded by highlighting
the need to focus not on the gap in infrastructure for growth but that to address an outstanding
climate adaptation deficit.
A different approach is needed for the built environment to better withstand disasters in future.
As the extent of climate mitigation will affect long-term climate impacts, an effective strategy
to deliver long-term resilience requires climate mitigation and adaptation to be delivered
together. One example of this approach is in Kolkata, whose city corporation has declared it
will adopt a new development pathway that is low-carbon and climate resilient [15]. However,
unless such plans are sufficiently precautionary and long-term in terms of both likely climate
impacts and carbon emissions reduction they might not ensure resilience in the longer-term
(see Box 1).
Box 1. The need for a precautionary approach to future climate risk: Kolkata.
Kolkata’s 2015 plan is based on data from the 2007 Fourth Assessment of the IPCC (AR4).
As this only considers 0.27m of sea level rise (by 2050) it very likely underestimates sea
level rise as it underplays the impact of future thermal expansion of oceans, glacier
collapses on Greenland, and accelerating Antarctic melt (From 2012 over 60% of new sea
level rise estimates account for such contributions, reflecting new science set out by [16]).
For example, the 2017 USA National Oceanic and Atmospheric Administration [17]
presents the current knowledge of Antarctic and Greenland positive feedbacks modelling
and highest rates of plausible additional global mean sea level rises, now project a 2m sea

8
level rise by 2100 under the “business-as-usual” scenario RCP8.5. Planning for Kolkata’s
future based on decade-old data could lead planners to underestimate future sea level rise
risks, as well as the associated economic losses of floods worsened by high sea level
increases.
Therefore, such an approach requires taking a different and longer-term approach to ensuring
future livelihood and infrastructure resilience. This includes both planning for greater
greenhouse gas emissions reductions to strive together globally to meet the lowest global
carbon emissions cap, while being realistic about what the current climate projections could
entail.
In Bangladesh, this approach might challenge the presumption that development will continue
to be concentrated around the capital, Dhaka. Reviewing the extent to which urbanisation (in
particular, in such a climate vulnerable location) is sustainable and resilient in the long term
will require a different development pathway, not just at the city but at country and international
levels.2
Kennedy and Corfee-Morlot [18] propose comprehensive national strategic plans coupled with
national climate change goals that prioritise investment differently. Such an approach for
spatial planning in the most vulnerable parts of Bangladesh is proposed in the Bangladesh
Delta Plan 2100 [19], but it is not clear to what extent this will change the current trends in
urban and infrastructure development. An alternative strategy could direct growth away from
large cities, in a sustainable manner. Such an approach requires resilience to be part of an
overall planned goal: sustainable, inclusive and resilient.
4. SUSTAINABLE, INCLUSIVE AND RESILIENT ECONOMIC PATHWAYS
4.1 Combining social and environmental goals: sustainable, inclusive and resilient
As outlined above, maximising climate mitigation (greenhouse gas emission reductions) will
reduce some of the increasing scale and magnitude of future climate disasters [20]. This in
turn requires us to shift to ways of living across the world that can be sustained within
environmental limits. This requires a planned approach: not just spatially but in terms of
energy and resource use across all sectors - to shift the scale of resource use globally to
within our planet’s stock of sustainable and renewable resources [21]. Thus for resilience to
be sustained, it must be environmentally sustainable. This requires a reduction in the overall
level of resource consumption (as well as greenhouse gas emissions), which could either:
Reduce the resilience and livelihoods of the poorest (households, geographic areas,
countries) first, increasing inequality. To some extent this is already happening [22],
and will likely increase social tensions and global instability; or
Create more resilient communities and economies (both within and between countries)
by increasing equality at the same time as reducing resource and energy consumption,
which could improve the wellbeing of all [23]3.
2 As some (particularly low-lying and hot) countries become increasingly precarious and/or inhabitable. 3 Some argue that it is best to reduce poverty first and then climate and environmental issues later [42], but this risks locking-in climate emissions through infrastructure choices, as considered below.

9
Achieving this second option requires a focus on improving the livelihoods (social
sustainability) of the poorest whilst reducing the resource and energy use (environmental
sustainability) of middle-income and richest households and societies globally. Thus, a
resilient approach must also be inclusive.
This aim is consistent with existing long-term national strategies such as the UK sustainability
strategy’s twin aim to improve quality of life for all within environmental limits: [24] as well as
various global agreements on climate change [25], disaster resilience [26] and wider
sustainability [27], [28]. However, it is not reflected in mainstream political decision making
which prioritises economic growth and infrastructure investment, using tools such as cost-
benefit analysis. Therefore, whilst planning to keep our urban areas (and wider economies)
within climate limits, sustainable, inclusive and resilient is both feasible and consistent with
stated goals, it is not currently sufficiently integrated into our decision making.
Improving the livelihoods (and resilience) of the poorest whilst reducing overall climate
emissions and impacts requires different priorities to underpin economic decisions. This
requires richer countries, urban areas and households to reduce their (still increasing) levels
of consumption of environmental resources most. This will require a shift from providing more
infrastructure (which tends to lock-in higher mobility and consumption for those able to afford
it most) to investing in different and less infrastructure overall.
Only limited infrastructure improvements are needed to improve the quality of life and
happiness of the poorest now - as research shows that quality of life [29] and happiness [30]
only increase up to a certain consumption level. This means a wider shift in infrastructure
provision can focus on enabling more sustainable and resilient employment and ways of living,
that enable better longer-term freedom and security. So, before planning how to adapt
infrastructure and wider development priorities4 to be as resilient as possible, we should plant
to unlock economic pathways and allow them to be sufficiently socially and environmentally
sustainable.
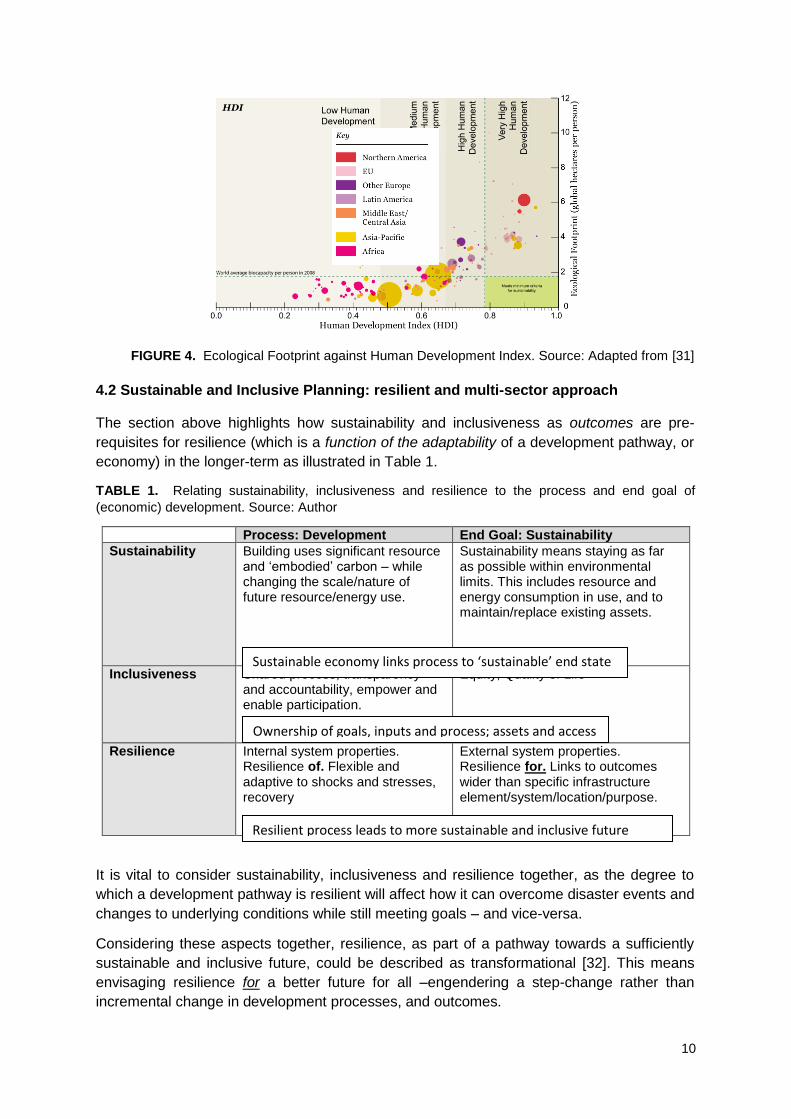
Mapping outcomes of different existing approaches (now and historically) indicates what
economic pathways are sustainable and inclusive – and therefore have the potential to also
be resilient. WWF [31] contrasts the social and environmental metrics for different countries,
and highlights that it is possible to be sustainable environmentally whilst having good social
outcomes (contrast countries in Fig. 4).
Applying this at different scales from the household and community, to city, region and global
scales highlights that reducing the scale of infrastructure tends to improve sustainability and
resilience. To reflect this in decisions by governments and others as to how much and what
type of infrastructure is needed, a different goal is needed.
4 As well as production and consumption.
10
FIGURE 4. Ecological Footprint against Human Development Index. Source: Adapted from [31]
4.2 Sustainable and Inclusive Planning: resilient and multi-sector approach
The section above highlights how sustainability and inclusiveness as outcomes are pre-
requisites for resilience (which is a function of the adaptability of a development pathway, or
economy) in the longer-term as illustrated in Table 1.
TABLE 1. Relating sustainability, inclusiveness and resilience to the process and end goal of
(economic) development. Source: Author
Process: Development End Goal: Sustainability
Sustainability Building uses significant resource and ‘embodied’ carbon – while changing the scale/nature of future resource/energy use.
Sustainability means staying as far as possible within environmental limits. This includes resource and energy consumption in use, and to maintain/replace existing assets.
Inclusiveness
Shared process, transparency and accountability, empower and enable participation.
Equity, Quality of Life
Resilience Internal system properties. Resilience of. Flexible and adaptive to shocks and stresses, recovery
External system properties. Resilience for. Links to outcomes wider than specific infrastructure element/system/location/purpose.
It is vital to consider sustainability, inclusiveness and resilience together, as the degree to
which a development pathway is resilient will affect how it can overcome disaster events and
changes to underlying conditions while still meeting goals – and vice-versa.
Considering these aspects together, resilience, as part of a pathway towards a sufficiently
sustainable and inclusive future, could be described as transformational [32]. This means
envisaging resilience for a better future for all –engendering a step-change rather than
incremental change in development processes, and outcomes.
Sustainable economy links process to ‘sustainable’ end state
Ownership of goals, inputs and process; assets and access
Resilient process leads to more sustainable and inclusive future
11
One key aspect of sustainability is the extent to which investment is used to drive an
unsustainable or sustainable economy (in terms of resource use, energy and carbon
emissions, employment and equity). Instead of increasing infrastructure that maximises
economic returns, infrastructure investment should be limited to that which delivers sufficient
reduction of carbon emissions on energy and resource invested whilst also increasing
inclusivity, and being sufficient adaptable to withstand potential disasters and future slow-
onset changes. This means that investment choices and urban planning that is more about
facilitating better quality of life with fewer resources.
Different decision making tools and approaches are needed to plan development that reduces
total resources and energy use, within a carbon budget. This should limit investment in
infrastructure to that which reduces future emissions (e.g. renewable energy), avoiding that
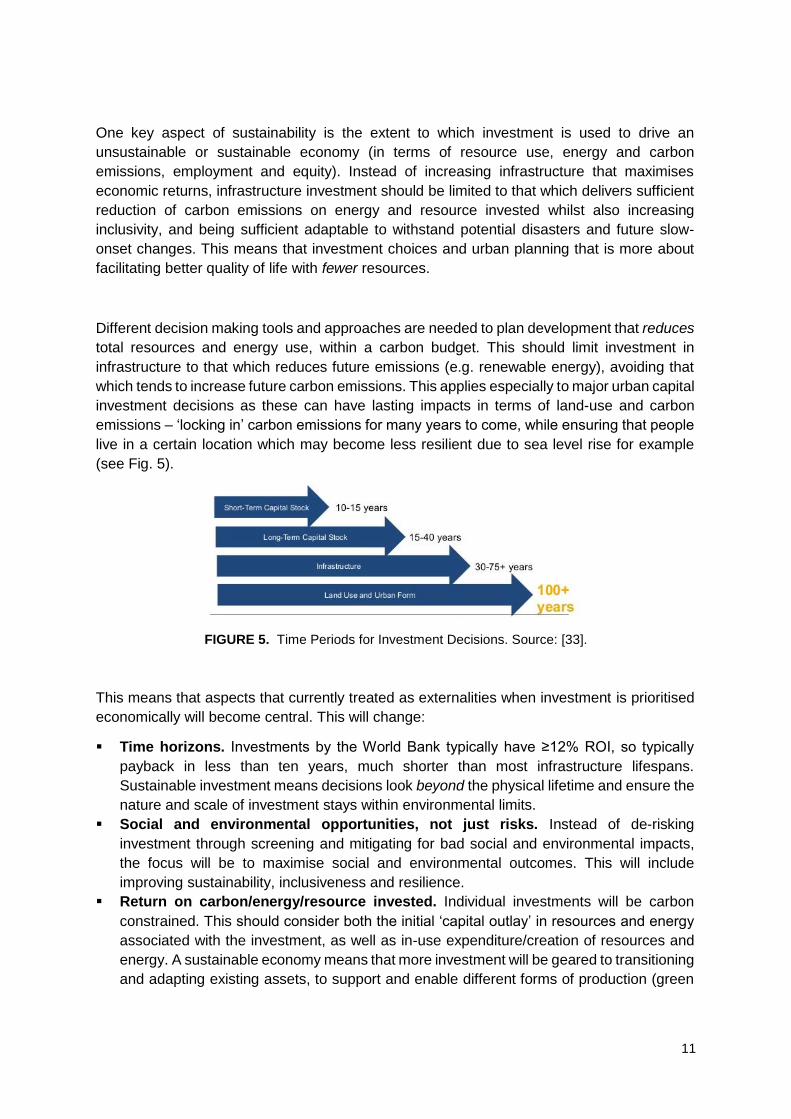
which tends to increase future carbon emissions. This applies especially to major urban capital
investment decisions as these can have lasting impacts in terms of land-use and carbon
emissions – ‘locking in’ carbon emissions for many years to come, while ensuring that people
live in a certain location which may become less resilient due to sea level rise for example
(see Fig. 5).
FIGURE 5. Time Periods for Investment Decisions. Source: [33].
This means that aspects that currently treated as externalities when investment is prioritised
economically will become central. This will change:
Time horizons. Investments by the World Bank typically have ≥12% ROI, so typically
payback in less than ten years, much shorter than most infrastructure lifespans.
Sustainable investment means decisions look beyond the physical lifetime and ensure the
nature and scale of investment stays within environmental limits.
Social and environmental opportunities, not just risks. Instead of de-risking
investment through screening and mitigating for bad social and environmental impacts,
the focus will be to maximise social and environmental outcomes. This will include
improving sustainability, inclusiveness and resilience.
Return on carbon/energy/resource invested. Individual investments will be carbon
constrained. This should consider both the initial ‘capital outlay’ in resources and energy
associated with the investment, as well as in-use expenditure/creation of resources and
energy. A sustainable economy means that more investment will be geared to transitioning
and adapting existing assets, to support and enable different forms of production (green
12
enterprises, leapfrogging current technologies and ways of organising) and consumption
(lifestyle choices), rather than extending the built environment further.
Multiple priorities. Urban infrastructure must be within resource and energy (greenhouse
gas emission) limits and account for air pollution. The New Climate Economy Group notes
that once these externalities are costed, it is likely that there will be less growth and more
compact cities, as low-density housing is not climate smart development. [34]
Linkages, not trade-offs. Environmental and climate impacts will not be traded against
resilience or social outcomes – solutions will be chosen that work well together. Connected
outcomes include how things are connected physically: live-work communities, transit-
orientated development.
This means investment decisions must sit within a shared vision, strategy, spatial plan and
economic strategy. This in turn requires greater, more inclusive participation so that different
infrastructure systems and future enterprises and operations are co-designed. For these
reasons, effective planning requires a plan-led approach: spatially, economically and
strategically.
4.3 Example of a Plan-led Approach: Guidelines for Inclusive, Low Carbon and Climate Resilient Secondary Cities in Rwanda
The Global Green Growth Institute in Rwanda advocated such an approach, to redirect
capital-centred economic growth, to create sustainable secondary city regions instead [35].
They intended to develop a plan that brought together the various infrastructure systems, and
considered outcomes in terms of employment, carbon emissions and climate resilience, wider
sustainability and inclusiveness – and economic outcomes. The vision developed to inform
this plan is set out in Table 2.
TABLE 2. Green City Vision: Inclusive, Low Carbon and Climate Resilient.
Source: Adapted from [36].
Vision Theme Key Aspects of Guidelines
Green circular (sustainable) economy
Cities and their surrounding regions develop to net zero carbon emissions and sustain a diverse green, locally resilient, full and high quality employment ‘circular’ economy employing appropriate green technologies; zero waste, sustainable water, material and energy use; secure and resilient local crop production and food supply.
Urban planning and design
Cities as compact continuous grids enabling appropriate density levels and mix of uses. Transit-oriented development accessible for citizens, integrated public transport services, public realm/spaces. Sustainably built and affordable housing in well-planned neighbourhoods.
Sustainable infrastructure
Invest in integrated, sustainable infrastructure to function efficiently locally, linked to their hinterlands and better able to adapt to changing climate/economy
Governance, and skills
Ensure sustainable urban/regional economic development; democratic accountability, engaged citizens, all have access to high quality public services.
Resilience Cities ‘future-proofed’ through good environmental planning and management to preserve natural capital, reduce impacts and ensure the long term resilience.

13
This vision and associated economic and spatial planning guidelines led to two development
alternatives being proposed, as set out in Table. 3.
TABLE 3. Contrasting visions for green city economies: as growth poles leading to city economies or
as sustainable city-regions. Source: Adapted from [36].
Crossroads/regional hub scenario.
Focuses on how secondary cities can develop
primarily as hubs of international connectedness,
building infrastructure to drive economic growth in
Rwanda, attracting inward investment to maximise
economic growth in an increasingly globalised world.
Assumes intensive effort to improve
international/national transport infrastructure with
high traffic growth to justify investment.
City-Region Scenario.
A higher share of urbanization occurs in smaller
settlements within the catchment area of the
secondary cities, connected to, and developing
alongside, the secondary cities themselves.
Focus on improved rural-urban linkages to strengthen
the rural (hinterland) economy, through local resource
and energy use, assets and building local resilience,
not relying heavily on wider investment and
commodity exports in increasingly volatile and
uncertain world market.
These two scenarios represent two substantially different development pathways. The choice
is between prioritising the resilience of cities primarily in terms of connection to the current
dominant economic system (and capital) or to a more localised social and environmental
sustainability. The resilience and sustainability of the chosen model of infrastructure
investment will depend on whether short-term economic development trumps long-term
sustainable, resilient and inclusive outcomes. This choice is reflected in the current widely
promoted notion of an infrastructure gap, as discussed below.
4.4 Overall Investment Choice: Prioritising a Resilient, Sustainable and Inclusive Futures requires less (not more) infrastructure.
The current approach to infrastructure development remains one focused on resilience of
infrastructure, not sufficiently on infrastructure as part of a resilient pathway to sustainable and
resilient futures. This is highlighted by overall targets to address the so-called infrastructure
gap and scale up infrastructure investment overall. An example of this conflict is planning in
the UK. The UK’s National Infrastructure Commission’s plan [37] which focuses on the link
between infrastructure “gap” and economic growth and presents climate change and climate
14
resilience as a constraint to this investment, not what it is primarily prioritised for. In contrast,
the UK’s national 5-year carbon budgets [38] are not applied to planning or infrastructure
investment, and increases emissions.
This links back to the initial question of how resilience applies to infrastructure (section 2
above). OECD research [8] set out the need to focus not on the ‘climate resilience of
infrastructure’ but infrastructure for low-carbon and climate resilient development. Their report
aims to advise governments how to ‘finance their transition to a low-carbon, climate resilient
economy’ through a ‘unique leapfrogging opportunity to shift those investments towards low-
carbon and climate resilient infrastructure’. It views this as part of the general challenge to
address the ‘infrastructure financing gap’, but also to shift this towards low-carbon and climate
resilient options. Therefore the approach proposed to embed climate resilience at the
investment options stage, not through safeguarding/screening type approaches.
There is a need to better integrate these approaches and, through doing so, address the
current separation (see ODI [40] and others) between strategic investment plans and national
climate strategies, and how they are planned and delivered.
5. CONCLUSION
In conclusion, we propose the following:
1. That resilience needs to be considered in context. For example, considering not just the
resilience of infrastructure, but what it is for.
2. Resilience must look long-term include climate mitigation, adaptation and wider
environmental sustainability. Resilience should also be inclusive.
3. Therefore Sustainability, Inclusiveness and Resilience should be considered together.
This means considering long-term climate and environmental risks and opportunities
together.
1. There is a need to look beyond sustainable and resilient solutions and places, to wider
sustainable and resilient local economies and development pathways.
Therefore, it is vital that urban planning embeds an acceptance that while some climate
disasters are inevitable, absolute climate catastrophe is not. And in that space between
increasing climate disaster and utter catastrophe, there is space for hope and collective
action for us to act. To ensure that disaster is limited, an overall pathway shift is required.
ACKNOWLEDGEMENTS
This work reflects and builds on the work of and collaboration with various people. In particular
I would like to thank Paul Deverill, Steve Fitzmaurice, Catalina Gallego-Lopez, Lorenza
Geronimo, Mark Harvey, John Hawkins, Mark Kowal, Kate Lonsdale, Stephen Newport, Tony
Lloyd-Jones and Daniela Villa.

15
REFERENCES
[1] DAI and IMC Worldwide, "Thinking about Resilience.," London, UK, 2016. https://prezi.com/2ocytgalfqn7/gateway-to-resilience-resources/
[2] United Nations Office for Disaster Risk Reduction, "Terminology on Disaster Risk Reduction," UN, Terminology on Disaster Risk Reduction 2009.
[3] United Nations, "Goal 9: Build resilient infrastructure, promote sustainable industrialization and foster innovation. Available from:," 2015.
[4] Raphaelle Moor, Mike Broadbent, Jonathan Essex, Steve Fitzmaurice, Mo Hamza, Kanaks Pakeer, Andre Steele, Tim Stiff, and John White Moor. "Disaster Risk Management in the Transport Sector," World Bank, 2015.
[5] S Spooner, V Kravva, A McMahon, J Parker, P Ross R Savage, "Managing the Water, Energy, Food and Land Nexus in the Context of Climate Change and Food Security.," London, UK, 2016.
[6] Roger Kemp, "Lancaster – a case study of the loss of the electricity supply on other infrastructure services and the life of the city: Workshop: March 9, 2016.," in Due to be published later in 2017, Lancaster, UK.
[7] S Dhakal, A Bigio, H Blanco, GC Delgado, D Dewar, L Huang, A Inaba, A Kansal, S Lwasa, JE McMahon, DB Müller, J Murakami, H Nagendra, A Ramaswami KC Seto, "Human Settlements, Infrastructure and Spatial Planning.," in Climate Change 2014: Mitigation of Climate Change. Contribution of Working Group III to the Fifth Assessment Report of the Intergovernmental Panel on Climate Change, R Pichs-Madruga, Y Sokona, E Farahani, S Kadner, K Seyboth, A Adler, I Baum, S Brunner, P Eickemeier, B Kriemann, J Savolainen, S Schlömer, C von Stechow, T Zwickel, JC Minx O Edenhofer, Ed. Cambridge, United Kingdom. Cambridge University Press, 2014.
[8] et al. J Corfee-Morlot, "Towards a Green Investment Policy Framework: The Case of Low-Carbon, Climate-Resilient Infrastructure," Paris, France, OECD Environment Working Papers, No. 48 2012.
[9] DFID, "Defining Disaster Resilience," UK Department for International Development , London, UK, DFID Approach Paper 2011.
[10] GFDRR, "Building Back Better in Post Disaster Recovery.," World Bank, Washington, US, undated.
[11] Vicente Barros, Thomas F Stocker, Qin Dahe, David J Dokken, Kristie L Ebi, Michael D Masrandrea, Katherine J Mach, Gian-Kasper Plattner, Simon K Allen, Melinda Tignor, Pauline M Midgley Christopher B Field, "Managing the Risks of Extreme Events and Disasters to Advance Climate Change Adaption," Intergovernmental Panel on Climate Change, New York, US, Special Report of the Intergovernmental Panel on Climate Change, 2012.
[12] Nicola Ranger, "Adaptation: Decision Making under Uncertainty," DFID, London, UK, Evidence on Demand Topic Guide 2013.
[13] Met Office. Thames 2100. [Online].
[14] Mainul Huq, Zahirul Huq Khan, Md Sohel Masud, MMZ Ahmed, Nandan Mukherjee, Kiran Pandey S Dasgupta, "Climate proofing infrastructure in Bangladesh: the incremental cost of limiting future inland monsoon flood damage," Policy Research Working Paper 2010.
[15] PWC, "Roadmap for Low Carbon and Climate Resilient Kolkata," DFID and British Deputy High Commissioner, Kolkata., 2015.
[16] A Cazenave R Nicholls, "Sea-level rise and its impacts on coastal zones," Science, vol. 328 (5985), pp. 1517-1520, 2010.
[17] NOAA, "Global and Regional SLR Scenarios for the US," National Ocean Service Center for Operational Oceanographic Products and Services, Silver Spring, Maryland, US, Technical Report 083 2017.
[18] J Corfee-Morlot C Kennedy, "Mobilising Investment in Low Carbon, Climate Resilient Infrastructure," OECD, Environment Working Papers, No. 46 2012.
[19] bangladeshdeltaplan2100.org.
16
[20] John Foster, "Towards Deep Hope: Climate Tragedy Realism and Policy.," Greenhouse Think Tank, 2017. www.greenhousethinktank.org
[21] Pooran Desai, One Planet Communities: a real-life guide to sustainable living. Chichester, UK: Wiley and Sons, 2010.
[22] Saskia Sassen, Expulsions: Brutality and complexity in the global economy. US: Harvard, 2014.
[23] Kate Picket Richard G Wilkinson, The Spirit Level: Why more equal societies almost always do better. London, UK: Allen Lane., 2009.
[24] Defra, UK, "Securing the Future: UK Government Sustainable Development Strategy.," UK Department of the Environment, Food and Rural Affairs, London, Strategy 40, 2005.
[25] UNFCCC. Paris Agreement. unfccc.int/paris_agreement/items/9485.php
[26] UNISRD. Sendai Framework. www.unisdr.org/we/coordinate/sendai-framework
[27] UN. Sustainable Development Goals. [Online].
[28] CBD. Convention on Biological Diversity. [Online]. http://cbd.int
[29] CE Suarez, "Energy Needs for Sustainable Development," in Energy As an Instrument for Socio-Economic Development, J and Johansson TB Goldemberg, Ed. New York, US: UNDP, 1995.
[30] Richard Layard, Happiness: Lessons from a new science. UK: Penguin, 2011.
[31] WWF, "Living Planet Report 2012," Woking, UK, 2012. [Online].
[32] P Pringle, B Turner K Lonsdale, "Transformational adaptation: What it is, why it matters and what is needed.," 2015.
[33] SEI, "Infrastructure health and environmental impacts: a nexus?," DFID, London, UK, Evidence on Demand Presentation 2016. [Online].
[34] New Climate Economy, "Better growth, better climate. Published by the," 2014.
[35] Global Green Growth Institute, "GGGI Rwanda: Fact Sheet Climate Resilient Green Cities.," 2014.
[36] Tony Lloyd-Jones, "Rwanda: Targeting Green Growth and Green Urbanisation.," Maxlock Centre, University of Westminster, London, 41, 2017.
[37] UK Treasury Department (HM Treasury), "National infrastructure plan 2011," Infrastructure UK, 2011.
[38] UK government. Carbon Budgets. https://www.gov.uk/guidance/carbon-budgets
[39] EBRD, "Green Economy Transition Approach," 2015.
[40] ODI, "Public spending on climate change in Africa: experiences from Ethiopia, Ghana, Tanzania and Uganda.," 2016.
[41] Ernst Friedrich Schumacher, A Guide to the Perplexed., 1995th ed. UK: Random House, 1977.
[42] Stefan Dercon. Is Green Growth Good for the Poor. Oxford University. 2011.
17
2. CHILD-CENTRED HAZARD, VULNERABILITY AND CAPACITY ASSESSMENT AND PLANNING IN URBAN SETTINGS
John Twigg1, Matthew Maclure1, Virginie Le Masson1, Gianfranco Gliozzo2
Overseas Development Institute, 203 Blackfriars Road, London SE1 8NJ, UK. 2 Department of Computer Science, University College London, London WC1E 6BT, UK.
ABSTRACT. This paper summarises the work and findings of a research project
investigating hazards, vulnerabilities and capacities assessment (HVCA)
approaches and toolkits that are currently used to design interventions to reduce
children’s risks from hazards and disasters in urban settings. The project sought to
identify effective methods and approaches, and to provide guidance on how to adapt
or develop tools to better identify vulnerable urban children and understand the risks
they face. The research comprised analysis of relevant HVCA toolkits, and key
informant interviews with practitioners involved in disaster risk reduction, climate
change adaptation, child- or youth-centred development, and urban development.
New information and communications technologies, and their potential applications
to this issue, were also reviewed. The project was commissioned by Save the
Children International and is now entering a second phase of piloting an improved
method.
Keywords: Vulnerability Assessment; Urban Children; Disaster Risk Reduction
1. INTRODUCTION
Child-centred disaster risk reduction (DRR) (paying specific attention to children’s needs in
planning and interventions) and child-led DRR (engaging children in designing, implementing,
communicating and advocating for interventions) aim at minimizing disasters’ impacts on
children and adolescents. DRR strategies that give particular attention to children’s needs,
skills and perspectives can make significant contributions to their resilience [1-2]. The main
international policy for DRR, the Sendai Framework for Disaster Risk Reduction 2015-2030,
recognises that 'children and youth are agents of change and should be given the space and
modalities to contribute to disaster risk reduction' [3]. This also contributes towards realising
children’s rights to special assistance and protection, and to their participation in reducing risk
[4-5]
Urban children face many different kinds of risk, which are linked to poverty, inequality and
discrimination. Research has identified a range of factors influencing their vulnerability and
exposure to risks and disasters, their capability and rights to participate in DRR as agents of
change, the barriers and opportunities for participation, and their access to protection and
services. Marginalized children are at particularly high risk: they include street children, child
labourers, and children living in informal and low-income settlements [6-9].
Hazards, vulnerabilities and capacities assessment (HVCA) is a key element in DRR and
climate change adaptation (CCA) programming. HVCA is a method of investigation into the
risks that people face in their locality, their vulnerability to those risks and their capacity to

18
cope with and recover from disasters. Its purpose is to: identify groups who are vulnerable;
the factors that make them vulnerable and how they are affected; assess their needs and
capacities; and ensure that projects, programmes and policies address these needs. HVCA is
used as a diagnostic tool, a planning tool and a tool for empowering and mobilising vulnerable
people. Many different HVCA frameworks and toolkits have been applied in various contexts
and at a range of scales.
Participatory HVCAs, influenced by participatory rural appraisal or participatory learning and
action (PRA/PLA) thinking and tools, and used principally by non-governmental organisations
(NGOs), other civil society organisations and local actors, have been effective in capturing the
experiences and perceptions of vulnerable, marginalised and excluded people, and have
played a significant role in their engagement in DRR/CCA processes and empowerment
through this involvement [10]. Information and communications technology innovations such
as digital mapping, smartphones, mobile internet and cloud computing, together with
crowdsourcing and citizen science approaches, have the potential to support and expand
traditional participatory data-gathering and analysis [11-13].
HVCA is designed to take a holistic view of risk, considering a wide range of environmental,
economic, social, cultural, institutional and political pressures that create vulnerability. In
practice, most HVCAs are community-wide assessments and therefore quite broad in scope.
Relatively few focus on children’s vulnerability and agency or are informed by sound
understanding of child protection and wellbeing issues. HVCAs tend to concentrate on risks
resulting from environmental or technological hazards (e.g. flood, fire) and pay less attention
to other significant or widespread social threats to children (e.g. domestic violence, bullying,
exploitation in the labour market). The few HVCA guidelines that do focus on young people
vary in their quality and sophistication. Plan International’s toolkit on child-centred DRR and
Save the Children’s guide to child-led DRR do contain detailed guidance on HVCA training
and application relating to children and young people, although they do not distinguish towns
and cities from other contexts [14-16].
HVCAs should be tailored to the contexts where they are applied and involve participation
from those most at risk or traditionally marginalized from decision-making processes.
Participation of children and young people should be a central component of child-centred
DRR/CCA design and implementation. Children can identify problems, particularly human-
induced and societal risks, which adults often overlook or underestimate (e.g. social exclusion,
alcohol abuse) [17]. Children’s organisations are also good at listening to children’s views of
hazards and vulnerabilities and giving voice to those views in public arenas [2]. In practice,
these contributions are not widespread and are often not acknowledged by local governments
and other agencies [18], although Save the Children has considerable experience of this
across the world, and has produced a range of practical guidance with examples of good
practice [14,19-21]. This is paralleled by child-led or child-friendly assessment tools applied
by other organisations in DRR and CCA contexts [16, 22].
Development of HVCA methods and tools for urban applications needs to be informed by
sound understanding of the distinctiveness of urban systems, contexts and issues, and the
known challenges of carrying out HVCA in urban settings [23-25]. Sophisticated
methodologies and toolkits for urban risk and vulnerability assessment, such as the World
Bank’s Urban Risk Assessment methodology and the Arup/Rockefeller City Resilience
Framework and Index, are designed for holistic, system-wide assessment by city
19
administrations [11, 26]; there are also a number of participatory tools and approaches used
to investigate urban risk and for CCA [27]. The extent to which these have been used to
identify children’s risks, vulnerabilities and capacities is unclear.
2. METHODOLOGY
The research project investigated HVCA approaches and toolkits currently used by
practitioners to design interventions to reduce children’s risks from hazards and disasters in
urban settings. It sought to identify successful approaches and useful methods, and provide
guidance on how to adapt or develop better tools to identify vulnerable children and
understand the risks they face.
The research, which was commissioned by Save the Children International, comprised a
scoping exercise and a needs assessment. The scoping exercise analysed 20 relevant HVCA
toolkits, which were identified through literature searches and key informant referrals. The
toolkits were designed by a variety of organisations, principally NGOs, and covered a range
of contexts. Most addressed communities in general; four were designed to look at urban
areas; six were child-centred; and two focused on school settings. The HVCAs also tended to
focus on local levels: only two of those examined were designed to analyse factors contributing
to risk, vulnerability and capacity building at a wider range of levels, from household to
national.
The needs assessment was based on 23 key informant interviews (KIIs) with NGO
practitioners involved in DRR, CCA and child- or youth-centred development; practitioners and
researchers with experience of developing and testing HVCA tools; and urban development
practitioners. The investigation focused on experiences in Asian cities. The initial
interviewees were identified by Save the Children, and additional participants through
snowball sampling. The interviews, which were mostly conducted by telephone, were semi-
structured using the same interview protocol; each interview lasted from 1-2 hours. Interviews
were recorded for coding and analysis.
3. FINDINGS
3.1 Assessment tools and approaches
HVCAs are toolkits comprising many different tools or activities. In this sample, the number
of tools or activities used in each HVCA toolkit ranged from 5 to 15. Apart from some
modifications to fit different contexts, the types of tool did not appear to vary much across the
different toolkits and guidelines. This implies a high degree of consensus among the
organisations that developed and used them, although the application of specific methods in
the field is likely to have been more diverse. The main tools were standard ones used in
participatory learning and action: local, community or school mapping (of hazards, resources,
capacities), seasonal calendars, historical and disaster timelines, stakeholder mapping,
transect walks, key informant interviews, focus group discussions, livelihoods analyses, social
mapping and hazard ranking. These would be familiar to most users. KIIs indicated that the
key strengths of the different toolkits lay in their sensitivity and adaptability to different

20
contextual issues, and their role in helping to forge relationships between different
stakeholders.
Overall, it appeared that HVCA toolkits do not actively encourage users to reflect upon or
question the decisions they make during the assessment process. The extent of information
provided to support users in planning and choosing the most effective assessment approach
and the specific selection of activities varied greatly. Some toolkits took a prescriptive and
linear approach, with a fixed range of tools used in a set order. Such guidelines demonstrated
a lack of flexibility regarding the choice, application and modification of individual methods and
tools, as well as a lack of awareness of the adaptation and re-evaluation that might be needed
to use the tools effectively in urban areas.
Some, more extensive, toolkits such as the IFRC’s Vulnerability and Capacity Assessment
(VCA) and Save the Children International’s recently developed Urban Situational Analysis
Tool (USAT), put more emphasis on being flexible and reflective during the assessment
process. In both cases, detailed guidelines are provided alongside the toolkit itself regarding
the various issues, challenges and discussion points that users should be aware of during
assessments. Both documents also provide a level of questioning, engaging users to question
their own decision making and the structure of the assessment itself.
3.2 Coverage of urban risks
KIIs believed that more could be done to construct a comprehensive urban HVCA toolkit.
Some urban issues were missing from toolkits that had been originally developed for rural
areas and then adapted for urban settings. There was little evidence of tools aimed at
identifying and assessing risks and vulnerabilities that are more prominent in or specific to
urban areas (e.g. road safety, air pollution, exposure to hazardous materials, drug use and
trafficking, violence, child trafficking, child labour and risks to children working on the streets).
Although urban applications of HVCA are mostly in poor or informal settlements, none of the
tools considered the daily risk of eviction and its consequences. It was noted that some toolkits
did not recognize children’s desire to play, and there seemed to be no tools that sought to
recognize where urban children played, the dangers those urban spaces presented, and what
other, safer spaces might be available. Street children and child labourers, who are
particularly at risk, were mostly identified through the process of implementing projects rather
than HVCAs. However, there was evidence of HVCAs directing projects towards focusing on
children in particularly difficult situations, such as single migrants, refugees and children in
unauthorized settlements. Risks to children from medium- or high-income areas were not
identified, even though their geographical location within a city might expose them to certain
hazards.
3.3 Understanding urban ‘communities’
Defining ‘community’ in an urban context and understanding how to work in such communities
was the barrier most often reported in the KIIs. The initial responses of some interviewees
revealed that they did not consider urban areas to have the same sense of community as rural
areas seemed to have. Urban communities certainly do exist, but they take forms that may
be very different from those in rural locations, and they may not be easy to identify. With this
in mind, the challenge is to ensure that project staff understand the different forms of urban
communities, how they are created, and how best to reach them through the HVCA process.

21
Tools developed for application in rural programmes, although familiar to most users, are
designed with rural conditions in mind, where communities and their structures are more
visible and there are relatively high levels of participation. They may be less useful when
trying to identify, differentiate between, or engage with, the diversity of stakeholders and roles,
power and decision-making structures, relationships and networks in urban areas.
3.4 Risk priorities
The research team noticed that the key informants said little about CCA or how it can be
integrated into HVCA toolkits. On the other hand, some interviewees identified forward
thinking as a gap in current assessments: new and emerging risks were not being considered,
but in complex urban contexts these should be addressed. Several interviewees suggested
that urban communities’ lack of awareness of hazard risks was an obstacle to their
engagement with DRR initiatives. This view is at odds with some research into risk perception
and risk management practices of the urban poor, which presents a more complex and
positive picture [28-29]
Nevertheless, environmental hazards may not be seen as a priority by the urban poor; and
the conventional project approach to DRR, based on HVCA, may not be the best entry point.
In one urban DRR project in India, an initial phase of participatory HVCA focusing on natural
hazards failed to engage the interest of community members. The project then shifted the
assessment’s focus to social protection issues (including access to schools and local
governance institutions, and access to food rations) that were a higher priority problem for the
community. This shift dramatically increased community engagement, and from this point
onwards project staff were able to work with community members to explore links between
risk reduction and social protection. One interviewee suggested avoiding compartmentalizing
different aspects of hazards, risks and vulnerabilities, as these are often perceived as one
interconnected issue at the local level. A comprehensive urban HVCA might therefore need
to consider an extensive range of risks, or link to other tools that examine these.
3.5 Children’s voices
NGOs working with children and young people aim to provide change from the ground up, by
engaging children, families and civil society in securing child rights. When discussing the ways
in which their organisations engaged with children, the interviewees described a range of
approaches, with different levels of children’s involvement. In some programmes,
engagement appeared to be strong, although not always age-responsive. In others, the
ambition of following participatory approaches that engaged children in consultation about
programme design and implementation did not necessarily translate into more substantial
involvement in project activities. Voice did not seem to be well ingrained in any of the HVCAs
and toolkits discussed with the key informants. Promoting the voices of children and young
people appeared to be almost solely reliant on how the programme staff using the toolkit
decided to implement it. Moreover, urban children appeared not to be recognized as agents
of change in the same way that children in rural areas were: this issue deserves further
investigation.

22
3.6 Stakeholders
HVCA toolkits and methodologies are expected to incorporate a wide range of stakeholder
groups into the assessment and DRR programming process (e.g. groups of children, parents
of children, other key adults and community members, teachers, NGOs, government officials).
This broad perspective is essential for capturing the wide range of often complex issues
associated with vulnerability, capacity and building resilience. Nevertheless, engaging so
many stakeholders can be a time-consuming and challenging process.
The KIIs also raised questions about how to work with informal groups or localised self-
governance and draw upon their capacities, recognizing that community-based, informal,
governance mechanisms exist in all urban settings and need to be integrated into HVCA.
Assessment tools also need to interrogate the underlying motivations of stakeholders who
may work (willingly or unwillingly) to keep children in positions of risk and poverty.
3.7 Time
Time constraints were identified as a major barrier to carrying out HVCAs. Community
members either do not have the time needed to participate in HVCAs or are not willing to give
it. KIIs suggested that one reason for their unwillingness was that environmental hazards
were not seen as a priority amidst many other pressures. One interviewee thought that
members of poor urban communities were becoming tired of researchers and had reached a
saturation point in terms of engagement with such processes.
4. TECHNOLOGICAL INNOVATION
A separate component of the project reviewed research and case studies of technological
innovations that can support HVCA and child-centred DRR in urban areas [30]. This included
technology that can be directly used by participants (e.g. mobile telephone, apps and balloon
mapping) and indirectly through analysis of large data collections. Access to the internet and
mobile phone technologies has an important role to play in achieving development goals [31].
Many children and young people have access to technologies such as social media, apps and
computer games and it would be pragmatic to use technologies that are already available in
HVCA. Participatory geographical information systems (PGIS), volunteered geographic
information (VGI), mobile technologies and smart phones can be used by at-risk and vulnerable
populations [32], for example by migrant children [33-34].
New technologies can be used to detect hazards, identify the exposure and vulnerability of
children, and implement risk reduction initiatives; they can also be used as child-centred learning
tools. For instance, they have been suggested as a support to sexually abused children, by
reducing vulnerability factors such as loneliness and lack of confidence [35]. So-called ‘big data’
systems that collect and process large volumes of information have been applied to public
decision making and action regarding children’s welfare [36-37]. Civic science and open
hardware can be a catalyst for engaging local communities, including children [38]. Work on
‘smart cities’, where new technological and computational capabilities are geared towards
change and adaptation, offers insights into human behaviour and preferences that can be used
for predictive modelling [39-40]. Big data and predictive analysis have been tested in New
Zealand to deliver a predictive risk model focusing on children’s welfare [41-43].

23
5. CONCLUSIONS
To address the issues and barriers to progress identified in the discussion above, programme
staff in development organisations need to be given the freedom to adapt, customize and
borrow from existing toolkits to fit them to the specific contexts they are working in. The
organisations could support this process by making relevant information available (e.g. an
online platform of different tools, toolkits and related resources), providing access to experts
for advice (possibly an HVCA focal point or a community of practice) and working in
partnerships. Most development organisations’ country offices and programmes engage with
risks and vulnerabilities in one way or another. In the case of HVCA, there is no need to invent
the wheel. Development and testing of new toolkits would be a major task requiring
considerable time and resources. Most of the relevant tools, methods and approaches are
already in existence, and many field staff are familiar with them; but they can be used more
effectively through an iterative process of learning and improvement.
One way of achieving such improvement could be through focusing on the decision-making
processes through which HVCA tools and toolkits are selected and deployed. The project
team recommended developing a pre-assessment process tool that would enable users to
plan and choose their approaches more effectively by making them reflect upon, and question,
the decisions they make during an HVCAP (HVCA and Planning) process. This integrative
approach could be applied to many different tools or toolkits and operational contexts. It would
ensure that everyone within an organization goes through the same robust, deliberative
decision-making process for planning individual HVCAPs and implementing projects based on
their findings, while allowing for flexibility regarding the choice, application and modification of
individual methods and tools. No toolkits currently contain such a process tool, but a recently
developed pilot version [44] is currently being tested by Save the Children International as a
follow-up to the project described in this paper.
ACKNOWLEDGEMENTS
This work was commissioned and funded by Save the Children International. We are
particularly grateful to Xiaowen Fan and Karimi Gitonga at Save the Children, and to Catriona
Foley and Marta Matosek at the Overseas Development Institute for their support.
REFERENCES
[1] E. Back, C. Cameron and T. Tanner, Children and Disaster Risk Reduction: Taking stock and moving forward, Brighton, Institute of Development Studies, 2009.
[2] UNISDR and Plan International, Children’s Action for Disaster Risk Reduction: Views from children in Asia, Bangkok, United Nations International Strategy for Disaster Reduction Asia Pacific and Plan International Asia Regional Office, 2012.
[3] UNISDR, Sendai Framework for Disaster Risk Reduction, Geneva, United Nations International Strategy for Disaster Reduction, 2015.
[4] E. Bild and M. Ibrahim, Towards the resilient future children want: a review of progress in achieving the Children’s Charter for Disaster Risk Reduction, Milton Keynes, World Vision UK, 2013.

24
[5] L. Theytaz-Bergman, Disaster Risk Management, Conflict and Climate Change in the Monitoring of the UN Convention on the Rights of the Child, Stockholm, Plan International, 2013.
[6] S. Bartlett, Climate change and urban children: Impacts and implications for adaptation in low and middle income countries, London, International Institute for Environment and Development, 2008.
[7] A. Stotler, C. Miller and J. Shindeldecker, Voices from urban Africa: The impact of urban growth on children, Westport, CT, Save the Children, 2012.
[8] D. Brown and D. Dodman, Understanding children’s risk and agency in urban areas and their implications for child-centred urban disaster risk reduction in Asia: Insights from Dhaka, Kathmandu, Manila and Jakarta, London, International Institute for Environment and Development, 2014.
[9] Save the Children, The Urban Disadvantage: State of the World’s Mothers 2015, Fairfield CT and London, Save the Children, 2015.
[10] J. Birkmann, Measuring Vulnerability to Natural Hazards (towards disaster resilient societies, United Nations University Press, 2006.
[11] E. Dickson et al., Urban Risk Assessments, Washington DC, The World Bank, 2012. [12] M. Haklay, V. Antoniou and S. Basiouka, Crowdsourced Geographic Information Use in
Government, London, World Bank Global Facility for Disaster Reduction and Recovery, 2014. [13] J. Twigg, N. Christie, J. Haworth, E. Osuteye and A. Skarlatidou, Improved Methods for Fire
Risk Assessment in Low-Income and Informal Settlements. International Journal of Environmental Research and Public Health, 14, 139 (2017)
[14] L. Benson and J. Bugge, Child-led disaster risk reduction - A practical guide, London, Save the Children, 2007.
[15] M. Luneta , 2007, Child-oriented participatory risk assessment and planning: A toolkit, Geneva/Bangkok, ProVention Consortium/Asian Disaster Preparedness Centre, 2007.
[16] Plan International, Child-Centred DRR Toolkit, London, Plan International, 2010 [17] T. Tanner, M. Garcia, J. Lazcano, F. Molina, G. Molina, G. Rodriguez, B. Tribunalo and F.
Seballos, Children’s participation in community-based disaster risk reduction and adaptation to climate change. Participatory Learning and Action. 60, 54–64 (2009).
[18] World Vision & Plan International, Children on the Frontline: Children and Young People in Disaster Risk Reduction, Monrovia and London, World Vision and Plan International, 2009.
[19] L. Esterhuizen, Child Led Data Collection: Experiences, findings and lessons learnt, Stockholm, Save the Children Sweden, 2012.
[20] L. Esterhuizen, Child Led Data Collection: A guide for young people to learn how to do research and create positive change, Stockholm, Save the Children Sweden, 2012.
[21] C. O’Kane, Guidelines for Children’s Participation in Humanitarian Programming, London, Save the Children UK, 2013.
[22] F. Molina, G. Moline, T. Tanner and F. Seballos, Child-friendly participatory research tools. Participatory learning and action. 60, 160–166 (2009).
[23] Humanitarian Futures, Mapping the way forward: Urban Futures Project Final Report, London, Humanitarian Futures Programme, 2013.
[24] IFRC, Integrating Climate Change and Urban Risks into the VCA - Ensure Effective Participatory Analysis and Enhanced Community Action, Geneva, International Federation of Red Cross and Red Crescent Societies, 2014.
[25] H. Nguyen, P. Tran, and T. Nguyen, Applying vulnerability and capacity assessment (VCA) tools in the urban contexts: Challenges, Difficulties and New Approach, Hanoi, ISET Vietnam, 2014.
[26] J. da Silva, City Resilience Index: Understanding and measuring city resilience, London, ARUP, 2014.
[27] C. Moser and A. Stein, Implementing urban participatory climate change adaptation appraisals: a methodological guideline. Environment and Urbanization. 23, 463–485 (2011).
[28] F. Nathan, Risk perception, risk management and vulnerability to landslides in the hill slopes in the city of La Paz, Bolivia: a preliminary statement. Disasters 32, 337-257 (2008).
[29] H. Jabeen, C. Johnson and A. Allen, Built-in resilience: learning from grassroots coping strategies for climate variability. Environment & Urbanization. 22, 415-431 (2010).
[30] G. Gliozzo, ‘Note on the potential of technological innovation in HVCAP for urban children’, in J. Twigg, M. Maclure, V. Le Masson and G. Gliozzo, ‘Scoping study and needs assessment: child-centred hazard, vulnerability and capacity assessment and planning in urban settings’, Save the Children International report, unpublished, 2017, pp. 28-37
25
[31] United Nations, The Millennium Development Goals Report, New York, United Nations, 2015. [32] A. Jha, T. Miner, and Z. Stanton-Geddes, Building Urban Resilience: Principles, Tools, and
Practice, Washington, DC, World Bank, 2013. [33] L. Raftree, K. Appel and A. Ganness, Modern Mobility: The role of ICTs in child and youth
migration, Washington DC, Plan International USA, 2013. [34] E. Cossor, Young and on the Move: Children and youth in mixed migration flows within and
from the Horn of Africa, Nairobi, Save the Children and Regional Mixed Migration Secretariat, 2016.
[35] K. Wrench, Helping Vulnerable Children and Adolescents to Stay Safe: Creative Ideas and Activities for Building Protective Behaviours, London, Jessica Kingsley Publishers, 2016.
[36] B. Lery, J. Haight and L. Alpert, Four principles of Big Data practice for effective child welfare decision making. Journal of Public Child Welfare 10, 466–474 (2016).
[37] T. Shaw, B. Lee, and J. Farrell, Introduction. Journal of Public Child Welfare 10, 349–351 (2016).
[38] L. Brix-Etgar and H. Keysar, A Matter of Scale: Civil Architecture and Open Hardware, https://publiclab.org/notes/hagitkeysar/10-19-2014/a-matter-of-scale-civil-architecture-and-open-hardware [last accessed September 2017]
[39] A. Caragliu, C. Del Bo, and P. Nijkamp, Smart Cities in Europe. Serie Research Memoranda, VU University Amsterdam, Faculty of Economics, Business Administration and Econometrics 48,1–15 (2009).
[40] Finlay 2014. S. Finlay, Predictive analytics, data mining and big data: Myths, misconceptions and methods, London, Palgrave Macmillan, 2014.
[41] T. Dare, Predictive Risk Modelling and Child Maltreatment - An Ethical Review, University of Auckland, 2013.
[42] R. Vaithianathan, T. Maloney, E. Putnam-Hornstein, and N. Jiang, Children in the public benefit system at risk of maltreatment: Identification via predictive modeling. American Journal of Preventive Medicine 45,354–359 (2013).
[43] P. Gillingham, P. 2016. Predictive Risk Modelling to Prevent Child Maltreatment and Other Adverse Outcomes for Service Users: Inside the “Black Box” of Machine Learning. British Journal of Social Work 46,1044–1058 (2016).
[44] J. Twigg, M. Maclure, V. Le Masson and G. Gliozzo, ‘Scoping study and needs assessment: child-centred hazard, vulnerability and capacity assessment and planning in urban settings’, Save the Children International report, unpublished, 2017.

26
3. USING RURAL POST-DISASTER RECOVERY EXPERIENCES TO REFLECT ON RESEARCH OPPORTUNITIES FOR UNDERSTANDING SELF-RECOVERY IN URBAN ENVIRONMENTS
Luisa Miranda Morel1 and John Twigg2
Overseas Development Institute, 203 Blackfriars Road, London SE1 8NJ, UK
ABSTRACT. The majority of families in developing countries recover from
disasters by making use of their own resources, knowledge and initiative: in other
words, they self-recover. Yet the process of self-recovery is poorly understood and
there is a lack of knowledge and evidence on how to support it. This paper builds on
the knowledge gathered throughout an inter-disciplinary pilot research project
between four collaborating partners, British Geological Society (BGS), the Overseas
Development Institute (ODI), University College London and CARE International
UK. It examines self-recovery processes in rural and some peri-urban environments
affected by rapid-onset disasters in the Philippines (typhoons Haiyan (2013) and
Haima (2016)) and Nepal (Gorkha earthquake 2015). The discussion draws on
emerging themes about self-recovery in rural environments and reflects on how
these themes may compare when addressing self-recovery in urban environments.
Building on this reflection, the paper highlights the persisting gaps in knowledge and
how different disciplines and stakeholders might collaborate in further research to
better understand how to support self-recovery within urban environments.
Keywords: Recovery, self-recovery, shelter, humanitarian response, disasters, rural, urban, strategies, communication
1. INTRODUCTION
The last decade has seen the term ‘self-recovery’ increasingly used to refer to the process
whereby individuals and communities affected by disasters reconstruct their houses using
their own resources, knowledge and initiative [1]. It is estimated that humanitarian agencies
struggle to meet as much as 30% of the shelter needs within the first 12 months of a disaster;
in many cases this percentage is significantly lower. In cyclones Sidr (Bangladesh 2007) and
Nargis (Myanmar 2008), only 1% and 2.5% respectively of the total shelter need was met [2].
The other households self-recovered in one way or another, but very little is known about the
process in both rural and urban post-disaster environments. Existing knowledge comes mostly
from humanitarian agencies’ evaluation reports relating only to known beneficiaries of agency
assistance to self-recovery activities, rather than the affected population as a whole [3-5]. This
is largely because self-recovering communities tend to be isolated geographically, socially or
politically and are therefore difficult to access; or because they do not fall within the beneficiary
selection processes of humanitarian organisations [6-8].
The term ‘self-recovery’ is applied mostly to shelter reconstruction. The term can be
misleading because it might suggest no input from any other actor, not only national and
international level actors but also localised bonding social capital networks including friends,

27
family, and neighbours – which is unlikely in any post-disaster situation. Its relation to the
shelter sector can also be misleading because it risks over-simplifying what is a very complex
and multi-dimensional social practice that moves beyond the built environment. Recovery is a
subjective and organic process. It incorporates aspects such as basic needs, shelter, health,
livelihoods, protection, security, education and culture recovery. Each of these has different
and shifting levels of importance. The overall pace of recovery is determined by a range of
factors including the scale of the event and the social, environmental, political and economic
contexts in which recovery takes place [9]. Nevertheless, housing reconstruction is central to
recovery, often acting as a ‘crude surrogate’ for many other aspects of economic and societal
recovery, such as safety, local administration, schooling, healthcare, water and sanitation and
livelihoods [10]. What is more in theory, the shelter sector identifies disaster affected
individuals as the first and most central actors in recovery processes. The use of the concept
is intended to reflect that, irrespective of the potential involvement of other actors [11-12].
This paper examines self-recovery processes in peri-urban and rural environments affected
by rapid-onset disasters in the Philippines (typhoons Haiyan (2013) and Haima (2016)) and
Nepal (Gorkha earthquake 2015). Urban populations are increasingly exposed to climate and
non-climate related hazards leading to disasters [13]. Yet, although humanitarian responses
have demonstrated the difficulties of achieving efficiency, efficacy and timeliness within urban
environments [14], research on self-recovery in urban environments is limited. Existing
research relates to urban responses more generally, is ‘self-referential’ and completed within
a limited timeframe [15]. This provides little space for alternative and innovative thinking by
learning from other sectors, about how to improve humanitarian responses within urban
contexts. At this stage, this paper can therefore only reflect on what the existing research has
found about self-recovery in rural areas and propose emerging themes as potential directions
for additional research. This can motivate discussion and possible collaboration between
multiple disciplines and sectors to make humanitarian practice more relevant, timely and
accountable to those that self-recover in post-disaster urban contexts.
2. METHODOLOGY
To capture the complexity of self-recovery, an inter-disciplinary research team was assembled
comprising specialists in the environmental (British Geological Society) and social sciences
(Overseas Development Institute), structural engineering (University College London) and
humanitarian shelter practice (CARE International UK). The social scientists engaged with
families and local builders to better understand local knowledge systems and the wider range
of factors that influence decision making processes. The engineers and humanitarian shelter
practitioners evaluated housing structures and construction processes. The environmental
scientists assessed risks to housing from the local environment. Their work was carried out in
parallel, working in the same research locations. This enabled the team to study the same
case through the different disciplinary lenses. The approach provided explanatory power in a
range of areas, for example, regarding the reasons why people rebuild in unsafe locations and
levels of household uptake of technical guidance on safer building.

28
The team adopted a mixed-methods, case study methodology (see table 1) 5. The qualitative
element of the research was a combination of transect walks, semi-structured interviews and
focus groups. Transect walks, guided by local community leaders and/or social mobilisers,
allowed for the collection of visual data and community perceptions relating to the physical
landscape and local hazards, housing typologies, the state of reconstruction, land use and
settlement location. Semi-structured interviews carried out with a range of community
members including homeowners, local leaders, builders and carpenters allowed for the team
to gather data relating to individual and household recovery experiences. This included
experiences before, during and after the disaster, information on recovery decisions and
pathways, reconstruction choices and factors such as household risk perception and opinions
and expectations of external assistance. Focus groups explored the strategies adopted by
communities to prepare for and recover from the disasters, the factors that influenced their
vulnerability (e.g. landslides, increased market prices, droughts, changing weather patterns,
road clearance and improvement) and the role that local institutions, authorities and families
played in supporting recovery.
The quantitative element consisted of building surveys which recorded data on the
households’ experience with the hazard (e.g. direction of the wind, direction of the shaking,
behaviour of the building), building typology (e.g. vernacular or not), and structural details
including the incorporation of techniques for safer building and hazard mapping using GPS
devices addressing other hazards (e.g. flooding, drought, landslides) in the area that have
impacted the recovery processes. The methods complemented each other, providing a holistic
and detailed idea of people’s self-recovery processes. The qualitative investigation added
people’s voices and experiences to the data gathered in the surveys, while the surveys
provided specific examples of reconstruction practices and assessments of the environmental
contexts in which their recovery was taking place.
TABLE 1. Research methods in each country
Country Date visited # Transect walks # FGDs # Interviews
# Survey forms
Philippines 3/06/2017 - 3/17/2017 14 35 21 36
Nepal 4/22/2017 - 5/01/2017 13 20 21 11
In the Philippines the research team visited 14 rural and peri-urban barangays6 of which six
were on Leyte island (affected by Typhoon Haiyan in 2013) and a further eight on Luzon
island (affected by Typhoon Haima in 2016). The areas visited varied in natural landscape,
accessibility and soil typology. Most were accessible within two to three hours from a main
town except two that were accessible within a four-hour car ride and a two-hour hike. All of
the barangays were home to beneficiaries of CARE shelter and/or livelihoods assistance
provided by local implementing partner organisations, although not all community members
had been selected as beneficiaries. In Nepal the research team visited 11 village development
5 For a more detailed discussion on the interdisciplinary methods and methodology adopted see Twigg et al. 2017: https://www.odi.org/publications/10963-self-recovery-disasters-interdisciplinary-perspective 6 A barangay is the smallest administrative division in the Philippines; the term is used by Filipinos to mean a village, district or ward.

29
committees7 (VDCs) in Dhading district. Between one and three communities were visited in
each VDC. Dhading is characterised by highly mountainous landscape with river valleys. The
VDCs visited were chosen based on their varied soil and rock types as well as their
accessibility. Accessibility of these communities varied between a three-hour car ride to a four-
hour hike.
3. SELF-RECOVERY PROCESSES
3.1 Philippines
Typhoon Haiyan, known locally as Yolanda, impacted the Philippines on the 8th of November
2013. One of the strongest typhoons to ever make landfall, Haiyan caused widespread
destruction, particularly across the Visayas region. More than 14 million people were affected,
more than 4 million displaced and over 6,000 were killed; 1.1 million houses were damaged
of which more than half were destroyed completely [16]. The impact of the event quickly
outpaced the government’s capacity to respond effectively, leading to its call for international
humanitarian assistance.
These experiences contrasted with those associated with typhoon Haima, known locally as
Lawin, which made landfall on the 19th of October 2016. Haima also caused serious damage
to homes and livelihoods, particularly, across the Cagayan and Apayao provinces of the
Northern Luzon region. At least 15 deaths were attributed to Haima [17], the typhoon displaced
around 200,000 people and damaged or completely destroyed almost as many houses [18].
Despite the high impact, the government led the humanitarian response and declined offers
of international assistance
Following both disasters, shelter construction and reconstruction was a priority for affected
families. They took steps to recover their shelter immediately, mostly by salvaging and reusing
(or in some cases buying new) materials [19]. Many households had reconstructed a shelter
before external assistance arrived. In some cases, what had originally started as an entire
temporary shelter formed one part of a larger, more permanent structure. The research team’s
visual observations and building surveys demonstrated that people who had already
constructed a shelter before new materials arrived, subsequently used these to build shelters
for their livestock or expand shelter size rather than replacing the old materials on their house.
Livestock is an important source of livelihood for rural families and often cited as an immediate
priority for households once their basic shelter needs had been met. Some households that
had rapidly reconstructed found themselves ineligible for shelter assistance by the time
assessments for beneficiary selection were carried out, on the basis that, their houses were
believed not to have been damaged by the event.
Many communities relied on community organization underpinned by traditional systems of
bayanihan for household reconstruction. Bayanihan is central to Filipino culture: it refers to
feelings of concern for the community, and the taking on of other people’s burdens [20]. In
practice this translated into community members grouping together to build shelters for
neighbours, often starting with the most vulnerable individuals in their community. However,
while bayanihan was often celebrated by communities there was, at times, the suggestion that
7 A Village Development Committee (VDC) is the lower administrative division of the Ministry of Federal Affairs and Local Development. VDCs function in a similar way to municipalities but with greater levels of interaction and administration between the public and the government.

30
wealth and power imbalances meant that some people benefited from the process more than
others. While local official leaders known as barangay captains played an important role in
recovery by acting as the bridge between the municipal governments and affected
communities, Filipino dynasties, geographical accessibility and nepotism were frequently
referenced during interview conversations on abilities to recover at individual, household and
community levels.
Beyond affected individuals and communities, a number of other actors influenced strategic
choices in recovery (e.g. whether or not to relocate; what materials to use in reconstruction;
changes to livelihood strategies) as well as the speed of interventions and beneficiary
selection processes. Other actors, for example, religious, family and neighbourhood networks
were clearly relevant in shaping pathways of recovery. Individuals often referred to family
members that were Overseas Filipino Workers (OFWs), a main source of income for the
country and an important economic asset for households8.
Shelter actors aimed to support people in building a safer, permanent house [21-22] using a
‘self-recovery’ approach that is operationalised using financial (cash and/or voucher
provision), material (provision of materials and tools for construction as well as support for
salvaging and reusing debris) and/or technical assistance (provision of guidance on
construction through training and/or guidelines and mass communications). The technical
assistance focused on communicating and promoting Build Back Safer (BBS) messages9.
Similarly, actors supporting livelihood recovery also used a three-pronged approach aiming to
reboot local economies and complement the shelter interventions. However, although
people’s agency in reconstruction was impressive, their frequent use of low-quality materials
was a concern as this can be at the core of either mitigating or reinforcing vulnerabilities [23].
Poorly constructed, unsafe buildings are frequently the largest cause of serious injury, trauma
and death when a disaster occurs.
3.2 Nepal
On the 25th April 2015, a 7.6 magnitude impacted Nepal with the epicentre in Gorkha district.
Gorkha borders the Dhading district province where this research was carried out, which lies
around 76 kilometres from the capital Kathmandu. The earthquake had a devastating impact
on housing stock, destroying more than 600,000 houses and leaving almost 300,000 partially
damaged. The event affected more than 8 million people, displaced around 117,000 and
caused injury to more than 22,000 [24].
The self-recovery experiences of disaster affected communities in Nepal contrasted
significantly with those in the Philippines for several reasons. A range of environmental factors
in the weeks and months following the event seriously challenged initial self-recovery efforts.
Some reports have stated that the main earthquake was followed by more than 300
8 See Philippine Statistics Authority: https://psa.gov.ph/content/statistical-tables-overseas-filipino-workers-ofw-2016 & ILO 2008 http://www.ilo.org/wcmsp5/groups/public/---asia/---ro-bangkok/documents/publication/wcms_160579.pdf 9 Build Back Safer (BBS) messages were developed through a consultative process with shelter agencies and government as a part of the Typhoon Haiyan / Yolanda response in the Philippines and can be seen as a minimum checklist of disaster risk reduction construction techniques for owner-driven self-recovery in non-engineered, non-architecturally designed lightweight structures that most shelter agencies were dealing with. BBS messages are often developed as part of shelter responses to different disaster contexts [26].
31
aftershocks including another 6.7 magnitude earthquake on April 26th [25]. The scale of the
event and the aftershocks increased the level of fear that people felt in relation to the
environment owing to the potential for rock fall, landslides, further building collapse and the
unpredictability of earthquakes.
While in the Philippines people made attempts to start clearing debris for reconstruction
relatively soon after the event, in Nepal people were often both unable and unwilling to return
from nearby displacement camps to previous settlements to carry this out. Many communities
described this as a key strategy in early recovery, building communal shelters and living
together for several months after the initial shock. This enabled people to meet their immediate
priorities of food and shelter in the aftermath of the earthquake, but also ensured they had the
time to overcome the feeling of fear, which resonated every time they experienced an
aftershock or trembling from a nearby landslide.
Additionally the monsoon period that lasts from June and to September served to further delay
self-recovery efforts with the heavy rains making debris clearance and reconstruction
impossible and significantly increasing cases of illness. Recovery and reconstruction in the
rural and mountainous areas was also disrupted by the damage to local transport and
infrastructure links caused by the earthquake and subsequent landslides. This restricted
access and the flow of materials for reconstruction but also increased the costs associated
with their transportation and caused feelings of isolation. In view of these challenges,
communities often discussed their mobilization for fixing roads and removing debris from
landslides. Furthermore, people discussed their seasonal, temporary or permanent movement
to other areas less isolated from their villages, particularly during the monsoon season.
Many households had been unable to reconstruct at all and remained in temporary shelters.
Families with irregular land tenure were not eligible to receive government financial
assistance, which posed a significant challenge to their recovery. These groups, often the
most vulnerable, included those living on religious guthi land, families living for years on
government land or marginal land, and grown-up offspring who had built houses on their
parents’ property but did not have separate title. The inability of these households to access
assistance meant that those who had managed to rebuild a shelter had gone into high levels
of indebtedness through reliance on bank loans, credit cooperatives or money lenders, and
had reconstructed houses that were no more earthquake-resilient or safer than their pre-
disaster condition.
Overall, the event rapidly overwhelmed the capacity of the government to respond, resulting
in their call for international assistance. The NGO shelter response then focused mainly on
the distribution of materials and tools, technical assistance and training (for local carpenters,
plumbers and masons), followed by cash grants, winterisation and housing design [27].
That said, the government is continuing to play a heavily centralised role in the reconstruction
of the affected districts and has placed much of its focus for recovery on owner-driven housing
reconstruction. The National Reconstruction Authority (NRA) and Housing Recovery and
Reconstruction Platform (HRRP) have developed several housing typologies and made
financial support for reconstruction conditional on the incorporation of structural features to
increase earthquake resilience [28].

32
Recovery in Nepal has, however, been stalled by lengthy delays in distributing cash for
reconstruction, as well as a shortage of trained engineers to provide information, advice and
guidance to households throughout the reconstruction process. Interviewees often explained
that they felt unsure as to whether their housing was structurally safer or not and whether they
had met the conditions to receive subsequent tranches of funding. As a consequence, families
felt they were unable to re-establish the type of emotional feelings of safety in the home that
are important for psychosocial recovery from the event [29].
Furthermore, research findings indicate a discord between government and community
perceptions of the aim of the financial assistance that was being provided. The government
maintained that the assistance was a support to recovery that households should then top up
using their own resources; and some households had indeed managed to do so by making
use of their access to overseas remittances or through loans and relying on labour exchange
with other community members. However many households saw an unbridgeable shortfall
between the cash grant and the cost of a finished house that complied with the required
typologies and techniques.
3.3 Emerging themes on self-recovery
Affected communities in both the Philippines and Nepal demonstrated a capacity to initiate
their own recovery through various strategies, whether influenced or not by other stakeholder
assistance. Whether it was bayanihan in the Philippines or living collectively for a period of
time in Nepal, community organisation and the use of social capital were part of people’s
immediate recovery strategies. The (re-)use of pre-existing resources such as salvaged
materials or what was left of their homes and livestock shelters was also identified as a self-
recovery strategy. However these actions were heavily burdened by lack of other resources
due to debts, insecure land tenure and damaged livelihoods from recurring hazards. Recovery
is further burdened by damaged infrastructures and as a result the physical and psychosocial
isolation of communities. Furthermore, prioritising their livelihood, diversifying their economic
activities and using their human capital were also important steps towards recovery. People’s
livelihoods emerged as a significant motivation in self-recovery efforts.
The research also identifies themes that present themselves as challenges in supporting self-
recovery in practice. One challenge relates to the role that different stakeholders take on as
assistance providers and how these roles influence and define recovery pathways by either
supporting or inhibiting them. A second challenge relates to the accessibility to adequate and
accurate information from those who are recovering - but also those who design assistance –
to make informed decisions on how to recover or support recovery.
4. SELF-RECOVERY IN THE URBAN ENVIRONMENT
4.1 Implications and persisting knowledge gaps
Drawing on the emerging themes highlighted from the initial research and applying an urban
lens one can propose certain implications for research on self-recovery in urban environments.
By identifying knowledge gaps, the following section suggests certain directions for future
inter-disciplinary and multi-stakeholder collaboration for supporting post-disaster self-recovery
in urban contexts.

33
4.1.1 Whose recovery?
Although disaster-impacted individuals are the owners of their own self-recovery pathways, it
is a process that is also influenced by the actions of other local, national and international
actors as well as the differential power dynamics that operate between them. The influence of
these factors on self-recovery is likely to be intensified as urban settings host a greater
quantity and wider range of stakeholders. Not only are there more actors, but they also vary
significantly in type and often have overlapping relationships that can be difficult to identify
and isolate. Urban environments have introduced new forms of both formal and informal
stakeholders into the crisis response equation. These environments are also highly dependent
on dense economic systems that define market relationships that are not geographically
isolated, are very fluid and sensitive to the smallest changes. The understanding of the
direction and type of connections between these different actors is very blurred, particularly
during emergencies when there is limited time to do so. Understanding these connections is
crucial when addressing the kind of support needed for self-recovery and the channels through
which it is provided.
4.1.2 Social organisation
Support mechanisms and networks are not only spatial - within a neighbourhood or around a
crossroads - but also virtual, through social media or specific interest groups. The multitude of
spatial, virtual, cultural and religious relations within urban environments also diversify the
natures of ‘communities’ within urban environments. Thus, strategies to self-recover through
communal action may also change. Communities in rural Philippines often relied heavily on
local social structures and bayanihan processes for reconstruction, and those in Nepal on the
exchange of labour between community members. In densely populated or highly mobile
urban environments the type of social cohesion necessary to allow collaborative strategies to
take place may differ or not exist at all. Different forms of social cohesion will exist [30, 32, 33].
It is also possible that affected urban communities will rely heavily on international support
networks or communities through social media and the internet for example. However when
network infrastructures are disrupted in the aftermath of a disaster, the level of support such
communities can provide may be considerably limited. The immediate aftermath of a disaster
may force new communities to form around common – and urgent – needs [33, 34], although
they may only exist temporarily
4.1.3 Shelter
Immediate shelter from harsh weather and aftershocks will also be a priority for people in post-
disaster urban environments. However, whilst both case studies demonstrate people’s
initiative and drive to salvage materials and rebuild temporary shelters, the nature,
components and space for the reconstruction and repair of shelters will vary considerably in
urban environments; if people take part in rebuilding at all. Co-habiting and renting will diversify
the already varied typologies of housing and the policies and codes within densely populated
spaces will increase the complexity of shelter support. These differences present important
implications for urban emergency shelter support for self-recovery and, require further
research.
34
4.1.4 Land tenure
Both the Philippines and Nepal experiences showed self-recovery to be heavily shaped by
issues of land tenure. Not only does land tenure dictate where people can legally reconstruct
following a disaster, but it also influences the type and quantities of assistance that they are
able to receive from other actors to do so. Land tenure issues are particularly pertinent within
low-income urban settlements that are often characterised by complex and insecure
ownership agreements that can paralyze response [33]. These locations can quickly come to
be declared as no-build zones in the aftermath of a disaster and/or become the focus of
resettlement programmes as witnessed following Typhoon Haiyan in the city of Tacloban [34].
Families in such situations are likely to face a series of difficult decisions when self-recovering.
In both the Philippines and Nepal people often found themselves making trade-offs between
relocation at the potential cost of local social networks and proximities to livelihood-earning
opportunities, or returning to old sites and risking reconstruction but potentially with little to no
support from governmental or international actors in doing so. In Nepal, people frequently
made reference to the relocation of family members to cities or overseas in search of economic
opportunities with which they could support their recovery financially.
4.1.5 Livelihoods
Livelihoods will always be a priority for recovery. However, the strategies and nature of
livelihoods vary significantly in an urban environment. How these livelihood strategies may
vary further or, perhaps, become more similar to those of rural environments during a crisis
will present an interesting question. Such livelihoods may depend on the extent of damage to
the urban economy and investment required to reboot it, as well as become subject to the risk
of reactivated and/or new forms of crime and violence, particularly within resource-poor,
marginalised and informal settlements. How these processes shape, hinder or activate
recovery pathways should be a key concern for further research.
4.1.6 Infrastructure, planning and scale
Land tenure, rental markets, shelter and service provision are key concerns in recovery and
longer-term resilience within urban environments [36,37]. Access to functioning services,
infrastructure and transport links, although often lacking, was considered to be a fundamental
aspect of recovery in rural Philippines and Nepal. People living in urban environments are no
less reliant on these services, often being accustomed to functioning infrastructure before the
disaster. The heavy reliance on these systems suggests they should be a key priority for local
governments in the immediate aftermath of disasters. However, the same reliance will also be
a challenge, as cities depend on heavier, more widespread and complex mechanisms that
need to be restored. Nonetheless, because urban centres depend so drastically on dense
interconnected infrastructural systems [38,39], the investment made to reboot them in the
aftermath of a disaster could have highly beneficial consequences for those self-recovering in
urban environments.
The issue of infrastructure is inherently connected to that of urban planning. There is a
practical gap between supporting self-recovery and the impact of this approach on the wider
urban planning and systemic challenges within urban environments [40]. Nonetheless, the
implications of self-recovery strategies used by communities – such as moving back into no-
build zones - can influence the longer-term sustainability, resilience and preparedness of cities

35
in the face of future crises. Thus, the challenge and humanitarian knowledge gap lies in
understanding how to reconcile the drive to support self-recovery of individuals in crisis-
affected urban environments with the longer-term implications of this support that lies beyond
the humanitarian mandate. Furthermore, working in urban environments makes engagement
with urban planning mechanisms and processes at different scales - as well as the politics that
underlie these processes – inevitable and important.
Supporting family and community self-recovery implies working at the scale of individual
households and neighbourhoods. However, such practice within urban environments cannot
be isolated from engaging with other scales in the city. Thhe more that humanitarians become
part of urban crisis response to individuals, the better they will need to understand the
parameters in which to work and their impact and role as intervenors in already significantly
complex urban systems with multiple scales.
4.2 Directions for future inter-disciplinary and multi-stakeholder collaboration
Complex urban contexts require that those intervening gain an interdisciplinary understanding
of the reality on the ground. Most research on urban crisis and humanitarian response has
failed to look across sectors (such as shelter, health, water and sanitation, education). [41].
There is a need to not only work across sectors within humanitarian practice but also across
different disciplines, actors and scales in the urban setting.
4.2.1 Informed intervention design
The present research provides evidence that decisions made in the early stages of recovery
by those who are self-recovering and those who design emergency interventions and select
beneficiaries can have significant consequences in the longer term; for example, when
temporary shelters are immediately rebuilt by affected individuals who then become ineligible
for shelter assistance, demonstrated in the Philippines and Nepal. They have risked rebuilding
houses that are reproducing structural vulnerabilities to future events and, by doing so, may
not receive newer, higher-quality materials and technical assistance in reconstruction.
Ironically, their agency and initiative to take control places them at a disadvantage. Similarly,
in urban contexts, those who exercise agency and initiative and find solutions quickly may fall
off the radar of humanitarian assistance by living with extended families or rebuilding in light
materials within areas more difficult for humanitarian assistance to reach.
Addressing the design of recovery interventions and implementation processes from an
informed interdisciplinary and multi-sector approach could support self-recovery pathways and
in some cases avoid deferring or inhibiting them. The Nepal reconstruction assistance
prioritised safety over other potentially important economic, social and cultural considerations.
Traditional Nepalese homes often have shops and tea-houses on the ground floor with living
spaces above. A typical mountain house can have a stable for livestock on the ground floor,
living space above and food storage in the roof space. Yet three-storey buildings and the wide
openings of the traditional shops are outside the provisions of the existing government housing
design catalogues. Deviation from these would require additional engineering design, which
is largely unattainable for the affected households10. The outcomes of the research suggest
10 Although field-based NRA engineers were available to respond to cases where additional engineering advice was needed, interviews and observations suggest the vast quantity of requests has overwhelmed the capacity of the engineers based in each VDC.

36
that this approach, although it supports an owner-driven-reconstruction model, has the
potential to disrupt the restoration of family livelihoods and the local economy. Similar risks
will present themselves in urban environments where complex land tenures, limited space and
multiple livelihood options require increased flexibility in reconstruction processes: a
requirement that is very difficult to achieve in face of strict building codes and other legal
frameworks, and the increased cost of space.
The significant diversity, of needs, capacities and self-recovery strategies within rural
environments becomes more diverse, dense and at a greater scale in urban environments.
The body of theoretical knowledge about mechanisms for quickly understanding this multitude
of needs, capacities and strategies in post-disaster urban contexts continues to grow [42].
However, evidence suggests that in practice, humanitarians continue to struggle in quickly
understanding post-disaster complex urban environments. Nonetheless, the existing
capacities of disaster-affected communities in recovery play a significant part in their rate and
possible ‘success’ of recovery and are therefore central to understanding what assistance is
most appropriate and why. Yet, the focus of disaster responders is often on the ‘how to’
question rather than the ‘why’ [43]. Disciplines should push to work with disaster-affected
communities to better understand the contexts in which recovery strategies are shaped,
critically engaging with the question of ‘why’. Often within the time and resource constraints of
emergency and recovery contexts, decisions are made without critically reflecting on their
consequences: such as whether or not the assistance is supporting or hindering the recovery
and resilience building processes of disaster-affected individuals. Not only are there significant
knowledge gaps for those designing humanitarian response but also for those who are making
choices to self-recover. In both the Philippines and Nepal, individuals explained that their
concerns were not only about making decisions in relation to recovery, but also about being
confident that they were making the right one thereafter. Communities often voiced a desire
to gain better understanding of natural hazards, changing markets and existing policies that
could facilitate and better inform their decisions. Interviewees demonstrated their capacity to
make decisions in every aspect - shelter, livelihoods, where to relocate to, what to do with the
assistance they received – but suggested the quality and relevance of information at hand to
inform these decisions was limited.
4.2.2 Developing effective and efficient knowledge exchange mechanisms
In both countries, providing technical information about reconstruction was a significant
element of the recovery response through the use of BBS messages. However, the application
of BBS messages in reconstruction, the misunderstandings of the role of financial assistance
and the desire for longer-term accompaniment indicated a gap in access to clearer, more
relevant and accurate information. This calls existing information, communication and
education (IEC) mechanisms and materials, used in the responses, into question and sheds
light on the significant challenge of communication for humanitarian practice in urban
environments [44]. Information can spread quickly and in an uncontrolled manner. There can
be a large number of stakeholders and sources that can influence or produce information and
control access to it. . A good understanding of market and political processes, housing, land
and property (HLP) systems, as well as the impacts of hazards on urban infrastructural
systems could be particularly valuable to those struggling to recover from urban disasters.
Access to information, communication and empowerment in information management and
decision-making should a subject for further research into the use of science, technology and

37
communication for disaster-affected communities that are self-recovering. Increased
efficiency and effective use of IEC materials, as well as more innovative data collection and
communication technologies (e.g. GPS, drones, tablets) could significantly improve
humanitarian practice in supporting self-recovery in contexts of urban crises.
5. CONCLUSIONS
Self-recovery is a new and little understood area of research but is nonetheless gaining
increased attention in academic and humanitarian shelter practice circles. What is increasingly
evidenced is that it does not take place in a linear and logical way as it is a subjective
experience and process. It takes on different forms and priorities that often overlap. Shelter
frequently comes hand in hand with livelihood priorities, for example. It is also clear is that
people make choices and take initiative to recover within hours of a disaster. Evidence
suggests that if disaster-affected communities have agency and will adapt assistance to meet
their own needs in the way they trust is best, then humanitarian practice and response needs
to be more adaptive toward this agency. If it is not, it is likely to inhibit recovery processes.
Although the findings from this paper are based on a rural study, they provide significant
direction for further research into self-recovery in urban environments. The paper highlights
the inevitability of affected individuals taking action and using their own resources to recover
in post-disaster contexts, whether assistance reaches them or not; and therefore, the
importance of understanding these processes as they define recovery pathways, long-term
resilience, preparedness and vulnerability to future events within urban environments.
Urban environments present fast-paced, dense and complex contexts. Depth in understanding
of the multiple systems at play is key to generating better informed humanitarian intervention
designs. However, this is only possible by continuing to develop more effective and efficient
knowledge exchange mechanisms for inter-disciplinary and multi-sector collaboration. The
promotion of safer reconstruction as well as more informed decision-making processes
regarding the built and natural environments and risks that people are exposed to depends
greatly on stakeholders’ ability to effectively exchange information and learn from each other,
to generate behaviour changes not only among crisis-affected communities but also of all
stakeholders involved in recovery processes.
References
[1] Parrack, C, Flinn, B, Passey, M, Getting the message across for safer self-recovery in post-disaster shelter. Open House International 39(3): 2014, pp.47-58.
[2] Parrack, C, Flinn, B, Passey, M, Getting the message across for safer self-recovery in post-disaster shelter. Open House International 39(3): 2014, pp.47-58.
[3] “Shelter Projects”, Global Shelter Cluster (2016), available from http://shelterprojects.org/ [last
accessed Sept.2017]
[4] Flinn, B. and Echegaray, M. Stories of recovery: CARE Philippines post Haiyan/Yolanda shelter response, CARE International UK, London (2016)
[5] Maynard, V., Parker, E. and Twigg, J. (2017). The effectiveness and efficiency of interventions supporting shelter self-recovery following humanitarian crises: An evidence synthesis. Oxford: Oxfam GB.
[6] Parrack, C, Flinn, B, Passey, M, Getting the message across for safer self-recovery in post-disaster shelter. Open House International 39(3): 2014, pp.47-58.
[7] Schofield H, Miranda Morel L, 2017. Whose recovery? Power, roles and ownership in humanitarian shelter assistance. Humanitarian Exchange 69: 29-30.
[8] Schofield H, Twigg J, 2017.Self-recovery for resilience: a multi-faceted process. In Batra P, et al., Resilience Scan, January-March 2017. London: ODI, pp. 11-14.

38
[9] Schofield H, Miranda Morel L, 2017. Whose recovery? Power, roles and ownership in humanitarian shelter assistance. Humanitarian Exchange 69: 29-30.
[10] Platt, S., Brown, D., and Hughes, M. (2016) Measuring resilience and recovery. International Journal of Disaster Risk Reduction 19: 447-460.; p.456
[11] Parrack, C, Flinn, B, Passey, M, Getting the message across for safer self-recovery in post-disaster shelter. Open House International 39(3): 2014, pp.47-58.
[12] Flinn, B. and Echegaray, M. Stories of recovery: CARE Philippines post Haiyan/Yolanda shelter response, CARE International UK, London (2016)
[13] Wamsler, C., & Brink, E. Moving beyond short-term coping and adaptation. Environment &
Urbanization, 26(1), (2014) pp.86-111. 10.1177/0956247813516061
[14] International Rescue Committee (IRC) (2017) Urban context analysis toolkit. Guidance note for
humanitarian practitioners. IIED, London.
[15] Brown, D, Johnson, C & Archer, D, Setting a new research agenda for urban crisis and
humanitarian response, IIED, London (2015)
[16] OCHA, Philippines: Typhoon Haiyan Situation Report, No. 34, OCHA, 28 January (2014)
[17] OCHA, Typhoon Haima update and unmet needs, OCHA Philippines Humanitarian Bulletin,
(2016) available from: http://ochaimphil.github.io/Humanitarian-
Bulletin/HumBulletinOct2016.html [last accessed: September 2017]
[18] OCHA, Philippines: Typhoon Haiyan Situation Report, No. 6 (final), OCHA, 28 October (2016)
[19] Schofield H, Miranda Morel L, 2017. Whose recovery? Power, roles and ownership in humanitarian shelter assistance. Humanitarian Exchange 69: 29-30.
[20] Bankoff, G (2004) : In the eye of the storm: The social construction of the forces of nature and
the climatic and seismic construction of God in the Philippines. Journal of Southeast Asian
Studies. 35 (1), pp 91-111.
[21] Flinn B, Schofield H, Miranda Morel L, 2017. The case for self-recovery. Forced Migration Review 55: 12-14.
[22] Maynard, V., Parker, E. and Twigg, J. (2017). The effectiveness and efficiency of interventions supporting shelter self-recovery following humanitarian crises: An evidence synthesis. Oxford: Oxfam GB.
[23] Richie, L.A and Tierney, K (2011) Temporary housing planning and early implementation in the
12 January 2010 Haiti earthquake. Earthquake Spectra (27) 1, pp. S487-S507.
[24] EMI, 2015 Nepal Earthquake: M7.6 Gorkha Earthquake response and Early Recovery Case
Study, Earthquakes and Megacities Initiative (2015)
[25] EMI, 2015 Nepal Earthquake: M7.6 Gorkha Earthquake response and Early Recovery Case
Study, Earthquakes and Megacities Initiative (2015)
[26] GSC, 8 Build Back Safer Key Messages Poster, Global Shelter Cluster, (2017) available at:
https://www.sheltercluster.org/pacific/documents/8-build-back-safer-key-messages-english
[last accessed: September 2017]
[27] Schofield H, Miranda Morel L, 2017. Whose recovery? Power, roles and ownership in humanitarian shelter assistance. Humanitarian Exchange 69: 29-30.
[28] Gov’t of Nepal Housing Progress, HRRP, 2017, available from:
http://www.hrrpnepal.org/housing-update [last accessed Sept 2017]
[29] Schofield H, Twigg J, 2017.Self-recovery for resilience: a multi-faceted process. In Batra P, et al., Resilience Scan, January-March 2017. London: ODI, pp. 11-14.
[30] See Campbell, L. and Miranda Morel, L., (2017) Learning from the Ebola Response in cities:
Communication and engagement. ALNAP Working Paper. London: ALNAP/ODI.
[31] Jabeen, H, Allen, A, & Johnson, C, Built-in resilience: Learning from grassroots coping
strategies to climate variability, Fifth Urban Research Symposium (2009)
[32] Campbell, L. (2016) Stepping back: understanding cites and their systems. ALNAP Working
Paper. London: ALNAP/ODI.
[33] Campbell, L, Working with people and communities in urban humanitarian crises, ALNAP,
(2017)
[34] CRS, Urban Shelter and Settlement Recovery: A menu of options for households,
Humanitarian Practice Network (2015) available at: http://odihpn.org/magazine/urban-shelter-

39
and-settlement-recovery-a-%C2%91menu-of-options%C2%92-for-households/ [last
accessed: September 2017]
[35] Mohiddin, L., Smith, G and Phelps, L (2017) Urban Response Analysis Framework (URAF).
Guidance note for humanitarian practitioners. IIED, LONDON
[36] Twigg, J & Mosel, I, emergent groups and spontaneous volunteers in urban disaster response,
Environment and Urbanization, IIED, (2017); pp. 1-16
[37] Campbell, L. Stepping back: understanding cites and their systems. ALNAP Working Paper.
ALNAP/ODI. London: (2016)
[38] Campbell, L. Stepping back: understanding cites and their systems. ALNAP Working Paper.
ALNAP/ODI. London: (2016), pp.34
[39] Wamsler, C., & Brink, E. Moving beyond short-term coping and adaptation. Environment &
Urbanization, 26(1), (2014) pp.86-111. 10.1177/0956247813516061
[40] Campbell, L. (2016) Stepping back: understanding cites and their systems. ALNAP Working
Paper. London: ALNAP/ODI.
[41] Brown, D, Johnson, C & Archer, D, Setting a new research agenda for urban crisis and
humanitarian response, IIED, London (2015)
[42] Mohiddin, L., Smith, G and Phelps, L (2017) Urban Response Analysis Framework (URAF).
Guidance note for humanitarian practitioners. IIED, LONDON
[43] Brown, D, Johnson, C & Archer, D, Setting a new research agenda for urban crisis and
humanitarian response, IIED, London (2015)
[44] Campbell, L, Working with people and communities in urban humanitarian crises, ALNAP,
(2017), p.49

40
4. INFRASTRUCTURE INTERDEPENDENCIES: OPPORTUNITIES FROM COMPLEXITY
Darren Robert Grafius1, Liz Varga2 and Simon Jude3 1 Department of Animal and Plant Sciences, University of Sheffield, S10 2TN, UK 2 Complex Systems Research Centre (CSRC), School of Management, Cranfield University, College Road, Cranfield, Bedfordshire, MK43 0AL, UK. 3 Centre for Environmental Risks and Futures (CERF), School of Water, Energy and Environment, Cranfield University, MK43 0AL, UK
ABSTRACT. Infrastructure networks such as those for energy, transportation and
telecommunication perform critical functions for societal well-being. Recent
sociotechnological development has replaced the historical isolation of these
systems with unprecedented interdependency. Infrastructure now functions as a
‘system-of-systems’, exhibiting complex and unpredictable behaviour.
Consequently, a majority of research efforts into infrastructure interdependencies
have focused on risk and vulnerability. Here we explore how these
interdependencies can conversely represent opportunities to increase resilience and
sustainability. We present a typology for classifying positive interdependencies, and
draw on fundamental principles in ecology where complexity is seen to enhance
rather than degrade stability. We argue that identifying the nature of opportunities
facilitates their adoption and enables better understanding of infrastructure
complexity, which in turn allows it to be turned to our advantage. Integrative thinking
is necessary not only for mitigating risks to system stability, but also for identifying
innovations that make human-created systems more sustainable and resilient.
Keywords: Infrastructure interdependency; Complexity; System-of-systems; Resilience; Sustainability
1. INTRODUCTION
Infrastructure systems such as those concerned with water, energy and transportation
networks perform functions critical to the health and well-being of society by facilitating
essential flows of resources, services, and information [1]. Historically, such systems have
largely been developed and maintained in isolation from one another, evolving over decades
or centuries in many cases as either public or private enterprises. Modern technologies and
demands, however, have given rise to an unprecedented degree of complexity and interlinking
between previously disparate networks. Infrastructure now functions as a ‘system of systems’,
exhibiting complex adaptive behaviour and numerous interdependencies that can leave critical
functions highly vulnerable to disturbances, particularly through exacerbating effects of this
complexity such as cascade failure [1–3].
As a consequence of this, a majority of research efforts on infrastructure interdependencies
have been concerned with risk and vulnerability, placing a primary focus on system complexity

41
as a negative. Broad challenges emerging from global climate change and population growth
are forcing industries, governments and other decision-makers to adapt by reaching across
conventional boundaries to share ideas and approaches in order to build resilience in the face
of universal concerns [4–6]. Related to this, understanding the interdependencies that have
become fundamental to our infrastructure systems is essential if such systems are to be
designed, managed, and adapted in ways that will be resilient to future disturbances [2].
Further, an evidence gap has been identified around the need for new models and methods
to understand the interdependencies present in infrastructure systems [7–9].
Although risk identification and mitigation make up the majority of research efforts on
infrastructure interdependencies, the systematic view that is necessary for such efforts can
shed light on beneficial elements of these interdependencies as well. Examples exist where
interdependencies have been exploited or proposed to enhance the delivery of essential
services, or synergised to create entirely new services [10–12], and climate change adaptation
efforts frequently state the need for interdisciplinary collaboration [4, 6]. Where this has been
done in practice, however, there has rarely been an explicit recognition of the positive role
played by interdependency; yet in complex natural systems it is generally accepted that
interdependency and complexity play key roles in enhancing the sustainability and resilience
of the overall system [13].
The aim of this paper is to illustrate and discuss the ways in which interdependencies in
complex infrastructure systems may be viewed as opportunities for enhancing function,
resilience and sustainability. To this end, we propose a threefold typology for considering
beneficial interdependencies based on their relative level of integration. Key principles of
ecological systems are then discussed, as these represent systems whose complexity builds
resilience rather than impedes it, and finally parallels are explored whereby infrastructure
systems might learn from the behaviours and structures of natural systems in order to function
more effectively.
2. INFRASTRUCTURE INTERDEPENDENCIES
Many infrastructure systems have historically been developed in relative isolation from one
another, driven by public interests to provide essential services or by private interests to
forward a business case. Technological advancements, societal demand changes and
evolving external drivers such as climate change and geopolitics have converged over time to
drive adaptations in the purpose and behaviour of critical infrastructures. These systems have
now grown interconnected and interdependent, forming a global ‘system of systems’ whose
functionality is critical to the smooth functioning of society.
In a seminal work that has underpinned interdependency research since, Rinaldi et al. [1]
defined dependency as a one-way linkage or flow of causality; whereas interdependency was
used specifically for bidirectional relationships where two separate systems or nodes both
exert influence on the other. The authors further proposed a typology for categorising
infrastructure interdependencies according to their nature, which has subsequently been
widely adopted by researchers. The framework consists of: physical linkages (where systems
share a direct material connection), cyber linkages (where system state depends on
information flow), geographic linkages (where systems are connected by spatial proximity)

42
and logical linkages (where systems are interconnected in some other fashion). The existence
of this typology has been beneficial in efforts to explore infrastructure interdependencies, as
it provides a structured framework by which complex interconnections can be classified,
understood and analysed [14–16]. More recent efforts by Carhart and Rosenberg [17] have
sought to expand upon the Rinaldi framework, proposing subdivisions to the category of logical
linkages such as policy/procedural, societal, and economic interdependencies, as well as
describing a framework of twelve variables by which interdependencies may be explicitly
described and typified.
Given the critical nature of infrastructure systems, coupled with the uncertainties associated
with complexity, the focus of most research on infrastructure interdependencies has been on
the risks and vulnerabilities they represent. Infrastructure systems have largely been
developed from a deterministic, goal-oriented systems engineering approach[18]. The
unpredictability of complex systems is at odds with this perspective, such that characteristics
of complexity such as nonlinear relationships, threshold effects and emergent behaviours are
perceived predominantly as threats to system stability and service delivery [3]. Accordingly,
most research conducted on infrastructure interdependencies has taken up this stance,
viewing interdependency as a threat to be mitigated and protected against.
3. INTERDEPENDENCY AS OPPORTUNITY
Interdependencies have thus far been explored primarily as a negative force, especially in the
context of infrastructure resilience, through the lens of the risks they represent through
cascade failures and cross-network vulnerability [2, 3, 5, 19–21]. We argue that
interdependency is, however, Janusian in nature; representing opportunities as well as risks.
In a 2013 workshop bringing together 25 infrastructure stakeholders from the energy, ICT,
transportation, waste and water sectors and including representation from industry, academia
and governance, Carhart and Rosenberg [17] focused on identifying beneficial
interdependencies within and across sectors. Of 77 identified interdependencies, 87% intra-
sector and 86% inter-sector linkages were categorised as having beneficial outcomes. This
result strongly suggests that the literature focus on interdependency solely as a risk factor is
disproportionate and incomplete.
In order to better identify opportunities from interdependency, these opportunities may be
organised into a typology depending on the nature and intensity of the interdependency in
question. Previous typologies have been proposed by which infrastructure interdependencies
can be broadly categorised and understood [1, 17, 22]; our aim here is not to replace or
challenge these efforts, but rather to complement them by presenting a typology specifically
targeted at the identification of beneficial opportunities arising from these interdependencies.
3.1. Simple opportunities
On a basic level, the sharing of knowledge across network gaps can inform and improve good
practice through exposure to new perspectives and procedures. What might represent
standard approaches to ensure secure, efficient or robust design in one system may be novel
and applicable to another where such approaches have not previously been explored. Here

43
the opportunity to increase the efficiency and resilience of systems is primarily a matter of
establishing lines of effective communication and collaboration between managers, designers
and operators that cross traditional departmental or industry boundaries [23]. While a one-
time learning event does not itself represent an interdependency, many interdependency-
based opportunities begin with the sharing of ideas (even within a single organisation such as
to increase productivity or single-plant resilience) and develop from that basis. This knowledge
exchange can then become a simple interdependency by establishing a transactional pathway
for the recurring transfer of knowledge and information between system operators. These
flows can be intermittent and non-critical to system functioning, thus representing
comparatively low risk, but also exhibiting a lesser degree of opportunity than more substantial
integrations. We therefore define simple interdependency opportunities as those based
primarily on knowledge exchange between practitioners, representing a transactional flow of
information that occurs intermittently but repeatedly, that are beneficial but not critical to the
operation of the coupled systems.
3.2. Geographic/physical opportunities
The physical co-location of multiple infrastructure systems can present opportunities for cost-
saving and increasing system efficiency. This represents essentially an expansion of
infrastructure sharing concepts to specifically consider sharing across multiple networks and
sectors. The placement of mobile phone network antennae on tall buildings or pre-existing
telecommunications masts precludes the need to build independent structures. Technologies
to store energy at the point of generation, especially in remote examples such as offshore
wind farms and wave-based power generation systems, can use combined structures to
reduce building costs and the necessary length of new transmission networks [24]. Similarly,
the establishment of power generation and storage technologies at the point of use, such as
with residential solar roof panels and home storage batteries currently under development,
would also represent a reduction in the loading demands of the transmission network. Such
decentralisation will support a considerable increase in system resilience, freeing end users
from sole dependence on the national power grid should a failure occur. Geographic/physical
interdependency opportunities represent beneficial couplings based on co-location and/or the
physical sharing of infrastructure, material or information across systems at a localised scale.
3.3. Integrative opportunities
Within the functioning and management of the networks themselves, interdependencies can
enable new opportunities for increasing resilience by applying the advantages offered by one
network to the management of another. The concepts of ‘smart’ infrastructure and the ‘internet
of things’, are fundamental examples of this. Data and information, gathered and distributed
by telecommunications infrastructure, are used to actively and efficiently manage decisions
and flows in networks of transport, water and power in real time (as opposed to simple
opportunities where information flow is used solely to impart knowledge). Integrative
interdependency opportunities are thus defined by a synergy and extensive functional
interconnection between multiple infrastructure systems at multiple points, representing
shared risk as well as significant benefits to the effective functioning of all coupled systems,
and improving the delivery of existing services and/or making entirely new services possible
[25, 26].

44
Infrastructures that become overly dependent on this synergy and make use of overly ‘tight’
couplings face the risk of cascade failure, so system design should seek to incorporate
redundancy and ‘fall-back positions’ to enable continued functioning if some breakdown
occurs. Resilience should remain a key priority and care should be taken to avoid the transition
to smart infrastructure being a blind one. Climate and social change will bring uncertain risks,
so systems must be engineered to be robust in the face of unknown pressures. With fully
integrated complex infrastructure systems, the risks are greater and thus must be recognised
and managed effectively, but the potential opportunities are equally more transformative. Our
ability to design and maintain resilient infrastructure systems depends on the ability to identify
those cases where the opportunities outweigh the risks.
4. ECOLOGY AS AN EXEMPLAR OF RESILIENT INTERDEPENDENCY
4.1. Why nature is resilient
Naturally occurring ecosystems are commonly given as examples of complex, interconnected
and resilient systems [27], and as such may offer insight into how such systems can function
effectively. Infrastructure systems are analogous to ecological systems in a number of ways:
both being highly interconnected, complex and adaptive; both exhibiting characteristic scaling
properties; and both relying on flows of material, information and energy [10]. In designing and
managing infrastructure systems, there may be lessons we can learn and apply from
ecosystems, which largely have evolved to be resilient to disturbance and sustainable within
their environment. Myriad feedbacks and interdependencies between numerous species of
organisms as well as energy and material flow systems act in nature to increase the resilience
of the overall system, rather than merely introducing vulnerabilities. Material and energy flows
are resilient in part by being fundamentally grounded in physical laws and chemical processes,
but also by functioning in cyclical pathways whereby no material is ultimately is wasted. At the
system level, resilience is achieved through complexity, with the system possessing self-
regulating behaviours and feedbacks that maintain the stability of the system in the face of
disturbances [13]. At finer scales, organisms and species are resilient in many cases due to
overlap and redundancy among ecological niches; rarely is a ‘role’ in the ecosystem filled by
only a single species whose loss would destabilise the broader system through cascading
effects.
4.2. How infrastructure differs from nature
By exploring ways in which the relationships and principles found in nature can be applied to
infrastructure systems, we find new ways to use complexity and interdependency to our
advantage by designing in greater resilience and sustainability to our own global systems.
Careful thought and translation will be required, however, as infrastructure and ecological
systems share fundamental differences despite their similarities, and are not perfect
analogues to one another. Natural systems have, by and large, adapted and evolved to their
current stable states through processes of random mutation, high attrition, emergent
behaviours and incredibly long time scales in a ‘bottom-up’ manner. Anthropogenic systems

45
on the other hand, and the concerns that drive them, are traditionally designed from a ‘top-
down’ goal-oriented perspective and are intolerant of such long time scales and resource
waste. Further, many technological systems have necessarily been developed to operate in a
highly controlled and deterministic manner [28] which is fundamentally at odds with the
seemingly haphazard way in which natural systems function. Such determinism and
reductionist thinking, however, encounters difficulty when considering larger systems, and
complexity forces a more integrative and ecological perspective than that which was used to
create the system’s components and base functionality [18]. This forced shift in perspective,
from a system’s creation based in reductionism and mechanistic design, to a systems
approach that recognises and addresses complexity, interdependency and emergent
properties, echoes the transition that has been seen in many disciplines over the past half-
century, such as Jane Jacobs’ pivotal call for fresh perspectives in urban studies [29] and the
steady rise of complexity science in ecology and biology [13]. Individual components and sub-
systems are necessarily created with a deterministic perspective; however, at the system
scale, human-created infrastructures must work to replicate by design and planning the
efficiency and resilience that nature has developed by long-term experimentation.
4.3. How infrastructure can learn from nature
Despite the important differences between human and natural complex systems,
commonalities exist where the functioning of nature can be applied as lessons for materials
engineering [30] and infrastructure design and management [31], enabling interdependencies
to be viewed as opportunities. In his book ‘The Web of Life,’ Capra [13] presents five principles
of ecology and system survival and discusses ways in which these lessons can be applied to
human society in the pursuit of sustainability. Here, we consider how these principles can
specifically be applied to infrastructure design and management (Table 1).
TABLE 1. Principles of ecology and system survival [13], and examples of how they can be applied to
infrastructure to build resilience and sustainability
Principle Ecological Description Infrastructure Relevance
Interdependence Members of a community are connected in a vast and intricate network of relationships via multiple feedbacks that create non-linear response patterns.
Reliance on outputs as inputs between infrastructures
Information feedback to optimise functioning (e.g. smart metering)
Cyclical Flow Nutrients are recycled so that waste of one species becomes food for another. Organisms are open systems but ecosystems are largely closed with respect to materials.
Avoidable waste reduction/ circular economy/ engineering for re-use
‘Closing the system’ by accounting for externalities, e.g. carbon tax systems
Partnership and Cooperation
Co-evolution, symbiogenesis and mutually interdependent adaptations
Infrastructure sharing (asset focus – cost efficiency)
Sharing economy (society focus – enhances well-being and community)
Flexibility Continual adjustment to feedback in response to constantly changing conditions. Negative feedbacks facilitate stabilisation after disturbance or a shift in conditions.
Adaptability to uncertainty (e.g. climate change)
Responsive traffic routing

46
Optimising for multiple objectives rather than maximisation to one
Diversity Pluralistic resilience, biodiversity with overlapping ecological functions that can partially replace one another
Distributed/pluralistic energy storage and generation
Multiple network pathways
The importance of Capra’s first principle, interdependence, is already well-known in
infrastructure contexts, but with focus usually placed on negative aspects such as vulnerability
and cascade failure risks as previously discussed. As in nature, and as explored above in the
proposed threefold typology, there are also many ways in which these interdependencies can
be exploited in a positive sense. Smart metering of residential electricity consumption, for
example, is growing in interest and uptake in various locations. This ability to provide
consumers with detailed and timely feedback has the potential to inform purchasing and
lifestyle decision-making toward more energy efficient behaviour, provided the feedback is
adequately clear and informative [32].
The second principle, cyclical flow, is something that human systems have taken steps to
transition toward but more progress is required to ensure sustainability and efficiency. The re-
use and recycling of materials, reduction in avoidable waste, and engineering of products for
long-term use rather than disposability are all actions that will serve to increase sustainability
at a society-wide scale. As organisations transition away from a solely competitive perspective
and consider circular economies and industrial symbiosis, benefits become apparent for both
the industrial community and long-term global sustainability [33]. This principle, in an
infrastructure context, primarily concerns flows of materials and resources but is closely linked
to, and dependent upon, partnership and cooperation between organisations and industries.
Partnership and cooperation are developing in many industries and sectors as interest grows
in systemic thinking, conducting interdisciplinary research, and bridging gaps between sectors
and networks that have previously operated independently. The drive to develop in this way
is largely a reaction to the growing complexity of global human-made systems, which cannot
be effectively managed and responded to by organisations remaining isolated and purely
competitive. At all three levels of interdependent opportunity identified above, partnership and
cooperation are required and, increasingly, becoming present. Knowledge exchange between
organisations has become commonplace in industries preparing to face climate change,
particularly where encouraged by government reporting programmes [4]. Infrastructure
sharing approaches (variously referred to in terms such as common carriage, unbundling,
track sharing, etc. depending upon industry context) represent geographic/physical
opportunities already widely exploited by numerous industries to mutual economic benefit [34].
Efforts to develop smart networks and infrastructure for efficient energy use and material
routing represent a strong integrative opportunity dependent on cooperative arrangements.
Flexibility is a principle whose importance has been highlighted by the need for infrastructures
and industries to adapt to the uncertain conditions caused by global climate change. Efforts to
build resilience to future disturbances, the exact nature and intensity of which remain
unknown, necessarily require a great deal of flexibility and capability to adapt to changing
circumstances. Rigid systems that are optimised to function only under a narrow set of external
conditions will face a high risk of failure when subjected to extreme circumstances outside of
the designed conditions. Systems that are able to adapt to these circumstances while

47
maintaining or improving their intended functions will prove much more resilient to future
disturbances. The possible ways in which driverless vehicles might be coupled to efficient
routing and vehicle sharing could transform the use of transportation infrastructure in major
cities, shifting personal transport from an owned asset to a shared service. This would
represent a flexible solution with benefits to urban congestion, emissions-based pollution and
manufacturing demand [35].
Finally, the principle of diversity is exemplified clearly in nature by the multitude of species,
functional groups and ecosystems that we observe; however its implementation in human
systems can be one of the greatest challenges. In large infrastructure networks, it is
recognised that redundant linkages play an important role in maintaining functionality should
a part of the network fail or saturate, offering diversity in the sense of multiple flow pathways.
However, beyond the mitigation of perceived immediate risk, excess redundancy may be
viewed as wasteful by decision-makers and stakeholders if the benefit to resilience is not
internalised. Conventional practices have also tended to favour mass production, providing a
financial incentive to populate networks and systems with an overabundance of a single
design or approach. In many cases this can be efficient, but this low diversity may represent
a vulnerability should a failure prove specific to that design or approach. The recent uptake of
‘lean manufacturing’ and agile production processes seeking to reduce waste while
maximising efficiency and adaptability [36] represent a change to this paradigm. In the energy
industry diversity is present in sources of electrical generation, which provides some resilience
to disturbances in the availability of fuel resources. Current research into battery technology
and the possibility of distributed, mobile and/or residential electricity storage also represent a
diverse approach, smoothing temporal discrepancies between supply and demand [37]. Such
‘micro-storage’ approaches would provide backup sources of energy to increase resilience
across the entire network, especially when coupled with distributed generation (e.g. residential
photovoltaic roof panels) and managed using smart grid technology to optimise timing, costs,
and social benefits [38, 39].
Understanding and analysing integrated infrastructure networks as holistic ‘systems of
systems’, as one would an ecosystem, is the first essential step in moving beyond an isolated
and sectoral approach and enabling a complete understanding of system dynamics [10, 40].
When understood in this way, system-level optimisation and management for broad-reaching
global interests become realistic possibilities. Further, the recognition of commonalities
between infrastructure networks and ecological networks (itself exemplifying a simple,
knowledge-based opportunity) allows us to adapt our own engineered systems and appreciate
the ways in which they can benefit from complexity. When incorporated into organisational
business models, and thus directly embedded in the guiding principles of how industries
operate and create value [41], sustainability and resilience may become much easier and
more natural issues to tackle.
4.4. Barriers to and enablers of opportunity
Opportunities can be recognised or driven in numerous ways, but several specific areas may
be considered from our Janusian perspective as either key barriers to or enablers of
interdependency-based opportunity. First, existing technology can act as a limiting factor in
the realisation of new innovations, but as it develops new opportunities may emerge that were

48
previously unfeasible. This is evidenced in the growth of smart systems, renewable energy
generation and increased efficiency in a variety of systems. Second, design and innovation
play a key role in re-evaluating how systems can function more effectively, such as through
the adoption of circular economic principles and the consideration of green and blue
infrastructure. If design perspectives are open to new ideas and creative thinking, rather than
resistant and entrenched in conventional practices, opportunity is possible from innovation.
Third, how we consider the maintenance of built systems influences the efficiency and
effectiveness with which they are managed, largely in terms of whether maintenance activity
is only reactive to faults or preventative and thus forward-looking. Fourth, governance can act
as a barrier to opportunity if regulatory structures are rigid, but equally capable of enabling
opportunity through careful and informed consideration of how public policy, regulation and
legislation can and should adapt to changing conditions. Finally, societal behaviour is
fundamental in determining whether innovations will be met with resistance or acceptance.
Demand-side responses to service delivery and an awareness of the context and implications
of consumer decisions are thus critical for enabling new opportunities.
5. CONCLUSIONS
Due to the way they have been historically developed, infrastructure systems traditionally tend
to be silo-bound; built and maintained in ways that discourage systems thinking and treatment
of interdependencies. Future efforts need to capture the ‘system of systems' view and work
across conventional boundaries in order to plan and manage infrastructure systems in the
wider context of one another and with regard to long-term benefits and risks to human well-
being.
Research and policy have largely focused on the negative aspects of interdependencies and
the risks they represent to resilience; however, further attention is warranted on the
opportunities they may represent. The risks represented by global climate change (and the
interdependencies they highlight) have driven a recognition of the need for organisations to
consider these risks and adapt to them together [4, 42]. By a similar token, infrastructure
design and management must recognise the risks and opportunities presented by
interdependency and adapt accordingly to these as well. However, we advocate here that the
focus on interdependency be pulled away from solely considering risks and vulnerabilities,
and seek to recognise and embrace the myriad opportunities that exist. Numerous projects
exist, either in theory or in practice, which are beginning to recognise and exploit these
opportunities [23, 43–47]. Such projects can range from adaptations of existing infrastructure
systems to novel disruptive business models that seek to replace entire supply chains and
conventional approaches [48, 49].
The typologies proposed in this paper represent a way in which the opportunities associated
with interdependency can be more effectively recognised and exploited. To further recognise
and understand opportunities in future efforts, several dimensions should be considered: 1.
what is the intensity of the opportunity? Is it a true two-way interdependency, and if so how
strong are the linkages? If not, is it a one-way dependency or simple co-location, and might it
develop into a true interdependency, either deliberately or unintentionally? 2. Has the
opportunity been planned in advance, or has it been recognised and exploited based on pre-
existing systems? Or is it completely emergent and serendipitous? 3. What specific value does

49
the opportunity offer, i.e. what is its business case? Does it provide increased resilience, an
engineering benefit or a cost benefit? Are the benefits represented in the market (i.e.
monetary) or not (e.g. societal well-being)? 4. What are the spatial and temporal scales of the
benefits? How large a geographic area do they impact, and when in the project’s life cycle do
they factor in? 5. Finally, how do the benefits weigh against the risks? All of the above
dimensions can and should be used to explore both opportunity and risk, and consider them
in the context of one another in order to weigh the overall value of interdependent efforts.
Accurately recognising and understanding opportunities from interdependency will aid
practitioners and decision makers in making informed choices as new innovations are
pursued. Transitioning our thinking toward the proactive recognition and pursuit of
opportunities from complexity, rather than only in reaction to threats, will have powerful and
far-reaching benefits for global well-being.
ACKNOWLEDGEMENTS
We acknowledge funding from the Engineering and Physical Sciences Research Council
(EPSRC) for project International Centre for Infrastructure Futures, ICIF, ref EP/K012347/1.
REFERENCES [1] Rinaldi, S. M., Peerenboom, J. P., & Kelly, T. K. (2001). Identifying, understanding, and
analyzing critical infrastructure interdependencies. IEEE Control Systems Magazine, 21(6), 11–25. doi:10.1109/37.969131
[2] Vespignani, A. (2010). Complex networks: The fragility of interdependency. Nature, 464(7291), 984–985. doi:10.1038/464984a
[3] Helbing, D. (2013). Globally networked risks and how to respond. Nature, 497(7447), 51–9. doi:10.1038/nature12047
[4] Jude, S. R., Drew, G. H., Pollard, S. J. T., Rocks, S. A., Jenkinson, K., & Lamb, R. (2017). Delivering organisational adaptation through legislative mechanisms: Evidence from the Adaptation Reporting Power (Climate Change Act 2008). Science of the Total Environment, 574, 858–871. doi:10.1016/j.scitotenv.2016.09.104
[5] Bissell, J. J. (2010). Resilience of UK infrastructure. POSTNOTE. London. Retrieved from http://www.parliament.uk/business/publications/research/briefing-papers/POST-PN-362
[6] Department for Environment Food and Rural Affairs (UK). (2011). Climate Resilient infrastructure: Preparing for a Changing Climate: Synthesis of the independent studies commissioned by the Government’s Infrastructure & Adaptation Project. London. Retrieved from www.defra.gov.uk/.../climate-resilient-infrastructure-full.pdf%5Cnhttp://www.google.co.uk/url?sa=t&rct=j&q=&esrc=s&source=web&cd=2&cad=rja&ved=0CCoQFjAB&url=http://www.defra.gov.uk/publications/files/pb13520-infrastructure-adaptation-supplementary.pdf&ei=
[7] Committee on Climate Change. (2016). 2016 UK Climate Change Risk Assessment Evidence Report. London. Retrieved from https://www.theccc.org.uk/uk-climate-change-risk-assessment-2017/review-and-engagement/research-conference/
[8] Guikema, S., Mclay, L., & Lambert, J. H. (2015). Infrastructure Systems, Risk Analysis, and Resilience-Research Gaps and Opportunities. Risk Analysis, 35(4), 560–561. doi:10.1111/risa.12416
[9] Pederson, P., Dudenhoeffer, D., Hartley, S., & Permann, M. (2006). Critical infrastructure interdependency modeling: a survey of US and international research. Idaho National Laboratory. Idaho Falls, US. doi:10.2172/911792
[10] Pandit, A., Minné, E. A., Li, F., Brown, H., Jeong, H., James, J. A. C., … Crittenden, J. C. (2015). Infrastructure ecology: An evolving paradigm for sustainable urban development. Journal of Cleaner Production, 1–9. doi:10.1016/j.jclepro.2015.09.010
[11] Roelich, K., Knoeri, C., Steinberger, J. K., Varga, L., Blythe, P. T., Butler, D., … Purnell, P. (2015). Towards resource-efficient and service-oriented integrated infrastructure operation. Technological Forecasting and Social Change, 92, 40–52. doi:10.1016/j.techfore.2014.11.008
[12] Delucchi, M. A., & Jacobson, M. Z. (2011). Providing all global energy with wind, water, and

50
solar power, Part II: Reliability, system and transmission costs, and policies. Energy Policy, 39(3), 1170–1190. doi:10.1016/j.enpol.2010.11.045
[13] Capra, F. (1996). The Web of Life: A New Synthesis of Mind and Matter. London: Harper Collins.
[14] Wu, B., Tang, A., & Wu, J. (2016). Modeling cascading failures in interdependent infrastructures under terrorist attacks. Reliability Engineering and System Safety, 147, 1–8. doi:10.1016/j.ress.2015.10.019
[15] Johansson, J., & Hassel, H. (2010). An approach for modelling interdependent infrastructures in the context of vulnerability analysis. Reliability Engineering and System Safety, 95(12), 1335–1344. doi:10.1016/j.ress.2010.06.010
[16] Chai, C. L., Liu, X., Zhang, W. J., & Baber, Z. (2011). Application of social network theory to prioritizing Oil & Gas industries protection in a networked critical infrastructure system. Journal of Loss Prevention in the Process Industries, 24(5), 688–694. doi:10.1016/j.jlp.2011.05.011
[17] Carhart, N. J., & Rosenberg, G. (2016). A Framework for Characterising Infrastructure interdependencies. International Journal of Complexity in Applied Science and Technology, 1(1), 35–60. Retrieved from http://www.inderscience.com/info/ingeneral/forthcoming.php?jcode=IJCAST
[18] Ottino, J. M. (2004). Engineering complex systems. Nature, 427(6973), 399–399. doi:10.1038/427399a
[19] Chou, C.-C., & Tseng, S.-M. (2010). Collection and Analysis of Critical Infrastructure Interdependency Relationships. Journal of Computing in Civil Engineering, 24(6), 539–547. doi:10.1061/(ASCE)CP.1943-5487.0000059
[20] Santos, J. R., Haimes, Y. Y., & Lian, C. (2007). A framework for linking cybersecurity metrics to the modeling of macroeconomic interdependencies. Risk Analysis, 27(5), 1283–1297. doi:10.1111/j.1539-6924.2007.00957.x
[21] Chang, S. E., Mcdaniels, T., Fox, J., Dhariwal, R., & Longstaff, H. (2014). Toward disaster-resilient cities: Characterizing resilience of infrastructure systems with expert judgments. Risk Analysis, 34(3), 416–434. doi:10.1111/risa.12133
[22] Ouyang, M. (2014). Review on modeling and simulation of interdependent critical infrastructure systems. Reliability Engineering & System Safety, 121, 43–60. doi:10.1016/j.ress.2013.06.040
[23] Davies, A., MacAulay, S., DeBarro, T., & Thurston, M. (2014). Making Innovation Happen in a Megaproject: London’s Crossrail Suburban Railway System. Project Management Journal, 45(6), 25–37. doi:10.1002/pmj.21461
[24] Li, B., & DeCarolis, J. F. (2015). A techno-economic assessment of offshore wind coupled to offshore compressed air energy storage. Applied Energy, 155, 315–322. doi:10.1016/j.apenergy.2015.05.111
[25] MK:Smart Consortium. (2017). MK:Smart. Retrieved February 27, 2017, from http://www.mksmart.org/
[26] d’Aquin, M., Davies, J., & Motta, E. (2015). Smart Cities’ Data: Challenges and Opportunities for Semantic Technologies. IEEE Internet Computing, 19(6), 66–70. doi:10.1109/MIC.2015.130
[27] Standish, R. J., Hobbs, R. J., Mayfield, M. M., Bestelmeyer, B. T., Suding, K. N., Battaglia, L. L., … Thomas, P. A. (2014). Resilience in ecology: Abstraction, distraction, or where the action is? Biological Conservation, 177, 43–51. doi:10.1016/j.biocon.2014.06.008
[28] Pennock, M. J., & Wade, J. P. (2015). The top 10 illusions of systems engineering: A research agenda. In Procedia Computer Science (Vol. 44, pp. 147–154). Elsevier Masson SAS. doi:10.1016/j.procs.2015.03.033
[29] Jacobs, J. (1961). The Death and Life of Great American Cities. New York: Random House. # [30] Fratzl, P. (2007). Biomimetic materials research: what can we really learn from nature’s
structural materials? Journal of the Royal Society Interface, 4(March), 637–642. doi:10.1098/rsif.2007.0218
[31] Graedel, T. E. (1996). On the Concept of Industrial Ecology. Annual Review of Energy and the Environment, 21(1), 69–98. doi:10.1146/annurev.energy.21.1.69
[32] Fischer, C. (2008). Feedback on household electricity consumption: A tool for saving energy? Energy Efficiency, 1(1), 79–104. doi:10.1007/s12053-008-9009-7
[33] Chertow, M., & Ehrenfeld, J. (2012). Organizing Self-Organizing Systems: Toward a Theory of Industrial Symbiosis. Journal of Industrial Ecology, 16(1), 13–27. doi:10.1111/j.1530-9290.2011.00450.x
[34] Song, Y. K., Zo, H., & Ciganek, A. P. (2014). Multi-criteria evaluation of mobile network sharing

51
policies in Korea. ETRI Journal, 36(4), 572–580. doi:10.4218/etrij.14.0113.1249 [35] Fagnant, D. J., & Kockelman, K. M. (2014). The travel and environmental implications of
shared autonomous vehicles, using agent-based model scenarios. Transportation Research Part C: Emerging Technologies, 40, 1–13. doi:10.1016/j.trc.2013.12.001
[36] Shah, R., & Ward, P. T. (2003). Lean manufacturing: Context, practice bundles, and performance. Journal of Operations Management, 21(2), 129–149. doi:10.1016/S0272-6963(02)00108-0
[37] Yekini Suberu, M., Wazir Mustafa, M., & Bashir, N. (2014). Energy storage systems for renewable energy power sector integration and mitigation of intermittency. Renewable and Sustainable Energy Reviews, 35, 499–514. doi:10.1016/j.rser.2014.04.009
[38] Vytelingum, P., Voice, T. D., Ramchurn, S. D., Rogers, A., & Jennings, N. R. (2010). Agent-based micro-storage management for the smart grid. In van der Hoek, Kaminka, Leperance, Luck, & Sen (Eds.), Proceedings of the 9th International Conference on Autonomous Agents and Multiagent Systems: Volume 1 (pp. 39–46). Toronto. doi:978-0-9826571-1-
[39] Kriett, P. O., & Salani, M. (2012). Optimal control of a residential microgrid. Energy, 42(1), 321–330. doi:10.1016/j.energy.2012.03.049
[40] Rehak, D., Markuci, J., Hromada, M., & Barcova, K. (2016). Quantitative evaluation of the synergistic effects of failures in a critical infrastructure system. International Journal of Critical Infrastructure Protection, 14, 3–17. doi:10.1016/j.ijcip.2016.06.002
[41] Morris, M., Schindehutte, M., & Allen, J. (2005). The entrepreneur’s business model: Toward a unified perspective. Journal of Business Research, 58(6), 726–735. doi:10.1016/j.jbusres.2003.11.001
[42] Dawson, R. (2015). Handling Interdependencies in Climate Change Risk Assessment. Climate, 3(4), 1079–1096. doi:10.3390/cli3041079
[43] Valdez, A.-M., Cook, M., Potter, S., & Langendahl, P.-A. (2015). Exploring participatory visions of smart transport in Milton Keynes. Proceedings of the Institution of Civil Engineers - Engineering Sustainability, jensu.15.00020. doi:10.1680/jensu.15.00020
[44] Varga, L. (2016). MK Futures 2050: Water Sustainability Report. [45] LOCOG. (2012). London 2012 Post-Games Sustainability Report. London. Retrieved from
http://learninglegacy.independent.gov.uk/documents/pdfs/sustainability/5-london-2012-post-games-sustainability-report-interactive-12-12-12.pdf
[46] Wallis, S. (2004). Smart solution to Kuala Lumpur’s flooding. Tunnels and Tunnelling International, 36(5), 16–19.
[47] Thomas, G. B., & Crawford, D. (2011). London tideway tunnels: Tackling London’s victorian legacy of combined sewer overflows. Water Science and Technology, 63(1), 80–87. doi:10.2166/wst.2011.012
[48] Keely, D., Charnley, F., Moreno, M., & Liddell, N. (2016). Re-distributed manufacturing and circular innovation: The end of take-make-dispose? - white paper. doi:10.17862/cranfield.rd.4139856.v1
[49] Moreno, M. A., Turner, C., Tirwari, A., Hutabarat, W., Charnely, F., Widjaja, D., & Mondini, L. (2017). Re-distributed manufacturing to achieve a Circular Economy: A case study utilizing IDEF0 modelling. In Procedia 50th CIRP Conference on Manufacturing Systems.
52
5. ASSESSING THE ‘GOVERNANCE GRIP’ OF COMBINED AUTHORITIES FOR INTEGRATED INFRASTRUCTURE PROVISION IN THE UK
Paul Honeybone1, Katrien Steenmans2 and Michele Acuto 3
1 Paul Honeybone (corresponding author), Research Associate, UCL City Leadership Laboratory (CLL), Department of Science, Technology, Engineering and Public Policy (STEaPP), University College London, 36-38 Fitzroy Square, London W1T 6EY, United Kingdom, 2 Katrien Steenmans, Researcher, UCL City Leadership Laboratory (CLL), Department of Science, Technology, Engineering and Public Policy (STEaPP), University College London, 36-38 Fitzroy Square, London W1T 6EY, United Kingdom 3 Professor Michele Acuto, Research Director of UCL City Leadership Laboratory (CLL), and Professor in Diplomacy and Urban Theory, STEaPP, UCL.
ABSTRACT. While the positive benefits of integrated infrastructure development
and management are theoretically understood, many global city-regions do not have
governance arrangements designed to operationalise integration. Despite the
criticality of ‘nexus’ provision and high degrees of interdependence in city-regions,
the organisation of governance mechanisms to ensure collaborative and symbiotic
relationships remains an incomplete aspect of business as usual. A preliminary
assessment was conducted of the governability of critical infrastructure domains
(water, energy, food, and waste) in select UK city-regions. To establish a systematic
approach for further research, a Governance Framework was produced and piloted.
The paper also reports on preliminary investigations and confirms insights that a
governance deficit exists. We note that integrated infrastructure issues were not
appearing systematically as high-level strategic governance priorities for the newly
established Combined Authorities. We conclude the ‘governance grip’ discernable
for overseeing integrated infrastructure outcomes is relatively weak.
Keywords: Integrated infrastructure, Governance and Power, Nexus, Combined Authorities, United Kingdom.
1. INTRODUCTION
Sustenance and prosperity in cities and regions are built upon well-functioning infrastructure.
The UCL City Leadership Laboratory (CLL) developed a method and conducted a pilot
assessing the ‘governability grip’ of Combined Authorities and City Councils and their
governance fundamentals for integrated urban infrastructure oversight in relation to water,
food, energy and waste. The paper reports on this research conducted to assess the
governability of critical infrastructure domains (water, energy, food, and waste) in select
UK city-regions.

53
Fundamental in determining the resilience (or fragilities) of cities and regions, 'nexus'
infrastructures underpin the systems of provision for 'liveability'. Strategic planning and
investment decisions in infrastructure systems provide medium-term 'steering' to advance
system performance and connectivity. This paper sets out initial findings about future
directions for system coordination and pathways for governance improvements, given the
range of roles and responsibilities. The task ahead, that is in part illuminated, is revealed as a
significant challenge even in the context of advanced economies.
2. BACKGROUND
The mix of public and private systems in the nexus spheres of water, energy, food, and waste
vitally underpin daily city-region functionality and ability to sustain shocks. While conceptually
the positive benefits of integrated infrastructure, in development and operation for mutually
supportive and coordinated infrastructure systems, are understood, day-to-day delivery
practice arrangements are not necessarily designed to reflect this. Despite the criticality of
nexus provision and high degrees of interdependency in city-regions, the organisation of
governance mechanisms to ensure collaborative and symbiotic relationships remains an
incomplete aspect of business as usual.
2.1 Governance agents
Local or regional governments are positioned as a key coordination node on behalf of all
citizens as the tiers below the national interest represented by that nation state. There are a
mix of local actors at differing levels of focus and resolution for infrastructures in the UK. At
the Combined Authority regional level, with a strategic function tasked with looking ahead, the
way a local government role is conducted can typically play out at three main levels:
(i) Making it work better now – attaining optimal and integrated business as usual system
performance in the short and medium-term;
(ii) Improving prospects ahead – improving strategic infrastructure development and long-term
investment for a more functional and resilient future; and
(iii) Leading response and recovery – contributing to, or spearheading crisis response and
recovery, with emergency management services and providers when short-term system
failure occurs.
In combination, these roles concurrently shape the assuredness in a city-region as
somewhere to live with a secure quality of life and invest in the future with confidence. While
doing better crisis management can potentially help inform priorities to mitigate short-run
problems, our interest is in the strategic medium to long-term city-regional level role of public
governance.
2.2 Motivation for research
Devolution of responsibilities in the UK provides a series of challenges and opportunities for
leadership of complex issues where integrated solutions can generate clearly positive
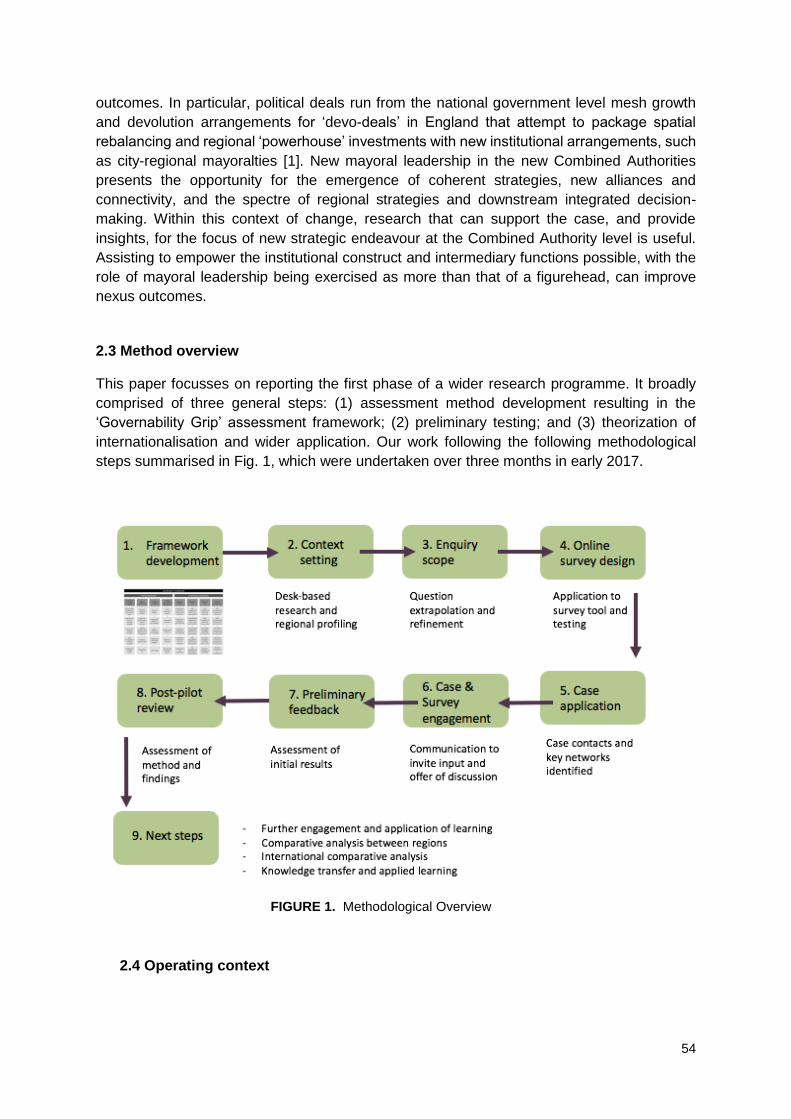
54
outcomes. In particular, political deals run from the national government level mesh growth
and devolution arrangements for ‘devo-deals’ in England that attempt to package spatial
rebalancing and regional ‘powerhouse’ investments with new institutional arrangements, such
as city-regional mayoralties [1]. New mayoral leadership in the new Combined Authorities
presents the opportunity for the emergence of coherent strategies, new alliances and
connectivity, and the spectre of regional strategies and downstream integrated decision-
making. Within this context of change, research that can support the case, and provide
insights, for the focus of new strategic endeavour at the Combined Authority level is useful.
Assisting to empower the institutional construct and intermediary functions possible, with the
role of mayoral leadership being exercised as more than that of a figurehead, can improve
nexus outcomes.
2.3 Method overview
This paper focusses on reporting the first phase of a wider research programme. It broadly
comprised of three general steps: (1) assessment method development resulting in the
‘Governability Grip’ assessment framework; (2) preliminary testing; and (3) theorization of
internationalisation and wider application. Our work following the following methodological
steps summarised in Fig. 1, which were undertaken over three months in early 2017.
FIGURE 1. Methodological Overview
2.4 Operating context

55
In the context of English devolution-oriented ‘city-deals’ and the potential for localised
empowerment of economic, urban and infrastructure development––regional resilience
building is a fundamental component of strategic foresight and delivery. Attending to the
stability of existing key infrastructure foundations, bolstering the dynamic strength of these
systems, and realising new potential to unlock growth requires intentional steps given
institutional histories and current coverage of the ‘nexus’ of provisions that underpin
successful long-run regional development.
With a focus on select Combined Authorities with mayoral elections in 2017, analysis was
conducted to produce an early formative view on the state of the respective areas fundamental
nexus resilience or fragility, with an assessment of their ‘grip’ on the issues, particularly at the
level of improving strategic infrastructure development and investment. At the heart of the
research was a quest to understand the nature of accountability as it stands, and to test what
it might need to be for improved oversight and management in the near-term future. On this
basis, new insights for advancing ‘governability’ and coordination were envisaged as part of
an ongoing research programme.
Extending the scope and integrative power of Combined Authorities to use their new role –
and leverage potential leadership – of local governance functions, working from areas such
as local transport and business incentives as part of driving industrial strategy, can open up
new investment strategies and a multitude of opportunities. A transfer of power to revitalise
regions, with enhanced regional governance capabilities to lead develop with a primary
economic and labour market orientation, presents the opportunity to dovetail
integrated regional resilience strategies alongside strategic leadership and planning system
improvements to present a step-change.
3. RESEARCH FRAMEWORK
Before outlining the framework, we briefly introduce the key concepts of governance, power,
the nexus, and resilience that underpin the analytic framework developed.
3.1 Key concepts
Governance – in this research our starting point is that governance at a basic level is simply
the system of governing through which provisions are delivered [2]. Recognising that the term
is used to denote the informal dynamics of ‘steering’ encapsulate in activity within public and
private policy networks, we note usage is wider than ‘government’ which references more
explicitly the formal channels of the state [3]. However, in this work our specific applied
conception is focused on the formal governmental ‘governance’ aspects of oversight and
control of defined physical infrastructure systems in the nexus. In other words, our focus is
constrained to the institutional mechanisms of apparent in government.
Power – Power in context of this research is constrained to consideration of the degree of
control or influence local authorities as governments exert over critical infrastructure [2].
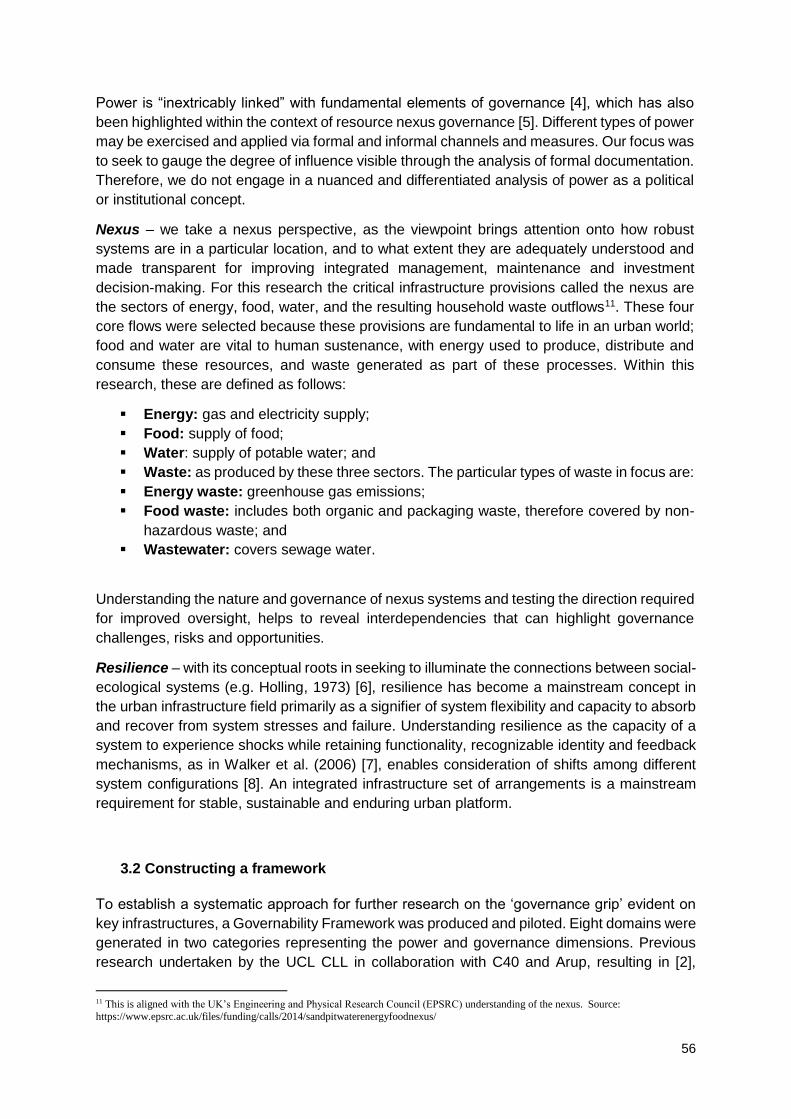
56
Power is “inextricably linked” with fundamental elements of governance [4], which has also
been highlighted within the context of resource nexus governance [5]. Different types of power
may be exercised and applied via formal and informal channels and measures. Our focus was
to seek to gauge the degree of influence visible through the analysis of formal documentation.
Therefore, we do not engage in a nuanced and differentiated analysis of power as a political
or institutional concept.
Nexus – we take a nexus perspective, as the viewpoint brings attention onto how robust
systems are in a particular location, and to what extent they are adequately understood and
made transparent for improving integrated management, maintenance and investment
decision-making. For this research the critical infrastructure provisions called the nexus are
the sectors of energy, food, water, and the resulting household waste outflows11. These four
core flows were selected because these provisions are fundamental to life in an urban world;
food and water are vital to human sustenance, with energy used to produce, distribute and
consume these resources, and waste generated as part of these processes. Within this
research, these are defined as follows:
Energy: gas and electricity supply;
Food: supply of food;
Water: supply of potable water; and
Waste: as produced by these three sectors. The particular types of waste in focus are:
Energy waste: greenhouse gas emissions;
Food waste: includes both organic and packaging waste, therefore covered by non-
hazardous waste; and
Wastewater: covers sewage water.
Understanding the nature and governance of nexus systems and testing the direction required
for improved oversight, helps to reveal interdependencies that can highlight governance
challenges, risks and opportunities.
Resilience – with its conceptual roots in seeking to illuminate the connections between social-
ecological systems (e.g. Holling, 1973) [6], resilience has become a mainstream concept in
the urban infrastructure field primarily as a signifier of system flexibility and capacity to absorb
and recover from system stresses and failure. Understanding resilience as the capacity of a
system to experience shocks while retaining functionality, recognizable identity and feedback
mechanisms, as in Walker et al. (2006) [7], enables consideration of shifts among different
system configurations [8]. An integrated infrastructure set of arrangements is a mainstream
requirement for stable, sustainable and enduring urban platform.
3.2 Constructing a framework
To establish a systematic approach for further research on the ‘governance grip’ evident on
key infrastructures, a Governability Framework was produced and piloted. Eight domains were
generated in two categories representing the power and governance dimensions. Previous
research undertaken by the UCL CLL in collaboration with C40 and Arup, resulting in [2],
11 This is aligned with the UK’s Engineering and Physical Research Council (EPSRC) understanding of the nexus. Source:
https://www.epsrc.ac.uk/files/funding/calls/2014/sandpitwaterenergyfoodnexus/

57
categorised power into four dimensions, which were tailored to apply within this research
context: long-term strategy setting, policy enforcing, budget control, and service operation and
ownership. Long-term strategy setting focuses on the level of control local authorities have
over long-term strategic plans. A strategic plan is defined as a document that sets out
strategies to achieve vision(s) and objectives. Policy enforcing covers the level of control local
authorities have over policy setting. Policies are defined as the particular rules set to deliver
action. Budget control covers the level of control local authorities have over budgets.
The final component, service operation/ownership, focuses on operation and ownership of the
services rather than ownership of the asset itself. Ownership of energy, food, water and waste
are not considered in this research as these discussions themselves have been the focus of
research projects. The concept of ownership depends on the legal system and what rights are
perceived to constitute it, e.g. [9-10]. The ownership of services is often very clear as this is
contractually stipulated, while the discussions in relation to the assets themselves are
sometimes more complex. For example, waste flushed into a watercourse or leaving premises
in the form of atmospheric emission is the “ultimate externality” and owned by no one [11],
and the interconnectedness of water on our planet results in discussions of water as a
common treasury [12-13]. There are thus both very clear areas and grey areas in relation to
assets, resulting in our focus on ownership of services.
A literature review identified four relevant governance dimensions: accountability,
participation, connectivity, and interdependencies. Accountability for the purposes of this
research is understood as the transparent relationship between the Combined Authorities and
their external actors (e.g. citizens, universities, non-governmental organisations (NGOs)),
where Combined Authorities are responsible to the external actors for their actions, e.g. [14-
19]. Participation of actors external to the Combined Authorities (e.g. citizens, universities,
NGOs) was examined in strategic decision-making on the operation of services, as well as the
level of engagement by external actors [20-23]. Connectivity is understood as the functional
connections between the nexus sectors through joint strategies and joint planning [24-25]. The
final component of interdependences between nexus sectors is understood as governance
and management connectivity. This is explored by examining joint investment and joint
management (i.e. where there are shared mechanisms of management) [24].
For each of these dimensions, the level of influence and control was coded from 0 to 4. This
framework, and the meanings of the code for each component, is outlined in Fig. 2.
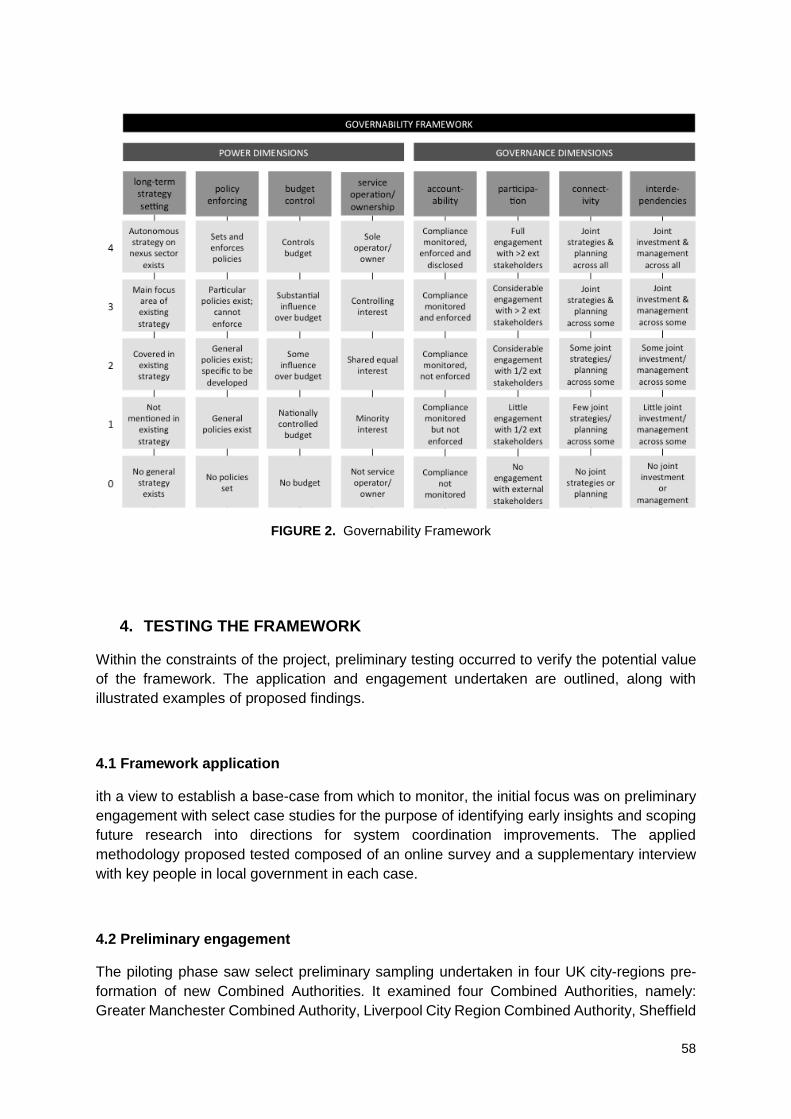
58
FIGURE 2. Governability Framework
4. TESTING THE FRAMEWORK
Within the constraints of the project, preliminary testing occurred to verify the potential value
of the framework. The application and engagement undertaken are outlined, along with
illustrated examples of proposed findings.
4.1 Framework application
ith a view to establish a base-case from which to monitor, the initial focus was on preliminary
engagement with select case studies for the purpose of identifying early insights and scoping
future research into directions for system coordination improvements. The applied
methodology proposed tested composed of an online survey and a supplementary interview
with key people in local government in each case.
4.2 Preliminary engagement
The piloting phase saw select preliminary sampling undertaken in four UK city-regions pre-
formation of new Combined Authorities. It examined four Combined Authorities, namely:
Greater Manchester Combined Authority, Liverpool City Region Combined Authority, Sheffield
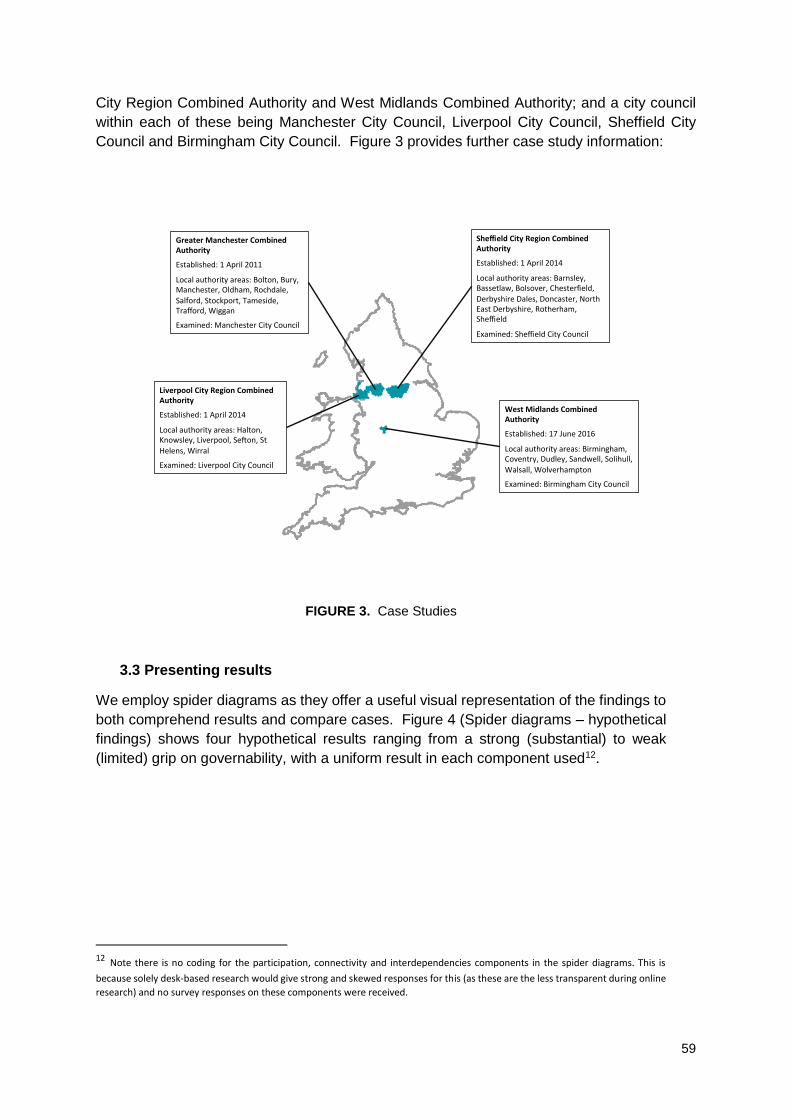
59
City Region Combined Authority and West Midlands Combined Authority; and a city council
within each of these being Manchester City Council, Liverpool City Council, Sheffield City
Council and Birmingham City Council. Figure 3 provides further case study information:
FIGURE 3. Case Studies
3.3 Presenting results
We employ spider diagrams as they offer a useful visual representation of the findings to
both comprehend results and compare cases. Figure 4 (Spider diagrams – hypothetical
findings) shows four hypothetical results ranging from a strong (substantial) to weak
(limited) grip on governability, with a uniform result in each component used12.
12 Note there is no coding for the participation, connectivity and interdependencies components in the spider diagrams. This is
because solely desk-based research would give strong and skewed responses for this (as these are the less transparent during online
research) and no survey responses on these components were received.
SheffieldCityRegionCombinedAuthority
Established:1April2014
Localauthorityareas:Barnsley,Bassetlaw,Bolsover,Chesterfield,
DerbyshireDales,Doncaster,NorthEastDerbyshire,Rotherham,Sheffield
Examined:SheffieldCityCouncil
GreaterManchesterCombinedAuthority
Established:1April2011
Localauthorityareas:Bolton,Bury,Manchester,Oldham,Rochdale,
Salford,Stockport,Tameside,Trafford,Wiggan
Examined:ManchesterCityCouncil
LiverpoolCityRegionCombinedAuthority
Established:1April2014
Localauthorityareas:Halton,Knowsley,Liverpool,Se on,St
Helens,Wirral
Examined:LiverpoolCityCouncil
WestMidlandsCombinedAuthority
Established:17June2016
Localauthorityareas:Birmingham,Coventry,Dudley,Sandwell,Solihull,Walsall,Wolverhampton
Examined:BirminghamCityCouncil
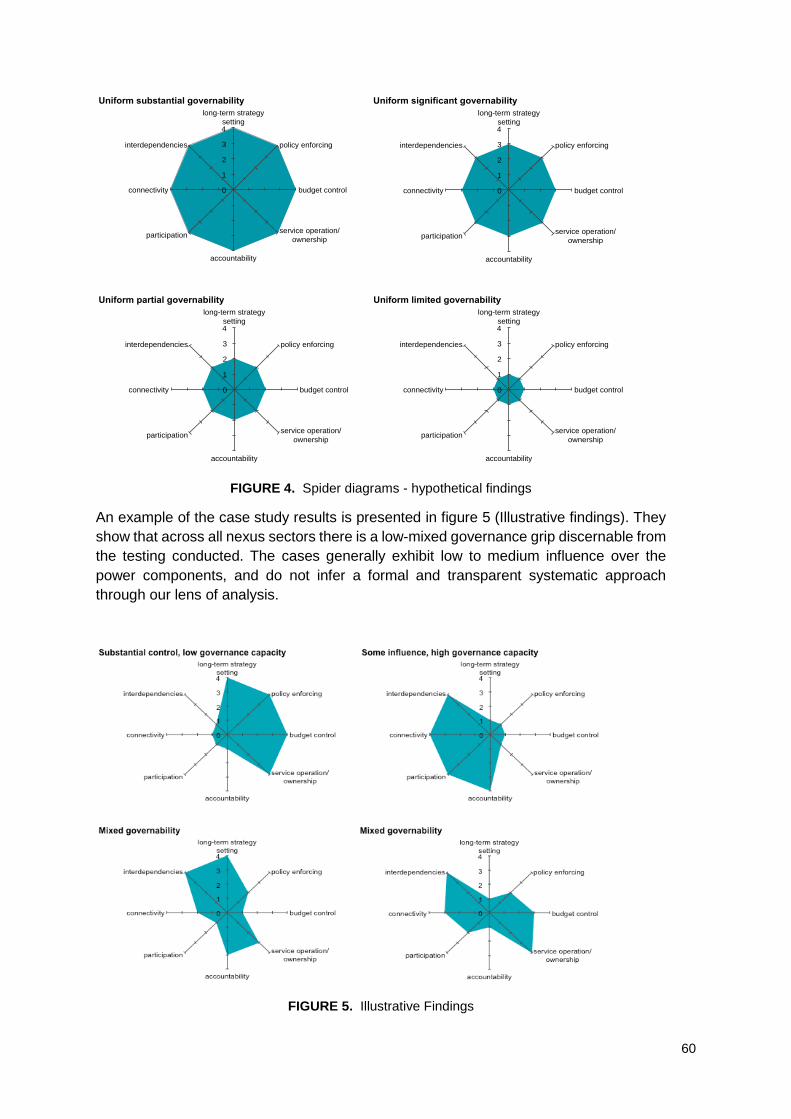
60
FIGURE 4. Spider diagrams - hypothetical findings
An example of the case study results is presented in figure 5 (Illustrative findings). They
show that across all nexus sectors there is a low-mixed governance grip discernable from
the testing conducted. The cases generally exhibit low to medium influence over the
power components, and do not infer a formal and transparent systematic approach
through our lens of analysis.
FIGURE 5. Illustrative Findings
0
1
2
3
4
long-term strategy
setting
policy enforcing
budget control
service operation/
ownership
accountability
participation
connectivity
interdependencies
Uniform substantial governability
0
1
2
3
4
long-term strategy
setting
policy enforcing
budget control
service operation/
ownership
accountability
participation
connectivity
interdependencies
Uniform limited governability
0
1
2
3
4
long-term strategy
setting
policy enforcing
budget control
service operation/
ownership
accountability
participation
connectivity
interdependencies
Uniform partial governability
0
1
2
3
4
long-term strategy
setting
policy enforcing
budget control
service operation/
ownership
accountability
participation
connectivity
interdependencies
Uniform significant governability

61
5. FINDINGS
This section outlines and discusses the key findings and implications derived from the
pilot to date. At a high level, we consider:
It is too early to see evidence of intention or clarity of action at a regional level of
integrated regional infrastructure strategic development, and furthermore;
Combined Authorities are not clearly positioned for a strategic role leading long-
term investment and integrated regional resilience.
Consequently, there are readily discernable gaps in governance, both a policy process
and institutional design level. We now elaborate further and propose policy-style advice
off the back of the research [26]13.
5.1 Preliminary findings
An emphasis on assessing the governability grip through the current and emerging institutional
architecture brings into focus for us the ‘direction of travel’ for infrastructure system
performance improvements that can lead to integrated and resilient outcomes. Despite the
criticality of ‘nexus’ provision and high degrees of interdependency in city-regions, the
organisation of governance mechanisms to ensure collaborative and symbiotic relationships
clearly remains an incomplete aspect of business as usual in the context of emergent region-
level governance authorities.
As noted, our preliminary investigations confirm the primary insight that a governance deficit
exists. In short, integrated infrastructure issues were not appearing systematically as high-
level strategic governance priorities or in mayoral discourse for the newly established
Combined Authorities. While this reflects an emphasis on local ‘burning platform’ political
issues, it points to the emphases mayoral candidates had to more immediate and local issues
such as inclusive economic growth, regional promotion and employment14. This in many
respects mirrors the set of common concerns embodied in the national-level political sphere
and the extension of more local concerns, to representation the formation of a new intersection
between them.
In summary, the advisory direction that emerged from our work was:
Regional resilience building of critical infrastructures is a fundamental component of
economic, urban and infrastructure development now for the future.
It is too early to see evidence at a regional level to support the idea of developing
integrated economic, social and environmental strategies to progress long-term
integrated decision-making.
As currently configured, Combined Authorities are not clearly positioned as the new
nodes of governance for strategic long-run investment and integrated regional
resilience.
13 This draws from our report at the UCL City Leadership Laboratory (CLL) website: https://www.cityleadership.net/nexus-urban-
infrastructure [25]. 14 For example, Mayor Andy Street and Mayor Andy Burnham’s priorities for West Midlands Combined Authority (WMCA) and the Greater Manchester Combined Authority (GMCA) respectively. Sources: https://blog.bham.ac.uk/cityredi/andy-streets-to-do-list-challenges-
for-the-new-wmca-mayor/; and: https://www.greatermanchester-ca.gov.uk/homepage/57/the_mayor

62
Better strategy and delivery could extend the scope and integrative power of Combined
Authorities to utilise their role to leverage leadership for significant integrated
infrastructure provision and performance improvements.
As it stands, it is plausible to claim there is a ‘governance deficit’ or an ‘ungoverned’
aspect of integrated infrastructure investment for high performance long-term growth.
There are gaps between the spatial concerns of local Councils and the emerging
regional interests of Combined Authorities, and the national interest orientation of
central government.
5.2 Preliminary implications for Combined Authorities
Consequently, we asked the question: what does this mean with Combined Authorities
mayoral elections in some UK regions? In short, our advice was issued as follows:
There is scope to take the opportunity to dovetail integrated regional resilience
strategies alongside new leadership and planning for economic and whole-of-system
improvements.
The current degree of devolution and power-sharing arrangements between local
councils and Combined Authorities will need to develop and mature to get genuine
coordinated and coherent investment planning for improved economic performance
and community resilience.
There is potential to develop a firmer and stronger governability grip on integrated
infrastructure planning, investment and delivery.
5.3 Methodological reflections
Given time and resources, combined with timing of the mayoral elections, we experienced low
uptake on direct engagement and access via the survey and preliminary interviews.
Additionally, those who did undertake the survey online and un-coached, did report
experiencing some difficulties committing to the categories established in the questions. This
suggests the value of face-to-face or telephone coached survey responses as being a superior
method to get better quality and more accurate engagement results.
In general, we note that with the power dimensions there was clearer shared understanding
evident, whereas the governance dimensions introduced more interpretative elements and
increased subjectivity given the nature of the categories. Furthermore, as with all research
engagement that seeks to understanding a complex contextual situation that is changing, we
acknowledge the value of longer-run ongoing relationships for research continuity.
5.4 Future work
Future work in 2017-18 is planned to focus on tangible ways to advance local government
practice, to add local value in the regions where practice is investigated, including the Greater
London city-region later in 2017. It is anticipated this research will be of interest to some
Whitehall departments, the National Infrastructure Commission (NIC) and other interested

63
parties and providers in the infrastructure sphere. As the framework also holds the potential
for international application, it is anticipated this will also be explored in due course.
6. CONCLUSION
This paper is anchored-off the core premise that the prosperity of cities and regions built upon
well-functioning infrastructure will have superior future prospects than those who do not. In its
broader quest to advance the governance of integrated infrastructures relating to the life-
support ‘nexus’, the team developed an approach to systemically generate new understanding
to build knowledge to support getting better governance attributes for integrated outcomes.
Subsequently, a pilot was conducted to assess the ‘governability grip’ of Combined Authorities
and City Councils, and their governance fundamentals for integrated urban infrastructure
oversight in relation to water, food, energy and waste. The paper reports on the first step of
this work, which included some select sampling in UK city-regions in the early stages of
formation, with impending mayoral roles, in relatively new Combined Authorities.
We signalled preliminary findings about future directions for system coordination and
pathways for governance improvements, given the range of roles and responsibilities
undertaken at a local and Combined Authority level. The challenge, that is in part illuminated,
is considered rateable as significant in the context of the UK’s scale and socio-economic
conditions. Strategic planning is under-developed and investment decisions not fully
transparent in infrastructure systems that provide the system directionality and medium-term
settings for integrated performance and connectivity. We found there to be wide ranging and
unrealised potential to develop a firmer governability grip, exhibiting both more strategic
coherence and more applied action at an operational level for integrated infrastructure
planning, investment and delivery.
ACKNOWLEDGEMENTS
We would like to thank colleagues at the UCL City Leadership Lab (CLL), particularly in the
Urban Governance and Nexus Infrastructure workstream that received support from the UK
Engineering and Physical Sciences Research Council (EPSRC as part of the “WEFWEBs”
Project (EP/N005600/1). The application of the “Governability Grip” methodology was also
supported by an EPSRC Impact Accelerator Award (EP/K503745/1) provided to the Lab by
the UCL Office of the Vice-Provost (Enterprise).
We thank those who participated in our preliminary testing of the framework who were working
in local government. We also acknowledge Dr. Jenny MacArthur’s continuation of this
workstream for the CLL, that goes beyond the first step of development conducted that this
paper reports.
REFERENCES
[1] D. Waite, D. Maclennan, D. McNulty & G. Roy, Shaping City Economies? – the institutional landscape for City Deals, Regional Studies Association Conference (RSA), Dublin, June 4-7 2017 (2017).
[2] C40 and Arup, “Powering climate action: Cities as global changemakers”, report, (2015).

64
[3] R.A.W. Rhodes, Understanding Governance: Ten Years On, Organization Studies, Vol. 28,
Issue 8, pp. 1243 – 1264 (2007). [4] M. Barnett and R. Duvall, “Power in global governance,” in Powers in global governance,
edited by M. Barnett and R. Duvall, Cambridge University Press, Cambridge (2005), pp. 1-32. [5] S. Marx, Governing the nexus for sustainability, Journal of Change and Adaptation. 2, pp. 29-
81 (2015). [6] C.S. Holling, Resilience and stability of ecological systems, Annual Review of Ecology and
Systematics, 4 (1), 1–23. (1973). [7] B.H. Walker, J.M. Anderies, A. P. Kinzig, & P. Ryan, Exploring resilience in social-ecological
systems through comparative studies and theory development: introduction to the special issue, Ecology and Society, 11 (1), article 12 (2006).
[8] A. Eraydin and T. Taşan-Kok, Introduction: Resilience Thinking in Urban Planning, Resilience Thinking in Urban Planning, 1 GeoJournal Library 106, Springer (2013).
[9] J. H. Merryman, Ownership and estate (variations on a theme by Lawson), Tulane Law Review. 48m pp. 916-945.
[10] Y. C. Chien and H. E. Smith, “Structure and style in comparative property law.” In Comparative law and economics, edited by T. Eisenberg and G. B. Ramello, Edward Elgar (2016), pp. 131-160.
[11] K. Steenmans, R. Malcolm and J. Marriott, Commodification of waste: Legal and theoretical approaches to industrial symbiosis as part of a circular economy, University of Oslo Faculty of Law Research Paper No. 2017-26 (2017), pp. 1-18.
[12] R. Malcolm and A. Clarke, “Water: a common treasury,” in Legal strategies for the development and protection of communal protection, edited by T. Xu and A. Clarke, Oxford University Press, (2017).
[13] B. Lange and M. Shepheard, Changing conceptions of rights to water? – An eco-socio-legal perspective, Journal of Environmental Law. 26, pp. 215-242 (2014).
[14] E. Peruzotti and C. Smulovitz, Held to account: experiences of social accountability in Latin America, Journal of Human Development. 3, pp. 209-230 (2002).
[15] R. J. Chaskin, Fostering neighbourhood democracy: legitimacy and accountability within loosely coupled system, Nonprofit and Voluntary Sector Quarterly. Pp. 161-189 (2003).
[16] J. G. S. Koppell, Pathologies of accountability ICANN and the challenges of “multiple accountabilities disorder”, Public Administration Review. (2005).
[17] M. Bovens, Analysing and assessing accountability: a conceptual framework, European Law Review. (2007).
[18] C. Harlow and R. Rawlings, Promoting accountability in a multilevel governance: a network approach, European Law Journal. (2007).
[19] F. Biermann and A. Gupta, Accountability and legitimacy in earth system governance: a research framework, Ecological Economics. (2011).
[20] F. Scharpf, Governing in Europe: effective and democratic? Oxford University Press, Oxford, (1999).
[21] M. Haus and H. Heinelt, “How to achieve governability at the local level: theoretical and conceptual considerations on a complementarity of urban leadership and community involvement” in Urban governance and democracy: leadership and community involvement, edited by M. Hauss, H. Heinelt, and M. Steward, Routledge, London (2005).
[22] V. A. Schmidt, The European Union: democratic legitimacy in a regional state?. Journal of Common Market Studies. 42, pp. 975-997 (2004).
[23] J. Howard and D. Sweeting, Understanding barriers to decision making in the UK energy-food-water nexus: the added value of interdisciplinary approaches, Environmental Science & Policy. 61, 53-60, (2007).
[24] E. S. Brondizio, E. Ostrom and O. R. Young, Connectivity and the governance of multilevel socio-ecological systems: the role of social capital, Annual Review of Environment and Resources. 34, pp. 253-278 (2009).
[25] V. Dakos and others, “Principle 2 – manage connectivity” in Principles for building resilience. Sustaining ecosystem services in socio-ecological systems, edited by R. Biggs, M. Schluter and M. L. School, Cambridge University Press, Cambridge, (2015).
[26] UCL City Leadership Laboratory, (M. Acuto, P. Honeybone, K. Steenmans & J. MacArthur), The Governability Grip: What ‘power’ do cities have on infrastructure? Research pilot overview, April 2017, sourced at: https://docs.wixstatic.com/ugd/6c6416_cb29b03f384d4b5a898def14a6610f7a.pdf
(2017).

65
6. ARTICULATING CIRCULAR ECONOMY DIMENSIONS IN SPACE: SIX CASE STUDIES
Julie Marin1 and Bruno De Meulder 1
1 Julie Marin University of Leuven | Department of Architecture, OSA Research Group Urbanism & Architecture, Kasteelpark Arenberg 1 - bus 2431 | B-3001 Heverlee (Leuven), Belgium.
ABSTRACT. Transition from linear to circular economy (CE) is a complex multi-
actor, multi-level, multi-phase and multi-pattern process [1]. It requires new
pathways weaving together technological, governmental, societal, behavioural,
economic and environmental dimensions [2] into sustainable and equitable [3]
circular futures. Since CE ultimately manifests in space this paper proposes place-
based reflections on CE transition. The paper focuses on two Flemish regions,
Antwerp and Central Limburg, investigating how circularized resource flows could
simultaneously densify settlement patterns and initiate infrastructural synergies.
Firstly, the paper articulates how circularity imaginaries produced in six research
through design (RTD) investigations synthesize some of CE’s complex system
changes in space. Furthermore, this paper investigates the roles these future
imaginaries played in processes supporting the two regions’ circular territorial
developments. Demonstrating RTD’s capacity to synthesize multiple CE transition
dimensions in place-based future imaginaries, this paper aims to contribute to
transdisciplinary research methods supporting multi-dimensional CE transition.
Keywords: Urban Metabolism, Research Through Design, Flemish Policy, CE Transition
1. INTRODUCTION
1.1 Circular economy (CE) as a multi-dimensional question
In a linear economy industry extracts natural resources to produce single-use products,
discarded after consumption. [4] As The Club of Rome already pointed out in the 1970s, the
planet’s limited natural resources cannot keep supporting wasteful linear economies and
lifestyles. [5] In the coming decades materials like oil, gold, silver and metals as well as
ecosystems such as coral reefs and agricultural lands will deplete. [6] Europe, housing limited
natural resources itself, will become increasingly vulnerable to resource scarcity. [7] Circular
economy (CE) is supposed to offer a way out of increasing material prices [4] and more
importantly the potential collapse of natural ecosystems. CE aims to achieve economic and
resource stability, considering waste as resource. Limiting industry’s dependency on nature’s
resources through reuse, repair and recycling, CE rebalances human dependency on natural
resources. [4] CE increasingly appears in regional and local policy documents [8-10] as a
means to optimize materials lifecycles. However, it has been criticized for lacking biophysical,
institutional and social dimensions. [3] According to Pomponi and Moncaster current CE
research seems characterised by partial approaches, not truly accounting for the complexity
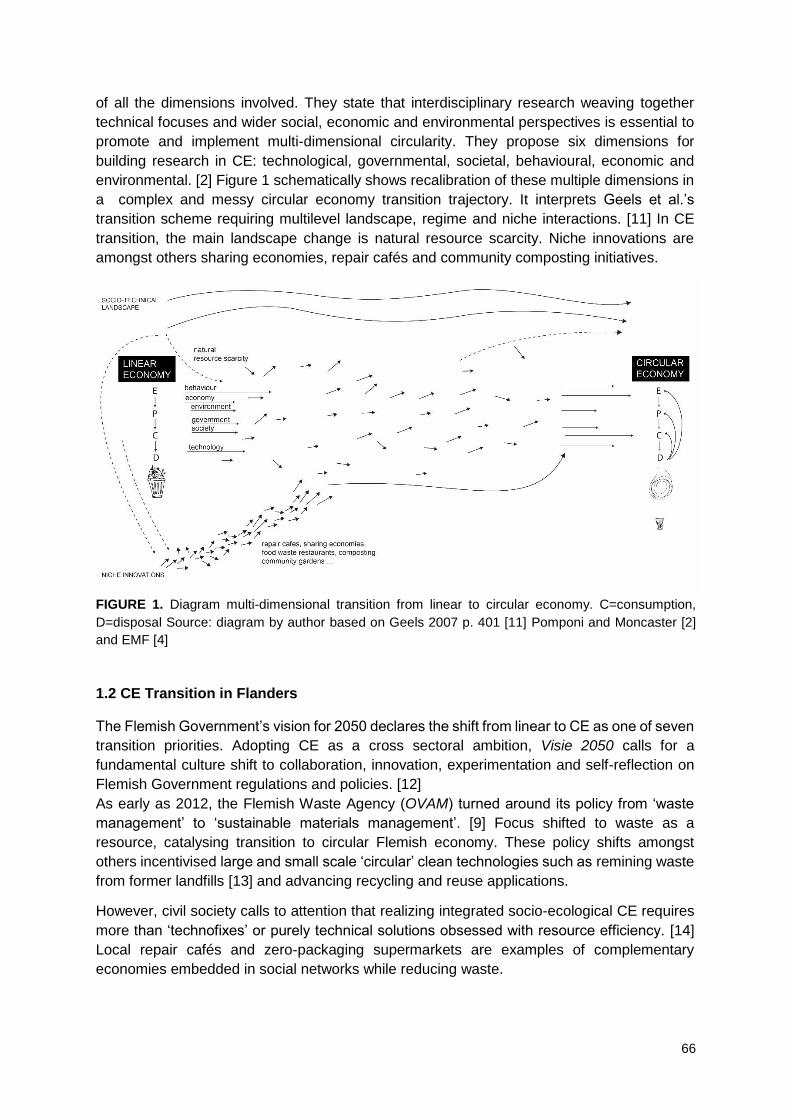
66
of all the dimensions involved. They state that interdisciplinary research weaving together
technical focuses and wider social, economic and environmental perspectives is essential to
promote and implement multi-dimensional circularity. They propose six dimensions for
building research in CE: technological, governmental, societal, behavioural, economic and
environmental. [2] Figure 1 schematically shows recalibration of these multiple dimensions in
a complex and messy circular economy transition trajectory. It interprets Geels et al.’s
transition scheme requiring multilevel landscape, regime and niche interactions. [11] In CE
transition, the main landscape change is natural resource scarcity. Niche innovations are
amongst others sharing economies, repair cafés and community composting initiatives.
FIGURE 1. Diagram multi-dimensional transition from linear to circular economy. C=consumption,
D=disposal Source: diagram by author based on Geels 2007 p. 401 [11] Pomponi and Moncaster [2]
and EMF [4]
1.2 CE Transition in Flanders
The Flemish Government’s vision for 2050 declares the shift from linear to CE as one of seven
transition priorities. Adopting CE as a cross sectoral ambition, Visie 2050 calls for a
fundamental culture shift to collaboration, innovation, experimentation and self-reflection on
Flemish Government regulations and policies. [12]
As early as 2012, the Flemish Waste Agency (OVAM) turned around its policy from ‘waste
management’ to ‘sustainable materials management’. [9] Focus shifted to waste as a
resource, catalysing transition to circular Flemish economy. These policy shifts amongst
others incentivised large and small scale ‘circular’ clean technologies such as remining waste
from former landfills [13] and advancing recycling and reuse applications.
However, civil society calls to attention that realizing integrated socio-ecological CE requires
more than ‘technofixes’ or purely technical solutions obsessed with resource efficiency. [14]
Local repair cafés and zero-packaging supermarkets are examples of complementary
economies embedded in social networks while reducing waste.

67
1.3 Research Through Design (RTD) on CE
Recent transition literature inquires how place-specificity and multi-scalar characteristics
matter for transition. [15] Therefore, this paper proposes place-based and site-specific
reflections on CE transition. In the end, raw materials and waste flows find their beginning and
endpoints in the landscape, in quarries, natural areas, landfills and incinerators supporting
production and consumption cycles. Hence, urban and natural areas, by nature transforming
resource hinterlands, should be prominent research arenas in CE transition.
Flemish Policy progressively adopts RTD as an instrument supporting increasingly complex
societal planning processes. RTD helps to imagine possible futures [16], combining research
rigour with design imagination. As such, RTD produces spatial proposals stimulating
discussions about the future of a concrete area or place. [17] As a medium of co-production,
RTD delivers design drawings synthesizing site observation, cartographic analysis and
iterative stakeholder and expert inputs and feedback. RTD imaginaries take the role of 'open
future explorations' guiding the commissioner in a complex thought- and transition process.
[18]
Acknowledging CE’s multi-dimensional character the OVAM adopts RTD since 2014. In
collaboration with different government agencies, OVAM commissions RTD to urban
(landscape) design practices studying case-based regional metabolisms in projective forward
looking ways. Furthermore, the OVAM and the Flemish Environmental Planning Agency
(Department Omgeving), adopt RTD to define circular territorial development. Aiming to
transcend merely technocratic accounting exercises on resource efficiency, these RTD
studies investigate the potential reciprocity between transition to circular resource flows,
densifying settlement patterns and initiating infrastructural synergies. [19]
1.4 Research objectives and methodology
This paper adopts comparative case study research, a common method in architectural
research and the social sciences to study particular situations in depth and to narrow downs
broad research topics. [20] The case study research starts exploring, describing and
explaining the selected cases’ complexity and multiple facets in depth. [20,21]
It analyses six RTD studies on CE transition in Antwerp and Central Limburg, two Flemish
areas transitioning to CE, executed between 2014 and 2017. The analysis feeds two research
questions: articulating CE dimensions in space (part 3) and demonstrating RTD capacities in
transition processes (part 4). Part 5 finally aims to clarify possible agendas for RTD in (CE)
transition processes. Besides final RTD reports and policy documents, semi-structured
interviews and a round table with both commissioners, urban (landscape) designers and
researchers conducting the studied RTD [22] provide the analysis data.
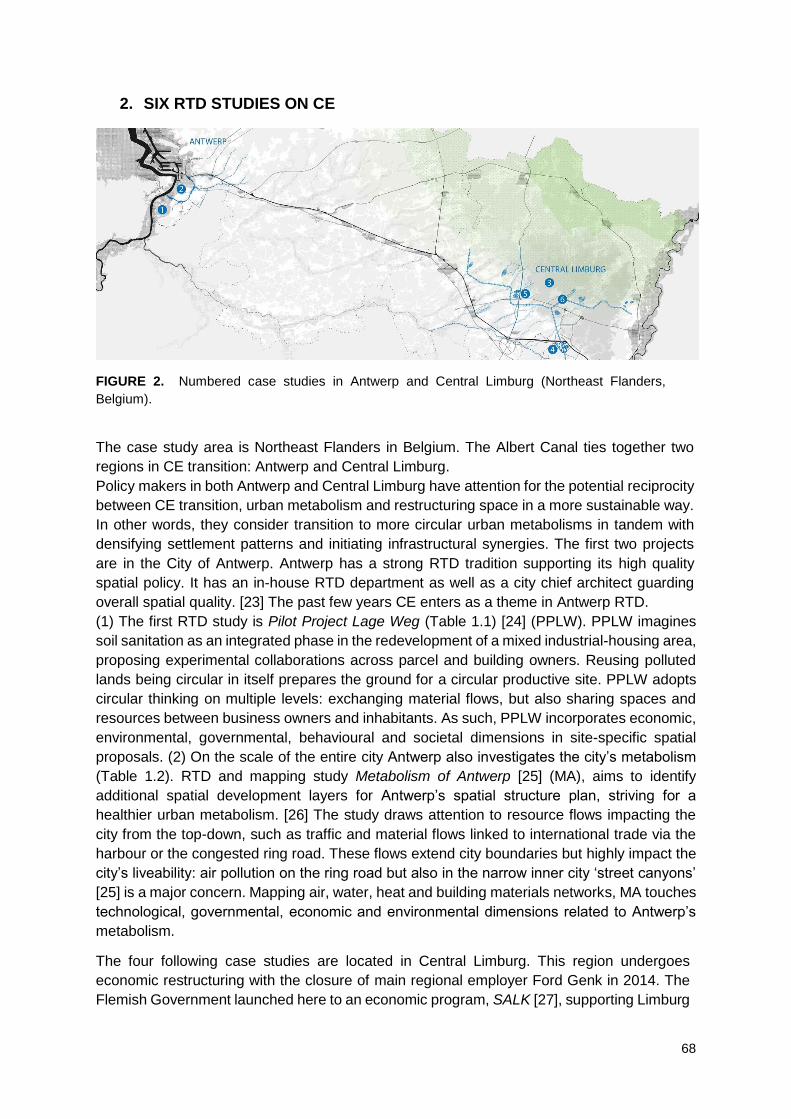
68
2. SIX RTD STUDIES ON CE
FIGURE 2. Numbered case studies in Antwerp and Central Limburg (Northeast Flanders,
Belgium).
The case study area is Northeast Flanders in Belgium. The Albert Canal ties together two
regions in CE transition: Antwerp and Central Limburg.
Policy makers in both Antwerp and Central Limburg have attention for the potential reciprocity
between CE transition, urban metabolism and restructuring space in a more sustainable way.
In other words, they consider transition to more circular urban metabolisms in tandem with
densifying settlement patterns and initiating infrastructural synergies. The first two projects
are in the City of Antwerp. Antwerp has a strong RTD tradition supporting its high quality
spatial policy. It has an in-house RTD department as well as a city chief architect guarding
overall spatial quality. [23] The past few years CE enters as a theme in Antwerp RTD.
(1) The first RTD study is Pilot Project Lage Weg (Table 1.1) [24] (PPLW). PPLW imagines
soil sanitation as an integrated phase in the redevelopment of a mixed industrial-housing area,
proposing experimental collaborations across parcel and building owners. Reusing polluted
lands being circular in itself prepares the ground for a circular productive site. PPLW adopts
circular thinking on multiple levels: exchanging material flows, but also sharing spaces and
resources between business owners and inhabitants. As such, PPLW incorporates economic,
environmental, governmental, behavioural and societal dimensions in site-specific spatial
proposals. (2) On the scale of the entire city Antwerp also investigates the city’s metabolism
(Table 1.2). RTD and mapping study Metabolism of Antwerp [25] (MA), aims to identify
additional spatial development layers for Antwerp’s spatial structure plan, striving for a
healthier urban metabolism. [26] The study draws attention to resource flows impacting the
city from the top-down, such as traffic and material flows linked to international trade via the
harbour or the congested ring road. These flows extend city boundaries but highly impact the
city’s liveability: air pollution on the ring road but also in the narrow inner city ‘street canyons’
[25] is a major concern. Mapping air, water, heat and building materials networks, MA touches
technological, governmental, economic and environmental dimensions related to Antwerp’s
metabolism.
The four following case studies are located in Central Limburg. This region undergoes
economic restructuring with the closure of main regional employer Ford Genk in 2014. The
Flemish Government launched here to an economic program, SALK [27], supporting Limburg
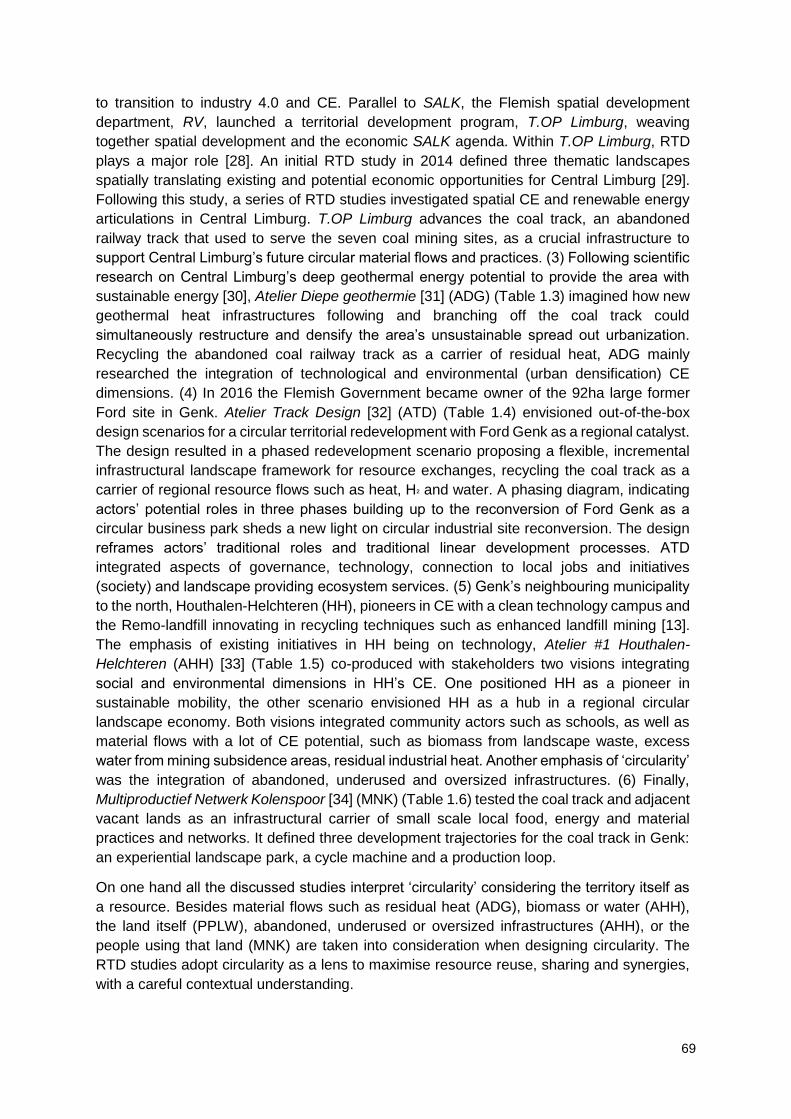
69
to transition to industry 4.0 and CE. Parallel to SALK, the Flemish spatial development
department, RV, launched a territorial development program, T.OP Limburg, weaving
together spatial development and the economic SALK agenda. Within T.OP Limburg, RTD
plays a major role [28]. An initial RTD study in 2014 defined three thematic landscapes
spatially translating existing and potential economic opportunities for Central Limburg [29].
Following this study, a series of RTD studies investigated spatial CE and renewable energy
articulations in Central Limburg. T.OP Limburg advances the coal track, an abandoned
railway track that used to serve the seven coal mining sites, as a crucial infrastructure to
support Central Limburg’s future circular material flows and practices. (3) Following scientific
research on Central Limburg’s deep geothermal energy potential to provide the area with
sustainable energy [30], Atelier Diepe geothermie [31] (ADG) (Table 1.3) imagined how new
geothermal heat infrastructures following and branching off the coal track could
simultaneously restructure and densify the area’s unsustainable spread out urbanization.
Recycling the abandoned coal railway track as a carrier of residual heat, ADG mainly
researched the integration of technological and environmental (urban densification) CE
dimensions. (4) In 2016 the Flemish Government became owner of the 92ha large former
Ford site in Genk. Atelier Track Design [32] (ATD) (Table 1.4) envisioned out-of-the-box
design scenarios for a circular territorial redevelopment with Ford Genk as a regional catalyst.
The design resulted in a phased redevelopment scenario proposing a flexible, incremental
infrastructural landscape framework for resource exchanges, recycling the coal track as a
carrier of regional resource flows such as heat, H² and water. A phasing diagram, indicating
actors’ potential roles in three phases building up to the reconversion of Ford Genk as a
circular business park sheds a new light on circular industrial site reconversion. The design
reframes actors’ traditional roles and traditional linear development processes. ATD
integrated aspects of governance, technology, connection to local jobs and initiatives
(society) and landscape providing ecosystem services. (5) Genk’s neighbouring municipality
to the north, Houthalen-Helchteren (HH), pioneers in CE with a clean technology campus and
the Remo-landfill innovating in recycling techniques such as enhanced landfill mining [13].
The emphasis of existing initiatives in HH being on technology, Atelier #1 Houthalen-
Helchteren (AHH) [33] (Table 1.5) co-produced with stakeholders two visions integrating
social and environmental dimensions in HH’s CE. One positioned HH as a pioneer in
sustainable mobility, the other scenario envisioned HH as a hub in a regional circular
landscape economy. Both visions integrated community actors such as schools, as well as
material flows with a lot of CE potential, such as biomass from landscape waste, excess
water from mining subsidence areas, residual industrial heat. Another emphasis of ‘circularity’
was the integration of abandoned, underused and oversized infrastructures. (6) Finally,
Multiproductief Netwerk Kolenspoor [34] (MNK) (Table 1.6) tested the coal track and adjacent
vacant lands as an infrastructural carrier of small scale local food, energy and material
practices and networks. It defined three development trajectories for the coal track in Genk:
an experiential landscape park, a cycle machine and a production loop.
On one hand all the discussed studies interpret ‘circularity’ considering the territory itself as
a resource. Besides material flows such as residual heat (ADG), biomass or water (AHH),
the land itself (PPLW), abandoned, underused or oversized infrastructures (AHH), or the
people using that land (MNK) are taken into consideration when designing circularity. The
RTD studies adopt circularity as a lens to maximise resource reuse, sharing and synergies,
with a careful contextual understanding.

70
3 ARTICULATING CE DIMENSIONS IN SPACE
The six RTD studies’ forward looking design images spatially articulate place-based
circularity interpretations. This section focuses on urban landscape design drawings as
instruments integrating multiple CE dimensions.
3.1 Multi-scalar material flow crosslinking
For material flows to be circularized, notions of sources and sinks require reconsideration. In
CE, the source or material flow origin is the place where a waste flow is recovered. The sink
is the place where the material flow is reused. ADG’s and AHH’s imaginaries (Figure 4)
demonstrate circular territorial development locally crosslinking multi-scalar material flows. A
regional heat network underneath an abandoned railway track recovers heat dissipating from
the soil to the air from geothermal soil layers as well as residual heat produced by industries
along the abandoned coal railway track (Figure 4 left). Combined with other recovered
infrastructural waste flows, such as residual water from mining subsidence areas, new
programs such as a heated public swimming pond along the coal track can be imagined
(Figure 4 right). Depending on the needs, the residual water could also be reused by
industries or natural areas along the railway. Figure 4’s multi-scalar plan formats highlight the
interplay between hard infrastructure and its surroundings. The heat network emerges as a
landscape embedded infrastructure, combining heat distribution with recreation and
productivity. Figure 4 shows the heat infrastructure side branches following river valleys, thus
reinforcing historical urbanization patterns along the water bodies.
FIGURE 3. Regional heat network underneath former coal track (left: ADG) allows site specific
programs, such as heated pools using excess water from mining subsidences in HH (right:
AHH).
3.2 The deep section
“Deep Urbanism is a reading of the city that acknowledges the complex ecological and
biogeochemical processes taking place above, below and within the urban ground. In the city,
nothing can simply be placed on the surface; the composition of the urban ground requires
that structures inevitably extend deep into a complex mix of disturbed soil horizons,
construction rubble, pipes, subways, utilities.” [35]

71
Figure 3’s deep sections for ADG and AHH spatially articulate potential interplays between
technology, public space and productivity related to a new regional heat network. The roll-out
of this residual heat network creates opportunities to introduce new programs such as
greenhouses, heated bicycle lanes or swimming ponds (Figure 3 and 4). The deep sections
articulate interdependencies between heat flows and spatial programming above and below
ground in integrated infrastructural systems supporting circularity [36].
FIGURE 4. Designing new programs in synergy with a new regional heat network. (left: ADG,
right: AHH)
3.3 The transect: a synoptic view of human land occupation and exploitation
Indebted to Von Humboldt’s eighteenth and nineteenth century transects across South
America, transects offer open formats synthesizing interconnectedness and complex
coherences of ecological systems in one image. [37] Similarly, transects such as AHH’s Figure
5 articulate spatial coherences and disruptions between natural and man-made systems
concerning material flows. Figure 5 shows an industrial platform on a flattened former coal
mining slag heap, receiving Limburg’s household waste as well as its waste water and the
region’s water treatment plants’ sludge. A waste incinerator delivers heat to a sludge drying
facility transforming the sludge into a building material component. As a consequence of
subterranean coal extraction, entire areas have sunk up to twelve meters and are flooded by
ground water. Derived from Sankey diagrams typically representing Material Flow Analysis in
industrial ecology, Figure 5’s arrows anchor data about natural resource colonization and
material flows to space. This trans scalar understanding of the site supports a contextualized
CE approach, identifying existing yet undefined and currently isolated linear waste flows that
could be integrated in a place-based circular redevelopment.
FIGURE 5. Houthalen-Helchteren transect articulating material flows and space dependencies above
and below ground. [30]
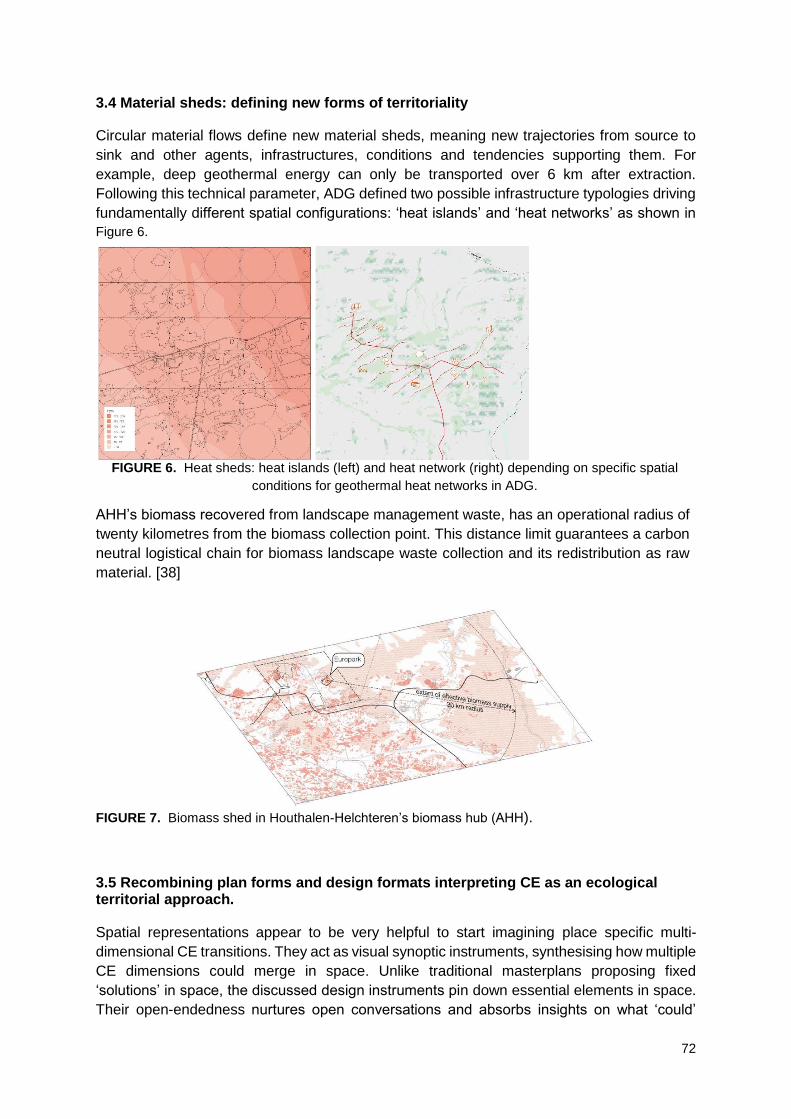
72
3.4 Material sheds: defining new forms of territoriality
Circular material flows define new material sheds, meaning new trajectories from source to
sink and other agents, infrastructures, conditions and tendencies supporting them. For
example, deep geothermal energy can only be transported over 6 km after extraction.
Following this technical parameter, ADG defined two possible infrastructure typologies driving
fundamentally different spatial configurations: ‘heat islands’ and ‘heat networks’ as shown in
Figure 6.
FIGURE 6. Heat sheds: heat islands (left) and heat network (right) depending on specific spatial
conditions for geothermal heat networks in ADG.
AHH’s biomass recovered from landscape management waste, has an operational radius of
twenty kilometres from the biomass collection point. This distance limit guarantees a carbon
neutral logistical chain for biomass landscape waste collection and its redistribution as raw
material. [38]
FIGURE 7. Biomass shed in Houthalen-Helchteren’s biomass hub (AHH).
3.5 Recombining plan forms and design formats interpreting CE as an ecological territorial approach.
Spatial representations appear to be very helpful to start imagining place specific multi-
dimensional CE transitions. They act as visual synoptic instruments, synthesising how multiple
CE dimensions could merge in space. Unlike traditional masterplans proposing fixed
‘solutions’ in space, the discussed design instruments pin down essential elements in space.
Their open-endedness nurtures open conversations and absorbs insights on what ‘could’

73
happen. The projective images’ accessible and attractive capacity, break through the status
quo. Using them in a co-productive way, they act as mediators between experts and
stakeholders, offering tangible and accessible spatial representations in often abstract
conversations about CE dimensions. The studied imaginaries each represent synoptic views
integrating technological, governmental, societal, behavioural, economic and/or
environmental dimensions. Depending on the specific research question, the design teams
integrated expertise from different sectors when developing circular spatial scenarios. For
example, ADG (Table1.1) bridged infrastructural engineers with planners and designers. AHH
involved ecologists, community representatives, industry and policy makers (Table1.3) and
MNK (Table1.6) strongly connected community groups with planners and the local policy
makers. ATD (Table1.4) proposed an alternative industrial redevelopment scheme, anchored
in ecological networks and anticipating new policy frameworks, circular science, market and
technology innovations.
4. RTD MEDIATING TRANSITION PROCESSES
4.1 Process supporting study results
As discussed in the previous section, each of the six RTD studies produced spatial
articulations of possible circular futures. Transition to CE still being in an early stage,
implementation of these imaginaries would simultaneously depend on new stakeholder
coalitions and reformulated policy frameworks. Rather than being directly implementable, the
imaginaries serve as one step in a long process of defining how a multi-dimensional CE could
be realized. In this light it is interesting to investigate which results the six RTD studies
obtained in the transition processes themselves. Since these results (listed in Table 1 column
4) are mostly process-supporting, they are hard to identify, let alone to be proven. Interviews
with the design offices who executed the RTD studies, as well as the leading commissioners
nevertheless provided the insights listed in Table 1. [22]
(1) In Antwerp’s PPLW (Table 1.1) the iterative design process concluded with land owners
signing an engagement declaration for an integrated, experimental and collaborative area
redevelopment and soil sanitation. Different urban design formats supported specific co-
production processes clarifying the issues and opportunities, triggering stakeholder
engagement and ownership. For example, individual site owners were taken on a site safari
with a brochure visualising possible futures as a result of collaborative soil sanitation and site
development, sharing spaces and resources. Simultaneously, the design team 51N4E noted
a new consensus about mixed land uses within the administration, seemingly nurtured by the
design process.
(2) Identifying and mapping enormous stakeholder networks related to water, energy, air and
construction materials, the Metabolism of Antwerp (Table 1.2) simultaneously mobilized and
engaged these formerly disparate stakeholders. Throughout the study, the design team also
initiated online data collection and sharing platforms supporting and accelerating exchanges
between all relevant parties [39].
(3) ADG (Table 1.3) adopted design to bridge engineers, planners and designers. A graphical
synthesis of technical data continues to support multidisciplinary exchange on the topic. (4)
In ATD (Table 1.4) future design scenarios for a circular industry site facilitated delicate
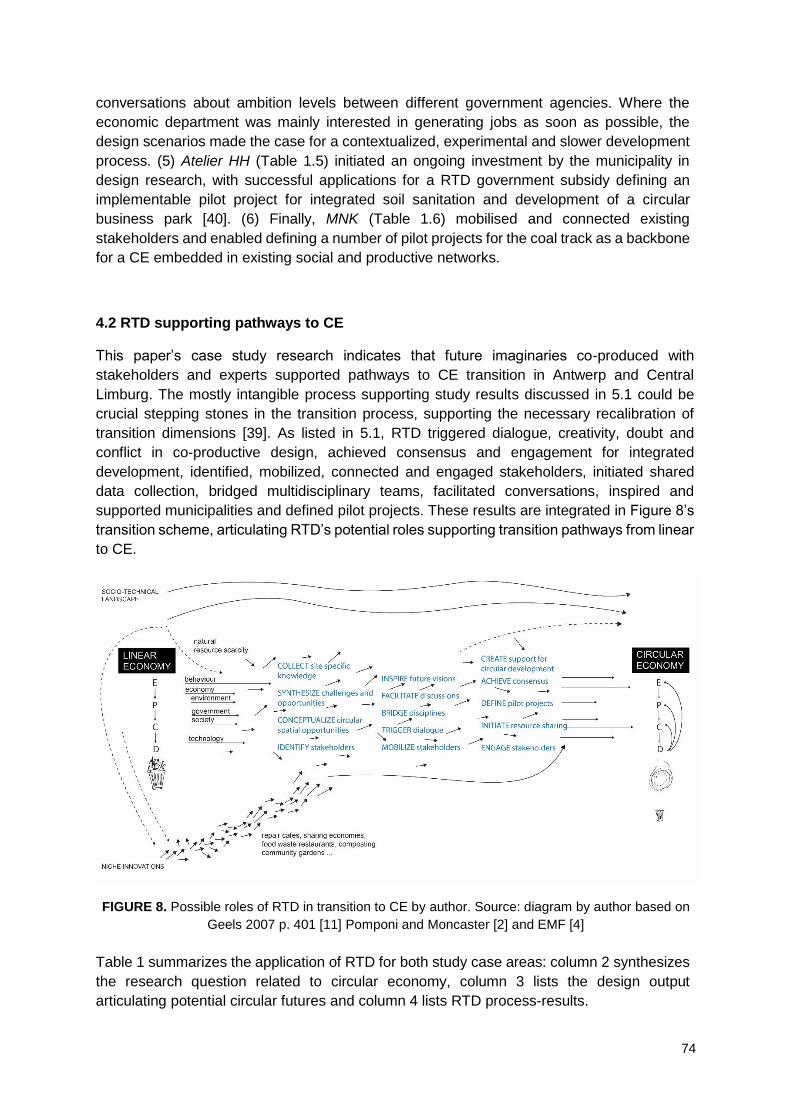
74
conversations about ambition levels between different government agencies. Where the
economic department was mainly interested in generating jobs as soon as possible, the
design scenarios made the case for a contextualized, experimental and slower development
process. (5) Atelier HH (Table 1.5) initiated an ongoing investment by the municipality in
design research, with successful applications for a RTD government subsidy defining an
implementable pilot project for integrated soil sanitation and development of a circular
business park [40]. (6) Finally, MNK (Table 1.6) mobilised and connected existing
stakeholders and enabled defining a number of pilot projects for the coal track as a backbone
for a CE embedded in existing social and productive networks.
4.2 RTD supporting pathways to CE
This paper’s case study research indicates that future imaginaries co-produced with
stakeholders and experts supported pathways to CE transition in Antwerp and Central
Limburg. The mostly intangible process supporting study results discussed in 5.1 could be
crucial stepping stones in the transition process, supporting the necessary recalibration of
transition dimensions [39]. As listed in 5.1, RTD triggered dialogue, creativity, doubt and
conflict in co-productive design, achieved consensus and engagement for integrated
development, identified, mobilized, connected and engaged stakeholders, initiated shared
data collection, bridged multidisciplinary teams, facilitated conversations, inspired and
supported municipalities and defined pilot projects. These results are integrated in Figure 8’s
transition scheme, articulating RTD’s potential roles supporting transition pathways from linear
to CE.
FIGURE 8. Possible roles of RTD in transition to CE by author. Source: diagram by author based on
Geels 2007 p. 401 [11] Pomponi and Moncaster [2] and EMF [4]
Table 1 summarizes the application of RTD for both study case areas: column 2 synthesizes
the research question related to circular economy, column 3 lists the design output
articulating potential circular futures and column 4 lists RTD process-results.

75
TABLE 1. Summary of six RTD studies articulating CE dimensions.
RTD STUDY RTD
QUESTIONS
RELATED TO
CIRCULAR
ECONOMY
DESIGN
OUTPUT
OTHER
STUDY
RESULTS
ANTWERP
1 Pilootproject Lage
Weg (PPLW)
2015-2016 [24]
Commissioned
by: stad
Antwerpen
stadsontwikkeling
, Kenniscentrum
Vlaamse Steden,
OVAM
Executed by:
51N4E, Connect
& Transform
Inserting
circular logics in
the
redevelopment
of a partially
abandoned
housing and
industrial area.
Reusing
polluted lands
for circular
production.
Bird’s eye
perspectives,
physical site
model,
photomontages
and disposable
masterplans
reframing and
clarifying the
redevelopment
issues and
opportunities at
stake.
Specific co-
productive
design formats
triggering
dialogue,
creativity,
doubt and
conflict
Land Owners
signed
Engagement
Declaration for
integrated
redevelopmen
t
Consensus
about mixed
land uses
reached within
administration
2 Metabolisme van
Antwerpen, stad
van stromen
2017-2018 (MA)
[25]
Commissioned by:
City of Antwerp, the
Flemish Spatial
Department, de OVAM
and the port of Antwerp
Executed by: Fabric
i.s.m. Marco
Broekman,
UAntwerpen,
Common Ground.
Mapping
Antwerp’s
urban
metabolism
flows to support
the Antwerp
Strategic
Spatial
Structure Plan
update
‘Bluecards’
identifying
opportunities to
evolve to a
circular city with
sustainable
material flow
management
Stakeholder
identification
and
engagement
related to each
flow
Initiating a
data collection
and sharing
platform
amongst
stakeholders
CENTRAL LIMBURG
3 Atelier diepe
geothermie 2015-
2016 (ADG) [31]
Commissioned by:
Imagining how
a new energy
infrastructure
can restructure
Graphical
technical data
synthesis
supporting
Bridging
technological,
contextual and
spatial

76
LABO RUIMTE (RV &
Team Vlaams
Bouwmeester), VITO
Executed by: 51N4E
regional urban
sprawl.
multidisciplinary
use
Maps,
diagrams,
photomontages,
deep sections
for two area
specific
infrastructure
typologies
supporting
densification
parameters
and
associated
experts and
stakeholders
4 Atelier Track
Design (ATD)
2015-2016 [32]
Commissioned by:
Ruimte Vlaanderen,
OVAM
Executed by:
WIT Architecten, OSA
KU Leuven, Lateral
Thinking Factory,
Technum Hasselt
Out-of-the box
design
scenarios for a
circular
redevelopment
for Ford Genk
as a hub in a
circular Central
Limburg
Phased multi-
scalar plans,
deep sections,
transects,
process and
stakeholder
diagrams for
setting up a
flexible context-
based
infrastructural
framework for
exchanging
resources
Facilitating
conversations
about ambition
levels around
‘circularity’
between
different
government
agencies
5 Atelier #1
Houthalen-
Helchteren 2016
(AHH) [33]
Commissioned by:
Ruimte Vlaanderen,
Houthalen-Helchteren
Executed by: OSA
KULeuven,
DAStU/Politecnico di
Milano
Invited
stakeholders/experts:
RLLK, Space Caviar &
Z33, RxD KUL
(Alvin&Andrew), Remo
Landfill, Limburgs
Landschap vzw
Envisioning a
social and
ecological
context-based
transition to CE
in Houthalen-
Helchteren
Phased
multiscalar
plans, deep
sections,
transects,
process and
stakeholder
diagrams for two
future visions for
Houthalen-
Helchteren
Inspiring
municipality to
think across
sectors and
administrative
borders, to see
opportunities
instead of
issues
Supporting
funding
application for
follow-up
research
6 Multiproductief
Netwerk
Kolenspoor 2016
(MNK) [34]
Testing the coal
track as an
infrastructural
carrier of small
scale food,
Interactive site
model,
Defining three
trajectories for
Mobilizing and
connecting
stakeholders

77
Commissioned by:
Stad Genk and Thuis in
de Stad
Executed by:
Plusoffice Architects,
Delva Landscape
Architects, Living Lab
de Andere Markt
energy and
material
practices and
networks
the coal track in
Genk
(experiential
landscape park,
cycle machine,
production loop)
Defining pilot
projects
5. CONCLUSIONS
5.1 Urban landscape design capacities: form and process
This paper firstly unpacked how multiple CE dimensions found a repository in shared graphic
representations that are fundamentally place-based and spatial. Urban design formats such
as the transect and the deep section offer graphic spatial synopses of multi-scalar and
multidimensional contextual parameters. Unlike traditional masterplans, the discussed spatial
imaginaries are not to be understood as one on one solutions. They are rather open design
instruments capturing issues and opportunities at stake in specific spatial contexts,
acknowledging the impossibility to generate one-fits-all solutions in complex reality. Sketching
opportunities of the territory’s resourcefulness, they open imagination and serve as media to
learn collectively across disciplines and government silos about the complex unknown circular
future. Breaking open imagination, they hold a tremendous potential to take up a mediating
role in transition processes.
Secondly, the paper articulated such possible mediating roles for RTD to support or accelerate
CE transition. In the six case studies, the imaginaries helped formulating clear questions and
problem statements around CE’s (potential) spatial articulations. Urban design drawings
served as media supporting cross sectoral conversations about CE. The research indicates
that the RTD method has the potential to integrate different social groups, CE scales and
models and ecological challenges while connecting spatial development to sustainable and
resilient economic redevelopment.
The case studies developed in this paper demonstrate several ways in which urban
(landscape) designers could contribute to complex transition processes. With their integrative
and coordinating mind-sets and visual instruments, urban landscape designers can support
switching from single sector approaches to understanding dependencies between them.
Urban landscape designers’ synoptic methods and capacities could be useful in reframing
CE’s multidimensionality questions as essentially site-specific spatial questions. RTD could
take up an integrating role throughout the entire transition process. Therefore this research
recommends involving urban landscape designers from the very beginning to help identifying
and formulating place-based circular economies. RTD’s application in transition processes
can help defining qualitative frameworks that can gradually integrate quantitative
assessments, rather than the other way around.
78
ACKNOWLEDGEMENTS
This research is supported by the Research Foundation - Flanders (FWO). We would like to
thank Departement Omgeving, de OVAM and all participants to the reflection workshop on
RTD in May 2017 for sharing their experiences. Thank you to Nadia Mirabella for her feedback
on the draft paper.
REFERENCES
[1] P. Vandenbroeck, Working with wicked problems. the King Baudouin Foundation, Brussels 2012), pp. 5.
[2] F. Pomponi and A. Moncaster, Circular economy for the built environment: A research framework. Journal of Cleaner Production. 143 pp. 710-718 (2017).
[3] V. Moreau et al., Coming Full Circle: Why Social and Institutional Dimensions Matter for the circular economy. Journal of Industrial Ecology. 21(3): pp. 497-506 (2017).
[4] E. McArthur Foundation, Towards the circular economy. vol.1. (2013). [5] D.H. Meadows et al. The Limits to Growth: A Report for the Club of Rome’s Project on the
Predicament of Mankind Meadows, 2nd ed.; New American Library: New York, NY, USA, 1975.
[6] iibStudio, Global Resources stock check (2012), available from http://www.bbc.com/future/story/20120618-global-resources-stock-check [last accessed July 2018]
[7] Plan C, How much is left? (2010), available from: http://www.plan-c.eu/en/infographics/how-much-is-left [last accessed Sept 2017]
[8] European Commission, “Closing the loop - An EU action plan for the CE” European Commission, Brussels (2015).
[9] OVAM, “Actieplan Vlaams Materialenprogramma”, (2012). [10] B. Circular, “Gewestelijk programma voor circulaire economie 2016 – 2020”, Brussels
Hoofdstedelijk Gewest, Brussels (2016). [11] F. Geels and J. Schott, Typology of sociotechnical transition pathways. Research Policy, 36
(2007), pp. 399–417. [12] Vlaamse Regering, “Visie 2050” (2016). [13] P.T. Jones, et al., Closing material loops: The enhanced landfill mining concept. JOM: the
Journal of the Minerals, Metals and Materials Society, 64(7): pp. 743-744 (2012). [14] D. Barrez, Transitie. Onze welvaart van morgen. Pelckmans Pro (2016). [15] L. Coenen et al., Toward a spatial perspective on sustainability transitions. Res. Policy, 41
(2012), pp. 968-979. [16] T.M. de Jong D.J.M. van der Voordt, Ways to study and research: urban, architectural and
technical design, ed. T.M. de Jong and D.J.M. van der Voordt. DUP Science, Delft (2002). [17] S. Tjallingii, “Urban Metabolism: an introduction to RTD in the urban fringe of Brussels”,
(2016) (unpublished). [18] A. Kuhk, M. Dehaene, M. Dumont and J. Schreurs “Toekomstverkenning als collectief leren.
Onderzoek naar planning in het licht van onzekerheid en complexiteit”, Steunpunt Ruimte (2016).
[19] J. De Bruyn, Circulaire gebiedsontwikkeling, OVAM & Departement Omgeving, Editor, Mechelen (2017), (unpublished)
[20] L.N. Groat and D. Wang, Architectural Research Methods; Monacelli: New York, NY, USA, (2002).
[21] R.K. Yin, Case Study Research: Design and Methods, 2nd ed.; Sage Publications: Thousand Oaks, CA, USA, (1991)
[22] J. Marin, “Lessen voor ontwerpend onderzoek in het kader van circulaire gebiedsontwikkeling”, KU Leuven, Leuven (2017).
[23] Stad Antwerpen; “Ontwerpend onderzoek als methodiek”, Antwerpen, (2012) [24] Stad Antwerpen, Labo XX: Pilootproject de Lage Weg, ed. J.D. Bruyn (2017). [25] .FABRICations, UAntwerpen, Common Ground, Marco Broekman, “Metabolisme van
Antwerpen, Stad van Stromen”, stad Antwerpen, de OVAM, Departement Omgeving, Haven van Antwerpen (2017).

79
[26] Stad Antwerpen, “Antwerpen Ontwerpen. Ruimtelijk structuurplan Antwerpen” Antwerpen (2006).
[27] Vlaamse Regering, “Strategisch actie-programma Limburg² 2013‐2019.” (2013). [28] L. Vanautgaerden, “Spatial activism in regional development: a renewed coalition between
planning, design and the territory.” (2017), (unpublished) [29] Maat ontwerpers, “Ontwerpend onderzoek Territoriaal ontwikkelingsprogramma Centraal-
Limburg” Ruimte Vlaanderen, (2014). [30] VITO, “Geothermie 2020”, (2015). [31] 51N4E, “Atelier Diepe Geothermie”Team Vlaams Bouwmeester, Ruimte Vlaanderen & VITO,
(2015). [32] WIT, OSA, LTF and Technum, “Atelier Track Design”, Ruimte Vlaanderen and OVAM, (2016). [33] J. Marin, M. Motti and B. De Meulder, “Atelier # 1”, in Het kolenspoor getest, Public space:
Mechelen. pp. 189-248, (2016). [34] Plusoffice Architects, Delva Landscape Architects, Living Lab De Andere Markt,
“Multiproductief kolenspoor Genk” Stad Genk, Ruimte Vlaanderen en Thuis in de stad, (2016).
[35] S. Carlisle & N. Pevsner, The Performative Ground: Rediscovering the Deep Section. Scenario Journal, (2012), available from: https://scenariojournal.com/article/the-performative-ground/ [last accessed Sept 2017]
[36] M. Hajer & T. Dassen, Smart about Cities. Visualizing the Challenges for 21st Century Urbanism, nai010 publishers, PBL publishers, Rotterdam (2014).
[37] J. Desimini & C. Waldheim, Cartographic Grounds. Projecting the landscape imaginary. Princeton Architectural Press, (2016).
[38] Regionaal Landschap Lage Kempen, “Biomass hub logistics” interview with B. Paesen, Houthalen-Helchteren (2016). (unpublished)
[39] DOCA voor metabolisme Antwerpen. (2017), available from: https://www.loomio.org/g/x5oSUMD1/doca-voor-metabolisme-antwerpen [last accessed Sept 2017]
[40] Vlaams Bouwmeester and OVAM, “Pilootprojecten Terug in Omloop”, (2014).

80
7. A METHODOLOGICAL PROPOSAL TO EVALUATE THE ENVIROMENTAL FOOTPRINT OF CITIES
Nadia Mirabella1 and Karen Allacker1
1 Division of Architectural Engineering, Department of Architecture, KU Leuven - Kasteelpark Arenberg 1, 3001 Leuven, Belgium; Phone: +32 16 37 34 27, E-mail: [email protected]
ABSTRACT. For the first time in human history, more than 1 person out of 2 is living
in urban area and projections talk about a further increase up to 66% of human
global population by 2050. As cities concentrate also most of the world’s economic
activities, this convergence of human and economic capital could lead to higher
pressures on planet Earth in terms of environmental impacts, if not properly
addressed. Holistic methodologies are necessary to understand, manage and tackle
environmental pressures of urban contexts, avoiding the risk of burdens shifting both
spatially and temporally. The assessment of environmental impacts and
performances are usually conducted from two perspectives: top-down (e.g. Urban
Metabolism) and bottom-up (e.g. Life Cycle Assessment) approaches. The
purposes of this contribution are: i) presenting the current state-of-art in terms of
urban environmental impact assessment and ii) proposing the City Environmental
Footprint, a new methodological approach to evaluate the environmental footprint of
cities in a comprehensive way.
Keywords: Urban Environmental Impact Assessment; Urban Sustainability; City Environmental Footprint; Urban Metabolism; Life Cycle Assessment
1. ENVIRONMENT ASSESSMENT OF THE URBAN CONTEXT: OVERVIEW AND STATE OF ART
For the first time in human history, more than one person out of two is living in urban areas.
Projections say that cities will continue to grow and be a pole of aggregation for human beings,
especially in developing countries, with 66 per cent of human global population residing in
urban areas by 2050 [1]. Many drivers are responsible for this phenomenon, e.g. the
intersection between supply and offer of jobs and services, better and safer living conditions,
or even a higher attractiveness in terms of social lifestyles and opportunities.
Cities are complex and dense systems, they require great amounts of energy and material
and they often produce huge amounts of waste in order to sustain such intensive living activity.
This means that the subsequent environmental burdens are high and they are likely going to
be higher in the future, if the urban population will increase at this pace. The density of social
and economic capital of cities makes them complex and evolving systems that require huge
amounts of energy and materials to survive and that are responsible for important
environmental burdens. Indeed, even if cities account for about 3% of the world surface, they
are responsible for 60-80% of energy consumption and 75% of greenhouse gas emissions
[2]. Nevertheless, the concentration of natural and human capital gives also the opportunity
to cities to be drivers for change and to address more favourably the impacts on planet Earth:

81
the solutions towards a more sustainable transition of our society are likely to be found in city
life.
The importance of cities in this transition was recognised also by United Nations, with the 17
Sustainable Development Goals (SDGs). The 11th goal is explicitly addressed to cities, and
aims to “make cities inclusive, safe, resilient and sustainable” [3].
How to reach such ambitious targets is still an open issue, as cities represent the most
complex system ever created by man. Cities widely differ in terms of size, context, social and
economic patterns, historical development, etc. and this means that a single definition of “city”
does not exist yet, but many definitions are possible according to the focus and targets of
research. In this regard, making “the city” as object of assessment is not a trivial task: issues
related to an appropriate definition and system boundaries are still open and object of debate.
Such complexity makes the application of holistic methodologies necessary to understand,
manage and tackle environmental pressures of urban contexts, avoiding the risk of burdens
shifting both spatially and temporally. Unfortunately, these are still lacking at the urban level
and the methodologies currently available present both strong and working points (Figure 1).
To date, the assessment of environmental performances are usually conducted from two
perspectives: top-down and bottom-up approaches [4]. Top-down approaches are
systematically complete in depicting the interactions between economic sectors (Input-Output
Analysis, IOA) and urban areas and surrounding natural environments (UM, Urban
Metabolism). The UM concept and related methodologies (such as the Material and Energy
Flow Analysis) allow making an inventory of the direct flows of materials, energy and waste
into and out of the city, but it do not allow to include the flows coming from upstream and
downstream processes and interpret these flows in terms of environmental impacts, providing
only an assessment of the environmental performances. The Environmental Input-Output
methodology attempts to estimating environmental impacts through the analysis economic
flows, but it is often available only at national or regional scale. The application to the urban
context is subjected to assumptions with a high degree of uncertainty and poses then some
threats for the quality of the results.
Regarding the bottom-up approaches, Carbon Footprint and Water Footprint are the most
widely used methods to evaluate the environmental performance of cities to date, despite their
limited scope. Several points have made these methods appealing to policy makers and
organizations: i) political commitments at national and international level; ii) rise of consensus
and concerns related to climate change and water scarcity; iii) relatively easy implementation
and communication of results. Notwithstanding, shortcomings are present. As these methods
focus only on one single environmental impact or issue, a comprehensive picture is missing
and the risk of burdens shifting could be high [5, 6] Furthermore, the proliferation of schemes
and approaches raised and the differences inherent to the urban contexts combined with the
lack of a single standardized method, make the interpretation of results often difficult to
analyse and compare.
Finally, Life Cycle Assessment (LCA) and Life Cycle Think approach (LCT) may be considered
the most comprehensive and robust holistic methodology to face this challenge. Compared to
the other methodologies presented, LCA has numerous advantages. Firstly, LCA takes into
account all processes, including upstream and downstream, from a cradle to grave
perspective, i.e. from the extraction of raw materials necessary, to the production, use and
final disposal (e.g. not direct operational energy use in a building for example, but also
embodied impacts related to the materials used). Furthermore, LCA considers a wide range
of environmental impacts (up to 18) and it is able to effectively compare the effects of different
scenarios (e.g. business as usual versus innovative scenario). The risk of burdens-shifting
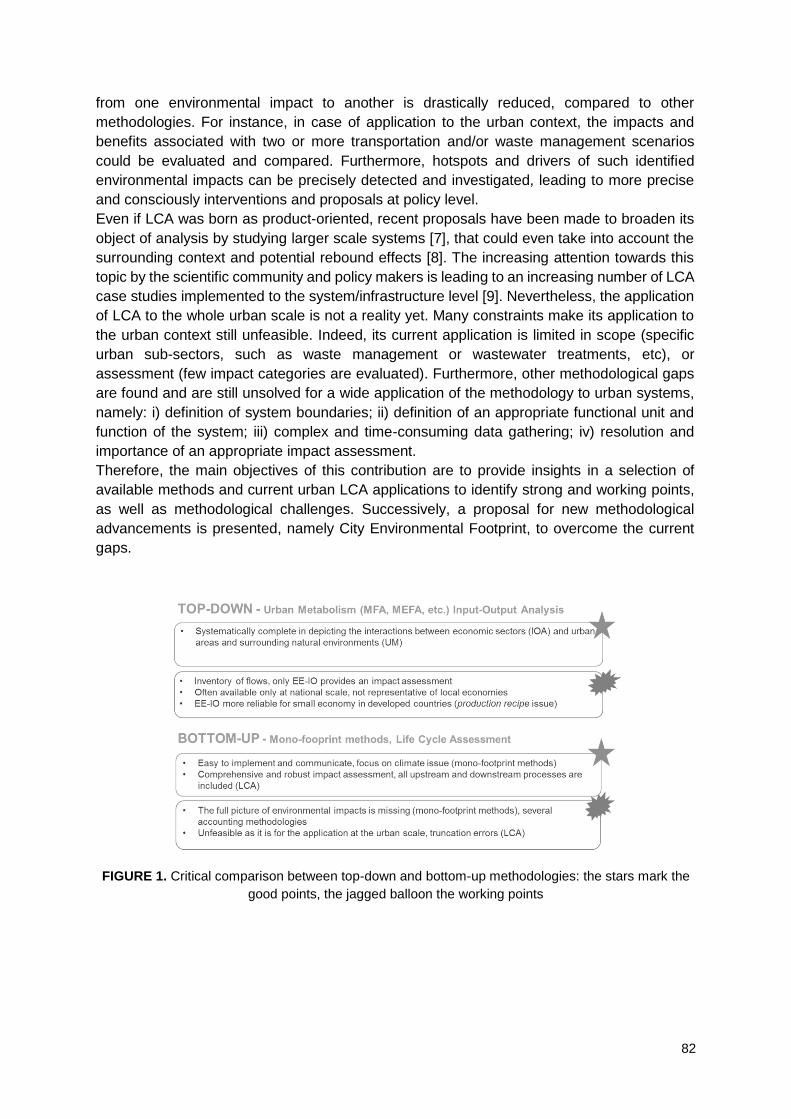
82
from one environmental impact to another is drastically reduced, compared to other
methodologies. For instance, in case of application to the urban context, the impacts and
benefits associated with two or more transportation and/or waste management scenarios
could be evaluated and compared. Furthermore, hotspots and drivers of such identified
environmental impacts can be precisely detected and investigated, leading to more precise
and consciously interventions and proposals at policy level.
Even if LCA was born as product-oriented, recent proposals have been made to broaden its
object of analysis by studying larger scale systems [7], that could even take into account the
surrounding context and potential rebound effects [8]. The increasing attention towards this
topic by the scientific community and policy makers is leading to an increasing number of LCA
case studies implemented to the system/infrastructure level [9]. Nevertheless, the application
of LCA to the whole urban scale is not a reality yet. Many constraints make its application to
the urban context still unfeasible. Indeed, its current application is limited in scope (specific
urban sub-sectors, such as waste management or wastewater treatments, etc), or
assessment (few impact categories are evaluated). Furthermore, other methodological gaps
are found and are still unsolved for a wide application of the methodology to urban systems,
namely: i) definition of system boundaries; ii) definition of an appropriate functional unit and
function of the system; iii) complex and time-consuming data gathering; iv) resolution and
importance of an appropriate impact assessment.
Therefore, the main objectives of this contribution are to provide insights in a selection of
available methods and current urban LCA applications to identify strong and working points,
as well as methodological challenges. Successively, a proposal for new methodological
advancements is presented, namely City Environmental Footprint, to overcome the current
gaps.
FIGURE 1. Critical comparison between top-down and bottom-up methodologies: the stars mark the
good points, the jagged balloon the working points
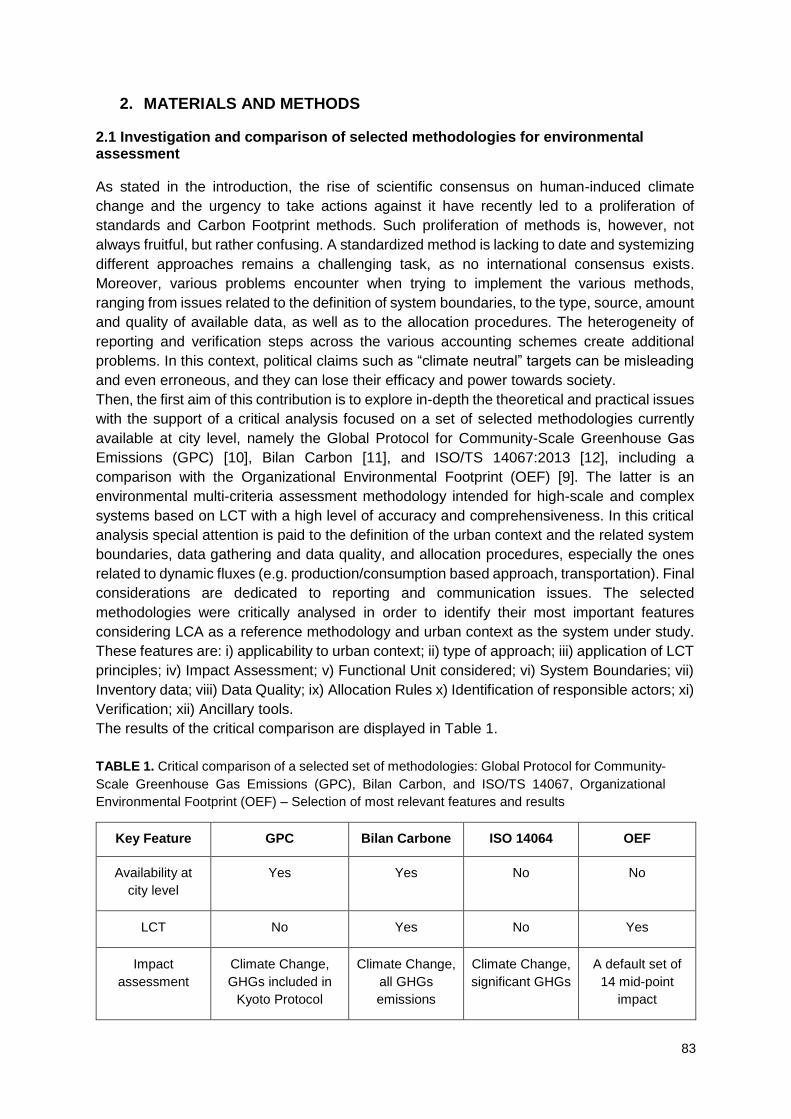
83
2. MATERIALS AND METHODS
2.1 Investigation and comparison of selected methodologies for environmental assessment
As stated in the introduction, the rise of scientific consensus on human-induced climate
change and the urgency to take actions against it have recently led to a proliferation of
standards and Carbon Footprint methods. Such proliferation of methods is, however, not
always fruitful, but rather confusing. A standardized method is lacking to date and systemizing
different approaches remains a challenging task, as no international consensus exists.
Moreover, various problems encounter when trying to implement the various methods,
ranging from issues related to the definition of system boundaries, to the type, source, amount
and quality of available data, as well as to the allocation procedures. The heterogeneity of
reporting and verification steps across the various accounting schemes create additional
problems. In this context, political claims such as “climate neutral” targets can be misleading
and even erroneous, and they can lose their efficacy and power towards society.
Then, the first aim of this contribution is to explore in-depth the theoretical and practical issues
with the support of a critical analysis focused on a set of selected methodologies currently
available at city level, namely the Global Protocol for Community-Scale Greenhouse Gas
Emissions (GPC) [10], Bilan Carbon [11], and ISO/TS 14067:2013 [12], including a
comparison with the Organizational Environmental Footprint (OEF) [9]. The latter is an
environmental multi-criteria assessment methodology intended for high-scale and complex
systems based on LCT with a high level of accuracy and comprehensiveness. In this critical
analysis special attention is paid to the definition of the urban context and the related system
boundaries, data gathering and data quality, and allocation procedures, especially the ones
related to dynamic fluxes (e.g. production/consumption based approach, transportation). Final
considerations are dedicated to reporting and communication issues. The selected
methodologies were critically analysed in order to identify their most important features
considering LCA as a reference methodology and urban context as the system under study.
These features are: i) applicability to urban context; ii) type of approach; iii) application of LCT
principles; iv) Impact Assessment; v) Functional Unit considered; vi) System Boundaries; vii)
Inventory data; viii) Data Quality; ix) Allocation Rules x) Identification of responsible actors; xi)
Verification; xii) Ancillary tools.
The results of the critical comparison are displayed in Table 1.
TABLE 1. Critical comparison of a selected set of methodologies: Global Protocol for Community-
Scale Greenhouse Gas Emissions (GPC), Bilan Carbon, and ISO/TS 14067, Organizational
Environmental Footprint (OEF) – Selection of most relevant features and results
Key Feature GPC Bilan Carbone ISO 14064 OEF
Availability at
city level
Yes Yes No No
LCT No Yes No Yes
Impact
assessment
Climate Change,
GHGs included in
Kyoto Protocol
Climate Change,
all GHGs
emissions
Climate Change,
significant GHGs
A default set of
14 mid-point
impact
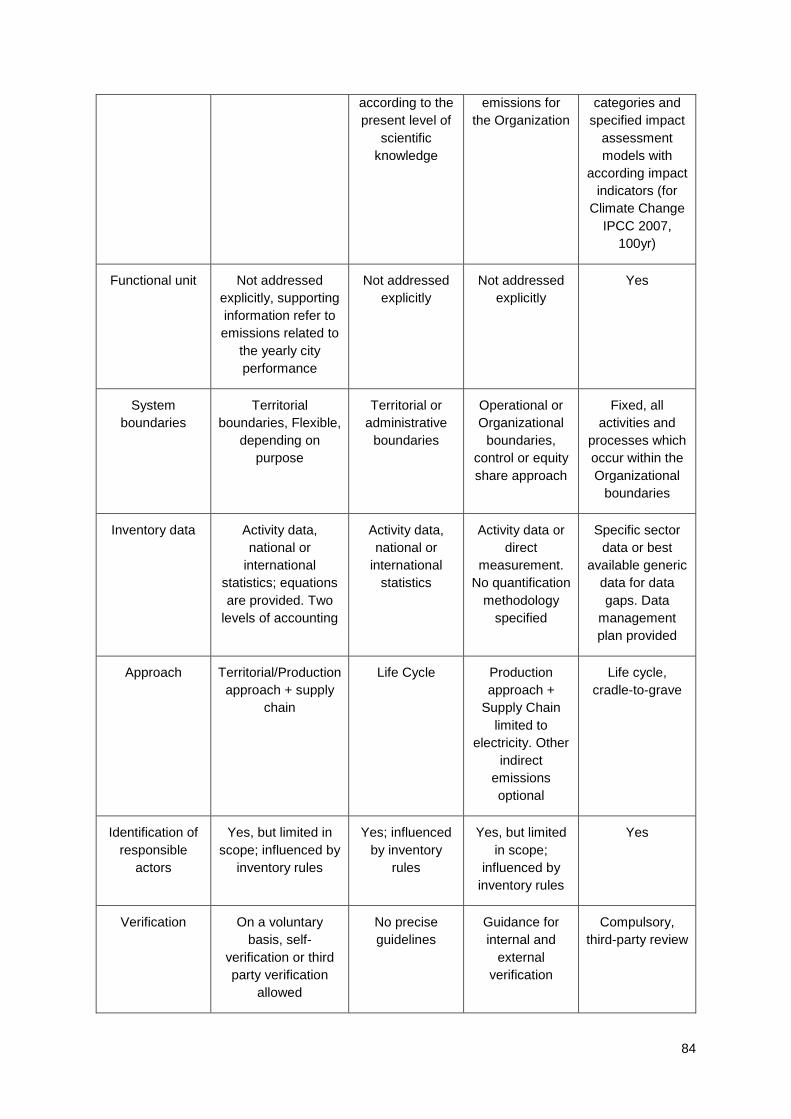
84
according to the
present level of
scientific
knowledge
emissions for
the Organization
categories and
specified impact
assessment
models with
according impact
indicators (for
Climate Change
IPCC 2007,
100yr)
Functional unit Not addressed
explicitly, supporting
information refer to
emissions related to
the yearly city
performance
Not addressed
explicitly
Not addressed
explicitly
Yes
System
boundaries
Territorial
boundaries, Flexible,
depending on
purpose
Territorial or
administrative
boundaries
Operational or
Organizational
boundaries,
control or equity
share approach
Fixed, all
activities and
processes which
occur within the
Organizational
boundaries
Inventory data Activity data,
national or
international
statistics; equations
are provided. Two
levels of accounting
Activity data,
national or
international
statistics
Activity data or
direct
measurement.
No quantification
methodology
specified
Specific sector
data or best
available generic
data for data
gaps. Data
management
plan provided
Approach Territorial/Production
approach + supply
chain
Life Cycle Production
approach +
Supply Chain
limited to
electricity. Other
indirect
emissions
optional
Life cycle,
cradle-to-grave
Identification of
responsible
actors
Yes, but limited in
scope; influenced by
inventory rules
Yes; influenced
by inventory
rules
Yes, but limited
in scope;
influenced by
inventory rules
Yes
Verification On a voluntary
basis, self-
verification or third
party verification
allowed
No precise
guidelines
Guidance for
internal and
external
verification
Compulsory,
third-party review

85
Afterwards, each method was screened highlighting strong points and shortcomings through
a SWOT analysis (Figure 2).
FIGURE 2. SWOT analysis, good and working points of GHG Protocol, Bilan Carbon, ISO 14064 and
OEF for application to the urban context
The analysis of the key features, strong and working points presented highlights points for
comparison and reflections for each method. According to the analysis and the reference to
the OEF, the Bilan Carbon performs better with regard to the target of an efficacious GHG
emission accounting at the urban level for a number of reasons. First of all, it is designed for
cities and utilizes an LCT approach for every sector considered, including all direct and indirect
emissions also from upstream and downstream processes. Furthermore, it is particularly
effective to balance the academic research and the policy-demand and it includes a
comprehensive accounting of GHG emissions, as this is not limited to the ones included in
the scope of the Kyoto Protocol, the good guidance to the user from the methodological point
of view and the supply of supporting material, as the spreadsheets for emissions factors.
Despite this promising features, Bilan Carbone requires higher costs of implementation that
shall be taken into account at policy-level, due to: i) big and time-consuming life cycle data
gathering; ii) the level of expertise necessary to manage it and to apply the method, as the
guide is less user-friendly than the GPC Protocol. Finally, reporting and verification are not in
the scope of the method, despite their importance for communication purposes to the
stakeholders and to ensure the reliability of the results.
The analysis undertaken for the GPC recognizes its user-friendly approach tailored for cities
and policy-makers, the attempt to follow IPCCs recommendations from the municipal
perspective, its degree of flexibility that can encourage interested neophytes in participating
to the climate discussion. However, the major scope of the standard is inventorying direct
territorial GHG emissions, this could lead to an underestimation of consumption-based
emissions and increase the risk of burdens shifting to other territories. At top of this,
accounting guidelines are found to be loose and this can affect the quality of results and the

86
purpose of comparison between cities and target-oriented strategies. Verification and
reporting are only encouraged and guidelines are not provided.
On top of the considerations provided above for Bilan Carbone and the GPC, the ISO 14064
benefits from its standard-oriented and loose framework that could be attractive, but that does
not seem enough comprehensive for the challenge of urban emissions accounting, as no
precise indications neither on GHG to be accounted for nor on the quantification methodology
are provided. Direct and (partially indirect) emissions are inventoried, but key choices are in
charge of the organization. Anyway, reporting and verification procedures are well developed
and defined.
Finally, it is remarkable to summarize some of the most important features of the OEF that
make it eligible to be used as reference methodology and should be taken into account from
experts and municipal stakeholders for improvements of reliability, consistency and
transparency of urban-related GHG emissions accounting, and, on a later stage, for the
assessment of environmental impacts.
The OEF method applies to organizational activities as a whole – in other words, to all
activities associated with the goods and/or services an organization uses and provides from
a life-cycle perspective. Depending on the use and purpose of the OEF study, the key
requirements are different. This allows flexibility and optimization of the efforts and it is an
important issue to be investigated also from the city requirements point of view. This, however,
does not imply an excessive subjectivity as in the case of GPC or ISO 14064. Indeed, the
guidelines are very similar to the LCA methodology, but stricter and more complete.
As a general conclusion, it is important to remark that no method provides an in-depth
discussion and proposal about the challenge of defining and categorizing the urban system in
an appropriate way to serve a more efficient assessment.
2.2 Current LCA applications at the urban scale: analysis of existing constraints, patterns and trends
As second part of research related to the current state of art, a review study was carried out,
taking into account the published literature from 2010 to the present [13]. The aim is twofold:
i) acquiring a comprehensive overview of the current applications of LCA at the urban level;
ii) defining a potential research agenda to make LCA suitable for urban studies.
Whereas a direct application of the methodology to the full urban scale does not exist yet, an
analysis for the different urban sub-systems was carried out. The sub-systems identified are:
i) built environment; ii) energy systems; iii) waste; vi) water; v) consumption patterns; vi)
transportation networks; vii) urban open spaces and green (including aspects related to land
use and ecosystem services). The intention is to cover the majority of the urban activities
needed to sustain the “life” of the city itself and its inhabitants, in terms of citizens, residents
and visitors (commuters, tourists, etc.), services, etc. Two additional core topics were covered:
i) hybrid approaches, i.e. combination of LCA with top-down methodologies (e.g. under the
UM umbrella) and/or with other tools used in the urban planning and management, such as
geographical information systems (GIS) and remote sensing; ii) upscaling LCA from urban
sub-systems to the upper scale level. The relevant papers were selected based on two criteria:
i) the papers shall deal with full LCAs, i.e. including a wide range of impact categories; ii) and
the case studies for the urban sub-sectors shall be considered at the whole urban scale. Few
exceptions to these criteria were allowed, e.g. evident elements of novelty, support to urban
planning, etc.
87
In the screening phase almost one thousands of titles and abstract were analysed and a
shortlist of 65 papers was selected. The analysis of the selected literature confirmed that no
applications of LCA at the full urban scale exist to date, while upscaling approaches are still
on their way of development. Waste and water sub-sectors seem to be the most mature in
performing the transition from the product/process level to the higher scale systems and LCA
is found to be used mainly as supporting tool for policy making, and strategic and comparative
analysis. In terms of literature coverage, the transportation sector and energy systems follow,
but for these the impact assessment is mainly focused on assessing and comparing emissions
and energy demands or technology systems, respectively. For what concerns household
consumption and urban building stock, the topic is poorly explored or still unexplored in an
integrated way, despite its relevance.
The attempts of upscaling approaches are still limited in their scope and practices, and even
the use of hybrid methodologies is not usually applied at the entire urban level. The most
comprehensive and established framework is found to be the territorial LCA [7, 14], while
other upscaling approaches are applied to a limited spatial extent, e.g. neighbourhood scale,
or they focus on specific urban issues [15]. Finally, it is interesting to notice that there is a
claim for integration of LCA with spatial planning and ICT tools, due their potential for data
gathering and management, spatialization of impacts and visualization purposes.
In the second part of this review study current bottlenecks for LCA at urban level were
screened and discussed [7]. More specifically the following issues were reviewed in more
detail: i) System Boundaries; ii) Functional Unit; iii) Data granularity and quality; iv) Life Cycle
Impact Assessment. These four elements are crucial for the correct application of LCA
methodology and are here briefly presented.
The system boundaries define the borders and bounds of the analysis, determining which unit
processes shall be included and excluded in the study. Depending on the goal and scope of
the study, the system boundaries are also influenced by the perspective taken, i.e.
territorial/production (activities in the territory) or consumption approach (including activities
outside the territory but related to consumption dynamics in the territory), in the case of urban
context and GHG emissions.
The Functional Unit (FU) is a concept typically related to LCT, it defines the reference unit of
the study for the inventoried flows and it allows for comparison. Typical FUs for the urban
context are the entire city over 1 year or one single citizen over 1 year (e.g. kiloton of CO2eq
per year or CO2eq per year*capita, respectively).
As pointed in section 1, there is no unique agreement on the definition of a city and its system
boundaries. As a unique definition of “city” does not exist yet, it is questionable and object of
debate what could be an appropriate choice to evaluate such a heterogeneous and dynamic
system as the urban context.
Data granularity and their quality are of paramount relevance for the purpose of the
appropriate and precise identification of the responsible actors, in order to avoid the black box
approach of UM.
The Life Cycle Impact Assessment phase aims at translating the inventory flows in potential
environmental impacts with the support of specific models (impact assessment methods).
According to the methods and impact categories selected is possible to evaluate up to 18
different environmental impacts, e.g. human toxicity, eutrophication, resource depletion, etc.
besides the popular climate change.

88
The analysis of the papers selected revealed that only upscaling approaches discuss and try
to overcome the current bottlenecks that remain open issues and methodological gaps to
solve [7, 13, 14, 15].
The key conclusion emerged from the review confirmed that LCA is a raising and promising
methodology to assess the environmental impacts of cities in a holistic way, but further
adjustments and improvements to the methodology are needed [13].
3. THE CITY ENVIRONMENTAL FOOTPRINT: PROPOSAL FOR A NEW METHODOLOGICAL APPROACH TO EVALUATE THE URBAN ENVIRONMENTAL FOOTPRINT
The outcomes of the previous steps served as a basis for the proposal for a City
Environmental Footprint (City EF), a hybrid methodology, LCA-based, able to combine top-
down and bottom-up approaches, to overcome the current limitations existing in the field of
urban environmental assessment.
Top-down methodologies enable to identify the main fluxes going into and out of the city (i.e.
typically inventoried for the main sectors within a city). Bottom-up approaches allow for
microscale analyses of various sub-systems of the city (e.g. residential buildings,
infrastructure, transport, energy production, water supply, etc.) and their constituting
processes and/or products (e.g. construction products, use of appliances, heating energy use,
cooling energy use, etc.). The first simplify the data gathering process and/or fill data gaps.
The combination of both approaches with a different level of granularity results in a more
precise and detailed modelling and data inventory and allows for a more clear identification of
hotspots and opportunities for efficient and effective improvement of the city.
The City EF proposed comprises five main steps, iterative and customizable according to the
needs and the specific reality of the urban context taken into account (Figure 3).
FIGURE 3 City Environmental Footprint, methodological details of the proposed approach
The first step entails a qualitative approach and aims at providing an overview of the dynamics
inherent to the city, with the study of the historical, social, and economic background, through
the identification of the main functions and the support of specific urban indicators (Figure 4).
A core set of horizontals indicators is dedicated to describe the dynamics common to each
urban context, while specific sets are dedicated to each urban categories identified.

89
Furthermore, proper definitions and methodological guidelines for various urban contexts
complete the qualitative step of the City EF. The final aim is to provide the necessary elements
to support the following quantitative approach. Indeed, as a unique definition of “city” does not
exist yet, a careful reflection on this issue is not crucial only from a semantic point of view, but
also from a technical one, as it involves the definition of system boundaries for the object
investigated.
FIGURE 4 Categories for cities and their subsystems as proposed in the City EF
The subsequent quantitative approach (LCA based) takes into account the findings emerged
from the previous step with specific refinements related to: functions of the system and
functional unit, system boundaries, allocation procedures for production/consumption and
transportation activities. The definition of the system boundaries shall be carefully done, and
even if geographical and administrative boundaries are the most feasible choices, as they are
objective, legal, political ways to define the urban context and they support better the data
gathering process, it is essential to consider appropriate allocation procedures for the existing
transboundary processes (e.g. mobility and trades). Moreover, an adequate functional unit
shall describe and account the heterogeneous urban space. Even if referring the yearly flows
to a single citizen or to the overall urban population are popular choices, the reference to the
“population equivalent” could be a more promising and advantageous concept, able to
consider not only the permanent residents, but also the city-users, share of people taking
advantage of the urban services (e.g. tourists, commuters, etc.).
The life cycle inventory follows (step three), and it is organized according to the different urban
subsystems identified in the qualitative step. Data about each subsystem are collected and
organized in coherence with the identified function of the city and functional unit (entire urban
system and number of population equivalent identified). A feasible level of data quality and
granularity, that could maximize the efforts and provide robust and consistent results in a
reasonable time, shall be defined. Learning from the previous analysis, an innovative way
could be the combination of common “low-tech” data (statistics, literature, etc.), with “high-
tech” data, e.g. spatial data from GIS.
The fourth step translates the inventoried fluxes in potential environmental impacts. In this
regards, appropriate models and LCIA methods are used, but they shall be carefully
considered to address better the spatialization of impacts and the identification of global (e.g.

90
climate change), regional (e.g. acid rain) and local (e.g. air quality) impacts for a more effective
and conscious decision-making process.
Finally, the fifth and conclusive step is dedicated to revisions, interpretation of results,
investigations on the major hotspots. Sensitivity analysis and evaluation of alternative
improvement scenarios are possible additional steps.
4. CONCLUSIONS AND FUTURE OUTLOOK
Cities are a strategic player in the path towards sustainability, but their complexities
require an ad-hoc methodology to achieve the target, as no methodology to date is
completely effective. This contribution shows that so far none of the available approaches
and selected methods can be applied as it is, but each one provides good points to start
or working points to start. The proposed City Environmental Footprint aims at overcoming
some of the macroscopic current limitations, such as: i) the assessment of potential
impacts induced by urban activities; ii) the identification of the major hotspots and
responsible actors; iii) the evaluation of more sustainable alternative scenarios to select
the best measures from an environmental point of view. Currently, investigations are
ongoing to define and test proper system boundaries, functions and functional unit of the
system, and provide methodological advancements for a more specific urban impact
assessment. Future advancements could be the extension of the methodology for the
evaluation of social and economic dimensions through the support of Social Life Cycle
Assessment (S-LCA) and Life Cycle Costing (LCC).
Finally, the intended final users of such method are urban planners, policy makers,
researchers and practitioners. The City EF aims to be an efficacious tool that can support
them in the transition for cities to a more sustainable path.
REFERENCES
[1] United Nations, 2012 World Urbanization Prospects: The 2011 Revision, Department of Economic and Social Affairs (United Nations, New York)
[2] United Nations, Department of Economic and Social Affairs, Population Division (2016). The World’s Cities in 2016 – Data Booklet (ST/ESA/ SER.A/392)
[3] United Nations, 2016. Sustainable Development Goals – 17 Goals to Transform Our World http://www.un.org/sustainabledevelopment/ (Accessed April 2017)
[4] Yetano Roche et al., 2014. Concepts and methodologies for measuring the sustainability of cities, Annu. Rev. Environ. Resour. 2014 39:519-47
[5] Allacker K., De Troyer F., 2013. Moving towards a more sustainable belgian dwelling stock: The passive standard as the next step? Journal of Green Energy Building, Vol 8, no 2: 112-132
[6] Kalbar P., Birkved M., Karmakar S., Nygaard S. E., Hauschild M. Z., 2017. Can carbon footprint serve as proxy of the environmental burden from urban consumption patterns? Ecological Indicators, Vol. 74, 2017, p. 109-118.
[7] Loiseau E., Roux P., Junqua G., et al., 2013. Adapting the LCA framework to environmental assessment in land planning. Int J Life Cycle Assess 18:1533–1548. doi: 10.1007/s11367-013-0588-y
[8] UNEP (2011) Global Guidance Principles for life cycle assessment databases – A Basis for Greener Processes and Products, “Shonan Guidance Principles”, http://www.unep.org/pdf/Global-Guidance-Principles-for-LCA.pdf
[9] European Commission, (2013). Recommendation (2013/179/EU) on the use of common methods to measure and communicate the life cycle environmental performance of

91
products and organisations, Annex III (Organisational Environmental Footprint (OEF) Guide)
[10] WRI, C40 cities and ICLEI, 2014. Global Protocol for Community-Scale Greenhouse Gas Emission Inventories – An accounting and Reporting Standard for Cities. Available on: http://www.ghgprotocol.org/city-accounting
[11] ADEME, 2010. Bilan Carbone®. Companies – Local Authorities – Regions. Methodology guide, version 6.1. Objectives and accounting principles, 2010. Available on: http://associationbilancarbone.fr/sites/default/files/guide_methodologique_v6_euk-v.pdf
[12] ISO 14064-1:2006, Greenhouse gases -- Part 1: Specification with guidance at the organization level for quantification and reporting of greenhouse gas emissions and removals
[13] Mirabella N., Allacker K., Sala S., 2017. Current trends and limitations of Life Cycle Assessment applied to the urban scale: critical analysis and review of selected literature. Submitted to International Journal of Life Cycle Assessment (March, 2017)
[14] Loiseau E., Roux P., Junqua G., Maurel P., Bellon-Maurel V., 2014. Implementation of an adapted LCA framework to environmental assessment of a territory: important learning points from a French Mediterranean case study. J. Clean. Prod., 80 (0) pp. 17–29 http://dx.doi.org/10.1016/j.jclepro.2014.05.059
[15] Trigaux D, Wijnants L, De Troyer F, Allacker K., 2016. Life cycle assessment and life cycle costing of road infrastructure in residential neighbourhoods. Int J Life Cycle Assess . DOI: 10.1007/s11367-016-1190-x

92
8. HUMAN WASTE MANAGEMENT, STORAGE AND DISPOSAL IN NIGERIA: IMPLICATIONS TO RESIDENTIAL APARTMENTS IN IKEJA, LAGOS
Bolawole F. Ogunbodede1
1 Department of Architecture, University of Lagos, Akoka, Yaba, Lagos, Nigeria
Phone: +234-8023311182, Email: [email protected]
ABSTRACT. Human waste is as important to mankind as life itself. As people feed
for survival, the process of digestion leads to the production of human waste. Lagos
being a Mega city with a population of more than fifteen million, the human waste
generated is significant. How the generated human waste is handled is worthy of
assessment. This paper examines the methods through which human wastes are
collected and disposed in Ikeja residential quarters. The case study has the three
classified residential zones of high density, medium density and low density. Sample
frame was based on the number of buildings. Findings reveal that, residents across
the density zones rely basically on septic tanks for human waste storage, which
leads to a recommendation that septic tanks and soakaways be kept at appropriate
distances to boreholes and wells, to prevent water contamination.
Keywords: Human waste, Storage and Disposal, Residential Apartment.
1. INTRODUCTION
How human waste is kept and processed will determine its resultant effects on the
environment and the lives of citizens. In Ikeja, the capital of Lagos State, Nigeria, human
wastes are generally subjected to onsite storage, just like most areas of Lagos State. This is
done through the construction of septic tanks and soakaways. The absence of sewer system
in this area makes it mandatory for each house to owner to store human wastes within the
limits of their sites. This practice has become traditional, and usually carried out without putting
the World Health Organisation recommended safe distance of 30 metres into consideration3
Population growth and change in lifestyle coupled with industrial growth are major causes
of waste increase in developing nations1 (Majeswari et al, 2017)
Human faeces and urine, which are products of living beings are a huge contributor to
wastes in the world. Human faeces contain organisms that are capable of causing diseases,
by getting into the body through food, water or any contaminated object. These often leads to
diseases like diarrhoea, cholera or typhoid that could result to death, if not promptly and
properly treated2. However, the dangers caused by these human waste makes it imperative
that it be properly managed, in order to achieve sustainable living.
.
Several issues have been found to be connected with human waste mismanagement in
Lagos State, Nigeria, these include; air pollution that results from the overflow of un-evacuated
septic tanks, contaminated underground water and accidents due to badly constructed septic
93
tanks and soakaways (Figures 3 & 4). It is then valuable to study the management pattern of
human wastes in Ikeja, Lagos State.
Two main identified problems guide the focus of this write-up. The first is the absence of
sewer lines in the study area and the resultant proliferation of septic tanks. The second is the
absence of an effective community water supply, which also leads to home owners having to
either drill bore-holes or dig wells. The study seeks to access Septic Tank/Soak-away
placement vis-à-vis bore-holes and septic tanks, and also explore solutions to the resultant
challenge of these placements. The results from this study will point to steps that could make
neighbourhoods and buildings more sustainable.
2. REVIEW
2.1 Human Waste and Underground Water
It is generally accepted that human waste is a major contributor to environmental pollution
in developing countries. About 98% have access to toilets and onsite technologies are usually
deployed through septic tanks and soakaways to manage the wastes generated through the
use of the toilets5. These technologies are considered safe when handled to specifications6.
More than 80% of Nigerians depend on this system for sanitary wastes3.
However, the peculiar situation of developing nations, like corruption, absence of
maintenance and population increase, usually causes inadequate water distribution through
government controlled infrastructure. This situation has forced individual property owners to
find alternative source of water supply, hence, the proliferation of boreholes and wells7. In
Nigeria, people depend mainly on the for drinking and other uses3.
For the contamination of this ground water, a major source is believed to be the septic
tank system. This is because septic tanks and soakaway pits are located with disregard to the
World Health Organisation (WHO) recommended distance of 30m – 40m. This is in addition
to boreholes being done without taking the UNICEF recommended minimum depth of 100m –
150m into consideration3,8.
2.2 Brief description of standard septic tank/soakaway in Nigeria
Septic tank is a sealed, watertight concrete tank used for onsite sewage treatment. It uses the
anaerobic bacteria environment to reduce solid wastes and organics. The tank is divided into
2 chambers provided with individual manhole cover. It is separated by a baffle wall with
opening close to the roof and floor of the tank. The inlet of the solid waste goes straight to the
sedimentation section where the waste gets decomposed and mineralized leaving the sludge
to settle at the base, the scum to float and the waste water at the middle. The wastewater
flows to the second chamber for further settlement leaving behind an almost clear wastewater,
which is transported to the soak away for primary treatment. Septic tanks vary in sizes based
on the number of users within the facility. It is provided with vents and access points for
inspection.
The soak away pit is another underground structure away from the septic tank. It is a drywell
commonly used to drain out the waste water from the septic tank. It allows soil water to slowly

94
percolate into the ground. In Nigeria, these soak-away pits are often made of sandcrete block
walls laid along the excavated pit walls with gaps to allow the water to seep through them to
the ground. However, this is meant to allow the water go through the earth to naturally filter
out but it may cause ground water pollution causing the water sources around to be
contaminated.
These two (septic tank and soak away pit) covers a large portion of the building setback and
is normally covered with concrete slabs and well supported to avert the possibilities of failure
when heavy objects pass across it.
2.3 Implications of siting Septic tanks/Soakaways close to Boreholes
FIGURE 6: Representation of the effects of Septic tank and Soakaway pit on ground water3.
3. STUDY AREA
The case study approach was adopted for the study. The specific case selected was Ikeja.
Lagos State, where Ikeja is situated, was created on the 27th of May, 1967, through States
Creation and Transitional Provision Decree No 14 of 1967. Before this time, Lagos municipality
was administered as a Federal Territory by the Federal Government. The State took off fully
as an administrative entity on the 11th of April, 1968. It is the 6th largest city in the world, with
the smallest landmass in Africa. It is West Africa’s most resourceful single trading market with
highest concentration of people. It has an area of 358,861 hectares or 3,577sq.km. Lagos is
located on the Atlantic coast in southern Nigeria9
The rate of population growth is about 600,000 per annum with a population density of about
4,193 persons per sq. km. In the built-up areas of Metropolitan Lagos, the average density is
over 20,000 persons per square km. Current demographic trend analysis revealed that the
State population is growing ten times faster than New York and Los Angeles with grave
implication for urban sustainability10.

95
Lagos has a diverse and fast-growing population, resulting from migration to the city from all
parts of Nigeria and neighbouring countries. This is the only urban settlement in the UN list of
30 largest urban settings in the world (Cohen 2004). In 1992, Lagos had an estimated
population of about 1,347,000. The population of its metropolitan area was about 10.1 million
in 2003. The United Nations predicts that, the city’s metropolitan area, which had only about
290,000 inhabitants in 1950, will exceed 20 million by 2010, making Lagos one of the world’s
five largest cities11
FIGURE 7. Map of Nigerian, showing the location of Lagos12

96
FIGURE 8. Map of Lagos State, showing Metropolitan Lagos in red highlight13
Ikeja, the study location, is the capital of Lagos State of Nigeria. This city was pronounced
the capital in 1976. This area has economic, social and material potentials, it also has its
environmental and physical challenges. Ikeja covers 5,630 hectares of land area, which
accounts for 1.57% of the state’s total area. It however accommodates 3.45% of the
population, which is a total of 533, 237. It is projected to become 1,062,833 in 2020. Lagos
state house survey 2010, takes the population of Ikeja to be 735, 828. It is documented that,
85% of the buildable space in Ikeja has already been utilized.
FIGURE 9. Map of Lagos State, showing sixteen of the existing twenty Local Governments in
Metropolitan Lagos; Ikeja Local government in oval circle14.
For ease of administration and political monitoring, Ikeja is divided into 10 wards, namely:
1. Anifowose/Ikeja
2. Ojodu/ Agidingbi/Omole
3. Alausa/Olusosun/Oregun
4. Airport/Onipetesi/Onilekere
5. Ipodo/Seriki Aro

97
6. Adekunle Village/Adeniyi Jones/Ogba
7. Oke-Ira/Aguda
8. Onigbongbo/Military Cantonment
9. GRA
10. Wasimi/Opebi/Allen
Ikeja is also noted for industrial activities apart from having most of its land area dedicated to
residential. It carries 46.4% of manufacturing production values, the highest in Nigeria as at
2014.
The population induced pressure on Ikeja has made the existing infrastructure inadequate for
the populace, which led to the degeneration in the quality of life and physical environment.
The choice of Ikeja as a study area is due to its being the capital of Lagos State where the
presence of the state government is domiciled. It also has a representation of the 3 major
income groups; low income/high density/medium income/medium density and high
income/low density. Apart from its being predominantly residential, industrial and commercial
activities are also located in this study area.
4. RESEARCH METHODS
4.1 Sampling technique
The study area has all the classified wards in it; low density, medium density and high density
income wards (table 2). It was purposively selected, due to its being the capital of Lagos State.
TABLE 1: Wards within Ikeja Local Government
HIGH DENSITY/LOW
INCOME WARD
MEDIUM
DENSITY/MEDIUM DENSITY
WARDS
LOW
DENSITY/HIGH
INCOME WARDS
1. Ipodo/Seriki Aro Anifowose/Ikeja Onigbongbo
2. Agidingbi/Omole/Ojodu GRA
3. Alausa/Oregun/Olusosun
4. Onilekere/Onipetesi
5. Adeniyi Jones/Ogba
6. Okeira/Aguda Titun
7. Wasinmi/Opebi/Allen
Ipodo/Seriki Aro, the only high density ward in Ikeja was selected, Wasinmi/Opebi/Allen was
randomly selected from the medium density wards, while GRA was equally selected randomly,
from the low density wards.

98
FIGURE 10: Randomly selected wards for administration of questionnaires15
Questionnaires were administered in selected residential buildings within these wards.
4.2 Sampling unit
The total number of residential buildings in Ikeja is 25,313, and number of polling units 350
(Independent National Electoral Commission, 2000). This gives an approximate 72 buildings
per polling unit. When applied to these three wards, by working out the number of buildings in
each ward through the application of the ratio of polling units per ward, considering that, the

99
number of polling units was determined, by the number of residential buildings in each of the
ward, the figures are as shown in table 3.
This gives a population of 7,953 buildings, as the basis for sampling.
TABLE 2: Selected wards. Source: Independent National Electoral Commission (2000)
WARD AVERAGE No OF
BUILDINGS/POLLING
UNIT X No OF POLLING
UNITS
POPULATION (Residents)
BASED ON No OF
BUILDINGS
1. Ipodo/Seriki Aro 72 X 55 3,960
2. Wasimi/Opebi/Allen 72 X 30 2,160
3. GRA 72 X 25 1,800
TOTAL 72 X 110 7,920
The sample size of this research was based on the population of residential buildings in
selected wards, which is 7,953. Questionnaires were administered on the basis of this
estimate.
4.3 Sample size
The sample size was determined in reference to table 4, at a confidence level of 95% and a
margin error of 5%.
TABLE 3. Sample size requirements
Source: https://edis.ifas.ufl.edu/pdffiles/PD/PD00600.pdf
A total number of 750 questionnaires (about double the size of the recommendation on table
4) were administered in the 3 zones. The total number of returned questionnaires were 595,
which accounts for 79.3%. The number of questionnaires analysed were 545 (72.7%), after
the ones with errors were separated.

100
5. FINDINGS
On the type of toilet facility used by respondents (Table 5), 93.8% use flush toilets within high
density area, 97.2% within the medium density area, 96.6% within the low-density area, while
96.0% of them use flush toilets at the combination of the 3 density areas. There is no existing
sewer to carry the wastes generated through these toilet systems. Every building stores the
resultant wastes from its toilet facilities onsite. The 25,313 number of buildings in ikeja, is
closely related to the number of Septic tanks and soak pits in existence.
For water supply, majority of respondents rely on private bore-holes or wells (Table 5), this is
evident within the 3 density areas and across the generality of respondents. This is 61.2%
within the high density area, 70.1% within the medium density area, 70.7% within the low
density area and 67.7% at the combination of all density areas.
Most respondents (73.2%) have never been enlightened through programmes on the
sustainability of the environment and dwellings.
TABLE 5: Frequency distribution of Respondents’ type of toilet facility, mode of water supply and
sustainability awareness
High
Density
Medium
Density
Low
Density
Total
Water
Supply
Pipe-borne water
Private bore-hole/Well
Water Vendors, Rain Water
48(30%)
98(61%)
13(3.1%
)
1(0.6%)
38(21.5
%)
124(70.1
%)
14(7.9%
)
1(0.6%)
45(21.6
%)
147(70.7
%)
12(5.8%
)
4(1.9%)
131(24.0
%)
369(67.7
%)
39(7.2%
)
6(1.1%)
Toilet
Facility
Flush Toilet
Pit Latrine
150(93.8
%)
10(6.2%
)
172(97.2
%)
5(2.8%)
201(96.6
%)
7(3.4%)
523(96.0
%)
22(4.0%
)
Involvement
in sustainability
Programme
Yes
No
45(28.1
%)
115(71.9
%)
51(28.8
%)
126(71.2
%)
50(24.0
%)
158(76.0
%)
146(26.8
%)
399(74.2
%)
However, majority of respondents within each income zone are Renters; 61.9% in the low
income zone, 67.2% in the middle income zone, 51.4% in the high income zone and 59.5% in
all combined. This is followed by owner occupiers, with 18.8% within the low income zone,
18.1% within the middle income, 27.9% within the high income and 22.0% within all
respondents combined. This has a significance difference of 0.059.

101
FIGURE 11: Tenure status of respondents across density zones
Physical assessment of the study area, shows the borehole distance to septic tanks and
soakaway pits to be 12 metres and below. This grossly inadequate as it does not conform
with World Health Organisation (WHO) recommendation.
FIGURE 12: Borehole distance to Septic tank and Soakaway pit in a selected compound
0.00%
10.00%
20.00%
30.00%
40.00%
50.00%
60.00%
70.00%
80.00%
Owner occupier Family occupier Free occupier Renter
Tenure status
High Density
Medium Density
Low Density

102
FIGURE 13: Borehole distance to Septic tank and Soakaway pit in a selected compound
6. RECOMMENDATIONS
Residents are at the risk of being infected by diseases related to water and sanitation
endemic in sub-Saharan Africa, especially through oral infection. These include Cholera and
Typhoid16. There is a higher risk of infection when there are no well-designed housing
strategies and the creation of healthy environments by stakeholders17. It is therefore
recommended that:
1. Awareness is created for stakeholders to know the health hazards and environmental
nuisance that could arise due to mismanagement of Human waste.
The location of septic tanks to buildings should be a minimum of 30 metres3. An average
plot of land in Ikeja, Lagos cannot accommodate such distance to the building. This makes
centralised storage an option. It is therefore recommended that:
2. Neighbourhood based treatment plants should be established with a network of
sewer lines
A greater percentage of respondents are renters (Figure 11), who have no control on the
properties as built. Based on this, it is recommended that:
3. Regulations that will compel the investors to imbibe sustainable practice be put in
place.
The following are also recommended:
4. Establishment of pressure groups that will compel government agencies to formulate
policies on human waste management.
5. There is a need for researchers, to focus on developing nations especially in the area
of Waste management
103
7. CONCLUSION
Viewing the composition of Lagos State, and the entire country, centralised human
waste management is not a common experience. Establishment of centralised Human waste
treatment plants, and a massive education of residents on the risks associated with
unsustainable practices will gradually lead the neighbourhoods towards resilience. Findings
and Recommendations from this research serves as a lead towards further studies on this
subject.
REFERENCES
[1] DIAZ L. S (2011): Solid Waste Management in Developing Countries: Status, Perspectives and
Capacity Building. Intergovernmental Preparatory Meeting for CSD-19, United Nations
Headquarters, New York, USA, March 3,2011
[2] http://www.who.int/water_sanitation_health/hygiene/emergencies/em2002chap8.pdf:
Sanitation, Human Waste and Health. Retrieved September 9,2017
[3] ABDUL A. O (2016): Lagos state government ministry of the environment wastewater
management office. Year 2016 Retreat,11th – 14th February, 2016
[4] CHENG S. K, ZHENG L, ZHAO M. Y, BAI X, LI X. F, HEINZ-PETER M (2017): Assessment of
Two Faecal Sludge Treatment Plants in Urban Areas: Case Study of Beijing. International
Journal of Agriculture & Biological Engineering, 2017; 10(3): 237-245
[5] BANDA L. J, MBEWE A. R, NZALA S. H, HALWANDI H (2014): Effect of Sitting Boreholes and
Septic Tanks on Groundwater Quality in St. Bonaventure Township of Lusaka District, Zambia.
International Journal of Environmental Science and Toxicology Research 2(9) pp 191-198
[6] FUBARA-MANUEL I, JUMBO R. B (2014): The Effect of Septic Tank Locations on Borehole
Water Quality in Port Harcourt, Nigeria. International Journal of Engineering and Technology,
Volume 4, No 5
[7] HANCHAR D. W (1991): Effects of Septic Tank Effluent on Ground Water Quality in Northern
Williamson County and Southern Davidson County, Tennessee. U. S Geological Survey,
Water-Resources Investigations Report Report 91-4011
[8] Abe, T. (2010). How to be a good Lagosian, Lagos, Nigeria: Taijo Wonukabe Ltd
[9] Lagos State Bureau of Statistics (2013). Retrieved November 18 2015, from
http://www.lagosstate.gov.ng/2013_Digest%20_of_Statistics.pdf.
[10] Microsoft Encarta (2009). Microsoft Corporation 2008
[11] www.google.com.ng (2013)
[12] www.google.com.ng (2015)
[13] Ministry of Physical Planning & Urban Development, Ikeja, Lagos State (2009).
[14] Lagos State Ministry of Physical Planning and Urban development (2010): Current Maps
[15] Nwabor O. F et al (2016). Water and Water borne Diseases: A Review. International Journal
of Tropical Disease and Health, 12(4): 1-14
[16] WHO (2011). Health and Sustainable Development. http://www.who.int/sustainable-
development/housing/strategies/en/

104
APPENDIXES
FIGURE 14. A typical soakaway construction in Lagos
FIGURE 15. A typical Septic tank construction in Lagos

105
FIGURE 16: An exposed Septic tank with rubbles, within the Lagos
Metropolis. Source4
FIGURE 17: A damaged Septic tank that has become a danger
to residents, within the Lagos Metropolis. Source4

106
FIGURE 18: Plans and sections of a typical Septic tank and Soakaway pit in Nigeria
107
9. DEVELOPMENT OF SOCIAL CAPITAL MANAGEMENT APPROACH WITH RESIDENT PARTICIPATION USING IMPROVED RESOURCE GENERATOR METHOD
Hideaki Kurishima1, Akifumi Nakamura 1 and Hidefumi Kurasaka 2 1 Shibaura Institute of Technology, 3-7-3, Toyosu, Koto-ku, Tokyo, 135-8548, Japan. 2 Chiba University, 1-33, Yayoicho, Inage-ku, Chiba-shi, Chiba, 263-8522 Japan.
ABSTRACT. In this research, based on the idea that it is important for urban
sustainability and resilience to pass on healthy underlying stocks to the next
generation, we developed a bottom-up method for managing social capital and
applied it to Yachiyo City, Chiba Prefecture, Japan. The developed method is as
follows. First, we conducted group interviews among residents to extract important
social relationships for the region. Using the results, we created a resource list for
the resource generator and grasped the present state of social capital using this list.
Finally, we implemented workshops for residents to revitalise social capital. The
results are as follows. First, group interviews revealed that expressive resources are
important in addition to instrumental resources. Second, the resource generator
survey extracted weak points of social capital in Yachiyo City. Third, at the
workshops, several specific ideas were proposed by citizens. From the above, the
effectiveness of our method was confirmed.
Keywords: Social capital, Stock management, Resource generator, Resident participation, Workshop
1. INTRODUCTION
It is extremely important to appropriately maintain and manage various underlying stocks at
the community level and hand them over to future generations for a sustainable society [1].
Underlying stocks are human capital, manufactured capital, natural capital, and social capital
[2]. It has been pointed out that these stocks can reduce vulnerability and increase community
resilience [3]. Therefore, grasping and managing these stocks leads to the sustainability and
resilience of cities.
Especially, we are paying attention to social capital among various stocks. In recent years, a
wide variety of disciplines and decision-makers have become more interested in such.
According to Putnam (2000), social capital is defined as ‘social networks and the norms of
reciprocity and trustworthiness that arise from them’ [4]. Social capital has attracted increased
attention because it is expected to improve efficiency in society, have a positive effect on the
decrease in regional unemployment rates, and enhance the health and safety of residents.
Moreover, it is pointed out that social capital is useful at the time of disasters and recovery,
and for social relational approach to natural resource governance [5, 6]. In other words, the
effects generated by ‘norms of social network and interdependence’ are expected in many
fields. These effects should lead to regional sustainability and resilience as well as an increase
in people’s happiness level.

108
Nonetheless, there are some challenges to conceptualization and operationalization of social
capital [7]. The first challenge is defining social capital. Definitions of social capital and its
expected utility are various, and when such definitions are not explicit, it is unclear what to
manage. The second challenge is quantitative and qualitative understanding of social capital.
There is great variability among measurement methods, effects expected, and scales applied
by researchers in previous studies. In other words, we should develop a bottom-up approach
to measure social capital for management purposes. The third challenge is how to plan for
management of social capital in actual circumstances. Building and maintaining of networks
for cooperative relationship or reciprocity depends on the practice of residents in particular
communities. To some extent, human capital, manufactured capital and natural capital can
estimate the future state using statistical data with a forecasting approach. But, without
resident participation on research, it is difficult to grasp the present and future state of social
capital.
Based on the above, the purpose of this study is to develop an approach to measure and
manage social capital. If this purpose is achieved, it will be possible to identify vulnerabilities
and strengths of social capital, and to reduce its vulnerabilities and utilize its strengths in actual
communities.
2. METHODOLOGY
2.1 Resource generator
First, in this study, we defined social capital as ‘the social relations (networks) and their
benefits’. Next, we reviewed various methods to measure social capital, ultimately adopting
the resource generator method. In this methodology, interviewees were asked about the
existence of acquaintances from whom they could obtain cooperation; descriptions of the
relationships were also explored [8–10]. We presented 30 items (resources) that require
cooperation from others. For example, we asked, ‘Do you have any acquaintances whom you
can ask to take care of your parents or children?’ If a person answered yes, then the person
was judged as having access to a resource. However, we thought previous studies using this
methodology has a problem. In previous research, researchers created a list of resource items
(hereinafter, a ‘resource list’), but these resources may not be important for residents.
2.2 Social capital management
We considered performing a following procedure. First, we conducted group interviews with
residents about resources from social relations required in the future. Next, based on the
results, we created a resource list for the resource generator. This method can creates a list
of resources more important to residents than to create them by researchers only. Moreover,
we disseminated a survey questionnaire with the resource list to grasp the current state of
social capital. Finally, we held citizens' workshop regarding ways to create networks among
people with little social capital with this survey results. This method can be expected to reduce
the vulnerability of social capital.
We applied this approach to measure and manage social capital in Yachiyo City, Chiba
Prefecture, Japan. This city is a dormitory suburb of the Tokyo metropolitan area, located
about 30 km from Tokyo station.

109
3. RESULTS
3.1 Group interviews
We conducted group interviews on August 2015 with 20 participants (residents) selected from
a larger number of applicants. Those selected were placed into four groups of five people who
were diverse in terms of generation and gender. The discussion theme was ‘What resources
(social relationships) do you think you will need in the future?’ Because it is difficult to estimate
the social capital with the forecasting approach, we adopted a backcasting approach regarding
social relations that participants considered necessary (retrospectively) for setting future goals
and conducting management. We identified 162 resources from these group interviews and
divided them into ‘instrumental’ and ‘expressive’ resources (Table 1) [11, 12].
Instrumental resources, adopted mainly in previous research studies, included the provision
of information and products, the introduction of people and work, and physical and financial
support. Examples from the interviews are as follows: ‘ask to take care (temporarily) of own
parents or children’, ‘ask someone to drive to destination (hospital, station, etc.)’, and ‘ask
someone to offer support when one is sick or has a disability’. Meanwhile, in the groups
interviewed, participants suggested many expressive (emotional) resources, such as mental
support, acceptance from others, and stimulation for personal growth. Examples include ‘to
listen to one’s problems and complaints’, ‘to give motivation and enthusiasm’, and ‘to be
accepted’. Technology, services, and goods can replace instrumental resources. However, it
is difficult to obtain expressive resources from outside one’s social network. In other words,
expressive resources will be important in the future in Japan.
3.2 Resource list
We created a resource list of 30 items based on the results of group interviews (Table 2). Of
these items, 13 are common with our previous studies [8]. Many of the newly added ones are
expressive resources.
TABLE 2a. Resource list based on group interview (NO.1-10)
NO Resources
1 … can show you nice restaurants
2 … you can rely on when problems occur with your PC and smartphones
3 … you can you can exchange hobby information
4 … you can ask to do shopping when you are sick
5 … can drive you to your destination when you can’t drive yourself (e.g. when you don’t have a license)
6 … you each know of the other’s family composition
TABLE 1. Instrumental and expressive resources
Type Instrumental resource Expressive resource
For example physical and financial support, information and product provision, introduction of people and work
mental support, empathy, acceptance, companionship, encouragement for personal growth

110
7 … you can tell each other’s present situation
8 … you can share information about evacuation area in times of disaster and safety confirmation method
9 … you can make a simple request such as watering when you go away for a long time (travel etc.)
10 … you can ask for sending supplies required at the time of disaster
TABLE 2b. Resource list based on group interview (NO. 11-30)
NO Resources
11 … do a local activities (local festivals, volunteers, etc.) with you
12 … you can enjoy hobbies with and exercise together
13 … always care about you and your family
14 … you can talk to about local history, environments and nature
15 … have values and experience different from your own
16 … you can share items (vegetables, souvenirs, etc.) each other
17 … gives you items that are no longer used (children's clothes, electrical appliances, etc.)
18 … can lend you small amounts of money in times of need
19 … you can ask to be your guarantor
20 … can mediate regarding you and your family’s place of work (including part-time)
21 … you can go out for eating/drinks together
22 … listens to your problems and complaints
23 … you can ask to take care (temporarily) of your parents or children
24 … can provide you with information in relation to hospitals, care facilities, support systems
25 … you can ask for physical support (care etc.)when you are sick or have a disability
26 … can translate or interpret English
27 … can give you advice on financial matters (insurance, investment and loans etc.)
28 … accepts you just as you are
29 … you can easily ask anything
30 … you can improve through friendly competition
3.3 Survey questionnaire using the resource generator
We conducted a survey in January 2016 with this resource list to grasp the status of social
capital. We mailed a questionnaire to 3,003 people who were extracted by stratified random
sampling, and 907 responses were sent back for a response rate of 30.2% (Table 3).
TABLE 3. Profiles of respondents
Attribute Respondents %
Gender Males 396 43.7
Females 499 55.0
Generation 20’s 104 11.5
30’s 125 13.8
40’s 167 18.4
50’s 129 14.2
60’s 174 19.2
70’s and over 198 21.8
Housing Detached 593 65.4

111
Flat (ownership) 130 14.3
Flat (rental) 164 18.1
Household Single 57 6.3
Two 304 33.5
Three and over 494 54.5
TABLE 4. Accessibility rate of each resources (acquisition source)
NO. Total
The acquaintance's place of residence
living together neighborhood local
community in the city out of the city
1 90.8 62.3 43.8 40.2 43.4 58.3
2 85.1 58.9 16.0 16.9 20.8 46.0
3 86.1 41.7 29.0 30.3 34.1 58.0
4 89.3 78.1 24.5 15.2 14.6 19.7
5 91.6 60.1 54.7 39.4 38.8 62.7
6 86.3 66.6 26.6 20.3 20.2 27.9
7 91.4 59.1 34.1 30.2 32.4 64.9
8 81.3 67.9 25.1 13.6 10.8 18.5
9 73.2 52.5 35.4 10.3 8.7 11.6
10 83.5 31.8 17.0 16.0 19.1 67.5
11 55.7 31.1 29.1 20.7 11.2 7.3
12 78.7 43.1 23.4 23.0 25.6 39.5
13 89.2 57.4 31.4 21.6 21.7 51.8
14 69.6 48.5 29.3 21.3 16.9 18.4
15 78.9 37.5 21.8 22.4 27.7 54.7
16 84.8 31.4 55.7 30.0 26.7 39.4
17 55.0 16.3 19.3 17.1 16.0 32.9
18 63.3 42.1 8.4 7.4 10.9 35.0
19 65.7 39.7 6.6 5.7 9.9 37.4
20 41.3 16.9 7.5 8.4 9.5 26.0
21 51.5 31.4 6.2 6.6 8.8 29.2
22 89.4 63.2 26.7 27.1 31.5 61.4
23 76.7 50.7 19.1 11.8 13.9 32.7

112
24 80.5 39.1 38.0 30.8 31.5 33.4
25 79.3 65.2 11.1 8.3 11.0 28.3
26 35.6 13.6 3.7 3.3 4.4 20.0
27 66.8 29.7 16.8 15.9 18.0 37.7
28 63.0 28.1 11.2 12.1 16.8 39.5
29 91.0 59.5 27.3 31.6 39.7 65.2
30 87.8 65.0 18.7 21.2 26.7 55.2
Table 4 shows the results regarding the accessibility of each resource. The accessibility rate
of each resource was generally high. The resources having less than 70% accessibility were
numbers 11, 14, 17, 18, 19, 20, 21, 26, 27, and 28. These resources are money-related or
highly specialised resources. Moreover, many resources are acquired from families living
together.
The analysis of gender and generation showed that females had a greater accessibility rate
to each resources than males (Table 5). One reason for this situation is that women are
typically more engaged in social relations within a region than men because of child rearing.
However, findings of this survey revealed that the average number of acquaintances was
larger for men than for women. Many men are acquainted with business contacts, but they
indicated that it is
TABLE 5. Accessibility rate of each resources (gender and generation)
NO.
Males Females
20’s 30’s 40’s 50’s 60’s 70’s 20’s 30’s 40’s 50’s 60’s 70’s
1 90.0 84.1 93.7 84.4 88.1 78.8 95.3 98.8 95.5 95.2 94.4 89.1
2 85.0 77.3 92.4 77.8 81.0 66.3 96.9 96.3 93.2 91.7 91.1 72.8
3 95.0 86.4 84.8 73.3 81.0 75.0 95.3 97.5 89.8 92.9 87.8 78.3
4 87.5 90.9 89.9 84.4 85.7 76.9 89.1 95.1 95.5 95.2 91.1 90.2
5 87.5 90.9 92.4 88.9 88.1 80.8 96.9 96.3 96.6 97.6 94.4 92.4
6 85.0 86.4 89.9 75.6 82.1 67.3 95.3 92.6 92.0 94.0 91.1 85.9
7 90.0 90.9 94.9 91.1 84.5 77.9 100.0 96.3 95.5 97.6 94.4 87.0
8 67.5 88.6 81.0 71.1 82.1 72.1 84.4 85.2 85.2 86.9 83.3 81.5
9 65.0 61.4 63.3 62.2 70.2 71.2 70.3 76.5 79.5 83.3 83.3 72.8
10 75.0 81.8 84.8 84.4 77.4 74.0 84.4 88.9 93.2 92.9 87.8 77.2
11 42.5 45.5 54.4 42.2 53.6 56.7 59.4 58.0 64.8 63.1 54.4 57.6

113
12 85.0 75.0 75.9 68.9 70.2 71.2 92.2 86.4 79.5 83.3 82.2 77.2
13 62.5 86.4 83.5 86.7 85.7 84.6 92.2 93.8 96.6 94.0 95.6 93.5
14 47.5 65.9 59.5 68.9 70.2 72.1 59.4 67.9 76.1 78.6 80.0 71.7
15 77.5 81.8 82.3 71.1 65.5 62.5 89.1 87.7 90.9 88.1 83.3 71.7
16 60.0 79.5 82.3 73.3 73.8 79.8 79.7 96.3 93.2 95.2 93.3 89.1
17 55.0 61.4 62.0 35.6 42.9 38.5 57.8 82.7 76.1 66.7 46.7 40.2
18 72.5 63.6 65.8 60.0 57.1 38.5 82.8 76.5 71.6 70.2 65.6 51.1
19 60.0 63.6 69.6 62.2 60.7 47.1 70.3 76.5 69.3 77.4 67.8 65.2
20 50.0 29.5 43.0 44.4 33.3 31.7 57.8 50.6 46.6 59.5 34.4 23.9
21 57.5 47.7 58.2 44.4 41.7 28.8 75.0 67.9 58.0 64.3 52.2 35.9
22 90.0 81.8 93.7 86.7 77.4 75.0 96.9 98.8 97.7 95.2 96.7 83.7
23 52.5 70.5 73.4 71.1 73.8 73.1 67.2 88.9 86.4 89.3 80.0 72.8
24 67.5 70.5 82.3 77.8 75.0 73.1 73.4 88.9 92.0 90.5 86.7 76.1
25 75.0 77.3 78.5 73.3 72.6 68.3 79.7 86.4 86.4 88.1 82.2 79.3
26 32.5 36.4 32.9 37.8 27.4 23.1 48.4 45.7 42.0 42.9 32.2 34.8
27 67.5 65.9 67.1 66.7 42.9 46.2 87.5 81.5 77.3 82.1 68.9 59.8
28 62.5 61.4 63.3 51.1 53.6 48.1 82.8 77.8 75.0 71.4 61.1 50.0
29 92.5 88.6 94.9 82.2 85.7 76.9 100.0 98.8 96.6 97.6 92.2 85.9
30 82.5 86.4 88.6 82.2 75.0 75.0 96.9 96.3 96.6 96.4 92.2 83.7
Result of Chi-squared test; Significant high and low at < 5%
difficult to receive private assistance from such acquaintances. Elderly people aged 70 years
or above had the lowest accessibility rate to a significant degree because support from families
living together decreases with the independence of children and death of a spouse;
association with acquaintances who live far away also decreases for health reasons.
Figure 1 shows the average number of accessible resources, for which there were also gender
and generational differences. We analysed the average number of accessible resources in
terms of number of people per household and found that single-person households had an
average number of 18.8 accessible resources, which was significantly lower than the 23.3
figure for two-person households and 23.7 for households with three or more people. This
finding corresponds to the fact that many resources are acquired from families living together.
In other words, if an individual becomes a single-person household for some reason, his/her
social capital may suddenly become vulnerable even if he/she could access many resources
before then. Moreover, in Yachiyo City, there are many people living in rental flats with a

114
significantly lower average number of accessible resources compared with people living in
detached houses.
First, the average household size of a rental flat is smaller than that of a detached house.
Generally, in rental flats, the connection between residents is thin, according to a previous
study, which may have influenced this result.
These results showed the current situation against the goal set for 2040 regarding resource
lists. That is, it demonstrated that ‘male’, ‘elderly’, ‘public flat’, and ‘single-person household’
are important keywords in the management of social relationship capital in Yachiyo City.
3.4 Citizens’ workshop
Based on the gap between the ideal and reality and the keywords elucidated via the survey,
we conducted workshops for citizens to discuss ways to activate social capital. The workshops
were conducted twice for middle and high school students (‘future workshop’) and
stakeholders (‘stakeholders’ meeting’).
The ‘future workshop’ was held in November 2016, and 20 junior and senior high and high
school students participated. In this workshop, children, as future mayors in 2040, used results
of our survey for their discussions. We explained that ‘males have less social capital than
females’, ‘the elderly have less social capital than other generations’, ‘social capital per person
may decline because the elderly population will expand in 2040’, and ‘people living in flats
have less social capital’. In response, the students proposed ‘holding resident-participating
events in the housing estate’, ‘setting move-in conditions for a housing estate to let a wide
range of generations live there’, ‘establishing the father’s network for child raising’, ‘preparing
a meeting place for the elderly and adults’, ‘encouraging the elderly to share houses’, and
‘building a facility where the elderly take care of kids’.
At the stakeholders’ meeting in July 2017, 19 people participated. Participants included
representatives of local administrative officials, NPOs, community associations, regional
industrial organisations, and citizens selected from among applicants. In this meeting, we also
explained the results of the resource generator, as was the case with the future workshop.
FIGURE 1. Average number of accessible resources
22.6
20.9
24.1
20.1
23.3 22.5
20.4
18.8
23.3 23.7
15.0
20.0
25.0
30.0
Yac
hiy
o c
ity
mal
e
fem
ale
70
's a
nd o
lder
Det
ached
flat(
ow
ners
hip
)
flat(
renta
l)
sing
le
two
thre
e and
over
Gender Age Housing household

115
This meeting featured discussions on how to activate social networks for males, the elderly,
flats, and single-person households. In response, the participants proposed ‘use vacant
houses as share house of various generations', 'create a regional cafeteria where diverse
people can interact and hold a lunch party that single-person households and foreigners can
participate once or twice a month' and 'build facilities that local people can learn and
exchanges'. These ideas are similar to the idea of 'Mehrgenerationenhaus' (multi-generation
house) in Germany. Besides that, ideas such as 'operate a fixed community bus to promote
people's exchanges', 'built a nursery school complex with an elderly facilitiy' and 'allow health
consultation at convenience stores' were provided.
4. CONCLUSION
In this research, based on the idea that it is important for urban sustainability and resilience to
pass on healthy underlying stocks to the next generation, we developed a bottom-up method
for managing social capital and applied it to Yachiyo City, Chiba Prefecture, Japan. The
developed method is as follows. First, we conducted group interviews among residents to
extract important social relationships for the region. Using the results, we created a resource
list for the resource generator and grasped the present state of social capital using this list.
Finally, we implemented workshops for residents to revitalise social capital.
The results are as follows. First, group interviews revealed that expressive resources are
important in addition to instrumental resources. Second, the resource generator survey
extracted weak points of social capital in Yachiyo City. Third, at the workshops, several
specific ideas were proposed by citizens. From the above, the effectiveness of our method
was confirmed.
One of problems is the representativeness of participants of group interviews and workshops.
As a method for solving this problem, interviews and workshops should be conducted multiple
times. Moreover, group interviews and workshops are greatly affected by the abilities of
participants and facilitators. For example, in a workshop conducted for this study, the facilitator
could not delve into some ideas sufficiently. There are still many problems regarding how to
proceed with the workshop, so we need to improve the facilitation method. In the future, we
would like to employ this method in another region to implement improvements.
ACKNOWLEDGEMENTS
The project obtained funding from the Japan Science and Technology Agency (JST) and the
Research Institute of Science and Technology for Society (RISTEX) in 2014 under the
‘designing sustainable multi-generational, co-creational society’ research and development
area.
REFERENCES
[1] Kurasaka, H. et al., Discussion: Special issue 2 / Workshop on the Local Sustainability
Management Focusing on the Four Capital Stocks, Journal on public affairs, JAPAN, 12-1,
pp.76-90 (2016).
[2] Ekins P., A four-capital model of wealth creation. In Real-Life Economics: Understanding
Wealth Creation, in Real life economics: understanding wealth creation, Routledge, London,
pp.147-155 (1992).
[3] Mayunga J. S., Understanding and applying the concept of community disaster resilience: A
capital-based approach, the summer academy for social vulnerability and resilience building,
pp.1-16 (2007).
116
[4] Putnam, R. D., Bowling Alone: The Collapse and Revival of American Community, Simon &
Schuster, New York, (2000).
[5] Aldrich, D. P., Building Resilience: Social Capital in Post-Disaster Recovery, University of
Chicago Press, Chicago, (2015).
[6] Bodin, O., Ramirez-Sanchez, S., Ernstson, H.,and Prell, C., A social relational approach to
natural resource governance, in Social Networks and Natural Resource Management,
Cambridge University Press, Cambridge,(2011), pp.3-28.
[7] Castiglione, D., Van Deth, J.W.,and Wolleb, G.,eds, The Handbook of Social Capital, Oxford
University Press, Oxford, (2008).
[8] Van del Gaag, M. and Snijders, T. A. B., The Resource Generator: social capital. Social
Networks, 27, pp.27-44 (2005).
[9] Webber, M. & Huxley, P., Measuring access to social capital: The validity and reliability of the
Resource Generator-UK and its association with common mental disorder. Social Science &
Medicine, 65, pp.481–492 (2007).
[10] Kurishima, H., Sato, S., Kurasaka, H. and Matsuhashi, K., Correlation Analysis with the
Measurement of the Residents' Social Capital by Resource Generator and the Evaluation of
Community: a Case Study of Ichihara City. Journal of Japan Society of Civil Engineers, Ser. G
(Environmental Research), 71, pp. II_91-II_98 (2015).
[11] Mitchell, J.C., The concept and use of social networks, in Social Networks in Urban
Situations, Manchester University Press, London, (1969), pp.1-50.
[12] Lincoln, J.R., and Miller, J., Work and Friendship Ties in Organizations : A Comparative
Analysis of Relational Networks. Administrative Science Quarterly, 24, pp.181-199 (1979).
117
10. TOWARDS RESILIENT OFFSHORE WIND FARMS
David Wilkie1 and Carmine Galasso 1 1 University College London, Department of Civil Environmental and Geomatic Engineering., Chadwick Building, Gower Street, London, WC1E 6BT
ABSTRACT. This paper proposes using a performance-based engineering (PBE)
approach to quantify the reliability of offshore wind turbines (OWT), for use in a
larger assessment of wind farm resilience. The concept of resilience provides a
useful framework for considering an OWT as a system that is comprised of both
structural and mechanical components and to extrapolate these risks across a farm.
An implementation based on the financial consequence of failure is used here, this
allows failure states to be defined that combine analytical structural failure scenarios
with empirical mechanical equipment failure rates within a unified calculation of
material losses. The loss associated with the failure of each component is used to
estimate the total annual loss for a case study farm. Results are presented in the
form of a case study and indicate that failure of the structure may have an impact
on the overall failure profile of the farm. This method provides a simple estimate of
robustness for the farm, which is a component of any resilience assessment. It also
provides a foundation from which a more detailed assessment of resilience,
including adaptability and recovery, will be developed.
Keywords: Offshore Wind, Structural Reliability, Resilience Framework, Loss Modelling, Site Assessment.
1. INTRODUCTION
The offshore wind industry has grown to the point where it supplies 11.03GW [1] of electricity
within Europe [1], with a further 26.4GW worth of projects approved [2]. Within European
waters most existing OWTs are supported on monopile foundations [3]; these are effectively
large diameter cylinders that are hammered into the seabed; on top of which is fixed a rotor
and tower, a tapered tubular member connecting the monopile to the rotor. However, the
overall cost of offshore wind farms (OWF) remains high and a recent UK government report
[4] has highlighted “integrated design” as an area that could improve cost reduction. This aim
is challenging as OWTs are unique civil engineering structures in that they rely on both
mechanical components (such as a generator, gearbox and control system) and structural
components (the tower and monopile) in order to remain operational. Additionally, structural
design of OWT is undertaken at the component level, with the tower and monopile commonly
being designed by separate companies [5]. Prescriptive codes [6], [7] are used to evaluate
potential designs but these do not explicitly consider (i.e., through a full probabilistic approach
to analysis and design) the risk posed by uncertainties associated with variability in physical
properties nor all of the highly variable natural hazards to which OWF are exposed. Safety
factors are instead used to achieve a target (structural) reliability level at both component and
system level. Any integrated assessment should account for the above uncertainties in an

118
explicit manner, also considering the possible complex interrelations between components;
for example, stopping the rotor will change loading on the blades, which will in turn influence
loads on the tower and monopile. The problem lies in quantifying the risk posed by these
diverse sub-systems and accounting for the impact of failures on the overall operability of the
farm.
The concept of resilience provides a framework to consider this problem. It has been used
within a large number of fields ranging from design to preparedness of communities exposed
to environmental hazards [8] and when applied to structural systems [9] incorporates:
robustness, redundancy, rapidity and resourcefulness. These represent the ability of a
structure to withstand an extreme event and the time required to re-instate operability
afterwards, as indicated on Figure 1. However, the properties are difficult to quantify especially
from the perspective of a design stage study, where information regarding the capacity of an
organisation to make budget available (i.e. resourcefulness) is unlikely to be available to the
design engineer. Therefore, a technique for estimating resilience that only relies on the
robustness and redundancy of the structure would allow the concept to be applied at the
design stage. The initial design estimate of robustness could be used in a later resilience
calculation by the asset operator, which also considers resourcefulness. One approach,
investigated by Bruneau and Reinhorn [10], assumes that loss of functionality after an extreme
event and the time to recovery are correlated. This is intuitive, as in the general case if an
event (i.e. wind storm) causes more damage it will take longer to repair structures as a result.
This assumption provides a starting point for considering resilience of OWF and has previously
been applied to PBE of structures for blast [11] by defining a relative resilience indicator (𝑅𝑅𝐼),
which is correlated to resilience (𝑅):
𝑹(𝑬) ∝ 𝑹𝑹𝑰(𝑬) = 𝟏/𝑪(𝑬) (𝟏)
Where RRI can be defined as the inverse of the consequence (C) of an extreme event (E).
Under this assumption a structure that experiences a lower consequence (i.e. less damage)
as the result of a hazard is viewed as more resilient.
The measure of consequence needs to efficiently capture the impact of failure on the system.
An OWT is a system comprised of structural and mechanical components, therefore some
typical structural consequence measures are not applicable, such as percentage of the
structure collapsing [11]. In this study we relate the consequence of failure to the financial
impact of a system failure and specifically material loss incurred by failure. This allows the
severity of different sub-systems to be compared by using a single measure which is easy to
communicate to different stakeholders but neglects the operational costs of repair, such as
hiring vessels, which are expensive but difficult to quantify. Metrics relating to life safety are
not of primary importance as the wind turbine is normally unmanned, apart from brief periods
for maintenance.

119
FIGURE 1. Graphical definition of resilience after an event (at 𝑡0).
Adapted from: Brunneau et al [8].
A consequence metric based on component material cost requires a probabilistic model
describing the likelihood of incurring these losses. The analytical method we apply to model
combined losses of structural and mechanical components is discussed in Section 2. This
includes a procedure for evaluating failure probability of the structure based on a PBE
technique, which employs dynamic structural analysis. The overall calculation is illustrated
through a case-study where a farm NREL 5MW OWT has been assessed at a real wind farm
site. Section 3 introduces the case study site and describes the structural reliability calculation.
While Section 4 demonstrates the loss calculation for the combined OWT system.
2. LOSS FRAMEWORK
Loss calculation for an OWT system requires both: information concerning costs of failure and
the failure frequencies for all relevant components. In this work we focus on severe failure
associated with major repairs or component replacement, and not on routine maintenance or
loss of production. Failure of the equipment is relatively common and databases of empirical
failure rates exist [12]. However, structural components fail less frequently, and they are
designed specifically for each wind farm [5], therefore a site-specific approach is necessary to
define average failure rates. This section summarises an approach for calculation structural
failures and how these are used in a calculation of system loss.
2.1 Structural Reliability
A framework for calculating the probability of incurring different levels of loss arising from
failure of an OWT structure has been developed previously by the authors [13]. This considers
failure in the turbine’s ultimate limit state, i.e., the turbine locally collapsing during storm
conditions. A brief overview of the background to the approach is presented here, full details
are available in the reference.
The approach is based on PBE which was originally proposed by the Pacific Earthquake
Engineering Research (PEER) centre to assess failure of structures due to seismic hazards
[14], and the approach has subsequently been expanded to consider a range of hazards
including wind [15], [16] and blast [11]. It is based on downgrading risk into conditional
distributions that are evaluated sequentially using total probability theorem. This approach can
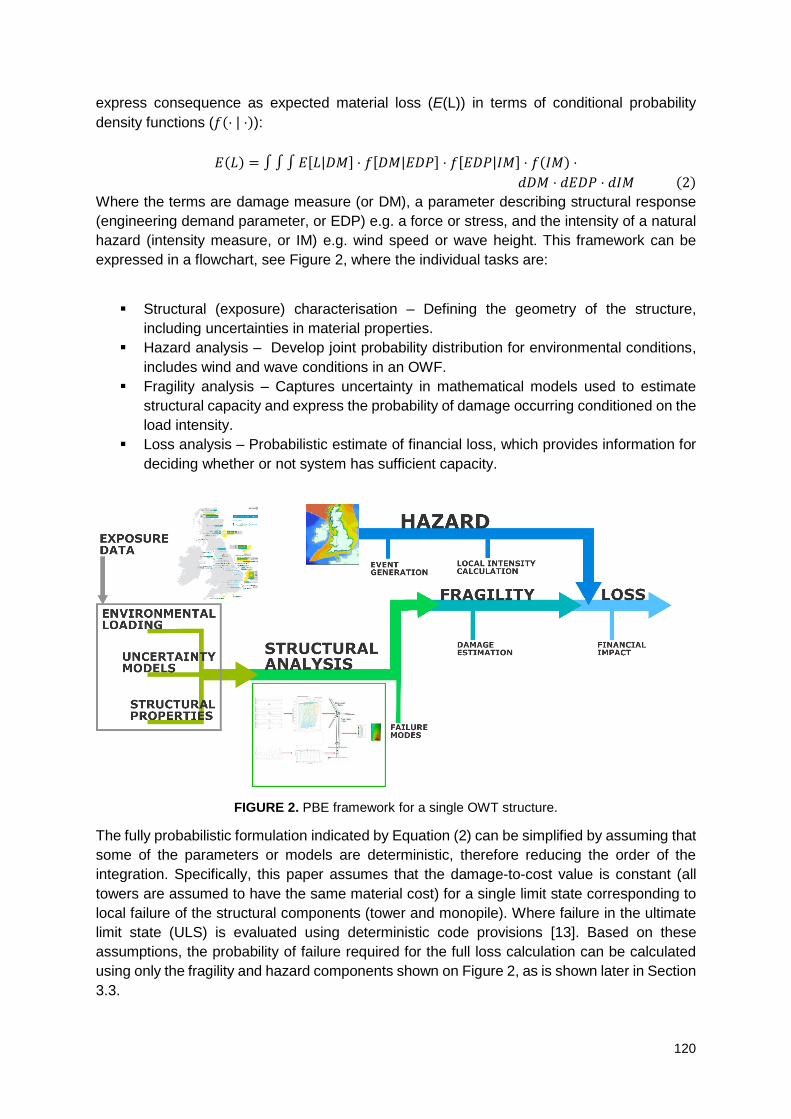
120
express consequence as expected material loss (E(L)) in terms of conditional probability
density functions (𝑓(⋅ | ⋅)):
𝐸(𝐿) = ∫ ∫ ∫ 𝐸[𝐿|𝐷𝑀] ⋅ 𝑓[𝐷𝑀|𝐸𝐷𝑃] ⋅ 𝑓[𝐸𝐷𝑃|𝐼𝑀] ⋅ 𝑓(𝐼𝑀) ⋅
𝑑𝐷𝑀 ⋅ 𝑑𝐸𝐷𝑃 ⋅ 𝑑𝐼𝑀 (2)
Where the terms are damage measure (or DM), a parameter describing structural response
(engineering demand parameter, or EDP) e.g. a force or stress, and the intensity of a natural
hazard (intensity measure, or IM) e.g. wind speed or wave height. This framework can be
expressed in a flowchart, see Figure 2, where the individual tasks are:
Structural (exposure) characterisation – Defining the geometry of the structure,
including uncertainties in material properties.
Hazard analysis – Develop joint probability distribution for environmental conditions,
includes wind and wave conditions in an OWF.
Fragility analysis – Captures uncertainty in mathematical models used to estimate
structural capacity and express the probability of damage occurring conditioned on the
load intensity.
Loss analysis – Probabilistic estimate of financial loss, which provides information for
deciding whether or not system has sufficient capacity.
FIGURE 2. PBE framework for a single OWT structure.
The fully probabilistic formulation indicated by Equation (2) can be simplified by assuming that
some of the parameters or models are deterministic, therefore reducing the order of the
integration. Specifically, this paper assumes that the damage-to-cost value is constant (all
towers are assumed to have the same material cost) for a single limit state corresponding to
local failure of the structural components (tower and monopile). Where failure in the ultimate
limit state (ULS) is evaluated using deterministic code provisions [13]. Based on these
assumptions, the probability of failure required for the full loss calculation can be calculated
using only the fragility and hazard components shown on Figure 2, as is shown later in Section
3.3.

121
2.2 System Failure
The wind turbine is modelled as a system comprised of mechanical and structural
components. In the general case, a system with independent components (N), each of which
has discrete failure states, will have a finite number of system failure conditions, i.e.
combinations of all the component failure states. These combinations can be summarised in
a matrix 𝐾 [17] where each individual component has two states, either: functioning or failure,
where a value of 1 is used to indicate that the component fails and 0 to indicate that the
component remains is operational. The matrix will have entries 𝑘𝑖𝑗 ∈ ℤ𝑁⋅2𝑁; for the 12 OWT
components listed on Table 3, the matrix will have entries 𝑘𝑖𝑗 ∈ ℤ12⋅4096, where the first column
will read [0 0 0 0 0 0 0 0 0 0 0 0]𝑇 indicating the case in which all components are functional,
and the last [1 1 1 1 1 1 1 1 1 1 1 1]𝑇 indicating the case where all components have failed. The
intermediate columns contain all possible permutations of 1s and 0s indicating different partial
failure states.
If each component has a deterministic material replacement cost, the discrete system failure
events can be combined to assess the probability of incurring a repair cost (𝑐𝑟). The matrix of
the failure events 𝐾 is converted into a failure cost matrix 𝐾𝑐 by multiplying each column of 𝐾
by a vector containing the failure cost of each component. This new matrix will contain the
same number of elements as 𝐾 but the values will equal to the failure cost of each component
as opposed to a logical (1 or 0). Then 𝑃𝑠𝑦𝑠(𝑐𝑟) can be defined as the probability that a set of
components fail 𝑘∗ ∈ 𝐾𝑐 whose combined repair cost is equal to the target (𝑐𝑟):
𝑷𝒔𝒚𝒔(𝒄𝒓) = ∑ ∏ 𝑷𝒊𝒌𝒊(𝟏 − 𝑷𝒊)
𝟏−𝒌𝒊
𝑵
𝒊=𝟏𝒌∗∈𝑲𝒄
(𝟑)
𝑃𝑠𝑦𝑠 (𝑐𝑟) is summed over all the columns of the 𝐾 matrix where the total repair cost of the
components equals 𝑐𝑟, i.e. 𝑘∗ is a subset of 𝐾 containing all equal cost vectors of system
status. The probability of each total material cost is the product of the individual component
failure probabilities in the matrix of failure events 𝐾 as this calculation assumes each
component is independent. When 𝑘𝑖 is 0 then the probability that the component survives is
used (1 − 𝑃𝑖)1−𝑘𝑖 and if 𝑘𝑖 is 1 then the probability that the component fails is used 𝑃𝑖𝑘𝑖. The
result is the combined probability that a set of conditions (defined by 𝑘∗) will occur.
3 CASE STUDY EXAMPLE – STRUCTURAL FRAGILTIY
An example is used to illustrate applying the loss calculation framework, described in Section
2, to the site of a real-world offshore wind farm. Here resilience is estimated using
consequence of failure alone, in the form of financial material costs. The procedure described
in Section 2 is implemented in two steps: firstly, fragility curves are defined for a
representative, index turbine and, secondly, the loss calculation is performed, using the
fragility curves combined with empirically derived equipment failure data. This section
describes the fragility calculation for an OWT structural components.
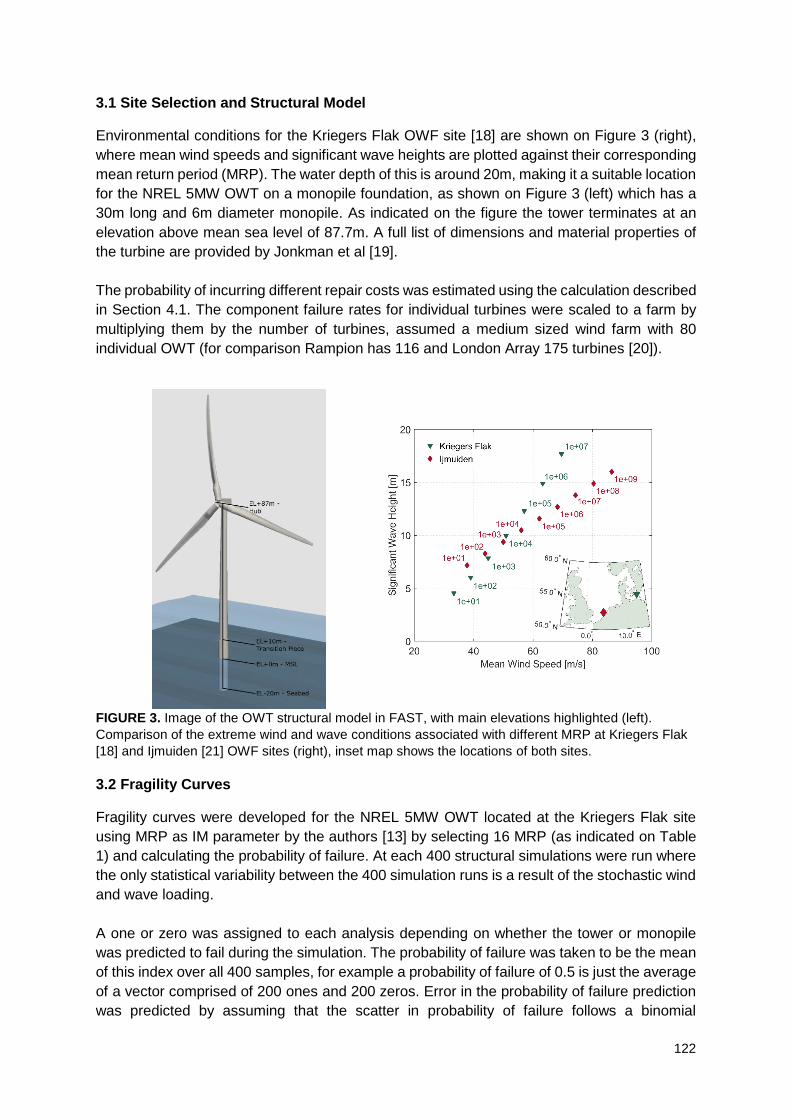
122
3.1 Site Selection and Structural Model
Environmental conditions for the Kriegers Flak OWF site [18] are shown on Figure 3 (right),
where mean wind speeds and significant wave heights are plotted against their corresponding
mean return period (MRP). The water depth of this is around 20m, making it a suitable location
for the NREL 5MW OWT on a monopile foundation, as shown on Figure 3 (left) which has a
30m long and 6m diameter monopile. As indicated on the figure the tower terminates at an
elevation above mean sea level of 87.7m. A full list of dimensions and material properties of
the turbine are provided by Jonkman et al [19].
The probability of incurring different repair costs was estimated using the calculation described
in Section 4.1. The component failure rates for individual turbines were scaled to a farm by
multiplying them by the number of turbines, assumed a medium sized wind farm with 80
individual OWT (for comparison Rampion has 116 and London Array 175 turbines [20]).
FIGURE 3. Image of the OWT structural model in FAST, with main elevations highlighted (left).
Comparison of the extreme wind and wave conditions associated with different MRP at Kriegers Flak
[18] and Ijmuiden [21] OWF sites (right), inset map shows the locations of both sites.
3.2 Fragility Curves
Fragility curves were developed for the NREL 5MW OWT located at the Kriegers Flak site
using MRP as IM parameter by the authors [13] by selecting 16 MRP (as indicated on Table
1) and calculating the probability of failure. At each 400 structural simulations were run where
the only statistical variability between the 400 simulation runs is a result of the stochastic wind
and wave loading.
A one or zero was assigned to each analysis depending on whether the tower or monopile
was predicted to fail during the simulation. The probability of failure was taken to be the mean
of this index over all 400 samples, for example a probability of failure of 0.5 is just the average
of a vector comprised of 200 ones and 200 zeros. Error in the probability of failure prediction
was predicted by assuming that the scatter in probability of failure follows a binomial

123
distribution [22], which is suitable as each analysis is assumed independent, the probability
mass function (PMF) shown in Equation (4):
𝑷(𝒙 = 𝒌) = (𝒏𝒌
) ⋅ 𝒑𝒌 ⋅ (𝟏 − 𝒑)𝒏−𝒌 (𝟒)
Where 𝑛 is the sample size, 𝑝 is the probability of failure calculated by taking the mean of the
indicator variables and 𝑘 is the number of observed failure samples. Based on Equation (4)
the variability in prediction of the probability of failure will hold a maximum value when the
probability of failure is 0.5 and will be 0 when the probability of failure is either 0 or 1, as the
standard deviation will be 0 at these points.
The data on Table 1 was used to fit a fragility curve, which provided a continuous prediction
of probability of failure, by using the maximum likelihood estimation to fit a lognormal
distribution (which has the parameters log mean 𝜇𝐿𝑁 and log standard deviation 𝜎𝐿𝑁). The
mean value of fragility is the probability of failure calculated as described in the previous
paragraphs, and the best fit lognormal distribution is described by the ‘mean’ parameters
shown on Table 2 with the curves defined by these parameters are shown in black on Figure
4 for both structural components. The MRP in Table 1 were scaled by a factor of 100 when
fitting the distribution parameters defined on Table 2 to improve the stability of the fit.
Additional post-processing was conducted to assess the error introduced by using a limited
sample size on the parameters of the lognormal distribution. Monte Carlo simulation was used
to sampling from each normal distribution at the 16 MRP, using the calculated mean and error
as the distribution parameters. The resulting variability in lognormal curves, shown in grey
lines on Figure 4, can be used to estimate the variability in the lognormal distribution
parameters. This means that the fragility curves for the monopile and tower can be defined as
stochastic with both the mean and standard deviation parameters as random variables, as
indicated on Table 2. The normality of the lognormal distribution parameters is confirmed on
Figure 5, where the four random variables are found to be approximately normally distributed
with kurtosis values around 3, per the definition of a normally distribution [23].
TABLE 1. MRP with corresponding probability of failure and standard error for the monopile and
tower.
MRP Pf
Monopile
Pf
Tower
1.00E+02 0 0
3.00E+02 0 0
1.00E+03 0 0
3.00E+03 0 0
1.00E+04 0 0
3.00E+04 0 0.0025
1.00E+05 0 0.0125
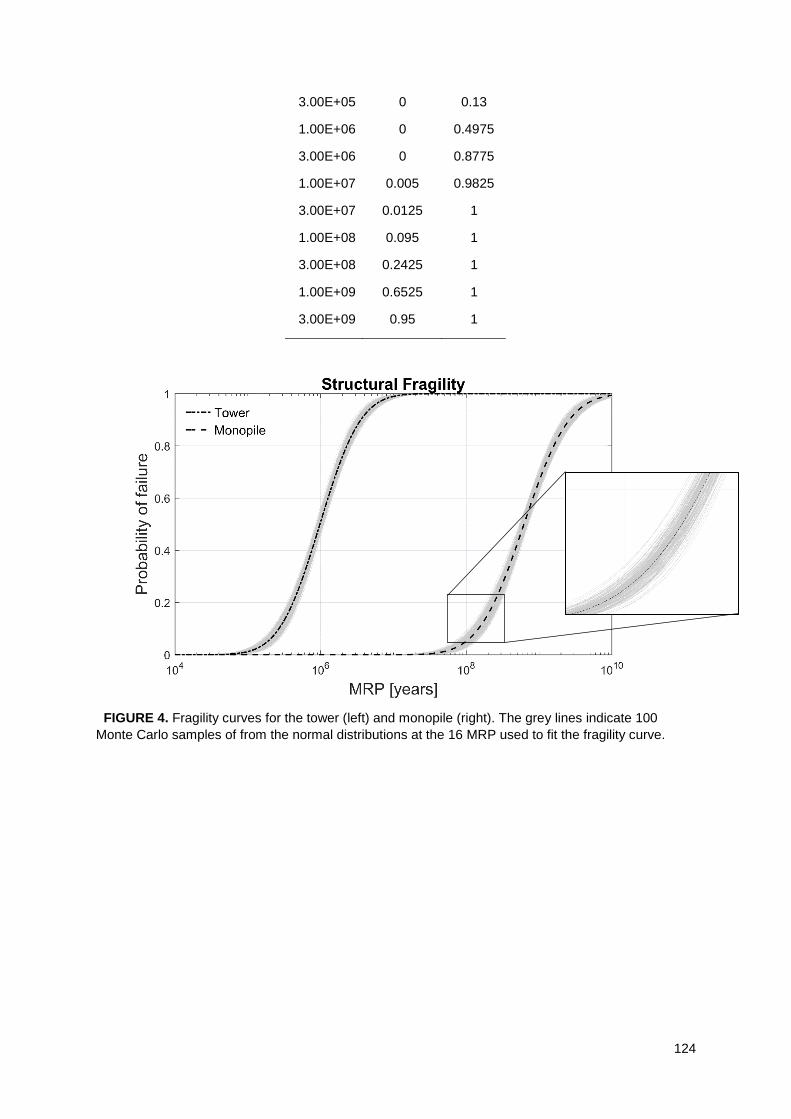
124
3.00E+05 0 0.13
1.00E+06 0 0.4975
3.00E+06 0 0.8775
1.00E+07 0.005 0.9825
3.00E+07 0.0125 1
1.00E+08 0.095 1
3.00E+08 0.2425 1
1.00E+09 0.6525 1
3.00E+09 0.95 1
FIGURE 4. Fragility curves for the tower (left) and monopile (right). The grey lines indicate 100
Monte Carlo samples of from the normal distributions at the 16 MRP used to fit the fragility curve.

125
FIGURE 5. Histograms showing variability in parameters which were used to define the tower
and monopile fragility curve. Based on 1000 samples of each normally distributed MRP Pf. Black
lines are the best fit normal distributions.
TABLE 2. Random variables associated with the fragility curve fit parameters.
Tower Monopile
𝜇𝐿𝑁 Mean 9.1925 15.6401 Standard deviation 0.0456 0.0467
𝜎𝐿𝑁 Mean 1.0078 1.1196 Standard deviation 0.0458 0.0574
3.3 Structural Component Probability of Failure
As discussed previously, fragility curves represent the expected damage to a component given
a level of hazard intensity (𝐼𝑀) and can be expressed as a conditional probability of failure
(𝐺[𝐷𝑀|𝐼𝑀]). However, to combine structural failure with the failure rates of the other OWT
sub-systems, we need to convert the distribution into the yearly probability of failure (𝑃𝑓𝑌𝑟) by
applying the total probability theorem:
𝑃𝑓𝑌𝑟 = ∫ 𝐺[𝐷𝑀|𝐼𝑀] ⋅ 𝑓(𝐼𝑀) ⋅ 𝑑𝐼𝑀 ≈ ∑ 𝐺[𝐷𝑀|𝐼𝑀] ⋅ (
1
𝑀𝑅𝑃𝑖−
1
𝑀𝑅𝑃𝑖+1) ⋅ 𝑑𝐼𝑀 (5)
In previous work [13] fragility curves for the tower and monopile of the NREL 5MW OWT were
calculated at the Krieger’s Flak OWF site, the set used in this work are shown on Figure 4.
These are based on 10-minute length time-history analyses with MRP is used as the IM; which
can be thought of as the inverse of an average rate of exceedance, and therefore the annual
probability of occurrence can be summarised using a Binomial distribution as indicated in
Equation (4). The annual probability of occurrence was calculated using numerical integration
with a step size (𝑑𝐼𝑀) of 20 to solve Equation (5).
The mean yearly probability of failure of an individual turbine monopile using Equation (5) is
assessed to be 1.7e-7 and the tower 1.7e-4, also shown on Table 3, the standard deviation of

126
both is a factor of 5 times smaller than the mean. This indicates the variability in loss due to
statistical uncertainty in the fragility curve is will be small and is therefore neglected in the
following analysis.
3 CASE STUDY EXAMPLE – LOSS
4.1 Structural Failure Cost
The material cost of the two structural components was calculated independently and are
indicated on Table 3, the following paragraph describes the background and assumptions.
Total offshore turbine cost (𝑐𝑊𝑇) in k€, including blades and drivetrain but excluding
foundations, was estimated using an equation derived by fitting a relationship between turbine
costs at seven different power ratings, 2MW through to 5MW, parameterised on the rated
power of the turbine (𝑃𝑊𝑇) in MW [25]. The equation was converted into Euros by Dicorato et
[26]:
𝑐𝑊𝑇 = 2.95 ⋅ 103 ⋅ 𝑙𝑛(𝑃𝑊𝑇) − 375.2 (6)
Analysis by the National Renewable Energy Laboratory (NREL) [27] reported that cost of the
tower of an onshore wind turbine comprised 17.6% of the total turbine cost. We calculate the
tower for an OWT cost assuming that the relative cost of components on an onshore and OWT
remains constant, using 17.6% of the value predicted from Equation (6).
The OWT foundation cost in k€ (𝑐𝐹𝑁) was estimated using a parametric equation [26]:
𝑐𝐹𝑁 = 320 ⋅ 𝑃𝑊𝑇 ⋅ (1 + 0.02(𝐷 − 8)) ⋅ (1 + 8 ⋅ 10−7(ℎ(0.5𝑑)2 − 105)) (7)
Where the cost estimate depends on: 𝐷 the water depth (m), ℎ the hub height above mean
sea level (m) and 𝑑 the rotor diameter (m). The equation originated from a 2003 feasibility
study into OWT, and was validated against actual foundation costs from five real OWF. The
average error was large, at 8.7%, but Equation (7) was found to predict foundation cost better
than two other models derived using fewer parameters [26].
4.2 Equipment Failure Rates and Cost
Failure data for the non-structural components of the OWT were taken from the work of Carroll
et al [12]. They analysed data from maintenance records of ~350 OWT ranging from 2MW to
4MW and presented the results for different sub-systems, details of the portfolio are not clear
as commercial sensitivity means the data was anonymised. Only the failure rates and material
costs relating to the top 10 sub-systems in terms of major replacement cost (out of a total of
19 sub-systems) were used in this work and are shown on Table 3. Additionally, costs were
rounded to the nearest €1000, to improve computational efficiency when evaluating Equation
(3).
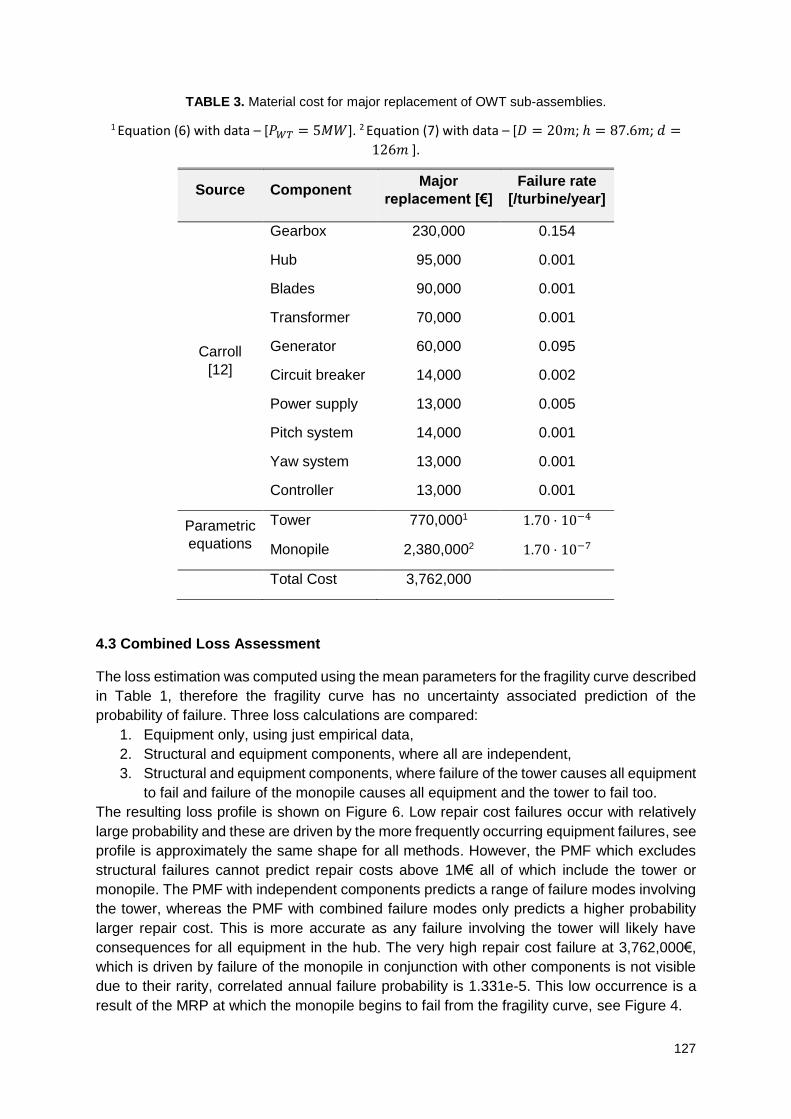
127
TABLE 3. Material cost for major replacement of OWT sub-assemblies.
1 Equation (6) with data – [𝑃𝑊𝑇 = 5𝑀𝑊]. 2 Equation (7) with data – [𝐷 = 20𝑚; ℎ = 87.6𝑚; 𝑑 =
126𝑚 ].
Source Component Major
replacement [€]
Failure rate
[/turbine/year]
Carroll
[12]
Gearbox 230,000 0.154
Hub 95,000 0.001
Blades 90,000 0.001
Transformer 70,000 0.001
Generator 60,000 0.095
Circuit breaker 14,000 0.002
Power supply 13,000 0.005
Pitch system 14,000 0.001
Yaw system 13,000 0.001
Controller 13,000 0.001
Parametric
equations
Tower 770,0001 1.70 ⋅ 10−4
Monopile 2,380,0002 1.70 ⋅ 10−7
Total Cost 3,762,000
4.3 Combined Loss Assessment
The loss estimation was computed using the mean parameters for the fragility curve described
in Table 1, therefore the fragility curve has no uncertainty associated prediction of the
probability of failure. Three loss calculations are compared:
1. Equipment only, using just empirical data,
2. Structural and equipment components, where all are independent,
3. Structural and equipment components, where failure of the tower causes all equipment
to fail and failure of the monopile causes all equipment and the tower to fail too.
The resulting loss profile is shown on Figure 6. Low repair cost failures occur with relatively
large probability and these are driven by the more frequently occurring equipment failures, see
profile is approximately the same shape for all methods. However, the PMF which excludes
structural failures cannot predict repair costs above 1M€ all of which include the tower or
monopile. The PMF with independent components predicts a range of failure modes involving
the tower, whereas the PMF with combined failure modes only predicts a higher probability
larger repair cost. This is more accurate as any failure involving the tower will likely have
consequences for all equipment in the hub. The very high repair cost failure at 3,762,000€,
which is driven by failure of the monopile in conjunction with other components is not visible
due to their rarity, correlated annual failure probability is 1.331e-5. This low occurrence is a
result of the MRP at which the monopile begins to fail from the fragility curve, see Figure 4.

128
FIGURE 6. Loss PMF using three calculated using 3 assumptions: only equipment (thin black line),
equipment and structure where all components are independent (cyan), and equipment and
structure where the failure of the structure results in failure of all other equipment (grey).
4 CONCLUSION
The developing concept of resilience provides an alternative approach, which may allow us to
consider performance of OWF as a whole. This paper proposes a framework for estimating
resilience of OWF by applying the existing framework of PBE. A case study demonstrates how
this calculation may be implemented to estimate potential loss associated with the multiple
sub-systems present on individual turbines at the OWF level.
In this study, structural resilience is simplified to estimation of the consequence of the turbines
failure, which is defined in terms of material cost alone. This allows the idea of resilience to be
applied by practicing engineers who will not have access to data required for a full evaluation
of resilience, including potential recovery phases. As robustness is a component of a full
resilience calculation, the simplified method presented in this paper could be used as an input
to a more comprehensive resilience assessment.
The case study presented included both generation equipment and structural. Although
structural failure was found to be rare it was associated with very high material costs, which
are relevant when considering the overall vulnerability of a wind farm that is comprised of
many individual turbines. Additionally, the structure will be site specific, therefore need to
include details of site loading into risk calculation, fragility will vary between sites [13].
Future steps will involve considering the risk posed to an array or whole OWF in greater detail,
due to correlated hazards i.e. a wind storm effects the whole installation simultaneously. Many
challenges remain to be answered, particularly relating to the choice of performance indicators
[13]. However, if successful, this approach will aid in the development of integrated design
techniques for OWF and therefore works towards meeting the goals set by the UK government
cost reduction framework for offshore wind.
ACKNOWLEDGEMENTS
This work was supported by the UK Engineering and Physical Sciences Research Council (EPSRC), DTP
grant EP/M507970/1 for University College London.

129
REFERENCES
[1] “The European offshore wind industry - key trends and statistics 2015,” 2016. [2] A. Ho and A. Mbistrova, “The European offshore wind industry - key trends and statistics 1st
half 2016,” 2016. [3] “Wind in power - 2015 European statistics,” 2016. [4] P. Arwas and D. Charlesworth, “Offshore wind cost reduction: pathways study,” 2012. [5] J. Van Der Tempel, “Design of support structures for offshore wind turbines,” Technical
University of Delft, 2006. [6] International Electrotechnical Commission, IEC 61400-3. Wind turbines - Part 3: design
requirements for offshore wind turbines. 2009. [7] DNV GL, DNVGL-ST-0126. Support structures for wind turbines. 2016, p. 182. [8] M. Bruneau, M. Eeri, S. E. Chang, M. Eeri, T. Ronald, M. Eeri, G. C. Lee, M. Eeri, T. D. O.
Rourke, M. Eeri, A. M. Reinhorn, M. Eeri, M. Shinozuka, M. Eeri, W. A. Wallace, and D. Von Winterfeldt, “A framework to quantitatively assess and enhance the seismic resilience of communities,” vol. 19, no. 4, pp. 733–752, 2003.
[9] M. Ghosn, M. Asce, L. Due, M. Shah, F. Asce, M. Akiyama, M. Asce, F. Biondini, M. Asce, S. Hernandez, and M. Asce, “Performance indicators for structural systems and infrastructure networks,” vol. 142, no. 9, pp. 1–18, 2016.
[10] M. Bruneau and A. Reinhorn, “Exploring the concept of seismic resilience for acute care facilities,” Earthq. Spectra, vol. 23, no. 1, pp. 41–62, 2007.
[11] S. E. Quiel, S. M. Marjanishvili, and B. P. Katz, “Performance-based framework for quantifying structural resilience to blast-induced damage,” J. Struct. Eng., vol. 142, no. 8, p. C4015004, 2015.
[12] J. Carroll, A. McDonald, and D. McMillan, “Failure rate, repair time and unscheduled O&M cost analysis of offshore wind turbines,” Wind Energy, vol. 19, no. 6, pp. 1107–1119, Jun. 2016.
[13] D. Wilkie and C. Galasso, “Ultimate limit state fragility of offshore wind turbines on monopile foundations,” in Proceedings of the 12th International Conference on Structural Safety and Reliability (ICOSSAR 2017), 2017, pp. 174–184.
[14] K. A. Porter, “An overview of PEER’s performance-based earthquake engineering methodology,” 9th Int. Conf. Appl. Stat. Probab. Civ. Eng., vol. 273, no. 1995, pp. 973–980, 2003.
[15] F. Petrini, “A probabilistic approach to performance-based wind engineering (PBWE),” Università degli Studi di Roma, 2009.
[16] M. Barbato, F. Petrini, V. U. Unnikrishnan, and M. Ciampoli, “Performance-based hurricane engineering (PBHE) framework,” Struct. Saf., vol. 45, pp. 24–35, 2013.
[17] A. F. Mensah and L. Dueñas-Osorio, “A closed-form technique for the reliability and risk assessment of wind turbine systems,” Energies, vol. 5, no. 6, pp. 1734–1750, 2012.
[18] Niras A/S, “Kriegers Flak - metocean report,” 2014. [19] J. Jonkman, S. Butterfield, W. Musial, and G. Scott, “Definition of a 5-MW reference wind
turbine for offshore system development,” 2009. [20] “Offshore Wind Projects Offshore Wind Project Timelines 2015,” 2015. [21] T. Fischer, W. de Vries, and B. Schmidt, “Upwind design basis - WP4,” 2010. [22] I. Iervolino, “Assessing uncertainty in estimation of seismic response for PBEE,” Earthq. Eng.
Struct. Dyn., vol. 46, no. February, pp. 1711–1723, 2017. [23] J. Benjamin and C. Cornell, Probabaility, statistics and decision for civil engineers. New York:
McGraw-Hill, 1970. [24] J. D. Sorensen and H. S. Toft, “Probabilistic design of wind turbines,” Energies, vol. 3, no. 2,
pp. 241–257, 2010. [25] “Study of the costs of offshore wind generation: a report to the renewables advisory board &
DTI,” 2007. [26] M. Dicorato, G. Forte, M. Pisani, and M. Trovato, “Guidelines for assessment of investment
cost for offshore wind generation,” Renew. Energy, vol. 36, no. 8, pp. 2043–2051, 2011. [27] C. Mone and B. Maples, “2013 cost of wind energy review - NREL/TP-5000-63267,” 2015.

130
11. A NEW APPROACH TO PREDICTION OF SATISFACTION: A MEANS TO IMPROVE SUSTAINABILITY AND RESILIENCE OF PUBLIC SERVICES
Radoslaw Kowalski 1 1 University College London, Gower Street, London, United Kingdom
ABSTRACT. Accurate prediction is critical for reliable public services under changing circumstances. Predictive models constitute cornerstone of simulation tools to identify hazards to for service provision and policies which optimize resource allocation. Real-time predictions can also help with early detection of new problems, to respond to problems earlier or solve problems before they emerge. This study addresses shortages in predictive analytical tools by looking at how to quantitatively represent shifts in public satisfaction in near real-time. Determinants of service user satisfaction are extracted and identified from free-text comments about public services and then used for effective prediction. Furthermore, usefulness of signature method for data pre-processing in a context of a multi-variable prediction is explored. Use of signatures can enable prediction from data points with multiple missing values in a reproducible and automated way. Findings indicate that signatures may reduce model training times several times and allow reliable handling of data points with missing values but with some cost to predictive power. Public institutions can make use of signatures for real-time predictive analytics in scenarios of numerous missing data, to enable near real-time analysis of public opinion trends without need for labour-intensive data imputation and pre-processing.
Keywords: Determinants of Satisfaction, Financial Sustainability, Prediction, Signature Method
1. INTRODUCTION
At present, the difficulty of processing and analysing data makes it impossible for public
organisations to reliably use predictions in decision-making [1–4]. Public managers lacking
reliable simulation tools may find it harder to make financially sustainable investments in
services whilst enabling a flexible response to shocks impacting on service provision. Accurate
prediction of future trends may be especially difficult when data used for training the prediction
model is not very abundant and where the prior pattern in the time series has not been smooth.
The data may be ‘rough’ over time. Examples of such rough data paths over time include
patterns in satisfaction ratings from public services by service users. Prediction into the future
from sparse and rough path readings may require pre-processing of predictor data before a
model useful for informing decision-making is computed. At present, the procedure for
preparation of such data often depends on the experience and opinion of the researcher and
may not be reproducible [5]. Development of more automated and hence reproducible
methods for pre-processing of rough and sparse time series data may be advantageous.
Signature method is one potential approach for handling automated pre-processing of rough
time series records [6]. Prior studies have explored the usefulness of signatures for prediction
[6,7] but so far an exploration is missing into whether signatures can also be helpful for multi-
dimensional regressions from sparse data. This study introduces and investigates the

131
usefulness of the signature method for a prediction task, on example of predicting satisfaction
with general practice (GP) medical services funded by National Health Services in England.
Enabling analysis of sparsely provided written feedback to identify key trends in near-real time
would greatly enhance the capability of NHS managers to respond to unexpected issues with
service provision on both national and local level. Accurate prediction of anticipated issues
with service provision would constitute an early signalling mechanism for problems before they
affect the quality of delivered services. Predictive models trained on user feedback may also
serve as simulation tools for identification of optimal policy decisions, as well as hazards which
may disrupt services for end users.
Usefulness of the signature method for prediction of satisfaction with GP services is tested
with Lasso regressions implemented with Python programming language15. Lasso regression
models have been computed in different configurations of independent and dependent
variables. Lasso regressions trained on unprocessed predictor data were compared to the
same model trained on the same data pre-processed into signatures. Outcomes of analysis
indicate that signatures may be used for high-speed computation of effective predictive models
which take into account why service users are satisfied. Moreover, signatures enable use of
incomplete data for model training in a systematic, reproducible manner.
2. LITERATURE REVIEW
Decision-makers in public organisations may decide better when they are informed about likely
consequences of their decisions, and may act quicker to overcome service delivery issues if
necessary insights are available earlier. Hence, prediction of possible consequences of
decisions and early detection are among key analytical priorities of any public organisation [8].
They should be done in anticipation of likely events, such as shifts in intensity of use of
services, as well as to identify risks of rare, highly disruptive events such as extreme weather
[1,8,9,10]. Heeding user feedback is critical for effective predictive analytics. Users of services
to a large extent define the problems which need to be solved and determine relative
importance of specific issues. If public organisations heed end users’ feedback, they can
develop sounder service provision approaches [11–13] and choose more aligned and effective
funding priorities [12,14,15]. For example, public healthcare organisations that pay attention
to patients’ opinions and gain their trust are able to, without significant additional funds,
improve treatment rates for preventable diseases [16-18]. Patients are more likely to report
truthful testimonies of their symptoms to doctors if they trust their healthcare provider [16-18].
Advances in measurement of public opinion are necessary for more accurate prediction of
quality of public services in the future [3,19].
Means of assessing user satisfaction at present are often deficient. Many public organisations
tend to estimate it with proxy values which may be loosely connected to what is supposed to
be measured [20–23]. For example, treatment rates for specific diseases may substitute
citizen opinions as measures of their satisfaction – regardless of the methods employed to
treat patients or their effectiveness [24]. Public organisations tend to use available data to
quantitatively study only the behaviour of service users without trying to simultaneously
15 Lasso regressions have been implemented with Scikit Learn library. More information is at:
http://scikit-learn.org, last visited on 21st Aug. 2017
132
understand the reasons for it [4,19,24,25]. Any such predictions are highly unreliable [9] and
hence it is usually not possible to simulate organisational change while considering all relevant
social interactions and contexts [1–4, 10]. Especially concerning is inability to accurately
predict user experiences of public services on individual level, which is necessary for more
tailored provision of services which takes into account individual circumstances whilst treating
individuals fairly [3,19]. Surveys are a popular quantitative approach to summarising opinions
[26] and serve as a means of addressing the shortcoming of formal performance evaluations.
Surveys help investigate why are users satisfied with public services [26]. At the same time,
surveys are not suitable for near real-time, highly accurate predictions because there are no
financially viable, established methods to use them for continuous measurement of
satisfaction under changing conditions [27–30]. Each time when circumstances of data
collection change, the survey questionnaire needs to be adapted, which makes it difficult to
observe long-term trends. It is also impossible to measure satisfaction continuously in most
instances because the costs of the procedure would be prohibitive. Furthermore, feedback
received through restricted lists of survey questions tends to oversimplify the reasons for user
satisfaction [31,32] and may be biased in not fully predictable ways by survey structure
[26,29,30]. Therefore, both practitioners and scientists encourage introduction of other forms
of data beyond surveys to more effectively gauge the determinants of user satisfaction with
public services [31,33–35]. Griffiths suggests recommender systems are a suitable approach
to model individual differences between service users [2]. However, the approach he
suggested by default relies on behavioural patterns of users to train the model for prediction
[2]. Rationale of service users for specific behaviours should be considered as well as their
behaviour to make more reliable predictions of future behaviour. Another challenge when
designing new measures of opinion about public services is the complexity of data structures
that may be required. A common recommendation for more powerful predictions is to obtain
more high quality datasets which incorporate more variables [1,4,19]. The challenge of the
approach is that obtaining, merging and processing more data necessitates significant
investments [1,4,10,25x]. Significant costs of innovation would inevitably slow down intake
and value-added of new solutions in public institutions. Moreover, it is never certain that some
important variables are unknown or may be unobtainable. In all, new modelling approaches
need to be deployed to deal with currently intractable modelling issues.
Feedback collected from citizens interested in improving public services is a candidate
resource for bringing additional insights for predictive models. Free-text reviews of users offer
more comprehensive insights than user surveys and are cheaper to obtain [26x, 5]. They have
no restrictions on what issues to cover, and feedback can be provided any time. Bates et al
give examples of communities formed on social media to comment about treatment of specific
rare diseases for the purpose of rating healthcare services [26x]. Data from communities
organised around interest in improvement of public services may help support sustainability
and resilience of public organisations [1]. Public availability of feedback used for predictions,
if coupled with easy-to-understand models, enables more direct public influence on how public
resources are allocated [1,3]. Furthermore, analysis of data from communities may support
introduction of shared decision-making with citizens about public services [1,3]. Co-creation
of services tends to significantly improve sustainability and resilience of public services
because those organisations learn and adapt faster this way [1].
One major problem with free-text comments is that service users post their comments
irregularly. Public service providers being assessed may also receive no feedback in some
133
periods. Sparse datasets with such problems may be difficult to trim down and pre-process,
and many instances of interest may end up being excluded [5]. In the case of Miotto et al, for
instance, data sparsity forced the authors to remove 99% of available information. For the 1%
of information they chose to retain on the basis of their experience, they employed dataset-
dependent strategies to fill out missing values [5]. Miotto et al’s data cleaning process is not
fully reproducible and transferable to other contexts despite robust descriptions. Furthermore,
the resulting model may not be useful for predicting future values for data points with
incomplete predictor information. Data sparsity makes quantitative studies harder to
implement and less reproducible. Fortunately, there are opportunities to address the problem
of data pre-processing. One way to cope with data sparsity is to use signature method to
transform variably sparse time series information into signatures of equal length [7,36].
Signatures are obtained by reducing non-linear relationships between data dimensions into
lists of linear relationships [6,7]. A signature of data available for a data point is an infinite
sequence of ordered iterated integrals [36]. For modelling purposes, only first terms of the
sequence up to a selected level of integral iterations are used as features for model training
[36]. Missing values do not disqualify a data point from being processed into signatures as
long as it has a full set of values recorded on each dimension at least two times, both for
independent and dependent variables [7,36]. Moreover, models computed from signature-
processed data may be computed at a relatively lower computational cost and be more
accurate compared to models from the same but unprocessed data [6,7,37]. Thus far,
published examples of use of signatures relate to classification problems [37] or regression
problems with 1-dimensional time series data [7,38]. Relative performance of signature-based
models for predictions using regressions with multi-dimensional predictor space is not certain.
Therefore, a research question of this study is: Does a signature-based prediction have any
advantages over a non-signature-based prediction of satisfaction of users from public
services? Answers to this research question could enable more accurate predictions of
satisfaction, which may be helpful for increasing long-term sustainability and resilience of
public sector service providers. Moreover, it would also showcase how subjective user
narratives can be consistently included in quantitative simulations of organisational change,
also in near real-time.
3. METHODS
Usefulness of the signature method for prediction is tested with anonymous reviews of GP
health services funded by National Health Service (NHS) in England16. The dataset used for
prediction has been generated from 145,000 of GP service reviews posted from May 2013
until January 2017. Each review contained a record of when it was posted, a free-text
comment and Likert-scale star rating responses to 6 statements: 1) “Are you able to get
through to the surgery by telephone?”, 2) Are you able to get an appointment when you want
one?”, 3) “Do the staff treat you with dignity and respect?”, 4) “Does the surgery involve you
in decisions about your care and treatment?”, 5) “How likely are you to recommend this GP
surgery to friends and family if they needed similar care or treatment?”, and 6) “This GP
practice provides accurate and up to date information on services and opening hours”. The
text comments from all reviews contain narratives accompanying the choice of Likert-scale
16 The reviews are collected and managed by NHS Choices. More information is at: http://www.nhs.uk/aboutNHSChoices, viewed on 11th September 2017
134
responses. They were analysed with LDA topic model17 [39] to generate 57 topics. The
resulting topics represent key themes present in the reviews which were then clustered with a
community detection algorithm to produce a cluster of positively-associated topics such as
“great doctors” and “professional”, a cluster of negative topics such as “long waits” and “bad
facilities” as well as a cluster which grouped neutral topics18. Information on proportional
presence of positive and negative topics in each GP review was used in further analysis. The
proportions of positive and negative topics were combined with ID numbers of the Clinical
Commissioning Groups (CCGs) which disbursed funds to the GP services commented on in
each review19. Furthermore, two variables were added to the dataset which could affect
satisfaction with GP services: average level of deprivation of patients registered at the
commented-on GP practices and the number of patients registered at the commented-on GP
practices20. The combined dataset was then transformed into a panel format. The resulting
panel data were organised according to 209 CCGs to which commented-on GP practices
belonged, and each CCG had a path of data (grouped into monthly time stamps) which
included up to 45 recordings. Each recording in the panel dataset was a monthly summary of
feedback about GP practices funded by a given CCG. The recordings contained: average
level of patient deprivation, average size of GP register in commented-on GP practices and a
count of reviews in a given month. 40 CCGs had fewer than 45 recordings due to lack of
reviews in some months and were removed from the dataset. Removal of incomplete data
paths enabled like-for-like comparisons of models trained on signature-processed data and
unprocessed data.
The data paths summarising feedback about GP services sponsored by 169 CCGs were
modelled with Lasso regressions to answer the research question about the relative utility of
the signature method for multi-dimensional prediction. Lasso regressions were used because
they allow for a non-parametric choice of the best model from the available predictor variables.
Each Lasso regression was implemented with a 5-fold cross-validation with the same
randomly selected training and test datasets, and was trained with up to 10,000 iterations. The
number of reviews in each month as well as average monthly levels of deprivation, GP register
size and proportions of negative and positive topics were normalized (on a scale from 0 to 1)
and used as independent variables in predictions. 5-point Likert-scale responses to the 6
above-mentioned survey statements were used as dependent variables. Lasso regression
models were trained for prediction as in this example: To predict month 38 from a 10-month-
long data path of independent variables 2 months in advance, the Lasso regression model
was trained on dependent variable data for month 37 and independent variable data from
months 26-35. Tests of the trained Lasso regression model were carried out using predictor
data for months from 27 to 36 to predict for satisfaction in month 38. The same set of
17 Further details about the stm software library used in R programming language for implementation of the topic model are available at: https://CRAN.R-project.org/package=stm, viewed on 6th February 2017 18 Topics have been clustered with Gephi, a software package for network modelling. For further information please visit: http://gephi.org, viewed on 27th February 2017 19 Source: http://content.digital.nhs.uk/catalogue/PUB18468, last visited on 1st August 2017 20 Counts of patients registered from each area of England (LSOA, Lower Layer Super Output Area – about 300 households per area) in GP practices in England were merged with data on levels of deprivation at each LSOA. Both datasets contained information for 2015 and were obtained on 1st August 2017. Patient counts per LSOA were obtained from https://data.gov.uk/dataset/numbers-of-patients-registered-at-a-gp-practice-lsoa-level, and data on deprivation per LSOA was obtained from https://www.gov.uk/government/statistics/english-indices-of-deprivation-2015
135
dependent and independent variables was used to make predictions with independent
variables which were either unprocessed or transformed with the signature method. The
signature method was used to compute both signatures or log signatures of predictor path for
the 169 predictor data paths. (Log)signatures are simplified representations of the paths which
contain path properties [36]. They have been computed with esig library, a software package
for python programming language21. esig computes signatures up to a specific degree.
Maximum degree of the signature constrains its length, effectively constraining the level of
detail with which the properties of the path are represented through a (log)signature [36]. The
higher the maximum degree, the longer the (log)signature [36]. For an all-in-one explanation
into how signatures and log signatures are calculated please refer to description by
Reizenstein [40].
The first task was to establish in which cases do Lasso regression models predict satisfaction
most accurately from narratives about public services, without transforming them with the
signature method. Sets of Lasso regressions were trained to obtain mean squared errors
(MSE) of test predictions for all 6 dependent variables in months 41 through 45. The models
were trained to predict up to 15 months ahead with predictor paths of length from 2 to 25. A
combination of predictor path length and number of months ahead with the lowest prediction
test MSE was to be found. Once the best combination has been found, Lasso regressions
were computed with it involving both signature-processed and unprocessed data. MSE
prediction errors for the test months (41 through 45) as well as computation times were
recorded. Lasso regressions involving signature-processed predictor data were carried out
with signatures (from 2 to 4 degrees) and log signatures (also from 2 to 4 degrees). Several
alternative (log)signatures were used to evaluate if longer (log)signature representations of
independent variable data improve test prediction accuracy. The resulting models were then
compared in terms of the computing speed and test prediction MSE.
4. RESULTS
Lasso regressions were computed with unprocessed data to test prediction accuracy for 6
dependent variables in months 41 to 45. Predictor paths from length 2 up to 25 were used to
predict up to 15 months ahead. Table 1 includes average mean squared prediction errors for
each combination of predictor path length and month ahead. Longer paths used for prediction
yielded relatively more accurate Lasso regression models than shorter paths. Shortest-term
(1-2 months ahead) and longest-term predictions (10-15 months) with long predictor paths
were the most accurate. Furthermore, most dimensions in all trained Lasso regression models
had 0 or near 0 coefficients for the majority of independent variables. Of all models, prediction
15 months ahead with a path of 24 months yielded the most accurate model with 0.410 test
MSE error, and prediction 3 months ahead with path of 3 months yielded the least accurate
model with 0.464 test MSE error. The combination of 24-month-long predictor path predicting
15 months ahead was chosen to test the relative utility of pre-processing data into
(log)signatures for prediction.
21 For more information about esig please visit: https://pypi.python.org/pypi/esig, viewed 11th Sept
2017

136
Lasso regressions trained on signature-processed predictor data for months 41 through 45
appear to offer no advantage relative to Lasso regressions trained on unprocessed data (see
Figure 1). On average, Lasso regressions trained on unprocessed data had a 0.41 test MSE
prediction error, and the second best average was obtained from 2-degree signature-based
Lasso regressions with 0.42 average test MSE error. Signature-based and log signature-
based Lasso regressions outperformed Lasso regression on unprocessed data only in case
of prediction of the dependent variables in month 42. Predictions for month 45 stood out as
overall the most difficult to predict, potentially because the data collection of feedback from
this month included only reviews posted up to 12th day of the month (the day when data
scraping was concluded). Overall, prediction accuracies between models were broadly similar
for each of the months.
TABLE 1. Average test mean squared errors with Lasso regression models trained from unprocessed
data
Notes:
• The table reports averages of mean squared errors for test prediction of 6 dependent variables in
months 41, 42, 43, 44 and 45
• Lasso regression models are trained with independent variable data from preceding months, using
predictor data from 2 up to 25 months.
• The models were trained to predict from 1 up to 15 months ahead
• Green shading indicates the test prediction is more than 1 standard deviation more accurate than
average of test predictions reported in the table. Light, medium and heavy red headings indicate,
respectively predictions which are 1, 2 or 3 standard deviations less accurate from average test
prediction. Average test mean squared error was 0.425 with a standard deviation of 0.09.
How many months ahead is the prediction for
1
2
3
4
5
6
7
8
9
10
11
12
13
14
15
N
um
ber
of
month
s w
ith p
redic
tor
data
used f
or
pre
dic
tion
2
3
4
5
6
7
8
9
10
11
12

137
13
14
15
16
17
18
19
20
21
22
23
24
25
Notes:
• The table reports averages of mean squared errors for test prediction of 6 dependent variables in
months 41, 42, 43, 44 and 45
• Seven lasso regressions were trained for prediction with unprocessed data and with the same data
processed into signatures (from 2 to 4 degrees) or log signatures (from 2 to 4 degrees)
• The models were trained to predict 15 months ahead from 24-month-long predictor paths
FIGURE 1: Average MSE test errors for Lasso regressions using variants of independent variable
data
0
0.1
0.2
0.3
0.4
0.5
0.6
0.7
0.8
41 42 43 44 45
test
mea
n s
qu
ared
err
or
Months predicted
Unprocessed sig 2deg sig 3deg sig 4deg logsig 2deg logsig 3deg logsig 4deg
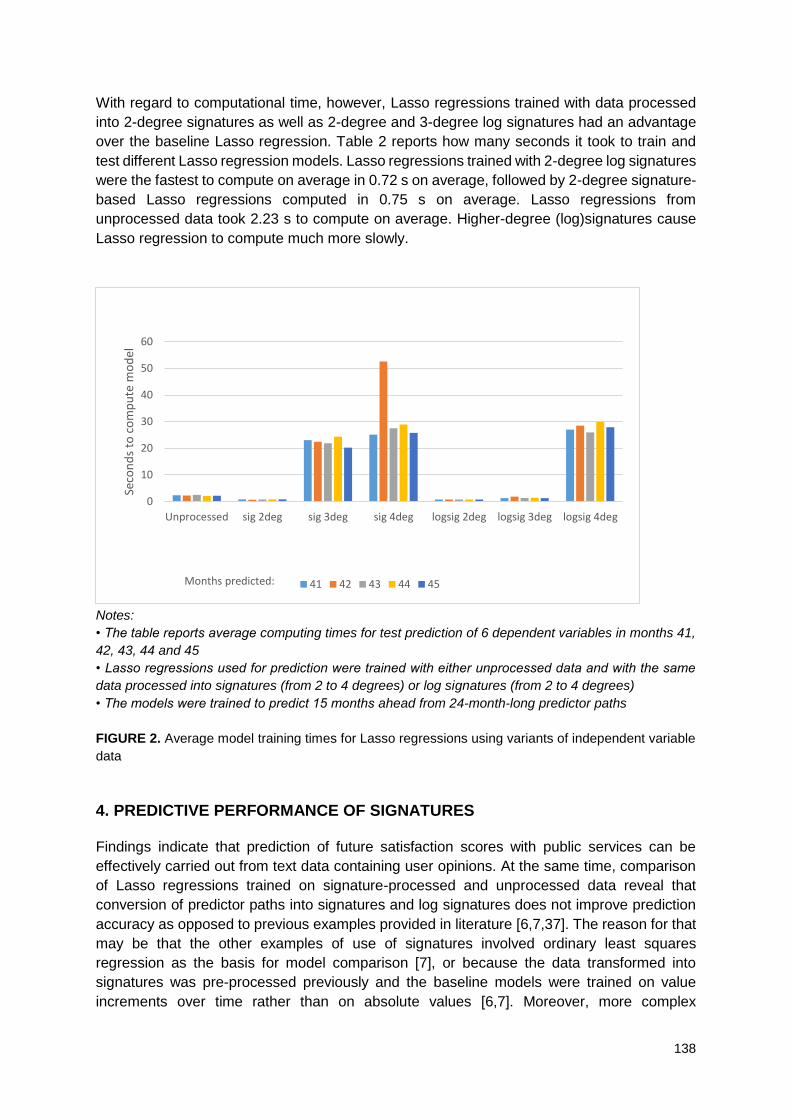
138
With regard to computational time, however, Lasso regressions trained with data processed
into 2-degree signatures as well as 2-degree and 3-degree log signatures had an advantage
over the baseline Lasso regression. Table 2 reports how many seconds it took to train and
test different Lasso regression models. Lasso regressions trained with 2-degree log signatures
were the fastest to compute on average in 0.72 s on average, followed by 2-degree signature-
based Lasso regressions computed in 0.75 s on average. Lasso regressions from
unprocessed data took 2.23 s to compute on average. Higher-degree (log)signatures cause
Lasso regression to compute much more slowly.
Notes:
• The table reports average computing times for test prediction of 6 dependent variables in months 41,
42, 43, 44 and 45
• Lasso regressions used for prediction were trained with either unprocessed data and with the same
data processed into signatures (from 2 to 4 degrees) or log signatures (from 2 to 4 degrees)
• The models were trained to predict 15 months ahead from 24-month-long predictor paths
FIGURE 2. Average model training times for Lasso regressions using variants of independent variable
data
4. PREDICTIVE PERFORMANCE OF SIGNATURES
Findings indicate that prediction of future satisfaction scores with public services can be
effectively carried out from text data containing user opinions. At the same time, comparison
of Lasso regressions trained on signature-processed and unprocessed data reveal that
conversion of predictor paths into signatures and log signatures does not improve prediction
accuracy as opposed to previous examples provided in literature [6,7,37]. The reason for that
may be that the other examples of use of signatures involved ordinary least squares
regression as the basis for model comparison [7], or because the data transformed into
signatures was pre-processed previously and the baseline models were trained on value
increments over time rather than on absolute values [6,7]. Moreover, more complex
0
10
20
30
40
50
60
Unprocessed sig 2deg sig 3deg sig 4deg logsig 2deg logsig 3deg logsig 4deg
Seco
nd
s to
co
mp
ute
mo
del
Months predicted: 41 42 43 44 45

139
representations of the predictor data through higher-degree (log)signatures did not improve
test prediction accuracy over simpler (log)signature-based representation. The reason for lack
of improvement with more complex data representations may be a consequence of small
overall dataset size (169 data paths) and relatively short paths used for model training [7].
In support of using (log)signatures for prediction in the future, computational time of predictive
modelling may be reduced several fold with the help of lower degree (log)signatures. Superior
model performance may be critical in contexts where fast model or efficient model training is
key. Another advantage of processing data into (log)signatures is that prediction quality is still
broadly comparable to that of a model involving unprocessed data whilst at the same time
enabling use of reproducible, more automated means for inclusion of data points with missing
values in model training. Even data points with missing dependent variable values can be
included in the dataset used for modelling if the dependent variable data are turned into
signatures [36]. At the same time, however, addition of data points with missing values may
decrease overall model accuracy. For example, data may be missing non-randomly in a
sparse dataset that contains relatively less information per data point [37]. Therefore, if data
points with missing values are used for modelling, it is advisable to add information on missing
data into the model. For example, an independent variable containing a count of missing
records in a data path turned into signature may improve the accuracy of a regression model.
In consequence of uncertainty with regards to the reasons for missing data, full automation of
data pre-processing with the signature method is not advisable. The limitations of the available
data for predictive modelling should be considered [8] but nonetheless signatures enable more
swift and reproducible means of pre-processing sparse data.
Future work with regards to this study may explore a change of the model used for comparison
between signature-processed and unprocessed data. Lasso regression may be less useful
than elastic net regularization. This is because the best predictions with Lasso regression
tended to handpick a small number of independent variables, hence potentially leading to
overemphasizing the importance of predictor values in specific months in model training.
Furthermore, incorporation of past satisfaction scores into model training may help explore if
the narratives add value in terms of improving prediction accuracy. It would be possible to
answer in more detail when, how and why how narratives used to justify satisfaction with public
services could be included in simulations of effects of organisational change in the future.
5. CONCLUSION
The study has established that measurement of satisfaction with public services with help of
narratives expressed by service users through free-text reviews is technically feasible and
may be useful for boosting sustainability and resilience of public organisations. Quantified user
narratives may help estimate real-time impacts of change on perceptions of service quality,
and may help shed light into evolving expectations of citizens. As a result, decision-makers
may obtain access to a rich information resource which they can use to ensure financially
sustainable service provision amidst changing circumstances, by considering the voice of the
public in the decision-making process. Accurate predictions which take into account the
reasons for satisfaction of service users may also be used in the future to simulate effects of
planned reforms. Candidate reforms with the highest potential for improving the quality of
public services can be identified and compared along measurable criteria. Moreover, it was
found that signature method may be highly useful for training efficient and comprehensive

140
predictive models involving sparse data. The addition of data points may be important
especially when data are likely missing at random in the dataset. Findings from a trained model
predicting only from data points with no missing values may be biased without cases with
incomplete data records.
ACKNOWLEDGEMENTS
Author would like to first thank Alexandru Cioba and David Maxwell for great support in making
the study possible. They made sure the software used for the study worked and helped with
the intricacies of how to use the signature method for prediction. Many thanks also to Jeremy
Reizenstein, Hao Ni and Terry Lyons for invaluable support in guiding the general direction of
the study and help with understanding of the mathematical foundations and context of the
signature method. This study was supported by Alan Turing Institute as part of institute’s
summer internship programme, and by the Economic and Social Research Council.
REFERENCES
[1] D. Majstorovic and M. A. Wimmer, “Future scenarios of ICT solutions for governance and policy modelling,” Proc. 8th Int. Conf. Theory Pract. Electron. Gov., pp. 124–133, (2014).
[2] T. L. Griffiths, “Manifesto for a new (computational) cognitive revolution,” Cognition, pp. 10–12 (2014).
[3] J. C. Bertot, E. Estevez, and T. Janowski, “Digital Public Service Innovation: Framework Proposal,” ICEGOV, vol. 15–16, p. 10 (2016).
[4] P. Gamage, “New development: Leveraging ‘big data’ analytics in the public sector,” Public Money Manag., vol. 36, no. 5, pp. 385–390 (2016).
[5] D. Levin, T. Lyons, and H. Ni, “Learning from the past, predicting the statistics for the future, learning an evolving system,” arXiv (2016).
[6] T. Lyons, H. Ni, and H. Oberhauser, “A Feature Set for Streams and an Application to High-frequency Financial Tick Data,” Proc. 2014 Int. Conf. Big Data Sci. Comput. (2014).
[7] Y. Y. Haimes, Ed., “The Art and Science of Systems and Risk Analysis,” in Risk Modeling, Assessment, and Management, 3rd ed., John Wiley & Sons, Inc. (2015), pp. 3–51.
[8] P. Coletti, “Public policy design: How to learn from failures,” World Polit. Sci., vol. 11, no. 2, pp. 325–345 (2015).
[9] W. Park, “Citizen Participation as a New Mode of Governance for Seoul,” Public Adm. Rev., vol. 75, no. 4 (2015).
[10] I. Beeri and F. Yuval, “New Localism and Neutralizing Local Government : Has Anyone Bothered Asking the Public for Its Opinion ?,” J. Public Adm. Res. Theory, vol. 25, pp. 623–653 (2013).
[11] L. Di Pietro, R. Guglielmetti Mugion, and M. F. Renzi, “An integrated approach between Lean and customer feedback tools: An empirical study in the public sector,” Total Qual. Manag. Bus. Excell., vol. 24, no. 7–8, pp. 899–917 (2013).
[12] B. S. Jimenez, “Raise Taxes, Cut Services, or Lay Off Staff : Citizens in the Fiscal Retrenchment Process,” J. Public Adm. Res. Theory, vol. 24, pp. 923–953 (2013).
[13] Y. Yuk-ping, “Comparing the Attractiveness of Public and Private Shopping Centres in Hong Kong,” , Ph.D. Thesis, University of Hong Kong (2015).
[14] M. Poku, “Campbells Law: implications for health care,” J. Health Serv. Res. Policy, vol. 21, no. 2, pp. 137–139 (2016).
[15] P. R. Brown and M. W. Calnan, “Chains of (dis)trust: exploring the underpinnings of knowledge-sharing and quality care across mental health services,” Sociol. Health Illn., vol. 38, no. 2, pp. 286–305 (2016).
[16] F. Kiernan and D. J. Buggy, “What’s measured matters: measuring performance in anaesthesia,” Br. J. Anaesth., vol. 114, no. 6, pp. 869–871 (2015).
[17] E. R. Brenes, K. Madrigal, and B. Requena, “Corporate governance and family business performance,” J. Bus. Res., vol. 64, pp. 280–285 (2011).
[18] E. Grigoroudis, E. Orfanoudaki, and C. Zopounidis, “Strategic performance measurement in a healthcare organisation: A multiple criteria approach based on balanced scorecard,” Omega,

141
vol. 40, no. 1, pp. 104–119 (2012). [19] A. Gunasekaran and B. Kobu, “Performance measures and metrics in logistics and supply
chain management: a review of recent literature (1995–2004) for research and applications,” Int. J. Prod. Res., vol. 45, no. 12, pp. 2819–2840 (2007).
[20] S. Kelman and J. N. Friedman, “Performance Improvement and Performance Dysfunction: An Empirical Examination of Distortionary Impacts of the Emergency Room Wait-Time Target in the English National Health Service,” J. Public Adm. Res. Theory, vol. 19, pp. 917–946 (2009).
[21] J. Höchtl, P. Parycek, and R. Schöllhammer, “Big data in the policy cycle: Policy decision making in the digital era,” J. Organ. Comput. Electron. Commer., vol. 26, no. 1–2, pp. 147–169 (2016).
[22] K. M. Cresswell, D. W. Bates, and A. Wright, “An Overview of Clinical Informatics,” in Key Advances in Clinical Informatics, Elsevier Inc. (2017), pp. 1–12.
[23] M. Maciejewski, “To do more, better, faster and more cheaply: using big data in public administration,” Int. Rev. Adm. Sci., vol. 83, no. IS, pp. 120–135 (2017).
[24] P. S. Hall and A. Morris, “Predictive Analytics and Population Health,” in Key Advances in Clinical Informatics, Elsevier Inc. (2017), pp. 217–226.
[25] . Y. Laor, D. Parker, and T. Pagé, “Measurement, prediction, and monitoring of odors in the environment: a critical review,” Rev. Chem. Eng., vol. 30, no. 2, pp. 139–166 (2014).
[26] D. W. Bates, K. M. Cresswell, A. Wright, and A. Sheikh, “The Future of Medical Informatics,” in Key Advances in Clinical Informatics, Elsevier Inc. (2017), pp. 293–300.
[27] S. van de Walle and G. G. Van Ryzin, “THE ORDER OF QUESTIONS IN A SURVEY ON CITIZEN SATISFACTION WITH PUBLIC SERVICES : LESSONS FROM A SPLIT-BALLOT EXPERIMENT,” Public Adm., vol. 89, no. 4, pp. 1436–1450 (2011).
[28] M. Madsen, S. Kiuru, M. Castren, and L. Kurland, “The level of evidence for emergency department performacne indicators: systematic review,” Eur. J. Emerg. Med., vol. 22, pp. 298–305 (2015).
[29] T. T. Burton, “Technology: Enabler or inhibitor of improvement?,” Process Excellence Network (2012), available from: http://www.processexcellencenetwork.com [last accessed Feb 2017].
[30] P. Schofield and P. Reeves, “Does the factor theory of satisfaction explain political voting behaviour ?,” Eur. J. Mark., vol. 49, no. 5/6, pp. 968–992 (2015).
[31] N. Gee, “A study of student completion strategies in a Likert-type course evaluation survey,” J. Furth. High. Educ., vol. 41, no. 3, pp. 340–350 (2017).
[32] A. A. Amirkhanyan, H. J. Kim, and K. T. Lambright, “The Performance Puzzle : Understanding the Factors Influencing Alternative Dimensions and Views of Performance,” J. Public Adm. Res. Theory, vol. 24, pp. 1–34 (2013).
[33] M. Mcguire, B. Meuleman, S. Jilke, and S. van de Walle, “We Need to Compare, but How? Measurement Equivalence in Comparative Public Administration,” Public Adm. Rev., vol. 75, no. 1, pp. 36–48 (2014).
[34] A. Brenninkmeijer, “Interfaces: How to Connect Effectively with Citizens,” Public Adm. Rev., vol. 1, pp. 10–11 (2016).
[35] S. Lavertu, “We All Need Help: ‘Big Data’ and the Mismeasure of Public Administration,” Public Adm. Rev., vol. 76, no. 6, pp. 864–872 (2014).
[36] L. B. Andersen, E. Heinesen, and L. H. Pedersen, “Individual Performance : From Common Source Bias to Institutionalized Assessment,” J. Public Adm. Res. Theory, pp. 63–78 (2016).
[37] R. Miotto, L. Li, B. A. Kidd, and J. T. Dudley, “Deep Patient : An Unsupervised Representation to Predict the Future of Patients from the Electronic Health Records,” Nature, no. January, pp. 1–10 (2016).
[38] I. Chevyrev and A. Kormilitzin, “A Primer on the Signature Method in Machine Learning,” arXiv (2016).
[39] A. Kormilitzin, K. E. A. Saunders, P. J. Harrison, J. R. Geddes, and T. Lyons, “Detecting early signs of depressive and manic episodes in patients with bipolar disorder using the signature-based model,” arXiv (2017).
[40] G. Flint, B. Hambly, and T. Lyons, “Discretely sampled signals and the rough Hoff process,” Stoch. Process. their Appl., vol. 126, pp. 2593–2614 (2016).
[41] D. M. Blei, A. Y. Ng, and M. I. Jordan, “Latent Dirichlet Allocation,” J. Mach. Learn. Res., vol. 3, pp. 993–1022 (2003).
[42] J. Reizenstein, “Calculation of Iterate-Integral Signatures and Log Signatures,” (2016), available from: https://www2.warwick.ac.uk/jreizenstein [last accessed Sept 2017].

142

143
12. MICROBIAL FUEL CELLS FOR THE MICRO GENERATION OF ELECTRICITY AND BIOMETHANE FROM ORGANIC WASTE.
Enrique L. Arroyo1, Ilan Adler1, Paul Helier, and L. C. Campos1
1 University College London, Department of Civil Environmental and Geomatic Engineering., Chadwick Building, Gower Street, London, WC1E 6BT
ABSTRACT. Microbial fuel cells (MFCs) can be used to treat contaminated water
and produce a small electric current in the process. Their main advantage against
the traditional waste water treatment (WWT) process, is that they can operate
anaerobically (displacing the need and cost of aeration) and they produce less
sludge per unit of organic waste treated. Anaerobic microorganisms called
methanogens are able to produce methane gas as by-product of their metabolism.
On the other hand, microorganisms called electrogens are able to directly transfer
electrons to the anode of a MFC. Some studies suggest that electrogens and
methanogens develop syntrophic relationships, through direct hydrogen and
electron transfer that benefit both microorganisms. The last suggest that the
anaerobic treatment of organic matter using MFCs could lead to the production of
electricity and higher methane yields. Our research explores the idea of combining
these two technologies for the treatment of organic waste.
Keywords: Cogeneration, methanogens, electrogens, syntrophic relationships.
INTRODUCTION
Microbial fuel cells (MFCs) are extremely simple devices that can recover electricity directly
from the organic matter contained in waste water (WW)1. They consist of an anode and a
cathode, held in a container with or without a membrane separating them. The most popular
materials used for the electrodes are graphite (anode) and steel (cathode), and for the
membrane the most exiting materials being used at the moment are ceramics. There is a vast
amount of energy contained in the organic waste disposed of daily by the domestic, industrial
and agricultural sectors all around the world. At present, waste water treatment (WWT)
facilities are designed in a way such that they demand energy instead of producing it, which
constrains their use. MFCs use the contaminated water as electrolyte to power a small current,
normally in the range of mA. Under laboratory conditions and pilot scale trials, It has been
shown that they can remove up to 90% of the chemical oxygen demand (COD) of domestic
waste water2. Additionally, one of the main costs within the WW treatment process is the
aeration of the WW during the biological treatment phase. MFCs can treat water anaerobically,
reducing the need of the aeration process without prolonging the retention time1. Moreover,
the biomass production yield under anaerobic metabolism is lower than under aerobic
conditions; 0.07 – 0.22g per g COD initial against 0.4 g per g COD initial. Therefore, less
sludge is produced and because of this there is potential to reduce the cost of its disposal1.
Microbial fuel cells (MFCs), as other types of fuel cells (FCs), are electrochemical converters
(also called bioelectrochemical devices BEDs) that release (as an electric current) the energy
that is stored in a fuel molecule. The main difference between MFCs and other types of FC
144
(such as Proton exchange membrane fuel cells PEMFC) is that MFCs use microorganisms
called electrogens, to mediate the transfer of electrons from the organic molecule (fuel) to the
fuel cell anode. MFCs, can accept a wide range of molecules as fuel, which includes organic
substances like carbohydrates, organic acids, lipids, amino acids and molecular hydrogen.
They do not require a purified fuel and can accept a mixture of organic molecules. This
possess has an advantage against PEMFC that require pure hydrogen or methane. At present
the majority (95%) of hydrogen produced globally comes from (unsustainable sources such
as) steam reformation of fossil fuels3,4. BEDs like MFCs and microbial electrolytic cells (MECs)
can recover electricity from organic residues and also produce hydrogen that could be later
used in a PEMFC5–7 to make a transition towards a sustainable source. The main constrain
for the commercial development of MFCs is the low electricity yields that can be recovered
from the organic waste. While PEMFCs can be deployed to generate substantial amounts of
energy, such as that needed to power a car or to provide electricity to a building, MFCs
electricity output is in the range of few watt per square meter of electrode2.
Anaerobic metabolism is less efficient recovering energy than the aerobic one. During
glycolysis only two molecules of Adenosine tri-phosphate (ATP) are formed anaerobically,
while 32 are formed under aerobic conditions. The last has an impact over the (retention) time
used by the microorganisms to consume the organic matter (OM) of the WW within the
biological reactors during the WW treatment process. Aerobic microbes can eat faster but they
also reproduce faster and build up more biomass (sludge). Anaerobic digestion (AD) is limited
to the metabolism of organic waste in much higher concentrations, where the longer retention
time period is compensated by the production of hydrogen and methane. At present within
WWTF, AD is used only at the end of the biological process, to recover energy and fertilizers
from the activated sludge produced. This work explores the idea of integrating the use of MFC
and the anaerobic digestion of organic matter for the parallel production of biogas and
electricity.
AIM AND OBJECTIVES
The aim of our work is to analyse the feasibility of integrating a microbial fuel cell and an
anaerobic digester, trying to predict possible outcomes for the production of biogas and
electricity and finally proposing a design to test the integration of both systems.
METHODOLOGY
Desk based analyses
Biochemical Pathways
A review of the main metabolic pathways for the production of electricity and biogas was
developed in order to identify possible interactions between the different microbial
communities within the AD reactor.
MFC configuration
Different MFCs configurations were reviewed to identify the optimal system set up which will
allow scaling up in the future. Different electrodes materials are compared based on their
efficiency to produce electricity and the cost of their use, with a focus on low cost materials.
Based on the MFCs configuration and materials analysis, a dual AD_MFC system will be
proposed to be tested through laboratory analyses.

145
RESULTS
Metabolic pathways
Living organisms can be classified in autotrophs and heterotrophs, the first ones are able to
store in the form of complex organic molecules the energy obtain from a light source
(photosynthetic) or a chemical source (chemosynthetic). Plants and microalgae are examples
of photosynthetic autotrophs and methanogen microorganisms are an example of
chemosynthetic autotrophs. Heterotrophs on the other hand, are not able to capture energy
and are required to steal the energy stored in organic molecules by autotrophs to power their
own metabolism. The process of capturing energy and storing it in organic molecules is called
synthesis, while the opposite process where the energy from organic molecules is realised, is
called respiration. During the respiration process, hydrogen from organic compounds such as
hydrocarbons, is separated and transported by carrier molecules such as NADH to the cell
membrane. Here the hydrogen’s electron is passed through the electrons transport chain
where is used to move the corresponding proton outside of the membrane in order to create
a proton gradient. These gradient is used to power the production of ATP from inorganic
phosphorus (Pi) and ADP. ATP is the energy currency from the cell and it is used to power
cell reactions which require energy. The driving force that allows the formation of ATP is the
electronegative attraction between the protons and electrons to the final acceptor of electrons.
Aerobic organisms use oxygen as the final electrons acceptor, we combine hydrogen from
food with oxygen and produce water. Anaerobic organisms can use other molecules instead
of oxygen as final acceptor of electrons. Electrogens is the name given to microorganisms that
can use a metal such as iron as a final electrons acceptor. Within a MFC the anode electrode
acts as a final electrons acceptor for electrogenic microorganisms.
Several possible interactions between the microorganisms present in an AD reactor and those
in a MFC have been identified. The AD of organic matter can be separated in four main steps,
hydrolysis, acidogenesis, acetogenesis and methanogenesis. This series of consecutive steps
take place under anaerobic conditions and are the result of the syntrophic relationships
between different types of microbial communities. These microbial communities use the
energy derived from the metabolism of organic matter to cover for their cell energy
requirements. During the first step of AD process organic matter is broken down from large
molecules into smaller molecules (hydrolysis), the next two steps are the formation of organic
acids and finally the formation of acetate. The metabolism of glucose and the metabolism of
fatty acids through beta oxidation leads to the production of the two carbon molecule acetate
and carbon dioxide. These steps are performed by fermentative microorganisms that are able
to convert sugar in acetic acid. A different group of microorganisms called Archaea are
capable of producing methane from the by-products released by the fermentative
microorganisms. Depending on the molecule they use as fuel they can be classified in
aceticlastic, methylotrophic and hydrogenotrophic methanogens. To summarise, organic
matter larger molecules (polymers) are broken down into smaller molecules (monomers) and
metabolised into fermentation products, which are then used by methanogen microbes to
produce methane.
Both methanogens and electrogens can use acetic acid or molecular hydrogen as an energy
source. As shown in Figure 1 both types of microorganisms can use the same raw material to
power their metabolism. This could be interpreted as a possible cause for substrate
competition between electrogens and methanogens8,9.
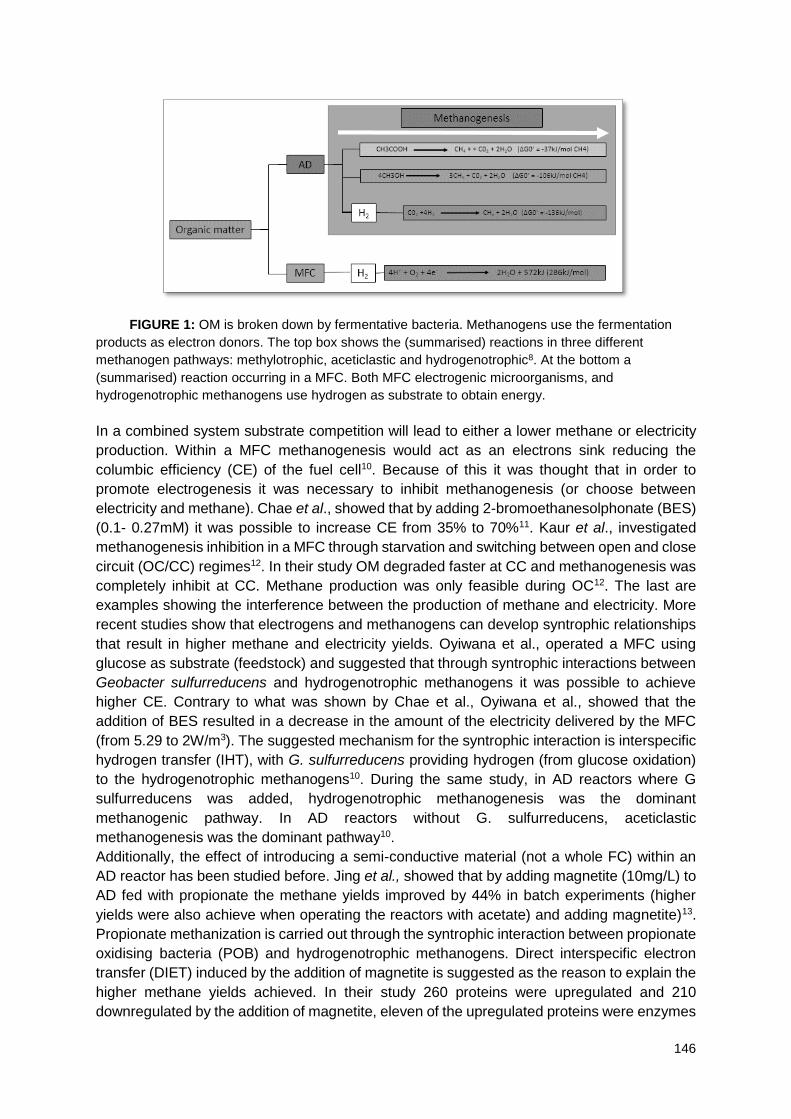
146
FIGURE 1: OM is broken down by fermentative bacteria. Methanogens use the fermentation
products as electron donors. The top box shows the (summarised) reactions in three different
methanogen pathways: methylotrophic, aceticlastic and hydrogenotrophic8. At the bottom a
(summarised) reaction occurring in a MFC. Both MFC electrogenic microorganisms, and
hydrogenotrophic methanogens use hydrogen as substrate to obtain energy.
In a combined system substrate competition will lead to either a lower methane or electricity
production. Within a MFC methanogenesis would act as an electrons sink reducing the
columbic efficiency (CE) of the fuel cell10. Because of this it was thought that in order to
promote electrogenesis it was necessary to inhibit methanogenesis (or choose between
electricity and methane). Chae et al., showed that by adding 2-bromoethanesolphonate (BES)
(0.1- 0.27mM) it was possible to increase CE from 35% to 70%11. Kaur et al., investigated
methanogenesis inhibition in a MFC through starvation and switching between open and close
circuit (OC/CC) regimes12. In their study OM degraded faster at CC and methanogenesis was
completely inhibit at CC. Methane production was only feasible during OC12. The last are
examples showing the interference between the production of methane and electricity. More
recent studies show that electrogens and methanogens can develop syntrophic relationships
that result in higher methane and electricity yields. Oyiwana et al., operated a MFC using
glucose as substrate (feedstock) and suggested that through syntrophic interactions between
Geobacter sulfurreducens and hydrogenotrophic methanogens it was possible to achieve
higher CE. Contrary to what was shown by Chae et al., Oyiwana et al., showed that the
addition of BES resulted in a decrease in the amount of the electricity delivered by the MFC
(from 5.29 to 2W/m3). The suggested mechanism for the syntrophic interaction is interspecific
hydrogen transfer (IHT), with G. sulfurreducens providing hydrogen (from glucose oxidation)
to the hydrogenotrophic methanogens10. During the same study, in AD reactors where G
sulfurreducens was added, hydrogenotrophic methanogenesis was the dominant
methanogenic pathway. In AD reactors without G. sulfurreducens, aceticlastic
methanogenesis was the dominant pathway10.
Additionally, the effect of introducing a semi-conductive material (not a whole FC) within an
AD reactor has been studied before. Jing et al., showed that by adding magnetite (10mg/L) to
AD fed with propionate the methane yields improved by 44% in batch experiments (higher
yields were also achieve when operating the reactors with acetate) and adding magnetite)13.
Propionate methanization is carried out through the syntrophic interaction between propionate
oxidising bacteria (POB) and hydrogenotrophic methanogens. Direct interspecific electron
transfer (DIET) induced by the addition of magnetite is suggested as the reason to explain the
higher methane yields achieved. In their study 260 proteins were upregulated and 210
downregulated by the addition of magnetite, eleven of the upregulated proteins were enzymes

147
related to propionate metabolism. Cytochrome c oxidase from Thauera was suggested as
candidate for DIET for aceticlastic methanogenesis. 43 enzymes involved in methanogenesis
were affected by the addition of magnetite. Due to the presence of upregulated proteins related
to methylenetetrahydromethanopterin (methylene-MPT) originated from Methanospirillum,
Methanosphaerula and Methanobrevibacter, these hydrogenotrophic genus are suggested as
responsible for DIET13. In another study Rotaru et al., proposed Methanosaeta as possible
responsible for DIET9. Both DIET and IHT are present during methanization of propionate.
Propionate oxidation is an endergonic reaction, because of this propionate tends to
accumulate during AD, propionic acid accumulation produces a drop in pH and can lead to
methanogenesis inhibition, therefore, the addition of semi-conductive materials such as
magnetite that facilitate methanization of propionate can contribute to a better operation of AD
reactors. It could be suggested that in a similar way to the addition of magnetite, the integration
of the MFC within an AD reactor could have a relatively similar syntrophic effect by providing
microorganisms with an electrons sink (anode) that can induce the oxidation of propionate,
acetate and hydrogen. Within a MFC the difference in potential between the anode and the
cathode providing the electromotive force to operate the MFC. It could be speculated that
similar to the magnetite study, by introducing iron containing electrodes it would be possible
to induce DIET and facilitate OM degradation, electrogenesis and methanogenesis.
During AD of OM fermentative bacteria produce fermentation products (such as ethanol or
lactic acid) that are later on used by acetogenic microorganisms to produce acetate and
hydrogen, this conversion is not thermodynamically feasible at high hydrogen concentrations
and therefore, acetogenesis is dependent on the hydrogen consumption rates within the
reactor14. Acetogens produce acetate that can be used by aceticlastic methanogens, but,
acetic acid accumulation can lead to low pH and the inhibition of aceticlastic methanogenesis.
Hydrogenotrophic methanogens are also inhibit at low pH. It was shown that electrogens adapt
better to low pH conditions than methanogens. It was suggested that higher methane
production yields (in the AD reactors with electrodes integrated) where due to hydrogen and
acetate consumption by electrogens which lead to an increase in the pH values and
subsequently to the reactivation of methanogens. In the same way as the addition of
magnetite, the presence of the electrodes provides the electrogens with a terminal electrodes
acceptor which allows the oxidation of hydrogen and acetate until the pH values have
increased to allow methanogens activation13,15,16. In the model proposed, acetate using
electrogens transfer electrons from acetate to the anode, this electrons are then used by
hydrogenotrophic methanogens in the cathode to produce methane by reducing carbon
dioxide15. The results presented by Zhang et al., and those presented by Oyiwona et al.,
suggest that electrogenesis and methanogenesis are not mutually exclusive and contradict
the substrate competition hypothesis10,15.
MFC configuration
Among the different configurations analysed to main factors were identified as key to the
integration of MFCs within AD reactors, the use of membranes and the shape of the fuel cell.
Although using a membrane to separate the anode from the cathode yields more electricity17,
it drastically increases the cost of the MFC. At present ceramics seem to be the most
interesting materials to test for a large scale system set up18. With regards to the shape and
design of the MFC, we prefer a tubular shape that could work as a pipe transporting water
while treating it at the same time. The shape chosen has to facilitate the contact between
anode and cathode of adjacent MFCs to connect them in series. At present graphite and steel

148
are the most common electrode materials. The use of ceramics has also been proposed for
the construction of electrodes, mainly based on the use of clays with high iron content such
as terracotta or goethite19. If a large scale AD system is to be integrated with MFCs, the cost
of the materials has to be minimise and their efficiency has to be improved to recover more
energy and facilitate a significant increase on biomethane production. A small increase on
methane production can have a significant economic impact in an AD plant operating with
thousands of tonnes of organic matter per year, therefore it is important to explore the impact
that the use of MFCs could have on biogas production. For this a biomethane potential test
will be develop in parallel with a MFC operation.
FIGURE 2: Schematic representation of the laboratory system proposed for evaluating the integration
of MFCs an AD. AD reactors A) with MFC (left) and B) without MFC (right). The gas produced (1) in
each reactor (500mL) flows up to each of their columns (1L) pushing the red liquid used as indicator
towards the reservoir (2). Anode and cathode are connected with copper wire to a data-logger to
collect the information about voltage and electricity generation.
Figure three shows the potential that the integration of MFCs in WWT facilities can have over
energy flows in the system. The potential of recovering the energy that is contained in the
organic waste produced by a city or by a country is unknown, a study from Saudi Arabia
estimates that this country could inject into the grid 637MWe (by2035) from the
bioelectrochemical treatment of its domestic water20.

149
FIGURE 1: Traditional WWT of organic matter (A) requires energy input to supply oxygen to the
aerobic microorganisms. The proposed arrangement for the treatment of OM, through the
combination of MFCs and AD (B), could be integrated during different stages of the WWT process.
CONCLUSIONS
Our literature review suggest that it might be possible to produce biogas while at the same
time sustain a constant electricity generation through the integration between a MFC and an
AD reactor, without affecting negatively the final biogas production or its composition. Although
some authors have proposed that methane production constrains electricity production, the
opposite has been observed in a few studies using semi conductive materials and
electrochemical devices. Because of this we consider important to further research into a way
to integrate these two waste to energy technologies.
Syntrophic interactions between microorganisms producing electricity and those producing
methane have been suggested by other authors as a possible explanation for the higher
biogas yields in AD reactors operating with a BED integrated or with a semi-conductive
material such as magnetite reported by other authors. Hydrogen and electrons transfer
between species are the possible mechanisms facilitating this interactions, at present it is not
clear how to exploit this in order to achieve higher biomass conversion rates.
The operation of an AD-MFC integrated system could allow the small scale production of
bioelectricity within urban environments where the space is limited. Electricity production for
small appliances would not be depending on the combustion of the biogas. At present the cost
of a generator as well as the presence of hydrogen sulphide in the biogas, limit the small scale
production of energy. It is important to research on alternatives such as MFCs that allow us to
convert organic matter into electricity directly, without the need of a generator.

150
REFERENCES
[1] Logan, B. E. et al. Microbial fuel cells: Methodology and technology. Environ. Sci. Technol. 40, 5181–5192 (2006).
[2] Rahimnejad, M., Adhami, A., Darvari, S., Zirepour, A. & Oh, S.-E. Microbial fuel cell as new technology for bioelectricity generation: A review. Alexandria Eng. J. 54, 745–756 (2015).
[3] Bicer, Y. & Dincer, I. ScienceDirect Life cycle evaluation of hydrogen and other potential fuels for aircrafts. Int. J. Hydrogen Energy 1–17 (2017). doi:10.1016/j.ijhydene.2016.12.119
[4] Butler, T., Weger, L. & Ab, A. ScienceDirect Methane cracking as a bridge technology to the hydrogen economy. 2, (2016).
[5] Lu, L., Ren, N., Xing, D. & Logan, B. E. Hydrogen production with effluent from an ethanol-H2-coproducing fermentation reactor using a single-chamber microbial electrolysis cell. Biosens. Bioelectron. 24, 3055–3060 (2009).
[6] Kadier, A. et al. A comprehensive review of microbial electrolysis cells (MEC) reactor designs and configurations for sustainable hydrogen gas production. Alexandria Eng. J. 55, 427–443 (2014).
[7] Ren, L., Siegert, M., Ivanov, I., Pisciotta, J. M. & Logan, B. E. Treatability studies on different refinery wastewater samples using high-throughput microbial electrolysis cells (MECs). Bioresour. Technol. 136, 322–328 (2013).
[8] Kim, B. H. Bacterial Physiology and Metabolism. Q. Rev. Biol. 84, 206–206 (2009). [9] Rotaru, A.-E. et al. A new model for electron flow during anaerobic digestion: direct
interspecies electron transfer to Methanosaeta for the reduction of carbon dioxide to methane. Energy Environ. Sci. 7, 408 (2014).
[10] Oyiwona, G. E. et al. Oxidation of glucose by syntrophic association between Geobacter and hydrogenotrophic methanogens in microbial fuel cell. Biotechnol. Lett. 39, 253–259 (2017).
[11] Chae, K. J. et al. Methanogenesis control by employing various environmental stress conditions in two-chambered microbial fuel cells. Bioresour. Technol. 101, 5350–5357 (2010).
[12] Kaur, A. et al. Inhibition of methane production in microbial fuel cells: Operating strategies which select electrogens over methanogens. Bioresour. Technol. 173, 75–81 (2014).
[13] Jing, Y., Wan, J., Angelidaki, I., Zhang, S. & Luo, G. iTRAQ quantitative proteomic analysis reveals the pathways for methanation of propionate facilitated by magnetite. Water Res. 108, 212–221 (2017).
[14] Oh, S. T. & Martin, A. D. Glucose contents in anaerobic ethanol stillage digestion manipulate thermodynamic driving force in between hydrogenophilic and acetoclastic methanogens. Chem. Eng. J. 243, 526–536 (2014).
[15] Zhao, Z., Zhang, Y., Chen, S., Quan, X. & Yu, Q. Bioelectrochemical enhancement of anaerobic methanogenesis for high organic load rate wastewater treatment in a up-flow anaerobic sludge blanket (UASB) reactor. Sci. Rep. 4, 6658 (2014).
[16] Kato, S., Nakamura, R., Kai, F., Watanabe, K. & Hashimoto, K. Respiratory interactions of soil bacteria with (semi)conductive iron-oxide minerals. Environ. Microbiol. 12, 3114–3123 (2010).
[17] Liu, J. et al. Patterned ion exchange membranes for improved power production in microbial reverse-electrodialysis cells. J. Power Sources 271, 437–443 (2014).
[18] Merino Jimenez, I., Greenman, J. & Ieropoulos, I. Electricity and catholyte production from ceramic MFCs treating urine. Int. J. Hydrogen Energy 42, 1791–1799 (2017).
[19] Winfield, J., Gajda, I., Greenman, J. & Ieropoulos, I. A review into the use of ceramics in microbial fuel cells. Bioresour. Technol. 215, 296–303 (2016).
[20] Khan, M. Z. et al. Microbial electrolysis cells for hydrogen production and urban wastewater treatment: A case study of Saudi Arabia. Appl. Energy 185, 410–420 (2017).

151
LIST OF AUTHORS
Essex, Jonathan …………………………………………………………………………………….. 2
Grafius, Darren Robert.…………………………………………………..…………………………40
Honeybone, Paul ………………………..……………………………………………………….....52
Kowalski, Radoslaw ……………………………………………………………………………....130
Kurishima, Hideaki ……………………………………………………………………………….. 107
L. Arroyo, Enrique………………………………………………………………………………… 143
Marin, Julie ………………..………………………………………………....................................65
Mirabella, Nadia ………………………………………………………………..............................80
Ogunbodede, Bolawole F. …………………………………………………….............................92
Twigg, John ……………………………………………………………………………………..17, 26
Wilkie, David………………………………………………………………..................................117
Top Related
Copyright © 2022 FDOKUMEN

