


Bahasa
Halaman
Hukum

arX
iv:a
stro
-ph/
0004
243v
2 1
Nov
200
0
PLANET observations of microlensing event OGLE-1999-BUL-23:
limb darkening measurement of the source star
M. D. Albrow1, J. An2, J.-P. Beaulieu3, J. A. R. Caldwell4, D. L. DePoy2,
M. Dominik5, B. S. Gaudi2, A. Gould2, J. Greenhill6, K. Hill6, S. Kane6,
R. Martin7, J. Menzies4, R. W. Pogge2, K. R. Pollard8, P. D. Sackett5,
K. C. Sahu1, P. Vermaak4, R. Watson6, and A. Williams7
(The PLANET Collaboration)
ABSTRACT
We present PLANET observations of OGLE-1999-BUL-23, a binary-lens mi-
crolensing event towards the Galactic bulge. PLANET observations in the I
and V bands cover the event from just before the first caustic crossing until
the end of the event. In particular, a densely-sampled second caustic crossing
enables us to derive the linear limb-darkening coefficients of the source star;
cV = 0.786+0.080−0.078 and cI = 0.632+0.047
−0.037. Combined analysis of the light curve
and the color-magnitude diagram suggests that the source star is a G/K sub-
giant in the Galactic bulge (Teff ≃ 4800 K). The resulting linear limb-darkening
coefficient of the source is consistent with theoretical predictions, although it
is likely that non-linearity of the stellar surface brightness profile complicates
the interpretation, especially for the I band. The global light curve fit to the
data indicates that the event is due to a binary lens of a mass ratio q ≃ 0.39
and a projected separation d ≃ 2.42. The lens/source relative proper motion is
(22.8 ± 1.5) km s−1 kpc−1, typical of bulge/bulge or bulge/disk events.
Subject headings: binaries: general — gravitational microlensing — stars: at-
mospheres, fundamental parameters
1Space Telescope Science Institute, 3700 San Martin Drive, Baltimore, MD 21218, U.S.A.
2Ohio State University, Department of Astronomy, 140 W 18th Avenue, Columbus, OH 43210, U.S.A.
3Institut d’Astrophysique de Paris, INSU CNRS, 98 bis Boulevard Arago, F-75014, Paris, France
4South African Astronomical Observatory, P.O. Box 9, Observatory 7935, South Africa
5Kapteyn Astronomical Institute, Postbus 800, 9700 AV Groningen, The Netherlands
6University of Tasmania, Physics Department, G.P.O. 252C, Hobart, Tasmania 7001, Australia
7Perth Observatory, Walnut Road, Bickley, Western Australia 6076, Australia
8Univ. of Canterbury, Dept. of Physics & Astronomy, Private Bag 4800, Christchurch, New Zealand
– 2 –
1. Introduction
In point-source-point-lens (PSPL) microlensing events, the light curve yields only one
physically interesting parameter, the characteristic time scale of the event, tE, which is
a combination of the mass of the lens and the source-lens relative parallax and proper
motion. However, more varieties than PSPL events have been observed in reality, and using
deviations from the standard light curve, one can deduce more information about the lens
and the source. The Probing Lensing Anomalies NETwork (PLANET) is an international
collaboration that monitors events in search of such anomalous light curves using a network
of telescopes in the southern hemisphere (Albrow et al. 1998).
One example of information that can be extracted from anomalous events is the surface
brightness profile of the source star (Witt 1995). In a binary or multiple lens system, the
caustic is an extended structure. If the source passes near or across the caustic, drastic
changes in magnification near the caustics can reveal the finite size of the source (Gould
1994; Nemiroff & Wickramasinghe 1994; Witt & Mao 1994; Alcock et al. 1997), and one
can even extract its surface-brightness profile (Bogdanov & Cherepashchuk 1996; Gould &
Welch 1996; Sasselov 1997; Valls-Gabaud 1998).
The fall-off of the surface brightness near the edge of the stellar disk with respect to
its center, known as limb darkening, has been extensively observed in the Sun. Theories of
stellar atmospheres predict limb darkening as a general phenomenon and give models for
different types of stars. Therefore, measurement of limb darkening in distant stars other
than the Sun would provide important observational constraints on the study of stellar at-
mospheres. However, such measurements are very challenging with traditional techniques
and have usually been restricted to relatively nearby stars or extremely large supergiants.
As a result, only a few attempts have been made to measure limb darkening to date. The
classical method of tracing the stellar surface brightness profile is the analysis of the light
curves of eclipsing binaries (Wilson & Devinney 1971; Twigg & Rafert 1980). However,
the current practice in eclipsing-binary studies usually takes the opposite approach to limb
darkening (Claret 1998a) – constructing models of light curves using theoretical predic-
tions of limb darkening. This came to dominate after Popper (1984) demonstrated that the
uncertainty of limb darkening measurements from eclipsing binaries is substantially larger
than the theoretical uncertainty. Since the limb-darkening parameter is highly correlated
with other parameters of the eclipsing binary, fitting for limb darkening could seriously de-
grade the measurement of these other parameters. Multi-aperture interferometry and lunar
occultation, which began as measurements of the angular sizes of stars, have also been used
to resolve the surface structures of stars (Hofmann & Scholz 1998). In particular, a large
wavelength dependence of the interferometric size of a stellar disk has been attributed to
limb darkening, and higher order corrections to account for limb darkening have been widely
– 3 –
adopted in the interferometric angular size measurement of stars. Several recent investiga-
tions using optical interferometry extending beyond the first null of the visibility function
have indeed confirmed that the observed patterns of the visibility function contradict a
uniform stellar disk model and favor a limb-darkened disk (Quirrenbach et al. 1996; Hajian
et al. 1998) although these investigations have used a model prediction of limb darkening
inferred from the surface temperature rather than deriving the limb darkening from the ob-
servations. However, at least in one case, Burns et al. (1997) used interferometric imaging
to measure the stellar surface brightness profile with coefficients beyond the simple linear
model. In addition, developments of high resolution direct imaging in the last decade using
space telescopes (Gilliland & Dupree 1996) or speckle imaging (Kluckers et al. 1997) have
provided a more straightforward way of detecting stellar surface irregularities. However,
most studies of this kind are still limited to a few extremely large supergiants, such as α
Ori. Furthermore, they seem to be more sensitive to asymmetric surface structures such as
spotting than to limb darkening.
By contrast, microlensing can produce limb-darkening measurements for distant stars
with reasonable accuracy. To date, limb darkening (more precisely, a set of coefficients of
a parametrized limb-darkened profile) has been measured for source stars in three events,
two K giants in the Galactic bulge and an A dwarf in the Small Magellanic Cloud (SMC).
MACHO 97-BLG-28 was a cusp-crossing event of a K giant source with extremely good
data, permitting Albrow et al. (1999a) to make a two-coefficient (linear and square-root)
measurement of limb darkening. Afonso et al. (2000) used data from five microlensing
collaborations to measure linear limb darkening coefficients in five filter bandpasses for
MACHO 98-SMC-1, a metal-poor A star in the SMC. Although the data for this event
were also excellent, the measurement did not yield a two-parameter determination because
the caustic crossing was a fold-caustic rather than a cusp, and these are less sensitive to
the form of the stellar surface brightness profile. Albrow et al. (2000a) measured a linear
limb-darkening coefficient for MACHO 97-BLG-41, a complex rotating-binary event with
both a cusp crossing and a fold-caustic crossing. In principle, such an event could give very
detailed information about the surface brightness profile. However, neither the cusp nor the
fold-caustic crossing was densely sampled, so only a linear parameter could be extracted.
In this paper, we report a new limb-darkening measurement of a star in the Galac-
tic bulge by a fold-caustic crossing event, OGLE-1999-BUL-23, based on the photometric
monitoring of PLANET.
– 4 –
2. OGLE-1999-BUL-23
OGLE-1999-BUL-23 was originally discovered towards the Galactic bulge by the Op-
tical Gravitational Lensing Experiment (OGLE) 9 (Udalski et al. 1992; Udalski, Kubiak, &
Szymanski 1997). The PLANET collaboration observed the event as a part of our routine
monitoring program after the initial alert, and detected a sudden increase in brightness
on 12 June 1999.10 Following this anomalous behavior, we began dense (typically one ob-
servation per hour) photometric sampling of the event. Since the source lies close to the
(northern) winter solstice (α = 18h07m45.s14, δ = −27◦33′15.′′4), while the caustic crossing
occurred nearly at the summer solstice (19 June 1999), and since good weather at all four of
our southern sites prevailed throughout, we were able to obtain nearly continuous coverage
of the second caustic crossing without any significant gaps. Visual inspection and initial
analysis of the light curve revealed that the second crossing was due to a simple fold caustic
crossing (see §2.2).
2.1. Data
We observed OGLE-1999-BUL-23 with I and V band filters at four participant tele-
scopes: the Elizabeth 1 m at South African Astronomical Observatory (SAAO), Sutherland,
South Africa; the Perth/Lowell 0.6 m telescope at Perth, Western Australia; the Canopus
1 m near Hobart, Tasmania, Australia; and the Yale/AURA/Lisbon/OSU 1 m at Cerro
Tololo Inter-American Observatory (CTIO), La Serena, Chile. From June to August 1999
(1338 < HJD′ < 1405), PLANET obtained almost 600 images of the field of OGLE-1999-
BUL-23. In addition, baseline points were taken at SAAO (HJD′ ≃ 1440) and Perth
(HJD′ ≃ 1450; HJD′ ≃ 1470). Here HJD′ ≡ HJD − 2450000, where HJD is Heliocentric
Julian Date at center of exposure. The data reduction and photometric measurements of
the event were performed relative to non-variable stars in the same field using DoPHOT.
After several re-reductions, we recovered the photometric measurements from a total of 476
frames.
We assumed independent photometric systems for different observatories and thus ex-
plicitly included the determination of independent (unlensed) source and background fluxes
for each different telescope and filter band in the analysis. This provides both determina-
tions of the photometric offsets between different systems and independent estimates of the
blending factors. The final results demonstrate satisfactory alignment among the data sets
9The OGLE alert for this event is posted at http://www.astrouw.edu.pl/˜ftp/ogle/ogle2/ews/bul-23.html
10The PLANET anomaly and caustic alerts are found at http://www.astro.rug.nl/˜planet/OB99023cc.html
– 5 –
(see §2.3), and we therefore believe that we have reasonable relative calibrations. Our pre-
vious studies have shown that the background flux (or blending factors) may correlate with
the size of seeing disks in some cases (Albrow et al. 2000a,b). To check this, we introduced
linear seeing corrections in addition to constant backgrounds.
From previous experience, it is expected that the formal errors reported by DoPHOT
underestimate the actual errors (Albrow et al. 1998), and consequently that χ2 is overes-
timated. Hence, we renormalize photometric errors to force the final reduced χ2/dof = 1
for our best fit model. Here, dof is the number of degrees of freedom (the number of data
points less the number of parameters). We determine independent rescaling factors for the
photometric uncertainties from the different observatories and filters. The process involves
two steps: the elimination of bad data points and the determination of error normalization
factors. In this as in all previous events that we have analyzed, there are outliers discrepant
by many σ that cannot be attributed to any specific cause even after we eliminate some
points whose source of discrepancy is identifiable. Although, in principle, whether particu-
lar data points are faulty or not should be determined without any reference to models, we
find that the light curves of various models that yield reasonably good fits to the data are
very similar to one another, and furthermore, there is no indication of temporal clumping
of highly discrepant points. We, therefore, identify outlier points with respect to our best
model and exclude them from the final analysis.
For the determination of outliers, we follow an iterative approach using both steps
of error normalization. First, we calculate the individual χ2’s of data sets from different
observatories and filter bands with reference to our best model without any rejection or error
scaling. Then, the initial normalization factors are determined independently for each data
set using those individual χ2’s and the number of data points in each set. If the deviation of
the most discrepant outlier is larger than what is predicted based on the number of points
and the assumption of a normal distribution, we classify the point as bad and calculate
the new χ2’s and the normalization factors again. We repeat this procedure until the
largest outlier is comparable with the prediction of a normal distribution. Although the
procedure appears somewhat arbitrary, the actual result indicates that there exist rather
large decreases of σ between the last rejected and included data points. After rejection of
bad points, 429 points remain (see Table 1 and Fig. 1).
2.2. Analysis: searching for χ2 minima
We use the method of Albrow et al. (1999b, hereafter Paper I), which was devised to fit
the light curve of fold-caustic crossing binary-lens events, to analyze the light curve of this
event and find an appropriate binary-lens solution. This method consists of three steps: (1)
– 6 –
fitting of caustic-crossing data using an analytic approximation of the magnification, (2)
searching for χ2 minima over the whole parameter space using the point-source approxima-
tion and restricted to the non-caustic crossing data, and (3) χ2 minimization using all data
and the full binary-lens equation in the neighborhood of the minima found in the second
step.
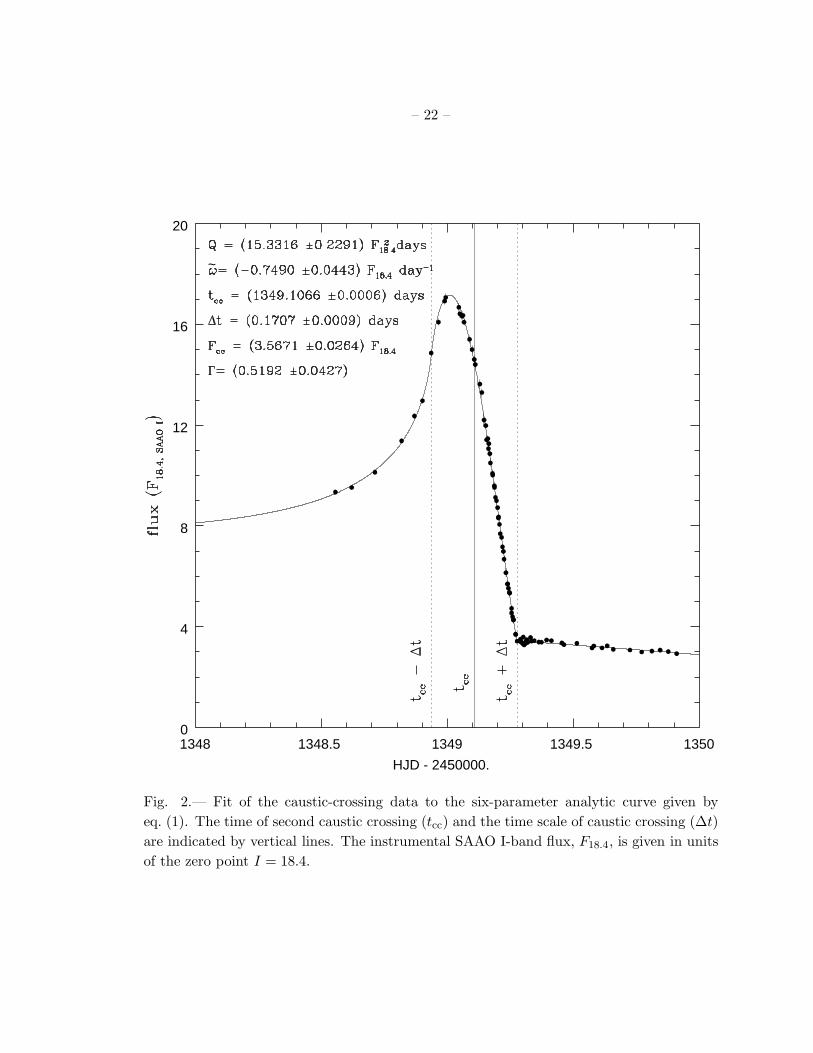
For the first step, we fit the I-band caustic crossing data (1348.5 ≤ HJD′ ≤ 1350) to
the six-parameter analytic curve shown in equation (1) that characterizes the shape of the
second caustic crossing (Paper I; Afonso et al. 2000),
F (t) =
(
Q
∆t
)1/2 [
G0
(
t − tcc∆t
)
+ ΓH1/2
(
t − tcc∆t
)]
+ Fcc + (t − tcc) ω , (1a)
Gn(η) ≡ π−1/2 (n + 1)!
(n + 1/2)!
∫ 1
max(η,−1)dx
(1 − x2)n+1/2
(x − η)1/2Θ(1 − η) , (1b)
H1/2(η) ≡ G1/2(η) − G0(η) . (1c)
Figure 2 shows the best-fit curve and the data points used for the fit. This caustic-crossing
fit essentially constrains the search for a full solution to a four-dimensional hypersurface
instead of the whole nine-dimensional parameter space (Paper I).
We construct a grid of point-source light curves with model parameters spanning a
large subset of the hypersurface and calculate χ2 for each model using the I-band non-
caustic crossing data. After an extensive search for χ2-minima over the four-dimensional
hypersurface, we find positions of two apparent local minima, each in a local valley of the
χ2-surface. The smaller χ2 of the two is found at (d, q, α) ≃ (2.4, 0.4, 75◦), where d is the
projected binary separation in units of the Einstein ring radius, q is the mass ratio of the
binary system, and α is the angle between the binary axis and the path of the source, defined
so that the geometric center of the lens system lies on the right hand side of the moving
source. The other local minimum is (d, q, α) ≃ (0.55, 0.55, 260◦). The results appear to
suggest a rough symmetry of d ↔ d−1 and (α < π) ↔ (α > π), as was found for MACHO
98-SMC-1 (Paper I; Afonso et al. 2000). Besides these two local minima, there are several
isolated (d, q)-grid points at which χ2 is smaller than at neighboring grid points. However,
on a finer grid they appear to be connected with one of the two local minima specified
above. We include the two local minima and some of the apparently isolated minimum
points as well as points in the local valley around the minima as starting points for the
refined search of χ2-minimization in the next step.
– 7 –
2.3. Solutions: χ2 minimization
Starting from the local minima found in §2.2 and the points in the local valleys around
them, we perform a refined search for the χ2 minimum. The χ2 minimization includes
all the I and V data points for successive fitting to the full expression for magnification,
accounting for effects of a finite source size and limb darkening.
As described in Paper I, the third step makes use of a variant of equation (1) to evaluate
the magnified flux in the neighborhood of the caustic crossing. Paper I found that, for
MACHO 98-SMC-1, this analytic expression was an extremely good approximation to the
results of numerical integration and assumed that the same would be the case for any fold
crossing. Unfortunately, we find that, for OGLE-1999-BUL-23, this approximation deviates
from the true magnification as determined using the method of Gould & Gaucherel (1997)
as much as 4%, which is larger than our typical photometric uncertainty in the region of
caustic crossing. To maintain the computational efficiency of Paper I, we continue to use
the analytic formula (1), but correct it by pre-tabulated amounts given by the fractional
difference (evaluated close to the best solution) between this approximation and the values
found by numerical integration. We find that this correction works quite well even at the
local minimum for the other (close-binary) solution – the error is smaller than 1%, and
in particular, the calculations agree within 0.2% for the region of primary interest. The
typical (median) photometric uncertainties for the same region are 0.015 mag (Canopus
after the error normalization) and 0.020 mag (Perth). In addition, we test the correction
by running the fitting program with the exact calculation at the minimum found using
the corrected approximation, and find that the measured parameters change less than the
precision of the measurement. In particular, the limb-darkening coefficients change by an
order of magnitude less than the measurement uncertainty due to the photometric errors.
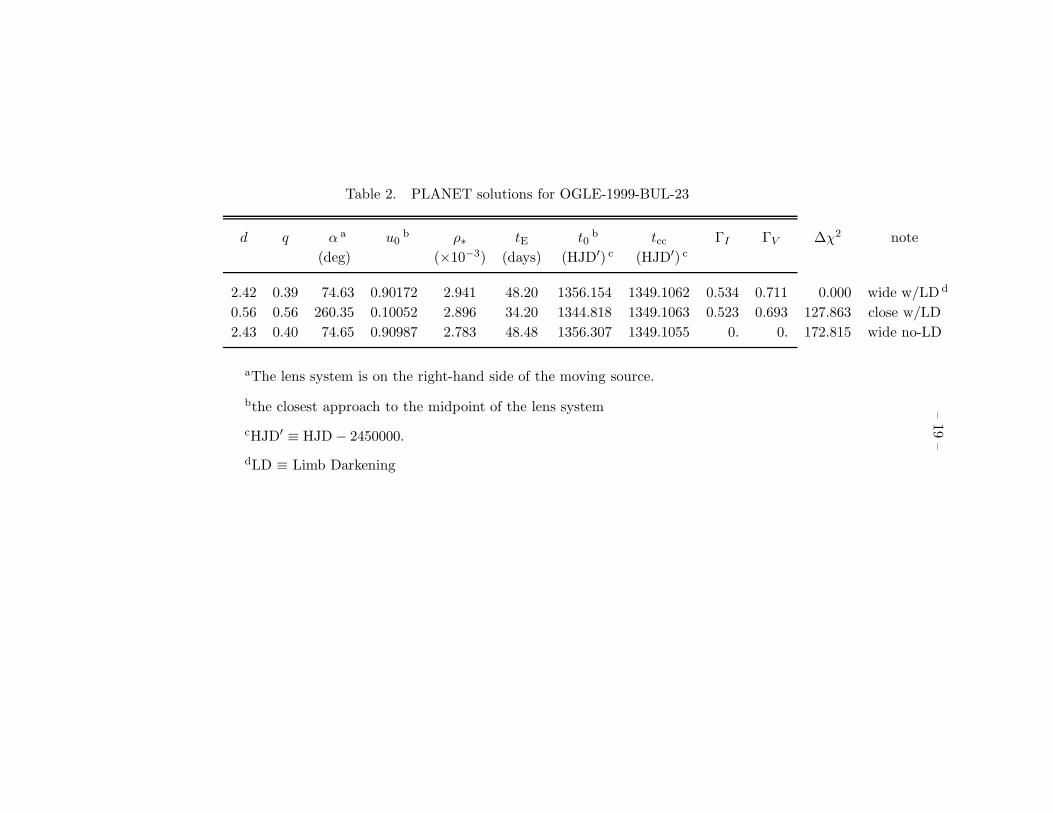
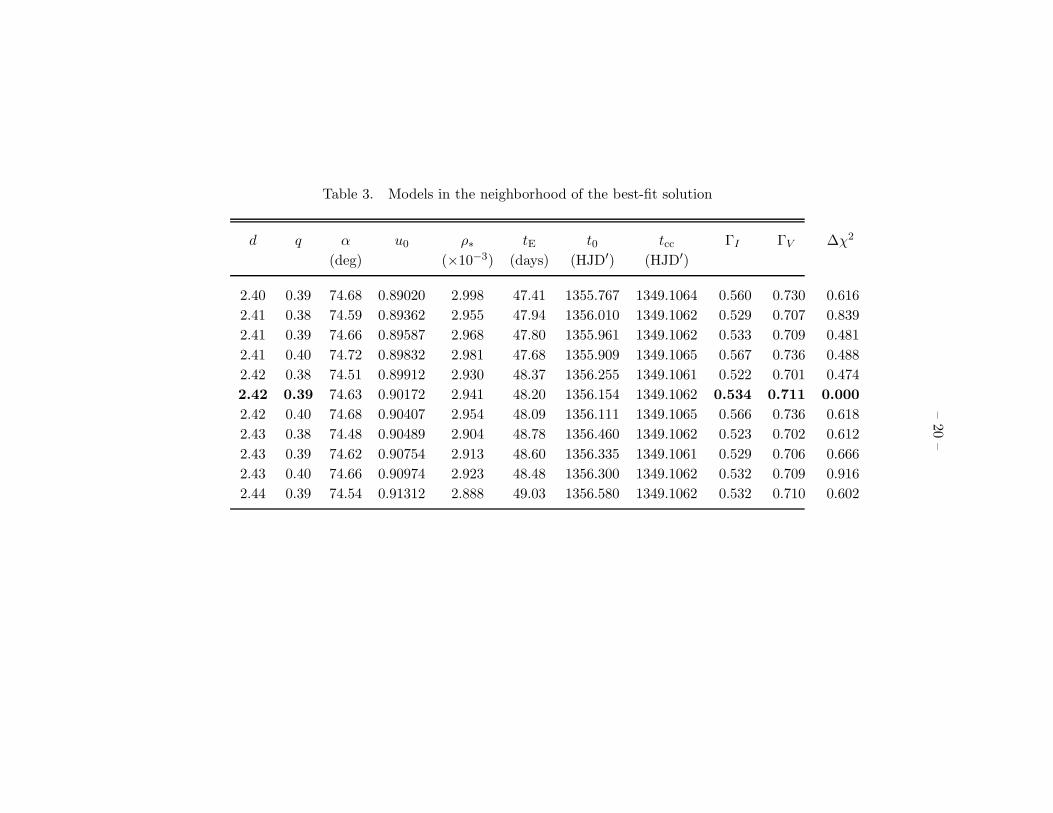
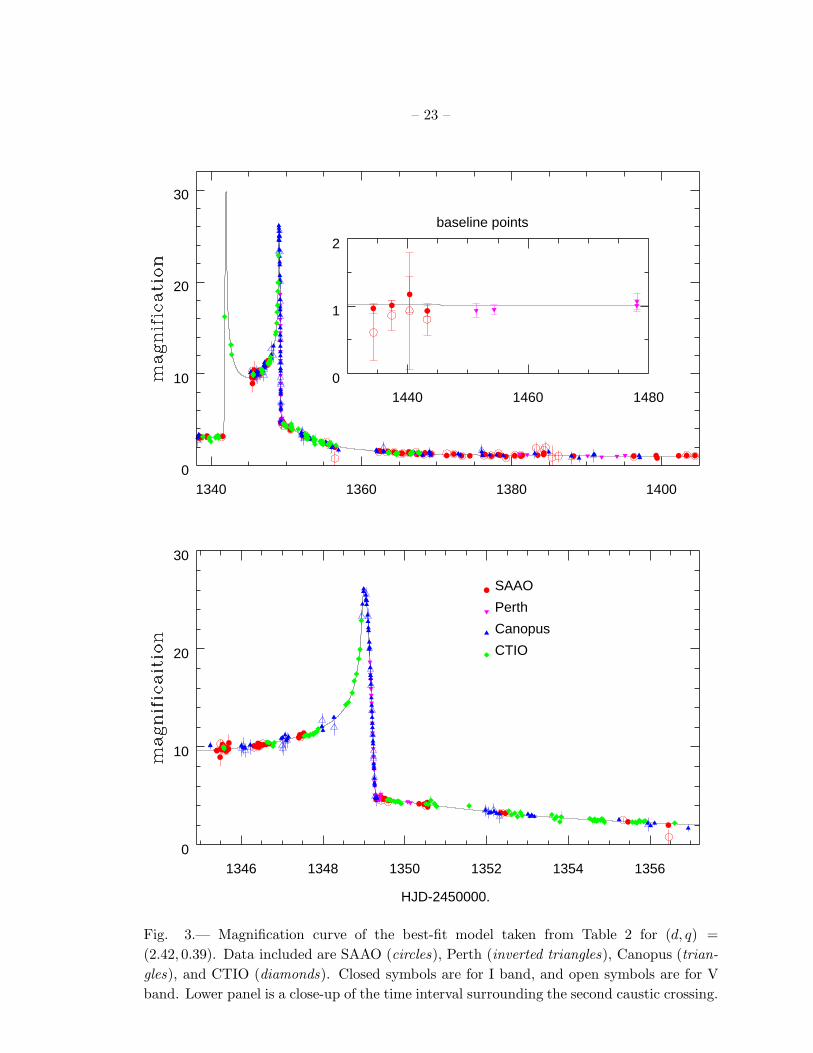
The results of the refined χ2 minimization are listed in Table 2 for three discrete
“solutions” and in Table 3 for grid points neighboring the best-fit solution whose ∆χ2 is
less than one. The first seven columns describe seven of the standard parameters of the
binary-lens model (the remaining two parameters are the source and background flux). The
eighth column is the time of the second caustic crossing (tcc) – the time when the center of
the source crossed the caustic. The limb darkening coefficients for I and V bands are shown
in the next two columns. The final column is ∆χ2,
∆χ2 ≡χ2 − χ2
best
χ2best/dof
, (2)
as in Paper I. The light curve (in magnification) of the best-fit model is shown in Figure 3
together with all the data points used in the analysis.
– 8 –
2.3.1. “Degeneracy”
For typical binary-lens microlensing events, more than one solution often fits the ob-
servations reasonably well. In particular, Dominik (1999) predicted a degeneracy between
close and wide binary lenses resulting from a symmetry in the lens equation itself, and such
a degeneracy was found empirically for MACHO 98-SMC-1 (Paper I; Afonso et al. 2000).
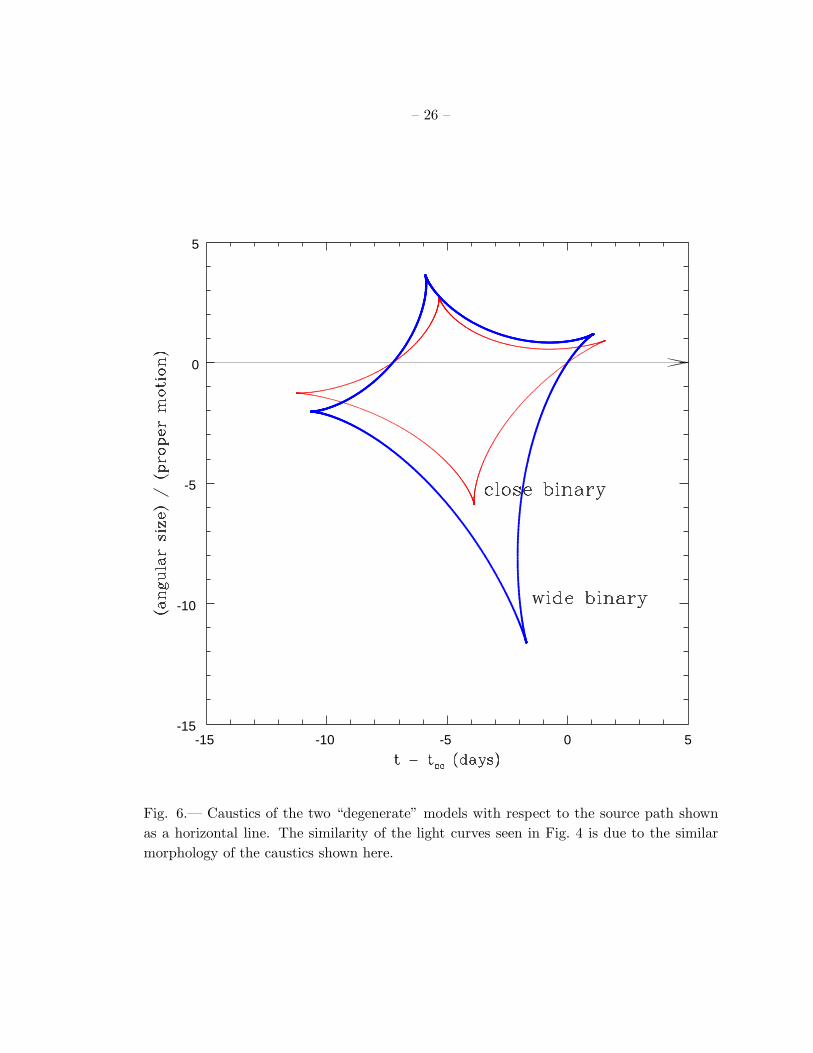
We also find two distinct local χ2 minima (§2.2) that appear to be closely related
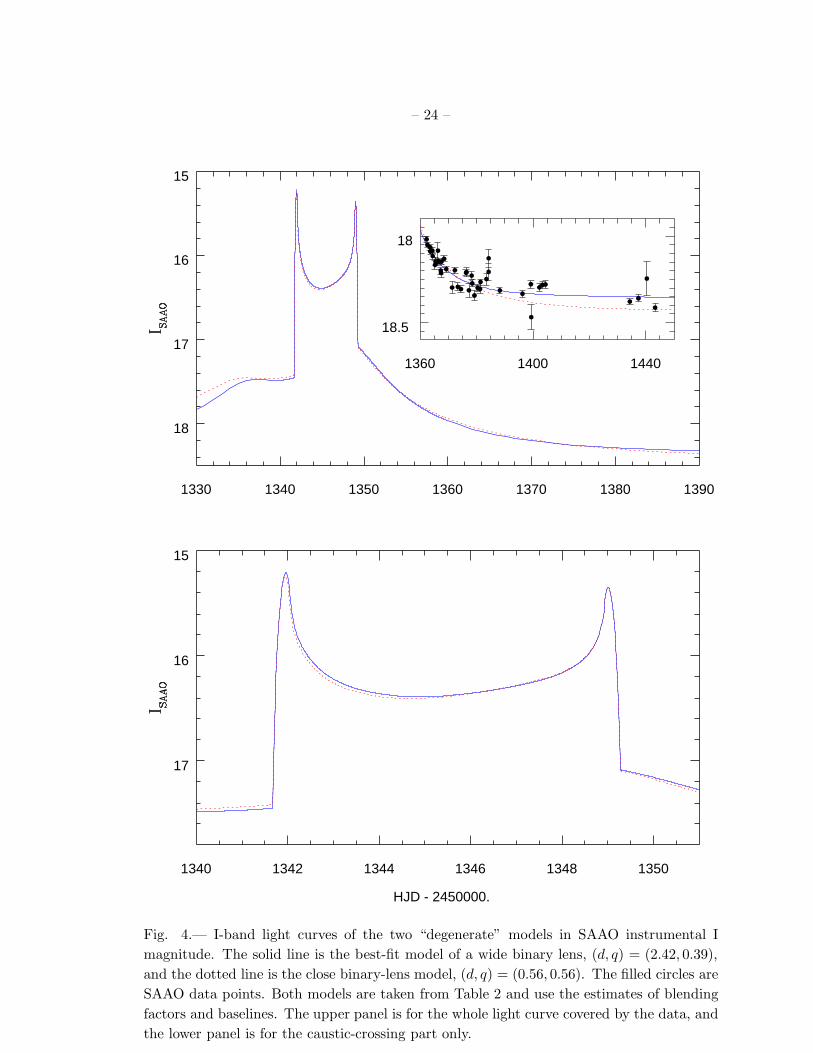
to such degeneracies. However, in contrast to the case of MACHO 98-SMC-1, our close-
binary model for OGLE-1999-BUL-23 has substantially higher χ2 than the wide-binary
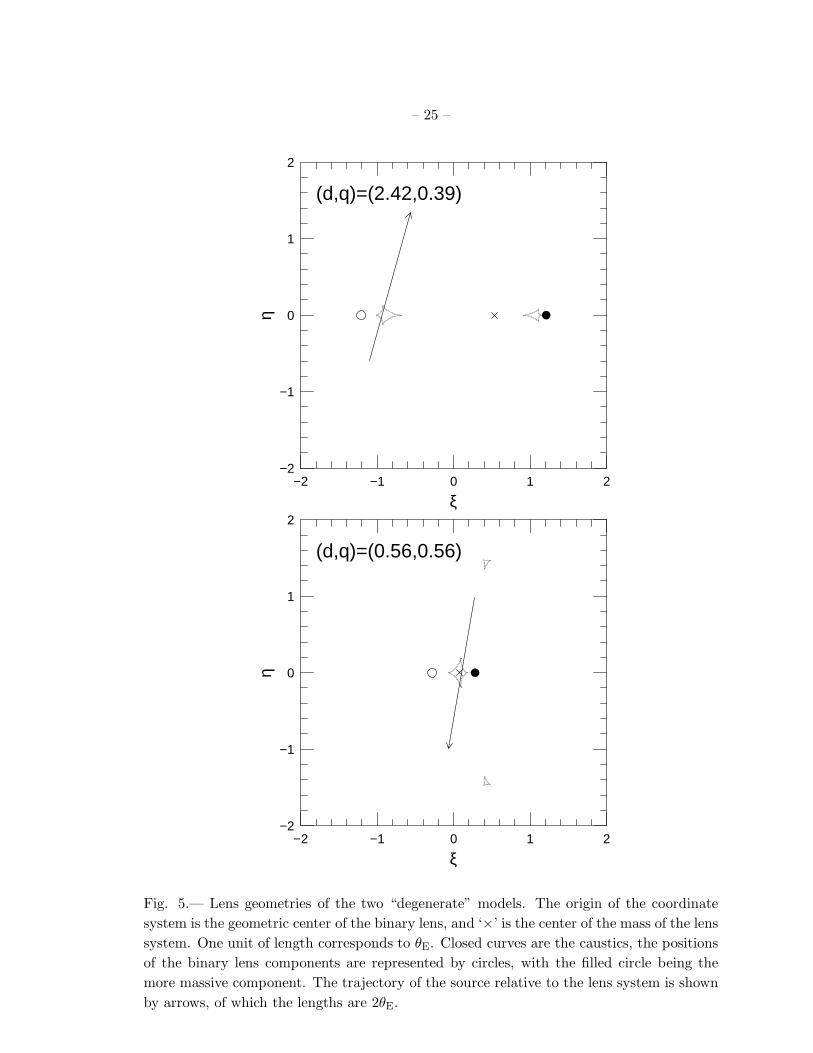
model (∆χ2 = 127.86). Figure 4 shows the predicted light curves in SAAO instrumental
I band. The overall geometries of these two models are shown in Figures 5 and 6. The
similar morphologies of the caustics with respect to the path of the source is responsible
for the degenerate light curves near the caustic crossing (Fig. 6). However, the close-binary
model requires a higher blending fraction and lower baseline flux than the wide-binary
solution because the former displays a higher peak magnification (Amax ∼ 50 vs. Amax ∼
30). Consequently, a precise determination of the baseline can significantly contribute to
discrimination between the two models, and in fact, the actual data did constrain the
baseline well enough to produce a large difference in χ2.
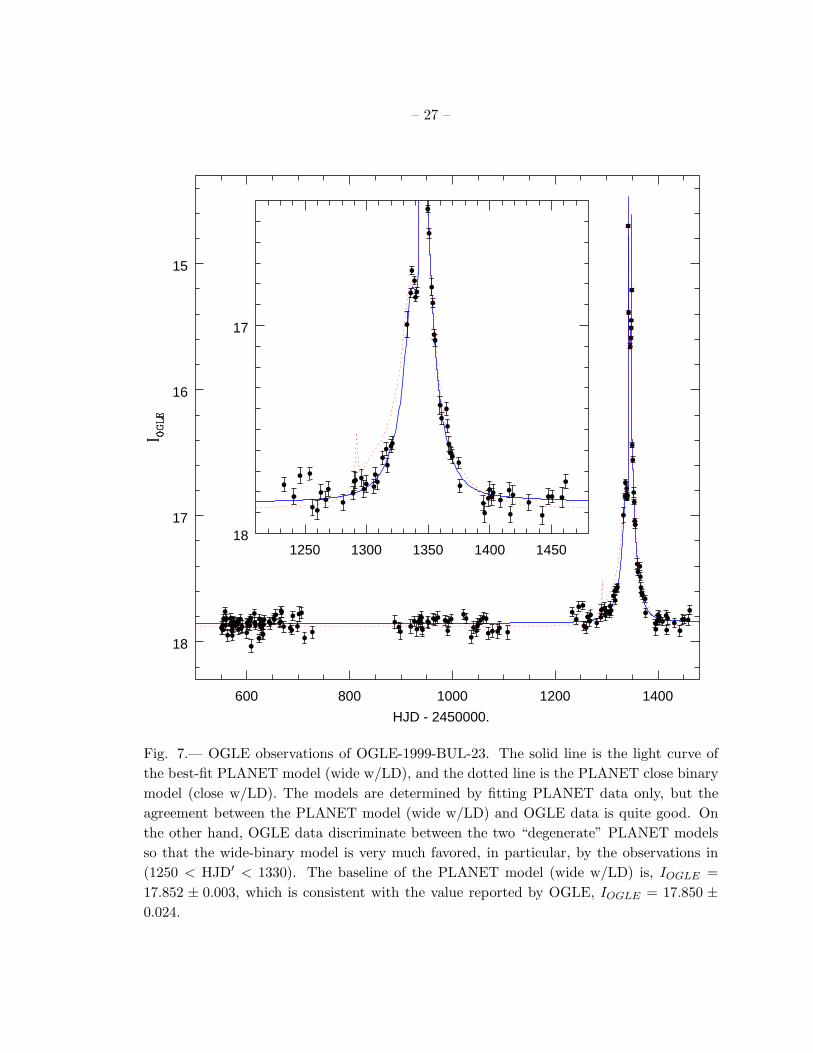
A fair number of pre-event baseline measurements are available via OGLE, and those
data can further help discriminate between these two “degenerate” models. We fit OGLE
measurements to the two models with all the model parameters being fixed and allowing
only the baseline and the blending fraction as free parameters. We find that the PLANET
wide-binary model produces χ2 = 306.83 for 169 OGLE points (χ2/dof = 1.83, compare
Table 1) while χ2 = 608.22 for the close-binary model for the same 169 points (Fig. 7).
That is, ∆χ2 = 164.04, so that the addition of OGLE data by itself discriminates between
the two models approximately as well as all the PLANET data combined. The largest
contribution to this large ∆χ2 appears to come from the period about a month before the
first caustic crossing which is well covered by the OGLE data but not by the PLANET data.
In particular, the close-binary model predicts a bump in the light curve around HJD′ ≃ 1290
due to a triangular caustic (see Fig. 5), but the data do not show any abnormal feature in
the same region, although it is possible that rotation of the binary moved the caustic far
from the source trajectory (eg. Afonso et al. 2000). In brief, the OGLE data strongly favor
the wide-binary model.
– 9 –
2.3.2. Limb-Darkening Coefficients
The limb darkening of the source is parametrized using a normalized linear model of
the source surface brightness profile, which was introduced in Appendix B of Paper I,
Sλ(ϑ) = Sλ
[
1 − Γλ
(
1 −3
2cos ϑ
)]
= Sλ
[
(1 − Γλ) +3
2Γλ cos ϑ
]
,
where sin ϑ ≡θ
θ∗and Sλ ≡
Fs,λ
πθ2∗
, (3)
while linear limb darkening is usually parametrized by,
Sλ(ϑ) = Sλ(0) [1 − cλ (1 − cos ϑ)] = Sλ(0) [(1 − cλ) + cλ cos ϑ ] . (4)
The relationship between the two expressions of linear limb-darkening coefficients is
cλ =3Γλ
2 + Γλ. (5)
Amongst our six data sets, data from SAAO did not contain points that were affected
by limb darkening, i.e. caustic crossing points. Since the filters used at different PLANET
observatories do not differ significantly from one another, we use the same limb-darkening
coefficient for the three remaining I-band data sets. The V-band coefficient is determined
only from Canopus data, so that a single coefficient is used automatically.
For the best-fit lens geometry, the measured values of linear limb-darkening coefficients
are ΓI = 0.534± 0.020 and ΓV = 0.711± 0.089, where the errors include only uncertainties
in the linear fit due to the photometric uncertainties at fixed binary-lens model parameters.
However, these errors underestimate the actual uncertainties of the measurements because
the measurements are correlated with the determination of the seven lens parameters shown
in Tables 2 and 3. Incorporating these additional uncertainties in the measurement (see the
next section for a detailed discussion of the error determination), our final estimates are
ΓI = 0.534+0.050−0.040
(
cI = 0.632+0.047−0.037
)
, (6a)
ΓV = 0.711+0.098−0.095
(
cV = 0.786+0.080−0.078
)
. (6b)
This is consistent with the result of the caustic-crossing fit of §2.2 (ΓI = 0.519 ± 0.043).
Our result suggests that the source is more limb-darkened in V than in I, which is generally
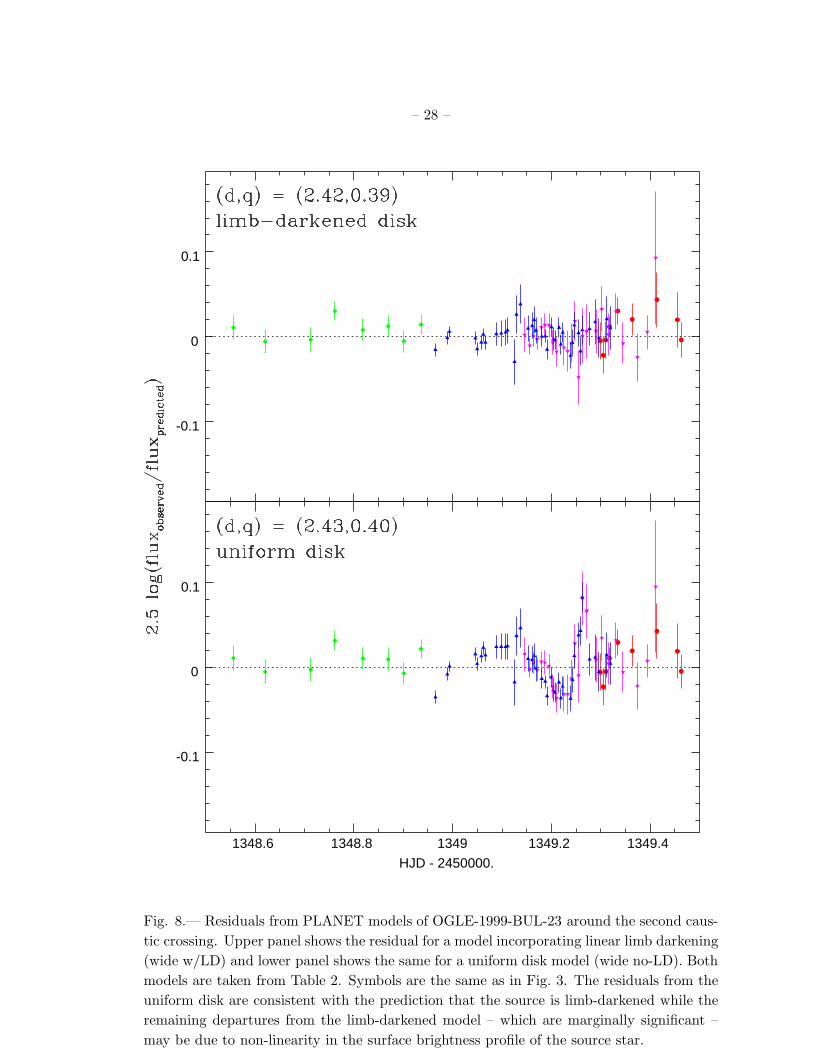
expected by theories. Figure 8 shows the I-band residuals (in magnitudes) at the second
caustic crossing from our best-fit models for a linearly limb-darkened and a uniform disk
model. It is clear that the uniform disk model exhibits larger systematic residuals near the
peak than the linearly limb-darkened disk. From the residual patterns – the uniform disk
– 10 –
model produces a shallower slope for the most of the falling side of the second caustic crossing
than the data require, one can infer that the source should be more centrally concentrated
than the model predicts, and consequently the presence of limb darkening. The linearly
limb-darkened disk reduces the systematic residuals by a factor of ∼ 5. Formally, the
difference of χ2 between the two models is 172.8 with two additional parameters for the
limb-darkened disk model, i.e. the data favor a limb-darkened disk over a uniform disk at
very high confidence.
3. Error Estimation for Limb Darkening Coefficients
Due to the multi-parameter character of the fit, a measurement of any parameter is
correlated with other parameters of the model. The limb-darkening coefficients obtained
with the different model parameters shown in Table 3 exhibit a considerable scatter, and
in particular, for the I-band measurement, the scatter is larger than the uncertainties due
to the photometric errors. This indicates that, in the measurement of the limb-darkening
coefficients, we need to examine errors that correlate with the lens model parameters in
addition to the uncertainties resulting from the photometric uncertainties at fixed lens
parameters. This conclusion is reinforced by the fact that the error in the estimate of Γ
from the caustic-crossing fit (see Fig. 2), which includes the correlation with the parameters
of the caustic-crossing, is substantially larger than the error in the linear fit, which does
not.
Since limb darkening manifests itself mainly around the caustic crossing, its measure-
ment is most strongly correlated with ∆t and tcc. To estimate the effects of these correla-
tions, we fit the data to models with ∆t or tcc fixed at several values near the best fit – the
global geometry of the best fit, i.e. d and q being held fixed as well. The resulting distri-
butions of ∆χ2 have parabolic shapes as a function of the fit values of the limb-darkening
coefficient and are centered at the measurement of the best fit. (Both, ∆t fixed and tccfixed, produce essentially the same parabola, and therefore, we believe that the uncertainty
related to each correlation with either ∆t or tcc is, in fact, same in its nature.) We interpret
the half width of the parabola at ∆χ2 = 1 (δΓI = 0.031, δΓV = 0.032) as the uncertainty
due to the correlation with the caustic-crossing parameters at a given global lens geometry
of a fixed d and q.
Although the global lens geometry should not directly affect the limb darkening mea-
surement, the overall correlation between local and global parameters can contribute an
additional uncertainty to the measurement. This turns out to be the dominant source of
the scatter found in Table 3. To incorporate this into our final determination of errors,
we examine the varying range of the measured coefficients over ∆χ2 ≤ 1. The result is
– 11 –
apparently asymmetric between the direction of increasing and decreasing the amounts of
limb darkening. We believe that this is real, and thus we report asymmetric error bars for
the limb-darkening measurements.
The final errors of the measurements reported in §2.3.2 are determined by adding these
two sources of error to the photometric uncertainty in quadrature. The dominant source of
errors in the I-band coefficient measurement is the correlation between the global geometry
and the local parameters whereas the photometric uncertainty is the largest contribution
to the uncertainties in the V-band coefficient measurement.
Although the measurements of V and I band limb darkening at fixed model parameters
are independent, the final estimates of two coefficients are not actually independent for the
same reason discussed above. (The correlation between V and I limb-darkening coefficients
is clearly demonstrated in Table 3.) Hence, the complete description of the uncertainty
requires a covariance matrix.
C = Cphot + C1/2cc
(
1 ξ
ξ 1
)
C1/2cc + C1/2
geom
(
1 ξ
ξ 1
)
C1/2geom , (7a)
Cphot ≡
(
σ2V,phot 0
0 σ2I,phot
)
, (7b)
C1/2cc ≡
(
σV,cc 0
0 σI,cc
)
, (7c)
C1/2geom ≡
(
σV,geom 0
0 σI,geom
)
, (7d)
where the subscript (phot) denotes the uncertainties due to the photometric errors; (cc),
the correlation with ∆t and tcc at a fixed d and q; (geom), the correlation with the global
geometry, and ξ is the correlation coefficient between ΓV and ΓI measurement. We derive
the correlation coefficient using each measurement of ΓV and ΓI , and the result indicates
that two measurements are almost perfectly correlated (ξ = 0.995). We accommodate
asymmetry of the errors by making the error ellipse off-centered with respect to the best
estimate. (See §5 for more discussion on the error ellipses.)
4. Physical Properties of the Source Star
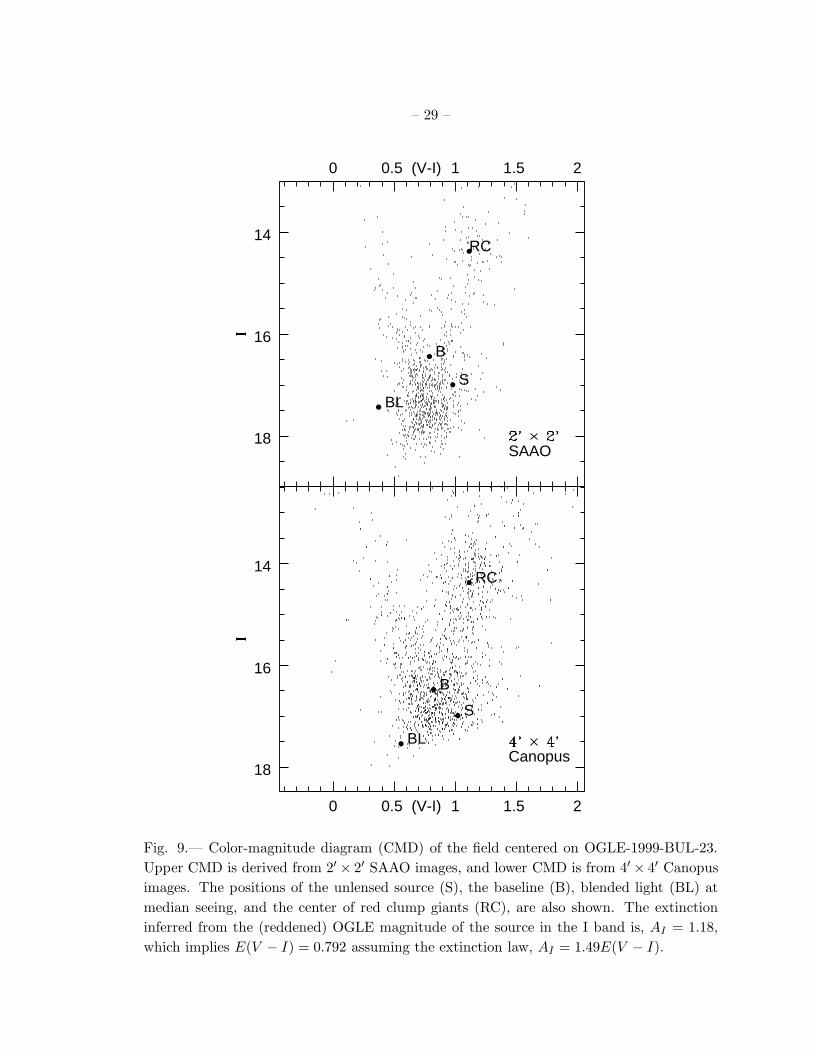
Figure 9 shows color-magnitude diagrams (CMDs) derived from a 2′ × 2′ SAAO field
and a 4′ × 4′ Canopus field centered on OGLE-1999-BUL-23 with positions marked for
– 12 –
the unmagnified source (S), the baseline (B), blended light (BL) at median seeing, and
the center of red clump giants (RC). The source position in these CMDs is consistent
with a late G or early K subgiant in the Galactic bulge (see below). Using the color and
magnitude of red clump giants in the Galactic bulge reported by Pacynski et al. (1999)
(IRC = 14.37± 0.02, [V − I]RC = 1.114± 0.003), we measure the reddening-corrected color
and magnitude of the source in the Johnson-Cousins system from the relative position of
the source with respect to the center of red clump in our CMDs, and obtain:
(V − I)S,0 = 1.021 ± 0.044, (8a)
VS,0 = 18.00 ± 0.06, (8b)
where the errors include the difference of the source positions in the two CMDs, but may
still be somewhat underestimated because the uncertainty in the selection of red clump
giants in our CMDs has not been quantified exactly.
From this information, we derive the surface temperature of the source; Teff = (4830±
100) K, using the color calibration in Bessell, Castelli, & Plez (1998) and assuming log g =
3.5 and the solar abundance. This estimate of temperature is only weakly dependent on
the assumed surface gravity and different stellar atmospheric models. To determine the
angular size of the source, we use equation (4) of Albrow et al. (2000a), which is derived
from the surface brightness-color relation of van Belle (1999). We first convert (V − I)S,0
into (V −K)S,0 = 2.298±0.113 using the same color calibration of Bessell et al. (1998) and
then obtain the angular radius of the source of
θ∗ = (1.86 ± 0.13) µas
= (0.401 ± 0.027) R⊙ kpc−1. (9)
If the source is at the Galactocentric distance (8 kpc), this implies that the radius of the
source is roughly 3.2R⊙, which is consistent with the size of a ∼ 1M⊙ subgiant (log g = 3.4).
Combining this result with the parameters of the best-fit model yields
µ = θ∗/(∆t sin φ) = (13.2 ± 0.9) µas day−1
= (22.8 ± 1.5) km s−1 kpc−1, (10)
θE = µ tE = (0.634 ± 0.043) mas, (11)
where φ = 123.◦9 is the angle that the source crosses the caustic (see Fig. 6). This corre-
sponds to a projected relative velocity of (182 ± 12) km s−1 at the Galactocentric distance,
which is generally consistent with what is expected in typical bulge/bulge or bulge/disk
(source/lens) events, but inconsistent with disk/disk lensing. Hence we conclude that the
– 13 –
source is in the bulge. As for properties of the lens, the projected separation of the binary
lens is (1.53 ± 0.10) AU kpc−1, and the combined mass of the lens is given by
ML =c2DSDL
4G(DS − DL)θ2E = (0.395 ± 0.053)
(
x
1 − x
)(
DS
8 kpc
)
M⊙ , (12)
where x ≡ DL/DS, DL is the distance to the lens, and DS is the distance to the source.
5. Limb Darkening of the Source
We compare our determination of the linear limb-darkening coefficients to model calcu-
lations by Claret, Dıaz-Cordoves, & Gimenez (1995) and Dıaz-Cordoves, Claret, & Gimenez
(1995). For an effective temperature of Teff = (4830 ± 100) K and a surface gravity
of log g = 3.5, the interpolation of the V-band linear limb-darkening coefficients, cV , of
Dıaz-Cordoves et al. (1995) predicts a value cV = 0.790 ± 0.012, very consistent with our
measurement. However, for the I-band coefficient, the prediction of Claret et al. (1995),
cI = 0.578± 0.008, is only marginally consistent with our measurement, at the 1.46σ level.
Adopting a slightly different gravity does not qualitatively change this general result. Since
we believe that the uncertainty in the color of the source is larger than in the limb-darkening
coefficients, we also examine the opposite approach to the theoretical calculations − using
the measured values of limb-darkening coefficients to derive the effective temperature of
the source. If the source is a subgiant (log g ≃ 3.5) as our CMDs suggest, the measured
values of the limb-darkening coefficients are expected to be observed in stars of the effective
temperature, Teff = (4850+650−670) K for cV or Teff = (4200+390
−490) K for cI . As before, the
estimate from the V-band measurement shows a better agreement with the measured color
than the estimate from the I-band. Considering that the data quality of I band is better
than V band (the estimated uncertainty is smaller in I than in V ), this result needs to be
explained.
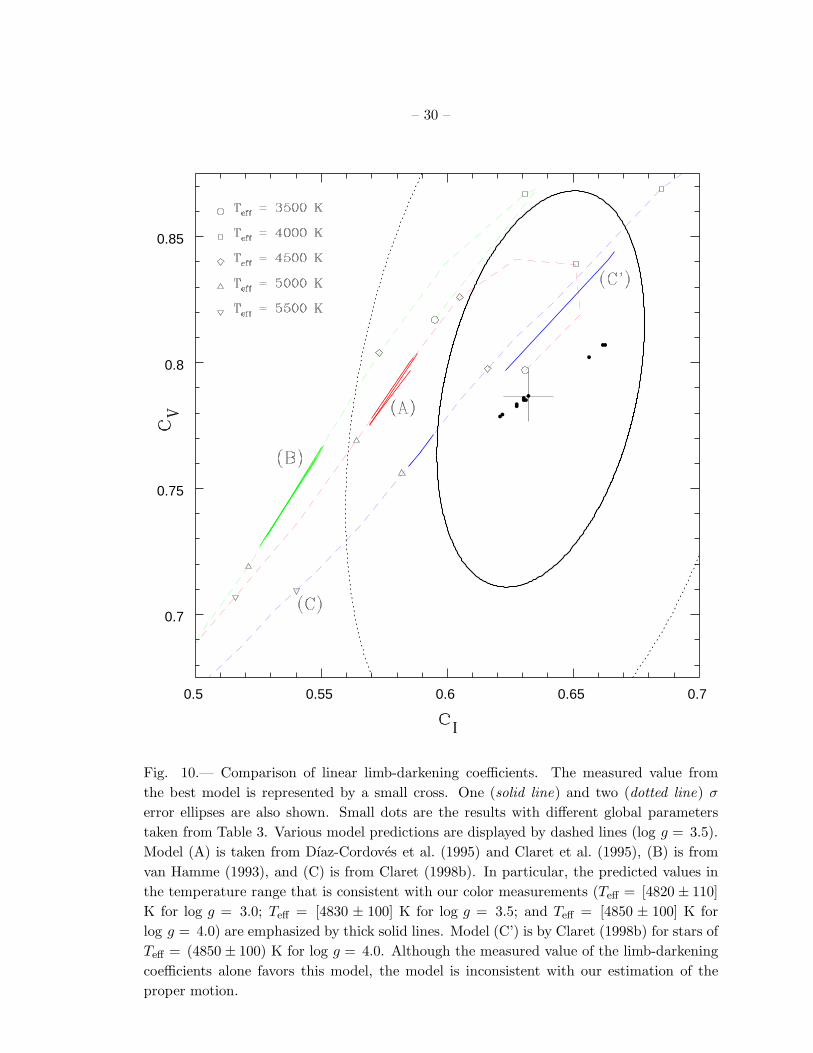
In Figure 10, we plot theoretical calculations of (cI , cV ) together with our measured
values. In addition to Dıaz-Cordoves et al. (1995) and Claret et al. (1995) (A), we also
include the calculations of linear limb-darkening coefficients by van Hamme (1993) (B) and
Claret (1998b) (C). For all three calculations, the V-band linear coefficients are generally
consistent with the measured coefficients and the color, although van Hamme (1993) predicts
a slightly smaller amount of limb darkening than the others. On the other hand, the
calculations of the I-band linear coefficients are somewhat smaller than the measurement
except for Claret (1998b) with log g = 4.0. (However, to be consistent with a higher
surface gravity while maintaining its color, the source star should be in the disk, which is
inconsistent with our inferred proper motion.) Since cV and cI are not independent (in
– 14 –
both the theories and in our measurement), it is more reasonable to compare the I and
V band measurements to the theories simultaneously. Using the covariance matrix of the
measurement of ΓI and ΓV (see §3), we derive error ellipses for our measurements in the
(cI , cV ) plane and plot them in Figure 10. Formally, at the 1σ level, the calculations of
the linear limb-darkening coefficients in any of these models are not consistent with our
measurements. In principle, one could also constrain the most likely stellar types that
are consistent with the measured coefficients, independent of a priori information on the
temperature and the gravity, with a reference to a model. If we do this, the result suggests
either that the surface temperature is cooler than our previous estimate from the color or
that the source is a low-mass main-sequence (log g ≥ 4.0) star. However, the resulting
constraints are not strong enough to place firm limits on the stellar type even if we assume
any of these models to be “correct”.
One possible explanation of our general result – the measured V-band coefficients are
nearly in perfect agreement with theories while the I-band coefficients are only marginally
consistent – is non-linearity of stellar limb darkening. Many authors have pointed out the
inadequacy of the linear limb darkening in producing a reasonably high-accuracy approxi-
mation of the real stellar surface brightness profile (Wade & Rucinski 1985; Dıaz-Cordoves
& Gimenez 1992; van Hamme 1993; Claret 1998b). Indeed, Albrow et al. (1999a) measured
the two-coefficient square-root limb darkening for a cusp-crossing microlensing event and
found that the single-coefficient model gives a marginally poorer fit to the data. The qual-
ity of the linear parameterization has been investigated for most theoretical limb-darkening
calculations, and the results seem to support this explanation. van Hamme (1993) defined
the quality factors (Q in his paper) for his calculations of limb-darkening coefficients, and
for 4000 K ≤ Teff ≤ 5000 K and 3.0 ≤ log g ≤ 4.0, his results indicate that the linear
parameterization is a better approximation for V band than for I band. Similarly, Claret
(1998b) provided plots of summed residuals (σ in his paper) for his fits used to derive
limb-darkening coefficients showing that the V-band linear limb-darkening has lower σ than
I-band and is as good as the V-band square-root limb-darkening near the temperature range
of our estimate for the source of OGLE-1999-BUL-23. In fact, Dıaz-Cordoves et al. (1995)
reported that the V-band limb darkening is closest to the linear law in the temperature
range Teff = 4500 ∼ 4750 K. In summary, the source happens to be very close to the tem-
perature at which the linear limb darkening is a very good approximation in V , but is less
good in I.
The actual value of the coefficient in the linear parameterization of a non-linear profile
may vary depending on the method of calculation and sampling. In order to determine
the linear coefficients, models (A) and (C) used a least square fit to the theoretical (non-
parametric) profile by sampling uniformly over cos ϑ (see eq. [3]), while model (B) utilized
– 15 –
the principle of total flux conservation between parametric and non-parametric profiles.
On the other hand, a fold-caustic crossing event samples the stellar surface brightness
by convolving it with a rather complicated magnification pattern (Gaudi & Gould 1999).
Therefore, it is very likely that neither of the above samplings and calculations is entirely
suitable for the representation of the limb-darkening measurement by microlensing unless
the real intensity profile of the star is actually same as the assumed parametric form (the
linear parameterization, in this case). In fact, the most apropriate way to compare the
measurement to the stellar atmospheric models would be a direct fit to the (non-parametric)
theoretical profile after convolution with the magnification patterns near the caustics. In
the present paper, this has not been done, but we hope to make such a direct comparison
in the future.
We thank A. Udalski for re-reducing the OGLE data on very short notice after we
noticed an apparent discrepancy between the PLANET data and the original OGLE reduc-
tions. This work was supported by grants AST 97-27520 and AST 95-30619 from the NSF,
by grant NAG5-7589 from NASA, by a grant from the Dutch ASTRON foundation through
ASTRON 781.76.018, by a Marie Curie Fellowship from the European Union, and by “coup
de pouce 1999” award from the Ministere de l’Education nationale, de la Recherche et de
la Technologie.
REFERENCES
Afonso, C. et al. 2000, ApJ, 532, 340
Albrow, M.D. et al. 1998, ApJ, 509, 687
Albrow, M.D. et al. 1999a, ApJ, 522, 1011
Albrow, M.D. et al. 1999b, ApJ, 522, 1022 (Paper I)
Albrow, M.D. et al. 2000a, ApJ, 534, 894
Albrow, M.D. et al. 2000b, ApJ, 535, 176
Alcock, C. et al. 1997, ApJ, 491, 436
Bessell, M.S., Castelli, F., & Plez, B. 1998, A&A, 333, 231
Bogdanov, M.B. & Cherepashchuk, A.M. 1996, Astron. Rep., 40, 713
Burns, D. et al. 1997, MNRAS, 209, L11
– 16 –
Claret, A. 1998a, A&AS, 131, 395
Claret, A. 1998b, A&A, 335, 647
Claret, A., Dıaz-Cordoves, J., & Gimenez, A. 1995, A&AS, 114, 247
Dıaz-Cordoves, J. & Gimenez, A. 1992, A&A, 259, 227
Dıaz-Cordoves, J., Claret, A., & Gimenez, A. 1995, A&AS, 110, 329
Dominik, M. 1999, A&A, 349, 108
Gaudi, B.S. & Gould, A. 1999, ApJ, 513, 619
Gilliland, R.L. & Dupree, A.K. 1996, ApJ, 463, L29
Gould, A. 1994, ApJ, 421, L71
Gould, A. & Gaucherel, C. 1997, ApJ, 477, 580
Gould, A. & Welch, D.L. 1996, ApJ, 464, 212
Hajian, A.R. et al. 1998, ApJ, 496, 484
Hofmann, K.-H. & Scholz, M. 1998, A&A, 335, 637
Kluckers, V.A., Edmunds, M.G., Morris, R.H., & Wooder, N. 1997, MNRAS, 284, 711
Nemiroff, R.J., & Wickramasinge, W.A.D.T 1994, ApJ, 424, L21
Pacynski, B., Udalski. A, Szymanski, M., Kubiak, M., Pietrzynski, I., Wozniak, P., &
Zebrun, K. 1999, Acta Astron., 49, 319
Popper, D.M. 1984, AJ, 89, 132
Quirrenbach, A., Mozurkewich, D., Buscher, D.F., Hummel, C.A., & Armstrong, J.T. 1996,
A&A, 312, 160
Sasselov, D.D. 1997, in IAP Colloq. Proc. 12, Variable Stars and the Astrophysical Returens
of Microlensing Surveys, eds. R. Ferlet, J.-P. Maillard, & B. Raban (Cedex: Editions
Frontieres), 141
Twigg, L.W. & Rafert, J.B. 1980, MNRAS, 193, 773
Udalski, A., Kubiak, M. & Szymanski, M. 1997, Acta Astron., 47, 319
Udalski, A., Szymanski, M., Kaluzny, J., Kubiak, M., & Mateo M. 1992, Acta Astron., 42,
253
– 17 –
Valls-Gaubaud, D. 1998, MNRAS, 294, 747
van Belle, G.T. 1999, PASP, 111, 1515
van Hamme, W. 1993, AJ, 106, 2096
Wade, R.A. & Rucinski, S.M. 1985, A&AS, 60, 471
Wilson, R.E. & Devinney, E.J. 1971, ApJ, 166, 605
Witt, H.J. 1995, ApJ, 449, 42
Witt, H.J. & Mao, S. 1994, ApJ, 430, 505
This preprint was prepared with the AAS LATEX macros v5.0.
– 18 –
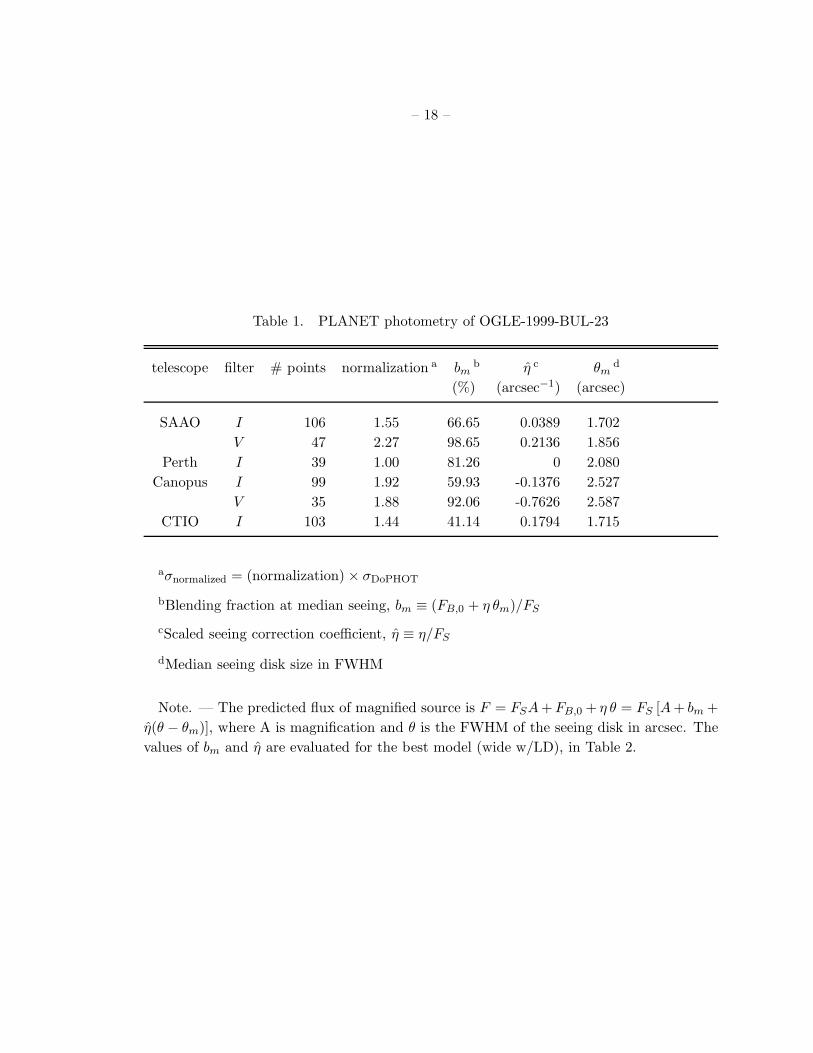
Table 1. PLANET photometry of OGLE-1999-BUL-23
telescope filter # points normalization a bmb η c θm
d
(%) (arcsec−1) (arcsec)
SAAO I 106 1.55 66.65 0.0389 1.702
V 47 2.27 98.65 0.2136 1.856
Perth I 39 1.00 81.26 0 2.080
Canopus I 99 1.92 59.93 -0.1376 2.527
V 35 1.88 92.06 -0.7626 2.587
CTIO I 103 1.44 41.14 0.1794 1.715
aσnormalized = (normalization) × σDoPHOT
bBlending fraction at median seeing, bm ≡ (FB,0 + η θm)/FS
cScaled seeing correction coefficient, η ≡ η/FS
dMedian seeing disk size in FWHM
Note. — The predicted flux of magnified source is F = FSA + FB,0 + η θ = FS [A + bm +
η(θ − θm)], where A is magnification and θ is the FWHM of the seeing disk in arcsec. The
values of bm and η are evaluated for the best model (wide w/LD), in Table 2.
–19
–
Table 2. PLANET solutions for OGLE-1999-BUL-23
d q α a u0b ρ∗ tE t0
b tcc ΓI ΓV ∆χ2 note
(deg) (×10−3) (days) (HJD′) c (HJD′) c
2.42 0.39 74.63 0.90172 2.941 48.20 1356.154 1349.1062 0.534 0.711 0.000 wide w/LD d
0.56 0.56 260.35 0.10052 2.896 34.20 1344.818 1349.1063 0.523 0.693 127.863 close w/LD
2.43 0.40 74.65 0.90987 2.783 48.48 1356.307 1349.1055 0. 0. 172.815 wide no-LD
aThe lens system is on the right-hand side of the moving source.
bthe closest approach to the midpoint of the lens system
cHJD′ ≡ HJD − 2450000.
dLD ≡ Limb Darkening
–20
–
Table 3. Models in the neighborhood of the best-fit solution
d q α u0 ρ∗ tE t0 tcc ΓI ΓV ∆χ2
(deg) (×10−3) (days) (HJD′) (HJD′)
2.40 0.39 74.68 0.89020 2.998 47.41 1355.767 1349.1064 0.560 0.730 0.616
2.41 0.38 74.59 0.89362 2.955 47.94 1356.010 1349.1062 0.529 0.707 0.839
2.41 0.39 74.66 0.89587 2.968 47.80 1355.961 1349.1062 0.533 0.709 0.481
2.41 0.40 74.72 0.89832 2.981 47.68 1355.909 1349.1065 0.567 0.736 0.488
2.42 0.38 74.51 0.89912 2.930 48.37 1356.255 1349.1061 0.522 0.701 0.474
2.42 0.39 74.63 0.90172 2.941 48.20 1356.154 1349.1062 0.534 0.711 0.000
2.42 0.40 74.68 0.90407 2.954 48.09 1356.111 1349.1065 0.566 0.736 0.618
2.43 0.38 74.48 0.90489 2.904 48.78 1356.460 1349.1062 0.523 0.702 0.612
2.43 0.39 74.62 0.90754 2.913 48.60 1356.335 1349.1061 0.529 0.706 0.666
2.43 0.40 74.66 0.90974 2.923 48.48 1356.300 1349.1062 0.532 0.709 0.916
2.44 0.39 74.54 0.91312 2.888 49.03 1356.580 1349.1062 0.532 0.710 0.602
– 21 –
SAAO
Perth
Canopus
CTIO
SAAO
Canopus
18
17
16
1340 1360 1380 1400
19
18
17
HJD - 2450000.
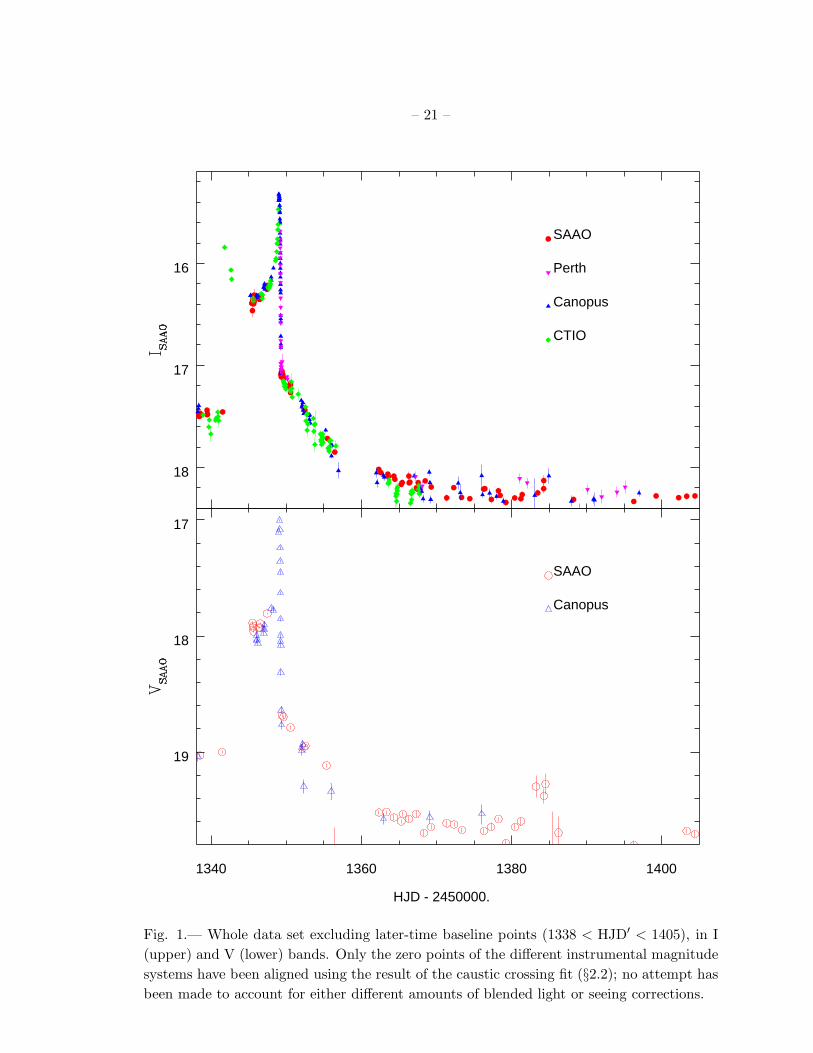
Fig. 1.— Whole data set excluding later-time baseline points (1338 < HJD′ < 1405), in I
(upper) and V (lower) bands. Only the zero points of the different instrumental magnitude
systems have been aligned using the result of the caustic crossing fit (§2.2); no attempt has
been made to account for either different amounts of blended light or seeing corrections.
– 22 –
1348 1348.5 1349 1349.5 13500
4
8
12
16
20
HJD - 2450000.
~
Fig. 2.— Fit of the caustic-crossing data to the six-parameter analytic curve given by
eq. (1). The time of second caustic crossing (tcc) and the time scale of caustic crossing (∆t)
are indicated by vertical lines. The instrumental SAAO I-band flux, F18.4, is given in units
of the zero point I = 18.4.
– 23 –
1340 1360 1380 14000
10
20
30
baseline points
1346 1348 1350 1352 1354 13560
10
20
30
HJD-2450000.
SAAO
Perth
Canopus
CTIO
1440 1460 14800
1
2
Fig. 3.— Magnification curve of the best-fit model taken from Table 2 for (d, q) =
(2.42, 0.39). Data included are SAAO (circles), Perth (inverted triangles), Canopus (trian-
gles), and CTIO (diamonds). Closed symbols are for I band, and open symbols are for V
band. Lower panel is a close-up of the time interval surrounding the second caustic crossing.
– 24 –
1330 1340 1350 1360 1370 1380 1390
18
17
16
15
1340 1342 1344 1346 1348 1350
17
16
15
HJD - 2450000.
1360 1400 1440
18.5
18
Fig. 4.— I-band light curves of the two “degenerate” models in SAAO instrumental I
magnitude. The solid line is the best-fit model of a wide binary lens, (d, q) = (2.42, 0.39),
and the dotted line is the close binary-lens model, (d, q) = (0.56, 0.56). The filled circles are
SAAO data points. Both models are taken from Table 2 and use the estimates of blending
factors and baselines. The upper panel is for the whole light curve covered by the data, and
the lower panel is for the caustic-crossing part only.
– 25 –
−2 −1 0 1 2−2
−1
0
1
2
ξ
η
(d,q)=(2.42,0.39)
−2 −1 0 1 2−2
−1
0
1
2
ξ
η
(d,q)=(0.56,0.56)
Fig. 5.— Lens geometries of the two “degenerate” models. The origin of the coordinate
system is the geometric center of the binary lens, and ‘×’ is the center of the mass of the lens
system. One unit of length corresponds to θE. Closed curves are the caustics, the positions
of the binary lens components are represented by circles, with the filled circle being the
more massive component. The trajectory of the source relative to the lens system is shown
by arrows, of which the lengths are 2θE.
– 26 –
-15 -10 -5 0 5-15
-10
-5
0
5
Fig. 6.— Caustics of the two “degenerate” models with respect to the source path shown
as a horizontal line. The similarity of the light curves seen in Fig. 4 is due to the similar
morphology of the caustics shown here.
– 27 –
600 800 1000 1200 1400
18
17
16
15
HJD - 2450000.
1250 1300 1350 1400 145018
17
Fig. 7.— OGLE observations of OGLE-1999-BUL-23. The solid line is the light curve of
the best-fit PLANET model (wide w/LD), and the dotted line is the PLANET close binary
model (close w/LD). The models are determined by fitting PLANET data only, but the
agreement between the PLANET model (wide w/LD) and OGLE data is quite good. On
the other hand, OGLE data discriminate between the two “degenerate” PLANET models
so that the wide-binary model is very much favored, in particular, by the observations in
(1250 < HJD′ < 1330). The baseline of the PLANET model (wide w/LD) is, IOGLE =
17.852 ± 0.003, which is consistent with the value reported by OGLE, IOGLE = 17.850 ±
0.024.
– 28 –
-0.1
0
0.1
1348.6 1348.8 1349 1349.2 1349.4
-0.1
0
0.1
HJD - 2450000.
Fig. 8.— Residuals from PLANET models of OGLE-1999-BUL-23 around the second caus-
tic crossing. Upper panel shows the residual for a model incorporating linear limb darkening
(wide w/LD) and lower panel shows the same for a uniform disk model (wide no-LD). Both
models are taken from Table 2. Symbols are the same as in Fig. 3. The residuals from the
uniform disk are consistent with the prediction that the source is limb-darkened while the
remaining departures from the limb-darkened model – which are marginally significant –
may be due to non-linearity in the surface brightness profile of the source star.
– 29 –
Canopus
(V-I)0 0.5 1 1.5 2
18
16
14
S
B
BL
RC
SAAO
(V-I)0 0.5 1 1.5 2
18
16
14
S
B
BL
RC
Fig. 9.— Color-magnitude diagram (CMD) of the field centered on OGLE-1999-BUL-23.
Upper CMD is derived from 2′ × 2′ SAAO images, and lower CMD is from 4′ × 4′ Canopus
images. The positions of the unlensed source (S), the baseline (B), blended light (BL) at
median seeing, and the center of red clump giants (RC), are also shown. The extinction
inferred from the (reddened) OGLE magnitude of the source in the I band is, AI = 1.18,
which implies E(V − I) = 0.792 assuming the extinction law, AI = 1.49E(V − I).
– 30 –
0.5 0.55 0.6 0.65 0.7
0.7
0.75
0.8
0.85
Fig. 10.— Comparison of linear limb-darkening coefficients. The measured value from
the best model is represented by a small cross. One (solid line) and two (dotted line) σ
error ellipses are also shown. Small dots are the results with different global parameters
taken from Table 3. Various model predictions are displayed by dashed lines (log g = 3.5).
Model (A) is taken from Dıaz-Cordoves et al. (1995) and Claret et al. (1995), (B) is from
van Hamme (1993), and (C) is from Claret (1998b). In particular, the predicted values in
the temperature range that is consistent with our color measurements (Teff = [4820 ± 110]
K for log g = 3.0; Teff = [4830 ± 100] K for log g = 3.5; and Teff = [4850 ± 100] K for
log g = 4.0) are emphasized by thick solid lines. Model (C’) is by Claret (1998b) for stars of
Teff = (4850 ± 100) K for log g = 4.0. Although the measured value of the limb-darkening
coefficients alone favors this model, the model is inconsistent with our estimation of the
proper motion.

This figure "f6c.gif" is available in "gif" format from:
http://arxiv.org/ps/astro-ph/0004243v2
Top Related
Copyright © 2022 FDOKUMEN

