


Bahasa
Halaman
Hukum


HUMAN BEHAVIOR,
DEVELOPMENT and SOCIETY Volume 21 No. 3, July – September 2020 | ISSN 2651–1762
1
Undergraduate Student Stress, Coping and Resiliency in Thai Higher Education: A Call for a Positive Psychology-Based Intervention Douglas Rhein and Ian McDonald
7–18
Adaptation Strategies of Farmers to Counter the Impact of Violent Incidents in the Three Southern Border Provinces of Thailand Apisith Chailap and Ayut Nissapa
19–29
Formative and Summative Evaluations in Learning Physics: Do They Complement Each Other? Nur Rasfina Mahyan, Nor Hayati Jaya, Liyana Rosli
30–37
Language and What Else? Academic Integration of International Students in a Thai University Jariya Sairattanain and Jeffrey Dawala Wilang
38–46
A Study of Millennial Job Satisfaction and Retention Rachaniphorn Ngotngamwong
47–58
The Role of Teacher Support, Classmate Support, and Self-efficacy in Reducing Speaking Anxiety among University Students Using English as a Foreign Language Jenette Villegas-Puyod, Sumit Sharma, Simon Ajah, Marut Chaisanrit and Bancha Skuldee
59–68
Factors Affecting School Choice: Observations from Nakhon Ratchasima Municipality Banjob Boonchan and Arisa Nopakun
69–76
The Relationship between Leadership, Quality of Working Life, Compensation, and Welfare Affecting Job Satisfaction of Hospital Employees Pimpa Cheewaprakobkit and Busabong Chulapetch
77–87
Employee Perceptions of Organizational Climate Factors in a Private School System Gavin Hibbert
88–97
The Development of Academic English Language Learning Strategies and Academic Motivation among International University Students in Thailand Roger Oconnor Valenzuela and Darrin Thomas
98–107
2
Human Behavior, Development and Society, Journal of the Institute for Interdisciplinary Studies, Asia-Pacific International University Online ISSN 2651-1762 Editor Assistant Professor Dr Damrong Sattayawaksakul, Asia-Pacific International University, Thailand Managing Editor Assistant Professor Dr Wayne A Hamra, Asia-Pacific International University, Thailand Associate Editors Dr Daron Benjamin Loo, National University of Singapore, Singapore Professor Dr Warren Shipton (Retired), James Cook University, Australia Editorial Secretary Chomphunut Phutikettrkit, Asia-Pacific International University, Thailand
Administrative Board Editor (Chair) Managing Editor (Vice-Chair/Secretary) Associate Editors Director of Research Associate Director of Research Editorial Secretary (Recording Secretary)
Editorial Statement Human Behavior, Development and Society is a refereed multidisciplinary journal that explores a wide range of scholarly topics, especially in fields relating to the humanities and social sciences. It is published online three times a year and is available free of charge through the ThaiJo and Asia-Pacific International University (AIU) websites, with a limited number of hard copies available. The journal, originally entitled Catalyst, has been published since 2006 by Asia-Pacific International University, Muak Lek, Thailand, through its publishing arm Institute Press. The journal has the following objectives:
a). To stimulate the creation and synthesis of beneficial information, as well as its broad dissemination, especially in the varied fields of the humanities and social sciences,
b). To foster a deeper understanding regarding the impact of business policies and practices on society, and
c). To promote the adoption of best practices in communities through education, and to aid in the resolution of community issues for the betterment of society; this represents the development aspect referred to in its name.
Editorial Objectives The editorial objectives are to advance knowledge through use of classical – or the creation of innovative – methods of investigation, and to foster the examination of cross-cultural issues to increase mutual understandings among diverse social groups. Encouraging cooperative studies and scholarly exchange across borders, as well as within Thailand, remains one of its aims. The application of theoretical considerations to the field, business, or community situations is also an outcome that is sought.
3
Journal Positioning The journal is broadly based and has the potential to impact thinking and practices across a range of subject areas, dealing with substantive issues that arise in both developing and developed countries. It will likely appeal to readers with a broad appreciation of the social issues facing organizations, communities, and governments operating under varied challenges and constraints. Its contents are meant to appeal to both the academic community and practitioners in numerous areas of interest. The positioning of the journal means that a variety of topics is covered in most issues. These, in turn, differ in their philosophical content, academic appeal, and practical implications. Appropriate Content The journal covers a broad spectrum of topics. These include, but are not limited to, anthropology, allied health focused on community issues and health education, education from the primary to the tertiary levels, literature, language use and acquisition, business, management, finance, geography, psychology, social sciences, philosophy, and theology. Review essays and seminar/forum papers are also accepted when appropriately focused. Well-executed studies that address interesting and significant topics in the areas mentioned above are particularly welcomed. All articles accepted should make significant contributions to understanding and add to the corpus of knowledge in their respective fields. The following constitutes a partial list of topics that are considered potentially suitable for publication:
1. Applied linguistic or linguistic studies that examine issues related to communication, language pedagogy and use, as well as theories and meaning of language.
2. Religious or biblical studies that explore historical, philosophical, sociological, as well as hermeneutical issues.
3. Anthropological or ethnographic studies which seek to reflect cultural nuances of communities for a better understanding of the society.
4. Cultural/intercultural issues and diversity, including how tensions involving these parameters might be handled to achieve social justice and acceptance.
5. Review articles or studies in the fields of marketing, business, stock market trading, and auditing practices, and their significance to the business and broader community.
6. Organizational behavior, resilience, and the creation of a positive psychological work environment and job satisfaction.
7. Teaching strategies, interventions, assessment, and other issues to the betterment of society. 8. Policies and political movements, and their impact on educational development. 9. Violence, discrimination, and marginalization: how these issues are viewed in contemporary
society, and the factors contributing to their emergence. 10. Social trends in addictive behavior; how to address such issues creatively. 11. Impact of specific policies and interventions on health care, including how to promote positive
health outcomes in communities. 12. Innovative and cost effective approaches to health care and education in poor, rural
communities. Contact Information
Principal Contact Supporting Contact Asst Prof Dr Wayne Hamra, Managing Editor Ms Chomphunut Phutikettrkit, Editorial Secretary Asia-Pacific International University Phone: (036) 720 – 777 ext. 1152 Phone: (036) 720 – 777 ext. 1241 Email: [email protected] Email: [email protected]
4
Editorial Board Professor Dr Beulah Manuel Washington Adventist University, USA Professor Dr Jazlin Ebenezer Wayne State University, USA Professor Dr John Agak Maseno University, Kenya Professor Dr Jolly Balila Adventist University of the Philippines, Philippines Professor Dr Kai Arasola Retired Scholar, Finland Professor Dr Miguel Luna Retired Scholar, Peruvian Union University, Peru Professor Dr Warren Shipton Retired, James Cook University, Australia Assistant Professor Dr Damrong Sattayawaksakul Asia-Pacific International University, Thailand Assistant Professor Dr Francis Hutabarat Universitas Advent Indonesia, Indonesia Assistant Professor Dr Wayne A Hamra Asia-Pacific International University, Thailand Dr Daron Benjamin Loo National University of Singapore, Singapore Reviewers Distinguished Professor Dr Anya Khanthavit Thammasart University, Thailand Professor Dr Ben Maguad Andrews University, USA Professor Dr Elizabeth Role Retired Scholar, USA Professor Dr Gilbert Valentine La Sierra University, USA Professor Dr Jimmy Kijai Andrews University, USA Professor Dr John Matthews Andrews University, USA Professor Dr Loren Agrey Burman University, Canada Professor Dr Ron Bissell Retired Scholar, Canada Professor Dr Ronald Vyhmeister Middle East University, Lebanon Professor Dr Siroj Sorajjakool Loma Linda University, USA and Asia-Pacific
International University, Thailand Associate Professor Dr Benjamin Khoo New York Institute of Technology, USA Associate Professor Dr Gerald Schafer Carroll College, USA Associate Professor Dr Rajeevnath Ramnath University of Nottingham (KL Campus), Malaysia Associate Professor Dr Ronny Kountur Binus University, Indonesia Assistant Professor Advella Meikle Northern Caribbean University, Jamaica Assistant Professor Aiyada Kharawarattanapichet Payap University, Thailand Assistant Professor Dr Aniwat Kaewjamnong Thaksin University, Thailand Assistant Professor Dr Catherine Tan Loma Linda University, USA Assistant Professor Dr Darrin Thomas Asia-Pacific International University, Thailand Assistant Professor Julie Cook AdventHealth University, USA Assistant Professor Dr Lokweetpan Suprawan Bangkok University, Thailand Assistant Professor Nguyen Thi Phuong Linh Asia-Pacific International University, Thailand Assistant Professor Dr Nicole Mauzard Northern Caribbean University, Jamaica Assistant Professor Dr Phanasan Kohsuwan Panyapiwat Institute of Management, Thailand Assistant Professor Poomarin Intachai Asia-Pacific International University, Thailand Assistant Professor Dr Pragasit Sitthitikul Thammasat University, Thailand Assistant Professor Dr Sang-Hoon Jee Asia-Pacific International University, Thailand Assistant Professor Thanis Bunsom King Mongkut’s Univ. of Technology Thonburi, Thailand Assistant Professor Dr Thatchavong Julsawat Thepsatri Rajaphat University, Thailand Assistant Professor Dr Wanlee Putsom Asia-Pacific International University, Thailand Assistant Professor Dr Wichayanee Ocha Rangsit University, Thailand Dr Aunyarat Tandamrong National University of Singapore, Singapore Dr Bienvisa Nebres Asia-Pacific International University, Thailand Dr Beryl Ben Mergal Adventist University of the Philippines, Philippines Dr Chew Sze Ted Aenon Health Care, Malaysia Dr Divya Shukla St Theresa International College, Thailand
5
Dr Elvin Walemba Asia-Pacific International University, Thailand Dr Henry Foster Asia-Pacific International University, Thailand Dr Jade Abuga Asia-Pacific International University, Thailand Dr Jae Kim Retired Scholar, Sahmyook University, Korea Dr Jariya Sudtho Srisaket Rajaphat University, Thailand Dr Jeffrey Dawala Wilang King Mongkut’s Univ. of Technology Thonburi, Thailand Dr Lucas Kohnke Hong Kong Polytechnic University Dr Mack Tennyson Independent Scholar, England Dr Meena Madhavan Chiang Mai University, Thailand Dr Namala Tilakaratna National University of Singapore, Singapore Dr Novriyanto Napu Gorontalo State University, Indonesia Dr Oktavian Mantiri Universitas Klabat, Indonesia Dr Paluku Kazimoto Asia-Pacific International University, Thailand Dr Parinda Jantori Kasatesart University, Thailand Dr Phitzesa Phongpanphaengpanga Vongchavalitkul University, Thailand Dr Rachaniphorn Ngotngamwong Stamford International University, Thailand Dr Romeo Barrios Adventist University of the Philippines, Philippines Dr Rosario Canon Garcia St Theresa International College, Thailand Dr Sayamol Nongbunnak Dhurakit Bundit University, Thailand Dr Stephen Louw King Mongkut’s Univ. of Technology Thonburi, Thailand Dr Stuart G. Towns King Mongkut’s Univ. of Technology Thonburi, Thailand Dr Surapee Silpachan St John’s University, Thailand Dr Vanlapa Wonchan Payap University, Thailand Dr Youssry Guirguis Asia-Pacific International University, Thailand Mr Nakhon Kitjaroonchai Asia-Pacific International University, Thailand Publishing Schedule Human Behavior, Development and Society is published four times per year by Institute Press during the months of March, June, September and December.
All opinions, errors, omissions and such expressed in Human Behavior, Development and Society are the responsibility of the authors. © Institute Press, Asia-Pacific International University, 2020
Indexing Thai-Journal Citation Index Centre (TCI) EBSCO Information Services
Current and Past Issues Volume 21 No 3 September 2020 Volume 13 June 2016 Volume 21 No 2 June 2020 Volume 12 December 2015 Volume 21 No 1 March 2020 Volume 11 June 2015 Volume 20 No 4 December 2019 Volume 10 December 2014 Volume 20 No 3 September 2019 Volume 9 July 2014 Volume 20 No 2 June 2019 Volume 8 December 2013 Volume 20 No 1 March 2019 Volume 7 December 2012 Volume 19 December 2018 (HBDS) Volume 6 December 2011 Volume 18 August 2018 (Catalyst) Volume 5 December 2010 Volume 17 April 2018 Volume 4 November 2009 Volume 16 December 2017 Volume 3 November 2008 Volume 15 June 2017 Volume 2 November 2007 Volume 14 December 2016 Volume 1 November 2006
6
From the Editor
Human Behavior, Development and Society (HBDS) is an interdisciplinary peer-reviewed journal of Asia-Pacific International University. HBDS aims to publish findings and discussions of all aspects of human behavior, development, and society. The journal endeavors to advance knowledge through the use of classical methods of investigation and foster the examination of cross-cultural issues to increase mutual understanding among diverse social groups in the international community. All articles published in the journal are indexed with the Thai-Journal Citation Index Center (TCI). The editorial team is committed to maintaining rigorous peer review standards and the highest level of ethical integrity, ensuring consistency and scientific rigor in each of its research articles.
The September 2020 issue of HBDS includes 10 articles from various researchers; eight of these studies were conducted by external scholars, and two by internal researchers. We are delighted to see reports and findings from various content areas, including liberal arts, business, education, psychology, and political science. The majority of the articles in this issue reflect viewpoints from Thai and other Asian contexts. We hope this issue of HBDS will contribute to the academic and professional development of society, and serve as a source of information for research in various disciplines.
We appreciate all the authors, reviewers, editorial board members, executive board members, and
journal staff who have contributed to make this issue a reality. Finally, we would like to invite readers to publish your valuable papers with us. You can find more information on our website, https://www.tci-thaijo.org/index.php/hbds. We would also appreciate comments or suggestions from you to help us improve the journal.
Assistant Professor Dr Damrong Sattayawaksakul, Editor Human Behavior, Development and Society Asia-Pacific International University
Human Behavior, Development and Society ISSN 2651-1762, Vol 21 No 3, September 2020
7
Undergraduate Student Stress, Coping and Resiliency in Thai Higher Education: A Call for a Positive Psychology-Based Intervention
Douglas Rhein and Ian McDonald, Mahidol University International College, Thailand
Date Received: 22 May 2020 Revised: 13 July 2020 Accepted: 28 July 2020
Abstract Mental health issues within Asian higher education continue to be problematic for educators, administrators, and policy makers. Within the Thai context, specific concerns surrounding student orientation practices, social and academic culture, and avoidance of psychological treatment tend to lead to a greater prevalence of undiagnosed distress. Student stress, anxiety, and lack of resiliency are detrimental to the adjustment to higher education as well as to the overall education experience. As the prevalence of psychology disorders continues to increase among Thai students, this article calls for the integration of positive psychology-based interventions within the Thai hazing ritual commonly referred to as SOTUS or Rap Nong. The use of specific positive psychology interventions with a culturally integrated focus within the Thai system will increase positive coping strategies, decrease stress and anxiety, and create a more positive learning environment. The development of positive coping mechanisms can be facilitated through the introduction of positive psychology-based interventions within the Thai higher education system. Keywords: Positive psychology, resiliency, stress, interventions, higher education Introduction to Common Mental Health Issues in Thai Higher Education Attending university is an important and often stressful experience for students and presents students with new psychological challenges. It is argued that the commonly practiced Rap Nong (SOTUS) hazing rituals should be thoroughly integrated with various positive psychology-based interventions in an effort to reduce stress, anxiety, and depression. This is critical to the development of resilience and specific coping strategies, for most undergraduates enter higher education at an age often associated with the onset of mental health problems (Kessler et al., 2007). Arnett (2000) used the term emerging adulthood to describe this stage of development when students are adjusting to challenges involved in facing new academic and social situations as well as the transition from adolescence. While many view the experience as exciting, constructive and react positively, significant numbers of students suffer from the negative consequences of this transition. To date, much of the research on undergraduate stress, anxiety, and depression has a Western emphasis, yet these issues also impact students in Asia (Peltzer et al., 2017). Therefore, it is necessary to explore student stress and seek practical methods of reducing the negative impact of stressors. Theories of stress originated with a physiological orientation (see Selye, 1976), led to psychological approaches to stress within the cognitive paradigm (see Lazarus & Folkman, 1984; McGrath, 1982). More recently, cognitive theories of stress have focused on the relationship between the individual and the situation. The processes central to stressor mediation identified as significant are the appraisal of the stressor, coping mechanisms employed, and potential development of resilience. In this article we explore student stress and outline the role stress plays among students in higher education within the Thai context in association to the related cognitive processes associated with stress. Intervention might be initiated through weekly freshmen seminar meetings at colleges throughout Thailand. Stress is broadly considered the reaction to a stressor but the nature of a stressor is subjective. For some students writing an essay is more stressful than giving a presentation and yet for others the opposite is true. From this perspective, stress is a normal part of life and should be embraced (McGonigal, 2015), yet in academia it is also a common source of concern among students (Goldman & Wong, 1997) and faculty (Misra et al., 2000). Research in Thailand has indicated that there are some stressful life events associated with psychological problems, which include social relationships, immediate family members, teachers, poor
8
health, lack of interest in course content, and failed personal relationships (Thanoi et al., 2010). This study indicated that adolescents who experienced stressful events may become depressed. The negative reactions to the aforementioned stressors have been described in multiple studies (Rungsan et al., 2017; Thanoi et al., 2010). Additional research from Thailand indicated that students with higher levels of stress and lower levels of psychological well-being were more likely to consume alcohol, had a greater risk of depression, and experienced sleep disturbances (Calderon et al., 2019). The latter has been shown to be negatively correlated with emotional problems, anxiety, and suicidal ideation (Sarchiapone et al., 2014). While much of the research reported tends to focus on negative outcomes as opposed to intervention for well-being (Naci & Ioannidis, 2015), it is important to identify the activities that impact student experiences, health, and functioning. SOTUS or Rap Nong—A Wrong Rite of Passage
Rap Nong or SOTUS is a series of events and activities, often weeks long, where new students gather together to meet senior students. Essentially, it is the introduction to the university culture and way of doing things. These SOTUS rituals involve various activities from singing and dancing to forced binge drinking, scandalous behavior and occasionally fatalities, as regularly reported in the local press (Saiyasombut & Voices, 2015). SOTUS is the Thai version of fraternity or military hazing in the United States, but it is conducted in Thai in universities. SOTUS stands for Seniority, Order, Tradition, Unity, and Spirit. The purpose of this article is to persuade Thai academic institutions to accept that, given the increasing prevalence of stress, anxiety, and a lack of coping strategies, the Rap Nong events should be integrated with positive psychology interventions. SOTUS continues today as it is commonly understood as a valuable tradition and, given Thailand is a hierarchical society, first year students must learn to accept hierarchical relations and thus develop obedience to upperclassmen (Winichakul, 2015). Obedience to power and order and the uncritical acceptance of tradition is the antithesis of the mission of higher education today. Given the real psychological problems students are facing, it is necessary to integrate specific aspects of the SOTUS events with the development of coping mechanisms and methods to create greater well-being. The creation of a positive vehicle to ease the transition to higher education should assist students with learning and developing a more positive attitude towards their education (McInnis et al., 2000). Whether one considers initiation rituals of Rap Nong a rite of passage, a community ritual, a ritual of power and authority, or an important tradition (Chamchoy & Burford, 2019), this article attempts to demonstrate that positive psychology-based interventions would be of greater long-term benefit than the rituals of the SOTUS system. The subsequent section of this article will introduce positive psychology in general and then specific interventions to be integrated into the SOTUS system. Positive Psychology Based Intervention Due to the increased prevalence of mental health issues in Thai undergraduate programs, greater attention should be given to this student cohort. The potential of resilience training and the introduction of resilience-based practices has the potential to reduce stress (Steinhardt & Dolbier, 2008). It is reasonable to assume that assisting incoming undergraduate students to develop or improve the quality of this transition will improve their overall mental health and potentially have an impact on their academic performance. Therefore, the introduction of resilience intervention strategies aimed at improving coping skills may prove beneficial to reduce student stress during the freshmen seminar or during the SOTUS activities. The field of positive psychology emphasizes the importance of cultivating mental health in addition to eliminating mental illness, which has been the recent primary focus of psychology (Seligman et al., 2006). Efforts to understand and develop happiness and well-being have been around for many years. The modern emphasis commenced with William James’ concept (1902) of ‘healthy mindedness,’ and later in ideas from humanistic psychologists, including Rogers’ concept of the fully functioning person, Maslow’s call to study healthy people to understand self-actualization, and others (historical overview—Froh, 2004). However, the field of positive psychology began in 1998, when Dr.
9
Martin Seligman formally called for psychologists to emphasize research on human excellence and goodness, character strengths, and building the best things in life. Seligman did not suggest replacing the study of mental illness, but he claimed that the almost exclusive focus of psychology on understanding and treating psychological problems did not do much to contribute to the development of thriving individuals or communities (Seligman, 1998; Seligman & Czikszentmihalyi, 2000). The disease-model perspective that had dominated psychology for so long approached mental illness with the goal of eliminating psychopathology, assuming that the absence of mental illness equals mental health. Positive psychology posits that mental health is more than the absence of psychological disorders and is concerned with the study of all that is good in life and on developing methods to improve well-being for individuals, families, and communities (Seligman & Czikszentmihalyi, 2000). Many organizations and countries have taken notice of Seligman’s call and are focusing on the importance of improving individual well-being. For example, Bhutan has formally adopted the happiness of its people as its principal goal; France and England have launched initiatives to measure national well-being; China and Australia are considering adding official happiness measures to economic measures of prosperity, just to name a few (see Bok, 2011 and Donaldson et al., 2015 for a review). More recently, Scotland, New Zealand, and Iceland also have made well-being a priority (Fisher, 2019). With so many potential benefits, the question then becomes, are there effective ways to improve our well-being? Evidence from studies in positive psychology suggests that the answer is yes (Sin & Lyubomirsky, 2009; Donaldson et al., 2015). Frederickson (2001) proposed the broaden-and-build theory of positive emotions to better understand this process. This theory states that positive emotions, such as love, interest, pride, contentment, and joy, are able to broaden an individual’s attention and habitual way of thinking and acting. Positive emotions set people on a path that, over time, builds lasting personal, physical, cognitive, emotional, and social resources (Frederickson et al., 2008). For example, the urge to play and to be creative is broadened by the experience of the positive emotion of joy. Engaging in different types of play is known to build enduring physical, cognitive, and social resources (Frederickson, 2001). Similarly, the positive emotion of pride, after an achievement, broadens by stimulating the urge to share the news with others and to think of new and more challenging goals in the future. Sharing news can build enduring resources by strengthening existing social bonds and attachments as well as increasing the individual’s self-confidence and feeling of efficacy. Subsequent work has found a causal relationship between learning to generate positive emotions and increased life satisfaction, and that the effects increase with time (Fredrickson & Joiner, 2018). Additional reports of meta-analyses of positive psychology interventions (PPIs) have shown consistent beneficial effects on subjective and psychological well-being and depression (Hendriks et al., 2018). With sustained effort and training, then, positive psychology research suggests that levels of well-being can be increased. Positive Psychology in Asia Around Asia, the influence of positive psychology has spread rapidly. From nationwide initiatives in schools across Bhutan, to more targeted applications in India, Singapore, and China, countries in the region are implementing programs aimed at improving well-being (Seligman & Adler, 2018). For example, in 2010, Beijing Normal University School of Psychology hosted the International Conference on Positive Psychology and Education. Likewise, Tsinghua University hosted a 2010 conference on positive psychology aiming to improve well-being in educational institutions (Obrien, 2010). Tsinghua University also runs a Positive Psychology Research Center, highlighting the importance of the topic (Seligman & Adler, 2018). Clearly, there is an interest in the potential benefits of incorporating elements of positive psychology into classrooms in Asia. With the spread of these ideas comes the need to carefully consider how relevant the findings of experiments using primarily Western samples of education are to non-Western populations and educational systems. The theoretical perspective of cultural psychology assumes that psychological processes and culture complement each other. Implicit in this assumption is the belief that processes of the mind (e.g., conceptions of happiness and well-being) are not uniform across cultures and that
10
a set of constructs and measures that is valid in one culture may not be meaningful in another cultural context (Shweder, 1991; Lu & Gilmour, 2004). Of central importance, then, in considering the use of exercises in non-Western cultures is whether meaningful differences exist in the conception of happiness and well-being, and what culturally acceptable routes exist for its attainment. Research into positive psychology exercises using non-Western samples is still quite limited in scope and in quality (Hendriks et al., 2018). Initial studies suggest that certain activities are universally beneficial, while others may benefit from being modified to ‘fit’ the specific culture (Ng & Lim, 2019). For example, the individualist view held in European and North American cultures strongly defends the independence of the self in relation to others. Happiness in Western cultures tends to be described using factors such as frequency of experience of positive emotions, self-esteem and affirmation of personal worth through personal achievement (Uchida et al., 2004; Lu & Gilmour, 2004). Seeing oneself as intelligent, talented, or kind may therefore effectively protect the Western individual from the anxiety of seeing oneself as stupid, talentless, or cruel. Comparatively, the collectivist view seen in East Asian cultures emphasizes harmony in social relationships and interpersonal connectedness. This suggests that well-being in collectivist cultures depends on one’s ability to fulfill social roles and obligations as well as one’s readiness to respond to social expectations. Compassion, support, and mutual sympathy are seen as ways to happiness in East Asian Cultures (Uchida et al., 2004). So, adapting positive psychology interventions to fit the values and beliefs of the culture may increase their overall effectiveness. Positive Psychology Interventions
One area of positive psychology that has particular relevance for educators is the development of PPIs. The PPIs are activities designed to increase positivity in daily life and, subsequently, coping skills and resilience. Many PPIs have been developed and tested, and some consistently have shown significant positive effects on increasing well-being. The next section briefly describes seven categories of PPIs with examples (Parks & Titova, 2016; Boehm et al., 2011), which should be integrated into the SOTUS system.
Gratitude. The purpose of this group of PPIs is to cultivate feelings of gratitude toward people or other external conditions that have changed one’s life for the better in some way. They may be focused on the act of reflection or also can include an active social component. For example, keeping gratitude journals, such as “Count Your Blessings” is a PPI that asks students to write down three or more good things that happened and to reflect on why. Some evidence shows that doing this activity once per week is more effective than doing it every day (Duckworth et al., 2005). Other studies have found that actively expressing gratitude has beneficial effects (Parks & Titova, 2016). “The Gratitude Visit” is a PPI that asks people to first think of someone who did something that has changed their life for the better. Once one has chosen the influential person they wish to focus on, then they are asked to write a letter of gratitude to this person explaining what they did and the effect it has had on their life. Finally, participants are asked to make an appointment with the influential person and to read the letter to them face to face (Seligman, 2011, pp. 30–31). Variations of these activities has shown that well-being may be improved by decreasing depressive symptoms, increasing the experience of positive emotions, and improving health (Parks & Titova, 2016). Gratitude-based interventions that strengthen social connections may be a good cultural fit with Asian cultures that emphasize strong familial bonds and feelings for the group (Hendricks, et al., 2018).
Kindness. Research has found that PPIs promoting kindness enhance well-being, whether through prosocial spending, or other deliberate kind acts not involving money. Kindness and happiness often occur together and reinforce each other (Parks & Titova, 2016). One useful PPI involves spending small amounts of money on others, rather than on themselves, for example, buying a meal for a homeless person, or buying a coffee for a friend. Researchers found that money, when spent on others, can lead to higher well-being. In “Performing Acts of Kindness,” participants are asked to perform five acts of kindness for others in one day. Studies have found this to be more beneficial than doing one kind act
11
per day for a week (Lyubomirsky et al., 2004). PPIs such as these fit well into Buddhist cultures, which stimulate feelings of compassion for others and encourage meaningful acts of kindness.
Savoring. Savoring activities ask people to pay close attention to activities that normally give them enjoyment, but that they may take for granted, so that such pleasant experiences can be appreciated, intensified or prolonged. In other words, stop and smell the roses in life (Lyubomirsky, 2008, pp. 191–193). PPIs designed to increase savoring may be focused on developing savoring as a general skill to be applied across different situations, or as a specific skill to be taught and practiced. In one PPI, participants were asked to take 2–3 minutes per day to reflect on two pleasurable experiences, and to prolong their enjoyment by attending to them. For example, a person might concentrate on the many aspects of a favorite fruit, noting the smell, texture, appearance, and flavor. Another savoring PPI involves teaching participants to photograph things that are beautiful and meaningful to them (Parks & Titova, 2016). “Replaying One’s Happiest Days” is a PPI that asks students to take 10–15 minutes and think privately about their happiest experience. It may be important not to write the experience down or share it (Boehm & Lyubomirsky, 2009). Savoring PPIs, then, can range across sensory, cognitive and emotional stimuli. Research suggests focusing one’s awareness on all parts of an experience can lead to benefits, including fewer depressive symptoms, more positive emotions, and higher levels of well-being (Parks & Titova, 2016). Asian populations, with varied natural wonders and rich cultural achievements in art, food, and music, should benefit greatly from savoring interventions.
Empathy. Meaningful social relationships are essential to well-being (Seligman, 2011). PPIs that focus on strengthening social connectedness aim to develop empathy for others. “Loving Kindness Meditation” is a PPI that teaches people to cultivate warm, loving feelings for self and others by focusing their attention first on a loved one (such as a close relative), and then expanding these feelings to include themselves and then other people. Researchers have found that regular practice of Loving Kindness Meditation has robust benefits, including decreases in depressive symptoms, as well as increases in positive behaviors and emotions. (Frederickson et al., 2008). Other activities to increase empathy focus on developing the self-other overlap and the ability to see things from another’s perspective, resulting in increased understanding and stronger social bonds (Parks & Titova, 2016). Learning the skill of responding actively and constructively to good news from a friend or loved one developed one’s empathy and has been shown to strengthen relationships (Seligman, 2011). Another PPI involves making a new social connection, however small, each day for a week. Examples include chatting with a classmate they do not know well, or asking a worker at a favorite restaurant about their day. Participants are asked to choose a day to spend an hour with an important person and to do something meaningful to connect with them. Then, they are to write down what they did and how it made them feel. As mentioned above, collectivist societies value activities that strengthen an appreciation of strong, interdependent relationships (Hendriks et al., 2018). Thus, the benefits from PPIs cultivating empathy are likely to be amplified.
Optimism. Optimism based PPIs develop the ability to create positive expectations for the future and to modify present behavior to more effectively follow these ideals. The “Best Possible Self” activity asks participants to imagine their life as it would be if everything went well in all areas, including career, relationship, lifestyle, etc., and write about it for 15 minutes (Lyubomirsky, 2008). In another version, called “Life Summary,” people are asked to write a one to two-page biography of their life as if summarizing the successes and accomplishments of a long, fruitful life. They are then asked what they can do in the present to begin creating that life (Seligman et al., 2006). In an effort to maximize its benefits, Sheldon and Lyubomirsky (2006) found that having participants regularly reflect back on what they wrote strengthened and prolonged its positive effects. Societies that emphasize harmonious relations over individual achievement can use optimism PPIs such as the “Life Summary” and the “Best Possible Self” to enhance an individual’s ability to successfully fulfill their culture’s expected social roles and obligations.
Strengths. Character strengths are innate qualities that are energizing, intrinsically motivating to use, and feel authentic (Peterson & Seligman, 2004). PPIs targeting the identification and use or
12
development of one’s character strengths lead to increased well-being and fewer depressive symptoms (Lyubomirsky, 2008). For instance, clients may be asked to complete the VIA survey of character strengths, which identifies their top character strengths. Simply identifying strengths can have positive effects. However, using them in new ways or developing them is more impactful than simply identifying them (Seligman et al., 2005; Seligman, 2011). More specifically, asking people to identify their top five character strengths, then use them in novel ways every day over the course of a week has been shown to increase positive emotions and well-being (Parks & Titova, 2006). For example, a person with the character strength of vitality/zest might volunteer to do an activity at work. Someone high on appreciation of beauty could attend a concert and savor the experience. Since these PPIs involve doing things that are intrinsically pleasing, it follows that increasing their frequency and variety would affect well-being positively. Another PPI asks people to compare their strengths, identify some they share with a family member, friend, or classmate, and plan an hour that taps into one or more of their shared strengths (Seligman, 2011). While identifying and using character strengths has universal appeal, PPIs involving family, friends, or larger groups may be particularly well suited for cultures that emphasize harmony and the success of the group over the individual.
Meaning. Having meaning in one’s life is an important predictor of life satisfaction. Many PPIs facilitate a better understanding of what brings meaning, and help us identify actions that can enhance their achievement. One such activity involves setting intrinsic goals that will lead to autonomy, competence or relatedness (Lyubomirsky, 2008). For example, deciding to join an adventure club that requires weekly attendance and regular interaction with others satisfies the intrinsic need to relate to others. Similarly, setting a goal to learn a skill, such as playing a musical instrument, or photography techniques, will lead to feelings of worth that are intrinsically rewarding. Other meaning-based PPIs focus on meaning-making after negative events, though reflection or writing, can help develop effective coping skills (Parks & Titova, 2016). Reflecting on and selecting goals that satisfy needs and pursuing them is intrinsically rewarding and produces larger gains in well-being than the pursuit of circumstantial material goals (Sheldon et al., 2010). Like many of the PPIs, aligning one’s personal goals with activities that are meaningful to the culture and society are likely to have a positive impact in collectivist societies. Why These Interventions
It is important to note that the interventions discussed herein are a process to assist students with the development of resilience and are not necessarily generalizable to other stressors. The ability to adequately ameliorate potential protective mechanisms varies contextually and temporally (Vanderbilt-Adriance & Shaw, 2008). As with other behavioral and cognitive interventions, the impact on the participants also depends on the individual and the organization or environment which the individual is interacting in. When considering the value of PPIs in an educational setting from the point of view of the cultural dimension described above (individualism vs. collectivism), it becomes clear that culture may mediate the effectiveness of some positive psychology strategies. For example, the Western individualist values of self-improvement, self-expression, and the pursuit of individual goals seem to indicate a suitable fit with the PPIs that develop the individual (see above). If one’s culture values affirmations of individual worth (e.g. “I” am “smart”), it follows that the PPIs of identifying and using personal character strengths, pursuing goals that are meaningful to the individual, or imagining one’s ideal future would be more appropriate, and perhaps more effective, than cultivating gratitude.
On the other hand, individuals coming from collectivist cultures that emphasize self-control, interdependence, maintaining positive relationships, and fulfilling expected roles in society would likely benefit more from using PPIs that cultivate feelings of gratitude (see above). More specifically, expressing one’s gratitude to a significant other, or performing acts of kindness for others, both highlight an awareness of interdependence with others, promote harmony and demonstrate effort toward maintaining positive social relationships. Some PPIs may be adapted to better fit the culture’s focus. For example, the PPI of pursuing goals meaningful to the individual may be changed slightly to focus on pursuing group goals. Similarly, the PPI of imagining one’s ideal future could be adapted
13
slightly to encourage the imagining of successfully fulfilling social obligations. There are many cultural factors to consider when deciding how to incorporate PPIs into a classroom or curriculum, and there is no one-size-fits-all approach to improving well-being, even within a single culture. Questions concerning individualism vs. collectivism, religiosity, restrictions on activities, customs with long histories, and more, all have clear and direct impact on which PPIs to use. Cognitive Appraisal and Coping Strategies
People tend to behave in predictable patterns based on the agents of socialization within their culture. These agents, be they religion, media, family education systems, or government shape the understanding and stress responses of the people. The concept of culture is necessary to contextualize the appraisal, coping, and resilience as found in the Thai context. The development and support of an emic perspective within this theoretical paradigm is supported by Mahoney and Bergman (2002) who agree that the specific sociocultural responses to stressors and the development of context specific resilience must be considered. Depending on the culture, there are variations to the appropriate strategy to implement when confronted with a stressor (Kim, 2008). However, not all cognitive and behavioral patterns produce positive results or are conducive to mental health. Therefore, the ability to effectively appraise and cope with stressful events is necessary to maintain positive mental health.
Cognitive appraisal is defined as the process of evaluating whether an interaction is relevant to one’s well-being and if so, how (Folkman et al., 1986). During stressful life events, students often implement two cognition processes that are important to their ability to understand the stressor. Primary cognitive appraisal is the process of evaluating the importance or significance of the event. Secondary appraisal involves one’s ability to overcome, cope or improve life with the stressor (Lazarus, 1993). Both primary and secondary cognitive appraisals interact to determine how individuals respond to stressors in the environment.
Lazarus and Folkman (1984) defined coping as “the constantly changing cognitive and behavioral efforts to manage specific external and/or internal demands that are appraised as taxing or exceeding the resources of the person” (p. 141). When students encounter stress, anxiety, and other emotionally distressing experiences, coping is considered the most relevant aspect of the psychological study of situational adaptation. While there are many different patterns of coping and frameworks for analysis, the work by Lazarus (1993) began to distinguish between the major types of coping styles and concluded that the two major forms were (i) emotion focused coping that is based on decreasing the emotional distress through specific cognitive strategies, managing the reaction to the stressor as opposed to manipulating aspects of the situation causing the stressor and (ii) problem focused coping that is based on eliminating or deteriorating the intensity of the stressor via problem solving, removing the stressor or removing oneself from the influence of the stressor (Lazarus & Folkman, 1984). It is acknowledged that problem focused coping strategies are beneficial when the stressor is within one’s control whereas emotion focused coping is better suited to responding to stressors that are beyond one’s control. These adaptive coping strategies often are implemented concurrently whereby the individual utilizes both to successfully overcome the impact of a stressor (Folkman & Moskowitz, 2004). An additional coping style, avoidance coping, was later suggested (Endler & Parker, 1990) that included the tendency for individuals to avoid stressful situations, yet avoidance coping is associated with an increase in psychological dysfunction (Higgins & Endler, 1995).
Men and women respond to stress and cope differently. Women are more likely to choose emotion focused coping strategies while men are more likely to choose problem-focused coping strategies (Lazarus & Folkman, 1984). It has also been shown that women are more likely than men to ruminate or employ emotion focused coping (Thoits, 1995). This has an impact on the gender-based experience of stress as emotion-based coping strategies are often less effective at reducing stress when compared to problem-focused coping strategies (Carver et al., 1989). This variance in the gendered pattern of rumination may explain partially why adolescent males in Thailand are more likely to exhibit behavioral problems (truancy, drug and alcohol usage, and aggression) whereas adolescent females are more likely to experience negative affect such as stress, anxiety and depression

14
(Charoensuk, 2007; Pengpid & Pelzer, 2012). Overall, the role of cognitive appraisal and student coping strategies are both important in gaining a better understanding of student stress. Developing Resilience
An additional cognitive process linked to the reduction of student stress and the negative outcomes of unhealthy coping strategies is the development of resilience. Early research on resilience (Block & Block, 1980) referred to this as ‘ego-resilience’ and categorized resilience as a trait which one either has or does not have. Thus, the early notion of resilience involved traits or protective factors (Rutter, 1985). As resilience research became more prominent in the 1990s, many of the conceptual models explored the individual protective characteristics as opposed to the process of overcoming stressors or life adversities (Luthar et al., 2000). These have since been developed and refined to include specific characteristics such as hardiness (Bonanno, 2004), self-efficacy (Gu & Day, 2007), and self–esteem (Kidd & Shahar, 2008).
A debate began to emerge regarding the conceptualization of resilience as a trait as opposed to a process (Windle, 2011). The concept of resilience as a combination of protective factors implies that one could develop these factors through cognitive and behavioral change. This began the transition from conceptualizing resilience as a trait to a process. Soon thereafter, Agaibi & Wilson (2005) defined resilience as a “complex repertoire of behavioral tendencies” (p. 197). This transition demonstrates one of the problematic aspects of defining resilience. Some researchers approach this construct as a trait yet others conceptualize resilience as a process. This discrepancy hinders the veracity of scholarly findings related to resilience (Davydov et al., 2010). Yet this failure to operationalize the construct and develop specific measurement tools has not driven this complex phenomenon into obscurity as exhibited by the work of scholars (Luthar, 2006; Rutter, 2006, Rutter, 2012, Walsh, 2015). While the definition of resilience may be problematic, most agree that resilience involves both the ability to overcome adversity and some form of positive adaptation to the situation (Luthar, 2006). In an effort to operationalize a variable for this intervention proposal, it is necessary to clearly define one’s terms. Therefore, the working definition used in this proposal is based on the work of Luthar et al. (2000), which argued that resilience is “a dynamic process encompassing positive adaptation within the context of significant adversity” (p. 543). Appraisal, Coping and Resilience—The Meta-model of Stress
It is important to differentiate coping and resilience as occasionally these terms are used interchangeably, yet they are conceptually distinct (Campbell-Sills et al., 2006). Coping is the positive or negative cognitive response to a stressor whereas resilience, once developed, is a positive characteristic that is present even prior to a stressor and positively influences the appraisal and coping responses. As such, the development of resilience has a protective impact that subsequently influences the stress appraisal and coping processes.
The interaction between people and the environment is an integral aspect of stress, appraisal, coping, and the development of resilience. The meta-model of stress (Fletcher & Fletcher, 2005) indicates that stressors are a reaction to our environment and are interpreted by the responding sensation and perception processes that activate the appraisal and coping sequences. This results in positive or negative responses and resilience development or failure. Therefore, each variable is related to and influences the stress response process whether it be biological via sensation and perception of stimuli or through metacognition in response to the emotional appraisal and the chosen coping mechanism.
The ability to improve university student resilience and coping strategies would likely have a positive impact on an institution’s ability to more effectively manage student stress levels and thus potentially decrease anxiety and depression (Houston et al., 2017). Given the increased psychological and behavioral issues Thai undergraduates face, there is a growing need for universities to develop comprehensive and innovative interventions designed at improving the quality of their mental health. An intervention should increase resilience, assist in the development of greater coping skills, and have
15
the potential to positively impact student’s mental health and academic ability. Steinhardt and Dolbier’s work (2008), which involved the use of a resilience intervention course included psychoeducation, cognitive-behavioral therapy techniques, rational emotive therapy, and other cognitive components, found that college participants reported greater resilience, coping skills, and less stress. Additionally, the development of cognitive appraisal techniques and analysis of typical students’ coping strategies allows the participants the opportunity to develop greater resilience. This is exemplified in further research by Leppin et al. (2014), who conducted a meta-analysis on resilience intervention programs aimed at improving resilience and the associated mental health issues. They concluded that the intervention programs had a positive effect on the participants. More recently, use of the Resilience and Coping Intervention has been used with undergraduates to demonstrate the important link between these two cognitive processes (First et al., 2018). In summary, stress, cognitive appraisal, coping, and the development of resilience are important concepts that impact student mental health. The development of resilience is a personal asset that has the potential to protect students from the negative appraisal of academic or social stressors and reduce the negative coping strategies (such as avoidance), which can positively influence other mental processes such as the promotion and development of meta-cognition. As students learn various methods to develop resilience, they should begin to give greater consideration to the nature of a stressor, their tendency to opt for certain healthy or unhealthy cognitive appraisals, and begin to use more positive cognition strategies, such as introspection and metacognition. Both educators and school psychologists are morally and professionally obligated to develop tools and practices that help students develop more effective appraisal, coping mechanisms, and the protective elements that eventually lead to resilience. An effective method of completing this is through the implementation of positive psychology interventions, which involve the above-mentioned variables, as well as a greater focus on positive psychology and well-being as outlined by the work of Seligman (2011). Conclusion
In this article the implications of stress and anxiety for educators and administrators was examined, particularly in the Thai context, by exploring some of the most effective positive psychology interventions in recent scientific literature, and describing how these currently are being used in educational settings. Finally, the PPIs were discussed in relation to the cultural dimension of individualism vs. collectivism. There is much interest internationally in the practical application of concepts from positive psychology to the classroom and these PPIs should be incorporated into the first-year student orientation or seminar sessions. The literature available on the use of PPIs gives reason to be excited about potential changes in what many feel has become a problematic educational system. It is important at this early stage of development for educators and administrators to consider carefully the impact that cultural differences might have on the effectiveness of the methods they choose to incorporate. Well-being researchers are aware of the influence that culture has on how a group defines happiness, as well as socially acceptable methods of attaining it. This awareness must be expanded and used to guide the development and testing of culture specific PPIs, as well as their integration into existing schools. To summarize, stress, anxiety, and the lack of coping skills has a significant negative impact on a student's adjustment to the undergraduate experience. There are many cognitive processes associated with this including appraisal, the development of both adaptive and maladaptive coping mechanisms, and the subsequent development of resiliency. The PPIs discussed herein are intended to decrease unhealthy cognitive tendencies and introduce concepts of coping and resiliency to support all first-year students. The integration of these PPIs into the SOTUS or Rap Nong system should be considered by educational administrators and policy makers within the Thai context. The authors suggest that this system be incrementally introduced to the Thai higher education system and data analyzed to determine if this is a suitable method to reduce student stress and positively impact the development of resilience.
16
References Agaibi, C. E., & Wilson, J. P. (2005). Trauma, PTSD, and resilience: A review of the literature. Trauma, Violence
and Abuse, 6(3), 195–216. https://doi 10.1177/1524838005277438 Arnett, J.J. (2000). Emerging adulthood: A theory of development from the late teens through the twenties.
American Psychologist, 55(5), 469–480. Block, J. H., & Block, J. (1980). The role of ego-control and ego resiliency in the organization of behavior. In W.
A. Collins (Ed.), Minnesota symposium on child psychology (pp. 39–101). Erlbaum. Boehm, J. K., & Lyubomirsky, S. (2009). The promise of sustainable happiness. In S. J. Lopez (Ed.), The Oxford
handbook of positive psychology (2nd ed.; pp. 667–677). Oxford University Press. Boehm, J. K., Lyubomirsky, S., & Sheldon, K. M. (2011). A longitudinal experimental study comparing the
effectiveness of happiness-enhancing strategies in Anglo Americans and Asian Americans. Cognition & Emotion, 25(7), 1263–1272.
Bok, D. (2011). The politics of happiness: What government can learn from research on well-being. http://press.princeton.edu/chapters/i9107.pdf
Bonanno, G. A. (2004). Loss, trauma and human resilience: Have we underestimated the human capacity to thrive after extremely aversive events? American Psychologist, 59(1), 20–28.
Campbell-Sills, L., Cohan, S. L., & Stein, M. B. (2006). Relationship of resilience to personality, coping, and psychiatric symptoms in young adults. Behaviour Research and Therapy, 44(4), 585–599.
Calderon Jr., R., Pupanead, S., Prachakul, W., & Kim, G. (2019). Happiness, perceived stress, psychological well-being, and health behaviors of Thai university students: Preliminary results from a multinational study on well-being. Journal of American College Health, 1–9.
Carver, C. S., Scheier, M. F., & Weintraub, J. K. (1989). Assessing coping strategies: A theoretically based approach. Journal of Personality and Social Psychology, 56(2), 267–283.
Chamchoy, P., & Burford, J. (2019). Academics’ participation in initiation ceremonies: Charting contested meanings and mixed possibilities for orienting Thai freshmen. Teaching in Higher Education, 1–16.
Charoensuk, S. (2007). Negative thinking: A key factor in depressive symptoms in Thai adolescents. Issues in Mental Health Nursing, 28(1), 55–74.
Davydov, D. M., Stewart, R., Ritchie, K., & Chaudieu, I. (2010). Resilience and mental health. Clinical Psychology Review, 30(5), 479–495.
Donaldson, S. I., Dollwet, M., & Rao, M. A. (2015). Happiness, excellence, and optimal human functioning revisited: Examining the peer-reviewed literature linked to positive psychology. The Journal of Positive Psychology, 10(3), 185–195.
Duckworth, A. L., Steen, T. A., & Seligman, M. E. P. (2005). Positive psychology in clinical practice. Annual Review of Clinical Psychology, 1(1), 629–651.
Endler, N. S., & Parker, J. D. (1990). Multidimensional assessment of coping: A critical evaluation. Journal of Personality and Social Psychology, 58(5), 844–854.
First, J., First, N. L., & Houston, J. B. (2018). Resilience and coping intervention (RCI): A group intervention to foster college student resilience. Social Work with Groups, 41(3), 198–210.
Fisher, D. (2019, October, 30th). “Wellbeing worldbeaters: New Zealand, Scotland and Iceland.” Institute of Welsh Affairs (IWA). https://www.iwa.wales/agenda/2019/10/wellbeing-worldbeaters-new-zealand-and-scotland/
Fletcher, D., & Fletcher, J. (2005). A meta-model of stress, emotions and performance: Conceptual foundations, theoretical framework, and research directions. Journal of Sports Sciences, 23, 157–158
Folkman, S. & Lazarus, R. S., (1980). An analysis of coping in a middle-aged community sample. Journal of Health and Social Behavior, 21, 219–239.
Folkman, S., Lazarus, R. S., Dunkel-Schetter, C., DeLongis, A., & Gruen, R. J. (1986). Dynamics of a stressful encounter: cognitive appraisal, coping, and encounter outcomes. Journal of Personality and Social Psychology, 50(5), 992–1003.
Folkman, S., & Moskowitz, J. T. (2004). Coping: Pitfalls and promise. Annual Review of Psychology, 55, 745–774. Fredrickson, B. L. (2001). The role of positive emotions in positive psychology: The broaden-and-build theory of
positive emotions. American Psychologist, 56(3), 218–226. Fredrickson, B. L., Cohn, M. A., Coffey, K. A., Pek, J., & Finkel, S. M. (2008). Open hearts build lives: Positive
emotions, induced through loving-kindness meditation, build consequential personal resources. Journal of Personality and Social Psychology, 95(5), 1045–1062.
Fredrickson, B. L., & Joiner, T. (2018). Reflections on positive emotions and upward spirals. Perspectives on Psychological Science, 13(2), 194–199.
17
Froh, J. J. (2004, May/June). The history of positive psychology: Truth be told. NYS Psychologist, 16(3), 18–20. https://scottbarrykaufman.com/wp-content/uploads/2015/01/Froh-2004.pdf
Goldman, C. S., & Wong, E. H. (1997). Stress and the college student. Education, 117(4), 604–611. Gu, Q., & Day, C. (2007). Teachers resilience: A necessary condition for effectiveness. Teaching and Teacher
Education, 23(8), 1302–1316. Hendriks, T., Schotanus-Dijkstra, M., Hassankhan, A., Graafsma, T. G. T., Bohlmeijer, E., & de Jong, J. (2018).
The efficacy of positive psychological interventions from non-western countries: A systematic review and meta-analysis. International Journal of Wellbeing, 8(1), 71–98.
Higgins, J. E., & Endler, N. S. (1995). Coping, life stress, and psychological and somatic distress. European Journal of Personality, 9, 253–270.
Houston, J., First, J., Spialek, M., Sorenson, M., Mills-Sandoval, T., Lockett, M., First, N., Nitiéma, P., Allen, S., & Pfefferbaum, B. (2017). Randomized controlled trial of the Resilience and Coping Intervention (RCI) with undergraduate university students. Journal of American College Health, 65(1), 1–9.
Kessler, R., Angermeyer, M., Anthony, J., de Graaf, R., Demyttenaere, K., Gasquet, I., de Girolamo, G., Gureje, O., Haro, J., Kawakami, N., Karam, A., Levinson, D., Mora, M., Browne, M., Posada-Villa, J., Stein, D., Tsang, C., Aguilar-Gaxiola, S., Alonso, J., … Ustün, B. (2007). Lifetime prevalence and age-of-onset distributions of mental disorders in the World Health Organization's World Mental Health Survey Initiative. World Psychiatry, 6(3), 168–176.
Kidd, S., & Shahar, G. (2008). Resilience in homeless youth: The key role of self-esteem. American Journal of Orthopsychiatry, 78(2), 163–172.
Kim, Y. Y. (2008). Intercultural personhood: Globalization and a way of being. International Journal of Intercultural Relations, 32(4), 359–368.
Lazarus, R. (1993). Coping theory and research: Past, present, and future Psychosomatic Medicine, 55(3), 234 –247.
Lazarus, R. S., & Folkman, S. (1984). Stress, appraisal, and coping. Springer Publishing Company. Leppin, A., Bora, P., Tilburt, J., Gionfriddo, M., Zeballos-Palacios, C., Dulohery, M., Sood, A., Erwin, P., Brito, J.,
Boehmer, K., & Montori, V. (2014). The efficacy of resiliency training programs: A systematic review and meta-analysis of randomized trials. PloS ONE, 9(10), e111420. https://doi.org/10.1371/journal.pone.0111420
Lu, L., & Gilmour, R. (2004). Culture and conceptions of happiness: Individual oriented and social oriented SWB. Journal of Happiness Studies, 5(3), 269–291
Luthar, S. S., Cicchetti, D., & Becker, B. (2000). The construct of resilience: A critical evaluation and guidelines for future work. Child Development, 71, 543–562
Luthar, S. S. (2006). Resilience in development: A synthesis of research across five decades. In D. Cicchetti & D. Cohen (Eds.), Developmental psychopathology: Risk, disorder, and adaptation (pp. 739–795). Wiley.
Lyubomirsky, S. (2008). The how of happiness: A new approach to getting the life you want. Penguin. Lyubomirsky S., Sheldon K.M., & Schkade, D. (2005). Pursuing happiness: The architecture of sustainable
change. Review of General Psychology 9(2), 111–131. Lyubomirsky, S., Tkach, C., & Sheldon, K. M. (2004). Pursuing sustained happiness through random acts of
kindness and counting one’s blessings: Tests of two six-week interventions. Unpublished raw data. Mahoney, J., & Bergman, L. (2002). Conceptual and methodological considerations in a developmental
approach to the study of positive adaptation. Journal of Applied Developmental Psychology, 23(2), 195–217.
McGonigal, K. (2015). The upside of stress: Why stress is good for you. Penguin/ Random House. McGrath, J. (1982). Methodological problems in research on stress. In H. W. Krohne & L. Laux (Eds),
Achievement, stress, and anxiety, (pp. 19–48). Hemisphere. McInnis, C., James, R., & Hartley, R. (2000). Trends in the first year experience in Australian universities.
Department of Education Training & Youth Affairs. http://hdl.voced.edu.au/10707/18781 Misra, R., McKean, M., West, S., & Russo, T. (2000). Academic stress of college students: Comparison of
student and faculty perceptions. College Student Journal, 34(2), 236–245. Naci, H., & Ioannidis, J. (2015). Evaluation of wellness determinants and interventions by citizen scientists. The
Journal of the American Medical Association, 314(2), 121–122. Ng, W., & Lim W. (2019) Developing positive psychological interventions: Maximizing efficacy for use in eastern
cultures. In L. van Zyl and S. Rothmann Sr. (Eds.), Positive psychological intervention design and protocols for multi-cultural contexts (pp. 277–295). Springer.
O’Brien, E. (2010). Happiness and positive education in China. http://positivepsychologynews.com/news/elaine-obrien/2010090213318
18
Parks, A. C., & Titova, L. (2016). Positive psychological interventions: An overview. In A. Wood and J. Johnson (Eds.), The Wiley handbook of positive clinical psychology (pp. 223–231). Wiley-Blackwell.
Peltzer, K., Yi, S., & Pengpid, S. (2017). Suicidal behaviors and associated factors among university students in six countries in the Association of Southeast Asian Nations (ASEAN). Asian Journal of Psychiatry, 26, 32–38.
Pengpid, S., & Peltzer, K. (2012). Alcohol use and associated factors among adolescent students in Thailand. West Indian Medical Journal, 61(9), 890–896.
Peterson, C., & Seligman, M. E. (2004). Character strengths and virtues: A handbook and classification (Vol. 1). Oxford University Press.
Rungsang, B., Chaimongkol, N., Deoisres, W., & Wongnam, P. (2017). Suicidal ideation among Thai adolescents: An empirical test of a causal model. Pacific Rim International Journal of Nursing Research, 21(2), 97–107.
Rutter, M. (1985). Resilience in the face of adversity: Protective factors and resistance to psychiatric disorder. The British Journal of Psychiatry, 147(6), 598–611.
Rutter, M. (2006). Implications of resilience concepts for scientific understanding. Annals of the New York Academy of Sciences, 1094(1), 1–12.
Rutter, M. (2012). Resilience as a dynamic concept. Development and Psychopathology, 24(2), 335–344. Saiyasombut, S., & Voices, S. (2015, May 1). Sanctioned sadism: Thai universities’ barbaric hazing culture.
Asian Correspondent. https://thaienews.blogspot.com/2015/05/sanctioned-sadism.html Sarchiapone, M., Mandelli, L., Carli, V., Iosue, M., Wasserman, C., Hadlaczky, G., Hoven, C., Apter, A., Balazs, J.,
Bobes, J., Brunner, R., Corcoran, P., Cosman, D., Haring, C., Kaess, M., Keeley, H., Keresztény, A., Kahn, J., Postuvan, V., Mars, U., … & Wasserman, D. (2014). Hours of sleep in adolescents and its association with anxiety, emotional concerns, and suicidal ideation. Sleep Medicine, 15(2), 248–254.
Seligman, M. (1998). Building human strength: Psychology’s forgotten mission. APA Monitor, 29(1). Seligman, M. (2011). Flourish: A visionary new understanding of happiness and well-being. Simon and Schuster. Seligman, M., & Adler, A. (2018). Positive education. In J. F. Helliwell, R. Layard, & J. Sachs (Eds.), Global
happiness policy report (pp. 52–73). Global Happiness Council. Seligman, M., & Czikszentmihalyi, M. (2000). Positive psychology: An introduction. American Psychologist,
55(1), 5–14. Seligman, M., Rashid, T., & Parks, A. (2006). Positive psychotherapy. American Psychologist, 61(8), 774–788. Seligman, M., Steen, T., Park, N., & Peterson, C. (2005). Positive psychology progress: Empirical validation of
interventions. American Psychologist, 60(5), 410–421. Selye, H, (1976). The stress of life (rev. ed.). McGraw-Hill. Sheldon, K. M., Abad, N., Ferguson, Y., Gunz, A., Houser-Marko, L., Nichols, C. P., & Lyubomirsky, S. (2010).
Persistent pursuit of need-satisfying goals leads to increased happiness: A 6-month experimental longitudinal study. Motivation and Emotion, 34(1), 39–48.
Sheldon, K. M., & Lyubomirsky, S. (2006). How to increase and sustain positive emotion: The effects of expressing gratitude and visualizing best possible selves. The Journal of Positive Psychology, 1(2), 73–82.
Shweder, R. A. (1991). Thinking through cultures: Expeditions in cultural psychology. Harvard University Press. Sin, N., & Lyubomirsky, S. (2009). Enhancing well-being and alleviating depressive symptoms with positive
psychology interventions: A practice-friendly meta-analysis. Journal of Clinical Psychology, 65(5), 467–487. Steinhardt, M., & Dolbier, C. (2008). Evaluation of a resilience intervention to enhance coping strategies and
protective factors and decrease symptomatology. Journal of American College Health, 56(4), 445–453. Thanoi, W., Phancharoenworakul, K., Thompson, E., Panitrat, R., & Nityasuddhi, D. (2010). Thai adolescent
suicide risk behaviors: Testing a model of negative life events, rumination, emotional distress, resilience and social support. Pacific Rim International Journal of Nursing Research, 14(3), 187–202.
Thoits, P. A. (1995). Stress, coping, and social support processes: Where are we? What next? Journal of Health and Social Behavior, Spec. No., 53–79.
Uchida, Y., Norasakkunkit, V., & Kitayama, S. (2004). Cultural constructions of happiness: Theory and empirical evidence. Journal of Happiness Studies, 5(3), 223–239.
Vanderbilt-Adriance, E., & Shaw, D. (2008). Protective factors and the development of resilience in the context of neighborhood disadvantage. Journal of Abnormal Child Psychology, 36(6), 887–901.
Walsh, F. (2015). Strengthening family resilience (3rd ed.). Guilford Press. Windle, G. (2011). What is resilience? A review and concept analysis. Reviews in Clinical Gerontology, 21(2),
152–169. Winichakul, T. (2015). The hazing scandals in Thailand reflect deeper problems in social relations1. ISEAS
Perspective, 56, 1–9. https://www.iseas.edu.sg/images/pdf/ISEAS_Perspective_2015_56.pdf
Human Behavior, Development and Society ISSN 2651-1762, Vol 21 No 3, September 2020
19
Adaptation Strategies of Farmers to Counter the Impact of Violent Incidents in the Three Southern Border Provinces of Thailand
Apisith Chailap1and Ayut Nissapa2
1Princess of Naradhiwas University, Thailand 2Prince of Songkla University, Thailand
Date Received: 19 March 2020 Revised: 10 May 2020 Accepted: 13 May 2020
Abstract
The objective of this research was to explore how violent incidents affected agricultural practices of farmers, how they struggled with these problems, and their methods of adaptation to permit survival. Data were collected from 26 key informants in Narathiwat, Pattani, and Yala Provinces. In-depth interviews and descriptive data analyses were used to indicate farmers’ choice of adaptation strategies. The results indicated that violent incidents affected agricultural activities: some agricultural lands were abandoned, farmer numbers and farm income decreased, agricultural officials and middlemen were prevented from meeting farmers to give advice or buy their products, and investors lacked confidence to make investments. Farmers adapted to these difficulties by adjusting working hours, growing other crops, seeking low-interest loans, using agricultural machinery, hiring elderly local laborers, acquiring knowledge and technology from various online media, along with selling products to local merchants and private investors. The findings of this study can help policymakers to better understand and plan agricultural policies to aid in effective adaptation to violent incidents.
Keywords: Farmers’ adaptation strategies, violence, southern Thai border Introduction
The effective management of agricultural resources is simpler when economic, social, and political conditions are good. Under bad conditions, such as after natural disasters, dramatic socio-economic or political changes, climate change, or violent incidents, agricultural resource management is difficult and perhaps ineffective. Agricultural resource management in the vicinity of violent incidents, a problem that threatens the lives and property of people in many countries around the world, has been neglected because security-related policies have usually received higher priority (Chailap et al., 2019).
Terrorism and violent incidents are usually understood as the result of political issues, religious matters, agro-economic deprivation of the people, and in some cases, psychological reasons. Aside from the loss of human life and property, there are serious economic and political consequences. Many major socio-economic variables leading to terrorism and people’s increased willingness to support it are listed below: repression, political volatility, sharp divisions in society, sectoral provincial factors, poverty and inequality, a high unemployment rate, inflation, a paucity of opportunities for development, fractionalization along ethnic and religious lines, ethnicity and religion, as well as international, institutional, and demographic factors (Frey et al., 2007; Freytag et al., 2010; Caruso & Schneider, 2011; Krieger & Meierrieks, 2011; Ismail & Amjad, 2014). Terrorists target tourists, military personnel, police, religious figures, and many others including civilians, as well as property. They use suicide attacks, bombings, hijackings, kidnappings, and armed attacks which result in casualties and damage to buildings, incurring huge economic losses (Abadie & Gardeazabal, 2003).
Not much work has been done on how violent incidents impact agricultural resource management, although several studies have analyzed its macroeconomic effects. Hence, we do not know the effects of violent incidents on short-term agricultural resource management. We know little about the persistence of these effects, although several studies have found that no long-run effects on income levels occurred because of the bombing in Vietnam (Miguel & Roland, 2005), Japan (Davis & Weinstein, 2002), and West Germany (Brakman et al., 2004). However, Abadie and Gardeazabal
1 Corresponding author’s e-mail address: [email protected]
20
(2003) uncovered persistent effects on per capita income of a low-intensity conflict in the Basque country. Besides, in the Punjab (India), Singh (2012) found significant negative effects of terrorism on the level of investment in long-term agricultural technology, but effects were small and insignificant for short-term investment during the period of insurgency.
A number of short-term strategies have been adopted in areas stressed by such factors to address agricultural problems. A study conducted in Vietnam, where farmers had been involuntarily resettled
to a remote mountain location with an intense scarcity of resources, found that livelihood outcomes were reduced, mainly due to crop output losses. In response, farmers intensified crop production by increased crop frequencies of rice; they also intensified mineral fertilizer use and livestock production. As a result, farm output and incomes increased. Some strategies were successful, and others were not (Bui et al., 2013). In Benin, a West African nation, farmers adopted a number of diversification strategies in response to climate change. These strategies included crop–livestock diversification and other good practices (mulching, organic fertilizer), use of improved varieties, use of chemical fertilizers and pesticides, and inclusion of agroforestry and perennial plantation options. The findings also revealed that most respondents used these strategies in combination (Mahouna, 2018).
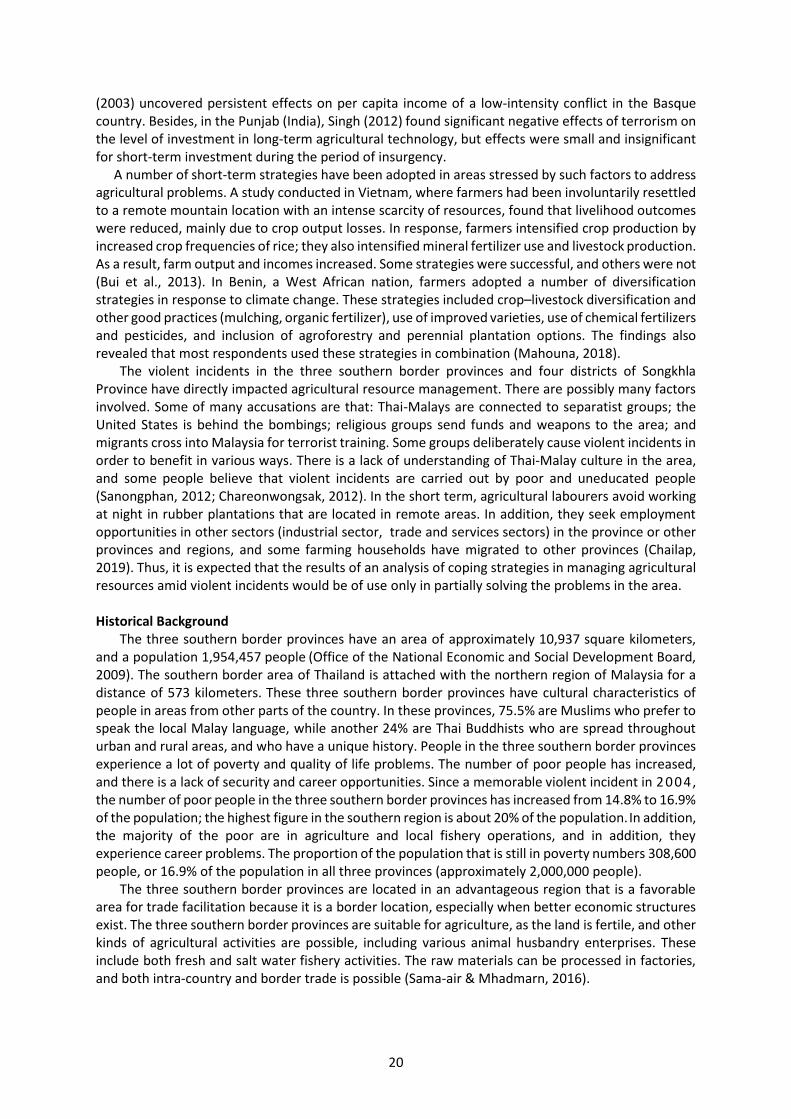
The violent incidents in the three southern border provinces and four districts of Songkhla Province have directly impacted agricultural resource management. There are possibly many factors involved. Some of many accusations are that: Thai-Malays are connected to separatist groups; the United States is behind the bombings; religious groups send funds and weapons to the area; and migrants cross into Malaysia for terrorist training. Some groups deliberately cause violent incidents in order to benefit in various ways. There is a lack of understanding of Thai-Malay culture in the area, and some people believe that violent incidents are carried out by poor and uneducated people
(Sanongphan, 2012; Chareonwongsak, 2012). In the short term, agricultural labourers avoid working at night in rubber plantations that are located in remote areas. In addition, they seek employment opportunities in other sectors (industrial sector, trade and services sectors) in the province or other provinces and regions, and some farming households have migrated to other provinces (Chailap, 2019). Thus, it is expected that the results of an analysis of coping strategies in managing agricultural resources amid violent incidents would be of use only in partially solving the problems in the area. Historical Background
The three southern border provinces have an area of approximately 10,937 square kilometers, and a population 1,954,457 people (Office of the National Economic and Social Development Board, 2009). The southern border area of Thailand is attached with the northern region of Malaysia for a distance of 573 kilometers. These three southern border provinces have cultural characteristics of people in areas from other parts of the country. In these provinces, 75.5% are Muslims who prefer to speak the local Malay language, while another 24% are Thai Buddhists who are spread throughout urban and rural areas, and who have a unique history. People in the three southern border provinces experience a lot of poverty and quality of life problems. The number of poor people has increased, and there is a lack of security and career opportunities. Since a memorable violent incident in 2004 , the number of poor people in the three southern border provinces has increased from 14.8% to 16.9% of the population; the highest figure in the southern region is about 20% of the population. In addition, the majority of the poor are in agriculture and local fishery operations, and in addition, they experience career problems. The proportion of the population that is still in poverty numbers 308,600 people, or 16.9% of the population in all three provinces (approximately 2,000,000 people).
The three southern border provinces are located in an advantageous region that is a favorable area for trade facilitation because it is a border location, especially when better economic structures exist. The three southern border provinces are suitable for agriculture, as the land is fertile, and other kinds of agricultural activities are possible, including various animal husbandry enterprises. These include both fresh and salt water fishery activities. The raw materials can be processed in factories, and both intra-country and border trade is possible (Sama-air & Mhadmarn, 2016).
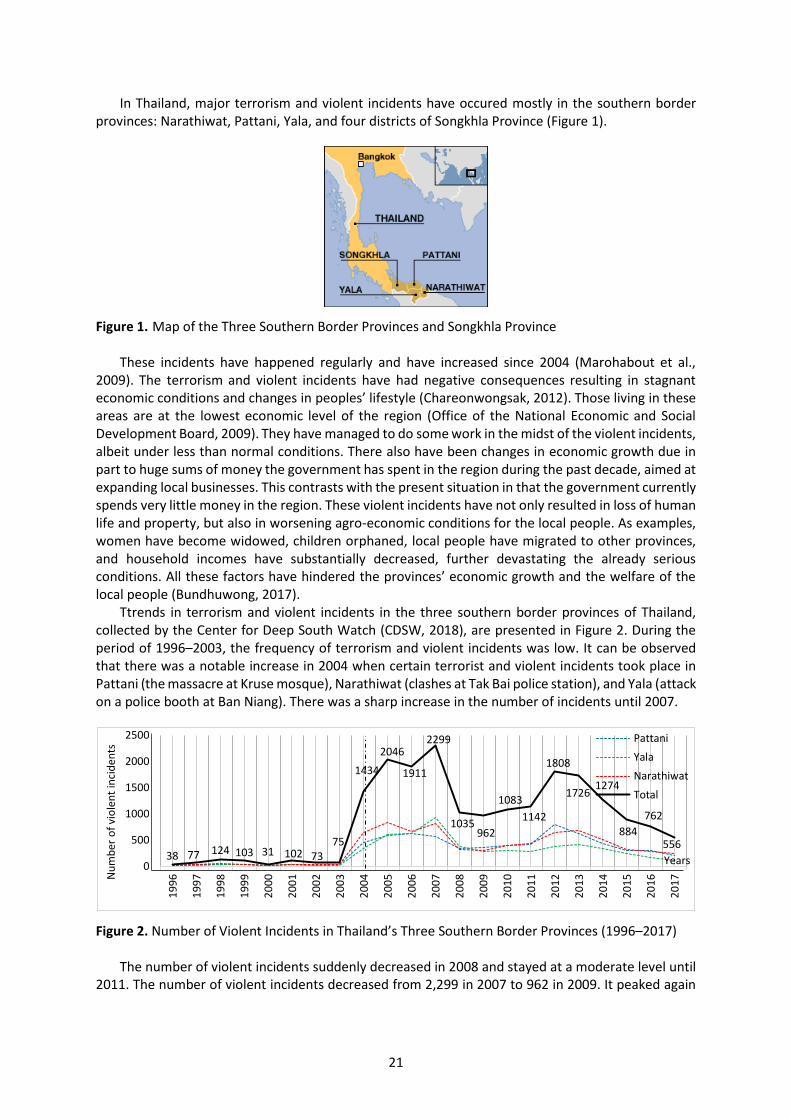
21
In Thailand, major terrorism and violent incidents have occured mostly in the southern border provinces: Narathiwat, Pattani, Yala, and four districts of Songkhla Province (Figure 1).
Figure 1. Map of the Three Southern Border Provinces and Songkhla Province
These incidents have happened regularly and have increased since 2004 (Marohabout et al., 2009). The terrorism and violent incidents have had negative consequences resulting in stagnant economic conditions and changes in peoples’ lifestyle (Chareonwongsak, 2012). Those living in these areas are at the lowest economic level of the region (Office of the National Economic and Social Development Board, 2009). They have managed to do some work in the midst of the violent incidents, albeit under less than normal conditions. There also have been changes in economic growth due in part to huge sums of money the government has spent in the region during the past decade, aimed at expanding local businesses. This contrasts with the present situation in that the government currently spends very little money in the region. These violent incidents have not only resulted in loss of human life and property, but also in worsening agro-economic conditions for the local people. As examples, women have become widowed, children orphaned, local people have migrated to other provinces, and household incomes have substantially decreased, further devastating the already serious conditions. All these factors have hindered the provinces’ economic growth and the welfare of the local people (Bundhuwong, 2017).
Ttrends in terrorism and violent incidents in the three southern border provinces of Thailand, collected by the Center for Deep South Watch (CDSW, 2018), are presented in Figure 2. During the period of 1996–2003, the frequency of terrorism and violent incidents was low. It can be observed that there was a notable increase in 2004 when certain terrorist and violent incidents took place in Pattani (the massacre at Kruse mosque), Narathiwat (clashes at Tak Bai police station), and Yala (attack on a police booth at Ban Niang). There was a sharp increase in the number of incidents until 2007.
Figure 2. Number of Violent Incidents in Thailand’s Three Southern Border Provinces (1996–2017)
The number of violent incidents suddenly decreased in 2008 and stayed at a moderate level until 2011. The number of violent incidents decreased from 2,299 in 2007 to 962 in 2009. It peaked again
38 77 124 103 31 102 7375
1434
2046
1911
2299
1035962
1083
1142
1808
17261274
884
762
556
0
500
1000
1500
2000
2500
19
96
19
97
19
98
19
99
20
00
20
01
20
02
20
03
20
04
20
05
20
06
20
07
20
08
20
09
20
10
20
11
20
12
20
13
20
14
20
15
20
16
20
17N
um
ber
of
vio
len
t in
cid
ents
Years
Pattani
Yala
Narathiwat
Total
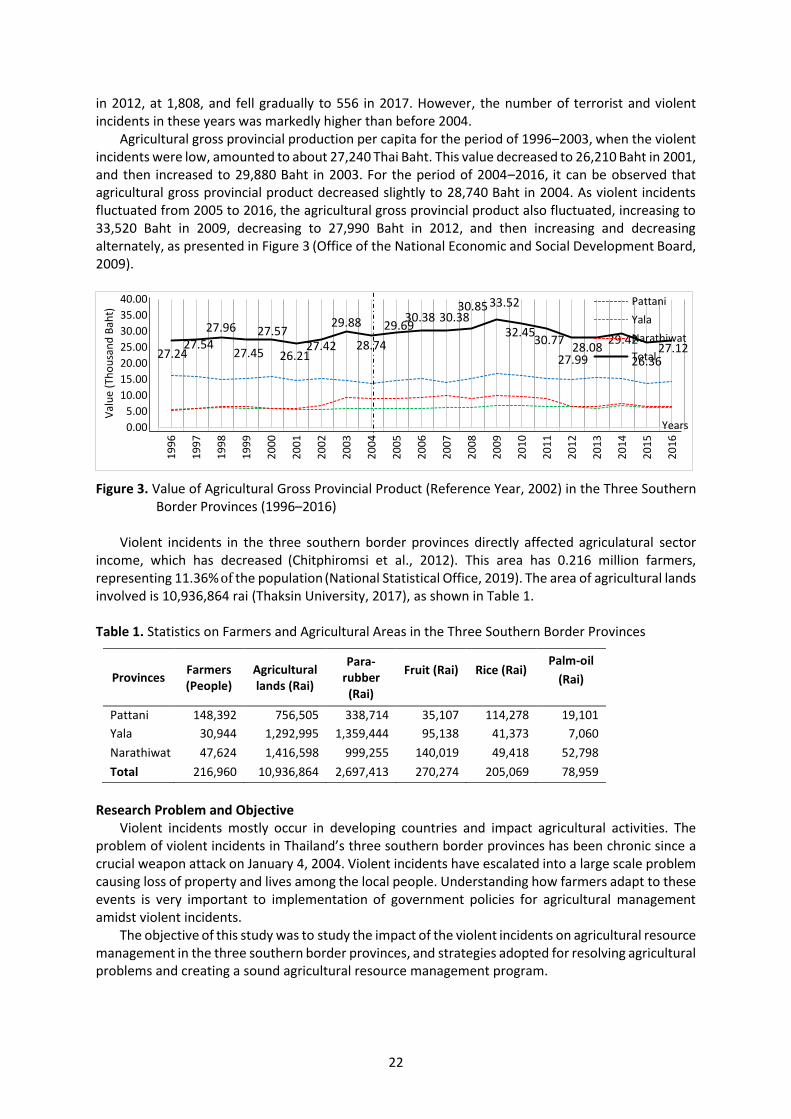
22
in 2012, at 1,808, and fell gradually to 556 in 2017. However, the number of terrorist and violent incidents in these years was markedly higher than before 2004.
Agricultural gross provincial production per capita for the period of 1996–2003, when the violent incidents were low, amounted to about 27,240 Thai Baht. This value decreased to 26,210 Baht in 2001, and then increased to 29,880 Baht in 2003. For the period of 2004–2016, it can be observed that agricultural gross provincial product decreased slightly to 28,740 Baht in 2004. As violent incidents fluctuated from 2005 to 2016, the agricultural gross provincial product also fluctuated, increasing to 33,520 Baht in 2009, decreasing to 27,990 Baht in 2012, and then increasing and decreasing alternately, as presented in Figure 3 (Office of the National Economic and Social Development Board, 2009).
Figure 3. Value of Agricultural Gross Provincial Product (Reference Year, 2002) in the Three Southern Border Provinces (1996–2016)
Violent incidents in the three southern border provinces directly affected agriculatural sector
income, which has decreased (Chitphiromsi et al., 2012). This area has 0.216 million farmers, representing 11.36% of the population (National Statistical Office, 2019). The area of agricultural lands involved is 10,936,864 rai (Thaksin University, 2017), as shown in Table 1. Table 1. Statistics on Farmers and Agricultural Areas in the Three Southern Border Provinces
Provinces Farmers (People)
Agricultural lands (Rai)
Para-rubber (Rai)
Fruit (Rai) Rice (Rai) Palm-oil
(Rai)
Pattani 148,392 756,505 338,714 35,107 114,278 19,101
Yala 30,944 1,292,995 1,359,444 95,138 41,373 7,060
Narathiwat 47,624 1,416,598 999,255 140,019 49,418 52,798
Total 216,960 10,936,864 2,697,413 270,274 205,069 78,959
Research Problem and Objective
Violent incidents mostly occur in developing countries and impact agricultural activities. The problem of violent incidents in Thailand’s three southern border provinces has been chronic since a crucial weapon attack on January 4, 2004. Violent incidents have escalated into a large scale problem causing loss of property and lives among the local people. Understanding how farmers adapt to these events is very important to implementation of government policies for agricultural management amidst violent incidents.
The objective of this study was to study the impact of the violent incidents on agricultural resource management in the three southern border provinces, and strategies adopted for resolving agricultural problems and creating a sound agricultural resource management program.
27.2427.54
27.96
27.45
27.57
26.2127.42
29.88
28.74
29.6930.38 30.38
30.8533.52
32.4530.77
27.9928.08
29.42
26.3627.12
0.00
5.00
10.00
15.00
20.00
25.00
30.00
35.00
40.00
19
96
19
97
19
98
19
99
20
00
20
01
20
02
20
03
20
04
20
05
20
06
20
07
20
08
20
09
20
10
20
11
20
12
20
13
20
14
20
15
20
16
Val
ue
(Th
ou
san
d B
aht)
Years
Pattani
Yala
Narathiwat
Total
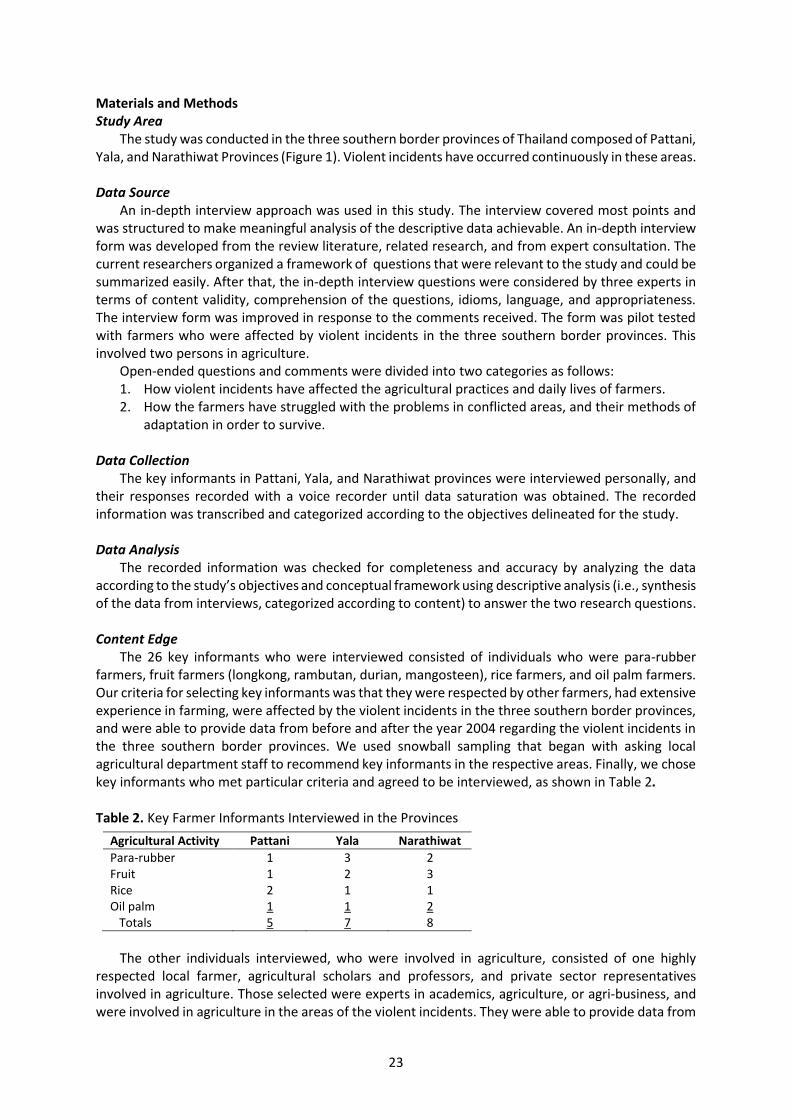
23
Materials and Methods Study Area
The study was conducted in the three southern border provinces of Thailand composed of Pattani, Yala, and Narathiwat Provinces (Figure 1). Violent incidents have occurred continuously in these areas.
Data Source
An in-depth interview approach was used in this study. The interview covered most points and was structured to make meaningful analysis of the descriptive data achievable. An in-depth interview form was developed from the review literature, related research, and from expert consultation. The current researchers organized a framework of questions that were relevant to the study and could be summarized easily. After that, the in-depth interview questions were considered by three experts in terms of content validity, comprehension of the questions, idioms, language, and appropriateness. The interview form was improved in response to the comments received. The form was pilot tested with farmers who were affected by violent incidents in the three southern border provinces. This involved two persons in agriculture.
Open-ended questions and comments were divided into two categories as follows: 1. How violent incidents have affected the agricultural practices and daily lives of farmers. 2. How the farmers have struggled with the problems in conflicted areas, and their methods of
adaptation in order to survive.
Data Collection The key informants in Pattani, Yala, and Narathiwat provinces were interviewed personally, and
their responses recorded with a voice recorder until data saturation was obtained. The recorded information was transcribed and categorized according to the objectives delineated for the study.
Data Analysis
The recorded information was checked for completeness and accuracy by analyzing the data according to the study’s objectives and conceptual framework using descriptive analysis (i.e., synthesis of the data from interviews, categorized according to content) to answer the two research questions.
Content Edge
The 26 key informants who were interviewed consisted of individuals who were para-rubber farmers, fruit farmers (longkong, rambutan, durian, mangosteen), rice farmers, and oil palm farmers. Our criteria for selecting key informants was that they were respected by other farmers, had extensive experience in farming, were affected by the violent incidents in the three southern border provinces, and were able to provide data from before and after the year 2004 regarding the violent incidents in the three southern border provinces. We used snowball sampling that began with asking local agricultural department staff to recommend key informants in the respective areas. Finally, we chose key informants who met particular criteria and agreed to be interviewed, as shown in Table 2.
Table 2. Key Farmer Informants Interviewed in the Provinces
Agricultural Activity Pattani Yala Narathiwat
Para-rubber 1 3 2 Fruit 1 2 3 Rice 2 1 1 Oil palm Totals
1 5
1 7
2 8
The other individuals interviewed, who were involved in agriculture, consisted of one highly
respected local farmer, agricultural scholars and professors, and private sector representatives involved in agriculture. Those selected were experts in academics, agriculture, or agri-business, and were involved in agriculture in the areas of the violent incidents. They were able to provide data from
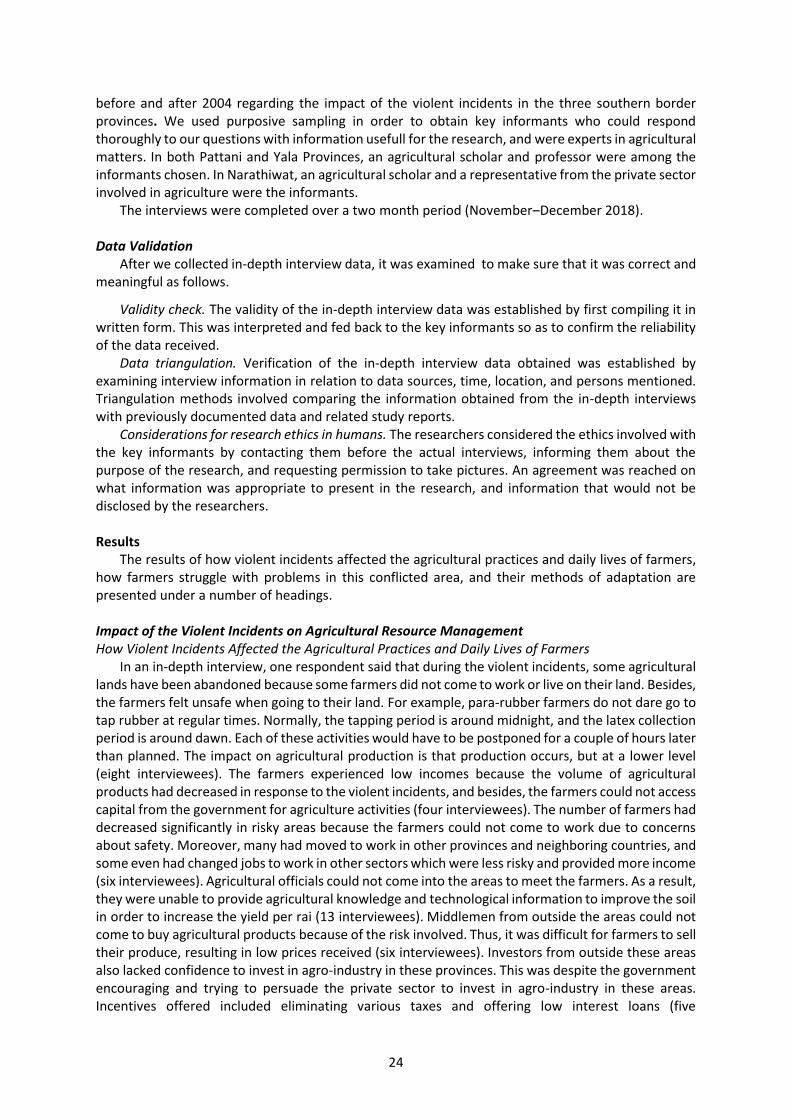
24
before and after 2004 regarding the impact of the violent incidents in the three southern border provinces. We used purposive sampling in order to obtain key informants who could respond thoroughly to our questions with information usefull for the research, and were experts in agricultural matters. In both Pattani and Yala Provinces, an agricultural scholar and professor were among the informants chosen. In Narathiwat, an agricultural scholar and a representative from the private sector involved in agriculture were the informants.
The interviews were completed over a two month period (November–December 2018).
Data Validation After we collected in-depth interview data, it was examined to make sure that it was correct and
meaningful as follows.
Validity check. The validity of the in-depth interview data was established by first compiling it in written form. This was interpreted and fed back to the key informants so as to confirm the reliability of the data received.
Data triangulation. Verification of the in-depth interview data obtained was established by examining interview information in relation to data sources, time, location, and persons mentioned. Triangulation methods involved comparing the information obtained from the in-depth interviews with previously documented data and related study reports.
Considerations for research ethics in humans. The researchers considered the ethics involved with the key informants by contacting them before the actual interviews, informing them about the purpose of the research, and requesting permission to take pictures. An agreement was reached on what information was appropriate to present in the research, and information that would not be disclosed by the researchers.
Results
The results of how violent incidents affected the agricultural practices and daily lives of farmers, how farmers struggle with problems in this conflicted area, and their methods of adaptation are presented under a number of headings.
Impact of the Violent Incidents on Agricultural Resource Management How Violent Incidents Affected the Agricultural Practices and Daily Lives of Farmers
In an in-depth interview, one respondent said that during the violent incidents, some agricultural lands have been abandoned because some farmers did not come to work or live on their land. Besides, the farmers felt unsafe when going to their land. For example, para-rubber farmers do not dare go to tap rubber at regular times. Normally, the tapping period is around midnight, and the latex collection period is around dawn. Each of these activities would have to be postponed for a couple of hours later than planned. The impact on agricultural production is that production occurs, but at a lower level (eight interviewees). The farmers experienced low incomes because the volume of agricultural products had decreased in response to the violent incidents, and besides, the farmers could not access capital from the government for agriculture activities (four interviewees). The number of farmers had decreased significantly in risky areas because the farmers could not come to work due to concerns about safety. Moreover, many had moved to work in other provinces and neighboring countries, and some even had changed jobs to work in other sectors which were less risky and provided more income (six interviewees). Agricultural officials could not come into the areas to meet the farmers. As a result, they were unable to provide agricultural knowledge and technological information to improve the soil in order to increase the yield per rai (13 interviewees). Middlemen from outside the areas could not come to buy agricultural products because of the risk involved. Thus, it was difficult for farmers to sell their produce, resulting in low prices received (six interviewees). Investors from outside these areas also lacked confidence to invest in agro-industry in these provinces. This was despite the government encouraging and trying to persuade the private sector to invest in agro-industry in these areas. Incentives offered included eliminating various taxes and offering low interest loans (five
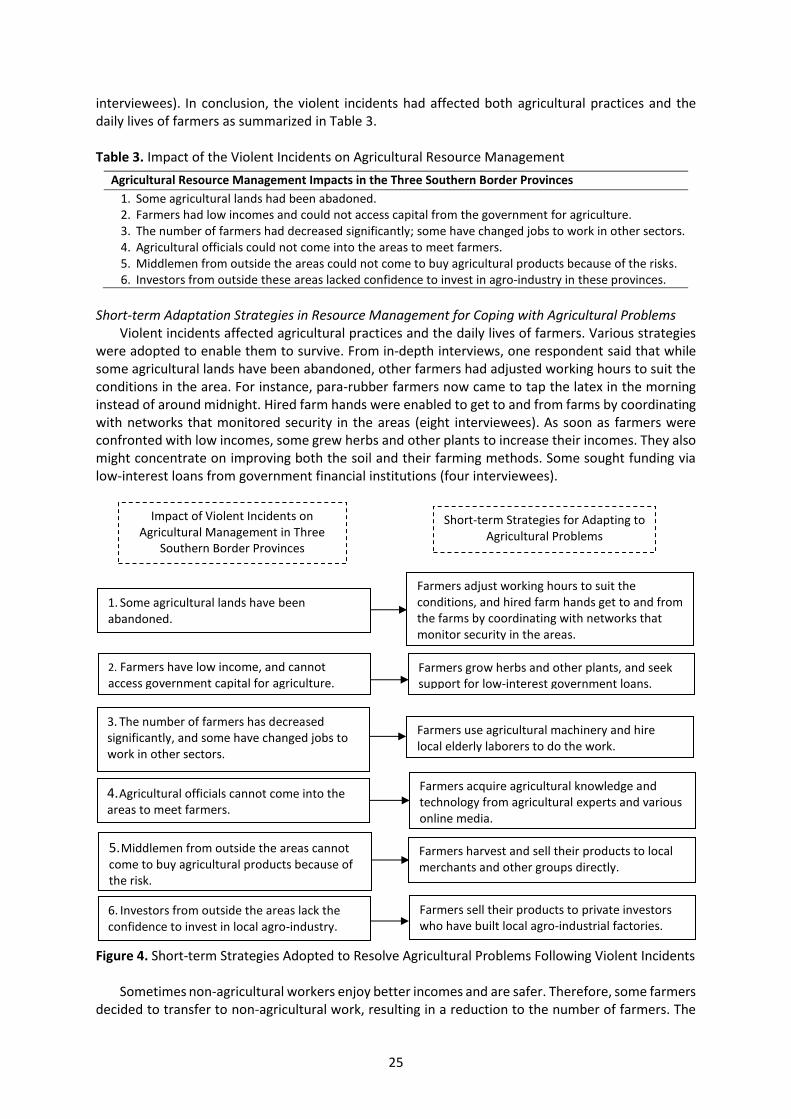
25
interviewees). In conclusion, the violent incidents had affected both agricultural practices and the daily lives of farmers as summarized in Table 3. Table 3. Impact of the Violent Incidents on Agricultural Resource Management
Agricultural Resource Management Impacts in the Three Southern Border Provinces
1. Some agricultural lands had been abadoned. 2. Farmers had low incomes and could not access capital from the government for agriculture. 3. The number of farmers had decreased significantly; some have changed jobs to work in other sectors. 4. Agricultural officials could not come into the areas to meet farmers. 5. Middlemen from outside the areas could not come to buy agricultural products because of the risks. 6. Investors from outside these areas lacked confidence to invest in agro-industry in these provinces.
Short-term Adaptation Strategies in Resource Management for Coping with Agricultural Problems
Violent incidents affected agricultural practices and the daily lives of farmers. Various strategies were adopted to enable them to survive. From in-depth interviews, one respondent said that while some agricultural lands have been abandoned, other farmers had adjusted working hours to suit the conditions in the area. For instance, para-rubber farmers now came to tap the latex in the morning instead of around midnight. Hired farm hands were enabled to get to and from farms by coordinating with networks that monitored security in the areas (eight interviewees). As soon as farmers were confronted with low incomes, some grew herbs and other plants to increase their incomes. They also might concentrate on improving both the soil and their farming methods. Some sought funding via low-interest loans from government financial institutions (four interviewees).
Figure 4. Short-term Strategies Adopted to Resolve Agricultural Problems Following Violent Incidents
Sometimes non-agricultural workers enjoy better incomes and are safer. Therefore, some farmers
decided to transfer to non-agricultural work, resulting in a reduction to the number of farmers. The
1. Some agricultural lands have been abandoned.
Farmers adjust working hours to suit the conditions, and hired farm hands get to and from the farms by coordinating with networks that monitor security in the areas.
2. Farmers have low income, and cannot access government capital for agriculture.
Farmers grow herbs and other plants, and seek support for low-interest government loans.
3. The number of farmers has decreased significantly, and some have changed jobs to work in other sectors.
Farmers use agricultural machinery and hire local elderly laborers to do the work.
4. Agricultural officials cannot come into the areas to meet farmers.
Farmers acquire agricultural knowledge and technology from agricultural experts and various online media.
5. Middlemen from outside the areas cannot come to buy agricultural products because of the risk.
Farmers harvest and sell their products to local merchants and other groups directly.
6. Investors from outside the areas lack the confidence to invest in local agro-industry.
Farmers sell their products to private investors who have built local agro-industrial factories.
Impact of Violent Incidents on Agricultural Management in Three
Southern Border Provinces
Short-term Strategies for Adapting to Agricultural Problems
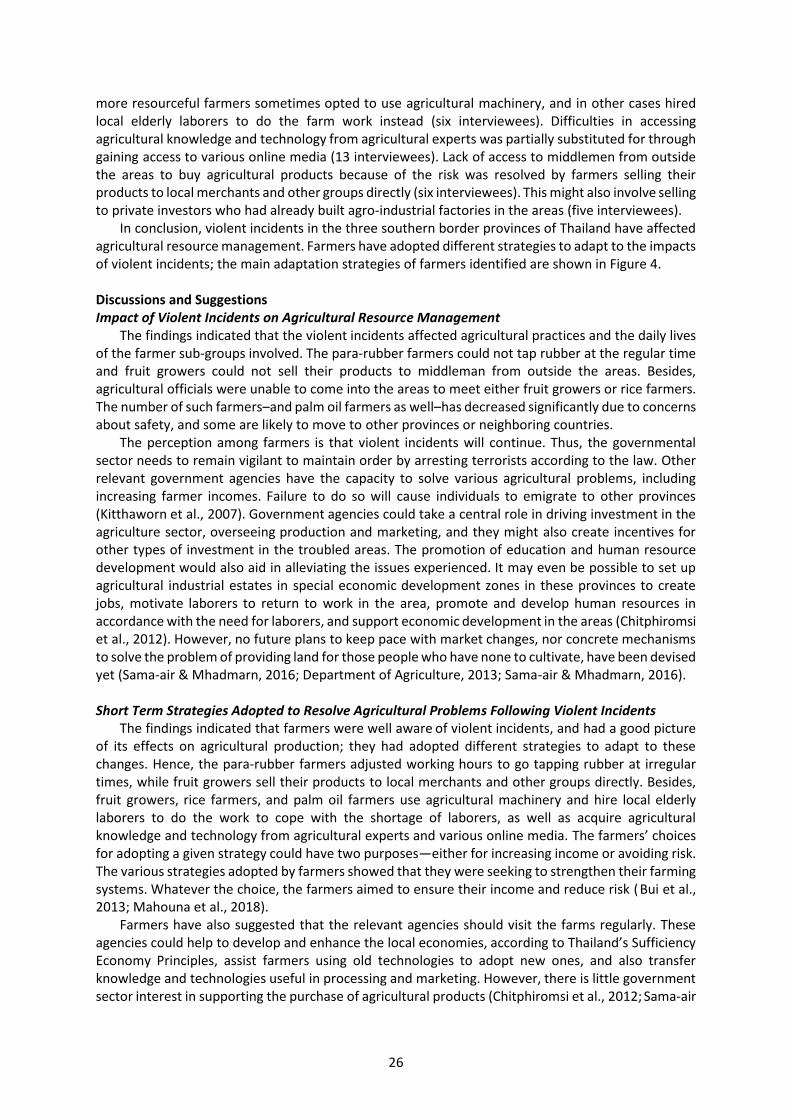
26
more resourceful farmers sometimes opted to use agricultural machinery, and in other cases hired local elderly laborers to do the farm work instead (six interviewees). Difficulties in accessing agricultural knowledge and technology from agricultural experts was partially substituted for through gaining access to various online media (13 interviewees). Lack of access to middlemen from outside the areas to buy agricultural products because of the risk was resolved by farmers selling their products to local merchants and other groups directly (six interviewees). This might also involve selling to private investors who had already built agro-industrial factories in the areas (five interviewees).
In conclusion, violent incidents in the three southern border provinces of Thailand have affected agricultural resource management. Farmers have adopted different strategies to adapt to the impacts of violent incidents; the main adaptation strategies of farmers identified are shown in Figure 4. Discussions and Suggestions Impact of Violent Incidents on Agricultural Resource Management
The findings indicated that the violent incidents affected agricultural practices and the daily lives of the farmer sub-groups involved. The para-rubber farmers could not tap rubber at the regular time and fruit growers could not sell their products to middleman from outside the areas. Besides, agricultural officials were unable to come into the areas to meet either fruit growers or rice farmers. The number of such farmers–and palm oil farmers as well–has decreased significantly due to concerns about safety, and some are likely to move to other provinces or neighboring countries.
The perception among farmers is that violent incidents will continue. Thus, the governmental sector needs to remain vigilant to maintain order by arresting terrorists according to the law. Other
relevant government agencies have the capacity to solve various agricultural problems, including increasing farmer incomes. Failure to do so will cause individuals to emigrate to other provinces
(Kitthaworn et al., 2007). Government agencies could take a central role in driving investment in the agriculture sector, overseeing production and marketing, and they might also create incentives for other types of investment in the troubled areas. The promotion of education and human resource development would also aid in alleviating the issues experienced. It may even be possible to set up agricultural industrial estates in special economic development zones in these provinces to create jobs, motivate laborers to return to work in the area, promote and develop human resources in accordance with the need for laborers, and support economic development in the areas (Chitphiromsi et al., 2012). However, no future plans to keep pace with market changes, nor concrete mechanisms to solve the problem of providing land for those people who have none to cultivate, have been devised yet (Sama-air & Mhadmarn, 2016; Department of Agriculture, 2013; Sama-air & Mhadmarn, 2016).
Short Term Strategies Adopted to Resolve Agricultural Problems Following Violent Incidents
The findings indicated that farmers were well aware of violent incidents, and had a good picture of its effects on agricultural production; they had adopted different strategies to adapt to these changes. Hence, the para-rubber farmers adjusted working hours to go tapping rubber at irregular times, while fruit growers sell their products to local merchants and other groups directly. Besides, fruit growers, rice farmers, and palm oil farmers use agricultural machinery and hire local elderly laborers to do the work to cope with the shortage of laborers, as well as acquire agricultural knowledge and technology from agricultural experts and various online media. The farmers’ choices for adopting a given strategy could have two purposes—either for increasing income or avoiding risk. The various strategies adopted by farmers showed that they were seeking to strengthen their farming systems. Whatever the choice, the farmers aimed to ensure their income and reduce risk (Bui et al., 2013; Mahouna et al., 2018).
Farmers have also suggested that the relevant agencies should visit the farms regularly. These agencies could help to develop and enhance the local economies, according to Thailand’s Sufficiency Economy Principles, assist farmers using old technologies to adopt new ones, and also transfer knowledge and technologies useful in processing and marketing. However, there is little government sector interest in supporting the purchase of agricultural products (Chitphiromsi et al., 2012; Sama-air
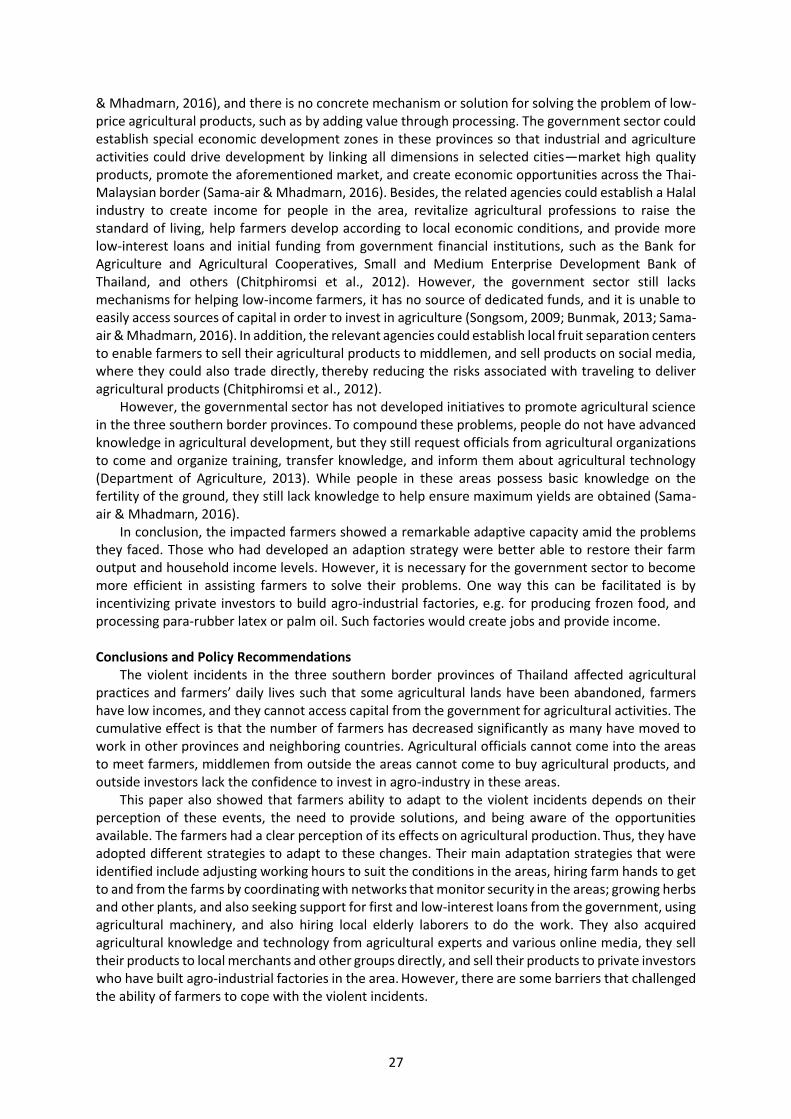
27
& Mhadmarn, 2016), and there is no concrete mechanism or solution for solving the problem of low-price agricultural products, such as by adding value through processing. The government sector could establish special economic development zones in these provinces so that industrial and agriculture activities could drive development by linking all dimensions in selected cities—market high quality products, promote the aforementioned market, and create economic opportunities across the Thai-Malaysian border (Sama-air & Mhadmarn, 2016). Besides, the related agencies could establish a Halal industry to create income for people in the area, revitalize agricultural professions to raise the standard of living, help farmers develop according to local economic conditions, and provide more low-interest loans and initial funding from government financial institutions, such as the Bank for Agriculture and Agricultural Cooperatives, Small and Medium Enterprise Development Bank of Thailand, and others (Chitphiromsi et al., 2012). However, the government sector still lacks mechanisms for helping low-income farmers, it has no source of dedicated funds, and it is unable to easily access sources of capital in order to invest in agriculture (Songsom, 2009; Bunmak, 2013; Sama-air & Mhadmarn, 2016). In addition, the relevant agencies could establish local fruit separation centers to enable farmers to sell their agricultural products to middlemen, and sell products on social media, where they could also trade directly, thereby reducing the risks associated with traveling to deliver agricultural products (Chitphiromsi et al., 2012).
However, the governmental sector has not developed initiatives to promote agricultural science in the three southern border provinces. To compound these problems, people do not have advanced knowledge in agricultural development, but they still request officials from agricultural organizations to come and organize training, transfer knowledge, and inform them about agricultural technology (Department of Agriculture, 2013). While people in these areas possess basic knowledge on the fertility of the ground, they still lack knowledge to help ensure maximum yields are obtained (Sama-air & Mhadmarn, 2016).
In conclusion, the impacted farmers showed a remarkable adaptive capacity amid the problems they faced. Those who had developed an adaption strategy were better able to restore their farm output and household income levels. However, it is necessary for the government sector to become more efficient in assisting farmers to solve their problems. One way this can be facilitated is by incentivizing private investors to build agro-industrial factories, e.g. for producing frozen food, and processing para-rubber latex or palm oil. Such factories would create jobs and provide income.
Conclusions and Policy Recommendations
The violent incidents in the three southern border provinces of Thailand affected agricultural practices and farmers’ daily lives such that some agricultural lands have been abandoned, farmers have low incomes, and they cannot access capital from the government for agricultural activities. The cumulative effect is that the number of farmers has decreased significantly as many have moved to work in other provinces and neighboring countries. Agricultural officials cannot come into the areas to meet farmers, middlemen from outside the areas cannot come to buy agricultural products, and outside investors lack the confidence to invest in agro-industry in these areas.
This paper also showed that farmers ability to adapt to the violent incidents depends on their perception of these events, the need to provide solutions, and being aware of the opportunities available. The farmers had a clear perception of its effects on agricultural production. Thus, they have adopted different strategies to adapt to these changes. Their main adaptation strategies that were identified include adjusting working hours to suit the conditions in the areas, hiring farm hands to get to and from the farms by coordinating with networks that monitor security in the areas; growing herbs and other plants, and also seeking support for first and low-interest loans from the government, using agricultural machinery, and also hiring local elderly laborers to do the work. They also acquired agricultural knowledge and technology from agricultural experts and various online media, they sell their products to local merchants and other groups directly, and sell their products to private investors who have built agro-industrial factories in the area. However, there are some barriers that challenged the ability of farmers to cope with the violent incidents.
28
The findings of this study can help policymakers to better think and plan agricultural policies in terms of adaptation to violent incidents. The government sector can include violent incident adaptation policies in their development agenda. Indeed, choices made in terms of public policies can be decisive. Some agricultural policies may exacerbate the impact of violent incidents, while others may be effective in increasing and securing farmers’ incomes. The design and implementation of any violent incidents amelioration policy requires adequate knowledge about the level of vulnerability, the population’s existing knowledge about the risks they are exposed to, the adaptation practices adopted, existing capacity to adapt, and perceived barriers to adaptation. This study provides evidence that agrees with the conclusions of Bui and colleagues (2013). To be effective, agricultural policies designed to enhance adaptation capacity should integrate the following information:
Disseminate techniques designed to increase yields per area.
Provide equitable access to the means of production.
Ensure sufficiently stable prices for agricultural produce.
Acknowledgments The authors express their sincere thanks to the Deep South Coordination Center and the Faculty
of Science and Technology, Prince of Songkla University, Pattani Campus, Thailand, for generously providing data. We express our gratitude to the Faculty of Natural Resources, Prince of Songkla University, Hat Yai Campus, for providing an opportunity to conduct this study. We would like to thank the Office of the Higher Education Commission for providing research grants. References Abadie, A., & Gardeazabal, J. (2003). The economic costs of conflict: A case study of the Basque country.
American Economic Review, 93(1), 113–132. Brakman, S., Garretsen, H., & Schramm, M. (2004). The strategic bombing of cities in Germany in World War II
and it impact on city growth. Journal of Economic Geography, 4(2), 201–218. Bui, T., Schreinemachers, P., & Berger, T. (2013). Hydropower development in Vietnam: Involuntary
resettlement and factors enabling rehabilitation. Land Use Policy, 31, 536–544. Bundhuwong, C. (2017). Setthakit læ kanphatthana nai phưnthi changwat chaidæn phak tai : kansamruat
chœng wiphak [Economy and development in southern border provinces: A critical investigation]. In A. Unno (Ed.), Nưng thotsawat manutsayawitthaya læ sangkhomwitthaya kap kansưksa changwat chaidæn phak ta i [One decade of anthropology and sociology with southern border provinces education] (pp. 31–68). https://socanth.tu.ac.th/ccscs/outreach/media/publication/anusorn-ed-2560/
Bunmak, S. (2013). Remittances: Malay-Thai workers in Malaysia. Parichart Journal, Thaksin University, 26(1), 74–93. https://so05.tcithaijo.org/index.php/parichartjournal/article/view/42944
Caruso, R., & Schneider, F. (2011). The socio-economic determinants of terrorism and political violence in western europe (1994–2007). European Journal of Political Economy, 27(1), 37–49.
Center for Deep South Watch. (2018). Summary of incidents in deep Southern Thailand. https://deepsouthwatch. org/sites/default/files/blogs/attachment/datasheet-032020-en.pdf
Chailap, A., Nissapa, A., & Somboonsuke, B. (2019). Association of macroeconomic indicators with violence incidents in Narathiwat province of southern Thailand-responses for adaptive agricultural management. Proceeding of International Conference on Sustainable Agriculture, Chiangmai, Thailand, 2, 9–22. http://icsa.mcc.cmu.ac.th/proceeding/Proceeding_P09-22-NS05-Apisith%20Chailap.pdf
Chareonwongsak, K. (2012). Setthasat waduai kanko ʻakanraI [Economics concerning terrorism]. http://www.kriengsak.com/node/2194
Chitphiromsi, S., Lomlim, C., & Laiphaphon, S. (2012). Setthasat kanmưang waduai kanphatthana changwat chaidæn phak tai nai thamklang pæt pi kho ng khwam mai sangop [Political economy concerned with the development of southern border provinces during 8 years of insurgency]. https://deepsouthwatch.org/th/ node/2871
Davis, D., & Weinstein, D. (2002). Bones, bombs, and breakpoints: The geography of economic activity. American Economic Review, 92(5), 1269–1289.
Department of Agriculture. (2013). Phatthana khunnaphap chiwit chaidæn tai duai kasettrakam [Improve the quality of life on the southern border with agriculture]. Spring Newsletter, 16(10), 2–5.
29
Frey, B., Luechinger, S., & Stutzer, A. (2007). Calculating tragedy: Assessing the costs of terrorism. Journal of Economic Surveys, 21(1), 1–24.
Freytag, A., Krüger, J., Meierrieks, D., & Schneider, F. (2010). The origins of terrorism: Cross-country estimates on socio-economic determinants of terrorism. European Journal of Political Economy, 27(1), 5–16. http://hdl.handle.net/10419/119352
Ismail, A., & Amjad, S. (2014). Determinants of terrorism in Pakistan: An empirical investigation. Economic Modelling, 37(C), 320–331.
Kitthaworn, P., Lertpipat, D., Poonsap, A., Sainui, S., Daoh, P., Pipitpan, N., Rakdee, O., & Chomaithong, S. (2007). Impact of violence on safety lives and properties: A case study of people migration in three southern provinces of Thailand [Research report, National Research Council of Thailand]. https://soreda.oas.psu. ac.th/show_detail.php?research_id=492
Krieger, T., & Meierrieks, D. (2011). What causes terrorism? Public Choice, 147(1/2), 3–27. Mahouna, A., Fadina, R., & Barjolle, B. (2018). Farmers’ adaptation strategies to climate change and their
implications in the Zou department of south Benin. Environments, 5(15), 2–17. https://doi: org/10.3390/environments5010015
Marohabout, P., Choonpradub, C., & Kuning, M. (2009). Terrorism risk modeling in southern border provinces of Thailand during 2004 to 2005. Songklanakarin Journal Social Sciences and Humanities, 15(6), 885–895. https://soreda.oas.psu.ac.th/show_detail.php?research_id=503
Miguel, E., & Roland, G. (2005). The long run impact of bombing Vietnam. Journal of Development Economics, 96, 1–5. https://doi: org/10.1016/j.jdeveco.2010.07.004
National Statistical Office. (2019). Chamnuan khruarưan kasettrako n thi khưn thabian kasettrako n chamnæk rai changwat Pho .So . 2557–2561 [2014–2018 Census of registered agricultural households classified by province]. http://statbbi.nso.go.th/staticreport/page/sector/th/11.aspx
Office of the National Economic and Social Development Board. (2009). Phænkan phatthana phưnthi phiset ha changwat chaidæn phak tai pi 2552-2555 [Development plan for special areas in the 5 southern border provinces 2009–2012]. http://slbkb.psu.ac.th/xmlui/bitstream/handle/2558/1068/แ ผ น พ ฒ น า พ น ท พ เ ศ ษ %
205%20จงหวดชายแดนภาคใต.pdf?sequence=1&isAllowed=y
Sama-air, A., & Mhadmarn, H. (2016). The opinion of community leaders on economic development of government in three southern border provinces. Al-Nur Journal of Graduate School of Fatoni University, 11(20), 151–164. https://so01.tci-thaijo.org/index.php/NUR_YIU/article/view/77808/62388
Sanongphan, S. (2012). The political violence in the three southern border provinces of Thailand. Research Journal of Rajamangala University of Technology Srivichai, 4(2), 31–45. http://rdi.rmutsv.ac.th/rmutsvrj/ download/year4-issue2-2555/p31.pdf
Singh, P. (2012). Insurgency, crime, and agricultural labor expenditure: Evidence from Punjab, 1978–1990. Economics of Peace and Security Journal, 7(2), 33–40.
Songsom, A. (2009). Household economy in Pattani province under the southern unrest. Journal of Humanities and Social Sciences, 5(2),37–70. https://so03.tci-thaijo.org/index.php/eJHUSO/article/view/85872
Thaksin University. (2017). Phæn phatthana klum changwat phak tai chaidæn si pi ( Pho .So . 2561–2564) [Four-year development plan for southern border provinces (2018–2021)]. https://www.osmsouth-border.go.th/news_develop
Human Behavior, Development and Society ISSN 2651-1762, Vol 21 No 3, September 2020
30
Formative and Summative Evaluations in Learning Physics: Do They Complement Each Other?
Nur Rasfina Mahyan1, Nor Hayati Jaya, Liyana Rosli, Universiti Malaysia Sarawak
Date Received: 21 May 2020 Revised: 19 June 2020 Accepted: 23 June 2020
Abstract
A correlational study was conducted to analyse the relationship between students’ performance in problem-based learning (PBL) and final exam scores with two student cohorts. This study focused on PBL as a teaching strategy and how it related to the students’ achievement in the final exam of a physics course. Exam reliability was assessed by Cronbach’s alpha, and values were obtained ranging from .71 to .83. Correlation between students’ scores in PBL and the final exam was analysed using Pearson’s correlation coefficient. Statistical significant was shown only for semester 2 in Cohort A. For Cohort A semester 1 and both semesters for Cohort B, the correlations were not significant. The corresponding highest Pearson correlation coefficient was .19, which was only for Cohort A semester 2. Coefficients of determination showed that PBL accounted for about 0 to 3.7% of the variance in students’ final exam scores. In all semesters for both cohorts, the difference between final exam scores and PBL scores was significantly higher in the upper quartile of students’ scores, and lower in the lower quartile of students’ scores. Thus, this study showed that PBL can be implemented as one of the teaching strategies to improve some students’ academic achievement.
Keywords: Physics, teaching strategy, problem-based learning, assessment, achievement Introduction
Teaching science effectively in schools, especially physics, is a challenge for educators, and has been of great concern in Malaysian educational institutes for a long period of time (Halim et al., 2012). Several researchers have identified the weaknesses in Malaysia’s teaching and learning methods. The main problem with traditional methods of teaching is that students tend to memorize problem-solving strategies without understanding the concept. This is a consequence of the method of teaching that emphasizes problem-solving rather than conceptual understanding (Mazur, 1999). Since Malaysia’s education system has a tendency to be examination-oriented (Kirkpatrick & Zang, 2011), it leads to a poor mastery of core and generic skills in students’ learning (Goh & Ali, 2014). The goal of learning science in the 21st century, as noted by the South Africans, is to educate students to understand concepts, develop process skills, and develop thinking skills for knowledge transfer (Department of Education, 2011). Pang (2011) stated that one of the key strategies for building an integrated human workforce is to restructure the education system to enhance students’ performance. Hence, educators need more effective teaching methods to provide motivation for courses, help students with difficulties, (EL-Shaer & Gaber, 2014), and be relevant for learners in a Science, Technology, Engineering and Math (STEM) community. According to Pedaste et al. (2015), students can engage with real-world applications of science and mathematical principles, by integrating technology into mathematics and science courses. Learning activities should focus on activating students’ creativity and critical thinking skills, rather than be restricted to rote learning (Goh & Ali, 2014).
Several researchers have explored the benefits of problem-based learning (PBL) and how it affects the performance of students in learning science. As an educational method, PBL assists learners in applying scientific knowledge to real-life situations using an open inquiry technique (Ketpichainarong et al., 2010). This is unlike the conventional passive teaching method, which does not encourage problem-solving and the development of cognitive skills (Ronis, 2008). Students who are exposed to PBL can transfer their skills and knowledge into real-life situations (Hoffman & Ritchie, 1997). Sungur
1 Corresponding author email address: [email protected]
31
and Tekkaya (2006) believed that PBL enabled students to improve self-regulatory skills, and thus enhance their academic performance. PBL as a teaching method encourages students to understand the process of information searching related to a problem, thus enhancing their thinking capability (Aidoo et al., 2016). The teacher only assists the students throughout the process of learning, while the students take charge of their own learning to find a solution (Ngeow & Kong, 2001). Cockrell et al. (2000) agreed that student's perception of PBL instruction had increased, as it allowed them to foster knowledge transfer. PBL is more effective compared to other pedagogical methods, for it facilitates students’ problem-solving and critical thinking skills since the learning theory can be applied in practice (Cooke & Moyle, 2002). Tretten and Zachariou (1995) stated that PBL allowed students to improve their ability to think critically after analysing a problem. This is due to their exposure to positive learning attitudes and the development of problem-solving skills (Aidoo et al., 2016).
However, several studies have highlighted some challenges in the implementation of PBL in science learning. Lockheed and Verspoor (1991) revealed that teaching science through the use of PBL appears to have some challenges, such as the lack of teaching aids, the lack of learning materials, the large size of classes, teachers’ attitudes regarding science, and teachers’ pedagogical skills. Ageorges et al. (2014) added that the limited number of teaching staff, the large number of students, and the economic constraints of educational institutions lead to difficulties in developing the PBL methodology. Besides, Bakaç (2014) stated that the most difficult process encountered in the PBL approach was to prepare suitable scenarios for the subject's learning gains. Preparing questions for evaluating the achievement of students in PBL becomes complicated, and assessment must be well-planned in advance (Ertmer et al., 2009). Energy and time invested in preparing successful PBL programs that promote learning and arouse students’ interest may discourage lecturers (Barber et al., 2015). Another major challenge in the implementation of PBL was the negative reaction of students to PBL (Ageorges et al., 2014). Also, students may not have the ability to carry out the inquiry process effectively, and thus become demotivated during the learning approach (Edelson et al., 1999).
Multiple studies have been completed in the field of medical enquiry, where PBL was introduced as a hybrid curriculum. Although PBL was first introduced in the field of engineering, research concerning the effectiveness of PBL for engineering students or those taking physics remains rather limited. To improve students’ performance in physics, lecturers should use a more engaging teaching strategy. PBL is one of the strategic teaching methods.
Methodology Research Approach
The present researchers sought to provide insights into the ability of lecturers to distinguish between excellent and poor students by using the final examination performance as a basis of comparison with PBL. In PBL, facilitators were instructed to evaluate students’ knowledge and their ability to integrate knowledge, regardless of group skills. This approach was adopted, for at the end of each semester, the aim of the study was to produce a component of the overall assessment that represented student learning irrespective of their performance on exams.
A correlational research approach was used in this study to analyse the relationship between students’ performance in PBL and final exam scores. This involved the use of two student cohorts studying physics. The curriculum examined encompassed two semesters in a one-year foundational program. During the first semester, the physics course focused on the study of motion in a body or a system, and in the second semester, the course contained electromagnetism, which included both electricity and magnetism. The curriculum was designed to cover all learning objectives of the course. In grading students’ performance in both PBL and the final examination, the lecturers used the answer schemes and rubrics provided to guide their evaluation. If students’ final grades produced a significant correlation with their scores in PBL, the PBL assessment would be maintained for the next cohort. It was expected that PBL as a teaching strategy could help improve students’ learning in the physics course. The null hypothesis adopted, hence, was that students’ scores in PBL would not be correlated with students’ exam scores.
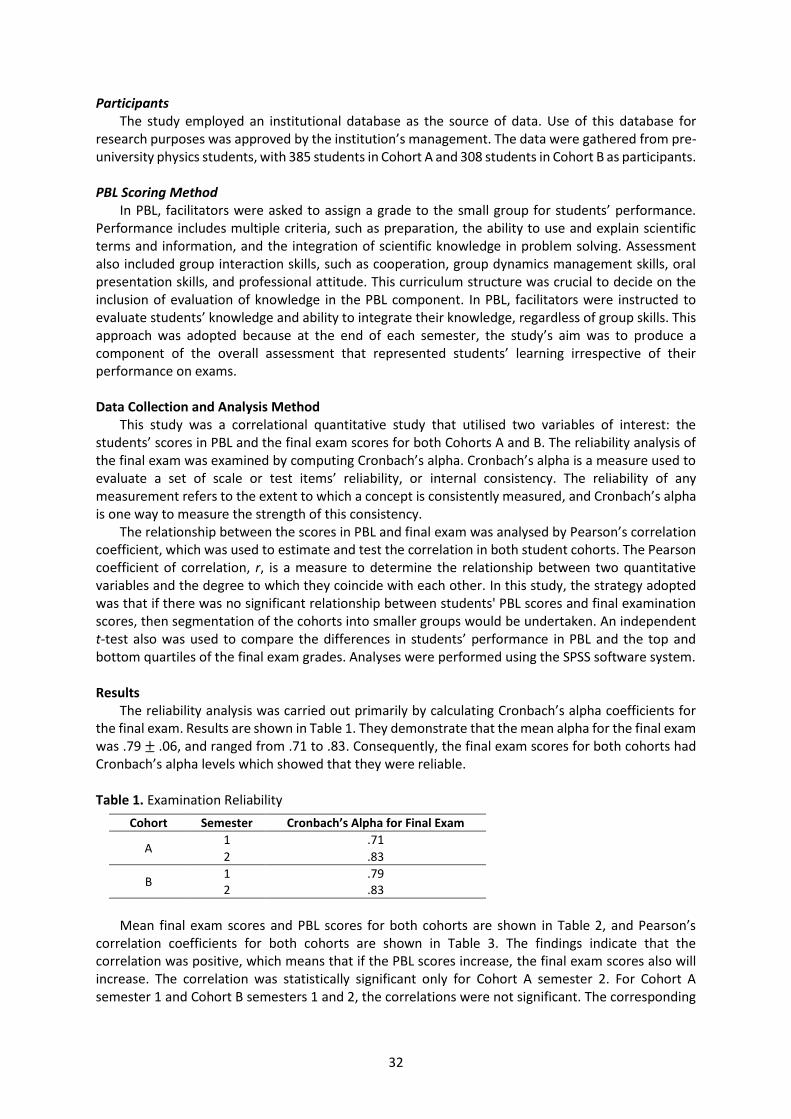
32
Participants The study employed an institutional database as the source of data. Use of this database for
research purposes was approved by the institution’s management. The data were gathered from pre-university physics students, with 385 students in Cohort A and 308 students in Cohort B as participants.
PBL Scoring Method
In PBL, facilitators were asked to assign a grade to the small group for students’ performance. Performance includes multiple criteria, such as preparation, the ability to use and explain scientific terms and information, and the integration of scientific knowledge in problem solving. Assessment also included group interaction skills, such as cooperation, group dynamics management skills, oral presentation skills, and professional attitude. This curriculum structure was crucial to decide on the inclusion of evaluation of knowledge in the PBL component. In PBL, facilitators were instructed to evaluate students’ knowledge and ability to integrate their knowledge, regardless of group skills. This approach was adopted because at the end of each semester, the study’s aim was to produce a component of the overall assessment that represented students’ learning irrespective of their performance on exams.
Data Collection and Analysis Method
This study was a correlational quantitative study that utilised two variables of interest: the students’ scores in PBL and the final exam scores for both Cohorts A and B. The reliability analysis of the final exam was examined by computing Cronbach’s alpha. Cronbach’s alpha is a measure used to evaluate a set of scale or test items’ reliability, or internal consistency. The reliability of any measurement refers to the extent to which a concept is consistently measured, and Cronbach’s alpha is one way to measure the strength of this consistency.
The relationship between the scores in PBL and final exam was analysed by Pearson’s correlation coefficient, which was used to estimate and test the correlation in both student cohorts. The Pearson coefficient of correlation, r, is a measure to determine the relationship between two quantitative variables and the degree to which they coincide with each other. In this study, the strategy adopted was that if there was no significant relationship between students' PBL scores and final examination scores, then segmentation of the cohorts into smaller groups would be undertaken. An independent t-test also was used to compare the differences in students’ performance in PBL and the top and bottom quartiles of the final exam grades. Analyses were performed using the SPSS software system. Results
The reliability analysis was carried out primarily by calculating Cronbach’s alpha coefficients for the final exam. Results are shown in Table 1. They demonstrate that the mean alpha for the final exam was .79 ± .06, and ranged from .71 to .83. Consequently, the final exam scores for both cohorts had Cronbach’s alpha levels which showed that they were reliable.
Table 1. Examination Reliability
Cohort Semester Cronbach’s Alpha for Final Exam
A 1 .71
2 .83
B 1 .79 2 .83
Mean final exam scores and PBL scores for both cohorts are shown in Table 2, and Pearson’s
correlation coefficients for both cohorts are shown in Table 3. The findings indicate that the correlation was positive, which means that if the PBL scores increase, the final exam scores also will increase. The correlation was statistically significant only for Cohort A semester 2. For Cohort A semester 1 and Cohort B semesters 1 and 2, the correlations were not significant. The corresponding
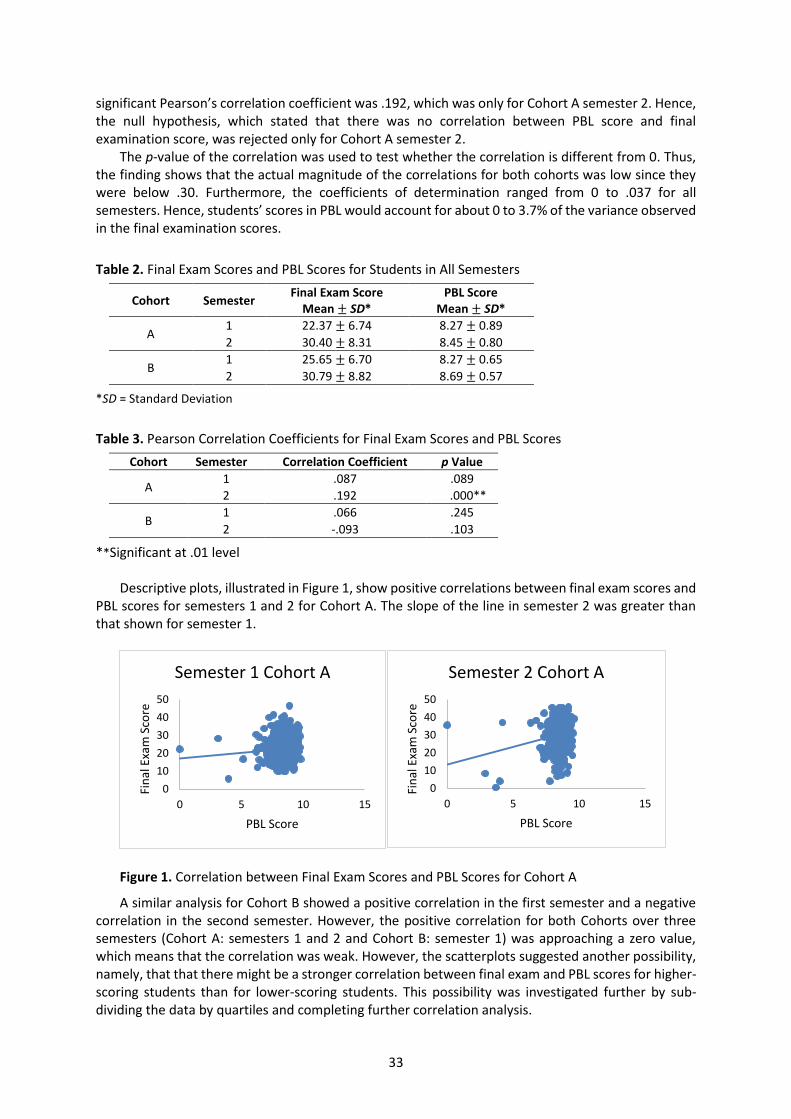
33
significant Pearson’s correlation coefficient was .192, which was only for Cohort A semester 2. Hence, the null hypothesis, which stated that there was no correlation between PBL score and final examination score, was rejected only for Cohort A semester 2.
The p-value of the correlation was used to test whether the correlation is different from 0. Thus, the finding shows that the actual magnitude of the correlations for both cohorts was low since they were below .30. Furthermore, the coefficients of determination ranged from 0 to .037 for all semesters. Hence, students’ scores in PBL would account for about 0 to 3.7% of the variance observed in the final examination scores.
Table 2. Final Exam Scores and PBL Scores for Students in All Semesters
Cohort Semester Final Exam Score
Mean ± SD* PBL Score
Mean ± SD*
A 1 22.37 ± 6.74 8.27 ± 0.89
2 30.40 ± 8.31 8.45 ± 0.80
B 1 25.65 ± 6.70 8.27 ± 0.65
2 30.79 ± 8.82 8.69 ± 0.57
*SD = Standard Deviation
Table 3. Pearson Correlation Coefficients for Final Exam Scores and PBL Scores
Cohort Semester Correlation Coefficient p Value
A 1 .087 .089
2 .192 .000**
B 1 .066 .245
2 -.093 .103
**Significant at .01 level Descriptive plots, illustrated in Figure 1, show positive correlations between final exam scores and
PBL scores for semesters 1 and 2 for Cohort A. The slope of the line in semester 2 was greater than that shown for semester 1.
Figure 1. Correlation between Final Exam Scores and PBL Scores for Cohort A
A similar analysis for Cohort B showed a positive correlation in the first semester and a negative correlation in the second semester. However, the positive correlation for both Cohorts over three semesters (Cohort A: semesters 1 and 2 and Cohort B: semester 1) was approaching a zero value, which means that the correlation was weak. However, the scatterplots suggested another possibility, namely, that that there might be a stronger correlation between final exam and PBL scores for higher-scoring students than for lower-scoring students. This possibility was investigated further by sub-dividing the data by quartiles and completing further correlation analysis.
0
10
20
30
40
50
0 5 10 15
Fin
al E
xam
Sco
re
PBL Score
Semester 1 Cohort A
0
10
20
30
40
50
0 5 10 15
Fin
al E
xam
Sco
re
PBL Score
Semester 2 Cohort A
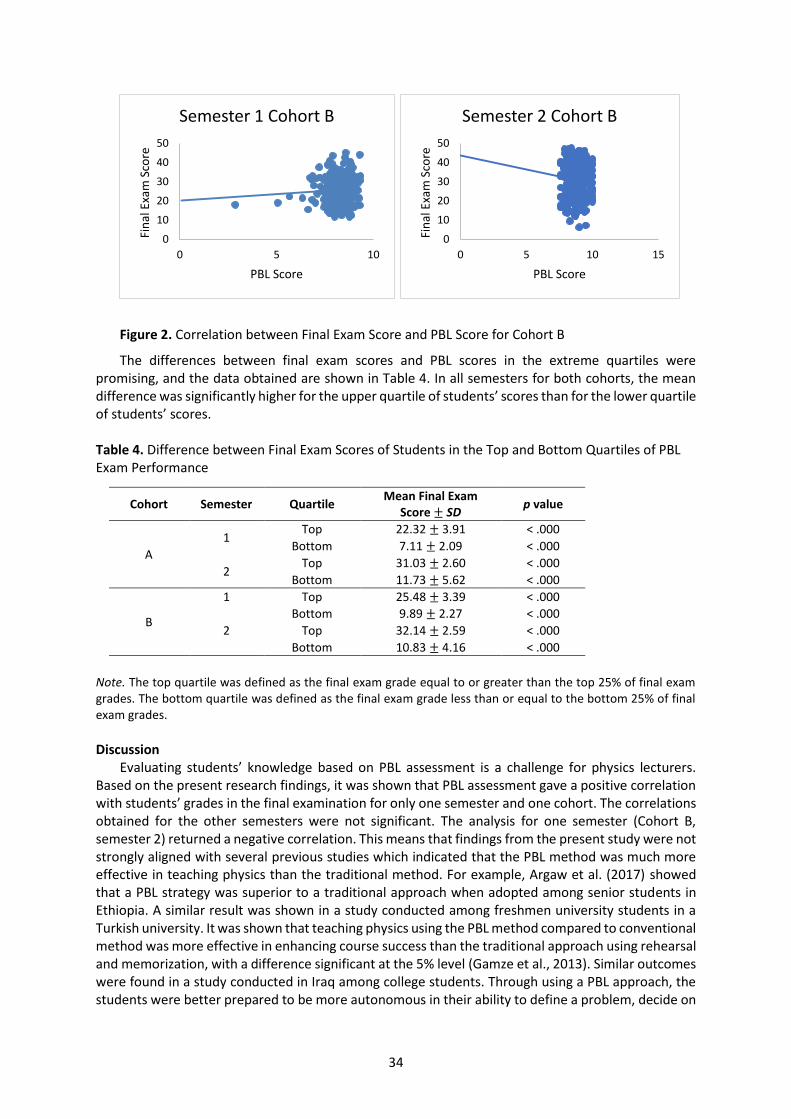
34
Figure 2. Correlation between Final Exam Score and PBL Score for Cohort B
The differences between final exam scores and PBL scores in the extreme quartiles were promising, and the data obtained are shown in Table 4. In all semesters for both cohorts, the mean difference was significantly higher for the upper quartile of students’ scores than for the lower quartile of students’ scores. Table 4. Difference between Final Exam Scores of Students in the Top and Bottom Quartiles of PBL Exam Performance
Cohort Semester Quartile Mean Final Exam
Score ± SD p value
A
1 Top 22.32 ± 3.91 < .000
Bottom 7.11 ± 2.09 < .000
2 Top 31.03 ± 2.60 < .000
Bottom 11.73 ± 5.62 < .000
B
1 Top 25.48 ± 3.39 < .000
Bottom 9.89 ± 2.27 < .000
2 Top 32.14 ± 2.59 < .000
Bottom 10.83 ± 4.16 < .000
Note. The top quartile was defined as the final exam grade equal to or greater than the top 25% of final exam grades. The bottom quartile was defined as the final exam grade less than or equal to the bottom 25% of final exam grades.
Discussion
Evaluating students’ knowledge based on PBL assessment is a challenge for physics lecturers. Based on the present research findings, it was shown that PBL assessment gave a positive correlation with students’ grades in the final examination for only one semester and one cohort. The correlations obtained for the other semesters were not significant. The analysis for one semester (Cohort B, semester 2) returned a negative correlation. This means that findings from the present study were not strongly aligned with several previous studies which indicated that the PBL method was much more effective in teaching physics than the traditional method. For example, Argaw et al. (2017) showed that a PBL strategy was superior to a traditional approach when adopted among senior students in Ethiopia. A similar result was shown in a study conducted among freshmen university students in a Turkish university. It was shown that teaching physics using the PBL method compared to conventional method was more effective in enhancing course success than the traditional approach using rehearsal and memorization, with a difference significant at the 5% level (Gamze et al., 2013). Similar outcomes were found in a study conducted in Iraq among college students. Through using a PBL approach, the students were better prepared to be more autonomous in their ability to define a problem, decide on
0
10
20
30
40
50
0 5 10
Fin
al E
xam
Sco
re
PBL Score
Semester 1 Cohort B
0
10
20
30
40
50
0 5 10 15
Fin
al E
xam
Sco
re
PBL Score
Semester 2 Cohort B
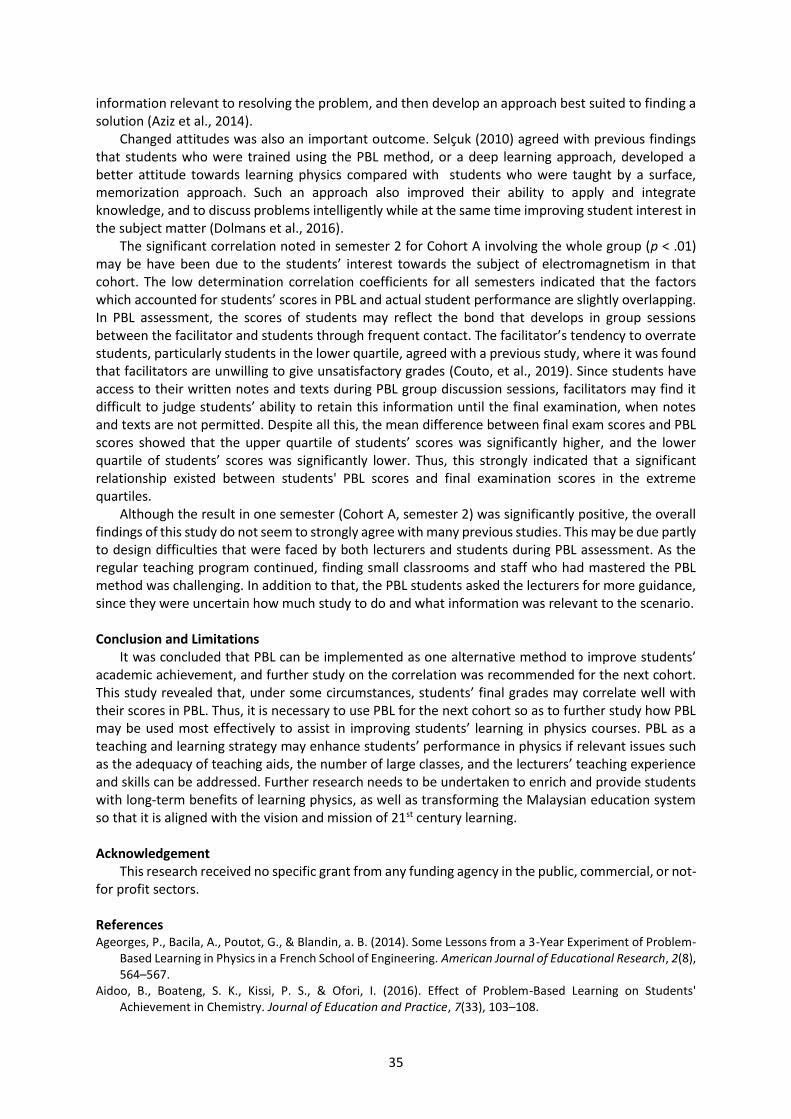
35
information relevant to resolving the problem, and then develop an approach best suited to finding a solution (Aziz et al., 2014).
Changed attitudes was also an important outcome. Selçuk (2010) agreed with previous findings that students who were trained using the PBL method, or a deep learning approach, developed a better attitude towards learning physics compared with students who were taught by a surface, memorization approach. Such an approach also improved their ability to apply and integrate knowledge, and to discuss problems intelligently while at the same time improving student interest in the subject matter (Dolmans et al., 2016).
The significant correlation noted in semester 2 for Cohort A involving the whole group (p < .01) may be have been due to the students’ interest towards the subject of electromagnetism in that cohort. The low determination correlation coefficients for all semesters indicated that the factors which accounted for students’ scores in PBL and actual student performance are slightly overlapping. In PBL assessment, the scores of students may reflect the bond that develops in group sessions between the facilitator and students through frequent contact. The facilitator’s tendency to overrate students, particularly students in the lower quartile, agreed with a previous study, where it was found that facilitators are unwilling to give unsatisfactory grades (Couto, et al., 2019). Since students have access to their written notes and texts during PBL group discussion sessions, facilitators may find it difficult to judge students’ ability to retain this information until the final examination, when notes and texts are not permitted. Despite all this, the mean difference between final exam scores and PBL scores showed that the upper quartile of students’ scores was significantly higher, and the lower quartile of students’ scores was significantly lower. Thus, this strongly indicated that a significant relationship existed between students' PBL scores and final examination scores in the extreme quartiles.
Although the result in one semester (Cohort A, semester 2) was significantly positive, the overall findings of this study do not seem to strongly agree with many previous studies. This may be due partly to design difficulties that were faced by both lecturers and students during PBL assessment. As the regular teaching program continued, finding small classrooms and staff who had mastered the PBL method was challenging. In addition to that, the PBL students asked the lecturers for more guidance, since they were uncertain how much study to do and what information was relevant to the scenario.
Conclusion and Limitations
It was concluded that PBL can be implemented as one alternative method to improve students’ academic achievement, and further study on the correlation was recommended for the next cohort. This study revealed that, under some circumstances, students’ final grades may correlate well with their scores in PBL. Thus, it is necessary to use PBL for the next cohort so as to further study how PBL may be used most effectively to assist in improving students’ learning in physics courses. PBL as a teaching and learning strategy may enhance students’ performance in physics if relevant issues such as the adequacy of teaching aids, the number of large classes, and the lecturers’ teaching experience and skills can be addressed. Further research needs to be undertaken to enrich and provide students with long-term benefits of learning physics, as well as transforming the Malaysian education system so that it is aligned with the vision and mission of 21st century learning.
Acknowledgement
This research received no specific grant from any funding agency in the public, commercial, or not-for profit sectors.
References Ageorges, P., Bacila, A., Poutot, G., & Blandin, a. B. (2014). Some Lessons from a 3-Year Experiment of Problem-
Based Learning in Physics in a French School of Engineering. American Journal of Educational Research, 2(8), 564–567.
Aidoo, B., Boateng, S. K., Kissi, P. S., & Ofori, I. (2016). Effect of Problem-Based Learning on Students' Achievement in Chemistry. Journal of Education and Practice, 7(33), 103–108.
36
Argaw, A. S., Haile, B. B., Ayalew, B. T., & Kuma, a. S. (2017). The effect of Problem Based Learning (PBL) Instruction on Students’ Motivation and Problem Solving Skills of Physics. EURASIA Journal of Mathematics Science and Technology Education, 13(3), 857–871.
Aziz, M. S., Zain, A. N., Samsudin, M. A., & Saleh, S. (2014). The effects of Problem-Based Learning on self-directed learning skills among physics undergraduates. International Journal of Academic Research in Progressive Education and Development, 3(1), 126–137.
Bakaç, A. K. (2014). The Effect of Problem Based Learning approach on conceptual understanding in teaching of magnetism topics. Eurasian Journal of Physics and Chemistry Education, 6(2), 110–122.
Barber, W., King, S., & Buchanan, S. (2015). Problem Based Learning and authentic assessment in digital pedagogy: Embracing the role of collaborative communities. Electronic Journal of E-Learning, 13(2), 59–67.
Cockrell, K. S., Caplow, J. A., & Donaldson, J. F. (2000). A context for learning: Collaborative groups in the problem-based learning environment. The Review of Higher Education, 23(3), 347–363.
Cooke, M., & Moyle, K. (2002). Students' evaluation of problem-based learning. Nurse Education Today, 22(4), 330–339.
Couto, L. B., Durand, M. T., Wolff, A. C., Restini, C. B., Jr., M. F., Romão, G. S., & Bestetti, R. B. (2019). Formative assessment scores in tutorial sessions correlates with OSCE and progress testing scores in a PBL medical curriculum. Medical Education Online, 24(1), Article 1560862. https://doi:10.1080/10872981.2018.1560862
Department of Education. (2011). National Curriculum and Assessment Policy Statement (CAPS). Government Printe (South Africa).
Dolmans, D. H., Loyens, S. M., Marcq, H., & Gijbels, D. (2016). Deep and surface learning in problem-based learning: A review of the literature. Advances in Health Sciences Education, 21(5), 1087–1112.
Edelson, D. C., Gordin, D. N., & Pea, R. D. (1999). Addressing the challenges of inquiry-based learning through technology and curriculum design. Journal of the learning sciences, 8(3–4), 391–450.
Education, D. O. (2011). National Curriculum and Assessment Policy Statement (CAPS). Government Printer (South Africa).
EL-Shaer, A., & Gaber, H. (2014). Impact of Problem-Based Learning on students' critical thinking dispositions, knowledge acquisition and retention. Journal of Education and Practice, 5(14), 74–85.
Ertmer, P. A., Glazewski, K. D., Jones, D., Ottenbreit-Leftwich, A., & Goktas, Y. (2009). Facilitating technology-enhanced Problem-based Learning (PBL) in the middle school classroom: An examination of how and why teachers adapt. Journal of Interactive Learning Research, 20(1), 35–54.
Gamze, S. S., Serap, C., & Mehmet, Ş. (2013). A comparison of achievement in Problem-based, strategic and traditional learning classes in Physics. International Journal on New Trends in Education and Their Implications, 4(1), 154–164.
Goh, H., & Ali, M. b. (2014). Robotics as a tool to STEM learning. International Journal for Innovation Education and Research, 2(10), 66–78.
Halim, L., Dahlan, F., Treagust, D., & and Chandrasegaran, A. (2012). Experiences of teaching the heat energy topic in English as a second language. Science Eduaction International, 23(2), 117–132.
Hoffman, B., & Ritchie, D. (1997). Using multimedia to overcome the problems with problem-based learning. Instructional Science, 25, 97–115.
Ketpichainarong, W., Panijpan, B., & and Ruenwongsa, P. (2010). Enhanced learning of biotechnology students by an inquiry-based cellulose laboratory. International Journal of Environmental and Science Education, 5(2), 169–187.
Kirkpatrick, R., & Zang, Y. (2011). The negative influences of exam-oriented education on Chinese high school students: Backwash from classroom to child. Language Testing in Asia, 1, Article 36. https://doi.org/ 10.1186/2229-0443-1-3-36
Lockheed, M. E., & Verspoor, A. M. (1991). Improving primary education in developing countries. Oxford University Press for World Bank.
Mazur, E. (1999). Understanding or memorization: Are we teaching the right thing? Proceedings of the Resnick Conference on the Introductory Course (pp. 113–123). John Wiley. http://sdsu-physics.org/sdsu_per/articles/Mazurpubs_89.pdf
Ngeow, K., & Kong, Y. S. (2001). Learning to learn: Preparing teachers and students for Problem-Based Learning. https://files.eric.ed.gov/fulltext/ED457524.pdf
Pang, C. L. (2011). Technical Education and Vocational Training (TEVT) in Malaysia: Revisiting the TEVT Framework. Malaysia Prince Hotel, Kuala Lumpur.
37
Pedaste, M., Mäeots, M., Siiman, L. A., Jong, T. D., van Riesen, S. A. N., Kamp, E. T., Manoli, C. C., Zacharia, Z. C., & Tsourlidaki, E. (2015). Phases of inquiry-based learning: Definitions and the inquiry cycle. Educational Research Review, 14, 47–61.
Ronis, D. L. (2008). Problem-based learning for math and science: Integrating inquiry and the Internet (2nd ed). Corwin Press.
Selçuk, G. S. (2010). The effects of problem-based learning on pre-service teachers’ achievement, approaches and attitudes towards learning physics. International Journal of the Physical Sciences, 5(6), 711–723.
Sungur, S., & Tekkaya, C. (2006). Effects of problem-based learning and traditional instruction on self-regulated. The journal of educational research, 99(5), 307–320.
Tretten, R., & Zachariou, P. (1995). Learning about project-based learning: Self-assessment preliminary report of results. The Autodesk Foundation.
Human Behavior, Development and Society ISSN 2651-1762, Vol 21 No 3, September 2020
38
Language and What Else? Academic Integration of International Students in a Thai University
Jariya Sairattanain, Sisaket Rajabhat University, Thailand
Jeffrey Dawala Wilang, King Mongkut’s University of Technology Thonburi, Thailand
Date Received: 29 January 2020 Revised: 6 May 2020 Accepted: 8 May 2020
Abstract Studies have indicated that language plays a central role in international students’ academic
integration. With an interest in Thailand, this study aimed to explore factors that affected international students’ academic integration. Initial data were collected from a discussion group attended by Thai and international students. Preliminary analysis of data using Antconc, a concordancing program, revealed the top words used were Thai, students, language, English, international, good, benefit, help, and study. Thereafter, insights from the concordance lines were used to develop guided questions for individual semi-structured interviews. Three international graduate students volunteered for the interview. Thematic analysis revealed that three topics, consisting of internal, external and institutional factors, had a bearing on academic integration. The findings indicated that while language, or other pertinent sociocultural factors, were pivotal for international students’ academic integration, there are also other factors worth considering.
Keywords: Academic integration, international students, higher education, Thailand Introduction
Over the last two decades, the Thai higher education scene has seen the introduction of numerous international programs (Rhein, 2016). With the primary aim of serving local students, international programs in Thailand have also attracted students from neighboring regions (Lavankura, 2013), as well as academics from around the world (Burford et al., 2018). Aside from offering a more affordable tuition, local and regional students are able to access English medium education with an English-based curriculum (Rhein, 2016; Lao, 2019). With this development, international students have become central to Thai higher education institutions. More than a source of income for institutions, they also bring with them diverse perspectives that allow the implementation of an international curriculum and internationalized Thai classrooms. Recognizing the impact of international students, it becomes necessary for higher education institutions to better understand factors that may come into play when integrating a new education culture in a different country.
While studies have critically examined the internationalization of higher education (e.g., Rhein, 2016; Boossabong, 2018; Lao, 2019), very few have actually looked international students’ academic integration (Rhein, 2018; Rhein & Jones, 2020). This is especially relevant in the peculiar sociolinguistic context such as that seen in Thailand. This needs to be addressed, given that Thai universities steadily are gaining global recognition. Furthermore, it is predicted that Thailand will become a regional educational hub in the coming years (Wilang, 2017), due to government policies, such as the creation of National Research University Initiative and Research Promotion in Higher Education Project spearheaded by the Office of Higher Education (OHEC) in 2009 (see also Kanjananiyot & Chaitiamwong, 2018).
In the succeeding sections, the paper provides a review of related literature, followed by the study context. Thereafter, details about the research methodology, including the participants, data collection and analytical frameworks are given. The results are discussed, as well as possible avenues for future studies.
39
Literature Review University students’ socialization into a higher education setting may be understood by looking at
the notion of academic integration appropriate to a particular sociocultural domain. Broadly speaking, and according to Baker and Siryk (1999), there are four concepts involved in academic integration: (1) academic adjustment, which covers educational demands; (2) social adjustment, which covers interpersonal-societal demands; (3) personal and emotional adjustment, which covers psychological and physical distress; and (4) attachment, which covers the educational institutional goals. Other authors, such as Almurideef (2016) and Ejiofo (2010), identified the following factors affecting international students: those related to culture (e.g., culture shock), emotional state (e.g., depression and anxiety), negative attitudes of the locals (e.g., discrimination), academic involvement (e.g., collaborative learning), and difficulties in social integration, among others.
These concepts represent the complex nature of higher education—a domain where students are confronted with views and perspectives. To successfully maneuver higher education and to achieve integration, authors have proposed the necessity of developing an intercultural disposition and competence (Young et al., 2013). An intercultural disposition and competence, however, may vary depending on the sociocultural context of a student. For instance, in an English-speaking context, international students have been found to integrate well into the academic and non-academic aspects of higher education given that they have acceptable levels of English language proficiency (for academic purposes) and have recurring social contacts with peers of the same nationality (Young et al., 2013). On the contrary, in a non-English speaking context, intercultural competence is crucial for international students to socialize with other non-local students. A common language such as English is also prioritized, but not necessarily for academic purposes; instead, it is used as a social tool for non-local students (Dalib et al., 2017) Insights from English and Non-English Speaking Environments
With high number of international students, many studies on academic integration have been conducted in the West. In the US, 2014 was the year when the country hosted 886,052 international students, with China as the top-sending country followed by India, South Korea, Taiwan and Japan (Almurideef, 2016). These international students do not necessarily transition smoothly into a new sociocultural setting. In the same study, it was reported that Saudi Arabians’ challenges included “culture, educational background, language, religion, family, economies, and gender issues” (Heyn, 2013, as cited in Almurideef, 2016, p. 8). Similarly, in the UK, international students experienced adjustment barriers on account of the language used, cultural perspectives, and academic conventions (Eze & Inegbedion, 2015). To overcome these challenges, students need to feel empowered. Brunton and Jeffrey (2014), in their survey of 196 international students in New Zealand universities, found that being empowered is significantly affected by students’ ability in the English language, their academic motivation, and their sense of distance with the host culture. These reports illustrate the centrality of the English language as a factor that facilitates academic integration. In non-English speaking environments insights about academic integration are distinct. For instance, among international students in South Korea, Alemu and Cordier (2017) reported that factors contributing to student satisfaction included academic and education quality, effective communication before going to Korea, socializing with Koreans and foreigners, understanding the Korean language, numbers of years residing in Korea, information accuracy, living arrangements, economic support, and East Asian culture. Similar to the study of Dalib and colleagues (2017), there seemed to be a need for students to equip themselves with a communicative tool for academic integration.
In the context of Thailand, academic integration may not be necessarily driven by high proficiency in the English language. Instead, the use and manifestation of English may be shaped by the tenets of English as a Lingua Franca (ELF), where English is used with a certain level of intelligibility (Seidlhofer, 2005). This can mean that English use emulates local social practices, with speakers being tolerant towards deviations from what is typically considered correct or standard (Sung, 2020). On top of the probable tolerance seen through the use of ELF, academic integration among international students
40
from neighboring countries may also be facilitated by Thailand’s proximity (geographical and cultural) with their home countries. Nonetheless, academic integration in a non-English speaking context may also be affected by issues such as prejudice, as that seen in the study of Rhein (2018) and Rhein and Jones (2020), where international students in Thailand encountered different experiences of racism. On one hand, students have found excessive attention due to the host community not having any social encounters before (e.g., never seen an African American), being isolated for not being able to communicate in Thai, or the preconceived notion of a disparity in class (e.g., always thinking that Burmese students have great financial difficulties).
To explore factors affecting the academic integration of international students in Thailand, this study took on a descriptive approach by using a corpus analysis tool—AntConc. Subsequently, we employed thematic analysis to understand the data (Boyatzis, 1998). Our methodology offered a different approach for the study of international students and academic integration, which have been examined primarily through surveys (e.g., Rujiprak, 2016; Rujiprak & Limprasert, 2016). The Study
In 2012, the Ministry of University in Thailand reported 16,999 international students enrolled at various higher education institutions. The student population represented at least 135 countries from around the world, with most students originating from Asia such as China, Myanmar, and Vietnam. However, in 2017, the number dropped to 12,000 according to the UK’s Quality Assurance Agency for Higher Education (2019). Despite the drop in numbers, Thailand remains an attractive educational hub, due to collaborative programs between Thai and foreign universities, the increasing number of English-taught courses, and the establishment of branch campuses of foreign institutes.
A top-ranked, and one of the most internationalized universities in Thailand, was chosen for the study. This institution is one of the most recognized research universities in Thailand. In addition, it is one of the top-ranked universities since 2008 according to the Times Higher Education Asia. It is also quite international. For example, in this university, using 2017 data, there were 758 students from 59 countries with the highest proportion coming from Japan (39%). The other top sending countries included Indonesia (8%), Vietnam (5%), Cambodia (4%), France (3%), and China (3%). To retain anonymity of the university under study, it is herein referred to as University X Bangkok. Participants
The number and nationalities of the participants in the study was varied according to the phase of data collection (two phases). The first phase included students enrolled in an academic writing course in Semester 2 of the 2017 school year. In this course, there was a group task, where both Thai and international students discussed the following topic: “Is it beneficial for foreign students to study with Thais? Why?” In total, 15 students took part voluntarily in this phase.
The second phase involved the focus group interview where three international students deeper reflected more deeply on factors affecting the academic integration of international students. In this phase, only three participants agreed to take part in the interview. They were all international students coming from Asia, namely, Myanmar, Cambodia and Pakistan (Table 1). Table 1. Participant’s Information
Number Country of origin Level of study Year level Area of study
1 Cambodian Master 1 Engineering 2 Pakistan Master 1 Biotechnology 3 Myanmar Master 1 Engineering
Data Collection Procedures
The first phase of data collection was done through a discussion among students about academic integration in the Thai higher education context. One of the researchers was the discussion moderator who initiated and facilitated the discussion in order to prompt students’ reflection about their
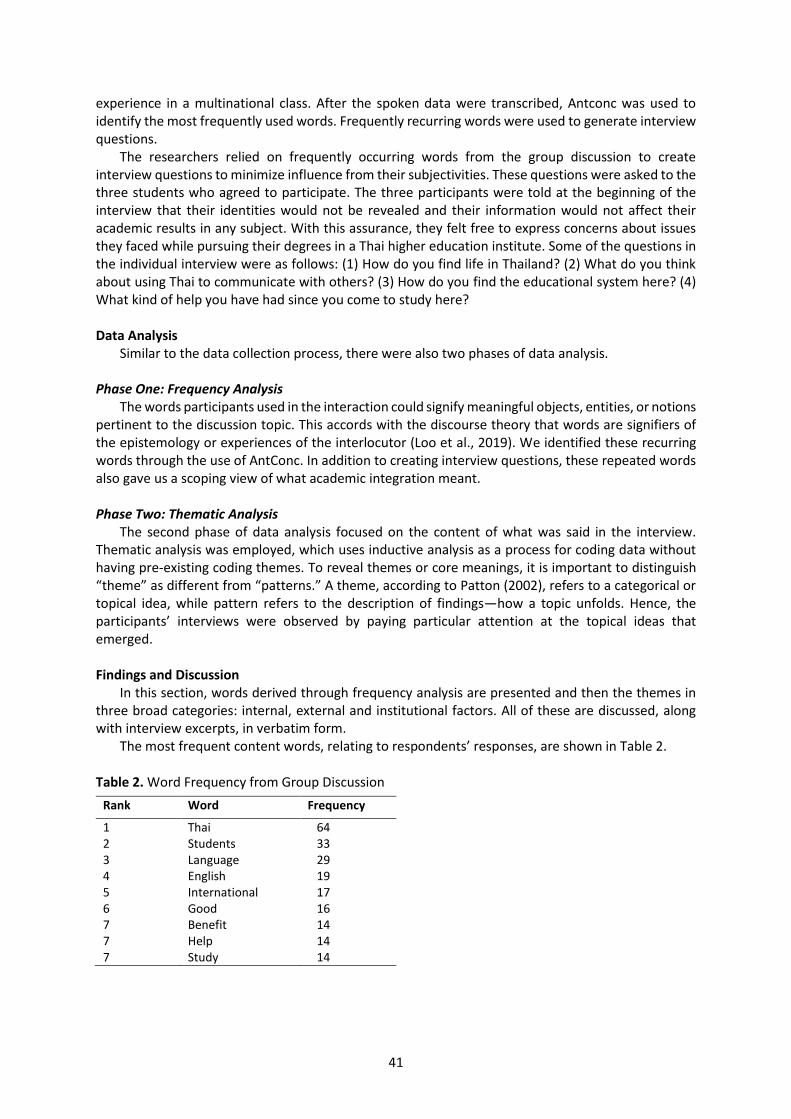
41
experience in a multinational class. After the spoken data were transcribed, Antconc was used to identify the most frequently used words. Frequently recurring words were used to generate interview questions.
The researchers relied on frequently occurring words from the group discussion to create interview questions to minimize influence from their subjectivities. These questions were asked to the three students who agreed to participate. The three participants were told at the beginning of the interview that their identities would not be revealed and their information would not affect their academic results in any subject. With this assurance, they felt free to express concerns about issues they faced while pursuing their degrees in a Thai higher education institute. Some of the questions in the individual interview were as follows: (1) How do you find life in Thailand? (2) What do you think about using Thai to communicate with others? (3) How do you find the educational system here? (4) What kind of help you have had since you come to study here? Data Analysis
Similar to the data collection process, there were also two phases of data analysis. Phase One: Frequency Analysis
The words participants used in the interaction could signify meaningful objects, entities, or notions pertinent to the discussion topic. This accords with the discourse theory that words are signifiers of the epistemology or experiences of the interlocutor (Loo et al., 2019). We identified these recurring words through the use of AntConc. In addition to creating interview questions, these repeated words also gave us a scoping view of what academic integration meant. Phase Two: Thematic Analysis
The second phase of data analysis focused on the content of what was said in the interview. Thematic analysis was employed, which uses inductive analysis as a process for coding data without having pre-existing coding themes. To reveal themes or core meanings, it is important to distinguish “theme” as different from “patterns.” A theme, according to Patton (2002), refers to a categorical or topical idea, while pattern refers to the description of findings—how a topic unfolds. Hence, the participants’ interviews were observed by paying particular attention at the topical ideas that emerged. Findings and Discussion
In this section, words derived through frequency analysis are presented and then the themes in three broad categories: internal, external and institutional factors. All of these are discussed, along with interview excerpts, in verbatim form.
The most frequent content words, relating to respondents’ responses, are shown in Table 2.
Table 2. Word Frequency from Group Discussion
Rank Word Frequency
1 Thai 64 2 Students 33 3 Language 29 4 English 19 5 International 17 6 Good 16 7 Benefit 14 7 Help 14 7 Study 14
42
In our earlier discussion, it was pointed out that other studies have indicated the significance of language, and other related attributes, such as culture, as factors affecting academic integration. As seen in Table 2, Thai, Language, and English, are in the top nine words of our frequency analysis. This gives us precursory insights into the role that these sociocultural factors play in international students’ academic integration.
The interview data yielded various topics related to academic integration. The first consideration involves topics under internal factors: Internal Factors
Internal factors include perceptions, existing beliefs, and general attitudes of the participants. From the data, it can be seen that participants mentioned what international students bring with them to a learning situation. This included attitude, perception, and motivation to study in other countries. For internal factors, there are two themes found in the interview data: the participants’ existing beliefs about the university and their attitude towards racism. Beliefs about Thai Education
The students’ belief about the quality of Thai education seemed to be an important issue when they discussed reasons in Thailand. Most of the students perceived that universities in Thailand seemed to have a higher standard than the ones in their home country. This perception contributed greatly to the international students’ willingness to come to study in Thailand, as described as follows: “I am saying that Thai universities have higher qualities than universities in Myanmar” (Burmese). “I think that the life in Thailand is very suitable to me and learn especially in the academics and in the background some different in Cambodia, Thai education is better” (Cambodian).
This perception is perhaps formed based on the fact that Thai higher education institutions offered more choices of programs for students. The prevalence of options may be translated to mean being “better.” When students perceived that they are in a better situation, they might have been more motivated to do well. We consider this an interesting finding, given that studies have indicated financial factors, and not quality, as significant criteria when enrolling with an international program located in a non-English speaking country (Ahmad & Buchanan, 2017). Apprehension from Racism
Apart from the belief about Thai higher education institutions, all the participants reported the feeling of being inferior when coming to Thailand. The students reported hearing racist encounters from their seniors who studied in Thailand. All of them felt that their nationality gave others a reason to look down on them. As a result of this pre-conceived notion, students are discouraged to make friends with others, especially those outside the university. The following quote is typical of responses received.
First all Pakistani, most of the people don’t know about it, and they associate it with terrorism because nowadays we have some issues like the negative relation with US and the Thai people are better responsive with US and European people than for Pakistanis.
This issue was brought up by Rhein (2018). He discussed ethnicized isolation as a situation where a person may be avoided due to their race, while ethnicized attention is a situation where excessive attention is given due to the novelty of a racial encounter. Both types of ethnicization are premised on racial prejudice, though the latter may seemingly appear positive. Similar to the experiences of African Americans studying in Thailand (Rhein, 2018), our participants also affirmed racist encounters, especially outside the university compound. The Burmese student also shared that there was racial tension outside, but all was well within the university. The statement made was “There is no discrimination within the university but outside the university is different.”
Within the university and university classrooms, all participants revealed that there was less likelihood of discrimination as compared to outside encounters. They felt that students and lecturers held moderate understandings on cultural differences. This second theme is related to the
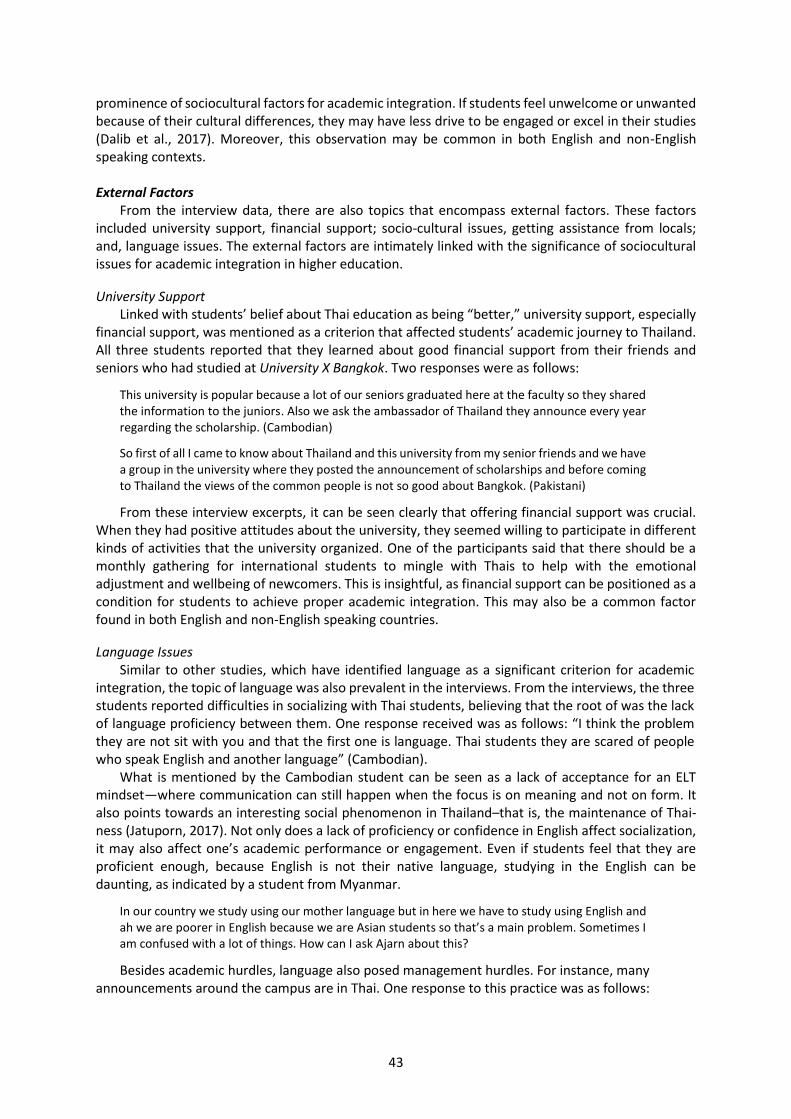
43
prominence of sociocultural factors for academic integration. If students feel unwelcome or unwanted because of their cultural differences, they may have less drive to be engaged or excel in their studies (Dalib et al., 2017). Moreover, this observation may be common in both English and non-English speaking contexts. External Factors
From the interview data, there are also topics that encompass external factors. These factors included university support, financial support; socio-cultural issues, getting assistance from locals; and, language issues. The external factors are intimately linked with the significance of sociocultural issues for academic integration in higher education.
University Support Linked with students’ belief about Thai education as being “better,” university support, especially
financial support, was mentioned as a criterion that affected students’ academic journey to Thailand. All three students reported that they learned about good financial support from their friends and seniors who had studied at University X Bangkok. Two responses were as follows:
This university is popular because a lot of our seniors graduated here at the faculty so they shared the information to the juniors. Also we ask the ambassador of Thailand they announce every year regarding the scholarship. (Cambodian)
So first of all I came to know about Thailand and this university from my senior friends and we have a group in the university where they posted the announcement of scholarships and before coming to Thailand the views of the common people is not so good about Bangkok. (Pakistani)
From these interview excerpts, it can be seen clearly that offering financial support was crucial. When they had positive attitudes about the university, they seemed willing to participate in different kinds of activities that the university organized. One of the participants said that there should be a monthly gathering for international students to mingle with Thais to help with the emotional adjustment and wellbeing of newcomers. This is insightful, as financial support can be positioned as a condition for students to achieve proper academic integration. This may also be a common factor found in both English and non-English speaking countries.
Language Issues Similar to other studies, which have identified language as a significant criterion for academic
integration, the topic of language was also prevalent in the interviews. From the interviews, the three students reported difficulties in socializing with Thai students, believing that the root of was the lack of language proficiency between them. One response received was as follows: “I think the problem they are not sit with you and that the first one is language. Thai students they are scared of people who speak English and another language” (Cambodian).
What is mentioned by the Cambodian student can be seen as a lack of acceptance for an ELT mindset—where communication can still happen when the focus is on meaning and not on form. It also points towards an interesting social phenomenon in Thailand–that is, the maintenance of Thai-ness (Jatuporn, 2017). Not only does a lack of proficiency or confidence in English affect socialization, it may also affect one’s academic performance or engagement. Even if students feel that they are proficient enough, because English is not their native language, studying in the English can be daunting, as indicated by a student from Myanmar.
In our country we study using our mother language but in here we have to study using English and ah we are poorer in English because we are Asian students so that’s a main problem. Sometimes I am confused with a lot of things. How can I ask Ajarn about this?
Besides academic hurdles, language also posed management hurdles. For instance, many announcements around the campus are in Thai. One response to this practice was as follows:
44
Some announcement is in Thai language so we can’t understand and read. So it’s quite difficult if the announcement is for me so I don’t know. It’s good to announce in both Thai and English to have a friendlier environment for international students. (Burmese)
From these excerpts, it appears that the notion of ELF might be problematic, mainly because there seems to be a lack of initiative from the local students and host institution. The ELF paradigm allows for linguistic affordances to support communication. This means that speakers do not need to possess high-levels of language abilities for communication to happen. However, ELF communication will not happen if one or more of the parties involved in an interaction refuse to engage in a common language. Help from Thai Friends
While the local students might not be open, in terms of speaking English, students in the interview divulged that the Thai students had been helpful.
They are helpful when I arrive here it is difficult for someone, like especially to order food. My friends in class help to find an apartment to find somewhere and to go somewhere. Even they are busy they help me to go somewhere. They are helpful. Some Thai students I think have difficulty in expressing themselves so they go but most Thai students are familiar talking with international students so they help me a lot. (Burmese)
These incidents from the Burmese participant showed that getting help from Thais seemed to be an important contribution to international student adjustment, despite the limited language ability of parties involved. Institutional Factors
Institutional factors consist of circumstances that may impede the sociocultural experience for international students. For instance, students may feel forced indirectly to concentrate on studying, instead of making new friends when studying abroad. While not necessarily supportive of sociocultural development, it is purposeful in that international students have a better understanding of the Thai university system and subsequently learn how to cope with rules, regulations and educational policies. Grade Requirements
Since most of the international students pursuing their degrees are on scholarship, they need to retain good grades. Sometimes, they found that meeting such expectation difficult to achieve as indicated by a Cambodian student.
To me the most pressure I have is the grade requirements I think that the school request of GPA limit is higher than 3.25 and should be below. It is difficult to get an A grade, even B plus, so our scholarship is affected.
The findings in the study highlight three factors affecting the integration of international students in Thailand. It could be seen that sociocultural factors are important for academic integration, but they alone do not determine the extent of students’ academic integration. Through the participants’ interview, we could see that other factors were linked with academic integration. Conclusions
The findings from this descriptive study illustrate how academic integration is shaped by students’ sociocultural perception and adaptation. The sociocultural factors, however, should not be treated as absolute; instead, they need to be seen as signifiers leading to other factors pertinent to an international study experience. Another observation made from this study was that, while Thailand seeks to be an educational hub for the ASEAN region, perceptions regarding language use need to be adjusted. Specifically, the Thai education community needs to be wary of the impact of their willingness to communicate in English, regardless of whether they have high proficiency. Furthermore, the institution needs to ensure that its intercultural efforts affect the immediate surroundings. Just as
45
mentioned by the Burmese student, who did not experience any racial prejudice within the university but did feel tension outside of the university, the society at large needs to examine their preconceived notions regarding international students. Only when there is a willingness to accept international visitors can sociocultural exchange and study abroad experiences be facilitated better. To achieve this, stakeholders in the education sectors and the community need to address conflicts that have surfaced due to the globalization of the workforce and westernization of Thai higher education (Lao, 2019; Rhein, 2016; Rhein & Jones, 2020). For our study, conducted in a non-English speaking context, this can constitute a distinct consideration for academic integration, aside from sociocultural factors.
From the findings and discussion, the following could be considered by administrators of Thai higher education institutions:
1. For international students, offer long-term courses on local language and culture, including courses that teach about the day-to-day happenings in the community;
2. For academic and administrative staff, provide professional development workshops grounded in intercultural competencies, especially for those working in international programs;
3. For the institution, gradually adjust the image of an institution through ample use of English, especially if international programs are offered; and
4. For the institution, ensure that intercultural opportunities are pervasive throughout the university (in classes or in extra-curricular activities) and its immediate surroundings.
Aside from being culturally aware to encourage academic integration, academic staff can also take into account the prospect of equitable teaching. This approach strives to minimize discrepancies in teachers’ management of student and promotes students to take responsibility for their learning (Saban, 2013). Only by being cognizant of the cultural diversity present in an international classroom can students become aware of the issues involved (Loo et al., 2018). After all, academic integration is a complex construct involving multiple variables; thus, students’ ability to settle within a new education domain needs also to be understood in the manner in which classes are organized. References Ahmad, S., & Buchanan, F. (2017). Motivation factors in students’ decision to study at international branch
campuses in Malaysia. Studies in Higher Education, 42(4), 651–668. Alemu, A., & Cordier, J. (2017). Factors influencing international student satisfaction in Korean universities.
International Journal of Educational Development, 57, 54–64. Almurideef, R. (2016). The challenges that international students face when integrating into higher education in
the United States. https://rdw.rowan.edu/cgi/viewcontent.cgi?article=3338&context=etd Baker, R., & Siryk, B. (1999). SACQ student adaptation to college questionnaire (2nd ed.). Western Psychological
Services. Boossabong, P. (2018). Neoliberalizing higher education in the Global South: lessons learned from policy impacts
on educational commercialization in Thailand. Critical Policy Studies, 12(1), 110–115. Boyatzis, R. (1998). Thematic analysis and code development: Transforming qualitative information. Sage
Publications. Brunton, M., & Jeffrey, L. (2014). Identifying factors that influence the learner empowerment of international
students. International Journal of Intercultural Relations, 43, 321–334. Burford, J., Koompraphant, G., & Jirathanapiwat, W. (2018). Being, adjusting and developing satisfaction: A
review of ajarn tangchart (non-Thai academics) within the Thai higher education system. Compare: A Journal of Comparative and International Education, 1–20.
Dalib, S., Harun, M., & Yusof, N. (2017). Student intercultural competence in a Malaysian campus: A phenomenological approach. Journal of Multicultural Discourses, 12(1), 42–62.
Ejiofo, L. (2010). The experiences of international students in a predominantly white American university [Master’s thesis, Graduate College, University of Nebraska]. https://digitalcommons.unl.edu/cgi/ viewcontent.cgi?article=1022&context=cehsedaddiss
Eze, S., & Inegbedion, H. (2015). Key factors influencing academic performance of international students’ in UK universities: A preliminary investigation. British Journal of Education, 3(5), 55–68.
Jatuporn, O. (2017). Education for enculturating the “Thainess” ideology: Decolonizing the Siamese colonial discourse in the social studies curriculum. Journal of International Social Studies, 6(2), 130–140.
46
Kanjananiyot P., & Chaitiamwong C. (2018). The internationalization of Thai higher education over the decades: Formidable challenges remain! In G. Fry (Ed.), Education in Thailand: An old elephant in search of a new mahout (pp. 271–321). Springer.
Lao, R. (2019). The politics, economics and cultural borrowing of Thai higher education reforms. In P. Chachavalpongpun (Ed.), Routledge handbook of contemporary Thailand. Routledge.
Lavankura, P. (2013). Internationalizing higher education in Thailand: Government and university responses. Journal of Studies in International Education, 17(5), 663–676.
Loo, D., Keough, W., Sundaresan, A., & Thomas, D. (2018). Perceptions towards engagement: The case of Thai English majors in an international higher education environment. LEARN Journal, 11(2), 116–133.
Loo, D., Trakulkasemsuk, W., & Jimarkon Zilli, P. (2019). Positioning students in the international intercultural classroom: An exploration of English teachers’ discourse. Journal of Liberal Arts, 19(1), 107–139.
Patton M. (2002). Qualitative research and evaluation method. Sage Publications. Quality Assurance Agency for Higher Education. (2019). Country report: Thailand. https://www.qaa.ac.uk/docs/
qaa/international/country-report-thailand-2019.pdf?sfvrsn=ab3fc081_6. Rhein, D. (2016). Westernisation and the Thai higher education system: Past and present. Journal of Educational
Administration and History, 48(3), 261–274. Rhein, D. (2018). African American student sociocultural adjustment to Thai international higher
education. Globalisation, Societies and Education, 16(4), 381–394. Rhein, D., & Jones, W. (2020). The impact of ethnicity on the sociocultural adjustment of international students
in Thai higher education. Educational Research for Policy and Practice. https://doi.org/10.1007/s10671-020-09263-9
Rujiprak, V. (2016). Cultural and psychological adjustment of international students in Thailand. International Journal of Behavioral Science, 11(2), 127–142
Rujiprak, V., & Limprasert, S. (2016). International students’ adjustment in Thailand. ABAC Journal, 36(1), 34–46. Saban, G. (2013). Learning needs in the multicultural classrooms: Implications to equitable teaching. Catalyst,
8(1), 7–24. Seidlhofer, B. (2005). English as a lingua franca. ELT journal, 59(4), 339–341. Sung, C. (2020). English as a lingua franca in the international university: Language experiences and perceptions
among international students in multilingual Hong Kong. Language, Culture and Curriculum. https://doi.org/10.1080/07908318.2019.1695814
Wilang, J. (2017, June 22–24). Silence of Japanese in a Thai EFL context [Paper presentation]. Proceedings of The International Conference on Doing Research in Applied Linguistics 3 / 19th English in South-East Asia Conference 2017 (DRAL 3/19th ESEA) (pp. 94–104). King Mongkut’s University of Technology, Thonburi, Bangkok, Thailand.
Young, T., Sercombe, P., Sachdev, I., Naeb, R., & Schartner, A. (2013). Success factors for international postgraduate students' adjustment: Exploring the roles of intercultural competence, language proficiency, social contact and social support. European Journal of Higher Education, 3(2), 151–171.
Human Behavior, Development and Society ISSN 2651-1762, Vol 21 No 3, September 2020
47
A Study of Millennial Job Satisfaction and Retention
Rachaniphorn Ngotngamwong, Stamford International University, Thailand
Date Received: 3 February 2020 Revised: 17 April 2020 Accepted: 27 April 2020
Abstract
Millennials have overtaken Baby Boomers as the largest generation in the workplace, as of April 2016, and organizations are being challenged more than ever to attract and retain job-hopping Millennials. The intent of this study was to investigate the factors contributing to Millennial job satisfaction, dissatisfaction, and their perspectives on retaining Millennials in Thailand. A total of 30 Millennials participated in a qualitative study that spanned over a period of four months. Millennials enjoyed jobs that provided challenging work while working alongside great colleagues in a pleasant working environment under good and supportive management. They also received satisfaction from competitive remunerations, training and career growth opportunities. On the other hand, others encountered unpleasant work experiences under bad management with communication problems while working with unpleasant coworkers, and receiving low remunerations. Millennials retention recommendations were for better management geared towards the needs of the new generation of employees, higher remuneration, good retention plans, providing mentorship and coaching opportunities, and establishing a more supportive work environment. Organizations could benefit from this study by using the results as possible change recommendations to increase Millennial job satisfaction that would in turn boost Millennial retention rates.
Keywords: Change, job dissatisfaction, job satisfaction, millennials, retention
Introduction
Millennials are today’s and the future’s fastest growing workforce population (Mihelic & Aleksić, 2017; Wen et al., 2018) who will make up 75% of working professionals by 2030 (Axten, 2015). In contrast to their previous cohorts, they have the tendency to job hop (Brown, 2017). Literature on Millennials has indicated that organizations have not been very successful in their retention efforts, hence the continual high turnover. The low employee retention and high turnover rates have been a tremendous financial drain on organizations, and strategies need to be developed to retain employees (Tadesse, 2018). The intent of this study was both exploratory and investigative, as it sought to find out what contributed to Millennial job satisfaction and dissatisfaction, as well as recommendations on Millennial retention from the Millennials themselves. Invaluable information gathered from the study would shed new light that could be used as recommendations to organizations in bringing about changes to improve Millennial job satisfaction and talent retention, as suggested by (Wen et al., 2018). Literature Review Millennials at Work
Millennials, also known as Gen Y, Generation Y, iPod Generation, Nexters, and the Why Generation (Williams & Page, 2011), were born between 1980 and 2000, and currently make up the majority of the workforce (Axten, 2015; Caraher, 2014). They look for managers who are caring, inspiring, and imaginative (Andert, 2011). When it comes to job selection, they are looking for an organization that is right for them, and do not just accept any job (Walsh, 2015). Showing little pride in their organizations (Angeline, 2011; Pratitas, 2011), they demonstrate minimal organizational loyalty (Deloitte, 2016; Hansen, 2015) and their relationship approach with their superiors is very different from the typical high-power distance relationship, as they expect close collaboration with their employers (Lancaster & Stillman, 2010). They have been said to show little respect for their superiors (Hansen, 2015) and consider their ideas just as good as their bosses, or sometimes even better (“Boomers and Millennials define the new workplace,” 2009). Creativity defines them (Axten,
48
2015; DeVaney, 2015; Espinoza & Ukleja, 2016). They seek meaningful jobs (Mihelic & Aleksić, 2017) that allow them to use their creativity (Espinoza & Ukleja, 2016). They want to be part of something meaningful and significant, and to be able to make a difference (Spano, 2015). Seeking for approval and praise (Crumpacker & Crumpacker, 2007), they want organizations to be open and listen to their comments and criticism (DeVaney, 2015).
Flexible working hours has been cited as one of the two most valuable Millennial work benefits (Wetherell et al., 2015) and they are willing to work hard, but would not go the extra mile by trying to impress their superiors by working 60–70 hours a week, as they do not believe in long working hours (Frankel, 2016). Being highly confident and overachievers (Axten, 2015; Hauw & Vos, 2010; Na-Nan & Saribut, 2019), they have the tendency to seek significantly higher advancement opportunities (Hauw & Vos, 2010), such as being considered for leadership roles (Kaifi et al., 2012). They are ranked higher in both self-esteem and assertiveness in comparison to the older generations (Deal et al., 2010).
Millennials have a preference for collaborating in teams (DeVaney, 2015; Fehn, 2009; Frankel, 2016) and are socially conscious (DeVaney, 2015; Saratovsky & Feldmann, 2013). Gen Yers want a great job (Gavert et al., 2015), are considered fast-paced workers (Lee et al., 2016), self-organized, and open (Saratovsky & Feldmann, 2013). They are out to change the world (Olson, 2018) with a ‘just-do-it kind of attitude’ (Aruna & Anitha, 2015, p. 94), and are filled with aspirations and ideas (Olson, 2018). They are enthusiastic and innovative (Axten, 2015), solution-focused (DeVaney, 2015; Saratovsky & Feldmann, 2013), self-directed in decision-making (Na-Nan & Saribut, 2019), engaged in frequent job changes (Caraher, 2014; Na-Nan & Saribut, 2019), and want to be happy at work (Caraher, 2014). Used to constant change in their lives, they have high levels of openness to it (Falletta, 2016; Kultalahti & Viitala, 2014), and are not afraid of challenges (Kultalahti & Viitala, 2014). They exhibit high levels of energy (Axten, 2015) and multitask (Axten, 2015; Zemke et al., 2000). Known as an instant generation, they seek instant gratification, as demonstrated by their needs for wanting “feedback now,” “training now,” and “recognition now” (Axten, 2015, p. 54), and show little patience when faced with difficult or challenging work (Angeline, 2011, Pratitas, 2011).
Turnover
Reasons for resignation vary from one individual to another, such as dissatisfaction with their jobs, heavy workloads (Sandhya & Kumar, 2011), high stress levels, or moving to better job opportunities elsewhere (Hillmer et al., 2004). Millennials change jobs when they want to (“Boomers and Millennials define the new workplace,” 2009), and their average job change is once every two years (Diskienė et al., 2017). They are said to have more than six job changes in their careers, particularly in their earlier working years (Burmeister, 2009; Dolezalek, 2007). Turnover begets turnover, meaning that when people leave an organization, those remaining have to take over their jobs while recruitment and training new staff are in place. This increased workload creates stress and may result in the decision to leave the organization (Mellott, 2018).
Aside from the enormous loss of knowledge, the financial costs involved in recruiting and training new employees are extremely high (Hancock et al., 2013). Turnover can be exacerbated by management (Bertagnoli, 2017) as “Employees do not quit their jobs, they quit their bosses!” (Campione, 2014, p. 19). Other turnover factors are inefficient policies and supervisors who undervalue employees (Natarajan & Palanissamy, 2015). Repressing their ability to express opinions or ignoring them would also drive them out of the organization (Olson, 2018), and that would be a bad idea because Millennials have so much to offer in terms of new perspectives (Zabriskie, 2016). The combination of low pay and stressful work can result in high turnover (~37%; Bertagnoli, 2017). They are more than happy to leave their jobs for another one to have a good life (Caraher, 2014). The revolving door keeps spinning due to low pay, burnout, and the clogged promotion pipeline that offers few advancements (Bertagnoli, 2017). Their targeted ideal employer is one that offers a relaxed work atmosphere, managerial opportunities, varied tasks, a shorter commute home, and a reputable company (Guillot-Soulez & Soulez, 2014).
49
Job Satisfaction Job satisfaction is defined as “a person’s evaluation of his or her job and work context. It is an
appraisal of the perceived job characteristics, work environment, and emotional experiences at work” (McShane & Von Glinow, 2018, p. 102). Overall job satisfaction varies depending on each cohort’s experiences and perspectives (Lamm & Meeks, 2009). Baby Boomers usually have higher levels of job satisfaction compared to Gen Xers and Yers (Bos et al., 2009; Young et al., 2013). Retirement delays by Baby Boomers, who are working past their retirement ages, have worsened advancement opportunities for Gen Xers and Yers (Mermin et al., 2007) and this had created yet another challenge for organizations to maintain job satisfaction (Young et al., 2013). Job satisfaction and retention rates are much higher when the Millennials’ values align with the organization’s culture (Inabinett & Ballaro, 2014). Positive outcomes from work-life balance have resulted in higher well-being, job satisfaction, health, productivity, and life satisfaction (Haar et al., 2014; Lyness & Judiesch, 2014). Millennials also experienced high levels of satisfaction and work-life balance when given the opportunity to craft their own jobs (Tims et al., 2012). Trust is appreciated (Seppanen & Gualtieri, 2012) and it is considered a significant and positive element that contributes to job satisfaction (Flaherty & Pappas, 2000). An important aspect that cannot be ignored is the need to motivate employees, as the lack of it would result in “dissatisfaction, job avoidance, absenteeism, psychological defenses, constructive protest, defiance and aggression of employees” (Wilson, 2005, as cited in Natarajan & Palanisamy, 2015, p. 714). Transformational leadership is the highest contributor to job satisfaction and employee retention for Millennials (Lee et al., 2016). They are disapproving of hierarchical management structure and resent it when their superiors’ opinions are most significant and indisputable (Rousseau, 2004).
Millennial Retention
Retention is significant (Siegfried Jr., 2008) and is largely affected by job satisfaction (Lee et al., 2016; Jauhar et al., 2017). There are positive correlations amongst job satisfaction, happy employees, and high performing organizations (Lee et al., 2016) and “enhancing workplace flexibility and equity between work and home life is critical to improving job satisfaction among millennial workers” (Ellis, 2013, p. 18) as they resist a “rigid bell-to-bell” workplace” (Chappell, 2012, p. 3). Organizations need to realize that although Millennials favor competitive salaries (Jauhar et al., 2017), money is not the sole motivator (Chappell, 2012). It is important to recognize their talents, strengths, and passions in designing jobs to match them (Bye, 2018). Some other retention techniques include keeping employees challenged (Siegfried Jr., 2008), motivated (Reuteman, 2015), engaged (Bye, 2018), and encouraging Millennials to collaborate and share their ideas in meetings (Reuteman, 2015). Organizations would also want to provide career coaching (Bye, 2018; Ware, 2014), flexibility (Chappell, 2012), and recognition for work well done (Reuteman, 2015; Jauhar et al., 2017). Empowerment, stimulating, and more fulfilling work (“Dial back high turnover rates,” 2010), career progression with advancement opportunities (Plew, 2013; Reuteman, 2015), and regular spot feedback and encouragement (Bye, 2018) are other retention tools.
Promoting a working environment that enhances freedom and flexibility and that grants them opportunities to work on projects increases their enthusiasm, creativity, and work commitment (“Dial back high turnover rates,” 2010). Millennials favor relationships, hence, managers can show that they care by establishing and maintaining a close relationship by getting to know Millennials on a personal level (Chappell, 2012; Fisher, 2015; “Dial back high turnover rates,” 2010). Millennials define the future, so both as employees and customers, organizations do not really have a choice when it comes to changing to adapt in order to compete and survive (Walsh, 2015). Many companies are still very traditional and use outdated methods (Falletta, 2016). There is an evident need to change how organizations should be led and managed (Falletta, 2016). Organizations might want to carefully consider creating a more Millennial-friendlier workplace by revising its traditional way of doing things (Aruna & Anitha, 2015). A big mistake that many organizations make is the assumption that Millennials are the same as previous generations in their attitudes and personal lives. The interactions and
50
communications that non-Millennials have with them need to be different if progress is to be seen (Frankel, 2016). Objectives and Research Questions
The main objectives of this study were to investigate the factors that Millennials were most satisfied and dissatisfied with at work, as well as recommendations for Millennial retention in Thailand as there was minimal research available on the topic. The gathered information could be used as valuable inputs for future organization models and retention plans where alignment to Millennial preferred work styles is being contemplated. The outcome from this study would also:
1. Provide insights as to what satisfies and dissatisfies Millennials in the workplace so that job satisfaction can be improved.
2. Provide insights as to what Millennials want organizations to do to retain them.
This study was guided by the following two research questions:
1. What are the top three factors that Millennials find satisfactory and disappointing in their current jobs?
2. What recommendations do Millennials have for employers to improve their retention? Methodology
This study was exploratory and sought to obtain the perspectives of Millennials on the research topic, “A Study of Millennial Job Satisfaction and Retention.” The qualitative research approach was chosen to align with the nature of the study (Creswell & Guetterman, 2018). This enabled the researcher to collect data in greater depth and detail (Zikmund et al., 2010). Grounded theory (GT) was the chosen qualitative research design, which included multiple participants who were involved in a process centered around a central phenomenon, namely, Millennial views on job satisfaction and retention.
Categories were developed through the clustering of similar codes (Merriam & Tisdell, 2016) and purposive sampling was used in the selection of 30 Millennials who were currently working in Bangkok, Thailand, and had at least a bachelor’s degree. The data collection technique used in this qualitative research study was the structured individual in-depth interview (IDI) that was conducted over business meals during either lunch or dinner. An open-ended interview protocol was used and consisted of three sections (total of 10 questions): (a) Demographics with four questions covering gender, age, ethnic background, and educational degree; (b) Job Satisfaction consisting of four questions that included the overall level of job satisfaction, top three items that contributed to job satisfaction, top three items that led to job dissatisfaction, and how long they planned to continue working at the current organization; and (c) recommendations for Millennial Retention with two questions that addressed the current employer efforts at retention and recommendations in Millennial retention techniques. Results Participants
Thirty working professional millennials (50% male and 50% female) participated in this study with representations from different industries in Thailand. The year range for Millennials spanned from 1980 to 2000 (Axten, 2015; Frankel, 2016) and were aged between 19 to 39 years of age in 2019. Four subcategories were established with the largest age group representation from ages 25 to 29 (60%), followed by a much smaller size of 30% representing the 30 to 34 years old age group. The smallest age groups that participated in this study were 35 to 39 (6.7%) and 19 to 24 (3.3%).
Job Satisfaction
The levels of job satisfaction were divided into five categories with the majority (76.7%) being either “Satisfied” (53.4%) or “Extremely Satisfied” (23.3%) while only 20% were “Moderately
51
Satisfied”, and only 3.3% or one person was “Dissatisfied”. The results also indicated that females were generally more satisfied than males. Each of the 30 participants were asked to state three factors that had contributed to their job satisfaction, and a total of 86 answers were gathered and categorized into eight main categories (Table 1). The top factor was the satisfaction derived from the job (39.5%). The participants reported having a perfect person-organization fit with a passion for their meaningful jobs that covered a multitude of tasks that came with autonomy and empowerment to make decisions without being pressured, and the opportunity to gain international working experiences. Up to nine participants stated that the job provided work-life balance and flextime, while two others were happy with their jobs because of the enjoyment received while working with nice customers. One participant said that “I get to learn a lot from the job and that would be most helpful in assisting me in starting my own business” while another shared that “I enjoy the work and never thought I would have an opportunity to do what I'm currently doing.”
The second most cited factor that contributed to job satisfaction was “colleagues” (14%). These colleagues were described as having great personalities that included being nice, educated, polite, fast, dynamic, and committed. They were also said to be helpful, close, like-minded, highly engaged, and were of the same generation. Two persons also stated that they enjoyed working as a team with their colleagues, who functioned as a great and supportive team. One person was happy to work in a “great non-competitive working environment alongside nice, well-educated, and polite coworkers.”
Both “Remuneration” and “Work Environment and Culture” were at a level of 10.5% in ranking. In terms of remuneration, salaries were said to be excellent as they were higher and more competitive, and benefits great. In fact, one female respondent stated that her salary was “extremely competitive and higher than other places.” As for favorable work environment and culture, up to four participants mentioned that the diverse and multicultural work environment had added to their job satisfaction. Others said that they liked the work environment because it was nice, supportive, friendly, and non-competitive. Training and career growth opportunities were also important to the participants (9.3%). Working under good managers and leaders was also significant in contributing to their job satisfaction (7%). They were described as being nice, understanding, supportive, caring, empowering, open-minded to new ideas, professional, gave autonomy, and trusted them. Challenging work, having a sense of achievement, feeling valued and appreciated (5.8%) were factors also cited as contributing to job satisfaction and the office’s location (3.5%) was also important as they preferred working nearer to home. Table 1. Factors Contributing to Job Satisfaction and Dissatisfaction
Job Satisfaction Job Dissatisfaction
Factor n Percentage Factor n Percentage
1. Job 34 39.5 1. Organizational problems 17 25
2. Colleagues 12 14 2. Work-related problems 16 23.5
3. Remuneration 9 10.5 3. Management issues 13 19.1
4. Work environment/culture 9 10.5 4. Remuneration 6 8.8 5. Training and career growth opportunities
8 9.3 5. Coworker problems 6 8.8
6. Leaders and managers 6 7.0 6. Organizational culture 6 8.8
7. Challenging work, sense of achievement, feeling valued and appreciated
5 5.8 7. Communication issues 4 5.9
8. Location 3 3.5
Job Dissatisfaction (Least Satisfying Things at Work)
The participants had the opportunity to state the three things they were least satisfied at work (dissatisfaction). A total of 68 comments were received and they were divided into seven main
52
categories (Table 1). The most cited item on the list was the problems encountered in the organization (25%). These organizational problems included the lack of transparency, disorganized systems that lacked procedures, standards, organized schedules, and policies. Other comments were complaints that organizations were too structured, filled with work process constraints, interdepartmental conflicts, and the lack of a better and more sophisticated AI system. A participant expressed her frustrations over the “conflicts amongst departments and was constrained by working processes,” while another complained about how “disorganized” the workflow was. Three participants were unhappy with the politics, while two expressed the lack of a career path. These outcomes were contributed to by the high staff turnover leading to higher workloads on the existing staff and terminations that had resulted from restructuring.
The second highest reason for dissatisfaction on the list related to problems dealing with their work (23.5%). There were bad schedules, no work-life balance, not much autonomy, unnecessary additional workloads, too much unnecessary paperwork, routine work, no person-job fit, and frustrations as a result of limited power in making decisions. The pressure of staying within the established framework set by older staff, the nature of the business, performing tasks beyond the agreed upon job description, and high work pressure due to a very competitive business were other reasons behind their work-related problems.
Management issues (19.1%) constituted a major problem. Millennials complained that management was not transparent, micromanaged, treated employees badly, had double-standards, were autocratic, biased, made all the decisions, disregarded their suggestions, and did not respond to their requests. One male respondent mentioned that he was working under a “micromanager boss who promotes cliques and discord amongst departments,” while another commented that the supervisor was “unsupportive of my ideas, is old fashioned, and sticks to the traditional way of doing things.” They were unsupportive, did not keep their word, employed bad management styles, and one participant (Chinese) complained that his employer did not adhere to the Thai law of paying Chinese employees at least 35,000 baht a month. In terms of remuneration (8.8%), they were unhappy because of low salaries, few vacation days, low bonuses, poor benefits, and no overtime compensation for everyone who was working beyond their scope of work.
Coworker problems (8.8%) were cited as another reason they were dissatisfied at work. The coworkers were said to be uncooperative, lazy, with the younger ones not following orders, while the older ones did not want to change and adapt or were just irresponsible. Organizational culture (8.8%) was an issue when there were cultural conflicts between the local and foreign cultures, and when organizations refused to move away from their traditional cultures to current trends. A female participant stated that she worked in a male-dominated organization that was unfavorably biased towards women, making her feel extremely uncomfortable. Some participants mentioned an unfavorable work culture, such as the lack of cultural diversity, an extremely competitive work environment, a Thai corporate culture that was unenthusiastic about growth, and cultural misfits. Communication issues were mentioned by a minority (5.9%). These involved language problems when foreigners and locals work alongside each other. Such issues involved unclear communication between leaders and followers, poor interdepartmental communication causing misunderstandings and delays in conflict resolution, and the inappropriate use of swear and harsh words.
Millennials’ Recommendations to Retain Them
There were numerous Millennial recommendations for organizations (Table 2). Interestingly, the highest cited recommendation addressed management. Millennials recommended managers make greater efforts aimed at being more approachable, supportive, open to Millennial opinions, not prone to showing favoritism, open to establishing better communication lines, be given to showing kindness, and engaging Millennials. They also wanted their managers to work alongside with them and be protective of them instead of scolding them in front of customers. As the world is changing, Millennials would like to encourage managers to be open-minded and move forward with the trends and be more open to the Millennial style of working that includes providing more flexibility or flextime and a work-
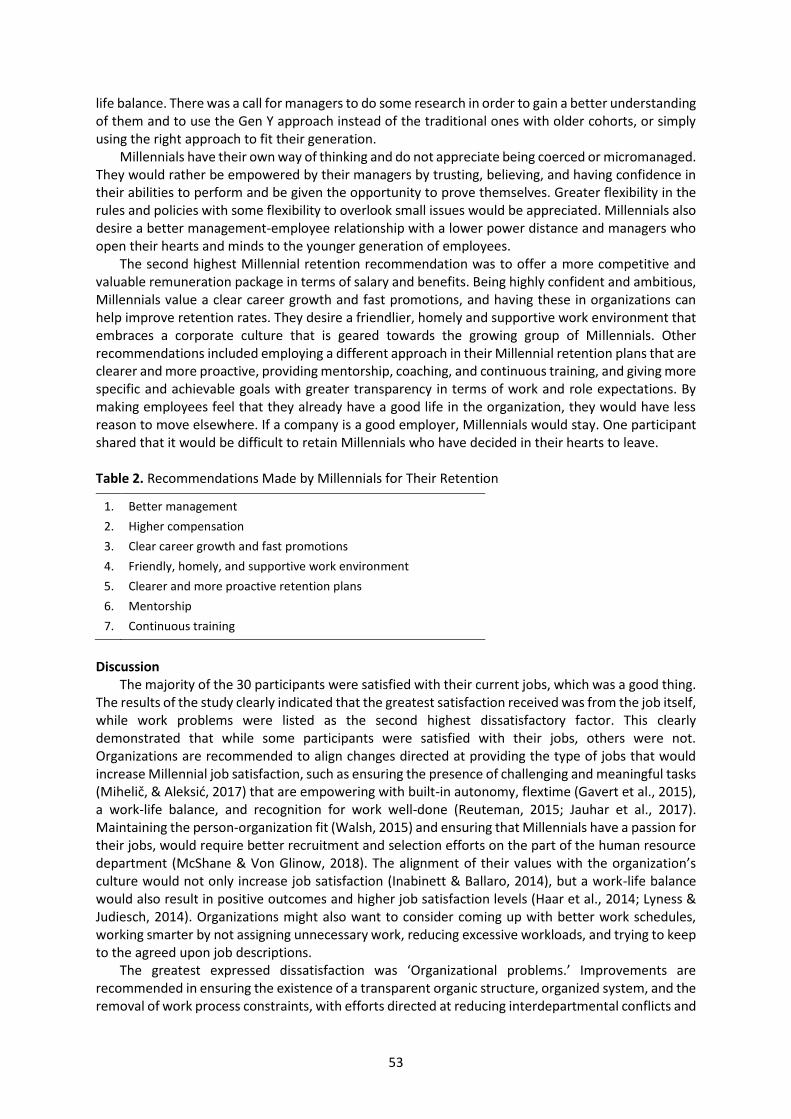
53
life balance. There was a call for managers to do some research in order to gain a better understanding of them and to use the Gen Y approach instead of the traditional ones with older cohorts, or simply using the right approach to fit their generation.
Millennials have their own way of thinking and do not appreciate being coerced or micromanaged. They would rather be empowered by their managers by trusting, believing, and having confidence in their abilities to perform and be given the opportunity to prove themselves. Greater flexibility in the rules and policies with some flexibility to overlook small issues would be appreciated. Millennials also desire a better management-employee relationship with a lower power distance and managers who open their hearts and minds to the younger generation of employees.
The second highest Millennial retention recommendation was to offer a more competitive and valuable remuneration package in terms of salary and benefits. Being highly confident and ambitious, Millennials value a clear career growth and fast promotions, and having these in organizations can help improve retention rates. They desire a friendlier, homely and supportive work environment that embraces a corporate culture that is geared towards the growing group of Millennials. Other recommendations included employing a different approach in their Millennial retention plans that are clearer and more proactive, providing mentorship, coaching, and continuous training, and giving more specific and achievable goals with greater transparency in terms of work and role expectations. By making employees feel that they already have a good life in the organization, they would have less reason to move elsewhere. If a company is a good employer, Millennials would stay. One participant shared that it would be difficult to retain Millennials who have decided in their hearts to leave.
Table 2. Recommendations Made by Millennials for Their Retention
1. Better management
2. Higher compensation
3. Clear career growth and fast promotions
4. Friendly, homely, and supportive work environment
5. Clearer and more proactive retention plans
6. Mentorship
7. Continuous training
Discussion
The majority of the 30 participants were satisfied with their current jobs, which was a good thing. The results of the study clearly indicated that the greatest satisfaction received was from the job itself, while work problems were listed as the second highest dissatisfactory factor. This clearly demonstrated that while some participants were satisfied with their jobs, others were not. Organizations are recommended to align changes directed at providing the type of jobs that would increase Millennial job satisfaction, such as ensuring the presence of challenging and meaningful tasks (Mihelic, & Aleksić, 2017) that are empowering with built-in autonomy, flextime (Gavert et al., 2015), a work-life balance, and recognition for work well-done (Reuteman, 2015; Jauhar et al., 2017). Maintaining the person-organization fit (Walsh, 2015) and ensuring that Millennials have a passion for their jobs, would require better recruitment and selection efforts on the part of the human resource department (McShane & Von Glinow, 2018). The alignment of their values with the organization’s culture would not only increase job satisfaction (Inabinett & Ballaro, 2014), but a work-life balance would also result in positive outcomes and higher job satisfaction levels (Haar et al., 2014; Lyness & Judiesch, 2014). Organizations might also want to consider coming up with better work schedules, working smarter by not assigning unnecessary work, reducing excessive workloads, and trying to keep to the agreed upon job descriptions.
The greatest expressed dissatisfaction was ‘Organizational problems.’ Improvements are recommended in ensuring the existence of a transparent organic structure, organized system, and the removal of work process constraints, with efforts directed at reducing interdepartmental conflicts and
54
politics. Employees have been said to leave organizations with excessive internal politics as it took away their satisfaction on the job (McShane & Von Glinow, 2018). Firms lacking in training and career growth opportunities might wish to rethink and include those on their agenda, as they are important to Millennials for job satisfaction and retention reasons. The need for mentoring and coaching as recommendations for retention were also aligned with the literature (Na-nan & Saribut, 2018). These authors identified them as methods in developing and training Millennials. Commuting long distances between home and work was an issue for some and a shorter commute definitely helps reduce levels of dissatisfaction (Guillot-Soulez & Soulez, 2014)
Working with good colleagues was also very important to Millennials and this was closely related to the work environment and culture that they valued. While the study indicated that good colleagues had contributed to job satisfaction, bad coworkers, on the other hand, had created coworker problems. It was also true that favorable work environment and culture made their jobs more satisfying, while, on the contrary, some cited being exposed to an unfavorable organizational culture as contributing to their dissatisfaction. An organization is made up of employees, and its culture is founded on the values of employees (McShane & Von Glinow, 2018). Therefore, in order to ensure a pleasant work environment and culture, as well as making sure that employees have great colleagues to work with, rests on the organization and human resource department in selecting the right employees who align with the organization’s values. This can be facilitated through the use of personality assessments to determine if they would fit in well in the organization to ensure a person-organization fit (McShane & Von Glinow, 2018). Aside from having the right type of employees, the culture and work environment are also highly dependent on the organization and top management (McShane & Von Glinow, 2018). Eliminating any single dominating sex, bias, moving away from a competitive and towards a more collaborative setting, as well as being more diverse would help improve the organizational culture. A shift towards a more Millennial-friendly environment away from the traditional one would be a good move to increase both job satisfaction and retention (Aruna & Anitha, 2015).
Remuneration never failed to be a hot item on Millennials’ list, and a positive correlation was found between remuneration and job satisfaction. Many Millennials cited higher remuneration as a contributing factor to their job satisfaction, while lower remuneration was said to be one of the things they liked least about their jobs. Offering competitive and high remuneration packages was the second highest recommendation to retain Millennials, and, although it sounded like a great idea, it is in reality a difficult recommendation to apply in every organization, as not every organization can afford it, and Millennials are always demanding more. They were especially upset when they were unfairly compensated for working beyond their job descriptions but not compensated accordingly. Although money may not be the sole motivating factor for Millennials (Chappell, 2012), the results of the study clearly demonstrated that they favored and placed a significant importance on competitive salaries (Jauhar et al., 2017). Millennials are also in favor of instant gratification (Axten, 2015), as seen in their desires for quick promotions and salaries and their tendency to move quickly once a better offer comes their way (Hillmer et al., 2004).
Management, whether managers, supervisors, or top-level management, has a tremendous impact on job satisfaction and retention levels. This was mentioned on both occasions as a factor that contributed to job satisfaction and something they were least satisfied with. Millennials also expressed high concerns for better management practices if they were to be retained. It has been said that Millenials leave managers, and not organizations (Reuteman, 2015) and that “employees do not quit their jobs, they quit their bosses!” (Campione, 2014, p. 19). Organizations that shift from a traditional to a newer mindset that empowers, supports, is open to new ideas and opinions, provides autonomy, moves towards creating a lower power distance, would do well, as Millennials have low tolerance levels for traditional and hierarchical management (Jalnawala, 2018) and want to be heard (Axten, 2015; DeVaney, 2015). The more fortunate Millennials were blessed with leaders who were supportive, open-minded, empowering, and nice, while others were crying out for leaders who could be more transparent, less directive and micromanaging, unbiased, fair, and refrain from practicing
55
double-standards. Numerous retention recommendations were also made for more understanding and open-minded managers, who could mentor and coach them, and move on to a managerial style that would accommodate the needs of the Y Generation, as Millennials want to collaborate closely with their superiors. This aligns with the literature. Andert (2011) stated that Millennials look for managers who are caring, inspiring, and who take the time to develop a good rapport with them. Miscommunication and inadequate communication issues need to be looked into, as good and effective communication are essential to the well-functioning of any successful organization (McShane & Von Glinow, 2018).
Conclusions and Recommendations for Further Research
The factors contributing to job satisfaction and dissatisfaction have been stated clearly, and some of them were included in the recommendations for the retention of Millennials. Simply said, what Millennials want is to work in a Millennial-oriented organization under supportive and open-minded management that can provide coaching and mentorship in a challenging, empowering, and meaningful job that provides a work life balance, while working alongside great colleagues and receiving competitive remuneration. As there is still a high percentage of firms using traditional and outdated methods (Falletta, 2016), it is recommended that organizations revisit their operations, management styles, remuneration packages, HR practices, with organizational changes shifting towards creating a more Millennial-friendlier workplace (Aruna & Anitha, 2015), with the aim of increasing job satisfaction and retention. According to Lee et al. (2016), there are positive correlations amongst job satisfaction, happy employees, and high performing organizations. Adhering to the factors that contribute to job satisfaction does not always guarantee that Millennials would not move to a new job, as they still could be attracted to better job offers (Ware, 2014) and they could move to different jobs despite being happy at work (Fisher, 2015).
Recommendations for further research includes interviewing the same participants in five years from now to find out if there has been a change in their answers, and if organizations had progressed in improving Millennial job satisfaction and turnover. A comparative study is also recommended to compare the answers from Gen Yers and Gen Zers to further study the similarities and differences. The results would provide invaluable information to organizations to better align to the new generations in the workplace. References Andert, D. (2011). Alternating leadership as a proactive organizational intervention: Addressing the needs of
the baby boomers, generation xers, and millennials. Journal of Leadership, Accountability & Ethics, 8(4), 67–83.
Angeline, T. (2011). Managing generational diversity in the workplace: Expectations and perceptions of different generations of employees. African Journal of Business Management, 5(2), 249–255.
Aruna, M., & Anitha, J. (2015). Employee retention enablers: Generation Y employees. SCMS Journal of Indian Management, 12(3), 94–103.
Axten, C. (2015). Millennials at work. Defense AT & L, 44(2), 50–54. Bertagnoli, L. (2017, January 2). Slowing down the revolving door. Crain’s Chicago Business, 40(1), 0003. Boomers and Millennials define the new workplace. (2009, October 15). Trends Magazine, Issue 078, 17–22. Bos, J., Donders, N., Bouwman-Brouwer, K., & Van der Gulden, J. (2009). Work characteristics and
determinants of job satisfaction in four age groups: University employees’ point of view. International Archives of Occupational and Environmental Health, 82(10), 1249–1259. doi.org/10.1007/s00420-009-0451-4
Brown, S. (2017, September 17). How Generations X, Y, and Z may change the academic workplace. Chronicle of Higher Education, 64(4), 19.
Burmeister, M. (2009). “It’s all about ME” becomes a cross-generational conversation. Training and Development, 63(5), 92–93.
Bye, D. (2018, March). Beyond stereotypes: How to manage and motivate millennials. HR Specialist, 16(3), 7. https://www.thehrspecialist.com
56
Campione, W. (2014). The influence of supervisor race, gender, age, and cohort on Millennials’ job satisfaction. Journal of Business Diversity, 14(1), 18–34.
Caraher, L. (2014, October). Harnessing the power of Millennials. Leadership Excellence, 31(10), 39. Chappell, L. (2012). Attention to retention. Automotive News, 87(6539), 3. Creswell, J., & Guetterman, T. (2018). Educational research: Planning, conducting, and evaluating
quantitative and qualitative research (6th ed.). Pearson Education. Crumpacker, M., & Crumpacker, J. (2007). Succession planning and generational stereotypes: Should HR
consider age-based values and attitudes a relevant factor or a passing fad? Public Personnel Management, 36(4), 349–369. doi.org/10.1177/009102600703600405
Deal, J., Altman, D., & Rogelberg, S. (2010). Millennials at work: What we know and what we need to do (if anything). Journal of Business & Psychology, 25(2), 191–199. doi.org/10.1007/s10869- 010-9177-2
Deloitte. (2016). The 2016 Deloitte millennial survey. https://www2.deloitte.com/content/dam/Deloitte/ global/Documents/About-Deloitte/gx-millenial-survey-2016-exec-summary.pdf
DeVaney, S. (2015). Understanding the millennial generation. Journal of Financial Service Professionals, 69(6), 11–14.
Dial back high turnover rates. (2010, August). Communication Briefings, 29(10), 5. www.briefingsmediagroup.com
Diskienė, D., Stankevicienė, A., & Jurgaitytė, N. (2017, December 7–8). Challenges for human resource department: The case of Millennials in the workplace [Paper presentation]. In E. Tsui & B. Cheung (Eds.), Proceedings of the 14th International Conference on Intellectual Capital, Knowledge Management & Organizational Learning, Hong Kong, 67–77. https://search.proquest.com/openview/ a659344dbd435597712af2626d76b23a/1.pdf?pq-origsite=gscholar&cbl=1796418
Dolezalek, H. (2007). X-Y Vision. Training, 44(6), 22–27. Ellis, R. (2013, July). Meeting millennials’ expectations. Training and Development, 67(7), 18. Espinoza, C., & Ukleja, M. (2016). Managing the millennials: Discover the core competencies for managing
today’s workforce (2nd ed.). John Wiley& Sons, Inc. Falletta, S. (2016). Embrace the future. Smart Business Akron/Canton, 26(3), 12. Fehn, D. (2009). Upstarts! How Gen Y entrepreneurs are rocking the world of business and 8 ways you can
profit from their success. McGraw-Hill. Fisher, A. (2015). Employees are happier at work, but plan to quit anyway. https://fortune.com/2015/05/12/
happy-employees-quit-anyway/ Flaherty, K., & Pappas, J. (2000). The role of trust in salesperson-sales manager relationships. The Journal of
Personal Selling & Sales Management, 20(4), 271–278. doi:10.1080/08853134.2000.10754247 Frankel, L. (2016). Employee retention: Seven common-sense ways to keep your star millennials. Employment
Relations Today (Wiley), 42(4), 49–56. Guillot-Soulez, C., & Soulez, S. (2014). On the heterogeneity of generation Y job preferences. Employee Relations,
36(4), 319–332. Haar, J., Russo, M., Suñe, A., & Ollier-Malaterre, A. (2014). Outcomes of work–life balance on job satisfaction,
life satisfaction and mental health: A study across seven cultures. Journal of Vocational Behavior, 85(3), 361–373. doi.org/10.1016/j.jvb.2014.08.010
Hancock, J., Allen, D., Bosco, F., McDaniel, K., & Pierce, C. (2013). Meta-analytic review of employee turnover as a predictor of firm performance. Journal of Management, 39(3), 573–603. https://doi.org/10.1177/ 0149206311424943
Hansen, R. (2015). Perception vs. reality: 10 truths about generation Y workforce. https://www.livecareer. com/resources/careers/planning/gen-y-workforce
Hauw, S., & Vos, A. (2010). Millennials’ career perspective and psychological contract expectations: Does the recession lead to lowered expectations? Journal of Business & Psychology, 25(2), 293–302.
Hillmer, S., Hillmer, B., & McRoberts, G. (2004). The real costs of turnover: Lessons from a call center. Human Resource Planning, 27(3), 34–41.
Inabinett, J., & Ballaro, J. (2014). Developing an organization by predicting employee retention by matching corporate culture with employee’s values: A correlation study. Organization Development Journal, 32(1), 55–74.
Jalnawala, C. (2018). Unlocking the potential. Human Capital, 21(11), 40–41.
Jauhar, J., Chan S., & Rahim, N. (2017). The impact of reward and transformational leadership on the intention to quit of Generation Y employees in oil and gas industry: Moderating role of job satisfaction. Global Business & Management Research, 9(4), 426–441.
57
Kaifi, B., Nafei, W., Khanfar, N., & Kaifi, M. (2012). A multi-generational workforce: Managing and understanding millennials. International Journal of Business & Management, 7(24), 88–93.
Kultalahti, S., & Viitala, R. (2014). Sufficient challenges and a weekend ahead–Generation Y describing motivation at work. Journal of Organizational Change Management, 27(4), 569–582. doi.org/10.1108/JOCM-05-2014-0101
Lamm, E., & Meeks, M. (2009). Workplace fun: The moderating effects of generational differences. Employee Relations, 31(6), 613–631.
Lancaster, L., & Stillman, D. (2010). The M-factor: How the millennial generation is rocking the workplace. Harper Collins.
Lee, C., Mullins, K., & Young, C. (2016). Factors affecting job satisfaction and retention of millennials. Allied Academies International Conference: Proceedings of the Academy of Organizational Culture, Communications & Conflict (AOCCC), 21(2), 6–9.
Lyness, K., & Judiesch, M. (2014). Gender egalitarianism and work-life balance for managers: Multisource perspectives in 36 countries. Applied Psychology: An International Review, 63(1), 96–129. doi.org/10.1111/apps.12011
McShane, S., & Von Glinow, M. (2018). Organizational behavior (8th ed.). McGraw-Hill Education. Mellott, A. (2018). S.E.E.: A solution to turnover. Exchange (19460406), (243), 24–26. https://www.
childcareexchange.com/article/s.e.e.-a-solution-to-turnover/5024324/ Mermin, G., Johnson, R., & Murphy, D. (2007). Why do boomers plan to work longer? Journal of Gerontology:
Social Sciences, 62B(5), S286–S294. Merriam S., & Tisdell, E. (2016). Qualitative research: A guide to design and implementation (4th ed.). Jossey-
Bass. Mihelic, K., & Aleksić, D. (2017). “Dear employer, let me introduce myself”–Flow, satisfaction with work–life
balance and millennials’ creativity. Creativity Research Journal, 29(4), 397–408. https://doi.org/10.1080/ 10400419.2017.1376503
Na-nan, K., & Saribut, S. (2019). Development and validation of an organizational commitment instrument for generation Y employees in small and medium-sized enterprises in Thailand. Industrial & Commercial Training, 51(4), 244–255. https://doi.org/10.1108/ICT-11-2018-0091
Natarajan, S., & Palanissamy, A. (2015). Employee motivation & encouraging retention in the workplace: A critical study. International Journal of Management Sciences, 5(10), 709–715.
Olson, A. (2018). What millennials expect in the workforce: Organizations need to adapt and understand what millennials want in a work environment. https://www.csemag.com/articles/what-millennials-expect-in-the-workforce/
Plew, S. (2013). Retaining young talent in your organization. Business People, 26(9), 82 Pratitas, P. (2011). Kwaam-pòok-pan-taang-jai kŏng pá-nák ngaan ong gaan àyk-gà-chonglùm jay ner ray-chân
waai gàp ong gaan têe kăo tam ngaan [The commitment of private enterprise Gen Y employees with their organization]. The Journal of Faculty of Applied Arts, King Mongkut’s University of Technology North Bangkok, 4(2), 38–47.
Reuteman, R. (2015, March). Generation gaps. Entrepreneur, 43(3), 42–48. Rousseau, D. (2004). Psychological contracts in the workplace: Understanding the ties that motivate. Academy
of Management Executive, 18(1), 120–127. doi.org/10.5465/AME.2004.12689213 Sandhya, K., & Kumar, D. (2011). Employee retention by motivation. Indian Journal of Science & Technology,
4(12), 1778–1782. Saratovsky, K., & Feldmann, D. (2013). Cause for change: The why and how of nonprofit millennial
engagement. Jossey-Bass. Seppanen, S., & Gualtieri, W. (2012). The millennial generation: Research review. USA: National Chamber
Foundation. https://www.uschamberfoundation.org/sites/default/files/article/foundation/ MillennialGeneration.pdf
Siegfried, R., Jr. (2008). Mapping a career path for attracting & retaining talent. Financial Executive, 24(9), 52–55.
Spano, K. (2015, July). Millennials and the workplace. NH Business Review. https://www.nhbr.com/millennials-and-the-workplace/
Tadesse, W. (2018). Factors affecting employee retention in Ethiopian Public Organizations. Journal of Strategic Human Resource Management, 7(3), 22–32.
Tims, M., Bakker, A., & Derks, D. (2012). Development and validation of the job crafting scale. Journal of Vocational Behavior, 80(1), 173–186. https://doi.org/10.1016/j.jvb.2011.05.009
Walsh, D. (2015, July). Millennials in the workplace. Crain’s Detroit Business, 31(13), 0011.
58
Ware, B. (2014, May). Stop the gen Y revolving door. T+D, 68(5), 58–63. Wen, C., Muthuveloo, R., & Ping, T. (2018). Factors influencing job satisfaction: A perspective of Millennials in
Malaysia Multinational (MNC) Companies. Global Business & Management Research, 10(1), 48–66. Wetherell, S., Gavert, E., Ellis, S., & O’Donovan, R. (2015). The “disruptive” generation: Millennials in the
workplace. Market Leader, (Q4), 40–42. Williams, K., & Page, R. (2011). Marketing to the generations. Journal of Behavioral Studies in Business, 3, 1–17. Young, S., Sturts, J., Ross, C., & Kim, K. (2013). Generational differences and job satisfaction in leisure services.
Managing Leisure, 18(2), 152–170. doi.org/10.1080/13606719.2013.752213 Zabriskie, K. (2016, June). Getting the most from millennials. State Legislatures, 42(6), 26–27. Zemke, R., Raines, C., & Filipczak, B. (2000). Generations at work: Managing the clash of veterans, Boomers,
Xers, and Nexters in your workplace. AMACOM. Zikmund, W., Babin, B., Carr, J., & Griffin, M. (2010). Business research methods (8th ed.). Cengage Learning.
Human Behavior, Development and Society ISSN 2651-1762, Vol 21 No 3, September 2020
59
The Role of Teacher Support, Classmate Support, and Self-efficacy in Reducing Speaking Anxiety among University Students Using English as a Foreign Language
Jenette Villegas-Puyod, Sumit Sharma, Simon Ajah, Marut Chaisanrit and Bancha Skuldee
Assumption University, Thailand
Date Received: 3 March 2020 Revised: 4 May 2020 Accepted: 6 May 2020
Abstract
The role of teacher support and student support in reducing speaking anxiety was explored in this research. The contribution of self-efficacy on the impact of teacher and classmate support in reducing speaking anxiety also was investigated among students at an international university in Thailand. The survey data were gathered from 345 students from the first to the fourth year. Partial least squares structural equation modeling was employed for data analysis. The results showed a positive association between teacher support and self-efficacy. Furthermore, classmate support had a positive linkage with self-efficacy. The results revealed that the higher self-efficacy of the student the lower the degree of speaking anxiety they experienced during oral presentations.
Keywords: Teacher support, classmate support, self-efficacy, speaking anxiety
Introduction
In this age of globalization, collaboration among the nations of the world becomes desirable. This international collaboration is supported primarily by the English language (Anyadubalu, 2010). While important, there are many places where English as a foreign language (EFL), such as in Thailand, has limited access to real English environments. This leads to a lack of opportunities for verbal exchange and oral presentation—which are important for the development of students’ speaking skills. Having access to such opportunities not only improves students’ speaking proficiency, but it also can enhance students’ self-efficacy to lower their speaking anxiety. This leads to a positive impact on students’ academic achievement (Asakereh & Dehghannezhad, 2015; Jackson et al., 2017; Mede & Karaırmak, 2017). While positive correlations have been shown by various studies, there still remains minimal literature on the relationship between affective variables, such as teacher support, classmate support, and self-efficacy towards the reduction of speaking anxiety, particularly during an oral presentation in the classroom. This research sought to bring these variables together and determine the extent to which such variables contributed to reducing speaking anxiety in an EFL classroom oral presentation setting. The guiding questions for this research were:
1. Does teacher and classmate support boost the self-efficacy of a student during the oral presentation in the classroom? and
2. Is the student’s self-efficacy the predictor in reducing speaking anxiety during an oral presentation in the classroom?
Literature Review Teacher and Classmate Support
Teacher support can be shown by appraisals in which students receive evaluation and feedback to enhance performances during conversations. Feedback and comments of the teacher may influence students’ self-efficacy (Pajares & Schunk, 2001). Feedback should be given with empathy by including recommendations dealing with strategies for improvement, instead of providing only corrective feedback. Besides having empathy, the teacher could also organize classroom tasks that can be implemented to decrease anxiety, such as doing projects, establishing a learning community, and creating a supportive classroom atmosphere. Providing indirect correction, accepting the need for self-growth protection, employing teacher immediacy, and praising are also effective strategies to reduce students’ speaking anxiety in the EFL classroom (Tsiplakides & Keramida, 2009). Teacher
60
support can also include providing comfort and helping students cultivate a sense of personal efficacy, which can alleviate academic anxiety (Bandura, 2001). Teacher support is best considered a constituent of the classroom context that interacts with other aspects that bear influence on student engagement. Other contextual features are classroom goal structure (Hughes & Kwok, 2007), academic initiative (Danielsen et al., 2011), and teacher characteristics (Sakiz et al., 2012). Furthermore, teacher support is crucial for students to be self-motivated in doing their school work (Pitzer & Skinner, 2017). Teachers’ support also upholds positive developmental results, such as having a positive relation toward academic performance (Ho et al., 2017), and encourages students to use help-seeking and help-giving styles in learning that enhances their engagement (Ansong et al., 2017). Classmate Support
Research posited that speaking in front of their peers provokes anxiety in foreign language learners, as they are frightened of making errors and being laughed at (Öztürk & Gürbüz, 2014). However, with appropriate support, the extent of anxiety may be mitigated. When classmate support is evident, it leads individuals to believe that they are cared for and loved, esteemed and valued, or belong to a network of communication and mutual obligation (Torsheim et al., 2000). For classmate support, it may refer to emotional support and caring behaviors student show during a presentation (Malecki & Demaray, 2006). Classmates offer informal support, and they interact directly with their peers in many informal settings, particularly when they interact in the school situation (Ansong et al., 2017). Furthermore, research claimed that perceived classmate support has a positive association with academic adjustment (Wang et al., 2011). In the same vein, there is evidence that classmate support is positively linked to academic adjustment. For example, it was found that perceived school environment, which encompasses support for autonomy and competence, is predictive of later academic achievement (Wang et al., 2011). Additionally, the main function of perceived classmate support is the provision of social acceptance and a sense of belonging (Torsheim et al., 2000). Self-efficacy
Self-efficacy is defined as the person’s belief in their ability to act, and their behavior in the learning process. Linnenbrink and Pintrich (2002) describe the key components of a student’s engagement (behavioral, cognitive, and motivation) as being related to self-efficacy. In past decades, self-efficacy has been studied extensively in educational research, specifically in the area of academic performance, motivation, and self-regulation (Bandura et al., 1985; Bradley et al., 2017; Dogan, 2015; Linnenbrink & Pintrich, 2002; Skaalvik et al., 2015). In EFL contexts, studies on self-efficacy were centered on variables such as language learning strategies, language anxiety, motivation, and language achievement. It has been shown that there is a strong correlation between self-efficacy and foreign language anxiety (Mede & Karaırmak, 2017). Research posited that self-efficacy can help students control their anxiety in the class (Linnenbrink & Pintrich, 2002). For example, an individual with a high level of self-efficacy tends to have lower anxiety in an EFL setting (Cryder et al., 2006). EFL learners’ self-efficacy beliefs are also correlated with their listening achievement (Chen, 2007) and writing performance (Fatemi & Vahidnia, 2013). With regards to oral presentation, research by Charoensukmongkol (2019) reported that students with low anxiety also obtained higher scores on their presentations than did those who reported high levels of anxiety. Speaking Anxiety
Speaking in public is one of the biggest fears among people from different walks of life (Pryor et al., 2005). Even professional speakers sometimes cannot avoid feeling anxious when speaking in front of a group of people. A survey from Chapman University conducted in 2014, ranks ‘fear of public speaking’ as one of the top fears among American adults. Brogan et al. (2008) posited that speech anxiety is a combination of internal and external factors including the environment that arouses anxiety in a speaker, inhibiting their ability to effectively communicate verbally. Neither the word anxiety nor the word fear had positive connotations for them, but in small doses, they are necessary
61
to boost energy levels and the critical thinking abilities of the speaker (Kankam & Boateng, 2017). For students, speaking anxiety may stem from other learning difficulties. It is often difficult to recognize compared with other learning difficulties, as everyone tends to feel anxious sometimes.
A growing body of research has recognized the factors that can reduce anxiety in speaking English in the classroom (Akkakoson, 2016; Charoensukmongkol, 2019; Kasbi & Shirvan, 2017; Mede & Karaırmak, 2017; Shorna & Suchona, 2019; Woodrow, 2006). Considering these observations, foreign language anxiety has been studied extensively by researchers in the field of education. One study revealed that EFL anxiety has a negative effect on the willingness of students to communicate in classrooms (Liu & Jackson, 2008).
Hypotheses Development Teacher and Classmate Support and EFL Speaking Anxiety
In the current research it was proposed that teacher support and classmate support was positively associated with self-efficacy among students in an international university in Thailand. A growing body of research on perceived teacher support tends to correlate with student self-efficacy, which is in turn linked with their academic achievements, career decision-making, and student wellness (Brewster & Bowen, 2004; Fredriksen & Rhodes, 2004; Suldo et al., 2009).
In the current study it was predicted that students with a higher level of self-efficacy would tend to show lower speaking anxiety. A body of research has predicted that self-efficacy is a significant factor that can alleviate speaking anxiety in an EFL classroom environment (Akkakoson, 2016; Charoensukmongkol, 2019; Kasbi & Shirvan, 2017; Mede & Karaırmak, 2017; Shorna & Suchona, 2019; Woodrow, 2006). Considering these observations, therefore, the following hypotheses were proposed:
H1: Teacher Support has a positive association with self-efficacy among students.
H2: Classmate Support has a positive influence on self-efficacy among students.
H3: Students with a higher level of self-efficacy will demonstrate lower speaking anxiety. Methods Participants and Context
The participants were made up of 16 nationalities, with a majority of them Thais, who were in the first to fourth year of their undergraduate studies at a private international university in Thailand. The participants were selected on a convenience sampling basis during the 2019 academic year. Their language proficiency level was at an intermediate level, according to the IELTS Test.
The student sample was chosen from two management subjects, namely, Introduction to Business and Business Communication. All who presented in the class were asked to answer the survey questions. The team chose these particular subjects because they demanded a lot of classroom participation and interaction. Students were required to do an oral presentation before the end of the term. In their presentation, they were expected to present professionally in an extemporaneous manner. They were expected to rehearse by themselves before making their own presentation. The score for this oral presentation represented 10% of the final grade. Therefore, reading from notes was highly discouraged, and students were supposed to maintain good eye contact with their classmates and lecturer. The students were expected to participate and interact with the lecturers and make sure they could answer the questions posed by their lecturer and classmates after the presentation. The actual scores given by the lecturer were measured based on the five criteria: language clarity of presentation, ability to handle instructor’s questions, understanding of content, physical delivery including eye contact, and vocal qualities. The measure was a revised version adopted from Ammons and Mills (2005).
62
Data Collection Method An online questionnaire survey was employed for data collection because it allowed students to
deal with the survey at their most convenient time. A survey also guarantees anonymity. The online survey was shared via a link and a QR code with 500 students. They were informed about the objectives of the research, along with that assurance of confidentiality and anonymity of the data collected. The data collection duration took about a month. At the end of the data collection, a total of 345 usable responses were gathered, which represented a 69% response rate.
To support the survey findings, the researchers conducted informal interviews with 10 teachers handling these two subjects, which were done via Microsoft Teams Platform to observe the social distancing protocol due to the Covid-19 pandemic. The responses of the teachers were collected and summarized based on the researchers’ impression. The result of the interview was used to integrate the quantitative data to support the research findings. We believed that our interviews may provide insights regarding the effects of teachers' and classmates' support in enhancing self-efficacy during the oral presentation. Measurement
The survey contained three categories of measurements. First, Teacher and Classmate support was measured using the scale developed by Torsheim et al. (2000). The scale contains eight questions: four for Teacher support and four for Classmate support. For teacher support, the items were: “Our teachers treat us fairly,” “When I need extra help, I can get it,” “My teachers are interested in me as a person,” and “Our teachers are nice and friendly”. For classmate support, the items were: “The student in my class enjoy being together,” “Most of the students in my class are kind and helpful,” “Other students accept me as I am,” and “When a classmate is upset, other students comfort him or her.” All questions in the original scale were scored on a 5-point Likert scale from 1 (Strongly disagree) to 5 (Strongly agree).
Second, there were items on Self-efficacy, adopted from Chen et al., (2001). This scale consists of eight questions. Example items were: “I will be able to achieve most of the goals that I set for myself,” “When facing difficult tasks, I am certain that I will accomplish them,” “In general, I think that I can obtain outcomes that are important to me,” and “I believe I can succeed at most any endeavor to which I set my mind.” All the items were measured using a 5-point Likert scale that ranged from 1 (Strongly disagree) to 5 (Strongly agree).
EFL Speaking Anxiety was measured using the modified version of the Public Speaking Class Anxiety Scale (PSCAS), developed and validated by Yaikhong and Usaha (2012). The scale was chosen because it evaluates speaking anxiety in an EFL public speaking class, such as that observed in this study’s context. Example items were “I never feel quite sure of myself while I am speaking English,” “I start to panic when I have to speak English without preparation in advance,” “In a speaking class, I can get so nervous I forget things I know,” “I feel confident while I am speaking English,” “I get nervous and confused when I am speaking English.” The scale contained seventeen questions that were measured on a 5-point Likert scale that ranges from 1 (Strongly disagree) to 5 (Strongly agree).
Aside from the main variables in the hypotheses that were predicted to explain EFL oral presentation in reducing speaking anxiety, some personal characteristics that may be related were also included as control variables in the analysis of the data. These included age, gender, GPA, faculty, language, and education level.
Statistical Analysis The authors used Partial Least Squares (PLS) regression to analyze the collected data. PLS is a
combination of principal component analysis, path coefficient analysis and regressions to generate the estimated standardized regression coefficients for the model paths and factor loadings for the items measured. This analysis was selected for two reasons: first, PLS is flexible as it does not require the data to be normally distributed compared to others; next, in this research, the variables were not distributed normally, therefore it fits. PSL estimation was performed using the latest version of WrapPLS (version 6.0).
63
Results and Discussion The demographic and academic characteristics of the respondents are presented in Table 1.
Table 1. Descriptive Statistics of the Sample
Gender Nationality Percentage Male: 206 59.7% Thai: 240 69.6 Female: 139 40.3% Chinese: 63* 18.2
Age (yr) Korean: 12 3.5
Minimum 18 Burmese: 11 3.2 Maximum 26 Cambodian: 1 0.3 Mean & S.D. 1.32 ± 0.50 Indian: 2 0.6
Education Level Nepalese: 1 0.3 First year college: 55 15.9% Taiwanese: 6 1.7 Second year college: 134 38.8% Vietnamese: 2 0.6 Third year college: 59 17.1% Filipino: 1 0.3 Fourth year college: 97 28.1% Japanese: 2 0.6
Cumulative GPA Pakistani: 1 0.3 Minimum 1.75 Laos: 2 0.6 Maximum 4.00 American: 1 0.3 Mean & S.D. 2.26 ± 1.03 Dutch: 1 0.3
*Includes a Cantonese speaker
Measurement Model
Both convergent and discriminant validity and reliability of the constructs, which were multi-items, were estimated. Convergent validity was evaluated by checking the factor loadings. The criteria adopted indicated that the values must be higher than .50 to support sufficient convergent validity measures (Hair et al., 2017). Four items of speaking anxiety construct were deleted as they were below the factor loading requirement. Discriminant validity was evaluated by the (AVE) average variance extracted to the squared correlation coefficient. Fornell and Larker (1981) mentioned that the square root of the AVE must be greater than the correlation between the constructs to enable confirmation of discriminant validity. Table 2 shows that all AVEs met the requirements, Next Cronbach’s alpha and composite reliability coefficients were checked. Coefficients' requirements must be higher than .70 (Nunnally, 1978). Table 2. Correlations among Variables and Convergent Validity
Var.
Cronbach’s Alpha
Composite
Reliability TS CS SE ANX
AGE
GEN GPA FAC LAN EDU
TS .82 .88 (.81) .60** .31** .17* -.03 -.05 -.02 -.14 .07 -.02
CS .86 .90 (.84) .25** .25**
.004
-.11 -.14 –.19**
.09 .04
SE .92 .94 (.81) .21** .08 -.05 -.01 -.07 -.01 .10 ANX .95 .96 (.79) .32 -.04 -.25** -.09 .25** .06 AGE – – (1) -.10 -.20** -.11 -.09 .60** GEN – – (1) .21** -.001 .11 .04
GPA – – (1)
–.03**
-.15 -.13
FAC – – (1) .07 .24** LAN – – (1) -.06 EDU – – (1)
Notes. * p ≤ .05; **p ≤ .01. Average variances extracted from latent variables are shown in the parentheses. Var. = Variables, TS = Teacher support, CS = Classmate support, SE = Self-efficacy, ANX = Speaking anxiety, AGE = age, GEN = Gender, GPA = Grade point average, FAC = Faculty, LAN = Language, and EDU = Educational level.
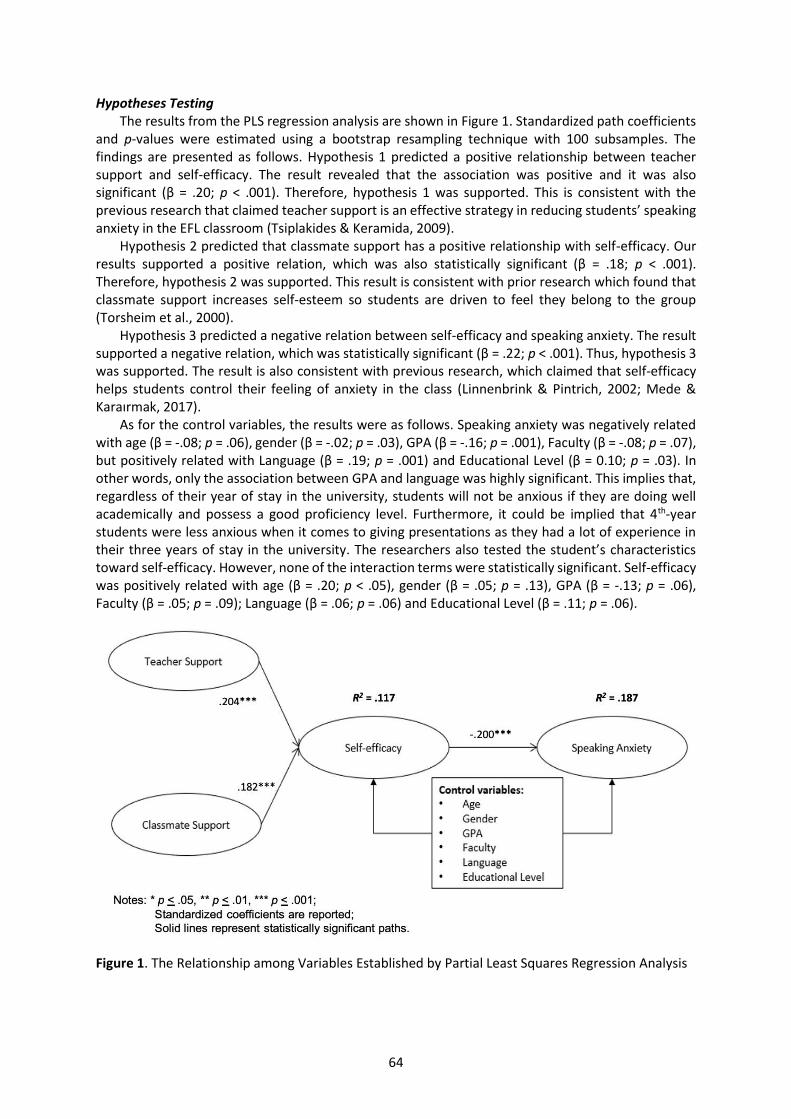
64
Hypotheses Testing The results from the PLS regression analysis are shown in Figure 1. Standardized path coefficients
and p-values were estimated using a bootstrap resampling technique with 100 subsamples. The findings are presented as follows. Hypothesis 1 predicted a positive relationship between teacher support and self-efficacy. The result revealed that the association was positive and it was also significant (β = .20; p < .001). Therefore, hypothesis 1 was supported. This is consistent with the previous research that claimed teacher support is an effective strategy in reducing students’ speaking anxiety in the EFL classroom (Tsiplakides & Keramida, 2009).
Hypothesis 2 predicted that classmate support has a positive relationship with self-efficacy. Our results supported a positive relation, which was also statistically significant (β = .18; p < .001). Therefore, hypothesis 2 was supported. This result is consistent with prior research which found that classmate support increases self-esteem so students are driven to feel they belong to the group (Torsheim et al., 2000).
Hypothesis 3 predicted a negative relation between self-efficacy and speaking anxiety. The result supported a negative relation, which was statistically significant (β = .22; p < .001). Thus, hypothesis 3 was supported. The result is also consistent with previous research, which claimed that self-efficacy helps students control their feeling of anxiety in the class (Linnenbrink & Pintrich, 2002; Mede & Karaırmak, 2017).
As for the control variables, the results were as follows. Speaking anxiety was negatively related with age (β = -.08; p = .06), gender (β = -.02; p = .03), GPA (β = -.16; p = .001), Faculty (β = -.08; p = .07), but positively related with Language (β = .19; p = .001) and Educational Level (β = 0.10; p = .03). In other words, only the association between GPA and language was highly significant. This implies that, regardless of their year of stay in the university, students will not be anxious if they are doing well academically and possess a good proficiency level. Furthermore, it could be implied that 4th-year students were less anxious when it comes to giving presentations as they had a lot of experience in their three years of stay in the university. The researchers also tested the student’s characteristics toward self-efficacy. However, none of the interaction terms were statistically significant. Self-efficacy was positively related with age (β = .20; p < .05), gender (β = .05; p = .13), GPA (β = -.13; p = .06), Faculty (β = .05; p = .09); Language (β = .06; p = .06) and Educational Level (β = .11; p = .06).
Figure 1. The Relationship among Variables Established by Partial Least Squares Regression Analysis
65
The main objective of this research was to investigate the role of teacher support, classmate support and self-efficacy in reducing speaking anxiety. The data were positively significant with the association of these variables. These findings suggest that students who received support from teachers and classmates possessed a high level of self-efficacy, particularly during the oral presentation using the English language, thereby, delivering their scripts well. Finally, for the third research objective, regarding self-efficacy lowering speaking anxiety particularly in the classroom presentation, the result was also significant. This implies that when a student possessed higher levels of self-efficacy, they tended to be more confident and they had more control of their anxiety. These findings are also consistent with the findings of previous researchers who claimed students with a high level of self-efficacy tended to have lower anxiety (Linnenbrink & Pintrich, 2002; Crysder et al., 2006; Fatimi & Vahidnia, 2013 & Charoensukmongkol, 2009).
The present researchers gathered qualitative data by doing informal interviews with the 10 teachers who were teaching Introduction to Business and Business Communication in order to support the findings from the data collected using the survey. The majority of the responses from the informal interviews mentioned that the teacher should complement and give constructive feedback, and when students felt that their teacher and their classmates were supportive during the presentation, they felt comfortable and confident and would yield good performances. Furthermore, teachers should set high expectations and encouraged the students to achieve higher standards observed that the students eventually performed well. Along the way, teachers should offer lots of praise, show care to every student, and be transparent and ready to extend help. They should provide a conducive friendly class climate, non-hostile environment, and correct students' pronunciation after the presentation. Moreover, the teachers create social and intellectual climates, where collaboration and cooperation are encouraged. There should be opportunities for students to interact with their classmates and with their teacher as well. The teacher and classmates can also give prompt feedback about the presentation in a friendly manner for future improvements. Additionally, when students perceived that teachers and classmates are concerned and sympathetic, their self-efficacy tends to be higher. To sum up, having teacher and classmate support would allow students to develop a certain level of self-efficacy; these factors explain why students with higher levels of self-efficacy tended to experience lower speaking anxiety during oral presentation in the classroom.
Moreover, this current research offered further evidence to supplement the findings of previous studies. The teachers in this reported study encouraged the students to rehearse before the presentation at their own pace. They were welcome to ask questions privately for more clarification about the presentation. Teachers should be able to provide detailed guidelines, organize appropriate groupings, help students pick the best topic for a presentation, guide them on how to use suitable visual aids, provide prompt and detailed feedback, and evaluate students’ performance (King, 2002). In the management of a presentation task, teachers need to remember to empathize. When the focus is student-centered, it can encourage cooperation and support, which are crucial for oral presentations. Conclusions and Limitations
This study contributed additional understanding to the role of self-efficacy by showing that students with a higher level of self-confidence tended to have a more satisfactory performance during the oral presentation. Nevertheless, it is recommended that future research projects consider mediators that might affect the relationship between student’s self-efficacy toward their oral presentation performance outcomes. For instance, students who are still developing their language proficiency have added issues to work on. These challenges can be overcome through adopting self-efficacy strategies, such as seeing people speak English everyday inside and outside the classroom, which research has shown to help students enhance the quality of their oral presentation. For example, in Business Communication class, students are not allowed to speak any other languages. In the same class, they are also engaged in English role-play and debating activities to boost their self-efficacy. Against the background of evidence from previous research supporting the benefits of self-
66
efficacy and the capability of modeling experiences to improve the quality of oral presentation, this research concluded that self-efficacy modeling can be used as another intervention that may help students improve English speaking performance and increase their ability to be successful in learning English.
Even though this current study offered contributions that expanded the researchers’ understanding of the contribution of teacher and classmate support and self-efficacy towards speaking anxiety, there are still limitations that should be recognized. First, the current study collected data from a small group of university students in Thailand alone. Second, the analysis was based on the survey data that were collected on a cross-sectional basis. Using cross-sectional data makes the direction of causality difficult to infer. Third, the qualitative interview involved just 10 people. There should be more respondents to enable more reliable conclusions to be drawn. Acknowledgments
We would like to express our heartfelt thanks to the students who devoted their time to answer the questionnaires. The authors were very grateful to anonymous reviewers for their valuable comments and suggestions. All remaining errors and omissions are the authors' responsibility. References Akkakoson, S. (2016). Speaking anxiety in English conversation classrooms among Thai students. Malaysian
Journal of Learning and Instruction, 13(1), 63–82. Ammons, J., & Mills, S. (2005). Course-embedded assessments for evaluating cross-functional integration and
improving the teaching–learning process. Issues in Accounting Education, 20(1), 1–19. Ansong, D., Okumu, M., Bowen, G., Walker, A., & Eisensmith, S. (2017). The role of parent, classmate, and
teacher support in student engagement: Evidence from Ghana. International Journal of Educational Development, 54, 51–58.
Anyadubalu, C. (2010). Self-efficacy, anxiety, and performance in the English language among middle-school students in English language program in Satri Si Suriyothai School, Bangkok. International Journal of Human and Social Sciences, 5(3), 193–198.
Asakereh, A., & Dehghannezhad, M. (2015). Student satisfaction with EFL speaking classes: Relating speaking self-efficacy and skills achievement. Issues in Educational Research, 25(4), 345.
Ayllón, S., Alsina, Á., & Colomer, J. (2019). Teachers’ involvement and students’ self-efficacy: Keys to achievement in higher education. PloS One, 14(5), 0216865. doi:https://doi.org/10.1371/journal.pone
Bandura, A. (2001). Social cognitive theory: An agentic perspective. Annual Review of Psychology, 52(1), 1–26. Bandura, A. (2010). Self‐efficacy.In I. Weiner, & W. Craighead (Eds.), The Corsini encyclopedia of psychology
(pp. 1–3). John Wiley and Sons. Bandura, A., Taylor, C., Williams, S., Mefford, I., & Barchas, J. (1985). Catecholamine secretion as a function of
perceived coping self-efficacy. Journal of Consulting and Clinical sychology, 53(3), 406. Behnke, R., & Sawyer, C. (1999). Public speaking procrastination as a correlate of public speaking
communication apprehension and self‐perceived public speaking competence. Communication Research Reports, 16(1), 40–47.
Bradley, R., Browne, B., & Kelley, H. (2017). Examining the influence of self-efficacy and self-regulation in online learning. College Student Journal, 51(4), 518–530.
Brewster, A., & Bowen, G. (2004). Teacher support and the school engagement of Latino middle and high school students at risk of school failure. Child and Adolescent Social Work Journal, 21(1), 47–67.
Brogan, S., Jowi, D., McCroskey, J., & Wrench, J. (2008). Social communication apprehension: The intersection of communication apprehension and social phobia. Human Communication, 11(4), 409–430.
Charoensukmongkol, P. (2019). The role of mindfulness in reducing English language anxiety among Thai college students. International Journal of Bilingual Education and Bilingualism, 22(4), 414–427.
Chen, S. (2007). Relationship between EFL learners' self-efficacy beliefs and English erformance. [Doctoral dissertation, Florida State University]. doi:http://diginole.lib.fsu.edu/etd/3846/
Chen, G., Gully, S., & Eden, D. (2001). Validation of a new general self-efficacy scale. Organizational Research Methods, 4(1), 62–83.
Cryder, C., Kilmer, R., Tedeschi, R., & Calhoun, L. (2006). An exploratory study of posttraumatic growth in children following a natural disaster. American Journal of Orthopsychiatry, 76(1), 65–69.
67
Danielsen, A., Breivik, K., & Wold, B. (2011). Do perceived academic competence and school satisfaction mediate the relationships between perceived support provided by teachers and classmates, and academic initiative? Scandinavian Journal of Educational Research, 55(4), 379–401.
Daud, N. S. M., Daud, N. M., & Kassim, N. (2016). Second language writing anxiety: Cause or effect? Malaysian Journal of ELT research, 1(1), 1–19.
Dogan, U. (2015). Student engagement, academic self-efficacy, and academic motivation as predictors of academic performance. The Anthropologist, 20(3), 553–561.
Dollah, S. (2016). The effects of self-esteem, anxiety and gender on oral communcation of EFL learners Pustaka Ramadlan, 15(3), 349–360.
Doménech-Betoret, F., Abellán-Roselló, L., & Gómez-Artiga, A. (2017). Self-efficacy, satisfaction, and academic achievement: the mediator role of students' expectancy-value beliefs. Frontiers in Psychology, 8, 1193–1204. https://doi:10.3389/fpsyg.2017.01193
Fatemi, A., & Vahidnia, F. (2013). An Investigation into Iranian EFL learners' level of writing self-efficacy. Theory & Practice in Language Studies, 3(9), 1698–1704.
Fornell, C., & Larker, D. (1981). Structural equation modeling and regression: Guidelines for research practice. Journal of Marketing Research, 18(1), 39–50.
Fredriksen, K., & Rhodes, J. (2004). The role of teacher relationships in the lives of students. New Directions for Youth Development, 2004(103), 45–54.
Hair Jr, J., Matthews, L., Matthews, R., & Sarstedt, M. (2017). PLS-SEM or CB-SEM:Uupdated guidelines on which method to use. International Journal of Multivariate Data Analysis, 1(2), 107–123.
Ho, N., Schweitzer, R., & Khawaja, N. (2017). Academic achievement among recently arrived Chinese adolescent migrants: The role of social support, school belonging, and acculturative stress. Journal of Psychologists and Counsellors in Schools, 27(1), 24–36.
Hughes, J., & Kwok, O. (2007). Influence of student-teacher and parent-teacher relationships on lower achieving readers' engagement and achievement in the primary grades. Journal of EducationalPpsychology, 99(1), 39–51.
Jackson, B., Compton, J., Thornton, A., & Dimmock, J. (2017). Re-thinking anxiety: Using inoculation messages to reduce and reinterpret public speaking fears. PloS One, 12(1). https://doi.org/10.1371/journal.pone.0169972
Kankam, P., & Boateng, S. (2017). Addressing the problem of speech anxiety among students. International Journal of Public Leadership, 13, 26–39. https://doi:10.1108/IJPL-07-2016-0029
Kasbi, S., & Shirvan, M. (2017). Ecological understanding of foreign language speaking anxiety: Emerging patterns and dynamic systems. Asian-Pacific Journal of Second and Foreign Language Education, 2(1), 1–20. https://doi:10.1186/s40862-017-0026-y
King, J. (2002). Preparing EFL learners for oral presentations preparing. Journal of Humanistic Studies, 4, 401–418.
Klem, A., & Connell, J. (2004). Relationships matter: Linking teacher support to student engagement and achievement. Journal of School Health, 74(7), 262–273.
Linnenbrink, E., & Pintrich, P. (2002). Motivation as an enabler for academic success. School Psychology Review, 31(3), 313–327.
Liu, M., & Jackson, J. (2008). An exploration of Chinese EFL learners' unwillingness to communicate and foreign language anxiety. The Modern Language Journal, 92(1), 71–86.
Lu, H., Lee, J., & Lin, M. (2019). Effects of authentic English-language videos on EFL students’ speaking anxiety. International Journal of Information and Education Technology, 9(6), 423–428.
Malecki, C., & Demaray, M. (2006). Social support as a buffer in the relationship between socioeconomic status and academic performance. School Psychology Quarterly, 21(4), 375–395.
Mede, E., & Karaırmak, Ö. (2017). The predictor roles of speaking anxiety and english self efficacy on foreign language speaking anxiety. Journal of Teacher Education and Educators, 6(1), 117–131.
Nunnally, J. (1978). An overview of psychological measurement. In Clinical diagnosis of mental disorders (pp. 97–146): Springer.
Öztürk, G., & Gürbüz, N. (2014). Speaking anxiety among Turkish EFL learners: The case at a state university. Dil ve Dilbilimi Çalışmaları Dergisi, 10(1), 1–17.
Pajares, F., & Schunk, D. (2001). Self-beliefs and school success: Self-efficacy, self-concept, and school achievement. In R. Riding, & S. Rayner (Eds.), International perspectives on individual differences: Self-perception (Vol. 2, pp. 239–265). Ablex.
Patrick, H., Ryan, A., & Kaplan, A. (2007). Early adolescents' perceptions of the classroom social environment, motivational beliefs, and engagement. Journal of Educational Psychology, 99(1), 83–98.
68
Pitzer, J., & Skinner, E. (2017). Predictors of changes in students’ motivational resilience over the school year: The roles of teacher support, self-appraisals, and emotional reactivity. International Journal of Behavioral Development, 41(1), 15–29.
Porter, D. (1974). A multivariate analysis of the effects of communication apprehension upon language behavior. [Unpublished doctoral dissertation]. Florida State University,
Preece, K. (2011). Relations among classroom support, academic self-efficacy, and perceived stress during early adolescence [Master’s thesis, University of South Florida]. https://scholarcommons.usf.edu/etd/3295/
Pryor, B., Butler, J., & Boehringer, K. (2005). Communication apprehension and cultural context: a comparison of communication apprehension in Japanese and American students. North American Journal of Psychology, 7(2), 247–252.
Sakiz, G., Pape, S., & Hoy, A. (2012). Does perceived teacher affective support matter for middle school students in mathematics classrooms? Journal of School Psychology, 50(2), 235–255.
Shorna, S., & Suchona, I. (2019). Speaking problems in English and solutions: Scrutinizing students’ perspective. Shanlax International Journal of English, 8(1). doi:10.34293/english.v8i1.661
Skaalvik, E., Federici, R., & Klassen, R. (2015). Mathematics achievement and self-efficacy: Relations with motivation for mathematics. International Journal of Educational Research, 72, 129–136.
Suldo, S., Friedrich, A., White, T., Farmer, J., Minch, D., & Michalowski, J. (2009). Teacher support and adolescents' subjective well-being: A mixed-methods investigation. School Psychology Review, 38(1), 67–85.
Torsheim, T., Wold, B., & Samdal, O. (2000). The teacher and classmate support scale: factor structure, test-retest reliability and validity in samples of 13-and 15-year-old adolescents. School Psychology International, 21(2), 195–212.
Tsiplakides, I., & Keramida, A. (2009). Helping students overcome foreign language speaking anxiety in the English classroom: Theoretical Issues and practical recommendations. International Education Studies, 2(4), 39–44.
Wang, J., Iannotti, R., & Luk, J. (2011). Peer victimization and academic adjustment among early adolescents: Moderation by gender and mediation by perceived classmate support. Journal of School Health, 81(7), 386–392.
Woodrow, L. (2006). Anxiety and speaking English as a second language. RELC journal, 37(3), 308–328. Yaikhong, K., & Usaha, S. (2012). A measure of EFL public speaking class anxiety: Scale development and
preliminary validation and reliability. English Language Teaching, 5(12), 23–35. Živković, S. (2014). The importance of oral presentations for university students. Mediterranean Journal of
Social Sciences, 5(19), 468–468.
Human Behavior, Development and Society ISSN 2651-1762, Vol 21 No 3, September 2020
69
Factors Affecting School Choice: Observations from Nakhon Ratchasima Municipality
Banjob Boonchan and Arisa Nopakun, Nakhon Ratchasima Rajabhat University, Thailand
Date Received: 23 January 2020 Revised: 14 May 2020 Accepted: 20 May 2020
Abstract
The purpose of this research was to study the factors influencing decision making for children to study in schools. A survey was distributed to school board members, principals, teachers, parents, and students (N = 364). Data were analysed by means of frequency, percentage, mean, standard deviation, and multiple regression analysis. The study indicated building and environment, teachers, reputation of the school, tuition fees, and relationships with the community influenced the decision of parents to send their children to a particular school, at a statistical significance level at or above .05. The most influential factor was building and environment. Teachers, school reputation, tuition fees were next in importance, and finally the relationships with the community. The correlated coefficient between these factors and the decision to send their children to a school was .92. These factors could explain 84.0% of the variance in deciding to send their children to a particular school.
Keywords: Parents decision, children school choice, Nakhon Ratchasima Introduction
It is normal for parents to seek the best educational environment for their children. In Southeast Asia, studies have shown that parents consider the proximity of school location, school performance, and the medium of instruction as significant factors when choosing a school for their children (Ting & Lee, 2019). Thailand, on the other hand, presents an interesting case. Thai children’s education may be affected by the parent with whom they stay. For instance, Jampaklay (2006) reported that there was less disruption to children’s education when they were under the care of their mother. Another social phenomenon related to school choice in Thailand is the ‘modified extended family,’ where rural children are sent by their parents to urban areas for educational opportunities. While this promotes the well-being of the parents, the communication dynamics between parents and children changes considerably (Knodel & Saengtienchai, 2007). These observations, however, were made based on studies of the migratory movements of children away from their parents. To date, minimal studies have examined parental choice of schools within their area of residence, especially the choice involving local Thai schools (see Lampadan, 2008, for choice of international schools in Thailand). Hence, to contribute to our current understanding of Thai parents’ choice of schools, this study examined relevant factors. This study was based on a sample taken in Nakhon Ratchasima Municipality—an area that faces challenges from the lack of trained teachers and learning facilities (Fry et al., 2018). Literature Review Education in Nakhon Ratchasima Municipality
Before discussing relevant factors that affect parents’ choice of school for their children, some educational issues found in Nakhon Ratchasima Municipality need to be highlighted. Educational research in this area is quite limited, but growing. Educational quality in Nakhon Ratchasima is of particular concern. It has been reported that schools in the region do not have adequate educational support or materials due to a lack of funding. This issue is more severe in schools located in remote areas (Fry et al., 2018). School students at the secondary school level in North-eastern Thailand have also been found to report higher levels of academic stress, attributed to students’ academic workloads and their preparation for national exams (Sripongwiwat et al., 2018). This may be linked to the retention of traditional approaches in classrooms, such as rote learning and teacher-centered learning (Tongpoon-Patanasorn, 2011). The lack of resources and teacher-centered approaches may also have
70
contributed to the generally low English proficiency among school students in the North-eastern provinces (Draper, 2012). Amidst these issues, there are also educational innovations worth noting, such as the promotion of a curriculum that recognizes the regional identity. Draper (2015) reported that the community from the Khon Kaen Municipality showed a positive attitude towards the revitalization of a local dialect. Moreover, the study reported that the local dialect is still used extensively in the school domain, despite standard Thai being the sole medium available in teaching and learning materials. Factors Affecting Thai Parents’ School Choice
As discussed in the introduction, there are various factors that may come into play when deciding on a school. In the context of Thailand, there have been several studies that have examined these factors. For instance, in a study by Aunsiri et al. (2018) indicated that school factors (building and environment, school climate), teacher factors (teacher ability, personality, morality and ethics, leadership), and parents (faith, involvement) were positively related to the decision making of parents (significance level of .01). In another study, Yaacob et al. (2014) found that parents, in deciding on an international school, emphasized the importance of the school curriculum, the environment, and the facilities of school. The academic performance of the school was ranked third, with the fourth factor considered being the qualification of teachers. This was also reflected in decisions on choosing a higher educational institution. For instance, Sankham and Hamra (2016), in their study of factors affecting student decisions to study at Asia-Pacific International University, found that significant service marketing mix factors were physical evidence (facilities), product (curriculum), process (service), pricing (tuition fees), and place (location). Relevant Factors for School Choice
In this section, the researchers discuss six factors relevant to school choice. They are School Reputation, Teachers, Tuition Fees, Building and Environment, Travel, and Relationship with the Community. School Reputation
School reputation may be formed based on the school’s academic performance. Bosetti (2004) found that the reputation and exam results of schools are key features guiding parents’ school choices. The choice may also be affected by values, beliefs, or even the principal heading the school. School reputation may also be defined by the services offered, such as access for students with special needs, transportation, or after-school care (Stein et al., 2011). There also are reports of parents who were unable to define what school reputation means (Fabian, 2012). Teachers
Linked with school reputation, research has shown that good teachers are important factors associated with school choice. Bosetti (2004) found one of four reasons for choosing a school was the teachers’ teaching style (47%), as this will impact students’ academic performance (Fairlie, 2006). Furthermore, Nurahimah (2010) stated that teachers can increase or decrease students’ efficacy. Tuition Fees
Cost is an important factor to consider when choosing a school (Lang et al., 2009). For example, parents in Nairobi chose low-cost private schools for their children (Zuilkowski et al., 2018). Low-fee schools in low-income areas also have become increasingly common in parts of Sub-Saharan Africa (Oketch et al., 2010). Building and Environment
The quality of school buildings is very important in creating an appropriate, attractive, and welcoming environment for teaching and learning. Head teachers, teachers, and parents should
71
participate in the upkeep of schools. Christopher (1991) believed that the school building design impacted positively on the educational process and students’ achievement. Several studies have focused on building attributes of schools that may affect student achievement, which in turn influenced parents in their choice of a school (Earthman, 2004; Higgins et al., 2005). Travel
It has been found that parents often choose a school because of its safe distance and access to transportation. The general preference is for nearby schools. Moreover, it may be highly preferred if children are able to commute to schools without transportation (Davison et al., 2008; Ting & Lee, 2019). Relationship with the Community
Schools’ engagement with the community is important, as the development of students’ sense of identity is critical. In a study in Malaysia by Ting and Lee (2019), as well as in another in Thailand by Draper (2015), it was found that parents preferred schools that would help their children develop a positive affiliation with their immediate community. This preference became increasingly positive if the schools were capable of retaining the ethnic identity of the community by allowing the use of ethnic dialects or the teaching of cultural norms. Study Context
Nakhon Ratchasima Municipality was chosen as it was considered to provide an interesting context. As discussed earlier, reports have indicated that schools in the North-eastern region face challenges due to the lack of facilities and qualified teachers. It is also an area where there is a distinct identity. Hence, plans have been created to improve the educational management of municipal schools. This plan covers the development of management systems, the system of teaching, human resource development and support, external evaluation, teaching 21st century skills, and learning foreign languages (English, Japanese, and Chinese).
Within the Nakhon Ratchasima Municipality, there are five schools that provide pre-primary, elementary, and secondary education. These Municipal School are: a) Burapha Wittayakorn Municipal School, b) Wat Samo Rai Municipal School, c) Yommarat Samakki Municipal School, d) Phoa Chum Municipal School, and e) Wat Pa Chitta Samakkhi. There are also other affiliated organizations such as the Office of Primary Educational Service Area, Office of Secondary Educational Service Area, Office of the Vocational Education Commission, and the Office of the Higher Education Commission that provide pre-primary, primary, and secondary education in the area of Nakhon Ratchasima Municipality. To enrol into any of these schools, parents need to submit a request. Methodology and Methods
A quantitative approach was chosen as the main data collection method. The researchers attempted to collect responses from different stakeholders, such as school board members, principals, teachers, parents, and students. Purposive sampling was employed, with the numbers of respondents from different schools as outlined in Table 1.
Data were collected through a survey. The items included both positive and negative statements. The survey consisted of two main parts. The first part used closed-ended questions to collect information about the participants. The second part consisted of statements regarding factors affecting the parents’ school choice for their children. The participants rated these statements according to a five-point Likert scale. These statements were validated with the Item Objective Congruency Index (IOC). Items with an IOC index higher than .50 were accepted and used in the questionnaire. The reliability of the factors investigated—school reputation, teachers, tuition fees, building and environment, travel, and relationship with the community—also were analysed by Cronbach’s alpha, which showed confidence values of .98, .85, .87, .92, .90, .88, and .93, respectively.
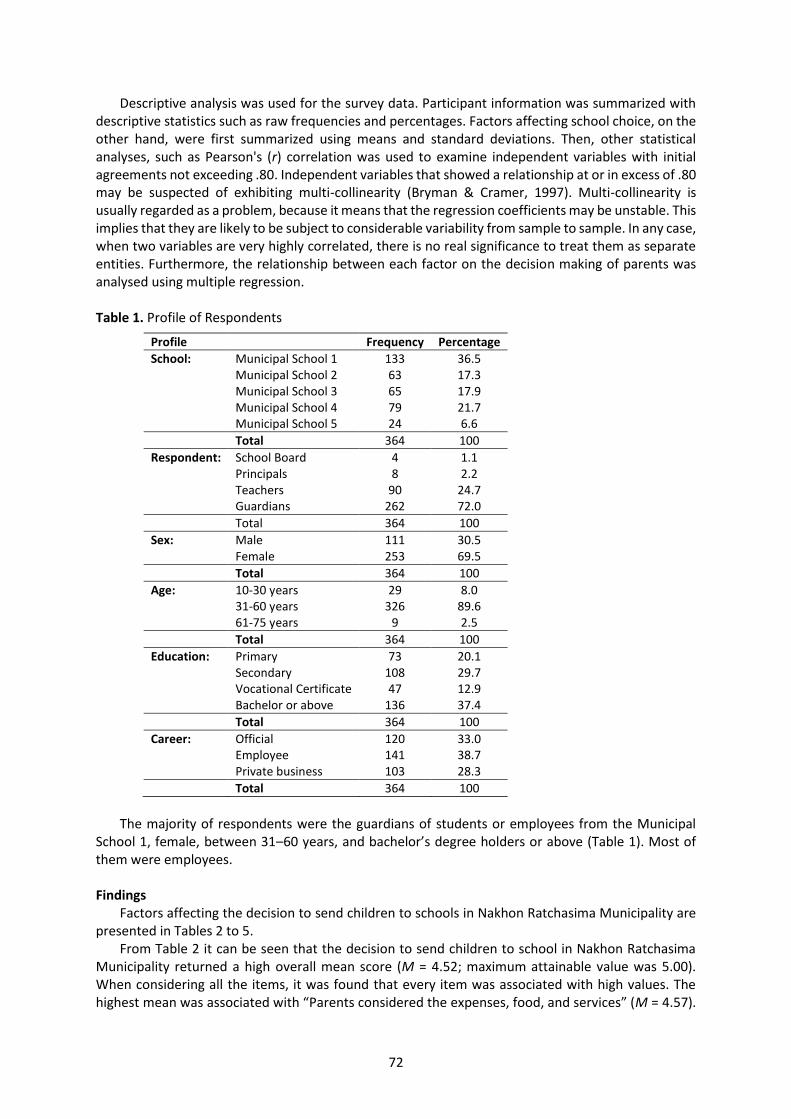
72
Descriptive analysis was used for the survey data. Participant information was summarized with descriptive statistics such as raw frequencies and percentages. Factors affecting school choice, on the other hand, were first summarized using means and standard deviations. Then, other statistical analyses, such as Pearson's (r) correlation was used to examine independent variables with initial agreements not exceeding .80. Independent variables that showed a relationship at or in excess of .80 may be suspected of exhibiting multi-collinearity (Bryman & Cramer, 1997). Multi-collinearity is usually regarded as a problem, because it means that the regression coefficients may be unstable. This implies that they are likely to be subject to considerable variability from sample to sample. In any case, when two variables are very highly correlated, there is no real significance to treat them as separate entities. Furthermore, the relationship between each factor on the decision making of parents was analysed using multiple regression.
Table 1. Profile of Respondents
Profile Frequency Percentage
School: Municipal School 1 133 36.5 Municipal School 2 63 17.3 Municipal School 3 65 17.9 Municipal School 4 79 21.7 Municipal School 5 24 6.6
Total 364 100
Respondent: School Board 4 1.1 Principals 8 2.2 Teachers 90 24.7 Guardians 262 72.0
Total 364 100
Sex: Male 111 30.5 Female 253 69.5
Total 364 100
Age: 10-30 years 29 8.0 31-60 years 326 89.6 61-75 years 9 2.5
Total 364 100
Education: Primary 73 20.1 Secondary 108 29.7 Vocational Certificate 47 12.9 Bachelor or above 136 37.4
Total 364 100
Career: Official 120 33.0 Employee 141 38.7 Private business 103 28.3
Total 364 100
The majority of respondents were the guardians of students or employees from the Municipal
School 1, female, between 31–60 years, and bachelor’s degree holders or above (Table 1). Most of them were employees. Findings
Factors affecting the decision to send children to schools in Nakhon Ratchasima Municipality are presented in Tables 2 to 5.
From Table 2 it can be seen that the decision to send children to school in Nakhon Ratchasima Municipality returned a high overall mean score (M = 4.52; maximum attainable value was 5.00). When considering all the items, it was found that every item was associated with high values. The highest mean was associated with “Parents considered the expenses, food, and services” (M = 4.57).
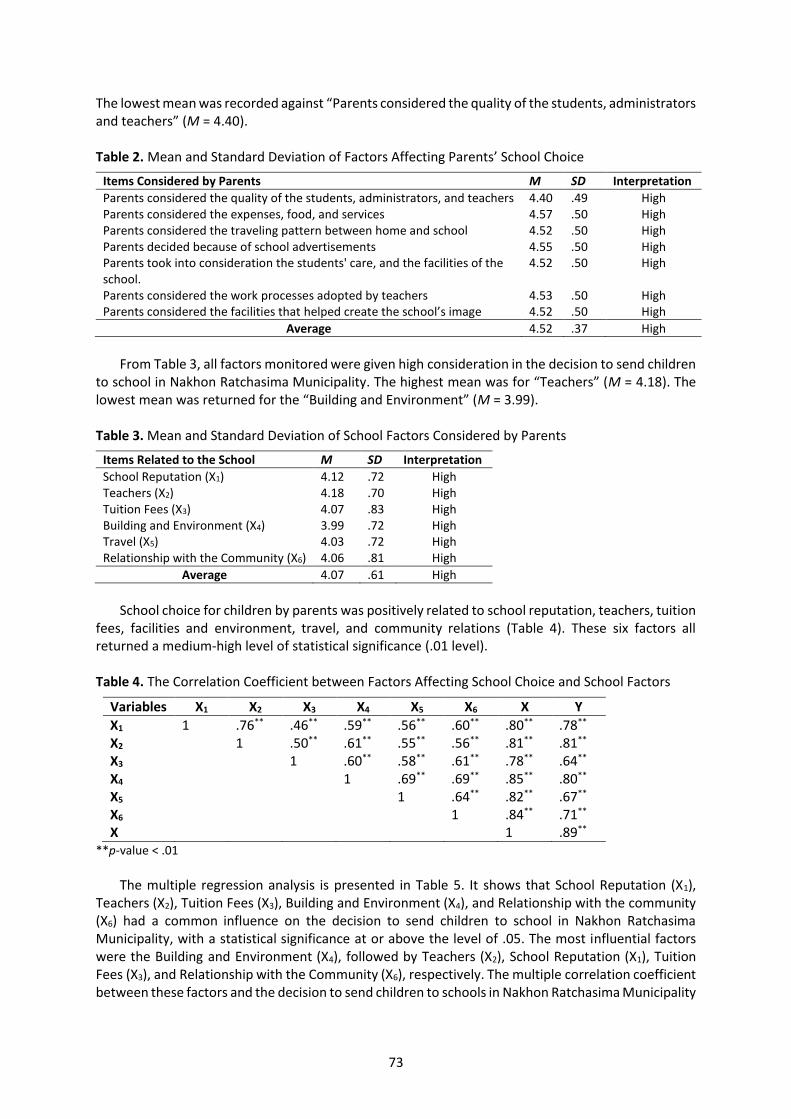
73
The lowest mean was recorded against “Parents considered the quality of the students, administrators and teachers” (M = 4.40).
Table 2. Mean and Standard Deviation of Factors Affecting Parents’ School Choice
Items Considered by Parents M SD Interpretation
Parents considered the quality of the students, administrators, and teachers 4.40 .49 High Parents considered the expenses, food, and services 4.57 .50 High Parents considered the traveling pattern between home and school 4.52 .50 High Parents decided because of school advertisements 4.55 .50 High Parents took into consideration the students' care, and the facilities of the school.
4.52 .50 High
Parents considered the work processes adopted by teachers 4.53 .50 High Parents considered the facilities that helped create the school’s image 4.52 .50 High
Average 4.52 .37 High
From Table 3, all factors monitored were given high consideration in the decision to send children
to school in Nakhon Ratchasima Municipality. The highest mean was for “Teachers” (M = 4.18). The lowest mean was returned for the “Building and Environment” (M = 3.99). Table 3. Mean and Standard Deviation of School Factors Considered by Parents
Items Related to the School M SD Interpretation
School Reputation (X1) 4.12 .72 High Teachers (X2) 4.18 .70 High Tuition Fees (X3) 4.07 .83 High Building and Environment (X4) 3.99 .72 High Travel (X5) 4.03 .72 High Relationship with the Community (X6) 4.06 .81 High
Average 4.07 .61 High
School choice for children by parents was positively related to school reputation, teachers, tuition
fees, facilities and environment, travel, and community relations (Table 4). These six factors all returned a medium-high level of statistical significance (.01 level). Table 4. The Correlation Coefficient between Factors Affecting School Choice and School Factors
Variables X1 X2 X3 X4 X5 X6 X Y
X1 1 .76** .46** .59** .56** .60** .80** .78** X2 1 .50** .61** .55** .56** .81** .81** X3 1 .60** .58** .61** .78** .64** X4 1 .69** .69** .85** .80** X5 1 .64** .82** .67** X6 1 .84** .71** X 1 .89**
**p-value < .01
The multiple regression analysis is presented in Table 5. It shows that School Reputation (X1),
Teachers (X2), Tuition Fees (X3), Building and Environment (X4), and Relationship with the community (X6) had a common influence on the decision to send children to school in Nakhon Ratchasima Municipality, with a statistical significance at or above the level of .05. The most influential factors were the Building and Environment (X4), followed by Teachers (X2), School Reputation (X1), Tuition Fees (X3), and Relationship with the Community (X6), respectively. The multiple correlation coefficient between these factors and the decision to send children to schools in Nakhon Ratchasima Municipality
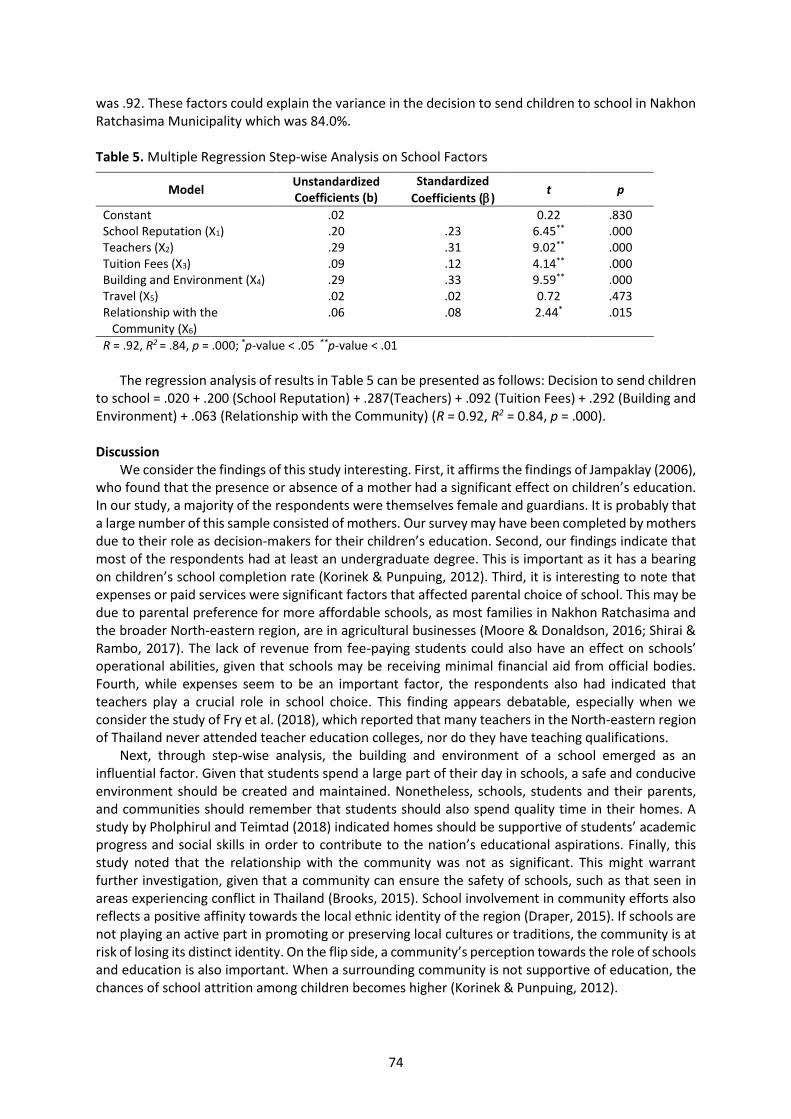
74
was .92. These factors could explain the variance in the decision to send children to school in Nakhon Ratchasima Municipality which was 84.0%. Table 5. Multiple Regression Step-wise Analysis on School Factors
Model Unstandardized Coefficients (b)
Standardized
Coefficients () t p
Constant .02 0.22 .830 School Reputation (X1) .20 .23 6.45** .000 Teachers (X2) .29 .31 9.02** .000 Tuition Fees (X3) .09 .12 4.14** .000 Building and Environment (X4) .29 .33 9.59** .000 Travel (X5) .02 .02 0.72 .473 Relationship with the Community (X6)
.06 .08 2.44* .015
R = .92, R2 = .84, p = .000; *p-value < .05 **p-value < .01
The regression analysis of results in Table 5 can be presented as follows: Decision to send children
to school = .020 + .200 (School Reputation) + .287(Teachers) + .092 (Tuition Fees) + .292 (Building and Environment) + .063 (Relationship with the Community) (R = 0.92, R2 = 0.84, p = .000). Discussion
We consider the findings of this study interesting. First, it affirms the findings of Jampaklay (2006), who found that the presence or absence of a mother had a significant effect on children’s education. In our study, a majority of the respondents were themselves female and guardians. It is probably that a large number of this sample consisted of mothers. Our survey may have been completed by mothers due to their role as decision-makers for their children’s education. Second, our findings indicate that most of the respondents had at least an undergraduate degree. This is important as it has a bearing on children’s school completion rate (Korinek & Punpuing, 2012). Third, it is interesting to note that expenses or paid services were significant factors that affected parental choice of school. This may be due to parental preference for more affordable schools, as most families in Nakhon Ratchasima and the broader North-eastern region, are in agricultural businesses (Moore & Donaldson, 2016; Shirai & Rambo, 2017). The lack of revenue from fee-paying students could also have an effect on schools’ operational abilities, given that schools may be receiving minimal financial aid from official bodies. Fourth, while expenses seem to be an important factor, the respondents also had indicated that teachers play a crucial role in school choice. This finding appears debatable, especially when we consider the study of Fry et al. (2018), which reported that many teachers in the North-eastern region of Thailand never attended teacher education colleges, nor do they have teaching qualifications.
Next, through step-wise analysis, the building and environment of a school emerged as an influential factor. Given that students spend a large part of their day in schools, a safe and conducive environment should be created and maintained. Nonetheless, schools, students and their parents, and communities should remember that students should also spend quality time in their homes. A study by Pholphirul and Teimtad (2018) indicated homes should be supportive of students’ academic progress and social skills in order to contribute to the nation’s educational aspirations. Finally, this study noted that the relationship with the community was not as significant. This might warrant further investigation, given that a community can ensure the safety of schools, such as that seen in areas experiencing conflict in Thailand (Brooks, 2015). School involvement in community efforts also reflects a positive affinity towards the local ethnic identity of the region (Draper, 2015). If schools are not playing an active part in promoting or preserving local cultures or traditions, the community is at risk of losing its distinct identity. On the flip side, a community’s perception towards the role of schools and education is also important. When a surrounding community is not supportive of education, the chances of school attrition among children becomes higher (Korinek & Punpuing, 2012).
75
Implications Parents’ Involvement in Schools
The municipality should establish good relationships with parents by participating in various community activities in which the parents live. For example, the school might allow the use of sports fields so as to become acquainted with parents. If the parents come to be resource speakers, the school can provide appropriate compensation. The municipality should develop a social network to make it easier for parents to access the school via Facebook, Twitter, YouTube, Google Plus, and Instagram. However, it is quite difficult to encourage parents to get involved. First, parents are different in education, occupation, income, ethnicity, and religion. Second, parents also have an attitude that educational management is the duty of the school. Third, most parents are poor. They have to spend most of their time with their careers. These differences lead to difficulty in getting everyone involved. The municipality should build credibility by maintaining educational standards in order to strengthen parents’ faith in the schools. Encouraging parents to have a knowledge and understanding of school policies and plans is the first thing that should be done. School Physical Facilities and Environments
Most schools have enough buildings, but still lack shaded areas. Schools should plant trees for shade and a vegetable garden. In addition to being ornamental plants, vegetables can also be cooked as food. Students should be involved in the care and benefit thereof. This activity should be done after school because it will truly benefit the family or community of students. Community Engagement
Project-based learning is designed for students to collect information about the health of their family members and neighbours. Students can learn health care methods, first aid, and epidemic prevention under the guidance of teacher advisors. The school should operate in collaboration with local administrative organizations in regards to budgetary support and environmental management that is conducive to child health. Schools already work with parents to control the intake of salty and sweet foods by students, but also might encourage them to eat more fruits and vegetables. Exercise might be encouraged in free time to benefit and improve health. Schools can contribute to this process, as they are well-equipped with facilities, and equipment, so exercising together will improve the health of the community.
References Aunsiri, T., Kaewsuk, S., & Phattaraphakin, K. (2018). Factors affecting the decision making of parents on sending
their children to study at small secondary school under the Educational Service Office Area 6. RMUTP Research Journal Humanities and Social Sciences, 3(1), 11–22.
Bosetti, L. (2004). Determinants of school choice: Understanding how parents choose elementary schools in Alberta. Journal of Education Policy, 19(4), 387–405.
Brooks, M. (2015). School principals in Southern Thailand: Exploring trust with community leaders during conflict. Educational Management Administration & Leadership, 43(2), 232–252.
Bryman, A., & Cramer, D. (1997). Quantitative data analysis with SPSS for Windows: A guide for social scientists. Routledge.
Christopher, G. (1991). Effect of architecture on education. CEFPl's Educational Facility Planner, 29(1), 10–12. Davison, K., Werder, J., & Lawson, C. (2008). Children’s active commuting to school: Current knowledge and
future directions. Preventing Chronic Disease, 5(3), 1–11. Draper, J. (2012). Reconsidering compulsory English in developing countries in Asia: English in a community of
Northeast Thailand. TESOL Quarterly, 46(4), 777–811. Draper, J. (2015). Towards a curriculum for the Thai Lao of Northeast Thailand? Current Issues in Language
Planning, 16(3), 81–105. Earthman, G. (2004). Prioritization of 31 criteria for school building adequacy. American Civil Liberties Union
Foundation of Maryland. Fabian, H. (2012). Children starting school: A guide to successful transitions and transfers for teachers and
assistants. David Fulton Publishers.
76
Fairlie, R. (2006). Racial segregation and the private/public school choice. National Center of Privatization in Education, Teachers College, Columbia University.
Fry, G., Bi, H., & Apahung, R. (2018). Regional educational disparities in Thailand. In G. W. Fry (Ed.), Education in Thailand: An old elephant in search of a new mahout (pp. 373–391). Springer.
Higgins, S., Hall, E., Wall, K., Woolner, P., & McCaughey, C. (2005). The impact of school environments: A literature review. The Design Council. https://www.researchgate.net/publication/232607630
Knodel, J., & Saengtienchai, C. (2007). Rural parents with urban children: Social and economic implications of migration for the rural elderly in Thailand. Population, Space and Place, 13, 193–210.
Korinek, K., & Punpuing, S. (2012). The effect of household and community on school attrition: An analysis of Thai youth. Comparative Education Review, 56(3), 474–510.
Lampadan, N. (2008). Factors affecting parents’ choice of the Adventist International Mission School (AIMS) in Muak Lek, Saraburi, Thailand. The Scriptor, 9, 57–69.
Lang, D., Chan, H., Pask-Aube, C., & Swift, K. (2009, May 25–27). Does the level of tuition fees affect student retention and graduation? [Paper presentation]. The Annual Conference of the Canadian Society for the Study of Higher Education, Carleton University, Ottawa, Canada.
Moore, J., & Donaldson, J. (2016). Human-scale economics: economic growth and poverty reduction in Northeastern Thailand. World Development, 85, 1–15.
Oketch, M., Mutisya, M., Ngware, M., & Ezeh, A. C. (2010). Why are there proportionately more poor pupils enrolled in non-state schools in urban Kenya in spite of FPE Policy?” International Journal of Educational Development, 30, 23–32.
Pholphirul, P., & Teimtad, S. (2018). Living with parents and educational outcomes in developing countries: Empirical evidence from PISA Thailand. Journal of Population Research, 35(1), 87–105.
Sankham, S., & Hamra, W. (2016). Factors affecting student decisions to study at Asia-Pacific International University. Catalyst, 13(1), 4–14.
Shirai, Y., & Rambo, A. (2017). Household structure and sources of income in a rice-growing village in northeast Thailand. Southeast Asian Studies, 6(2), 275–292.
Sripongwiwat, S., Bunterm, T., & Tang, K. (2018). An investigation of learning stressors among secondary school students: A case study in northeast Thailand. Kasetsart Journal of Social Sciences, 39(2), 197–206.
Stein, M., Goldring, E., & Cravens, X. (2011). Do parents do as they say? In M. Berends, M. Cannata, & E. Goldring (Eds.), School Choice and School Improvement (pp. 103–114). Harvard Education Press.
Ting, S., & Lee, D. (2019). Determinants of primary school choice in Malaysia: School proximity and ethnicity-related reasons. Journal of School Choice, 13(2), 228–254. doi: 10.1080/15582159.2019.1574464
Tongpoon-Patanasorn, A. (2011). Impact of learner-centeredness on primary school teachers: A case study in Northeast Thailand. The Journal of Asia TEFL, 8(3), 1–28.
Yaacob, N., Osman, M., & Bachok, S. (2014). Factors influencing parents’ decision in choosing private schools. Procedia-Social and Behavioral Sciences, 153, 242–253. https://doi.org/10.1016/j.sbspro.2014.10.058
Zuilkowski, S. S., Piper, B., Ong’ele, S., & Kiminza, O. (2018). Parents, quality, and school choice: Why parents in Nairobi choose low-cost private schools over public schools in Kenya’s free primary education era. Oxford Review Education, 44(2), 258–274.
Human Behavior, Development and Society ISSN 2651-1762, Vol 21 No 3, September 2020
77
The Relationship between Leadership, Quality of Working Life, Compensation, and Welfare Affecting Job Satisfaction of Hospital Employees
Pimpa Cheewaprakobkit, Asia-Pacific International University, Thailand
Busabong Chulapetch, Mission Hospital, Bangkok, Thailand
Date Received: 5 May 2020 Revised: 8 July 2020 Accepted: 20 July 2020
Abstract The structural relationship was investigated between leadership and the quality of the working life, compensation, and welfare of the employees affecting job satisfaction at Mission Hospital, Bangkok. Employees (N = 330) completed a questionnaire and the data were analyzed using Structural Equation Modeling with the Partial Least Square technique. Employees were of the opinion that leadership had a direct impact on their quality of working life (49.8%) and also had a direct effect on levels of compensation and welfare (68.7%). Apart from determining organizational direction, the leaders also determine the operational plans and various budgets. Employee satisfaction depended on the quality of working life (48.7%) and on compensation (9.1%). This indicated that employees paid more attention to the quality of their working lives than to income or welfare benefits, as long these were high enough to provide a reasonable living. Income and benefits are a part of a support structure that promotes employee quality of life, helps them reach their potential, and creates incentives for participation by performing their duties to their fullest capacity. Keywords: Work satisfaction, hospital leadership, factors affecting satisfaction
Introduction Leaders in an organization play an important role in determining its progress and the management style that will affect employee attitudes and job efficiency. The characteristics of a good leader will make the operations run smoothly, reduce conflicts, and motivate employees to perform their duties willingly at their full capacity, leading the organization to success. Having employees perform their duties to the best of their ability is due partly to their job satisfaction. If the employees are not satisfied with their work, then they will lack enthusiasm and morale at work, and that will affect organizational efficiency and increase the rate of employee turnover. In addition to environmental factors, job satisfaction is influenced by motivation factors such as career stability, receiving fair compensation and benefits, and career advancement. Administrators can use well-established principles known in human relations to supervise their subordinates by providing good welfare and making them comfortable at work (Herzberg, 1966). The employees are thereby encouraged and have increased confidence in the organization. This leads to commitment and effective utilization of their knowledge and skills to perform tasks to achieve the goals set by the organization. Leadership Leadership is the ability to persuade a group of people to carry out certain activities together in order to achieve goals (Robbins & Judge 2017). Kalsoom et al. (2018) and Othman et al. (2014) indicated that leadership is the most important component and skill in an organization which has direct and indirect impacts on the efficiency of employee performance. Leaders who possess foresight are able to steer an organization away from failure or towards success (Asrar-ul-haq & Kuchinke, 2016). In studies of leadership that affects the job satisfaction of employees, scholars have divided leadership into four main categories which are: (a) Directive Leadership: the leader holds the absolute highest power. The employees must comply regardless of whether they are willing or not.
78
(b) Supportive Leadership: the leader always supports the employees in various fields such as materials, equipment, consultation, and problem-solving together that leads to a decrease in organizational conflicts. Therefore, these result in operational efficiency where the employees love and respect such a leader. (c) Participative Leadership: the leader focuses on the participation of all employees in performing the job, helping one another to achieve integration of ideas. The leader or executive is just the team leader who is helping to solve problems to achieve the most successes in the job. (d) Achievement-oriented Leadership: the leader does not care about what they exchange their work for, as long as the work is accomplished and they achieve the goal. Many employees feel dissatisfied with this type of leader (Pongsriwat, 2015). Employee Satisfaction The Gallup Organization is one of the largest companies conducting management consulting. It is known for its analytical ability and knowledge of peoples’ behavior, which enable it to help companies understand their employees and clients so that satisfactory solutions are realized to the problems encountered. A 2016 Gallup survey involving 1,032 individuals in 50 U.S. states indicated 13 significant areas in Workers' Satisfaction across various careers. According to Newport and Harter (2016), these were:
1. The physical safety conditions of your workplace. 2. Your relations with other coworkers. 3. The flexibility of your hours. 4. Your job security. 5. Your boss or immediate supervisor. 6. The amount of work that is required of you. 7. The amount of vacation time you receive. 8. The recognition you receive at work for your work accomplishments. 9. The retirement plans your employer offers. 10. Your chances for promotion. 11. The amount of money you earn. 12. The health insurance benefits your employer offers. 13. The amount of on-the-job stress in your job.
The researchers found that the highest satisfaction was with safety and relations with coworkers, and the lowest satisfaction was with stress, benefits, and pay. Many scholars have different definitions of job satisfaction. Davis and Newstrom (1985) defined job satisfaction as the relationship between employee expectations and the benefits they receive. Job satisfaction also depends on the integration of the mental state, physiology, and the environment, which brings satisfaction to the work (Hoppock, 1935). Employee satisfaction is reflected in their behavior, which in turn is influenced by their attitudes and values. Cheerful employees enjoy and rejoice in their work. This helps improve the quality of the work experience. Job satisfaction is beneficial to organizations in many areas: it reduces complaints, employee turnover, and dismissal. This helps employees to display greater morale at work, such as coming to work on time, which then makes organizations more effective (Grover & Wahee, 2013). Organizational efficiency also depends on leadership attitudes, employee management, job satisfaction with different types of work, teamwork, and the self-awareness of leaders (Kuzey, 2012; Datta & Datta, 2013). According to a study by Chaulagain & Khadka (2012), job satisfaction of medical personnel was significantly influenced by factors such as career development opportunities, assigned responsibilities, patient care, and relationships among colleagues. Gilmer (1996) summarized the factors influencing job satisfaction, which involved security at work, the fairness of feedback received from supervisors, opportunities for advancement, wages, working conditions, benefits, retirement, medical care, and housing provisions.
79
Quality of Work Life The quality of working life is one of the most important components of the overall quality of life, and it is one that links job satisfaction and performance efficiency. Every employee, in addition to working to earn a living, also wishes to have a good quality working life. Most people spend eight hours, or a third of their time each day, working. Many people understand that a good work-life balance consists in having a comfortable job and earning a high income; but in reality, people need more than this, especially in this era. According to a study conducted with Gen Ys (born from 1981 to 1991) by Fidelity Investments in the United States of America in 2016, most employees valued quality of life more than financial benefits. They were willing to receive reduced wages in exchange for a better working life, such as having a good work-relaxation balance (Christ, 2016). People with good working life quality are satisfied in their jobs, enabling their organizations to proceed with various activities and achieve the objectives set (Sungkapate & Srivichai, 2017). Good working life quality results from employers responding to appropriate employee desires to make their lives and work pleasant by providing fair and adequate compensation, enabling them to support themselves and their families, and furnishing a safe environment and atmosphere that is conducive to work (Pandey & Tripathi, 2018; Sirgy et al., 2001). This makes employees feel positive about their work on account of having good leaders and colleagues (Tosh, 2019). A study by Nayak and Sahoo (2015) found that improving employees’ quality of working life enhanced their commitment to performing tasks, and this resulted in making their organizations significantly more efficient, which is also consistent with the findings of Vadivel and Velmurugan (2017). Compensation and Welfare Compensation represents all forms of payment in monetary form and services, including various benefits and other advantages received by employees in return for working for the organization. These benefits may include wages, support and encouragement for employees to improve themselves, supporting scholarships, time off for further study, ongoing training and seminars, bonuses, and prizes. It may also mean reimbursement that the employer pays as compensation for losses (Prugsasri, 2014). Welfare initiatives aim to provide employees with well-being, happiness, career security, certainty in life, or other benefits apart from their salary or wages that are regularly received. These may be provident funds, health service, comprehensive annual physical examinations, health and accident insurance for employees who work in high-risk departments, and other financial support, including financial assistance for families and children in certain matters (Assawarungruang, 2017; Patro, 2015; Manasa & Krishnanaik, 2015). Study Background
The annual performance report of Mission Hospital, Bangkok for 2015 and 2016 found that many employees sought advice and help in solving their problems. Some problems were worked out, but many could not be resolved immediately because they involved emotional and morale issues. Therefore, the employees felt depressed, lacked motivation, and were unhappy in doing their work. This led to complaints and accusations. Patient satisfaction with the service provided decreased, and resulted in 2015 employee turnover rates as high as 34.4%; this increased to 57.0% in 2016 (Human Resources Committee, 2020). For this reason, the hospital director conducted training for employees at all levels to assist them in realizing their value and the value of others. From 2017 to 2019, the turnover rate gradually decreased to 28.6%, 26.9%, and 24.0% respectively. It is apparent that employee satisfaction depends significantly on leadership and motivation. Therefore, studying the factors that affect employee job satisfaction has the potential to lead to greater client satisfaction, development of professionalism, increased motivation in operation, reduction of the turnover rate, and increased job efficiency.
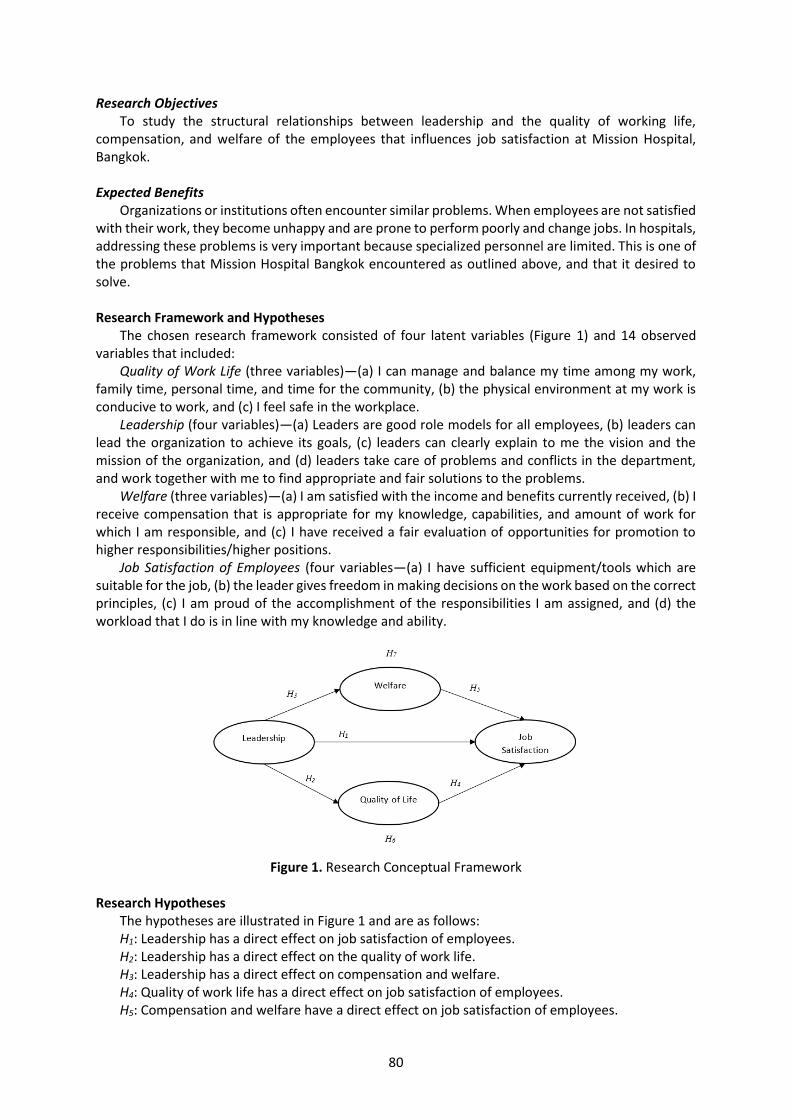
80
Research Objectives To study the structural relationships between leadership and the quality of working life, compensation, and welfare of the employees that influences job satisfaction at Mission Hospital, Bangkok. Expected Benefits Organizations or institutions often encounter similar problems. When employees are not satisfied with their work, they become unhappy and are prone to perform poorly and change jobs. In hospitals, addressing these problems is very important because specialized personnel are limited. This is one of the problems that Mission Hospital Bangkok encountered as outlined above, and that it desired to solve. Research Framework and Hypotheses
The chosen research framework consisted of four latent variables (Figure 1) and 14 observed variables that included:
Quality of Work Life (three variables)—(a) I can manage and balance my time among my work, family time, personal time, and time for the community, (b) the physical environment at my work is conducive to work, and (c) I feel safe in the workplace.
Leadership (four variables)—(a) Leaders are good role models for all employees, (b) leaders can lead the organization to achieve its goals, (c) leaders can clearly explain to me the vision and the mission of the organization, and (d) leaders take care of problems and conflicts in the department, and work together with me to find appropriate and fair solutions to the problems.
Welfare (three variables)—(a) I am satisfied with the income and benefits currently received, (b) I receive compensation that is appropriate for my knowledge, capabilities, and amount of work for which I am responsible, and (c) I have received a fair evaluation of opportunities for promotion to higher responsibilities/higher positions.
Job Satisfaction of Employees (four variables—(a) I have sufficient equipment/tools which are suitable for the job, (b) the leader gives freedom in making decisions on the work based on the correct principles, (c) I am proud of the accomplishment of the responsibilities I am assigned, and (d) the workload that I do is in line with my knowledge and ability.
Figure 1. Research Conceptual Framework
Research Hypotheses
The hypotheses are illustrated in Figure 1 and are as follows: H1: Leadership has a direct effect on job satisfaction of employees. H2: Leadership has a direct effect on the quality of work life. H3: Leadership has a direct effect on compensation and welfare. H4: Quality of work life has a direct effect on job satisfaction of employees. H5: Compensation and welfare have a direct effect on job satisfaction of employees.
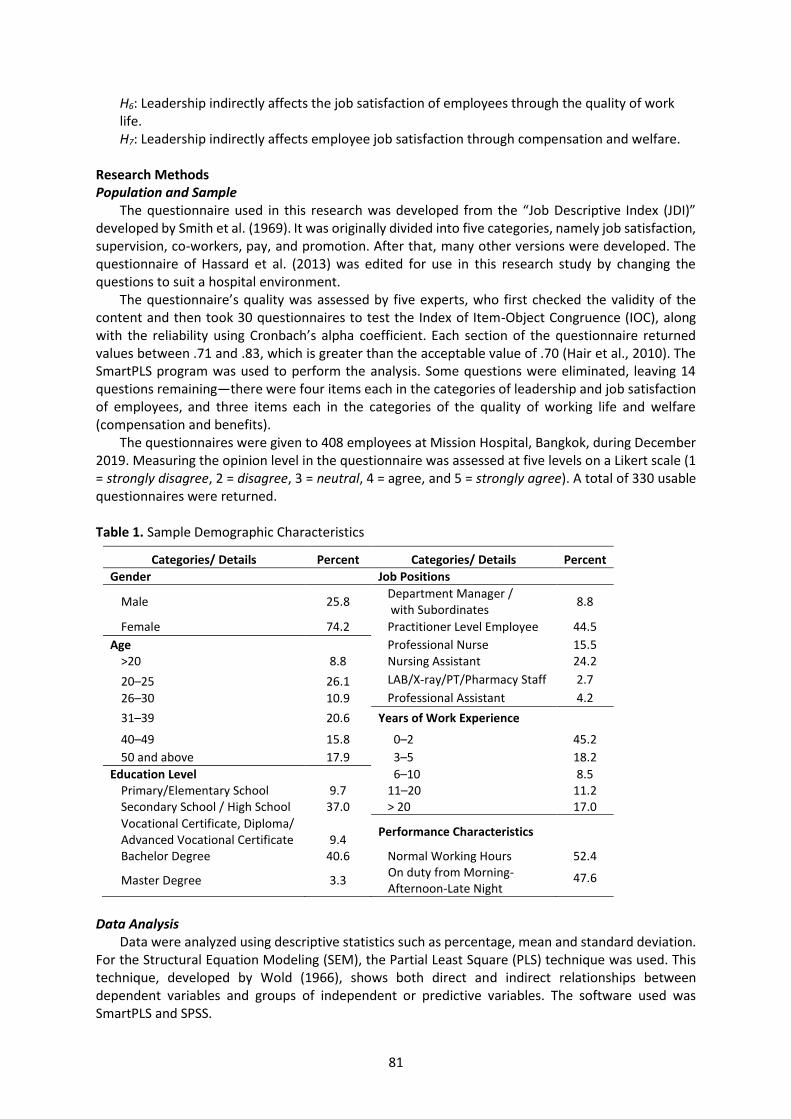
81
H6: Leadership indirectly affects the job satisfaction of employees through the quality of work life. H7: Leadership indirectly affects employee job satisfaction through compensation and welfare.
Research Methods Population and Sample
The questionnaire used in this research was developed from the “Job Descriptive Index (JDI)” developed by Smith et al. (1969). It was originally divided into five categories, namely job satisfaction, supervision, co-workers, pay, and promotion. After that, many other versions were developed. The questionnaire of Hassard et al. (2013) was edited for use in this research study by changing the questions to suit a hospital environment.
The questionnaire’s quality was assessed by five experts, who first checked the validity of the content and then took 30 questionnaires to test the Index of Item-Object Congruence (IOC), along with the reliability using Cronbach’s alpha coefficient. Each section of the questionnaire returned values between .71 and .83, which is greater than the acceptable value of .70 (Hair et al., 2010). The SmartPLS program was used to perform the analysis. Some questions were eliminated, leaving 14 questions remaining—there were four items each in the categories of leadership and job satisfaction of employees, and three items each in the categories of the quality of working life and welfare (compensation and benefits).
The questionnaires were given to 408 employees at Mission Hospital, Bangkok, during December 2019. Measuring the opinion level in the questionnaire was assessed at five levels on a Likert scale (1 = strongly disagree, 2 = disagree, 3 = neutral, 4 = agree, and 5 = strongly agree). A total of 330 usable questionnaires were returned. Table 1. Sample Demographic Characteristics
Categories/ Details Percent Categories/ Details Percent
Gender Job Positions
Male 25.8 Department Manager / with Subordinates
8.8
Female 74.2 Practitioner Level Employee 44.5
Age Professional Nurse 15.5 >20 8.8 Nursing Assistant 24.2
20–25 26.1 LAB/X-ray/PT/Pharmacy Staff 2.7
26–30 10.9 Professional Assistant 4.2
31–39 20.6 Years of Work Experience
40–49 15.8 0–2 45.2
50 and above 17.9 3–5 18.2
Education Level 6–10 8.5 Primary/Elementary School 9.7 11–20 11.2 Secondary School / High School 37.0 > 20 17.0
Vocational Certificate, Diploma/ Advanced Vocational Certificate 9.4
Performance Characteristics
Bachelor Degree 40.6 Normal Working Hours 52.4
Master Degree 3.3 On duty from Morning-Afternoon-Late Night
47.6
Data Analysis Data were analyzed using descriptive statistics such as percentage, mean and standard deviation. For the Structural Equation Modeling (SEM), the Partial Least Square (PLS) technique was used. This technique, developed by Wold (1966), shows both direct and indirect relationships between dependent variables and groups of independent or predictive variables. The software used was SmartPLS and SPSS.
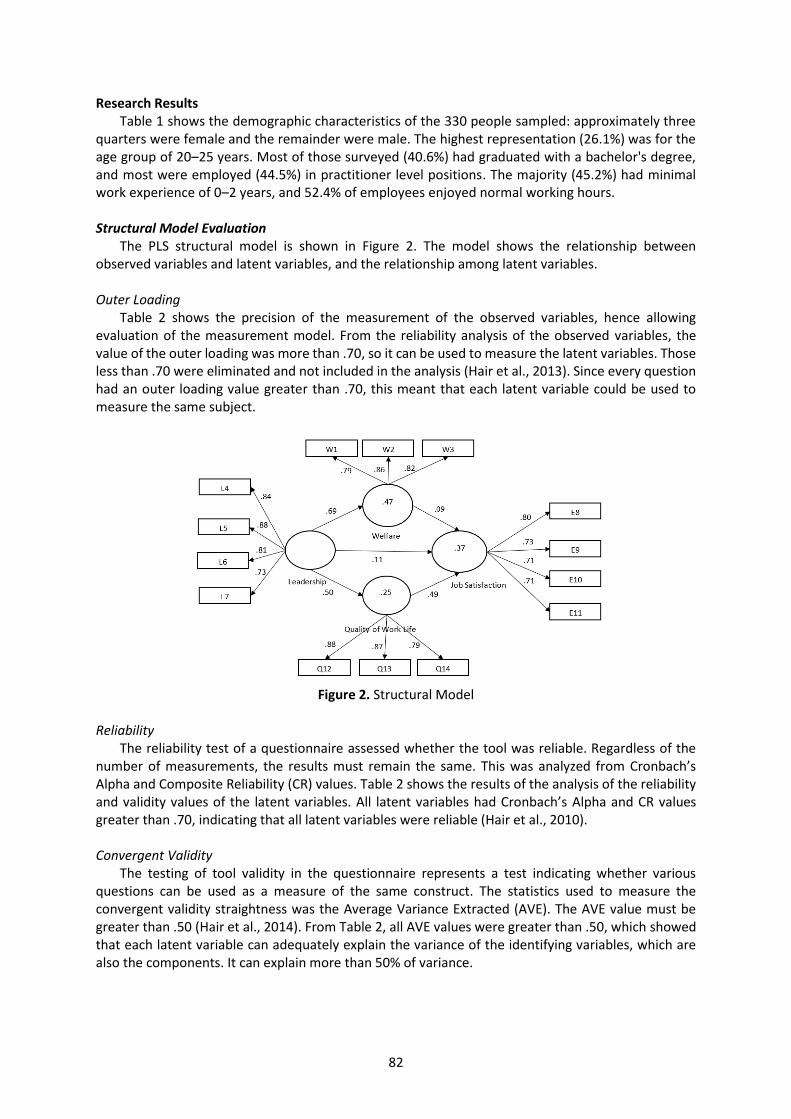
82
Research Results Table 1 shows the demographic characteristics of the 330 people sampled: approximately three quarters were female and the remainder were male. The highest representation (26.1%) was for the age group of 20–25 years. Most of those surveyed (40.6%) had graduated with a bachelor's degree, and most were employed (44.5%) in practitioner level positions. The majority (45.2%) had minimal work experience of 0–2 years, and 52.4% of employees enjoyed normal working hours. Structural Model Evaluation
The PLS structural model is shown in Figure 2. The model shows the relationship between observed variables and latent variables, and the relationship among latent variables. Outer Loading Table 2 shows the precision of the measurement of the observed variables, hence allowing evaluation of the measurement model. From the reliability analysis of the observed variables, the value of the outer loading was more than .70, so it can be used to measure the latent variables. Those less than .70 were eliminated and not included in the analysis (Hair et al., 2013). Since every question had an outer loading value greater than .70, this meant that each latent variable could be used to measure the same subject.
Figure 2. Structural Model
Reliability The reliability test of a questionnaire assessed whether the tool was reliable. Regardless of the number of measurements, the results must remain the same. This was analyzed from Cronbach’s Alpha and Composite Reliability (CR) values. Table 2 shows the results of the analysis of the reliability and validity values of the latent variables. All latent variables had Cronbach’s Alpha and CR values greater than .70, indicating that all latent variables were reliable (Hair et al., 2010). Convergent Validity
The testing of tool validity in the questionnaire represents a test indicating whether various questions can be used as a measure of the same construct. The statistics used to measure the convergent validity straightness was the Average Variance Extracted (AVE). The AVE value must be greater than .50 (Hair et al., 2014). From Table 2, all AVE values were greater than .50, which showed that each latent variable can adequately explain the variance of the identifying variables, which are also the components. It can explain more than 50% of variance.
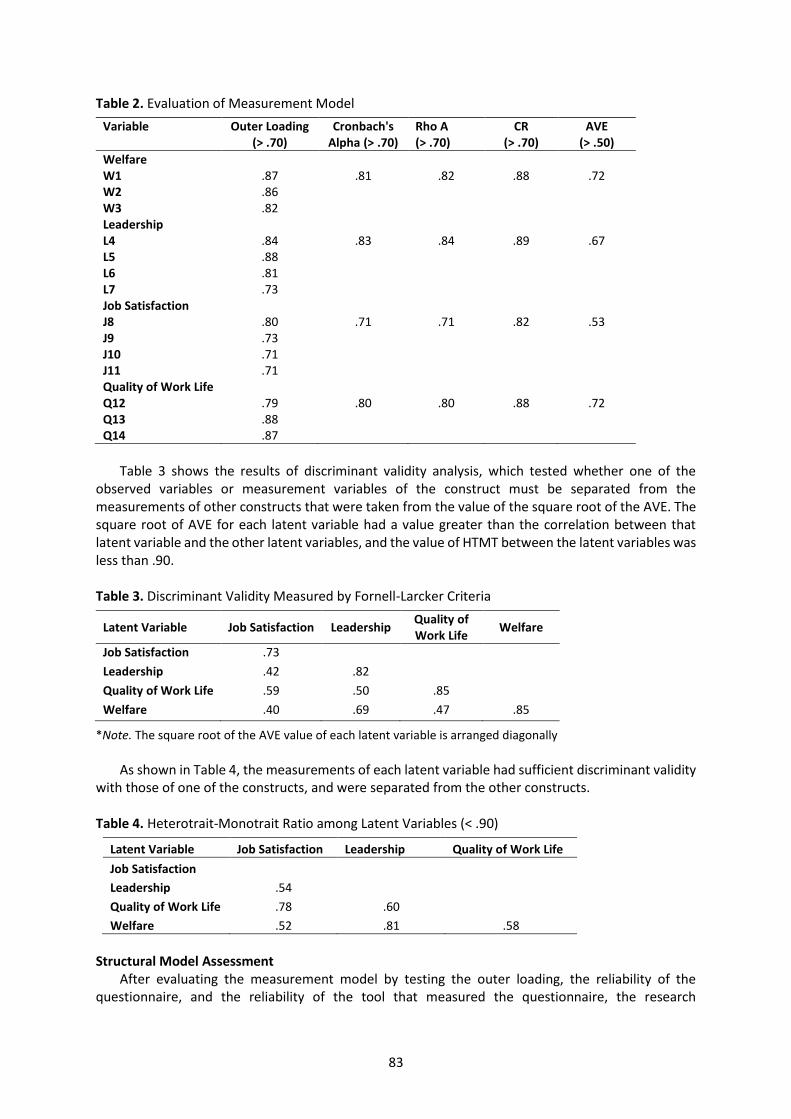
83
Table 2. Evaluation of Measurement Model
Variable Outer Loading (> .70)
Cronbach's Alpha (> .70)
Rho A (> .70)
CR (> .70)
AVE (> .50)
Welfare W1 .87 .81 .82 .88 .72 W2 .86 W3 .82 Leadership L4 .84 .83 .84 .89 .67 L5 .88 L6 .81 L7 .73 Job Satisfaction J8 .80 .71 .71 .82 .53 J9 .73 J10 .71 J11 .71 Quality of Work Life Q12 .79 .80 .80 .88 .72 Q13 .88 Q14 .87
Table 3 shows the results of discriminant validity analysis, which tested whether one of the observed variables or measurement variables of the construct must be separated from the measurements of other constructs that were taken from the value of the square root of the AVE. The square root of AVE for each latent variable had a value greater than the correlation between that latent variable and the other latent variables, and the value of HTMT between the latent variables was less than .90. Table 3. Discriminant Validity Measured by Fornell-Larcker Criteria
Latent Variable Job Satisfaction Leadership Quality of Work Life
Welfare
Job Satisfaction .73
Leadership .42 .82
Quality of Work Life .59 .50 .85
Welfare .40 .69 .47 .85
*Note. The square root of the AVE value of each latent variable is arranged diagonally
As shown in Table 4, the measurements of each latent variable had sufficient discriminant validity
with those of one of the constructs, and were separated from the other constructs. Table 4. Heterotrait-Monotrait Ratio among Latent Variables (< .90)
Latent Variable Job Satisfaction Leadership Quality of Work Life
Job Satisfaction Leadership .54 Quality of Work Life .78 .60 Welfare .52 .81 .58
Structural Model Assessment After evaluating the measurement model by testing the outer loading, the reliability of the questionnaire, and the reliability of the tool that measured the questionnaire, the research
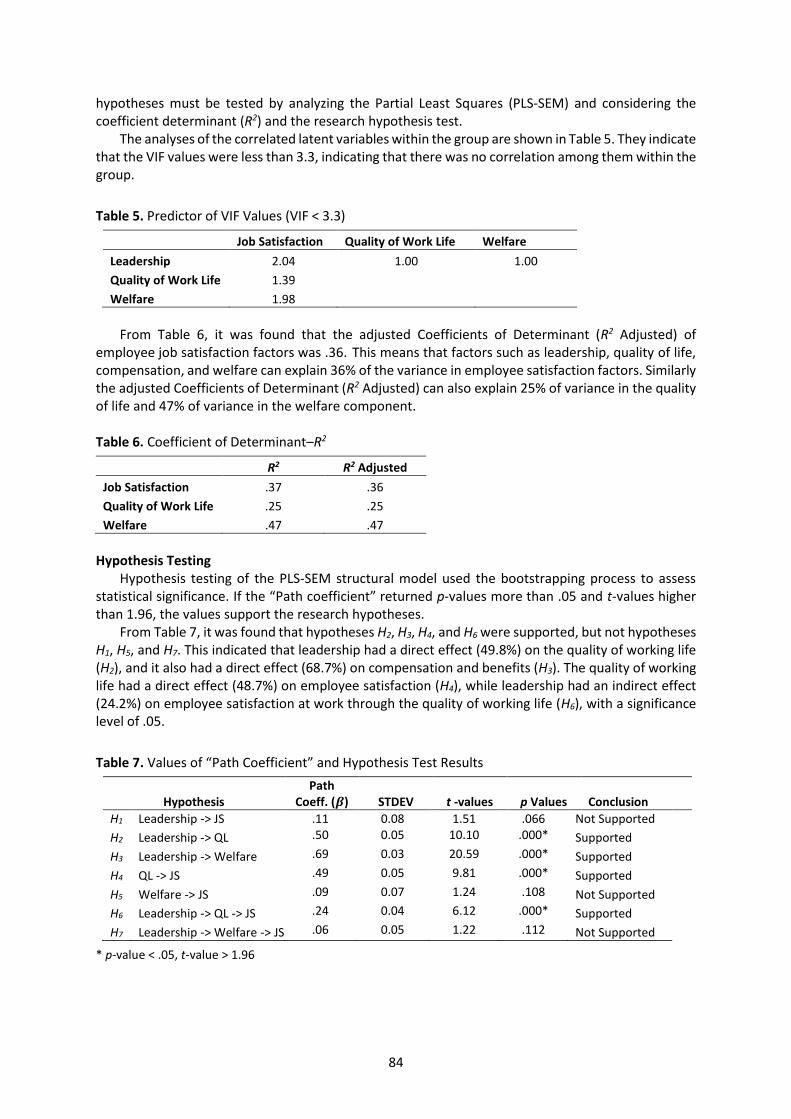
84
hypotheses must be tested by analyzing the Partial Least Squares (PLS-SEM) and considering the coefficient determinant (R2) and the research hypothesis test.
The analyses of the correlated latent variables within the group are shown in Table 5. They indicate that the VIF values were less than 3.3, indicating that there was no correlation among them within the group.
Table 5. Predictor of VIF Values (VIF < 3.3)
Job Satisfaction Quality of Work Life Welfare
Leadership 2.04 1.00 1.00
Quality of Work Life 1.39 Welfare 1.98
From Table 6, it was found that the adjusted Coefficients of Determinant (R2 Adjusted) of
employee job satisfaction factors was .36. This means that factors such as leadership, quality of life, compensation, and welfare can explain 36% of the variance in employee satisfaction factors. Similarly the adjusted Coefficients of Determinant (R2 Adjusted) can also explain 25% of variance in the quality of life and 47% of variance in the welfare component. Table 6. Coefficient of Determinant–R2
R2 R2 Adjusted
Job Satisfaction .37 .36
Quality of Work Life .25 .25
Welfare .47 .47
Hypothesis Testing Hypothesis testing of the PLS-SEM structural model used the bootstrapping process to assess statistical significance. If the “Path coefficient” returned p-values more than .05 and t-values higher than 1.96, the values support the research hypotheses. From Table 7, it was found that hypotheses H2, H3, H4, and H6 were supported, but not hypotheses H1, H5, and H7. This indicated that leadership had a direct effect (49.8%) on the quality of working life (H2), and it also had a direct effect (68.7%) on compensation and benefits (H3). The quality of working life had a direct effect (48.7%) on employee satisfaction (H4), while leadership had an indirect effect (24.2%) on employee satisfaction at work through the quality of working life (H6), with a significance level of .05.
Table 7. Values of “Path Coefficient” and Hypothesis Test Results
Hypothesis Path
Coeff. (𝜷) STDEV t -values p Values Conclusion
H1 Leadership -> JS .11 0.08 1.51 .066 Not Supported
H2 Leadership -> QL .50 0.05 10.10 .000* Supported
H3 Leadership -> Welfare .69 0.03 20.59 .000* Supported
H4 QL -> JS .49 0.05 9.81 .000* Supported
H5 Welfare -> JS .09 0.07 1.24 .108 Not Supported
H6 Leadership -> QL -> JS .24 0.04 6.12 .000* Supported
H7 Leadership -> Welfare -> JS .06 0.05 1.22 .112 Not Supported
* p-value < .05, t-value > 1.96
85
Summary and Discussion of Research Findings From the research study, the results can be summarized as follows: employees expressed the opinion that leadership had a direct effect on the quality of working life (49.8%), and had a direct effect also on compensation and benefits (68.7%). Employees considered their leaders as ones who had authority in determining the direction, policies, operating models, and budgets of the organization. These directly and indirectly affected the quality of working life, and the compensation and welfare of employees. The satisfaction of employees depended on the quality of their working life (48.7%) and on salary and benefits (9.1%). This meant that the quality of the working life, on a daily basis, had a greater impact on job satisfaction than income or benefits received on a monthly basis. This is in accordance with the study done by Christ (2016). This researcher stated that job satisfaction does not depend solely on income. Employees pay more attention to the quality of working life, such as working in a happy environment, as long as the income is sufficient for living and raising a family. If these conditions are met, then they are satisfied. Leaders play a very important role in planning, executing work, and solving problems so that employees have good quality of life, appropriate income, and welfare support. Leaders who listen to their employees regarding their problems and then help and support them in their work will encourage their employees. This is reflected in employees having good attitudes, satisfaction with their work, efficiency in job performance, and also a decrease in employee turnover rates. The study of Assawarungruang (2018) found that job satisfaction influenced the relationship between satisfaction with wages and the intention of doctors to resign.
The administration of Mission Hospital Bangkok organized training to increase knowledge, develop skills in various types of work, and increase work efficiency. This initiative also allowed the employees to express their opinions more freely, increased listening to their problems, and solved various problems in a timelier manner. This has created a family atmosphere in the workplace that helps to decrease problems and conflicts. Moreover, supervising the welfare of employees and providing them with a conducive environment to work, resulted in employees being more satisfied, and increased work efficiency. From a customer satisfaction survey, it was found that they were more satisfaction with the services rendered, and staff turnover rates from 2017–2019 decreased to 28.6%, 26.9%, and 24.0%, respectively. Therefore, it can be concluded that as important intermediaries, leaders drive organizations both directly and indirectly to achieve their goals through various factors. Employees pay considerable attention to good quality of working life. Compensation and benefits are a part of the motivation for employees to participate and perform their duties to the best of their ability. Limitations and Recommendations for the Next Research The sample group from which the data was collected came from one private hospital. In further research, data might be collected from many sources for comparison. Collecting data ideally would focus on employees’ perspectives, their intentions to remain or resign, and the problems contributing to their decisions. In this fashion, employees could be assisted immediately. Other factors might also be considered in future studies that affect work satisfaction and the intention to resign. References Asrar-ul-Haq, M., & Kuchinke, K. (2016). Impact of leadership styles on employees’ attitude towards their
leader and performance: Empirical evidence from Pakistani banks. Future Business Journal, 2(1), 54–64. https://doi.org/10.1016/j.fbj.2016.05.002
Assawarungruang, W. (2017). Patchai thi mi ʻitthiphon to khwamtangchai laʻo k kho ng phæt chak sathan phayaban nai khet Krung Thep Maha Nakho n [Factors influencing intention to quit of physician from healthcare facility in Bangkok] [Master’s thesis, University of the Thai Chamber of Commerce]. https://searchlib.utcc.ac.th/ library/onlinethesis/303872.pdf
Chaulagain, N., & Khadka, D. (2012). Factors influencing job satisfaction among healthcare professionals at Tilganga Eye Centre, Kathmandu, Nepal. International Journal of Scientific & Technology Research, 1(11), 32–36.
86
Christ, G. (2016). Millennials value quality of work life over money. https://www.ehstoday.com/safety-
leadership/ article/21917522/millennials-value-quality-of-work-life-over-money
Datta, P., & Datta, D. (2013). A study on motivation and satisfaction of employees in corporate hospitals in Kolkata, India. National Journal of Medical Research, 3(1), 56–59.
Davis, K., & Newstrom, J. (1985). Human behavior at work: Organizational behavior (7th ed.). McGraw-Hill Book Company.
Gilmer, B. (1996). Applied psychology: Problems in living and work. Hill Book Company. Grover, H., & Wahee, S. J. (2013). Study on factors influencing job satisfaction of employees in Delhi/NCR.
Opinion-International Journal of Business Management, 3(2), 101–112. Hair, J., Black, W., Babin, B., & Anderson, R. (2010). Multivariate data analysis (7th ed.). Prentice Hall. Hair, J., Hult, G., Ringle, C., & Sarstedt, M. (2014). A primer on partial least squares structural equation
modeling (PLS-SEM). Sage Publications. Hair, J., Ringle, C., & Sarstedt, M. (2013). Partial least squares structural equation modeling: Rigorous
applications, better results and higher acceptance. Long Range Planning, 46(1–2), 1–12. Hassard, J., Cox, T., Murawski, S., De Meyer, S., & Muylaert, K. (2011). Mental health promotion in the
workplace—a good practice report. Publications Office of the European Union. https://osha.europa.eu/en/publications/ mental-health-promotion-workplace-good-practice-report
Herzberg, F. (1966). Work and the nature of man. World Publishing Company. Hoppock, R. (1935). Job satisfaction. Harper and Brothers. Human Resources Committee. (2020). PM20–003: Humanize care survey result Y2019. In Minutes of human
resource committee meeting 16 January 2020. Mission Hospital Bangkok. Kalsoom, Z., Khan, M., & Zubair, S. (2018). Impact of transactional leadership and transformational leadership
on employee performance: A case of FMCG industry of Pakistan. Industrial Engineering Letters, 8(3), 23–
30.
Kuzey, C. (2012). Impact of health care employees’ job satisfaction on organizational performance support vector machine approach. European Journal of Economic and Political Studies, 5(1), 65–89.
Manasa, B., & Krishnanaik, C. (2015). Employee welfare measures—A study on cement corporation of India
units, in Thandur and Adilabad. International Research Journal of Engineering and Technology, 2(9),
219–226.
Nayak, T., & Sahoo, C. (2015). Quality of work life and organizational performance: The mediating role of employee commitment. Journal of Health Management, 17(3), 263–273.
Newport, F., & Harter, J. (2016). U.S. workers' satisfaction with job dimensions increases. https://news.gallup.com/ poll/195143/workers-satisfied-job-dimensions.aspx
Othman, F., Saad, M., Robani, A., & Abdullah, A. (2014). A conceptual framework of the impact of leadership
styles on heterogeneous R&D team performance. International Symposium on Research in Innovation and
Sustainability, 26(5), 1759–1762.
Pandey, M., & Tripathi, P. (2018). Examine the relationship between level of aspiration, believes in just world, psychological well-being and quality of work-life. Indian Journal of Health and Wellbeing, 9(1), 53–59.
Patro, C. S. (2015). Employee welfare measures in public and private sectors. International Journal of Service Science, Management, Engineering, and Technology, 6(1), 22–36.
Pongsriwat, S. (2015). Phawa khwampen phu nam [Leadership]. https://www.mebmarket.com/index.php?action= BookDetails&book_id=15942
Prugsasri, P. (2014). Patchai kha to pthæn thi mi phon to prasitthiphap nai kan patibat ngan kho ng phanakngan bo risat Sayam mækkhro chamkat (Mahachon) nai khet Krung Thep Maha Nakho n læ parimonthon [Compensation factors affecting to performance of the employee a case study of employee in Siam Makro Public Co., Ltd. Bangkok and Metropolitan Area] [Master’s Independent Study, Sripatum University]. http://dspace.spu.ac.th/handle/123456789/5190
Robbins, S. & Judge, T. (2017). Organizational behavior (13th ed.). Pearson Education.
Sirgy, M., Efraty, D., Siegel, P., & Lee, D. (2001). New measure of Quality of Work Life (QWL) based on need satisfaction and spillover theories’. Social Indicators Research: An International and Interdisciplinary Journal for Quality-of-Life Measurement, 55(3), 241–302.
Smith, P., Kendall, L., & Hulin, C. (1969). The measurement of satisfaction in work and retirement. Rand McNally.
87
Sungkapate, M., & Srivichai, C. (2017). Khwamsamphan rawang khunnaphap chiwit nai kanthamngan kap
khwam phukphan to ʻongkan tam khwamkhithen kho ng phayaban wichachip nai rongphayaban chumchon
changwat pathumthan [Relationships between quality of work life and organizational commitment as
perceived by nurses at the community hospitals in Pathum Thani Province]. EAU Heritage Journal Science
and Technology, 11(2), 227–238.
Tosh (2019). Khunnaphap chiwit nai kanthamngan [Quality of working life]. https://tosh.or.th/index.php/blog/ item/475-quality-of-working-life
Vadivel, S., & Velmurugan, R. (2017). Quality of work life of employees in private companies with reference to Coimbatore. International Journal of Multidisciplinary Research & Development, 4(5), 128–131.
Wold, H. (1966). Estimation of principal components and related models by iterative least squares. In P.R. Krishnaiaah (Ed.), Multivariate analysis (pp. 391–420). Academic Press.

Human Behavior, Development and Society ISSN 2651-1762, Vol 21 No 3, September 2020
88
Employee Perceptions of Organizational Climate Factors in a Private School System
Gavin Hibbert, Asia-Pacific International University, Thailand
Date Received: 25 March 2020 Revised: 9 June 2020 Accepted: 12 June 2020
Abstract
This research was undertaken to assess employee perceptual positivity of selected current and expected organizational climate factors in a private school system. A survey adapted and modified from the Charles F. Kettering Ltd. School Climate Profile was developed consisting of 11 climate factors and 55 positive statements followed by an open-ended comment section. Completed, valid responses were received from employees (N = 215) across four different schools. A One-Way ANOVA and a t-test were used to determine perceptions. Overall employee perceptual expectations of climate factors were very high in every climate factor (mean = 3.79 on a 4.00 scale), while the overall perceptions of current climate factors were high to moderate (mean = 3.08). The highest perceptions of current climate factors were attributed to respect (3.26) and communication (3.26), while the lowest factors were trust (2.85) and morale (2.90). Open-ended findings generally supported statistical findings. Spirituality and caring were perceived to be among the strongest organizational climate aspects in these schools. Resources ranked as one of the weakest aspects across all schools. Morale was not perceived to be a strong aspect in any of the schools, and was perceived to be among the weakest aspects at most schools.
Keywords: Organizational culture, organizational climate factors, perceptual positivity Introduction
Researchers have defined culture and climate in different ways. One common theme in studies has been the underlying notion that climate is an apparent function or expression of organizational culture at any given moment. The use of the organizational culture concept has become more prevalent over the past 30 years and frequently is confused as being identical to organizational climate (Griffin & Moorhead, 2014). They are similar in so far as both are concerned with the general workplace atmosphere, social interactions, and employee behavior within an organization. According to Griffin and Moorhead (2014, p. 516), organizational culture "usually refers to the historical context within which a situation occurs and the impact of this context on the behaviors of employees." It is the vehicle whereby “people in the organization learn and communicate what is acceptable and unacceptable in an organization—its values and norms." Organizational climate does not, however, include concerns about “values and norms” but is rather concerned with the “current atmosphere” in an organization. Organizational climate has a perceptual research base that focuses on personal perceptions and can be defined as "recurring patterns of behavior, attitudes, and feelings that characterize life in the organization; and refers to current situations in an organization and the linkages among work groups, employees, and work performance" (Griffin & Moorhead, 2014, p. 516).
Another difference between organizational climate and culture is that the study of organizational climate is founded on psychology, while organizational culture is founded on anthropology and sociology. Administrators can, therefore, more readily influence organizational climate and employee behavior (Griffin & Moorhead, 2014). Furthermore, these authors stated that it is more difficult to change an organization’s culture because it has been constructed gradually over the duration of the organization’s existence and is grounded on its philosophy, beliefs, and traditions.
Stringer has pointed out how climate and culture are different. “Culture emphasizes the unspoken assumptions that underlie an organization, whereas climate focuses on the more accessible perceptions of the organization, especially how they arouse motivation and, thus, impact performance” (Stringer, 2002, p. 14). When trying to distinguish between the concepts of organizational culture and organizational climate, Payne considered that they are very different from
89
each other. He agreed, however, that many definitions “are easily substitutable for each other” because “they share the common ground of trying to describe and explain the relationships that exist among groups of people who share some sort of common situation/experience” (Payne, 2000, p. 166). Peterson and Spencer (1990, p. 7) have provided further clarity on the difference between culture and climate by defining climate as “the current common patterns of important dimensions of organizational life or its members’ perceptions and attitudes towards those dimensions.” Furthermore, they saw climate as being “more concerned with current perceptions and attitudes, whereas culture is more concerned with deeply held meanings, beliefs, and values (p. 12).”
Stolp and Smith (1995, p. 22) defined school culture as “historically transmitted patterns of meaning that include the norms, values, beliefs, traditions, and myths understood, maybe in varying degrees, by members of the school community.” Likewise, Stringer divided culture into five components, namely values, beliefs, myths, traditions, and norms (Stringer, 2002). Organizational climate, on the other hand, should be understood within the greater context of an organizational culture. While these terms are not mutually exclusive, some writers often fail to differentiate clearly between them. Climate has been used to define the “subtle spirit” of a school (Stolp & Smith, 1995, p. 21). Organizational climate “describes people’s shared perceptions” and “expectations” of an organization; whereas culture includes “not only how people feel about their organization, but the assumptions, values, and beliefs that give the organization its identity and specify its standards of behavior” (Stolp & Smith, 1995, p. 25).
Payne (2000, p. 166) described cultural research as “more accurate and more specific than climate research” but more difficult to “generalize from.” Climate research is “more generalizable, but it is less accurate and less specific,” and may “provide a useful description of a single organization and an even more useful comparison with other organizations.”
According to Stringer (2002, p. 10), “Organizational climate exists objectively in the organization, but it can only be described and measured indirectly through the perceptions of the members of the organization.” Organizational climate, therefore, may be understood as people’s perceptions of current organizational culture. Furthermore:
Culture is a product of the history of relationships in a school, whereas climate is defined by how people perceive those relationships in the present. (This is not to suggest people’s perceptions readily change from day to day; in fact, school climate, like culture, is relatively stable). (Stolp & Smith, 1995, p. 27)
Organizational climate emanates from the organization’s physical appearance, employees, clientele and many other experienced “cultural artifacts” (Schein, 2000). Schein’s solution to the culture-climate debate is to “define climate as a cultural artifact resulting from espoused values and shared tacit assumptions.” Moreover, he elaborated that,
To understand climate fully, one must dig deeper and examine values and assumptions. In other words, to understand what goes on in an organization and why it happens in the way it does, one needs several concepts. Climate and culture, if each is carefully defined, then become two critical building blocks for organizational description and analysis. (Schein, 2000, p. xxiv)
Finally, organizational climate, according to Robbins and Judge (2013, p. 516), denotes “the shared perceptions organizational members have about their organization and work environment.” This climate is generally experienced individually or collectively at an emotional level and includes such things as team spirit and feelings about priorities and success. It has also been related to workplace habits, “job satisfaction, involvement, commitment, and motivation,” as well as to “higher customer satisfaction and financial performance” (Robbins & Judge, 2013, p. 516). They further elaborated that there are many interacting dimensions of climate that can lead to positive or negative experiences and behavior (p. 517).
In light of the aforementioned, it was a goal of this research to provide a description of the climate of individual organizations, while also being able to make useful comparisons between them. In this study, the author has attempted to understand employee perceptions of these “interacting
90
dimensions of climate,” and has adopted the operational definitions of a number of terms as indicated below.
● Organizational Culture refers to the enduring and historically transmitted philosophy and mission ascribed to by an organization that includes its norms, values, beliefs, and traditions.
● Organizational Climate refers to employees currently shared perceptions of their experience working in the organization at any given time that includes impressions, attitudes, feelings, and expectations of the wider organizational culture.
● Climate Factors refers to individual aspects or categories of organizational culture identified and presented in such a way as to accurately elicit employee perceptions, thereby providing an overview of the current organizational climate. Such factors may be perceived positively or negatively.
● Degree of Perceptual Positivity refers to low-positive perception, slightly-low positive perception, slightly-high positive perception, and high-positive perception; it is determined by the cut-off point ranges on a four-point Likert Scale (Almost Never, Occasionally, Frequently, Almost Always) in the organizational climate survey.
● Thailand Adventist Mission (TAM) refers to the Seventh-day Adventist (SDA) Church in Thailand that oversees the schools under its jurisdiction. These schools are part of the worldwide Seventh-day Adventist School system, which is one of the largest parochial educational systems in the world.
Climate Dimensions (Factors)
While it is a challenge to determine the essential factors or dimensions that impact employee’s motivation and performance, common sense determines that these factors would include most aspects of the work environment. Stringer (2002, p. 10) identified specific measurable and manageable behaviors that “can best be described and measured in terms of six distinct dimensions: structure, standards, responsibility, recognition, support, and commitment.” Peterson and Spencer (1990, p. 8) further elaborated on the commonly examined aspects of climate as follows: “Unlike culture, the content of which cannot be easily specified, the options with climate are extensive, so it is important to identify the content of the climate one is examining.”
A wide variety of aspects pertaining to organizational life can be addressed in climate studies because, as Stringer (2002, p. 14) has stated, “Although climate is a largely subjective phenomenon, we know how to measure it accurately. We also know how climates are created. Of all the factors that determine climate, the most important are the practices of the leaders of the organization.” Research suggests that there is almost no limit to the number of climate aspects that can be studied. Peterson and Spencer (1990) have pointed out that such studies, depending on the purpose of the research, can be either comprehensive or focused on specific organizational dimensions. The focus of this research was on specific organizational factors.
Organizational climate instruments have been developed to indicate levels of shared employee commitment for the purpose of assisting administrators to better understand prevailing employee attitudinal perceptions. According to Ashkanasy et al. (2000, p. 8), the term organizational climate is used
To describe configurations of attitudes and perceptions by organization members that, in combination, reflect a substantial part of the context of which they are a part and within which they
work. It is usually conceived of as being structurally realist, deductive, and based on survey methods.
It must be remembered that while the “results of the survey can provide a broad characterization of school climate, no one model or instrument will accurately characterize all elements of a school's culture or climate” (Stolp & Smith, 1995, p. 48). It is important that any administrator endeavor to analyze an organization from as many perspectives as possible in order to gain a comprehensive understanding of the organization.
91
This purpose of this study was to help educational administrators understand their organizational climate by providing valuable information on employee perceptions within the context of the greater organizational culture. In this study the perceptions of three groups of employees were examined, namely administrators, teachers, and staff, regarding select organizational climate factors in an effort to assess how they aligned with organizational culture. The study also sought to identify significant differences between employee perceptions of current climate factors (“what is”) and their perceptions of what these factors ideally should be like (“what should be”). Hypotheses Constructed and Premise Used
The following were the working hypotheses and major premise for this research study.
● Hypothesis 1: Employees across all four TAM schools have a high-positive (H1.1) current (what is) and/or (H1.2) expected (what should be) perception of select school climate factors.
● Hypothesis 2: Employees within each of the four TAM schools have a high-positive (H2.1) current (what is) and/or (H2.2) expected (what should be) perception of select school climate factors.
● Hypothesis 3: Employees across all four TAM schools who differ according to their (H3.1) role, (H3.2) gender, (H3.3) length of service, and/or (H3.4) religion exhibit differences in their current (what is) and expected (what should be) perceptions of school climate factors.
● Hypothesis 4: Employees across all four TAM schools exhibit differences in their current (what is) and expected (what should be) perception of school climate factors.
● Major Premise: The above working hypothesis H1 and H2 will be supported if it can be established that school employees have a high-positive perception of the select climate factors in this study. Hypothesis H3 and H4 will be supported if it can be established that employees exhibit differences in organizational climate factor perceptions of ‘what is’ and ‘what should be’.
Methodology, Instrumentation, and Data Collection
This study describes the perceptions that exist in an organization, but not why they exist. In order to achieve the research objectives, a School Climate Profile Survey provided data on the perceptions of 11 climate factors. Data analysis yielded valuable information for the research questions posed. Attitudinal perceptions arise from subjective individual employee (administrator, staff, and teacher) experiences within the organizational environment. It was assumed that an analysis of selected climate factors in this survey would provide the following useful information for school administrators.
1. Descriptive information on how current employee climate perceptions (“what is” responses) were aligned with organizational culture across and within employee role groups. This information is valuable because it may reveal potential inconsistencies of alignment.
2. Descriptive information on how current climate perceptions were aligned with expected perceptions (“what ought to be” responses) across and within employee role groups. This information is valuable because it may reveal potential misunderstanding of alignment.
The conceptual framework for this study was derived from “The Charles Kettering Ltd. School Climate Profile” (Johnson & Johnson, 1992), and the instrument used was adapted to the unique educational context of the institutions under study. Many of the particular climate factors chosen for this study are found in this Climate Profile; however, individual statements within each factor were changed or modified to reflect the unique conditions of the schools under study. The Charles F. Kettering Ltd. School Climate Profile has been used widely over the past 25 years (Stolp & Smith, 1995, p. 48). Another important aspect of the instrument used was the ability to make a comparison between perceptions of the current situation and expectations of what it should be, as pointed out by Peterson and Spencer (1990). “The comparison of actual and ideal views reflecting the differences between perceived reality and expectation is often the most informative contrast.”
The survey population in this study refers to current actively serving administrators, teachers, and staff at four TAM schools. A total of 400 individuals were working in the year 2019. The questionnaires were distributed over the four schools to all available employees. A total of 250 respondent
92
participants returned their questionnaires. However, there were 35 incomplete (invalid) sets of questionnaires. As a result, a usable sample of 215 questionnaires was available for the study.
The sample size for respondents randomly selected from the population was calculated, based on Yamane’s formula of respondents (Yamane, 1967), and gave a suggested number of 200 respondents selected from the population of about 400 employees.
The organizational climate factors selected for this study were the following: A. Cohesiveness, B. Morale, C. Growth, D. Trust, E. Respect, F. Caring, G. Spirituality, H. Resources, I. Conflicts, J. Communication, and K. Problems. The selection of climate factors was based on the factors identified in the aforementioned climate profile, on the uniqueness of the institutions under study, personal interest, and factors most applicable to the schools being surveyed. One of the climate factors unique to the institutions under study was “Spirituality.” Historical forces and the external environment (Stinger, 2002, p. 13) are potential climate dimensions that were not addressed in this study.
For the purposes of the study, a questionnaire was used as the research instrument. The first part of the questionnaire consisted of the demographic information of the respondents. The second part consisted of statements pertaining to the organizational climate of the school. Respondents were asked to select a scale number that best described their perception of the statements regarding “what the current situation at the respondents’ school was like” and “what the situation at the respondent’s school should be.” The respondents were asked to rate their perceptions to the questions based on a four-point Likert scale (Lozano et al., 2008). Within the rubric of organizational climate, “interview approaches, fixed-response instruments, and survey techniques are well-understood and commonly used methodologies” (Peterson & Spencer, 1990). In the third part, respondents were asked to provide open-ended comments about the strongest and weakness aspects of the organizational climate at their institution. The content of the instrument was validated judgmentally by giving it to three local experts in order to ascertain its suitability to the local situation. Back translation (translation both ways) was done to ensure the accuracy of the statements in the instrument.
Positivity of perception was determined if all climate factors statements reflected positive characteristics. The degree of perceptual positivity was determined by the extent to which the employees ranked their Likert Scale response categories (Almost Never: 1.00–1.75, Occasionally: 1.76–2.50, Frequently: 2.51–3.25, and Almost Always: 3.26–4.00). Lozano et al. (2008) have shown that four alternatives are an optimum number in a comparison type test. The reliability and validity decreases with fewer than four alternatives and the psychometric properties of the scale scarcely increase further with more than seven alternatives.
When gathering data for this study, the researcher requested permission from the TAM officers to collect data from schools directly under its jurisdiction. The survey instrument was taken before the TAM Administrative Committee for a vote of approval. The researcher also requested permission from the chief administrator of each individual school under study. Paper copies of the instrument were hand-delivered to schools and distributed as per instructions at the convenience of each school administrator. Upon completion, the researcher collected the completed instruments for data analysis.
The tabulated collected data was analyzed using SPSS software. The surveys were grouped according to role group (Administrator, Staff Member, and Teachers). The sum and mean scores were calculated for each role group. Mean scores were statistically compared by t-test and One-Way ANOVA. The information obtained allowed for an interpretation of how these school climate factors contributed to the degree of perceptual positivity.
Finally, the open-ended comments from the survey participants in each school were presented individually in numerical order, followed by a summary involving all the schools. Comments were categorized by climate factor and frequency to determine the strongest and the weakest aspects. These perceptions were used to complement other comparisons across schools.
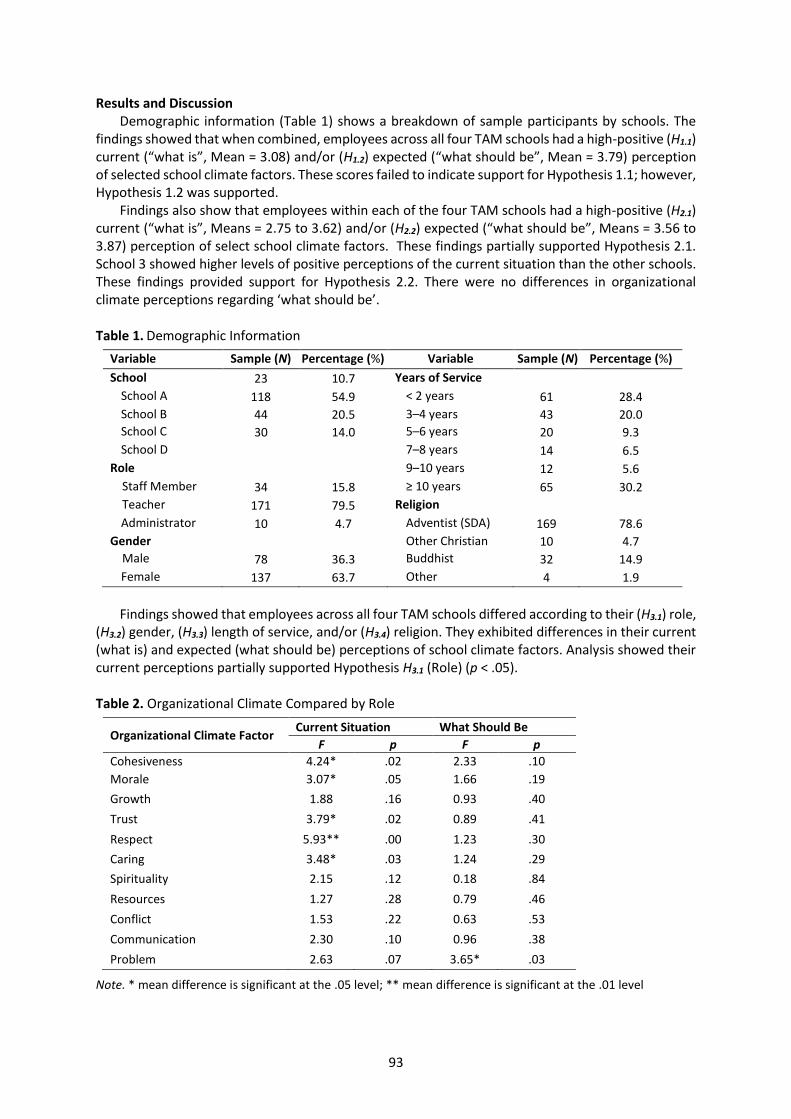
93
Results and Discussion Demographic information (Table 1) shows a breakdown of sample participants by schools. The
findings showed that when combined, employees across all four TAM schools had a high-positive (H1.1) current (“what is”, Mean = 3.08) and/or (H1.2) expected (“what should be”, Mean = 3.79) perception of selected school climate factors. These scores failed to indicate support for Hypothesis 1.1; however, Hypothesis 1.2 was supported.
Findings also show that employees within each of the four TAM schools had a high-positive (H2.1) current (“what is”, Means = 2.75 to 3.62) and/or (H2.2) expected (“what should be”, Means = 3.56 to 3.87) perception of select school climate factors. These findings partially supported Hypothesis 2.1. School 3 showed higher levels of positive perceptions of the current situation than the other schools. These findings provided support for Hypothesis 2.2. There were no differences in organizational climate perceptions regarding ‘what should be’.
Table 1. Demographic Information
Variable Sample (N) Percentage (%) Variable Sample (N) Percentage (%)
School 23 10.7 Years of Service
School A 118 54.9 < 2 years 61 28.4
School B 44 20.5 3–4 years 43 20.0
School C 30 14.0 5–6 years 20 9.3
School D 7–8 years 14 6.5
Role 9–10 years 12 5.6
Staff Member 34 15.8 ≥ 10 years 65 30.2
Teacher 171 79.5 Religion
Administrator 10 4.7 Adventist (SDA) 169 78.6
Gender Other Christian 10 4.7
Male 78 36.3 Buddhist 32 14.9
Female 137 63.7 Other 4 1.9
Findings showed that employees across all four TAM schools differed according to their (H3.1) role,
(H3.2) gender, (H3.3) length of service, and/or (H3.4) religion. They exhibited differences in their current (what is) and expected (what should be) perceptions of school climate factors. Analysis showed their current perceptions partially supported Hypothesis H3.1 (Role) (p < .05).
Table 2. Organizational Climate Compared by Role
Organizational Climate Factor Current Situation What Should Be
F p F p
Cohesiveness 4.24* .02 2.33 .10
Morale 3.07* .05 1.66 .19
Growth 1.88 .16 0.93 .40
Trust 3.79* .02 0.89 .41
Respect 5.93** .00 1.23 .30
Caring 3.48* .03 1.24 .29
Spirituality 2.15 .12 0.18 .84
Resources 1.27 .28 0.79 .46
Conflict 1.53 .22 0.63 .53
Communication 2.30 .10 0.96 .38
Problem 2.63 .07 3.65* .03
Note. * mean difference is significant at the .05 level; ** mean difference is significant at the .01 level
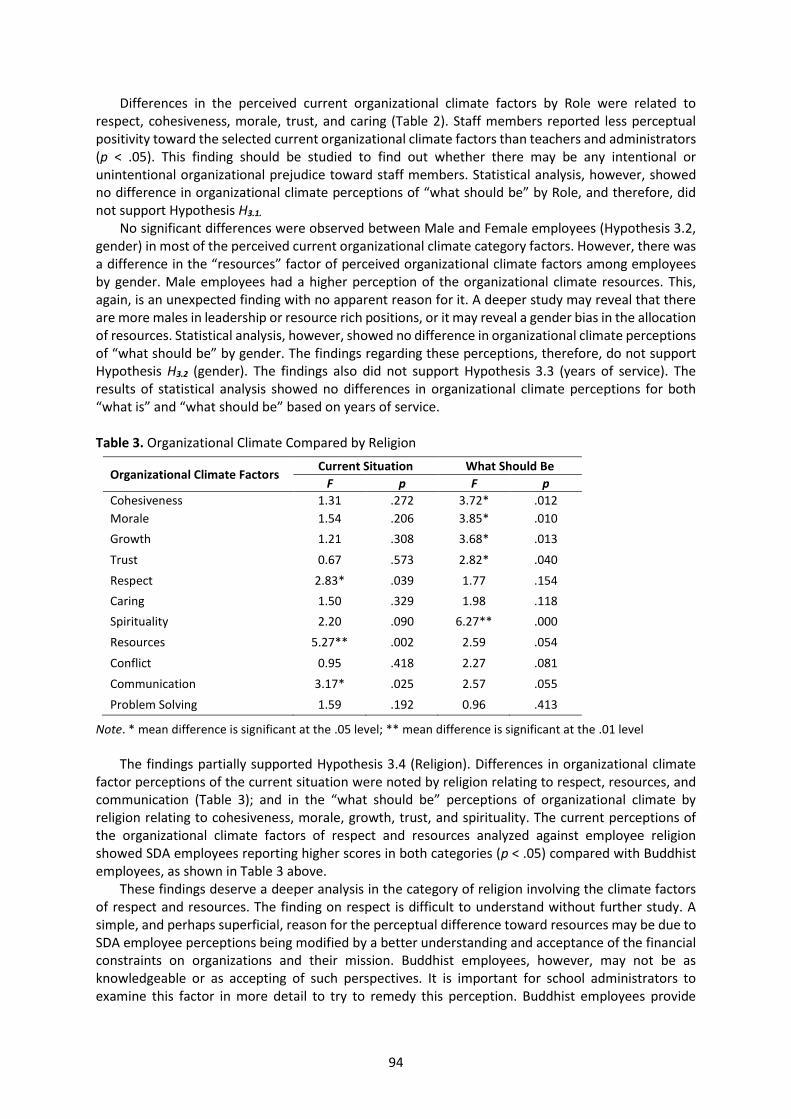
94
Differences in the perceived current organizational climate factors by Role were related to respect, cohesiveness, morale, trust, and caring (Table 2). Staff members reported less perceptual positivity toward the selected current organizational climate factors than teachers and administrators (p < .05). This finding should be studied to find out whether there may be any intentional or unintentional organizational prejudice toward staff members. Statistical analysis, however, showed no difference in organizational climate perceptions of “what should be” by Role, and therefore, did not support Hypothesis H3.1.
No significant differences were observed between Male and Female employees (Hypothesis 3.2, gender) in most of the perceived current organizational climate category factors. However, there was a difference in the “resources” factor of perceived organizational climate factors among employees by gender. Male employees had a higher perception of the organizational climate resources. This, again, is an unexpected finding with no apparent reason for it. A deeper study may reveal that there are more males in leadership or resource rich positions, or it may reveal a gender bias in the allocation of resources. Statistical analysis, however, showed no difference in organizational climate perceptions of “what should be” by gender. The findings regarding these perceptions, therefore, do not support Hypothesis H3.2 (gender). The findings also did not support Hypothesis 3.3 (years of service). The results of statistical analysis showed no differences in organizational climate perceptions for both “what is” and “what should be” based on years of service.
Table 3. Organizational Climate Compared by Religion
Organizational Climate Factors Current Situation What Should Be
F p F p
Cohesiveness 1.31 .272 3.72* .012
Morale 1.54 .206 3.85* .010
Growth 1.21 .308 3.68* .013
Trust 0.67 .573 2.82* .040
Respect 2.83* .039 1.77 .154
Caring 1.50 .329 1.98 .118
Spirituality 2.20 .090 6.27** .000
Resources 5.27** .002 2.59 .054
Conflict 0.95 .418 2.27 .081
Communication 3.17* .025 2.57 .055
Problem Solving 1.59 .192 0.96 .413
Note. * mean difference is significant at the .05 level; ** mean difference is significant at the .01 level
The findings partially supported Hypothesis 3.4 (Religion). Differences in organizational climate
factor perceptions of the current situation were noted by religion relating to respect, resources, and communication (Table 3); and in the “what should be” perceptions of organizational climate by religion relating to cohesiveness, morale, growth, trust, and spirituality. The current perceptions of the organizational climate factors of respect and resources analyzed against employee religion showed SDA employees reporting higher scores in both categories (p < .05) compared with Buddhist employees, as shown in Table 3 above.
These findings deserve a deeper analysis in the category of religion involving the climate factors of respect and resources. The finding on respect is difficult to understand without further study. A simple, and perhaps superficial, reason for the perceptual difference toward resources may be due to SDA employee perceptions being modified by a better understanding and acceptance of the financial constraints on organizations and their mission. Buddhist employees, however, may not be as knowledgeable or as accepting of such perspectives. It is important for school administrators to examine this factor in more detail to try to remedy this perception. Buddhist employees provide
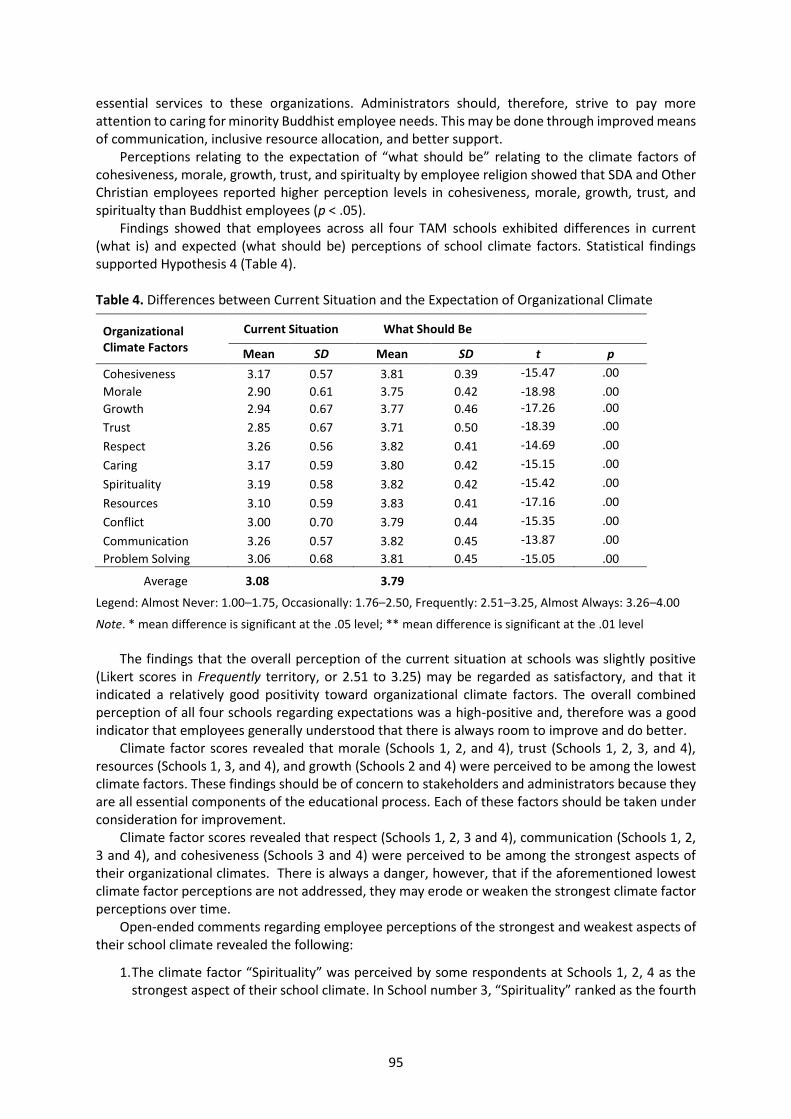
95
essential services to these organizations. Administrators should, therefore, strive to pay more attention to caring for minority Buddhist employee needs. This may be done through improved means of communication, inclusive resource allocation, and better support.
Perceptions relating to the expectation of “what should be” relating to the climate factors of cohesiveness, morale, growth, trust, and spiritualty by employee religion showed that SDA and Other Christian employees reported higher perception levels in cohesiveness, morale, growth, trust, and spiritualty than Buddhist employees (p < .05).
Findings showed that employees across all four TAM schools exhibited differences in current (what is) and expected (what should be) perceptions of school climate factors. Statistical findings supported Hypothesis 4 (Table 4). Table 4. Differences between Current Situation and the Expectation of Organizational Climate
Organizational Climate Factors
Current Situation What Should Be
Mean SD Mean SD t p
Cohesiveness 3.17 0.57 3.81 0.39 -15.47 .00
Morale 2.90 0.61 3.75 0.42 -18.98 .00
Growth 2.94 0.67 3.77 0.46 -17.26 .00
Trust 2.85 0.67 3.71 0.50 -18.39 .00
Respect 3.26 0.56 3.82 0.41 -14.69 .00
Caring 3.17 0.59 3.80 0.42 -15.15 .00
Spirituality 3.19 0.58 3.82 0.42 -15.42 .00
Resources 3.10 0.59 3.83 0.41 -17.16 .00
Conflict 3.00 0.70 3.79 0.44 -15.35 .00
Communication 3.26 0.57 3.82 0.45 -13.87 .00
Problem Solving 3.06 0.68 3.81 0.45 -15.05 .00
Average 3.08 3.79
Legend: Almost Never: 1.00–1.75, Occasionally: 1.76–2.50, Frequently: 2.51–3.25, Almost Always: 3.26–4.00
Note. * mean difference is significant at the .05 level; ** mean difference is significant at the .01 level
The findings that the overall perception of the current situation at schools was slightly positive
(Likert scores in Frequently territory, or 2.51 to 3.25) may be regarded as satisfactory, and that it indicated a relatively good positivity toward organizational climate factors. The overall combined perception of all four schools regarding expectations was a high-positive and, therefore was a good indicator that employees generally understood that there is always room to improve and do better.
Climate factor scores revealed that morale (Schools 1, 2, and 4), trust (Schools 1, 2, 3, and 4), resources (Schools 1, 3, and 4), and growth (Schools 2 and 4) were perceived to be among the lowest climate factors. These findings should be of concern to stakeholders and administrators because they are all essential components of the educational process. Each of these factors should be taken under consideration for improvement.
Climate factor scores revealed that respect (Schools 1, 2, 3 and 4), communication (Schools 1, 2, 3 and 4), and cohesiveness (Schools 3 and 4) were perceived to be among the strongest aspects of their organizational climates. There is always a danger, however, that if the aforementioned lowest climate factor perceptions are not addressed, they may erode or weaken the strongest climate factor perceptions over time.
Open-ended comments regarding employee perceptions of the strongest and weakest aspects of their school climate revealed the following:
1. The climate factor “Spirituality” was perceived by some respondents at Schools 1, 2, 4 as the strongest aspect of their school climate. In School number 3, “Spirituality” ranked as the fourth
96
strongest aspect, which may be of interest or concern to administrators. Furthermore, “Spirituality” did not feature in any school’s perceptions of its weakest aspects.
2. The school climate factor “Caring” was perceived to be one of the strongest aspects by all schools; furthermore, “Caring” did not feature in any school’s perceptions of its weakest aspects.
3. The school climate factor “Cohesiveness” ranked as the strongest aspect in Schools 3, and one of the strongest aspects in Schools 2 and 4. It should be noted, however, that “Cohesiveness” was also perceived to be among the weakest aspects by some observers in Schools 2 and 4, which may indicate contrasting or ambivalent perceptions of this climate factor that may be of interest or concern to administrators. Furthermore, the major negative perception expressed in School 4 regarding this factor was a group or clique mentality.
4. The school climate factor “Communication” was perceived to be a strong aspect by School 2 only; however, it was also perceived to be a weak aspect by Schools 2 and 4. This may indicate contrasting or ambivalent perceptions of this climate factor, which may be of interest or concern to administrators. Negative perceptions for School 4 regarding this factor primarily had to do with inadequate communication between administrators and teachers/staff.
5. The school climate factor “Resources” ranked as one of the weakest aspects across all schools, which may be of interest or concern to administrators. In Schools 1 and 4, a negative spread between positive and negative perceptions of this factor indicates a potential area of interest to administrators. The negative perceptions in School 4 regarding resources primarily had to do with insufficient space or room. School 3 shows potentially contrasting or ambivalent perceptions of resources, which may be of concern to administrators. Furthermore, the negative perceptions in School 4 regarding resources primarily had to do with the large number of students, along with insufficient teachers and classroom space.
6. The school climate factor “Morale” was not perceived to be a strong aspect in any of the schools; it was perceived to be among the weakest aspects at Schools 1, 2, and 3, which may be of interest or concern to administrators. Morale may be a potential area of interest to administrators in School 3, as negative perceptions in this factor primarily had to do with low salaries and insufficient benefits.
7. Employees at School 4 indicated that they perceived the strongest aspects of their school climate to be a family-like community with a high degree of harmonious cooperation, care, and spirituality.
8. Comments from employees at School 3 indicated that they perceived the strongest aspects of their school climate to be a family-like community, with a high degree of harmonious cooperation and a strong appreciation for their environment.
The findings in the open-ended comments indicate that spirituality was perceived to be among strongest factors in most schools, and that caring was perceived to be one of the strongest in all schools. This should be commended, insofar as the overall employee perception corresponds favorably with the organizational culture (mission and philosophy) at TAM schools. The findings that cohesiveness and communication featured as both strong and weak climate perceptions may be of concern. Of greater concern is the perception that resources ranked as one of the weakest aspects across all schools. Furthermore, it is should be of great concern that morale was not perceived to be a strong aspect in any of the schools, and was perceived to be among the weakest aspects at most schools. These open-ended findings appear to generally support the findings based on statistical analysis. Limitations and Implications
An inability to make a comparative analysis between biographical categories at each of the participating schools for this study was a limiting factor due to time constraints. Inability to receive surveys back from two schools within the allocated time period was another limiting factor. It is recommended that the format of the survey in future studies be slightly modified to make it more
97
user friendly by more clearly explaining, separating and identifying the “what is” and “what should be” columns. It is recommended that the survey be simplified with more direct statements for easier understanding and translation in future editions. Furthermore, the open-ended section of the survey can be modified to make it easier and simpler, thereby encouraging more respondent participation. It is recommended that miscellaneous comments from the open-ended section be evaluated for potential new factors to be included in future surveys. Future studies may include other stakeholders, such as board members and parents. References Ashkanasy, N., Wilderom, C., & Peterson, M. (2000). The handbook of organizational culture and climate. Sage. Griffin, R., & Moorhead, G. (2014). Organizational behavior: Managing people and organizations (11th ed.).
South-Western/Cengage Learning. Johnson, W., & Johnson, A. (1992). A study on the Kettering school climate scale. Education, 112(4), 635–639. Lozano, L. M., García-Cueto, E., & Muñiz, J. (2008). Effect of the number of response categories on the reliability
and validity of rating scales. Methodology: European Journal of Research Methods for the Behavioral and Social Sciences, 4(2), 73–79.
Payne, R. L., (2000). Climate and culture: How close can they get? In N. M. Ashkanasy, C. P. Wilderom, & M. F. Peterson, (Eds.), Handbook of organizational culture and climate (pp. 163–176). Sage.
Peterson, M., & Spencer, G. (1990). Understanding academic culture and climate. New Directions for Institutional Research, 17(4), 3–18.
Robbins, S., & Judge, T. (2013). Organizational behavior (15th ed.). Prentice Hall. Schein, E. (2000). Sense and nonsense about culture and climate. In N. M. Ashkanasy, C. P. Wilderom, & M. F.
Peterson, (Eds.). Handbook of organizational culture and climate (pp. xxiii–xxx). Sage. Schneider, B. (2000). The psychological life of organizations. In N. M. Ashkanasy, C. P. Wilderom, & M. F.
Peterson. (Eds.), Handbook of organizational culture and climate (pp. xvii–xxi). Sage. Stolp, S., & Smith, S. (1995). Transforming school culture: Stories, symbols, values & the leader's role.
https://eric.ed.gov/?id=ED386783 Stringer, R. (2002). Leadership and organizational climate: The cloud chamber effect. Prentice Hall. Yamane, T. (1967). Statistics: An introductory analysis (2nd ed.). Harper and Row.
Human Behavior, Development and Society ISSN 2651-1762, Vol 21 No 3, September 2020
98
The Development of Academic English Language Learning Strategies and Academic Motivation among International University Students in Thailand
Roger Oconnor Valenzuela and Darrin Thomas, Asia-Pacific International University, Thailand
Date Received: 19 April 2020 Revised: 26 August 2020 Accepted: 27 August 2020
Abstract
The development of academic English language learning strategies is an issue that university students face in their academic journey. This development also is affected by academic motivation. In this study the relationship between language learning strategies and academic motivation was explored. Using a cross-sectional survey design, with a sample of 100 participants taken from an international university located in Thailand, analysis indicated that the participants were mostly neutral in their perceptions towards language learning strategies. Other findings were the lack of gender differences in academic motivation or language learning strategies. In addition, a correlational analysis showed a strong positive relationship between language learning strategies and academic motivation. A multiple regression analysis suggested that language learning strategies explained 63% of the variance of academic motivation. However, gender did not constitute a significant explanatory variable for academic motivation.
Keywords: Language learning strategies, academic motivation, relationship, regression Introduction
English is becoming the predominant language of instruction at the tertiary level. The ASEAN community also has acknowledged the need for implementing English programs at different educational levels (Kitjaroonchai, 2013). Thailand, as a leading educational hub in Southeast Asia, not only welcomes teaching and learning in English but also hosts a growing number of international universities (Michael, 2018). Many international students from neighboring nations come to pursue a degree in Thailand because it is financially viable and attractive. In this context, international programs in Thailand become culturally enriching, having students, teachers, and staff from different parts of the world who use English as the lingua franca to facilitate instruction and communication.
However, international university students coming to Thailand might face the challenges that consist of adjusting to the use of English as a medium of instruction and the lingua franca with other international students, while adjusting to university life in a new country (e.g., Gardner & Lau, 2019). To better understand how international students adjust to the challenges of adjusting linguistically and academically, several investigators have explored the relationship between learning English and academic motivation among college students (Lee & Bong, 2019; Li et al., 2016). In Thailand, while research has been conducted on language learning strategies and academic motivation among Thai students at different educational levels using a quantitative approach (Kakaew & Damnet, 2017; Pipattarasakul & Singhasiri, 2018; Vibulphol, 2016), few studies have looked at how international students in Thailand, who have English as their second language, perceived the use of language learning strategies. Huang’s (2017) study represents the only known attempt. He examined how Chinese students used language learning strategies whilst studying in Thailand.
Broadly speaking, language learning strategies are tools used by students to acquire a language (Burns & Richards, 2018). Language learning strategies are relevant particularly to language learners who are still developing their proficiency. However, research suggests that many higher education students, who are non-native English speakers, show low levels of academic English proficiency even in their third or fourth year in international programs (Benzie, 2010). In addition, few studies have been completed in Thailand on the association between language learning strategies and academic motivation. Such work has documented the use of language learning strategies, but not in conjunction with the specific form of motivation discussed in this study, which is academic motivation. Therefore,
99
we sought to explore the relationship between language learning strategies and academic motivation among international university students in Thailand. Understanding how strategies for learning English are related to academic motivation may help teachers to guide students in the process of teaching content in a second language among college students in international universities.
The following questions were developed for this study: 1. What are the students’ perception of their strategies for learning English and their academic
motivation? 2. Is there a difference in language learning strategies and academic motivation based on
gender? 3. What is the relationship of language learning strategies and gender to academic motivation?
Review of Literature Language Learning Strategies (LLS)
Thomas and Rose (2019) recognized that coming up with a definition for language learning strategies has not been easy among experts in the field of TESOL over the last few decades. However, scholars agree that language learning strategies refer to the actions learners employ to improve the development of their language (Cawagdan-Cuarto & Rivera, 2018). Burns and Richards (2018) stated that language learning strategies (LLS) are understood as “purposeful mental actions used by a learner to regulate his or her second or foreign language (L2) learning” (p. 81). Language learning strategies also are considered a means to facilitate the acquisition of language and the use of information learners received, stored, and recalled (Hardan, 2013).
Some theories have been developed to understand language learning strategies in a better way. Phenomenography, besides being a well-accepted qualitative research technique, in recent years has become an important theory that seeks to explain how students go through the process of learning a second language by looking at the interaction between the population and the phenomenon (Chan, 2017). In this sense, the phenomenographic model also explores the learner’s perceptions of acquiring a second language and how they affect or influence the content learned (Norberg et al., 2018; Polat, 2013). Another important theoretical framework is self-directed learning (SDL) theory, which sets the learner, neither the content nor the teacher, as the guide in the process of acquiring new knowledge by setting goals and monitoring their own learning pace (Manning, 2007; Tekkol & Demirel, 2018). This theory has been linked with the notion of independent learning at different educational levels, which raises some questions about needs versus interests on the students’ side (Manning, 2007). There is an association between language learning strategies and self-directed learning theory, since the usage of technology and online training platforms in many educational institutions is a part of the students’ learning experience (Lai et al., 2016). Based on the findings of prior studies and the theories that have been developed already, it is significant to consider if similar ideas hold in the Thai context.
Several sources show that language learning strategies are closely related to students’ experiences and what they consider will be effective for them. A study conducted among university students in Mongolia indicated that using their mother tongue was the students’ first strategy when trying to read, write, or speak in English (Zhao, 2019). College students elsewhere may be interested in listening to music in English, learning the correct pronunciation of words, and developing a richer vocabulary while adopting English as their second language (Bravo et al., 2017). According to research conducted by Nguyen and Terry (2017), students felt that memorizing, repeating, or completing grammar exercises were not effective strategies for acquiring English as a second language. However, speaking English seemed to be highly esteemed by students who were willing to communicate and learn from their mistakes (Oveisi & Nosratinia, 2019). Each of the studies provide examples of language learning strategies that have been employed by students. Academic Motivation
The relationship between language learning and academic motivation was established by Gardner and his associates (see meta-analysis by Masgoret & Gardner, 2003). Academic motivation is
100
conceived as an amalgam of personality dispositions, goals, and varying states of arousal (Campbell, 1973). Khalid Sawalha et al. (2017) considered motivation as one of the key factors affecting what students do and how well they do it. Utvaer and Haugan (2016) went a step further and stated that a human being can be externally and internally motivated, with the latter leading to acting or displaying certain behaviors.
There are several theories of motivation that have looked at motivation in general. For example, self-determination theory (Deci & Ryan, 2010) holds that individuals are in control of their “behavior and personality development” as they experience different “types of motivation” (Ryan & Deci, 2017, p. 3). Goal theory approaches the problem from a different perspective (Pintrich & Schunk, 2002). Its focus is on “the goals students pursue for their course or academic tasks, contrasting mastery goals and performance goals, which represents different reasons for engaging in a task and use different standards for defining success” (Senko, 2016, p. 75). In other words, in self-determination theory the attempt is to explain motivation from an individual perspective that gives no consideration to external intervention, while goal theory focuses on objectives or goals set by the individual. Both theories represent individualistic approaches that stress intrinsic motivation. Students who learn English in the academic context may experience these forms of motivation as they seek effective language learning strategies (Lee & Bong, 2019). However, none of these studies was completed in the context of mainland Southeast Asia.
Studies have shown that a variety of extrinsic and intrinsic factors may be relevant to students’ academic motivation. Rowell and Hong (2013) pointed out that school environment, teacher’s views, and values learned at home have an important influence on student motivation. This is supported by another study where it was found that the student-teacher relationship had a positive impact on academic motivation (Trolian et al., 2016). While these previous investigators concentrated their efforts on extrinsic motivational factors, Ross et al. (2016) indicated that intrinsic motivational factors, such as knowing how to find relevant information while reading, were closely related to academic motivation. In a study conducted by Khazaie and Mesbah (2014), they explored how motivational orientations in the academic setting were related to language learning strategies. They pointed out that extrinsic motivation was the most common motivational orientation, and social strategy the most frequently used language learning strategy.
An aspect that may be considered, especially in the context of language learning and academic motivation, is gender. Gender differences have been found to be related to motivation. One study found differences by gender among university students while another study found differences among adolescent girls of different ages (Bonneville-Roussy et al., 2017; Bugler et al., 2016). However, consensus does not exist on the role of gender and motivation, as shown in a meta-analysis undertaken by Turhan (2020). Given the comprehensive nature of meta-analysis, there was evidence that gender may not be a strong predictor of academic motivation.
On another note, there is a considerable body of research on academic motivation in the Asian context. Several studies have been conducted within the context of Asia, but not specifically in Thailand, where the relationship between academic motivation and language learning strategies has been examined. A study in Japan found that there was a difference in the language learning strategies of highly motivated students in contrast to students who were not highly motivated (Damayanti et al., 2018). In Indonesia, researchers found a relationship between learning strategies and motivation in the context of writing achievement (Nasihah & Cahyono, 2017). Lastly, studies conducted in China showed that language learning strategies mediated the relationship between motivation and language knowledge and that there were academic motivational differences between genders (You et al., 2016; Zhang et al., 2017).
Based on the review of literature, it can be surmised that language learning strategies are tools used by learners in the process of acquiring a new language. Academic motivation is a mix of attitudes that are affected by extrinsic and intrinsic factors. To better understand how international students adjust to a new language and a different academic setting, we sought to explore the association between language learning strategies and academic motivation.
101
Methodology Context and Participants
The participants for this study were taken from an international university located in Thailand. Students from Myanmar, Vietnam, Indonesia, Cambodia, Malaysia, South Africa, China, and Thailand participated. Convenience sampling was employed to gather data from 100 participants who were part of the university’s international program. Of all the participants, 57% were male and 43% female. Most of the participants were sophomore students (41%), followed by juniors, seniors, and freshmen—28%, 19%, and 11%, respectively. In terms of majors, Education students constituted the majority of the participants (32%). Business majors made up 27% of participants, while Religion, English, and Science students were more sparsely represented—24%, 16%, and 1%, respectively.
Research Design In this study a cross-sectional survey design was employed to collect data at a specific moment in
time. This is a useful approach when there are limits to cost and the amount of time that can be spent conducting research. Teachers were asked to administer and collect the survey in different classrooms. The instrument was bisectional. The first section addressed the demographic information of the respondents, which included their class level, gender, and major. The second section consisted of 56 Likert-type items that measured the students’ perception of language learning strategies and academic motivation. A five-point scale (1 = strongly disagree, 2 = disagree, 3 = neutral, 4 = agree, and 5 = strongly agree) was used to measure the two variables previously mentioned.
Language Learning Strategy Scale The language learning strategy scale was adopted from Habók and Magyar (2018). This scale
evaluated a participant’s experience and attitude when choosing strategies for learning English as a second language and thus provides insights into student perceptions in their use of language learning strategies. Sample items from this scale were “I use new English words I know in different ways” and “I notice if I am tense or nervous when I am studying or using English.” The Cronbach alpha for this scale was .95.
Academic Motivation Scale The academic motivation scale was adopted from Pintrich and De Groot (1990). This scale
assessed a participant’s experience and attitude toward their academic journey and provided understanding into the level of engagement students had towards academic information. Sub-constructs measured in this scale included self-efficacy, intrinsic value, and test anxiety. Sample items included “I am sure I can do an excellent job on the problems and tasks assigned for this class,” “It is important for me to learn what is being taught in this class,” and “I worry a great deal about tests.” The Cronbach alpha for this scale was .88.
Data Analysis Descriptive data were analyzed by the calculation of the mean and standard deviation for the
observed variables in order to address research question one. A t-test was conducted to determine if there was a difference between language learning strategies and academic motivation based on gender in order to address research question two. Lastly, the correlation among the variables was calculated as well as performing a regression analysis to determine the strength of the association with academic motivation as the dependent variable and language learning strategies and gender as the independent variables in order to address research question three. Normality was check through a visual inspection of histograms and plots.
Ethics The Internal Board Review Committee approved the research project. Every respondent that
answered the survey did so voluntarily. Lastly, the process of data collection did not put the participants’ physical or mental health at risk.
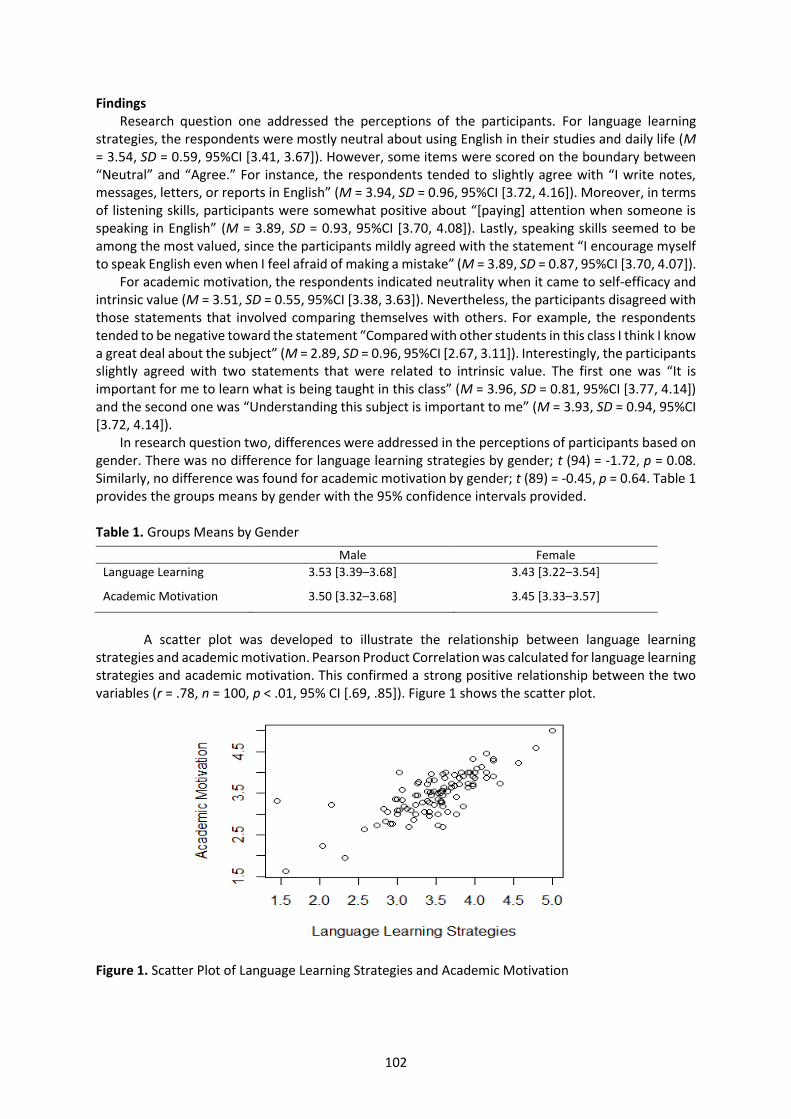
102
Findings Research question one addressed the perceptions of the participants. For language learning
strategies, the respondents were mostly neutral about using English in their studies and daily life (M = 3.54, SD = 0.59, 95%CI [3.41, 3.67]). However, some items were scored on the boundary between “Neutral” and “Agree.” For instance, the respondents tended to slightly agree with “I write notes, messages, letters, or reports in English” (M = 3.94, SD = 0.96, 95%CI [3.72, 4.16]). Moreover, in terms of listening skills, participants were somewhat positive about “[paying] attention when someone is speaking in English” (M = 3.89, SD = 0.93, 95%CI [3.70, 4.08]). Lastly, speaking skills seemed to be among the most valued, since the participants mildly agreed with the statement “I encourage myself to speak English even when I feel afraid of making a mistake” (M = 3.89, SD = 0.87, 95%CI [3.70, 4.07]).
For academic motivation, the respondents indicated neutrality when it came to self-efficacy and intrinsic value (M = 3.51, SD = 0.55, 95%CI [3.38, 3.63]). Nevertheless, the participants disagreed with those statements that involved comparing themselves with others. For example, the respondents tended to be negative toward the statement “Compared with other students in this class I think I know a great deal about the subject” (M = 2.89, SD = 0.96, 95%CI [2.67, 3.11]). Interestingly, the participants slightly agreed with two statements that were related to intrinsic value. The first one was “It is important for me to learn what is being taught in this class” (M = 3.96, SD = 0.81, 95%CI [3.77, 4.14]) and the second one was “Understanding this subject is important to me” (M = 3.93, SD = 0.94, 95%CI [3.72, 4.14]).
In research question two, differences were addressed in the perceptions of participants based on gender. There was no difference for language learning strategies by gender; t (94) = -1.72, p = 0.08. Similarly, no difference was found for academic motivation by gender; t (89) = -0.45, p = 0.64. Table 1 provides the groups means by gender with the 95% confidence intervals provided. Table 1. Groups Means by Gender
Male Female
Language Learning 3.53 [3.39–3.68] 3.43 [3.22–3.54]
Academic Motivation 3.50 [3.32–3.68] 3.45 [3.33–3.57]
A scatter plot was developed to illustrate the relationship between language learning
strategies and academic motivation. Pearson Product Correlation was calculated for language learning strategies and academic motivation. This confirmed a strong positive relationship between the two variables (r = .78, n = 100, p < .01, 95% CI [.69, .85]). Figure 1 shows the scatter plot.
Figure 1. Scatter Plot of Language Learning Strategies and Academic Motivation
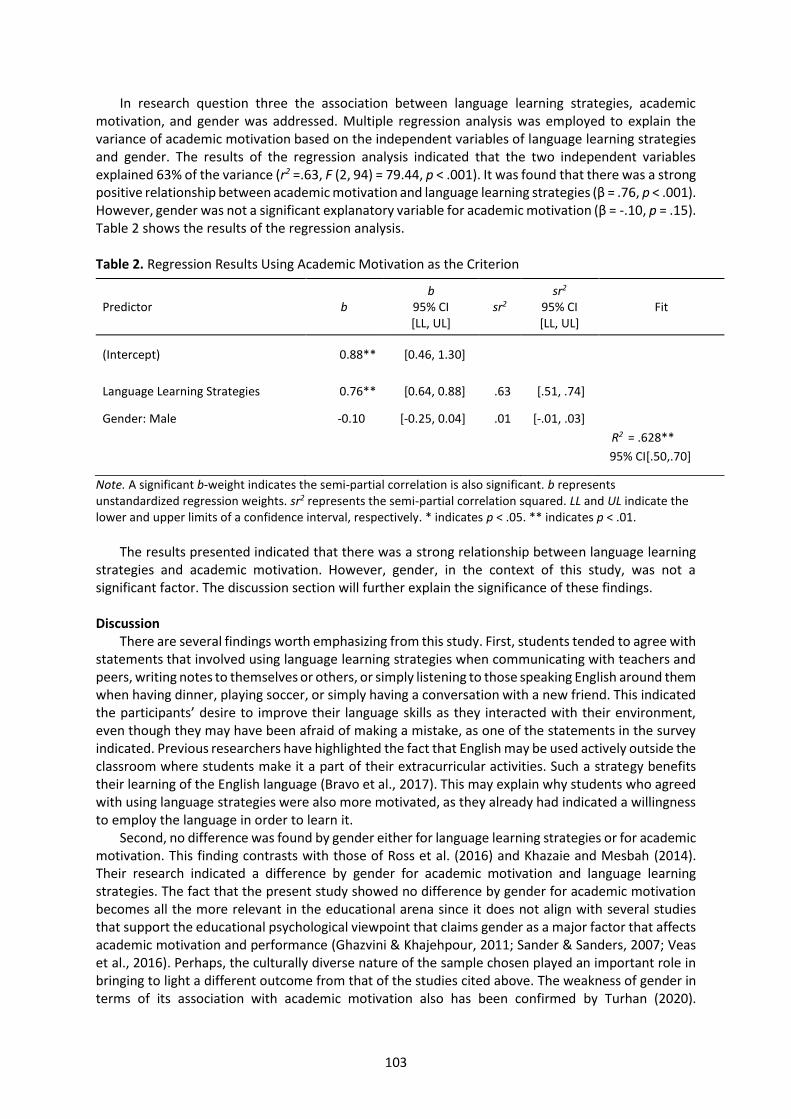
103
In research question three the association between language learning strategies, academic motivation, and gender was addressed. Multiple regression analysis was employed to explain the variance of academic motivation based on the independent variables of language learning strategies and gender. The results of the regression analysis indicated that the two independent variables explained 63% of the variance (r2 =.63, F (2, 94) = 79.44, p < .001). It was found that there was a strong positive relationship between academic motivation and language learning strategies (β = .76, p < .001). However, gender was not a significant explanatory variable for academic motivation (β = -.10, p = .15). Table 2 shows the results of the regression analysis. Table 2. Regression Results Using Academic Motivation as the Criterion
Note. A significant b-weight indicates the semi-partial correlation is also significant. b represents unstandardized regression weights. sr2 represents the semi-partial correlation squared. LL and UL indicate the lower and upper limits of a confidence interval, respectively. * indicates p < .05. ** indicates p < .01.
The results presented indicated that there was a strong relationship between language learning
strategies and academic motivation. However, gender, in the context of this study, was not a significant factor. The discussion section will further explain the significance of these findings. Discussion
There are several findings worth emphasizing from this study. First, students tended to agree with statements that involved using language learning strategies when communicating with teachers and peers, writing notes to themselves or others, or simply listening to those speaking English around them when having dinner, playing soccer, or simply having a conversation with a new friend. This indicated the participants’ desire to improve their language skills as they interacted with their environment, even though they may have been afraid of making a mistake, as one of the statements in the survey indicated. Previous researchers have highlighted the fact that English may be used actively outside the classroom where students make it a part of their extracurricular activities. Such a strategy benefits their learning of the English language (Bravo et al., 2017). This may explain why students who agreed with using language strategies were also more motivated, as they already had indicated a willingness to employ the language in order to learn it.
Second, no difference was found by gender either for language learning strategies or for academic motivation. This finding contrasts with those of Ross et al. (2016) and Khazaie and Mesbah (2014). Their research indicated a difference by gender for academic motivation and language learning strategies. The fact that the present study showed no difference by gender for academic motivation becomes all the more relevant in the educational arena since it does not align with several studies that support the educational psychological viewpoint that claims gender as a major factor that affects academic motivation and performance (Ghazvini & Khajehpour, 2011; Sander & Sanders, 2007; Veas et al., 2016). Perhaps, the culturally diverse nature of the sample chosen played an important role in bringing to light a different outcome from that of the studies cited above. The weakness of gender in terms of its association with academic motivation also has been confirmed by Turhan (2020).
Predictor b b
95% CI [LL, UL]
sr2 sr2
95% CI [LL, UL]
Fit
(Intercept) 0.88** [0.46, 1.30]
Language Learning Strategies 0.76** [0.64, 0.88] .63 [.51, .74]
Gender: Male -0.10 [-0.25, 0.04] .01 [-.01, .03]
R2 = .628**
95% CI[.50,.70]
104
Therefore, men and women may be motivated differently but in the context of learning a language, the overall amount of motivation is the same.
Third, there was a strong positive relationship between language learning strategies and academic motivation. This finding points to seeing language learning strategies as an influential factor for academic motivation. In other words, the more engaged students are in developing their speaking, reading, writing, and listening skills through effective strategies, the higher their academic motivation levels. Nguyen and Terry (2017) asserted that language learning strategies played a major role in the students’ academic journey, which confirms the finding previously mentioned. This indicates that students may need to be motivated and/or given strategies for learning a language in order to enjoy academic success. Recommendations and Conclusions
Several recommendations can be given from this study in the context of international universities in Thailand. First, teachers might encourage the use of language learning strategies in the classroom and outside of it to keep their students academically motivated. For example, when coming across a new or difficult word for the students, educators may ask students to search for the word’s meaning on the internet, deconstruct the word, and share the information with the rest of the class. Students might do the same when reading or participating in a conversation that they could not understand fully on account of an unknown word. Such an experience could help students find this learning strategy beneficial and also motivating, giving them a clearer understanding of the language content. Since many third and fourth year students have low levels of academic English proficiency in the context of international universities (Benzie, 2010), it is important that students work on the development of academic English language learning strategies by being more proactive when dealing with unknown terminologies. Such an approach is not only in agreement with the findings of prior studies but also supports the idea that teachers may guide students by asking them to find relevant strategies for enhancing their language learning (Khazaie & Mesbah, 2014; Thomas & Rose, 2019).
Second, students at the tertiary level could use language learning strategies in a more effective way if they evaluated their own work and focused on “correcting their own mistakes” (Cawagdan-Cuarto & Rivera, 2018, p. 151). After students realize, either by themselves or with the help of a teacher, that they are using a word improperly when speaking or writing, they could look for examples that showed the correct usage of the word and implement the discovery in future conversations or essays. This would enhance their understanding of the English language and show the value of language learning strategies. Finally, international university teachers could motivate and help their students by using technology as part of the language learning strategies available in the classroom, giving students the chance to work with online English laboratories that enhance their speaking, reading, and writing skills (Lai et al., 2016).
The purpose of this study was to explore the relationship between language learning strategies and academic motivation. The relationship between language learning strategies and academic motivation was positive and strong. The most important contribution of this study is that language learning strategies is a primary explanatory variable of academic motivation. In this sense, teachers at international universities can know that language learning strategies are closely connected to academic motivation, which is something that should encourage them to share effective strategies for learning English with their students. Limitations and Future Research
The fact that this study was correlational in nature leads to accepting it lacks the ability to establish any cause-and-effect relationship between the independent and dependent variables present in the model. Another limitation would be that the results came from a sample taken from one university. Therefore, it is critical to understand that generalizability is restrained to a context similar to that undertaken in this study. On the other hand, future studies could explore whether students from
105
different backgrounds residing in the same learning environment share the same language learning strategies and/or levels of motivation.
With regard to further study, it would be valuable to explore not only the relationship between language learning strategies and academic motivation but to also check whether students from different backgrounds and residing in the same learning environment used the same language learning strategies and/or exhibited the same level of motivation. In this sense, looking at the association among different subsamples coming from different cultures may give teachers and students at the tertiary level relevant insights about how second language content can be taught and learned at international universities while considering the particular background of the students. References Benzie, H. J. (2010). Graduating as a ‘native speaker’: International students and English language proficiency
in higher education. Higher Education Research & Development, 29(4), 447–459. https://doi.org/10.1080/07294361003598824
Bonneville-Roussy, A., Evans, P., Verner-Filion, J., Vallerand, R. J., & Bouffard, T. (2017). Motivation and coping with the stress of assessment: Gender differences in outcomes for university students. Contemporary Educational Psychology, 48, 28–42. https://doi.org/10.1016/j.cedpsych.2016.08.003
Bravo, J. C., Intriago, E. A., Holguín, J. V., Garzon, G. M., & Arcia, L. O. (2017). Motivation and autonomy in learning English as foreign language: A case study of Ecuadorian college students. English Language Teaching, 10(2), 100–113.
Bugler, M., McGeown, S., & Clair-Thompson, H. S. (2016). An investigation of gender and age differences in academic motivation and classroom behaviour in adolescents. Educational Psychology, 36(7), 1196–1218. https://doi.org/10.1080/01443410.2015.1035697
Burns, A., & Richards, J. C. (2018). The Cambridge guide to learning English as a second language. Cambridge University Press.
Campbell, E. M. (1973). A conceptualization of academic motivation and its implications for classroom teachers. Australian Journal of Education, 17(3), 276–288. https://doi.org/10.1177/000494417301700305
Cawagdan-Cuarto, H. C., & Rivera, E. E. (2018). Influence of language learning strategies to the English proficiency test performance of college students. JPAIR Multidisciplinary Research, 32(1), 149–163. https://doi.org/10.7719/jpair.v32i1.580
Chan, M. L. (2017). A phenomenographic study of medical students’ strategies in learning English. Educational Research International, 6(4), 20–28.
Damayanti, L., Sibuea, A. M., & Murad, A. (2018, December). The effect of learning strategies and motivation of Japanese language learning towards Japanese’s learning outcomes [Paper presentation]. The 3rd Annual International Seminar on Transformative Education and Educational Leadership (AISTEEL 2018) (pp. 192–195). Atlantis Press. https://doi.org/10.2991/aisteel-18.2018.41
Deci, E. L., & Ryan, R. M. (2010). Self-determination. In the Corsini encyclopedia of psychology (pp. 1–2). https://doi.org/10.1002/9780470479216.corpsy0834
Gardner, D., & Lau, K. (2019). One international university, two perspectives: The role of English as a lingua franca as perceived by Mainland and Hong Kong Chinese students. Compare: A Journal of Comparative and International Education, 49(2), 192–210.
Ghazvini, S. D., & Khajehpour, M. (2011). Gender differences in factors affecting academic performance of high school students. Procedia - Social and Behavioral Sciences, 15, 1040–1045. https://doi.org/10.1016/j.sbspro.2011.03.236
Habók, A., & Magyar, A. (2018). Validation of a self-regulated foreign language learning strategy questionnaire through multidimensional modelling. Frontiers in Psychology, 9, 1–11. https://doi.org/10.3389/fpsyg.2018.01388
Hardan, A. A. (2013). Language learning strategies: A general overview. Procedia - Social and Behavioral Sciences, 106, 1712–1726. https://doi.org/10.1016/j.sbspro.2013.12.194
Huang, Z. (2017). Second language learning strategies (LLSs) used by Chinese students at Assumption University, Thailand: An ecological perspective. Rangsit Journal of Educational Studies, 4(1), 1–2. https://doi.org/10.14456/RJES.2017.1
Kakaew, J., & Damnet, A. (2017). Learning strategies model to enhance Thai undergraduate students’ self-efficacy beliefs in EIL textual reading performance. Advances in Language and Literary Studies, 8(6), 19–27. https://doi.org/10.7575/aiac.alls.v.8n.6p.19
106
Khazaie, Z. M., & Mesbah, Z. (2014). The relationship between extrinsic vs. intrinsic motivation and strategic use of language of Iranian intermediate EFL learners. Theory and Practice in Language Studies, 4(1), 99–109. https://doi.org/10.4304/tpls.4.1.99-109
Kitjaroonchai, N. (2013). Motivation toward English language learning of students in secondary and high schools in education service area office 4, Saraburi province, Thailand. International Journal of Language and Linguistics, 1(1), 22. https://doi.org/10.11648/j.ijll.20130101.14
Lai, C., Shum, M., & Tian, Y. (2016). Enhancing learners’ self-directed use of technology for language learning: The effectiveness of an online training platform. Computer Assisted Language Learning, 29(1), 40–60. https://doi.org/10.1080/09588221.2014.889714
Lee, M., & Bong, M. (2019). Relevance of goal theories to language learning research. System, 86, 102122. https://doi.org/10.1016/j.system.2019.102122
Li, M., Yu, L., Qin, Y., Lu, P., & Zhang, X. (2016). College student academic motivation and engagement in the college English course. Theory and Practice in Language Studies, 6(9), 1767–1773. https://doi.org/10.17507/tpls.0609.07
Manning, G. (2007). Self-directed learning: A key component of adult learning theory. Business and Public Administration Studies, 2(2), 104–115.
Masgoret, A. M., & Gardner, R. C. (2003). Attitudes, motivation, and second language learning: A meta‐analysis of studies conducted by Gardner and associates. Language learning, 53(S1), 167–210.
Michael, R. (2018). Education in Thailand. WENR World Education News + Reviews. https://wenr.wes.org/2018/02/education-in-thailand-2
Nasihah, M., & Cahyono, B. (2017). Language learning strategies, motivation, and writing achievement of Indonesian EFL students. Arab World English Journal, 8(1). https://dx.doi.org/10.2139/ssrn.2945905
Nguyen, H., & Terry, D. R. (2017). English learning strategies among EFL learners: A narrative approach. IAFOR Journal of Language Learning, 3(1). https://doi.org/10.22492/ijll.3.1.01
Norberg, C., Vikström, A., & Kirby, E. P. (2018). Secondary school students’ understanding of and strategies for vocabulary acquisition: A phenomenographic approach to language learning. Journal of Language Teaching and Research, 9(5), 895–904. https://doi.org/10.17507/jltr.0905.02
Oveisi, M., & Nosratinia, M. (2019). The relationship among EFL learners’ self-directed learning, resilience, and willingness to communicate. Journal of Language and Translation, 9(4), 77–91.
Pintrich, P. R., & De Groot, E. V. (1990). Motivational and self-regulated learning components of classroom academic performance. Journal of Educational Psychology, 82(1), 33–40.
Pintrich, P. R., & Schunk, D. H. (2002). Motivation in education: Theory, research, and applications. Merrill. Pipattarasakul, P., & Singhasiri, W. (2018). Metastrategies employed by science and engineering EFL learners in
a speaking task. The Journal of AsiaTEFL, 15(1), 66–81. https://doi.org/10.18823/asiatefl.2018.15.1.5.66 Polat, B. (2013). Experiencing language: Phenomenography and second language acquisition. Language
Awareness, 22(2). https://www.tandfonline.com/doi/abs/10.1080/09658416.2012.658811 Ross, M., Perkins, H., & Bodey, K. (2016). Academic motivation and information literacy self-efficacy: The
importance of a simple desire to know. Library & Information Science Research, 38(1), 2–9. https://doi.org/10.1016/j.lisr.2016.01.002
Rowell, L., & Hong, E. (2013). Academic motivation: Concepts, strategies, and counseling approaches. Professional School Counseling, 16, 158–171. https://doi.org/10.5330/PSC.n.2013-16.158
Ryan, R. M., & Deci, E. L. (2017). Self-determination theory: Basic psychological needs in motivation, development, and wellness. Guilford Press.
Sander, P., & Sanders, L. (2007). Gender, psychology students and higher education. Psychology Learning & Teaching, 6(1), 33–36. https://doi.org/10.2304/plat.2007.6.1.33
Sawalha, K., Ali, M. A., Sawalha, A., Ko, H., Abdelli, I., Shawish, S. E., & Hussien, A. (2017). Factors influencing academic motivation among UOS medical students. Journal of Health Science, 5, 177–180. https://doi.org/10.17265/2328-7136/2017.04.004
Senko, C. (2016). Achievement goal theory: A story of early promises, eventual discords, and future possibilities. In K. R. Wentzel & D. B. Miele (Eds.), Handbook of Motivation at School (pp. 75–95). Routledge.
Tekkol, İ. A., & Demirel, M. (2018). An investigation of self-directed learning skills of undergraduate students. Frontiers in Psychology, 9. https://doi.org/10.3389/fpsyg.2018.02324
Thomas, D. (2019). Segmentation of tertiary non-native English speaking students’ language learning strategies. ABAC Journal, 39(1). http://www.assumptionjournal.au.edu/index.php/abacjournal/article/view/3730
107
Thomas, N., & Rose, H. (2019). Do language learning strategies need to be self‐directed? Disentangling strategies from self‐regulated learning. TESOL Quarterly, 53(1), 248–257. https://doi.org/10.1002/tesq.473
Trolian, T. L., Jach, E. A., Hanson, J. M., & Pascarella, E. T. (2016). Influencing academic motivation: The effects of student–faculty interaction. Journal of College Student Development, 57(7), 810–826. https://doi.org/10.1353/csd.2016.0080
Turhan, N. S. (2020). Gender differences in academic motivation: A meta-analysis. International Journal of Psychology and Educational Studies, 7(2), 211–224.
Utvær, B. K. S., & Haugan, G. (2016). The academic motivation scale: Dimensionality, reliability, and construct validity among vocational students. Nordic Journal of Vocational Education and Training, 6(2), 17–45. https://doi.org/10.3384/njvet.2242-458X.166217
Veas, A., Gilar, R., & Miñano, P. (2016). The influence of gender, intellectual ability, academic self-concept, self-regulation, learning strategies, popularity and parent involvement in early adolescence. International Journal of Information and Education Technology, 6(8), 591–597. https://doi.org/10.7763/IJIET.2016.V6.757
Vibulphol, J. (2016). Students’ motivation and learning and teachers’ motivational strategies in English classrooms in Thailand. English Language Teaching, 9(4), 64–75. https://doi.org/10.5539/elt.v9n4p64
You, C., Dörnyei, Z., & Csizér, K. (2016). Motivation, vision, and gender: A survey of learners of English in China. Language Learning, 66(1), 94–123. https://doi.org/10.1111/lang.12140
Zhang, Y., Lin, C.-H., Zhang, D., & Choi, Y. (2017). Motivation, strategy, and English as a foreign language vocabulary learning: A structural equation modelling study. British Journal of Educational Psychology, 87(1), 57–74. https://doi.org/10.1111/bjep.12135
Zhao, X. (2019). A study on English learning strategies used by Mongolian university students. In C. Huang, J. Wang, & Han, Y (Eds.), The 4th International Conference on Humanities Science, Management and Education Technology (HSMET 2019) (pp. 506–511). Atlantis Press. https://doi.org/10.2991/hsmet-19.2019.94
Human Behavior, Development and Society ISSN 2651-1762, Vol 21 No 3, September 2020
108
Human Behavior, Development and Society Statement of Publication Ethics
“The publication of an article in a peer-reviewed journal is an essential building block in the development of a coherent and respected network of knowledge. It is a direct reflection of the quality of the work of the authors and the institutions that support them. Peer-reviewed articles support and embody the scientific method. It is therefore important to agree upon standards of expected ethical behavior for all parties involved in the act of publishing: the author, the journal editors, and the peer reviewer.” (Elsevier, Publishing Ethics Guidelines) DUTIES OF AUTHORS
Original Work: Human Behavior, Development and Society expects that manuscripts submitted to be considered for publication are the author(s) own original work, are not currently under review elsewhere, and have not been previously published in any language. Manuscripts should not “recycle” essentially the same material that has been published elsewhere. Turnitin software is used to check for plagiarism and/or previous publication, and Human Behavior, Development and Society rejects articles that have substantial proportions of text that are copied from other sources.
Authorship: The names of authors appearing on manuscripts should be limited to individuals who have made significant contributions to the article. Individuals who have provided technical assistance or support may be thanked by mentioning their contributions in the Acknowledgements. The corresponding author should ensure that all co-authors have seen and approved the final version of the paper, and have agreed to its submission for publication.
Accuracy: Authors of original research papers should present an accurate account of their work along with an objective discussion of its significance. Underlying data should be represented accurately in the paper; adding data or removal of outlier results are unacceptable. Conclusions should be based on evidence presented in the paper, not on personal opinions.
Errors: If significant errors/inaccuracies become apparent after an article has already been submitted, Human Behavior, Development and Society expects authors to immediately contact the Editorial Staff so that appropriate corrections may be made in a timely manner.
Acknowledgement of Sources: A research paper builds upon previously published work. Author(s) should paraphrase ideas or results that have been previously published elsewhere in their own words, along with citing these works in the paper and listing them in the references. Making statements of facts or ideas without citing evidence to back up these statements is not good research practice.
Disclosure of Financial Support and Conflicts of Interest: Financial support received for research and the paper writing process should be disclosed in the acknowledgments, and any potential conflicts of interest must be disclosed to the Human Behavior, Development and Society editorial team when a manuscript is first submitted.
Protection of Human Subjects: Human Behavior, Development and Society expects that experiments using human subjects have been conducted in compliance with international standards and research protocols, and that they received prior review and approval from an Institutional Review Board (IRB) or ethics committee. Such approval and the approving entity’s name should be specified in the Methods section. DUTIES OF EDITORS
Confidentiality: The editors of Human Behavior, Development and Society use a “double-blind” peer review process, where neither authors nor reviewers know each other’s identity. The editors endeavor to protect the identity of author(s) and reviewers throughout the review process. Unpublished materials from a submitted manuscript must not be quoted or referenced by an editor without the
109
express written consent of the author. Information or ideas obtained through peer review must be kept confidential and not used for personal advantage.
Objectivity: Decisions on publication are made objectively by the Human Behavior, Development and Society Administrative Board after reviewing the submitted manuscript and the peer reviews. The importance of the article’s contribution to the existing research in its field, the quality of articulation of the argument, and the strength of evidence provided are critical factors in the decision to publish.
Conflicts of Interest: Editors are not allowed to publish or co-publish articles that appear in Human Behavior, Development and Society, and they must recuse themselves from the review process when they have a conflict of interest or personal stake in the publication of a research article. DUTIES OF REVIEWERS
Confidentiality: Reviewers should respect the confidentiality of the review process. They should not discuss aspects of the work under review with other researchers until after an article is published. Unpublished materials disclosed in a manuscript under review must not be quoted or referenced by a reviewer without the express written consent of the author, requested through the editor. Information or ideas obtained through peer review must be kept confidential and not used for personal advantage.
Objectivity: Manuscripts should be reviewed objectively in the context of the reviewer’s expertise in the field. The importance of the article’s contribution to the existing research in its field, the quality of articulation of the argument, and the strength of the evidence provided are critical factors in reviewing the quality of a manuscript. Personal opinions without backing evidence should not be used as criteria for review decisions.
Conflicts of Interest: If the reviewer realizes, after receiving a manuscript for review, that he or she has been involved in the research described, knows the researcher(s) involved in the research, or for any reason cannot give an objective review of the manuscript, the reviewer should inform the editors and decline to review it. Conflicts of interest may include competitive, collaborative, or other relationships or connections with any of the authors, companies, or institutions connected to the paper under review.
Acknowledgment of Sources: Reviewers should point out important relevant published work that has not been cited by the authors. A reviewer should also call to the editor’s attention any substantial similarity or overlap between the manuscript under consideration and any other published paper of which they have personal knowledge. SUBMISSIONS
Unsolicited manuscripts are welcomed. Submissions must be in the form of completed articles; partially completed articles are not considered.
Articles published elsewhere will not be considered. Full manuscripts of abstracts published in any form will be considered, but editorial judgment will be exercised to accept or reject.
The journal’s policy is not to reconsider an article that has been rejected by its referees. Papers that primarily feature negative results are also unlikely to be accepted, as are those which focus on promoting a concept by selectively choosing positive results.
Papers rejected by the editorial team are not open to reconsideration. Rejection may be based on a number of considerations including relevance, interest to readers, timeliness, adoption of a writing style that is considered offensive or partisan political, outside the space considerations stipulated by the journal, or failure to follow the specified guidelines.
110
Human Behavior, Development and Society (HBDS) Author Guidelines
Here are some general guidelines for preparing and submitting articles to HBDS.
1. Manuscripts for Submissions 1.1. Manuscripts should be no less than 8 and no more than 12 pages in length. 1.2. Manuscripts should be written in correct and standard academic English. 1.3. Manuscripts should be single-spaced. 1.4. Manuscripts should use Calibri font size 11. 1.5. Manuscripts should contain minimal formatting (bold and italics commands are acceptable). 1.6. Manuscripts should not contain editorial controls of any kind. 1.7. Manuscripts should also contain a 150-200 word abstract of the article. Provide at least three
keywords, but do not exceed seven.
2. Suggested Referencing Format 2.1. In order to maintain a consistent look for Human Behavior, Development and Society, use of the American Psychological Association (APA) publication guidelines is mandatory. For details, please see the APA Publication Manual (7th edition). 2.2. HBDS follows the APA guidelines for endnotes (preferred), in-text citations and references. 2.3. Referencing Samples: Please refer to http://www.apastyle.org/ for questions about referencing, and serialization in the APA format.
3. Submissions Procedure 3.1. Manuscripts submitted to HBDS must not have been previously published elsewhere or under
review for publication in other journals. 3.2. Manuscripts must adhere to the journal guidelines; failure to comply with these may result in
the rejection of a submission. 3.3. Manuscripts must be submitted through the ThaiJo online submission system at
https://so01.tci-thaijo.org/index.php/hbds; look for the HBDS web page. 3.4. Manuscripts should be submitted by no later than November 30 for the March issue, February 28 for the June issue, May 31 for the September issue, and August 31 for the December issue. Nonetheless, even if a submission is received before the stated dates, and is accepted, the journal’s Administrative Board reserves the right to decide on the publication date.
4. Review Process 4.1. Manuscripts will be checked for originality and prescreened by the editorial staff to see if their structure, content, and formatting complies with journal standards. 4.2. Manuscripts will undergo a double-blind review process conducted by at least 2 qualified
independent peer reviewers who are external to authors’ institutions, and knowledgeable in a relevant academic field. This process typically takes from 4–6 weeks, depending on peer reviewer response times.
4.3. Authors will be informed of reviewers’ comments as soon as they are available. 4.4. Authors will be given up to 1 month to revise their papers (should that be necessary) and should return the revised version by the 1st of February/May/August/November (or earlier).
5. Numbers in APA Style 5.1 In general, round decimals to two places with the exception of p-values (three decimal places is
the limit—p < .01 or .001). Percentages are expressed as whole numbers or to one decimal place. 5.2 Rounding rules: If the final number is 5 or more, add one to the last decimal place to be kept
(1.565 becomes 1.57). If the number is less than 5, write the number with the required decimal places (2.344 becomes 2.34).
5.3 When a statistical expression cannot exceed the value of 1, then the number reported is NOT preceded by a zero (e.g., with p-values—p < .01, also applies to correlations, Cronbach’s alpha).
5.4 Large numbers—use commas between groups of three digits in most figures of 1,000 or more.
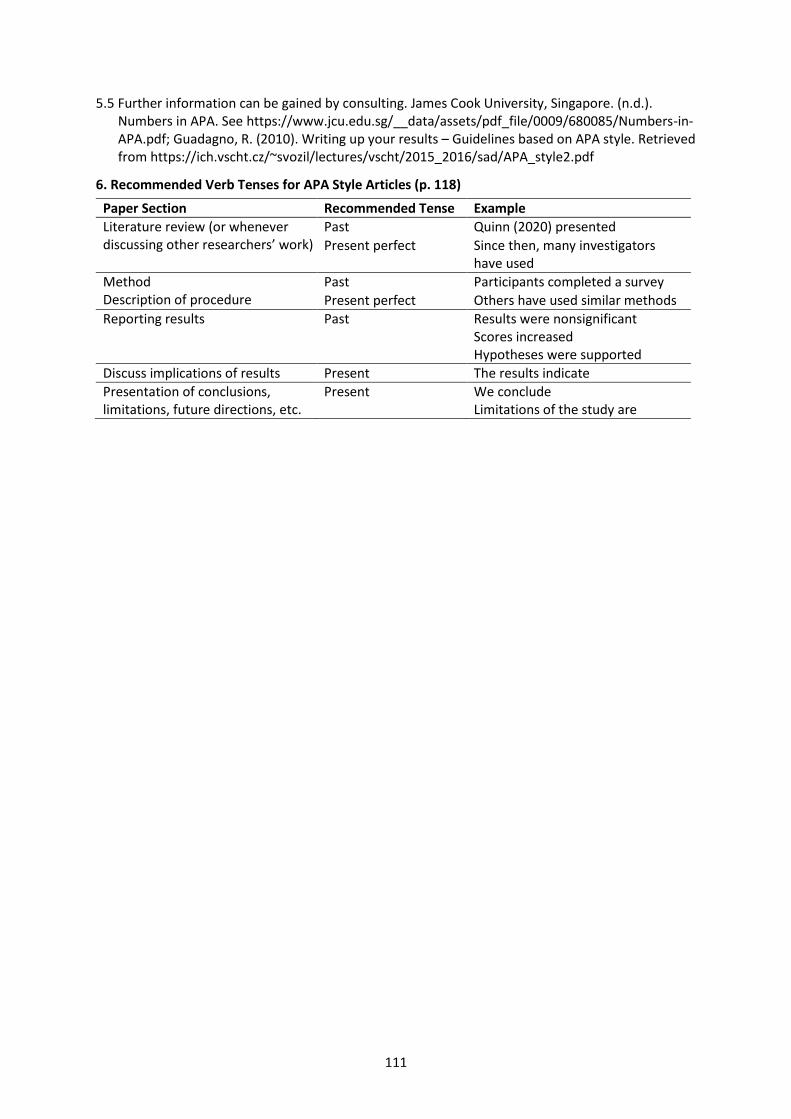
111
5.5 Further information can be gained by consulting. James Cook University, Singapore. (n.d.). Numbers in APA. See https://www.jcu.edu.sg/__data/assets/pdf_file/0009/680085/Numbers-in-APA.pdf; Guadagno, R. (2010). Writing up your results – Guidelines based on APA style. Retrieved from https://ich.vscht.cz/~svozil/lectures/vscht/2015_2016/sad/APA_style2.pdf
6. Recommended Verb Tenses for APA Style Articles (p. 118)
Paper Section Recommended Tense Example
Literature review (or whenever discussing other researchers’ work)
Past Quinn (2020) presented
Present perfect Since then, many investigators have used
Method Description of procedure
Past Participants completed a survey
Present perfect Others have used similar methods
Reporting results Past Results were nonsignificant Scores increased Hypotheses were supported
Discuss implications of results Present The results indicate
Presentation of conclusions, limitations, future directions, etc.
Present We conclude Limitations of the study are
Top Related
Copyright © 2022 FDOKUMEN

