


Bahasa
Halaman
Hukum

Jurnal Perencanaan Pembangunan The Indonesian Journal of Development Planning
Volume V No. 1 April 2021/Page: 71-93
Doi: 10.36574/jpp.v5i1.167 Article
71
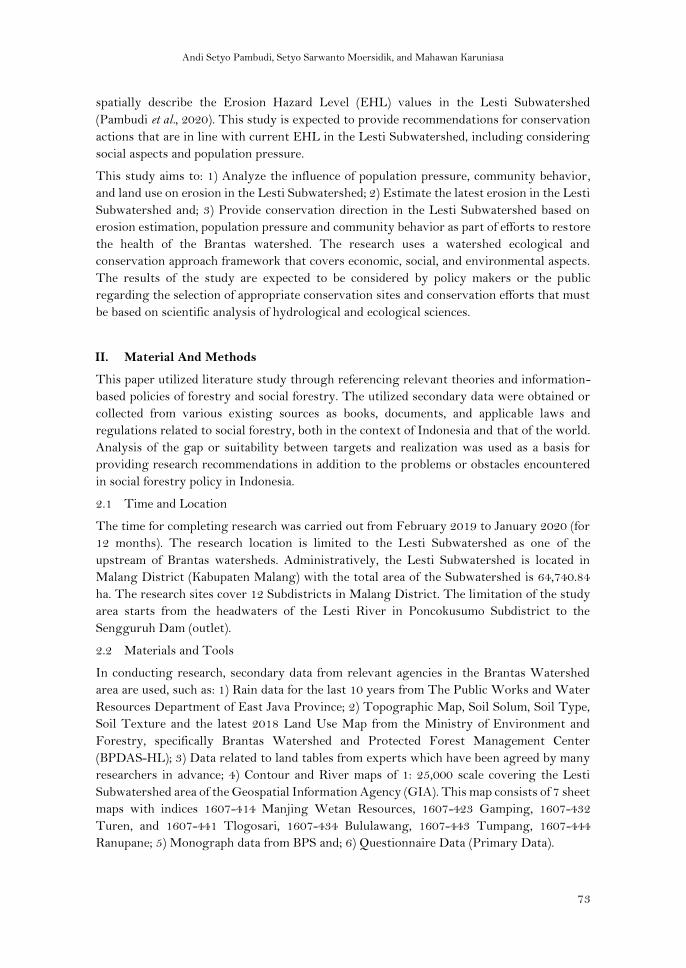
Analysis of Recent Erosion Hazard Levels and Conservation Policy
Recommendations for Lesti Subwatershed, Upper Brantas Watershed
Andi Setyo Pambudi1, Setyo Sarwanto Moersidik2, and Mahawan Karuniasa3
Corresponding author. Email: [email protected]
Submitted: 2021-02-19 | Accepted: 2021-04-26 | Published: 2021-04-30
Abstract
The reduced age function of Sengguruh Dam/Reservoir due to erosion in the upper of Brantas
Watershed (Lesti Subwatershed area) interferes with its role in flood control, irrigation water supply,
and the supply of most of the hydroelectricity in East Java Province, Indonesia. This study aims to
estimate erosion, analyze the interrelationship of the causative factors, and provides environmental
conservation direction. The research uses mixed methods. The quantitative method of erosion rates is
done by calculating the Modify Universal Soil Loss Equation which is supported by GIS tools. The
qualitative method is carried out with questionnaires and interviews in the Lesti Subwatershed area.
The results showed that the current erosion rate in each ha of land (average) in the Lesti Subwatershed
was 153,868 tons /ha/year (exceeding the tolerable erosion rate of 30 tons/ha/year). The rate of
erosion in the Lesti Subwatershed has always increased in the last 14 years. Of the 12 Subdistricts in
the Lesti watershed, as many as 6 Subdistricts are identified as having high levels of Erosion Hazards
so that they were a priority to be handled, namely in the Wajak, Dampit, Tirtoyudo, Gedangan,
Sumbermanjing Wetan, and Bantur Subdistricts. Dampit Subdistrict, Turen Subdistrict, and
Gondanglegi Subdistrict also face behavioral problems and high population pressure compared to other
Subdistricts. Research also shows that there is a relationship between erosion and knowledge, attitudes,
and behavior of the community in the form of population pressure and land use patterns. It is
recommended that environmental conservation directives focus on these 6 Sub-districts through the
application of soil and water conservation. The results of spatial analysis at priority locations suggest
conservation measures in the form of law enforcement or counseling, and community empowerment
to increase the ability and independence of the community through providing access to resources,
education, and training.
Keywords: Conservation, Erosion, Population Pressure, Community Behavior, Watershed
1 Directorate of Monitoring, Evaluation and Control of Regional Development, Ministry of National Development Planning / Bappenas 2 Faculty of Engineering, University of Indonesia, Depok Campus, West Java, Indonesia 3 Postgraduate School of Environmental Sciences, University of Indonesia, Salemba Campus, Jakarta, Indonesia
Andi Setyo Pambudi, Setyo Sarwanto Moersidik, and Mahawan Karuniasa
72
Analysis of Recent Erosion Hazard Levels and Conservation Policy
Recommendations for Lesti Subwatershed, Upper Brantas Watershed
Andi Setyo Pambudi, Setyo Sarwanto Moersidik, and Mahawan Karuniasa
I. Introduction
Erosion and sedimentation have been recognized as important issues that reduce reservoir
capacity and destroy many public facilities (Setyawan & Lee, 2017). Analyzing erosion and
sedimentation cannot be released from the hydrological boundary of the Watershed (Anache
et al., 2018; Bisri et al., 2017; Asdak, 2010). Dwelling or hydrological containers of economic
activity based on the environment are described as watersheds (Common & Stagl 2005;
Miller & Spoolman 2015; Reddy et al., 2017). Watershed areas are often used as socio-
economic, biophysical or political units for the management and planning of natural
resources (Pambudi, 2019; Heathcote, 1998). Global climate change, increasing population
and the intensity of economic activity are accelerating changes in watershed conditions
which affect erosion where destroy is often caused by mismanagement in the upstream, such
as the addition of cultivated and also residential land areas (Bellfield et al., 2015; Kindu et al. .,
2017; Euler et al., 2018).
The government has responded to the importance of restoring watershed conditions
through the National Mid-Term Development Plan (RPJMN) 2015-2019 and 2020-2024
(GoI, 2014a). In this document, 15 priority watersheds are determined to be restored, one of
them is the Brantas watershed (Bappenas, 2015). One of the upstream of the Brantas
watersheds is the Lesti Subwatershed. Previous studies of erosion in this area show a
significant increase in erosion rates. Yupi (2006) has calculated the erosion rate, especially
the average of each hectare of land about 30.57 tons/ha/ year. The results of Setyono and
Prasetyo (2012) showed an erosion rate of 105,763 tons/ha/year. Meanwhile, the study of
Ma'wa et al. (2015) got 131,098 tons/ha/year. The erosion rate needs to be lowered and
controlled in following the provisions that require further study.
Wischmeier and Smith (1978) in Arsyad (2006) state that the value of erosion rate or
tolerable soil erosion (T) in each hectare of land that can be tolerated for land in America is
4.48-11.21 tons/ha/year. The maximum rate of soil erosion in each hectare of land tolerated
by many researchers for Indonesia is based on research of Hardjowigeno (1995), which is 30
tons / ha / year.
Ideally, erosion data in the watershed should be updated regularly so that the handling policy
can be under the existing factual conditions (Pambudi & Moersidik, 2019). The average
erosion rate in the Lesti Subwatershed that can be tolerated is 30 tons/ha/year. When the
erosion rate in the Lesti Subwatershed exceeds the tolerance limit, conservation is needed to
control erosion rate so that sedimentation downstream can be reduced (Pambudi et al., 2020;
Jeloudar et al., 2018; Nabi et al, 2017). Conservation efforts that are not proportional to the
erosion rate have an impact on the magnitude of sedimentation in the Sengguruh Reservoir
making the reservoir function is not optimal (Firdaus et al., 2015; Djajasinga et al., 2012).
Conservation considerations require erosion rate data as well as soil solum which will
Andi Setyo Pambudi, Setyo Sarwanto Moersidik, and Mahawan Karuniasa
73
spatially describe the Erosion Hazard Level (EHL) values in the Lesti Subwatershed
(Pambudi et al., 2020). This study is expected to provide recommendations for conservation
actions that are in line with current EHL in the Lesti Subwatershed, including considering
social aspects and population pressure.
This study aims to: 1) Analyze the influence of population pressure, community behavior,
and land use on erosion in the Lesti Subwatershed; 2) Estimate the latest erosion in the Lesti
Subwatershed and; 3) Provide conservation direction in the Lesti Subwatershed based on
erosion estimation, population pressure and community behavior as part of efforts to restore
the health of the Brantas watershed. The research uses a watershed ecological and
conservation approach framework that covers economic, social, and environmental aspects.
The results of the study are expected to be considered by policy makers or the public
regarding the selection of appropriate conservation sites and conservation efforts that must
be based on scientific analysis of hydrological and ecological sciences.
II. Material And Methods
This paper utilized literature study through referencing relevant theories and information-
based policies of forestry and social forestry. The utilized secondary data were obtained or
collected from various existing sources as books, documents, and applicable laws and
regulations related to social forestry, both in the context of Indonesia and that of the world.
Analysis of the gap or suitability between targets and realization was used as a basis for
providing research recommendations in addition to the problems or obstacles encountered
in social forestry policy in Indonesia.
2.1 Time and Location
The time for completing research was carried out from February 2019 to January 2020 (for
12 months). The research location is limited to the Lesti Subwatershed as one of the
upstream of Brantas watersheds. Administratively, the Lesti Subwatershed is located in
Malang District (Kabupaten Malang) with the total area of the Subwatershed is 64,740.84
ha. The research sites cover 12 Subdistricts in Malang District. The limitation of the study
area starts from the headwaters of the Lesti River in Poncokusumo Subdistrict to the
Sengguruh Dam (outlet).
2.2 Materials and Tools
In conducting research, secondary data from relevant agencies in the Brantas Watershed
area are used, such as: 1) Rain data for the last 10 years from The Public Works and Water
Resources Department of East Java Province; 2) Topographic Map, Soil Solum, Soil Type,
Soil Texture and the latest 2018 Land Use Map from the Ministry of Environment and
Forestry, specifically Brantas Watershed and Protected Forest Management Center
(BPDAS-HL); 3) Data related to land tables from experts which have been agreed by many
researchers in advance; 4) Contour and River maps of 1: 25,000 scale covering the Lesti
Subwatershed area of the Geospatial Information Agency (GIA). This map consists of 7 sheet
maps with indices 1607-414 Manjing Wetan Resources, 1607-423 Gamping, 1607-432
Turen, and 1607-441 Tlogosari, 1607-434 Bululawang, 1607-443 Tumpang, 1607-444
Ranupane; 5) Monograph data from BPS and; 6) Questionnaire Data (Primary Data).
Andi Setyo Pambudi, Setyo Sarwanto Moersidik, and Mahawan Karuniasa
74
The research design was carried out by giving 3 questionnaires namely a knowledge
questionnaire sheet, an attitude questionnaire sheet, and a behavioral questionnaire sheet for
the selection of environmental-related activities in the Lesti Subwatershed. The completion
of the questionnaire was carried out through direct visits on 17 to 30 July 2019 or online via
the bit.ly/SubDASLesti link with a total of 358 respondents in 12 Subdistricts in the Lesti
Subwatershed. The analytical tool used is by using the help of Arc GIS 10.3 Software, SPSS
Version 22 and Microsoft Excel 2019.
2.3 Research Methods
The method used is a mixed method with community behavior analysis using cross
tabulation statistical analysis methods. Behavior analysis design starts from the results of a
questionnaire-based survey in order to determine the relationship between attitudes,
knowledge and behavior of the community with a sample analysis scale of 358 respondents
in Malang District (12 Subdistricts) who are in the scope of the Lesti Subwatershed. The
research ethics used was informed consent and confidentiality. The results of this survey
form the basis for calculating Pearson's bivariate correlation in statistical science. Delegation
of the Lesti Subwatershed is carried out by generating Digital Elevation Model (DEM) data
from the Earth Map, in particular the 1: 25,000 scale Contour and River Maps covering the
Lesti Subwatershed area from the Geospatial Information Agency (GIA). Rain data
consistency test uses the double mass curve approach (Soemarto, 1987) and the calculation
of regional maximum rainfall uses Polygon Thiessen. Analysis of rainfall design using the
Pearson Log Type III distribution and 1.01 return time. To calculate surface runoff
discharge, a modified rational formula is used. The calculation in this study such as: 1)
Determine the Flow Coefficient (C); 2) Calculate the Concentration Time (Tc), Reservoir
Coefficient (Cs) and Rain Intensity (I) and; 3) Running formula of runoff discharge and
describe it in the form of Surface Runoff Discharge Distribution Map in various times with
Arc GIS Software 10.3. Analysis related to population pressure using the Soemarwoto
Formula (1985) and behavior analysis using the Pearson bivariate statistical method. The
erosion rate was calculated by the MUSLE method with a database of surface runoff erosivity
index, erodibility, length and slope as well as crop management factors and conservation
measures (CP). The component of obtaining CP value is also related to community behavior
and population pressure on land. Meanwhile, to get the level of erosion hazard an overlay is
done between the erosion rate map and the soil solum map with the help of Geographic
Information System tools. Conservation action recommendations use overlay techniques
from attributes entered under Law 37 of 2014 on Soil and Water Conservation (GoI, 2014b).
III. Results And Discussion
3.1 Behavior Analysis
Analysis of Knowledge, Attitudes and Behavior in Lesti Subwatershed using pearson
bivariate correlation analysis. This analysis was conducted to determine the closeness of the
relationship between variables expressed by the correlation coefficient. This study uses SPSS
software that is used to simplify the process of correlation analysis. There are three ways
that can be used as a guide / basis for decision making in Pearson's bivariate correlation
Andi Setyo Pambudi, Setyo Sarwanto Moersidik, and Mahawan Karuniasa
75
analysis, which is based on the significance value of sig. (2-tailed), based on r count values
(Pearson correlations) and based on asterisks (*) in SPSS software.
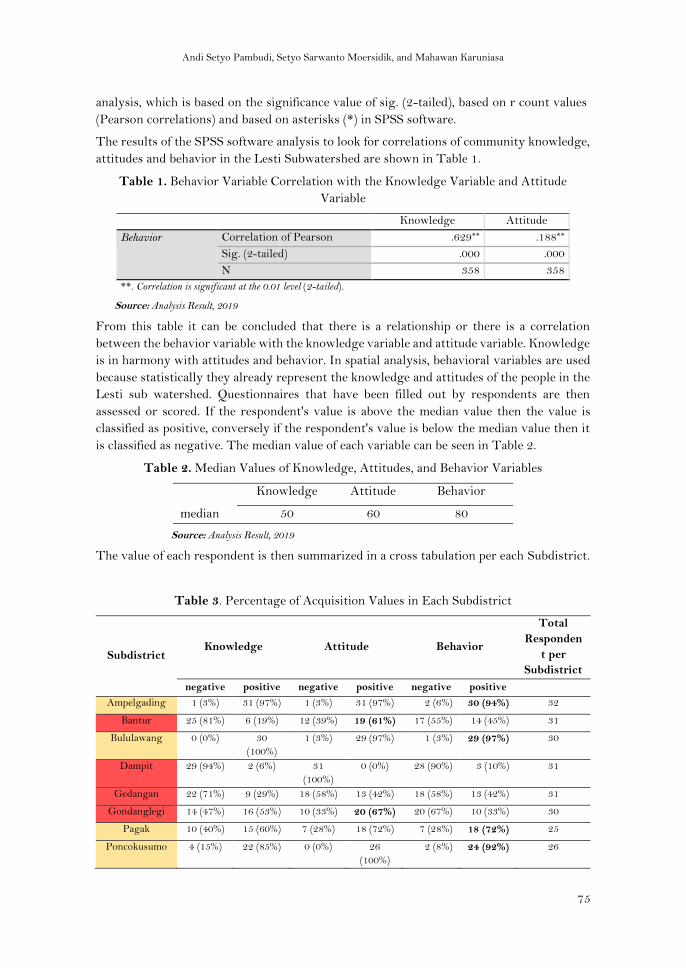
The results of the SPSS software analysis to look for correlations of community knowledge,
attitudes and behavior in the Lesti Subwatershed are shown in Table 1.
Table 1. Behavior Variable Correlation with the Knowledge Variable and Attitude
Variable
Knowledge Attitude
Behavior Correlation of Pearson .629** .188**
Sig. (2-tailed) .000 .000
N 358 358
**. Correlation is significant at the 0.01 level (2-tailed).
Source: Analysis Result, 2019
From this table it can be concluded that there is a relationship or there is a correlation
between the behavior variable with the knowledge variable and attitude variable. Knowledge
is in harmony with attitudes and behavior. In spatial analysis, behavioral variables are used
because statistically they already represent the knowledge and attitudes of the people in the
Lesti sub watershed. Questionnaires that have been filled out by respondents are then
assessed or scored. If the respondent's value is above the median value then the value is
classified as positive, conversely if the respondent's value is below the median value then it
is classified as negative. The median value of each variable can be seen in Table 2.
Table 2. Median Values of Knowledge, Attitudes, and Behavior Variables
median
Knowledge Attitude Behavior
50 60 80
Source: Analysis Result, 2019
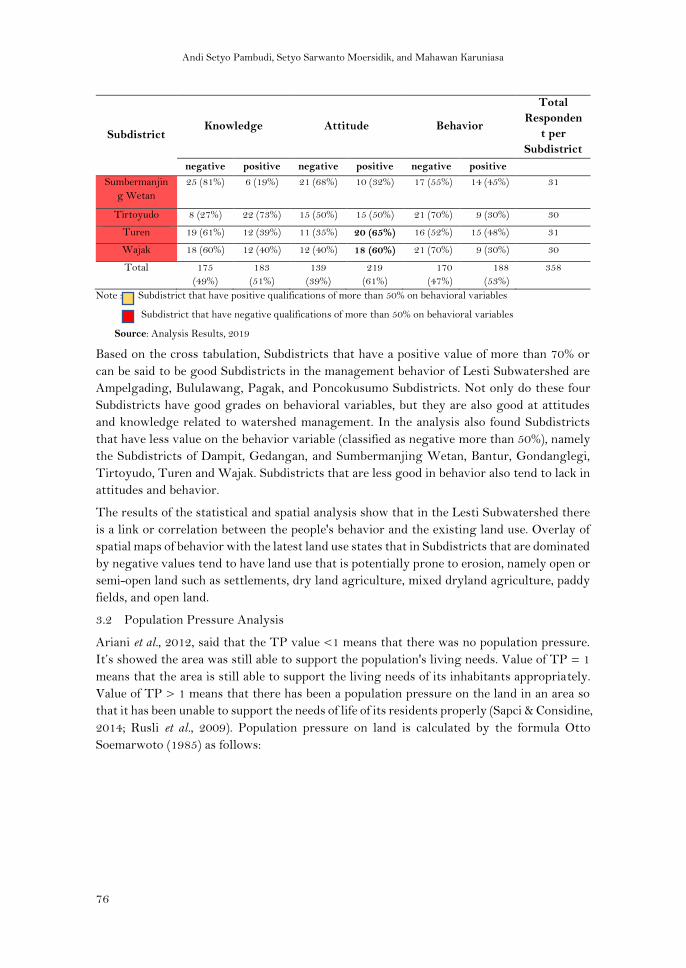
The value of each respondent is then summarized in a cross tabulation per each Subdistrict.
Table 3. Percentage of Acquisition Values in Each Subdistrict
Subdistrict Knowledge Attitude Behavior
Total
Responden
t per
Subdistrict
negative positive negative positive negative positive
Ampelgading 1 (3%) 31 (97%) 1 (3%) 31 (97%) 2 (6%) 30 (94%) 32
Bantur 25 (81%) 6 (19%) 12 (39%) 19 (61%) 17 (55%) 14 (45%) 31
Bululawang 0 (0%) 30
(100%)
1 (3%) 29 (97%) 1 (3%) 29 (97%) 30
Dampit 29 (94%) 2 (6%) 31
(100%)
0 (0%) 28 (90%) 3 (10%) 31
Gedangan 22 (71%) 9 (29%) 18 (58%) 13 (42%) 18 (58%) 13 (42%) 31
Gondanglegi 14 (47%) 16 (53%) 10 (33%) 20 (67%) 20 (67%) 10 (33%) 30
Pagak 10 (40%) 15 (60%) 7 (28%) 18 (72%) 7 (28%) 18 (72%) 25
Poncokusumo 4 (15%) 22 (85%) 0 (0%) 26
(100%)
2 (8%) 24 (92%) 26
Andi Setyo Pambudi, Setyo Sarwanto Moersidik, and Mahawan Karuniasa
76
Subdistrict Knowledge Attitude Behavior
Total
Responden
t per
Subdistrict
negative positive negative positive negative positive
Sumbermanjin
g Wetan
25 (81%) 6 (19%) 21 (68%) 10 (32%) 17 (55%) 14 (45%) 31
Tirtoyudo 8 (27%) 22 (73%) 15 (50%) 15 (50%) 21 (70%) 9 (30%) 30
Turen 19 (61%) 12 (39%) 11 (35%) 20 (65%) 16 (52%) 15 (48%) 31
Wajak 18 (60%) 12 (40%) 12 (40%) 18 (60%) 21 (70%) 9 (30%) 30
Total 175
(49%)
183
(51%)
139
(39%)
219
(61%)
170
(47%)
188
(53%)
358
Note : Subdistrict that have positive qualifications of more than 50% on behavioral variables
Subdistrict that have negative qualifications of more than 50% on behavioral variables
Source: Analysis Results, 2019
Based on the cross tabulation, Subdistricts that have a positive value of more than 70% or
can be said to be good Subdistricts in the management behavior of Lesti Subwatershed are
Ampelgading, Bululawang, Pagak, and Poncokusumo Subdistricts. Not only do these four
Subdistricts have good grades on behavioral variables, but they are also good at attitudes
and knowledge related to watershed management. In the analysis also found Subdistricts
that have less value on the behavior variable (classified as negative more than 50%), namely
the Subdistricts of Dampit, Gedangan, and Sumbermanjing Wetan, Bantur, Gondanglegi,
Tirtoyudo, Turen and Wajak. Subdistricts that are less good in behavior also tend to lack in
attitudes and behavior.
The results of the statistical and spatial analysis show that in the Lesti Subwatershed there
is a link or correlation between the people's behavior and the existing land use. Overlay of
spatial maps of behavior with the latest land use states that in Subdistricts that are dominated
by negative values tend to have land use that is potentially prone to erosion, namely open or
semi-open land such as settlements, dry land agriculture, mixed dryland agriculture, paddy
fields, and open land.
3.2 Population Pressure Analysis
Ariani et al., 2012, said that the TP value <1 means that there was no population pressure.
It’s showed the area was still able to support the population's living needs. Value of TP = 1
means that the area is still able to support the living needs of its inhabitants appropriately.
Value of TP > 1 means that there has been a population pressure on the land in an area so
that it has been unable to support the needs of life of its residents properly (Sapci & Considine,
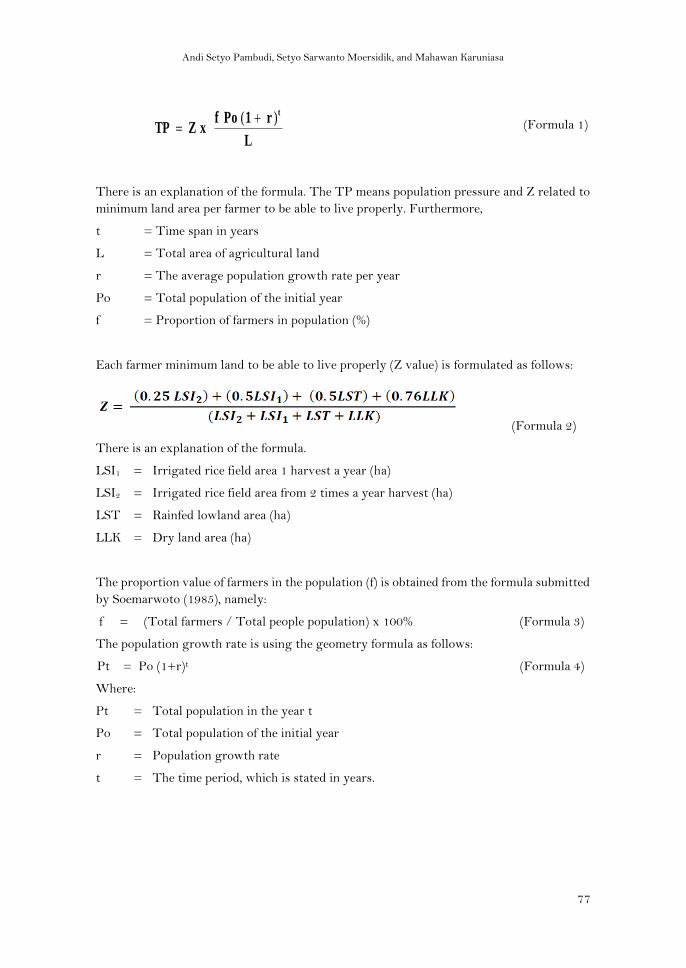
2014; Rusli et al., 2009). Population pressure on land is calculated by the formula Otto
Soemarwoto (1985) as follows:
Andi Setyo Pambudi, Setyo Sarwanto Moersidik, and Mahawan Karuniasa
77
L
r1PofxZTP
t)( +=
(Formula 1)
There is an explanation of the formula. The TP means population pressure and Z related to
minimum land area per farmer to be able to live properly. Furthermore,
t = Time span in years
L = Total area of agricultural land
r = The average population growth rate per year
Po = Total population of the initial year
f = Proportion of farmers in population (%)
Each farmer minimum land to be able to live properly (Z value) is formulated as follows:
(Formula 2)
There is an explanation of the formula.
LSI1 = Irrigated rice field area 1 harvest a year (ha)
LSI2 = Irrigated rice field area from 2 times a year harvest (ha)
LST = Rainfed lowland area (ha)
LLK = Dry land area (ha)
The proportion value of farmers in the population (f) is obtained from the formula submitted
by Soemarwoto (1985), namely:
f = (Total farmers / Total people population) x 100% (Formula 3)
The population growth rate is using the geometry formula as follows:
Pt = Po (1+r)t (Formula 4)
Where:
Pt = Total population in the year t
Po = Total population of the initial year
r = Population growth rate
t = The time period, which is stated in years.
Andi Setyo Pambudi, Setyo Sarwanto Moersidik, and Mahawan Karuniasa
78
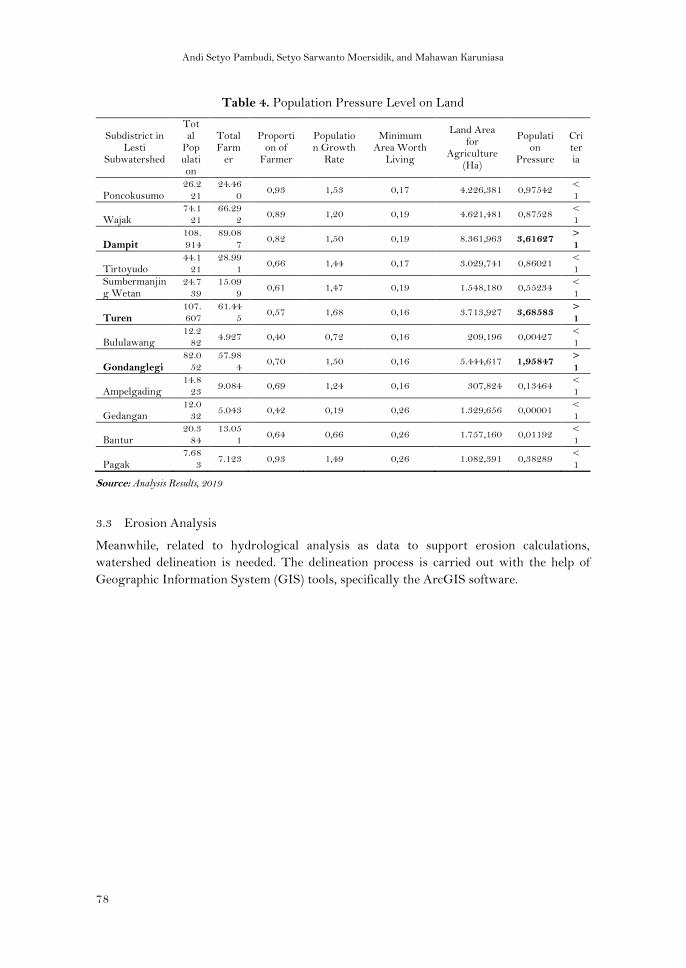
Table 4. Population Pressure Level on Land
Subdistrict in Lesti
Subwatershed
Total
Population
Total Farm
er
Proportion of
Farmer
Population Growth
Rate
Minimum Area Worth
Living
Land Area for
Agriculture (Ha)
Population
Pressure
Criteria
Poncokusumo 26.2
21 24.46
0 0,93 1,53 0,17 4.226,381 0,97542
< 1
Wajak 74.1
21 66.29
2 0,89 1,20 0,19 4.621,481 0,87528
< 1
Dampit 108.914
89.087
0,82 1,50 0,19 8.361,963 3,61627 > 1
Tirtoyudo 44.1
21 28.99
1 0,66 1,44 0,17 3.029,741 0,86021
< 1
Sumbermanjing Wetan
24.739
15.099
0,61 1,47 0,19 1.548,180 0,55234 < 1
Turen 107.607
61.445
0,57 1,68 0,16 3.713,927 3,68583 > 1
Bululawang 12.2
82 4.927 0,40 0,72 0,16 209,196 0,00427
< 1
Gondanglegi 82.0
52 57.98
4 0,70 1,50 0,16 5.444,617 1,95847
> 1
Ampelgading 14.8
23 9.084 0,69 1,24 0,16 307,824 0,13464
< 1
Gedangan 12.0
32 5.043 0,42 0,19 0,26 1.329,656 0,00001
< 1
Bantur 20.3
84 13.05
1 0,64 0,66 0,26 1.757,160 0,01192
< 1
Pagak 7.68
3 7.123 0,93 1,49 0,26 1.082,391 0,38289
< 1
Source: Analysis Results, 2019
3.3 Erosion Analysis
Meanwhile, related to hydrological analysis as data to support erosion calculations,
watershed delineation is needed. The delineation process is carried out with the help of
Geographic Information System (GIS) tools, specifically the ArcGIS software.
Andi Setyo Pambudi, Setyo Sarwanto Moersidik, and Mahawan Karuniasa
79
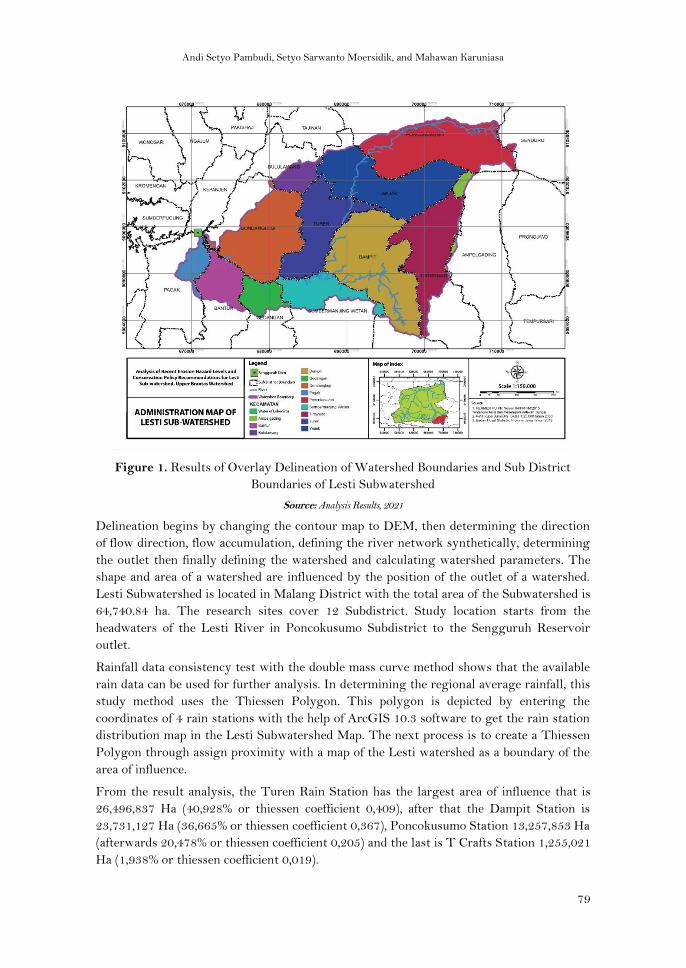
Figure 1. Results of Overlay Delineation of Watershed Boundaries and Sub District
Boundaries of Lesti Subwatershed
Source: Analysis Results, 2021
Delineation begins by changing the contour map to DEM, then determining the direction
of flow direction, flow accumulation, defining the river network synthetically, determining
the outlet then finally defining the watershed and calculating watershed parameters. The
shape and area of a watershed are influenced by the position of the outlet of a watershed.
Lesti Subwatershed is located in Malang District with the total area of the Subwatershed is
64,740.84 ha. The research sites cover 12 Subdistrict. Study location starts from the
headwaters of the Lesti River in Poncokusumo Subdistrict to the Sengguruh Reservoir
outlet.
Rainfall data consistency test with the double mass curve method shows that the available
rain data can be used for further analysis. In determining the regional average rainfall, this
study method uses the Thiessen Polygon. This polygon is depicted by entering the
coordinates of 4 rain stations with the help of ArcGIS 10.3 software to get the rain station
distribution map in the Lesti Subwatershed Map. The next process is to create a Thiessen
Polygon through assign proximity with a map of the Lesti watershed as a boundary of the
area of influence.
From the result analysis, the Turen Rain Station has the largest area of influence that is
26,496,837 Ha (40,928% or thiessen coefficient 0,409), after that the Dampit Station is
23,731,127 Ha (36,665% or thiessen coefficient 0,367), Poncokusumo Station 13,257,853 Ha
(afterwards 20,478% or thiessen coefficient 0,205) and the last is T Crafts Station 1,255,021
Ha (1,938% or thiessen coefficient 0,019).
Andi Setyo Pambudi, Setyo Sarwanto Moersidik, and Mahawan Karuniasa
80
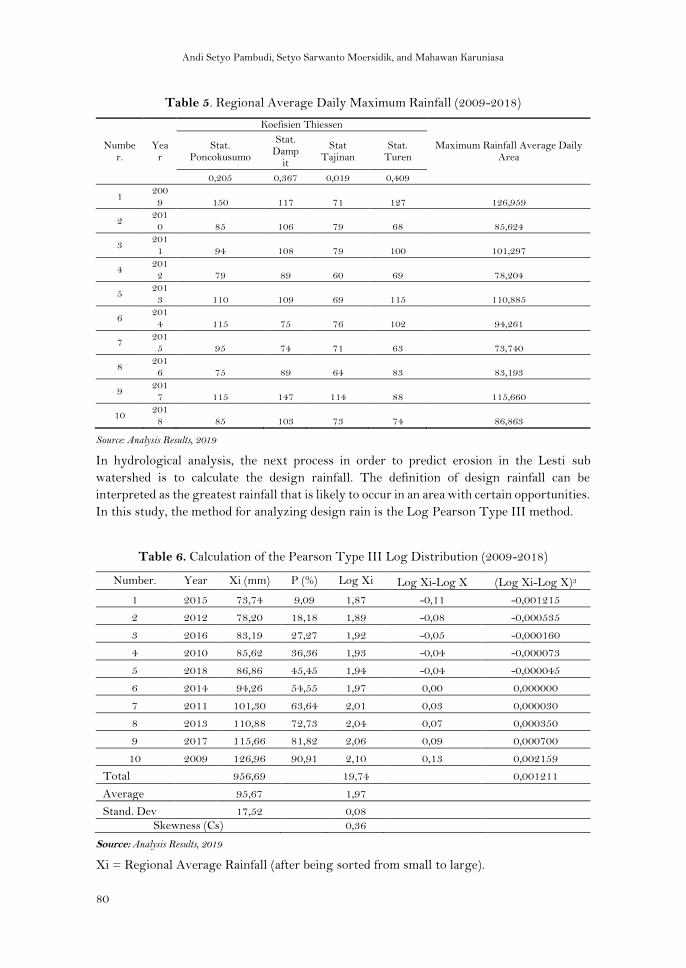
Table 5. Regional Average Daily Maximum Rainfall (2009-2018)
Number.
Year
Koefisien Thiessen
Maximum Rainfall Average Daily Area
Stat. Poncokusumo
Stat. Damp
it
Stat Tajinan
Stat. Turen
0,205 0,367 0,019 0,409
1 200
9 150 117 71 127 126,959
2 201
0 85 106 79 68 85,624
3 201
1 94 108 79 100 101,297
4 201
2 79 89 60 69 78,204
5 201
3 110 109 69 115 110,885
6 201
4 115 75 76 102 94,261
7 201
5 95 74 71 63 73,740
8 201
6 75 89 64 83 83,193
9 201
7 115 147 114 88 115,660
10 201
8 85 103 73 74 86,863
Source: Analysis Results, 2019
In hydrological analysis, the next process in order to predict erosion in the Lesti sub
watershed is to calculate the design rainfall. The definition of design rainfall can be
interpreted as the greatest rainfall that is likely to occur in an area with certain opportunities.
In this study, the method for analyzing design rain is the Log Pearson Type III method.
Table 6. Calculation of the Pearson Type III Log Distribution (2009-2018)
Number. Year Xi (mm) P (%) Log Xi Log Xi-Log X (Log Xi-Log X)3
1 2015 73,74 9,09 1,87 -0,11 -0,001215
2 2012 78,20 18,18 1,89 -0,08 -0,000535
3 2016 83,19 27,27 1,92 -0,05 -0,000160
4 2010 85,62 36,36 1,93 -0,04 -0,000073
5 2018 86,86 45,45 1,94 -0,04 -0,000045
6 2014 94,26 54,55 1,97 0,00 0,000000
7 2011 101,30 63,64 2,01 0,03 0,000030
8 2013 110,88 72,73 2,04 0,07 0,000350
9 2017 115,66 81,82 2,06 0,09 0,000700
10 2009 126,96 90,91 2,10 0,13 0,002159
Total 956,69 19,74 0,001211
Average 95,67 1,97
Stand. Dev 17,52 0,08
Skewness (Cs) 0,36
Source: Analysis Results, 2019
Xi = Regional Average Rainfall (after being sorted from small to large).
Andi Setyo Pambudi, Setyo Sarwanto Moersidik, and Mahawan Karuniasa
81
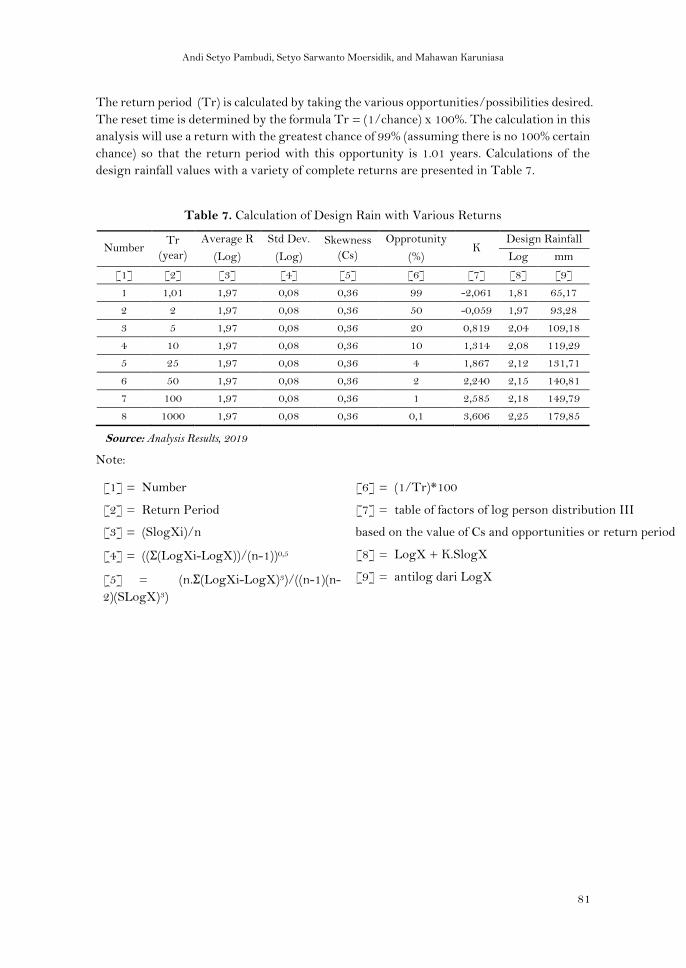
The return period (Tr) is calculated by taking the various opportunities/possibilities desired.
The reset time is determined by the formula Tr = (1/chance) x 100%. The calculation in this
analysis will use a return with the greatest chance of 99% (assuming there is no 100% certain
chance) so that the return period with this opportunity is 1.01 years. Calculations of the
design rainfall values with a variety of complete returns are presented in Table 7.
Table 7. Calculation of Design Rain with Various Returns
Number Tr
(year)
Average R Std Dev. Skewness
(Cs)
Opprotunity K
Design Rainfall
(Log) (Log) (%) Log mm
[1] [2] [3] [4] [5] [6] [7] [8] [9]
1 1,01 1,97 0,08 0,36 99 -2,061 1,81 65,17
2 2 1,97 0,08 0,36 50 -0,059 1,97 93,28
3 5 1,97 0,08 0,36 20 0,819 2,04 109,18
4 10 1,97 0,08 0,36 10 1,314 2,08 119,29
5 25 1,97 0,08 0,36 4 1,867 2,12 131,71
6 50 1,97 0,08 0,36 2 2,240 2,15 140,81
7 100 1,97 0,08 0,36 1 2,585 2,18 149,79
8 1000 1,97 0,08 0,36 0,1 3,606 2,25 179,85
Source: Analysis Results, 2019
Note:
[1] = Number
[2] = Return Period
[3] = (SlogXi)/n
[4] = ((Σ(LogXi-LogX))/(n-1))0,5
[5] = (n.Σ(LogXi-LogX)3)/((n-1)(n-
2)(SLogX)3)
[6] = (1/Tr)*100
[7] = table of factors of log person distribution III
based on the value of Cs and opportunities or return period
[8] = LogX + K.SlogX
[9] = antilog dari LogX
Andi Setyo Pambudi, Setyo Sarwanto Moersidik, and Mahawan Karuniasa
82
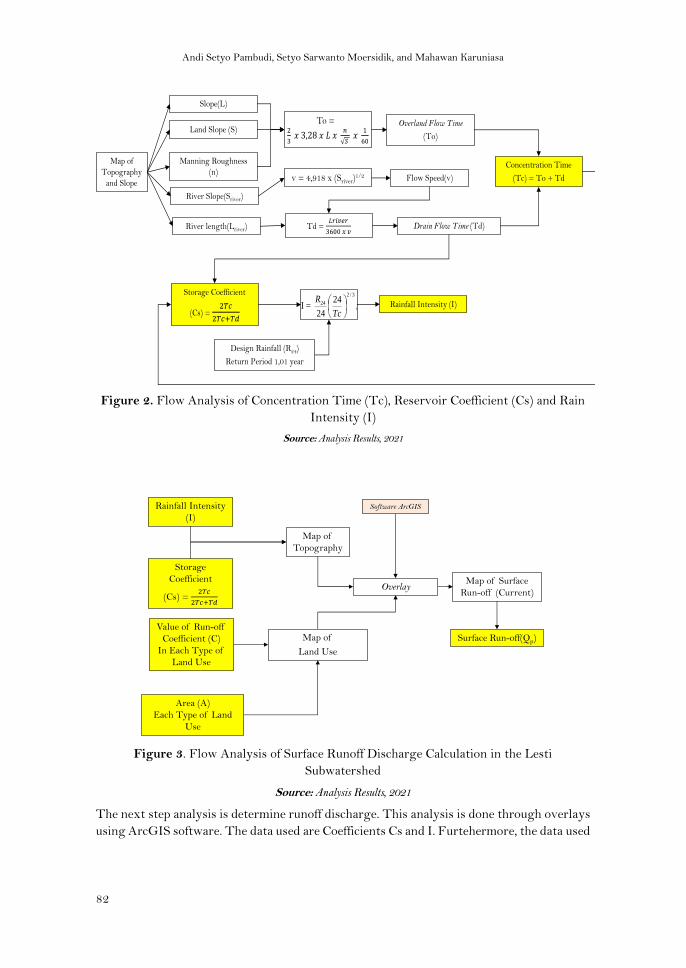
Figure 2. Flow Analysis of Concentration Time (Tc), Reservoir Coefficient (Cs) and Rain
Intensity (I)
Source: Analysis Results, 2021
Figure 3. Flow Analysis of Surface Runoff Discharge Calculation in the Lesti
Subwatershed
Source: Analysis Results, 2021
The next step analysis is determine runoff discharge. This analysis is done through overlays
using ArcGIS software. The data used are Coefficients Cs and I. Furtehermore, the data used
Slope(L)
Land Slope (S)
River Slope(Sriver)
Design Rainfall (R24)
Return Period 1,01 year
River length(Lriver)
Manning Roughness
(n)Flow Speed(v)
Overland Flow Time
(To)
Drain Flow Time (Td)
Concentration Time
(Tc) = To + Td
Storage Coefficient
(Cs) = Rainfall Intensity (I)
To =
v = 4,918 x (Sriver)1/2
Td =
I =
3/2
24 24
24
Tc
R,
Map of
Topography
and Slope
Map of Surface
Run-off (Current)
Storage
Coefficient
(Cs) =
Rainfall Intensity
(I)
Map of
Topography
Value of Run-off
Coefficient (C)
In Each Type of
Land Use
Map of
Land Use
Software ArcGIS
Overlay
Surface Run-off(Qp)
Area (A)
Each Type of Land
Use
Andi Setyo Pambudi, Setyo Sarwanto Moersidik, and Mahawan Karuniasa
83
are land use maps for Coefficient C. The formula used is the modified rational runoff equation,
namely:
Q = 0,00278. Cs. C. I. A (Formula 5)
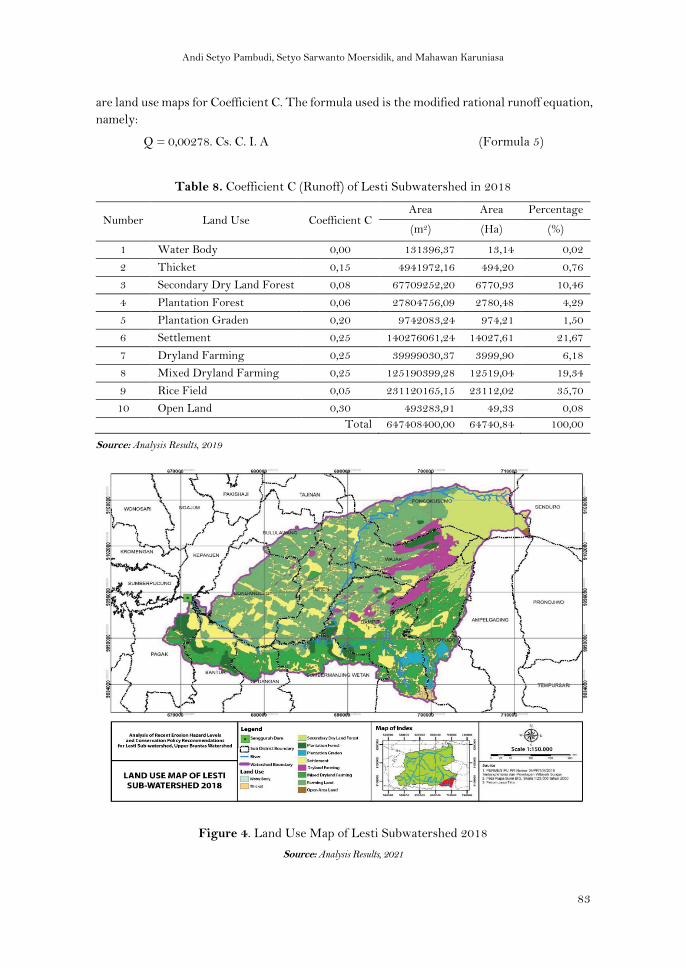
Table 8. Coefficient C (Runoff) of Lesti Subwatershed in 2018
Number Land Use Coefficient C Area Area Percentage
(m2) (Ha) (%)
1 Water Body 0,00 131396,37 13,14 0,02
2 Thicket 0,15 4941972,16 494,20 0,76
3 Secondary Dry Land Forest 0,08 67709252,20 6770,93 10,46
4 Plantation Forest 0,06 27804756,09 2780,48 4,29
5 Plantation Graden 0,20 9742083,24 974,21 1,50
6 Settlement 0,25 140276061,24 14027,61 21,67
7 Dryland Farming 0,25 39999030,37 3999,90 6,18
8 Mixed Dryland Farming 0,25 125190399,28 12519,04 19,34
9 Rice Field 0,05 231120165,15 23112,02 35,70
10 Open Land 0,30 493283,91 49,33 0,08
Total 647408400,00 64740,84 100,00
Source: Analysis Results, 2019
Figure 4. Land Use Map of Lesti Subwatershed 2018
Source: Analysis Results, 2021
Andi Setyo Pambudi, Setyo Sarwanto Moersidik, and Mahawan Karuniasa
84
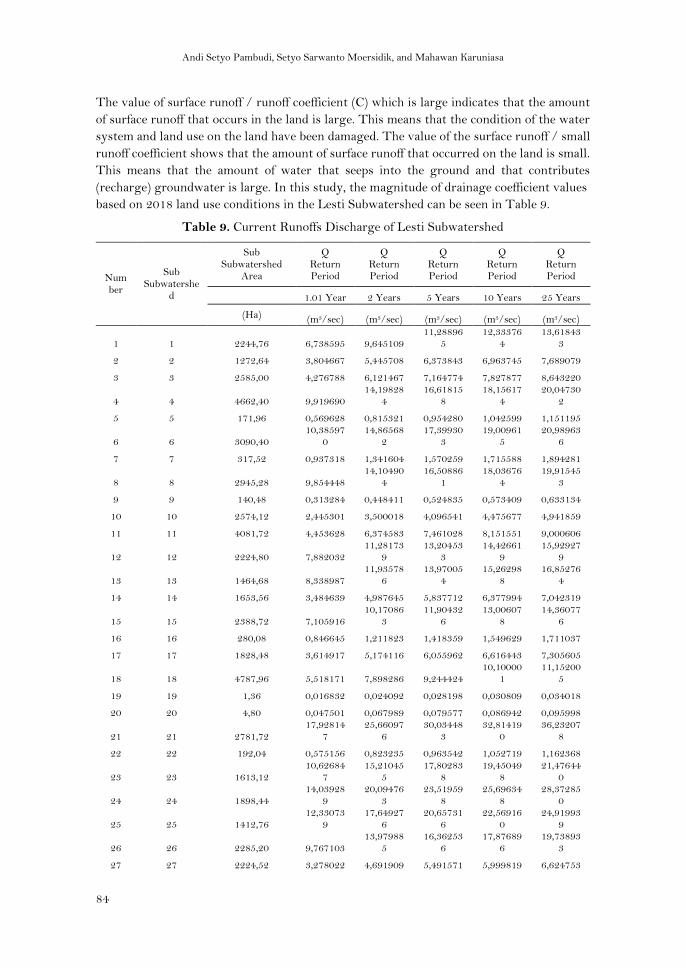
The value of surface runoff / runoff coefficient (C) which is large indicates that the amount
of surface runoff that occurs in the land is large. This means that the condition of the water
system and land use on the land have been damaged. The value of the surface runoff / small
runoff coefficient shows that the amount of surface runoff that occurred on the land is small.
This means that the amount of water that seeps into the ground and that contributes
(recharge) groundwater is large. In this study, the magnitude of drainage coefficient values
based on 2018 land use conditions in the Lesti Subwatershed can be seen in Table 9.
Table 9. Current Runoffs Discharge of Lesti Subwatershed
Number
Sub Subwatershe
d
Sub Subwatershed
Area
Q Return Period
Q Return Period
Q Return Period
Q Return Period
Q Return Period
1.01 Year 2 Years 5 Years 10 Years 25 Years
(Ha) (m3/sec) (m3/sec) (m3/sec) (m3/sec) (m3/sec)
1 1 2244,76 6,738595 9,645109 11,28896
5 12,33376
4 13,61843
3
2 2 1272,64 3,804667 5,445708 6,373843 6,963745 7,689079
3 3 2585,00 4,276788 6,121467 7,164774 7,827877 8,643220
4 4 4662,40 9,919690 14,19828
4 16,61815
8 18,15617
4 20,04730
2
5 5 171,96 0,569628 0,815321 0,954280 1,042599 1,151195
6 6 3090,40 10,38597
0 14,86568
2 17,39930
3 19,00961
5 20,98963
6
7 7 317,52 0,937318 1,341604 1,570259 1,715588 1,894281
8 8 2945,28 9,854448 14,10490
4 16,50886
1 18,03676
4 19,91545
3
9 9 140,48 0,313284 0,448411 0,524835 0,573409 0,633134
10 10 2574,12 2,445301 3,500018 4,096541 4,475677 4,941859
11 11 4081,72 4,453628 6,374583 7,461028 8,151551 9,000606
12 12 2224,80 7,882032 11,28173
9 13,20453
3 14,42661
9 15,92927
9
13 13 1464,68 8,338987 11,93578
6 13,97005
4 15,26298
8 16,85276
4
14 14 1653,56 3,484639 4,987645 5,837712 6,377994 7,042319
15 15 2388,72 7,105916 10,17086
3 11,90432
6 13,00607
8 14,36077
6
16 16 280,08 0,846645 1,211823 1,418359 1,549629 1,711037
17 17 1828,48 3,614917 5,174116 6,055962 6,616443 7,305605
18 18 4787,96 5,518171 7,898286 9,244424 10,10000
1 11,15200
5
19 19 1,36 0,016832 0,024092 0,028198 0,030809 0,034018
20 20 4,80 0,047501 0,067989 0,079577 0,086942 0,095998
21 21 2781,72 17,92814
7 25,66097
6 30,03448
3 32,81419
0 36,23207
8
22 22 192,04 0,575156 0,823235 0,963542 1,052719 1,162368
23 23 1613,12 10,62684
7 15,21045
5 17,80283
8 19,45049
8 21,47644
0
24 24 1898,44 14,03928
9 20,09476
3 23,51959
8 25,69634
8 28,37285
0
25 25 1412,76 12,33073
9 17,64927
6 20,65731
6 22,56916
0 24,91993
9
26 26 2285,20 9,767103 13,97988
5 16,36253
6 17,87689
6 19,73893
3
27 27 2224,52 3,278022 4,691909 5,491571 5,999819 6,624753
Andi Setyo Pambudi, Setyo Sarwanto Moersidik, and Mahawan Karuniasa
85
Number
Sub Subwatershe
d
Sub Subwatershed
Area
Q Return Period
Q Return Period
Q Return Period
Q Return Period
Q Return Period
1.01 Year 2 Years 5 Years 10 Years 25 Years
(Ha) (m3/sec) (m3/sec) (m3/sec) (m3/sec) (m3/sec)
28 28 1674,48 6,867159 9,829125 11,50434
3 12,56907
6 13,87825
7
29 29 4468,48 13,21674
7 18,91744
1 22,14161
9 24,19083
6 26,71052
7
30 30 2922,56 15,19414
3 21,74773
2 25,45428
9 27,81009
5 30,70676
3
31 31 4546,80 24,91082
8 35,65545
4 41,73236
2 45,59471
1 50,34380
5
Source: Analysis Results, 2019
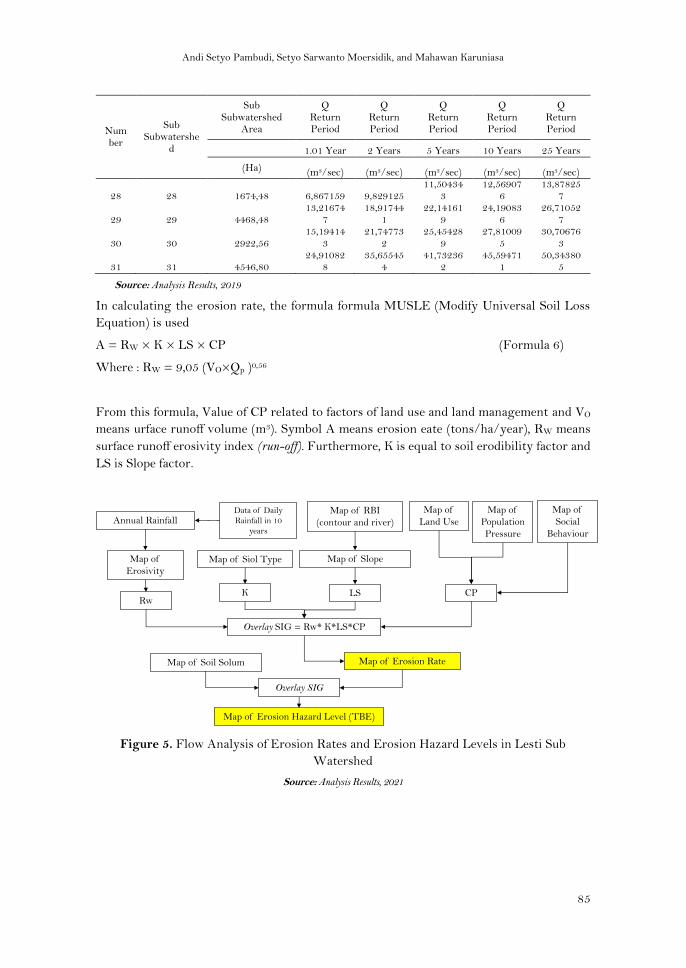
In calculating the erosion rate, the formula formula MUSLE (Modify Universal Soil Loss
Equation) is used
A = RW × K × LS × CP (Formula 6)
Where : RW = 9,05 (VO×Qp )0,56
From this formula, Value of CP related to factors of land use and land management and VO
means urface runoff volume (m3). Symbol A means erosion eate (tons/ha/year), RW means
surface runoff erosivity index (run-off). Furthermore, K is equal to soil erodibility factor and
LS is Slope factor.
Figure 5. Flow Analysis of Erosion Rates and Erosion Hazard Levels in Lesti Sub
Watershed
Source: Analysis Results, 2021
Map of
Erosivity
Annual Rainfall
Map of Erosion Rate
Map of RBI
(contour and river)
Rw
Overlay SIG = Rw* K*LS*CP
Map of Erosion Hazard Level (TBE)
Data of Daily
Rainfall in 10
years
Map of Soil Solum
Map of Siol Type Map of Slope
Map of
Land Use
K LS CP
Overlay SIG
Map of
Population
Pressure
Map of
Social
Behaviour
Andi Setyo Pambudi, Setyo Sarwanto Moersidik, and Mahawan Karuniasa
86
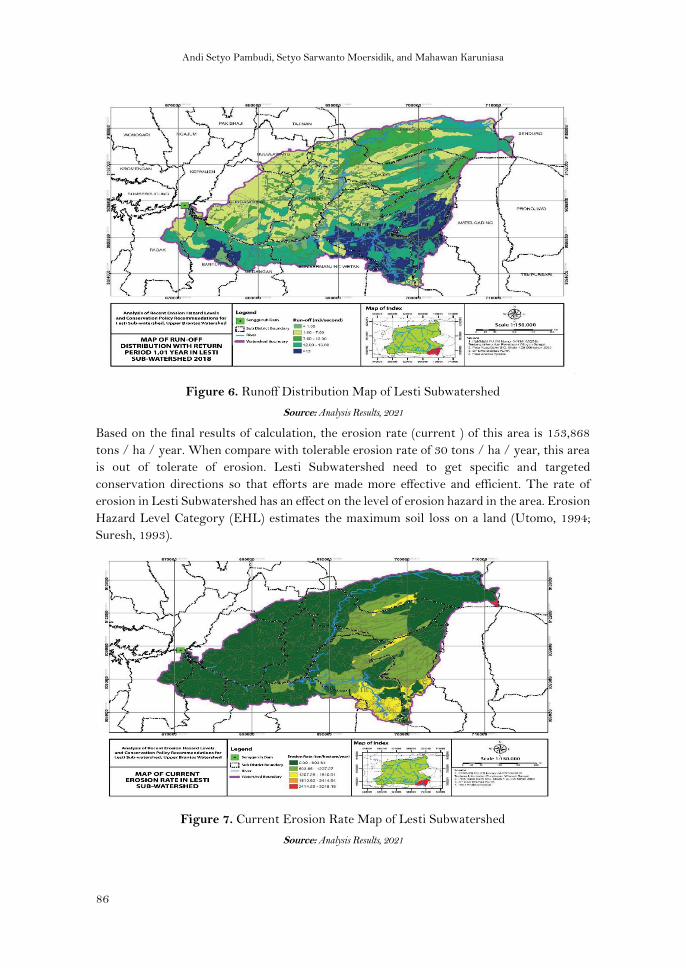
Figure 6. Runoff Distribution Map of Lesti Subwatershed
Source: Analysis Results, 2021
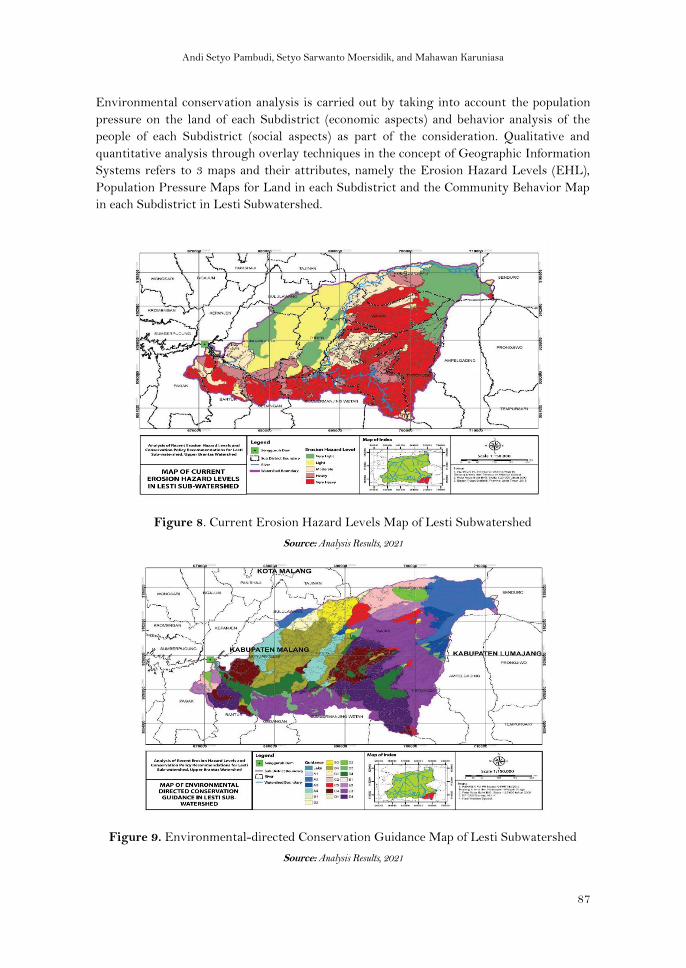
Based on the final results of calculation, the erosion rate (current ) of this area is 153,868
tons / ha / year. When compare with tolerable erosion rate of 30 tons / ha / year, this area
is out of tolerate of erosion. Lesti Subwatershed need to get specific and targeted
conservation directions so that efforts are made more effective and efficient. The rate of
erosion in Lesti Subwatershed has an effect on the level of erosion hazard in the area. Erosion
Hazard Level Category (EHL) estimates the maximum soil loss on a land (Utomo, 1994;
Suresh, 1993).
Figure 7. Current Erosion Rate Map of Lesti Subwatershed
Source: Analysis Results, 2021
Andi Setyo Pambudi, Setyo Sarwanto Moersidik, and Mahawan Karuniasa
87
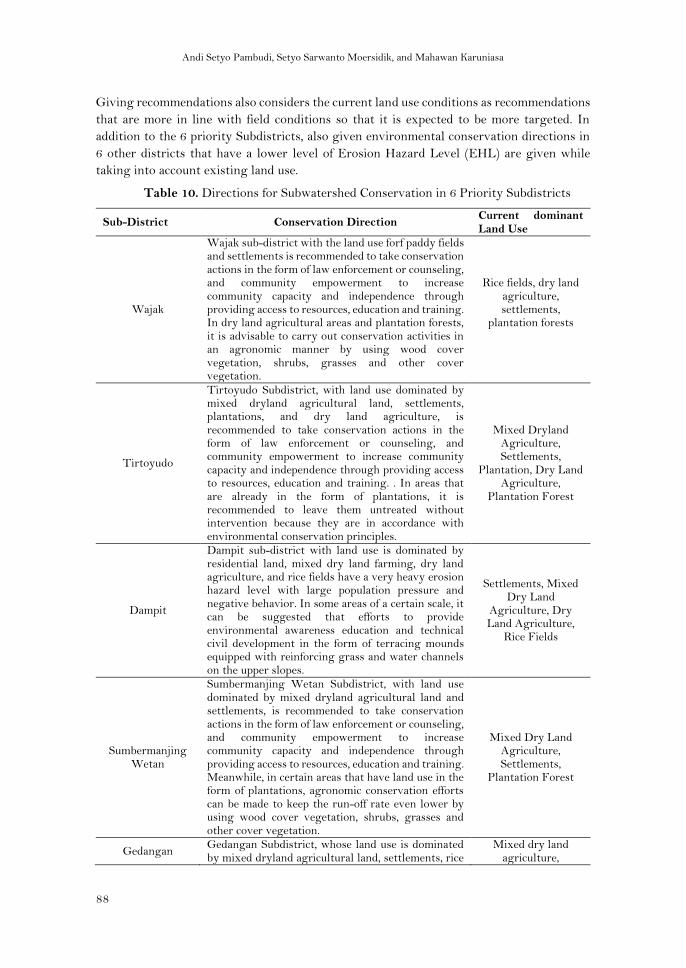
Environmental conservation analysis is carried out by taking into account the population
pressure on the land of each Subdistrict (economic aspects) and behavior analysis of the
people of each Subdistrict (social aspects) as part of the consideration. Qualitative and
quantitative analysis through overlay techniques in the concept of Geographic Information
Systems refers to 3 maps and their attributes, namely the Erosion Hazard Levels (EHL),
Population Pressure Maps for Land in each Subdistrict and the Community Behavior Map
in each Subdistrict in Lesti Subwatershed.
Figure 8. Current Erosion Hazard Levels Map of Lesti Subwatershed
Source: Analysis Results, 2021
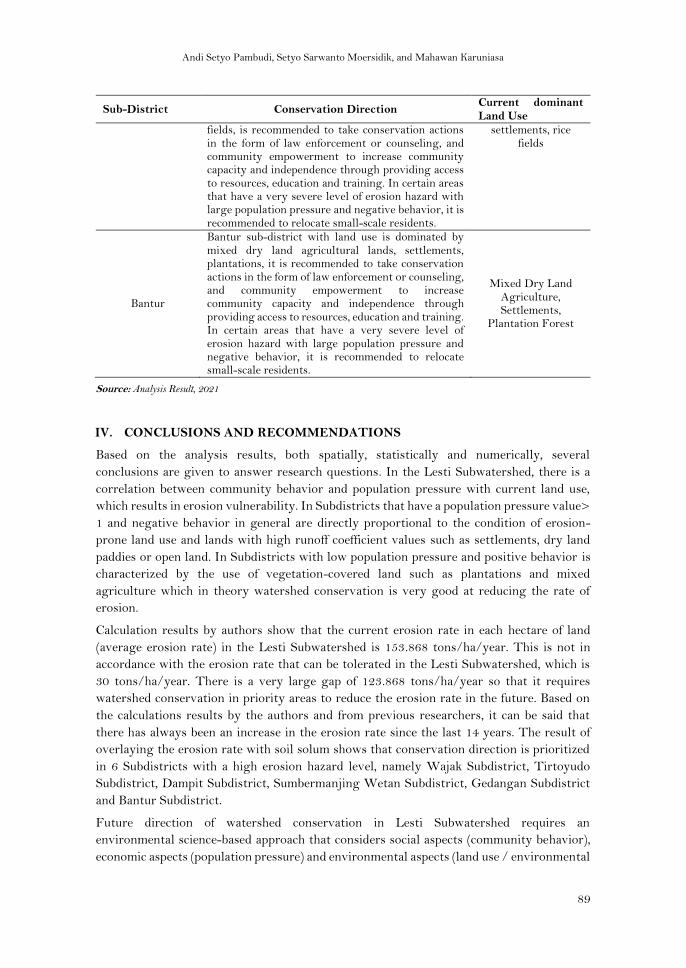
Figure 9. Environmental-directed Conservation Guidance Map of Lesti Subwatershed
Source: Analysis Results, 2021
Andi Setyo Pambudi, Setyo Sarwanto Moersidik, and Mahawan Karuniasa
88
Giving recommendations also considers the current land use conditions as recommendations
that are more in line with field conditions so that it is expected to be more targeted. In
addition to the 6 priority Subdistricts, also given environmental conservation directions in
6 other districts that have a lower level of Erosion Hazard Level (EHL) are given while
taking into account existing land use.
Table 10. Directions for Subwatershed Conservation in 6 Priority Subdistricts
Sub-District Conservation Direction Current dominant Land Use
Wajak
Wajak sub-district with the land use forf paddy fields and settlements is recommended to take conservation actions in the form of law enforcement or counseling, and community empowerment to increase community capacity and independence through providing access to resources, education and training. In dry land agricultural areas and plantation forests, it is advisable to carry out conservation activities in an agronomic manner by using wood cover vegetation, shrubs, grasses and other cover vegetation.
Rice fields, dry land agriculture, settlements,
plantation forests
Tirtoyudo
Tirtoyudo Subdistrict, with land use dominated by mixed dryland agricultural land, settlements, plantations, and dry land agriculture, is recommended to take conservation actions in the form of law enforcement or counseling, and community empowerment to increase community capacity and independence through providing access to resources, education and training. . In areas that are already in the form of plantations, it is recommended to leave them untreated without intervention because they are in accordance with environmental conservation principles.
Mixed Dryland Agriculture, Settlements,
Plantation, Dry Land Agriculture,
Plantation Forest
Dampit
Dampit sub-district with land use is dominated by residential land, mixed dry land farming, dry land agriculture, and rice fields have a very heavy erosion hazard level with large population pressure and negative behavior. In some areas of a certain scale, it can be suggested that efforts to provide environmental awareness education and technical civil development in the form of terracing mounds equipped with reinforcing grass and water channels on the upper slopes.
Settlements, Mixed Dry Land
Agriculture, Dry Land Agriculture,
Rice Fields
Sumbermanjing Wetan
Sumbermanjing Wetan Subdistrict, with land use dominated by mixed dryland agricultural land and settlements, is recommended to take conservation actions in the form of law enforcement or counseling, and community empowerment to increase community capacity and independence through providing access to resources, education and training. Meanwhile, in certain areas that have land use in the form of plantations, agronomic conservation efforts can be made to keep the run-off rate even lower by using wood cover vegetation, shrubs, grasses and other cover vegetation.
Mixed Dry Land Agriculture, Settlements,
Plantation Forest
Gedangan Gedangan Subdistrict, whose land use is dominated by mixed dryland agricultural land, settlements, rice
Mixed dry land agriculture,
Andi Setyo Pambudi, Setyo Sarwanto Moersidik, and Mahawan Karuniasa
89
Sub-District Conservation Direction Current dominant Land Use
fields, is recommended to take conservation actions in the form of law enforcement or counseling, and community empowerment to increase community capacity and independence through providing access to resources, education and training. In certain areas that have a very severe level of erosion hazard with large population pressure and negative behavior, it is recommended to relocate small-scale residents.
settlements, rice fields
Bantur
Bantur sub-district with land use is dominated by mixed dry land agricultural lands, settlements, plantations, it is recommended to take conservation actions in the form of law enforcement or counseling, and community empowerment to increase community capacity and independence through providing access to resources, education and training. In certain areas that have a very severe level of erosion hazard with large population pressure and negative behavior, it is recommended to relocate small-scale residents.
Mixed Dry Land Agriculture, Settlements,
Plantation Forest
Source: Analysis Result, 2021
IV. CONCLUSIONS AND RECOMMENDATIONS
Based on the analysis results, both spatially, statistically and numerically, several
conclusions are given to answer research questions. In the Lesti Subwatershed, there is a
correlation between community behavior and population pressure with current land use,
which results in erosion vulnerability. In Subdistricts that have a population pressure value>
1 and negative behavior in general are directly proportional to the condition of erosion-
prone land use and lands with high runoff coefficient values such as settlements, dry land
paddies or open land. In Subdistricts with low population pressure and positive behavior is
characterized by the use of vegetation-covered land such as plantations and mixed
agriculture which in theory watershed conservation is very good at reducing the rate of
erosion.
Calculation results by authors show that the current erosion rate in each hectare of land
(average erosion rate) in the Lesti Subwatershed is 153.868 tons/ha/year. This is not in
accordance with the erosion rate that can be tolerated in the Lesti Subwatershed, which is
30 tons/ha/year. There is a very large gap of 123.868 tons/ha/year so that it requires
watershed conservation in priority areas to reduce the erosion rate in the future. Based on
the calculations results by the authors and from previous researchers, it can be said that
there has always been an increase in the erosion rate since the last 14 years. The result of
overlaying the erosion rate with soil solum shows that conservation direction is prioritized
in 6 Subdistricts with a high erosion hazard level, namely Wajak Subdistrict, Tirtoyudo
Subdistrict, Dampit Subdistrict, Sumbermanjing Wetan Subdistrict, Gedangan Subdistrict
and Bantur Subdistrict.
Future direction of watershed conservation in Lesti Subwatershed requires an
environmental science-based approach that considers social aspects (community behavior),
economic aspects (population pressure) and environmental aspects (land use / environmental
Andi Setyo Pambudi, Setyo Sarwanto Moersidik, and Mahawan Karuniasa
90
carrying capacity). There are 2 principles of environmental science that can be considered in
the future direction of conservation, namely the principle of interaction and sustainability.
Watershed conservation paradigm as a derivative of Law no. 37 of 2014 in the form of a
Draft of Government Regulation currently being compiled by the government needs to pay
more attention to ecological concepts that involve the fulfillment of human and natural needs
in more synergy according to their respective roles. This research found a new idea, namely
environmental education and relocation of small-scale population that can be input into the
Draft of Government Regulation. Relocation of small-scale population is needed especially
in priority areas where population pressure is high, community behavior is negative and the
erosion hazard level is very heavy. Nevertheless, the selection of new locations resulting
from relocation must still consider aspects of social, economic and environmental needs so
as not to cause other problems in the future.
Based on the conclusions, several suggestions/recommendations can be established, both
per conservation priority area, and general recommendations from the point of view of
environmental science, as follows:
a) Wajak Subdistrict with the use of paddy fields and settlements are advised to take
conservation measures in the form of law enforcement or counseling, and community
empowerment to increase the ability and independence of the community through providing
access to resources, education, and training. In dryland agricultural areas and plantations, it
is recommended to carry out agronomic conservation activities using cover vegetation of
woody plants, shrubs, grasses, and other cover vegetation.
b) Tirtoyudo Subdistrict with land use dominated by mixed upland, settlements, plantation,
and dryland agriculture is recommended to take conservation measures in the form of law
enforcement or counseling, and community empowerment to increase the ability and
independence of the community through providing access to resources, education, and
training. In areas that are already in the form of plantations, it is recommended to be left
naturally without intervention because it is following the environmental conservation
principles
c) Dampit Subdistrict with land use dominated by settlement, mixed upland agriculture,
dryland agriculture, paddy fields have a very high erosion hazard level with large population
pressure and negative behavior is recommended for gradual relocation of the population. In
some areas of a certain scale, it can be suggested efforts to provide environmental awareness
education and technical civil development in the form of making guludan terraces which are
equipped with reinforcement grass and waterways on the upper slopes
d) Sumbermanjing Wetan Subdistrict with land use dominated by mixed upland agriculture
land and settlement, it is recommended to carry out conservation actions in the form of law
enforcement or counseling, and community empowerment in the context of increasing
community capacity and independence through providing access to resources, education, and
training. Meanwhile, in certain areas that have land use in the form of plantation forest,
agronomic conservation efforts can be made to keep the run-off rate even lower by using
cover vegetation of woody plants, shrubs, grasses, and other cover vegetation.
e) Gedangan Subdistrict with land use dominated by mixed upland agriculture, settlement,
paddy fields, it is recommended to take conservation measures in the form of law
Andi Setyo Pambudi, Setyo Sarwanto Moersidik, and Mahawan Karuniasa
91
enforcement or counseling, and community empowerment to increase the capacity and
independence of the community through providing access to resources, education, and
training. In certain areas which have a very high erosion hazard level with large population
pressure and negative behavior, it is recommended to relocate a small-scale population.
f) Bantur Subdistrict with land use dominated by mixed upland agriculture lands,
settlements, plantations it is recommended to take conservation measures in the form of law
enforcement or counseling, and community empowerment to increase the capacity and
independence of the community through providing access to resources, education, and
training. In certain areas which have a very high erosion hazard level with large population
pressure and negative behavior, it is recommended to relocate a small-scale population.
g) When the conservation directives for behavioral improvement through environmental
education have been successful individually by the community, then it needs to be developed
into a value system that is integrated and wide-scale watershed scope. The value system in
the community such as cooperation needs to be encouraged again. This system already exists
in the lives of rural communities, but needs to be raised again on a broader scale, even if it
needs to be made a common philosophy in one goal namely environmental care for better
watershed health. Mutual cooperation is a shared value system of Indonesian society where
personal values such as volunteerism, togetherness, and tolerance can be accumulated in the
transformation of a unique joint movement.
References
Anache, J. A. A., Flanagan, D. C., Srivastava, A., & Wendland, E. C. (2018). Land use and
climate change impacts on runoff and soil erosion at the hillslope scale in the Brazilian
Cerrado. Science of The Total Environment, 622-623, 140–
151. doi:10.1016/j.scitotenv.2017.11.257
Ariani, D.R. & Harini, R. (2012). Tekanan penduduk terhadap lahan pertanian di kawasan
pertanian. Jurnal Bumi Indonesia. Volume 1, Nomor 3, Tahun 2012
Arsyad, Sitanala. (2006). Konservasi Tanah dan Air. Bogor : IPB Press
Asdak, Chay. (2010). Hidrologi dan Pengelolaan Daerah Aliran Sungai. Edisi Kelima (Revisi).
Yogyakarta: Gadjah Mada University Press.
Bappenas. (2015). Kajian Pengaruh Kebijakan Konservasi Sumber Daya Air di dalam DAS
Terhadap Sektor Kehutanan dan Sektor lainnya. Jakarta: Bappenas.
Bappenas. (2012). Kajian Analisis Perubahan Penggunaan Lahan di Ekosistem DAS dalam
Menunjang Ketahanan Air dan Ketahanan Pangan, Studi Kasus DAS Brantas. Jakarta:
Bappenas.
Bellfield, B., Leggett, M., Trivedi, M., Pareira, J., Gangga, A. (2016). How Can Indonesia
Achieve Water, Energy and Food Security?. Jakarta: WCS and Global Canopy Programme.
Bisri M., Limantara L.M., Prasetyorini L., Chasanawati D. (2017). Application of the Kineros
model for predicting the effect of land use on the surface run-off. Case study in Brantas
Subwatershed, Klojen District, Malang City, East Java Province of Indonesia. Journal
of Water and Land Development No. 35 p. 3–9. Polish Academy of Sciences (PAN) in
Warsaw.doi:10.1515/jwld-2017-0062.
Andi Setyo Pambudi, Setyo Sarwanto Moersidik, and Mahawan Karuniasa
92
Common, M. & Stagl, S. (2005). Ecological Economic: An Introduction. New York: Cambridge
University Press.
Djajasinga, V., Masrevaniah, A., & Juwono, P.T. (2012). Kajian Ekonomi Penanganan
Sedimen Pada Waduk Seri Di Sungai Brantas (Sengguruh , Sutami Dan Wlingi). Jurnal
Teknik Pengairan, Volume 3, Nomor 2, Desember 2012, hlm 143–152. E - ISSN : 2477-
6068. P - ISSN : 2086-1761. Universitas Brawijaya, Malang.
Euler, J., & Heldt, S. (2018). From information to participation and self-organization: Visions
for European river basin management. Science of The Total Environment, 621, 905–
914. doi:10.1016/j.scitotenv.2017.11.072
Firdaus, W., Sayekti, R.W., Prasetyorini, L. (2015). Studi Penentuan Kinerja Kelestarian
dan Sosial Pengelolaan DAS di Sub DAS Lesti. Jurnal Teknik Pengairan. E - ISSN :
2477-6068. P - ISSN : 2086-1761. Universitas Brawijaya, Malang.
Hardjowigeno S. (1995). Ilmu Tanah. Jakarta: Akademika Pressindo.
Heathcote, I. (1998). Integrated Watershed Management: Principles and Practice. New York:
John Wiley & Sons.
Jeloudar, F. T., Sepanlou, M.G., Emadi, S.M. (2018). Impact of land use change on soil
erodibility. Global Journal Environment Science Manage.,4(1): 59-70. DOI:
10.22034/gjesm.2018.04.01.006
Kindu, M., Schneider, T., Döllerer, M., Teketay, D., & Knoke, T. (2018). Scenario modelling
of land use/land cover changes in Munessa-Shashemene landscape of the Ethiopian
highlands. Science of The Total Environment, 622-623, 534–
546. https://doi.org/10.1016/j.scitotenv.2017.11.338
Ma’wa, J., Andawayanti, U., Juwono, P.T.(2015). Studi Pendugaan Sisa Usia Guna Waduk
Sengguruh dengan Pendekatan Erosi dan Sedimentasi. Jurnal Jurusan Pengairan
Fakultas Teknik Universitas Brawijaya.
Nabi, G., Hussain, F., Wu, R.-S., Nangia, V., Bibi, R., and Majid, A. (2017). Optimizing micro
watershed management for soil erosion control under various slope gradient and
vegetation cover conditions using SWAT modeling. Hydrol. Earth Syst. Sci. Discuss.,
https://doi.org/10.5194/hess-2017-532.
Pambudi, A.S., Moersidik, S.S., & Karuniasa, M. (2020). Keterkaitan Perilaku Masyarakat
dengan Penggunaan Lahan dan Erosivitas Limpasan Permukaan di Sub DAS Lesti,
Kab. Malang (Relationship between community behavior with land use and surface
runoff erosivity in Lesti Subwatershed, Malang District). Jurnal Penelitian Pengelolaan
Daerah Aliran Sungai (Journal of Watershed Management Research). Vol. 4, No. 2 (2020).
doi https://doi.org/10.20886/jppdas.2020.4.2.155-172
Pambudi, A.S. & Moersidik, S.S. (2019). Conservation direction based on estimation of
erosion in Lesti Subwatershed, Malang District. International Proceeding IOP Conference
Series: Earth and Environmental Science,Volume 399, The 1st International Seminar on
Natural Resources and Environmental Management 2019. Published under licence by IOP
Publishing Ltd. doi: 10.1088/1755-1315/399/1/012097
Pambudi, Andi Setyo. (2019). Watershed Management in Indonesia: A Regulation,
Institution, and Policy Review. The Indonesian Journal of Development Planning, 3(2),
185-202. ISSN: 2654-2625 (Online) ISSN: 2598-0807 (Print).
https://doi.org/10.36574/jpp.v3i2.74.
Andi Setyo Pambudi, Setyo Sarwanto Moersidik, and Mahawan Karuniasa
93
GoI. (2014a). Peraturan Presiden Nomor 2 Tahun 2015 tentang Rencana Pembangunan Jangka
Menengah Nasional Tahun 2015 – 2019. Jakarta
GoI. (2014b). Undang-undang Nomor 37 Tahun 2014 tentang Konservasi Tanah dan Air.
Jakarta
Reddy, V.R., Saharawat, Y. S., & George, B. (2017). Watershed management in South Asia:
A synoptic review. Journal of Hydrology, 551, 4–13. doi:10.1016/j.jhydrol.2017.05.043
Rusli, S., Widono, S., & Indriana, H. (2009), Tekanan penduduk dan, overshoot ekologi pulau
jawa, dan masa pemulihannya. Jurnal Sodalit: Jurnal Sosiologi Pedesaan. Vol. 3 No. 1
(2009). DOI: https://doi.org/10.22500/sodality.v3i1.5871
Sapci, O., & Considine, T. (2014). Evaluasi potensi degradasi lahan dengan menggunakan
Analisis kemampuan lahan dan tekanan penduduk terhadap lahan pertanian di
Kecamatan Kokap Kabupaten Kulon Progo. Forum Geografi , 1-12. Journal of
Behavioral and Experimental Economics The Sartohadi J, P. F.
Setyawan C. & Lee,.C.Y (2017). GIS application for sediment delivery ratio assessment in
tropical river basin. Journal of Scientific and Engineering Research, 2017, 4(4):116-122
Setyono & Prasetyo. (2012). Analisis Tingkat Bahaya Erosi Pada Sub DAS Lesti Kabupaten
Malang Menggunakan Sistem Informasi Geografis. Media Teknik Sipil, Volume 10,
Nomor 2, Agustus 2012: 114 – 127DOI: https://doi.org/10.22219/jmts.v10i2.1786
Soemarwoto, Otto. (1985). Ekologi, Lingkungan Hidup dan Pembangunan. Jakarta: Jambatan.
Soemarto, C.D. (1987). Hidrologi Teknik. Penerbit Usaha Nasional. Surabaya.
Suresh, R. (1993). Soil and Water Conservation Engineering. Nem Chand Jain, Delhi : Standard
Publisher Distributors Nai Sarak
Utomo, Wani Hadi. (1994). Erosi dan Konservasi Tanah. Malang: IKIP
Yupi, Haiki Mart. (2006). Studi Model WEPP (Water Erosion Prediction Project) Dalam Upaya
Pengaturan Fungsi Kawasan Pada Sub DAS Lesti Berbasis Sistem Informasi Geografi (SIG).
Tesis: Universitas Brawijaya
Top Related
Copyright © 2022 FDOKUMEN

