


Bahasa
Halaman
Hukum

Nuclear Engineering and Design 235 (2005) 1583–1605
Analysis of likelihood of lower head failure and ex-vesselfuel coolant interaction energetics for AP1000
H. Esmaili, M. Khatib-Rahbar∗
Energy Research Inc., P.O. Box 2034, Rockville, MD 20847-2034, USA
Received 29 August 2004; accepted 3 February 2005
Abstract
A one-dimensional model is formulated to assess the thermal response of the Westinghouse Advanced Plant (AP1000) lowerhead based on two bounding melt configurations. Melt Configuration I involves a stratified light metallic layer on top of a moltenceramic pool, and melt Configuration II represents the conditions that an additional heavy metal layer forms below the ceramicpool. The approach consists of the specification of initial conditions; determination of the mode, the size and the location oflower head failure based on heat transfer analyses; computer simulation of the fuel coolant interaction processes; and finally, anexamination of the impact of the uncertainties in the initial conditions and the model parameters on the fuel coolant interactionenergetics through a series of sensitivity calculations. The results of the calculations for melt Configuration I show that the heatflux remains below critical heat flux (CHF) in the molten oxide pool, but the heat flux in the light metal layer could exceed CHFbecause of the focusing effect associated with presence of the thin metallic layers. The thin metallic layers are associated withs ulationss .O be highlyu ssumed toi nded toa ads rangef few kPa st©
f
in-ctors
ndertities
0
maller quantities of the molten oxide in the lower plenum following the initial relocation into the lower head. The calchow that the lower head failure probability due to the focusing effect of the stratified metal layer ranges from∼0.04 to∼0.30n the other hand, the thermal failure of the lower head at the bottom location for melt Configuration II is assessed tonlikely. Based on the in-vessel retention analysis, the base case for the ex-vessel fuel coolant interaction (FCI) is a
nvolve a side failure of the vessel involving a metallic pour into the cavity water. The FCI sensitivity calculations intessess the implications of the uncertainties in initial conditions and the FCI modeling parameters show that the FCI lo
rom a few MPa to upward of 1000 MPa (maximum pool pressure) with corresponding impulse loads ranging from ao a few hundred kPa s.
2005 Elsevier B.V. All rights reserved.
∗ Corresponding author. Tel.: +1 301 881 0866;ax: +1 301 881 0867.
E-mail address:[email protected] (M. Khatib-Rahbar).
1. Introduction
The physical processes involved in the latevessel phase of severe accidents in light water rea(LWRs) are very complex and remain uncertain. Upostulated severe accident conditions, large quan
029-5493/$ – see front matter © 2005 Elsevier B.V. All rights reserved.
doi:10.1016/j.nucengdes.2005.02.003
1584 H. Esmaili, M. Khatib-Rahbar / Nuclear Engineering and Design 235 (2005) 1583–1605
Nomenclature
Ah,b heat transfer area between the heavymetal layer and the vessel (m2)
Ah,t heat transfer area between the heavymetal layer and the lower crust (m2)
Al,b heat transfer area of between the uppercrust of the ceramic pool and the lightmetallic layer (m2)
Al,t heat transfer area between the lightmetallic layer and the reactor internal at-mosphere (m2)
Al,w heat transfer area between the lightmetallic layer and the adjacent reactorvessel (m2)
Ao,b heat transfer area between the oxide pooland the bottom crust of the ceramic pool(m2)
Ao,t heat transfer area between the oxide pooland the top crust (m2)
Ao,w heat transfer area between the oxide pooland the crust layer adjacent to the vesselwall (m2)
As total surface area of all core internalstructures exposed to the molten pool(m2)
Aw,i heat transfer area between the vessel walland the crust of the oxide pool adjacentto it (m2)
H height of the molten layer (m)hboil coefficient for nucleate pool boiling heat
transfer (W/m2 K3)hl,b heat transfer coefficient at the light
metallic layer-lower oxide crust juncture(W/m2 K)
hl,t heat transfer coefficient at the top surfaceof the light metallic layer (W/m2 K)
hl,w heat transfer coefficient at the light metallayer, vessel wall juncture (W/m2 K)
ho,b heat transfer coefficient at the oxidepool-lower crust juncture (W/m2 K)
ho,t heat transfer coefficient at the oxidepool-upper crust juncture (W/m2 K)
ho,w heat transfer coefficient at the oxidepool-wall crust juncture (W/m2 K)
kc thermal conductivity of the crust(W/m K)
kw thermal conductivity of the vessel wall(W/m K)
Nu Nusselt numberQ′′′
c volumetric heat generation rate in the ox-ide crust (W/m3)
Q′′′h volumetric heat generation rate in the
heavy metal layer (W/m3)Q′′′
l volumetric heat generation rate in thelight metal layer (W/m3)
Q′′′o volumetric heat generation rate in the ox-
ide pool (W/m3)q′′CHF critical heat flux (CHF) (W/m2)q′′h,b heat flux from the heavy metal layer to
the bottom of the vessel (W/m2)q′′h,t heat flux from the lower oxide pool crust
into the heavy metal layer (W/m2)q′′l,b heat flux from the top oxide pool crust
into the top light metal layer (W/m2)q′′l,t heat flux from the top light metal layer
into the internal atmosphere of the reac-tor (W/m2)
q′′l,w heat flux from the top light metal layer
into the vessel wall (W/m2)q′′o,b heat flux from the oxide pool into the
lower crust (W/m2)q′′o,t heat flux from the oxide pool into the top
crust (W/m2)q′′o,w heat flux from the oxide pool into the
crust adjacent to the vessel wall (W/m2)q′′w,i heat flux from the oxide pool crust that
exists adjacent to the vessel wall into thevessel wall (W/m2)
q′′w,o heat flux from the vessel wall into thecavity water (W/m2)
R lower head radius (m)Ra Rayleigh number (based on internal heat
generation)T l
b bulk temperature of the light metal layer(K)
Th,t temperature at the heavy metal layer-bottom crust juncture (K)
H. Esmaili, M. Khatib-Rahbar / Nuclear Engineering and Design 235 (2005) 1583–1605 1585
Tl,t temperature at the light metal layer-atmosphere interface (K)
Tl,b temperature at the light metal layer-lower oxide crust juncture (K)
T om melting temperature of the oxide pool
(K)T v
m melting temperature of vessel wall (K)T o
max maximum temperature of the oxide pool(K)
Ts temperature of internal structures (K)Tsat saturation temperature of cavity water
(K)Tw,i inside vessel wall temperature (K)Tw,o outside vessel wall temperature (K)Vc,l volume of the lower oxide crust (m3)Vc,u volume of the upper oxide crust (m3)Vc,w volume of the oxide crust that exists ad-
jacent to the vessel wall (m3)Vh volume of the heavy metal layer (m3)Vl volume of the light metal layer (m3)Vo volume of the oxide pool (m3)
Greek symbolsδs vessel wall thickness (m)δc oxide crust thickness (m) (further in-
dexed by u, l and w for upper, lower andwall)
εt emissivity at the light metal layer-atmosphere interface
εs emissivity of the core internal structuresσ Stefan–Boltzmann constant
(5.672× 10⁻⁸ W/m2 K4)
of molten core material may relocate to the lowerplenum of the reactor pressure vessel (RPV) where itinteracts with water, lower plenum and RPV structures.The heat transfer from the molten debris causes evapo-ration of any remaining water and heat-up of the lowerplenum and vessel structures. If the reactor cavity isflooded before melt relocation into the lower plenum,the vessel wall would be initially cool and the outervessel temperature would remain close to the cavitywater saturation temperature. Nucleate pool boiling ofthe cavity water is an efficient mechanism for heat re-moval from the molten debris in the lower plenum.
Provided that adequate heat removal could not beachieved, and if the local heat flux at the vessel wallwere to exceed the critical heat flux, vessel failurewould be expected.
Following the structural failure of the lower head,the molten core debris will pour into the reactor cavitywhere the potential for energetic fuel–coolant interac-tion (FCI) with cavity water exists. This energetic FCIis initiated by transfer of energy from the hot liquid(fuel) to the colder liquid (coolant) during liquid–liquidcontact resulting in rapid steam generation that couldlead to a high local pressure. The dynamic loads on thecavity wall and the RPV structures could potentiallylead to the failure of the cavity wall and/or subject-ing the primary system piping connected to the steamgenerators and the main steam lines penetrating thecontainment boundary, to severe mechanical loads thatcould challenge the containment integrity.
The core debris attack on the RPV lower head andthe in-vessel retention (IVR) of molten core debris in-side RPV lower head through external cooling by cavitywater has been the subject of numerous numerical andexperimental investigations as exemplified byTurlandand Morgan (1983), Park and Dhir (1991), O’Brienand Hawkes (1991), Henry and Fauske (1993), Turland(1994), Theofanous et al. (1994a,b), Khatib-Rahbaret al. (1996), Esmaili et al. (1996), Asfia and Dhir(1996), Theofanous et al. (1996), Rempe et al. (1997),Kymfilfiinen et al. (1997), Theofanous and Angelini(2000), Sehgal et al. (2003)andSeiler et al. (2003),w ns,m er ins ure-m thee
onalms fol-l dela eadw mi-la heR res-eF e oft tion-i and
hich include one-, and two-dimensional calculatioeasurements of natural convection heat transf
imulated molten pool configurations, and measents of critical heat flux applicable to boiling on
xternal surface of the RPV lower head.In one of the earliest studies, a one-dimensi
odel was proposed byO’Brien and Hawkes (1991)totudy the thermal response of the RPV lower headowing core relocation to the lower plenum. The mollowed for the spherical geometry of the lower hith convective heat transfer in the molten pool. A si
ar one-dimensional model was developed byEsmaili etl. (1996). The capability of the external cooling of tPV lower head to prevent failure considering the pnce of the RPV insulation was studied byHenry andauske (1993). The analysis of the thermal respons
he lower head was very simple assuming a parting of the heat transfer in the molten ceramic pool
1586 H. Esmaili, M. Khatib-Rahbar / Nuclear Engineering and Design 235 (2005) 1583–1605
one-dimensional conduction in the vessel wall. The fo-cus of the analysis (Henry and Fauske, 1993) was toassess the water inflow through the insulation and thetwo-phase heat removal in the gap between the insula-tion and the vessel wall.
The mathematical models used for the thermal re-sponse of the lower head have included both one-dimensional (O’Brien and Hawkes, 1991; Esmaili etal., 1996; Theofanous et al., 1996; Rempe et al., 1997)and two-dimensional models (Park and Dhir, 1991;Khatib-Rahbar et al., 1996). A comparison of the one-dimensional and two-dimensional models byEsmailiet al. (1996)showed that a one-dimensional heat con-duction model of the lower head performed adequatelyand the second order effects using a two-dimensionalmodel were found to be small considering the uncer-tainties associated with the late phase in-vessel meltprogression.
The study of the in-vessel retention under externallycooled conditions requires closure relations for heattransfer in the molten ceramic and metallic regions.Allison et al. (1994)provided a detailed review ofthe heat transfer correlations for volumetrically heatedpools. This review (Allison et al., 1994) included exper-imental and numerical studies that had been reportedin the literature for flat surfaces and curved configu-rations. A summary of the various heat transfer cor-relations for the ceramic pool and the stratified lightmolten metallic layer is also provided byTheofanous etal. (1996)andRempe et al. (1997). In the present study,r beenm
ail-u ther ter,p rac-t
insd un-c FCIm entyyt s,1 s.T en-t tain-t ajoru lude
the water pool sub-cooling, the lower head failure sizeand location, and the melt composition and tempera-ture.
The main objective of the present paper is to presenta simple mechanistic model based on the existingconstitutive relations, originally developed for AP600(Khatib-Rahbar et al., 1996; Esmaili et al., 1996) thatis used together with a synthesis of severe core dam-age phenomenology, to arrive at a likelihood of vesselfailure for AP1000 (Esmaili and Khatib-Rahbar, 2004).In addition, the present study provides an assessmentof the ex-vessel fuel coolant interaction energetics fol-lowing a similar approach that was used for AP600(Khatib-Rahbar et al., 1996).
2. Mathematical model for IVR analysis
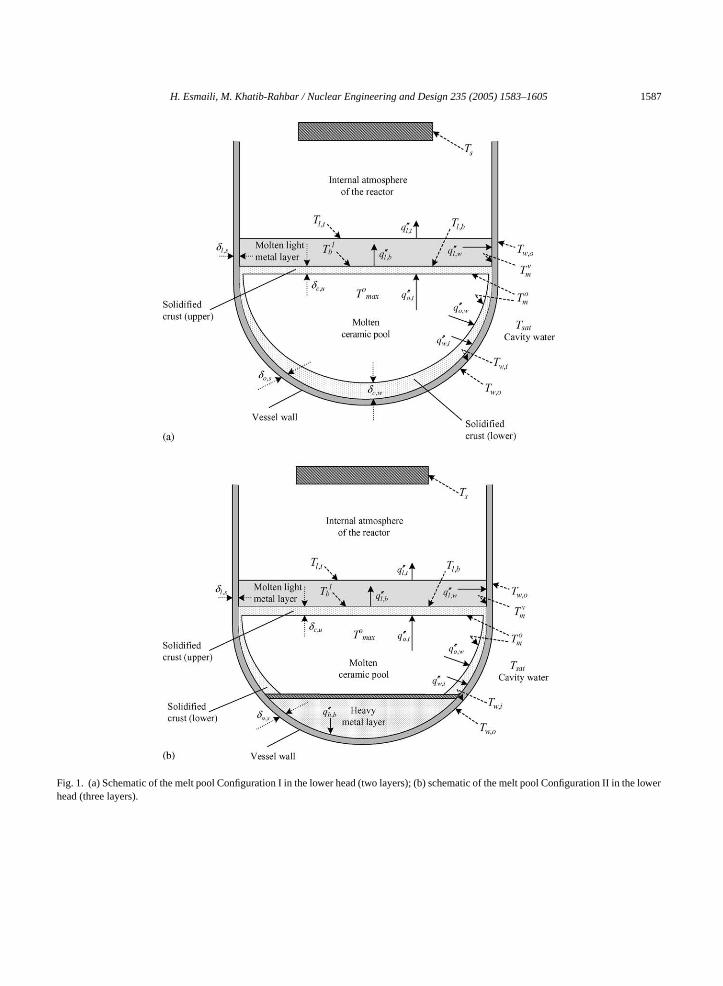
The model is based on a conceptual representation oftwo melt configurations shown inFig. 1. The melt Con-figuration I is assumed to represent a two-layer meltpool with a light metallic layer of Fe–Zr on top of aceramic pool of UO2–ZrO2 as shown inFig. 1a. Onthe other hand, the melt Configuration II is assumed torepresent a stratified molten pool consisting of a densemetallic layer of Zr–U––Fe (in the bottom), a ceramiclayer of UO2–ZrO2 (in the middle), and a light metalliclayer of Fe–Zr (on top) as shown inFig. 1b. The ceramiclayer does not contain any metals, and the top metal-lic layer is assumed to contain no metallic uranium. Iti ltenpe werh n isc
2
ittenf
1 ible;2 yer
st;
3 i.e.,on-
eferences to these heat transfer correlations haveade where appropriate.If the RPV lower head could not be cooled, the f
re of the lower head is a certainty, resulting inelocation of molten core debris into the cavity waotentially leading to an energetic fuel coolant inte
ion.The modeling of fuel coolant interactions rema
ifficult and analysis results are also subject to largeertainties. Examples of one- and two-dimensionalodels that have been developed over the last tw
ears include the TEXAS code (Young, 1982) andhe PM-ALPHA/ESPROSE (Yuen and Theofanou995; Theofanous and Yuen, 1995) computer codehe FCI models are evolving as additional experim
al data become available. In addition to the unceries inherent in modeling FCI processes, other mncertainties that affect the explosion energetic inc
s recognized that other configurations of the moool can be also envisioned (Rempe et al., 1997); how-ver, in terms of the potential implications on the loead integrity, the present three-layer configuratioonsidered to be adequate.
.1. Governing equations
The conservation of energy equation can be wror each layer subject to the following limitations:
. The heat generation in the vessel wall is neglig
. The radiation heat transfer from the light metal latop surface is not sufficient to form a metallic cruand
. The potential impacts of materials interactions (heat of mixing and autocatalytic effects) are not csidered.
H. Esmaili, M. Khatib-Rahbar / Nuclear Engineering and Design 235 (2005) 1583–1605 1587
Fig. 1. (a) Schematic of the melt pool Configuration I in the lower head (two layers); (b) schematic of the melt pool Configuration II in the lowerhead (three layers).
1588 H. Esmaili, M. Khatib-Rahbar / Nuclear Engineering and Design 235 (2005) 1583–1605
Top light metal layer
Q′′′l Vl + q′′l,bAl,b = q′′l,tAl,t + q′′l,wAl,w (1)
Middle ceramic(oxide) pool
Q′′′o Vo = q′′o,tAo,t + q′′o,wAo,w + q′′o,bAo,b (2)
q′′l,bAl,b = Q′′′c Vc,u + q′′o,tAo,t (3)
q′′w,iAw,i = q′′o,wAo,w +Q′′′c Vc,w (4)
q′′h,tAh,t = q′′o,bAo,b +Q′′′c Vc,l (5)
Bottom heavy metal layer
Q′′′h Vh + q′′h,tAh,t = q′′h,bAh,b (6)
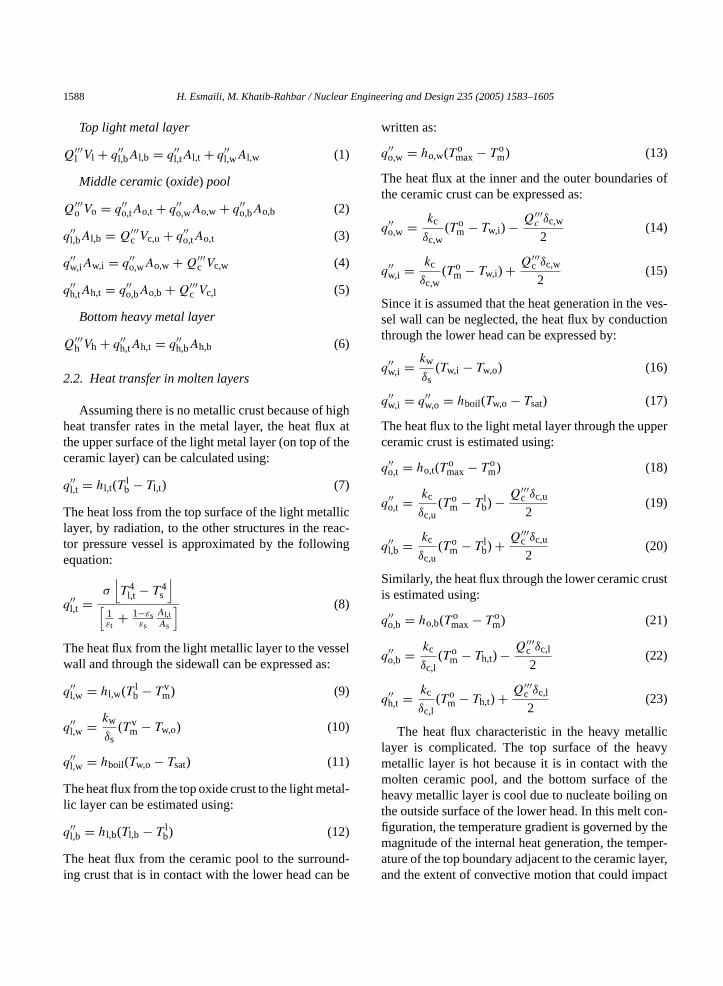
2.2. Heat transfer in molten layers
Assuming there is no metallic crust because of highheat transfer rates in the metal layer, the heat flux atthe upper surface of the light metal layer (on top of theceramic layer) can be calculated using:
q′′l,t = hl,t(Tlb − Tl,t) (7)
The heat loss from the top surface of the light metalliclayer, by radiation, to the other structures in the reac-tor pressure vessel is approximated by the followingequation:
qσ⌊T 4 − T 4
⌋
T elw
q
q
q
T l-l
q
T d-i be
written as:
q′′o,w = ho,w(T omax − T o
m) (13)
The heat flux at the inner and the outer boundaries ofthe ceramic crust can be expressed as:
q′′o,w = kc
δc,w(T o
m − Tw,i) − Q′′′c δc,w
2(14)
q′′w,i = kc
δc,w(T o
m − Tw,i) + Q′′′c δc,w
2(15)
Since it is assumed that the heat generation in the ves-sel wall can be neglected, the heat flux by conductionthrough the lower head can be expressed by:
q′′w,i = kw
δs(Tw,i − Tw,o) (16)
q′′w,i = q′′w,o = hboil(Tw,o − Tsat) (17)
The heat flux to the light metal layer through the upperceramic crust is estimated using:
q′′o,t = ho,t(Tomax − T o
m) (18)
q′′o,t = kc
δc,u(T o
m − T lb) − Q′′′
c δc,u
2(19)
q′′l,b = kc
δc,u(T o
m − T lb) + Q′′′
c δc,u
2(20)
Similarly, the heat flux through the lower ceramic crusti
q
q
q
llicl avym them theh ont on-fi them per-a yer,a act
′′l,t = l,t s[
1εt
+ 1−εsεs
Al,tAs
] (8)
he heat flux from the light metallic layer to the vessall and through the sidewall can be expressed as:
′′l,w = hl,w(T l
b − T vm) (9)
′′l,w = kw
δs(T v
m − Tw,o) (10)
′′l,w = hboil(Tw,o − Tsat) (11)
he heat flux from the top oxide crust to the light metaic layer can be estimated using:
′′l,b = hl,b(Tl,b − T l
b) (12)
he heat flux from the ceramic pool to the surrounng crust that is in contact with the lower head can
s estimated using:
′′o,b = ho,b(T
omax − T o
m) (21)
′′o,b = kc
δc,l(T o
m − Th,t) − Q′′′c δc,l
2(22)
′′h,t = kc
δc,l(T o
m − Th,t) + Q′′′c δc,l
2(23)
The heat flux characteristic in the heavy metaayer is complicated. The top surface of the he
etallic layer is hot because it is in contact witholten ceramic pool, and the bottom surface ofeavy metallic layer is cool due to nucleate boiling
he outside surface of the lower head. In this melt cguration, the temperature gradient is governed byagnitude of the internal heat generation, the temture of the top boundary adjacent to the ceramic land the extent of convective motion that could imp
H. Esmaili, M. Khatib-Rahbar / Nuclear Engineering and Design 235 (2005) 1583–1605 1589
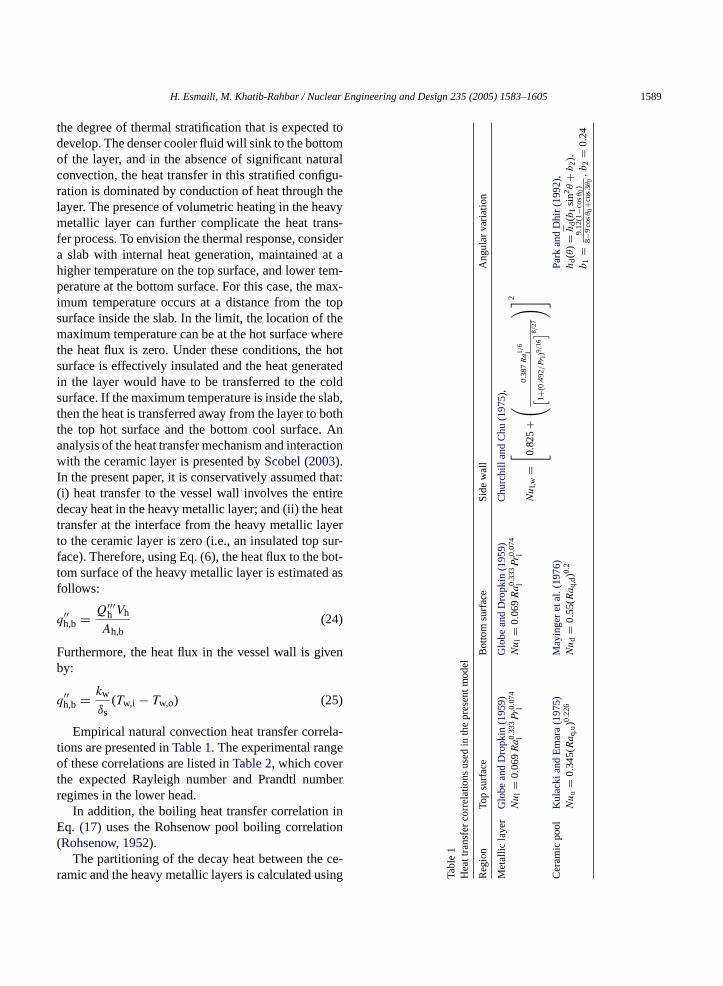
the degree of thermal stratification that is expected todevelop. The denser cooler fluid will sink to the bottomof the layer, and in the absence of significant naturalconvection, the heat transfer in this stratified configu-ration is dominated by conduction of heat through thelayer. The presence of volumetric heating in the heavymetallic layer can further complicate the heat trans-fer process. To envision the thermal response, considera slab with internal heat generation, maintained at ahigher temperature on the top surface, and lower tem-perature at the bottom surface. For this case, the max-imum temperature occurs at a distance from the topsurface inside the slab. In the limit, the location of themaximum temperature can be at the hot surface wherethe heat flux is zero. Under these conditions, the hotsurface is effectively insulated and the heat generatedin the layer would have to be transferred to the coldsurface. If the maximum temperature is inside the slab,then the heat is transferred away from the layer to boththe top hot surface and the bottom cool surface. Ananalysis of the heat transfer mechanism and interactionwith the ceramic layer is presented byScobel (2003).In the present paper, it is conservatively assumed that:(i) heat transfer to the vessel wall involves the entiredecay heat in the heavy metallic layer; and (ii) the heattransfer at the interface from the heavy metallic layerto the ceramic layer is zero (i.e., an insulated top sur-face). Therefore, using Eq.(6), the heat flux to the bot-tom surface of the heavy metallic layer is estimated asfollows:
q
F venb
q
ela-t eo rt berr
inE ion(
ce-r sing Ta
ble
1H
eatt
rans
fer
corr
elat
ions
used
inth
epr
esen
tmod
el
Reg
ion
Top
surf
ace
Bot
tom
surf
ace
Sid
ew
all
Ang
ular
varia
tion
Met
allic
laye
rG
lobe
and
Dro
pkin
(195
9)Nu
l=
0.06
9Ra
0.33
3l
Pr0.0
74l
Glo
bean
dD
ropk
in(1
959)
Nu
l=
0.06
9Ra
0.33
3l
Pr0.0
74l
Chu
rchi
llan
dC
hu(1
975),
Nu
l,w=[ 0.
825+(
0.38
7Ra
1/6
l[ 1+
(0.4
92/Pr l
)9/16] 8/27)] 2
Cer
amic
pool
Kul
acki
and
Em
ara
(197
5)Nu
u=
0.34
5(Ra
q,u)
0.22
6M
ayin
ger
etal
.(19
76)
Nu
d=
0.55
(Ra
q,d)
0.2
Par
kan
dD
hir
(199
2),h
d(θ
)=h
d(b
1si
n2θ
+b
2),
b1
=9.
12(1
−cosθ 0
)8−
9co
sθ0+c
os3θ
0,b
2=
0.24
′′h,b = Q′′′
h Vh
Ah,b(24)
urthermore, the heat flux in the vessel wall is giy:
′′h,b = kw
δs(Tw,i − Tw,o) (25)
Empirical natural convection heat transfer corrions are presented inTable 1. The experimental rangf these correlations are listed inTable 2, which cove
he expected Rayleigh number and Prandtl numegimes in the lower head.
In addition, the boiling heat transfer correlationq. (17) uses the Rohsenow pool boiling correlat
Rohsenow, 1952).The partitioning of the decay heat between the
amic and the heavy metallic layers is calculated u
1590 H. Esmaili, M. Khatib-Rahbar / Nuclear Engineering and Design 235 (2005) 1583–1605
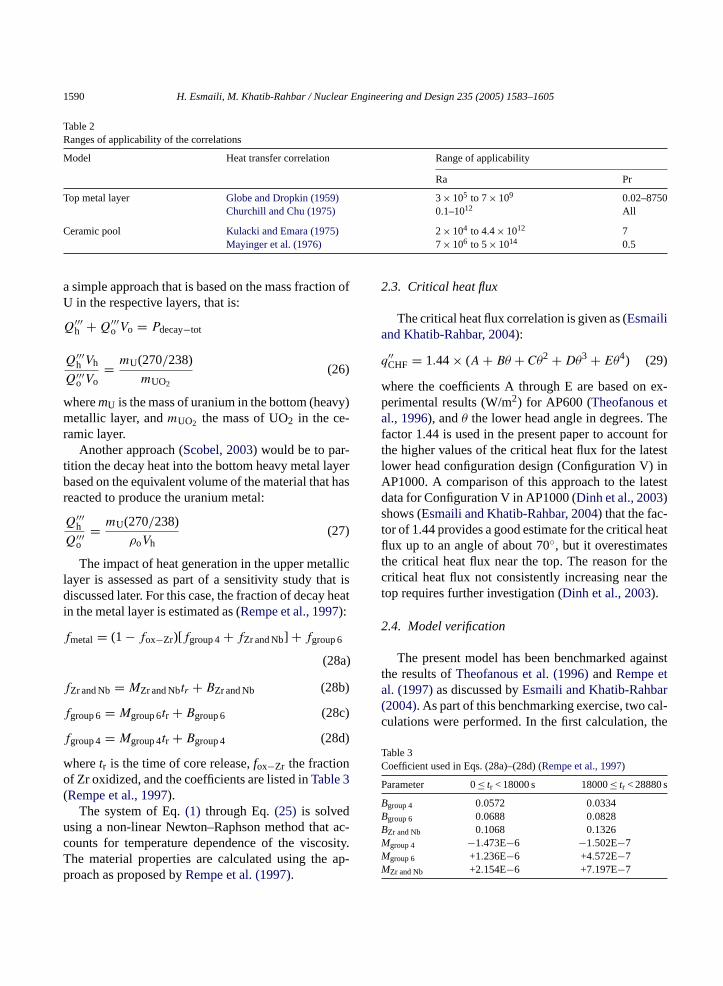
Table 2Ranges of applicability of the correlations
Model Heat transfer correlation Range of applicability
Ra Pr
Top metal layer Globe and Dropkin (1959) 3× 10⁵ to 7× 10⁹ 0.02–8750Churchill and Chu (1975) 0.1–1012 All
Ceramic pool Kulacki and Emara (1975) 2× 10⁴ to 4.4× 10¹² 7Mayinger et al. (1976) 7× 10⁶ to 5× 10¹⁴ 0.5
a simple approach that is based on the mass fraction ofU in the respective layers, that is:
Q′′′h +Q′′′
o Vo = Pdecay−tot
Q′′′h Vh
Q′′′o Vo
= mU(270/238)
mUO2
(26)
wheremU is the mass of uranium in the bottom (heavy)metallic layer, andmUO2 the mass of UO2 in the ce-ramic layer.
Another approach (Scobel, 2003) would be to par-tition the decay heat into the bottom heavy metal layerbased on the equivalent volume of the material that hasreacted to produce the uranium metal:
Q′′′h
Q′′′o
= mU(270/238)
ρoVh(27)
The impact of heat generation in the upper metalliclayer is assessed as part of a sensitivity study that isdiscussed later. For this case, the fraction of decay heatin the metal layer is estimated as (Rempe et al., 1997):
fmetal = (1 − fox−Zr)[fgroup 4+ fZr and Nb] + fgroup 6
(28a)
fZr and Nb= MZr and Nbtr + BZr and Nb (28b)
fgroup 6= Mgroup 6tr + Bgroup 6 (28c)
fgroup 4= Mgroup 4tr + Bgroup 4 (28d)
wo(
u t ac-c sity.T ap-p
2.3. Critical heat flux
The critical heat flux correlation is given as (Esmailiand Khatib-Rahbar, 2004):
q′′CHF = 1.44× (A+ Bθ + Cθ2 +Dθ3 + Eθ4) (29)
where the coefficients A through E are based on ex-perimental results (W/m2) for AP600 (Theofanous etal., 1996), andθ the lower head angle in degrees. Thefactor 1.44 is used in the present paper to account forthe higher values of the critical heat flux for the latestlower head configuration design (Configuration V) inAP1000. A comparison of this approach to the latestdata for Configuration V in AP1000 (Dinh et al., 2003)shows (Esmaili and Khatib-Rahbar, 2004) that the fac-tor of 1.44 provides a good estimate for the critical heatflux up to an angle of about 70◦, but it overestimatesthe critical heat flux near the top. The reason for thecritical heat flux not consistently increasing near thetop requires further investigation (Dinh et al., 2003).
2.4. Model verification
The present model has been benchmarked againstthe results ofTheofanous et al. (1996)andRempe etal. (1997)as discussed byEsmaili and Khatib-Rahbar(2004). As part of this benchmarking exercise, two cal-culations were performed. In the first calculation, the
TC
P
BBBMMM
heretr is the time of core release,fox−Zr the fractionf Zr oxidized, and the coefficients are listed inTable 3Rempe et al., 1997).
The system of Eq.(1) through Eq.(25) is solvedsing a non-linear Newton–Raphson method thaounts for temperature dependence of the viscohe material properties are calculated using theroach as proposed byRempe et al. (1997).
able 3oefficient used in Eqs. (28a)–(28d) (Rempe et al., 1997)
arameter 0≤ tr < 18000 s 18000≤ tr < 28880 s
group 4 0.0572 0.0334
group 6 0.0688 0.0828
Zr and Nb 0.1068 0.1326
group 4 −1.473E−6 −1.502E−7
group 6 +1.236E−6 +4.572E−7
Zr and Nb +2.154E−6 +7.197E−7
H. Esmaili, M. Khatib-Rahbar / Nuclear Engineering and Design 235 (2005) 1583–1605 1591
heat transfer correlations were assumed to be the sameas those byTheofanous et al. (1996). In the second cal-culation, the heat transfer correlations were changed tothose ofTable 1. The initial conditions for the bench-marking calculation were taken directly fromRempeet al. (1997). In general, the results of the calcula-tions showed good agreement (Esmaili and Khatib-Rahbar, 2004) with those ofTheofanous et al. (1996)andRempe et al. (1997), with differences attributed tothe lack of documented information on some of the ini-tial conditions used in the analyses as also discussed byRempe et al. (1997).
3. Specification of initial conditions for IVRanalysis
The uncertainties associated with the initial condi-tions include the decay power, fraction of Zr oxidation,mass of UO2 relocation to the lower plenum, and theamount of steel in the lower plenum debris, consideringthe two bounding melt Configurations I and II.
The mass and composition of debris in the lowerplenum after core relocation is dependent on the ac-cident scenario. However, there are significant uncer-tainties with late phase melt progression. In the presentassessment, the scenarios of interest involve full de-pressurization of the reactor coolant system (RCS).The quantification of the initial and boundary condi-tions is mainly based on the results of plant-specificM e-p l.,2 la-t 97T pro-p ra-t
por-t thev , theq ol isv on-fi e int tionI micp ingt ,2 be-
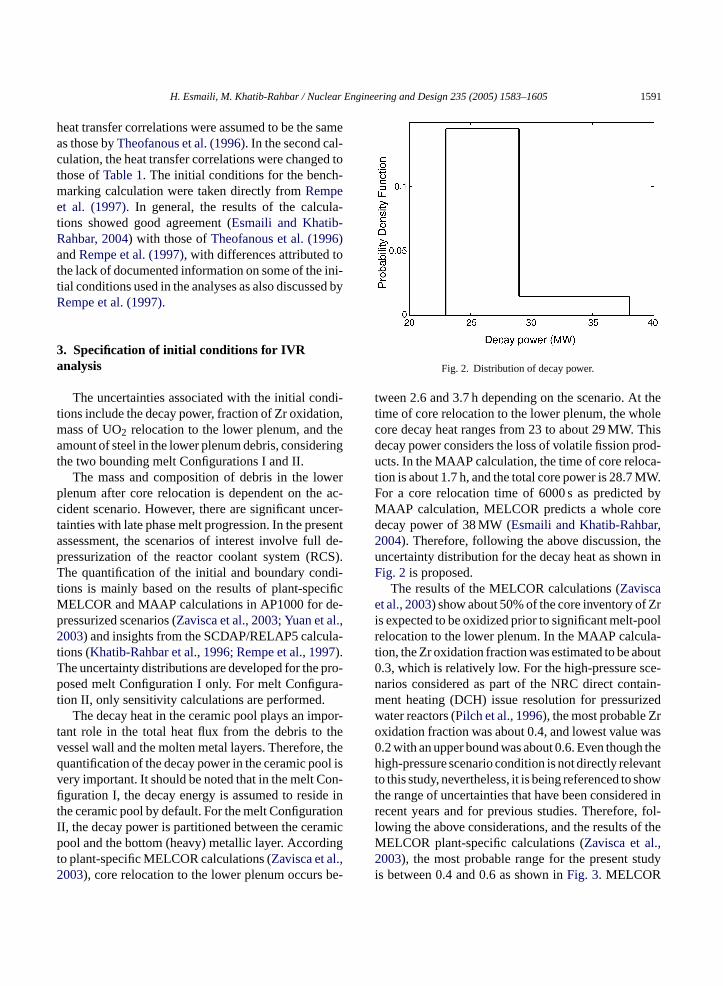
Fig. 2. Distribution of decay power.
tween 2.6 and 3.7 h depending on the scenario. At thetime of core relocation to the lower plenum, the wholecore decay heat ranges from 23 to about 29 MW. Thisdecay power considers the loss of volatile fission prod-ucts. In the MAAP calculation, the time of core reloca-tion is about 1.7 h, and the total core power is 28.7 MW.For a core relocation time of 6000 s as predicted byMAAP calculation, MELCOR predicts a whole coredecay power of 38 MW (Esmaili and Khatib-Rahbar,2004). Therefore, following the above discussion, theuncertainty distribution for the decay heat as shown inFig. 2 is proposed.
The results of the MELCOR calculations (Zaviscaet al., 2003) show about 50% of the core inventory of Zris expected to be oxidized prior to significant melt-poolrelocation to the lower plenum. In the MAAP calcula-tion, the Zr oxidation fraction was estimated to be about0.3, which is relatively low. For the high-pressure sce-narios considered as part of the NRC direct contain-ment heating (DCH) issue resolution for pressurizedwater reactors (Pilch et al., 1996), the most probable Zroxidation fraction was about 0.4, and lowest value was0.2 with an upper bound was about 0.6. Even though thehigh-pressure scenario condition is not directly relevantto this study, nevertheless, it is being referenced to showthe range of uncertainties that have been considered inrecent years and for previous studies. Therefore, fol-lowing the above considerations, and the results of theMELCOR plant-specific calculations (Zavisca et al.,2003), the most probable range for the present studyi
ELCOR and MAAP calculations in AP1000 for dressurized scenarios (Zavisca et al., 2003; Yuan et a003) and insights from the SCDAP/RELAP5 calcu
ions (Khatib-Rahbar et al., 1996; Rempe et al., 19).he uncertainty distributions are developed for theosed melt Configuration I only. For melt Configu
ion II, only sensitivity calculations are performed.The decay heat in the ceramic pool plays an im
ant role in the total heat flux from the debris toessel wall and the molten metal layers. Thereforeuantification of the decay power in the ceramic poery important. It should be noted that in the melt Cguration I, the decay energy is assumed to residhe ceramic pool by default. For the melt ConfiguraI, the decay power is partitioned between the ceraool and the bottom (heavy) metallic layer. Accord
o plant-specific MELCOR calculations (Zavisca et al.003), core relocation to the lower plenum occurs
s between 0.4 and 0.6 as shown inFig. 3. MELCOR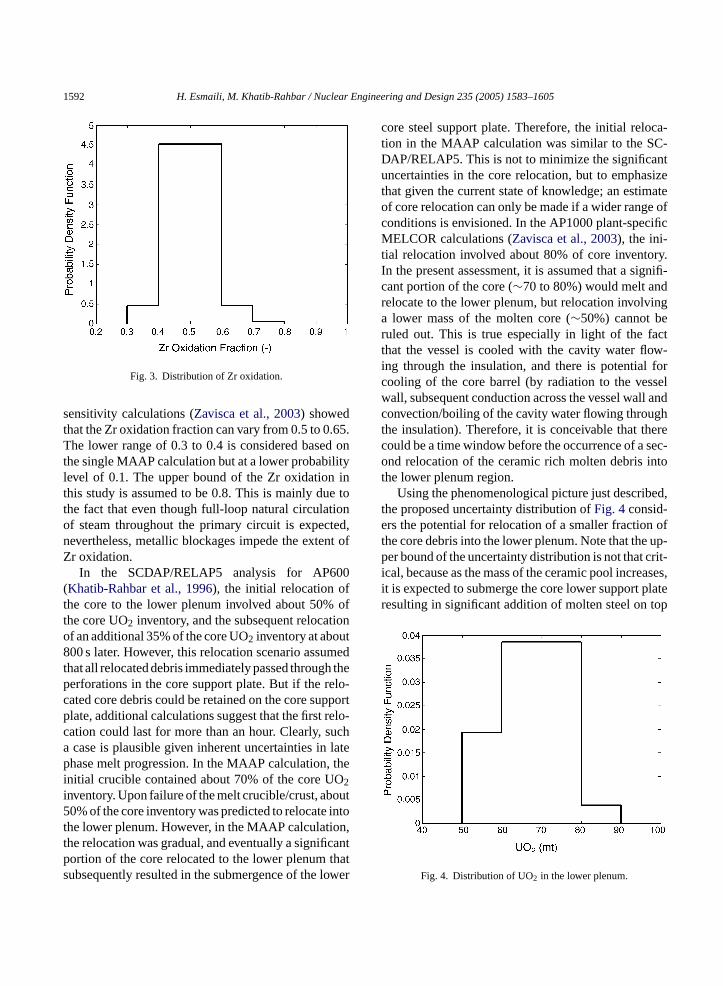
1592 H. Esmaili, M. Khatib-Rahbar / Nuclear Engineering and Design 235 (2005) 1583–1605
Fig. 3. Distribution of Zr oxidation.
sensitivity calculations (Zavisca et al., 2003) showedthat the Zr oxidation fraction can vary from 0.5 to 0.65.The lower range of 0.3 to 0.4 is considered based onthe single MAAP calculation but at a lower probabilitylevel of 0.1. The upper bound of the Zr oxidation inthis study is assumed to be 0.8. This is mainly due tothe fact that even though full-loop natural circulationof steam throughout the primary circuit is expected,nevertheless, metallic blockages impede the extent ofZr oxidation.
In the SCDAP/RELAP5 analysis for AP600(Khatib-Rahbar et al., 1996), the initial relocation ofthe core to the lower plenum involved about 50% ofthe core UO2 inventory, and the subsequent relocationof an additional 35% of the core UO2 inventory at about800 s later. However, this relocation scenario assumedthat all relocated debris immediately passed through theperforations in the core support plate. But if the relo-cated core debris could be retained on the core supportplate, additional calculations suggest that the first relo-cation could last for more than an hour. Clearly, sucha case is plausible given inherent uncertainties in latephase melt progression. In the MAAP calculation, theinitial crucible contained about 70% of the core UO2inventory. Upon failure of the melt crucible/crust, about50% of the core inventory was predicted to relocate intothe lower plenum. However, in the MAAP calculation,the relocation was gradual, and eventually a significantportion of the core relocated to the lower plenum thatsubsequently resulted in the submergence of the lower
core steel support plate. Therefore, the initial reloca-tion in the MAAP calculation was similar to the SC-DAP/RELAP5. This is not to minimize the significantuncertainties in the core relocation, but to emphasizethat given the current state of knowledge; an estimateof core relocation can only be made if a wider range ofconditions is envisioned. In the AP1000 plant-specificMELCOR calculations (Zavisca et al., 2003), the ini-tial relocation involved about 80% of core inventory.In the present assessment, it is assumed that a signifi-cant portion of the core (∼70 to 80%) would melt andrelocate to the lower plenum, but relocation involvinga lower mass of the molten core (∼50%) cannot beruled out. This is true especially in light of the factthat the vessel is cooled with the cavity water flow-ing through the insulation, and there is potential forcooling of the core barrel (by radiation to the vesselwall, subsequent conduction across the vessel wall andconvection/boiling of the cavity water flowing throughthe insulation). Therefore, it is conceivable that therecould be a time window before the occurrence of a sec-ond relocation of the ceramic rich molten debris intothe lower plenum region.
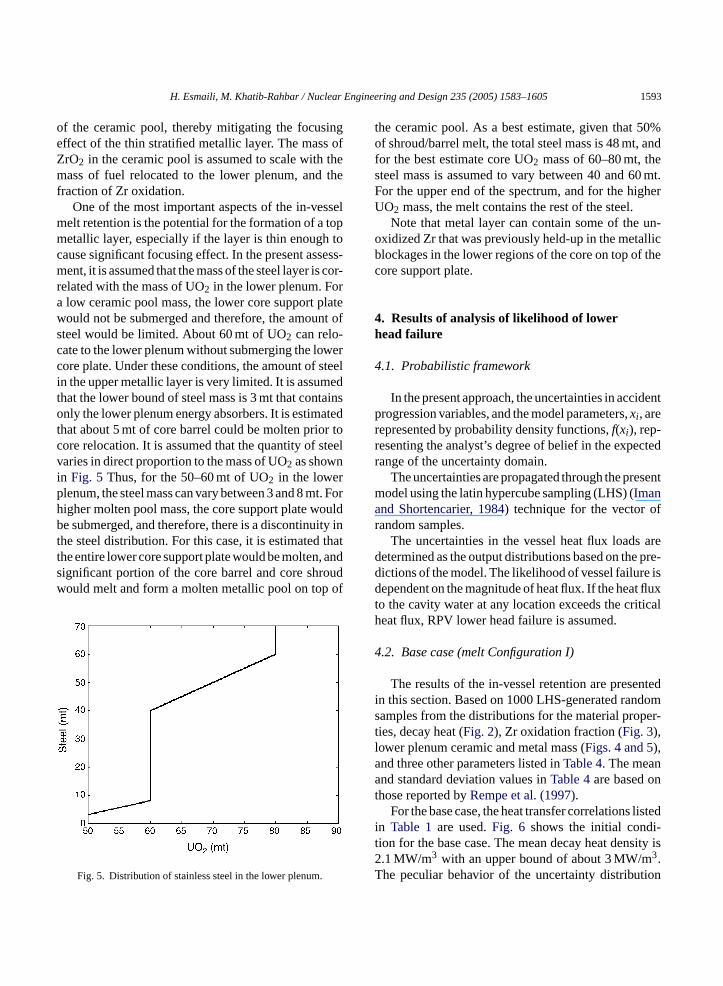
Using the phenomenological picture just described,the proposed uncertainty distribution ofFig. 4consid-ers the potential for relocation of a smaller fraction ofthe core debris into the lower plenum. Note that the up-per bound of the uncertainty distribution is not that crit-ical, because as the mass of the ceramic pool increases,it is expected to submerge the core lower support plater top
esulting in significant addition of molten steel onFig. 4. Distribution of UO2 in the lower plenum.
H. Esmaili, M. Khatib-Rahbar / Nuclear Engineering and Design 235 (2005) 1583–1605 1593
of the ceramic pool, thereby mitigating the focusingeffect of the thin stratified metallic layer. The mass ofZrO2 in the ceramic pool is assumed to scale with themass of fuel relocated to the lower plenum, and thefraction of Zr oxidation.
One of the most important aspects of the in-vesselmelt retention is the potential for the formation of a topmetallic layer, especially if the layer is thin enough tocause significant focusing effect. In the present assess-ment, it is assumed that the mass of the steel layer is cor-related with the mass of UO2 in the lower plenum. Fora low ceramic pool mass, the lower core support platewould not be submerged and therefore, the amount ofsteel would be limited. About 60 mt of UO2 can relo-cate to the lower plenum without submerging the lowercore plate. Under these conditions, the amount of steelin the upper metallic layer is very limited. It is assumedthat the lower bound of steel mass is 3 mt that containsonly the lower plenum energy absorbers. It is estimatedthat about 5 mt of core barrel could be molten prior tocore relocation. It is assumed that the quantity of steelvaries in direct proportion to the mass of UO2 as shownin Fig. 5 Thus, for the 50–60 mt of UO2 in the lowerplenum, the steel mass can vary between 3 and 8 mt. Forhigher molten pool mass, the core support plate wouldbe submerged, and therefore, there is a discontinuity inthe steel distribution. For this case, it is estimated thatthe entire lower core support plate would be molten, andsignificant portion of the core barrel and core shroudwould melt and form a molten metallic pool on top of
the ceramic pool. As a best estimate, given that 50%of shroud/barrel melt, the total steel mass is 48 mt, andfor the best estimate core UO2 mass of 60–80 mt, thesteel mass is assumed to vary between 40 and 60 mt.For the upper end of the spectrum, and for the higherUO2 mass, the melt contains the rest of the steel.
Note that metal layer can contain some of the un-oxidized Zr that was previously held-up in the metallicblockages in the lower regions of the core on top of thecore support plate.
4. Results of analysis of likelihood of lowerhead failure
4.1. Probabilistic framework
In the present approach, the uncertainties in accidentprogression variables, and the model parameters,xi , arerepresented by probability density functions,f(xi), rep-resenting the analyst’s degree of belief in the expectedrange of the uncertainty domain.
The uncertainties are propagated through the presentmodel using the latin hypercube sampling (LHS) (Imanand Shortencarier, 1984) technique for the vector ofrandom samples.
The uncertainties in the vessel heat flux loads aredetermined as the output distributions based on the pre-dictions of the model. The likelihood of vessel failure isdependent on the magnitude of heat flux. If the heat fluxt ticalh
4
ntedi doms per-tlaa nt
listedi i-t ity is2T ion
Fig. 5. Distribution of stainless steel in the lower plenum.o the cavity water at any location exceeds the crieat flux, RPV lower head failure is assumed.
.2. Base case (melt Configuration I)
The results of the in-vessel retention are presen this section. Based on 1000 LHS-generated ranamples from the distributions for the material proies, decay heat (Fig. 2), Zr oxidation fraction (Fig. 3),ower plenum ceramic and metal mass (Figs. 4 and 5),nd three other parameters listed inTable 4. The meannd standard deviation values inTable 4are based o
hose reported byRempe et al. (1997).For the base case, the heat transfer correlations
n Table 1are used.Fig. 6 shows the initial condion for the base case. The mean decay heat dens.1 MW/m3 with an upper bound of about 3 MW/m3.he peculiar behavior of the uncertainty distribut
1594 H. Esmaili, M. Khatib-Rahbar / Nuclear Engineering and Design 235 (2005) 1583–1605
Table 4Uncertainties in the emissivity of surfaces and the vessel thermalconductivity
Physical property Mean S.D.
Vessel thermal conductivity (W/m K) 32 2Metal emissivity 0.29 0.04Structure emissivity 0.8 0.03
for the steel mass shown inFig. 6 is due to the depen-dence of the steel mass on the UO2 mass relocation aswas discussed earlier. Furthermore, the base case anal-yses assume a two-layer configuration of ceramic poolwith an overlaying metallic layer (i.e., ConfigurationI).
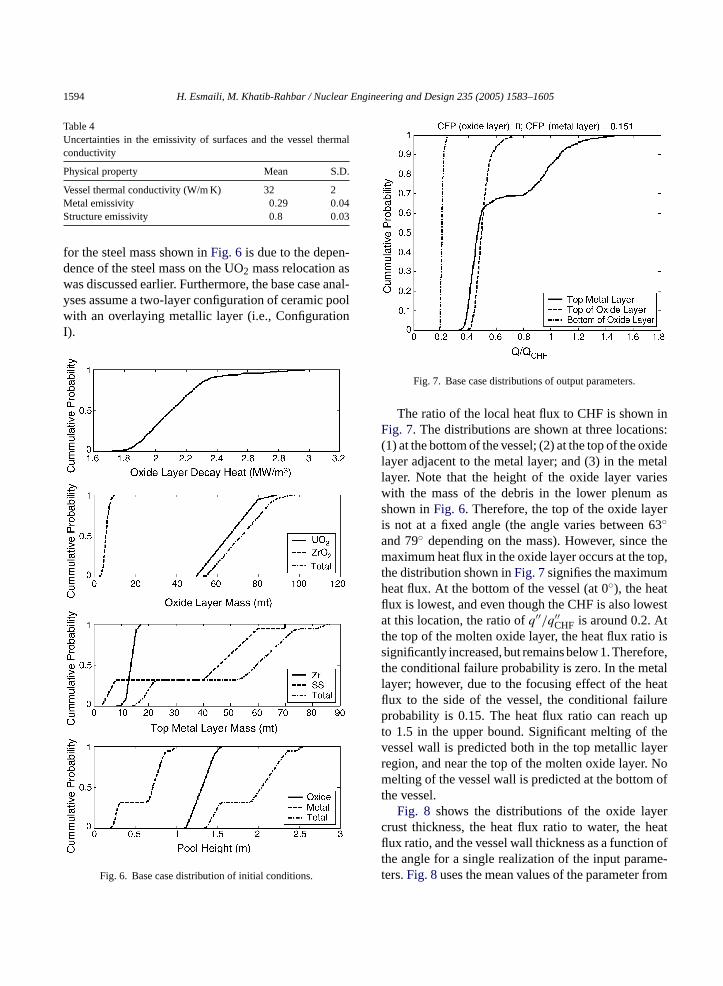
Fig. 7. Base case distributions of output parameters.
The ratio of the local heat flux to CHF is shown inFig. 7. The distributions are shown at three locations:(1) at the bottom of the vessel; (2) at the top of the oxidelayer adjacent to the metal layer; and (3) in the metallayer. Note that the height of the oxide layer varieswith the mass of the debris in the lower plenum asshown inFig. 6. Therefore, the top of the oxide layeris not at a fixed angle (the angle varies between 63◦and 79◦ depending on the mass). However, since themaximum heat flux in the oxide layer occurs at the top,the distribution shown inFig. 7signifies the maximumheat flux. At the bottom of the vessel (at 0◦), the heatflux is lowest, and even though the CHF is also lowestat this location, the ratio ofq′′/q′′CHF is around 0.2. Atthe top of the molten oxide layer, the heat flux ratio issignificantly increased, but remains below 1. Therefore,the conditional failure probability is zero. In the metallayer; however, due to the focusing effect of the heatflux to the side of the vessel, the conditional failureprobability is 0.15. The heat flux ratio can reach upto 1.5 in the upper bound. Significant melting of thevessel wall is predicted both in the top metallic layerregion, and near the top of the molten oxide layer. Nomelting of the vessel wall is predicted at the bottom ofthe vessel.
Fig. 6. Base case distribution of initial conditions.
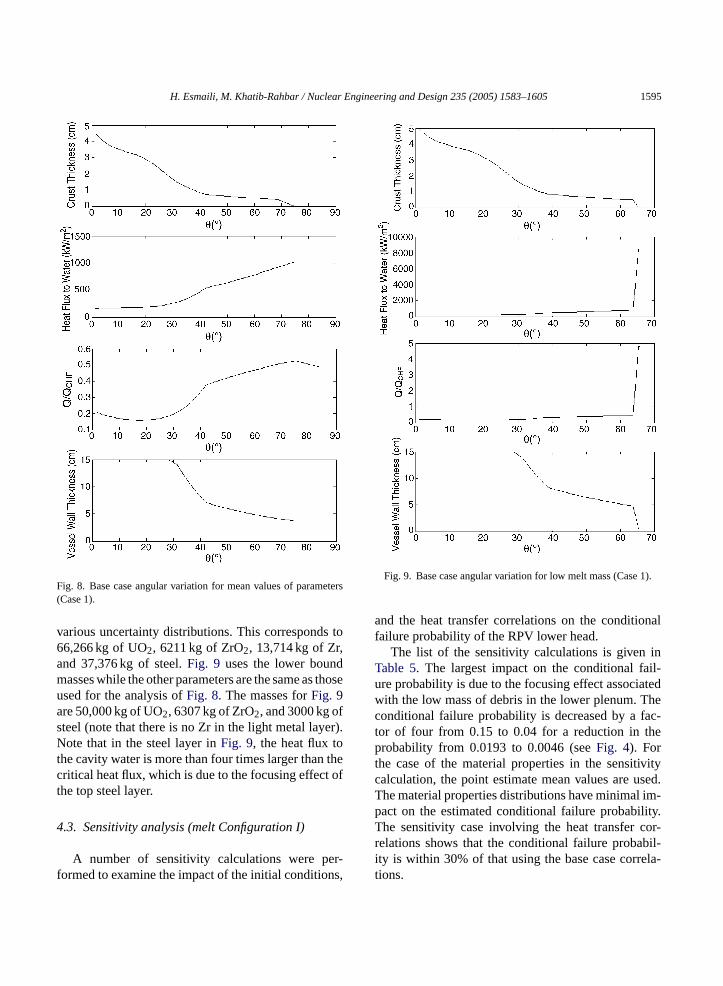
Fig. 8 shows the distributions of the oxide layercrust thickness, the heat flux ratio to water, the heatflux ratio, and the vessel wall thickness as a function ofthe angle for a single realization of the input parame-ters.Fig. 8uses the mean values of the parameter from
H. Esmaili, M. Khatib-Rahbar / Nuclear Engineering and Design 235 (2005) 1583–1605 1595
Fig. 8. Base case angular variation for mean values of parameters(Case 1).
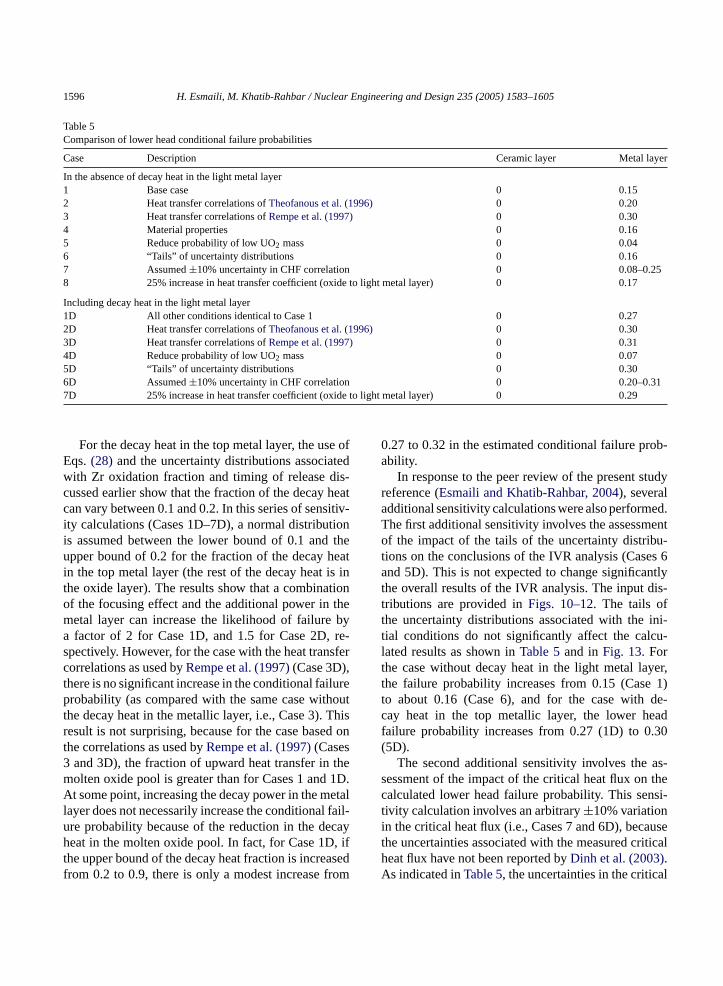
various uncertainty distributions. This corresponds to66,266 kg of UO2, 6211 kg of ZrO2, 13,714 kg of Zr,and 37,376 kg of steel.Fig. 9 uses the lower boundmasses while the other parameters are the same as thoseused for the analysis ofFig. 8. The masses forFig. 9are 50,000 kg of UO2, 6307 kg of ZrO2, and 3000 kg ofsteel (note that there is no Zr in the light metal layer).Note that in the steel layer inFig. 9, the heat flux tothe cavity water is more than four times larger than thecritical heat flux, which is due to the focusing effect ofthe top steel layer.
4.3. Sensitivity analysis (melt Configuration I)
A number of sensitivity calculations were per-formed to examine the impact of the initial conditions,
Fig. 9. Base case angular variation for low melt mass (Case 1).
and the heat transfer correlations on the conditionalfailure probability of the RPV lower head.
The list of the sensitivity calculations is given inTable 5. The largest impact on the conditional fail-ure probability is due to the focusing effect associatedwith the low mass of debris in the lower plenum. Theconditional failure probability is decreased by a fac-tor of four from 0.15 to 0.04 for a reduction in theprobability from 0.0193 to 0.0046 (seeFig. 4). Forthe case of the material properties in the sensitivitycalculation, the point estimate mean values are used.The material properties distributions have minimal im-pact on the estimated conditional failure probability.The sensitivity case involving the heat transfer cor-relations shows that the conditional failure probabil-ity is within 30% of that using the base case correla-tions.
1596 H. Esmaili, M. Khatib-Rahbar / Nuclear Engineering and Design 235 (2005) 1583–1605
Table 5Comparison of lower head conditional failure probabilities
Case Description Ceramic layer Metal layer
In the absence of decay heat in the light metal layer1 Base case 0 0.152 Heat transfer correlations ofTheofanous et al. (1996) 0 0.203 Heat transfer correlations ofRempe et al. (1997) 0 0.304 Material properties 0 0.165 Reduce probability of low UO2 mass 0 0.046 “Tails” of uncertainty distributions 0 0.167 Assumed±10% uncertainty in CHF correlation 0 0.08–0.258 25% increase in heat transfer coefficient (oxide to light metal layer) 0 0.17
Including decay heat in the light metal layer1D All other conditions identical to Case 1 0 0.272D Heat transfer correlations ofTheofanous et al. (1996) 0 0.303D Heat transfer correlations ofRempe et al. (1997) 0 0.314D Reduce probability of low UO2 mass 0 0.075D “Tails” of uncertainty distributions 0 0.306D Assumed±10% uncertainty in CHF correlation 0 0.20–0.317D 25% increase in heat transfer coefficient (oxide to light metal layer) 0 0.29
For the decay heat in the top metal layer, the use ofEqs.(28) and the uncertainty distributions associatedwith Zr oxidation fraction and timing of release dis-cussed earlier show that the fraction of the decay heatcan vary between 0.1 and 0.2. In this series of sensitiv-ity calculations (Cases 1D–7D), a normal distributionis assumed between the lower bound of 0.1 and theupper bound of 0.2 for the fraction of the decay heatin the top metal layer (the rest of the decay heat is inthe oxide layer). The results show that a combinationof the focusing effect and the additional power in themetal layer can increase the likelihood of failure bya factor of 2 for Case 1D, and 1.5 for Case 2D, re-spectively. However, for the case with the heat transfercorrelations as used byRempe et al. (1997)(Case 3D),there is no significant increase in the conditional failureprobability (as compared with the same case withoutthe decay heat in the metallic layer, i.e., Case 3). Thisresult is not surprising, because for the case based onthe correlations as used byRempe et al. (1997)(Cases3 and 3D), the fraction of upward heat transfer in themolten oxide pool is greater than for Cases 1 and 1D.At some point, increasing the decay power in the metallayer does not necessarily increase the conditional fail-ure probability because of the reduction in the decayheat in the molten oxide pool. In fact, for Case 1D, ifthe upper bound of the decay heat fraction is increasedfrom 0.2 to 0.9, there is only a modest increase from
0.27 to 0.32 in the estimated conditional failure prob-ability.
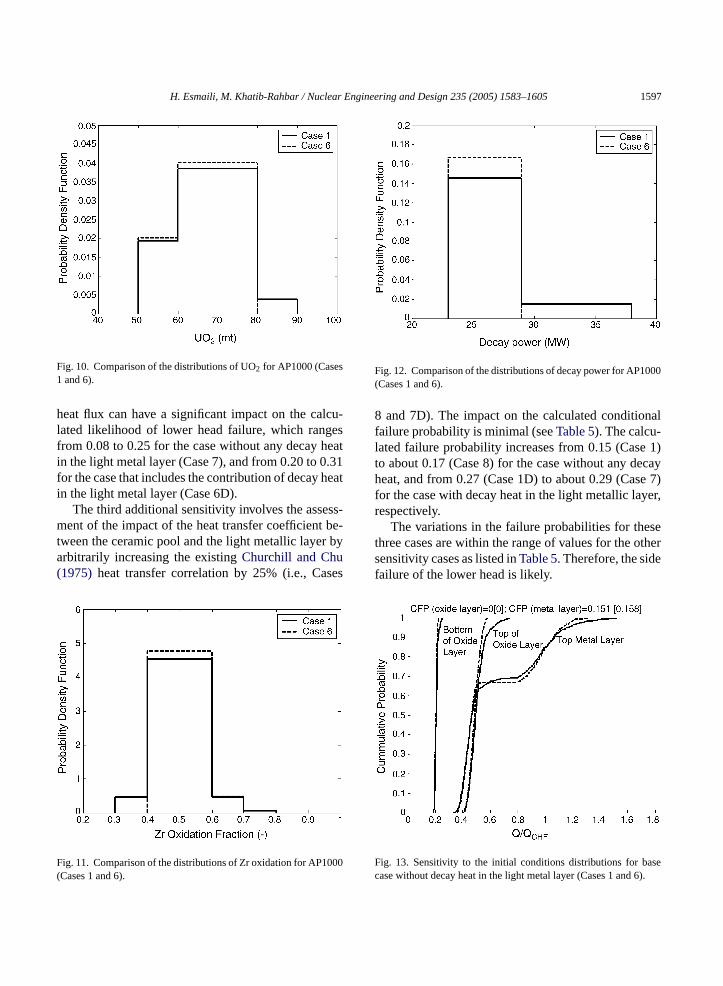
In response to the peer review of the present studyreference (Esmaili and Khatib-Rahbar, 2004), severaladditional sensitivity calculations were also performed.The first additional sensitivity involves the assessmentof the impact of the tails of the uncertainty distribu-tions on the conclusions of the IVR analysis (Cases 6and 5D). This is not expected to change significantlythe overall results of the IVR analysis. The input dis-tributions are provided inFigs. 10–12. The tails ofthe uncertainty distributions associated with the ini-tial conditions do not significantly affect the calcu-lated results as shown inTable 5and inFig. 13. Forthe case without decay heat in the light metal layer,the failure probability increases from 0.15 (Case 1)to about 0.16 (Case 6), and for the case with de-cay heat in the top metallic layer, the lower headfailure probability increases from 0.27 (1D) to 0.30(5D).
The second additional sensitivity involves the as-sessment of the impact of the critical heat flux on thecalculated lower head failure probability. This sensi-tivity calculation involves an arbitrary±10% variationin the critical heat flux (i.e., Cases 7 and 6D), becausethe uncertainties associated with the measured criticalheat flux have not been reported byDinh et al. (2003).As indicated inTable 5, the uncertainties in the critical
H. Esmaili, M. Khatib-Rahbar / Nuclear Engineering and Design 235 (2005) 1583–1605 1597
Fig. 10. Comparison of the distributions of UO2 for AP1000 (Cases1 and 6).
heat flux can have a significant impact on the calcu-lated likelihood of lower head failure, which rangesfrom 0.08 to 0.25 for the case without any decay heatin the light metal layer (Case 7), and from 0.20 to 0.31for the case that includes the contribution of decay heatin the light metal layer (Case 6D).
The third additional sensitivity involves the assess-ment of the impact of the heat transfer coefficient be-tween the ceramic pool and the light metallic layer byarbitrarily increasing the existingChurchill and Chu(1975) heat transfer correlation by 25% (i.e., Cases
Fig. 11. Comparison of the distributions of Zr oxidation for AP1000(Cases 1 and 6).
Fig. 12. Comparison of the distributions of decay power for AP1000(Cases 1 and 6).
8 and 7D). The impact on the calculated conditionalfailure probability is minimal (seeTable 5). The calcu-lated failure probability increases from 0.15 (Case 1)to about 0.17 (Case 8) for the case without any decayheat, and from 0.27 (Case 1D) to about 0.29 (Case 7)for the case with decay heat in the light metallic layer,respectively.
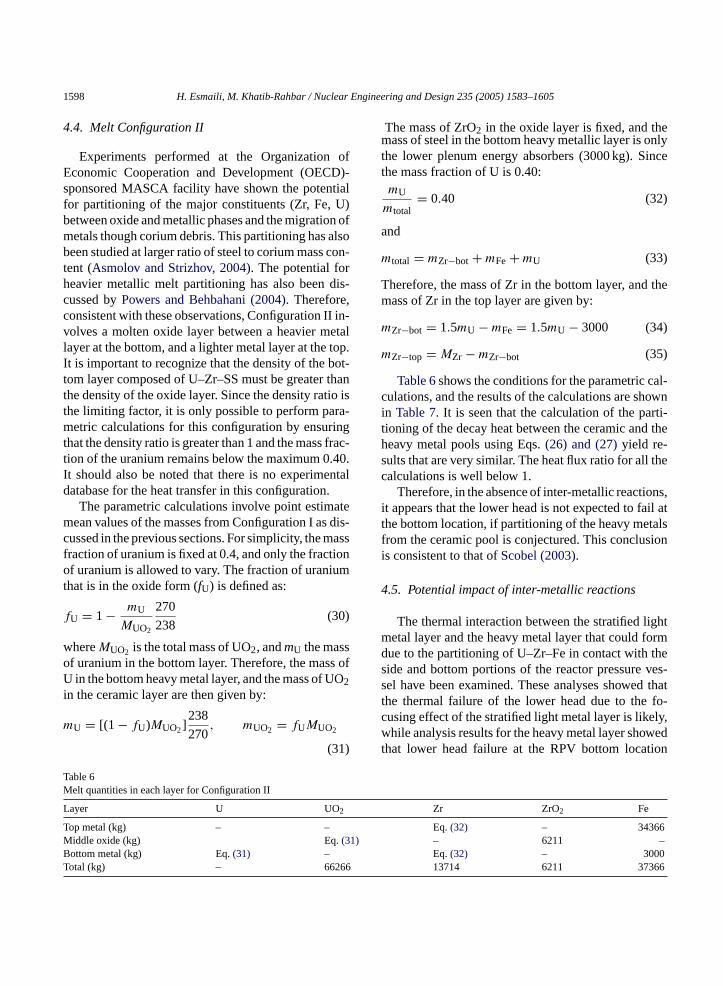
The variations in the failure probabilities for thesethree cases are within the range of values for the othersensitivity cases as listed inTable 5. Therefore, the sidefailure of the lower head is likely.
Fig. 13. Sensitivity to the initial conditions distributions for basecase without decay heat in the light metal layer (Cases 1 and 6).
1598 H. Esmaili, M. Khatib-Rahbar / Nuclear Engineering and Design 235 (2005) 1583–1605
4.4. Melt Configuration II
Experiments performed at the Organization ofEconomic Cooperation and Development (OECD)-sponsored MASCA facility have shown the potentialfor partitioning of the major constituents (Zr, Fe, U)between oxide and metallic phases and the migration ofmetals though corium debris. This partitioning has alsobeen studied at larger ratio of steel to corium mass con-tent (Asmolov and Strizhov, 2004). The potential forheavier metallic melt partitioning has also been dis-cussed byPowers and Behbahani (2004). Therefore,consistent with these observations, Configuration II in-volves a molten oxide layer between a heavier metallayer at the bottom, and a lighter metal layer at the top.It is important to recognize that the density of the bot-tom layer composed of U–Zr–SS must be greater thanthe density of the oxide layer. Since the density ratio isthe limiting factor, it is only possible to perform para-metric calculations for this configuration by ensuringthat the density ratio is greater than 1 and the mass frac-tion of the uranium remains below the maximum 0.40.It should also be noted that there is no experimentaldatabase for the heat transfer in this configuration.
The parametric calculations involve point estimatemean values of the masses from Configuration I as dis-cussed in the previous sections. For simplicity, the massfraction of uranium is fixed at 0.4, and only the fractionof uranium is allowed to vary. The fraction of uraniumthat is in the oxide form (fU) is defined as:
f
w so s ofU Oi
m
The mass of ZrO2 in the oxide layer is fixed, and themass of steel in the bottom heavy metallic layer is onlythe lower plenum energy absorbers (3000 kg). Sincethe mass fraction of U is 0.40:mU
mtotal= 0.40 (32)
and
mtotal = mZr−bot +mFe +mU (33)
Therefore, the mass of Zr in the bottom layer, and themass of Zr in the top layer are given by:
mZr−bot = 1.5mU −mFe = 1.5mU − 3000 (34)
mZr−top = MZr −mZr−bot (35)
Table 6shows the conditions for the parametric cal-culations, and the results of the calculations are shownin Table 7. It is seen that the calculation of the parti-tioning of the decay heat between the ceramic and theheavy metal pools using Eqs.(26) and (27)yield re-sults that are very similar. The heat flux ratio for all thecalculations is well below 1.
Therefore, in the absence of inter-metallic reactions,it appears that the lower head is not expected to fail atthe bottom location, if partitioning of the heavy metalsfrom the ceramic pool is conjectured. This conclusionis consistent to that ofScobel (2003).
4.5. Potential impact of inter-metallic reactions
ightm ormd thes ves-s d thatt fo-c ly,w wedt ion
TM
L
TM 1)BT 6 6
U = 1 − mU
MUO2
270
238(30)
hereMUO2 is the total mass of UO2, andmU the masf uranium in the bottom layer. Therefore, the masin the bottom heavy metal layer, and the mass of U2
n the ceramic layer are then given by:
U = [(1 − fU)MUO2]238
270, mUO2 = fUMUO2
(31)
able 6elt quantities in each layer for Configuration II
ayer U UO2
op metal (kg) – –iddle oxide (kg) Eq.(3ottom metal (kg) Eq.(31) –otal (kg) – 6626
The thermal interaction between the stratified letal layer and the heavy metal layer that could fue to the partitioning of U–Zr–Fe in contact withide and bottom portions of the reactor pressureel have been examined. These analyses showehe thermal failure of the lower head due to theusing effect of the stratified light metal layer is likehile analysis results for the heavy metal layer sho
hat lower head failure at the RPV bottom locat
Zr ZrO2 Fe
Eq.(32) – 34366– 6211 –Eq.(32) – 300013714 6211 3736
H. Esmaili, M. Khatib-Rahbar / Nuclear Engineering and Design 235 (2005) 1583–1605 1599
Table 7Results of parametric calculations for Configuration II
fU 0.95 0.9 0.85mU (kg) 2921 5841 8762mUO2 (kg) 62953 59639 56326ρh (kg/m3) 8909 8584 8481ρo (kg/m3) 8392 8377 8358Vh (m3) 0.820 1.701 2.583Ah,b (m2) 4.69 6.86 8.56 hh,b (m) 0.373 0.546 0.681Vo (m3) 8.240 7.861 7.481Decay heat Eq.(26) Eq.(27) Eq.(26) Eq.(27) Eq.(26) Eq.(27)Qh (MW/m3) 1.126 1.029 1.084 0.9915 1.071 0.978Qo (MW/m3) 2.127 2.137 2.112 2.132 2.096 2.128q′′/q′′CHF 0.22 0.20 0.30 0.28 0.36 0.33
is not likely due to the significant margin to criticalheat flux. However, these analyses did not considerthe potential for inter-metallic reactions (Powers andBehbahani, 2004), including the reaction of moltenZr with the molten stainless steel resulting in signifi-cant heat generation, which at sufficiently high Zr molefractions, can result in a self-propagating attack on thelower head.
In the light metallic layer, the Zr mole fraction isrelatively smaller than that in the heavier bottom layer.Therefore, the impact of any self propagating mecha-nism for failure is not as significant, especially given thealready high likelihood of failure due to thermal effects.Even in the bottom location, the additional steel that isablated from the lower head due to any inter-metallicreactions, tends to mitigate this self-propagating effect(by reduction in the heat of mixing due to a reductionin the mole fraction of Zr in the mixture). Furthermore,the conditions that can result in the segregation of theheavy metals from the ceramic pools may not be sus-tainable (Asmolov and Strizhov, 2004). Considerationof the impact of inter-metallic reactions on the lowerhead integrity requires additional experimental and an-alytic studies.
5. Initial conditions for analysis of ex-vesselFCI loads
5
po-s es-
sel breach depends primarily on the accident scenario.The time scale for FCI is very short and would not in-volve the entire mass of the molten debris in the lowerplenum. Based on the results of IVR analysis, the mostlikely failure of the RPV lower head is expected to oc-cur in the light metallic layer due to the focusing effectthat results in the local heat flux to exceed the criticalheat flux. The best estimate melt temperature for themetallic layer is about 2060 K based on the results ofthe present IVR model.
5.2. Cavity condition at vessel breach
The AP1000 containment is designed to result inthe submergence of the lower head in a very short timeframe.Zavisca et al. (2003)also show that at the timeof core relocation into the lower plenum, the depth ofthe water in sufficient to result in the full submergenceof the RPV.
Furthermore, the results of calculations performedby Zavisca et al. (2003)also indicate that the contain-ment pressure is about 2 bar and the cavity water issub-cooled at a temperature of about 343 K followingcore relocation into the lower plenum. These calcula-tion show that the cavity water remains sub-cooled forseveral hours following core relocation into the lowerplenum.
5.3. Location, mode and size of vessel breach
uresa eac-t n is
.1. Melt initial conditions in the lower plenum
The quantification of molten debris mass, comition and temperature in the lower plenum at v
The failure location impacts the dynamic pressnd the impulsive loads on the cavity wall and the r
or pressure vessel, especially if the failure locatio
1600 H. Esmaili, M. Khatib-Rahbar / Nuclear Engineering and Design 235 (2005) 1583–1605
on the side of the vessel lower head and in the vicinityof the cavity wall. The best-estimate location of failureis on the side of the lower head in the light metallic re-gion. The size of failure cannot be estimated with anydegree of certainty. The results of the in-vessel reten-tion analysis discussed previously show that the thick-ness of the metallic layer can be over 0.35 m before thecritical heat flux is exceeded. Therefore, as a best es-timate, a failure hole diameter of 0.4 m is assumed forthe base case calculation. Using the upper bound valuesof 90 mt of UO2 and decay heat of 38 MW, the metallicmelt layer thickness can be as high as 0.53 m before thecritical heat flux is exceeded. Therefore, a sensitivity toa larger hole size of 0.6 m is also considered. Further-more, to assess the potential impact of RPV failure atthe bottom location (e.g., due to materials interactionseffects), a sensitivity case that involves RPV failure atthe bottom of the reactor pressure vessel (assuming afailure size of 0.4 m) is also considered.
6. Results of analysis of ex-vessel FCI energetics
In the present study, the FCI processes are mod-eled using the two-dimensional PM-ALPHA (Yuen andTheofanous, 1995) and ESPROSE.m (Theofanous andYuen, 1995) computer codes.
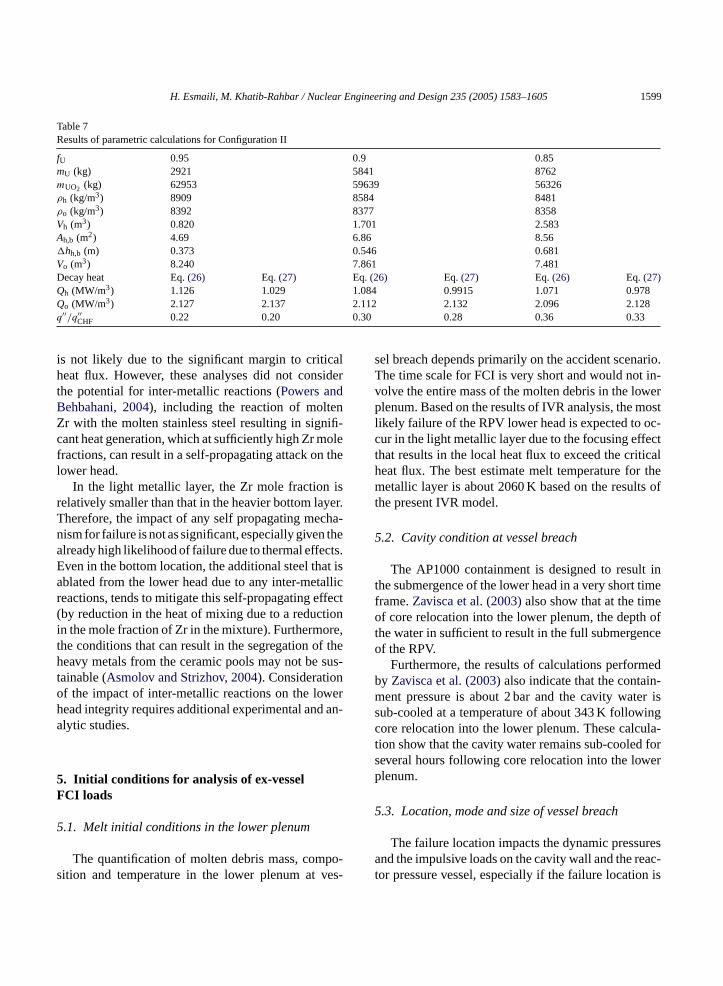
The RPV is modeled as an “obstacle” in the compu-tation domain.Fig. 14shows the problem nodalization,the representation of the hemispherical lower head witha thep giono f thee .
eadm essa sion.T por-t tionc re-v hea ac-t enti ftert ion,t va-p ther ef-
Fig. 14. Schematic of lower head nodalization.
fects of altering the mixing process and providing alarger degree of “boundary compliance” to the RPVwall could diminish the focusing effects of this surfaceand thereby reduce the dynamic pressures in the localregion. However, it is difficult to quantify the impactof the thermal insulation on the dynamic pressure us-ing the available computer codes, especially in light ofthe uncertainties that are inherent in the fuel coolantinteraction phenomena.
For the PM-ALPHA calculation, the melt inlet loca-tion is about 2 m above the cavity floor; therefore, thesize of the computational domain is 2 m in the verticaldirection (20 nodes) and 3 m in the horizontal direction(15 nodes). The last node in the vertical direction rep-resents a steam gap. PM-ALPHA requires the inlet tobe at the boundaries of the computational domain, anddoes not accept an inlet below the surface of the waterpool. The PM-ALPHA calculation is only performedto obtain the conditions for the ESPROSE.m explosionpropagation simulation. The entire RPV including thecylindrical portion up to a distance of 6 m from the cav-ity floor is modeled as an obstacle. An additional 1 mof steam gap is also included to allow for the ventingof the explosion. The water pool depth of 5 m is mod-eled that is consistent with the results ofZavisca et al.(2003).
number of horizontal and vertical lines, signifyingresence of the obstacles. Only a narrow annular ref thickness 0.4 m is available for the propagation oxplosion around the cylindrical portion of the RPV
The insulation that surrounds the RPV lower hay potentially affect the fuel coolant mixing procnd the subsequent explosion propagation/expanhe presence of the insulation may have two im
ant effects. During the mixing phase, the insulaould alter the flow of the molten material and pent efficient fuel coolant mixing. It would restrict tmount of water that could mix with the fuel and
ually increase the void fraction of the vapor presn the region near the vessel wall. In addition, ahe metallic melt has melted through the insulathe residual passages in the insulation could trapor and provide a certain degree of compliance toigid boundary of the RPV outer wall. These two
H. Esmaili, M. Khatib-Rahbar / Nuclear Engineering and Design 235 (2005) 1583–1605 1601
6.1. Base case
The base case calculations used a metallic pour re-locating through a lower head failure size of 0.4 m indiameter at 2060 K into the cavity water at 343 K. Thepour velocity is 1.7 m/s, and the melt particle diameteris 0.01 m assuming a maximum fragmentation rate perparticle of 4 kg/s.
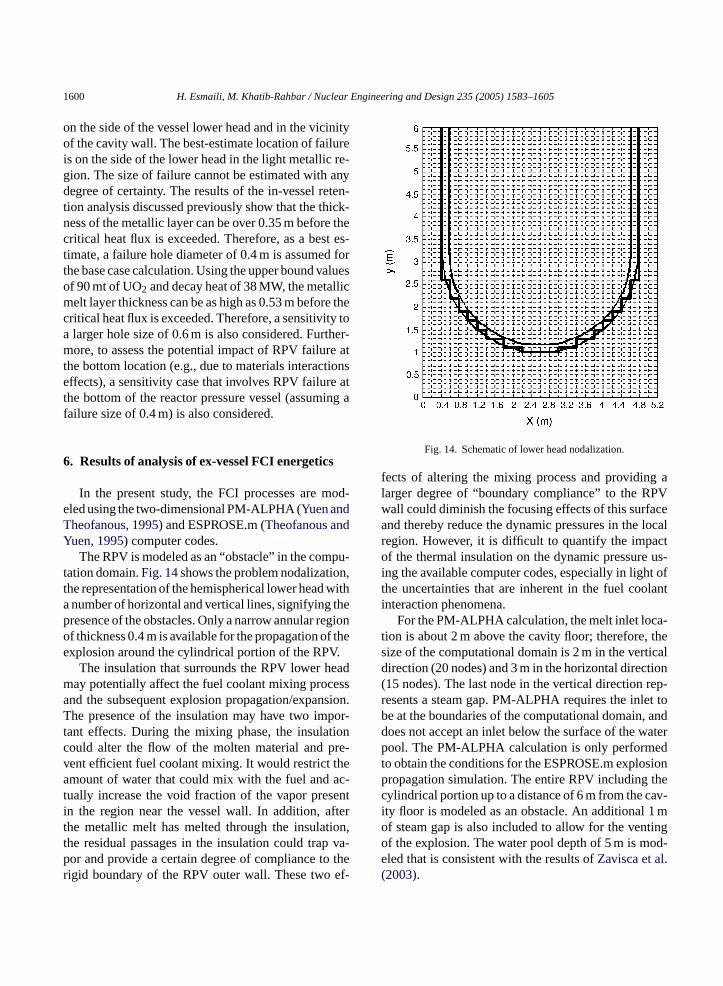
The initial distribution of the melt volume fractionbased on the ESPROSE.m premixing calculation isshown inFig. 15. The water pool sub-cooling leadsto suppression of the vapor void fraction. These condi-tions are conducive to high pressurization. The durationof the premixing was 1 s to allow the melt to reach thecavity floor before the explosion is triggered.
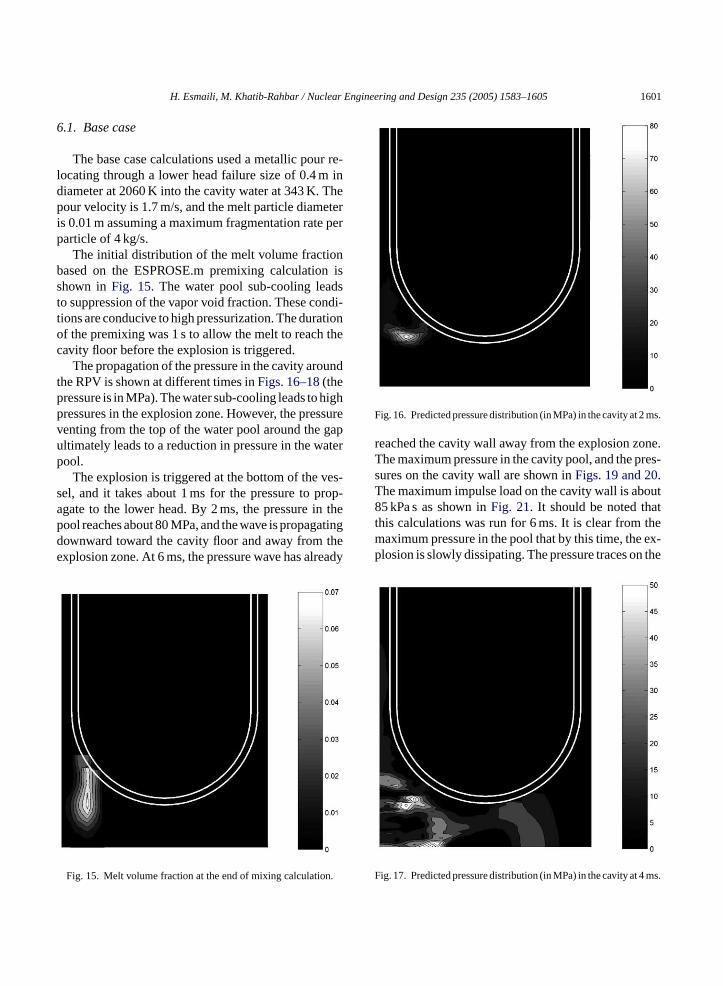
The propagation of the pressure in the cavity aroundthe RPV is shown at different times inFigs. 16–18(thepressure is in MPa). The water sub-cooling leads to highpressures in the explosion zone. However, the pressureventing from the top of the water pool around the gapultimately leads to a reduction in pressure in the waterpool.
The explosion is triggered at the bottom of the ves-sel, and it takes about 1 ms for the pressure to prop-agate to the lower head. By 2 ms, the pressure in thepool reaches about 80 MPa, and the wave is propagatingdownward toward the cavity floor and away from theexplosion zone. At 6 ms, the pressure wave has already
.
Fig. 16. Predicted pressure distribution (in MPa) in the cavity at 2 ms.
reached the cavity wall away from the explosion zone.The maximum pressure in the cavity pool, and the pres-sures on the cavity wall are shown inFigs. 19 and 20.The maximum impulse load on the cavity wall is about85 kPa s as shown inFig. 21. It should be noted thatthis calculations was run for 6 ms. It is clear from themaximum pressure in the pool that by this time, the ex-plosion is slowly dissipating. The pressure traces on the
Fig. 17. Predicted pressure distribution (in MPa) in the cavity at 4 ms.
Fig. 15. Melt volume fraction at the end of mixing calculation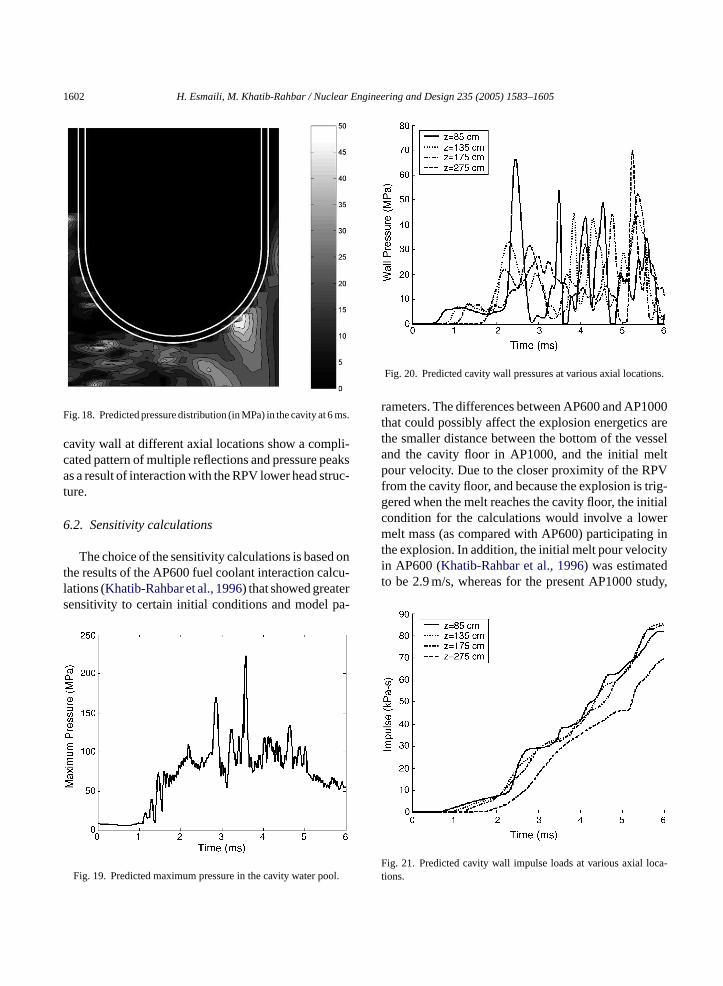
1602 H. Esmaili, M. Khatib-Rahbar / Nuclear Engineering and Design 235 (2005) 1583–1605
Fig. 18. Predicted pressure distribution (in MPa) in the cavity at 6 ms.
cavity wall at different axial locations show a compli-cated pattern of multiple reflections and pressure peaksas a result of interaction with the RPV lower head struc-ture.
6.2. Sensitivity calculations
The choice of the sensitivity calculations is based onthe results of the AP600 fuel coolant interaction calcu-lations (Khatib-Rahbar et al., 1996) that showed greatersensitivity to certain initial conditions and model pa-
Fig. 19. Predicted maximum pressure in the cavity water pool.
Fig. 20. Predicted cavity wall pressures at various axial locations.
rameters. The differences between AP600 and AP1000that could possibly affect the explosion energetics arethe smaller distance between the bottom of the vesseland the cavity floor in AP1000, and the initial meltpour velocity. Due to the closer proximity of the RPVfrom the cavity floor, and because the explosion is trig-gered when the melt reaches the cavity floor, the initialcondition for the calculations would involve a lowermelt mass (as compared with AP600) participating inthe explosion. In addition, the initial melt pour velocityin AP600 (Khatib-Rahbar et al., 1996) was estimatedto be 2.9 m/s, whereas for the present AP1000 study,
Fig. 21. Predicted cavity wall impulse loads at various axial loca-t
ions.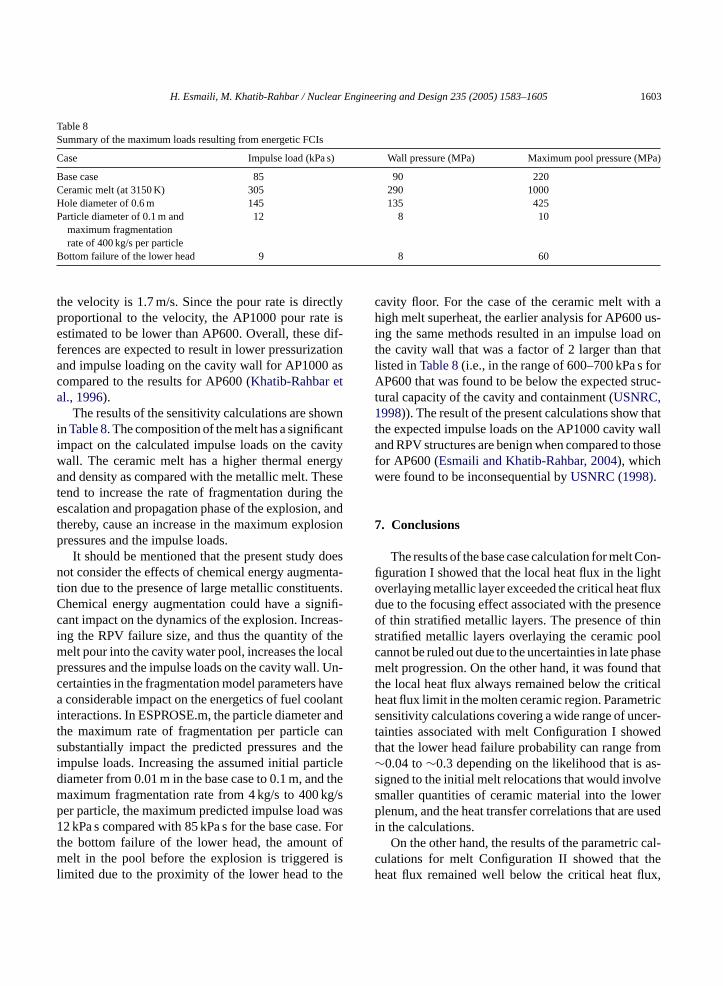
H. Esmaili, M. Khatib-Rahbar / Nuclear Engineering and Design 235 (2005) 1583–1605 1603
Table 8Summary of the maximum loads resulting from energetic FCIs
Case Impulse load (kPa s) Wall pressure (MPa) Maximum pool pressure (MPa)
Base case 85 90 220Ceramic melt (at 3150 K) 305 290 1000Hole diameter of 0.6 m 145 135 425Particle diameter of 0.1 m and
maximum fragmentationrate of 400 kg/s per particle
12 8 10
Bottom failure of the lower head 9 8 60
the velocity is 1.7 m/s. Since the pour rate is directlyproportional to the velocity, the AP1000 pour rate isestimated to be lower than AP600. Overall, these dif-ferences are expected to result in lower pressurizationand impulse loading on the cavity wall for AP1000 ascompared to the results for AP600 (Khatib-Rahbar etal., 1996).
The results of the sensitivity calculations are shownin Table 8. The composition of the melt has a significantimpact on the calculated impulse loads on the cavitywall. The ceramic melt has a higher thermal energyand density as compared with the metallic melt. Thesetend to increase the rate of fragmentation during theescalation and propagation phase of the explosion, andthereby, cause an increase in the maximum explosionpressures and the impulse loads.
It should be mentioned that the present study doesnot consider the effects of chemical energy augmenta-tion due to the presence of large metallic constituents.Chemical energy augmentation could have a signifi-cant impact on the dynamics of the explosion. Increas-ing the RPV failure size, and thus the quantity of themelt pour into the cavity water pool, increases the localpressures and the impulse loads on the cavity wall. Un-certainties in the fragmentation model parameters havea considerable impact on the energetics of fuel coolantinteractions. In ESPROSE.m, the particle diameter andthe maximum rate of fragmentation per particle cansubstantially impact the predicted pressures and theimpulse loads. Increasing the assumed initial particled d them g/sp was1 . Fort t ofm isl he
cavity floor. For the case of the ceramic melt with ahigh melt superheat, the earlier analysis for AP600 us-ing the same methods resulted in an impulse load onthe cavity wall that was a factor of 2 larger than thatlisted inTable 8(i.e., in the range of 600–700 kPa s forAP600 that was found to be below the expected struc-tural capacity of the cavity and containment (USNRC,1998)). The result of the present calculations show thatthe expected impulse loads on the AP1000 cavity walland RPV structures are benign when compared to thosefor AP600 (Esmaili and Khatib-Rahbar, 2004), whichwere found to be inconsequential byUSNRC (1998).
7. Conclusions
The results of the base case calculation for melt Con-figuration I showed that the local heat flux in the lightoverlaying metallic layer exceeded the critical heat fluxdue to the focusing effect associated with the presenceof thin stratified metallic layers. The presence of thinstratified metallic layers overlaying the ceramic poolcannot be ruled out due to the uncertainties in late phasemelt progression. On the other hand, it was found thatthe local heat flux always remained below the criticalheat flux limit in the molten ceramic region. Parametricsensitivity calculations covering a wide range of uncer-tainties associated with melt Configuration I showedthat the lower head failure probability can range from∼0.04 to∼0.3 depending on the likelihood that is as-s lves werp usedi
cal-c theh ux,
iameter from 0.01 m in the base case to 0.1 m, anaximum fragmentation rate from 4 kg/s to 400 ker particle, the maximum predicted impulse load2 kPa s compared with 85 kPa s for the base case
he bottom failure of the lower head, the amounelt in the pool before the explosion is triggered
imited due to the proximity of the lower head to t
igned to the initial melt relocations that would invomaller quantities of ceramic material into the lolenum, and the heat transfer correlations that are
n the calculations.On the other hand, the results of the parametric
ulations for melt Configuration II showed thateat flux remained well below the critical heat fl
1604 H. Esmaili, M. Khatib-Rahbar / Nuclear Engineering and Design 235 (2005) 1583–1605
rendering the thermal failure of the lower head at thebottom location improbable.
Notwithstanding the uncertainties in the underlyingphenomena associated with the fuel coolant interaction,based on two-dimensional computer code calculations,it was shown that there is a potential for large impulseloads on the cavity and the RPV structures (and subse-quently the containment penetrations) in the AP1000.However, the calculated impulse loads on the cavitywall for AP1000 were found to be below those esti-mated for AP600 using a similar approach.
Acknowledgements
The authors acknowledge valuable peer reviewcomments by Drs. M.L. Corradini (University ofWisconsin-Madison), V.K. Dhir (University of Cali-fornia, Los Angeles) and F. Moody (Consultant, for-merly of General Electric Company). This work wasperformed under the auspices of U.S. Nuclear Regu-latory Commission, Office of Nuclear Regulatory Re-search, Contract Number NRC-RES-04-02-075.
References
Allison, C.M., Rempe, J.L., Chavez, S.A., 1994. Design report onSCDAP/RELAP5 model improvements–debris bed and moltenpool behavior. INEEL-94/0174.
n-top
heSe-iott
m-. J.
s ofV
ingul,
l-adC
en-rgy
Globe, S., Dropkin, D., 1959. Natural convection heat transfer inliquid confined by two horizontal plates and heated from below.Trans. ASME 81C, 24.
Henry, R., Fauske, H., 1993. External cooling of a reactor vesselunder severe accident conditions. Nucl. Eng. Design 139, 31–43.
Iman, R.L., Shortencarier, M.J., 1984. A FORTRAN 77 program anduser’s guide for the generation of Latin hypercube and randomsamples for use with computer models. NUREG/CR-3624.
Khatib-Rahbar, M., Esmaili, H., Vijaykumar, R., Wagage, H., 1996.An assessment of ex-vessel steam explosions in the AP600advanced pressurized water reactor. Energy Research, Inc.,ERI/NRC 95-211.
Kulacki, F.A., Emara, A.A., 1975. High Rayleigh number convec-tion in enclosed fluid layers with internal heat sources. USNRC,NUREG-75/065.
Kymfilfiinen, O., Tuomisto, H., Theofanous, T.G., 1997. In-vesselretention of corium at the Loviisa plant. Nucl. Eng. Design 169,109–130.
Mayinger, F., et al., 1976. Examination of thermohydraulic processesand heat transfer in a core melt. BMFT RS 48/1, Institute furVerfanhrenstechnic der TU, Hanover, Germany.
O’Brien, J.E., Hawkes, G.L., 1991. Thermal analysis of a reactorlower head with core relocation and external boiling heat transfer.AIChE Symp. Ser. 87 283, 159–168.
Park, H., Dhir, V.K., 1991. Steady state analysis of external coolingof a PWR vessel lower head. AIChE Symp. Ser. 87 283, 1–12.
Park, H., Dhir, V.K., 1992. Effect of outside cooling on the thermalbehavior of a pressurized water reactor vessel lower head. Nucl.Technol. 100, 331.
Pilch, M.M., et al., 1996. Resolution of the direct containment heatingissue for all Westinghouse plants with large dry containments orsub-atmospheric containments. NUREG/CR-6338.
Powers, D., Behbahani, A., 2004. Density stratification of core de-bris. In: Proceedings of the OECD MASCA Seminar, Paris,
R ten-ort,
R data
S iluredur-s on
S egrity
S s by
T ughthens-
T inte-oling.rge
France.empe, J.L., et al., 1997. Potential for AP600 in-vessel re
tion through ex-vessel flooding. Technical Evaluation RepINEEL/EXT-97-00779.
ohsenow, W.M., 1952. A method of correlating heat transferfor surface boiling of liquids. Trans. ASME 74, 969.
cobel, J.H., 2003. The potential for AP1000 reactor vessel fainduced by a stratified debris bed with a bottom metal layering IVR. In: Proceedings of the 2003 International CongresAdvances in Nuclear Power Plants, Cordoba, Spain.
ehgal, B.R., et al., 2003. Assessment of reactor vessel int(ARVI). Nucl. Eng. Design 221, 23–53.
eiler, J.M., et al., 2003. Analysis of corium recovery conceptthe EUROCORE Group. Nucl. Eng. Design 221, 119–136.
heofanous, T.G., et al., 1994a. Critical heat flux throcurved, downwards facing thick wall. In: Proceedings ofOECD/CSNI/NEA Workshop on Large Molten Pool Heat Trafer, Gernoble, France.
heofanous, T.G., et al., 1994b. Experience from the first twograted approaches to in-vessel retention through external coIn: Proceedings of the OECD/CSNI/NEA Workshop on LaMolten Pool Heat Transfer, Gernoble, France.
Asfia, F.J., Dhir, V.K., 1996. An experimental study of natural covection in a volumetrically heated spherical pool bounded onwith a rigid wall. Nucl. Eng. Design 163, 333–348.
Asmolov, V., Strizhov, V., 2004. Overview of the progress in tOECD MASCA project. In: Proceedings of the Cooperativevere Accident Research Program (CSARP) Meeting, MarrCrystal Gateway, May 3–4.
Churchill, S.W., Chu, H.H.S., 1975. Correlating equations for lainar and turbulent free convection from a vertical plate. IntHeat Mass Transfer 18, 1323.
Dinh, T.N., Tu, T.P., Salmassi, T., Theofanous, T.G., 2003. Limitcoolability in the AP1000-related ULPU-2400 Configurationfacility. In: Proceedings of the 10th International Topical Meeton Nuclear Reactor Thermal Hydraulics (NURETH-10), SeoKorea, October 5–9.
Esmaili, H., Ali, S., Vijaykumar, R., Khatib-Rahbar, M., 1996. Evauation of debris coolability by external cooling of the lower hefor AP600 using MELCOR. Energy Research, Inc., ERI/NR96-201.
Esmaili, H., Khatib-Rahbar, M., 2004. Analysis of in-vessel rettion and ex-vessel fuel coolant interaction for AP1000. EneResearch, Inc., ERI/NRC 04-201, NUREG/CR-6849.
H. Esmaili, M. Khatib-Rahbar / Nuclear Engineering and Design 235 (2005) 1583–1605 1605
Theofanous, T.G., Yuen, W.W., 1995. ESPROSE.m: A computercode for addressing the escalation/propagation of steam explo-sions. DOE/ID-10501.
Theofanous, T.G., et al., 1996. In-vessel coolability and retention ofa core melt. DOE/ID-10460, vol. I.
Theofanous, T.G., Angelini, S., 2000. Natural convection for in-vessel retention at prototypic Rayleigh numbers. Nucl. Eng. De-sign 200, 1–9.
Turland, B.D., Morgan, J., 1983. Thermal attack of core debris on aPWR reactor vessel. In: Proceedings of the International Meetingon Light Water Reactor Severe Accident Evaluation, Cambridge,MA, August 28–September 1.
Turland, B.D., 1994. In-vessel phenomena relevant to the achieve-ment of debris coolability by ex-vessel flooding for a PWR.In: Proceedings of the OECD/CSNI/NEA Workshop on LargeMolten Pool Heat Transfer, Gernoble, France.
United States Nuclear Regulatory Commission (USNRC), 1998.AP600 final safety evaluation report related to the certificationof the AP600 design. NUREG-1512.
Young, M.F., 1982. The TEXAS code for fuel–coolant interactionanalysis. In: Proceedings of ANS/ENS LMFBR Safety TopicalMeeting, Lyon-Ecully, France.
Yuan, Z., Zavisca, M., Khatib-Rahbar, M., 2003. Impact of thereactor pressure vessel insulation on the progression of se-vere accidents in AP1000. Energy Research, Inc., ERI/NRC03-205.
Yuen, W.W., Theofanous, T.G., 1995. PM-ALPHA: a computer codefor addressing the premixing of steam explosions. DOE/ID-10502.
Zavisca, M., Yuan, Z., Khatib-Rahbar, M., 2003. Analysis of selectedaccident scenarios for AP1000. Energy Research, Inc., ERI/NRC03-201.
Top Related
Copyright © 2022 FDOKUMEN

