


Bahasa
Halaman
Hukum


ANALYSIS OF AN AIRFOIL BY CHANGING THE SIZE, SHAPE
AND LOCATION OF THE DIMPLE
Arvind Mukundan, November 2019.
ABSTRACT
The present work describes change in aerodynamic characteristics of an airfoil by applying certain surface
modifications in form of dimples. A comparative study of modified airfoil models showing variance in lift and
drag at different angle of attacks (AOA). The surface modifications are done here by considering the different
types and shapes of dimples [1]. Dimples help in reduction of pressure drag when airfoil attains some angle of
attack because that time, wake formation starts due to boundary layer separation. effects of dimples as a
conventional vortex is studied computationally, dimples are quite effective at different angle of attack and can
change angle of stall to a greater extent. In order to verify the effect of dimples, the different shapes of
dimples are analyzed by placing over NACA 2412 airfoil at the effective location to delay flow separation
point. Aerodynamic analysis for this airfoil is carried out using Computational Fluid Dynamics. Through this
study we aim at making aircrafts more maneuverable by implementing dimples over the wing.
INTRODUCTION
Over the past decade, various aerodynamic simulation has been conducted which provide insinghts
of complex flows and to provide design inputs [2]. Various aerodynamic simulations have been conducted
on sports balls [3]. For example, one of the research works is to analyze the basic aerodynamic
characteristics of conventional volleyballs and new volleyballs by using a wind tunnel [4]. On the other
hand, many research works have been conducted on golf balls [5] [6] [7]. On analyzing the golf ball, the
aerodynamics present in the dimple over the ball results in experiencing drag force smaller than the
smooth surfaced ball. In a golf ball, non-circular isodiametrical dimples provide increased efficiency of
coverage of the surface of a golf ball. Additionally, the aerodynamic properties of the ball are improved [8]. In deep, dimples delay the flow separation point by creating turbulent boundary layer by reenergizing
potential energy in to kinetic energy. Modifying the aircraft wing structure by means of placing dimples
will reduce the drag to considerable amount from the total drag and helps to stabilize the aircraft during
stall [9]. Turbulence can be caused due to the introduction of dimples on the aircraft wing by creating
vortices delaying the boundary layer separation eventually reducing the pressure drag and raise in the stall
angle [10]. Also, the inward dimples are more effective than the outward dimples for cases where the
dimples were seen effective [11] while the wake region, increases the pressure drag at higher angle of attack
which is due to flow separation [12].
GEOMETRY DESIGN
The reason for choosing a semi spherical dimple is that it is a bluff body, so when placed in a flow
separation regime, it would gain some turbulent kinetic energy to stick to the surface thereby reducing the
pressure drag. The geometry is drawn using CATIA. Once the airfoil is imported, the control volume
(Domain) surrounding the airfoil is drawn by taking the considerations of making it 15 times greater than
the chord length (1m). The semi spherical dimple is placed at two points 20% of chord length and 40% of
chord length. The reason for choosing these points is that these are just ahead and behind the maximum
thickness point, from where the flow separation might take place. The dimple is drawn to the radius of
20mm. The comparative study is done between the normal airfoil and the ones with the dimple for a angle

of attack.
Fig 2. Domain for normal airfoil using CATIA Fig 3. Domain for dimpled airfoil using CATIA
Fig 4. Dimple at 20% chord length Fig 5. Dimple at 20% chord length
ANALYSIS PARAMETERS
A parameter, generally, is any characteristic that can help in defining or classifying a
system. A parameter is an element of a system that is useful, or critical, when identifying the
system, or when evaluating its performance, status, condition, etc. Here, we have the following
parameters,
AIRFOIL SPECFICATIONS
S.NO PARAMETER VALUES
1 CHORD LENGTH 1m
2 DIMPLE RADIUS 0.02m
3 SERIES CODE NACA 2412
4 EXPERIMENTAL AOA 0,5,8,12,17,19,20,21 (degrees)
5 MATERIAL Solid Aluminum
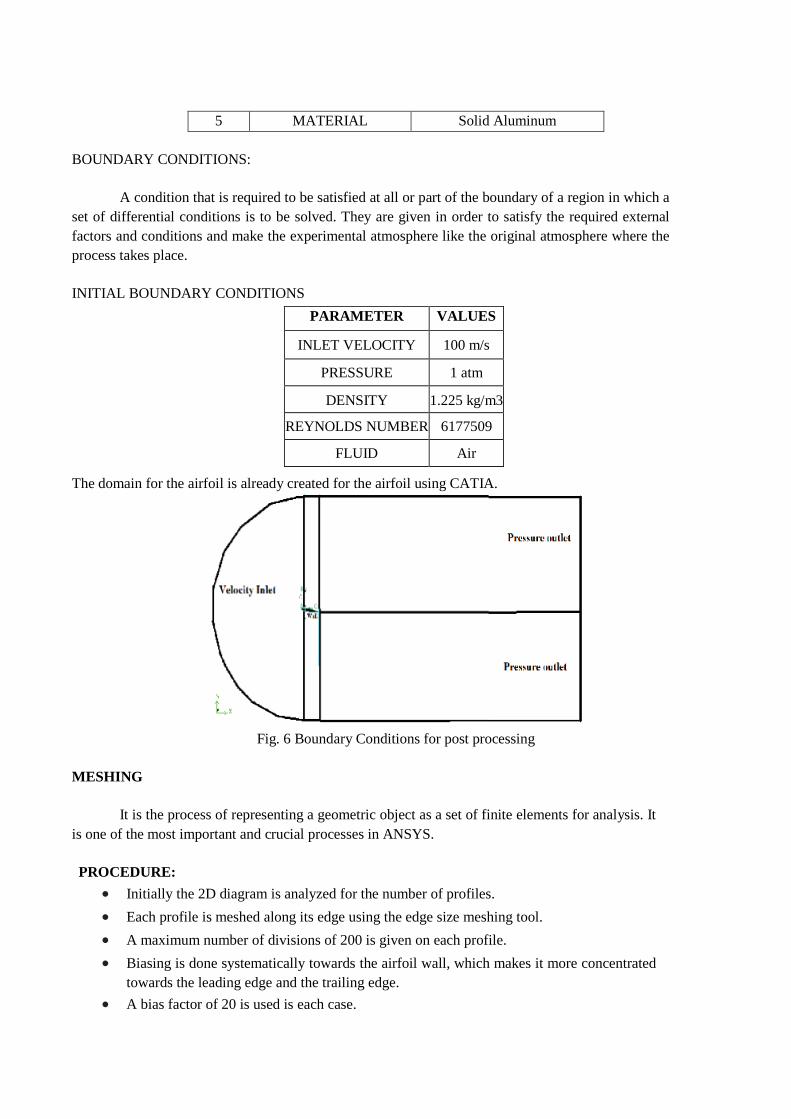
BOUNDARY CONDITIONS:
A condition that is required to be satisfied at all or part of the boundary of a region in which a
set of differential conditions is to be solved. They are given in order to satisfy the required external
factors and conditions and make the experimental atmosphere like the original atmosphere where the
process takes place.
INITIAL BOUNDARY CONDITIONS
The domain for the airfoil is already created for the airfoil using CATIA.
Fig. 6 Boundary Conditions for post processing
MESHING
It is the process of representing a geometric object as a set of finite elements for analysis. It
is one of the most important and crucial processes in ANSYS.
PROCEDURE:
• Initially the 2D diagram is analyzed for the number of profiles.
• Each profile is meshed along its edge using the edge size meshing tool.
• A maximum number of divisions of 200 is given on each profile.
• Biasing is done systematically towards the airfoil wall, which makes it more concentrated
towards the leading edge and the trailing edge.
• A bias factor of 20 is used is each case.
PARAMETER VALUES
INLET VELOCITY 100 m/s
PRESSURE 1 atm
DENSITY 1.225 kg/m3
REYNOLDS NUMBER 6177509
FLUID Air

• Biasing is only given to the profiles on the peripheral surfaces of the airfoil.
• All the surfaces are mapped to the mesh and generated.
• Care must be taken to limit the minimum size of the divisions to ensure smooth meshing.
Usually the minimum size is of the order of 10-4.
4.1 MESHING CONDITIONS
Fig.7, 8 Entire domain mesh and Meshing for airfoil view for dimple at 20% chord length
Fig.9, 10 Entire domain mesh and Meshing for airfoil view for dimple at 40% chord length
CALCULATIONS AND ANALYSIS
Various calculation parameters and values are required to obtain the accurate result. The
various input required for analysis are,

INPUT PARAMETERS
S.NO PARAMETERS VALUES/CONDITIONS
1 Inlet velocity 100m/s(x direction)
2 Pressure 1 atm
3 Gradient Least squares cell based
4 Pressure Second order
5 Momentum First order upwind
6 Turbulent kinetic energy First order upwind
7 Turbulent dissipation rate
8 Number of iterations 1000
9 Calculation model k-epsilon
10 plots Cll2 CD
RESULTS AND GRAPHS

PLOTS OF VELOCITY AT 0 AOA:
Fig.11 Plain Airfoil at 0 AOA (V)
Fig.12 Airfoil with dimple at 20% of chord length at 0 AOA (V)
Fig.13 Airfoil with dimple at 40% of chord length at 0 AOA (V)

10
PLOTS OF STATIC PRESSURE AT 0 AOA:
Fig.14 Plain Airfoil at 0 AOA (P)
Fig.15 Airfoil with dimple at 20% of chord length at 0 AOA (P)
Fig.16 Airfoil with dimple at 40% of chord length at 0 AOA (P)

11
PLOTS OF VELOCITY AT 5 AOA:
Fig.17 Plain Airfoil at 5 AOA (V)
Fig.18 Airfoil with dimple at 20% of chord length at 5 AOA (V)
Fig.19 Airfoil with dimple at 40% of chord length at 5 AOA (V)

12
PLOTS OF STATIC PRESSURE AT 5 AOA:
Fig.20 Plain Airfoil at 5 AOA (P)
Fig.21 Airfoil with dimple at 20% of chord length at 5 AOA (P)
Fig.22 Airfoil with dimple at 40% of chord length at 5 AOA (P)
13
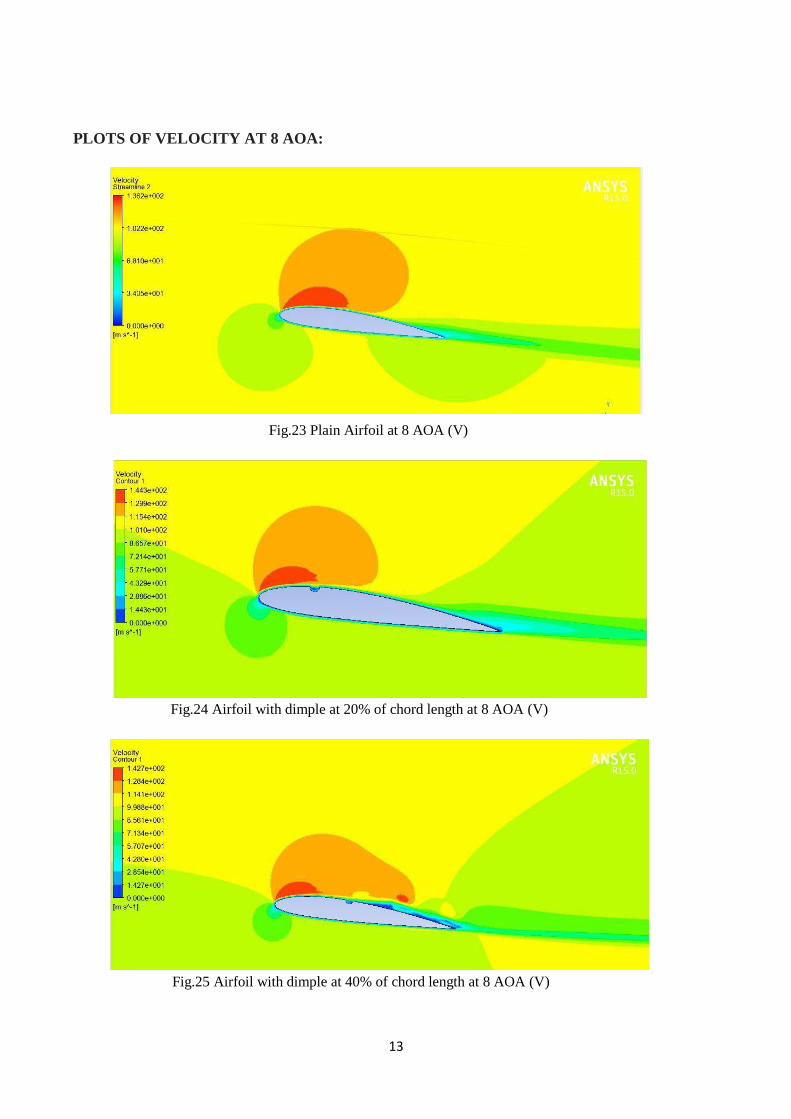
PLOTS OF VELOCITY AT 8 AOA:
Fig.23 Plain Airfoil at 8 AOA (V)
Fig.24 Airfoil with dimple at 20% of chord length at 8 AOA (V)
Fig.25 Airfoil with dimple at 40% of chord length at 8 AOA (V)

14
PLOTS OF STATIC PRESSURE AT 8 AOA:
Fig.26 Plain Airfoil at 8 AOA (P)
Fig.27 Airfoil with dimple at 20% of chord length at 8 AOA (P)
Fig.28 Airfoil with dimple at 40% of chord length at 8 AOA (P)

15
PLOTS OF VELOCITY AT 12 AOA:
Fig.29 Plain Airfoil at 12 AOA (V)
Fig.30 Airfoil with dimple at 40% of chord length at 12 AOA (V)
Fig.31 Airfoil with dimple at 20% of chord length at 12 AOA (V)
16
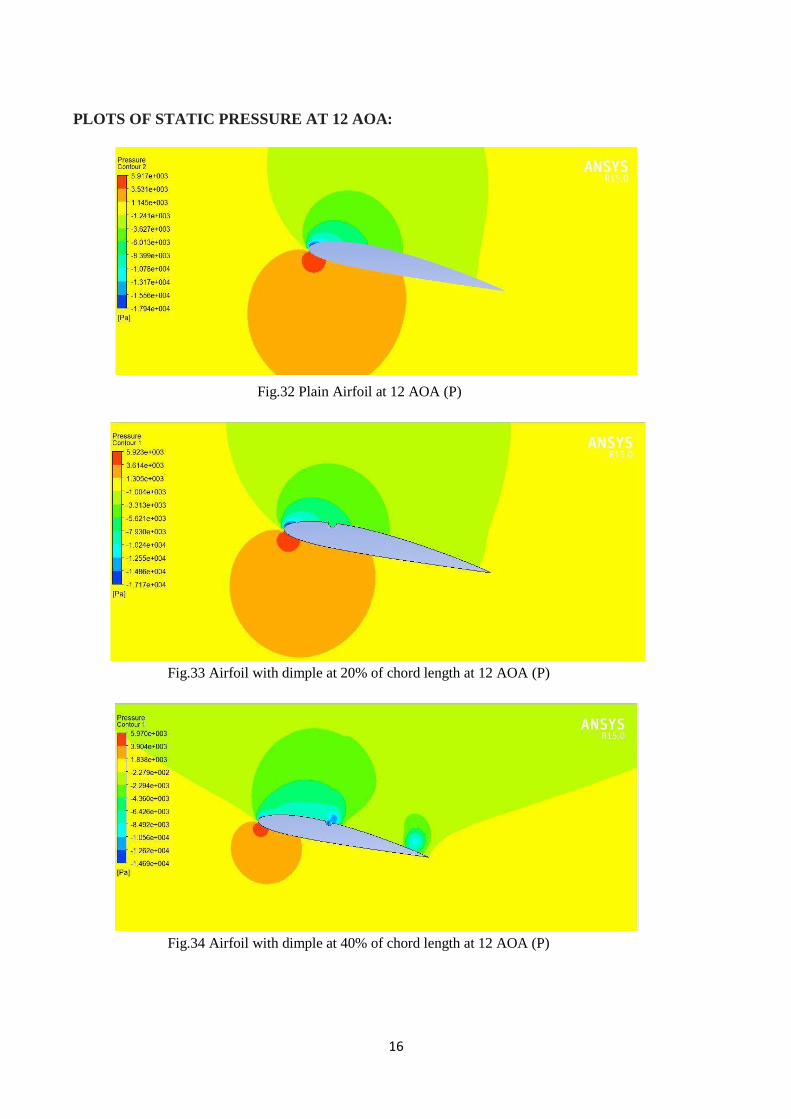
PLOTS OF STATIC PRESSURE AT 12 AOA:
Fig.32 Plain Airfoil at 12 AOA (P)
Fig.33 Airfoil with dimple at 20% of chord length at 12 AOA (P)
Fig.34 Airfoil with dimple at 40% of chord length at 12 AOA (P)

17
PLOTS OF VELOCITY AT 17 AOA:
Fig.35 Plain Airfoil at 17 AOA (V)
Fig.36 Airfoil with dimple at 40% of chord length at 17 AOA (V)
Fig.37 Airfoil with dimple at 20% of chord length at 17 AOA (V)

18
PLOTS OF STATIC PRESSURE AT 17 AOA:
Fig.38 Plain Airfoil at 17 AOA (P)
Fig.39 Airfoil with dimple at 20% of chord length at 17 AOA (P)
Fig.40 Airfoil with dimple at 40% of chord length at 17 AOA (P)

19
PLOTS OF VELOCITY AT 19 AOA:
Fig.41 Plain Airfoil at 19 AOA (V)
Fig.42 Airfoil with dimple at 20% of chord length at 19 AOA (V)
Fig.43 Airfoil with dimple at 40% of chord length at 19 AOA (V)

20
PLOTS OF STATIC PRESSURE AT 19 AOA:
Fig.44 Plain Airfoil at 19 AOA (P)
Fig.45 Airfoil with dimple at 20% of chord length at 19 AOA (P)
Fig.46 Airfoil with dimple at 40% of chord length at 19 AOA (P)
21
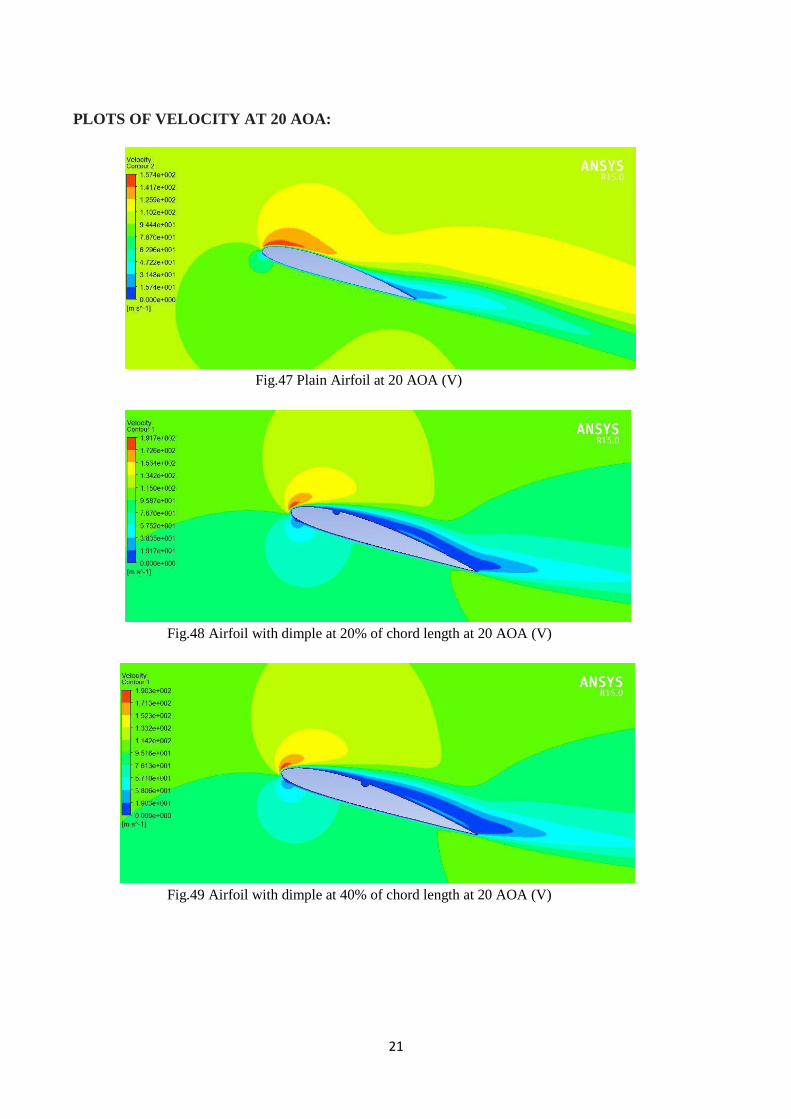
PLOTS OF VELOCITY AT 20 AOA:
Fig.47 Plain Airfoil at 20 AOA (V)
Fig.48 Airfoil with dimple at 20% of chord length at 20 AOA (V)
Fig.49 Airfoil with dimple at 40% of chord length at 20 AOA (V)

22
PLOTS OF STATIC PRESSURE AT 20 AOA:
Fig.50 Plain Airfoil at 20 AOA (P)
Fig.51Airfoil with dimple at 20% of chord length at 20 AOA (P)
Fig.52 Airfoil with dimple at 40% of chord length at 20 AOA (P)

23
PLOTS OF VELOCITY AT 21 AOA:
Fig.53 Plain Airfoil at 21 AOA (V)
Fig.54 Airfoil with dimple at 20% of chord length at 21 AOA (V)
Fig.55 Airfoil with dimple at 40% of chord length at 21 AOA (V)

24
PLOTS OF STATIC PRESSURE AT 21 AOA:
Fig.56 Plain Airfoil at 21 AOA (P)
Fig.57 Airfoil with dimple at 20% of chord length at 21 AOA (P)
Fig.58 Airfoil with dimple at 40% of chord length at 21 AOA (P)

26
GRAPHS
FROM XFLR:
Fig. 59 CL vs CD
Fig.60 CL vs Alpha
Fig. 61 CL/CD vs Alpha
FROM OBSERVATIONS:

27
Fig .62 CL Vs Alpha
Fig. 63 CL/CD Vs Alpha
CONCLUSION
1. From the obtained values, it is seen that the stall angle is increased using dimples. When the flow
along the surface of the airfoil enters a dimple, a small separation bubble is formed in the cavities.
The consequence of the bubble formation is the acceleration of the flow between the dimples on the
surface of the airfoil and boundary layer undergo a transition from laminar to turbulent. This
transition leads to delay of separation of flow from the airfoil causing a substantial reduction of drag
force.
2. For, plain airfoil, the stall angle is at 19 degrees. By using dimples at 20% of chord from the tip, the
stall angle increases to 20 degrees but, the L/D ratio is lesser than that of the plain airfoil. When
dimples are introduced at 40% of chord from the tip the stall angle increases to 21 degrees and the
L/D ratio is increased to 33.79.

28
3. The introduction of dimples at 40% has delayed the flow separation much better than at 20%
which results in significant decrease in drag.
4. A further analysis of the airfoil by changing the size of the dimple and even the shape and the
location of the dimple could give a better and more accurate result of the effect of dimples.
FUTURE SCOPE OF THE PROJECT
The next step of this research could be to test the airfoils with not only different types of inward dimples, but
also with outward dimples and based on how these affect the aerodynamics, the better type can be chosen, or a
hybrid pattern could be tested for better efficiency.
Once these are done, the next step would be to test these patterns on a wing in actual flight conditions. This
can be achieved by either the usage of inflatable surfaces on the wing to effectively change the contour of
surface at specific parts for different angle of attacks by the use of pressure sensors. Or, a smart matrix of
dimples can be created which will arrange itself over the airfoil by sensing the boundary layer separation at
different points. This sensing of boundary layer separation will be done through MEMS based pressure
sensors which will estimate the pressure gradient. Through a predefined algorithm using this data for MEMS
pressure sensors boundary layer separation can be predicted. The same algorithm will then send a command to
rearrange the dimple matrix to optimize for maximum aerodynamic efficiency.
Fig. 64 Inflatable surfaces
Fig.65 Multi dimpled matrix configuration

29
REFERENCES
1. Hossain, Md. Amzad & Uddin, Md & Mustak, Rubiat & Mashud, Mohammad. (2015). Experimental
study of aerodynamic characteristics of airfoils using different shaped dimples. 4. 13-17.
2. Steger J, Benek J. On the use of composite grid schemes in computational aerodynamics. Computer
Methods in Applied Mechanics and Engineering. 1987;64(1-3):301-320.
3. Mehta R. Aerodynamics of Sports Balls. Annual Review of Fluid Mechanics. 1985;17(1):151-189.
4. 4. Asai T, Ito S, Seo K, Hitotsubashi A. Fundamental aerodynamics of a new volleyball. Sports
Technology. 2010;3(4):235-239.
5. Alam F, Chowdhury H, Moria H, Steiner T and Subic A. A Comparative Study of Golf Ball
Aerodynamics. Proceedings of the 17th Australasian Fluid Mechanics Conference (AFMC) 2010; 5-9
December, Auckland.
6. C.E. Smith, N. Beratlis, E. Balaras, K. Squires, M. Tsunoda Numerical investigation of the flow over
a golf ball in the subcritical and supercritical regimes International Journal of Heat and Fluid Flow, 31
(2010), pp. 262-273.
7. Smits AJ and Ogg S. Golf Ball Aerodynamics. In: J.M. Pallis, R. Mehta, M. Hubbard, Editors,
Proceedings 5th International Sports Engineering Conference, 2004.
8. BRIAN F M. Golf balls with isodiametrical dimples. United States of America; US5377989, 2019.
9. Livya, E., Ganna Anitha and P. Valli. “Aerodynamic Analysis of Dimple Effect on Aircraft Wing.”
(2015).
10. 5. Arunkumar A, Gowthaman T, Muthuraj R, Vinothkumar S, Balaji K. Numerical Investigation over
Dimpled Wings of an Aircraft. International Journal for Research in Applied Science and Engineering
Technology. 2017; V(IV):206-211.
11. Bhadri R, Tej R, Srinath S. Aerodynamic effect on Dimple on Aircraft Wings. International
conference on advance in Mechanical,Aeronautical and Production Techniques, MAPT 2011.
12. Al-Obaidi, Abdulkareem Sh & Soh, Zheng. (2016). Numerical Analysis of the Shape of Dimple on
the Aerodynamic Efficiency of NACA 0012 Airfoil.
13. Mustak, Rubiat & Uddin, Md & Mashud, Mohammad. (2018). Effect of Different Shaped Dimples on
Airfoils.
Top Related
Copyright © 2022 FDOKUMEN

