Language Department Handbook (Rev 4/05) - St. Ignatius College ...
Upload
khangminh22Category
view
3download
0
PRACTICAL PHYSICS TESTS USING PARTIAL
ADONU, IFEANYI IGNATIUS
PG/Ph.D/08/49721
PSYCHOMETRIC ANALYSIS OF WAECPRACTICAL PHYSICS TESTS USING PARTIAL
MODEL
FACULTY OF EDUCATION
DEPARTMENT OF SCIENCE EDUCATION
Paul Okeke
Digitally Signed by: Content manager’s DN : CN = Webmaster’s name O= University of Nigeri OU = Innovation Centre
ADONU, IFEANYI IGNATIUS
PSYCHOMETRIC ANALYSIS OF WAEC AND NECO PRACTICAL PHYSICS TESTS USING PARTIAL CREDIT
EDUCATION
DEPARTMENT OF SCIENCE EDUCATION
: Content manager’s Name
Webmaster’s name
O= University of Nigeria, Nsukka
OU = Innovation Centre

PSYCHOMETRIC ANALYSIS OF WAEC AND NECO
PRACTICAL PHYSICS TESTS USING PARTIAL CREDIT MODEL
BY
ADONU, IFEANYI IGNATIUS PG/Ph.D/08/49721
DECEMBER, 2014

iii
PSYCHOMETRIC ANALYSIS OF WAEC AND NECO PRACTICAL PH YSICS TESTS USING PARTIAL CREDIT MODEL
A Ph.D THESIS SUBMITTED TO THE DEPARTMENT OF SCIENCE EDUCATION
UNIVERSITY OF NIGERIA, NSUKKA
BY
ADONU, IFEANYI IGNATIUS PG/Ph.D/08/49721
DECEMBER, 2014
iv
APPROVAL PAGE
This project has been approved for the Department of Science Education,
University of Nigeria, Nsukka.
____________________ ____________________ Professor B.G. Nworgu Professor Z.C. Njoku Supervisor Head of Department ______________________ ____________________ Professor Kalu, Iroha Mathias Dr. B. C. Madu External Examiner Internal Examiner
________________________ Professor Uju C. Umo
Dean, Faculty of Education

v
CERTIFICATION
This is to certify that ADONU, IFEANYI IGNATIUS, a postgraduate student in the
Department of Science Education with Registration Number PG/Ph.D/08/49721 has
satisfactorily completed the requirements for the award of the Degree of Doctor of
Philosophy in Measurement and Evaluation. The work embodied in this Thesis is original
and has not been submitted in part or full for any other diploma or degree of this or any
other university.
________________________ ____________________ Adonu, Ifeanyi Ignatius Prof. B. G. Nworgu Student Supervisor

vi
DEDICATION
To my dear wife Carolyn Ukamaka for her patience and empathetic compromise.

vii
ACKNOWLEDGEMENTS
The researcher is infinitely grateful to Almighty God for granting him good
health, protection, favour, strength and divine grace all through the span of this study.
The transform of this work to a reality today is just a prime grant of the Almighty God.
The researcher therefore promises and prescribes constant adoration to God for this
singular gesture.
The researcher remains forever grateful to Prof. B.G. Nworgu his supervisor for
the study. Through his innate and infinite professional virtues, -tolerance, empathy,
wealthy technical experiences, perseverance etc – he offered immeasurable and exquisite
assistance, advice, criticism and motivations in the course of this study. For his
magnanimity in the course of this work, I will prevail on the Almighty God to bless him
beyond bounds and limits of his passionate expectations.
The immense gratitude of the researcher is also indelibly registered for Dr. B.C.
Madu, Dr. (Mrs.) F.O. Ezeudu, Prof. Z.C. Njoku, Prof. K.O. Usman, Mr Chris Ugwuanyi
and other lecturers in Department of Science Education, University of Nigeria. Their
painstaking efforts in reading through the manuscript, their criticisms and scholarly
inputs, contributed significantly to the grand success of this exercise. To all of you I say
bravo and let God multiply your blessings a million times, thank you so much.
It will be absolutely unfair if the researcher concludes this acknowledgement
without the recognition of prime role played by Dr. J.J. Agah of Department of Science
Education, University of Nigeria, Nsukka in procuring the WINSTEP Computer software
program used for the analysis of the data obtained in this study. Additionally, his roles in
providing directions and criticisms, reading of the manuscripts etc knew no bounds.
The researcher’s joy and thanks also go to Mr. C.E. Urama, former Dean, school
of Sciences, Federal College of Education, Eha-Amufu, Mr. Emmanuel Eze of National
Orientation Agency Enugu and Mr. Emmanuel Uroko of National Orthopedic Hospital,
Enugu. These close allys of mine were divinely inspired to ensure that the study did not
get extinguished when I was at the “Cross road”. The good God that inspired them to
propel the study forward cannot afford not to uplift them one by one in the nearest future.
Equally, appreciated are the following lecturers, Mr. Onyishi S.O., Mrs. Omeke
N.E., Miss Nwoke, C.M., Engr.Ugwu, H.C. (of Department of Physics Fed. College of

viii
Education Eha-Amufu), Mr. Adegoke Nathan, Mr. Odo Friday, of Integrated Science
FCE Eha-Amufu, Mr Eze Celestine Onyebuchi of College Library FCE Eha-Amufu (and
Sister Chika Sylvanus who typed most of the work). Their indispensable roles as able and
committed research assistants throughout the conduct of the study and marking are
hereby fully acknowledged. I cannot thank them well enough but I pray that God will
elevate all of them in the nearest future.
The prayers of Pastor and Pastor (Mrs.) Celestine Ugwuja and other brethren
provoked the requisite spiritual empowerment and psychological equanimity for the
success of this study. I thank them in a special way.
Finally, the researcher thanks in a special way his wife – Carolyn Ukamaka, and
his children – Ifeanyi Henry, Favour Chiamaka, Gold Abumchi and Divine Chimere for
their love, understanding, prayers and support were immeasurable during this study. I
remain forever grateful to them for tolerating and coping with my absence in the course
of this study.
To all of you I say more blessings.
Adonu Ifeanyi Ignatius

ix

x
TABLE OF CONTENTS
Title Page i
Approval Page ii
Certification iii
Dedication iv
Acknowledgement v
Table of Contents vii
List of Appendices x
List of Tables xii
List of figures xiii
Abstract xiv
CHAPTER ONE: INTRODUCTION
Background of the Study 1
Statement of the Problem 12
Purpose of the Study 13
Significance of the Study 14
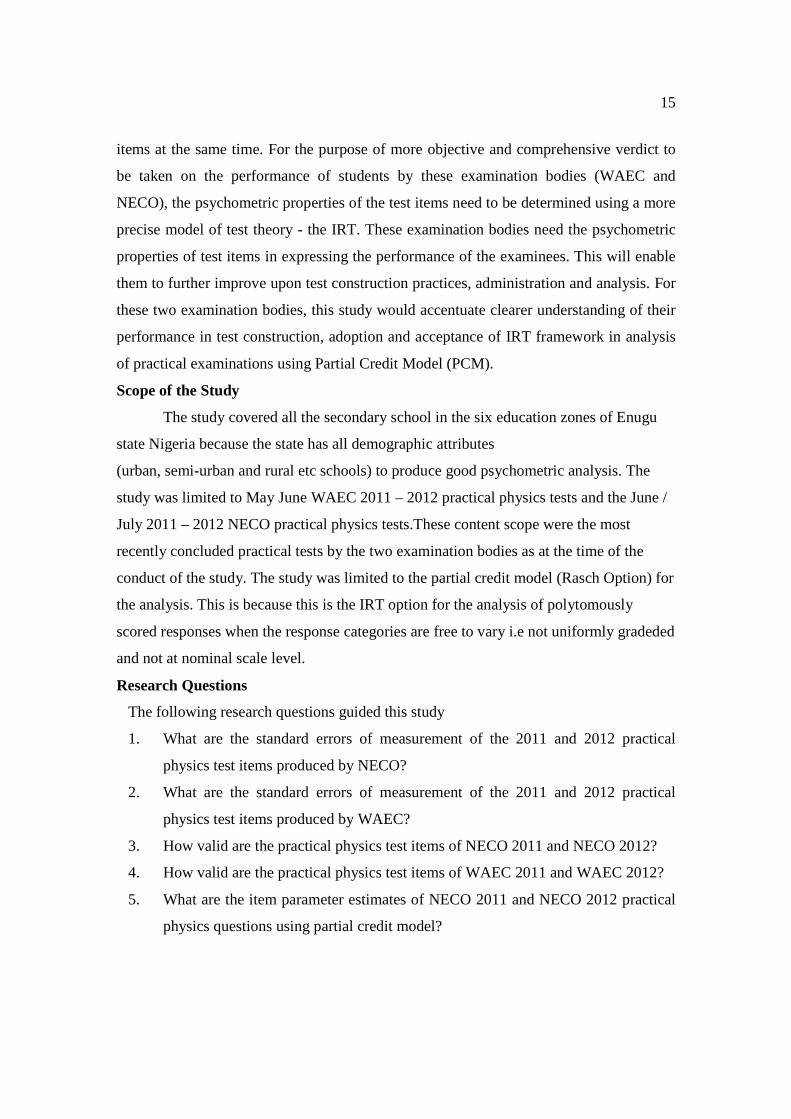
Scope of the Study 15
Research Questions 15
Hypotheses 16
CHAPTER TWO: LITERATURE REVIEW
Conceptual Framework 18
Achievement Testing 20
Item Analysis 21
Validity and Reliability of Measurement Instrument 25
Reliability and Standard Error of Measurements 31
Theoretical Framework
Classical Test Theory 32
Item Response Theory 34
− Historical Background of Item Response Theory (IRT) 34
− Conceptual Background of Item Response Theory 35
− Models of Item Response Theory 43

xi
The Partial Credit Model 45
Some IRT Methods in Estimating Item Parameters 50
Statistical Fit Tests 51
Empirical Studies 52
Summary of Literature Reviewed 61
CHAPTER THREE: RESEARCH METHODS
Research Design 63
Area of Study 63
Population of the Study 63
Sample and Sampling Techniques 64
Instrument for Data Collection 65
Validity of the Instrument 65
Reliability of the instrument 65
Method of Data Collection 66
Method of Data Analyses 66
CHAPTER FOUR: RESULTS
Research Question 1 69
Research Question 2 70
Research Question 3 71
Research Question 4 73
Research Question 5 76
Research Question 6 77
Research Question 7 80
Research Question 8 81
Hypothesis 1 83
Hypothesis 2 83
Hypothesis 3 84
Hypothesis 4 84
Hypothesis 5 85
Hypothesis 6 85

xii
Hypothesis 7 86
Hypothesis 8 87
Hypothesis 9 87
Summary of the Findings of the Study 88
CHAPTER FIVE: DISCUSSION, CONCLUSION AND SUMMARY
Discussion of the Findings 90
Conclusion Reached from the Findings of the Study 98
Implications of the Study 99
Limitations of the Study 100
Recommendations 101
Suggestion for Further Studies 101
Summary of the Study 102
References 109
Appendices 115
A: List of Public secondary schools in Enugu State 115
B: Letter to principal / physics teachers for administration of the instrument 118
C: Practical physics Questions of NECO 2011 (PPQN 1) 119
D: Practical physics questions of NECO 2012 (PPQN 2) 124
E: Practical physics questions of WAEC 2011 (PPQW 1) 127
F: Practical physics questions of WAEC 2012 (PPQW 2) 131
G: Marking scheme of PPQN 2 134
H: Marking scheme of PPQN 1 142
I: Marking scheme of PPQW 1 150
J: Marking scheme of PPQW 2 154
K: Item statistics of Partial Credit analysis showing SEM, fit statistics and ZSTD, difficulty estimates for PPQN 1 158
L: Item fit order of Partial Credit analysis showing observed, expected, residual and STD residual for PPQN 1 159
M: Summary statistics of PCM analysis showing the test reliability for PPQN1 160

xiii
N: Item statistics of Partial Credit analysis showing SEM, fit statistics and ZSTD, difficulty estimates for PPQN 2 161
O: Item fit order of Partial Credit analysis showing observed,
expected, residual and STD residual for PPQN 2 162
P: Summary statistics of PCM analysis showing the test reliability for PPQN2 163
Q: Item statistics of Partial Credit analysis showing SEM, fit statistics and ZSTD, difficulty estimates for PPQW 1 164
R: Item fit order of Partial Credit analysis showing observed, expected,
residual and STD residual for PPQW 1 165 S: Summary statistics of PCM analysis showing the test reliability
for PPQW1 166
T: Item statistics of Partial Credit analysis showing SEM, fit statistics and ZSTD, difficulty estimates for PPQW 2 167
U: Item fit order of Partial Credit analysis showing observed, expected, residual and STD residual for PPQW 2 168
V: Summary statistics of PCM analysis showing the test reliability
for PPQW2 169
W: Education Zones, local government areas and the number of sampled Schools 170 X: Summary of sample size used for data collection as distributed in schools and education zones, local government 171
Appendix
AA: Paired sample t-test analysis of SEM for NECO 2011 and NECO 2012 172
AB: Paired sample t-test analysis of SEM for WAEC 2011 and WAEC 2012 173
AC: Paired sample t-test analysis of SEM for NECO 2011 and WAEC 2011 174
AD: Paired sample t-test analysis of SEM for NECO 2012 and WAEC 2012 175
AE: Paired sample t-test analysis of fit (validity) of NECO 2011 and NECO 2012
176
AF: Paired sample t-test analysis of fit (validity) of WAEC 2011 and WAEC 2012
177
AG: Paired sample t-test analysis of fit (validity) of NECO 2011 and WAEC 2011
178

xiv
AH: Paired sample t-test analysis of fit (validity) of NECO 2012 and WAEC 2012
179
AI: Paired sample t-test for item difficulty (b) of NECO 2011 and NECO 2012
180
AJ: Paired sample t-test for item difficulty (b) of WAEC 2011 and WAEC 2012
181
AK: Paired sample t-test for item difficulty (b) of NECO 2011 and WAEC 2011
182
AL: Paired sample t-test for item difficulty (b) of NECO 2012 and WAEC 2012
183
AM: Squared standardized Residual (fit analysis) of NECO 2011and NECO 2012
184
AN: Squared standardized Residual (fit analysis) of WAEC 2011and WAEC 2012
185
AO: Squared standardized Residual (fit analysis) of NECO 2011and WAEC 2011
186
AP: Squared standardized Residual (fit analysis) of WAEC 2011and NECO 2012
187

xv
LIST OF TABLES
Table pgs
1: SEM of practical physics exam conducted by NECO 2011 and NECO 2012 69
2: SEM of practical physics exam conducted by WAEC 2011 and WAEC 2012 70
3: Validity (Fit statistics) of practical physics exam by NECO 2011 and NECO 2012 72
4: Validity (Fit statistics) of practical physics exam by W AEC 2011 and
WAEC 2012 74
5: Item difficulty measures (b) of NECO practical physics questions conducted in NECO 2011 and NECO 2012 76
6: Item difficulty measures (b) of NECO practical physics questions conducted in WAEC 2011 and WAEC 2012 78
7: The infit, outfit and their ZSTD of NECO 2011 and NECO 2012 practical
physics exam 80
8: The infit, outfit and their ZSTD of WAEC 2011 and WAEC 2012 practical
physics exam 82
9: T test of SEM of NECO 2011 and NECO 2012 83
10: T test of SEM of WAEC 2011 and WAEC 2012 83
11: T test of SEM of NECO 2011 and WAEC2011 84
12: T test of SEM of NECO 2012 and WAEC 2012 84
13: T test of fit statistics (validity) of NECO 2011 and NECO 2012 84
14: T test of fit statistics (validity) of WAEC 2011 and WAEC 2012 85
15: T test of fit statistics (validity) of NECO 2011 and WAEC 2011 85
16: T test of fit statistics (validity) of NECO 2012 and WAEC 2012 86
17: T test of item difficulty estimates for NECO 2011 and NECO 2012 86
18: T test of item difficulty estimates for WAEC 2011 and WAEC 2012 87
19: T test of item difficulty estimates for NECO 2011 and WAEC 2011 87
20: T test of item difficulty estimates for NECO 2012 and WAEC 2012 88

xvi
LIST OF FIGURES
1. Item Characteristics curve for One Parameter Partial Credit Model of IRT.
10
2. Schematic Diagram of Conceptual and Theoretical Framework.
19
3. Adaptation of Rasch ICC for One Parameter PCM.
38
4. The Item Trace Line for Underlying Latent Variable.
39
5. Test Characteristics Curve.
40
6. Item Information Function.
41
7. Test Information Function with approximeter
42

xvii
ABSTRACT
The purpose of the study was to analyse the psychometric qualities of practical physics questions of West African Examination Council and National Examinations Council using the Partial Credit Model (PCM). The objectives of the study were specifically to evaluate the Standard Error of Measurement (SEM), the fit statistics and item difficulty estimates of WAEC and NECO practical physics items and also to test for significance difference of NECO, WAEC and NECO-WAEC psychometric qualities in various years. The apparent difference in the public image of WAEC and NECO examinations, the neglect of psychometric analsyis of polytomously scored physics items and the absolute importance of psychomotor assessments in physics, motivated the researcher to carry out this study. The design of the study was instrumentation research design and the area of the study was Enugu State of Nigeria. The population of the study was all SS III physics students of 2012/2013 academic session in Enugu State. A sample of 668 physics students was drawn through multi stage sampling procedure. The instrument for the study consisted of four different tests viz; two practical physics questions of NECO 2011 and 2012 (PPQN, 1 and 2) and two practical physics questions of WAEC 2011 and 2012 (PPQW, 1 and 2). Eight research questions and nine hypotheses guided the study. The research questions were answered using the descriptive statistics of Winstep software maximum likelihood ratio. The hypotheses were tested at 0.05 level of significance using the SPSS independent sample t-test statistics, and the chi square goodness of fit test using WINSTEP PCM analysis and SPSS. The major findings of the study indicated that: The standard error of measurement (SEM) of items of WAEC and NECO practical physics in 2011 and 2012 were very low- below 0.18 for all items. The fit statistic indicated that nearly all the items of both exams NECO and WAEC were valid and thus sufficiently demonstrated unidimensionality; The item difficulty estimates (b) for both examinations for the two years studied showed that all the items have difficulty estimates that range between -1.53 to +1.94 which show that their difficulty are moderate for all items. All the four different tests that constituted the instrument had very high proportion of their item fit to PCM with all the four parts having 0.92 proportion of fit. Other findings of the study include; There was significant difference in NECO 2011and NECO 2012, SEM. There was no significant difference between WAEC 2011 and WAEC 2012; NECO 2011 and WAEC 2011; NECO 2012 and WAEC 2012, SEM; NECO 2011 and NECO 2012; WAEC 2011 and WAEC 2012; NECO 2011 and WAEC 2011; NECO 2012and WAEC 2012 fit (validity) analysis; and in the difficulty estimates of NECO 2011 and NECO 2012; WAEC 2011 and WAEC 2012; NECO 2011 and WAEC 2011; NECO 2012 and WAEC 2012 tests. Based on the close resemblance of the psychometric qualities of these two examination bodies as revealed by these findings it is recommended that the confidence and recognition accorded to these two examination bodies by the public and educational institutions continues to be the same.

1
CHAPTER ONE
INTRODUCTION
Background of the Study
Societal development and break through in any nation are predicated on education
sector of such a nation. New researches prove the long held expectation that human
capital formation (the population education) plays a significant role in country’s
economic development. Quality education leads not only to higher individual output but
is also a necessary precondition for long term economic growth. Rigorous analysis of
data provides policy makers with proof that education is a necessary precondition for
long term economic development.
It is for the above reason that Nigeria in her National Policy in Education adopted
education as an instrument “par excellence” for effecting national development and
harnessing the potentials of the citizens (Federal Republic of Nigeria, FRN 2008).
Akindogu and Bamjoko (2010) pointed out that the country’s vision is for a complete
transformation of all aspects of the nations life over time and that education should be
able to effect inter and intra generational transmission of our cherished heritages and life
inventions and should reposition Nigeria global status in science and technology in all
spheres of life.
While commenting on the role of education in national development, Blogspot
(2009) noted that education is a milestone for all types of development and provides all
knowledge to do any work in a systematic way. According to this author, with education
any country can develop her economy and society, develop the personality of youths of
the nation; make the citizens more productive by providing large number of skills to
make them self reliant.
The major challenge for education in the twenty first century for our country
Nigeria according to Maduagwu (2008) is designing an educational system that will be
stable and global in outlook, and maintaining high standard of education. A cardinal
challenge for Nigeria, if she is to use education to achieve the objective of overall
development, is maintaining high standard of education through high quality assessment.
And to achieve high quality assessment, in order to realize the goal of overall
1

2
development, all the dimensions of educational objectives must be adequately measured
and assessed.
Educational objectives according to Onwuka (1981) are expressed in terms of
knowledge (cognitive domain), attitude (affective domain) and practical/motor skills
(psychomotor domain). Hence education is said to be balanced when it satisfies the
demands of the three major domains of educational objectives. Behaviour under the three
domains of objective should form the bases for teaching and learning process and
subsequently assessment. Bandele (2002) noted that the three domains should be taught
and assessed critically to mould individual in totality and make the recipient of education
to live a fulfilled life and contribute meaningfully to the society in which he lives.
The cognitive objectives refer to the intellectual results of schooling, the
improvement in the child’s intellectual structure, his increase in knowledge and his
ability to reason rather than just to remember. The affective objectives refer to the
emotional education, and the learners’ acquisition of certain desirable attitudes, interest
and appreciation; while psychomotor objectives refer to physical and practical
manipulative skills learnt at school (Nwana, 1979).
The three domains of educational objectives according to Oyesola (1986) are
inter-related. In general psychomotor domain deals with practical activities and some
examples of practical and motor activities include writing legibly, drawing maps
accurately, ability to manipulate laboratory equipment and use them effectively,
maintaining farm tools, weave and make baskets etc (Osunde, 1997). This author posited
that practical skill assessment requires some form of performance testing under a
controlled condition.
The National Policy on Education (FRN, 2008) considers the acquisition of
appropriate skills, abilities and competences as equipment for the individual to live and
contribute to the development of the society as one of the cardinal national educational
goals (FRN, 2008). The national policy was explicit on developing the manipulative
skills of students in the schools and de-emphasizing the memorization and regurgitation
of facts while encouraging practical, exploratory and experimental methods of
developing motor skills. Also, for secondary and tertiary institutions, the national policy
has vividly emphasized the acquisition of manual and practical skills that will enable us

3
to live and keep pace in the modern age of technology. The various policies of national
government as stated above can readily be realized by emphasizing qualitative
assessment of the aspect of curriculum that teach practical skills. Therefore, for the
objectives of national policy on technological advancement to be realized through the
school system, a greater emphasis has to be given to the psychomotor assessment of
practical aspect of various courses.
Since the instructional objective include psychomotor domains (practical skills),
this domain should be assessed and stressed like the cognitive assessment. Generally, in
sciences, WAEC and NECO place more emphasis on cognitive domain than on other
domains of educational objectives. At secondary school level, most often than not
assessment is concentrated on cognitive achievement to the detriment of psychomotor
and affective development of the learners. This is not unconnected with Nigeria societal
quest for paper qualification. Thus, a child with pass mark in his or her subject receives a
certificate at the end of the course no matter how bad his/her manners are or how
unskilled he/she may be (Idowu and Esere, 2009). In other words, psychomotor and
affective traits do not fully count towards obtaining a certificate. Educational evaluators
like Miller, Frank, Frank and Eheltor (1989), have prescribed a departure from excessive
emphasis on only cognitive domain to make room for a more comprehensive picture in
the development of the learners in the school system.
Test of practical skills in physics is measurement of psychomotor domain of
behaviour. Different instruments exist for the assessment of psychomotor domains of our
educational enterprise. To evaluate achievement in psychomotor domain, the procedures
are the same with that of cognitive domain, although the objectives differ. The procedure
for assessing the psychomotor domain includes among others practical work and projects
(Harbor Peters, 1999). Test of practical skills are of importance because like every other
reliable and valid test performances, they are utilized for selection of candidates, for
further studies, for employment etc. Several experts such as Yoloye (2004), Harbor-Peter
(1999), Nworgu (1992), and Gronlund (1975) have noted that achievement test in
psychomotor domains of educational objectives serve the purpose of evaluating students
progress and giving students, parents, family, school and society feedback on the students
progress. Also, achievement tests in psychomotor motivate students to learn more; giving

4
feedback on teaching effectiveness; predicting future performances; providing methods
of selection, etc.
Achievement test in physics practicals is inevitable because the practice of
physics equips us with the knowledge of underlying principle for the majority of our
technological products. According to Egbugara (1989), “physics is the most fundamental
science subject which act as the basic index to all courses in technological development
and myriad of other scientific development necessary to mankind”. WAEC (2009) stated
that the objectives of practical physics among others are to inculcate in students the spirit
of scientific investigation, to establish some basic principles of physics using experiment,
to understand the use of certain equipment, to develop the ability of conducting
experiment according to specification while using same for analysis.
Also, Kirschner and Meester (1988) suggested the students’ centered objective for
practical work to include (i) to formulate hypotheses (ii) to solve problems (iii) to use
knowledge and skill in unfamiliar situation (iv) to design simple experiment for testing
hypothesis (v) to use laboratory skills in performing experiment, interpret the data and
draw inference. In the same vein, Carduff and Reid (2003) provided many possible
reasons for inclusion of practical work in various subjects to include, illustrating key
concepts, training in specific practical skills, developing observational skills, deduction
and interpretation skills, developing problem solving skills, showing that theory arises
from practical and developing the scientific bases for some products etc. Practical physics
as a matter of fact is indispensable as they improve our disposition towards the scientific
bases of technology. Adequate practical activities in physics correlate with good school
results in physics. Practical, project and examinations, test achievement in psychomotor
domain.
Test is only one technique of measuring educational outcomes and other
techniques include questionnaire, interview, practicals, observations etc. Test connotes a
structured situation comprising a set of questions which an individual is expected to
respond to, on which bases his behaviour, and/or performance is quantified ( Habor
Peters, 1999; Nworgu, 1992; Gronlund, 1976)
Gronlund (1976) hinted that the validity of information provided by the test (of
practical skills) however, depends on the care with which the test are planned and

5
developed. Also, measurement of practical skills in education is the quantitative
description of pupils change in behavior and measurement instruments are tests, class
work, projects, assignment etc (Habor Peters, 1999; Nworgu, 1992;). Nenty (2004) and
Kerlinger and Lee, (2000), have suggested that for measurement in education to be
meaningful, the objectives to be measured, the number to be assigned and the rules of the
assignment of the number must be well defined. Yoloye (2004) stated that responses to
tests and other measuring instruments enable the examiner to assign the testees numeral
or set of numerals from which inferences could be made about the testees performance on
whatever the test is supposed to measure. This means that a good instrument for testing of
psychomotor ability should have some psychometric properties
In the first instance psychometric analysis is the science of measuring latent traits
or constructs in our subjects of interests. The psychometric analysis of a test would imply
analyzing such constituents of psychometrics as (i) Validity- whether a test measures
what it is intended to measure (ii) Reliability – the consistency in measuring what it
intends to measure (iii) Difficulty index or conversely easiness index ( iv) Discrimination
index –how sharply does the test distinguish between low and high ability students. The
psychometric analysis of a psychomotor test in physics therefore implies analysis of
practical test in physics to obtain the validity, reliability, difficulty and discrimination
indices.
In practice, the relevance of practical test is largely dependent on the levels of
reliability, validity, difficulty and discrimination indices. All these constitute
psychometric properties of a test. The psychometric analysis of a test is a multi step
process that can follow more than one measurement theory frame work. These
frameworks are usually classical test theory (CTT) and item response theory (IRT).
The teacher, the school and various assessment agencies such as West African
Examination Council (WAEC) and National Examination Council (NECO), etc are
saddled with the responsibility of implementing the objectives as stated in national policy
on education. In WAEC and NECO the analysis of psychometric qualities of their
polytomously scored items are mostly done with classical test theory (Korashy, 1995).
Thereafter the qualities of these items are kept as classified information and can be hardly
accessed by the public, researchers or other educational agencies. Since the practical

6
aspect of physics curriculum is a sine-qua-non to technological advancement and
realization of objectives of national policy on education, it is therefore pertinent that the
psychometric properties of practical tests by the examination bodies such as WAEC and
NECO should be determined. This will indicate the overall quality of assessment/ test
conducted by the examination bodies in practicals. This will go a long way towards
enlisting confidence or otherwise in the examining bodies.
The ultimate examining bodies in secondary schools such as WAEC and NECO
assess /test the psychomotor aspects of objectives through practical examinations in the
sciences. WAEC, NECO and National Business and Technical Education Board
(NABTEB) are the three bodies in Nigeria today that have the responsibility of awarding
ordinary level certificate.
The origin of WAEC dates back to 1949, when the British Council of states for
colonies invited Jeffry to visit West Africa to study and come up with a proposal for West
African Examination Council (WAEC, 2002). The report was submitted and adopted in
1950 by four West African governments (Nigeria, Ghana, Sierra Leone and Gambia).
These governments came up with an ordinance that established WAEC as a cooperate
body. WAEC in these countries conduct both national and international examination at
both ordinary and advanced levels.
Also, in 1999, the Federal government of Nigeria established the National
Examination council (NECO). The aim of this is for Nigeria to have an independent and
national examination body that has the same standard with WAEC. The cooperate
headquarters of NECO is Minna and they conduct national examinations such as
examination into unity schools i.e. entrance examination into Federal government
secondary schools, entrance examinations into schools for the gifted children and
ordinary level school certificate examinations (NECO, 2001).
The WAEC physics O’level examinations are made up of three parts: paper 1
(practical – 50 marks); paper 2 (objective – 50 marks); and paper 3 (essay – 60
marks)(WAEC,2009).Exactly the same allocation of marks to various papers apply to
NECO. For this study, only the practical questions will be used for analyses. This is
because many studies like Obinne (2011, 2008) have dwelt on psychometric properties of
objective test items in various subjects. Up to now no study could be assessed in literature

7
that has attempted the analyses of psychometric properties of practical aspects of physics
(polytomously scored with varied category) in WAEC and NECO O’level examinations.
The West African Examination Council and the National Examination Council
base the analyses of psychometric properties of items on classical test theory framework
(Obinne, 2008). On the premise of having weak theoretical assumptions and the item and
person circular dependency statistics, the classical test theory has been seen as not precise
as item response theory for ensuring objectivity in psychometric analyses (Ndalichako
and Rogers, 1997; Smith, 1996; Korashy, 1995).
Despite the importance of practical physics, the various analysis of psychometric
properties of questions (in research studies) have not attempted psychometric analysis of
practicals (Korashy, 1995). Such studies as Obinne (2011), Obinne (2008), Nworgu
(1985), Agwagah (1985), Obioma (1985) went variously into psychometric analyses of
questions that are dichotomously scored. Moreover, most psychometric analyses so far
used classical test theory (CTT) model. The classical test theory is no longer considered
fully or 100% valid enough for ensuring objectivity in measurement (Smith, 1996;
Korashy, 1995).
The classical test theory (that is mostly being used for test analysis) has many
limitations such as circular dependency, weak theoretical assumptions etc which cast
doubts when psychometric properties of tests are obtained using the CTT model. There is
therefore, the need to change the method of analysis of psychometric properties of tests
from CTT to a theory that will further attenuate the shortcomings of CTT model. In
particular, there is the need to study the psychometric properties of physics practical in
WAEC and NECO practical physics as many has been done for objective physics and
virtually none for practical examinations and both are of equal weight in these exams ie
they carry equal marks.
Almost every, if not all instruments used in Nigeria currently for assessment of
achievements in our educational processes rely on classical test theory. This CTT model
produces scale that yield different results across different population i.e. item and person
parameter are sample dependent; there is weak theoretical assumption to meet with test
data such as the assumption that error scores in high and low ability students are equal –
in other words student error of measurement is consistent across the entire population and

8
the sample size for the item parameter estimation is small. [Embretson and Reise, 2000;
Fan, 1998; Hambleton and Jones, 1993; Lord and Norvick, 1968; and Lord, 1952; 1953].
The major limitation of CTT can be summarized as circular dependency (a) the person
statistics (i.e. observed score) is item sample dependent and (b) the item statistics (i.e.
item difficulty and item discrimination) are examinee sample dependent. This circular
dependence poses some theoretical difficulty in CTT application in some measurement
situations (Fan, 1998).
Due to the inherent advantages of item response theory, it becomes absolutely
compelling that emphases are to shift from classical test theory to item response theory in
test analyses. Theoretically IRT overcomes the major weakness of CTT, that is the
circular dependency of CTT item/ person statistics. As a result IRT models produce item
statistics independent of examinees samples and person statistics which are independent
of the particular set of items administered. This invariance property of item and person
statistics of IRT has been illustrated theoretically (Hambleton and Swaminathan, 1985);
Hambleton, Swaminathan and Rogers, 1991) and these have been widely accepted by the
global measurement community: This invariance property of IRT model parameters
makes it theoretically possible to solve some measurement problems that have been
difficult to handle within the CTT framework such as computerized adaptive testing
(Hambleton et al., 1991). The importance of invariance property of IRT model parameter
cannot be overstated. Without this crucial property however, the complexity of IRT
models can hardly be justified on either theoretical or practical grounds (Fan, 1998).
Item Response Theory (IRT) is an attempt to model the relationship between an
unobserved variable - the examinees ability and the probability of the examinee correctly
responding to any particular test item. IRT models are therefore mathematical functions
which relate the probability of success on a task to the underlying proficiency measured
by the task. IRT avails us of the opportunity of attaining invariant item parameters such
as difficulty index (b-parameter), discrimination index (a-parameter), guessing index, (c-
parameter) in the cases of dichotomously scored responses. IRT on the whole is a
statistical framework for addressing measurement problems such as test development,
test score equating and identification of biased test items (Hambleton and Jones, 1991).
With IRT, it is possible to construct trait line for exact measurement of a particular trait

9
possessed by an individual. The foregoing merits of IRT made possible by invariant
property of Item Response Theory (IRT) makes IRT a plausible alternative to classical
test theory in an attempt to enthrone better objectivity in measurement.
Item response theory can be divided into two families – uni-dimensional and
multi-dimensional models. While uni-dimensional model require a single trait or ability
dimension, multi dimensional IRT models response data (instrument data) arising from
multiple traits. Most item response theory researchers and applications make use of uni-
dimensional IRT models. IRT models are also categorized on the bases of scored
responses. The typical multiple choice items are dichotomously scored. Even if there are
four or five options they are still being scored as correct or incorrect, right or wrong. A
different class of models apply to polytomous outcomes where each response has
different score values. An example of polytomously scored items are those rated on a
scale of 1-5 or a situation where some number of steps are required to complete a
particular assignment.
The relationship between examinees performance and the set of traits underlying
the item performance can be explained by a monotonically increasing function known as
Item Characteristic Curve (ICC) or Item Characteristic Function (ICF) (Hambleton,
Swaminathan and Rogers, 1991). For items that are dichotomously scored, the ICF can be
verified using the one parameter, two parameter and three parameter logistic models.
Using these models the item statistics,- the item difficulty (b-parameter), item
discrimination (a-parameter) and pseudo guessing, (c- parameter) can be verified for
items that are dichotomously scored. The one parameter model (Rasch model) can only
verify b, the two parameter model or Birnbaun model can verify b and a; while the three
parameter model or Lords models can verify b, a and c.
For items that are polytomously scored various models for studying the item
statistics exist. Some of these models are: Graded Response model, Nominal Model,
Partial Credit model and Rating Scale Model. The various models provide mathematical
equations for the relationship that exists between the probability of correct response (θ) to
the ability level of the student. Each of the models has one or more parameter –(b, a or c
defined above) that describes a particular item characteristic curve along with other

10
technical properties of the item. In each IRT model, a mathematical function is used to
estimate the probability of correct response at several ability levels (-3 to +3).
In IRT, the Item Characteristics Curve (ICC) is described by (i) the difficulty
parameter b which is the location on the ability axis at which the probability of correct
response P(θ) = 0.5 (ii) the discrimination parameter (a) which is the slope of ICC at a
particular ability level; the higher the value of a, the steeper the slope (iii) the guessing
parameter c is the vulnerability to guessing which makes ICC asymptotic and always
positive along vertical axis.
The assessment of psychomotor/practical skills in any area will be better studied
if the examinees responses are polytomously scored rather than dichotomously scored.
Cognitive outcomes may be simply studied using dichotomous scoring but for
psychomotor outcomes they are better done with polytomous scoring. This makes partial
credit scoring indispensable in many assessment situations. The usual motive for partial
credit scoring as stated in Masters (1982) is the hope that it will lead to a more precise
estimate of person’s ability than a simple pass/fail score. This author noted that certain
type of data should come from an observation format which requires the prior
identification of several other levels of performance on each item and thereby award
partial credit for partial success on each item.
The item item characteristics curve for Rasch (one parameter) Partial Credit
Model of IRT is illustrated below:
1.000
0.800
0.600
0.400
0.200
0.000 -3 -2 -1 0 b 1 2 3
Pro
bab
ility
of c
orr
et r
esp
ons
e P
(θ)
Ability ( θ) in Standard Scores
Fig. 1-Item Characteristics Curve for One Parameter / Rasch (One Parameter) Partial Credit Model of IRT

11
The polytomous Rasch model which is a generalization of the dichotomous model
can be applied in contexts in which successive integer scores represent categories of
increasing level of magnitude of a latent trait such as increasing ability, motor function
and so forth. The PCM is an appealing model for many applications because unlike the
Graded Response model, Generalized partial credit model, etc it does not contain a
discrimination parameter and thus can be used with sample sizes that are smaller than
those required for models containing a discrimination parameter. Furthermore, because
the PCM belongs to Rasch family of models it brings with it the advantageous properties
known to exist for all Rasch models including separation of person and item parameters
(Andrich, 1988; Michell, 1990; Fischer, 1995).
Hypothetically, an examinee could take the test a great many times and obtain a
variety of test scores. One would anticipate that these scores would cluster themselves
around some average value. In measurement theory, this value is known as true score and
its definition depends upon the particular measurement theory. In item response theory,
the definition of true score according to Lawley, in Baker (2001) is given by
∑=
=N
jij PTs11
)(θ
where Tsj is the true score for examinee with ability level θj
i denotes an item and Pι jθ depends on the item characteristics curve
model employed.
Just like other IRT models, the PCM is characterized by specific objectivity and
uni-dimensionality. Mellember (1994) stated that specific objectivity means that
comparison of two items difficulty are assumed to be independent of any group of
subjects being studied and does not depend on any subset of item being administered.
And uni-dimensionality means that a single latent variable fully explains task
performance (Carlson, 1993).
Latent characteristics of examinees cannot be measured with physical implements
or instruments like measurements in the physical sciences. But objective measurements
of latent traits can be achieved using the item response approach. The sample free nature
of the results provided by the IRT models are technically known as Invariance of item
parameters. With this invariance of item parameters a uniform scale of measurement is

12
provided for use in different populations. Latent traits are behaviours that can be
indirectly observed. To measure these traits we need to provoke the examinees to act
while trying to capture the intensity of such a trait in the individual by putting up a
related graded task (known as item) for the examinees. Through this we can elicit the
behaviour that describes the trait under study (Nenty, 2005).
All examinations conducted in Nigeria have been based on classical Test Theory
framework CTT for years (Obinne, 2008). Examination bodies have as well relied on
CTT for testing their candidates. Psychometric analyses done on instruments by Nworgu
(1985), Agwagah (1985), Obioma (1985) all relied on classical test theory. There is
nearly no psychometric analysis of practical physics yet as revealed by literature. Even
though practical physics in WAEC and NECO have the same weight with their objective
tests, studies that have so far been done have mostly dwelt in objective aspect. There is
therefore the need to study the psychometric qualities of our practical questions in these
two examinations using item response theory Format-Partial Credit, model. This will help
attenuate the shortcomings of CTT model that is presently used for analysis by the exam
bodies. There is also the need for more concise, objective and pragmatic method of
constructing, scoring and analyzing psychometric properties of practical physics. This
will go a long way to convince the public that the standard of the two examinations
WAEC and NECO are about the same thereby removing bias and doubt against any of
their standard as is sometimes the case.
Statement of the Problem
West African Examination Council Ordinary level examinations in Physics are
made up of three parts, namely paper 1(practical -50 marks); Paper 2 (objective-50
marks) and paper 3 (essay-60 marks) (WAEC 2009). Exactly the same mark allocation is
applicable to the respective patterns of assessment in National Examination Council
O’level physics examination. Studies on psychometric properties of WAEC and NECO
examination have dwelt on the objective component of these examinations (i.e. paper 2)
to the exclusion of the practical, component (i.e. paper 1) and the essay component (i.e.
paper 3). The polytomously scored components i.e. practical (paper 1) and essay (paper3)
of these examination (practical and essay) contribute more than two thirds of the total
score on both WAEC and NECO O’level physics. Yet there is no study that has gone into

13
psychometric analyses of polytomously scored components of WAEC and NECO physics
examinations. This situation creates an obvious gap, part of which this study was able to
address.
Furthermore, these studies on psychometric properties of WAEC and NECO
mostly utilized the classical test theory (CTT) approach in their analyses. The modern
measurement theory – item response theory (IRT) has not been fully explored with
respect to analyses of psychometric properties of our tests in WAEC and NECO.
Considering the obvious advantages in the underlying assumption and basic tenets of the
framework- IRT, would the scenario be different if we utilize IRT for analyses of
psychometric properties of WAEC and NECO examinations in Nigeria?
Purpose of the Study
The purpose of the study was to investigate some psychometric properties of
WAEC and NECO practical physics questions using the partial credit model of item
response theory.
Specifically, the study did:
1. Estimate the standard error of measurement of the practical physics test items set
by the National Examination Council (NECO) of Nigeria.
2. Estimate the standard error of measurement of the practical physics test items set
by the West African Examination Council WAEC.
3. Investigate the validity of the practical physics test items produced by NECO.
4. Investigate the validity of the test items of practical physics test items produced
by WAEC.
5. Estimate the item parameter (item difficulty) of NECO practical physics
test items using the Partial Credit Model.
6. Estimate the item parameter (item difficulty) of WAEC practical
physics test items using Partial Credit Model.
7. Determine the proportion of fit of NECO practical physics questions using Partial
Credit Model of IRT.
8. Determine the proportion of fit of WAEC practical physics questions using Partial
Credit Model of IRT.

14
Significance of the Study
The following could benefit from the findings of the study- test devevelopers, the
classroom teacher, the society, and examination bodies.
The results of the study would make input into the present state of test
construction. This would help test developer and examination bodies to determine the
existence or otherwise of Item Differential Functioning (DIF). Item bias or Differential
Functioning is readily and more reasonably possible in item response theory model due to
its invariant sample properties. And so, the results from this study will encourage test
developers to undertake rigorous item analysis before and after test administrations.
The results of the study will be useful to classroom teachers, as they gets
informed on the possibility of use of partial credit model for the analysis of their
polytomously scored items. To the guidance counselors it exposes the students’
performance item by item and the possible reason for such performance for each item.
And for educational establishments it offers some explanation of examinees results
through person by item response pattern for large scale testing purposes. The results of
the study would serve as a tool for diagnosis of student’s strengths and weaknesses by
teachers and guidance counselors. The method of this study would involve identification
of errors and factors/misconceptions leading to such errors. Hence, it will ensure
improvement in the teacher’s instructional strategies, coverage and practices. The study
will arm the guidance counselor with the weapon, necessary information and data to
diagnose students’ strength and weaknesses since the study will have the data on their
performance item by item.
The results of this study would help to establish the quality of examination
conducted by WAEC and NECO. It will confirm the reliability and validity of the
examination conducted by NECO and WAEC. This will go a long way to establish to the
society public trust and acceptability of results from these examination bodies. The
results of this study would probably convince the public that the exams conducted by
WAEC and NECO are of comparable standard.
Presently, the examination bodies such as WAEC, NECO and others are largely
dependent on classical test theory for their test development and analyses. The use of the
CTT in test analysis conceals some of the characteristics of both the examinees and the
15
items at the same time. For the purpose of more objective and comprehensive verdict to
be taken on the performance of students by these examination bodies (WAEC and
NECO), the psychometric properties of the test items need to be determined using a more
precise model of test theory - the IRT. These examination bodies need the psychometric
properties of test items in expressing the performance of the examinees. This will enable
them to further improve upon test construction practices, administration and analysis. For
these two examination bodies, this study would accentuate clearer understanding of their
performance in test construction, adoption and acceptance of IRT framework in analysis
of practical examinations using Partial Credit Model (PCM).
Scope of the Study
The study covered all the secondary school in the six education zones of Enugu
state Nigeria because the state has all demographic attributes
(urban, semi-urban and rural etc schools) to produce good psychometric analysis. The
study was limited to May June WAEC 2011 – 2012 practical physics tests and the June /
July 2011 – 2012 NECO practical physics tests.These content scope were the most
recently concluded practical tests by the two examination bodies as at the time of the
conduct of the study. The study was limited to the partial credit model (Rasch Option) for
the analysis. This is because this is the IRT option for the analysis of polytomously
scored responses when the response categories are free to vary i.e not uniformly gradeded
and not at nominal scale level.
Research Questions
The following research questions guided this study
1. What are the standard errors of measurement of the 2011 and 2012 practical
physics test items produced by NECO?
2. What are the standard errors of measurement of the 2011 and 2012 practical
physics test items produced by WAEC?
3. How valid are the practical physics test items of NECO 2011 and NECO 2012?
4. How valid are the practical physics test items of WAEC 2011 and WAEC 2012?
5. What are the item parameter estimates of NECO 2011 and NECO 2012 practical
physics questions using partial credit model?

16
6. What are the item parameter estimates of WAEC 2011 and WAEC 2012 practical
physics questions using partial credit model?
7. What proportion of NECO 2011 and NECO 2012 practical physics test items fit
the partial credit model of IRT?
8. What proportion of WAEC 2011and WAEC 2012 practical physics test items fit
the partial credit model of IRT?
Hypotheses
1. There is no significant difference (P<.05) in the Standard Error of Measurement
(SEM) between NECO 2011 and NECO 2012 practical physics tests items.
2. There is no significant difference (P<.05) in the Standard Error of Measurement
(SEM) between WAEC 2011 and WAEC 2012 practical physics test items.
3. (a) There is no significant difference (P<.05) in the Standard Error or
Measurement (SEM) between (NECO 2011 and WAEC 2011); practical physics
tests items.
(b) There is no significant difference (P<.05) in the Standard Error or
Measurement (SEM) between (WAEC 2012 and NECO 2012) practical physics
tests items.
4. There is no significant difference (P<.05) in the validity (fit statistic) of NECO
2011 and NECO 2012 practical physics tests items.
5. There is no significant difference (P<.05) in the validity (fit statistics) of WAEC
2011 and WAEC 2012 practical physics test items.
6. (a)There is no significant difference (P<.05) between the validity (fit statistics) of
(NECO 2011 and WAEC 2011) practical physics test items.
(b) There is no significant difference (P<.05) between the validity (fit statistics) of
(NECO 2012 and WAEC 2012) practical physics test items.
7. There is no significant difference (P<.05) in the item difficulty estimates (b) of
NECO 2011 and NECO 2012 practical physics test items using PCM.
8. There is no significant difference (P<.05) in the item difficulty estimate (b) of
WAEC 2011 and WAEC2012 practical physics test items using PCM.
9. (a)There is no significant difference (P<.05) between the item difficulty estimates
(b) of (NECO 2011 and WAEC 2011) practical physics test items using PCM.

17
(b) There is no significant difference (P<.05) between the item difficulty estimates
(b) of (NECO 2012 and WAEC 2012) practical physics test items using PCM.

18
CHAPTER TWO
LITERATURE REVIEW
The relevant literature on the psychometric analysis of practical physics question
given by WAEC and NECO using Partial Credit Model (PCM) of Item Response Theory
(IRT) was done under the following subheadings:
Conceptual Framework
• Achievement Testing
• Item Analyses
• Validity and Reliability of Measurement Instruments
Reliability and Standard Error of Measurement
Theoretical Framework
Classical Test Theory
Item Response theory
Some IRT methods in estimating item parameters
Empirical Studies
Summary of Literature Reviewed
18

19
18
Test Developer Examination bodies
Guidance conusellors
Teachers
Achievement Testing
Test Theories
Classical Test theories
Item characteristics curve Test characteristic curve Item Information function
Item Response Theory Model
Dichotomously Scored dd
Polytomously Scored dd
1PLM dd
2PLM dd
3PLM dd
Partial Credit Model
Graded response Model
dd
Rating scale Model
Correlation Method
Regression Method
Approximation Method
Maximum Likelihood Procedure Method
Ability Estimate
Parameter Estimate
Validity Reliability /Standard
error of measurement
Testing
Nominal scale model
Fig. 2-Schematic Diagram of Conceptual and Theoretical Framework

20
In achievement testing two major test theories are mostly utilized for assessment
of psychometric properties of the items. These theories are Classical Test Theory and
Item Response Theory. Item Response Theory Models utilize Item Characteristcs Curve
(ICC), Test characteristics Curve (TCC), and Item Information Function (ICF),
differently for Dichotomously scored and Polytomously scored responses. In both
dichotomously and polytomously scored reponses, four methods are used in estimating
item parameters - correlation method, regression method, approximation method and
maximum likelihood procedure method. These methods are used to estimate the ability
estimates, Parameter estimates, validity and Reliability of the items under item response
theory. These item characteristics are useful for Test developers, examination bodies,
guidance counselors, and classroom teachers.
Achievement Testing
An achievement test according to Nworgu (2003) is an instrument designed to
measure the outcome of the level of accomplishment in a specified programme of
instruction in a subject area or occupation which a student has undertaken in the recent
past. Ali (1996) also defined achievement test as an instrument administered to an
individual as a stimuli to elicit certain desired and expected responses as demanded in the
instrument, performance on which the individual is assigned a score representing his
achievement. According to the author, this score baring other unforeseen circumstances is
a measure of his possession of the characteristics being measured by the test taken.
Essentially if a test has to measure achievement very well, it has to be valid, reliable and
manifestly objective. The use of test can be greatly improved and substantiated if it has a
clear and usable marking scheme and direction for administration, scoring and
interpretation of the test. For proper analyses of achievement test, the researcher has to
prepare instructional objectives on the topic of instruction of the test. Nworgu (2003)
specifically noted that since tests are designed to aid in determining the extent of
attainment of objectives, assessment measure can therefore be classified into three on the
basis of corresponding objectives as follows: Measures of cognitive ability, measures of
affective ability and measures of psychomotor ability.
An achievement test is a measure of maximum performance and is classified into
general and diagnostic achievement test. Gronlund (1976) defined diagnostic evaluation

21
to connote a test designed to reveal a persons strengths and weakness in one or more
areas of the field being tested. It is mainly used to identify source of difficulty in a
curriculum area, while the general achievement test sample the entire field of work being
tested and which yield a single score that indicate relative achievement in the area being
tested.
Achievement tests are designed to identify what a student has learned in a general
or specific area of knowledge that he has been exposed to. The achievement test dwell on
specified content area. The items of test have to be sampled for suitable statistical
properties. According to Ferguson in Nworgu (2003) "Such items are those which will
contribute positively in the differentiation of the individual or description of individual
differences" (p. 103). Hence in analyzing achievement tests, the emphasis is on ensuring
that the test posseses a fairly large variance in relation to the number of items of the test.
Since the total test variance is a function of the items variance and the inter items co-
variances, it therefore follows that items with large item variances will make more
contribution to total test variance. Items variance is largest and ideal when item facility is
0.50. Value of item facility is large if it is close to 0.50. However the ideal item facility of
0.50 is not readily practically possible. Therefore in test construction, we include items
within specified range of facilities equally spaced on both side of 0.5. For practical
purposes, the acceptable range, according to Harbor Peters (1999), Nworgu (2003) is 0.03
to 0.7,Q. Item facility could take values of 0 where nobody gets the answer correctly to 1
where everybody gets the answer correctly.
In this study, the researcher identified important psychometric qualities of a test
and used WAEC and NECO questions to determine the level of these qualities in these
questions. The study was undertaken using partial credit model of item response theory.
Item Analysis
Item analysis is a process which examines students’ responses to individual test
items (questions) in order to assess the quality of those items and of the test as a whole.
Item analysis is especially valuable in improving items which will be used again in later
test but it can also be used to eliminate ambiguous test items or misleading items in a
single test administration. Additionally, item analysis is valuable for increasing

22
instructor’s skill in test construction and identifying areas of the course content that need
greater emphasis or clarification.
Item analysis is a method of reviewing items on a test and that this review could
be both qualitative and statistical, to ensure that they all met minimum quality control
criteria. Qualitative review according to this author is essential during item development
when no data are available for quantitative or statistical analysis. Item analysis
(quantitative) is conducted after test administration and data is available for analysis. The
objectives of item analysis is to identify problematic items or bad or misfitting items.
Items may be problematic because (1) they are poorly written causing students to be
confused during response (2) graphs, diagrams, pictures etc are not clear (3) items do not
have a clear response and a distraction may potentially qualify as the correct answer (4)
items containing distractors that most students can see are obviously wrong, increasing
the chance of correct guessing (5) tyey represent a different content area than that
measured by the test. This is known as multi dimensionality.
In summary, Harbor-Peters (1999) stated that test item analysis deals with the
processes involved in determining the psychometric qualities of the tests and that since
the qualities of the test items determine the quality of the whole test, the assessment of
these qualities of items constitute item analysis. This could be qualitative or quantitative.
One may ask why is it important to review every item in a test. One may equally
speculate that as long as the majority of the test items are good, there may not be much
impact if a few items are problematic. However, based on statistical theory and previous
experience, we know that the presence of few problematic items reduces overall test
reliability and validity sometimes markedly. Measurement tools (test) are frequently
assessed based on reliability and validity.
Qualitative item analysis deals with the consideration of content validity – how
effective the items are in terms of their writing procedures. Content validity is the most
important validity consideration for an achievement test. Anastasi in Nworgu (2003)
noted that content validity involves systematic examination of the test content to
determine whether it covers a representative sample of the behaviour domain to be
measured. This implies analysis of a test to ascertain if the aspect of behaviour domain

23
under consideration are covered to reflect the relative importance of each section and if
the skills resulting from the behaviour is covered.
From the foregoing, it can be deduced that ordinary inspection of a test is not
enough to ensure its content validity and the behaviour domain to be sampled by a test
has to be well defined before it is developed. Consequently, a number of specific
procedures can be adopted in evaluating content validity of an achievement test. One of
such procedure involves in cooperating content validity into the test from the beginning
through the choice of appropriate item. For educational achievement tests this is done by
adoption of appropriate test blue prints. The test blue print is developed in the beginning
of the test construction based on close inspection of relevant course syllabus, textbooks
and consulting subject experts. In this way, the content area to be covered and the
objective to be tested and the relative importance of each area in the syllabus is given a
thorough survey hence ensuring content validity. The second procedure adopted in
ensuring content validity of an achievement test is supplementary and empirical in nature.
The total score on the test and performance are checked for grade progress. Items that
show large gains in the proportion of students passing them from lower to upper grade
are retained. This procedure is not applicable to all contents, like in a situation where the
syllabus is not sequenced according to class level. In this type of situation better
performance at lower level does not necessarily mean some defects in the items. It may
imply that the items represent content areas that the higher class was not exposed to.
Quantitative item analysis deals with analysis of statistical properties of the items
such as item facility and item validity. Izard (n.d) stated that two main indices are
obtained from a traditional analysis of students responses to test items. These are item
difficulty (or item facility) and an index of item discrimination. Item facility also known
as item easiness or item difficulty is defined as the index that describes the level of the
difficulty of test item (Harbour-Peters, 1999). The index of difficulty of item which is
reported for a particular test administered to a particular group is function of the skills
required by the questions and the skills achieved by those attempting the test. According
to Ross (n.d) item facility is the opposite of item difficulty and as the difficulty increases,
fewer candidates are able to give the correct responses; as the facility increases, more
candidates are able to give the correct response. Habor-Peter (1999) and various other

24
authors relate the item facility to the proportion of students answering each item
correctly. It helps in ensuring that items that are suitable are included in the final version
of the items in the parallel form of test and arranging such items of the test in an
approximate order of decreasing facility. Such deferential sequencing of test items has
been shown by Haliday and Patridge (1979) to produce superior performance than any
other ordering. The facility of the test items determines the test mean facility, the lowest
and the highest scores and the spread of the test scores. This implies that if the
distribution of the test scores deviates sufficiently from normality when a large sample
was used then the facility of the items included in the test may be considered unsuitable.
The item facility will need to be adjusted until the distribution of the test scores shows
normality (Nworgu, 2003).
Item validity indices are however, based on item criterion relationship. The
criterion may have been the one employed in the validation process of the test. Over fifty
of such indices have been developed and employed in test construction according to
Anastasi as reported in Nworgu (2003). These indices could be differentiated, some
applied to dichotomous while others apply to continuous measure, and some are
dependent on item facility while some are not. Those item validity indices that are
dependent on item facility yield high validities for item facilities near 0.50. Irrespective
of these differences, all the indices yield very close results even though their numerical
value varies a bit, the item selected or rejected through different validity indices are more
or less the same. On this basis the researcher for the purpose of item analysis should
choose the index that can be computed with ease.
Item discrimination is a procedure that investigates how each item distinguishes
between candidates with knowledge and skill and those lacking such knowledge and
skill; choosing items with an acceptable discrimination index will tend to provide new
version of test with greater homogeneity (Ross, nd) or simply put that the discrimination
is the measure of the extent to which a test item discriminates between high ability and
low ability students who got the item right divided by the number in either group (Harbor
Peters 1999).
Two item validity indices are worthy of mention because they are commonly used

25
(i) Discrimination Index: This is a measure of the proportion of testees passing each item
in the upper and lower criterion groups, Discrimination Index ranges from -1 to+1; items
with higher values are preferred. If the sample N is large (N>150 say) discrimination
index of 0.22 and above is recommended (Nworgu 2003). The criterion group is
frequently selected on the bases of total test score. Other criteria that may be employed
are cumulative grade point, job rating, course grade, teachers rating etc. The important
thing is the consideration of criterion measure vis-a-vis the ability being assessed by the
test. The extreme group has sharp differentiation but the reliability of the test result is
reduced.
The following characteristics are identified for discrimination index
• It is simple in calculating and in concord with most other measures of validity
indices
• The size of the sample from where it is obtained does not affect the interpretation
of the index
• There is relationship between mean discrimination index and the reliabilities of
the test. The higher the mean index the higher the reliability coefficient
• It is independent of item facility but biased in favour of intermediate values of
item facility
(ii) The Phi-Coefficient: This is a measure of the relationship between item and the
criterion. Its value ranges from -1 to +1. It is computed from a four fold table based on
proportion passing and failing each item in the upper and the lower group. This
coefficient assumes a genuine dichotomy in both variables. It is strictly applicable to
dichotomous condition under which it was obtained. This coefficient is biased towards
intermediate facility.
Validity and Reliability of Measurement Instrument
Cardinals among the proprieties of good research instrument are validity and
reliability
Validity: An instrument is deemed to be valid when it measures what it is supposed to
measure. This definition is in line with the View of Gronlund (1976) where he defined
validity in terms of the usefulness of the result of the test. According to Gronlund (1976)
validity is "The extent to which results of an evaluation procedure serves the particular

26
uses for which they are intended for" (p.79). In his view if test result is used to describe
achievement, it should represent specific achievement and nothing more. That is if test
result is used to predict success in future activity, the result should provide as accurate as
possible the estimate of the future success. To that extent therefore is the test valid.
Also Stanley (1964) views validity in terms of the result being a suitable measure.
According to Stanley (1964) "A test is valid if in the end it turns out to be a suitable
measure" (p. 160). Thousand and one authors such as Mehrens and Lehman (1978) have
consistently described an instrument to be valid when the instrument measures
specifically what it is supposed to measure.
In all, instrument validity differs according to the situation and the major criterion
for the instrument validity is the purpose for which the instrument was being established.
The validity of the instrument therefore has to be determined by the research objective. If
the objective of the instrument is in line with the research objective then the instrument is
valid. An instrument that is not valid is useless so to say. An instrument could be valid
for some purposes and invalid for others. Different interpretations for the use of a test
have different degrees of validity for each interpretation. Since no test is valid for all
purposes or in all situations for every pupil, there is nothing like the validity of a test.
Actually a test cannot just be said to be valid. A test is valid for a particular purpose and
for a particular group. For instance a valid test of intelligence is not likely to be a valid
test of personality
A test, which has high validity for a purpose may or may not have low or
moderate validity for another. A test no matter how well designed is valid for some
purpose and invalid for others. Precisely speaking we talk of validity of test scores and
not of the test. This view is also shared by Gronlund (1976) when he stated that “Validity
refers to the extent to which the results of an evaluation procedure serve the particular
uses for which they are intended” (P.79). Also Harbor Peters (1999) noted that validity
pertains to the results of the evaluation instrument not the instrument itself.
Three types of validity are known to exist. They are:
(1) Content validity
(2) Criterion related validity
(3) Construct validity

27
There exist a fourth type but in the technical sense strictly, it is not a type of
validity. This is face validity. Some authors like Harbor Peters (1999) regards all the four
mentioned as types of validity.
Face validity according to Harbor Peters (1999) confirms the extent a test -
represents what has been specified in the blueprint. Face validity is a crude method of
assessing (by measurement experts) the content validity of the specification on the test
blueprint. In general face validity has to do with appearance of the measuring instrument.
It confirms whether the instrument looks like a test and asseses whether the test is content
valid. In face validation, the validator considers (a) appropriateness of language for the
intended audience (b) Relevance of items with respect to research objectives (c) Extent of
Content coverage.
Content Validity: This according to Gronlund (1976) may be defined as "the extent, to
which a test measures a representative" sample of the subject matter content and the
behavioural change under consideration. The content validity is essentially concerned
with the adequacy of the sample with respect to the content this is the primary concern in
achievement testing. This form of validity is usually built into the instrument during its
process of development making use of test blue prints. Content validity is applicable
where the content domain is delineated e.g. Achievement in a given area. But if the
dependent variable is not delineated e.g. Interest, content validity is not applicable.
For the development of test blue print which we usually use as basis for
determining content validity we usually compose the table of specification on various
level of the taxonomy of the educational objective. The number of question at various
levels (the weighting) is determined by the curriculum area emphasis, the time of
teaching and the extent of material covered. The test blue print is therefore the
benchmark for assessing content validity. A consideration of test vis-a-vis the table of
specification tells whether the test is content valid.
Criterion Related Validity: This is the extent to which measures from a test is related to
an external criterion. The measure from the test or instrument is the predictor where the
external behaviour the test is predicting is known as the criterion. Criterion related
validity according to Harbor Peters (1999) “is the extent to which test performance is

28
accurate in predicting future performances or estimating some current performances” (p.
49).
There are two types of criterion related validity. These are predictive and
concurrent validity. The distinction between concurrent and predictive validity lies in the
time lag between when the predictor measure was collected and when the criterion
measure became available. If the two measures are available about the same time then it
is called concurrent validity. But when there is time lag of days, weeks or years then it is
predictive validity. The procedure for establishing criterion related validity is to correlate
the two measures, the predictor and criterion measure using appropriate correlation
technique. The resultant correlation coefficient is the concurrent or predictive validity as
the case may be.
Construct Validity: This deals with the extent to which a test performance can be
interpreted in terms of a given psychological construct. In researches where the
dependent variable is in form of construct (e.g. Intelligence, scientific attitude, critical
thinking, study habit etc) that do not have a defined content domain; construct validity is
the, most appropriate form of validity. Factor analysis is frequently used to establish
construct validity.
Reliability: According to Harbor Peters (1999) "the reliability of test scores refers TO
their relative freedom from unsystematic errors of measurement" Pg. 44. (Unsystematic
errors are errors that may emanate from administrative conditions -Physical and
psychological).
Reliability therefore refers to the ability of a test to measure consistently even
under varying conditions. It establishes the consistency or other wise of a particular
score. Reliability is intimately related to validity. In fact all valid tests are reliable but all
reliable tests are not necessarily valid. Gronlund (1976) noted that "reliability merely
provides consistency that makes validity possible" (p.107). He further observed that a test
that has high reliability may have little or no validity, but a test that has satisfactory
validity must essentially have satisfactory reliability. He went further to state that the
only difference between validity coefficient and reliability coefficient is that the former is
based on agreement with an outside criterion and the latter is based on agreement
between two sets of result from the same procedure.

29
If a test is not reliable, it may be due to influence of some sources of error with
the test subjects. In theory each source of error defines instability. In practice these types
of reliability estimates have been identified, by several authors such as Harbor Peters
(1999), Gronlund (1976), Stanley (1964) etc.
Types of Reliability
(i) Stability
(ii) Equivalence
(iii) Internal consistency
(iv) Scorer or Rater’s Reliability
i) Stability is the ability of the same test to produce the same results if the test is given
the same testees within short interval. The reliability coefficient of stability is
obtained through test - retest method. The result from the same test for the same
testees obtained twice is correlated using Pearsons product moment correlation
method. In this way the result obtained after correlation gives us reliability coefficient
of the test results for stability.
ii) In obtaining equivalence form of reliability we talk of two parallel tests. The two
parallel tests are given in short time interval or even in quick succession. The results
obtained from the same testees for the two parallel tests are then correlated using
Pearson's product moment correlation formula. This is the index of Equivalence for
the two tests.
iii) Internal consistency is concerned with the accuracy with which an instrument has
sampled a given content universe. The major source of error here is the content
coverage. The internal consistency can be established using:
(a) Split half method
(b) Kuder Richardson method
(c) Cronbach Alpha or Coefficient Alpha
(a) In split half method you administer the test once but in scoring you split the
scores into two (may be even and odd number scores). In this, each testee will
have two composite scores. The reliability coefficient for each half is obtained
30
and represented as r12.To get the reliability of the whole test from the correlation
between the two halves, we can use the Spearman-Brown prophecy fomula.
Thus
1
1
1
2
r
rrtt +
=
Where rtt = reliability of the whole test
ri = reliability of half of the test
(b) Kuder- Richardson method is used to estimate the internal consistency when the
items are dichotomously scored using the formula
K – R(20) rxx =
Σ−
− xS
pq
n
n2
11
K – R(21) rxx =
×−×−
− xnS
n
n
n2
(1
1
Where rxx = internal consistency reliability of the test result
pq = variance of single item
n = number of items in the test
S2x` = variance of total test
× = mean of the total test
K – R20 is used for dichotomously scored items
K – R21 is used for polytomously scored items
c) Cronback Alpha is used for continuously scored and essay type questions to
estimate the internal consistency.
(d) Scorer or Raters Reliability: When the same scripts are given to two scorers to mark,
we can obtain individual scorers consistency using Pearson's product moment
correlation. We can as well obtain the relationship between two different scorers
using the spearman's rank order correlation. But if the scorers are more than two we

31
can use Kendal Coefficient of concordance or any other appropriate technique to
obtain the scorers reliability.
Reliability Coefficient could vary depending on the method used to estimate the
index. Gronlund (1976) identified a number of factors that -can influence the reliability of
test result such as test length, speed of the test, the group homogeneity, difficulty level of
test, objectivity in scoring etc.
Reliability and Standard Error of Measurement
Psychometric instruments are valuable if and only if such instrument is a valid
and reliable measure. The first major task of a test developer is establishing the
instrument to be valid and sufficiently reliable. This reliability is characteristic of the
scores from the instrument. When the test is given to a specified group of testees under
designated conditions, it is standardized instrument. Since the reliability of a test
according to Thondike (1990) is intended to measure the degree of accuracy,
dependability and consistency, the concept is indispensable in test development and as a
result has been undergoing continuous redevelopment with increasing definition
clarification and applicability. As a result there are several perspectives of interpreting
reliability.
Lord and Norvick (1968), Allen and Wendy (1979), interpreted reliability in
several ways to include:
(a) The reliability of a test is equal to the correlation of its observed scores with
observed scores on a parallel test
(b) The reliability coefficient is the ratio of true score variance to observed score
variance i.e. reliability = VarianceScoreObserved
VarianceScoreTrue
(c) The reliability coefficient is one minus the squared correlation between the
observed and error score i.e. Reliability = 1 – r2 where r is the correlation between
observed and error score
(d) The reliability coefficient is the square of correlation r between observed and true
score i.e. Reliability = r2

32
(e) The reliability coefficient is one minus the ratio of error score variance VE to
observed score variance VX i.e. Reliability = 1 - X
E
V
V
(f) The reliability of the test refers to the relative freedom of test scores from errors
of measurement. The standard error of measurement (SEM) is given by
SEM = sd XXr−1
Where
Sd = Standard deviation of the observed scores rxx = the reliability of the test.
Therefore the SEM is dependent on reliability coefficient rxx and the standard
deviation of the test. While the rxx takes into consideration the measurement errors
present in the observed scores, the S.d takes into consideration the variability of the
observed scores. In conclusion, from this perspective, both standard error of measurement
and standard deviation are important in determining the reliability of a test.
B. Theoretical Framework
Classical Test Theory
Schumacker (2009), Embretson and Reise (2000), Fan (1998), Hambleton and
Jones (1993), etc were all consistent in stating that classical test theory was an emanation
of the early 20th century approach to measurement of individual differences. Classical
theory has three basic measurement concepts (a) Test Score or observed score (b) True
score and (c) Error score.
Classical Test Theory (CTT) postulates linking the observed score or test score X,
to the sum of true score (latent unobservable score) T and error score (E) as X = T + E.
The following assumptions are at the background of the CTT (1) That true score and
error score are uncorrelated (2) The average error score in a population of testes is zero
(3) Error scores in a parallel test are uncorrelated.
CTT utilizes item and sample dependent statistics. These include item difficulty,
item discrimination estimates, distractor analysis and other such related statistics. Most of
the psychometric analyses have focused on examinee assessment at the test score level
and not at the item level as in the case of item response theory. Analysis of test scores
using the CTT also includes a measure for the reliability of the scores, difficulty of test
etc.

33
The major advantage of CTT is its relatively weak theoretical assumption which
makes CTT easy to apply in many testing situations (Hambleton and Jones 1993).
Relatively weak assumption does not only characterize CTT but also its extensions such
as generalizability theory. Although CTT’s major focus is on test level information, item
statistics (item difficulty and item discrimination) are also important aspect of CTT
models.
The second advantage of CTT is that at item level the CTT model is relatively
simple. CTT does not invoke a complex theoretical model to relate an examinee’s ability
to success on a particular item. The CTT instead considers a pool of examinees and
empirically examines their success rate on an item. Another advantage of CTT is that the
analysis can be performed with smaller representative samples of examinees. This is
particularly important when field testing an instrument.
The major limitations of the classical test theory are (1) the two statistics that
form the cornerstone of most CTT i.e. item difficulty and item discrimination are both
sample dependent. Higher item difficulty values are obtained from examinee samples of
lower-average knowledge. And for the discrimination indices higher values tend to be
obtained from heterogenous sample of examinees and lower values from homogenous
samples. Such sample dependency relationships reduce the overall utility of these
statistics (Schumacker 2009). (2) Another limitation of CTT is that the person statistic
(observed score) is (item) sample dependent. The two limitations of CTT above can be
summarized as circular dependency i.e person statistic is item dependent; and item
statistics are (examinee) sample dependent. This circular dependency poses some
theoretical difficulties in CTT application in some measurement situations such as test
equating, computerized adaptive testing (Fan 1998).
Embretson and Reise (2000) reviews the ramifications or rules of CTT to include:
1) The standard error of measurement of a test is consistent across the entire
population i.e the standard error of measurement (SEM) does not differ from
person to person but instead is generated by large number of test takers and is
therefore generalized to the population of the test takers. Additionally regardless
of raw test scores the standard error for each score is the same.

34
2) Another ramification is that as the test become longer the test become
increasingly reliable. Statistics generated from large population is more stable
than that generated from small population. Larger number of items better sample
the universe of items and statistics generated by them such as mean test scores are
more stable if they are based on more items.
3) Multiple form of test are considered to be parallel only after much effort has been
expended on them to demonstrate their equality. Also their variances and
reliabilities as well have to be equal.
4) Another ramification is that the item statistics depend on the sample of the
respondents being representative of the population. The interpretation of
normative information should also be applicable to test scores in CTT so that the
sample characteristics can be conveniently generalized to the population.
Item Response Theory
Historical Background of Item Response Theory
The concept and methodology of IRT have been developed for over three quarters
of a century now (Reeve 1986). In effect the modern psychometric theory is no longer too
recent. Thurstone (1925) laid down the conceptual foundation of IRT in his paper titled:
A method of scaling Educational and Psychological Tests. In this paper he provided a
technique for placing items of Binet and Simon test of 1905 which is a test of childrens
mental development on an age graded scale.
Thurstone abandoned his work in measurement to pursue the development of
multiple factor analysis but his colleagues and students continued to refine the theoretical
bases of IRT (Steinberg and Thissen 1995). Normal orgive model was introduced as a
means to display the proportions correct for individual items as a function of normalized
scores. Lawley (1944) extended the statistical analysis of the properties of normal orgive
curve to describe the maximum likelihood estimation procedure for item parameters and
linear approximation to those estimates. Also Lord (1952) introduced the idea of latent
trait or ability and differentiated this construct from observed test score and Lazarsfeld
(1950) explained and established the unobserved variable as accounting for the observed
interrelationship within the item responses.

35
Embretson and Reise (2000) textbook titled “Item Response Theory for
Psychologist” is considered a landmark in IRT development while Lord and Novick
(1968) textbook titled “Statistical Theories of Mental Test Scores” provided a unified
treatment of the classical test theory. The remaining half of this textbook Statistical
Theory of mental Test Scores written by Allen Brinbaun also provided rigorous
description of the IRT models. Reeve (1986) noted that Bock; David Thissen; Muraki
Eiji; Robert Gibbons; Robert Mislevy, were among notable students of University of
Chicago contributed in no small measure in developing effective estimation methods and
computer program such as Bilog, multi log, par scale and Test fact. Also Bock and
Aitken (1981) developed the algorithm of maximum likelihood method to estimate item
parameters that are used in many item response theory programs.
Rasch (1960) explained the need for creating statistical models that exhibit the
property of specific objectivity, and the idea that people and item parameters be estimated
separately but comparable on similar metric. Rasch inspired Fischer (1968) to extend the
applicability of Rasch model into psychological measurement. Ben Wright was also
inspired to teach the same methods and to inspire other students for further development
of the Rasch model. Such students include David Andrich, Geoffrey Masters, Graham
Douglass etc who helped and pushed the methodology into education and behavioural
medicine (Wright 1997).
Conceptual Background of Item Response Theory
Item response Theory (IRT) just like CTT is a popular statistical frame work for
addressing measurement problems like test development, test score equating and
identification of a biased items (Hambleton and Jones 1993). IRT affords us of different
ways apart from CTT of constructing tests and at the heart of the IRT according to Nenty
(2005) is the characteristics of the individual items. In IRT the proportion of Individuals
getting a valid item correct is correlated with ability (θ). Using factor analysis,
undimensionality and local independence is established for each item. This enhances
additional validation issues for tests developed using IRT. In IRT each test item is
correlated with the ability assessed by the testee, if the result is negative or uncorrelated
then the item should be dropped. This will ensure the homogeneity of items developed.

36
IRT is a model for expressing the association between an individual’s response to
an item and the underlying latent variable (ability or trait) being measured by the
instrument (Reeve 1986). The latent variable expressed as theta (θ) is a continuous
unidimensional construct that explains the covariance among item responses (Steinberg
and Thissen 1995). Individuals at higher level of (θ) have higher probability of
responding or endorsing an item correctly.
IRT models use item responses to obtain scaled estimate of θ as well as to
calibrate the items and examine their properties (Mellenbergh 1994). Such item is
characterized by one or more model parameters. The item difficulty or threshold
parameter b is the point on the latent scale (θ) where a person has 50% chance of
responding positively to the scale item (question). Items with high threshold are less often
endorsed (Steinberg and Thissen 1995). The scope or discrimination parameter, a,
describes the strength of an item discrimination between people with trait level (θ) below
and above the threshold b. the a parameter may also be interpreted as describing how an
item may be related to trait measured by scale and is directly related, under the
assumption of normal (θ) distribution to the biseral item test correlations ρ (Linden and
Hambleton 1997). For item i the relationship is
a: = 21
.p
pi
−
the scope parameter is under some conditions linearly related to the variable
loading in factor analysis. Some IRT models in educational research may include a lower
asymptote parameter or guessing parameter c to possibly explain why people of low
levels of the trait (θ) are responding positively to an item.
The probability P(θ) of correct response to an item is modeled depending or
conditional on the latent variable (θ) or ability being measured. The item trace line for
each item estimated from corresponding item parameter is plotted as in the figure below.
The partial credit model is a simple adaptation of Rasch model for the
dichotomies (Reeve, 1986). The Rasch model (one parameter logistic model), assumes
that all items are equal in discrimination and that chance or guessing does not influence
the responses of the individual. Thissen, Nelson, Buileaud and McLeod (2001) noted that
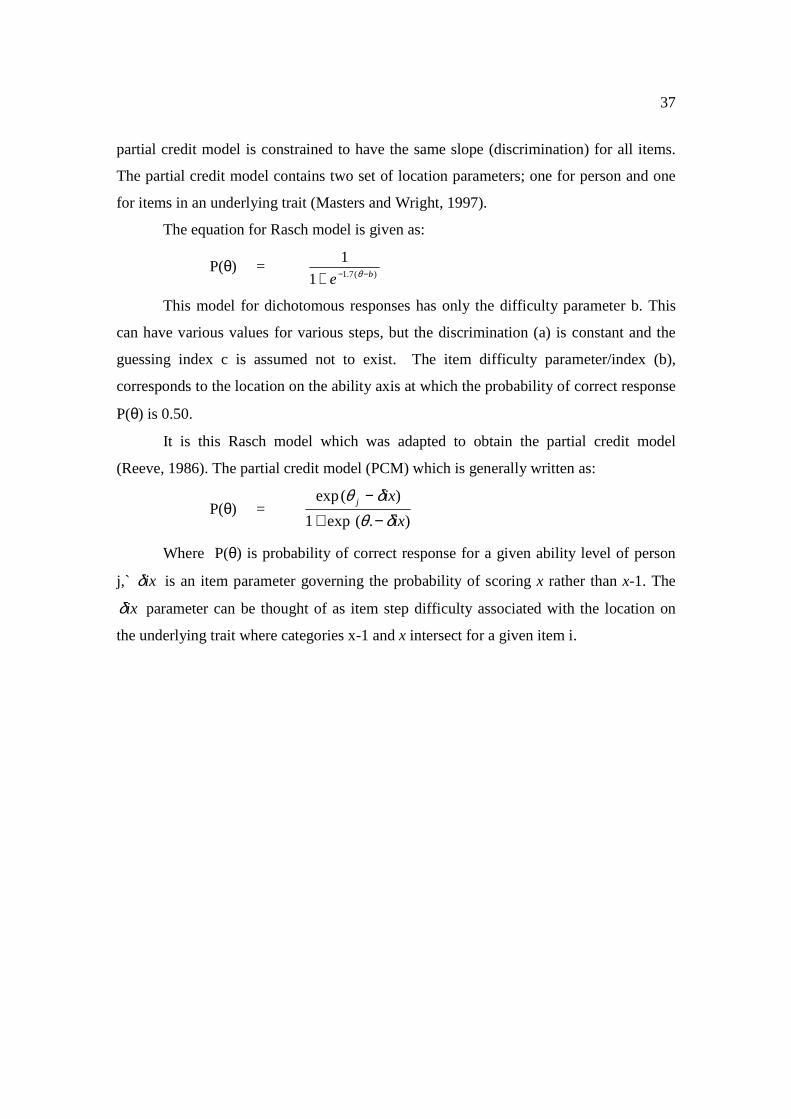
37
partial credit model is constrained to have the same slope (discrimination) for all items.
The partial credit model contains two set of location parameters; one for person and one
for items in an underlying trait (Masters and Wright, 1997).
The equation for Rasch model is given as:
P(θ) = )(7.11
1be −−+ θ
This model for dichotomous responses has only the difficulty parameter b. This
can have various values for various steps, but the discrimination (a) is constant and the
guessing index c is assumed not to exist. The item difficulty parameter/index (b),
corresponds to the location on the ability axis at which the probability of correct response
P(θ) is 0.50.
It is this Rasch model which was adapted to obtain the partial credit model
(Reeve, 1986). The partial credit model (PCM) which is generally written as:
P(θ) = ).(exp1
)(exp
ix
ixj
δθδθ−+
−
Where P(θ) is probability of correct response for a given ability level of person
j,` ixδ is an item parameter governing the probability of scoring x rather than x-1. The
ixδ parameter can be thought of as item step difficulty associated with the location on
the underlying trait where categories x-1 and x intersect for a given item i.

38
Fig. 3-Adaptation of Rasch Item Characteristics Curve for one
parameter Partial Credit Model.
Most IRT models in research assume that normal orgive or logistic function
described the relationship between the P(θ) and θ and fits the data perfectly well. The
logistic model is similar to orgive model and is mathematically simpler to use and is
more often used in researches.
The trace line also called the item characteristics curve (ICC) can be vviewed as
the regression of item score on the under lying variable θ (Lord, 1980). The graph below
models the probability of endorsing an item conditional on the level of underlying trait.
Ability ( θθθθ) in Standard Scores
P( θθ θθ
)

39
Fig. 4- The item trace line for Underlying Latent Variable.
The higher the persons trait level moving from left to right along the θ scale, the
greater the probability that the person will endorse the item.
The collection of the item trace lines forms a scale. Hence the sum of the
probabilities of correct response of the item trace lines yields the test characteristics curve
(TCC) the TCC describes the expected number of scale items endorsed as a function of
the underlying latent variable.

40
Fig. 5- The Test Characteristics Curve (TCC)
The graph above represents a TCC curve for 30 items. When the sum of the
probabilities is divided by the number of items, the TCC gives the average probability or
expected proportion correct as a function of the underlying trait (Weiss 1995).
Another essential feature of IRT models is the information function, an index
indicating the range of trait level θ over which an item or test is most useful for
distinguishing among individuals. Impliedly the information function characterizes the
precision of measurement for persons at different levels of underlying latent construct
with higher information, denoting more precision. The graph of information function
place persons trait level on the horizontal axis and amount of information on vertical
axes.

41
Fig. 6- Item Information Function.
The shape of the item information function depends actually on the item
parameters. High item discrimination implies more peaked information function. Higher
discrimination parameters provide more information about individuals whose trait level θ
lie near the item’s threshold value. The item difficulty parameter (s) determines where the
item information function is situated (Flannery, Reise and Widaman 1995). With the
assumption of local independence, the item information values can be summed across all
of the items in the scale to form the test information curve (Lord 1980).
In each level of the underlying trait θ the information function is approximately
equal to the expected value of the inverse squared standard errors of the θ estimate (Lord
1980). The smaller standard error of measurement (SEM), more information or precision
the scale that has information value of 16 at θ = 2.0; then the examinees score at trait
level of 2 have SEM of 25.016
1 = indicating a good precision (reliability approximately
= 0.94) at the level of theta (Flannery et al.,l 1995).

42
Fig. 7- Test information curve with approximater
Precision in measurement is contained within the middle of the scale (-1 <θ<1.5) with
reliability r for the various latent trait.
IRT has a major advantage over CTT .In CTT the summed score scale is
dependent on the difficulty level of the items used in the score scale and therefore not an
accurate measure of the trait level. The procedure in CTT assumes that equal rating on
each item of the scale represents equal level of the underlying trait (Cookie and Michie,
1997). But IRT estimates individual latent trait level scores based on all information in a
participant response pattern. IRT takes into consideration which items were answered
correctly and which ones were answered incorrectly and utilizes the difficulty and
difficulty parameters of the items when estimating trait levels (Weiss 1995). Individuals
with the same summed scores but different response pattern may end up having different
IRT estimated latent score. One may answer more of the highly discriminating and
difficult items and receive higher latent score than one who answers the same number of
items with lower discrimination or difficulty. IRT level estimation utilizes item response
curves associated with the individual response pattern. IRT models focus on

43
measurement of change in trait level which connotes the level of positive behavioural
change and is therefore indispensable in education.
(C) Models of Item Response Theory
There exist two approaches to model building in IRT. The first is to develop a
well fitting model to reflect the response data and the second is to obtain measurement
properties (defined by the model) to which the item response data must fit (Thissen and
Orlando 2001). The case where the data fits the model, offers a simple interpretation for
scale scoring and item analysis.
Educational research measurement is about describing behaviours behind the
response pattern. For this purpose in education we use the most applicable IRT model
such as one, two, three parameter logistic models, partial credit, graded response models,
etc, to fit the data. The choice of the IRT model to employ in a study is data dependent.
Rasch family models are suggested to be used when each item carries equal
weight and is equally important in defining underlying variable and when specific
objectivity and simple sufficiency are needed. But if there is the need of an IRT model to
fit already existing data or highly accurate parameter estimates required, then a more
complex model such as 2 or 3 parameter logistic model or partial credit model or graded
model etc is to be used (Embretson and Reise 2000).
Specifically for dichotomously scored responses in Item Response Theory
Models, the Item characteristics curve (ICC) is described by one, two or three parameters.
First is the difficulty parameter (b) which is the location on the ability axis when the
probability of correct response P(θ) = 0.5. Second is the discrimination parameter (a)
which is the slope of the ICC curve. The higher the value of a, the steeper the slope and
the lower the value of a, the more gentle the slope. The third parameter C is the
vulnerability to guessing which makes ICC asymptotic and to have positive value along
the vertical axis. The equation for Rasch Model i.e. One Parameter logistic Model
(IPLM) is given by
Pθ = 11 + e.(θ )
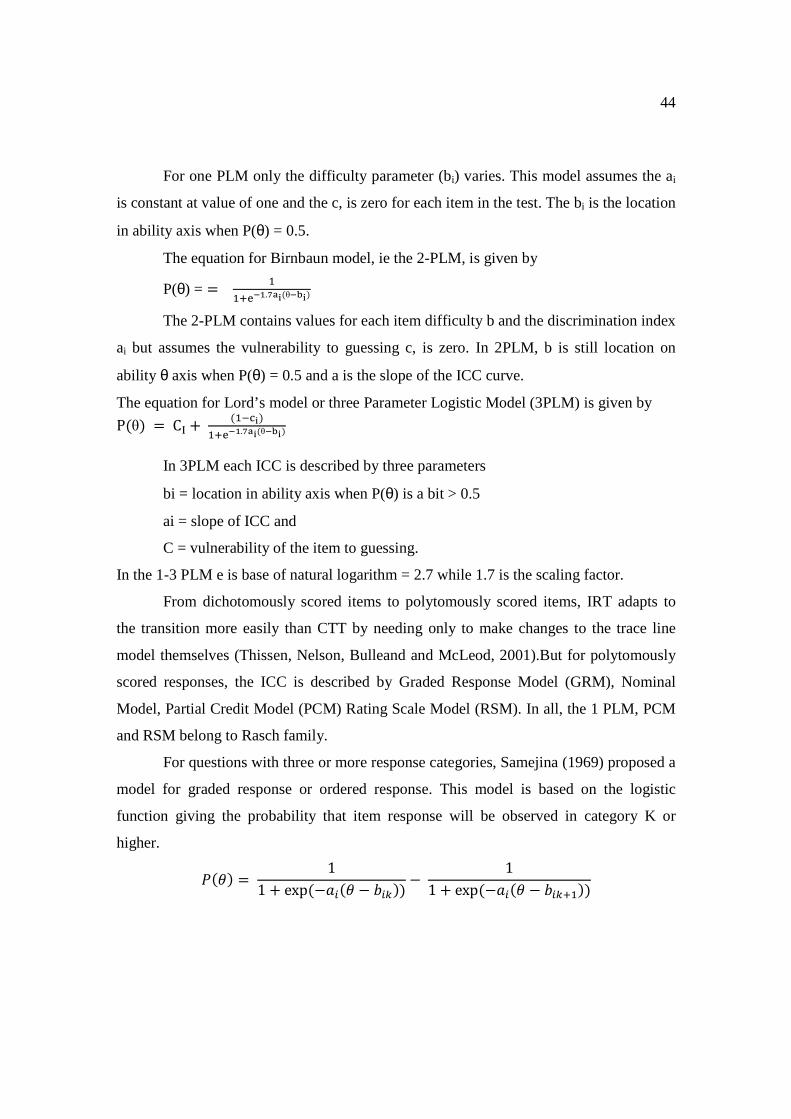
44
For one PLM only the difficulty parameter (bi) varies. This model assumes the ai
is constant at value of one and the c, is zero for each item in the test. The bi is the location
in ability axis when P(θ) = 0.5.
The equation for Birnbaun model, ie the 2-PLM, is given by
P(θ) = = . (θ )
The 2-PLM contains values for each item difficulty b and the discrimination index
ai but assumes the vulnerability to guessing c, is zero. In 2PLM, b is still location on
ability θ axis when P(θ) = 0.5 and a is the slope of the ICC curve.
The equation for Lord’s model or three Parameter Logistic Model (3PLM) is given by
P(θ) = C + ( ). (θ )
In 3PLM each ICC is described by three parameters
bi = location in ability axis when P(θ) is a bit > 0.5
ai = slope of ICC and
C = vulnerability of the item to guessing.
In the 1-3 PLM e is base of natural logarithm = 2.7 while 1.7 is the scaling factor.
From dichotomously scored items to polytomously scored items, IRT adapts to
the transition more easily than CTT by needing only to make changes to the trace line
model themselves (Thissen, Nelson, Bulleand and McLeod, 2001).But for polytomously
scored responses, the ICC is described by Graded Response Model (GRM), Nominal
Model, Partial Credit Model (PCM) Rating Scale Model (RSM). In all, the 1 PLM, PCM
and RSM belong to Rasch family.
For questions with three or more response categories, Samejina (1969) proposed a
model for graded response or ordered response. This model is based on the logistic
function giving the probability that item response will be observed in category K or
higher.
() = 11 + exp(−( − !)) − 1
1 + exp(−( − !))

45
Bock (1972) proposed the Nominal Model as an alternative to GRM for
polytomously scored item not requiring any prior specification of exclusive response
category as:
() = exp("( + #")∑ exp(!( + #!)%
!&
The Rating Scale Model (RSM) is derived from the partial credit model with
constant a-parameter across all items (Andrich, 1978). The RSM differs from PCM in
that the distance between difficulty steps from category to category within each item is
same across all items. The RSM includes an additional parameter λI which locates where
item i is on the construct being measured by the scale. The probability of person j scoring
x on the possible outcome 0,1,2… m of item i is
() = '( ∑ ()*(+*,-)).-/0
∑ '( ∑1-/2 3)4(5*,-)674
1/2
Another model for polytomously scored items when the response categories vary
is the partial credit Model.
The Partial Credit Model
For items with two or more ordered responses, Masters (1982) created the partial
credit model within the Rasch model and thus, the model shares the desirable
characteristics of the Rasch family discussed above. i.e. simple sum as sufficient statistics
for trait level measurement and separate persons and item parameter estimation allowing
specifically objective comparisons. The partial credit model contains two sets of location
parameters, one for person and one for items on an underlying unidimensional construct
(Masters and Wright, 1997).
According to Reeve (1986), the partial credit model is a simple adaptation of
Rasch model for the Dichotomies. The model follows that from intended order 0 < 1 <
2,…, < m of a set of categories the conditional probability of scoring x rather than x -1 on
an item should increase monotonically throughout the latent variable range for the partial
credit model, the expectation for persons j scoring in category x over x-1 is modeled.
P(θ )j = )(exp1
)exp(
ixj
ixj
δθδθ−+
−
where

46
ixδ is an item parameter governing the probability of scoring x rather than x-1.
The ixδ parameter can be thought of as item step difficulty associated with the location
on the underlying trait where categories x -1 and x intersect.
The response function (from this model) for the probability of person j scoring x
on the possible outcome 0,1,2,3… m of item i can be written as:
( )
( )ikj
m
h
h
ok
x
ok ik
ji j
xUTδθ
δθθι
−
−=
=∑ ∑
∑
= =
=
0exp
exp
where x = 0, 1, 2 … mi
Thus, the probability of respondent j endorsing category x for item i is a function
of the difference between their level on the underlying trait step difficulty (θ - δ )
Thissen et al. (2001) noted that partial credit model is constrained to have the
same slope (discrimination) for all items.
The partial credit model has been applied to wide range of item types, (Wu and
Adams, 2007). For example
i. Likert type questionnaire items such as strongly agree, agree, disagree, and
strongly disagree.
ii. Essay rating for example on a scale 0-5
iii. Item requiring multiple steps such as a problem solving item requiring students to
perform different steps
iv. Items where some answers are more correct than others.
v. A testlet or item bundle consisting of a number of questions.
vi. Test items where the response categories vary.
The Generalized Partial Credit Model
The Generalized Partial Credit Model is a generalization of the partial credit
model that allows discrimination parameter to vary among the items.
According to Tang (1996), the major difference between the partial credit model
and the generalized partial credit model is that the partial credit model assumes that the
item discrimination is a constant for all the items in a test. The generalized partial credit
model on the other hand assumes that item discrimination can be different across items
and has a parameter to model this. The difference between these two models is similar to

47
the difference between Rasch model and the two parameter logistic model in the
dichotomous case.
Muraki (1992) extended Master’s partial credit model by relaxing the assumption
of discrimination power of test items based on the two parameter logistic model. In
Muraki’s formulation, the probability of choosing k over category k-l is given by the
conditional probability
)()(1
)(
)(.1/
θθθ
θ
jkjk
jk
jjk
pkp
p
kkkpC
+−=
−≡
=
where k = 1, 2 … mj
The above equation can be written as:
After normalizing each Pjk(ϑ ) so that )(θjkPΣ = 1 then the Generalized partial credit
model can be written as:
[ ][ ])(exp
(exp)(
υ
υ
θ
θθ
jjaj
c
ov
)jjaj
k
ovjk
dbD
dbDP
+−
+−=
∑∑
=
=
Where D is a scaling constant set to 1.7 to approximate the normal orgive model, a is a
slope parameter, b is an item location parameter and djv is a category parameter. The
slope parameter indicates the degree to which categorical responses vary among the items
as θ level changes with mj categories; only mj-1 category can be identified.
Indeterminacies in the parameters in the Generalized partial credit model are resolved by
setting.
OdandOd jk
m
ojj
k== ∑ −
−
1
1.
Muraki (1992) pointed out that bj – djk is the point on the θ scale at which the plot of Pj,k-1
ad Pjk θ intersect and so characterizes the point on θ scale at which the responses to item j
[ ][ ])(exp1
)(exp
jkj
jkj
ba
ba
−+−
θθ
[ ] )()(exp)(1
)( 11 θθθθ −− −=−
= jkjkjjkjk
jkjk PbaP
C
CP

48
has equal probability of falling in response category k-1 and falling in response category
of k.
Tang (1996) noted the following while discussing parameter interpretation in GPCM
that both the partial credit model and GPCM
(i) Assume that each of the two adjacent categories (k and k-1) in a polytomously
scored item can be seen as dichotomous categories and therefore, the
likelihood of a person with certain ability level reaching the score category of
k rather than k-1 can be described by a dichotomous IRT model.
(ii) The models IRT were thus generalized from dichotomous IRT model to
describe the probability of selecting a particular score category from all
possible score categories for an examinee.
(iii) For a polytomously scored item that has m score categories, based on GPCM,
the item has one item discrimination parameter, one location parameter and a
set of m-1 threshold parameters. That is to say that in GPCM we have only
one b, one a, and m score cathegory minus one threshold parameters
The item discrimination parameter describes how well the item can distinguish
between individual of different ability levels. The location parameter indicates the item
difficulty.
Assumptions of Partial Credit Model
Unidimensionality means that a single latent variable fully explains task
performance. This is one of the major assumptions for the polytomous item response
theory models. Carlson (1993), has shown that even if the cognitive processes required to
answer constructed items are inherently complex, data from these items meet the
unidimensionality assumptions essentially before applying partial credit model to data,
the data should be investigated, whether it conforms to the unidimensionality assumption,
that is to say that the data must be assesing only one latent ability . Hugh and Ferrara
(1994) investigated whether the test for Maryland school performance assessment
programme met the unidimensionality assumption. All the task in this programme
required brief or extended responses to performance task designed to elicit students
ability to apply knowledge, skills and thinking processes. The conclusion was that the

49
responses to the polytomously scored items were dominated by one major factor or the
data was unidimensional.
The second assumption for polytomously scored items is local independence. This
means that items even if they are based on a common passage should be mutually
independent or exclusive. The response to one question is independent of response to
other questions. However, items within each cluster could show minimal level of
dependency. Yen (1993) showed that performance assessments tend to produce more
local item dependence (LID) than multiple choice items and suggested some strategies
for reducing local item dependence to avert negative measurement implications.
Advantages of Partial Credit Model
The following are advantages of Partial Credit Model as identified by Hancook
(2006)
1) All items independent of type are placed on the same common score scale.
2) The Partial Credit Model (PCM) provides the same score scale for which
students’ achievement results are placed. Thus, direct comparison of items
and achievement level can be made. This is enormously helpful in
describing results of assessments to students and parents.
3) The PCM allows for the pre-equating of future test forms which is a
valuable component of test construction process.
4) The PCM supports post equating of the test items. There is a link established
between previous forms and current administration
5) The PCM allows for direct comparison of performance level standards
established against future test forms.
Some IRT Methods in Estimating Item Parameters
The estimation procedures for item parameters in IRT include (i) correlation
method (ii) regression method (iii) approximation (PROX) method (iv) maximum
likelihood procedure.
Correlation method was used by Lord (1968) for estimation of item
discrimination indices for all items in the test at the same time using the factor analysis of
the matrix of inter item correlation. The parameter estimating the item difficulty is
evaluated by the normal deviate that matched the proportion of subjects in the total group

50
that answered the item correctly. Also the discrimination index was estimated by the item
loading in the factor analysis. A direct conversion method for estimation of item
parameter in latent trait models is possible from item parameters of classical test model
through the test point biserial (Urry, 1974).
According to Baker (1977), the regression method involves the regression of an
item on the latent trait based on the item characteristics curve. In this the discrimination
index of an item is the scope of the item characteristic curve while the item difficulty is
the value of the ability θ at which the probability of correct responses to an item is 0.5 or
50%.
Izard and White (1980) had an approximation (PROX) procedure for item
analysis of the latent trait models. In PROX analysis, the answers given by examinees are
listed in students by item matrix. The analyses are based on marginal totals of correct and
incorrect responses (frequency counts) for each items and subjects. The procedures
estimate any testee with perfect or zero scores. Items not attempted by any testee are
deleted from the matrix before calculation. This facilitates validation of the whole items.
If N is the number of examinees that attempted an item,
S is the total score on an item ie total no. of correct responses for an item.
b = Ln ( )
S
SN −
Also if Y is the number of correct respondents to an item
N is the number of examinees that attended the item Izard and White (1980)
established that the ability θ estimate is
θ = Ln YN
Y
−
Lord (1968) also employed estimation procedure in statistics known as maximum
likelihood estimation. In this procedure there is conditional and unconditional maximum
likelihood. For conditional likelihood the data for item parameter are estimated based on
the students ability scores and the item difficulty indices. But for unconditional likelihood
the students ability score is removed from the estimation equation and so the item
parameters are estimated with no respect to students latent ability. On the whole
maximum likelihood estimation is a statistical procedure that finds the maximum
likelihood function created from the product of a population distribution with the

51
individual trace curve associated with each items right or wrong response. The pattern of
the subjects score, 1 if correct 0 if wrong is the basic data for the item analysis in this
approach. Amidst other procedural steps, the indices of item parameters and estimate of
individual latent ability scores are obtained.
Out of the methods described above, that are used in IRT to estimate parameters
the use of maximum likelihood procedure is more frequent and preferred. This is because
the maximum likelihood procedure yields comprehensively the item parameters and
ability estimated for all examinees (Baker, 1977).
Statistical Fit Tests
The statistics usually utilized when assessing the validity of a test in classical test
theory are the item bi serials. But the magnitude of this item statistics in CTT depend on
the ability distribution of the samples and it has the disadvantage of being sample
dependent.
In item Response Theory, the validity of a test is assessed in terms of the
statistical fit of each item to the model of IRT used. The analysis of fit is a check on the
validity when the fit statistics of an item is susceptible, then it is valid and if a given set
of item fit the model, it is an evidence that they refer to unidimensinoal ability (Korashy,
1995). Also, fit to the model implies that the items’ discrimination are uniform and
substantial and hence little or no error in scoring. A measure of fit statistic commonly
employed is the Chi square goodness of fit. A large positive fit statistics indicate no
fitting, a low fit statistic nearer one (1) indicates better fit (Bryce, 1981). This criterion of
fit to the model enables the test developers to identify and delete bad or misfitting items.
Specifically, for Partial Credit model, the infit and outfit mean square statistics
has goodness of fit when the infit and outfit of the item has the range (0.7 – 1.5) and has
the mean statistics that approximate 1 (one); with mean square (MNSQ), standardized in
z-score (Z STD) which approximate a theoretical distribution with mean O (Opsomer,
Jenson, Nusser, Drignei and Amemiya; 2002)
In an attempt to assess the model data fit to PCM, we use the Residual Based
measures (Ostini and Nering, 2006). Fit measures can be classified in terms of the level
of generality of their application. Fit can be assessed globally in terms of the fit of an
entire data set from a complete measurement instrument. Fit can also be assessed in terms

52
of the fit of specific groups of items from a test if specific hypotheses about fit are to be
tested (Ostini and Nering, 2006).
In direct residual based measure, a simple response residual comprises the
difference between observed and expected item response. This can be standardized by
dividing the residual by the standard deviation of the observed score (Masters and
Wright, 1997).
Response residuals can be summed over respondents to obtain an item fir measure
and generally the accumulation is done with squared standardized residuals, which are
then divided by the total number of respondents to obtain the fit statistic (mean chi
square). In this form, the statistic is highly sensitive to outlier responses (Masters and
Wright, 1997; Ostini and Nering, 2006)
Empirical Studies
Nkpone (2001) utilized one and two parameter logistic models of IRT and also
CTT in the development and standardization of physics achievement test for senior
secondary students. The sample of the study was 2215 students who sat for SSCE of
May/June 1999 in River State of Nigeria. The instrument of the study was 60 multiple
choice item, physics achievement test. The result of the study was analysed. The
reliability and validity of each of the items and whole test, item parameter estimation (b
and a), the person parameter estimation (the ability estimates) each item S.E.M, and
analyses of fit test were carried out by the researcher. The item parameters (b and a) of
CTT and IRT were compared by the study.
The data analyses were done using PROX and regression techniques of Microsoft
Excel Visual Basic Computer programme. The chi square goodness of fit test as used and
factor analysis was used to establish the unidmensionality (validity) of 0.89 (using K-R
20) for the instrument and the items showed a good fit to the model. There was also no
significant difference among item parameter obtained using 1 PLM, 2 PLM and CTT in
analysing the dichotomously scored physics achievement test.
Lian and Idris (2006) assessed the algebraic solving ability of form four students.
The purpose of the study was to use the SOLO model (Unistructural, multistructural,
relational and extended abstract) as a theoretical framework for assessing the form four
algebraic solving ability in using linear equation. The content domain in the framework

53
were linear pattern, direct variation, concept of functions and arithmetic sequence. The
test composed eight super items of four items each. The sample of the study was 40 form
iv student in a secondary school in Malaysia. This study used qualitative and quantitative
approach to assess the students algebraic solving ability based on SOLO model. The
rationale of the researcher in choosing quantitative method was to assess the students
level of algebraic solving ability. The data set was subjected to partial credit analysis and
later quantitative method was used to seek clarification of the students algebraic solving
processes. Each of the four items for each super item, represented four levels of reasoning
defined by SOLO model. The data analysis was done based on the finding from the
pencil and paper test and interview.
The test paper results were analyzed by using partial credit model. Partial credit
model (Wright and Masters, 1982) is a statistical model that specifically incorporates the
possibility of having different number of steps or levels for each item in a test (Bond and
Fox, 2001). In this study the ordered values 0,1,2,3,4… was applied to super items as
follows 0 = Totally wrong or no response, 1 = Unistructural level, 2 = Multistructural
level, 3 = Lower relational level, 4 = Relational level, 5 = Higher relational level, and 6 =
Extended abstract level i.e. codes 0-6 covered all the response possibilities in the test.
Winstep software programme was used to run the analysis. It computed the
probability of each response pattern to obtain the ability of the each learner and difficulty
of each item. The purpose of this computer analysis was to estimate the value of the
validity, the reliability index, difficulty of items, and the levels achieved by the students
on each content domain. The partial credit model of this study estimated reliability both
for person and items. The item reliability index indicated the replicability of items if they
are given to another samples with comparable ability levels and persons reliability index
and indicated the persons replicability of person ordering if the sample are given another
set of item measuring the same construct. In this study the partial credit model revealed
the item and person reliability indices were 0.91 and 0.73. According to this study
validity is dependent on reliability and success of evaluation to fit statistics (infit and
outfit). The expected value of mean square was between 0.7 and 1.3. Also the infit (mean
for infit mean square) was 1.06 and out fit (mean for outfit mean square was 0.98. In the
analysis the infit and outfit mean square for each super item fall within the acceptable

54
range. Generally the result of the study indicated that 62% of the students have less than
50% probability of success at relational level. This result also provided evidence on the
significance of SOLO model in assessing algebraic solving ability in upper secondary
school level.
Justice, Bowles and Skibbe (2006) measured pre school attainment of print
concept knowledge; a study of typical and at risk 3-5 year old children using item
response theory. This study determined, the psychometric quality of a criterion –
referenced measure that was thought to measure pre schoolers Print Concept Knowledge
(PCK). The total sample of the study consisted of 128, 3-5 year old children from urban,
sub-urban and rural regions of southeast Ohio made up of 65 boys and 63 girls with a
mean age of 53 months. The measure titled Pre-school Word and Print Awareness
(PWPA) was analysed using the Partial Credit Model (PCM) to determine its suitability
for use by clinicians, educators and researchers. The study also investigated the extent to
which PWPA differentiated estimates of PCK for at risk population on the basis of Socio
Economic Status (SES) and language ability. The sample varied in SES (middle, low)
and language ability (typical and impaired language). The result of the partial credit
model fit analyses showed good fit between the overall data and the PCM indicating that
PWPA provided a valid estimate of the latent PCK trait. Socio-economic status and
language ability were found to be significant predictors in the study when age was used
as a covariate. These results showed PWPA to be suitable for measuring Pre school age
print concept knowledge to be sensitive differences among children as a function of risk
status. According to this result Pre School Print Word and Print Awareness PWPA is an
appropriate instrument for clinical and educational use in pre school children.
Wallace, Prather and Ducan (2012) performed an item response approach to the
study of General Education Astronomy Students’ Understanding of Cosmology Part III in
which they evaluated four cosmology surveys. In this work they developed cosmology
survey and analysed student’s responses to three out of the four cosmology survey they
developed. Partial Credit Model of IRT was specifically used for the analysis of the
students responses to assess the reliabilities of the survey forms and to determine the
probabilities of students achieving different scores on the survey items. The sample of the
study was 4359 students that responded to the four forms in semesters of 2009 and 2010

55
academic session in University of Arizona. For a given semester the students and item
parameters using pre and post instruction responses. This is acceptable because IRT
unlike CTT attempts to disentangle item difficulty parameters from the students abilities.
They therefore estimated difficulty parameters using students of low and high abilities
by, using pre and post-instruction responses in the estimation. The researchers used only
forms A, B and C leaving form D since form D exhibited item chaining- a situation
where each item builds off the previous item such that knowing the answer for one
increases the probability of correctly answering the next (Yen 1993). This study
compared the item step parameters b and the Thurstone threshold parameters step
difficulty β for all the items in forms A,B,C for all the students in the two sessions under
studied. The aim of this study was to present IRT analysis of students responses to for A-
C of conceptual cosmology survey, to provide insight to conceptual knowledge and
reasoning abilities of their students.
The analysis of step difficulties b and thurstone thresholds β for each item
revealed which levels of understanding that were obtainable or well beyond the abilities
of the students. The data presented in the study indicated that interpreting Hubble Spot
(Form A) is much more difficult than understanding the Big Bang and evolution of the
universe (Form B and C). The evidence for the reliabilities of forms A-C was obtained
using Wright maps which showed that the items adequately span the students abilities.
Finally the study established foundation for their research methodology and the reliability
and validity of the survey instrument they used to assess students understanding of
cosmology.
Opsomer, Jenson, Nusser, Drignei and Amemiya (2002) carried out statistical
consideration for the United States Department of Agriculture (ASDA) food insecurity
index. This work reviewed the statistical properties of the model used to obtain the
estimates of the prevalence and severity of poverty linked food insecurity and hunger in
the United States. The assessment of household food insecurity was based on a one
parameter logistic model of item response theory also called the Rasch partial Credit
Model and applied to a series of eighteen question reported in the population survey Food
Security Module. According to the authors, the partial credit model as a technique is of
interest to them since PCM can answer the questions that are polytomously scored and as

56
well collapse some questions to fit PCM without making them dichotomous. The
researchers fitted PCM on a set of 1995 current population survey (CPS) food insecurity
questions used in the original scale.
The item parameter estimates and goodness of fit statistics computed by BIGSTEP
software following the procedural steps explained in Hamilton ,Cook,Thompson, Buron,
Olson, Frongillo, and Welher (1997b) . Also the same estimates and statistics for PCM
fitted with BIGSTEPS. Both item parameters and goodness of fit for the dichotomous
case as described in Hamilton et al. (1997b) and PCM fitted with BIGSTEPS for
polytomous responses, their columns had the following interpretations:
(i) Entry Number: The sequence number of the question
(ii) Raw Score: The number of ‘yes’ answers to the question
(iii) Count: the total number of valid responses for that questions
(iv) Measure: the estimate of the severity parameter (Difficulty estimates)
(v) Error: The standard error of the estimate
(vi) Infit/Outfit: BIGSTEPS goodness of fit statistics. NMSQ is the mean square
statistics with expectation = 1; ZSTD is the mean square statistic with
standardized to approximate theoretical distribution with mean = 0 and variance =
1.
In Hamilton et al(1997b) items with both infit and outfit MNSQ – mean square
statistics larger than 1.2 indicate a poor fit, and are targeted for removal from the scale.
Items that have infit and outfit MNSQ smaller than 0.8 are redundant with respect to
information they share with other items in the scale. In this study the goodness of fit as
measured by the infit and outfit statistics is degraded for some items since the changes in
the PCM model are aimed at improving the model of fit and removing assumption
violations. Using the technique of this study it could also be evaluated whether this PCM
model would hold for subgroups of American population. This work was used as the
basis for discussions concerning future directions of research on food insecurity measure.
Siasang and Nenty (2012) studied the differential functioning of 2007 Trends in
International Mathematics and science study (TIMSS) examination items. In this work
there was a comparative consideration of students performance in Botswana, Singapore
and United States of America using TIMSS examination items. The study was

57
necessitated by the import of educational decisions made by many countries and
international organizations based on comparative countries. The purpose of the study,
was to investigate differential item functioning (DIF) in test items of 2007 TIMSS for
16184 students from Botswana, Singapore and USA. The sample of the study were 4208,
4599 and 7377 eight grade students from Botswana, Singapore and USA respectively
generated using random sampling done by TIMSS headquarters. A comparative DIF
analysis of data was done using two statistical method; the Scheuneman modified chi
square (SSX2) and Mantel Haenszel (M.H) analysis. The findings of the study reflected
that most of the TIMSS items functioned significantly differently among students from
Botswana, Singapore and USA and therefore showed the existence of significant bias
across learners in the three nations. The recommendation of the study was that future DIF
studies in TIMSS should investigate the causes of DIF and the subject curriculum
developers in the three nations should review their curriculum.
Nworgu and Agah (2012) applied three parameter logistic model (3PLM) in the
calibration of a mathematics achievement test. The purpose of the study was to use 3PLM
of item response theory in the caliberation of a mathematics achievement test. The
sample of the study was 1514 SS III students from Rivers and Cross river states of
Nigeria and the instrument for the study was a 40 items multiple choice test developed
by the researchers. The data analysis was done using BILOG-MG an IRT computer
software that estimated the item parameter and their corresponding standard error of
measurement. Three research question and three hypotheses guided the study. The chi
square goodness of fit was used to determine the goodness of fit of the items of the
instrument to three parameter logistic model. The study also generated item
characteristics curve to determine if the items in the tests are good enough for the
assessment of the students’ ability. The result showed the empirical reliability coefficient
of 0.79. The item parameter indices obtained indicated that the discrimination parameter
(a) ranges from 0.29 to 2.05; item difficulty form -0.40 to 1.79; the probability of
guessing in the test correctly ranged from 0.02 to 0.50 for all the ability levels.
Ojerinde and Onyeneho (2012) conducted a comparison between classical test
theory and item response theory from 2011 pre test in the use of English of the unified
tertiary matriculation examination (UTME) in Nigeria. The aim of the study was to

58
evaluate the use of English pre-test data so as to compare the indices obtained using 3-
parameter model of IRT with those of the classical test theory (CTT) and hence verify
their degree of comparability. The sample of the study was 1075 test takers that took one
version of the pretest use of English. The instrument was a 100 item use of English items
developed by UTME and the data was analyzed by using Microsoft excel programme for
the CTT analysis. For the IRT model the data was analyzed using XCALIBRE software.
The findings of the study showed that the 3PLM was found to be more suitable in
multiple choice ability test. Overall, the indices obtained from both approaches gave
valuable information with comparable and almost interchangeable results. It was
recommended that both IRT and CTT parameters should be used in empirical
determination of validities of dichotomously scored items to ensure common bases of test
analysis, enhance interpretability and objectivity of test agencies in Africa.
Pido (2012) also compared item analysis results obtained using item response
theory (IRT) and classical test theory CTT approaches. The aim of the study was to
analyze, determine and compare the item parameters of multiple choice questions of
Uganda certificate of education (UCE) the sample of the study, selected though multi
stage procedure was 480 students scripts in dichotomously scored, physics, chemistry,
Biology and Geography part of the UCE. The data analysis was done suing XCALIBRE
4.1.7.1 software to determine items parameters based on the CTT and IRT approaches.
The output included the item characteristics curve (ICC), item difficulty indices (b) item
discrimination indices (a) and differential item functioning with respect to gender. Two
methods of correlation coefficent were used to compare the b and a indices based on CTT
and IRT approaches. The result revealed that there is a high correlation between b and a
in IRT and CTT approaches. The study therefore recommended that both CTT and IRT
should be used for item analysis since they produce similar results.
Odili (2010) investigated the effect of manipulating the language test items on
differential item functioning of test items in Biology in a multicultural setting. The
purpose of the study was to manipulate by simplifying the language of biology multiple
choice items and evaluate the effect on DIF index and to investigate the effect of such
manipulation on index of DIF for testees from high and low Socio-economic status SES.
The sample of the study was 1, 025 SSIII students from Delta State composed using

59
random and proportionate sampling technique. The instrument of the study was SES
questionnaire and Biology multiple choice achievement test (in two forms). Four research
questions and four hypothesis guided the study. The data was analyzed using
Scheuneman modified Chi-square statistic and the hypotheses were tested using
dependent t-test. The results of the study showed that manipulation of test items to
simplify their language reduce the index of DIF among testers in a multicultural setting.
The study recommended that for test validity in a multicultural setting, the language of
the test items should be simplified to reduce DIF.
Ugodulunwa and Muttsapha (2011) used differential Item Functioning (DIF)
analysis for studying the improvement of quality in State Wide examination in Nigeria.
The problem of threat to validity of JSCE as a result of low correlations between results
of JSCE and SSCE in Mathematics that is replete in literature necessitated this study.
Cluster sampling was used to select eleven local government areas and 77% of all the
scripts used for JSCE examination in mathematics in the years 2007 and 2008. A total of
27038 scripts formed the sample for the study. Six hypotheses guided this study. The data
analysis was done using Scheuneman modified Chi-square statistics to identity the
presence or otherwise of DIF in the mathematics items that were dichotomously scored.
The findings of the study were that the examination items contained items that
differentially functioned for candidates described by gender, school type and school
location. The study recommended that to ensure quality in a state wide examination such
as JSCE, DIF analysis should form part of the test process and in fact in other nation wide
examinations in Nigeria.
Akindele (2004) worked on development of prototype of items for selection tests
into universities in Nigeria. Using computer progamme he randomly generated a sample
of a thousand students who entered for 1998 university entry examination-made up of
626 males and 374 females-in English Language. The data analysis was done using SPSS
and BILOG MG software. The SPSS accomplished the classical item statistics, while the
BILOG MG software was used to calibrate the test to determine the item parameters and
ability estimates. On testing the hypothesis, the study indicated significant differences in
the item parameter estimates of test items using IRT and CTT; but the scaled scores for
the three subparts of the test (grammar, lexis and structure, comprehension) did not show

60
any significant difference in the mean and standard deviations as computed using CTT
and IRT procedures. Three different ability estimation procedure used in the study did not
reveal any significant difference in estimated abilities of the students. Gender was noted
in the study as a moderating variable in the student academic performance as it
established differential item functioning. The values of item statistics a,b and c as
estimated using 1,2 and 3 parameter logistic models of IRT showed significant
difference. The item developed and stored in this study’s item bank was calibrated with
3-PL model because the study deemed it (3-PLm) to be more robust given the sample
size and the length of the test.
Obinne (2008) did a comparison of psychometric properties of WAEC and NECO
Biology examinations under item response theory. The purpose of the study was to
investigate the psychometric properties (reliability, validity, difficulty index etc) of the
items of biology examinations conducted by WAEC and NECO using the item response
theory (IRT). The study was necessitated by public persistent out cry that NECO is too
cheap to pass. Fourteen research questions and seven hypotheses guided this study. The
sample of the study was 1800 SS III students from 36 secondary schools in urban and
rural areas of Benue State. Multistage stratified sampling technique was used. WAEC and
NECO biology examination questions (objective) from year 2000 – 2002 were the
instruments for data collection. The research questions were answered using maximum
likelihood estimation technique of BI LOG MG computer programme according to IRT
procedure. The SPSS was used to test the hypotheses.
The results of the study were that biology examination items from WAEC and
NECO were equally reliable and valid; and that biology items of NECO examination
were more difficult than those of WAEC of the same year. The study concluded that
NECO questions were really not cheap to pass. The study also discovered that WAEC
items were more prone to guessing than those of NECO items. This study finally
recommended that IRT procedures should be adopted by all examination bodies in
Nigeria so that most measurement problems will be put to test.
Obinne (2011) performed a psychometric analysis of two major examinations in
Nigeria, WAEC and NECO:- Standard error of measurement. This work dealt with the
psychometric analysis of two major examinations in Nigeria conducted by NECO and
61
WAEC. The aim of this study was to compare the standard error of measurement (SEM)
of biology examination conducted between year 2000 to 2002 using one parameter
logistic model of IRT. Instrumentation research design was used for the study; the area of
study was Benue State of Nigeria. The population of the study was all year three (SS III)
who registered for May/June 2006 biology examination in WAEC and NECO in Benue
State. The sample of the study was 1800 students selected using multistage stratified
random sampling technique. The instrument of this study was 2000-2002 objective
Biology questions. Maximum likelihood estimation techniques of the BILOG MG
computer software programme and SPSS were used for data analyses. The result
indicated significant difference in the SEM of NECO and WAEC Biology in the years
understudied. The result showed that Biology examination conducted by NECO had
smaller SEM than those of WAEC and noted that NECO Biology has higher reliability
than that of WAEC. The recommendation of the study is that IRT analysis should be
employed for test development and examination bodies in Nigeria for increased
precision.
Summary of Literature Reviewed
The reviewed literature in this study has among other things looked at theoretical
and conceptual background of item response theory. In these the historical development
and progress made in IRT over time, explanation of basic concepts in IRT etc were made.
Also explored is how item analyses were conducted using some latent trait models and
their procedures for item selection. Various methods of determining the standard error of
measurements were also reviewed. The need for enhanced precision in measurement was
continually highlighted in this review. Presently most studies that have been done in test
analyses made use of classical test theory. This is attributable to ease of computation in
CTT; but tests analyzed using CTT are highly questionable due to the circular
dependency of item parameters on population and person parameters on items. Owing to
these inherent defects in the CTT there is the need for analyzing our tests using item
response theory models.
Extensive and diligent search during this review for researches done using partial
credit model (PCM) of item response theory revealed that this model (PCM) has been in
use in overseas, and even then none of them went into test analyses in physics. Given the

62
indispensable nature of partial credit scoring in some areas such a performance in music,
dance, describing a work of art, technical drawing and in fact in all psychomotor
activities that require completion of a number of steps, there is the need for analyses of
tests in psychomotor aspects of physics using the PCM as this will increase precision in
this area.
During the review, no study could be accessed that was conducted in Nigeria that
used PCM. The studies that have been attempted in Nigeria using Item Response Theory
used 1PL, 2PL and 3PL (either one or more) in their test analyses. Their use of these
logistic models, are actually appropriate. But there is the need to analyze test using PCM
in Nigeria in a situation where series of steps are needed (Polytomously scored).
Locally in Africa, some studies used 1, 2 and 3 parameter logistical models for
test analysis. In Nigeria only one study used 1PLM and 2PLM in development and
standardization of dichotomously scored physics achievement tests. No research has been
carried out in Nigeria using IRT model in practical physics or any polytomously scored
aspect of physics. This research stands out as it analysed practical physics of WAEC and
NECO in Nigeria using the IRT model called Partial Credit Model PCM to investigate
the psychometric qualities. From the literature, it was also revealed that WAEC and
NECO always use classical test theory in their psychometric analysis. It is high time
another measurement framework is utilized for psychometric analysis of their
examination to see if the precision will change.
Since no study has been conducted in Nigeria using Partial Credit Model and
many studies that have been done in Nigeria, and in Africa as a whole dwelt on
psychometric analysis of objective questions, then there is the need for such analysis in
practical aspects of the physics. Practical physics is of equal weight with objectives in
both WAEC and NECO, while some studies have attempted psychometric analyses of
objective aspects of sciences as revealed by literature, none has attempted psychometric
analysis of practical physics. Then there is every need for psychometric analyses of
practical physics questions given by our examination bodies – WAEC and NECO.
63
CHAPTER THREE
RESEARCH METHOD
This chapter basically discusses the general framework on which this study was
carried out. This general framework includes: The research design, The Area of Study,
Population of the Study, Sample and Sampling techniques, Instrument for Data
Collection, Validity of the Instrument, Reliability of the Instrument, Method of Data
Collection, and Method of Data Analyses.
Research Design
This study is an instrumentation research. Instrumentation research design was
therefore appropriate for this study. Instrumentation research is that study which is geared
towards the development and validation of instrument in education (Ali, 1996). And
according to international Centre for Educational Evaluation (ICEE) (1982),
instrumentation research is a study aimed at introduction of new or modified content,
procedure, technological or instruments of educational practice. In this present study,
WAEC and NECO in practical physics questions were analysed with respect to some
psychometric properties of the questions.
Area of the Study
The area of study was Enugu state of Nigeria. Enugu state is located at South
Eastern part of Nigeria. This state is made up of seventeen local government areas. The
state is entirely an Igbo speaking tribe. The area of this study is made up of six
educational zones. Three education zones (Nsukka, Enugu and Obollo-Afor) made up of
nine local government areas were used for the study. There are public and private
secondary schools in the state. The public secondary school (state owned) is 272 in
number. The 83 government approved private secondary schools were ignored in the
study because only very few of them have physics laboratory.
Population of the Study
The population of this study comprised all senior secondary year three physics
students, who enrolled for May/June/July 2013 physics senior secondary certificate
examination of WAEC and NECO in state owned secondary schools (public) in the six
educational zones of Enugu state. The research subjects (2013 SS three physics
candidates) would have covered the WAEC and NECO physics syllabuses. The number
63

64
of candidates of 2013 SSCE level physics examination in WAEC and NECO in state
owned (public) schools is 12,067 (WAEC and NECO sources respectively).
Sample and Sampling Techniques
Six hundred and sixty eight (668) respondents formed the sample for this study.
Multistage sampling technique was used in selecting the sample for the study. Firstly,
three educational zones out of six educational zones of Enugu state were selected using
simple random sampling.
Enugu state has about 272 public (state owned secondary schools) and they are
distributed in the six educational zones of the state (Appendix A). The three sampled
zones were Enugu, Nsukka and Obollo-Afor education zones. (See appendix W)
In each sampled educational zone the schools were stratified into various local
governments. From various strata of schools in various local governments, purposive
random sampling were used to select two schools from each local government where the
number of SS3 physics candidates were up to thirty. Purposive sampling was used to
select all schools that had up to thirty physics students in the local government. This was
done in order to enable the researcher sample only schools that can give reasonable
number of respondents four the four different sections of the instrument at the same time.
From this random sampling was again used to select two schools finally used per local
government area. Between thirty to forty physics (SS3) candidates were randomly
selected for the study in each sampled school. This gave a sample of sixty to seventy
candidates in every local government and about two hundred candidates in every sampled
education zone. This gave a total of six hundred and sixty eight candidates used for the
study (Appendix X). From this between 164-172 respondents used for analysis of each of
the four sets of questions were generated. This is because the number of respondents
required in Rasch model for polytomusly scored items for 95% confidence level is from
64-144, and higher numbers are acceptable. (Linacre 1994; 1999; 2002; 2007) Eckes
(2011). From the total of eighteen sampled schools, a total of 668 respondents that
registered for 2012 / 2013 WAEC and NECO May/June/July emerged as the sample for
the study (See appendix X, p. 171).

65
Instrument for Data Collection
The instrument for this study consisted of WAEC and NECO 2011 – 2012
May/June/July practical physics examination questions. The instrument was made up of
four parts that were used for the study. They are (i) 2011 practical physics questions of
NECO (PPQN 1) – Appendix C, (ii) 2012 practical physics questions of NECO (PPQN
2) - Appendix D ,
(iii) 2011 practical physics questions of WAEC (PPQW 1) - Appendice E, (iv) 2012
practical physics questions of WAEC (PPQW 2) - Appendix F. Results from the
instrument consisted of performance of each student item by item in the practical
question set of questions attempted. These results were obtained using the appropriate
marking guide (to each part of the instrument) from the two examination bodies
(Appendices G, H, I, and J)
Validity of the instrument
The instrument is made up of WAEC and NECO practical physics questions for
May/June/July for years 2011 and 2012. These were validated by West African
Examination Council and National Examination Council.
Reliability of the Instrument
The reliabilities of the questions were as well obtained before administration to
the candidates who took the examination in those years by the two examination bodies.
The presumption therefore is that the questions are equivalent in content. Moreover the
validity and reliability of the practical physics questions are among the major thrusts of
the study.
In the response analysis of Item Response Theory, every estimate of item
difficulty measure comes with its standard error of measurement and the smaller the
standard error, the better the test item and the higher the reliability (Baumgartner,2002).
Also in IRT, validity connotes a fit to the model, that item discrimination is uniform.
(Nkpone, 2001). An item is valid or has a good fit to the model if it has fit statistics
between 0.7- 1.5. (Curtis and Boman, (2007); Opsomer et al (2002), Bryce, (1981)).
Eventually in the study the researcher analysed the validity of the items using fit
statistics (Results to research question 1and 2). And the reliability was analysed through

66
the standard errors of measurement for the test items (Results to research question 3 and
4).
Method of Data Collection
The instrument for the study was administered to the respondents by the trained
research assistants and the sampled schools physics teachers under the supervision of the
researcher. The researcher ensured adequate supervision to avert cheating. The
invigilators of the examination ensured strict compliance of respondents to instruction.
Similar conditions of administration by WAEC and NECO were ensured. The study was
carried out in the second half of second term when the SS3 students fully were ready for
WAEC and NECO examinations.
The practical physics questions that were administered to the respondents were in
two sets for WAEC (PPQW1and2) and two sets for NECO (PPQN1and2). Each set was
made up of three different practical activities that the students were instructed to answer
all questions in the set he/she had. The four sets of practical physics question were
administered at the same time in the same class (See Appendix X p. 171). In each
sampled school the sampled students were randomly assigned to the four different sets of
practicals. This implies that each examinee had either NECO or WAEC practical physics
question for the year 2011 or 2012 May/ June/July examination. Each examinee was
required to answer one of the four sets of questions. The data of the students’ scores in
practical physics questions were collected. On the whole, 166, 172, 166, and 172
students responded to NECO 2011, NECO 2012, WAEC 2011 and WAEC 2012
respectively (appendix x).Their performance (scores) were used for data analysis and
subsequently to answer the research questions and test the hypotheses.
The marking guide for the questions were the marking scheme provided by the
examination bodies- WAEC and NECO (Appendices G, H, I and J). The marking scheme
therefore was supposed to offer the different score categories to the questions or sub
questions.
Method of Data Analysis
In this study, the data collected were analysed using maximum likelihood
estimation procedure of the CATS WINSTEP 3.80.1 computer programme of partial
credit model analysis. The research questions were answered using item response theory

67
descriptive statistics estimation procedure such as mean, SEM, reliability, fit statistics
and difficulty measure.
To test the hypotheses, independent-test analysis was carried out at (0.05) level of
significance using the SPSS computer program.
Specifically the criteria on which basis the items psychometric qualities were
considered are as follows: –
(i)SEM: Any value less than 0.5 is acceptable.
(ii)Validity and Fit : The infit/outfit range is 0.7-1.5,
(iii) Item Difficulty parameter: Ranges from -3 to +3

68
CHAPTER FOUR
RESULTS
The results obtained in this study are presented in this chapter. The data are
presented in tabular form and analysed according to the research questions and
hypotheses that formed the thrust of this study.
Research Question One
What are the Standard Errors of Measurement of the 2011 and 2012 practical
physics test items produced by NECO using the partial credit model of IRT
Table One: Standard Errors of Measurement of practical physics tests conducted by NECO for the years 2011 and 2012 using partial credit model
Item SE 2011 SE 2012 1. .10 .16 2. .11 .16 3. .07 .07 4. .09 .12 5. .11 .11 6. .10 .12 7. .10 .10 8. .10 .12 9. .08 .09 10. .09 .09 11. .07 .17 12. .10 .12 13. .13 .16 14. .10 .11 15. .10 .10 16. .09 .13 17. .06 .08 18. .07 .07 19. .06 .06 20. .08 .10 21. .09 .13 22. .10 .10 23. .09 .10 24. .11 .14
Mean .09 .11 S.D .02 .03
Recall that the recommended limit of SEM for a good item is 0.5. Table one
shows the standard errors of measurement of the test items of practical physics tests for
the years 2011 and 2012 based on partial credit model of item response theory. The range
68

69
of standard error for NECO 2011 is from 0.06 for items 17 and 19 to 0.13 for item 13.
The standard errors for the year 2011 NECO practical physics examination is therefore
very low with all the item having standard error far below .5 the recommended limit of
SEM. This is an indication of very high reliability for NECO 2011 practical physics tests.
In the year 2012, practical physics tests had the standard error of measurement
ranging from 0.06 of item 19 to 0.16 of items 1,2 and 13. 100% of the items have low
standard error of measurement. This range of SEM 0.06 – 0.16 indicate very high
reliability as it is very much below 0.5 which is the recommended limit of good item
SEM.
On a general note, the items have the following statistics for practical physics
tests NECO 2011 and NECO 2012.
Year 2011, mean SE = 0.09, SD = 0.02
Year 2012, mean SE = 0.11, SD = 0.03
Therefore, the items of NECO practical physics have very high reliability i.e. very low
SEM with consistently low standard deviation for the years studied.

70
Research Question Two:
What are the Standard Errors of Measurement of the 2011 and 2012 practical
physics test items produced by WAEC?
Table Two: Standard Errors of Measurement of practical physics tests produced by WAEC for the years 2011 and 2012.
Item SE 2011 SE 2012 1. .09 .10 2. .08 .10 3. .08 .07 4. .11 .12 5. .12 .13 6. .11 .12 7. .10 .10 8. .10 .11 9. .07 .10 10. .08 .11 11. .06 .07 12. .11 .11 13. .18 .10 14. .11 .10 15. .10 .10 16. .10 .10 17. .07 .07 18. .06 .07 19. .06 .06 20. .09 .10 21. .10 .13 22. .10 .10 23. .10 .10 24. .10 .10
Mean .09 .10 S.D .02 .02
Table two shows the standard error of measurement of the test of practical physics
conducted by WAEC in the year 2011 and 2012 using partial credit model of IRT. The
items of the test for the year 2011 have the standard error of measurement ranging from
.06 of items 11, 18 and 19 to 0.18 of item 13. The implication is that all the items of the
test of 2011 WAEC practical physics has all the construct measurement with low
standard error. Since the range is below S.E of 0.5, the reliability of the test is high.

71
For the constructs/items measured by WAEC 2012 practical physics test, the
standard error of measurement ranges from 0.06 of item 19 to 0.13 of items 5 and 21.
Also, the S.E. for WAEC 2012 practical physics is sufficiently low for one to infer that
the reliability of this test is very high.
On a general level, the items have the following statstics for practical physics
WAEC tests.
Year 2011, mean S.E. = .09, S.D = .10
Year 2012, mean S.E = 0.02, S.D .02
It could therefore be said that the items of WAEC practical physics have perfectly high
reliability for the years under studied.
Research Question Three
How valid are the Practical Physics test items produced by NECO for year 2011
and 2012 based on Partial Credit Model of Item Response Theory?

72
Table Three: Validity of test items of Practical Physics test conducted by NECO (Fit Statistic) for years 2011 and 2012 based on Partial Credit Model of IRT
Item Infit 2011 Outfit 2011 Infit 2012 Outfit 2012 1. 1.02 0.83 1.03 1.02 2. 1.08 1.00 1.04 1.05 3. 0.99 0.98 1.47 1.44 4. 1.11 1.28 0.85 0.78 5. 0.92 0.90 1.00 1.02 6. 0.81 0.78 1.10 1.12 7. 1.01 1.09 1.12 1.03 8. 0.99 0.90 1.32 1.85 9. 0.93 0.77 1.07 1.16 10. 0.97 0.99 1.01 1.01 11. 0.73 0.70 1.08 1.08 12. 0.82 0.84 0.88 0.83 13. 0.92 0.95 1.23 2.37 14. 0.88 0.83 0.95 0.92 15. 0.96 0.89 0.95 0.84 16. 1.31 1.28 1.02 1.15 17. 1.51 2.49 0.96 0.83 18. 1.50 1.73 0.87 0.93 19. 1.40 1.50 0.87 0.83 20. 1.07 1.09 0.80 0.75 21. 0.99 1.01 0.92 0.93 22. 1.05 1.00 0.85 0.84 23. 0.83 0.78 0.95 0.88 24. 0.91 0.89 0.90 0.78 Mean 1.03 1.06 1.01 1.06 S.D 0.20 0.38 0.15 0.36
Table three shows the result of the fit statistics of the test items for the years under
study using Partial Credit model of IRT. The result showed that the test item for the year
2011 had the infit and out fit statistic ranging from 0.82 to 1.51; and 0.83 to 2.49
respectively. It is only items 17 (that has infit of 1.51 and out fit of 2.49) and 18 (that has
outfit of1.73) beyond the accepted range of 0.7 – 1.5. The fit statistics of the NECO 2011
practical physics apart from item 17 and18 indicate that all the items are perfectly valid.
Since the mean of the infit and outfit are 1.03 and 1.06 respectively since they all fall
within the accepted range of infit/outfit i.e 0.7-1.5.
The test items for NECO 2012 practical physics has infit statistic range of 0.8 to
1.47; and outfit statistics range of 0.78 – 2.37. In the items of NECO 2012, it is only item

73
numbers 8 and 13 outfit statistics of 1.85 and 2.37 that are outside the accepted range.
The rest of the NECO 2012 items have their infit and out fit within the acceptable range
of 0.7 – 1.5. The mean of the infit and outfit statistics is 1.01 and 1.06. The spread of the
outfit and infit and their mean indicate highly valid items (since their mean are
sufficiently close to one (1). All the items of NECO 2011, NECO 2012 show high
validity. This is also an expression of undimensionality - a situation where all the items
asses one latent ability, that is psychomotor skills achievement in physics .
Therefore, apart from items 8 and 13 of NECO 2012, item 17 and 18 of NECO
2011, all other items of NECO practical physics are valid and shows undimensionality
Research Question Four
How valid are the practical Physics test items produced by WAEC for year
2011and 2012 based on Partial Credit Model of Item Response Theory?

74
Table Four: Validity of test items of practical Physics tests produced by WAEC (fit statistics) for years 2011 and 2012 based on Partial Credit Model of IRT
WAEC 2011 WAEC2012 Item In
fit Out fit
In fit
Out fit
1. 1.14 1.10 1.07 1.01 2. 1.01 0.95 1.02 1.00 3. 0.87 0.85 0.99 1.05 4. 0.93 0.83 0.86 0.82 5. 1.38 1.53 1.45 2.14 6. 1.03 1.02 1.06 1.02 7. 1.16 1.11 1.12 1.09 8. 1.12 1.04 1.12 1.38 9. 1.28 1.12 1.04 1.36 10. 0.97 1.12 1.04 1.36 11. 1.10 1.17 1.20 1.10 12. 0.86 0.87 0.90 0.87 13. 1.49 3.07 0.94 0.97 14. 0.87 0.83 0.98 0.99 15. 0.88 0.77 1.06 0.14 16. 1.10 0.99 1.17 1.41 17. 1.23 2.24 1.08 1.52 18. 0.76 0.57 0.76 0.70 19. 1.16 1.09 0.78 0.82 20. 0.93 0.90 0.78 0.82 21. 0.93 0.90 0.79 0.79 22. 0.76 0.65 0.83 0.77 23. 0.93 0.89 0.90 0.85 24. 0.93 0.85 1.08 1.10 Mean 1.03 1.05 1.00 1.08 S.D 0.18 0.46 0.15 0.31
In Table four, the results of fit statistic of test items for years 2011 and 2012 are
shown for practical physics tests of WAEC using Partial Credit model of IRT.
The results showed that the test items for the year 2011 had the infit and outfit
statistics ranging from 0.76-1.49 and 0.83-3.07 respectively. It is only items 13 and 17
that have out fit of 3.07 and 2.24 respectively beyond the accepted range of 0.7-1.5. The
fit statistic of WAEC 2011 apart from item 13 and17 indicate that all the items are perfect
and valid since they all fall within the range of fit regarded valid. Since the mean of the

75
infit and outfit are 1.03 and 1.05 with generally low S.D of 0.18 and .46; 92% of the
items are valid and unidimensional.
For the test items of WAEC 2012 practical physics, the in fit statistics range of
.76 to 1.45 and outfit statistic range of 0.70 to 2.14. It is only items 5 and17 that have the
outfit of 2.14 and 1.52 respectively which are outside the accepted range. The fit statistics
of WAEC 2012 items (apart from the outfit statistic of items 5 and 17) indicate that the
items are valid since they fall into the range of 0.7-1.5. The mean of the infit and outfit
are 1.00 and 1.08 with standard deviations of 0.15 and .31 respectively. The percentage
of the fitting items is 92%. This implies high validity and almost all items are
unidimensional
It could therefore be said that apart from items 13 and 17 in WAEC 2011 and
items 5 and17 of WAEC 2012, all the items of WAEC practical physics are within the
accepted range and therefore valid and sufficiently demonstrates unidimensionality.

76
Research Question Five
What are the item parameter estimates (difficulty index, b) of NECO practical
physics questions produced in the years 2011and 2012 using Partial Credit Model of
IRT?
Table Five: Item Difficulty Measures (Difficulty Estimates b) of practical Physics tests produced by NECO for years 2011 and 2012 based on Partial Credit Model of IRT
Item Difficulty Measure 2011
Difficulty Measure 2012
1. -0.89 0.33 2. 0.02 0.35 3. -0.36 -0.91 4. 1.18 -1.06 5. 0.52 -0.75 6. -0.09 -1.01 7. 0.64 0-.58 8. -0.48 1.94 9. -0.18 -1.26 10. -0.79 -1.31 11. 0.21 -0.75 12. -0.85 1.12 13. 0.45 1.63 14. -1.31 -0.27 15. -.59 -0.60 16. 1.47 1.25 17. -1.29 -0.17 18. 1.15 -0.80 19. 0.84 -0.32 20. -0.40 1.35 21. 0.89 0.70 22. 0.01 -0.08 23. -0.31 -0.21 24. 0.18 1.41 Mean 0.00 0.00 S.D 0.76 0.97
Table five shows the item difficulty estimates or difficulty measures of the test
items of practical physics questions conducted by NECO.
For items of NECO 2011 practical physics questions, the results show that items
ranged in difficulty from -1.31 of item 14 (the easiest item) to +1.47 of item 16 (the most
difficult item) for the year 2011 NECO questions. Twelve items were with negative index
and so were fairly easy and twelve items were with indices that are positive-fairly

77
difficult. That means 50% of the questions were fairly easy and 50% fairly difficult,
striking a perfect balance at 0.00. That the mean of the difficult index distribution is also
0.00 with low S.D of 0.76.
On the analysis of NECO 2012 questions, the result showed that the range of item
difficulty is -1.26 of item 9 (the easiest item) to 1.94 of item 8 (the most difficult item).
Fifteen items had negative b estimates and so were fairly easy. But eleven b estimates
were positive and were fairly difficult. However, the mean of the difficulty estimate
distribution is 0.00 (SD of 0.77) and that connotes a balance between moderately difficult
and easy items.
Research Question Six
What are the item parameter estimates (difficulty index b) of WAEC practical
physics questions produced in the years 2011and 2012 based on Partial Credit Model of
IRT?

78
Table Six: Item difficulty estimates b of practical physics tests produced by WAEC for years 2011 and 2012 based on Partial Credit Model of IRT
Item Difficulty Measure 2011
Difficulty Measure 2012
1. -1.24 -1.56 2. -1.07 -1.39 3. -0.94 0.19 4. 1.13 -0.81 5. 0.92 1.47 6. 0.01 -0.75 7. -0.39 -0.51 8. -0.24 0.77 9. -0.97 -0.57 10. -0.88 -0.57 11. -0.50 -0.69 12. -0.43 1.22 13. -0.98 0.10 14. -0.38 0.16 15. -0.56 0.81 16. 1.17 0.72 17. 0.24 -0.85 18. -0.63 -0.25 19. -0.06 0.63 20. 1.53 -0.11 21. 0.46 1.12 22. 0.16 0.03 23. 0.29 0.34 24. 0.40 0.49
Table six shows the item difficulty estimates b of the practical physics test items
of WAEC for years 2011 and 2012 using Partial Credit model of IRT.
The results show that items for the year 2011 had difficulty estimate that ranges
from -1.24 of item (1) (the easiest item) to 1.53 of item 20 (the most difficult item).
Within this range, fourteen items had negative difficulty estimate which means fourteen
fairly easy items. Also, ten items had positive difficulty estimate which implies fairly
difficult questions. The mean of the estimate distribution is 0.00 which suggest that fairly
easy items balances fairly difficult items. The difficulty indices are desirable since both
the positive and negative range, are close to 0.00 and the standard deviation is low 0.84.
The results of difficulty estimate b for 2012 WAEC items revealed that the range
of difficulty estimate is from -1.56 of item (1) one to 1.47 of item 20. In between this

79
range there are eleven items with negative difficulty and 13 items with positive difficulty
moderately easy and difficult items respectively. The mean of 0.00 for the distribution
and S.D of the .80 suggest a fair balance between difficult and moderately easy questions.

80
Research Question Seven
What proportion of NECO practical physics test items fit the Partial Credit Model
of IRT?
Table Seven: The Infit, Outfit and their ZSTD of NECO practical Physics questions for years 2011 and 2012 based on Partial Credit Model of IRT
Item 2011 NECO 2012 NECO Infit ZSTD Outfit ZSTD Infit ZSTD Outfit ZSTD 1. 1.02 0.20 0.83 -0.90 1.03 0.30 1.02 0.20 2. 1.08 0.40 1.00 0.10 1.04 0.30 1.05 0.30 3. 0.99 0.00 0.98 -0.10 1.47 2.90 1.44 2.60 4. 1.11 0.60 1.28 1.50 0.85 -1.40 0.78 -1.50 5. 0.92 -0.90 0.90 -1.00 1.00 0.00 1.02 0.20 6. 0.81 -2.60 0.78 -2.50 1.10 1.00 1.12 0.90 7. 1.01 0.20 1.09 1.00 1.12 1.30 1.03 0.20 8. 0.99 0.10 0.90 -0.70 1.32 2.70 1.85 4.30 9. 0.93 -0.40 0.77 -1.30 1.07 0.40 1.16 1.00 10. 0.97 -0.10 0.99 0.00 1.01 0.10 1.01 0.10 11. 0.73 -2.40 0.70 -2.60 1.08 0.70 1.08 0.70 12. 0.82 -1.30 0.84 -1.10 0.88 -1.30 0.83 -1.60 13. 0.92 -0.70 0.95 -0.40 1.23 1.10 2.37 1.90 14. 0.88 -1.6 0.83 -1.90 0.95 -0.60 0.92 -0.80 15. 0.96 -0.50 0.89 -0.70 0.95 -0.60 0.84 -1.00 16. 1.31 3.20 1.28 2.40 1.02 0.20 1.15 0.90 17. 1.51 3.40 2.49 6.40 0.96 -0.20 0.83 -0.80 18. 1.50 2.90 1.73 3.00 0.87 -1.10 0.93 -0.40 19. 1.40 3.30 1.50 4.30 0.87 -1.10 0.83 -1.40 20. 1.07 0.50 1.09 0.60 0.80 -2.40 0.75 -2.40 21. 0.99 0.00 1.01 0.10 0.92 -0.90 -0.93 -0.70 22. 1.05 -0.70 1.00 0.00 0.85 -1.80 0.84 -1.00 23. 0.83 -2.30 0.78 -2.40 0.95 -0.50 0.88 -1.00
24. Mean
0.91 1.03
-0.9 0.10
0.89 1.06
-0.70 0.10
0.88 1.01
-1.50 -0.10
0.82 1.06
-1.70 -0.10
S.D 0.02 1.70 0.38 2.10 0.15 1.30 0.36 0.15
Table seven shows the results of the goodness of fit statistics of the test
items for the years under study using partial credit model of IRT. The results show that
for NECO 2011, two items (17 and 18) had a poor fit. The rest of the item had their fit
within the range that fits PCM. Therefore, 22 items out of 24 had good fit i.e. 91.67% or
0.92 of the items of NECO 2011 items had good fit to the PCM and the mean of the Z
STD = 0.1 for both infit and outfit which conforms to theoretical view for good items.

81
Also, for NECO 2012, two items (8 and 13) had a bad fit. So 22 out of 24 items
had a good fit to the PCM. This implies that 91.67% or 0.92 of the items of NECO 2012
items fitted the PCM and the mean of the Z STD = .1 for both infit and outfit goodness of
fit which is sufficiently close to zero and this agrees with theory for good item fit to
PCM.
Research Question Eight
What proportion of WAEC practical Physics test items fit the Partial Credit
Model of IRT?

82
Table Eight: The infit, outfit and their ZSTD of WA EC practical Physics Examination for years 2011and 2012 based on PCM of IRT
Item 2011 WAEC 2012 WAEC Infit ZSTD Outfit ZSTD Infit ZSTD Outfit ZSTD 1. 1.14 0.90 1.10 0.60 1.07 0.60 1.01 0.10 2. 1.01 0.10 0.95 -0.30 1.02 0.20 1.00 0.00 3. 0.87 0.90 0.85 -0.90 0.99 -0.10 1.05 0.40 4. 0.93 0.60 0.83 -1.10 0.86 -1.50 0.82 -1.60 5. 1.38 3.30 1.53 3.50 1.45 3.00 2.14 4.80 6. 1.03 -0.40 1.02 0.20 1.06 0.60 1.02 0.30 7. 1.16 1.80 1.11 0.80 1.12 1.20 1.09 0.60 8. 1.12 1.50 1.04 0.30 1.12 1.30 1.38 2.60 9. 1.28 1.70 1.12 0.80 1.04 0.30 1.36 2.00 10. 0.97 -0.20 0.94 -0.40 0.90 -0.50 0.87 -1.00 11. 1.10 0.80 1.17 1.10 1.20 1.60 1.10 0.80 12. 0.86 -1.80 0.87 1.10 0.90 -1.10 0.87 -1.20 13. 1.49 -1.80 3.07 2.60 0.94 -0.80 0.97 -0.30 14. 0.87 -1.60 0.83 -1.60 0.98 -0.20 0.99 -0.10 15. 0.88 -1.30 0.77 -1.20 1.06 0.60 1.42 2.30 16. 1.10 -1.10 0.99 0.00 1.17 1.80 1.41 2.30 17. 1.23 1.40 2.24 1.00 1.08 0.60 1.52 2.30 18. 0.76 -2.00 0.57 -2.70 0.76 -1.80 0.70 -1.90 19. 1.16 1.40 1.09 0.60 0.89 -1.00 0.94 -0.50 20. 0.93 -0.50 0.90 -0.80 0.78 -1.30 0.82 -2.10 21. 0.93 -0.80 0.90 0.70 0.79 -2.40 0.79 -2.40 22. 0.76 -3.30 0.65 -3.20 0.83 -2.40 0.77 -2.50 23. 0.93 -0.80 0.89 -0.80 0.90 -1.30 0.85 -1.40 24. Mean
0.93 1.03
0.80 0.10
0.85 1.05
-1.20 -0.20
1.08 1.00
0.90 -1.00
1.10 1.08
1.00 0.20
S.D 0.18 1.50 0.46 1.40 0.15 1.50 0.31 1.80
Table eight shows results of the goodness of fit statistics of test items for the years
being studied using Partial Credit model of IRT. The results showed that for WAEC 2011
items; items 13 and 17 had the infit and/or out fit outside the good fit range; therefore, 22
out of 24 items had a good fit to PCM. This implies that 91.57% or 0.92 of the items of
WAEC 2011 items have a good fit to PCM of IRT. Also, the mean of ZSTD for the infit
and outfit are 0.1 and 0.2 respectively. These ZSTD means are close to zero and so agrees
with theory that most items have good fit for PCM.

83
For WAEC 2012, items, items 5, and 17 had poor fit to PCM mostly due to their
outfit. Therefore WAEC 2012 questions had 22 items with good fit and two items with
poor fit. It means 91.57% or .92 of WAEC 2012 items fits or has a good fit to PCM.
Hypothesis One (H01)
There is no significant difference (P<.05) in the standard error of measuring
(SEM) of practical physics questions conducted by NECO 2011 and NECO 2012.
Table Nine: Standard error of measurement for NECO 2011 and NECO 2012
Variable K Mean 89 S.D Df t-value sig Decision
NECO 2011 24 .09 .02 23 2.50 .02 S
NECO 2012 24 .11 .03 23
α = 0.05, significant
The result on Table 9 shows that the t-value obtained was 2.50 with associated
probability value of 0.02. This probability value is less than the 0.05 level of significance.
Therefore, the null hypothesis which states that there is no significant difference in the
SEM of NECO 2011 and NECO 2012 practical physics questions was rejected. It was
concluded that there is a significant difference in the SEM of NECO 2011 and NECO
2012 practical physics questions.
Hypothesis Two (H02)
There is no significant difference (P<.05) in the standard error of measurement
SEM of practical physics tests conducted by WAEC 2011 and WAEC 2012
Table 10: Standard Error of measurement for WAEC 2011 and WAEC 2012 Variable K Mean 89 S.D df t-value sig Decision
WAEC 2011 24 .10 .03 23 0.59 .56 NS
WAEC 2012 24 .10 .02 23
α = 0.05, Not significant
The result on Table 10 revealed that the t-value obtained was 0.59 with associated
probability value of 0.56. This probability value is greater than the 0.05 level of
significance. Therefore, the researcher fails to reject the null hypothesis which states that
there is no significant difference in the SEM of WAEC 2011 and WAEC 2012 practical
physics questions. It was therefore concluded that there was no significant difference in
the SEM of WAEC 2011 and WAEC 2012 Practical physics tests

84
Hypothesis Three (H03)
There is no significant difference (P<.05) in the SEM of practical physics tests
conducted by NECO and WAEC 2011-2012.
Table 11: Standard error of measurement for NECO 2011 and WAEC 2011 Variabe K Mean 89 S.D Df t-value sig Decision
NECO 2011 24 .09 .02 23 0.54 .59 NS
WAEC 2012 24 .10 .02 23
α = 0.05, Not Significant
In Table 11 the result showed that the t-value obtained was 0.54 with associated
probability of 0.59 . This probability value is greater than the level of significance 0.05.
Therefore, the researcher fails to reject Ho. That means that there is no significant
difference in the S.E.M of NECO 2011 and WAEC 2011 practical physics questions.
Table 12: Standard error of measurement for NECO 2012 and WAEC 2012
Variable K Mean 89 S.D Df t-value sig Decision
NECO 2012 24 .11 .03 23 -1.47 .16 NS
WAEC 2012 24 .10 .02 23
x = 0.05 Significant
The result in Table 12 showed that the t-value obtained was -1.47 with associated
probability of 0.16. This probability value is greater than the 0.05 level of significance.
Therefore, we fail to reject Ho. That implies that there is no significant difference in the
S.E.M of NECO 2012 and WAEC 2012 practical physics questions.
Hypothesis Four (H04)
There is no significant difference in the validity (fit statistics) of NECO 2011-
2012 practical physics questions
Table 13: Fit statistic (for partial credit model) for NECO 2011 and NECO 2012. ( Appendix AM)
Variable N Mean 89 S.D df t-value sig Decision
NECO 2011 50 18.78 12.40 49 1.11 .27 NS
NECO 2012 50 21.25 9.68 49
α = .05, Significant

85
The result on Table 13 revealed that the t-value obtained was 1.11 with associated
probability of 0.27. This probability value is less than the level of significance 0.05.
Therefore we fail to reject the null hypothesis Ho. This implies that there is no significant
difference in the fit statistic (validity) of NECO 2011 and NECO 2012 practical physics
questions.
Hypothesis Five (H05)
There is no significant difference in the validity (fit statistics) of WAEC practical
physics questions
Table 14: Fit statistics for PCM for WAEC 2011 and WAEC 2012 (Appendix AN) Variable N Mean 89 S.D df t-value sig Decision
WAEC 2011 50 21.33 20.57 49 -.96 .34 NS
WAEC 2012 50 17.94 14.36 49
α = .05, Significant
On Table 14 are the results of t test for the validity (fit statistic) of practical
physics items in questions conducted by WAEC in 2011 and 2012 based on PCM of IRT.
The result showed that the t-value obtained was .96 with associated with
associated probability of 0.34. This probability value is greater than the level of
confidence 0.05. The researcher therefore, fails to rejects the Ho. This means that there is
no significant difference between the validity (fit statistics) of practical physics items of
questions conducted by WAEC 2011 and WAEC2012.
Hypothesis Six (H06)
There is no significant difference (P<.05) in the validity (fit statistic) of practical
physics questions conducted by NECO 2011 and WAEC 2011.
Table 15: Validity (fit statistic) for PCM of NECO 2011 and WAEC 2011 Appendix AO)
Variable N Mean 89 S.D df t-value sig Decision
NECO2011 50 18.78 12.40 49 .75 .46 NS
WAEC 2011 50 21.32 20.57 49
α = .05,Not Significant
Table 15 is the result of fit statistic (validity) of practical physics items in
questions conducted by WAEC 2011 and NECO 2011 based on PCM.

86
The result revealed that the t-value of 0.75 was obtained with associated
probability of 0.46. This probability value is greater than the level of confidence 0.05. We
therefore fail to reject Ho. This means that there is no significant difference between the
validity (fit statistic) of practical physics items of tests conducted in WAEC 2011 and
NECO 2011.
Table 16: Validity (fit statistic) for PCM of NECO 2012 and WAEC 2012 (Appendix AP) Variable N Mean 89 S.D df t-value sig Decision
NECO 2012 50 21.26 9.68 49 1.36 .18 NS
WAEC 2012 50 17.94 14.35 49
α = .05, Significant
Table 16 shows the result of the t test for the validity (fit statistic) for practical
physics items in questions conducted by NECO 2012 and WAEC 2012 based on PCM of
IRT.
This result revealed that the value of significance 0.18 is greater than the level of
significance 0.05. Therefore Ho is upheld (fail to reject). This implies that there is no
significant difference between the validity (fit statistic) of practical physics items of tests
conducted in NECO 2012 and WAEC 2012.
Hypothesis Seven (H07)
There is no significant difference in the difficulty parameter estimates (b) of
NECO practical physics tests.
Table 17: Item Parameter estimates (difficulty) b for NECO 2011 and NECO 2012
Variable K Mean 89 S.D df t-value sig Decision
NECO 2011 24 .00 .78 23 0.003 0.997 NS
NECO 2012 24 .00 .99 23
α = 0.05,Not Significant
The result from Table 17 revealed that the t-value obtained is 0.003 with
associated probability of 0.997 .This probability value is greater than the significance
level of (0.05). Therefore, we fail to reject the Null hypothesis. There is therefore no
significant difference in the difficulty estimates of NECO 2011 and NECO 2012 practical
physics tests using PCM of IRT.
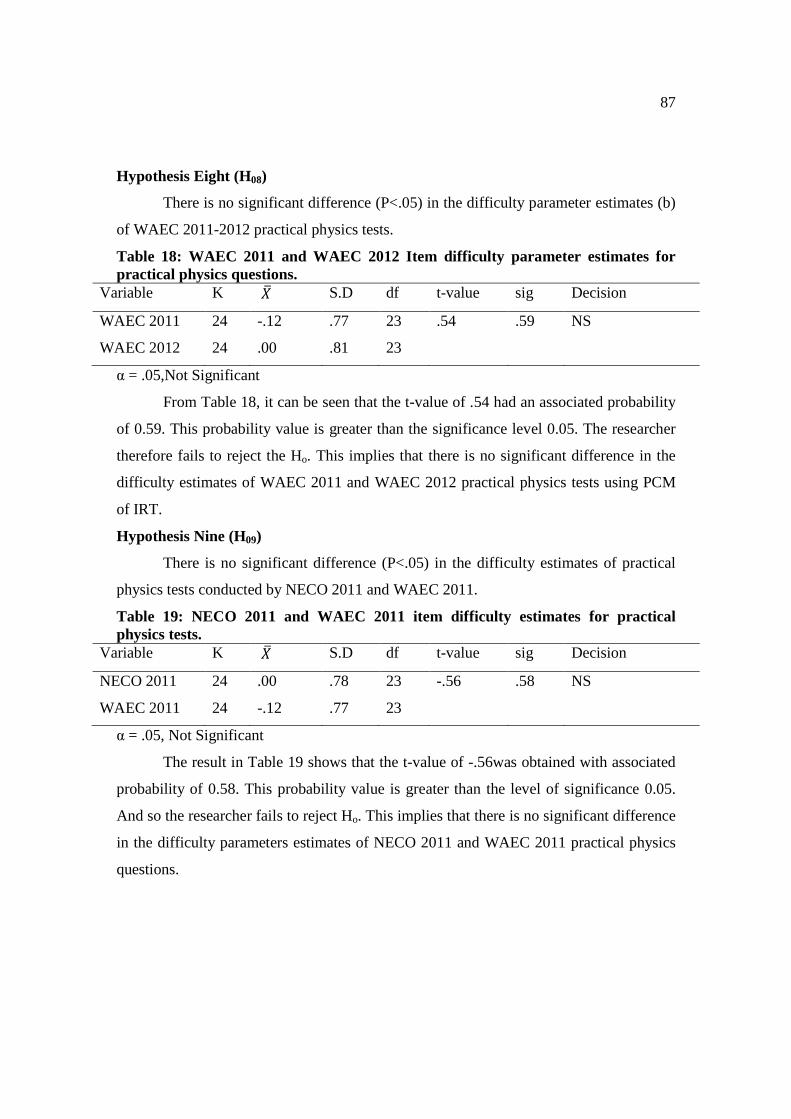
87
Hypothesis Eight (H08)
There is no significant difference (P<.05) in the difficulty parameter estimates (b)
of WAEC 2011-2012 practical physics tests.
Table 18: WAEC 2011 and WAEC 2012 Item difficulty parameter estimates for practical physics questions.
Variable K 89 S.D df t-value sig Decision
WAEC 2011 24 -.12 .77 23 .54 .59 NS
WAEC 2012 24 .00 .81 23
α = .05,Not Significant
From Table 18, it can be seen that the t-value of .54 had an associated probability
of 0.59. This probability value is greater than the significance level 0.05. The researcher
therefore fails to reject the Ho. This implies that there is no significant difference in the
difficulty estimates of WAEC 2011 and WAEC 2012 practical physics tests using PCM
of IRT.
Hypothesis Nine (H09)
There is no significant difference (P<.05) in the difficulty estimates of practical
physics tests conducted by NECO 2011 and WAEC 2011.
Table 19: NECO 2011 and WAEC 2011 item difficulty estimates for practical physics tests.
Variable K 89 S.D df t-value sig Decision
NECO 2011 24 .00 .78 23 -.56 .58 NS
WAEC 2011 24 -.12 .77 23
α = .05, Not Significant
The result in Table 19 shows that the t-value of -.56was obtained with associated
probability of 0.58. This probability value is greater than the level of significance 0.05.
And so the researcher fails to reject Ho. This implies that there is no significant difference
in the difficulty parameters estimates of NECO 2011 and WAEC 2011 practical physics
questions.

88
Table 20: NECO 2012 and WAEC 2012. Item difficulty estimates for practical physics questions.
Variable K 89 S.D df t-value sig Decision
NECO 2012 24 .03 1.01 23 .13 0.90 NS
WAEC 2012 24 00 .82 23
α = 0.05, Not Significant
The results of the Table 20 indicate that the t-value obtained was .13 with
associated probability of 0.90. This probability value is greater than the level of
significance 0.05. Therefore, we fail to reject the Null hypothesis and by implication,
there is no significant difference in the difficulty parameter estimates of NECO 2012 and
WAEC 2012.
Summary of the Findings of the Study
Based on the data analysis in this study, the findings are summarized as follows:
1. The items of NECO practical physics tests has very low SEM and consequently
reliable, based on Partial Credit Model.
2. Also, based on the PCM, the items of WAEC practical physics tests has low SEM
and as a result are highly reliable.
3. The validity of items of the practical physics tests conducted by NECO is
discovered in this study to be sufficiently high.
4. The validity of items of WAEC practical physics tests using partial credit model
is very high
5. The items of NECO practical physics tests had difficulty parameters estimate
within the acceptable range that indicate that the items are of moderate difficulty
6. Item difficulty parameter estimates of WAEC practical physics tests were also
estimated in this model within the range that is acceptable and which showed that
item difficulty indices are of moderate difficulty.
7. Each of the two NECO tests studied had the item proportion fit to partial credit
model at 0.92.
8. WAEC 2011 and WAEC 2012 practical physics items had 0.92 each as their item
proportion fit to partial credit model.
9. There is significant difference in the standard error of measurement in the
practical physics tests conducted by NECO

89
10. There is no significant difference in the standard error of measurement in the
practical physics tests conducted by WAEC
11. (i) There is no significant difference in the SEM of NECO 2011 and WAEC 2011
conducted practical physics tests (ii) There is no significant difference in the SEM
of NECO 2012 and WAEC 2012 practical physics tests.
12. There is no significant difference in the validities of practical physics tests
conducted by NECO
13. There is no significant difference in the validities of practical physics tests
conducted by WAEC.
14. (i) There is no significant difference in the validities of NECO 2011 and WAEC
2011 conducted practical physics tests. (ii) There is no significant difference in
the validities of NECO 2012 and WAEC 2012 conducted practical physics tests.
15. There is no significant difference between the difficulty indices of NECO
practical physics tests.
16. There is no significant difference between the difficulty indices of WAEC
practical physics tests.
17. (i) There is no significant difference between the difficulty indices of NECO 2011
and WAEC 2011 practical physics tests. (ii) There is no significant difference
between the difficulty indices of NECO 2012 and WAEC 2012 practical physics
tests.

90
CHAPTER FIVE
DISCUSSION, CONCLUSION, AND SUMMARY
This chapter discusses the findings of the study, conclusions reached from the
findings, limitations of the study, recommendation, suggestions for further studies and
summary of the study
Discussion of the Findings
. The discussions on the findings were organized under the following sub-headings,
− Standard error of measurements (S.E.M),
− Validity (fit statistics),
− item parameter or the difficulty estimates,
− Proportion of item fit to PCM and
− Stability of SEM, validity and item difficulty estimates in the hypotheses tested.
The standard error of measurements (SEM)
The aim of research questions one and two was to estimate the standard error of
measurement SEM for items of practical physics test of NECO 2011, NECO 2012,
WAEC 2011 and WAEC 2012 based on partial credit model of item response theory.
The SEM of NECO tests ranges from 0.06 - 0.16 and that of WAEC tests ranges
from 0.06 - 0.18. Baumgartner (2002) stated that in the response analysis every estimate
of item difficulty measure comes with its standard error, that the allowed limit of
standard error for test is 0.5 and the smaller the standard error, the better the test item and
the higher the reliability.
Tables one to four showed the standard error of physics practical items based on
the partial credit model. Table one reveals that 100% of the items have their SEM
between 0.06 – 0.13 for NECO 2011. Table two revealed that the SEM for all the item
between 0.06 – 0.16. For NECO 2012 practical test. The items SEM have their standard
90

91
deviations as 0.02 and 0.03; mean standard error of 0.09 and 0.11 respectively for NECO
2011 and NECO 2012 practical physics items.
Based on partial credit model therefore the implications for NECO 2011 and
NECO 2012 practical physics items are as follows (i) the S.E.M are very low (far below
the limit of 0.5), which implies high reliability for the two NECO practical tests. (ii) The
standard deviations were very low implying low variability for the SEM of the two
NECO tests. (iii) Their mean standard errors when compared with the limit of standard
error of 0.5 means that the tests are of high quality required for a good practice in test
construction.
Table three and four revealed the SEM of WAEC 2011 and WAEC 2012.They
had ranges 0.06 – 0.18 and 0.07 – 0.13 respectively with standard deviations of 0.2 for
both. The mean of their SEM are 0.09 and 0.10 respectively for WAEC 2011 and WAEC
2012 items.00
Therefore based on partial credit model the implication for WAEC 2011 and
WAEC 2012 practical physics items are as follows. (i) Since the SEM are very low
compared to the maximum limit allowed in literature (0.5), the items of the two WAEC
practical test are of high reliability. (ii) The standard deviations of their SEM were very
low which connotes low variability for the SEM of the two WAEC tests. (iii) Their mean
standard errors of 0.5 depicts that the test items are of high quality necessary for good test
construction.
114

92
Validity
The essence of research questions three and four was to establish the validity of
test items of practical physics tests conducted by NECO and WAEC in the years 2011
and 2012 based on partial credit model.
In item response theory, validity connotes a fit to the model; that item
discrimination are uniform and substantial and that there is no error in scoring (Nkpone,
2001). According to Bryce (1981) an item will be valid or of good fit to the model if it
had fit statistics of 1.5 and below. A large positive fit indicate a poor fit, but fit statistic
nearer one (1) indicate a better fit. Specifically, for PCM fit Curtis and Boman (2007)
Lian and Idris (2006), Bond and Fox (2001) Opsomer et al (2002) noted that infit and
out fit statistics should be between 0.7 and 1.5 for items validity or fitness to be
acceptable for moderately rigorous assessment purposes and for such items to be
considered unidimensional.
In this study the items examined for NECO 2011 showed that the infit/out fit
statistics range between 0.70 and 1.73. For NECO 2012 the infit/outfit statistic range
between 0.78 and 2.37. On the whole NECO 2011 had two items and NECO 2012 had
two items with either infit and/or outfit outside the accepted infit /outfit range of 0.7-1.5.
Also the mean infit /outfit range between 1.01-1.06 for the two NECO tests studied were
observed.
The implications of this is that for 24 items of NECO 2011, two items had their
validity or fit statistic within the range that does not portray unidimensionality. The 24
items of NECO 2012 had two item fit statistics within the range that does not show
unidmensionality. Therefore PCM showed that only three items of NECO 2011 and two

93
items of NECO 2012 test are not valid and therefore not unidmensional. Also that the
mean of the infit/outfit ranged between 1.01 to 1.06 implies high validity for the two
years understudied in NECO test since according to Bryce (1981) a fit statistic near one
(1) indicate a letter fit. Since the mean of the fit statistics for the two NECO tests are
sufficiently close to one ie (1.01 – 1.06). Then the mean results if the fit statistic
sufficiently demonstrates a good fit and undimensionality.
The items WAEC 2001 studies showed that the infit /outfit statistics range
between 0.76 to 3.07. For WAEC 2012 the infit /outfit statistics range between 0.76 –
2.14. In all WAEC 2011 had two items and NECO 2012 had two items with either infit
and/or outfit outside the accepted infit/outfit range of 0.7-1.5. More over their mean for
infit outfit range between 1.00 – 1.08 for the two WAEC tests studied were obtained.
This implies that for the 24 items of WAEC 2011, two items had their validity or
fit statistic with the range that does not depict undimensionality. The 24 items of WAEC
2012 had two items fit statistics within the range that does not show unidmensionality.
Hence PCM showed that two items each of WAEC 2011 and WAEC 2012 are not valid
and therefore not undimensional. Also that the mean of the infit/outfit range is between
1.00 and 1.08 connotes high validity for the WAEC 2011 and WAEC 2012 practical test.
This is because the mean fit statistic being close to one indicate a better fit (Bryce 1981)
On the whole therefore two items each for NECO 2011, NECO 2012, WAEC
2011 and WAEC 2012 were not valid, which implies that each of these test have 22 items
out of 24 with fit statistics that fit PCM. NECO 2011 had two items with bad fit and
twenty two with good fit. Therefore a significant percentage of both NECO and WAEC
practical tests are highly valid and thus demonstrate imidimensionality

94
Item parameter (Difficulty) Estimates
The intent of research questions five and six was to estimate the items difficulty
of practical physics tests conducted by NECO and WAEC in years 2011 and 2012 using
PCM.
In items response theory the number of examinees responding correctly to an item
determines the estimates of the difficulty index ( b) of such item. Theoretically, b spans
- ∞ to +∞, but in practice the usual range of b is – 3 to +3, and values outside this usual
range are rare to come by (Baker, 2001). While negative estimates of b implies easy
items, positive estimates of b progressively imply difficult items.
In the table of item difficulty (b) NECO 2011 had the b range of -1.13 to +1.47.
From the Table, twelve (12) items had negative index and twelve items had positive
index. The implication is that 50% of the items were fairly easy and 50% of the items
were relatively difficult.
The NECO 2012 test had the b range of – 1.26 to 1.94. Even though the b range
of the items are within good range of items difficulty, 15 items had negative values. This
means that there were more of easy items in NECO 2012 practical test items than that of
NECO 2011. Generally the item difficulty of NECO practical tests are good for
moderately rigorous examination purposes
For WAEC 2011, the range of item difficulty was -1.24 to 1.53. In all thirteen
items had negative difficulty which implied that those thirteen items were fairly easy and
the remaining eleven items were fairly difficult. The item difficulty are within he
practical range for item difficulty of -3 to +3. The difficulty estimate of WAEC 2011
items are desirable hence both positive and negative indices of b range are close to zero
with low standard deviation of 0.84. And in items of WAEC 2012, the range of item
difficulty is -1.56 to 1.47. Eleven items had negative b estimates and thirteen have

95
positive b estimates. The spread of item b is clustered around zero for all the item. This
indicates that there is a fair balance for fairly easy and moderately difficult items.
Despite the fact that results from both WAEC 2011 and WAEC 2012 items have
about half of the items with negative difficulty, the item for both years, the item b are
relatively desirable since they are within the null point of the practical difficulty range.
Proportion of Item fit to PCM
The research questions seven and eight were aimed at investigating the proportion
of NECO and WAEC practical physics item that has a good fit to the PCM.
In theory, we are made to understand that items with infit and outfit that range
between 0.7 to 1.5 with expected mean = 1 and ZSTD of mean = O are of good fit to
PCM.
In NECO 2011, only two items had a poor fit to the model. Hence, 22 out of 24
item had a good fit to PCM. Therefore, 91.67% or .92 of the items of NECO 2011
practical physics examination had a good fit to partial credit model. Also, in NECO 2012,
two items had a poor fit to the model. So 22 out of 24 items had their infit and outfit
within the limits of good fit. That means that 91.67% or 0.92 of the items of NECO 2012
practical physics had good fit to PCM. The expected mean of 1.00 for infit and outfit for
both years range between 1.01 and 1.08. This means that very high proportion of the
items fit the PCM.
WAEC 2011 had two items with infit and /or outfit outside the good fit range for
PCM. It then means that 20 out of 24 items had a good fit to PCM. This implies that
91.57% or 0.92 of the items of WAEC 2011 had a good fit to the PCM. Finally, in
WAEC 2012, also two items had a bad fit, mostly due to their outfit. It therefore means
that 22 out of 24 items had a good fit to PCM. 91.57% or 0.92 of items of WAEC 2012
practical physics items therefore has a good fit to PCM.
While WAEC 2011 and WAEC 2012 items had 0.92 each of proportion of their
items fit PCM; NECO 2011 and NECO 2012 items had 0.92 each as well. This therefore
connotes that on comparative basis, NECO practical physics items have equal proportion
of their items fit PCM with WAEC practical physics items.

96
Stability of S.E.M. in Hypotheses tested.
Hypothesis one compared the standard error of measurement SEM of NECO 2011
and NECO 2012 practical physics item based on the partial credit model. The result of
the t-test of difference indicated that there is a significant difference in the SEM of
NECO 2011 and NECO 2012 practical physics items conducted by NECO for the two
different years. This significant difference was caused by the difference in the SEM range
of NECO 2011 – (.06 to 0.13) and NECO 2012 – (0.06 – 0.16).
Hypothesis two also compared the standard error of measurement of WAEC 2011
and WAEC 2012 practical physics items using PCM. The test of difference indicated that
there is no significant difference in the SEM of WAEC 2011 and WAEC 2012 practical
physics examination conducted by WAEC for the two years studied. This indication of no
significant difference expresses that there is relative stability in the SEM / reliability of
examinations conducted by WAEC.
Hypothesis three explored whether there is any significant difference in the SEM
of practical physics exam conducted by NECO 2011 and WAEC 2011; NECO 2012 and
WAEC 2012 using PCM. The result indicated that there is no significant different in the
SEM of NECO 2011 and WAEC 2011 conducted practical physics examination. This
result show that reliability/SEM of WAEC and NECO is closely related. It indicated that
there is no significant different in the reliability / SEM of WAEC and NECO at least for
some years.
For the test of difference of NECO 2012 and WAEC 2012, the result of t-test
indicated that there is no significant difference in the SEM of NECO 2012 and WAEC
2012 practical physics examination.
Stability of Fit Statistics (Validity) in the Hypotheses tested.
The fourth hypothesis attempted to verify whether the difference in the validity or
fit statistics of NECO 2011 and NECO 2012 practical physics examina3tion is
significant. T test carried out on the fit statistics of NECO 2011 and NECO 2012 results
of the practical physics items showed that there was no significant difference in the fit
statistics of the items of the two examinations.
The fifth hypothesis aimed at testing whether there is significant difference in the
fit statistics of WAEC 2011 and WAEC 2012 practical physics examination. Based on

97
partial credit model, there was no significant difference in validity / fit statistic of
practical physics examination conducted by WAEC for the two years under study. This
implies stability in the quality of WAEC examinations across the years.
Sixth hypothesis verified if there is significant difference in the fit statistics of (i)
NECO 2011 and WAEC 2011; (ii) NECO 2012 and WAEC 2012 practical physics items.
The test of difference in fit statistics conducted for NECO 2011 and WAEC 2011
revealed that there are no significant difference in the validity of NECO 2011 and WAEC
2011; NECO 2012 and WAEC 2012 practical physics examination. This result is also
consistent with hypothesis 3(a and b) that indicated no significant difference in the SEM
of WAEC 2011 and NECO 2011; WAEC 2012 and NECO 2012. All these are expression
of near equivalence of validity of WAEC and NECO examinations across the years.
Stability of the Difficulty parameter estimates
Hypothesis seven compared the item parameter (difficulty) (b) estimates of
NECO 2011 and NECO 2012. The difficulty estimates for NECO 2011 and NECO 2012
were subjected to t test. This revealed that there was no significant difference between the
difficulty estimates of NECO 2011 and NECO 2012 practical physics items using PCM.
This indicates that there is stability in the difficulty estimates of NECO examination in
practical physics.
The purpose of hypothesis eight was to compare the item difficulty estimates of
WAEC 2011 and WAEC 2012. The difficulty estimates for WAEC 2011 and WAEC
2012 were subjected to t-test analysis and it was found that there is no significant
difference between the difficulty estimates of WAEC 2011 and WAEC 2012 practical
physics items. This is an evidence that WAEC practical physics examinations have some
steady measure of difficulty estimates in their year to year examinations.
Finally, hypothesis nine attempted comparison of (i) NECO 2011 and WAEC
2011, (ii) NECO 2012 and WAEC 2012 item difficulty estimates of their practical
physics questions. The items of these paired tests and their item difficulties were
accordingly subjected to t-test of significance. It was discovered that there is no
significant difference in the item difficulty estimates of (i) WAEC 2012 and NECO 2011;
(ii) NECO 2012 and WAEC 2012 at α = 0.5. This simply implies that the difficulty index
for the NECO and WAEC conducted practical physics examinations is more or less the

98
same. Since the results showed consistently that there is no significant difference in the
NECO to NECO; WAEC to WAEC and WAEC to NECO (twice), item difficulty
estimate. It then implies that the difficulty indices of both examinations are very
consistent and significantly stable.
Conclusion Reached from the Findings of the Study
Based on the data analysis in this study the following conclusions have been
drawn from the study.
The NECO practical physics tests analyzed in this study had the limits of SEM
from 0.06 to 0.16. This being far below the recommended limit of SEM (0.5) is an
indication that the NECO physics tests has very high reliability. More over the WAEC
practical physics test had their limits of SEM from 0.06 to 0.18. This as well is
sufficiently low SEM that defines high reliability for the practical physics tests of
WAEC.
Item validities of NECO practical physics tests demonstrate high proportion of
unidimensionalty. Both years of 2011 and 2012 NECO practical physics tests showed
that 0.92 proportion of the items had good fit to the PCM and so since both had 92% of
item statistics within the range that showed unidimensionality, it implies that the
validities for NECO practical physics tests are high. For WAEC 2011 and WAEC 2012
their fit statistics which showed 0.92 each for proportion of good fit to PCM, also
indicated that high proportion were unidimensional. To this extent therefore the WAEC
practical physics test are highly valid as well. But on comparative bases, the NEECO
practical physics tests are of exactly eqaul validity with that of WAEC for both years
under consideration.
The items of NECO practical physics tests had difficulty parameter estimates
within the acceptable range that indicate that the items are of moderate difficulty (- 1.31
to 1.94). For WAEC practical physics tests the item difficulty estimate (-1.56 to 1.53) are
within the range that typifies moderately difficult items. The four parts of the instrument
(WAEC 2011, WAEC 2012, NECO 2011 and NECO 2012 practical physics tests) had
nearly equal difficulty estimates of negative and positive values. This implies that for
both WAEC and NECO tests, easy items balances difficult items. Therefore both WAEC
and NECO tests studied had moderate item difficulty estimates.

99
For the hypothesis tested in the SEM, since NECO 2011- NECO 2012; showed
significant difference in their SEM it implies that there is a measure of instability in
NECO – NECO tests SEM and were of values that are not very related. Therefore there is
instability in SEM of NECO 2011-NECO 2012. Also SEM of ; NECO 2012 and WAEC
2012; WAEC 2011 – WAEC 2012; NECO 2011 – WAEC 2011 showed no significant
difference. Therefore there is stability in the SEM of WAEC practical tests for their SEM
and the SEM of WAEC 2011 and NECO 2011; NECO 2012 and WAEC 2012 are closely
related.
The hypotheses tested in fit statistics showed that there is stability in the validities
of NECO -NECO, WAEC –WAEC, and NECO-WAEC, Therefore the validity of NECO
and WAEC practical physics tests had consistent and nearly equal validities. Since all
NECO-WAEC showed no significant difference in their fit statistics, this implies that the
validities of two examination bodies were very similar across the years 2011 and 2012.
The difficultly estimates of both WAEC and NECO practical physics item
demonstrated consistently that there is no significant difference within NECO, WAEC
and NECO-WAEC in both years. Therefore this study found out that there is stability in
the difficulty estimates of the test conducted by both examination bodies. Also on
comparative bases, the item difficulties of the examination bodies are similar and that
was why there was no significant difference in the estimates across the exam bodies and
across the years. Therefore the difficulty estimates of WAEC and NECO examinations
are consistent and comparable.
Implications of the Study
The findings of this study revealed very close ties in the quality of the
examinations set by WAEC and NECO. The striking similarities on the SEM, item
difficulties range validity and the proportion of model fit of items to PCM, all indicate the
closeness in the qualities of exam set by the two bodies. Therefore, the society now, by
this study should have equal confidence in the examinations set by these two bodies.
The possibility of analysis of quality of a test through the invariant properties of
SEM, item difficulties, fit statistics etc through item response theory format has
implication for test analysis and developers in Africa. This has not been the case in Africa

100
and so this study encourages test developers in Africa to start making effectively the use
of IRT format for test development and analysis.
Examinees behaviour, strength and weaknesses in testing conditions could be
adequately explained using the findings of this nature. The counselor and test analysts
can use the various psychometric characteristics possible in partial credit model studies to
assess the examinee performance especially as it concern each item.
The study can attribute some failure of the examinee to some undesirable
psychometric properties of some items. Such undesirable property of an item that can
lead to massive failure in such items that have very high item difficulty estimate, item
misfit etc can be adequately ascertained for explanation.
The partial credit model studies could collapse the score categories to only two
categories without making it necessarily dichotomous. This increases the precision of the
model more than that of dichotomous model in IRT. The implication for this study is that
there was very precise item parameter estimates and other psychometric qualities
estimated on this study.
Limitations of the Study
1. This study is limited to one parameter PCM. This studies only b and no study of
item discrimination was carried out.
2. Relevant literatures to this study were obtained from foreign studies. This is
because item response theory researches are not yet common in Africa. Therefore
the peculiarities of partial credit model to African sub region (if any) could not be
ascertained since IRT researches are relatively new in this region.
3. Also, many relevant journals in the internet are to be exorbitantly subscribed to
before gaining assess to them. Therefore, the relevant literature consulted were
only the ones that the researcher could subscribe to and the ones that are of free
assess.
4. Softwares for the analysis of item response theory researches are not common in
Nigeria. The analysis of this study was done only in one of the few analysis
centres available in Nigeria.
5. It was impossible to retrieve the psychometric properties of the examination
bodies (WAEC and NECO) because they are classified information. Otherwise

101
this study would have compared the psychometric values obtained to that
obtained by the exam bodies.
Recommendations
The following general recommendations were made based on the results of this
study.
1. Psychometricians, test developers, teachers and other persons involved in any kind of
measurement should be trained in item response theory framework. This will enable
the advantage of the framework and its overall essence to be appreciated and
popularized in our local situation.
2. The government, ministries of education and high profile stakeholders in education
should procure the various IRT analytical software and sponsor the training of
individuals to learn the analysis using IRT framework. This way, the framework
would have been popularized and the interpretation of the results and usage of the
framework will thus be demystified.
3. Given the obvious advantages of IRT over other popular measurement framework,
the government should encourage our examination bodies such as WAEC, NECO,
NABTEB, NTI etc to adopt this measurement framework. This will ultimately
surmount the measurement problems we frequently encounter in Nigeria. Such
measurement problem as test score equating has nearly gone into extinction in the
foreign countries that have adopted the IRT measurement framework. IRT framework
can also do the magic for us in Nigeria.
4. Teachers in institutions of higher learning in Nigeria should be oriented on the usage
of IRT for psychometric analysis of their examinations. This way the quality of our
test items in such institution will get more refined and measurement problems
associated with the presently used framework will get obliterated.
Suggestions for Further Studies
This study – Psychometric Analysis of WAEC and NECO practical physics
examinations using Partial Credit Model – has the following suggested areas for further
research.
1. Items of physics theory (paper 3) has to be investigated using partial credit model
for the exam bodies such as WAEC, NECO etc.

102
2. Items of other subjects that are polytomously scored should be investigated using
the partial credit model.
3. The ability estimates of examinees in partial credit analyses should be studied.
4. Psychometric analysis of WAEC, NECO, NABTEB etc of practical physics items
other than those done in this study could be investigated.
5. This study can as well be subjected to generalized partial credit model analyses
6. Every other suggestion for further research can as well be subjected to
Generalized Partial Credit Model analyses.
Summary of the Study
West African Examination Council and National Examination Council are two
foremost examination bodies in secondary schools in Nigeria. In part, their responsibility
is assessing the psychomotor aspects of objectives achieved by students while undergoing
through the secondary school science curriculum. As ultimate test developer and agency
responsible for testing the psychomotor or practical aspect of secondary school sciences,
it is required that they employ best practices in practical test psychometric analysis. This
is by way of jettisoning of psychometric analysis saddled with frequent measurement
problems. The modern measurement framework that would reduce measurement
problems to the barest minimum is needed for psychometric analyses of items of these
vital and ultimate examining bodies especially in sciences that are needed to move the
nation to technological realm.
This study – the psychometric analysis of WAEC and NECO practical physics
examinations using Partial Credit Model –was purposed towards analyzing the items of
practical physics examination using the item response theory model. But because the
items of the practical physics examination are polytomously scored, the study had to use
the modern measurement theory IRT model for polytomously scored items -The Partial
Credit Model. This analysed various psychometric properties of practical physics
examination of WAEC and NECO for years 2011 and 2012 (internal) examinations.
In an attempt to sharpen the focus and have a guided direction for this study, a lot
of literature was reviewed on IRT generally and on work done using partial credit
analysis. This way the psychometric qualities such as SEM, item difficulty, fit analyses
etc possible with IRT researches were noted and the method used in their analysis

103
comparison and testing significance related to them were also noted. The works that have
been done using partial credit model were all foreign studies such as Lian and Idris
(2006), Opsomer et al (2002) etc. The studies that utilized item response theory format in
Nigeria used one or more of dichotomous model of IRT e.g. Obinne (2008), Nkpone
(2001), Akindele (2004). Nkpone (2001) happened to have done IRT study in physics but
then he used the dichotomously scored model of IRT 1,2,3 parameter logistic model in
development and standardization of physics achievement test. No study all over both
foreign and local has utilized Partial Credit Model for analysis in polytomously scored
item in physics. This made this study to be considered worthwhile.
To help in carrying out the study on psychometric analysis of practical physics of
WAEC and NECO items, eight research questions and nine hypotheses guided the study.
The research questions verified the Standard Error of Measurement, Validity, Item
Difficulty Parameter and item proportion fit to PCM for the WAEC and NECO questions
studied. While the hypotheses tested whether is any significant difference between the
psychometric qualities of WAEC- WAEC; NECO-NECO; and NECO-WAEC questions
within the years studied.
The area of the study was Enugu State and the sample of the was six hundred and
sixty eight SS III students selected through multistage sampling procedure across three
education zones of Enugu State. The sampling technique used was random samplings,
first of education zones, of local government and then proportionate random sampling of
schools from each local government in the selected education zones. The instruments
used for the study are 2011 and 2012 practical physics questions of WAEC (PPQW) (1
and 2) and 2011 and 2012 practical physics questions of NECO (PPQN) (1 and 2). The
data collected in this study were analysed using maximum likelihood estimation
procedure of WINSTEP Computer Programme of PCM analysis and the hypotheses were
tested using SPSS computer programme.
The results of the study are as follows:
1. Based on Partial Credit model, the items of NECO practical physics tests has very
low SEM and consequently reliable.
2. Also, based on the PCM, the items of WAEC practical physics tests has low SEM
and as a result are highly reliable.

104
3. The validity of items of the practical physics tests conducted by NECO is
discovered in this study to be sufficiently high.
4. The validity of items of WAEC practical physics tests using partial credit model
is very high
5. The items of NECO practical physics tests had difficulty parameters estimate
within the acceptable range that indicate that the items are of moderate difficulty
6. Item difficulty parameter estimates of WAEC practical physics tests were also
estimated in this model within the range that is acceptable and which showed that
item difficulty indices are of moderate difficulty.
7. Each of the two NECO tests studied had the item proportion fit to partial credit
model at 0.92.
8. WAEC 2011 and WAEC 2012 practical physics items had 0.92 each (as well) as
their item proportion fit to partial credit model.
9. There is significant difference in the standard error of measurement in the
practical physics tests conducted by NECO
10. There is no significant difference in the standard error of measurement in the
practical physics tests conducted by WAEC
11. (i) There is no significant difference in the SEM of NECO 2011 and WAEC 2011
conducted practical physics tests (ii) There is no significant difference in the SEM
of NECO 2012 and WAEC 2012 practical physics tests.
12. There is no significant difference in the validities of practical physics tests
conducted by NECO
13. There is no significant difference in the validities of practical physics tests
conducted by WAEC.
14. (i) There is no significant difference in the validities of NECO 2011 and WAEC
2011 conducted practical physics tests. (ii) There is no significant difference in
the validities of NECO 2012 and WAEC 2012 conducted practical physics tests.
15. There is no significant difference between the difficulty indices of NECO
practical physics tests.
16. There is no significant difference between the difficulty indices of WAEC
practical physics tests.

105
17. (i) There is no significant difference between the difficulty indices
of NECO 2011 and WAEC 2011 practical physics tests. (ii) There is no
significant difference between the difficulty indices of NECO 2012 and WAEC
2012 practical physics tests.
In summary, the following were inferred from results of the study:
(i) The items of WAEC and NECO practical physics examination both have very
low SEM and high reliability.
(ii) The items of both exam bodies are of high validity as indicated by fit statistics
(iii) The item difficulty estimates of WAEC and NECO practical physics both
consistently demonstrated moderate difficulty
(iv) High proportion of both WAEC and NECO practical physics items had good
fit to PCM.
A close look at the result of the hypothesis tested indicated that NECO item had
significant difference between their various years examination in SEM. The item
difficulties and fit statistics of NECO exams had no significant difference. Exactly, the
same results apply to WAEC items, fit statistics and item difficulty as it applies to
NECO. On comparison of NECO; WAEC; NECO - WAEC items consistently showed no
significant difference in the SEM, fit statistics, item difficulty. NECO and WAEC were
therefore intra and inter-related in their psychometric qualities the years studied.
In conclusion, therefore,
(1) The close relationship among psychometric qualities of WAEC and NECO items
will elevate the trust and confidence of the public the in these two examination
bodies.
(2) The test developers can comfortably explain examinees behaviour in testing
situation. This also has a far reaching implication for the guidance counsellors.
(3) It is recommended that examination bodies should adopt IRT framework and have
our measurement problems reduced to the barest minimum.
(4) Teachers, psychometricians, and other stakeholders in measurement should
procure IRT software analysis programme and have the people involved
sponsored in the training. This will enable interpretation and consequent

106
appreciation of the IRT framework advantages over other measurement
framework.

107
References Agwagah, U.V. (1985). The Development and Preliminary Validation of an Achievement
Test in Mathematics Methods. M.Sc. Dissertation. University of Nigeria. Akindoju A.O. and Bamjoko, S.O. (2010). Perceived Roles of ICT in the implementation
of Continuous Assessment in Nigeria Schools. African Journal of Teacher Education, 1(1): 78-90.
Akinlele, P.B. (2004). The Development of Item Bank for Selection Test into Nigeria
Universities. Unpublished Ph.D Thesis Institute of Education. University of Ibadan.
Allen, M.J. and Wendy, M. (1979). Introduction to Measurement Theory. California:
Wadsworth Inc. Ali, A.A. (1996) Fundamentals of Research in Education .Meks Publishers . Awka,Nigeria. Andrich, D. (1978). Application of psychometric model to ordered cathegories which are scored with successive integers. Applied
Psychological Measurement, 2: 581-594. Andrich, D. (1988). Rasch Models for Measurement. Newbury Park C.A: Sage. Baker, F. (2001). The Basics of Item Response Theory. Eric Clearing House on
Assessments and Evaluation. University of Maryland College. Park M.D. Baker, F.B. (1977). Advances in Item Analysis. Review of Educational Research 47: 151-
178. Bandele, S.O. (2002). Administration of Continuous Assessment in Tertiary Institutions
in Nigeria. Journal of Educational Foundation and Management, 1(1): 289-296. Baumgartner, T.A. (2002). Conducting and reading research in health and human
performance (3rd ed.). McGraw Hill high education. New York. Blogspot (2009). Role of Education in National Development.
http://collegerajpura.blogspot.com/2009/01/roleofeducationfornational development html.
Bock, R.D. and Aitken, M. (1981). Marginal Maximum Likelihood Estimation of Item
Parameters. Application of an EM Algorithm Psychometrica, 46: 443-459. Bond, T.G. and Fox, C.M. (2001). Applying the Rasch Model Fundamental Measurement
in Human Sciences. New Jersey: Lawrence Erlbaum Associates.
136
109

108
Bryce, T.K. (1981). Rasch fitting. British educational research journal. 7(2): 137-153. Carlson, J.E. (1993). Dimensionality of NAEP Instruments that Incorporate Polytomously
Scored Items. Paper Presented at the Annual Meeting of American Educational Research Association. Atlanta.
Carduff, J. and Reid, N. (2003). Enhancing Undergraduate Chemistry and Physics
Laboratories, Pre-Laboratory and Post Laboratory Exercises. Education Department, Royal Society of Chemistry, Burlington House, Picadilly, London.
Cookie, D. and Michie, C. (1997).An Item Response Theory Analysis of the Hare
Psychopathy Checklist. Psychological Assessment, 9:3-14. Curtis D.D and Boman P (2007). X-ray your Data with Rasch. International Journal of
Educational Research. Shannon Research Press. 8 (2) 249-259. http://iej.com.au. Eckes,T. (2011) Item Banking for Tests. A polytomous Rasch Modelling
Approach.http://www.ondaf.de/gast/ondaf/info/documente/PTAM-53.pdf downloaded on 20/06/2013.
Egbugara, O.U. (1989). An Investigation of Aspects of Students Problem Solving
Difficulties in Ordinary Level Physics. Journal of Science Teachers Association of Nigeria, 26(1): 25.
Embreston, S.E. and Reise, S.P. (2000). Item Response Theory for Psychologists. Mahwah, New Jersey: Lawrence Erlbaum Associates Fan, X. (1998). Item Response Theory and Classical Test Theory: An Empirical
Comparison of their Item/Person Characteristics. Educational and Psychological Measurement, 58(3): 357-382.
Federal Republic of Nigeria (2008). National Policy on Education. Nigeria, National
Educational Research Council NERC Press. Flannery, W.P., Reise, S.P. and Widaman, K.F. (1995). An Item Response Theory
Analysis of the General Academic Scales of Self Description Questionnaire II. Journal of Research in Personality, 29: 168-188.
Gronlund, N.E. (1976). Measurement and Evaluation in Teaching. Macmillan
Publishing Co. London. Haliday, W and Patridge, A (1979). Differential Sequencing Effects of test items on
Children. Journal of Research in Science teaching 16(5) 407-411. Hambleton, R.K. and Jones, R.W. (1993). Comparison of Classical Test Theory and Item
Response Theory and their Applications to Test Development. Educational Measurement. Issues and Practice 12(3): 38-47.

109
Hambleton, R.K. and Swaminathan, H. (1985). Item Response Theory. Principles and
Applications. Boston: Kluwer. Hambleton, R.K., Swaminathan, H. and Rogers, H.J. (1991). Fundamentals of Item
Response. Theory. Newbury Park, CA: Sage Hamilton, W.L., Cook, J.T., Thompson, W.W., Buron, F.L., Olson C.M, Frungillo, E.A.,
and Wehler, C.A. (1997b). Household Food Security in 1995: Technical Report on Food Security Measurement Project. Washington D.C. U.S Department of Agriculture Food and Consumer Service. September.
Harbor-Peters, V.F.A. (1999). Noteworthy Points on Measurement and Evaluation. Snaap Press Ltd. Enugu. Hugh, H. and Ferrara, S. (1994). A Comparison of Equal Percentile and Partial Credit
Equating for Performance Based Assessment Composed of Free Response Items. Journal of Educational Measurement, 31: 125-141.
Idowu, I.A. and Esere, O.M. (2009). Assessment in Nigeria Schools: A Counsellors
Viewpoint. Edo Journal of Counselling, 2(1); http://www.ajol.info/index.php/ejc/article/view/52650/4/254.
International Centre for Education Evaluation (ICEE) (1982). A conference on priorities
in Educational Research in Nigeria. Institute of Education University of Ibadan. Izard, J. F.(nd). Trial Testing and Item Analysis in Test Construction in Quantitative
Research Methods in Educational Planning. In N.K. Ross (ed.) (online) http://www.scameg.org/downloads/modules/module7.pdf. Retrieved on 7/2/2012.
Izard, J.F. and White, V.D. (1980). The use of Latent Trait Model in the Development and
Analysis of Classroom tests. In D. Spearitt (Ed.). The Improvement of Measurements in Education and Psychology: Contribution of Latent Theories. Australian Council for Education Research ACER.
Justice, L.M., Bowles, R.P. and Skibbe, L.E. (2006). Measuring Preschool Attainment of
Print Concept Knowledge. American Journal of Language, Speech and Hearing Services in schools, 37: 224-235.
Kerlinger, F.N. and Lee, H.B. (2000). Foundations of Behavioural Research.
Philadelphia. Harcourt College Publishers. Kirschner, P.A. and Meester, M.A. (1988). “Problems, Premises and Objectives of
praticals in higher Education” The laboratory in higher science education journal. 17: 81-98.

110
Korashy, A.F. (1995). Applying the Rasch Model to Selection of Items for a Mental Ability Test. Educational and Psychological Measurement, 55(5): 753-763.
Lawley, D.N. (1944). On Problems Connected with Item Selection and Test Construction
in Baker, F.B. 1977, Advances in Item Analysis. Review of Educational Research, 47: 151-158.
Lian, H. and Idris. N. (2006). Assessing Algebraic Solving Ability of Form Four
Students. International Electronic Journal of Mathematics Education, 1(1):55-76. Available on line www.iejme.com.
Linacre J.M (1994) Sample size and Item Calibration Stability. Rasch Measurement
Transactions 7.(4) p.328.Available online http://www.rasch.org/rmt/rmt74m.htm Linacre J.M (1999) Investigating Rating Scale Category Utility Journal of Outcome
Measurement 3:2,103-122. Linacre J M (2002) Understanding Rasch Measurement: Optimising Rating Scale
Category effectiveness. Journl of Applied Measurement 3:1 85-106 Linacre J.M (2007) Minimum Sample Size: Rasch Measurement Forum-Winstep.
http://www.winstep .com/cgi-local/forum/B/ar.pl?b-cc/m-1174678456/ downloaded on 20/6/2013.
Linden, W.J. and Hambleton, R.K. (1997). (Eds.) Handbook of Modern Item Response
Theory. New York, NY: Springer-Verlag. Lord, F.M. (1952). A Theory of Test Scores. Psychometric Monograph, p .7. Lord, F.M. (1953). The Relation of Test Scores to the Trait Underlying the test.
Educational and Psychological Measurement, 13: 517-548. Lord, F.M. (1980). Applications of Item Response Theory to Practical Testing Problems.
Hillsdale, New Jersey: Lawrence Erlbaum Associates, Inc. Lord, F.M. and Norvick, M.R. (1968). Statistical Theories of Mental Test Scores.
Readings M.A; Addison. Wesley. Maduagwu, S.N. (2008). Development of Education in Nigeria - Past Present and Future. http://subsite.icu.ac.jp/iers/download/maduagwu_31008 pdf. Masters, G.N. (1982). A Rasch Model for Partial Credit Scoring. Psychometrica, 47(2):
150. Masters, G.N. (1988). The Analysis of Partial Credit Scoring. Applied Measurement in
Education. Lawrence Erlbaum Associate Inc. 1(4) 279-297.

111
Masters, G.N. and Wright, B.D. (1997). The Partial Credit Model. In W.J. Vander,
Linden and R.K. Hambleton (Eds). Handbook on Modern Item Response Theory, pp. 101-121.
Mehrens, W.A. and Lehmann, I.I. (1978). Measurement and Evaluation in Education and
Psychology (2nd ed). New York: Holt, Rinchart and Winton. Mellenbergh, G.J. (1994). A Unidimensional Latent Trait Model for Continuous Item
Responses. Multivariate Behavioural Research, 29: 223-236. Miller, G., Frank, D., Franks, R and Eheltor, C. (1989). Non Cognitive Criteria for
Assessing Students in North American medical Schools. Acad. Med. 64: 42-45. Michell, J. (1990). An Introduction to the Logic of Psychological Measurement.
Hillsdale, N.J: Lawrence Erlbaum. Muraki, (1992). A Generalized Partial Credit Model: “Application of an Em Algorithm”
Applied Psychological Measurement, 16(2): 159-176. Ndalichako, J.L and Rogers, W.T. (1997). Comparison of finite state scores theory,
classical test theory and item response theory in scoring multiple test items. Educational and Psychological Measurements, 57, 580-589.
NECO (2001). Fact about National Exmaination Council (NECO) Minna (Nigeria). Nenty, H. (2004). Designing Measurement Instruments for Assessment and Research in
Education. A Paper for Publication in a Book Series by Akwa Ibom State College of Education Afaha NSIT AKS Nigeria.
Nenty, H.J. (2005). Item Response Theory: Quality Enhancing Measurement Technique in Education. Nkpone, H.L. (2001). Application of latent trait models in the development and
standardization of a physics achievement test for senior secondary schools. Unpublished Ph.D Thesis, University of Nigeria.
Nwana, O.C. (1979). Measurement and Evaluation for Teachers. Objectives in
Education. Nelson Africa. Hong Kong. Nworgu, B.G. (1985). The Development and Preliminary Validation of Physics
Achievement Test (PAT). MSc Dissertation (unpublished). University of Nigeria. Nworgu, B.G. (1992). Ed. Educational Measurement and Evaluation Theory and
Practice; University Trust Publishers Nsukka.

112
Nworgu, B.G. (ed.) (2003). Educational Measurement and Evaluation. University Trust Publishers Nsukka.
Nworgu B.G. and Agah J.J. (2012). Application of three parameter logistic
model in the Calibration of a mathematics Achievement Test. Journal of
Educational Assessment in Africa 29 (7) 162 – 172.
Obinne, A.D.E. (2011). Psychometric Analysis of Two Major Examination
in Nigeria: Standard Error of Measurement. International Journal of Educational Sciences, 3(2): 137-144. Also available at – http://www.Krepublisher.com.102-journals/IJES/11JES.03000-11-web/IJES. Retrieved on 1/6/2012.
Obinne, A.E. (2008). Comparison of Psychometric properties of WAEC and NECO test
item under item response theory. Unpublished Ph.D Thesis, University of Nigeria, Obioma, G. (1985). Development and Validation of a Diagnostic Mathematics
Achievement Test for Nigeria Secondary School Students. Unpublished Ph.D Thesis. University of Nigeria.
Ojerinde D.P. and Bayeneho P. (2012). A Comparison between Classical
Test Theory and Item Response Theory: Experience from 2011 Pre-Test in the
Use of English Paper of the Unified Tertiary Matriculation Examination (UTME)
Journal of Educational Assessment in Africa 29 (7) 173 – 191.
Onwuka, U. (1981). Curriculum Development for Africa. Africana FEP Publishers Ltd. Nigeria.
Opsomer, J.D., Jesnen, H.H., Nusser, S.M., Dregnei, D., Amemiya, Y. (2002). Statistical
Considerations for the USPDA Food Insecurity Index. www.card.iastate.edu.downloadded on 14th Aug. 2011.
Ostini, R. and Nering, M.L. (2006). Polytomous item response theory models.
Quantitative applications in social sciences international educational and professional publishers. London, New Delhi.
Osunde, (1997). Measurement of Educational Objectives. In S.A. Madinde (ed.)
Educational theory and Practice in Nigeria. Lagos. New Era Publications 67-73. Oyesola, S.E. (1986). Guidance for 6-3-3-4 System of Education. A new Approach:
Ibadan. University press ltd.
Odili J.N. (2010): Effect of Language Manipulation on Differential Item

113
Functioning of Test Items in Biology in a Multicultural Settings Journal of
Educational Assessment in Africa 27 (4) 269 – 286.
Pido S. (2010). Comparison of Item Analysis of Uganda Certificate of Education results obtained using IRT and CTT approaches. Journal of Educational Assesment in Africa. (30) 29 (7) 59-67 Rasch, G. (1960). Probabilistic Models for some Intelligent and Attainment Tests: Chicago: MESA press ltd. Reeve, B.B. (1986). An Introduction to Modern Measurement Theory:
http//appliedresearch.a.a.ncer.gov/areas/cognitive/immt. Pd. Samejina, F. (1969). Estimation of latent ability using a response pattern of graded
scores. Psychometrika monographs, 34(4pt 2) No 17). Schumacker, R.E. (2009). Classical Item Analysis International. Journal of Educational
and Psychological Assessment, 1(1) Seema, V. (nd.) Preliminary Item Statistics using Point Biserial Correlation and P.
Values. (Online) Available at http://www.eddata.com/resources/publicatwas/EDSpoint_Biserial.pdf. Retrieved on 7/2/2012.
Siaisang, FT. and Nenty H.J. (2012): Differential Functioning of 2007
TIMSS Examination Items: A Comparative consideration of Students
performance in Botswana, Singapore and USA. Journal of Educational
Assessment in Africa (30) 29 (7) 30 – 42.
Smith, R.M. (1996). A Comparison of the Rasch Separate Calibration and between Fit
Models of Detecting Item Bias. Educational and Psychological Measurements 55(3): 4032-417.
Stanley J.C (1964) Measurement in Today’s Schools . Prentice-Hall Inc. Engle Cliffs,
New Jersey. Steinberg, L. and Thissen, D. (1995). Item Response Theory in Personality Research. In
P.E. Shrout nd S.T. Fiske (Eds.), Personality Research Methods and Theory: A Festschrift Honouring Donald W. Fiske 161-181 Hillsdale NJ: Erlbaum.
Tang, R.L. (1996). Test of English as Foreign Language Monograph Series, “Polytomous
Item Response Theory Models and their Applications in Large Scale Testing Programme”. Education Testing Service, Princeton, New Jersey.

114
Thissen, D., Nelson, I., Billeaud, K. and McLeod, L. (2001). Chapter 4-Item Response Theory for Items Scored in more than one Categories in D. Thissen and H. Wainers (Eds.) Test Scoring, Hillsdale, N.: Lawrence Erlbaum Associates.
Thissen D and Orlando M (2001). Chapter 3-Item Response Theory for items scored in
two categories.In Thissen D and Wainer H(Eds), Test Scoring, Hillsdale, N.J. Earlbaum.
Thurstone, L.L (1925) A method of scaling psychological and educational tests. Journal of educational psychology 16,433-451.
Ugodulunwa, C.A. and Mutsapha A.Y. (2011): Using differential Item
Functioning. Analysis for improving Quality of State Wide Examination in
Nigeria. Journal of Educational Assessment in Africa 28(5) 241 – 252.
WAEC (2009). Regulation and Syllabus. West African Book Publishers Ltd. Lagos.
Wallace, C.S., Prather, E.E., Duncan, D.K. (2012). A Study of General Education
Astronomy Students Understanding of Cosmology. Part III: Evaluating Conceptual Cosmology Surveys. An Item Response Approach. The American astronomical Society.
Weiss, D.J. (1995). Improving Individual Differences Measurement with Item Response
Theory and Computerized Adaptive Testing. In D.J. Lubinski and R.V. Davis (Eds.) Assessing Individual Differences in Human behaviour: New Concepts, Methods and Findings (pp. 49-79). Palo Alto CA: Davis-Black Publishing.
West African Examination Council (2002). West African Book Publishers Limited
Lagos. Wright, B.D. (1997). A History of Social Science Measurement, Educational
Measurement, Issues and Practice, 16: 21-33. Wu, M. and Adams, R. (2007). Applying the Rasch model to psycho-social
measurements. A practical approach educational measurement solutions, melbourne.
Yen, M.W. (1993). Scaling performance Assessments: Strategies for Managing Local
Item Dependence. Journal of Educational Measurement, 30: 187. Yoloye, T.W. (2004). That We May Learn Better. Ibadan Stirling Hordon Publishers Ltd.

115

116

117

118
APPENDIX B
Department of Science Education, University of Nigeria, Nsukka. 13 April 2013.
The Principal/Head Physics Teacher, Dear Sir/Madam, REQUEST TO USE YOUR PHYSICS LAB AND SS III PHYSICS STUDENTS AND TEACHER FOR Ph.D STUDIES I am a post graduate student of department of Science Education, University of Nigeria. In partial Fulfillment of the requirement of the course Ed. 690, I am carrying out an instrumentation research in which I will do a psychometric analysis of NECO and WAEC practical physics Tests (internal) for years 2011 and 2012 questions. I humbly request that you grant me access to your physics laboratory (equipment), SS III physics teacher (s) and students. The equipment will be used to conduct the practical questions that formed the instrument of the study, the physics teacher will help the researcher and his assistants in conducting the practicals (study), and the SS III students will help to carry out the practical activities and respond to the items in the instrument. Thank you so much in anticipation of your approval, cooperation and assistance.
Yours faithfully, Adonu, I. Ifeanyi PG/Ph.D/08/49721

119
APPENDIX C
Practical Physics Questions of NECO 1 (PPQN 1)
SENIOR SCHOOL CERTIFICATE EXAMINATION (INTERNAL) NATIONAL EXAMINATION COUNCIL (NECO)
JUNE/JULY 2011 1(a)
Using Fig (1) (a) above as a guide, carry out the following instructions.
(i) Place the metre rule provided on the knife-edge and adjust its position until it
balances horizontally.
(ii) Read and record the point of balance G of the metre rule
(iii) Suspend a mass M1 = 100g at A, a distance y = 5cm from the 0cm mark of the
metre rule.
x1 y G K1
0cm 100cm
Fig (1) (a) m1
G K2
x2 y
100cm 0cm
m2
Fig (1) (b)

120
(iv) Balance the whole arrangement horizontally on the knife-edge as shown in the
diagram above.
(v) Read and record the position of the knife edge K1. Also record the length K1A =
x1.
(vi) Repeat the procedure for values of y = 10, 15, 20 and 25cm respectively. In each
case, record the corresponding values of K1 and x1.
(vii) Repeat the entire procedure with a mass M2 = 150g suspended at distance y =
5.10, 15, 20 and 25cm as shown in fig 1(b). In each case, record the
corresponding values of K2 and x2.
(viii) Tabulate your readings in the space provided below:
(ix) Plot a graph of x1 on the vertical axis and x2 on the horizontal axis, starting both
axes from the origin (0,0).
(x) Determine the slope S of the graph.
Slope of graph, S.
(xi) Evaluate : = ; <=; =
(xii) State TWO precautions taken to ensure accurate results.
(b)(i) State TWO conditions that are necessary for a body to be in equilibrium under
three non-parallel, coplanar forces.
(ii) a uniform metre rule balances horizontally on a knife edge at the 15cm when a
mass of 350g is suspended at the zero cm mark. Calculate the mass of the metre
rule.

121
2(a)
(i) Trace the outline ABCD of the glass block on a sheet of paper as shown
above. Remove the block.
(ii) Mark a position N very close to A and draw a normal MNR at N.
(iii) Draw a line TN making an angle I = 20o with MN and produce it to meet DC
at Y.
(iv) Fix two pins at points P1 and P2 along the TN.
(v) Replace the block on its outline and fix two other pins at points P3 and P4 such
that the pins appear to be in a straight line with the images of the pins at P1
and P2 when viewed through the side DC of the glass block.
(vi) Remove the block and join the points at P3 and P4 producing the line to meet
DC at X.
(vii) Join NX.
(viii) Draw a line XZ = d perpendicular to NY.
(ix) Measure the record the angle of refraction r and the distance d. Evaluate sin (i-
r) and dcos r.
(x) Repeat the procedure for I = 25o, 30o and 40o respectively. In each case,
measure and record the corresponding values of r and d. Also evaluate sin (i-r)
and dcos r. Tabulate your readings in the space provided below.
P2
T
M P1
N i
B A
r
Z R
d
C
C Y P3
X D
P4

122
(xi) Plot a graph of dcos r on the vertical axis and sin (i-r) on the horizontal axis,
starting both axes from the origin (0,0).
(xii) Determine the slope S of the graph
Slope of graph, S =
(xiii) State TWO precautions taken to ensure accurate results.
b(i) State Snell’s law of refraction of light.
(ii) An object lies at the bottom of a pool of water 80cm deep. If the refractive index
of water is 1.33, calculate the apparent upward displacement of the object when
viewed vertically from above.
3(a)
(i) Measure and record the e.m.f E of the battery provided.
(ii) Connect the circuit as shown in the diagram above.
(iii) For a length C1C2 = L = 100cm of the wire P, close the key K.
(iv) Read and record the ammeter reading I.
(v) Evaluate > = ?@
(vi) Repeat the procedure for values of L = 90, 80, 70, 60 and 50cm respectively.
In each case, read and record the corresponding values of I. Also evaluate
> = ?@
Tabulate your readings in the space provided below.
(vii) Plot a graph of Q on the vertical axis and L on the horizontal axis, starting
both axes from the origin (0,0).
Determine the slope S of the graph and intercept C on the vertical axis.
Slope of graph, S =
P
2Ω
C2 C1
A
K

123
(viii) Evaluate K = C – 2.
(ix) State TWO precautions taken to ensure accurate results.
b(i) Define the internal resistance of a cell.
(ii) Given that > = A.B"C
D L + C
in the experiment above, use your graph to determine the value of A.

124
APPENDIX D
Practical Physics Questions of NECO (PPQN 2)
SENIOR SCHOOL CERTIFICATE EXAMINATION (INTERNAL) NATIONAL EXAMINATION COUNCIL (NECO)
JUNE/JULY 2012
PHYSICS (PRACTICAL) PHYSICS PAPER 1 (1)
(i) Place the metre rule provided on the knife edge and adjust its position until it
balances horizontally.
(ii) Read and record the point of balance G of the metre rule. Keep the knife edge at the
point G throughout the experiment.
(iii) Suspend the mass labelled M at P, the 25cm-rnark' of the metre rule, determine and
record the length PG = D.
(iv) On the other side of G, suspend the mass m = 30g and adjust its position until the
metre balances horizontally as shown in the diagram above.
(v) Read and record the position R, the point of suspension of m
(vi) Record the value of m. Also determine and record the length GR = d.
(vii) Evaluate d-1
(viii) Keeping the mass M at P, the same 25cm mark, repeat the procedure for mass m =
40. 50, 60, 70 and 80g to determine R. In each case record the values of m and (the .
corresponding distance d. Also evaluate d-1. Tabulate your readings in the space
provided below.
M M
D d
25cm
G R 100 O P

(ix) Plot the graph of m on the vertical axis and d
(x) Determine the slope S of the graph
(xi) Evaluate K = D
S
(xii) State TWO precautions taken to ensure accurate results.
b (i) Define the
(ii) A uniform metre rule balances horizontally on a knife edge at 55cm mark.
When an object of mass 1.0kg is placed at the 5cm mark, it balances at 35cm mark.
Calcaulte the magnitude of the weight of the metre rule. (g = 10m
2(a)
(2) Using the
diagram above as a guide, carry out the following instructions:
(i) Place an optical pin (object) at the bottom of the measuring cylinder
(ii) Pour water of volume V = 150cm
(iii) Measure and record the real depth, OS =
(iv) Move the search pin up and down, and locate the image I. Measure and record
the apparent depth: IS = h.
(v) Repeat the procedure for V = 175, 200, 225, 250 and 275cm
measure and record the values of H and the corresponding values of h.
Tabulate your readings in the space provided below.
(vi) Plot a graph of H on the vertical axis and h on the horizontal axis.
(vii) Determine the slope S of the graph
(viii) State TWO precautions taken to ensure accurate results.
Plot the graph of m on the vertical axis and d-1- on the horizontal axis.
Determine the slope S of the graph
precautions taken to ensure accurate results.
Define the centre of gravity of a body.
A uniform metre rule balances horizontally on a knife edge at 55cm mark.
When an object of mass 1.0kg is placed at the 5cm mark, it balances at 35cm mark.
Calcaulte the magnitude of the weight of the metre rule. (g = 10m
diagram above as a guide, carry out the following instructions:
Place an optical pin (object) at the bottom of the measuring cylinder
Pour water of volume V = 150cm-2 into the measuring cylinder.
Measure and record the real depth, OS = H
Move the search pin up and down, and locate the image I. Measure and record
the apparent depth: IS = h.
Repeat the procedure for V = 175, 200, 225, 250 and 275cm
measure and record the values of H and the corresponding values of h.
late your readings in the space provided below.
Plot a graph of H on the vertical axis and h on the horizontal axis.
Determine the slope S of the graph
precautions taken to ensure accurate results.
125
on the horizontal axis.
A uniform metre rule balances horizontally on a knife edge at 55cm mark.
When an object of mass 1.0kg is placed at the 5cm mark, it balances at 35cm mark.
Calcaulte the magnitude of the weight of the metre rule. (g = 10m-2)
Place an optical pin (object) at the bottom of the measuring cylinder
into the measuring cylinder.
Move the search pin up and down, and locate the image I. Measure and record
Repeat the procedure for V = 175, 200, 225, 250 and 275cm3. In each case,
measure and record the values of H and the corresponding values of h.
Plot a graph of H on the vertical axis and h on the horizontal axis.

126
b(i) State Snell’s law of refraction
(ii) A glass of thickness t and refractive indeed n is laced on a dot of ink. If the
dot of ink is viewed through the glass, express the displacement d of the
dot in terms of n and t.
(i) Measure and record the electromotive force E of the battery provided.
(ii) Connect the circuit as shown in the diagram above.
(iii) Setting resistance box R = 1Ω, close the key. Read and record the current I on
the ammeter. Evaluate I-1
(iv) Repeat the procedure for R = 2, 3, 4 5 and 6Ω. In each case, read and record the
corresponding values of I. Also evaluate I-1
(v) Tabulate your readings in the space provided below.
(vi) Plot a graph of R on the vertical axis and 1-1 on the horizontal axis, starting both
axes from the origin (0,0).
(vii) Determine the slope S of the graph and the intercept C.
(viii) State TWO precautions taken to ensure accurate results.
b(i) Define the internal resistance of a cell.
(ii) A resistor of resistance R is connected across a cell of c.m.f. E. If the internal
resistance of the cell is one third of R. express the value of the terminal
potential different V of the cell in terms of E and R.
( )
Battery
Key
A
. . . . . . . .
. . .
. . . . . . . .
3(a)
Resistance box R

127
APPENDIX E
Practical Physics Question of WAEC 1 (PPQW 1)
WEST AFRICAN EXAMINATION COUNCIL (WAEC)
MAY/JUNE 2O11 SENIOR SCHOOL CERTIFICATE (SSCE)
PAPER 1 PRACTICAL
1(a)
You are provided with a wooden block to which a hook is fixed: set of masses, spring
balance and other necessary materials. Using the diagram above as a guide, carry out the
following instructions.
(i) Record the mass m0 indicated on the wooden block.
(ii) Place the block on the table.
(iii)Attach the spring balance to the hook.
(iv) Pull the spring balance horizontally with a gradual increase in force until the block
just starts to move. Record the spring balance reading F.
(v) Repeat the procedure by placing in turn mass m = 200, 400, 600 and 800 g on top of
the block. In each case, read and record the corresponding value of R
(vi) Evaluate M = m0 + m and R = 100
M in each case.
(vii) Tabulate your readings.
(viii)Plot a graph with F on the vertical axis and R on the horizontal axis.
(ix) Determine the slope, s, of the graph.
(x) State two precautions taken to ensure accurate results.
(b) (i) Define coefficient of the static friction.
Wooden block
Hook
Spiral spring
F
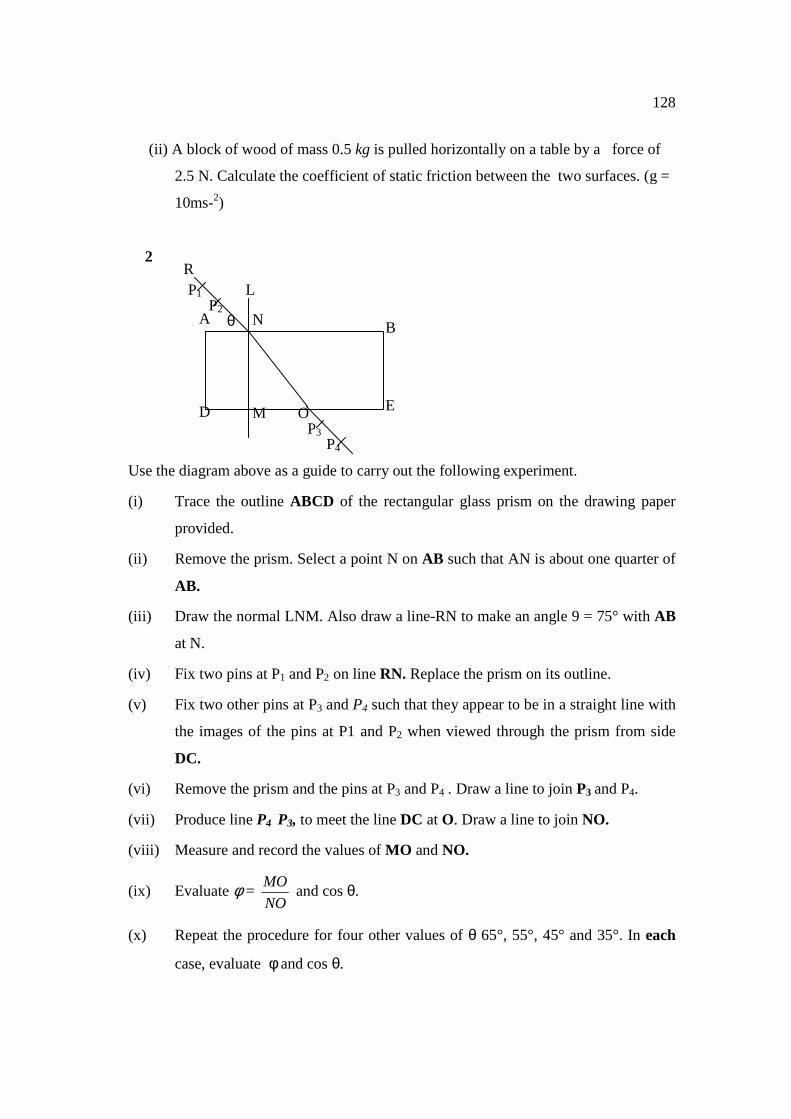
128
(ii) A block of wood of mass 0.5 kg is pulled horizontally on a table by a force of
2.5 N. Calculate the coefficient of static friction between the two surfaces. (g =
10ms-2)
2
Use the diagram above as a guide to carry out the following experiment.
(i) Trace the outline ABCD of the rectangular glass prism on the drawing paper
provided.
(ii) Remove the prism. Select a point N on AB such that AN is about one quarter of
AB.
(iii) Draw the normal LNM. Also draw a line-RN to make an angle 9 = 75° with AB
at N.
(iv) Fix two pins at P1 and P2 on line RN. Replace the prism on its outline.
(v) Fix two other pins at P3 and P4 such that they appear to be in a straight line with
the images of the pins at P1 and P2 when viewed through the prism from side
DC.
(vi) Remove the prism and the pins at P3 and P4 . Draw a line to join P3 and P4.
(vii) Produce line P4 P3, to meet the line DC at O. Draw a line to join NO.
(viii) Measure and record the values of MO and NO.
(ix) Evaluate φ = NO
MO and cos θ.
(x) Repeat the procedure for four other values of θ 65°, 55°, 45° and 35°. In each
case, evaluate φ and cos θ.
L
N B
E M D
A θ
R P1
P2
P3 P4
O

(xi) Tabulate your readings.
(xii) Plot a graph with cos
(xiii) Determine the slope,
(xiv) State two precautions taken to ensure accurate results'
(b) (i) State Snell 's law of refraction.
(ii) Calculate the critical angle f
above if its refractive index is 1.5.
3(a)
You are provided with cells, a potentiometer, an ammeter, a voltmeter, a bulb. a key, a
jockey and other necessary materials.
(i) Measure and record the emf E of the battery.
(ii) Set-up a circuit as shown in the dia
(iii) Close the key K and use the jockey to make a firm contact at J on the potentiometer
wire such that PJ = x =
(iv) Take and record the voltmeter reading
(v) Evaluate log V and log I
(vi) Repeat the procedure for other values of
(vii) Tabulate your readings.
(viii) Plot a graph with 1og1 on the vertical axis and log V on the horizontal axis.
(ix) Determine the slope, s. of the graph.
(x) Determine the intercept, c, on the vertical axis.
(xi) Slate two precautions taken to ensure accurate results.
Tabulate your readings.
Plot a graph with cos θ on the vertical axis and φ on the horizontal axis,
Determine the slope, s, of the graph.
precautions taken to ensure accurate results'
Snell 's law of refraction.
(ii) Calculate the critical angle for the glass prism used in the
above if its refractive index is 1.5.
You are provided with cells, a potentiometer, an ammeter, a voltmeter, a bulb. a key, a
jockey and other necessary materials.
Measure and record the emf E of the battery.
a circuit as shown in the diagram above.
Close the key K and use the jockey to make a firm contact at J on the potentiometer
= x = 10 cm.
Take and record the voltmeter reading V and the corresponding ammeter reading
Evaluate log V and log I
Repeat the procedure for other values of x = 20, 30, 40, 50 and 60 cm.
Tabulate your readings.
Plot a graph with 1og1 on the vertical axis and log V on the horizontal axis.
Determine the slope, s. of the graph.
Determine the intercept, c, on the vertical axis.
precautions taken to ensure accurate results.
129
on the horizontal axis,
r the glass prism used in the experiment
You are provided with cells, a potentiometer, an ammeter, a voltmeter, a bulb. a key, a
Close the key K and use the jockey to make a firm contact at J on the potentiometer
ing ammeter reading
= 20, 30, 40, 50 and 60 cm.
Plot a graph with 1og1 on the vertical axis and log V on the horizontal axis.

130
b(i) How is the brightness of the bulb affected as x increase? Give a reason for
your answer
(ii)List the electrical devices whose actions do not obey ohm’s law.

131
APPENDIX F
Practical Physics Questions of WAEC 2 (PPQW 2) WEST AFRICAN EXAMINATION COUNCIL (WAEC)
MAY/JUNE 2012 SENIOR SCHOOL CERTIFICATE (SSCE) PAPER 1-PRACTICAL
1(a)
Study the diagrams beside and use them as guides in carrying out the following ins-
tructions.
(i) Using the spring balance provided, determine the weight of object of mass M=
50.0g.in air Record this weight as W2
(ii) Determine the weight of the object when it is completely immersed in water
contained in a beaker as shown in the diagram above. Record the weight as
W3
(iii) Determine the weight of the object when it is completely immersed in the
liquid labelled L. Record the weight as W3
(iv) Evaluate U = (W1 – W2) and V = (W1 – W3).
(v) Repeat the procedure with the objectives of masses M = 100g, 150g, 200g and
250g.
(vi) In each case, evaluate U = (W1– W2) and V = (W,- W,).
(vii) Tabulate your readings
(viii) Plot a graph with V on the vertical axis and U the horizontal axis.
(ix) Determine the slope, s, of the graph.
(x) State two precautions taken to ensure accurate results.
b. (i) State Archimedes principle.
support pointer spiral spring balance
M
beaker
object water
M
support pointer spiral spring balance
beaker
object liquid L

(ii) A piece of brass 20.0g is hung on a spring balance from a rigid support and
completely immersed in kerosene of density 8.0 x 10
reading on the sp
(i) Pull the piston of the syringe, upward until it can no longer move.
(ii) Read and record this position of the piston on the graduated mark on the syringe
as V0
(iii) Clamp the syringe and ensure that it is vertical.
(iv) Place a mass M = 500g gently at the centre of the pertri
(v) Read and record the new position of the piston as V. (v) Evaluate V
(vi) Repeat the procedure for four other values of M = l00g, 150
(vii) Tabulate your readings.
(viii) Plot as graph with V
both axes from the origin (0,0).
(ix) Determine the slope, s of the graph.
(x) Evaluate k = s-1
(xi) State two precautions taken to ensure a
(b) (i) When a weight is placed on the petri
syringe (∝) increases; (
(ii) What is responsible for the pressure exerted by a gas in a closed vessel?
(ii) A piece of brass 20.0g is hung on a spring balance from a rigid support and
completely immersed in kerosene of density 8.0 x 10²kgm-3. Determine the
reading on the spring balance. (g = 10ms-2, density of brass =8.0 x l0kgm
Pull the piston of the syringe, upward until it can no longer move.
Read and record this position of the piston on the graduated mark on the syringe
Clamp the syringe and ensure that it is vertical.
Place a mass M = 500g gently at the centre of the pertri-dish.
Read and record the new position of the piston as V. (v) Evaluate V
Repeat the procedure for four other values of M = l00g, 1500g, 2000g and 2500g
Tabulate your readings.
Plot as graph with V-1 on the vertical axis and M on the horizontal axis, starting
both axes from the origin (0,0).
Determine the slope, s of the graph.
precautions taken to ensure accurate results.
(b) (i) When a weight is placed on the petri-dish. Which quantities of the gas in the
) increases; (β) decreases?
(ii) What is responsible for the pressure exerted by a gas in a closed vessel?
132
(ii) A piece of brass 20.0g is hung on a spring balance from a rigid support and
. Determine the
, density of brass =8.0 x l0kgm-3
Pull the piston of the syringe, upward until it can no longer move.
Read and record this position of the piston on the graduated mark on the syringe
dish.
Read and record the new position of the piston as V. (v) Evaluate V-1
0g, 2000g and 2500g
on the vertical axis and M on the horizontal axis, starting
ntities of the gas in the
(ii) What is responsible for the pressure exerted by a gas in a closed vessel?

133
(i) Set up a circuit as illustrated in the diagram above.
(ii) Close the key, K.
(iii) Read and record the ammeter reading. I0 and the volt-meter reading V0 when jockey
J is not making contact with the potentiometer wire OQ.
(iv) Using J make a contact with the potentiometer wire OQ at a point P such that OP =
10cm.
(v) Read and record the current and the corresponding value of the voltage V.
(vi) Repeat the procedure for other values of OP =20cm, 30cm,-40cm, 50cm and 60cm.
(vii) Tabulate your readings
(viii) Plot a graph with V on the vertical axis and. I on the horizontal axis, starting both
axes from the origin (0,0).
(ix) Determine the slope, s, of the graph.
(x) Determine the value of V when I = O
(xi) State two precautions taken to obtain, accurate results.
b. (i) State two advantages of a lead-acid accumulator over a dry Leclanché cell
(ii) A cell emf 2V and internal resistance of IΩ passes current through an external load
of 9Ω. Calculate the potential drop across the cell.

134
APPENDIX G
NATIONAL EXAMINATION COUNCIL
SENIOR SCHOOL CERTIFICATE EXAMINATION (INTERNAL) JUNE/JULY 2012
PHYSICS (PRACTICAL)
FINAL MARKING SCHEME CANDIDATE ARE TO ANSWER TWO QUESTIONS OUT OF THREE GENERAL NOTES 1. Each question is marked on a total of 25marks under different sub-heading:
Observations, graph, slope, deductions, accuracy, precautions, and short answer
questions
2.i. Penalties earned under one sub-heading are not transferable if no marks have been
earned in that section.
ii. Units wrong or missing attract loss of ½ mark each. Units may be sated in table or
graph. There is no penalty for derived units.
iii. Inconsistent significant figures (s.f) attract loss of ½ mark per column up to a
maximum of 1 mark per table.
iv. Systematic errors (s.e.) attract loss of 1 mark
v. Disregard of instructions (d.i) attract loss of 1 mark
vi. Gross errors (g.e.) for instance, measurement of glancing angles where angles of
incidence are required should be treated as gross error and NOT as systematic
error. Award zero for gross error
vii. Quantities read from table must be recorded to at least 3 decimal places except for
exact values e.g. (Reciprocals, logs etc) or to 3 significant figures depending on
value required.
viii. For short-answer questions, deduct ½ mark for missing or wrong unit in final
answer of numerical problems
x. Deduct ½ mark for each wrong or missing heading.

135
3. GRAPH
i. For scales to be reasonable, graph must occupy at least a half of page/space provided
for use. Origin is part if requested or if intercept is required.
ii. Scales using multiples or sub-multiples of prime numbers such as 3.7.11.13 e.t.c. are
not acceptable.
iii. Points should be plotted correctly to nearest half square on both axes,
iv. To obtain the suitable line mark, at least three points must be correctly plotted.
v. Where points are matched, candidates should be awarded zero for plotted points
slope, intercept etc.
vi. If a candidate plotted unwanted variables, i c. gross error, score zero for graph, slope.
intercept, deduction, etc.
4. SLOPE
i. Large right-angled triangle implies that it occupies at least ½ of graph.
ii. To obtain correct arithmetic mark, candidate must have read AX or AY correctly.
NOTE: Coordinates are not acceptable
5. PRECAUTIONS
Must be stated in acceptable language e.g. 1 avoided conical swing of the pendulum bob
or conical swing of the pendulum bob was avoided, not you must avoid conical swing of
pendulum bob, not you should avoid conical swing and not avoid conical swing.
6. TIME SAVING
It has been decided to save time marking good consistent scripts. When a number of
processes such as multiplications, divisions, readings from tables, plotting etc are to be
repeated for all readings we begin by checking the first three. If all are correct. award full
marks for the process. Otherwise, check all and score accordingly. This does not apply to
observed readings.
l(a) OBSERVATION (9 MARKS)
(i). Point of balance G. read and recorded to at least 1 d.p. in cm............. ½
(ii). Value of D determined and recorded to at least 1 d.p. in cm.............. ½

136
(iii). 6 values of m recorded in grams. ....................................................... ½
(Deduct ½. mark for each wrong or missing value)
(iv). 6 values of the position R of m read and recorded to at least I d.p in cm and in
trend.........................................................................................3
(Trend: As m increases, R of m decreases: ½ mark each)
(v). 6 values ofd-1correctly determined and recorded ...................................2
(Deduct ½ mark for each wrong or mining value)
(vi). 6 values of d-1 correctly calculated and recorded to at least 3 d.p. .......1
(Deduct ½ mark for each wrong or missing value)
(vii). Composite table showing m, position R of m, d. d-1 at least................. 1
NOTE: If the value of G is not recorded score zero for observation (i). (ii) and (v).
GRAPH (6 MARKS)
(i). Axes distinguished (½ mark each).........................................................1
(ii). Reasonable scales (1/2 mark each).,…………………………..........1
(iii). 6 points correctly plotted (½ mark each)..............................................3
(iv). Line of best fit...,.................................................................................1
SLOPE (2 MARKS)
(i). l.arge right-angled triangle............................................................... ..½
(ii). ∆m correctly read and recorded........................................................... ½
(iii). ∆d -1correctly read and recorded ........................................................ ½
(iv). 1−∆
∆d
m correctly calculated.................................................................. ½
DEDUCTION (I MARK)
.
;,
PGLenghtD
SlopeSWherD
SK
=
==
Correct substitution ..................................................................................... ½
Correct arithmetic..........................................................................................½
ACCURACY (1 MARK)

137
Based on K = Mass of M as supplied by teacher to within ± 10%.
NOTE; If mass M is not supplied award zero for accuracy.
PRECAUTION (2 MARKS)
Award 1 mark each for any TWO of the following stated in acceptable language.
(i) I avoided draught (award zero if avoid air is used) OR Draught was avoided.
(ii) 1 avoided error of parallax on metre rule. OR Error due to parallax on metre rule
was avoided.
(iii) I avoided mass touching table. OR mass was not allowed to touch the table.
(iv) Zero error of metre rule was noted, OR I noted zero error of the metre rule.
(v) Repeated readings shown on the table.
-Any other valid point.
b(i) -The point through which the lines of action of the weight of
the body always passes irrespective of the position
of the body.......................................................................................2
OR
-The point through which the line of action of the weight always acts.
OR
-The point at which the resultant/entire weight of the body appears to be concentrated.
Correct diagram ..................................................................................2
Taking moment about the pivot
20 x w = 10 x30 ...................................................................................... ½
W= 15N............................................................................................... ½
2(a) OBSERVATION (11 MARKS)
(i). 6 values of H measured and recorded to 1 d,p in cm and in trend......... 5
30 20
10 W
5 35 55 100

138
(Trend: As V increases, H increases)
(Deduct 1 mark for each wrong or missing value)
(ii) 6 values ofh measured and recorded to I d.p. in cm and in trend ....... 5
(Trend: As H increases, h increases)
(Deduct 1 mark for each wrong or missing value)
(iii). Composite table showing V, H, and h at Ieast……………………….1
NOTE; H must be greater than h, otherwise penalize for wrong heading.
GRAPH (6 MARKS) - As in question 1
SLOPE (2 MARKS) - As in question 1
PRECAUTION (2 MARKS)
Award 1 mark each for any TWO of the following stated in acceptable language.
(i) Reading of the water level is taken from the lower meniscus.
(ii) Zero error of metre rule was noted OR I noted zero error of the metre rule.
(iii) Repealed readings shown on table.
(iv) Parallax error avoided on metre rule.
-Any other valid point.
b(i). The ratio of the sine of the angle of incidence to the sine of the angle of retraction
is a constant for a given pair of media…………………. 2 or 0
(ii). Let t be the real thickness and x be the apparent thickness of the
glass. Displacement d = Real thickness - Apparent thickness
d = t - x
x = t – d ...............................eq(l)............................................. ½
Also, n = thicknessapparent
thickenessalRe
Refractive index, n = x
1

139
nx
1= ……………………………………… eq (2)…………… ½
Equating (t) & (2), we have
n
t = t – d ........................................................................... ½
d = t - n
t
OR
d = t
−n
11 .................................................................................. ½
Alternatively
antna
t =⇒= , ……………………………………………….. ½
Where a = apparent displacement,
∴ displacement d = t – a
= t - n
t...................................................................... ½
3(a) OBSERVATION (10 MARKS)
(i). Value of E measured and recorded to 1 d.p. in volts ..................1
(ii). 6 values of I read and recorded to 1 d.p. in Amp and in trend
(1 mark each) …………………………………………………....6 (Trend: As R increases 1 decreases)
(iii). 6 values of 1-1 correctly calculated and recorded to at least 3 d.p
.......................................................................................... 2
(Deduct ½ mark for each wrong or missing value)
(iv). Composite table showing R, I, 1-1 at least.................................1
GRAPH (6 MARKS)
As in question I
SLOPE (2 MARKS)
As in question 1

140
INTERCEPT, (1 MARK)
Correctly shown ………………………………………………..…………. ½
Correctly read…………………………………………..…………….…… ½
NOTE: Accept intercept on any axis.
PRECAUTIONS (2 MARKS)
Award one mark each for any TWO of the following stated in acceptable language.
i. Connections were made tight
ii. I ensured clean terminals.
iii. Key was opened when readings were not taken
iv. I avoided/noted zero error of ammeter
v. I repeated readings shown on table.
(vi). I avoided parallax error when reading the ammeter -Any other valid point.
b(i) -The opposition to the flow of current offered by the chemicals
and the poles..........2
(ii). E = I(R + r) …………………………………. ½
r = 3
R ………………………………….. ½
= 1(R + 3
R) …………………………………….. ½
E = IR + 3
IR ; E = V +
3
IR
∴ V = E - 3
IR……………………………………….….. ½
OR
E = I(R+r) ……………………………………..….. ½
r = 3
R…………………………………….….. ½
= 1(R + 3
R) …………………………………….. ½
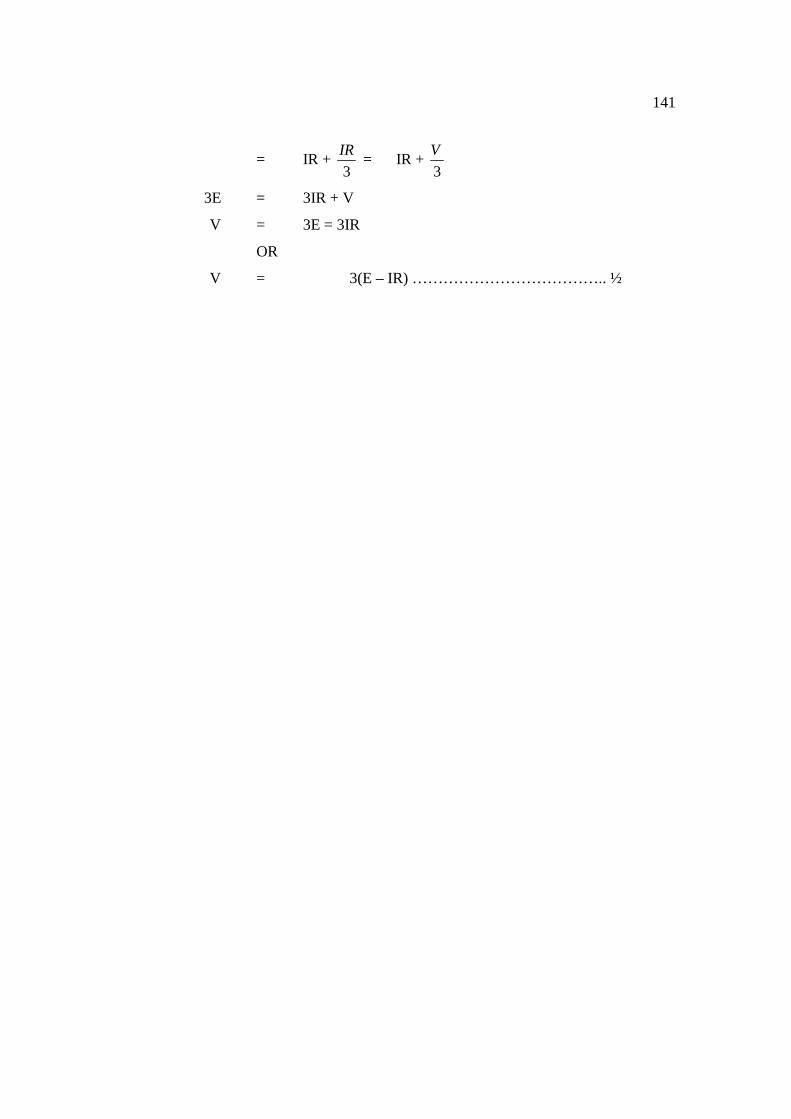
141
= IR + 3
IR = IR +
3
V
3E = 3IR + V
V = 3E = 3IR
OR
V = 3(E – IR) ……………………………….. ½

142
APPENDIX H NATIONAL EXAMINATION COUNCIL (NECO)
2011 SENIOR SCHOOL CERTIFICATE EXAMINATION (INTERNA L)
PHYSICS (PRACTICAL) FINAL MARKING SCHEME (2011)
CANDIDATE ARE TO ANSWER TWO QUESTIONS OUT OF THREE GENERAL NOTES 1. Each question is marked on a total of 25 marks under different sub-heading:
Observations, Graph, Slope, Deductions, Accuracy, Precautions and Short answer
questions.
2.i. Penalties earned under one sub-heading are not transferable if no marks have been
earned in that section.
ii. Units wrong or missing attract loess of ½ mark each. Units may be sated in table or
graph. There is no penalty for derived units.
iii. Inconsistent significant figures (s.f) attract loss of ½ mark per column up to a
maximum of 1 mark per table.
iv. Systematic errors (s.e.) attract loss of 1 mark
v. Disregard of instructions (d.i) attract loss of 1 mark
vi. Gross errors (g.e.) for instance, measurement of glancing angles where angles of
incidence are required should be treated as gross error and NOT as systematic
error. Award zero for gorses error
vii. Quantities read from table must be recorded to at least 3 decimal places except for
exact values e.g. (Reciprocals, logs etc) or to 3 significant figures depending on
value required.
viii. For short-answer questions, deduct ½ mark for missing or wrong unit in final
answer of numerical problems
xi. Deduct ½ mark for each wrong or missing heading.
3. GRAPH
i. For scales to be reasonable, graph must occupy at least a hall of page/space
provided for use. Origin is part if requested or if intercept is required.
ii. Scales using multiples or sub-multiples of prime numbers such as 3.7.11.13 e.t.c.
are not acceptable.

143
iii. Points should be plotted correctly to nearest half square on both axes,
iv. To obtain the suitable line mark, at least three points must be correctly plotted.
v. Where points are matched, candidates should be awarded zero for plotted points
slope, intercept etc.
vi. If a candidate plotted unwanted variables, i e. gross error, score zero for graph,
4. SLOPE
i. Large right-angled triangle implies that it occupies at least ½ of graph.
ii. To obtain correct arithmetic mark, candidate must have read AX or AY correctly.
NOTE: Coordinates are not acceptable
5. PRECAUTIONS
Must be stated in acceptable language e.g. 1 avoided conical swing of the pendulum bob
or conical swing of the pendulum bob was avoided, not you must avoid conical swing of
pendulum bob, NOT you should avoid conical swing and NOT avoid conical swing.
6. TIME SAVING
It has been decided to save time marking good consistent scripts. When a number of
processes such as multiplications, divisions, readings from tables, plotting etc are to be
repeated for all readings we begin by checking the first three. If all are correct. award full
marks for the process. Otherwise, check all and score accordingly. This does not apply to
observed readings.
1(a) OBSERVATION (9 MARKS)
i. Point of balance, G = 50.0cm read and recorded to at least 1 d.p.
in cm and within tolerance of ± 1.0cm ……………………….. 1mark
ii. 5 values of K1 read and recorded to at least 1 d.p in cm and in
trend ( ½ mark each) …………………………………… 2 ½ marks
(Trend: As y increase, K1= increases)
iii. 5 values of K2 read and recorded to at least 1 d.p in cm and in
trend ( ½ mark each) …………………………………. 2 ½ marks

144
(Trend: As y increase, K2 increase)
iv. 5 values of x1 correctly calculated …………………….. 1 mark
(Deduct ½ mark for each wrong or missing value)
v. 5 values of x2 mark for each wrong or missing value)
(Deduct ½ mark for each wrong or missing value)
vi. Composite table showing y, k1, K2, x1, and x2 at least …….. 1 mark
GRAPH (6 MARKS)
i. Axes distinguished .. ( ½ mark each) …………………… 1mark
ii. Reasonable scales … ( ½ each) ………………………… 1mark
iii. 5 points correctly plotted ……………………………….. 3marks
(Deduct 1 mark for each wrong or missing point)
iv. Line of best fit …………………………………………… 1mark
SLOPE (2 MARKS)
i. Large right-angled triangle ………………………………… ½ mark
ii. ∆x1 correctly read and recorded ……………………………… ½ mark
iii. ∆x2 correctly read and recorded ……………………………. ½ mark
iv. ∆"< ∆"< correctly calculated ……………………………… ½ mark
EVALUATION (1 MARK)
K = E< =;
F
Where S = slope Correct substitution ………………………………………….. ½ mark Correct arithmetic …………………………………………… ½ mark ACCURATE (1 MARK) Based On K – mass of metre rule as supplied by teacher within ± 10% NOTE: If mass of metre rule is not supplied award zero. PRECAUTIONS (2 MARKS) Award 1 mark each for any TWO of the following, stated in acceptable language.
i. I avoided draught / Draught was avoided
ii. I avoided error of parallax in reading metre rule
iii. I avoided mass touching table/floor

145
iv. Repeated reading shown on the table
v. I avoided zero error of the metre rule.
(b)i I - The forces must be concurrent. II - The resulting of the forces must be equal to zero. OR
- The resolved components of the forces along two mutually perpendicular
directions must separately be equal to zero.
III - The algebraic sum of the moments of the forces about a given axis must be
equal to zero.
Any Two of these three x 1 mark each = 2 marks.
ii.
Correct diagram – ½ mark
Taking moments about P gives that
350 x g x 15 = m x g x 35 …………………………………… ½ mark
m = HIC'I'JFHI'J ………………………………………........ ½ mark
= 150 grammes ………………………………………........ ½ mark
2(a) OBSERVATION (11 MARKS)
i. 5 complete and correct traces …………………………....... 2marks
(Deduct ½ mark for each incomplete, incorrect or missing trace)
(For trace to be complete and correct, the incident ray, refracted ray, emergent ray
from DC and the normal must be shown as in the diagram)
NOTE: Do not accept traces combined on one ray diagram
ii. 5 values of r correctly measured and recorded to 1o and in trend …. 2marks
(Trend: As i increases, r increases)
(Deduct ½ mark for each wrong or missing value)
P
m 35cm 15cm 350

146
iii. 5 values of d correctly drawn and recorded in cm to at least 1 d.p.
and in trend …………………………........................ 2mark
(Trend: as I increase, d increase)
(Deduct ½ mark for each wrong or missing value)
iv. 5 values of (i-r) correctly evaluated. …………………….. 1 mark
(Deduct ½ mark for each wrong or missing value)
v. 5 values of sin(i-r) correctly evaluated to at least 3 d.p. ….. 1mark
(Deduct ½ mark for each wrong or missing value)
vi. 5 values of cosr correctly evaluated to at least 3 d.p……….. 1mark
(Deduct ½ mark for each wrong or missing value)
vii. 5 values of dcosr correctly calculated to at least 3 d.p……. 1mark
(Deduct ½ mark for each wrong or missing value)
viii. Composite table showing I, r, d, sin (i-r) and dcosr at least …. 1mark
NOTE:
(i) If traces are not attached score zero for I, ii and iii
(ii) If no pin marks, treat as if no traces were attached
(iii) Do not accept group work
(iv) Where a candidate has calculated and recorded dcosr and sin(i-r)
without recording cosr and i-r separately award …………… 2marks
GRAPH (5 MARKS)
(i) Both axes correctly distinguished ……………………….. 2 marks
(ii) Both scales reasonable …………………………………… ½ mark
(iii) 5 points correctly plotted ………………………………… 3 marks
(Deduct ½ mark for each wrong or missing point)
(iv) Line of best fit ………………………………… ………… 1 marks
SLOPE (2 MARKS)
As in Question 1(a)

147
ACCURACY (1 MARK)
Based on slope, S = Width of the glass block within ± 10% as measured from candidate’s trace.
PRECAUTIONS (2 MARKS)
Award 1 mark each for any TWO of the following stated in acceptable language.
i. Ensure pins are vertical/upright
ii. Sharp pencil/neat traces as shown from traces
iii. Ensured reasonable spacing of pins/Ensured minimum spacing of 4cm of the pins.
iv. Avoided parallax error in reading protractor/ruler
Accept any other valid precaution
i. Snell’s law states that:
The ratio of the sine of the angle of incidence to the sine of the angle of refraction is a
constant for a given pair of media.
OR
For any pair of media, the ratio of the sine of the angle of incidence to the sine of the angle of
refraction is a constant.
(2 marks or zero)
ii. Refractive index = KLMN OLPQ5
DPPMRLSQ OLPQ5 (") …………………………….. ½ mark
1.33 = UC'
x = UC.HH
= 60.15cm …………………………………………… ½ mark Displacement = Real depth = Apparent depth …………………… ½ mark = 80 -60.15 = 19.85cm…………………………………………… ½ mark OR
d = r X1 − YZ ………………………………………………..1mark
where d = displacement, r = real depth, n = refractive index
d = 80 X1 − .HHZ………………………………………………… ½ mark
÷ 80 – 60.15
= 19.85cm…………………………………………… ½ mark

148
3(a) OBSERVATION (8 MARKS) i. E.m.f. of battery recorded in volt to at least 1 d.p………………. 1mark
ii. 6 values of L measured and recorded to at least 1 d.p. in cm …… 1mark
(Deduct ½ mark for each wrong or missing value) iii. 6 values of 1 read and recorded at least 1 d.p. in Amperes
and in trend …………………………………………………… 4marks (Trend: As L decreases, 1 increases) (Deduct 1 mark for each wrong or missing value)
iv. 6 values of Q correctly calculated and recorded to at least 2 d.p. …. 1mark
(Deduct ½ mark for each wrong or missing value) v. Composite table showing L, 1 and Q at least …………………… 1mark
GRAPH (6 MARKS) i. Axes distinguished … ( ½ mark each ………………………… 1mark
ii. Reasonable scales .. ( ½ mark each) …..…………………….. 1mark
iii. 6 points correctly plotted .. ( ½ mark each)………………… 3marks
iv. Line of best fit ……………………………………………….1mark
SLOPE (2 MARKS) As in Question 1(a) INTERCEPT C (1 MARK) Correctly shown …………………………………………………….. ½ mark Correctly read …………………………………………………….. ½ mark EVALUATION (1 MARK) K = C – 2, where C = intercept
i. Correct substitution ………………………………………………..½ mark
ii. Correct arithmetic ………………………………………………..½ mark
ACCURACY (1 MARK) Based on value of K – internal resistance of cell to within ± 10% of teacher’s value ……………………………………………………….. ½ mark NOTE: If internal resistance of cell is not supplied, score zero for accuracy. PRECAUTIONS (2 MARKS) Award 1 mark each for any TWO of the following, stated in acceptable language.
i. Connections were made tight/ I ensured clean terminals.
ii. Key opened when readings are not taken

149
iii. Avoided/Noted zero error of ammeter
iv. Avoided parallax error when reading the ammeter/meter rule
v. Repeated readings shown on table
vi. Any other valid precautions
(b)i. Opposition to current flow offered by the chemicals and the poles of the cell. (2 or 0) ii. Slope from plotted graph ………………………………………..½ mark
[ = A.B"C
D
OR
\ = A.B"C
= ………………………………………….. ½ mark
Correct substitution ……………………………………….. ½ mark
Correct arithmetic ………………………………………… ½ mark

150
APPENDIX I
WEST AFRICAN EXAMINATION COUNCIL 2011 MAY JUNE SENIOR SCHOOL CERTIFICATE MARKING SCH EME O’ LEVEL
PRACTICAL PHYSICS i) A) Observation (12 Marks)
i) The value of Mo read and recorded to at least one decimal place in gram - - - - - 1 mark.
ii) 4 values of F (N) force recorded to at least one (deduct ½ mark for each missing value) - - - 1 mark.
iii) 4 values of M = (Mo + M (g)) read and recorded to one decimal place and in increasing trend - - - - 3 marks.
iv) 4 values of F = R = M/100g calculated and in increasing trend - - - 3 marks
v) 4 values o f mass m(g) recorded to 1 decimal place1 mark
vi) Composite table showing O M, F, M and R
vii) Correct units for each quantity (column) – 1 mark;
viii) Consistency with decimal place– 1 mark
GRAPH (5 marks) i) Axes distinguished – (1/2 mark each) -------1
ii) Reasonable scale – (1/2 mark each) ----------1
iii) 4 points correctly plotted - - - - 2 (deduct ½ mark for each wrong or missing point).
iv) Line of test fit - - - - - - 1
SLOPE (2 Marks) i) Large right angled triangle - - - ½
ii) ∆F correctly read and recorded - - ½
iii) ∆R correctly read and recorded - - ½
iv) ∆F/∆R correctly calculated - - - ½
PRECAUTIONS (2 marks) Award 1 mark each for any two correct precautions stated in acceptable language
i) 1 avoided parallax error when taking readings on the spring balance (award zero if avoid error due to parallax is used; and award zero if spring balance was not mentioned).

ii) 1 avoided zero error of spring balance .
Accept any other acceptable precaution stated in appropriate language.(b) i) Coefficient of static fraction is the ratio of frictional force to normal reaction between two surfaces in contact mark if two surfaces in contact was not mentioned)ii) M = 0.5kg, F = 2.5v, g = 10m/s F = UR = Umg
Or U = = 2 a) OBSERVATION (12 Marks)
i) Five values of Mo, (cm) read and recorded to 1 decimal place
ii) Five values of No (cm) read and recorded to 1 decimal place
iii) 5 values in trend increasing as recorded to at least 2 decimal place
iv) 5 values of cos
v) Five traces of the RN and NO with traces for the emergent and incident rays - -
vi) Correct unit for each quantity
vii) Constituency decimal place
GRAPH (5 Marks) i) Axes distinguished ½ mark each
ii) Reasonable scale (1/2 mark each)
iii) 5 points correctly plotted
iv) Line of best fit
SLOPE (2 Marks) i) Large right angled triangle
ii) ∆θ correctly read and recorded
iii) ∆θ correctly read and recorded
iv) ∆θ/∆θ correctly calculated
PRECAUTIONS (2 Marks) Award 1 mark each for any two correct precautions stated in acceptable language.
i) Error of parallax on metre rule
1 avoided zero error of spring balance .
Accept any other acceptable precaution stated in appropriate language.(b) i) Coefficient of static fraction is the ratio of frictional force to normal reaction
tween two surfaces in contact - - - 2 marks or zero (award 1 mark if two surfaces in contact was not mentioned) ii) M = 0.5kg, F = 2.5v, g = 10m/s
- - - - - 1 mark
= 0.5 ---------1 Mark OBSERVATION (12 Marks)
Five values of Mo, (cm) read and recorded to 1 decimal place
Five values of No (cm) read and recorded to 1 decimal place
5 values in trend increasing as θ increase of θ = correctly calculated and recorded to at least 2 decimal place--------2 marks
5 values of cos θ recorded to 4 decimal place---1 mark
Five traces of the RN and NO with traces for the emergent and incident rays - - - - 1 mark
Correct unit for each quantity - - 1 mark
cy decimal place - - - 1 mark
Axes distinguished ½ mark each - - 1 mark
Reasonable scale (1/2 mark each) - - 1 mark
5 points correctly plotted - - - 2 marks
Line of best fit - - - - - 1 mark
Large right angled triangle - - - ½
correctly read and recorded - - ½
correctly read and recorded - - ½
correctly calculated - - - ½
PRECAUTIONS (2 Marks) Award 1 mark each for any two correct precautions stated in acceptable language.
Error of parallax on metre rule was avoided
151
Accept any other acceptable precaution stated in appropriate language. (b) i) Coefficient of static fraction is the ratio of frictional force to normal reaction
2 marks or zero (award 1
1 mark
Five values of Mo, (cm) read and recorded to 1 decimal place----3 marks
Five values of No (cm) read and recorded to 1 decimal place-----3 marks
correctly calculated and
Five traces of the RN and NO with traces for the emergent and incident rays
1 mark
1 mark
1 mark
Award 1 mark each for any two correct precautions stated in acceptable language.

152
ii) I noted zero error of the metre rule
iii) I took repeated reading to ensure accurate result.
iv) I ensured that the normal is perpendicularly drawn to the rectangular block.
Take any other good precaution
b(i) Snells law of refraction states that the ratio of the sine of angle of incidence to the sine of angle of refraction is a constant for a given pair of media - - - - - - - 1mark
µ=rSin
iSin (a constant) - - - 1 mark
ii) Sin C = ga n
1
Sin C = 5.1
1 = 0.6666 - - - - - - - 1 mark
or C = Sin-1 0.6666 = 41.60 - - - - - - - - 1mark (3a) OBSERVATION (12 Marks)
i) Value of E read and recorded to 1 decimal place in volts - - 1 mark
ii) 6 values of V(v) read and recorded to 2 decimal place(trend V
increase as 1 increase, deduct ½ mark for missing value) - - 3 marks
iii) 6 values of 1 (A) read and recorded to 2 decimal point - - 3 marks
iv) Log I correctly evaluated - - 11/2 marks
v) Log V correctly evaluated - - - - 11/2 marks
vi) Correct unit for each quantity - - - - - 1 mark
vii) Consistency in decimal place - - - - 1 mark
viii) Composite table showing X,V,I, log I, Log V - - 1 mark
GRAPH (5 Marks) i) Axes distinguished ½ mark each - - - - - 1 mark ii) Reasonable scale ½ mark each - - - - - 1 mark
iii) 6 points correctly plotted (deduct ½ mark ) - - - 1 mark
iv) Line of best fit - - - - - - 1 mark
SLOPE (2 Marks)
i) Large right angled triangle - - - - ½

153
ii) ∆log I correctly read and recorded - - - - ½
iii) ∆log V correctly read and recorded - - - - - ½
iv) ∆Log I/∆Log V correctly calculated - - - - ½
INTERCEPT (2 Marks ) 1. Intercept C on the vertical axis
Correctly show - - - - - - - 1 mark
Correctly read - - - - - - - 1 mark
PRECAUTIONS (2 Marks) Award 1 mark each for any two correct precaution stated in good language such as: i) I made sure that the key was opened when the circuit was not in use to avoid running down the cell ii) I avoided error due to parallax when taking reading from potentiometer and/or voltmeter/ammeter. (Bi)T he brightness increases. This is because as the length x increases - 1mark Therefore the current that flows through it reduces while that through the bulb increases - - - 1 mark ii) Diode valve, rectifier, transistor - - - 1 mark each = 2

154
APPENDIX J
WEST AFRICAN EXAMINATION COUNCIL 2012 MAY JUNE SENIOR SCHOOL CERTIFICATE MARKING SCH EME O’ LEVEL PRACTICAL PHYSICS 1 (a) OBSERVATION (12 MARKS)
i) The 5 values of W1(N) measured and recorded to 2 decimal points - - - - - - - - 2 marks
ii) 5 values of W2 (N) measured and recorded to 2 decimal points intend as W1 increases W2 increases (remove ½ of mark for missing value - - - - - - - - 2 marks
iii) 5 values of W3 (N) measured and recorded to 2 decimal points (in trend increases as W1 and W2 increase) - - 2 marks
iv) 5 values of U (W1- W2) correctly evaluated -2 marks
v) 5 values of V (W1 – W3) correctly evaluated -2 marks
vi) Composite table of m,w1, w2, w3, u,v - 1mark
vii) Consistency in writing the decimal place - 1 mark
GRAPH (5 MARKS) i) Axes distinguished ½ mark each - - 1mark
ii) Reasonable scale ½ mark each - - 1 mark
iii) Five points correctly plotted - - - 2marks
iv) Line of best fit - - - - 1 mark
SLOPE (2 MARKS) i) Large right angled triangle - - - ½
ii) ∆V correctly read and recorded - - ½
iii) ∆U correctly read and recorded - - ½
iv) ∆V/∆U correctly calculated - - - ½
PRECAUTION (2 MARKS)
Award I mark each for any two correct precaution stated in acceptable language
i) I avoided error due to parallax when reading the spring balance

155
ii) I ensured that the suspended weight did not touch beaker or any, other good
precaution
Bi) Archimedes principle states that when a body is totally or partially immersed in a
fluid, (liquid or gas), it experiences an up thrust which is equal to the weight of the fluid
displaced. - - 2 marks
iii) Mass of brass = 20g = 0.02kg; Density of brass = 8.0 X 10³ kg/m3
Volume = 33 /108
02.0
mkgX
kg
Density
Mass = = 2.5 X 10⁻⁶m3
upthrust = 2.5 X 10 X 8.0 X 103 X 10 - 1mark
= 20 X 10-3 N - - - - 1 mark 2a) OBSERVATION ( 10 MARKS)
i) The value of Vo read and recorded to 1 decimal place - 1 mark
ii) Five values of V recorded to at least 1 decimal place (deduct 1 mark for each missing
value trend –V increases as M increase - 3marks
iv) 5 values of V-1 recorded to at least 3 decimal points
(increases as M increase) - - - - 3 marks
v) Consistency in recording the decimal points - 1 mark
vi) Correct unit for each quantity - - - - 1 mark
vii) Composite table of m,v,v-1 - - - 1 mark
GRAPH (5 MARKS)
i) Axes distinguished ½ mark each - - - - 1mark
ii) Reasonable scales ½ mark each - - - 1 mark
iii) Five points correctly plotted (deduct ½ mark for each wrong plotting) -- -
- - - - - - - 2 marks
iv) Line of best fit - - - 1 mark
SLOPE (2MARKS)
i) Large right angled triangle - - - 1/2
ii) ∆V-1 correctly read and recorded - - 1/2
iii) ∆M correctly read and recorded - - ½

156
iv) ∆V-1/∆M correctly calculated - - - ½
EVALUATION (2 MARKS)
R=5-1 = 1/5 - - - - - 1 mark
Correct substitution and final answer - 1 mark
PRECAUTION (2 MARKS) 1 mark each for any two good precaution stated in correct
language.
1. I ensured that the syringe was vertically erect .
2. I avoided error due to parallax while taking reading from syringe and any other
good precaution.
Bi) Pressure ,volume (1mark X 2)
ii) Collision between gases and walls of the container - - 2 marks
3a) OBSERVATION (11 MARKS)
i) The value of I0 and V0 to 1 decimal place - - 1 mark X 2
ii) The value 5 for OP ie length in cm - - - 2marks
iii) 6 values of I(A) read and recorded to 2 decimal points (trend I increase as Op increase
deduct ½ mark for any missing value - - 2 marks
iv0 6 Values of V (v) recorded to 2 decimal points (trend increases as OP and I increase
deduct ½ mark for a missing value) - - 2 marks
v) Consistency in writing the decimal places - - 1 mark
vi) Composite table for OP, 1 and V - - - 1 mark
viii) Correct unit for each quantity - - - 1 mark
GRAPH (5 MARKS)
i) Axes distinguished ½ mark each - - - 1 mark
ii) Reasonable scale – ½ mark each - - - 1 mark
iii) Six points correctly plotted (deduct ½ mark for any wrong plotting -
- - - 2 marks
iv) Line of best fit - - - - - - 1 mark

SLOPE (2 MARKS)
i) Large right angled triangle
ii) ∆V correctly read and recorded
iii) ∆I correctly read and recorded
iv) ∆V/∆I correctly calculated
EVALUATION (1 MARK)
The value of V when I = 0 correctly read from graph
PRECAUTION (2 MARKS)
Any good precaution – 1 mark for two
i) I always removed the key when not taking reading to avoid running down the
battery
ii) I avoided error due to parallax when reading the me
Bi) it can be recharged
ii) It can maintain large current for a long time
iii) R = 90hms, r = 1 ohm, E = 2v
I =
V = IR = 0.2 X 9 = 1.8V
Potential Drop = 2 – 1.8V + 0.2V
i) Large right angled triangle - - - - - ½
V correctly read and recorded - - - - ½
I correctly read and recorded - - - - ½
I correctly calculated - - - - -
EVALUATION (1 MARK)
The value of V when I = 0 correctly read from graph 1 mark
PRECAUTION (2 MARKS)
1 mark for two
I always removed the key when not taking reading to avoid running down the
I avoided error due to parallax when reading the metre rule, ammeter
- - - 1 mark
ii) It can maintain large current for a long time - 1 mark
iii) R = 90hms, r = 1 ohm, E = 2v
0.2A - - - - - 1 mark
V = IR = 0.2 X 9 = 1.8V
1.8V + 0.2V - - - 1 mark.
157
½
1 mark
I always removed the key when not taking reading to avoid running down the
tre rule, ammeter

158
APPENDIX X
Summary of Sample Size used for Data Collection as Distributed in Sampled Education Zone, Local Government and Schools
Education
zone Local Govt.
Area School WAEC
2011 WAEC
2012 NECO 2011
NECO 2012
Total
Obollo Afor Igbo Eze N CSS Amufie 8 7 8 8 31 ISS Enugu Ezike 8 8 8 8 32 Igbo Eze S Iheaka GSS 8 8 7 8 31 CSS Iheakpu Awka 8 8 8 8 32 Udenu CSS Obollo aFor 8 9 8 8 33 CSS Ezimo Uno 7 9 9 7 32 Nsukka Nsukka STC Nsukka 8 9 8 9 34 NHS Nsukka 8 8 8 8 32 BSS Aku 8 8 8 8 32 GSS Aku 7 7 10 6 30 CSS Nrobo 9 10 7 8 34 CSS Nimbo 8 8 8 8 32 Enugu Isi Uzo CSS Umuhu 8 8 8 7 31 CSS Eha Ohuala 8 8 7 8 31 Enugu East GSS Abakpa 7 7 8 7 29 New Heaven BSS 8 8 8 8 32 Enugu North CSS Iva Valley 8 8 7 8 31 Urban GSS Enugu 8 8 8 8 32 Obollo-Afor Igbo Eze North CHS Ogrute 8 10 6 8 32 Udenu GSS Obollo Afor 8 8 8 8 32 BHS Orba 8 8 9 8 33 Total 166 172 166 164 668

159
APPENDIX W
Educational Zone Local government area
Total Number of School
Number of Sampled School
Enugu Isi Uzo
Enugu East
Enugu North
8
10 10
2
2 2
Nsukka Nsukka
Igbo Etiti
Uzo Uwani
24
15
13
2
2
2
Obollo Afor Udenu
Igbo Eze South
Igbo Eze North
16
9
23
2
2
2
Total 18
Copyright © 2022 FDOKUMEN


![INSTITUT AGAMA ISLA]YI NEGERI](https://static.fdokumen.com/doc/165x107/6313aa03b1e0e0053b0e7909/institut-agama-islayi-negeri.jpg)