YEAR END FINANCIAL REPORT - Anglo American Peru
94
YEAR END FINANCIAL REPORT for the year ended 31 December 2021
-
Upload
khangminh22 -
Category
Documents
-
view
1 -
download
0
Transcript of YEAR END FINANCIAL REPORT - Anglo American Peru
YEAR END FINANCIAL REPORT
for the year ended 31 December 2021

This page has been intentionally left blank.
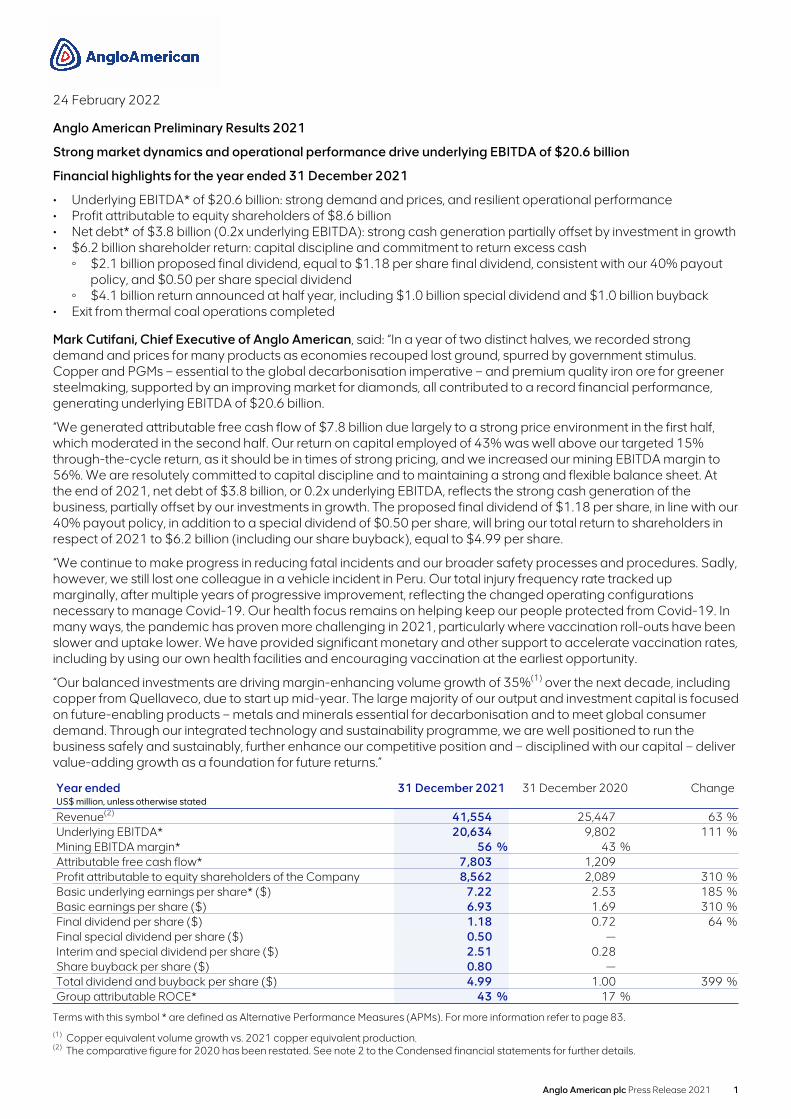
24 February 2022
Anglo American Preliminary Results 2021
Strong market dynamics and operational performance drive underlying EBITDA of $20.6 billion
Financial highlights for the year ended 31 December 2021
• Underlying EBITDA* of $20.6 billion: strong demand and prices, and resilient operational performance • Profit attributable to equity shareholders of $8.6 billion • Net debt* of $3.8 billion (0.2x underlying EBITDA): strong cash generation partially offset by investment in growth• $6.2 billion shareholder return: capital discipline and commitment to return excess cash◦ $2.1 billion proposed final dividend, equal to $1.18 per share final dividend, consistent with our 40% payout
policy, and $0.50 per share special dividend◦ $4.1 billion return announced at half year, including $1.0 billion special dividend and $1.0 billion buyback
• Exit from thermal coal operations completed
Mark Cutifani, Chief Executive of Anglo American, said: “In a year of two distinct halves, we recorded strong demand and prices for many products as economies recouped lost ground, spurred by government stimulus. Copper and PGMs – essential to the global decarbonisation imperative – and premium quality iron ore for greener steelmaking, supported by an improving market for diamonds, all contributed to a record financial performance, generating underlying EBITDA of $20.6 billion.
“We generated attributable free cash flow of $7.8 billion due largely to a strong price environment in the first half, which moderated in the second half. Our return on capital employed of 43% was well above our targeted 15% through-the-cycle return, as it should be in times of strong pricing, and we increased our mining EBITDA margin to 56%. We are resolutely committed to capital discipline and to maintaining a strong and flexible balance sheet. At the end of 2021, net debt of $3.8 billion, or 0.2x underlying EBITDA, reflects the strong cash generation of the business, partially offset by our investments in growth. The proposed final dividend of $1.18 per share, in line with our 40% payout policy, in addition to a special dividend of $0.50 per share, will bring our total return to shareholders in respect of 2021 to $6.2 billion (including our share buyback), equal to $4.99 per share.
“We continue to make progress in reducing fatal incidents and our broader safety processes and procedures. Sadly, however, we still lost one colleague in a vehicle incident in Peru. Our total injury frequency rate tracked up marginally, after multiple years of progressive improvement, reflecting the changed operating configurations necessary to manage Covid-19. Our health focus remains on helping keep our people protected from Covid-19. In many ways, the pandemic has proven more challenging in 2021, particularly where vaccination roll-outs have been slower and uptake lower. We have provided significant monetary and other support to accelerate vaccination rates, including by using our own health facilities and encouraging vaccination at the earliest opportunity.
“Our balanced investments are driving margin-enhancing volume growth of 35%(1) over the next decade, including copper from Quellaveco, due to start up mid-year. The large majority of our output and investment capital is focused on future-enabling products – metals and minerals essential for decarbonisation and to meet global consumer demand. Through our integrated technology and sustainability programme, we are well positioned to run the business safely and sustainably, further enhance our competitive position and – disciplined with our capital – deliver value-adding growth as a foundation for future returns.”
Year ended 31 December 2021 31 December 2020 ChangeUS$ million, unless otherwise stated
Revenue(2) 41,554 25,447 63 %Underlying EBITDA* 20,634 9,802 111 %Mining EBITDA margin* 56 % 43 %Attributable free cash flow* 7,803 1,209 Profit attributable to equity shareholders of the Company 8,562 2,089 310 %Basic underlying earnings per share* ($) 7.22 2.53 185 %Basic earnings per share ($) 6.93 1.69 310 %Final dividend per share ($) 1.18 0.72 64 %Final special dividend per share ($) 0.50 — Interim and special dividend per share ($) 2.51 0.28 Share buyback per share ($) 0.80 — Total dividend and buyback per share ($) 4.99 1.00 399 %Group attributable ROCE* 43 % 17 %
Terms with this symbol * are defined as Alternative Performance Measures (APMs). For more information refer to page 83.(1) Copper equivalent volume growth vs. 2021 copper equivalent production.(2) The comparative figure for 2020 has been restated. See note 2 to the Condensed financial statements for further details.
Anglo American plc Press Release 2021 1

Sustainability performance
Key sustainability performance indicators
Anglo American tracks its strategic progress using KPIs that are based on our seven pillars of value: safety and health, environment, socio-political, people, production, cost and financial. In addition to the financial performance set out above, our performance for the first four pillars is set out below:
Pillar of Value Metric 2021 2020 TargetTarget achieved
Safety and health
Work-related fatal injuries 1 2 Zero Not achieved
Total recordable case frequency rate per million hours
2.24 2.14 Year-on-year reduction Not achieved
New cases of occupational disease
16 30 Year-on-year reduction On track
Workforce potentially exposed to noise over 85 dBA(1)
30,832 33,253 Year-on-year reduction On track
Workforce potentially exposed to inhalable hazards over the occupational exposure limit (1)
1,796 1,994 10% reduction year-on-year On track
Environment Energy consumption (million GJ)
85 81 Improve energy efficiency by 30% by 2030
On track
GHG emissions - Scopes 1 & 2 (Mt CO2e)
14.8 16.1 Reduce absolute GHG emissions by 30% by 2030
On track
Operational water withdrawals (million m3)
176.5 197.5 Reduce freshwater abstraction in water scarce areas by 50% by 2030
On track
Level 4-5 environmental incidents
0 0 Zero On track
Socio-political
Social Way implementation (based on updated Social Way 3.0 for 2020)(2)
49 % 23 % Full compliance with Social Way 3.0 by end 2022
On track
Local procurement spend ($bn)(3)
10.0 10.0
Taxes and royalties ($m)(4) 7,134 3,778
Jobs supported by Enterprise and Supplier Development (ESD) initiatives
147,374 137,777
People Women in management 31% 27% To achieve 33% by 2023 On track
Women in the workforce 23% 23%
Voluntary labour turnover 3.5% 2.8% < 5% On track
(1) Reflects the number of employees and contractors who work in environments where there is potential for exposure above the exposure limit. All employees and contractors working in such environments are issued with protective equipment to prevent occupational illness.
(2) In 2020, we launched a new integrated social performance management system (Social Way 3.0) which has raised performance expectations and has resulted in continued improvement in our social performance. Sites are expected to have implemented the Social Way 3.0 by the end of 2022. While sites are assessed annually against all requirements applicable to their context, for consistency during the transition period, the metric reflects performance against the Social Way foundational requirements.
(3) Local procurement spend relates to spend within the country where an operation is located. The basis of calculation has been amended to more closely reflect the Group’s financial accounting consolidation, i.e. 100% of subsidiaries and a proportionate share of joint operations, based on Anglo American’s shareholding. The prior year comparative has been restated.
(4) Taxes and royalties include all taxes and royalties both borne and collected by the Group. This includes corporate income taxes, withholding taxes, mining taxes royalties, employee taxes and social security contributions and other taxes, levies and duties directly incurred by the Group, as well as taxes incurred by other parties (e.g. customers and employees) but collected and paid by the Group on their behalf. Figures disclosed are based on cash remitted, net of entities consolidated for accounting purposes, plus a proportionate share, based on the percentage shareholding, of joint operations. Taxes borne and collected by associates and joint ventures are not included.
Anglo American Preliminary Results
2 Anglo American plc Press Release 2021
Safety
Anglo American’s most important priority is always safety – keeping our colleagues safe and well. We also look beyond safety, working towards everyone being better off and healthier having worked for Anglo American. This drives our thinking and the commitment to quality of life and sustainable livelihoods across the company. We continue to make progress in reducing fatal incidents and our broader safety processes and procedures. Sadly, however, we still lost one colleague in a vehicle incident on our major project in Peru. Our total injury frequency rate tracked up marginally, after multiple years of progressive improvement, reflecting the changed operating configurations necessary to manage Covid that tend to disrupt planned work routines. The increase in the first half of the year reduced in the second half as we reinforced the importance of these new routines across the business.
On fatal incidents, our Elimination of Fatalities Taskforce has supported a 93% reduction in fatal incidents since 2013 and we are engaging with our non-managed joint operations and our approach to influencing better performance, as they reported three fatal incidents in the year. For us, every loss of life is a tragedy, and we will continue to mobilise our resources across the Group to support our zero harm imperative.
Health
We tackle the threats to health and wellbeing wherever we find them, with separate programmes for physical and mental health – including our Living with Dignity programme to help tackle gender-based and domestic violence; for creating a healthier working environment; and for encouraging healthy lifestyles. We are paying greater attention to psychological safety, intrinsic to embedding a safety-conscious mindset, establishing a steering group to investigate psychological safety issues while also introducing the thinking into an array of other programmes.
Our health focus remains on helping keep our people protected from Covid-19, while sustaining our work to continuously improve our key health measures. The pandemic proved to be more challenging in 2021, particularly in those countries where vaccination roll-outs lagged. We provided significant monetary and other support to accelerate vaccination rates, using our own health facilities and encouraging vaccination at the earliest opportunity, including in many host communities. With the pandemic as a backdrop, we are pleased to have met our three major annual improvement targets for health – for occupational disease, noise exposure and inhalable hazards.
Recognising the link between employee health and broader community wellbeing, in 2021 we completed community health improvement strategies for our operations in support of our Sustainable Mining Plan targets. Building on our extensive Covid-19 support, implementation of these strategies will begin in 2022.
Environment
Our Sustainable Mining Plan (SMP) includes commitments to be a leader in environmental stewardship. By 2030, we aim to: reduce GHG emissions (Scopes 1 and 2) by 30%; improve energy efficiency by 30%; achieve a 50% net reduction in freshwater abstraction in water-scarce areas; and deliver net-positive impacts in biodiversity wherever we operate.
Our environmental performance continues to improve, with no Level 5 or 4 incidents in 2021. This achievement reflects the improvements to our planning and operating disciplines across the business. We launched a ‘no repeats’ challenge during the year to help us learn from low level incidents and prevent repeats of a similar nature across the business, which has led to improvements in controls, specifically helping to prevent significant incidents.
Energy consumption increased in line with production following the operational shutdowns during the first half of 2020 due to the pandemic. Nevertheless, we achieved an 8% reduction in GHG emissions due to our Copper business in Chile moving to a renewable electricity supply in 2021, thereby reducing its Scope 2 emissions, as well as a reduction in methane emissions from our metallurgical coal mines in Australia.
We have a target to be carbon neutral across our operations by 2040, and an ambition to reduce our Scope 3 emissions by 50%, also by 2040. We are making encouraging progress. In 2020, around one third of the electricity Anglo American used globally was drawn from renewables. Having secured 100% renewable electricity supply across our operations in South America, by 2023 we expect to be drawing 56% of our global grid supply from renewables.
Socio-political
As we grow our business and improve our performance, so our total tax contribution increases, benefiting host countries. Total taxes and royalties borne and collected in 2021 amounted to $7.1 billion, an 89% increase from 2020. We also made further progress with our enterprise and supplier development initiatives, supporting 147,374 jobs in the year – a key component of our SMP goal to support five jobs offsite for every job onsite by 2030.
Anglo American Preliminary Results Sustainability Performance
Anglo American plc Press Release 2021 3
People
Tightly linked to our safety imperative and our Values, we strive to create a workplace that is safe in every respect, inclusive and that empowers every colleague to bring their whole self to work. We have zero tolerance for any form of bullying, harassment or victimisation and we know there is no room for complacency when it comes to culture in any organisation. To that end, we have extensive training, systems and processes in place to keep improving both physical and psychological safety, with an increased focus on addressing gender-based and domestic violence since 2019, including in host communities. We will continue to embed and launch initiatives that will allow us to realise our vision of a truly inclusive workplace where every employee can reach their full potential.
We also continue to make progress against our diversity goals, including to achieve 33% female representation in management by 2023. The proportion of women at this level increased to 31% (2020: 27%), while female employees across the company represent 23% of our workforce.
WeCare – our global response to the pandemic
Anglo American acted quickly at the onset of the pandemic to support the lives and livelihoods of our workforce and host communities through the health, social and economic effects of the Covid-19 pandemic – through our global “WeCare” response programme. Our mines and host communities, which are also often home to much of our workforce, operate as an ecosystem and both must be healthy to prosper. Across our operational footprint and in those communities that are local to our operations, WeCare provides information and extensive practical support across four pillars of: physical health, mental health, Living with Dignity, and community response:
Physical health – education and behavioural change to support personal health and hygiene; health screening and testing; PPE and medical equipment and facilities; vaccination information programme; and support for government-led vaccination programmes, including licensing our own medical facilities in South Africa to vaccinate employees, to encourage vaccination at the earliest opportunity.
Mental health – employee support programmes, including via our employee app, expanding the number of professionally trained mental health first aiders, and online events and other digital materials.
Living with Dignity – direct employee and community support to combat the prevalence of gender-based and domestic violence; work with health authorities to identify abuse cases and referrals to support mechanisms.
Community response – wide-ranging livelihoods programme to support communities through the social and economic effects of the pandemic, including: public information campaigns aimed at health and hygiene; health screening and Covid-19 testing; support for health service provision; continuation of essential services (e.g. water, energy, accommodation); food package distribution; employee match-giving programme; support for SMEs and entrepreneurs; support for teachers and students; job training for post-pandemic employability; and regional development planning to enhance local economic activity for the long term.
Anglo American Foundation – special endowment of $100 million
Building on the extensive in-kind support and financial contributions as part of the WeCare programme detailed above, in July 2021 we committed to endowing the Anglo American Foundation with a $100 million donation. The Anglo American Foundation is focused on accelerating progress towards the United Nations’ Sustainable Development Goals (UNSDGs), placing a particular importance on programmes that empower women, youth and vulnerable groups. By partnering with non-profit, public and private organisations, the Anglo American Foundation supports health, education, economic and environmental projects aligned with the goals of Anglo American’s Sustainable Mining Plan – itself designed to align with the UNSDGs.
This special endowment presented an opportunity for the Foundation to redefine its strategy, including governance and operating model, to ensure it can deliver to an entirely new level – creating systemic impact at scale. Aligned with Anglo American’s Purpose, the Foundation will become a strategic grant-maker focusing on long-term system‑level change within three themes, each with two ‘signature’ topics:
• Clean water and energy: water resource management; access to (clean) energy / off-grid solutions• Skills and job creation for growth: development of relevant skills for current and future jobs (focus on youth);
incubating innovative tech; and supporting SMEs and entrepreneurs• Healthy living: access to primary health care; preventative health care
Geographically, the Foundation focuses its funding on the current, and potential future, footprint of Anglo American. During 2022, the Foundation is working with strategic partners to detail the priority areas of focus and design a number of programmatic interventions.
Anglo American Preliminary Results Sustainability Performance
4 Anglo American plc Press Release 2021

Operational and financial review of Group results for the year ended 31 December 2021
Operational performance
Improved operational performances at PGMs, De Beers and Kumba (Iron Ore) contributed to a 5% production increase on a copper equivalent basis(1). This was driven in part by the easing of certain Covid-19 related restrictions that impacted production throughout 2020, as well as improved mining performance and processing stability at PGMs, planned higher rough diamond production at De Beers in response to strong consumer demand, and improved plant availability at Kumba. These improvements were partially offset by the continued suspension of longwall operations at Grosvenor, operational issues and geological conditions at Moranbah (Metallurgical Coal), unplanned maintenance at Minas-Rio (Iron Ore), and licensing delays at Nickel. In response to the pandemic, comprehensive safeguarding measures remain in place at operations, which have helped a return to more normal operating levels, with production generally maintained at approximately 95%(2) of normal capacity across the year.
De Beers’ rough diamond production increased by 29% to 32.3 million carats (2020: 25.1 million carats), in response to the strong recovery in consumer demand following the impact of Covid-19 in 2020.
Copper production was in line with the prior year at 647,200 tonnes (2020: 647,400 tonnes). At Los Bronces, production increased marginally by 1% to 327,700 tonnes (2020: 324,700 tonnes) due to higher water availability owing to water management initiatives, partially offset by planned lower grades. A strong plant performance at Collahuasi improved attributable production to a record 277,200 tonnes (2020: 276,900 tonnes).
Nickel production decreased by 4% to 41,700 tonnes (2020: 43,500 tonnes), due to licencing delays and lower ore grades.
PGMs’ production (metal in concentrate) increased by 13% to 4,298,700 ounces (2020: 3,808,900 ounces), reflecting the impact in 2020 of the temporary shutdown of operations in response to the Covid-19 pandemic, the improved mining performance at both Amandelbult and Mogalakwena, as well as processing stability. Refined PGM production increased to a record 5,138,400 ounces (2020: 2,713,000 ounces), reflecting the strong performance of the converter plant (ACP) Phase A unit following its successful rebuild in 2020. The ACP Phase B rebuild was completed in January 2022 and is expected to be recommissioned in the first quarter of 2022.
Iron ore production increased by 3% to 63.8 Mt (2020: 61.7 Mt). At Kumba, production increased by 9% to 40.9 Mt (2020: 37.6 Mt), owing to the easing of Covid-19 related restrictions that had affected production in 2020, and improved plant availability. Minas-Rio production decreased by 5% to 22.9 Mt (2020: 24.1 Mt), due to unplanned maintenance at the beneficiation plant.
Metallurgical coal production decreased by 11% to 14.9 Mt (2020: 16.8 Mt), principally due to the suspension of longwall operations at Grosvenor since May 2020 following the underground incident, and the elevated gas levels at Moranbah that resulted in the stoppage of longwall operations from 21 February 2021 until 3 June 2021. Operations at Moranbah were further impacted by challenging geological conditions in the second half of the year. Grosvenor longwall production received approval to restart in February 2022 and is now operational again.
Manganese ore production increased by 5% to 3.7 Mt (2020: 3.5 Mt).
Thermal coal export production was 9.3 Mt (2020: 20.6 Mt). In South Africa, production was 5.7 Mt (2020: 16.5 Mt), reflecting the demerger of operations on 4 June 2021. In Colombia, attributable production was 3.6 Mt (2020: 4.1 Mt), which reflects production until 30 June 2021, when the sale agreement for Cerrejón was reached. Both of these businesses have now been exited.
Group copper equivalent unit costs(1) increased by 16% in US dollar terms and 10% in local currency terms, due to stronger producer currencies and input cost increases at most of our operations, despite higher production.
(1) Copper equivalent production and unit cost is normalised to reflect the demerger of the South Africa thermal coal operations, the sale of our shareholding in Cerrejón and the closure of the manganese alloy operations.
(2) Production capacity excludes Grosvenor.
Anglo American Preliminary Results
Anglo American plc Press Release 2021 5
Financial performance
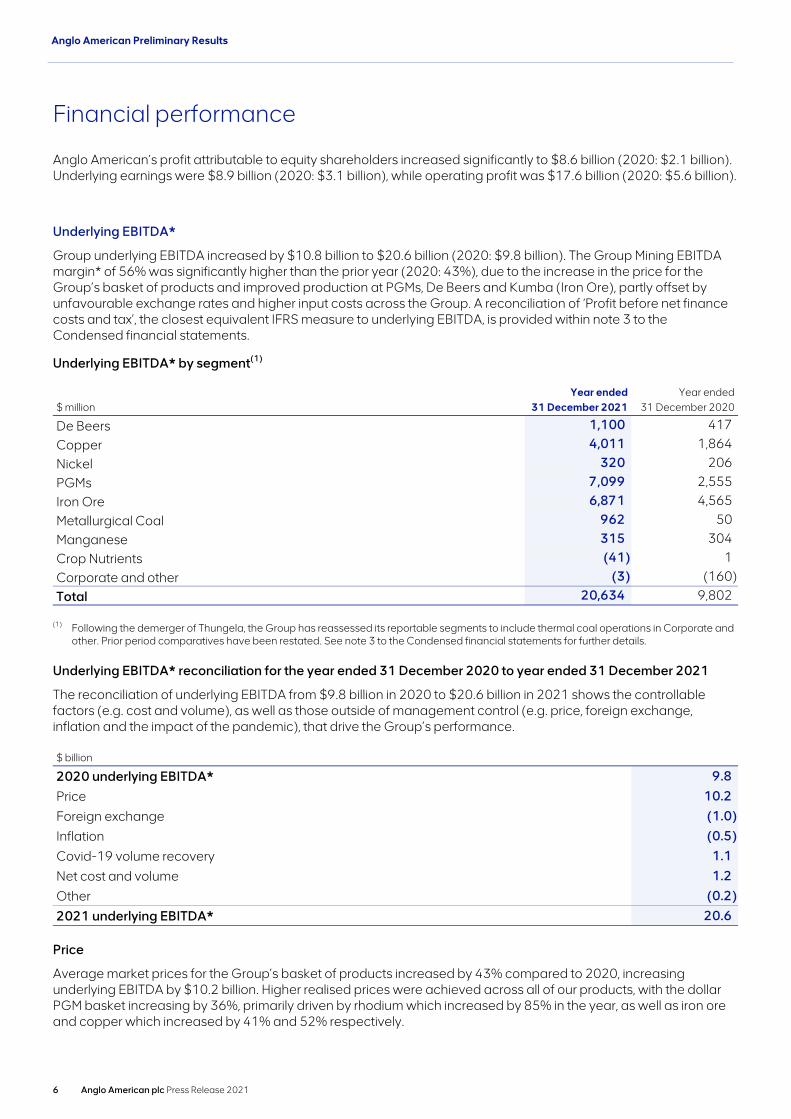
Anglo American’s profit attributable to equity shareholders increased significantly to $8.6 billion (2020: $2.1 billion). Underlying earnings were $8.9 billion (2020: $3.1 billion), while operating profit was $17.6 billion (2020: $5.6 billion).
Underlying EBITDA*
Group underlying EBITDA increased by $10.8 billion to $20.6 billion (2020: $9.8 billion). The Group Mining EBITDA margin* of 56% was significantly higher than the prior year (2020: 43%), due to the increase in the price for the Group’s basket of products and improved production at PGMs, De Beers and Kumba (Iron Ore), partly offset by unfavourable exchange rates and higher input costs across the Group. A reconciliation of ‘Profit before net finance costs and tax’, the closest equivalent IFRS measure to underlying EBITDA, is provided within note 3 to the Condensed financial statements.
Underlying EBITDA* by segment(1)
Year ended Year ended$ million 31 December 2021 31 December 2020
De Beers 1,100 417
Copper 4,011 1,864
Nickel 320 206
PGMs 7,099 2,555
Iron Ore 6,871 4,565
Metallurgical Coal 962 50
Manganese 315 304
Crop Nutrients (41) 1
Corporate and other (3) (160)
Total 20,634 9,802
(1) Following the demerger of Thungela, the Group has reassessed its reportable segments to include thermal coal operations in Corporate and other. Prior period comparatives have been restated. See note 3 to the Condensed financial statements for further details.
Underlying EBITDA* reconciliation for the year ended 31 December 2020 to year ended 31 December 2021
The reconciliation of underlying EBITDA from $9.8 billion in 2020 to $20.6 billion in 2021 shows the controllable factors (e.g. cost and volume), as well as those outside of management control (e.g. price, foreign exchange, inflation and the impact of the pandemic), that drive the Group’s performance.
$ billion
2020 underlying EBITDA* 9.8
Price 10.2
Foreign exchange (1.0)
Inflation (0.5)
Covid-19 volume recovery 1.1
Net cost and volume 1.2
Other (0.2)
2021 underlying EBITDA* 20.6
Price
Average market prices for the Group’s basket of products increased by 43% compared to 2020, increasing underlying EBITDA by $10.2 billion. Higher realised prices were achieved across all of our products, with the dollar PGM basket increasing by 36%, primarily driven by rhodium which increased by 85% in the year, as well as iron ore and copper which increased by 41% and 52% respectively.
Anglo American Preliminary Results
6 Anglo American plc Press Release 2021
Foreign exchange
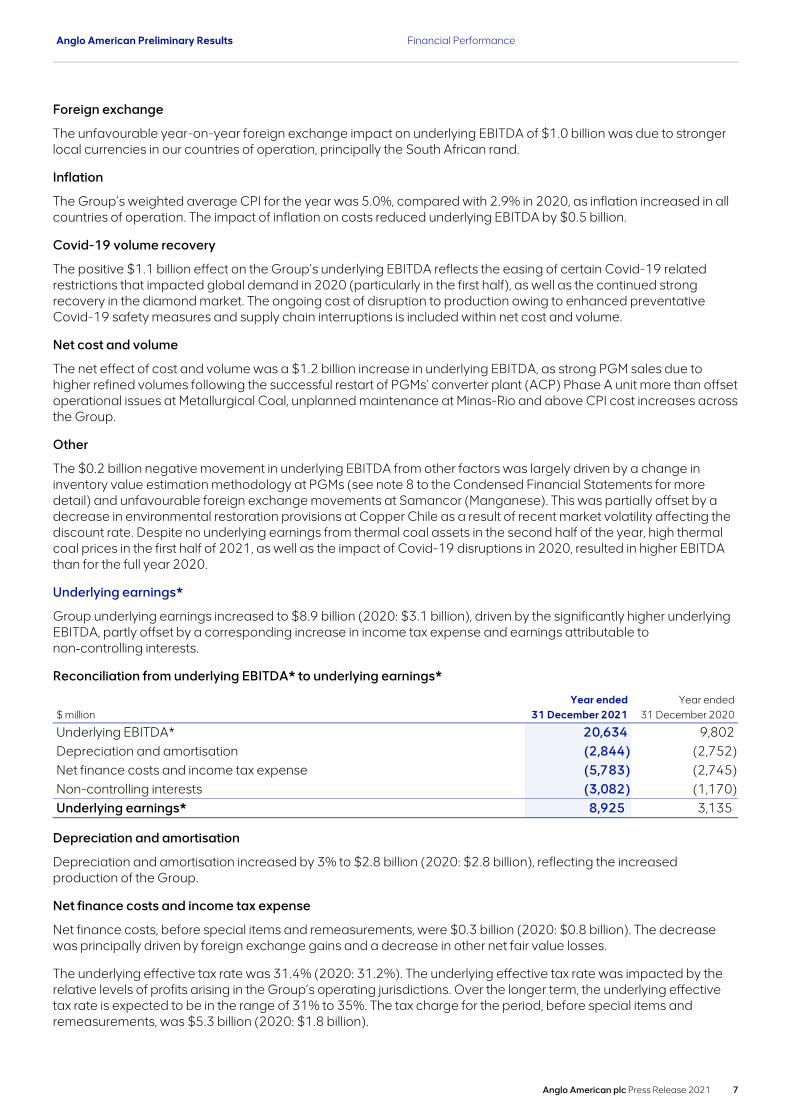
The unfavourable year-on-year foreign exchange impact on underlying EBITDA of $1.0 billion was due to stronger local currencies in our countries of operation, principally the South African rand.
Inflation
The Group’s weighted average CPI for the year was 5.0%, compared with 2.9% in 2020, as inflation increased in all countries of operation. The impact of inflation on costs reduced underlying EBITDA by $0.5 billion.
Covid-19 volume recovery
The positive $1.1 billion effect on the Group’s underlying EBITDA reflects the easing of certain Covid-19 related restrictions that impacted global demand in 2020 (particularly in the first half), as well as the continued strong recovery in the diamond market. The ongoing cost of disruption to production owing to enhanced preventative Covid-19 safety measures and supply chain interruptions is included within net cost and volume.
Net cost and volume
The net effect of cost and volume was a $1.2 billion increase in underlying EBITDA, as strong PGM sales due to higher refined volumes following the successful restart of PGMs’ converter plant (ACP) Phase A unit more than offset operational issues at Metallurgical Coal, unplanned maintenance at Minas-Rio and above CPI cost increases across the Group.
Other
The $0.2 billion negative movement in underlying EBITDA from other factors was largely driven by a change in inventory value estimation methodology at PGMs (see note 8 to the Condensed Financial Statements for more detail) and unfavourable foreign exchange movements at Samancor (Manganese). This was partially offset by a decrease in environmental restoration provisions at Copper Chile as a result of recent market volatility affecting the discount rate. Despite no underlying earnings from thermal coal assets in the second half of the year, high thermal coal prices in the first half of 2021, as well as the impact of Covid-19 disruptions in 2020, resulted in higher EBITDA than for the full year 2020.
Underlying earnings*
Group underlying earnings increased to $8.9 billion (2020: $3.1 billion), driven by the significantly higher underlying EBITDA, partly offset by a corresponding increase in income tax expense and earnings attributable to non‑controlling interests.
Reconciliation from underlying EBITDA* to underlying earnings*
Year ended Year ended$ million 31 December 2021 31 December 2020
Underlying EBITDA* 20,634 9,802Depreciation and amortisation (2,844) (2,752) Net finance costs and income tax expense (5,783) (2,745) Non-controlling interests (3,082) (1,170) Underlying earnings* 8,925 3,135
Depreciation and amortisation
Depreciation and amortisation increased by 3% to $2.8 billion (2020: $2.8 billion), reflecting the increased production of the Group.
Net finance costs and income tax expense
Net finance costs, before special items and remeasurements, were $0.3 billion (2020: $0.8 billion). The decrease was principally driven by foreign exchange gains and a decrease in other net fair value losses.
The underlying effective tax rate was 31.4% (2020: 31.2%). The underlying effective tax rate was impacted by the relative levels of profits arising in the Group’s operating jurisdictions. Over the longer term, the underlying effective tax rate is expected to be in the range of 31% to 35%. The tax charge for the period, before special items and remeasurements, was $5.3 billion (2020: $1.8 billion).
Anglo American Preliminary Results Financial Performance
Anglo American plc Press Release 2021 7
Non-controlling interests
The share of underlying earnings attributable to non-controlling interests of $3.1 billion (2020: $1.2 billion) principally relates to minority shareholdings in Kumba (Iron Ore), PGMs and Copper.
Special items and remeasurements
Special items and remeasurements (after tax and non-controlling interests) are a net charge of $0.4 billion (2020: net charge of $1.0 billion), including tax special items and remeasurements arising in Iron Ore Brazil (Iron Ore) and Nickel of $0.3 billion; impairment charges of $0.6 billion at Moranbah/Grosvenor, Dawson and Capcoal (Metallurgical Coal); and a loss of $0.4 billion on the demerger of the South African thermal coal operations (Corporate and other), offset by impairment reversals of $1.0 billion mainly related to Minas-Rio (Iron Ore).
Full details of the special items and remeasurements recorded are included in note 9 to the Condensed financial statements.
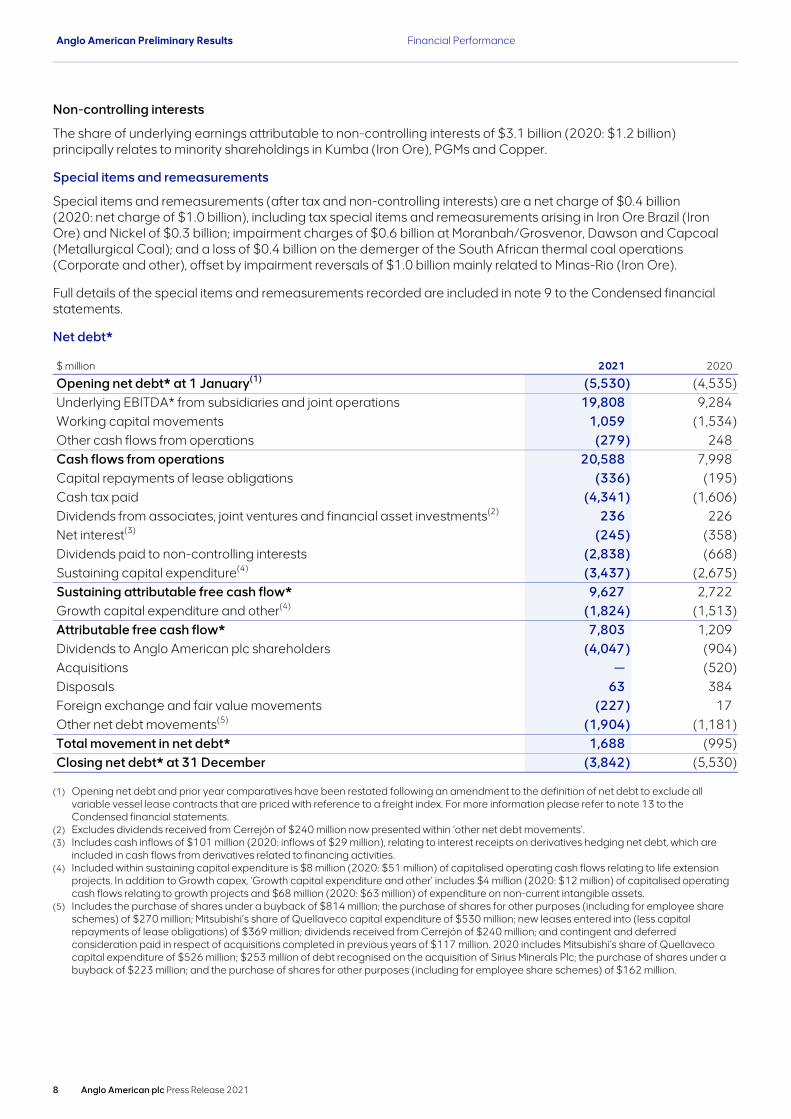
Net debt*
$ million 2021 2020
Opening net debt* at 1 January(1) (5,530) (4,535) Underlying EBITDA* from subsidiaries and joint operations 19,808 9,284 Working capital movements 1,059 (1,534) Other cash flows from operations (279) 248 Cash flows from operations 20,588 7,998 Capital repayments of lease obligations (336) (195) Cash tax paid (4,341) (1,606) Dividends from associates, joint ventures and financial asset investments(2) 236 226 Net interest(3) (245) (358) Dividends paid to non-controlling interests (2,838) (668) Sustaining capital expenditure(4) (3,437) (2,675) Sustaining attributable free cash flow* 9,627 2,722 Growth capital expenditure and other(4) (1,824) (1,513) Attributable free cash flow* 7,803 1,209 Dividends to Anglo American plc shareholders (4,047) (904) Acquisitions — (520) Disposals 63 384 Foreign exchange and fair value movements (227) 17 Other net debt movements(5) (1,904) (1,181) Total movement in net debt* 1,688 (995) Closing net debt* at 31 December (3,842) (5,530)
(1) Opening net debt and prior year comparatives have been restated following an amendment to the definition of net debt to exclude all variable vessel lease contracts that are priced with reference to a freight index. For more information please refer to note 13 to the Condensed financial statements.
(2) Excludes dividends received from Cerrejón of $240 million now presented within ‘other net debt movements’.(3) Includes cash inflows of $101 million (2020: inflows of $29 million), relating to interest receipts on derivatives hedging net debt, which are
included in cash flows from derivatives related to financing activities.(4) Included within sustaining capital expenditure is $8 million (2020: $51 million) of capitalised operating cash flows relating to life extension
projects. In addition to Growth capex, ‘Growth capital expenditure and other’ includes $4 million (2020: $12 million) of capitalised operating cash flows relating to growth projects and $68 million (2020: $63 million) of expenditure on non-current intangible assets.
(5) Includes the purchase of shares under a buyback of $814 million; the purchase of shares for other purposes (including for employee share schemes) of $270 million; Mitsubishi’s share of Quellaveco capital expenditure of $530 million; new leases entered into (less capital repayments of lease obligations) of $369 million; dividends received from Cerrejón of $240 million; and contingent and deferred consideration paid in respect of acquisitions completed in previous years of $117 million. 2020 includes Mitsubishi’s share of Quellaveco capital expenditure of $526 million; $253 million of debt recognised on the acquisition of Sirius Minerals Plc; the purchase of shares under a buyback of $223 million; and the purchase of shares for other purposes (including for employee share schemes) of $162 million.
Anglo American Preliminary Results Financial Performance
8 Anglo American plc Press Release 2021

Net debt (including related derivatives) of $3.8 billion has decreased by $1.7 billion since 31 December 2020, driven by robust cash flows from operations of $20.6 billion. The Group generated strong sustaining attributable free cash inflows of $9.6 billion, used in part to fund growth capital expenditure of $1.8 billion and dividends paid to Anglo American plc shareholders of $4.0 billion. New leases entered into, including for the Group's London head office, added $0.7 billion to net debt. Net debt at 31 December 2021 represented gearing (net debt to equity) of 10% (2020: 14%).
Cash flow
Cash flows from operations
Cash flows from operations increased to $20.6 billion (2020: $8.0 billion), reflecting an increase in underlying EBITDA from subsidiaries and joint operations, and a working capital reduction of $1.1 billion (2020: increase of $1.5 billion). A reduction in inventories of $0.3 billion was driven by a change in the inventory value estimation methodology that reduced the cost of purchased concentrate at PGMs (see note 8 to the Condensed financial statements for more detail); and an increase in payables of $1.4 billion was driven by a higher customer pre‑payment within PGMs and provisionally priced sale adjustments within Iron Ore. These were partly offset by an increase in receivables of $0.6 billion, mainly owing to increased base metal prices.
Capital expenditure*
Year ended Year ended$ million 31 December 2021 31 December 2020
Stay-in-business 2,068 1,566 Development and stripping 904 769 Life extension projects 474 296 Proceeds from disposal of property, plant and equipment (17) (7) Sustaining capital 3,429 2,624 Growth projects 1,752 1,438 Total 5,181 4,062 Capitalised operating cash flows 12 63 Total capital expenditure 5,193 4,125
Capital expenditure increased to $5.2 billion (2020: $4.1 billion), as comprehensive response plans partially mitigated the impact of the Covid-19 pandemic, which affected spend in 2020, and ensured business continuity.
Sustaining capital expenditure increased to $3.4 billion (2020: $2.6 billion), driven by the roll-over of deferred expenditure from 2020 owing to Covid-19 related restrictions and the effect of stronger local currencies in our countries of operation.
Growth capital expenditure increased to $1.8 billion (2020: $1.4 billion), largely due to higher expenditure incurred at the Woodsmith polyhalite project of $0.5 billion (2020: $0.3 billion) following the acquisition of the project in the first half of 2020.
Attributable free cash flow*
The Group’s attributable free cash flow increased to $7.8 billion (2020: $1.2 billion) due to higher cash flows from operations of $20.6 billion (2020: $8.0 billion). This was partially offset by increased capital expenditure of $5.2 billion (2020: $4.1 billion), higher tax payments of $4.3 billion (2020: $1.6 billion) and increased dividends paid to non-controlling interests of $2.8 billion (2020: $0.7 billion).
Shareholder returns
In line with the Group’s established dividend policy to pay out 40% of underlying earnings, the Board has proposed a dividend of $1.18 per share (2020: $0.72 per share), as well as a special dividend of $0.50 per share, bringing the total dividends paid and proposed in respect of 2021 to $4.19 per share (2020: $1.00 per share), equivalent to $5.2 billion (2020: $1.2 billion). The timetable for the special dividend will follow the same timetable as for the payment of Anglo American’s final dividend. For further information, please refer to the ‘Notice of Final Dividend’ set out on page 91.
The Group has made significant progress in deleveraging and strengthening the balance sheet and, given the levels of cash generated in the business, along with the further value potential in Anglo American, excess cash was paid
Anglo American Preliminary Results Financial Performance
Anglo American plc Press Release 2021 9

out to shareholders in the second half of the year. In September 2021, in addition to the interim base dividend, the Group paid a special dividend of $1.0 billion equal to $0.80 per share. Anglo American also returned $0.8 billion to shareholders in 2021, as part of a $1.0 billion on-market share buyback programme that completed on 11 February 2022, at an average price of £28.84 per share.
Acquisitions
The Group completed no material acquisitions in the year. In the prior year, on 17 March 2020, the Group completed the acquisition of Sirius Minerals Plc for a cash consideration of $0.5 billion.
Disposals
On 4 June 2021, the Group demerged its thermal coal operations in South Africa into a newly incorporated company, Thungela Resources Limited (‘Thungela’), that was subsequently admitted to trading on both the Johannesburg and London stock exchanges on 7 June 2021. The demerged assets included net cash of $0.2 billion. Following the demerger, no further production from South African thermal coal was reported by Anglo American.
Net cash received from disposals was $0.1 billion (2020: $0.4 billion), being deferred and contingent consideration in respect of previous divestments by PGMs and Copper, partially offset by the net cash disposed in 2021 through the demerger of the Group’s South African thermal coal operations.
Balance sheet
Net assets increased by $2.0 billion to $34.8 billion (2020: $32.8 billion), reflecting the profit for the period, offset by dividend payments to Company shareholders and non-controlling interests.
Attributable ROCE*
Attributable ROCE increased to 43% (2020: 17%). Attributable underlying EBIT was higher at $13.5 billion (2020: $5.3 billion), reflecting the impact of significantly higher realised prices achieved for the Group’s products and the easing of Covid-19 related restrictions that impacted sales in 2020. Average attributable capital employed increased to $31.4 billion (2020: $30.5 billion), primarily due to growth capital expenditure, largely at Quellaveco (Copper) and Woodsmith (Crop Nutrients).
Liquidity and funding
Group liquidity remains conservative at $17.1 billion (2020: $17.5 billion), comprising $9.1 billion of cash and cash equivalents (2020: $7.5 billion) and $8.0 billion of undrawn committed facilities (2020: $10.0 billion).
In March 2021, the Group issued $500 million 2.250% Senior Notes due 2028, and $500 million 2.875% Senior Notes due 2031, as part of the Group’s routine financing activities.
In June 2021, the Group bought back US dollar denominated bonds with maturities in 2025. The Group used $1.0 billion of cash to retire $0.9 billion of contractual repayment obligations (including derivatives hedging the bonds).
The weighted average maturity on the Group’s bonds decreased marginally to 6.2 years (31 December 2020: 6.3 years).
The Group has an undrawn $4.7 billion revolving credit facility due to mature in March 2025.
In April 2020, the Group signed a new $2.0 billion revolving credit facility with an initial maturity date of April 2021. After the Group’s $1.0 billion bond issuance in March 2021, the Group issued a notice of cancellation for the facility, which became effective in March 2021 and, accordingly, this facility is no longer available.
Anglo American Preliminary Results Financial Performance
10 Anglo American plc Press Release 2021
Portfolio upgrade
Anglo American continues to evolve its portfolio of competitive, world class assets towards those future-enabling products that are fundamental to enabling a low carbon economy and that cater to global consumer demand trends. Aligned to this strategy, the Group commenced or completed several transactions in 2021.
In April 2021, Anglo American reached a significant milestone in delivering our environmental commitments, securing 100% renewable electricity supply for all our operations in South America including by, for example, signing an agreement to provide 100% renewable electricity for the Quellaveco copper operation in Peru, where the mains power supply will come entirely from renewables from 2022, having already met our objective to source electricity entirely from renewables in Chile from 2021, and Brazil from 2022.
In June 2021, we completed the demerger of our thermal coal operations in South Africa through the creation of a new stand-alone company, Thungela, which has a primary listing on the Johannesburg Stock Exchange, and a standard listing on the London Stock Exchange.
On 20 December 2021, Anglo American Platinum announced its sale of its 49% interest in Bokoni. The transaction is subject to the fulfilment or waiver of notable conditions precedent and is expected to complete during 2022.
In January 2022, Anglo American Platinum entered into transaction agreements for the sale of its 50% interests in the Kroondal and Marikana pool-and-share agreements (the ‘PSAs’) to Sibanye-Stillwater (Sibanye). The transaction is subject to regulatory approvals, including section 11 consent for the transfer of the mining right and approvals by the Competition Authorities, as well as the delivery of 1.35 million 4E ounces of metal in concentrate by the Kroondal PSA (100% basis).
On 11 January 2022, we completed the sale of our 33.3% shareholding in Cerrejón to Glencore plc for a total cash consideration of $0.3 billion, before adjustment for dividends received in 2021. The agreement is effective on 31 December 2020 and, therefore, economic benefits from 1 January 2021 onwards have not accrued to Anglo American.
Both the Thungela demerger and Cerrejón sale represent the final stage of our responsible exit from thermal coal operations.
Anglo American Preliminary Results Financial Performance
Anglo American plc Press Release 2021 11

Growth projects (metrics presented on a 100% basis unless otherwise indicated)
Progress and current expectations in respect of our key growth projects are as follows:
Copper
Quellaveco New copper mine in Moquegua, Peru producing c. 300 ktpa (100% basis, 180 ktpa our share) over the first 10 years in Q1 cost curve position.
c.2.8 (Anglo American 60% share)
0.7 –0.8 (Anglo American 60% share)
2022 Construction began in 2018. The project is moving into the final stages as all major works near completion. Significant milestones delivered include: the start of pre-stripping in April 2021; first ore excavated in October; pre-commissioning activities commenced at the first grinding line in the processing plant; and completion of the water dam (to mainly provide fresh water to communities) and the tailings starter dam. First production is expected mid-2022 but remains subject to the current and ongoing impacts of the pandemic. Refer to the Technology projects table below for Coarse Particle Recovery at Quellaveco.
Collahuasi Phase 1 expansion focused on near-term P101 optimisation opportunities, the implementation of a fifth ball mill (approved) and a restart of leaching activities to add c.50 ktpa (44% basis). Additional debottlenecking options to further increase throughput remain under study.
Further phase expansions are in early stage study to increase production by up to an additional 100 ktpa (44% basis).
Fifth ball mill approved; other studies ongoing
c. 0.3 in total, with 5th ball mill c.0.1 (44% basis). Additional expansion studies ongoing. Subject to permitting and approvals
2023 As part of the routine environmental approval (EIA) cycle a nominal expansion of throughput to 210 ktpd has been submitted as part of this application. EIA approval was obtained in December 2021, enabling expansion of the processing capacity up to a maximum 210 ktpd and the construction of a desalination plant and related infrastructure to provide a sustainable alternative water source.
The fifth ball mill project (first stage of the expansion) is progressing according to plan with the execution of early works and purchase of critical items. The expected start up is during Q4 2023.
Operation ScopeCapex $bn
Remaining Capex $bn First production Progress
Anglo American Preliminary Results Financial Performance
12 Anglo American plc Press Release 2021

Diamonds
Marine Namibia New diamond recovery vessel, adding 0.5 Mctpa (100% basis) of some of the highest value diamonds in the portfolio.
c.0.2 (Anglo American 50% share)
<0.1 (Anglo American 50% share)
2022 Construction began in 2019 and the vessel was successfully completed and delivered to Cape Town in Q3 2021 where recovery and plant systems have been installed. The vessel is currently undergoing sea trials and is on track for commissioning in Q1 2022.
Crop Nutrients
Woodsmith New polyhalite (natural mineral fertiliser) mine being developed in Yorkshire, UK. Expected to produce POLY4 – a premium quality, low carbon fertiliser certified for organic use.
Subject to development timeline review
Subject to development timeline review
Subject to development timeline review
Ongoing technical review confirmed there are several improvements to modify design to bring it up to Anglo American’s safety and operating integrity standards and optimise value for the long term. There has also been a leadership change, with Tom McCulley having replaced Chris Fraser as CEO of Crop Nutrients.
Iron Ore
Sishen Implementation of Ultra High Dense Media Separation (UHDMS) technology at Kumba’s Sishen operation will enable an increase in premium product production and the beneficiation of lower grade materials by reducing the current cut-off grade of <48% Fe to <40% Fe. In addition, the project contributes an additional 3–4 years to Sishen’s life of mine to 2039.
0.2 0.2 2023 Project execution approved in Feb 2021.
PGMs
Mogalakwena Evaluating various options to expand PGM production of the mine through technology development and deployment and the optimal mine plan to deliver feed to the concentrators.
Number of options being considered
Not yet approved ~2026 The Future of Mogalakwena (FoM) work continues to make good progress in the six workstreams:
Each of the six workstreams have several steps to unlock value. Although integrated, the workstreams allow for separate approval stage gates and an optimised development pathway.
Operation ScopeCapex $bn
Remaining Capex $bn First production Progress
Anglo American Preliminary Results Financial Performance
Anglo American plc Press Release 2021 13
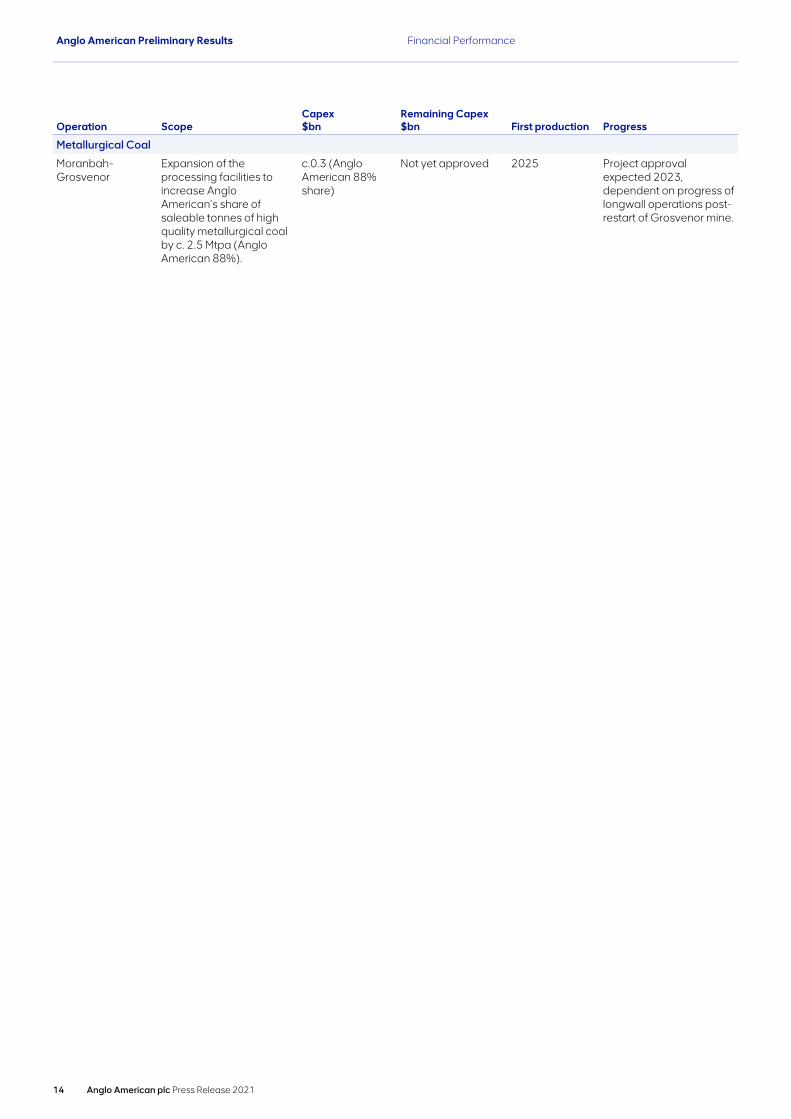
Metallurgical Coal
Moranbah-Grosvenor
Expansion of the processing facilities to increase Anglo American’s share of saleable tonnes of high quality metallurgical coal by c. 2.5 Mtpa (Anglo American 88%).
c.0.3 (Anglo American 88% share)
Not yet approved 2025 Project approval expected 2023, dependent on progress of longwall operations post-restart of Grosvenor mine.
Operation ScopeCapex $bn
Remaining Capex $bn First production Progress
Anglo American Preliminary Results Financial Performance
14 Anglo American plc Press Release 2021

Life extension projects (metrics presented on a 100% basis unless otherwise indicated)
Progress and current expectations in respect of our key life extension projects are as follows:
Operation ScopeCapex $bn
Remaining spend $bn
Expected first production Progress
Diamonds
Venetia 4 Mctpa underground replacement for the existing open pit. The project is expected to add an estimated 88 million carats and extend the life of the mine to 2047.
2.1 1.2 2023 Open-pit mining at Venetia is planned to end in H2 2022, with the transition to underground mining starting thereafter.
Jwaneng 9 Mctpa replacement (100% basis) for cuts 7 and 8. The Cut-9 expansion of Jwaneng will extend the life of the mine to 2036 and is expected to yield approximately 57 million carats of rough diamonds.
0.3 (Anglo American 19.2% share)
0.2 (Anglo American 19.2% share)
2027 Project progressing on schedule.
Metallurgical Coal
Aquila 3.5 Mtpa (70% basis), 7 year extension of Capcoal’s underground operations with Grasstree approaching end of life. Aquila will be a longwall operation leveraging the existing Grasstree infrastructure and producing high quality hard coking coal. The project will extend the life of the Capcoal underground operations to 2028.
0.2 (Anglo American 70% share)
<0.1 (Anglo American 70% share)
2022 Development work began in September 2019 and first longwall production commenced in February 2022.
Iron Ore
Kolomela 4 Mtpa high grade iron ore replacement project. The development of a new pit, Kapstevel South, and associated infrastructure at Kolomela to help sustain output of c.13 Mtpa and extend the remaining life of mine to 2034.
0.4 0.4 2024 Approved in July 2020. Pit establishment and waste stripping has commenced in 2021, with first ore expected in 2024.
PGMs
Mototolo/Der Brochen
The development of the project leverages the existing Mototolo infrastructure, enabling mining to extend into the adjacent and down-dip Der Brochen resource, which will potentially extend the life of mine beyond 30 years.
0.2 Approved 2023 Approved in December 2021. Execution commenced in Q1 2022, with the majority of capital invested in 2022, 2023 and 2024. First production expected in late 2023.
Anglo American Preliminary Results Financial Performance
Anglo American plc Press Release 2021 15
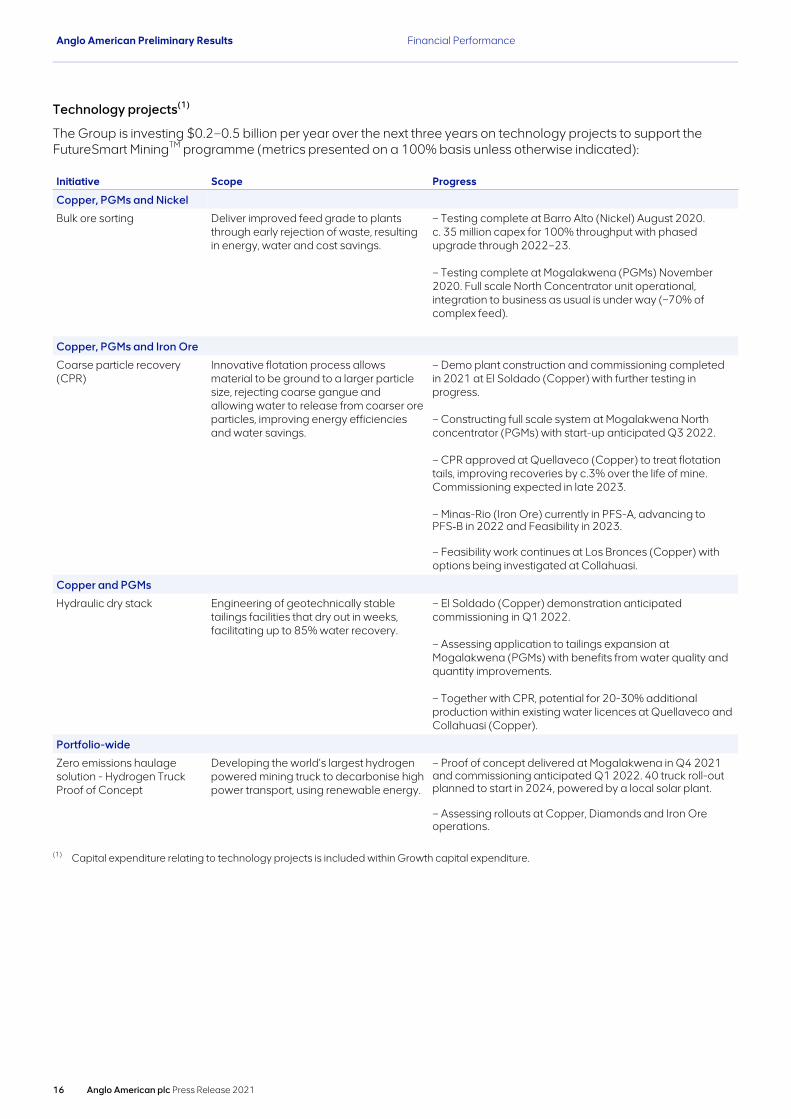
Technology projects(1)
The Group is investing $0.2–0.5 billion per year over the next three years on technology projects to support the FutureSmart MiningTM programme (metrics presented on a 100% basis unless otherwise indicated):
Initiative Scope Progress
Copper, PGMs and Nickel
Bulk ore sorting Deliver improved feed grade to plants through early rejection of waste, resulting in energy, water and cost savings.
– Testing complete at Barro Alto (Nickel) August 2020. c. 35 million capex for 100% throughput with phased upgrade through 2022–23.
– Testing complete at Mogalakwena (PGMs) November 2020. Full scale North Concentrator unit operational, integration to business as usual is under way (~70% of complex feed).
Copper, PGMs and Iron Ore
Coarse particle recovery (CPR)
Innovative flotation process allows material to be ground to a larger particle size, rejecting coarse gangue and allowing water to release from coarser ore particles, improving energy efficiencies and water savings.
– Demo plant construction and commissioning completed in 2021 at El Soldado (Copper) with further testing in progress.
– Constructing full scale system at Mogalakwena North concentrator (PGMs) with start-up anticipated Q3 2022.
– CPR approved at Quellaveco (Copper) to treat flotation tails, improving recoveries by c.3% over the life of mine. Commissioning expected in late 2023.
– Minas-Rio (Iron Ore) currently in PFS-A, advancing to PFS‑B in 2022 and Feasibility in 2023.
– Feasibility work continues at Los Bronces (Copper) with options being investigated at Collahuasi.
Copper and PGMs
Hydraulic dry stack Engineering of geotechnically stable tailings facilities that dry out in weeks, facilitating up to 85% water recovery.
– El Soldado (Copper) demonstration anticipated commissioning in Q1 2022.
– Assessing application to tailings expansion at Mogalakwena (PGMs) with benefits from water quality and quantity improvements.
– Together with CPR, potential for 20-30% additional production within existing water licences at Quellaveco and Collahuasi (Copper).
Portfolio-wide
Zero emissions haulage solution - Hydrogen Truck Proof of Concept
Developing the world’s largest hydrogen powered mining truck to decarbonise high power transport, using renewable energy.
– Proof of concept delivered at Mogalakwena in Q4 2021 and commissioning anticipated Q1 2022. 40 truck roll-out planned to start in 2024, powered by a local solar plant.
– Assessing rollouts at Copper, Diamonds and Iron Ore operations.
(1) Capital expenditure relating to technology projects is included within Growth capital expenditure.
Anglo American Preliminary Results Financial Performance
16 Anglo American plc Press Release 2021
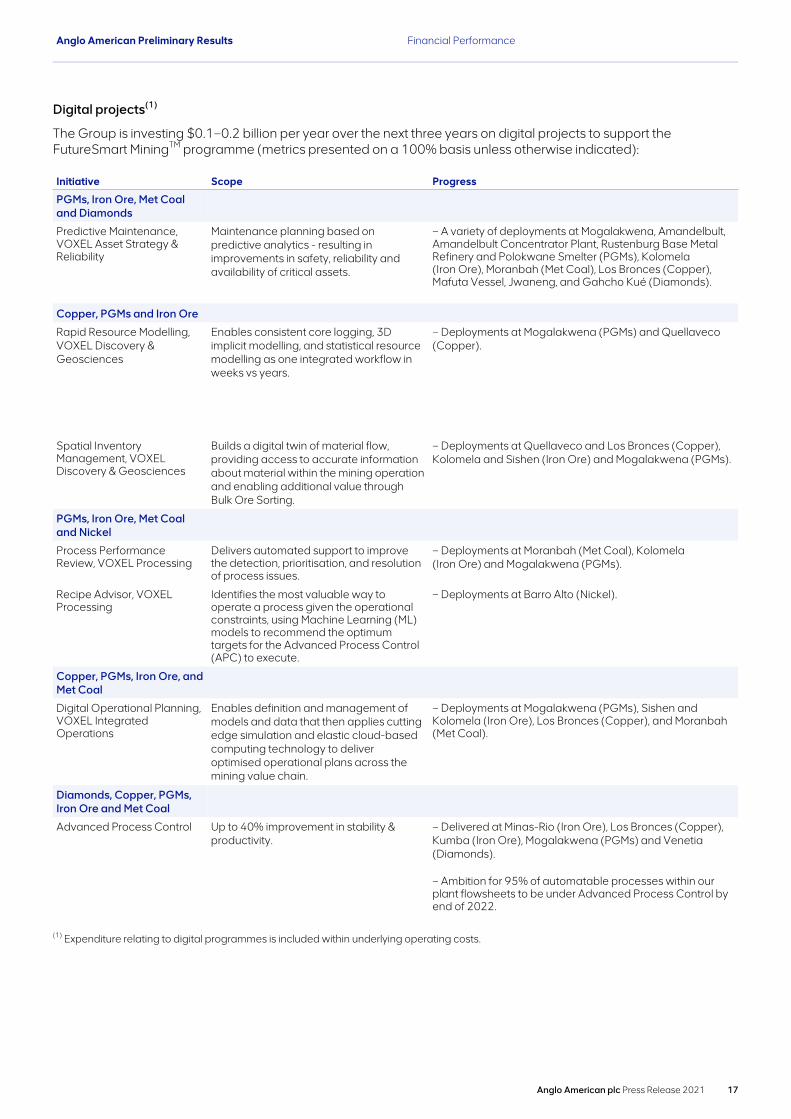
Digital projects(1)
The Group is investing $0.1–0.2 billion per year over the next three years on digital projects to support the FutureSmart MiningTM programme (metrics presented on a 100% basis unless otherwise indicated):
Initiative Scope Progress
PGMs, Iron Ore, Met Coal and Diamonds
Predictive Maintenance, VOXEL Asset Strategy & Reliability
Maintenance planning based on predictive analytics - resulting in improvements in safety, reliability and availability of critical assets.
– A variety of deployments at Mogalakwena, Amandelbult, Amandelbult Concentrator Plant, Rustenburg Base Metal Refinery and Polokwane Smelter (PGMs), Kolomela (Iron Ore), Moranbah (Met Coal), Los Bronces (Copper), Mafuta Vessel, Jwaneng, and Gahcho Kué (Diamonds).
Copper, PGMs and Iron Ore
Rapid Resource Modelling, VOXEL Discovery & Geosciences
Enables consistent core logging, 3D implicit modelling, and statistical resource modelling as one integrated workflow in weeks vs years.
– Deployments at Mogalakwena (PGMs) and Quellaveco (Copper).
Spatial Inventory Management, VOXEL Discovery & Geosciences
Builds a digital twin of material flow, providing access to accurate information about material within the mining operation and enabling additional value through Bulk Ore Sorting.
– Deployments at Quellaveco and Los Bronces (Copper), Kolomela and Sishen (Iron Ore) and Mogalakwena (PGMs).
PGMs, Iron Ore, Met Coal and Nickel
Process Performance Review, VOXEL Processing
Delivers automated support to improve the detection, prioritisation, and resolution of process issues.
– Deployments at Moranbah (Met Coal), Kolomela (Iron Ore) and Mogalakwena (PGMs).
Recipe Advisor, VOXEL Processing
Identifies the most valuable way to operate a process given the operational constraints, using Machine Learning (ML) models to recommend the optimum targets for the Advanced Process Control (APC) to execute.
– Deployments at Barro Alto (Nickel).
Copper, PGMs, Iron Ore, and Met Coal
Digital Operational Planning, VOXEL Integrated Operations
Enables definition and management of models and data that then applies cutting edge simulation and elastic cloud-based computing technology to deliver optimised operational plans across the mining value chain.
– Deployments at Mogalakwena (PGMs), Sishen and Kolomela (Iron Ore), Los Bronces (Copper), and Moranbah (Met Coal).
Diamonds, Copper, PGMs, Iron Ore and Met Coal
Advanced Process Control Up to 40% improvement in stability & productivity.
– Delivered at Minas-Rio (Iron Ore), Los Bronces (Copper), Kumba (Iron Ore), Mogalakwena (PGMs) and Venetia (Diamonds).
– Ambition for 95% of automatable processes within our plant flowsheets to be under Advanced Process Control by end of 2022.
(1) Expenditure relating to digital programmes is included within underlying operating costs.
Anglo American Preliminary Results Financial Performance
Anglo American plc Press Release 2021 17
The Board
Changes during 2021 to the composition of the Board are set out below.
On 1 March 2021, Elisabeth Brinton joined the Board as a non-executive director and as a member of the Sustainability Committee in September 2021.
On 1 June 2021, Hilary Maxson joined the Board as a non-executive director and member of the Audit Committee.
The following non-executive changes were announced in October:
• Ian Tyler joined the Board as a non-executive director and member of the Audit and Remuneration committees on 1 January 2022.
• Anne Stevens and Byron Grote will step down from the Board at the Company’s Annual General Meeting (AGM) on 19 April 2022, having both served for nine years.
• Ian Tyler will succeed Anne Stevens as chair of the Remuneration Committee, and Hilary Maxson will succeed Byron Grote as chair of the Audit Committee, both with effect from the AGM in April 2022.
The following executive changes were announced in November:
• Duncan Wanblad will join the Board as chief executive at the Company’s AGM on 19 April 2022.
• Mark Cutifani will retire as chief executive and step down from the Board at the 2022 AGM, after nine years in the role.
On 23 February 2022, the following non-executive appointments were announced; both to take effect on 19 April 2022:
• Ian Tyler will succeed Byron Grote as the Board’s senior independent director.
• Marcelo Bastos will succeed Byron Grote as the designated non-executive director to chair the Anglo American Global Workforce Advisory Panel.
The names of the directors at the date of this report and the skills and experience our Board members contribute to the long term sustainable success of Anglo American are set out on the Group’s website:
www.angloamerican.com/about-us/leadership-team/board
Anglo American Preliminary Results
18 Anglo American plc Press Release 2021
Principal risks and uncertainties
Anglo American is exposed to a variety of risks and uncertainties which may have a financial, operational or reputational impact on the Group, and which may also have an impact on the achievement of social, economic and environmental objectives. The principal risks and uncertainties facing the Group relate to the following:
• Catastrophic and natural catastrophe risks• Product prices• Cyber security• Political• Community and social relations• Safety• Climate change• Regulatory and permitting• Operational performance• Pandemic• Corruption• Water• Future demand
The Group is exposed to changes in the economic environment, including to tax rates and regimes, as with any other business. Details of any key risks and uncertainties specific to the period are covered in the Operations review section. Details of relevant tax matters are included in note 6 to the Condensed financial statements.
The principal risks and uncertainties facing the Group at the 2021 year end are set out in detail in the strategic report section of the Integrated Annual Report 2021 on the Group’s website from 7 March 2022 www.angloamerican.com.
Anglo American plc Press Release 2021 19

De Beers – Diamonds
Financial and operational metrics(1)
Productionvolume
Salesvolume Price
Unit cost*
Grouprevenue*
UnderlyingEBITDA*
EBITDAmargin*(6)
UnderlyingEBIT* Capex* ROCE*
’000 cts
’000 cts(2) $/ct(3) $/ct(4) $m(5) $m $m $m
De Beers 32,276 33,357 146 58 5,602 1,100 47 % 620 565 7 %
Prior year 25,102 21,380 133 57 3,378 417 54 % 0 381 0 %
Botswana 22,326 n/a 152 32 n/a 464 n/a 407 72 n/a
Prior year 16,559 — 124 35 — 225 — 178 66 —
Namibia 1,467 n/a 565 359 n/a 101 n/a 68 91 n/a
Prior year 1,448 — 492 272 — 113 — 82 77 —
South Africa 5,306 n/a 113 45 n/a 241 n/a 82 309 n/a
Prior year 3,771 — 99 53 — 165 — 16 147 —
Canada 3,177 n/a 62 44 n/a 68 n/a 4 42 n/a
Prior year 3,324 — 58 36 — 92 — 40 31 —
Trading n/a n/a n/a n/a n/a 515 11 % 505 4 n/a
Prior year — — — — — 80 3 % 74 3 —
Other(7) n/a n/a n/a n/a n/a (289) n/a (446) 47 n/a
Prior year — — — — — (258) — (390) 57 —
(1) Prepared on a consolidated accounting basis, except for production, which is stated on a 100% basis except for the Gahcho Kué joint operation in Canada, which is on an attributable 51% basis.
(2) Total sales volumes on a 100% basis were 36.3 million carats (2020: 22.7 million carats). Total sales volumes (100%) include De Beers Group’s joint arrangement partners’ 50% proportionate share of sales to entities outside De Beers Group from Diamond Trading Company Botswana and Namibia Diamond Trading Company.
(3) Pricing for the mining business units is based on 100% selling value post-aggregation of goods. Realised price includes the price impact of the sale of non-equity product and, as a result, is not directly comparable to the unit cost.
(4) Unit cost is based on consolidated production and operating costs, excluding depreciation and operating special items, divided by carats recovered.
(5) Includes rough diamond sales of $4.9 billion (2020: $2.8 billion). (6) Total De Beers EBITDA margin shows mining EBITDA margin on an equity basis, which excludes the impact of non-mining activities,
third‑party sales, purchases, trading downstream and corporate.(7) Other includes Element Six, Brands and consumer markets, acquisition accounting adjustments and corporate.
Markets
The diamond industry continued to recover from the impacts of the Covid-19 pandemic during 2021. In the first half of the year, consumer sales of diamond jewellery in the US and mainland China posted positive growth not only on the Covid-19 affected sales in 2020, but also in comparison to 2019 before the onset of the pandemic. Other global consumer markets initially saw a less pronounced rebound due to the uneven timing of pandemic impacts across the world, but the second half of 2021 saw a more positive recovery trend across the entire international diamond value chain.
The ongoing increase in consumer demand led to strong growth rates in consumer sales of diamond jewellery in the US, with holiday season sales increasing by about a third compared to 2020. The strength of demand was the result of an accumulation of savings by US consumers through the various lockdowns and restrictions on movement seen earlier in the pandemic; a pent-up demand for weddings and engagements; a strong desire for diamonds as meaningful gifts that symbolise personal connection; less luxury travel; and supported by ongoing marketing campaigns (including an increase in marketing effectiveness from De Beers).
The positive demand trends in retail underpinned the increased demand for polished diamonds and as a result, stocks of polished diamonds in cutting centres steadily declined during the course of the year. Lower supply and steady demand for polished diamonds from retailers supported growth in polished diamond prices.
As downstream and midstream demand conditions continued to improve, rough diamond production and prices increased throughout the year, following the significant reductions seen at the start of the pandemic. Midstream sentiment and rough diamond demand were robust throughout 2021.
De Beers
20 Anglo American plc Press Release 2021
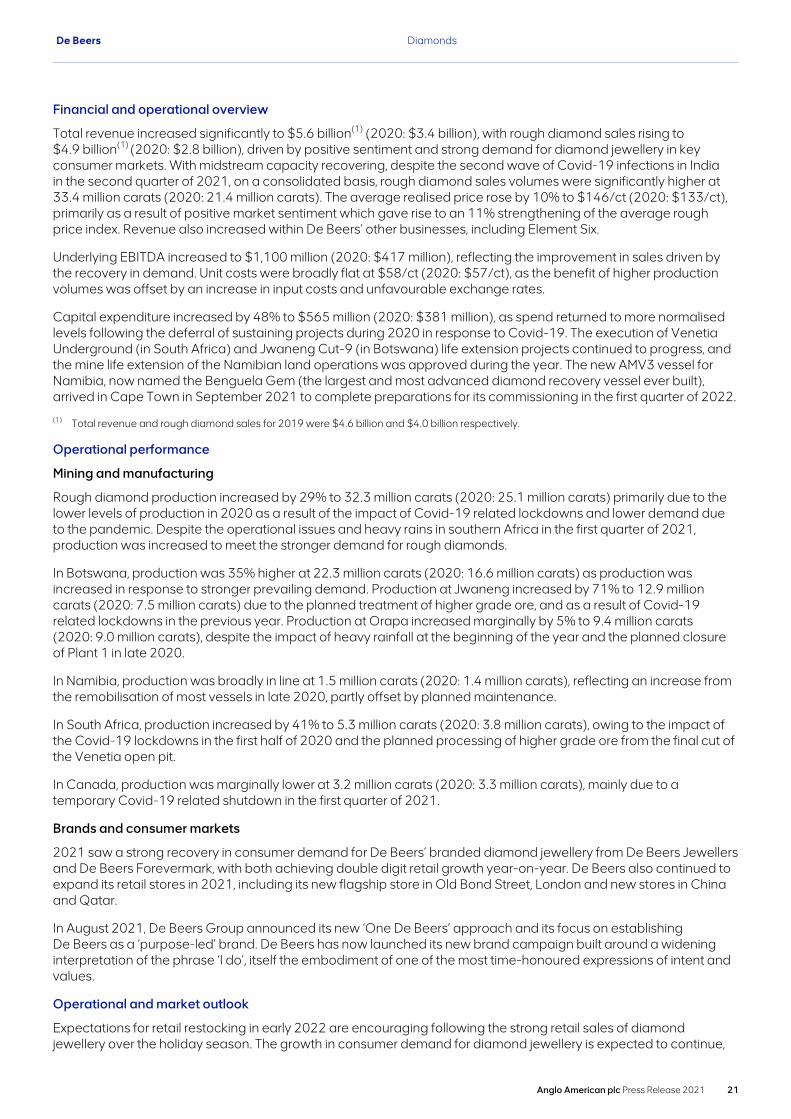
Financial and operational overview
Total revenue increased significantly to $5.6 billion(1) (2020: $3.4 billion), with rough diamond sales rising to $4.9 billion(1) (2020: $2.8 billion), driven by positive sentiment and strong demand for diamond jewellery in key consumer markets. With midstream capacity recovering, despite the second wave of Covid-19 infections in India in the second quarter of 2021, on a consolidated basis, rough diamond sales volumes were significantly higher at 33.4 million carats (2020: 21.4 million carats). The average realised price rose by 10% to $146/ct (2020: $133/ct), primarily as a result of positive market sentiment which gave rise to an 11% strengthening of the average rough price index. Revenue also increased within De Beers’ other businesses, including Element Six.
Underlying EBITDA increased to $1,100 million (2020: $417 million), reflecting the improvement in sales driven by the recovery in demand. Unit costs were broadly flat at $58/ct (2020: $57/ct), as the benefit of higher production volumes was offset by an increase in input costs and unfavourable exchange rates.
Capital expenditure increased by 48% to $565 million (2020: $381 million), as spend returned to more normalised levels following the deferral of sustaining projects during 2020 in response to Covid-19. The execution of Venetia Underground (in South Africa) and Jwaneng Cut-9 (in Botswana) life extension projects continued to progress, and the mine life extension of the Namibian land operations was approved during the year. The new AMV3 vessel for Namibia, now named the Benguela Gem (the largest and most advanced diamond recovery vessel ever built), arrived in Cape Town in September 2021 to complete preparations for its commissioning in the first quarter of 2022.
(1) Total revenue and rough diamond sales for 2019 were $4.6 billion and $4.0 billion respectively.
Operational performance
Mining and manufacturing
Rough diamond production increased by 29% to 32.3 million carats (2020: 25.1 million carats) primarily due to the lower levels of production in 2020 as a result of the impact of Covid-19 related lockdowns and lower demand due to the pandemic. Despite the operational issues and heavy rains in southern Africa in the first quarter of 2021, production was increased to meet the stronger demand for rough diamonds.
In Botswana, production was 35% higher at 22.3 million carats (2020: 16.6 million carats) as production was increased in response to stronger prevailing demand. Production at Jwaneng increased by 71% to 12.9 million carats (2020: 7.5 million carats) due to the planned treatment of higher grade ore, and as a result of Covid-19 related lockdowns in the previous year. Production at Orapa increased marginally by 5% to 9.4 million carats (2020: 9.0 million carats), despite the impact of heavy rainfall at the beginning of the year and the planned closure of Plant 1 in late 2020.
In Namibia, production was broadly in line at 1.5 million carats (2020: 1.4 million carats), reflecting an increase from the remobilisation of most vessels in late 2020, partly offset by planned maintenance.
In South Africa, production increased by 41% to 5.3 million carats (2020: 3.8 million carats), owing to the impact of the Covid-19 lockdowns in the first half of 2020 and the planned processing of higher grade ore from the final cut of the Venetia open pit.
In Canada, production was marginally lower at 3.2 million carats (2020: 3.3 million carats), mainly due to a temporary Covid-19 related shutdown in the first quarter of 2021.
Brands and consumer markets
2021 saw a strong recovery in consumer demand for De Beers’ branded diamond jewellery from De Beers Jewellers and De Beers Forevermark, with both achieving double digit retail growth year-on-year. De Beers also continued to expand its retail stores in 2021, including its new flagship store in Old Bond Street, London and new stores in China and Qatar.
In August 2021, De Beers Group announced its new ‘One De Beers’ approach and its focus on establishing De Beers as a ‘purpose-led’ brand. De Beers has now launched its new brand campaign built around a widening interpretation of the phrase ‘I do’, itself the embodiment of one of the most time-honoured expressions of intent and values.
Operational and market outlook
Expectations for retail restocking in early 2022 are encouraging following the strong retail sales of diamond jewellery over the holiday season. The growth in consumer demand for diamond jewellery is expected to continue,
De Beers Diamonds
Anglo American plc Press Release 2021 21
driven by the US, primarily due to continued economic recovery, higher accumulated savings and postponed marriages. Rough diamond demand is expected to remain steady as the midstream continues to operate with lower stock levels, manufacturing below full capacity but using a faster manufacturing cycle. While there continue to be risks relating to the effects of Covid-19 across the pipeline, geo-political uncertainty and cost inflation pressures, sentiment in the midstream is expected to remain positive on the back of anticipated strong US retailer restocking in the first quarter.
The longer term evolution of the diamond value chain continues, including a sustained focus on inventory balance, the efficient distribution of diamonds throughout the pipeline, increased online purchasing, and a greater focus on the provenance and sustainability credentials of companies and their products. De Beers is well positioned to take advantage of these changes. The long term outlook for diamond jewellery demand remains positive.
Production guidance for 2022 is 30–33 million carats (100% basis), subject to trading conditions and the extent of further Covid-19 related disruptions. Unit cost guidance for 2022 is c.$65/ct, reflecting the impact of inflation.
De Beers Diamonds
22 Anglo American plc Press Release 2021

Copper
Financial and operational metrics
Productionvolume
Salesvolume Price
Unit cost*
Grouprevenue*
UnderlyingEBITDA*
MiningEBITDA
margin*(2)Underlying
EBIT* Capex* ROCE*
kt kt(1) c/lb(2) c/lb(3) $m(4) $m $m $m
Copper 647 641 453 120 6,433 4,011 62 % 3,428 1,773 39 %
Prior year 647 648 299 113 4,199 1,864 45 % 1,227 1,443 19 %
Los Bronces(5) 328 325 n/a 158 3,047 1,871 61 % 1,588 493 n/a
Prior year 325 325 — 149 2,013 639 32 % 294 272 —
Collahuasi(6) 277 273 n/a 61 2,641 2,188 83 % 1,970 365 n/a
Prior year 277 278 — 62 1,767 1,308 74 % 1,083 313 —
Quellaveco(7) n/a n/a n/a n/a n/a n/a n/a n/a 777 n/a
Prior year — — — — — — — — 788 —
Other operations(8) 42 43 n/a n/a 745 (48) 61 % (130) 138 n/a
Prior year 46 45 — — 419 (83) 9 % (150) 70 —
(1) Excludes 432 kt third-party sales (2020: 453 kt). (2) Represents realised price and excludes impact of third-party sales.(3) C1 unit cost includes by-product credits. (4) Group revenue is shown after deduction of treatment and refining charges (TC/RCs). Total Copper and Other operations prior year
comparatives have been restated from a gross to net presentation. See note 2 to the Condensed financial statements for more details.(5) Figures on a 100% basis (Group’s share: 50.1%). (6) 44% share of Collahuasi production, sales and financials. (7) Figures on a 100% basis (Group’s share: 60%), except capex which represents the Group’s share after deducting direct funding from
non‑controlling interests. 2021 capex on a 100% basis is $1,295 million, of which the Group’s share is $777 million. 2020 capex on a 100% basis was $1,314 million, of which the Group’s share was $788 million.
(8) Other operations includes El Soldado and Chagres (figures on a 100% basis, Group’s share: 50.1%). Financials include third-party sales and purchases, projects and corporate costs.
Financial and operational overview
Underlying EBITDA more than doubled to $4,011 million (2020: $1,864 million), underpinned by record copper prices.
Copper production of 647,200 tonnes was in line with the prior year (2020: 647,400 tonnes). Planned lower grades were fully offset by continued strong plant performance at Collahuasi and the implementation of water management initiatives at Los Bronces. Unit costs increased by 6% to 120 c/lb (2020: 113 c/lb), reflecting a stronger Chilean peso and high levels of local inflation impacting production and selling costs, partly offset by an increase in waste stripping capitalised and higher by-product credits.
Capital expenditure increased by 23% to $1,773 million (2020: $1,443 million), reflecting adverse movements in the Chilean peso and higher capitalised waste stripping as a result of resuming mine development activity following the impact of the pandemic in 2020.
Markets
31 December 2021 31 December 2020
Average market price (c/lb) 423 280Average realised price (c/lb) 453 299
The difference between the market price and realised price is largely a function of provisional pricing adjustments, with 162,361 tonnes of copper provisionally priced at 442 c/lb at 31 December 2021 (2020: 140,599 tonnes provisionally priced at 352 c/lb), and the timing of sales across the year.
The average LME copper price increased by 51%, due to a strong recovery in economic activity following the initial waves of the Covid-19 outbreak in 2020. While demand rebounded sharply in 2020 in China, momentum in 2021 was led by the US and Europe, as China faced headwinds in its real estate sector. The strength of demand for copper, like many commodities, was reinforced by government measures which were implemented to help offset the effects of the pandemic, and during the year this was further affected by supply-chain bottlenecks in major
Base metals
Anglo American plc Press Release 2021 23
economies. Copper supply growth continued to be constrained, resulting in declines in reported inventories to multi‑year lows. Demand for the metal has benefited from copper’s key role in global decarbonisation efforts, with growth in copper-intensive applications, such as wind and solar power generation. Investment fund interest in copper also contributed to price strength, as prices reached a record high of 486c/lb in May 2021, although concerns about inflation and potential interest rate rises have tempered further advances.
Operational performance
Copper production was in line with the prior year at 647,200 tonnes (2020: 647,400 tonnes).
At Los Bronces, production increased marginally by 1% to 327,700 tonnes (2020: 324,700 tonnes) due to higher water availability owing to water management initiatives, partially offset by planned lower grades (0.70% vs. 0.81%). C1 unit costs increased by 6% to 158 c/lb (2020: 149 c/lb), with the benefit of higher waste stripping capitalised and higher by-product credits, offset by the stronger Chilean peso and inflation, as well as cost increases associated with water management.
At Collahuasi, Anglo American’s attributable share of copper production of 277,200 tonnes was a record and slightly above the prior year (2020: 276,900 tonnes). C1 unit costs decreased by 2% to 61 c/lb (2020: 62 c/lb), reflecting the benefit of higher production and by-product credits, offset by the stronger Chilean peso and inflation.
Production at El Soldado decreased by 8% to 42,300 tonnes (2020: 45,800 tonnes) due to lower grades in accordance with the mine plan (0.73% vs. 0.84%). C1 unit costs of 206 c/lb are broadly in line with the prior year (2020: 204 c/lb), with the impact of lower production volumes, the stronger Chilean peso and inflation being offset by an increase in waste stripping capitalised.
Chile´s central zone continues to face severe drought conditions. While production impacts during 2021 have been fully mitigated by the successful implementation of water management initiatives, record low levels of precipitation during the year have reduced water availability for Los Bronces in the first half of 2022 and have been factored into our production guidance.
Operational outlook - Copper Chile
Production guidance for Chile for 2022 is 560,000–600,000 tonnes, subject to the extent of further Covid-19 related disruptions and water availability. C1 unit cost guidance for Chile for 2022 is c.145c/lb, reflecting lower production volumes, the impact of inflation, higher input costs and water purchases, as well as lower by-product credits.
Quellaveco update
The project is on track to achieve first production in mid-2022, in line with the original project schedule despite the challenges presented by the Covid-19 pandemic to date.
2021 saw the achievement of several major milestones and, as at February 2022, construction on all work fronts is reaching the final stages. The Vizcachas Dam – part of the infrastructure that will provide water to both the operation and local communities – is now commissioned and turned over to the operating team, and the 95 km water pipeline to site is on track to complete in the first quarter of 2022. In the mine, pre-stripping started in April 2021, moving 24 million tonnes in the year, and first ore was reached and excavated in October. The majority of the mine equipment fleet is now assembled, being the first in Peru to use fully automated haul trucks and drills, and all three rope shovels are operation-ready. Significant progress has been made on the primary crusher, with commissioning due to begin in the first quarter of 2022. The overland ore transport conveyor belt to the processing plant is being installed following completion of excavation work in the tunnel section of the conveyor route. We are also nearing construction completion at the processing plant, and pre-commissioning of the first of two milling lines began in January 2022. In the tailings area, the starter dam is built to its full elevation, and at the port, works to expand the existing port facilities remain on-track to allow copper concentrate shipments to begin in 2022.
During January and early February, Peru has been experiencing its third wave of Covid-19 following the spread of the Omicron variant throughout the country. While almost all of the on-site workforce is fully vaccinated and serious illness has been rare, progress has been negatively impacted by reduced workforce availability and the need to isolate the increasing number of Covid-19 cases identified on-site. To date, this disruption has not materially impacted the project schedule or capital estimate, however the camp has, at times, reduced to 50% occupancy rates, compared with 95% in December 2021 and early January 2022, and the full impact will depend on how long these challenging conditions last. As a result of this, production guidance for 2022 has been revised (see operational outlook below) and the total project capital expenditure estimate has been tightened to $5.4–5.5 billion (previously $5.3–5.5 billion), of which the Group’s share is c.$2.8 billion.
Base metals Copper
24 Anglo American plc Press Release 2021
Capital expenditure in 2021 (on a 100% basis) was $1.3 billion, of which the Group’s share is $0.8 billion. Guidance for 2022 remains $0.8–1.1 billion (100% basis), of which the Group’s share is $0.5–0.7 billion.
In 2022, focus is shifting to commissioning and operational readiness, which is aligned with the Anglo American Operating Model. The operating team is largely in place, along with a dedicated commissioning team implementing an integrated commissioning plan. All key obtainable permits have been received, and we are on track to obtain operational permits that become available as infrastructure is completed. In addition, key operational contracts are placed or under negotiation. The local Moqueguan workforce has been key to the success of the project and, as we near the close-out of construction activities, we are working closely with government and local communities to manage the demobilisation and support future employment opportunities for the local workforce.
Revised mine design and planning at the Quellaveco district has led to an 18% increase in Ore Reserves, with estimated contained copper of c.8.9 million tonnes at 0.53% TCu, and a resultant six-year increase in the Life of Mine to 36 years.
Operational outlook - Quellaveco
We expect to achieve first production in mid-2022, followed by a 12-month ramp-up to full capacity. Production guidance for Quellaveco for 2022 is 100,000–150,000 tonnes (previously 120,000–160,000 tonnes). Both the schedule and production guidance remain subject to the extent of current and ongoing Covid-19 related disruption.
C1 unit cost guidance for 2022 is c.125c/lb, based on ramp-up production volumes. It is, therefore, highly dependent on production start date and is subject to further Covid-19 impacts. Unit costs are expected to average c. 95c/lb over the first five years once the operation reaches full production capacity from 2023.
All guidance, project progress and capital expenditure remain subject to the extent of ongoing and further Covid-19 related disruption. Quellaveco expects to deliver around 300,000 tonnes per year of copper equivalent production on average in its first 10 years of operation.
Base metals Copper
Anglo American plc Press Release 2021 25
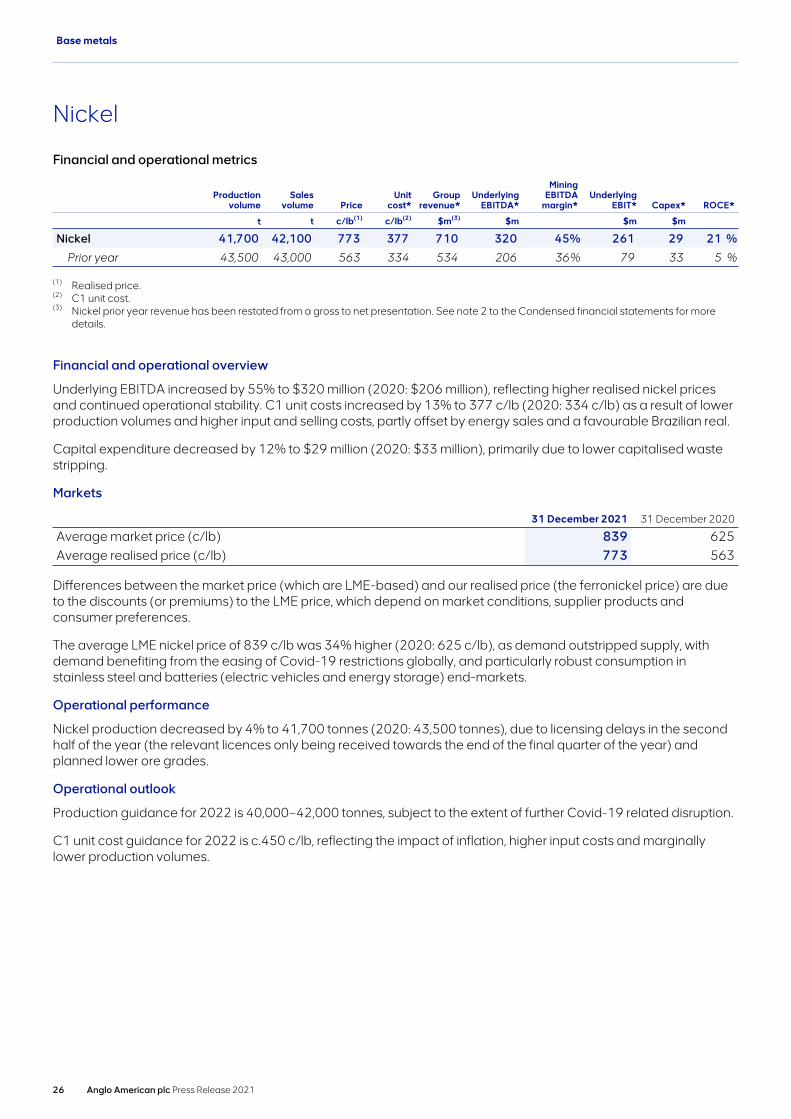
Nickel
Financial and operational metrics
Productionvolume
Salesvolume Price
Unitcost*
Grouprevenue*
UnderlyingEBITDA*
MiningEBITDA
margin*Underlying
EBIT* Capex* ROCE*
t t c/lb(1) c/lb(2) $m(3) $m $m $m
Nickel 41,700 42,100 773 377 710 320 45 % 261 29 21 %
Prior year 43,500 43,000 563 334 534 206 36 % 79 33 5 %
(1) Realised price.(2) C1 unit cost. (3) Nickel prior year revenue has been restated from a gross to net presentation. See note 2 to the Condensed financial statements for more
details.
Financial and operational overview
Underlying EBITDA increased by 55% to $320 million (2020: $206 million), reflecting higher realised nickel prices and continued operational stability. C1 unit costs increased by 13% to 377 c/lb (2020: 334 c/lb) as a result of lower production volumes and higher input and selling costs, partly offset by energy sales and a favourable Brazilian real.
Capital expenditure decreased by 12% to $29 million (2020: $33 million), primarily due to lower capitalised waste stripping.
Markets
31 December 2021 31 December 2020
Average market price (c/lb) 839 625Average realised price (c/lb) 773 563
Differences between the market price (which are LME-based) and our realised price (the ferronickel price) are due to the discounts (or premiums) to the LME price, which depend on market conditions, supplier products and consumer preferences.
The average LME nickel price of 839 c/lb was 34% higher (2020: 625 c/lb), as demand outstripped supply, with demand benefiting from the easing of Covid-19 restrictions globally, and particularly robust consumption in stainless steel and batteries (electric vehicles and energy storage) end-markets.
Operational performance
Nickel production decreased by 4% to 41,700 tonnes (2020: 43,500 tonnes), due to licensing delays in the second half of the year (the relevant licences only being received towards the end of the final quarter of the year) and planned lower ore grades.
Operational outlook
Production guidance for 2022 is 40,000–42,000 tonnes, subject to the extent of further Covid-19 related disruption.
C1 unit cost guidance for 2022 is c.450 c/lb, reflecting the impact of inflation, higher input costs and marginally lower production volumes.
Base metals
26 Anglo American plc Press Release 2021
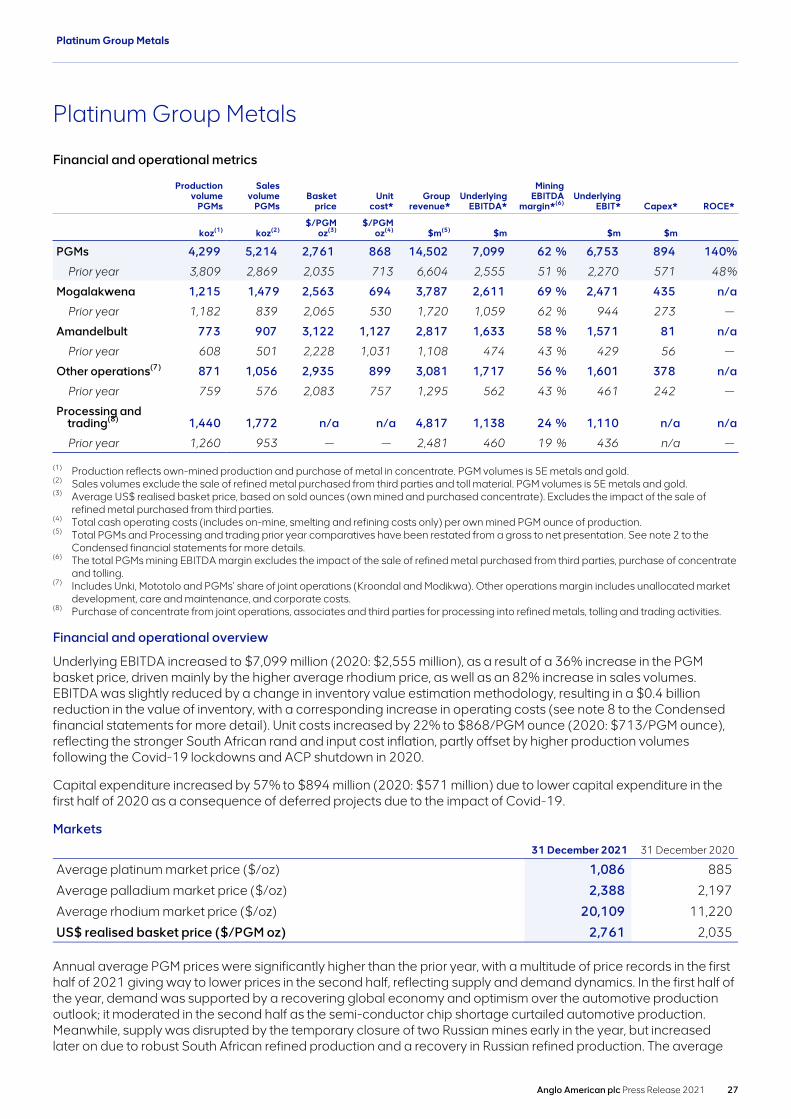
Platinum Group Metals
Financial and operational metrics
Productionvolume
PGMs
Salesvolume
PGMsBasket
priceUnit
cost*Group
revenue*Underlying
EBITDA*
MiningEBITDA
margin*(6)Underlying
EBIT* Capex* ROCE*
koz(1) koz(2)$/PGM
oz(3)$/PGM
oz(4) $m(5) $m $m $m
PGMs 4,299 5,214 2,761 868 14,502 7,099 62 % 6,753 894 140 %
Prior year 3,809 2,869 2,035 713 6,604 2,555 51 % 2,270 571 48 %
Mogalakwena 1,215 1,479 2,563 694 3,787 2,611 69 % 2,471 435 n/a
Prior year 1,182 839 2,065 530 1,720 1,059 62 % 944 273 —
Amandelbult 773 907 3,122 1,127 2,817 1,633 58 % 1,571 81 n/a
Prior year 608 501 2,228 1,031 1,108 474 43 % 429 56 —
Other operations(7) 871 1,056 2,935 899 3,081 1,717 56 % 1,601 378 n/a
Prior year 759 576 2,083 757 1,295 562 43 % 461 242 —
Processing and trading(8) 1,440 1,772 n/a n/a 4,817 1,138 24 % 1,110 n/a n/a
Prior year 1,260 953 — — 2,481 460 19 % 436 n/a —
(1) Production reflects own-mined production and purchase of metal in concentrate. PGM volumes is 5E metals and gold.(2) Sales volumes exclude the sale of refined metal purchased from third parties and toll material. PGM volumes is 5E metals and gold.(3) Average US$ realised basket price, based on sold ounces (own mined and purchased concentrate). Excludes the impact of the sale of
refined metal purchased from third parties. (4) Total cash operating costs (includes on-mine, smelting and refining costs only) per own mined PGM ounce of production. (5) Total PGMs and Processing and trading prior year comparatives have been restated from a gross to net presentation. See note 2 to the
Condensed financial statements for more details.(6) The total PGMs mining EBITDA margin excludes the impact of the sale of refined metal purchased from third parties, purchase of concentrate
and tolling.(7) Includes Unki, Mototolo and PGMs’ share of joint operations (Kroondal and Modikwa). Other operations margin includes unallocated market
development, care and maintenance, and corporate costs.(8) Purchase of concentrate from joint operations, associates and third parties for processing into refined metals, tolling and trading activities.
Financial and operational overview
Underlying EBITDA increased to $7,099 million (2020: $2,555 million), as a result of a 36% increase in the PGM basket price, driven mainly by the higher average rhodium price, as well as an 82% increase in sales volumes. EBITDA was slightly reduced by a change in inventory value estimation methodology, resulting in a $0.4 billion reduction in the value of inventory, with a corresponding increase in operating costs (see note 8 to the Condensed financial statements for more detail). Unit costs increased by 22% to $868/PGM ounce (2020: $713/PGM ounce), reflecting the stronger South African rand and input cost inflation, partly offset by higher production volumes following the Covid-19 lockdowns and ACP shutdown in 2020.
Capital expenditure increased by 57% to $894 million (2020: $571 million) due to lower capital expenditure in the first half of 2020 as a consequence of deferred projects due to the impact of Covid-19.
Markets
31 December 2021 31 December 2020
Average platinum market price ($/oz) 1,086 885
Average palladium market price ($/oz) 2,388 2,197
Average rhodium market price ($/oz) 20,109 11,220
US$ realised basket price ($/PGM oz) 2,761 2,035
Annual average PGM prices were significantly higher than the prior year, with a multitude of price records in the first half of 2021 giving way to lower prices in the second half, reflecting supply and demand dynamics. In the first half of the year, demand was supported by a recovering global economy and optimism over the automotive production outlook; it moderated in the second half as the semi-conductor chip shortage curtailed automotive production. Meanwhile, supply was disrupted by the temporary closure of two Russian mines early in the year, but increased later on due to robust South African refined production and a recovery in Russian refined production. The average
Platinum Group Metals
Anglo American plc Press Release 2021 27
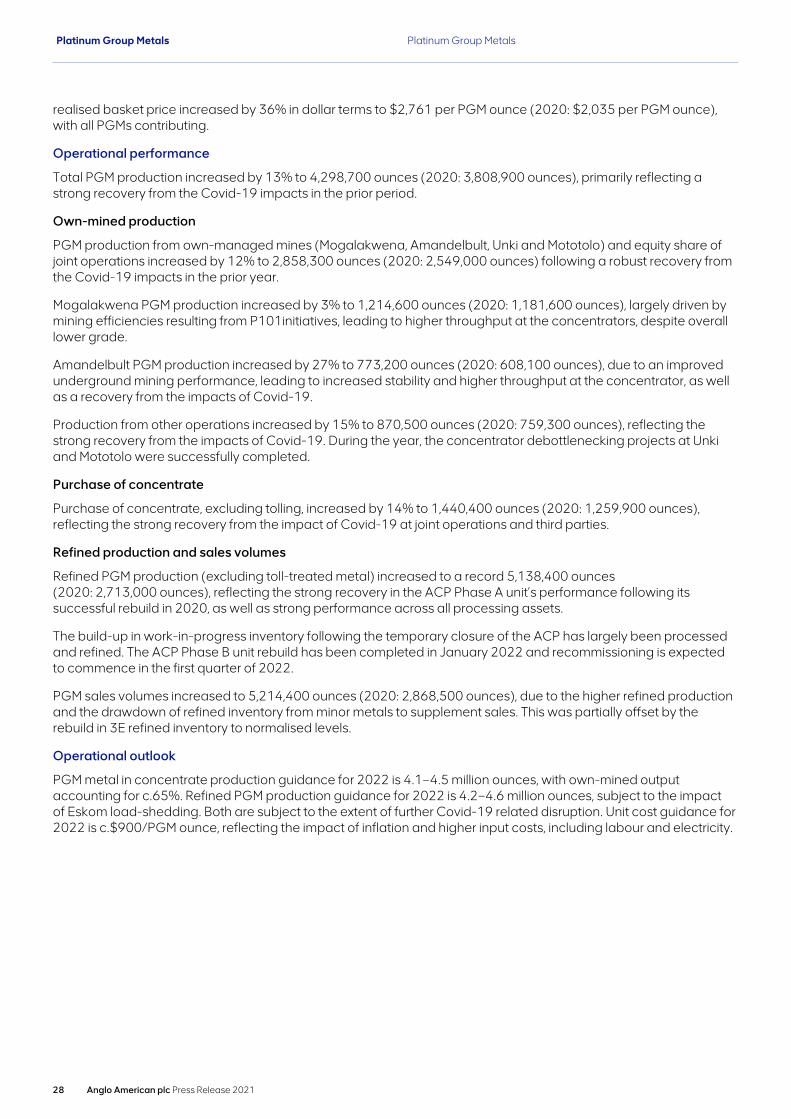
realised basket price increased by 36% in dollar terms to $2,761 per PGM ounce (2020: $2,035 per PGM ounce), with all PGMs contributing.
Operational performance
Total PGM production increased by 13% to 4,298,700 ounces (2020: 3,808,900 ounces), primarily reflecting a strong recovery from the Covid-19 impacts in the prior period.
Own-mined production
PGM production from own-managed mines (Mogalakwena, Amandelbult, Unki and Mototolo) and equity share of joint operations increased by 12% to 2,858,300 ounces (2020: 2,549,000 ounces) following a robust recovery from the Covid-19 impacts in the prior year.
Mogalakwena PGM production increased by 3% to 1,214,600 ounces (2020: 1,181,600 ounces), largely driven by mining efficiencies resulting from P101initiatives, leading to higher throughput at the concentrators, despite overall lower grade.
Amandelbult PGM production increased by 27% to 773,200 ounces (2020: 608,100 ounces), due to an improved underground mining performance, leading to increased stability and higher throughput at the concentrator, as well as a recovery from the impacts of Covid-19.
Production from other operations increased by 15% to 870,500 ounces (2020: 759,300 ounces), reflecting the strong recovery from the impacts of Covid-19. During the year, the concentrator debottlenecking projects at Unki and Mototolo were successfully completed.
Purchase of concentrate
Purchase of concentrate, excluding tolling, increased by 14% to 1,440,400 ounces (2020: 1,259,900 ounces), reflecting the strong recovery from the impact of Covid-19 at joint operations and third parties.
Refined production and sales volumes
Refined PGM production (excluding toll-treated metal) increased to a record 5,138,400 ounces (2020: 2,713,000 ounces), reflecting the strong recovery in the ACP Phase A unit’s performance following its successful rebuild in 2020, as well as strong performance across all processing assets.
The build-up in work-in-progress inventory following the temporary closure of the ACP has largely been processed and refined. The ACP Phase B unit rebuild has been completed in January 2022 and recommissioning is expected to commence in the first quarter of 2022.
PGM sales volumes increased to 5,214,400 ounces (2020: 2,868,500 ounces), due to the higher refined production and the drawdown of refined inventory from minor metals to supplement sales. This was partially offset by the rebuild in 3E refined inventory to normalised levels.
Operational outlook
PGM metal in concentrate production guidance for 2022 is 4.1–4.5 million ounces, with own-mined output accounting for c.65%. Refined PGM production guidance for 2022 is 4.2–4.6 million ounces, subject to the impact of Eskom load-shedding. Both are subject to the extent of further Covid-19 related disruption. Unit cost guidance for 2022 is c.$900/PGM ounce, reflecting the impact of inflation and higher input costs, including labour and electricity.
Platinum Group Metals Platinum Group Metals
28 Anglo American plc Press Release 2021
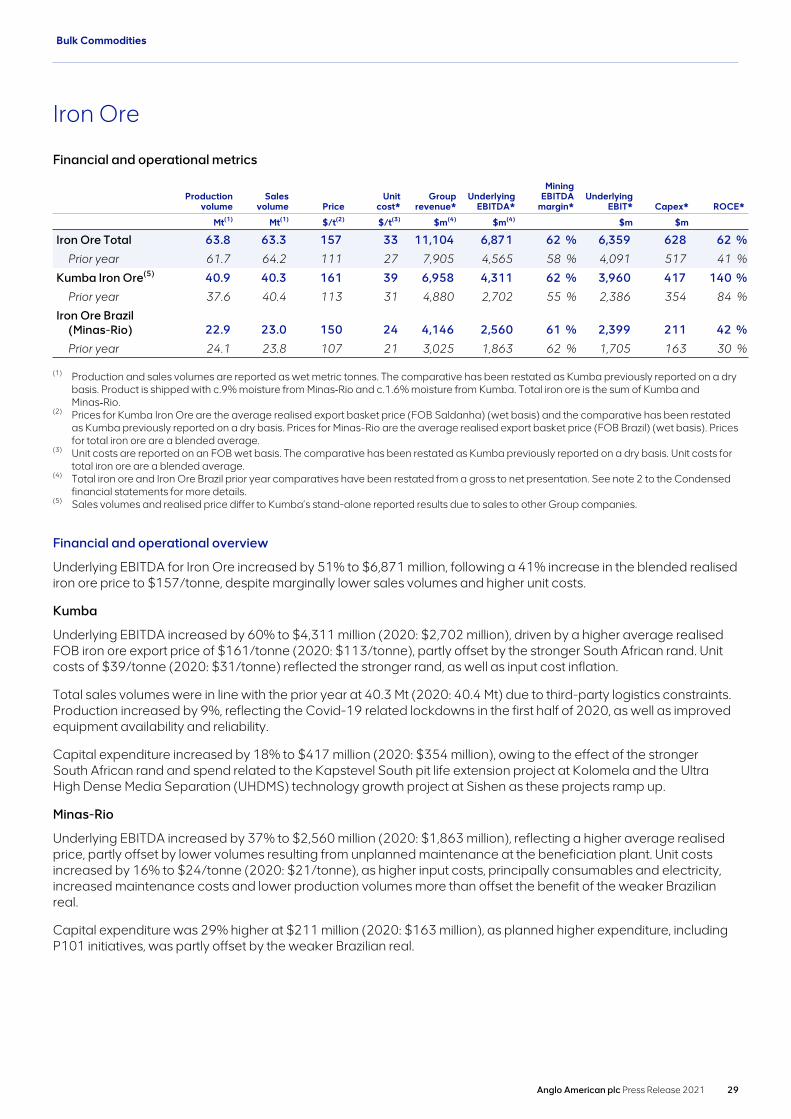
Iron Ore
Financial and operational metrics
Production volume
Salesvolume Price
Unit cost*
Grouprevenue*
UnderlyingEBITDA*
MiningEBITDA
margin*Underlying
EBIT* Capex* ROCE*
Mt(1) Mt(1) $/t(2) $/t(3) $m(4) $m(4) $m $m
Iron Ore Total 63.8 63.3 157 33 11,104 6,871 62 % 6,359 628 62 %
Prior year 61.7 64.2 111 27 7,905 4,565 58 % 4,091 517 41 %
Kumba Iron Ore(5) 40.9 40.3 161 39 6,958 4,311 62 % 3,960 417 140 %
Prior year 37.6 40.4 113 31 4,880 2,702 55 % 2,386 354 84 %
Iron Ore Brazil (Minas-Rio) 22.9 23.0 150 24 4,146 2,560 61 % 2,399 211 42 %
Prior year 24.1 23.8 107 21 3,025 1,863 62 % 1,705 163 30 %
(1) Production and sales volumes are reported as wet metric tonnes. The comparative has been restated as Kumba previously reported on a dry basis. Product is shipped with c.9% moisture from Minas‑Rio and c.1.6% moisture from Kumba. Total iron ore is the sum of Kumba and Minas‑Rio.
(2) Prices for Kumba Iron Ore are the average realised export basket price (FOB Saldanha) (wet basis) and the comparative has been restated as Kumba previously reported on a dry basis. Prices for Minas-Rio are the average realised export basket price (FOB Brazil) (wet basis). Prices for total iron ore are a blended average.
(3) Unit costs are reported on an FOB wet basis. The comparative has been restated as Kumba previously reported on a dry basis. Unit costs for total iron ore are a blended average.
(4) Total iron ore and Iron Ore Brazil prior year comparatives have been restated from a gross to net presentation. See note 2 to the Condensed financial statements for more details.
(5) Sales volumes and realised price differ to Kumba’s stand-alone reported results due to sales to other Group companies.
Financial and operational overview
Underlying EBITDA for Iron Ore increased by 51% to $6,871 million, following a 41% increase in the blended realised iron ore price to $157/tonne, despite marginally lower sales volumes and higher unit costs.
Kumba
Underlying EBITDA increased by 60% to $4,311 million (2020: $2,702 million), driven by a higher average realised FOB iron ore export price of $161/tonne (2020: $113/tonne), partly offset by the stronger South African rand. Unit costs of $39/tonne (2020: $31/tonne) reflected the stronger rand, as well as input cost inflation.
Total sales volumes were in line with the prior year at 40.3 Mt (2020: 40.4 Mt) due to third-party logistics constraints. Production increased by 9%, reflecting the Covid-19 related lockdowns in the first half of 2020, as well as improved equipment availability and reliability.
Capital expenditure increased by 18% to $417 million (2020: $354 million), owing to the effect of the stronger South African rand and spend related to the Kapstevel South pit life extension project at Kolomela and the Ultra High Dense Media Separation (UHDMS) technology growth project at Sishen as these projects ramp up.
Minas-Rio
Underlying EBITDA increased by 37% to $2,560 million (2020: $1,863 million), reflecting a higher average realised price, partly offset by lower volumes resulting from unplanned maintenance at the beneficiation plant. Unit costs increased by 16% to $24/tonne (2020: $21/tonne), as higher input costs, principally consumables and electricity, increased maintenance costs and lower production volumes more than offset the benefit of the weaker Brazilian real.
Capital expenditure was 29% higher at $211 million (2020: $163 million), as planned higher expenditure, including P101 initiatives, was partly offset by the weaker Brazilian real.
Bulk Commodities
Anglo American plc Press Release 2021 29

Markets
31 December 2021 31 December 2020
Average market price (Platts 62% Fe CFR China – $/tonne) 160 109
Average market price (MB 66% Fe Concentrate CFR – $/tonne) 185 120
Average realised price (Kumba export – $/tonne) (FOB wet basis) 161 113
Average realised price (Minas-Rio – $/tonne) (FOB wet basis) 150 107
Kumba’s FOB realised price of $161/wet metric tonne was 18% higher than the equivalent Platts 62% Fe FOB Saldanha market price (adjusted for moisture) of $136/wet metric tonne. This reflects the premium for the higher iron content at 64.1% and relatively high proportion (approximately 69%) of lump that the product portfolio attracts (which helps steel mills reduce emissions). There was also a benefit of $3/tonne (2020: $7/tonne) related to marketing activities.
Minas-Rio’s pellet feed product is also higher grade (with iron content of 67% and lower impurities) than the reference product used for the Platts 62% Fe CFR China index. The Metal Bulletin (MB) 66 index, therefore, is used when referring to Minas-Rio product. The Minas-Rio realised price of $150/wet metric tonne was 6% higher than the equivalent MB 66 FOB Brazil index, (adjusted for moisture, of $142/wet metric tonne). This reflects the premium quality of the product, as well as a benefit of $5/tonne (2020: $13/tonne) related to marketing activities.
Operational performance
Kumba
Despite third-party logistical constraints, production increased by 9% to 40.9 Mt relative to 2020, which was impacted by Covid-19 related disruptions (2020: 37.6 Mt). The increase was partly driven by improved plant availability and reliability in 2021. Production at Sishen increased by 9% to 28.0 Mt (2020: 25.8 Mt) and at Kolomela by 8% to 12.8 Mt (2020: 11.9 Mt).
Minas-Rio
Production decreased by 5% to 22.9 Mt (2020: 24.1 Mt), due to lower plant availability as a result of unplanned maintenance at the beneficiation plant.
Operational outlook
Kumba
Production guidance for 2022 is 39–41 Mt, subject to the extent of further Covid-19 related disruption and third‑party rail and port performance.
2022 unit cost guidance is c.$41/tonne, reflecting the impact of inflation and higher input costs.
Minas-Rio
Production guidance for 2022 is 24–26 Mt, subject to the extent of further Covid-19 related disruption.
2022 unit cost guidance is c.$25/tonne, reflecting the impact of inflation and higher input costs.
Bulk Commodities Iron Ore
30 Anglo American plc Press Release 2021
Metallurgical Coal
Financial and operational metrics
Productionvolume
Salesvolume Price
Unit cost*
Grouprevenue*
UnderlyingEBITDA*
MiningEBITDA
margin*Underlying
EBIT* Capex* ROCE*
Mt(1) Mt(2) $/t(3) $/t(4) $m $m $m $m
Metallurgical Coal 14.9 14.1 200 105 2,899 962 33 % 450 649 15 %
Prior year 16.8 16.9 109 86 1,909 50 3 % (468) 683 (15) %
(1) Production volumes are saleable tonnes, excluding thermal coal production of 1.7 Mt (2020: 2.0 Mt).(2) Sales volumes exclude thermal coal sales of 2.1 Mt (2020: 2.3 Mt). (3) Realised price is the weighted average hard coking coal and PCI sales price achieved at managed operations. (4) FOB cost per saleable tonne, excluding royalties and study costs.
Financial and operational overview
Underlying EBITDA increased to $962 million (2020: $50 million), driven by an 83% increase in the weighted average realised price for metallurgical coal, partially offset by 16% lower sales volumes, and 22% increase in unit costs to $105/tonne (2020: $86/tonne), reflecting the impact of lower production and the stronger Australian dollar. The volume and cost performances were principally affected by the impact of the underground incident at Grosvenor in May 2020, where longwall production received approval to restart in February 2022 and is now operational again, as well as the temporary suspension at Moranbah during the first half of 2021 in response to elevated gas levels.
Capital expenditure decreased by 5% to $649 million (2020: $683 million) due to reduced capitalised stripping at Grasstree, partly offset by the Aquila life extension project (replacing production from Grasstree), where longwall production commenced in February 2022.
Markets
31 December 2021 31 December 2020
Average benchmark price – hard coking coal ($/tonne)(1) 226 124
Average benchmark price – PCI ($/tonne)(1) 164 78
Average realised price – hard coking coal ($/tonne)(2) 211 112
Average realised price – PCI ($/tonne)(2) 138 84
(1) Represents average spot prices.(2) Realised price is the sales price achieved at managed operations.
Average realised prices differ from the average market prices owing to differences in material grade and timing of contracts. Hard coking coal price realisation increased to 93% of benchmark (2020: 90%), driven by the return of premium quality hard coking coal production from Moranbah in the second half of the year, in a higher price environment.
The average market price for Australian hard coking coal increased by 82% to $226/tonne (2020: $124/tonne). Coking coal prices in the first half of 2021 were impacted by the ban on Australian-originated coal into Chinese ports and the Covid-19 outbreak in India, but recovered strongly in the second half of the year, due to a reduction of supply from Australian and North American producers, while demand from Asian steelmakers outside China, remained strong with steel production supported by robust margins.
Operational performance
Production decreased by 11% to 14.9 Mt (2020: 16.8 Mt), principally due to the suspension of longwall operations at Grosvenor since May 2020 following the underground gas incident, and at Moranbah from 21 February 2021 until 3 June 2021, in response to elevated gas levels. Operations at Moranbah were further impacted by challenging geological conditions during the second half of the year. Open cut operations returned to pre-Covid-19 production levels, having been scaled back at Dawson and Capcoal since mid-2020 in response to reduced demand for the products. At Grosvenor, development activities have progressed well and the longwall restarted operations in the first quarter of 2022, following approval from Resources Safety and Health Queensland.
Bulk Commodities
Anglo American plc Press Release 2021 31
Operational outlook
Following confirmation of the restart at Grosvenor, while export metallurgical coal production guidance for 2022 is 20–22 Mt, due to the impact of Covid-19 in early 2022 and a later than expected restart of operations at Grosvenor, production is expected to be towards the lower end of the guidance range. As a result, unit cost guidance for 2022 is revised to c.$85/tonne (previously c.$80/tonne and compared to 2021 unit costs of $105/tonne). These figures are subject to the extent of any further Covid-19 related disruptions.
Bulk Commodities Metallurgical Coal
32 Anglo American plc Press Release 2021
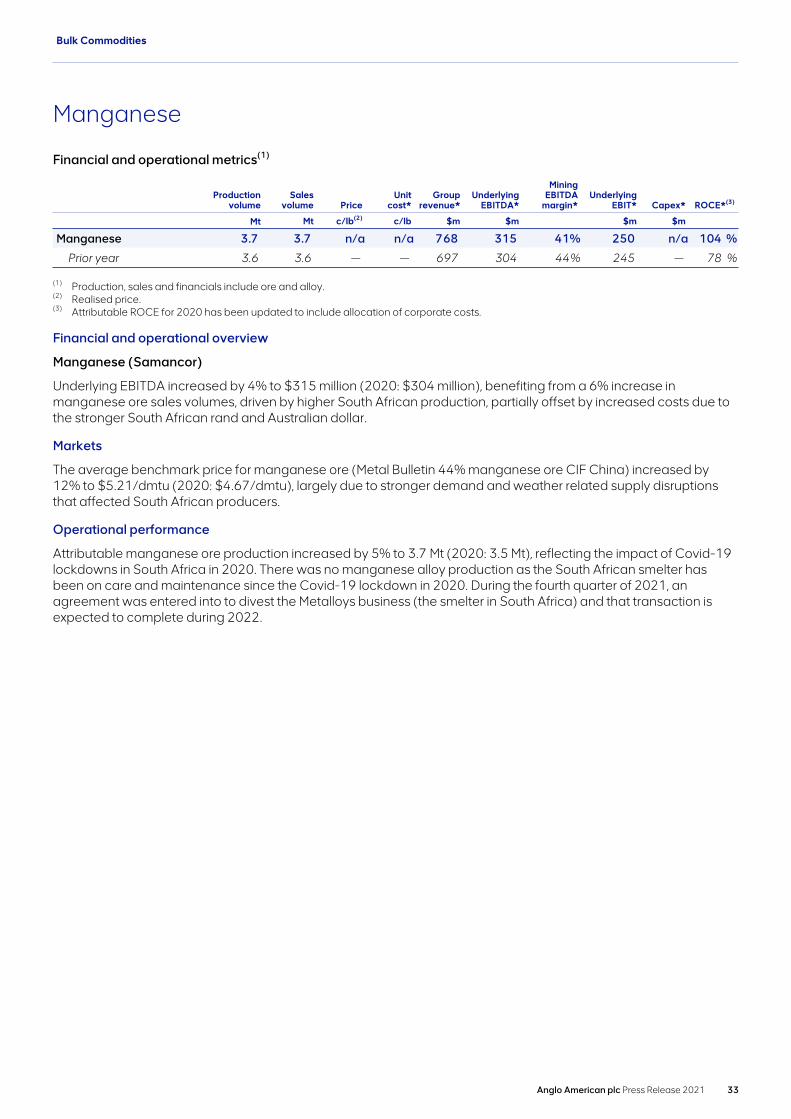
Manganese
Financial and operational metrics(1)
Productionvolume
Salesvolume Price
Unitcost*
Grouprevenue*
UnderlyingEBITDA*
MiningEBITDA
margin*Underlying
EBIT* Capex* ROCE*(3)
Mt Mt c/lb(2) c/lb $m $m $m $m
Manganese 3.7 3.7 n/a n/a 768 315 41 % 250 n/a 104 %
Prior year 3.6 3.6 — — 697 304 44 % 245 — 78 %
(1) Production, sales and financials include ore and alloy. (2) Realised price.(3) Attributable ROCE for 2020 has been updated to include allocation of corporate costs.
Financial and operational overview
Manganese (Samancor)
Underlying EBITDA increased by 4% to $315 million (2020: $304 million), benefiting from a 6% increase in manganese ore sales volumes, driven by higher South African production, partially offset by increased costs due to the stronger South African rand and Australian dollar.
Markets
The average benchmark price for manganese ore (Metal Bulletin 44% manganese ore CIF China) increased by 12% to $5.21/dmtu (2020: $4.67/dmtu), largely due to stronger demand and weather related supply disruptions that affected South African producers.
Operational performance
Attributable manganese ore production increased by 5% to 3.7 Mt (2020: 3.5 Mt), reflecting the impact of Covid-19 lockdowns in South Africa in 2020. There was no manganese alloy production as the South African smelter has been on care and maintenance since the Covid-19 lockdown in 2020. During the fourth quarter of 2021, an agreement was entered into to divest the Metalloys business (the smelter in South Africa) and that transaction is expected to complete during 2022.
Bulk Commodities
Anglo American plc Press Release 2021 33

Crop Nutrients
Financial and operational metrics
Productionvolume
Salesvolume Price
Unitcost
Grouprevenue*
UnderlyingEBITDA*
MiningEBITDA
margin*Underlying
EBIT* Capex* ROCE*
c/lb c/lb $m $m $m $m
Crop Nutrients n/a n/a n/a n/a 114 (41) n/a (42) 530 n/a
Prior year — — — — 107 1 — 1 292 —
Woodsmith project n/a n/a n/a n/a n/a n/a n/a n/a 530 n/a
Prior year — — — — — — — — 292 —
Other(1) n/a n/a n/a n/a 114 (41) n/a (42) n/a n/a
Prior year — — — — 107 1 — 1 — —
(1) Other comprises projects and corporate costs as well as the share in associate results from The Cibra Group, a fertiliser distributor based in Brazil.
Crop Nutrients
Anglo American is developing the Woodsmith project in the north east of England to access the world’s largest known deposit of polyhalite, a natural mineral fertiliser product containing potassium, sulphur, magnesium and calcium – four of the six nutrients that every plant needs to grow.
The Woodsmith project is located approximately 3 km south of Whitby, where polyhalite ore will be extracted via two 1.6 km deep mine shafts and transported to Teesside on an underground conveyor belt in a 37 km tunnel, thereby minimising impact on the surface. It will then be granulated at a materials handling facility to produce a low carbon fertiliser product – known as POLY4 – that will be exported from our dedicated port facility to a network of customers around the world.
In December, we appointed Tom McCulley, who has led the development of our Quellaveco copper project in Peru, as CEO of our Crop Nutrients business from 1 January 2022, replacing Chris Fraser who has taken up a strategic projects role for Anglo American.
Woodsmith Project
Development of the project continued to progress, with capital expenditure of $530 million (2020: $292 million). Excavation of the mineral transport tunnel had passed 18 km by the end of the year, beyond the intermediate access shaft site at Lockwood Beck. The Lockwood Beck shaft is complete, having reached its target depth of 383 m, and shaft lining is currently underway. At the mine head itself, shaft boring has started in the services shaft, while progress is also being made on the production shaft infrastructure.
Anglo American has conducted a detailed technical review of the project since mid-2020 to ensure the technical and commercial integrity of the full scope of its design. Now largely complete, the review has confirmed that a number of elements of the project’s design would benefit from modification to bring it up to Anglo American’s safety and operating integrity standards and to optimise the value of the asset for the long term.
The Woodsmith team is further developing the engineering to optimise the configuration of the project, recognising the multi-decade life of the mine. Particular attention is on those aspects identified at the outset of Anglo American’s ownership – namely, the sinking of the two main shafts, the development of the underground mining area, and the changes required to accommodate both increased production capacity and the more efficient and scalable mining method of using only continuous miners; such improvements will also require the installation of additional ventilation earlier in the development of the underground mining area.
Ahead of the full project execution phase, the Woodsmith team, led by new CEO Tom McCulley, is working through the detailed design engineering throughout 2022 and is expected to make a number of changes to the phasing of work, particularly in relation to the two main shafts. The capital budget for 2022 is therefore expected to be reduced by approximately $0.1 billion to $0.6 billion to accommodate these changes.
Anglo American expects that the improvements it is making to the project will result in an enhanced configuration and therefore a different and longer construction schedule. Anglo American’s capital budget for the development of Woodsmith will reflect such scope and timing changes to ensure that its exacting standards are met and the full
Crop Nutrients
34 Anglo American plc Press Release 2021
commercial value of the asset is realised. Once the detailed design engineering is complete, and the capital budget and schedule are updated, the full project will be submitted to the Board.
Market development – POLY4
The ongoing focus of the market development activities is to develop and implement detailed sales and marketing strategies for each region and to support customers with their own market development activities in order to further promote POLY4 to the end users of the product – farmers.
We are accelerating the number of commercial scale on-farm demonstrations, with around 800 now in progress or complete. The demonstrations continue to validate the efficacy of the product and the improvements it can deliver to farmers in terms of crop yield, quality or both. In addition, POLY4 has been shown in studies to enhance soil health through resilience to compaction, erosion and run-off, as well as improving nutrient availability to crops, helping to reduce nutrient waste into watercourses. POLY4 offers farmers a solution to agricultural efficiency and sustainability challenges, through its naturally low chloride multi-nutrient composition, its suitability for organic use and ultra low carbon profile, generating up to 85% fewer carbon emissions than the equivalent conventional nutrient products, with little to no waste generated in its production.
Crop Nutrients
Anglo American plc Press Release 2021 35
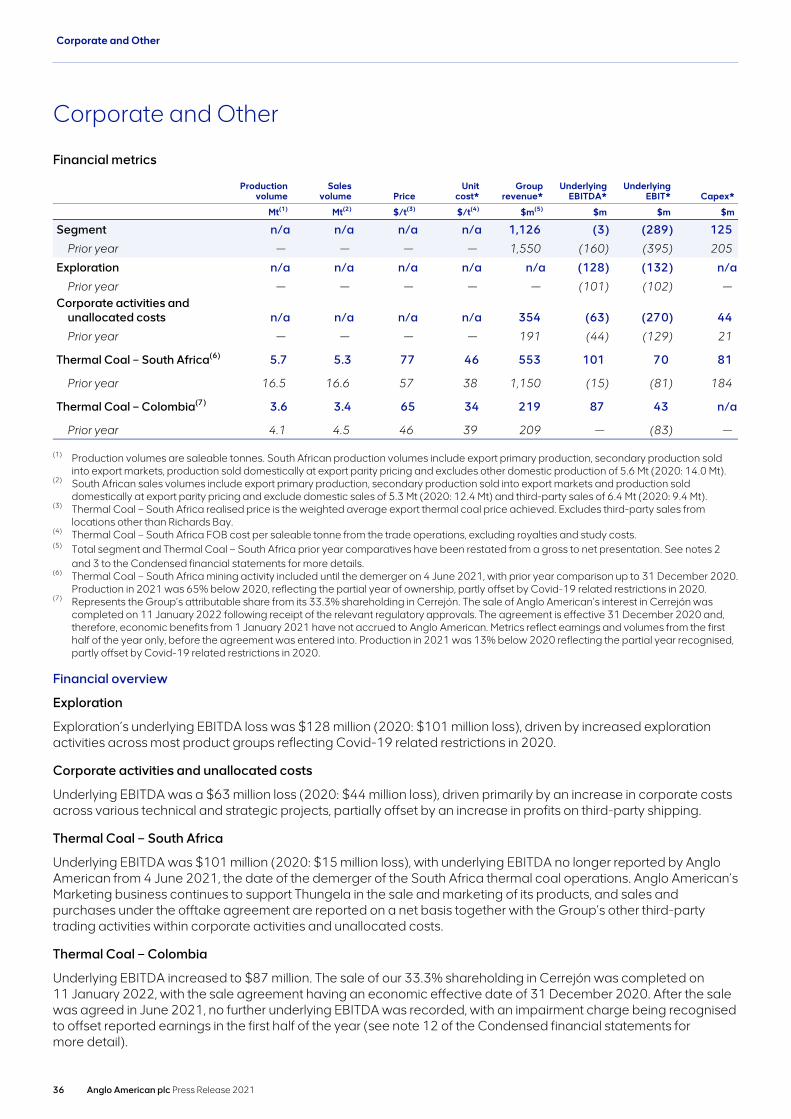
Corporate and Other
Financial metrics
Productionvolume
Salesvolume Price
Unit cost*
Grouprevenue*
UnderlyingEBITDA*
UnderlyingEBIT* Capex*
Mt(1) Mt(2) $/t(3) $/t(4) $m(5) $m $m $m
Segment n/a n/a n/a n/a 1,126 (3) (289) 125
Prior year — — — — 1,550 (160) (395) 205
Exploration n/a n/a n/a n/a n/a (128) (132) n/a
Prior year — — — — — (101) (102) — Corporate activities and
unallocated costs n/a n/a n/a n/a 354 (63) (270) 44
Prior year — — — — 191 (44) (129) 21
Thermal Coal – South Africa(6) 5.7 5.3 77 46 553 101 70 81
Prior year 16.5 16.6 57 38 1,150 (15) (81) 184
Thermal Coal – Colombia(7) 3.6 3.4 65 34 219 87 43 n/a
Prior year 4.1 4.5 46 39 209 — (83) —
(1) Production volumes are saleable tonnes. South African production volumes include export primary production, secondary production sold into export markets, production sold domestically at export parity pricing and excludes other domestic production of 5.6 Mt (2020: 14.0 Mt).
(2) South African sales volumes include export primary production, secondary production sold into export markets and production sold domestically at export parity pricing and exclude domestic sales of 5.3 Mt (2020: 12.4 Mt) and third-party sales of 6.4 Mt (2020: 9.4 Mt).
(3) Thermal Coal – South Africa realised price is the weighted average export thermal coal price achieved. Excludes third-party sales from locations other than Richards Bay.
(4) Thermal Coal – South Africa FOB cost per saleable tonne from the trade operations, excluding royalties and study costs.(5) Total segment and Thermal Coal – South Africa prior year comparatives have been restated from a gross to net presentation. See notes 2
and 3 to the Condensed financial statements for more details.(6) Thermal Coal – South Africa mining activity included until the demerger on 4 June 2021, with prior year comparison up to 31 December 2020.
Production in 2021 was 65% below 2020, reflecting the partial year of ownership, partly offset by Covid-19 related restrictions in 2020.(7) Represents the Group’s attributable share from its 33.3% shareholding in Cerrejón. The sale of Anglo American’s interest in Cerrejón was
completed on 11 January 2022 following receipt of the relevant regulatory approvals. The agreement is effective 31 December 2020 and, therefore, economic benefits from 1 January 2021 have not accrued to Anglo American. Metrics reflect earnings and volumes from the first half of the year only, before the agreement was entered into. Production in 2021 was 13% below 2020 reflecting the partial year recognised, partly offset by Covid-19 related restrictions in 2020.
Financial overview
Exploration
Exploration’s underlying EBITDA loss was $128 million (2020: $101 million loss), driven by increased exploration activities across most product groups reflecting Covid-19 related restrictions in 2020.
Corporate activities and unallocated costs
Underlying EBITDA was a $63 million loss (2020: $44 million loss), driven primarily by an increase in corporate costs across various technical and strategic projects, partially offset by an increase in profits on third-party shipping.
Thermal Coal – South Africa
Underlying EBITDA was $101 million (2020: $15 million loss), with underlying EBITDA no longer reported by Anglo American from 4 June 2021, the date of the demerger of the South Africa thermal coal operations. Anglo American’s Marketing business continues to support Thungela in the sale and marketing of its products, and sales and purchases under the offtake agreement are reported on a net basis together with the Group’s other third-party trading activities within corporate activities and unallocated costs.
Thermal Coal – Colombia
Underlying EBITDA increased to $87 million. The sale of our 33.3% shareholding in Cerrejón was completed on 11 January 2022, with the sale agreement having an economic effective date of 31 December 2020. After the sale was agreed in June 2021, no further underlying EBITDA was recorded, with an impairment charge being recognised to offset reported earnings in the first half of the year (see note 12 of the Condensed financial statements for more detail).
Corporate and Other
36 Anglo American plc Press Release 2021

Guidance summary
Production and unit costs
Unit costs2022F
Production volumes
Units 2022F 2023F 2024F
Diamonds(1) c.$65/ct Mct 30–33 30–33 30–33
Copper(2) c.140 c/lb kt 660–750 910–1,020 910–1,020
(previously 680-760)
PGMs – metal in concentrate(3) c.$900/PGM ounce Moz 4.1–4.5 4.1–4.5 4.1–4.5
Platinum Moz 1.9–2.1 1.9–2.1 1.9–2.1Palladium Moz 1.3–1.4 1.3–1.4 1.3–1.4Other Moz 0.9–1.0 0.9–1.0 0.9–1.0
PGMs – refined(4) Moz 4.2–4.6 3.8–4.2 4.1–4.5
Iron ore(5) c.$35/tonne Mt 63–67 64–68 67–71
Metallurgical coal(6) c.$85/tonne Mt 20–22 22–24 24–26
(previously c.$80/tonne)
Nickel(7) c.450 c/lb kt 40–42 41–43 42–44
Note: Unit costs are subject to any further effects of Covid-19 and exclude royalties, depreciation and include direct support costs only. FX rates for 2022 costs: ~16 ZAR:USD, ~1.4 AUD:USD, ~5.6 BRL:USD, ~830 CLP:USD, ~4 PEN:USD. Production volumes are subject to the extent of further Covid-19 related disruption.
(1) Unit cost is based on De Beers’ share of production. Production on a 100% basis except for the Gahcho Kué joint operation, which is on an attributable 51% basis, subject to trading conditions. Venetia continues to transition to underground operations during 2022, with ramp-up expected from 2023.
(2) Copper business unit only. On a contained-metal basis. Total copper is the sum of Chile and Peru. Unit cost total is a weighted average based on the mid-point of production guidance. 2022 Chile: 560–600kt; Peru 100–150kt (previously 120-160kt). 2023 Chile: 590–650kt; Peru: 320–370kt. 2024 Chile: 590–650kt; Peru 320–370kt. Chile production is subject to water availability. Chile 2022 unit cost is c.145c/lb. Peru 2022 unit cost is c.125c/lb and based on ramp-up production volumes. It is therefore highly dependent on production start date and subject to further Covid-19 impacts. Chile production in 2022 impacted by lower expected grades at Collahuasi and Los Bronces, and lower water availability at Los Bronces. Peru production for 2022 has been revised down as a result of reduced workforce availability due to Covid-19 following the spread of the Omicron variant in Peru in early 2022.
(3) Unit cost is per own mined 5E + gold PGMs metal in concentrate ounce. Production is 5E + gold produced metal in concentrate ounces. Includes own mined production (~65%) and purchased concentrate volumes (~35%).
(4) 5E + gold produced refined ounces. Includes own mined production and purchased concentrate volumes. Refined production is subject to the potential impact of Eskom load-shedding.
(5) Wet basis. Total iron ore is the sum of Kumba and Minas-Rio. Unit cost total is a weighted average based on the mid-point of production guidance. 2022 Kumba: 39–41Mt; Minas-Rio: 24–26Mt. 2023 Kumba: 39–41Mt; Minas-Rio: 25–27Mt. 2024 Kumba: 41–43Mt; Minas-Rio: 26–28Mt. Kumba production is subject to the third party rail and port performance. Kumba 2022 unit cost is c.$41/tonne. Minas-Rio 2022 unit cost is c.$25/tonne.
(6) Metallurgical Coal FOB/t unit cost comprises managed operations and excludes royalties and study costs. Volumes excludes thermal coal production in Australia. 2022 production guidance is expected to be at the lower end of the range due to the delayed restart of operations at Grosvenor. 2022 unit cost revision reflects the impact of the delayed restart of operations at Grosvenor, resulting in production volumes towards the lower end of the guidance range.
(7) Nickel business unit only. 2023 and 2024 volumes dependent on bulk ore sorting technology and briquetting.
Guidance summary
Anglo American plc Press Release 2021 37
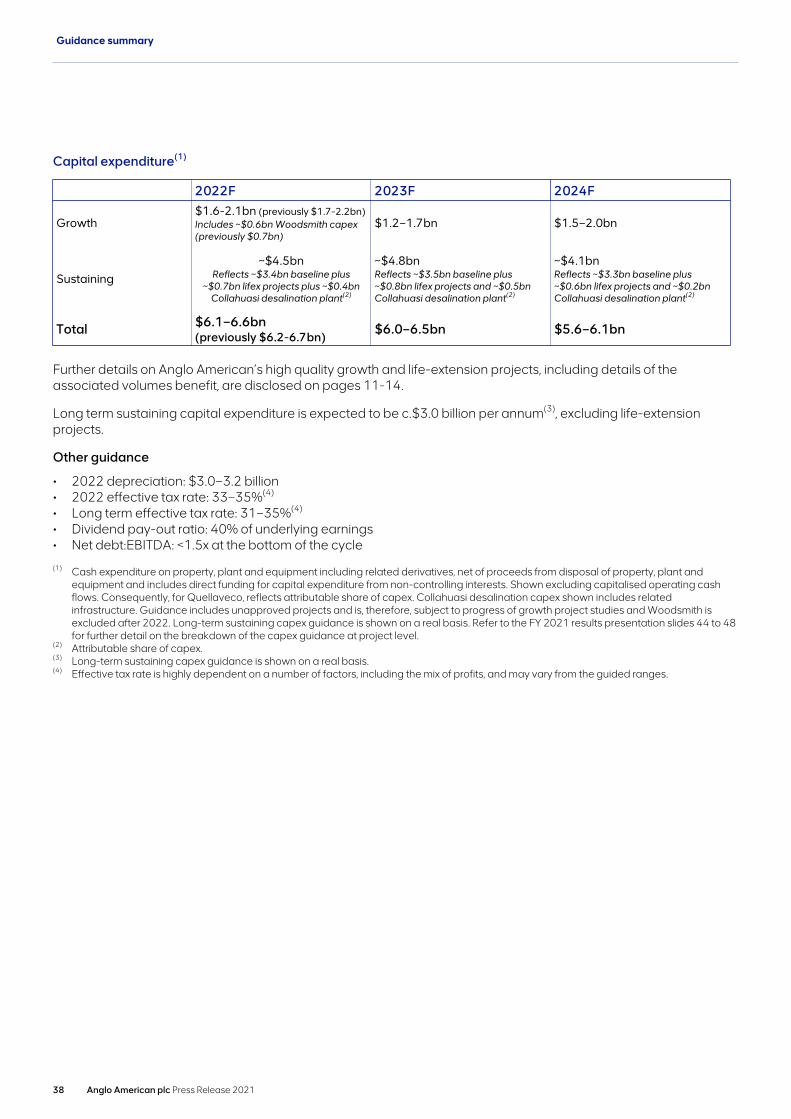
Capital expenditure(1)
2022F 2023F 2024F
Growth$1.6-2.1bn (previously $1.7-2.2bn)Includes ~$0.6bn Woodsmith capex (previously $0.7bn)
$1.2–1.7bn $1.5–2.0bn
Sustaining~$4.5bn
Reflects ~$3.4bn baseline plus ~$0.7bn lifex projects plus ~$0.4bn
Collahuasi desalination plant(2)
~$4.8bnReflects ~$3.5bn baseline plus ~$0.8bn lifex projects and ~$0.5bn Collahuasi desalination plant(2)
~$4.1bnReflects ~$3.3bn baseline plus ~$0.6bn lifex projects and ~$0.2bn Collahuasi desalination plant(2)
Total $6.1–6.6bn(previously $6.2-6.7bn)
$6.0–6.5bn $5.6–6.1bn
Further details on Anglo American’s high quality growth and life-extension projects, including details of the associated volumes benefit, are disclosed on pages 11-14.
Long term sustaining capital expenditure is expected to be c.$3.0 billion per annum(3), excluding life-extension projects.
Other guidance
• 2022 depreciation: $3.0–3.2 billion• 2022 effective tax rate: 33–35%(4)
• Long term effective tax rate: 31–35%(4)
• Dividend pay-out ratio: 40% of underlying earnings• Net debt:EBITDA: <1.5x at the bottom of the cycle
(1) Cash expenditure on property, plant and equipment including related derivatives, net of proceeds from disposal of property, plant and equipment and includes direct funding for capital expenditure from non-controlling interests. Shown excluding capitalised operating cash flows. Consequently, for Quellaveco, reflects attributable share of capex. Collahuasi desalination capex shown includes related infrastructure. Guidance includes unapproved projects and is, therefore, subject to progress of growth project studies and Woodsmith is excluded after 2022. Long-term sustaining capex guidance is shown on a real basis. Refer to the FY 2021 results presentation slides 44 to 48 for further detail on the breakdown of the capex guidance at project level.
(2) Attributable share of capex.(3) Long-term sustaining capex guidance is shown on a real basis.(4) Effective tax rate is highly dependent on a number of factors, including the mix of profits, and may vary from the guided ranges.
Guidance summary
38 Anglo American plc Press Release 2021
For further information, please contact:
Media Investors
UKJames [email protected]: +44 (0)20 7968 8759
UKPaul [email protected]: +44 (0)20 7968 8718
Marcelo [email protected]: +44 (0)20 7968 8891
Juliet [email protected]: +44 (0)20 7968 8830
Katie [email protected]: +44 (0)20 7968 8935
Emma [email protected]: +44 (0)20 7968 8574
South AfricaNevashnee [email protected]: +27 (0)11 638 3189
Michelle [email protected]: +44 (0)20 7968 1494
Sibusiso [email protected]: +27 (0)11 638 2175
Notes to editors:Anglo American is a leading global mining company and our products are the essential ingredients in almost every aspect of modern life. Our portfolio of world-class competitive operations, with a broad range of future development options, provides many of the future-enabling metals and minerals for a cleaner, greener, more sustainable world and that meet the fast growing every day demands of billions of consumers. With our people at the heart of our business, we use innovative practices and the latest technologies to discover new resources and to mine, process, move and market our products to our customers – safely and sustainably.
As a responsible producer of diamonds (through De Beers), copper, platinum group metals, premium quality iron ore and metallurgical coal for steelmaking, and nickel – with crop nutrients in development – we are committed to being carbon neutral across our operations by 2040. More broadly, our Sustainable Mining Plan commits us to a series of stretching goals to ensure we work towards a healthy environment, creating thriving communities and building trust as a corporate leader. We work together with our business partners and diverse stakeholders to unlock enduring value from precious natural resources for the benefit of the communities and countries in which we operate, for society as a whole, and for our shareholders. Anglo American is re-imagining mining to improve people’s lives.
www.angloamerican.com
Webcast of presentation: A live webcast of the results presentation, starting at 9.00am UK time on 24 February 2022, can be accessed through the Anglo American website at www.angloamerican.com
Note: Throughout this results announcement, ‘$’ denotes United States dollars and ‘cents’ refers to United States cents. Tonnes are metric tons, ‘Mt’ denotes million tonnes and ‘kt’ denotes thousand tonnes, unless otherwise stated.
Further information
Anglo American plc Press Release 2021 39
Group terminologyIn this document, references to “Anglo American”, the “Anglo American Group”, the “Group”, “we”, “us”, and “our” are to refer to either Anglo American plc and its subsidiaries and/or those who work for them generally, or where it is not necessary to refer to a particular entity, entities or persons. The use of those generic terms herein is for convenience only, and is in no way indicative of how the Anglo American Group or any entity within it is structured, managed or controlled. Anglo American subsidiaries, and their management, are responsible for their own day-to-day operations, including but not limited to securing and maintaining all relevant licences and permits, operational adaptation and implementation of Group policies, management, training and any applicable local grievance mechanisms. Anglo American produces group-wide policies and procedures to ensure best uniform practices and standardisation across the Anglo American Group but is not responsible for the day to day implementation of such policies. Such policies and procedures constitute prescribed minimum standards only. Group operating subsidiaries are responsible for adapting those policies and procedures to reflect local conditions where appropriate, and for implementation, oversight and monitoring within their specific businesses.
Forward-looking statements and third party information:This document includes forward-looking statements. All statements other than statements of historical facts included in this document, including, without limitation, those regarding Anglo American’s financial position, business, acquisition and divestment strategy, dividend policy, plans and objectives of management for future operations, prospects and projects (including development plans and objectives relating to Anglo American’s products, production forecasts and Ore Reserve and Mineral Resource positions) and sustainability performance related (including environmental, social and governance) goals, ambitions, targets, visions, milestones and aspirations, are forward-looking statements. By their nature, such forward-looking statements involve known and unknown risks, uncertainties and other factors which may cause the actual results, performance or achievements of Anglo American or industry results to be materially different from any future results, performance or achievements expressed or implied by such forward-looking statements.
Such forward-looking statements are based on numerous assumptions regarding Anglo American’s present and future business strategies and the environment in which Anglo American will operate in the future. Important factors that could cause Anglo American’s actual results, performance or achievements to differ materially from those in the forward-looking statements include, among others, levels of actual production during any period, levels of global demand and commodity market prices, mineral resource exploration and project development capabilities and delivery, recovery rates and other operational capabilities, safety, health or environmental incidents, the effects of global pandemics and outbreaks of infectious diseases, natural catastrophes or adverse geological conditions, climate change and extreme weather events, the outcome of litigation or regulatory proceedings, the availability of mining and processing equipment, the ability to produce and transport products profitably, the availability of transport infrastructure, the development, efficacy and adoption of new technology, the impact of foreign currency exchange rates on market prices and operating costs, the availability of sufficient credit, the effects of inflation, political uncertainty, tensions and disputes and economic conditions in relevant areas of the world, evolving societal and stakeholder requirements and expectations, the actions of competitors, activities by courts, regulators and governmental authorities such as in relation to permitting or forcing closure of mines and ceasing of operations or maintenance of Anglo American’s assets and changes in taxation or safety, health, environmental or other types of regulation in the countries where Anglo American operates, conflicts over land and resource ownership rights and such other risk factors identified in Anglo American’s most recent Annual Report. Forward-looking statements should, therefore, be construed in light of such risk factors and undue reliance should not be placed on forward-looking statements. These forward-looking statements speak only as of the date of this document. Anglo American expressly disclaims any obligation or undertaking (except as required by applicable law, the City Code on Takeovers and Mergers, the UK Listing Rules, the Disclosure and Transparency Rules of the Financial Conduct Authority, the Listings Requirements of the securities exchange of the JSE Limited in South Africa, the SIX Swiss Exchange, the Botswana Stock Exchange and the Namibian Stock Exchange and any other applicable regulations) to release publicly any updates or revisions to any forward-looking statement contained herein to reflect any change in Anglo American’s expectations with regard thereto or any change in events, conditions or circumstances on which any such statement is based.
Nothing in this document should be interpreted to mean that future earnings per share of Anglo American will necessarily match or exceed its historical published earnings per share. Certain statistical and other information about Anglo American included in this document is sourced from publicly available third party sources. As such it has not been independently verified and presents the views of those third parties, but may not necessarily correspond to the views held by Anglo American and Anglo American expressly disclaims any responsibility for, or liability in respect of, such information.
Anglo American plc 17 Charterhouse Street London EC1N 6RA United Kingdom Registered office as above. Incorporated in England and Wales under the Companies Act 1985. Registered Number: 3564138 Legal Entity Identifier: 549300S9XF92D1X8ME43
Further information
40 Anglo American plc Press Release 2021
CONDENSED FINANCIAL STATEMENTS
for the year ended 31 December 2021
Contents
Primary statementsConsolidated income statement 43Consolidated statement of comprehensive income 44Consolidated balance sheet 45Consolidated cash flow statement 46Consolidated statement of changes in equity 47
Notes to the Condensed financial statements1. Basis of preparation 482. Changes in accounting policies, estimates and disclosures 49
Financial performance3. Financial performance by segment 504. Earnings per share 545. Net finance costs 556. Income tax expense 567. Dividends 58
Significant items8. Significant accounting matters 599. Special items and remeasurements 64
Capital base10. Capital by segment 6711. Capital expenditure 6912. Investments in associates and joint ventures 70
Net debt and financial risk management13. Net debt 7214. Borrowings 74
Unrecognised items and uncertain events15. Events occurring after end of year 7516. Contingent assets and liabilities 75
Group structure17. Assets and liabilities held for sale 7618. Acquisitions and disposals 76
Summary by operation 79
Key financial data 82
Alternative performance measures 83
Exchange rates and commodity prices 91
Notice of Dividend 92
Financial statements and other financial information
42 Anglo American plc Press Release 2021

Consolidated income statementfor the year ended 31 December 2021
2021 2020 (restated)(1)
US$ million Note
Beforespecial
items andremeasure-
ments
Specialitems and
remeasure-ments
(note 9) Total
Beforespecial
items andremeasure-
ments
Specialitems and
remeasure-ments
(note 9) Total
Revenue 3 41,547 7 41,554 25,447 — 25,447
Operating costs (24,454) 492 (23,962) (18,760) (1,056) (19,816)
Operating profit 3 17,093 499 17,592 6,687 (1,056) 5,631
Non-operating special items 9 — (207) (207) — 513 513
Net income from associates and joint ventures 3 12 460 174 634 180 (77) 103
Profit before net finance costs and tax 17,553 466 18,019 6,867 (620) 6,247
Investment income 139 — 139 115 — 115
Interest expense (434) (116) (550) (556) (31) (587)
Other net financing gains/(losses) 18 3 21 (334) 23 (311)
Net finance costs 5 (277) (113) (390) (775) (8) (783)
Profit before tax 17,276 353 17,629 6,092 (628) 5,464
Income tax expense 6 (5,271) (659) (5,930) (1,790) (346) (2,136)
Profit for the financial year 12,005 (306) 11,699 4,302 (974) 3,328
Attributable to:
Non-controlling interests 3,080 57 3,137 1,167 72 1,239
Equity shareholders of the Company 8,925 (363) 8,562 3,135 (1,046) 2,089
Earnings per share (US$)
Basic 4 7.22 (0.29) 6.93 2.53 (0.84) 1.69
Diluted 4 7.13 (0.29) 6.84 2.50 (0.83) 1.67
(1) The Group has changed its accounting policy to amend the presentation of third-party purchases and related commodity sales which are made by the Group’s marketing business to earn a trading margin. These sales and purchases were previously shown on a gross basis and are now shown net within revenue from other sources. Revenue and operating costs have been restated accordingly but there was no impact on operating profit from this change in accounting policy for which the comparatives have been restated. See note 8 for further details.
Financial statements and other financial information Primary statements
Anglo American plc Press Release 2021 43
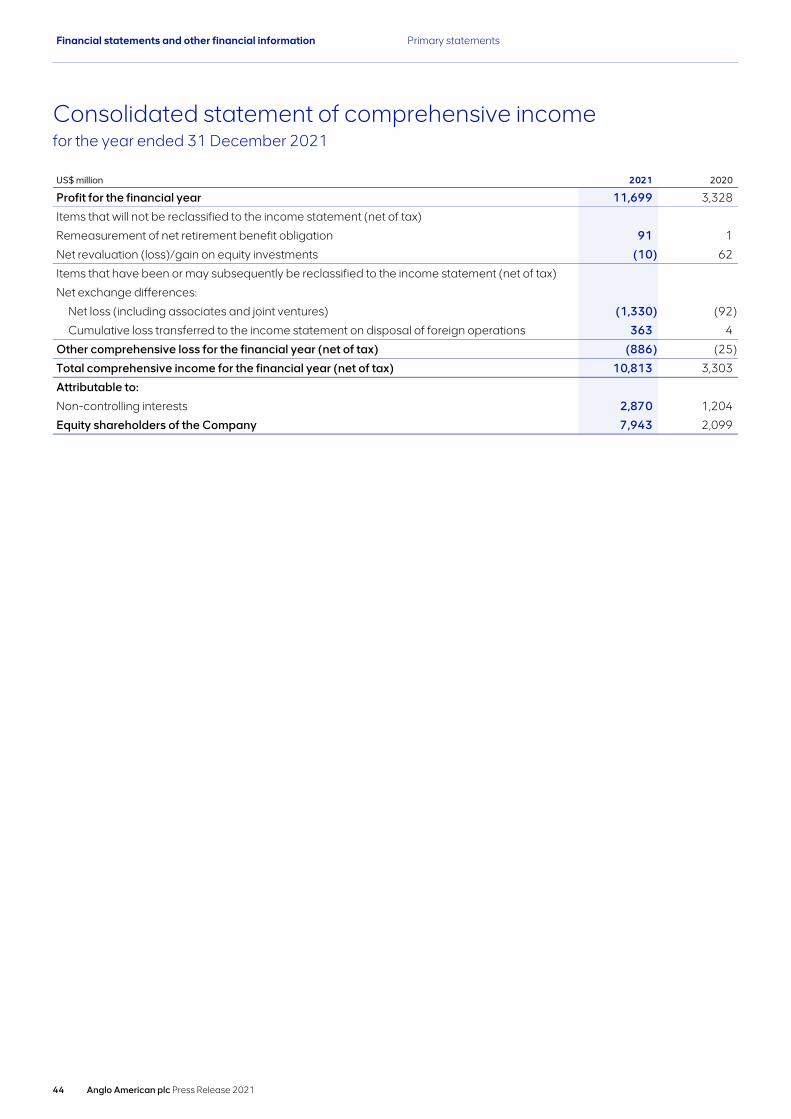
Consolidated statement of comprehensive incomefor the year ended 31 December 2021
US$ million 2021 2020
Profit for the financial year 11,699 3,328
Items that will not be reclassified to the income statement (net of tax)
Remeasurement of net retirement benefit obligation 91 1
Net revaluation (loss)/gain on equity investments (10) 62
Items that have been or may subsequently be reclassified to the income statement (net of tax)
Net exchange differences:
Net loss (including associates and joint ventures) (1,330) (92)
Cumulative loss transferred to the income statement on disposal of foreign operations 363 4
Other comprehensive loss for the financial year (net of tax) (886) (25)
Total comprehensive income for the financial year (net of tax) 10,813 3,303
Attributable to:
Non-controlling interests 2,870 1,204
Equity shareholders of the Company 7,943 2,099
Financial statements and other financial information Primary statements
44 Anglo American plc Press Release 2021
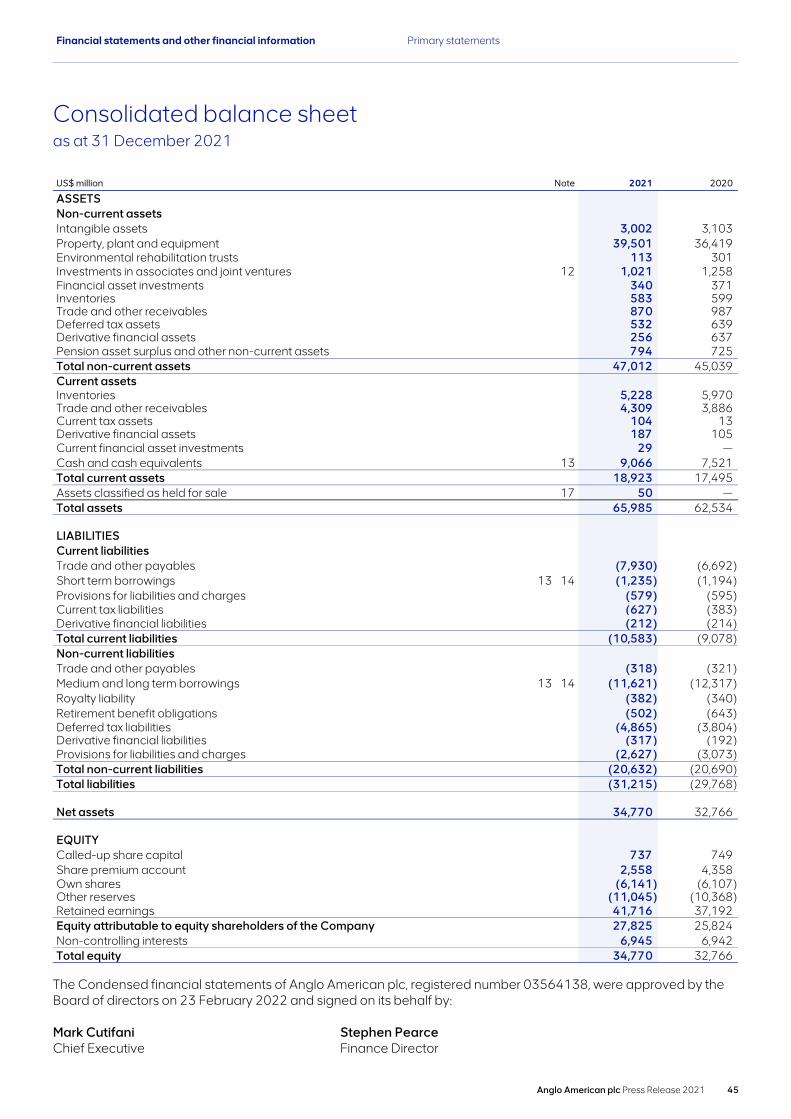
Consolidated balance sheetas at 31 December 2021
US$ million Note 2021 2020
ASSETSNon-current assetsIntangible assets 3,002 3,103 Property, plant and equipment 39,501 36,419 Environmental rehabilitation trusts 113 301 Investments in associates and joint ventures 12 1,021 1,258 Financial asset investments 340 371 Inventories 583 599 Trade and other receivables 870 987 Deferred tax assets 532 639 Derivative financial assets 256 637 Pension asset surplus and other non-current assets 794 725 Total non-current assets 47,012 45,039 Current assetsInventories 5,228 5,970 Trade and other receivables 4,309 3,886 Current tax assets 104 13 Derivative financial assets 187 105 Current financial asset investments 29 — Cash and cash equivalents 13 9,066 7,521 Total current assets 18,923 17,495 Assets classified as held for sale 17 50 — Total assets 65,985 62,534
LIABILITIESCurrent liabilitiesTrade and other payables (7,930) (6,692) Short term borrowings 13 14 (1,235) (1,194) Provisions for liabilities and charges (579) (595) Current tax liabilities (627) (383) Derivative financial liabilities (212) (214) Total current liabilities (10,583) (9,078) Non-current liabilitiesTrade and other payables (318) (321) Medium and long term borrowings 13 14 (11,621) (12,317) Royalty liability (382) (340) Retirement benefit obligations (502) (643) Deferred tax liabilities (4,865) (3,804) Derivative financial liabilities (317) (192) Provisions for liabilities and charges (2,627) (3,073) Total non-current liabilities (20,632) (20,690) Total liabilities (31,215) (29,768)
Net assets 34,770 32,766
EQUITYCalled-up share capital 737 749 Share premium account 2,558 4,358 Own shares (6,141) (6,107) Other reserves (11,045) (10,368) Retained earnings 41,716 37,192 Equity attributable to equity shareholders of the Company 27,825 25,824 Non-controlling interests 6,945 6,942 Total equity 34,770 32,766
The Condensed financial statements of Anglo American plc, registered number 03564138, were approved by the Board of directors on 23 February 2022 and signed on its behalf by:
Mark Cutifani Stephen PearceChief Executive Finance Director
Financial statements and other financial information Primary statements
Anglo American plc Press Release 2021 45

Consolidated cash flow statementfor the year ended 31 December 2021
US$ million Note 2021 2020
Cash flows from operating activitiesProfit before tax 17,629 5,464 Net finance costs including financing special items and remeasurements 5 390 783 Net income from associates and joint ventures 12 (634) (103) Non-operating special items 9 207 (513) Operating profit 17,592 5,631 Revenue and operating special items and remeasurements 9 (499) 1,056 Cash element of special items (18) (107) Depreciation and amortisation 2,715 2,597 Share-based payment charges 189 166 (Decrease)/increase in provisions and net retirement benefit obligations (303) 126 Decrease/(increase) in inventories 328 (1,560) Increase in operating receivables (637) (1,035) Increase in operating payables 1,368 1,061 Other adjustments (147) 63 Cash flows from operations 20,588 7,998 Dividends from associates and joint ventures 12 475 226 Dividends from financial asset investments 1 — Income tax paid (4,341) (1,606) Net cash inflows from operating activities 16,723 6,618
Cash flows from investing activitiesExpenditure on property, plant and equipment 11 (5,732) (4,647) Cash flows used in derivatives related to capital expenditure 11 (8) (11) Proceeds from disposal of property, plant and equipment 11 17 7 Investments in associates and joint ventures (35) (14) Expenditure on intangible assets (68) (63) Net redemption of financial asset investments held at amortised cost 29 67 Interest received and other investment income 87 84 Net cash outflow on acquisitions 18 — (520) Net cash inflow on disposals 18 63 384 Other investing activities 89 (27) Net cash used in investing activities (5,558) (4,740)
Cash flows from financing activitiesInterest paid (433) (471) Cash flows from/(used in) derivatives related to financing activities 13 95 (20) Dividends paid to Company shareholders 7 (4,047) (904) Dividends paid to non-controlling interests (2,838) (668) Proceeds from issuance of bonds 996 2,966 Proceeds from other borrowings 972 2,121 Capital repayment of lease obligations (336) (195) Repayments of bonds and borrowings (2,554) (3,160) Purchase of shares by Group companies (1,084) (385) Other financing activities (127) — Net cash used in financing activities (9,356) (716)
Net increase in cash and cash equivalents 1,809 1,162
Cash and cash equivalents at start of year 13 7,508 6,335 Cash movements in the year 1,809 1,162 Effects of changes in foreign exchange rates (260) 11 Cash and cash equivalents at end of year 13 9,057 7,508
Financial statements and other financial information Primary statements
46 Anglo American plc Press Release 2021

Consolidated statement of changes in equityfor the year ended 31 December 2021
US$ million
Total share
capital(1)Own
shares(2)Retained earnings
Cumulative translation
adjustment reserve
Other reserves(3)
Total equity attributable
to equity shareholders
of the Company
Non-controlling
interests Total
equity
At 1 January 2020 5,111 (6,195) 36,274 (10,965) 570 24,795 6,590 31,385
Profit for the year — — 2,089 — — 2,089 1,239 3,328
Other comprehensive income/(loss) — — — (39) 49 10 (35) (25)
Dividends — — (904) — — (904) (810) (1,714)
Equity settled share-based payment schemes — 89 (95) — 21 15 1 16
Shares cancelled during the year (4) — — — 4 — — —
Share buyback — — (223) — — (223) — (223)
Change in ownership — — 44 — — 44 (58) (14)
Other — (1) 7 — (8) (2) 15 13
At 31 December 2020 5,107 (6,107) 37,192 (11,004) 636 25,824 6,942 32,766
Profit for the year — — 8,562 — — 8,562 3,137 11,699
Other comprehensive income/(loss) — — 81 (692) (8) (619) (267) (886)
Dividends — — (4,047) — — (4,047) (2,837) (6,884)
Equity settled share-based payment schemes — (71) (10) — 15 (66) 3 (63)
Shares cancelled during the year (12) — — — 12 — — —
Share buyback — — (1,000) — — (1,000) — (1,000)
Change in ownership — — (73) — — (73) 89 16
In specie return of capital relating to Thungela demerger (note 18) (1,800) — 1,081 — — (719) (106) (825)
Other — 37 (70) — (4) (37) (16) (53)
At 31 December 2021 3,295 (6,141) 41,716 (11,696) 651 27,825 6,945 34,770 (1) Includes share capital and share premium.
(2) Own shares comprise shares of Anglo American plc held by the Company, its subsidiaries and employee benefit trusts.(3) Includes the share-based payment reserve, financial asset revaluation reserve, capital redemption reserve, legal reserve and other reserves.
Financial statements and other financial information Primary statements
Anglo American plc Press Release 2021 47
Notes to the Condensed financial statements
1. Basis of preparation
Basis of Preparation
On 31 December 2020, IFRS as adopted by the European Union at that date was brought into UK law and became UK-adopted International Accounting Standards, with future changes being subject to endorsement by the UK Endorsement Board. The Group transitioned to UK-adopted international accounting standards on 1 January 2021 and accordingly the Group’s annual Consolidated financial statements for the year ending 31 December 2021 have been prepared under UK-adopted international accounting standards. This change constitutes a change in accounting framework. However, there is no impact on recognition, measurement or disclosure in the year reported as a result of the change in framework.
The Condensed financial statements for the year ended 31 December 2021 do not constitute statutory accounts as defined in section 435 (1) and (2) of the Companies Act 2006. The results for the year to 31 December 2021 have been extracted from the 31 December 2021 audited Consolidated Financial Statements which have been approved by the Board of Directors. Statutory accounts for the year ended 31 December 2020 have been delivered to the Registrar of Companies and those for 2021 will be delivered following the Company’s Annual General Meeting convened for 19 April 2022. The auditors have reported on these accounts; their reports were unqualified, did not include a reference to any matters to which the auditors drew attention by way of emphasis of matter and did not contain a statement under section 498 (2) or (3) of the Companies Act 2006.
Whilst the preliminary announcement (the Condensed financial statements) has been prepared in accordance with UK-adopted International Accounting Standards, with those parts of the Companies Act 2006 applicable to companies reporting under those standards and the requirements of the Listing Rules of the Financial Conduct Authority in the United Kingdom, these Condensed financial statements do not contain sufficient information to comply with UK-adopted International Accounting Standards. The Group will publish full financial statements that comply with UK-adopted International Accounting Standards in March 2022.
Going concern
The financial position of the Group, its cash flows, liquidity position and borrowing facilities are set out in the Group financial review on pages 6-10. The Group’s net debt (including related hedges) at 31 December 2021 was $3.8 billion (2020(restated): $5.5 billion), representing a gearing level of 10% (2020: 14%). The Group’s liquidity position (defined as cash and undrawn committed facilities) of $17.1 billion at 31 December 2021 remains strong. Details of borrowings and facilities are set out in note14 and further analysis of net debt is set out in note 13.
The directors have considered the Group’s cash flow forecasts for the period to the end of December 2023 under base and downside scenarios. Further consideration was given to the uncertainty of the impact of the Covid-19 pandemic on both the wider macroeconomic environment, including demand for the Group’s products and realised prices, and the Group’s operations, including production levels. In each of the downside scenarios modelled (including price reductions of up to 20% against budget, operational incidents and climate change impacts), the Group maintains sufficient liquidity throughout the period of assessment without the use of mitigating actions.
The Board is satisfied that the Group’s forecasts and projections, taking account of reasonably possible changes in trading performance, show that the Group will be able to operate within the level of its current facilities for the period of at least 12 months from the date of approval of the financial statements. For this reason the Group continues to adopt the going concern basis in preparing its financial statements.
Alternative Performance Measures
When assessing and discussing the Group’s reported financial performance, financial position and cash flows, management makes reference to Alternative Performance Measures (APMs) of historical or future financial performance, financial position or cash flows that are not defined or specified under IFRS. APMs should be considered in addition to, and not as a substitute for or as superior to, measures of financial performance, financial position or cash flows reported in accordance with IFRS. Further information on APMs is provided on page 83 of these Condensed financial statements.
Financial statements and other financial information
48 Anglo American plc Press Release 2021

2. Changes in accounting policies, estimates and disclosures
The accounting policies applied are materially consistent with those adopted and disclosed in the Group financial statements for the year ended 31 December 2020 with the exception of the change in the Group’s revenue and operating costs recognition policy for physical commodity trades. New accounting pronouncements, principally minor amendments to existing standards, also became effective on 1 January 2021 and have been adopted by the Group. The adoption of these new accounting pronouncements has not had a significant impact on the accounting policies, methods of computation or presentation applied by the Group.
The Group has adopted amendments to IFRS 9, IAS 39, IFRS 7, IFRS 4 and IFRS 16: Interest Rate Benchmark Reform – Phase 2 with no significant impact.
The Group has not early adopted any other amendment, standard or interpretation that has been issued but is not yet effective. It is expected that where applicable, these standards and amendments will be adopted on each respective effective date.
Change in accounting policy for trading of physically settled contracts
The Group has amended its accounting policy in respect of certain physically-settled contracts relating to the purchase and sale of material produced by third-parties (third-party sales). These contracts are entered into and managed collectively to generate a trading margin as part of the Group’s Marketing business and are accounted for as derivatives prior to settlement as they meet the definition of net settlement as defined in IFRS 9 Financial Instruments. Due to the demerger of the Group’s South African thermal coal business and the continued growth of the Group’s trading activities, presentation of the margin arising on these transactions on a net basis will provide more relevant information about the impact of these activities on the Group’s financial performance. Further detail with respect to the change is included in note 8.
Change in accounting estimate
Due to changes in PGM prices, demand and trading conditions, the classification of iridium and ruthenium has been amended from waste products to by-products with effect from 1 January 2021. This prospective change in estimate has increased the carrying value of inventory at 31 December 2021 by $138 million.
Following the normalisation of the metal refining process at the Platinum Group Metals (PGM) business unit (after the temporary Anglo Converter Plant (ACP) shutdown in 2020) and a review of recent price trends, the PGM inventory valuation model has been reassessed and amended. Further detail with respect to the change is included in note 8.
Financial statements and other financial information Notes to the Condensed financial statements
Anglo American plc Press Release 2021 49
Financial performance
Profit attributable to equity shareholders for the year ended 31 December 2021 is $8,562 million (2020: $2,089 million). Underlying earnings for the year ended 31 December 2021 are $8,925 million (2020: $3,135 million). Underlying earnings increased by 185%.
The following disclosures provide further information about the drivers of the Group’s financial performance in the year. This includes analysis of the respective contribution of the Group’s reportable segments along with information about its operating cost base, net finance costs and tax. In addition, disclosure on earnings per share and the dividend is provided.
3. Financial performance by segment
Overview
The Group’s operating segments are aligned to those business units that are evaluated regularly by the chief operating decision maker in deciding how to allocate resources and in assessing performance. Operating segments with similar economic characteristics are aggregated into reportable segments.
The Group has reassessed its reportable segments following the demerger of Thungela (see note 18). The Thermal Coal (South Africa and Cerrejón) operating segment, which was previously aggregated with Metallurgical Coal within the ‘Coal’ reportable segment, has been presented within the ‘Corporate and other’ reportable segment as it is no longer part of the Group’s core business due to the commitment to exit from the production of thermal coal. The results of the Group’s metallurgical coal businesses are now disclosed separately as the ‘Metallurgical Coal’ reportable segment. Additionally, the ‘Nickel and Manganese’ reportable segment has been amended to disaggregate the Nickel and Manganese businesses. Comparative information has been restated to reflect the changes.
Shipping revenue related to shipments of the Group’s products is shown within the relevant operating segment. Revenue from other shipping arrangements, primarily relating to third-party carriage services, is presented within the ‘Corporate and other’ segment, which also includes unallocated corporate costs, exploration costs and the results of the Group’s Thermal Coal (South Africa and Cerrejón) operations. Revenue disclosed in relation to Cerrejón arose in advance of the sale agreement for the disposal on 28 June 2021 (see note 12).
The disclosures in this note include certain Alternative Performance Measures (APMs). For more information on the APMs used by the Group, including definitions, please refer to page 83.
Financial statements and other financial information Notes to the Condensed financial statements
50 Anglo American plc Press Release 2021

Financial performance
3. Financial performance by segment continued
Segment results2021
US$ millionGroup
revenue Underlying
EBITDA
Depreciation and
amortisation Underlying
EBIT
Net finance costs and
income tax expense
Non-controlling
interests Underlying
earnings
De Beers 5,602 1,100 (480) 620 (214) (61) 345 Copper 6,433 4,011 (583) 3,428 (1,337) (572) 1,519 Nickel 710 320 (59) 261 18 — 279 Platinum Group Metals 14,502 7,099 (346) 6,753 (1,919) (1,045) 3,789 Iron Ore 11,104 6,871 (512) 6,359 (1,717) (1,411) 3,231 Metallurgical Coal 2,899 962 (512) 450 (150) — 300 Manganese 768 315 (65) 250 (116) (2) 132 Crop Nutrients 114 (1) (41) (1) (42) 3 — (39) Corporate and other 1,126 (3) (286) (289) (351) 9 (631)
43,258 20,634 (2,844) 17,790 (5,783) (2) (3,082) 8,925 Less: associates and joint ventures(3) (1,711) (826) 129 (697) 235 2 (460) Subsidiaries and joint operations 41,547 19,808 (2,715) 17,093 (5,548) (3,080) 8,465
Reconciliation:Net income from associates and joint
ventures 634 634 Special items and remeasurements 7 292 (537) Revenue 41,554 Profit before net finance costs and tax 18,019 Profit attributable to equity shareholders
of the Company 8,562
Financial statements and other financial information Notes to the Condensed financial statements
Anglo American plc Press Release 2021 51
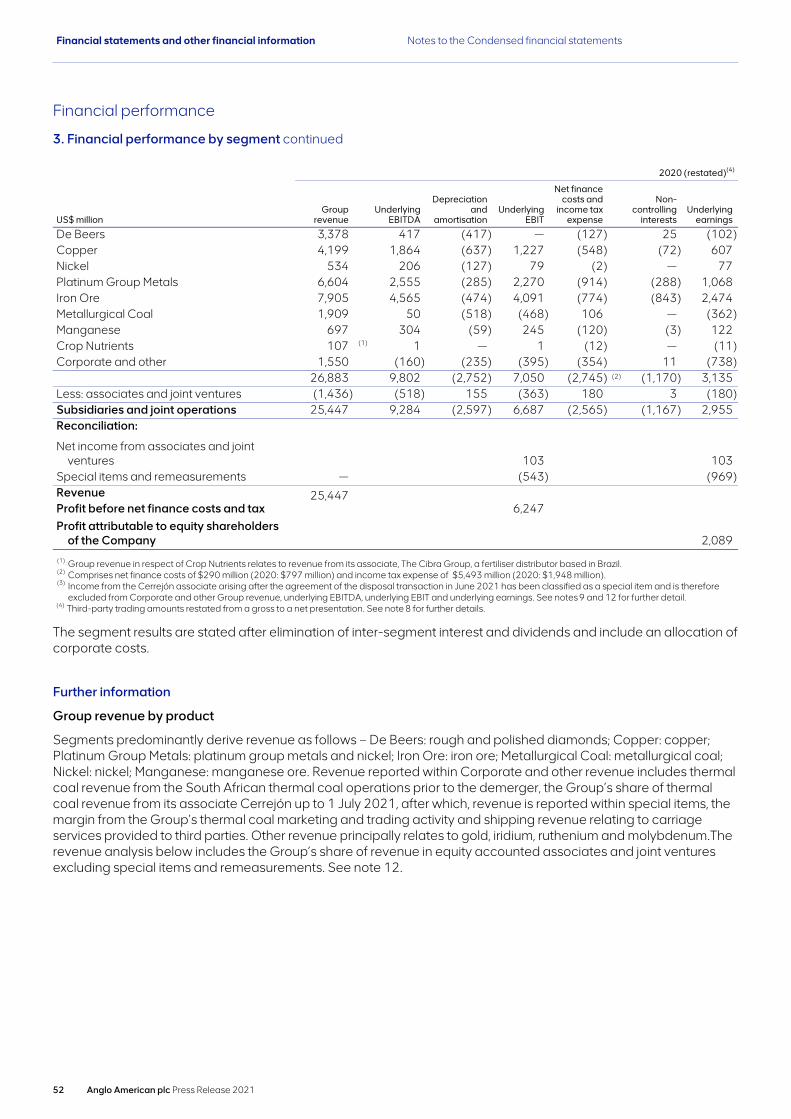
Financial performance
3. Financial performance by segment continued
2020 (restated)(4)
US$ millionGroup
revenueUnderlying
EBITDA
Depreciation and
amortisation Underlying
EBIT
Net financecosts and
income tax expense
Non-controlling
interests Underlying
earnings
De Beers 3,378 417 (417) — (127) 25 (102) Copper 4,199 1,864 (637) 1,227 (548) (72) 607 Nickel 534 206 (127) 79 (2) — 77 Platinum Group Metals 6,604 2,555 (285) 2,270 (914) (288) 1,068 Iron Ore 7,905 4,565 (474) 4,091 (774) (843) 2,474 Metallurgical Coal 1,909 50 (518) (468) 106 — (362) Manganese 697 304 (59) 245 (120) (3) 122 Crop Nutrients 107 (1) 1 — 1 (12) — (11) Corporate and other 1,550 (160) (235) (395) (354) 11 (738)
26,883 9,802 (2,752) 7,050 (2,745) (2) (1,170) 3,135 Less: associates and joint ventures (1,436) (518) 155 (363) 180 3 (180) Subsidiaries and joint operations 25,447 9,284 (2,597) 6,687 (2,565) (1,167) 2,955 Reconciliation:
Net income from associates and joint ventures 103 103
Special items and remeasurements — (543) (969) Revenue 25,447 Profit before net finance costs and tax 6,247 Profit attributable to equity shareholders
of the Company 2,089
(1) Group revenue in respect of Crop Nutrients relates to revenue from its associate, The Cibra Group, a fertiliser distributor based in Brazil. (2) Comprises net finance costs of $290 million (2020: $797 million) and income tax expense of $5,493 million (2020: $1,948 million). (3) Income from the Cerrejón associate arising after the agreement of the disposal transaction in June 2021 has been classified as a special item and is therefore
excluded from Corporate and other Group revenue, underlying EBITDA, underlying EBIT and underlying earnings. See notes 9 and 12 for further detail. (4) Third-party trading amounts restated from a gross to a net presentation. See note 8 for further details.
The segment results are stated after elimination of inter-segment interest and dividends and include an allocation of corporate costs.
Further information
Group revenue by product
Segments predominantly derive revenue as follows – De Beers: rough and polished diamonds; Copper: copper; Platinum Group Metals: platinum group metals and nickel; Iron Ore: iron ore; Metallurgical Coal: metallurgical coal; Nickel: nickel; Manganese: manganese ore. Revenue reported within Corporate and other revenue includes thermal coal revenue from the South African thermal coal operations prior to the demerger, the Group’s share of thermal coal revenue from its associate Cerrejón up to 1 July 2021, after which, revenue is reported within special items, the margin from the Group’s thermal coal marketing and trading activity and shipping revenue relating to carriage services provided to third parties. Other revenue principally relates to gold, iridium, ruthenium and molybdenum.The revenue analysis below includes the Group’s share of revenue in equity accounted associates and joint ventures excluding special items and remeasurements. See note 12.
Financial statements and other financial information Notes to the Condensed financial statements
52 Anglo American plc Press Release 2021
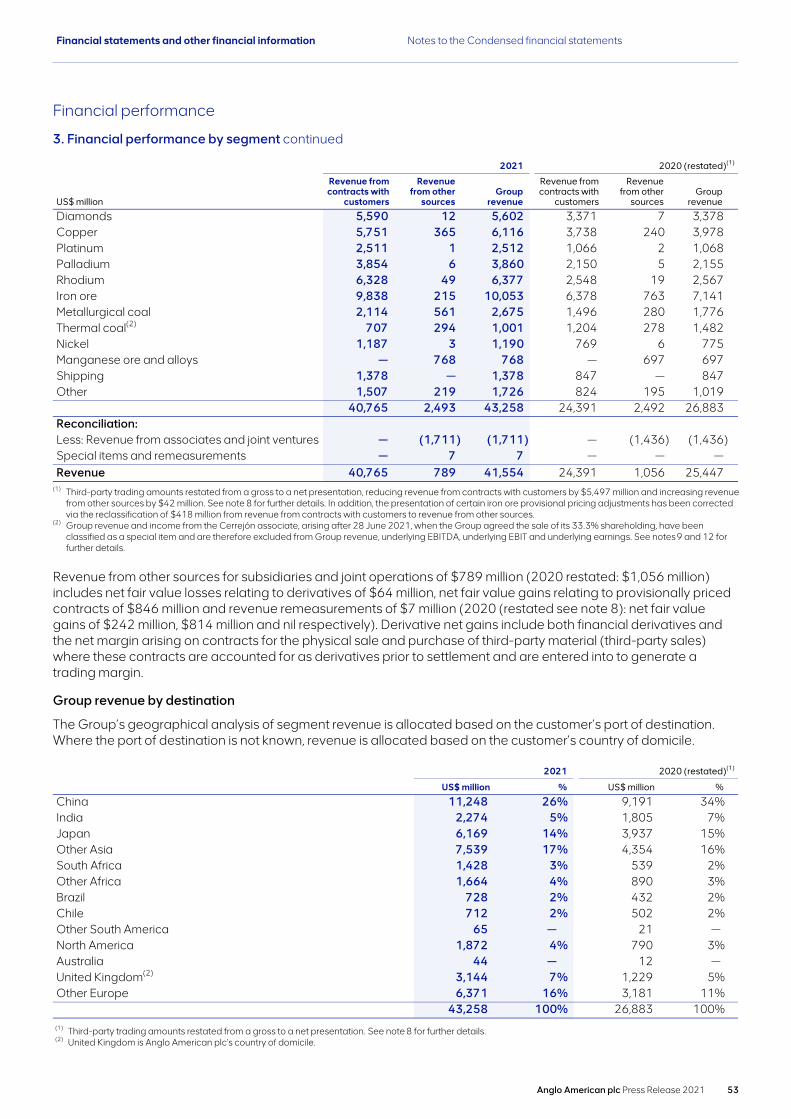
Financial performance
3. Financial performance by segment continued
2021 2020 (restated)(1)
US$ million
Revenue from contracts with
customers
Revenue from other
sources Group
revenue
Revenue from contracts with
customers
Revenue from other
sources Group
revenue
Diamonds 5,590 12 5,602 3,371 7 3,378 Copper 5,751 365 6,116 3,738 240 3,978 Platinum 2,511 1 2,512 1,066 2 1,068 Palladium 3,854 6 3,860 2,150 5 2,155 Rhodium 6,328 49 6,377 2,548 19 2,567 Iron ore 9,838 215 10,053 6,378 763 7,141 Metallurgical coal 2,114 561 2,675 1,496 280 1,776 Thermal coal(2) 707 294 1,001 1,204 278 1,482 Nickel 1,187 3 1,190 769 6 775 Manganese ore and alloys — 768 768 — 697 697 Shipping 1,378 — 1,378 847 — 847 Other 1,507 219 1,726 824 195 1,019
40,765 2,493 43,258 24,391 2,492 26,883 Reconciliation:Less: Revenue from associates and joint ventures — (1,711) (1,711) — (1,436) (1,436) Special items and remeasurements — 7 7 — — — Revenue 40,765 789 41,554 24,391 1,056 25,447
(1) Third-party trading amounts restated from a gross to a net presentation, reducing revenue from contracts with customers by $5,497 million and increasing revenue from other sources by $42 million. See note 8 for further details. In addition, the presentation of certain iron ore provisional pricing adjustments has been corrected via the reclassification of $418 million from revenue from contracts with customers to revenue from other sources.
(2) Group revenue and income from the Cerrejón associate, arising after 28 June 2021, when the Group agreed the sale of its 33.3% shareholding, have been classified as a special item and are therefore excluded from Group revenue, underlying EBITDA, underlying EBIT and underlying earnings. See notes 9 and 12 for further details.
Revenue from other sources for subsidiaries and joint operations of $789 million (2020 restated: $1,056 million) includes net fair value losses relating to derivatives of $64 million, net fair value gains relating to provisionally priced contracts of $846 million and revenue remeasurements of $7 million (2020 (restated see note 8): net fair value gains of $242 million, $814 million and nil respectively). Derivative net gains include both financial derivatives and the net margin arising on contracts for the physical sale and purchase of third-party material (third-party sales) where these contracts are accounted for as derivatives prior to settlement and are entered into to generate a trading margin.
Group revenue by destination
The Group’s geographical analysis of segment revenue is allocated based on the customer’s port of destination. Where the port of destination is not known, revenue is allocated based on the customer’s country of domicile.
2021 2020 (restated)(1)
US$ million % US$ million %
China 11,248 26% 9,191 34% India 2,274 5% 1,805 7% Japan 6,169 14% 3,937 15% Other Asia 7,539 17% 4,354 16% South Africa 1,428 3% 539 2% Other Africa 1,664 4% 890 3% Brazil 728 2% 432 2% Chile 712 2% 502 2% Other South America 65 — 21 —North America 1,872 4% 790 3% Australia 44 — 12 —United Kingdom(2) 3,144 7% 1,229 5% Other Europe 6,371 16% 3,181 11%
43,258 100% 26,883 100% (1) Third-party trading amounts restated from a gross to a net presentation. See note 8 for further details. (2) United Kingdom is Anglo American plc's country of domicile.
Financial statements and other financial information Notes to the Condensed financial statements
Anglo American plc Press Release 2021 53

Financial performance
4. Earnings per share
Overview
The disclosures in this note include certain Alternative Performance Measures (APMs). For more information on the APMs used by the Group, including definitions, please refer to page 83.US$ 2021 2020
Earnings per shareBasic 6.93 1.69 Diluted 6.84 1.67 Underlying earnings per shareBasic 7.22 2.53 Diluted 7.13 2.50 Headline earnings per shareBasic 7.00 2.47 Diluted 6.92 2.44
Further informationThe calculation of basic and diluted earnings per share is based on the following data:
Profit attributable to equityshareholders of the Company Underlying earnings Headline earnings 2021 2020 2021 2020 2021 2020
Earnings (US$ million)Basic and diluted earnings 8,562 2,089 8,925 3,135 8,654 3,056
Weighted average number of shares (million)Basic number of ordinary shares outstanding 1,236 1,239 1,236 1,239 1,236 1,239 Effect of dilutive potential ordinary shares 15 14 15 14 15 14 Diluted number of ordinary shares outstanding 1,251 1,253 1,251 1,253 1,251 1,253
The weighted average number of ordinary shares in issue is the weighted number of shares in issue throughout the year, and excludes shares held by employee benefit trusts and Anglo American plc shares held by Group companies. The weighted average number of shares has decreased since 2020, principally due to the share buyback announced in July 2021. The diluted number of ordinary shares outstanding, including share options and awards, is calculated on the assumption of conversion of all potentially dilutive ordinary shares. In the year ended 31 December 2021 there were 19,953 (2020: 198,161) share options that were potentially dilutive but not included in the calculation of diluted earnings because they were anti-dilutive.
Headline earnings, a Johannesburg Stock Exchange defined performance measure, is reconciled from profit attributable to equity shareholders of the Company as follows:
2021 2020
US$ million Gross Net Gross Net
Profit attributable to equity shareholders of the Company 8,562 2,089 Special items and remeasurements 363 1,046 Underlying earnings for the financial year 8,925 3,135 Revenue remeasurements 7 14 — — Operating special items – restructuring — — (50) (40) Operating remeasurements (106) (111) (56) (71) Non-operating special items – remeasurement of deferred consideration 453 306 509 348 Non-operating special items – disposals (16) (32) — — Financing special items and remeasurements (113) (113) (8) (8) Tax special items and remeasurements — (317) — (344) Associates’ and joint ventures’ special items and remeasurements — (10) — — Other reconciling items 10 (8) 72 36 Headline earnings for the financial year 8,654 3,056
The reconciling items above are shown gross and net of tax and non-controlling interests.
Other reconciling items principally relate to adjustments to former operations and disposals of property, plant and equipment (2020: relate to adjustments to former operations and disposals of property, plant and equipment and investments).
Financial statements and other financial information Notes to the Condensed financial statements
54 Anglo American plc Press Release 2021
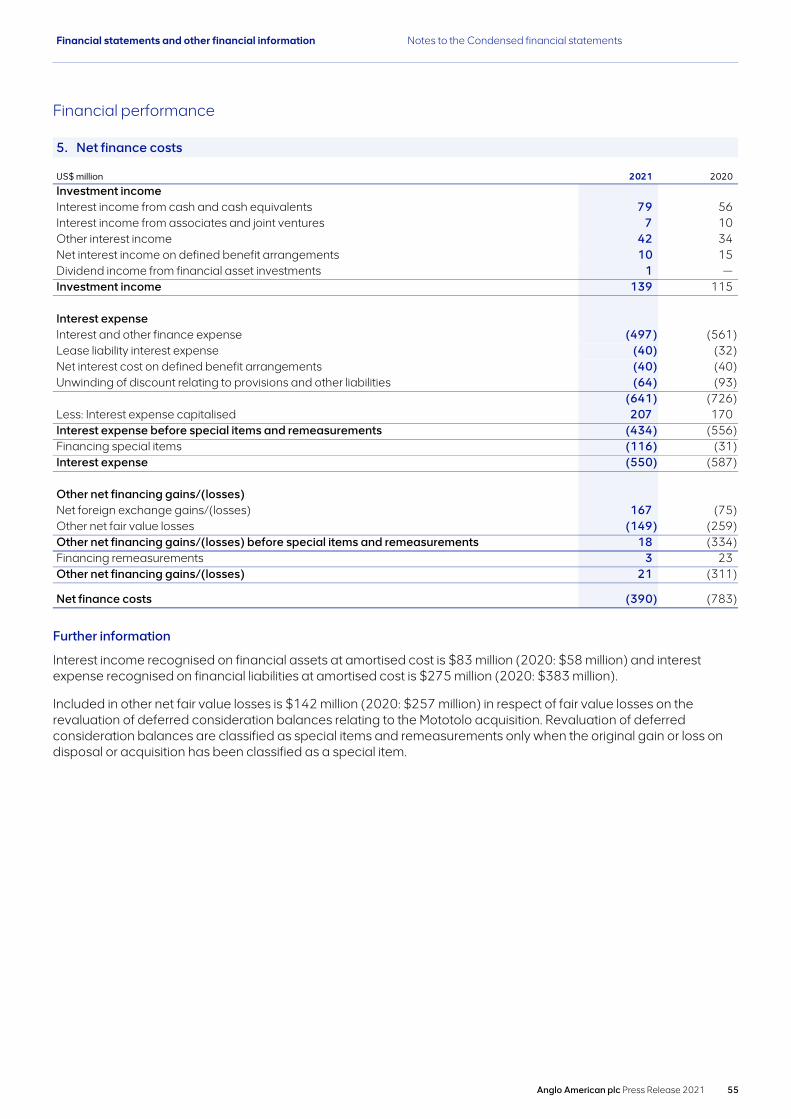
Financial performance
5. Net finance costs
US$ million 2021 2020
Investment incomeInterest income from cash and cash equivalents 79 56 Interest income from associates and joint ventures 7 10 Other interest income 42 34 Net interest income on defined benefit arrangements 10 15 Dividend income from financial asset investments 1 — Investment income 139 115
Interest expenseInterest and other finance expense (497) (561) Lease liability interest expense (40) (32) Net interest cost on defined benefit arrangements (40) (40) Unwinding of discount relating to provisions and other liabilities (64) (93)
(641) (726) Less: Interest expense capitalised 207 170 Interest expense before special items and remeasurements (434) (556) Financing special items (116) (31) Interest expense (550) (587)
Other net financing gains/(losses)Net foreign exchange gains/(losses) 167 (75) Other net fair value losses (149) (259) Other net financing gains/(losses) before special items and remeasurements 18 (334) Financing remeasurements 3 23 Other net financing gains/(losses) 21 (311)
Net finance costs (390) (783)
Further information
Interest income recognised on financial assets at amortised cost is $83 million (2020: $58 million) and interest expense recognised on financial liabilities at amortised cost is $275 million (2020: $383 million).
Included in other net fair value losses is $142 million (2020: $257 million) in respect of fair value losses on the revaluation of deferred consideration balances relating to the Mototolo acquisition. Revaluation of deferred consideration balances are classified as special items and remeasurements only when the original gain or loss on disposal or acquisition has been classified as a special item.
Financial statements and other financial information Notes to the Condensed financial statements
Anglo American plc Press Release 2021 55
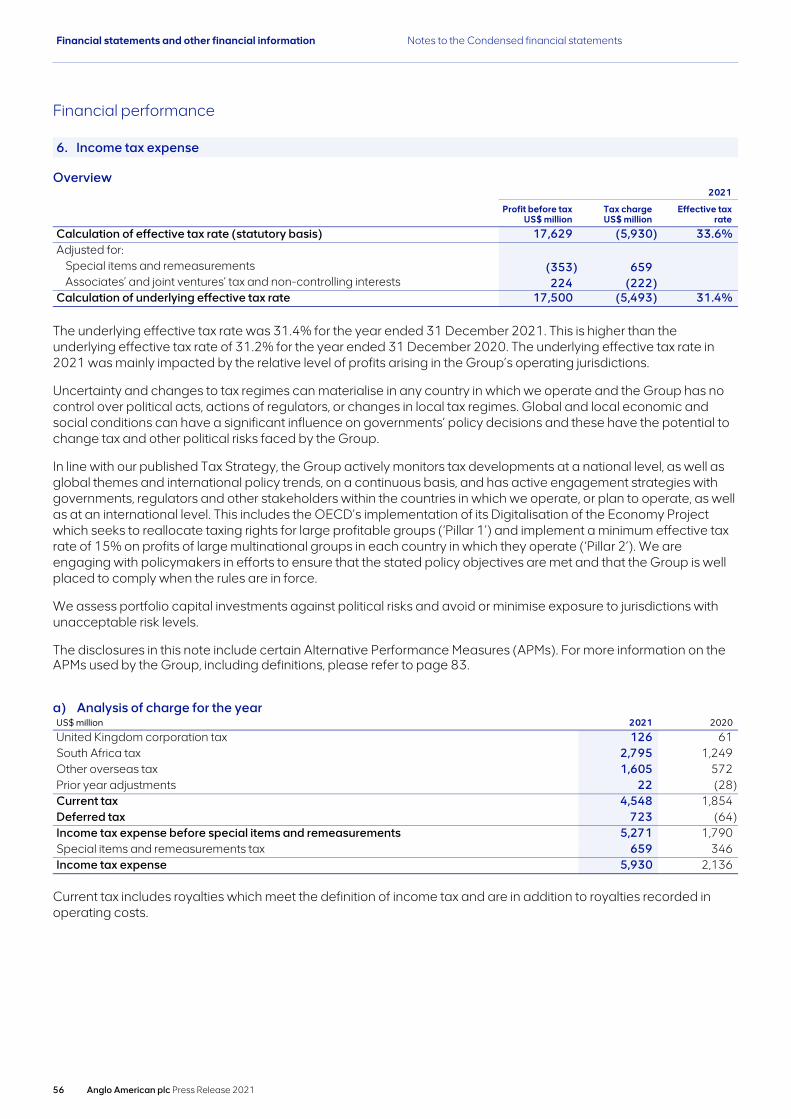
Financial performance
6. Income tax expense
Overview2021
Profit before tax US$ million
Tax chargeUS$ million
Effective tax rate
Calculation of effective tax rate (statutory basis) 17,629 (5,930) 33.6% Adjusted for:
Special items and remeasurements (353) 659 Associates’ and joint ventures’ tax and non-controlling interests 224 (222)
Calculation of underlying effective tax rate 17,500 (5,493) 31.4%
The underlying effective tax rate was 31.4% for the year ended 31 December 2021. This is higher than the underlying effective tax rate of 31.2% for the year ended 31 December 2020. The underlying effective tax rate in 2021 was mainly impacted by the relative level of profits arising in the Group’s operating jurisdictions.
Uncertainty and changes to tax regimes can materialise in any country in which we operate and the Group has no control over political acts, actions of regulators, or changes in local tax regimes. Global and local economic and social conditions can have a significant influence on governments’ policy decisions and these have the potential to change tax and other political risks faced by the Group.
In line with our published Tax Strategy, the Group actively monitors tax developments at a national level, as well as global themes and international policy trends, on a continuous basis, and has active engagement strategies with governments, regulators and other stakeholders within the countries in which we operate, or plan to operate, as well as at an international level. This includes the OECD’s implementation of its Digitalisation of the Economy Project which seeks to reallocate taxing rights for large profitable groups (‘Pillar 1’) and implement a minimum effective tax rate of 15% on profits of large multinational groups in each country in which they operate (‘Pillar 2’). We are engaging with policymakers in efforts to ensure that the stated policy objectives are met and that the Group is well placed to comply when the rules are in force.
We assess portfolio capital investments against political risks and avoid or minimise exposure to jurisdictions with unacceptable risk levels.
The disclosures in this note include certain Alternative Performance Measures (APMs). For more information on the APMs used by the Group, including definitions, please refer to page 83.
a) Analysis of charge for the yearUS$ million 2021 2020
United Kingdom corporation tax 126 61 South Africa tax 2,795 1,249 Other overseas tax 1,605 572 Prior year adjustments 22 (28) Current tax 4,548 1,854 Deferred tax 723 (64) Income tax expense before special items and remeasurements 5,271 1,790 Special items and remeasurements tax 659 346 Income tax expense 5,930 2,136
Current tax includes royalties which meet the definition of income tax and are in addition to royalties recorded in operating costs.
Financial statements and other financial information Notes to the Condensed financial statements
56 Anglo American plc Press Release 2021
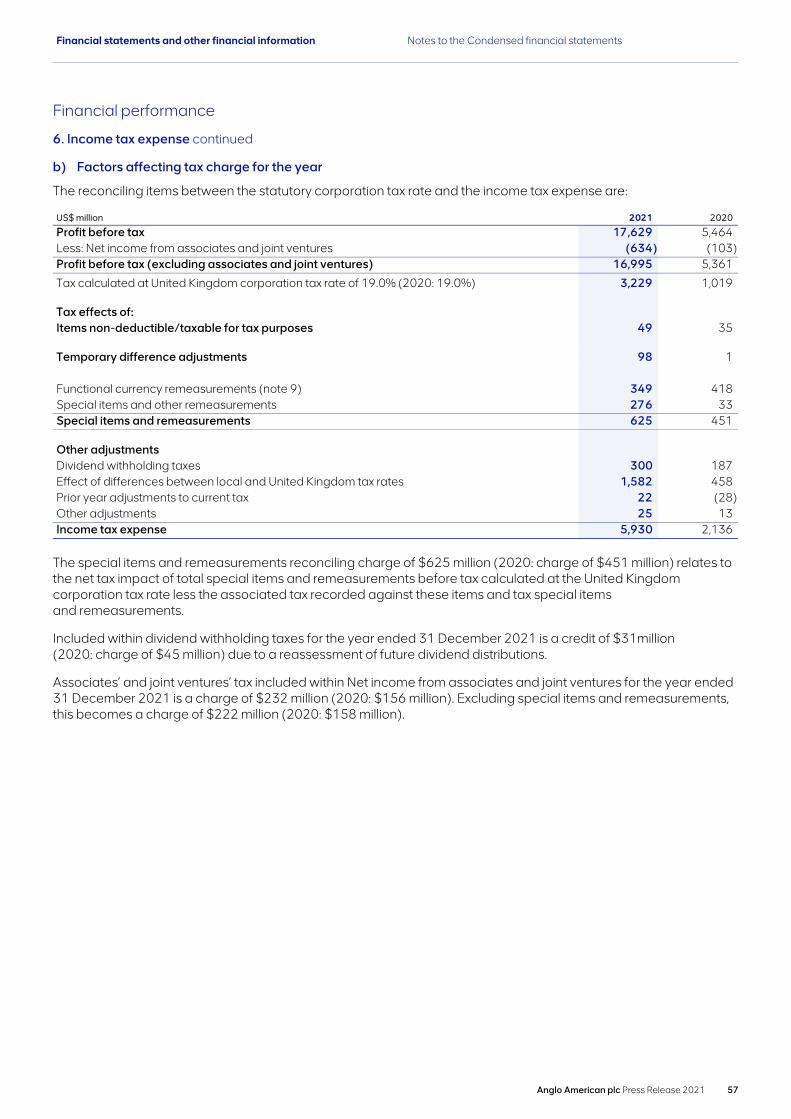
Financial performance
6. Income tax expense continued
b) Factors affecting tax charge for the year
The reconciling items between the statutory corporation tax rate and the income tax expense are:
US$ million 2021 2020
Profit before tax 17,629 5,464 Less: Net income from associates and joint ventures (634) (103) Profit before tax (excluding associates and joint ventures) 16,995 5,361
Tax calculated at United Kingdom corporation tax rate of 19.0% (2020: 19.0%) 3,229 1,019
Tax effects of:Items non-deductible/taxable for tax purposes 49 35
Temporary difference adjustments 98 1
Functional currency remeasurements (note 9) 349 418 Special items and other remeasurements 276 33 Special items and remeasurements 625 451
Other adjustmentsDividend withholding taxes 300 187 Effect of differences between local and United Kingdom tax rates 1,582 458 Prior year adjustments to current tax 22 (28) Other adjustments 25 13 Income tax expense 5,930 2,136
The special items and remeasurements reconciling charge of $625 million (2020: charge of $451 million) relates to the net tax impact of total special items and remeasurements before tax calculated at the United Kingdom corporation tax rate less the associated tax recorded against these items and tax special items and remeasurements.
Included within dividend withholding taxes for the year ended 31 December 2021 is a credit of $31million (2020: charge of $45 million) due to a reassessment of future dividend distributions.
Associates’ and joint ventures’ tax included within Net income from associates and joint ventures for the year ended 31 December 2021 is a charge of $232 million (2020: $156 million). Excluding special items and remeasurements, this becomes a charge of $222 million (2020: $158 million).
Financial statements and other financial information Notes to the Condensed financial statements
Anglo American plc Press Release 2021 57

Financial performance
7. Dividends
2021 2020
Proposed final ordinary dividend per share (US cents) 118 72 Proposed final ordinary dividend (US$ million) 1,444 899 Proposed final special dividend per share (US cents) 50 — Proposed final special dividend (US$ million) 612 —
These financial statements do not reflect the proposed final ordinary dividend or final special dividend as it is still subject to shareholder approval.
Dividends paid during the year are as follows:
US$ million 2021 2020
Final ordinary dividend for 2020 – 72 US cents per ordinary share (2019: 47 US cents per ordinary share)
907 557
Interim ordinary dividend for 2021 – 171 US cents per ordinary share (2020: 28 US cents per ordinary share)
2,140 347
Interim special dividend for 2021 – 80 US cents per ordinary share (2020: nil) 1,000 —
4,047 904
As at the dividend record date, there are forecasted to be 1,223,693,614 (2020: 1,248,370,165) dividend bearing shares in issue.
Financial statements and other financial information Notes to the Condensed financial statements
58 Anglo American plc Press Release 2021

In the course of preparing financial statements, management necessarily makes judgements and estimates that can have a significant impact on the financial statements. The critical judgements and key sources of estimation uncertainty that affect the results for the year ended 31 December 2021are set out below. In addition to these items, further detail on other significant judgements and estimates determined by management is provided, where applicable, in the relevant note to the financial statements.
Impairment and impairment reversals of assetsi) Critical accounting judgements
The Group assesses at each reporting date whether there are any indicators that its assets and cash generating units (CGUs) may be impaired. Operating and economic assumptions which could affect the valuation of assets using discounted cash flows, including those that could be impacted by the Group’s current and emerging principal risks such as climate change, are updated regularly as part of the Group’s planning and forecasting processes. Judgement is therefore required to determine whether the updates represent significant changes in the service potential of an asset or CGU, and are therefore indicators of impairment or impairment reversal. The judgement also takes into account the Group’s long term economic forecasts, market consensus and sensitivity analysis of the discounted cash flow models used to value the Group’s assets.
Assets (other than goodwill) that have been previously impaired must be assessed for indicators of both impairment and impairment reversal. Such assets are generally carried on the balance sheet at a value close to their recoverable amount at the last assessment. Therefore in principle any change to operational plans or assumptions or economic parameters could result in further impairment or impairment reversal if an indicator is identified. Significant operating assets that the Group has previously impaired include Minas-Rio (Iron Ore); Dawson, Capcoal, Moranbah-Grosvenor (Metallurgical Coal) and Barro Alto (Nickel). These assets have a combined carrying value of $10.3 billion within property, plant and equipment as at 31 December 2021, of which the most significant individual asset is Minas-Rio, which has a carrying value of $6.8 billion.
ii) Cash flow projections for impairment testing
Expected future cash flows used in discounted cash flow models are inherently uncertain and could materially change over time. They are significantly affected by a number of factors including Ore Reserves and Mineral Resources, together with economic factors such as commodity prices, exchange rates, discount rates and estimates of production costs and future capital expenditure. Where discounted cash flow models based on management’s assumptions are used, the resulting fair value measurements are considered to be at level 3 in the fair value hierarchy, as defined in IFRS 13 Fair Value Measurement, as they depend to a significant extent on unobservable valuation inputs.
Cash flow projections are based on financial budgets and Life of Mine Plans or, for non-mine assets, an equivalent appropriate long term forecast, incorporating key assumptions as detailed below:
– Ore Reserves and Mineral ResourcesOre Reserves and, where considered appropriate, Mineral Resources are incorporated in projected cash flows, based on Ore Reserves and Mineral Resources statements and exploration and evaluation work undertaken by appropriately qualified persons. Mineral Resources are included where management has a high degree of confidence in their economic extraction, despite additional evaluation still being required prior to meeting the required confidence to convert to Ore Reserves.
– Commodity and product pricesCommodity and product prices are based on latest internal forecasts, benchmarked with external sources of information such as the range of available analyst forecasts and for the short term, spot prices. In estimating the forecast cash flows, management also takes into account the expected realised price from existing contractual arrangements.
– Foreign exchange ratesForeign exchange rates are based on latest internal forecasts, benchmarked with external sources of information for relevant countries of operation or directly from external forecasts. Long term foreign exchange rates are kept constant on a real basis.
Financial statements and other financial information Notes to the Condensed financial statements
Significant items8. Significant accounting matters
Anglo American plc Press Release 2021 59
– Discount ratesCash flow projections used in fair value less costs of disposal impairment models are discounted based on real post-tax discount rates, assessed annually. Adjustments to the rates are made for any risks that are not reflected in the underlying cash flows, including the risk profile of the individual asset and country risk.
– Operating costs, capital expenditure and other operating factorsOperating costs and capital expenditure are based on financial budgets covering a five-year period. Cash flow projections beyond five years are based on Life of Mine Plans, as applicable, and internal management forecasts. Cost assumptions incorporate management experience and expectations, as well as the nature and location of the operation and the risks associated therewith (for example, the grade of Ore Reserves varying significantly over time and unforeseen operational issues). Underlying input cost assumptions are consistent with related output price assumptions. Other operating factors, such as the timelines of granting licences and permits, are based on management’s best estimate of the outcome of uncertain future events at the balance sheet date. For further information refer to the unaudited Ore Reserves and Mineral Resources Report 2021.
Where an asset has potential for future development through capital investment, to which a market participant would attribute value, and the costs and economic benefits can be estimated reliably, this development is included in the recoverable amount (with appropriate risk adjustments).
– Climate changeClimate change may have various impacts for the Group. These include the risks and opportunities relating to the demand for the Group’s commodities as a result of the transition to a low carbon economy, and physical risks caused by climate change such as the inability to obtain or sustain the level of water security needed to support operations. The Group has incorporated carbon pricing when preparing discounted cashflow valuations. Short-term carbon prices are incorporated based on currently enacted legislation, and longer term carbon prices are based on the latest internal views, formed with reference to external forecasts. Separate carbon prices are used for developed and developing economies. These carbon prices are used both as an input into our commodity price forecasts and in our forecast carbon cost for each operation. Carbon costs are based on the forecast carbon price per tonne/CO2e, multiplied by estimated Scope 1 and 2 emissions for the relevant operation.
The cost and benefits of achieving the Group’s emissions reduction ambitions and targets and the implementation of projects to mitigate physical climate risk are included when the Group has a high degree of confidence that a project is technically feasible and it is included in the Life of Mine Plan, which typically aligns with the related capital project being internally approved. This is consistent with the approach taken for other key assumptions such as the inclusion of Ore Reserves and Mineral Resources and forecasted operating costs and capital expenditures as outlined above.
The Group has assessed the strategic and financial resilience of its portfolio under 1.5°C, 2°C and 3°C scenarios. Further disclosure about these scenarios, aligned to the Task Force on Climate-Related Financial Disclosures (TCFD) requirements, is provided in the Group’s 2021 Climate Change Report. These specific scenarios are not used as an input to asset valuations for financial reporting purposes as no single scenario is representative of management’s best estimate of the likely assumptions that would be used by a market participant when valuing the Group’s assets. When constructing a scenario that assumes global temperature increases are contained to a certain level, many judgements and assumptions are needed, including in relation to the nature and speed of technological deployment and the evolution of public policy. Depending on the judgements and assumptions made there is therefore a wide range of possible transition impacts for each level of warming and scenarios may therefore not be comparable between companies.
Financial statements and other financial information Notes to the Condensed financial statements
Significant items
8. Significant accounting matters continued
60 Anglo American plc Press Release 2021
The Group has not yet performed a full assessment of the implications of any resilience scenario on asset valuations used for financial reporting purposes, although we would anticipate that prices for the majority of the Group’s commodities would be higher than existing forecasts in the short and medium term under a 1.5°C or 2°C scenario, driven by growing investment in infrastructure associated with the transition to a low-carbon economy while carbon prices are also likely to be higher than existing forecasts. In the longer term the more rapid decarbonisation of the steel value chain under a 1.5°C or 2°C scenario through higher steel recycling rates and technological change would be expected to lead to lower benchmark prices for both iron ore and metallurgical coal, although we anticipate that for iron ore this may largely be offset by higher product premiums for the Group’s high quality lump and pellet-feed products given these are particularly well-suited to less carbon intensive steelmaking technologies. The valuation of the Group’s metallurgical coal assets is less sensitive to changes in the long-term price than other operations given the remaining asset lives.
iii) Key sources of estimation uncertainty
For assets where indicators of impairment or impairment reversal are identified, the Group performs impairment reviews to assess the recoverable amount of its operating assets principally with reference to fair value less costs of disposal, assessed using discounted cash flow models. Mining operations are large, complex assets requiring significant technical and financial resources to operate. Their value may be sensitive to a range of characteristics unique to each asset. Management applies judgement in determining the assumptions that are considered to be reasonable and consistent with those that would be applied by market participants. All assumptions are made from the perspective of a hypothetical informed market participant (as required by IFRS 13 Fair Value Measurement). As a result, these assumptions may differ from the Group’s own internal forecasts.
Minas-Rio (Iron Ore)
At 30 June 2021, based on improved market conditions in the short and medium term, the valuation of Minas-Rio was assessed and the previous impairments have been partially reversed to a recoverable amount of $7.1 billion, resulting in an impairment reversal of $1.4 billion ($0.9 billion after tax) when applying a discount rate of 7.3%. Another assessment was undertaken at 31 December 2021 as a result of changes in the production profile in the latest Life of Mine Plan but there was no resultant change necessary to the carrying value of the cash generating unit as the recoverable amount was materially consistent with the carrying value.
The latest valuation is inherently sensitive to changes in economic and operational assumptions. The model uses forecast iron ore prices that fall within the analyst range throughout the model. The long term price in the model from 2032 onwards falls within the second quartile of the analyst price range of $62/tonne to $70/tonne (Platts 62% CFR reference basis, 2021 real basis). In addition to the base case valuation, alternative scenarios have been considered to assess the impact of changes in key assumptions, including decreases in the long term iron ore price. If the long term price assumptions used in the model were changed by $5/tonne in each year, with all other assumptions remaining the same, this would change the valuation by $0.6 billion.
De Beers Goodwill
The valuation of De Beers has been assessed as at 31 December 2021 and the recoverable amount was considered to exceed the carrying value by $1.8 billion. The valuation, based on discounted cash flows using a discount rate of 7.0%, is sensitive to input assumptions particularly in relation to the foreign exchange assumption for producer currencies against the USD (affecting the cost of production in USD terms) and the future price growth for diamonds. In addition, the valuation assumes that material contractual arrangements, including our relationship with the Government of the Republic of Botswana, continue without material amendment.
The foreign exchange assumption in respect of the producer currency rates against the USD are sourced from an external provider. In the short term to medium term we assume the southern African producer currencies exchange rates depreciate by between 2% and 3% per annum against the USD compared to the FY21 actual rates. Thereafter the rates are assumed to depreciate by the inflation differential between producer economies and the US.
Financial statements and other financial information Notes to the Condensed financial statements
Significant items
8. Significant accounting matters continued
Anglo American plc Press Release 2021 61
The two primary factors impacting price growth are expected consumer demand growth and changes in global supply. Expected consumer demand growth (in USD terms) is driven predominantly by: local currency GDP growth expectations in the primary markets in which diamonds are sold; foreign exchange movements against the USD in the end consumer markets; and the desirability of diamonds. Desirability includes all aspects of buying behaviour such as competition for share of wallet from other luxury products including experiential holidays, hardline and softline goods, new technology and jewellery products such as those containing other precious stones or laboratory-grown diamonds. The Group has experienced a strong economic recovery from the Covid-19 pandemic in diamond jewellery consuming countries in 2021. External forecasts assume a return to pre-pandemic levels of growth from 2022 onwards with consumer demand recovering to the level seen in 2018 by the beginning of 2023. The real GDP growth assumption in USD terms is 3.0% over the next five years including 3.4% over the first three years which is sourced from an external provider and is weighted by the key markets in which we operate including the US, China, India, Japan, Gulf Region and Eurozone. Over the long-term consumer demand is expected to grow at least in line with inflation.
The external foreign exchange forecast is of annual USD appreciation against the Indian Rupee of 0.3% and USD depreciation against the Chinese Renminbi, Japanese Yen and Euro of 0.3%, 1.7% and 1.1% respectively for the medium term compared to FY21 actual average rates. The consumer demand forecast has assumed that the laboratory-grown diamond jewellery sector will continue to grow as it builds from a relatively small base. However, the forecast is for the laboratory-grown diamond jewellery market size to stabilise by 2026. Changes in total global supply are driven primarily by the output anticipated from new projects and assumes a continued supply contraction over the long term.
The valuation remains sensitive to consumer demand growth which could result in both upside and downside risk. For example, a reduction in the weighted GDP growth rates, a strengthening of the USD against other consumer country currencies or an increase in substitution by laboratory-grown diamonds in certain categories would suppress consumer demand growth. These factors have a range of possible impacts that may not occur independently of each other. A range of alternative scenarios have been considered in determining whether there is a reasonably possible change in the forecast for foreign exchange rates in producer countries in conjunction with a reasonably possible change in consumer demand growth, which would result in the recoverable amount equating to the carrying amount.
A 5% strengthening of the producer currencies against our assumed USD in conjunction with a 0.4 percentage point underperformance in our mid to long term consumer demand growth expectation would result in the recoverable amount equating to the carrying amount. This reduction in the consumer demand growth might be brought about through either a 23% one-off appreciation of the USD against consumer countries’ currencies or a reduction in long term real GDP growth assumptions by 0.4 percentage points, with other valuation assumptions remaining the same. Our assessment is that with other assumptions remaining the same, no reasonably possible change in global supply would result in the recoverable amount equating to the carrying amount.
Accounting policy change from a gross revenue presentation to a net basis
During the year the Group amended its accounting policy in respect of certain physically-settled contracts relating to the purchase and sale of material produced by third parties (third-party sales) and now presents the margin on these transactions on a net basis within revenue from other sources where the contracts form part of the Group’s commodity trading activities. Judgement was applied to determine that the revised policy would provide more relevant information given the demerger of the Group’s South African thermal coal business and the continued growth of the Group’s trading activities.
Revenue and operating costs for the year ended 31 December 2021 are both $8.0 billion lower than would have been reported under the Group’s previous accounting policy ($4.1 billion of which relates to copper, $1.8 billion relates to platinum group metals and $1.8 billion relates to thermal coal), with no impact on operating profit or reported cash flows. The prior period comparative has been restated for this change in accounting policy. Revenue and operating costs for the year ended 31 December 2020 have both reduced by $5.5 billion compared to the previously reported values, with no impact on operating profit or reported cash flows.
Financial statements and other financial information Notes to the Condensed financial statements
Significant items
8. Significant accounting matters continued
62 Anglo American plc Press Release 2021

Change in accounting estimate for PGM inventories
Following the normalisation of the metal refining process at the Platinum Group Metals (PGM) business unit (after the temporary Anglo Converter Plant (ACP) shutdown in 2020) and a review of recent price trends, the PGM inventory valuation model has been reassessed and amended. The most significant amendment relates to the valuation of concentrate purchased from third parties. This material is now valued using a six-month rolling average cost, which is more closely aligned to the number of months stock on hand, including stock within the production process, than the twelve-month rolling average used in previous periods. The change in estimate had the effect of decreasing the value of inventory as disclosed in the financial statements at 31 December 2021 by $381 million with a corresponding increase in operating costs.
Thungela Disposal
On 4 June 2021, the Group completed the demerger of its South African thermal coal assets into a newly incorporated company, Thungela Resources Limited (Thungela), that on 7 June 2021 was admitted to trading on both the Johannesburg and London Stock Exchanges (JSE and LSE). As a level 3 fair value measurement at the date of the demerger, a discounted cash flow model was used to determine the fair value of the in specie return of capital and retained financial asset investment. The Group applied judgement to select appropriate inputs to this model, in particular with respect to the discount rate and forecast thermal coal prices. See note 18 for further details.
Recognition of deferred tax assets
As a result of both the partial utilisation of the asset, as well as the increase in the deferred tax liability relating to functional currency remeasurements, the net deferred tax asset recognised in Brazil in relation to the Minas-Rio iron ore mine at 31 December 2020, has become a net deferred tax liability at 31 December 2021. Accordingly, it is no longer considered to be a significant accounting matter for the Group.
Financial statements and other financial information Notes to the Condensed financial statements
Significant items
8. Significant accounting matters continued
Anglo American plc Press Release 2021 63
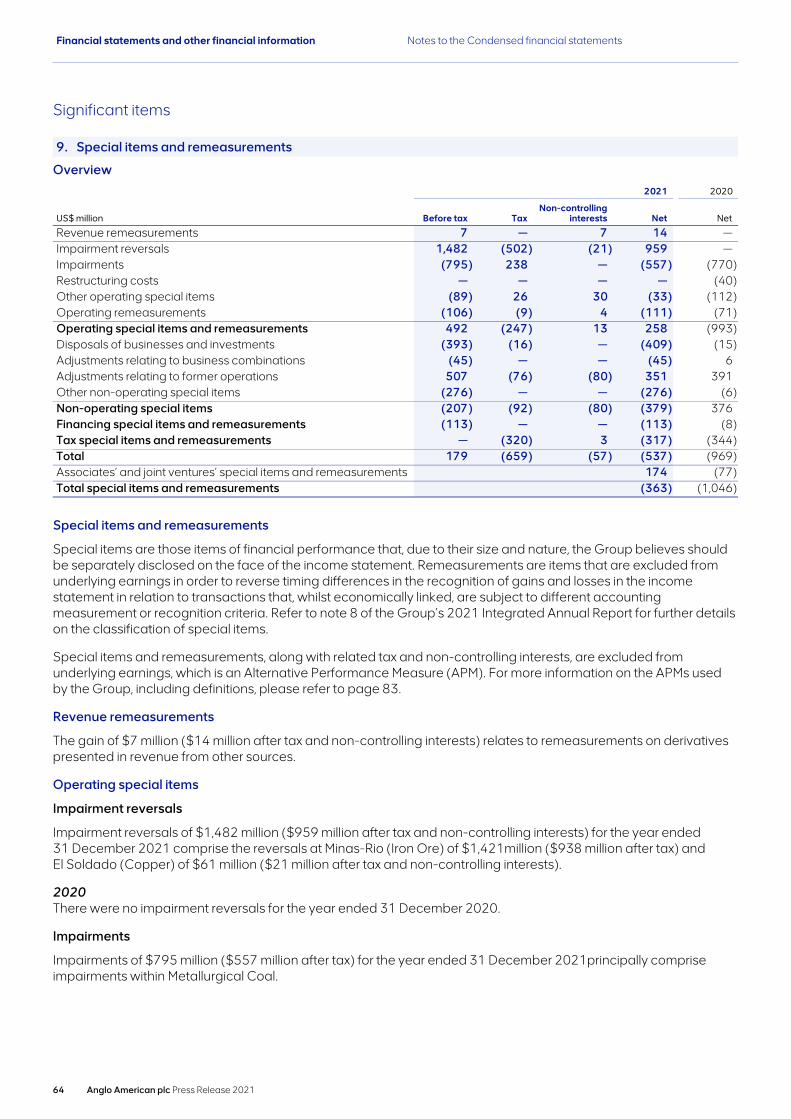
Overview
2021 2020
US$ million Before tax TaxNon-controlling
interests Net Net
Revenue remeasurements 7 — 7 14 — Impairment reversals 1,482 (502) (21) 959 — Impairments (795) 238 — (557) (770) Restructuring costs — — — — (40) Other operating special items (89) 26 30 (33) (112) Operating remeasurements (106) (9) 4 (111) (71) Operating special items and remeasurements 492 (247) 13 258 (993) Disposals of businesses and investments (393) (16) — (409) (15) Adjustments relating to business combinations (45) — — (45) 6 Adjustments relating to former operations 507 (76) (80) 351 391 Other non-operating special items (276) — — (276) (6) Non-operating special items (207) (92) (80) (379) 376 Financing special items and remeasurements (113) — — (113) (8) Tax special items and remeasurements — (320) 3 (317) (344) Total 179 (659) (57) (537) (969) Associates’ and joint ventures’ special items and remeasurements 174 (77) Total special items and remeasurements (363) (1,046)
Special items and remeasurements
Special items are those items of financial performance that, due to their size and nature, the Group believes should be separately disclosed on the face of the income statement. Remeasurements are items that are excluded from underlying earnings in order to reverse timing differences in the recognition of gains and losses in the income statement in relation to transactions that, whilst economically linked, are subject to different accounting measurement or recognition criteria. Refer to note 8 of the Group’s 2021 Integrated Annual Report for further details on the classification of special items.
Special items and remeasurements, along with related tax and non-controlling interests, are excluded from underlying earnings, which is an Alternative Performance Measure (APM). For more information on the APMs used by the Group, including definitions, please refer to page 83.
Revenue remeasurements
The gain of $7 million ($14 million after tax and non-controlling interests) relates to remeasurements on derivatives presented in revenue from other sources.
Operating special items
Impairment reversals
Impairment reversals of $1,482 million ($959 million after tax and non-controlling interests) for the year ended 31 December 2021 comprise the reversals at Minas-Rio (Iron Ore) of $1,421million ($938 million after tax) and El Soldado (Copper) of $61 million ($21 million after tax and non-controlling interests).
2020There were no impairment reversals for the year ended 31 December 2020.
Impairments
Impairments of $795 million ($557 million after tax) for the year ended 31 December 2021principally comprise impairments within Metallurgical Coal.
Financial statements and other financial information Notes to the Condensed financial statements
Significant items
9. Special items and remeasurements
64 Anglo American plc Press Release 2021
2020Impairments of $770 million for the year ended 31 December 2020 principally comprise the impairment charges to operations at Barro Alto (Nickel) of $589 million and South African thermal coal (Corporate and other) of $119 million.
Restructuring costs
No restructuring costs were recognised within special items for the year ended 31 December 2021.
2020Restructuring costs of $40 million for the year ended 31 December 2020 principally consisted of restructuring programmes in De Beers.
Other operating special items
The loss of $89 million ($33 million after tax and non‑controlling interest) principally relates to the write-off of redundant waste dump infrastructure assets at Copper Chile (Copper).
2020The net loss of $112 million after tax write-off related to lost equipment and longwall assets, which were assessed to have no future economic benefit following the incident at Grosvenor (Metallurgical Coal) and the write off of other redundant assets.
Operating remeasurements
Operating remeasurements reflect a loss of $106 million ($111 million after tax and non-controlling interests) which principally relates to a $93 million depreciation and amortisation charge arising due to the fair value uplift on the Group’s pre-existing 45% shareholding in De Beers, which was required on acquisition of a controlling stake in 2012.
2020 Operating remeasurements reflected a net loss of $71 million which principally related to depreciation and amortisation charge arising due to the fair value uplift on the Group’s pre-existing 45% shareholding in De Beers, which was required on acquisition of a controlling stake.
Non-operating special items
Disposals of businesses
The $393 million loss ($409 million after tax and non-controlling interests) relates to the demerger of the South African thermal coal operations, for further information please see note 18.
2020The net loss principally relates to the equalisation of ownership across its integrated metallurgical coal operations at Moranbah and Grosvenor in Australia (Metallurgical Coal).
Adjustments relating to business combinations
The $45 million loss during the year ended 31 December 2021 relates to adjustments in respect of business combinations in prior years.
2020The net $6 million gain during the year ended 31 December 2020 related to adjustments in respect of business combinations in prior years.
Adjustments relating to former operations
The net gain of $507 million ($351 million after tax and non-controlling interests) principally relates to contingent consideration adjustments in respect of disposals of the Group's interests in Rustenburg and Union (Platinum Group Metals) completed in 2016 and 2018 respectively, and contingent consideration received in respect of disposal of Anglo American Norte (Copper) completed in 2015.
Financial statements and other financial information Notes to the Condensed financial statements
Significant items
9. Special items and remeasurements continued
Anglo American plc Press Release 2021 65
2020The net gain of $391 million after tax and non-controlling interests related to adjustments in respect of disposals completed in prior years.
Other non-operating special items
On 28 June 2021, the Group announced that it had agreed the sale of its 33.3% shareholding in the Cerrejón associate to Glencore. As the associate’s carrying value was higher than the estimated $294 million consideration due on completion, an impairment of $283 million has been recognised. This includes $184 million of the Group’s share of net income that is immediately impaired (see below), and has been recorded to bring the associate’s carrying value into line with its fair value less costs of disposal. The sale was completed on 11 January 2022.
2020There were no significant other non-operating special items during the year ended 31 December 2020.
Financing special items and remeasurements
Financing special items and remeasurements principally comprise a net fair value loss of $113 million (2020: $31 million) in respect of bond buybacks completed in the year.
Tax associated with special items and remeasurements
Tax associated with special items and remeasurements includes a tax remeasurement charge of $349 million principally arising on Brazilian deferred tax, a tax on special items charge of $339 million and tax special items credit of $29 million (2020: tax remeasurements of $418 million principally arising on Brazilian deferred tax and tax on special items credit of $72 million).
Of the total tax charge of $659 million (2020: $346 million), there is a net current tax charge of $24 million (2020: credit of $32 million) and a net deferred tax charge of $635 million (2020: $378 million).
Associates’ and joint ventures’ special items and remeasurements
Associates’ and joint ventures’ special items and remeasurements of $174 million in the year ended 31 December 2021 principally relates to $184 million income from the Cerrejón associate arising after the agreement of the transaction in June 2021 and immediately impaired to bring the carrying value of the investment in line with the expected disposal proceeds.
2020Associates’ and joint ventures’ special items and remeasurements of $77 million in the year ended 31 December 2020 principally related to impairment charges and restructuring costs in Manganese.
Financial statements and other financial information Notes to the Condensed financial statements
Significant items
9. Special items and remeasurements continued
66 Anglo American plc Press Release 2021
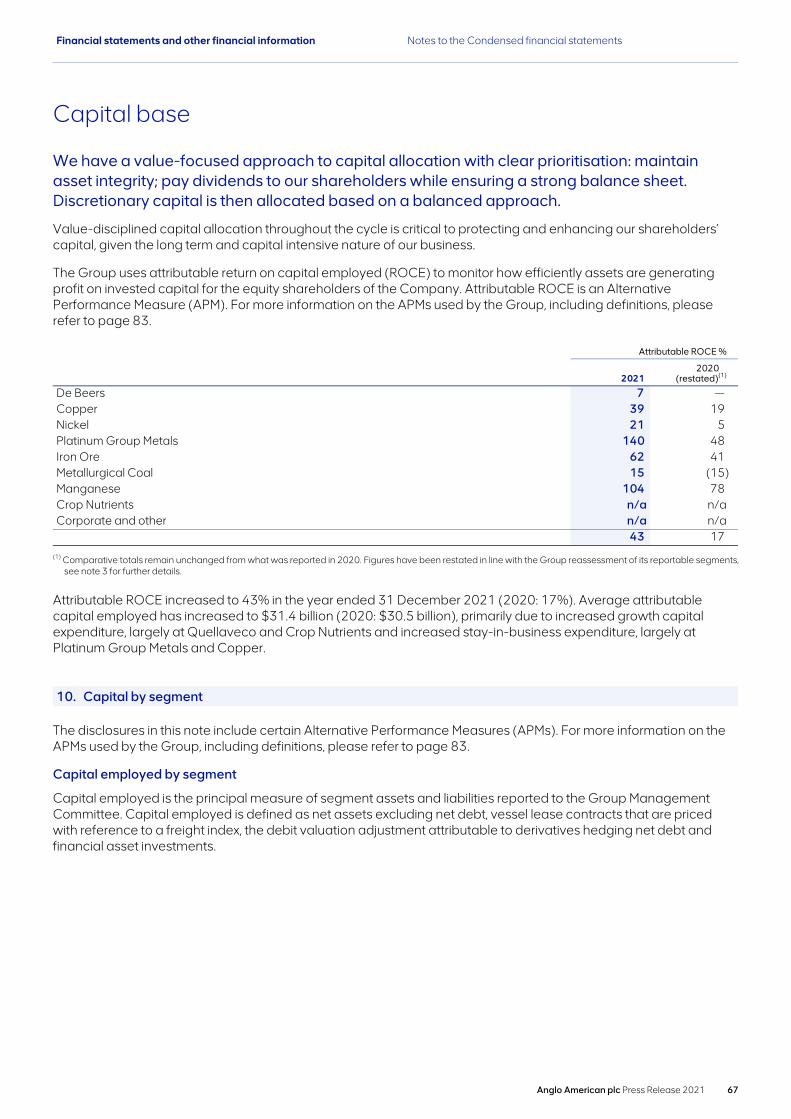
Capital base
We have a value-focused approach to capital allocation with clear prioritisation: maintain asset integrity; pay dividends to our shareholders while ensuring a strong balance sheet. Discretionary capital is then allocated based on a balanced approach.
Value-disciplined capital allocation throughout the cycle is critical to protecting and enhancing our shareholders’ capital, given the long term and capital intensive nature of our business.
The Group uses attributable return on capital employed (ROCE) to monitor how efficiently assets are generating profit on invested capital for the equity shareholders of the Company. Attributable ROCE is an Alternative Performance Measure (APM). For more information on the APMs used by the Group, including definitions, please refer to page 83.
Attributable ROCE %
2021 2020
(restated)(1)
De Beers 7 — Copper 39 19 Nickel 21 5 Platinum Group Metals 140 48 Iron Ore 62 41 Metallurgical Coal 15 (15) Manganese 104 78 Crop Nutrients n/a n/aCorporate and other n/a n/a
43 17
(1) Comparative totals remain unchanged from what was reported in 2020. Figures have been restated in line with the Group reassessment of its reportable segments, see note 3 for further details.
Attributable ROCE increased to 43% in the year ended 31 December 2021 (2020: 17%). Average attributable capital employed has increased to $31.4 billion (2020: $30.5 billion), primarily due to increased growth capital expenditure, largely at Quellaveco and Crop Nutrients and increased stay-in-business expenditure, largely at Platinum Group Metals and Copper.
10. Capital by segment
The disclosures in this note include certain Alternative Performance Measures (APMs). For more information on the APMs used by the Group, including definitions, please refer to page 83.
Capital employed by segment
Capital employed is the principal measure of segment assets and liabilities reported to the Group Management Committee. Capital employed is defined as net assets excluding net debt, vessel lease contracts that are priced with reference to a freight index, the debit valuation adjustment attributable to derivatives hedging net debt and financial asset investments.
Financial statements and other financial information Notes to the Condensed financial statements
Anglo American plc Press Release 2021 67

Capital base
10. Capital by segment (continued)
Capital employed
US$ million 2021 2020 (restated)(1)
De Beers 8,415 8,967 Copper 11,232 9,128 Nickel 1,285 1,157 Platinum Group Metals 4,082 4,967 Iron Ore 8,379 8,472 Metallurgical Coal 2,712 3,196 Manganese 238 238 Crop Nutrients 1,563 988 Corporate and other 406 857 Capital employed 38,312 37,970 Reconciliation to the Consolidated balance sheet:Net debt(2) (3,842) (5,530) Variable vessel leases excluded from net debt (see note 13) (74) (45) Debit valuation adjustment attributable to derivatives hedging net debt 5 — Financial asset investments 369 371 Net assets 34,770 32,766
(1) Comparative totals for capital employed remain unchanged from what was reported in 2020. Figures have been restated in line with the Group reassessment of its reportable segments, see note 3 for further details.
(2) The Group has amended the definition of net debt during the year to exclude variable vessel leases.
Intangible assets,Property, plant and equipment Total non-current assets
US$ million 2021 2020 2021 2020
South Africa 9,711 10,271 10,185 10,744 Botswana 3,386 3,829 3,388 3,829 Other Africa 1,138 1,071 1,146 1,078 Brazil 7,502 6,018 8,059 6,516 Chile 6,745 6,402 6,821 6,552 Peru 6,691 4,712 6,931 4,997 Other South America 1 1 2 367 North America 621 649 621 649 Australia and Asia 3,048 3,807 3,547 4,171 United Kingdom(1) 3,561 2,656 3,729 2,799 Other Europe 99 106 101 110 Non-current assets by location 42,503 39,522 44,530 41,812 Unallocated assets 2,482 3,227 Total non-current assets 47,012 45,039
(1) United Kingdom is Anglo American plc’s country of domicile.
Total non-current assets by location primarily comprise Intangible assets, Property, plant and equipment and Investments in associates and joint ventures.
Financial statements and other financial information Notes to the Condensed financial statements
68 Anglo American plc Press Release 2021
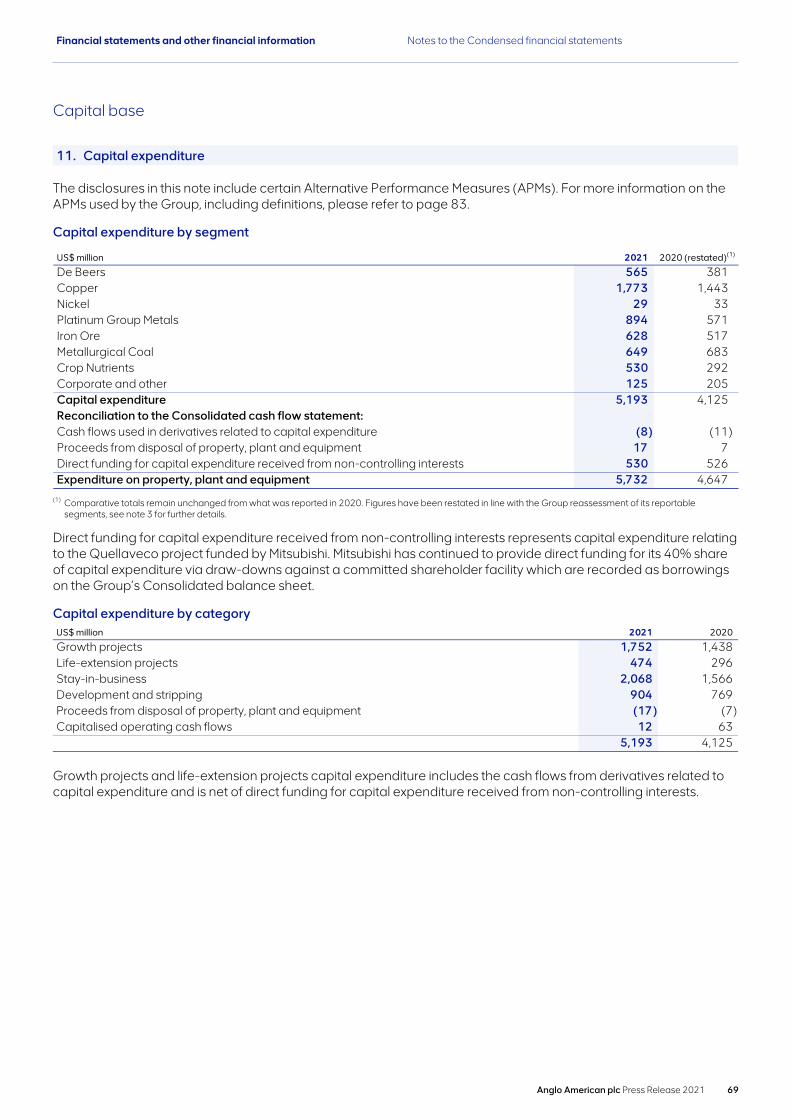
Capital base
11. Capital expenditure
The disclosures in this note include certain Alternative Performance Measures (APMs). For more information on the APMs used by the Group, including definitions, please refer to page 83.
Capital expenditure by segment
US$ million 2021 2020 (restated)(1)
De Beers 565 381 Copper 1,773 1,443 Nickel 29 33 Platinum Group Metals 894 571 Iron Ore 628 517 Metallurgical Coal 649 683 Crop Nutrients 530 292 Corporate and other 125 205 Capital expenditure 5,193 4,125 Reconciliation to the Consolidated cash flow statement:Cash flows used in derivatives related to capital expenditure (8) (11) Proceeds from disposal of property, plant and equipment 17 7 Direct funding for capital expenditure received from non-controlling interests 530 526 Expenditure on property, plant and equipment 5,732 4,647
(1) Comparative totals remain unchanged from what was reported in 2020. Figures have been restated in line with the Group reassessment of its reportable segments, see note 3 for further details.
Direct funding for capital expenditure received from non-controlling interests represents capital expenditure relating to the Quellaveco project funded by Mitsubishi. Mitsubishi has continued to provide direct funding for its 40% share of capital expenditure via draw-downs against a committed shareholder facility which are recorded as borrowings on the Group’s Consolidated balance sheet.
Capital expenditure by categoryUS$ million 2021 2020
Growth projects 1,752 1,438 Life-extension projects 474 296 Stay-in-business 2,068 1,566 Development and stripping 904 769 Proceeds from disposal of property, plant and equipment (17) (7) Capitalised operating cash flows 12 63
5,193 4,125
Growth projects and life-extension projects capital expenditure includes the cash flows from derivatives related to capital expenditure and is net of direct funding for capital expenditure received from non-controlling interests.
Financial statements and other financial information Notes to the Condensed financial statements
Anglo American plc Press Release 2021 69

Capital base
12. Investments in associates and joint ventures
Overview
Investments in associates and joint ventures represent businesses the Group does not control, but instead exercises significant influence or joint control. These include (within the respective business units) the associates Cerrejón (thermal coal production in the Corporate and other segment, disposed in January 2022) and Jellinbah (metallurgical coal production in the Metallurgical Coal segment) and the joint ventures Ferroport (port operations in the Iron Ore segment) and Samancor (manganese mining in the Manganese segment). The Group’s other investments in associates and joint ventures arise primarily in the Platinum Group Metals segment and Crop Nutrients segment.
The disclosures in this note include certain Alternative Performance Measures (APMs). For more information on the APMs used by the Group, including definitions, please refer to page 83.
On 28 June 2021, the Group agreed the sale of its 33.3% shareholding in the Cerrejón associate to Glencore. The sale agreement had an economic effective date from 31 December 2020 and any dividends received after this date are deducted from the consideration due on completion. Economic benefits from 1 January 2021 onwards therefore did not accrue to the Group. Income from the associate arising after the agreement of the transaction in June 2021 has been classified as a special item and is therefore excluded from the Group revenue, underlying EBITDA and underlying EBIT APMs disclosed in the tables below. An impairment charge has been recognised within non-operating special items to bring the carrying value of the investment in line with the expected disposal proceeds and the Group’s post-disposal share of earnings. The Cerrejón associate met the criteria to be classified as held for sale on 23 December 2021, and the investment value of $50 million was transferred to assets held for sale, see note 17 for further details.
On 20 December 2021, Anglo American Platinum announced the sale of its 49% interest in Bokoni. The transaction is subject to the fulfilment or waiver of notable conditions precedent and therefore does not meet the criteria to be classified as held for sale at 31 December 2021.
Income statement
The Group’s share of the results of the associates and joint ventures is as follows:
US$ million 2021 2020
Group revenue 1,711 1,436 Operating costs (before special items and remeasurements) (1,014) (1,073) Associates’ and joint ventures’ underlying EBIT 697 363 Net finance costs (13) (22) Income tax expense (222) (158) Non-controlling interests (2) (3) Net income from associates and joint ventures (before special items and remeasurements) 460 180 Special items and remeasurements 184 (79) Special items and remeasurements tax (10) 2 Net income from associates and joint ventures 634 103
Group revenue and net income from the Cerrejón associate, arising after 28 June 2021, when the Group agreed the sale of its 33.3% shareholding, have been classified as special items and are therefore excluded from Group revenue, underlying EBITDA, underlying EBIT and underlying earnings. See note 9 for further detail.
Financial statements and other financial information Notes to the Condensed financial statements
70 Anglo American plc Press Release 2021

Capital base
12. Investments in associates and joint ventures (continued)
Further information
The Group’s share of the results of the associates and joint ventures is as follows: 2021
US$ million Group RevenueUnderlying
EBITDAUnderlying
EBITShare of net
incomeDividends
received
Samancor 768 315 250 132 125 Cerrejón (1) 219 87 43 203 240 Jellinbah 514 279 265 183 97 Ferroport 85 69 62 41 — Other 125 76 77 75 13
1,711 826 697 634 475
2020
US$ million Group RevenueUnderlying
EBITDAUnderlying
EBITShare of net
incomeDividends received
Samancor 697 304 245 39 163 Cerrejón 209 — (83) (75) 11 Jellinbah 303 93 80 56 49 Ferroport 114 95 94 64 — Other 113 26 27 19 3
1,436 518 363 103 226
Aggregate investment
US$ million 2021 2020
Samancor 233 230 Cerrejón(1) — 400 Jellinbah 340 271 Ferroport 265 229 Other 183 128
1,021 1,258
(1) As at 31 December 2021 Cerrejón investment in associate assets of $50 million was classified as held for sale. Income from the Cerrejón associate arising after the sale agreement dated in June 2021 has been classified as a special item and is therefore excluded from Group revenue, underlying EBITDA, underlying EBIT and underlying earnings. See notes 9 and 17 for further detail.
Financial statements and other financial information Notes to the Condensed financial statements
Anglo American plc Press Release 2021 71
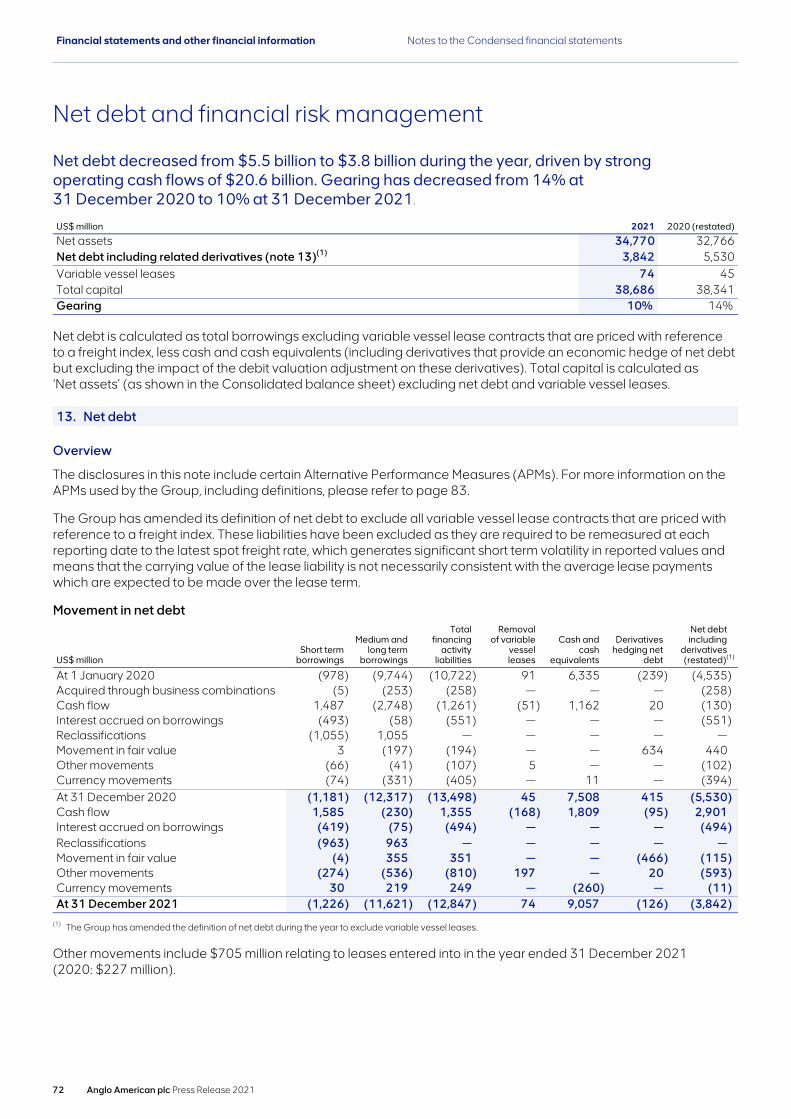
Net debt and financial risk management
Net debt decreased from $5.5 billion to $3.8 billion during the year, driven by strong operating cash flows of $20.6 billion. Gearing has decreased from 14% at 31 December 2020 to 10% at 31 December 2021.
US$ million 2021 2020 (restated)
Net assets 34,770 32,766Net debt including related derivatives (note 13)(1) 3,842 5,530Variable vessel leases 74 45Total capital 38,686 38,341Gearing 10% 14%
Net debt is calculated as total borrowings excluding variable vessel lease contracts that are priced with reference to a freight index, less cash and cash equivalents (including derivatives that provide an economic hedge of net debt but excluding the impact of the debit valuation adjustment on these derivatives). Total capital is calculated as ‘Net assets’ (as shown in the Consolidated balance sheet) excluding net debt and variable vessel leases.
13. Net debt
Overview
The disclosures in this note include certain Alternative Performance Measures (APMs). For more information on the APMs used by the Group, including definitions, please refer to page 83.
The Group has amended its definition of net debt to exclude all variable vessel lease contracts that are priced with reference to a freight index. These liabilities have been excluded as they are required to be remeasured at each reporting date to the latest spot freight rate, which generates significant short term volatility in reported values and means that the carrying value of the lease liability is not necessarily consistent with the average lease payments which are expected to be made over the lease term.
Movement in net debt
US$ millionShort term
borrowings
Medium and long term
borrowings
Total financing
activity liabilities
Removal of variable
vessel leases
Cash and cash
equivalents
Derivatives hedging net
debt
Net debt including
derivatives (restated)(1)
At 1 January 2020 (978) (9,744) (10,722) 91 6,335 (239) (4,535) Acquired through business combinations (5) (253) (258) — — — (258) Cash flow 1,487 (2,748) (1,261) (51) 1,162 20 (130) Interest accrued on borrowings (493) (58) (551) — — — (551) Reclassifications (1,055) 1,055 — — — — — Movement in fair value 3 (197) (194) — — 634 440 Other movements (66) (41) (107) 5 — — (102) Currency movements (74) (331) (405) — 11 — (394) At 31 December 2020 (1,181) (12,317) (13,498) 45 7,508 415 (5,530) Cash flow 1,585 (230) 1,355 (168) 1,809 (95) 2,901 Interest accrued on borrowings (419) (75) (494) — — — (494) Reclassifications (963) 963 — — — — — Movement in fair value (4) 355 351 — — (466) (115) Other movements (274) (536) (810) 197 — 20 (593) Currency movements 30 219 249 — (260) — (11) At 31 December 2021 (1,226) (11,621) (12,847) 74 9,057 (126) (3,842)
(1) The Group has amended the definition of net debt during the year to exclude variable vessel leases.
Other movements include $705 million relating to leases entered into in the year ended 31 December 2021 (2020: $227 million).
Financial statements and other financial information Notes to the Condensed financial statements
72 Anglo American plc Press Release 2021
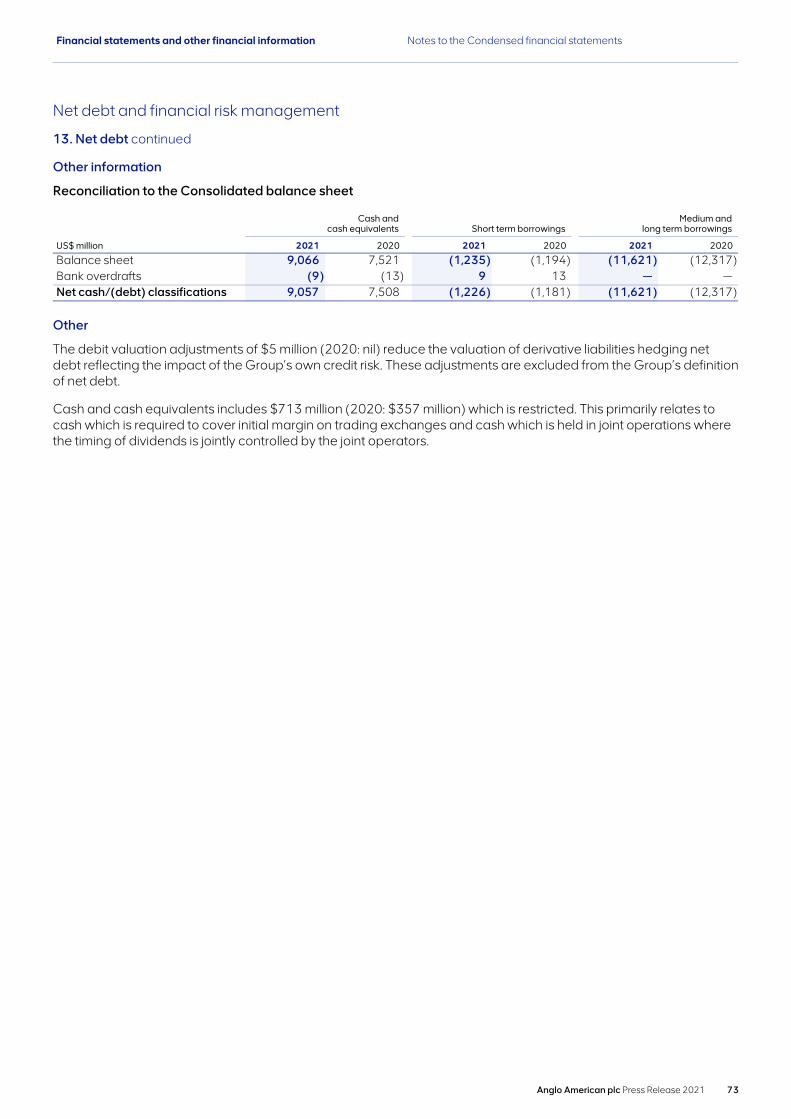
Net debt and financial risk management
13. Net debt continued
Other information
Reconciliation to the Consolidated balance sheet
Cash andcash equivalents Short term borrowings
Medium andlong term borrowings
US$ million 2021 2020 2021 2020 2021 2020
Balance sheet 9,066 7,521 (1,235) (1,194) (11,621) (12,317) Bank overdrafts (9) (13) 9 13 — — Net cash/(debt) classifications 9,057 7,508 (1,226) (1,181) (11,621) (12,317)
Other
The debit valuation adjustments of $5 million (2020: nil) reduce the valuation of derivative liabilities hedging net debt reflecting the impact of the Group’s own credit risk. These adjustments are excluded from the Group’s definition of net debt.
Cash and cash equivalents includes $713 million (2020: $357 million) which is restricted. This primarily relates to cash which is required to cover initial margin on trading exchanges and cash which is held in joint operations where the timing of dividends is jointly controlled by the joint operators.
Financial statements and other financial information Notes to the Condensed financial statements
Anglo American plc Press Release 2021 73

Net debt and financial risk management
14. Borrowings
Overview
The Group borrows mostly in the capital markets through bonds issued in the US markets and under the Euro Medium Term Note (EMTN) programme. The Group uses interest rate and cross currency swaps to ensure that the majority of the Group’s borrowings are exposed to floating rate US dollar interest rates.
In March 2021, the Group issued $500 million 2.250% Senior Notes due 2028 and $500 million 2.875% Senior Notes due 2031 as part of its routine financing activities.
In April 2021, following the maturity of the last outstanding notes, the Group discontinued its South African Domestic Medium Term Note (DMTN) programme.
In June 2021, the Group bought back US dollar denominated bonds with maturities in 2025. The Group used $1.0 billion of cash to retire $0.9 billion of contractual repayment obligations (including derivatives hedging the bonds) maturing in 2025 as part of the funding objective to reduce near term debt maturities and increase the average maturity of the Group’s bond portfolio.
At 31 December 2021 and 31 December 2020, the following bonds were retained as fixed rate exposures; $193 million 5.375% due April 2025, $99 million 5% due May 2027, $750 million 5.625% due April 2030, and $500 million 3.95% due September 2050. All other bonds at 31 December 2021 and 31 December 2020 were swapped to floating rate exposures.
Further information 2021 2020
US$ millionShort term
borrowings
Medium andlong term
borrowingsTotal
borrowingsShort term
borrowings
Medium and long term
borrowingsTotal
borrowings
SecuredBank loans and overdrafts 22 89 111 25 33 58 Leases 207 668 875 179 364 543 Other loans 2 — 2 — — —
231 757 988 204 397 601 UnsecuredBank loans and overdrafts — 180 180 252 553 805 Bonds 858 9,113 9,971 563 10,400 10,963 Mitsubishi facility — 1,571 1,571 — 967 967 Interest payable and other loans 146 — 146 175 — 175
1,004 10,864 11,868 990 11,920 12,910 Total borrowings 1,235 11,621 12,856 1,194 12,317 13,511
Undrawn committed borrowing facilities
The Group had the following undrawn committed borrowing facilities at 31 December:
US$ million 2021 2020
Expiry dateWithin one year 209 2,228 Greater than one year, less than two years 1,092 615 Greater than two years, less than three years 1,520 1,453 Greater than three years, less than four years 4,885 916 Greater than four years, less than five years 326 4,718 Greater than five years 9 47
8,041 9,977
The Group has an undrawn $4.7 billion revolving credit facility due to mature in March 2025.
In April 2020, the Group signed a new $2.0 billion revolving credit facility with an initial maturity date of April 2021. After the Group’s $1.0 billion bond issuance in March 2021 the Group issued a notice of cancellation for the facility which became effective in March 2021 and accordingly this facility is no longer available.
On 14 December 2021, the Group cancelled its $0.2 billion bilateral facility. At the same date, it increased a $4.5 billion revolving credit facility maturing March 2025 by $0.2 billion to $4.7 billion.
Financial statements and other financial information Notes to the Condensed financial statements
74 Anglo American plc Press Release 2021

Unrecognised items and uncertain events15. Events occurring after end of year
On 21 February 2022 Anglo American announced the safe restart of its Grosvenor (Metallurgical Coal) mining operation in Queensland, Australia. With the exception of the Grosvenor restart, the disposal of Cerrejón completed on 11 January 2022 (see note 17) and the proposed final and special dividend for 2021 (see note 7) there have been no further reportable events since 31 December 2021.
16. Contingent assets and liabilities
Overview
The Group is subject to various claims which arise in the ordinary course of business. Additionally, the Group has provided indemnities against certain liabilities as part of agreements for the sale or other disposal of business operations. Having taken appropriate legal advice, the Group believes that a material liability arising from the indemnities provided is remote.
The Group is required to provide guarantees in several jurisdictions in respect of environmental restoration and decommissioning obligations. The Group has provided for the estimated cost of these activities.
Contingent assets
Metallurgical Coal
In 2014, the Metallurgical Coal business was granted an arbitration award of $107 million against MMTC Limited in respect of a contractual dispute. The award has since been challenged in the Indian courts, during which time interest has continued to accrue. On 17 December 2020, the Indian Supreme Court found in favour of the Metallurgical Coal business. The award, inclusive of interest, is currently valued at approximately $140 million. The precise timing and value of receipt remains uncertain and hence no receivable has been recognised on the Consolidated balance sheet as at 31 December 2021.
Contingent liabilities
Anglo American South Africa Proprietary Limited (AASA)
In October 2020, an application was initiated against Anglo American South Africa Proprietary Limited (AASA). The application seeks the certification of class action litigation to be brought on behalf of community members residing in the Kabwe area in Zambia in relation to alleged lead-related health impacts.
AASA has noted its intention to oppose the class certification application, and will defend itself against the allegations made. It filed its response to the application on 31 August 2021 and a supplementary response on 11 November 2021. The class certification hearing is likely to take place in the second half of 2022, with a ruling likely to follow several months later.
This litigation is still subject to significant uncertainty, and it is not currently possible to make a reasonable estimate of the outcome, quantum or timing of any potential future determination and therefore no provision is recognised.
De Beers
Guarantees provided in respect of environmental restoration and decommissioning obligations involve judgements in terms of the outcome of future events. In one of the territories in which De Beers operates, conditions exist, or are proposed, with respect to backfilling pits on closure. A formal appeal has been lodged to remove the existing backfilling condition and no provision has been raised on the basis that it is not probable that this condition will be enforced. Should the appeal not be successful the estimated cost of backfilling is $254 million.
Financial statements and other financial information Notes to the Condensed financial statements
Anglo American plc Press Release 2021 75

Group structure17. Assets and liabilities held for sale
On 28 June 2021, the Group announced it had entered into an agreement for the sale of its 33.3% interest in the Cerrejón associate to Glencore. All conditions precedent, including approvals from authorities, were cleared on 23 December 2021, and the Cerrejón associate therefore met the criteria to be classified as held for sale from that date. At 31 December 2021, assets of $50 million were classified as held for sale and an impairment of $283 million recognised within non-operating special items to bring the carrying amount in line with the expected disposal proceeds (see note 9 and 12).
On 11 January 2022, the Group completed the disposal and received the outstanding consideration receivable of $50 million. In line with the agreement, the initial cash consideration of $294 million was reduced by $240 million cash dividends, repayment of shareholders loan of $41 million received from Cerrejón and adjusted for the cash sweeping arrangement paid to Cerrejón of $37 million.
2020
There were no assets classified as held for sale as at 31 December 2020.
18. Acquisitions and disposals
Acquisitions
There were no acquisitions in the year ended 31 December 2021.
2020On 17 March 2020, the Group acquired a 100% interest in Sirius Minerals Plc (Crop Nutrients) for cash consideration of $496 million (£405 million). As a result of the acquisition the Group acquired control of the Woodsmith project, which once developed will mine the world’s largest known source of high grade polyhalite (a premium multi-nutrient fertiliser).
Disposals
On 4 June 2021, the Group completed the demerger of its South African thermal coal assets into a newly incorporated company, Thungela Resources Limited (Thungela), that on 7 June 2021 was admitted to trading on both the Johannesburg and London Stock Exchanges (JSE and LSE). The demerger comprised the Goedehoop, Greenside, Khwezela, Zibulo, Isibonelo and Butsanani coal mining operations, a 23.2% shareholding in Richards Bay Coal Terminal and the 50:50 Mafube Colliery joint operation. The demerger was executed by means of an in specie return of capital valued at an amount equal to the fair value of the disposed operations. Share premium decreased by $1,800 million and the difference between this and the fair value demerged was credited to retained earnings.
The fair value of the in specie return of capital at the date of the demerger and retained financial asset investment was a level 3 fair value measurement based on a discounted cash flow model with a real post-tax discount rate of 9.5%. The model used forecast thermal coal prices that fall within the analyst range throughout the forecast period. The forecast long-term price from 2027 onwards fell within the interquartile range of analyst prices of $65/tonne to $72/tonne (API4 FOB Richards Bay real 2021 basis).
Financial statements and other financial information Notes to the Condensed financial statements
76 Anglo American plc Press Release 2021
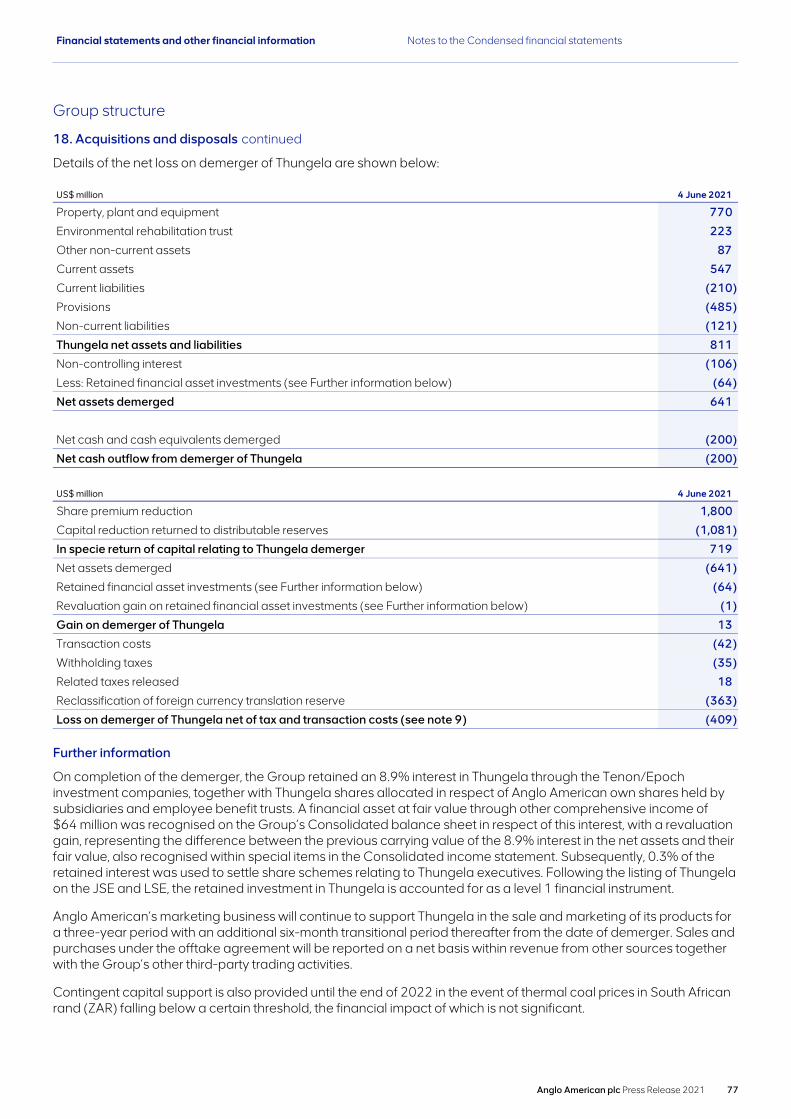
Group structure
18. Acquisitions and disposals continued
Details of the net loss on demerger of Thungela are shown below:
US$ million 4 June 2021
Property, plant and equipment 770
Environmental rehabilitation trust 223
Other non-current assets 87
Current assets 547
Current liabilities (210)
Provisions (485)
Non-current liabilities (121)
Thungela net assets and liabilities 811
Non-controlling interest (106)
Less: Retained financial asset investments (see Further information below) (64)
Net assets demerged 641
Net cash and cash equivalents demerged (200)
Net cash outflow from demerger of Thungela (200)
US$ million 4 June 2021
Share premium reduction 1,800
Capital reduction returned to distributable reserves (1,081)
In specie return of capital relating to Thungela demerger 719
Net assets demerged (641)
Retained financial asset investments (see Further information below) (64)
Revaluation gain on retained financial asset investments (see Further information below) (1)
Gain on demerger of Thungela 13
Transaction costs (42)
Withholding taxes (35)
Related taxes released 18
Reclassification of foreign currency translation reserve (363)
Loss on demerger of Thungela net of tax and transaction costs (see note 9) (409)
Further information
On completion of the demerger, the Group retained an 8.9% interest in Thungela through the Tenon/Epoch investment companies, together with Thungela shares allocated in respect of Anglo American own shares held by subsidiaries and employee benefit trusts. A financial asset at fair value through other comprehensive income of $64 million was recognised on the Group’s Consolidated balance sheet in respect of this interest, with a revaluation gain, representing the difference between the previous carrying value of the 8.9% interest in the net assets and their fair value, also recognised within special items in the Consolidated income statement. Subsequently, 0.3% of the retained interest was used to settle share schemes relating to Thungela executives. Following the listing of Thungela on the JSE and LSE, the retained investment in Thungela is accounted for as a level 1 financial instrument.
Anglo American’s marketing business will continue to support Thungela in the sale and marketing of its products for a three-year period with an additional six-month transitional period thereafter from the date of demerger. Sales and purchases under the offtake agreement will be reported on a net basis within revenue from other sources together with the Group’s other third-party trading activities.
Contingent capital support is also provided until the end of 2022 in the event of thermal coal prices in South African rand (ZAR) falling below a certain threshold, the financial impact of which is not significant.
Financial statements and other financial information Notes to the Condensed financial statements
Anglo American plc Press Release 2021 77
Group structure
18. Acquisitions and disposals continued
Other
Other cash received in respect of disposals principally relates to $235 million on the settlement of deferred consideration balances relating to the sale of the Rustenburg operations (Platinum Group Metals) completed in November 2016 and $50 million contingent consideration in respect of the disposal of the Group’s interest in Anglo American Norte (Copper) completed in 2015.
2020Disposals in 2020 principally related to the settlement of deferred consideration balances at Platinum Group Metals and the sale of 12% of the Group’s interest in the Grosvenor mine (Metallurgical Coal) as part of the equalisation of ownership across its integrated Australian metallurgical coal operations at Moranbah North and Grosvenor.
Financial statements and other financial information Notes to the Condensed financial statements
78 Anglo American plc Press Release 2021

Summary by operation
This section includes certain Alternative Performance Measures (APMs). For more information on the APMs used by the Group, including definitions, please refer to page 83.
Marketing activities are allocated to the underlying operation to which they relate.2021
US$ million (unless otherwise stated)
Sales volume
Realised price Unit cost
Grouprevenue(1)
Underlying EBITDA
Underlying EBIT
Underlying earnings
Capital expenditure
’000 cts $/ct $/ct
De Beers 33,357 (2) 146 (3) 58 (4) 5,602 (5) 1,100 620 345 565
Mining
Botswana n/a 152 (3) 32 (4) n/a 464 407 n/a 72
Namibia n/a 565 (3) 359 (4) n/a 101 68 n/a 91
South Africa n/a 113 (3) 45 (4) n/a 241 82 n/a 309
Canada n/a 62 (3) 44 (4) n/a 68 4 n/a 42
Trading n/a n/a n/a n/a 515 505 n/a 4
Other(6) n/a n/a n/a n/a (289) (446) n/a 47
kt c/lb c/lb
Base Metals n/a n/a n/a 7,143 4,331 3,689 1,798 1,802
Copper 641 (7) 453 (8) 120 (9) 6,433 4,011 3,428 1,519 1,773
Los Bronces(10) 325 n/a 158 (9) 3,047 1,871 1,588 n/a 493
Collahuasi(11) 273 n/a 61 (9) 2,641 2,188 1,970 1,307 365
Quellaveco(12) n/a n/a n/a n/a n/a n/a n/a 777
Other Copper(13) 43 n/a n/a 745 (48) (130) n/a 138 Nickel 42 773 377 (14) 710 320 261 279 29
koz $/PGM oz $/PGM oz
Platinum Group Metals 5,214 (15) 2,761 (16) 868 (17) 14,502 7,099 6,753 3,789 894
Mogalakwena 1,479 (15) 2,563 (16) 694 (17) 3,787 2,611 2,471 n/a 435
Amandelbult 907 (15) 3,122 (16) 1,127 (17) 2,817 1,633 1,571 n/a 81
Processing and trading(18) 1,772 (15) n/a n/a 4,817 1,138 1,110 n/a n/a
Other(19) 1,056 2,935 899 3,081 1,717 1,601 n/a 378
Mt $/t $/t
Bulk Commodities n/a n/a n/a 14,771 8,148 7,059 3,663 1,277
Iron Ore 63.3 (20) 157 (21) 33 (22) 11,104 6,871 6,359 3,231 628
Kumba Iron Ore(23) 40.3 (20) 161 (21) 39 (22) 6,958 4,311 3,960 1,442 417 Iron Ore Brazil
(Minas-Rio) 23.0 (20) 150 (21) 24 (22) 4,146 2,560 2,399 1,789 211
Metallurgical Coal 14.1 (24) 200 (25) 105 (26) 2,899 962 450 300 649 Manganese (Samancor)(27) 3.7 n/a n/a 768 315 250 132 —
Crop Nutrients n/a n/a n/a 114 (41) (42) (39) 530
Woodsmith n/a n/a n/a n/a n/a n/a n/a 530
Other(28) n/a n/a n/a 114 (41) (42) (39) —
Corporate and other n/a n/a n/a 1,126 (3) (289) (631) 125
Exploration n/a n/a n/a n/a (128) (132) (120) — Corporate activities and
unallocated costs n/a n/a n/a 354 (63) (270) (600) 44 Thermal Coal
– South Africa(29) 5.3(30)
77(31)
46(32)
553 101 70 61 81 Thermal Coal
– Colombia(33) 3.4 65 34 219 87 43 28 —
n/a n/a n/a 43,258 20,634 17,790 8,925 5,193
See page 81 for footnotes.
Financial statements and other financial information
Anglo American plc Press Release 2021 79
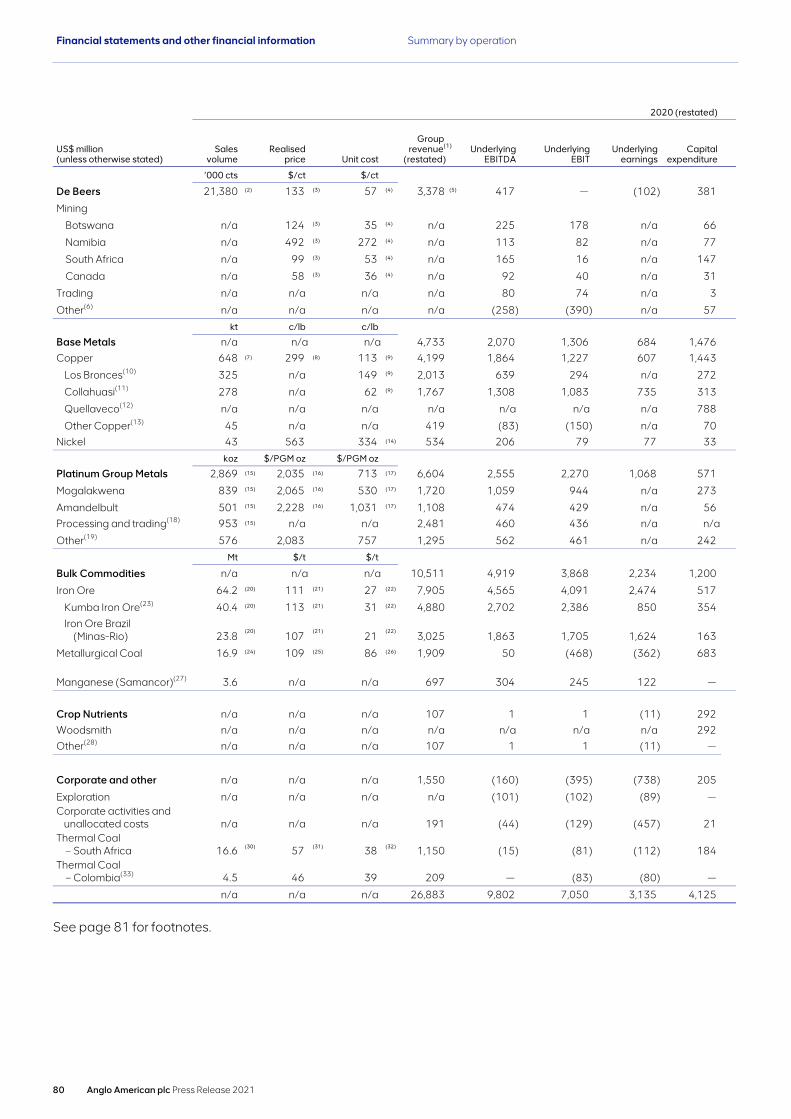
2020 (restated)
US$ million (unless otherwise stated)
Sales volume
Realised price Unit cost
Grouprevenue(1)
(restated)Underlying
EBITDAUnderlying
EBITUnderlying
earningsCapital
expenditure
’000 cts $/ct $/ct
De Beers 21,380 (2) 133 (3) 57 (4) 3,378 (5) 417 — (102) 381
Mining
Botswana n/a 124 (3) 35 (4) n/a 225 178 n/a 66
Namibia n/a 492 (3) 272 (4) n/a 113 82 n/a 77
South Africa n/a 99 (3) 53 (4) n/a 165 16 n/a 147
Canada n/a 58 (3) 36 (4) n/a 92 40 n/a 31
Trading n/a n/a n/a n/a 80 74 n/a 3
Other(6) n/a n/a n/a n/a (258) (390) n/a 57
kt c/lb c/lb
Base Metals n/a n/a n/a 4,733 2,070 1,306 684 1,476 Copper 648 (7) 299 (8) 113 (9) 4,199 1,864 1,227 607 1,443
Los Bronces(10) 325 n/a 149 (9) 2,013 639 294 n/a 272
Collahuasi(11) 278 n/a 62 (9) 1,767 1,308 1,083 735 313
Quellaveco(12) n/a n/a n/a n/a n/a n/a n/a 788
Other Copper(13) 45 n/a n/a 419 (83) (150) n/a 70 Nickel 43 563 334 (14) 534 206 79 77 33
koz $/PGM oz $/PGM oz
Platinum Group Metals 2,869 (15) 2,035 (16) 713 (17) 6,604 2,555 2,270 1,068 571
Mogalakwena 839 (15) 2,065 (16) 530 (17) 1,720 1,059 944 n/a 273
Amandelbult 501 (15) 2,228 (16) 1,031 (17) 1,108 474 429 n/a 56 Processing and trading(18) 953 (15) n/a n/a 2,481 460 436 n/a n/a
Other(19) 576 2,083 757 1,295 562 461 n/a 242
Mt $/t $/t
Bulk Commodities n/a n/a n/a 10,511 4,919 3,868 2,234 1,200
Iron Ore 64.2 (20) 111 (21) 27 (22) 7,905 4,565 4,091 2,474 517
Kumba Iron Ore(23) 40.4 (20) 113 (21) 31 (22) 4,880 2,702 2,386 850 354
Iron Ore Brazil (Minas-Rio) 23.8
(20) 107
(21) 21
(22) 3,025 1,863 1,705 1,624 163
Metallurgical Coal 16.9 (24) 109 (25) 86 (26) 1,909 50 (468) (362) 683
Manganese (Samancor)(27) 3.6 n/a n/a 697 304 245 122 —
Crop Nutrients n/a n/a n/a 107 1 1 (11) 292 Woodsmith n/a n/a n/a n/a n/a n/a n/a 292 Other(28) n/a n/a n/a 107 1 1 (11) —
Corporate and other n/a n/a n/a 1,550 (160) (395) (738) 205
Exploration n/a n/a n/a n/a (101) (102) (89) — Corporate activities and
unallocated costs n/a n/a n/a 191 (44) (129) (457) 21 Thermal Coal
– South Africa 16.6 (30) 57 (31) 38 (32) 1,150 (15) (81) (112) 184 Thermal Coal
– Colombia(33) 4.5 46 39 209 — (83) (80) —
n/a n/a n/a 26,883 9,802 7,050 3,135 4,125
See page 81 for footnotes.
Financial statements and other financial information Summary by operation
80 Anglo American plc Press Release 2021
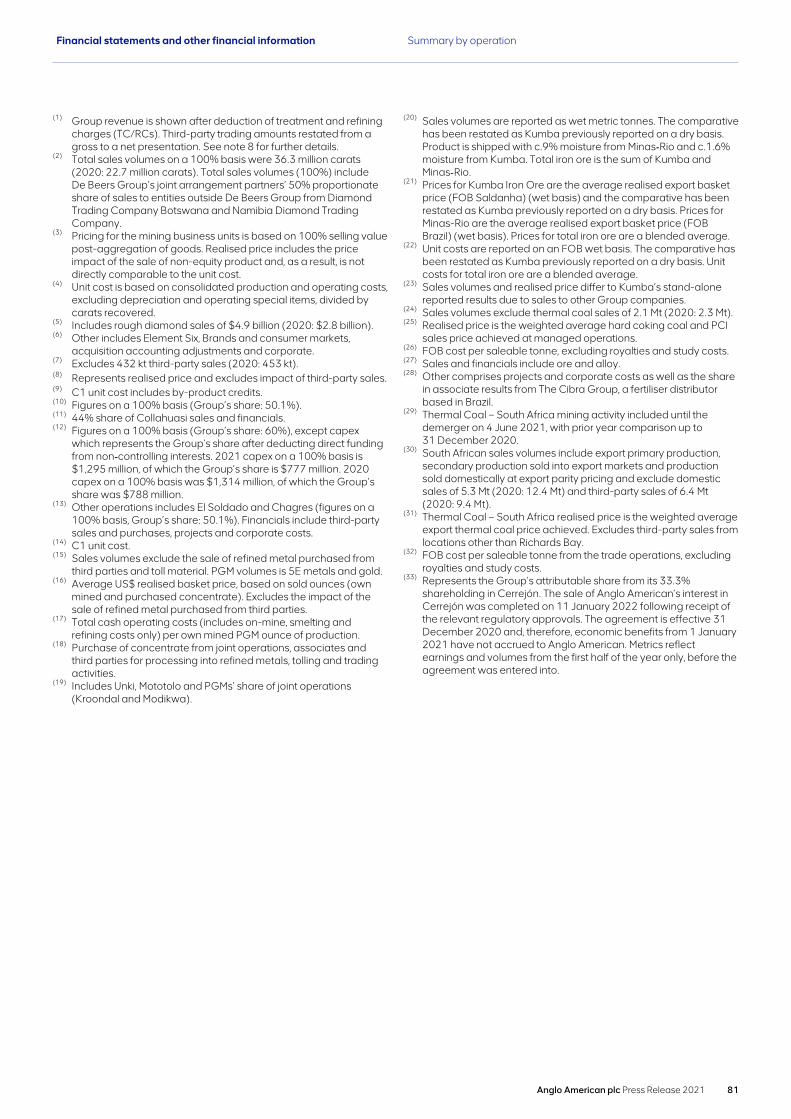
(1) Group revenue is shown after deduction of treatment and refining charges (TC/RCs). Third-party trading amounts restated from a gross to a net presentation. See note 8 for further details.
(2) Total sales volumes on a 100% basis were 36.3 million carats (2020: 22.7 million carats). Total sales volumes (100%) include De Beers Group’s joint arrangement partners’ 50% proportionate share of sales to entities outside De Beers Group from Diamond Trading Company Botswana and Namibia Diamond Trading Company.
(3) Pricing for the mining business units is based on 100% selling value post-aggregation of goods. Realised price includes the price impact of the sale of non-equity product and, as a result, is not directly comparable to the unit cost.
(4) Unit cost is based on consolidated production and operating costs, excluding depreciation and operating special items, divided by carats recovered.
(5) Includes rough diamond sales of $4.9 billion (2020: $2.8 billion). (6) Other includes Element Six, Brands and consumer markets,
acquisition accounting adjustments and corporate.(7) Excludes 432 kt third-party sales (2020: 453 kt). (8) Represents realised price and excludes impact of third-party sales. (9) C1 unit cost includes by-product credits.(10) Figures on a 100% basis (Group’s share: 50.1%).(11) 44% share of Collahuasi sales and financials. (12) Figures on a 100% basis (Group’s share: 60%), except capex
which represents the Group’s share after deducting direct funding from non‑controlling interests. 2021 capex on a 100% basis is $1,295 million, of which the Group’s share is $777 million. 2020 capex on a 100% basis was $1,314 million, of which the Group’s share was $788 million.
(13) Other operations includes El Soldado and Chagres (figures on a 100% basis, Group’s share: 50.1%). Financials include third-party sales and purchases, projects and corporate costs.
(14) C1 unit cost.(15) Sales volumes exclude the sale of refined metal purchased from
third parties and toll material. PGM volumes is 5E metals and gold.(16) Average US$ realised basket price, based on sold ounces (own
mined and purchased concentrate). Excludes the impact of the sale of refined metal purchased from third parties.
(17) Total cash operating costs (includes on-mine, smelting and refining costs only) per own mined PGM ounce of production.
(18) Purchase of concentrate from joint operations, associates and third parties for processing into refined metals, tolling and trading activities.
(19) Includes Unki, Mototolo and PGMs’ share of joint operations (Kroondal and Modikwa).
(20) Sales volumes are reported as wet metric tonnes. The comparative has been restated as Kumba previously reported on a dry basis. Product is shipped with c.9% moisture from Minas‑Rio and c.1.6% moisture from Kumba. Total iron ore is the sum of Kumba and Minas‑Rio.
(21) Prices for Kumba Iron Ore are the average realised export basket price (FOB Saldanha) (wet basis) and the comparative has been restated as Kumba previously reported on a dry basis. Prices for Minas-Rio are the average realised export basket price (FOB Brazil) (wet basis). Prices for total iron ore are a blended average.
(22) Unit costs are reported on an FOB wet basis. The comparative has been restated as Kumba previously reported on a dry basis. Unit costs for total iron ore are a blended average.
(23) Sales volumes and realised price differ to Kumba’s stand-alone reported results due to sales to other Group companies.
(24) Sales volumes exclude thermal coal sales of 2.1 Mt (2020: 2.3 Mt). (25) Realised price is the weighted average hard coking coal and PCI
sales price achieved at managed operations. (26) FOB cost per saleable tonne, excluding royalties and study costs.(27) Sales and financials include ore and alloy. (28) Other comprises projects and corporate costs as well as the share
in associate results from The Cibra Group, a fertiliser distributor based in Brazil.
(29) Thermal Coal – South Africa mining activity included until the demerger on 4 June 2021, with prior year comparison up to 31 December 2020.
(30) South African sales volumes include export primary production, secondary production sold into export markets and production sold domestically at export parity pricing and exclude domestic sales of 5.3 Mt (2020: 12.4 Mt) and third-party sales of 6.4 Mt (2020: 9.4 Mt).
(31) Thermal Coal – South Africa realised price is the weighted average export thermal coal price achieved. Excludes third-party sales from locations other than Richards Bay.
(32) FOB cost per saleable tonne from the trade operations, excluding royalties and study costs.
(33) Represents the Group’s attributable share from its 33.3% shareholding in Cerrejón. The sale of Anglo American’s interest in Cerrejón was completed on 11 January 2022 following receipt of the relevant regulatory approvals. The agreement is effective 31 December 2020 and, therefore, economic benefits from 1 January 2021 have not accrued to Anglo American. Metrics reflect earnings and volumes from the first half of the year only, before the agreement was entered into.
Financial statements and other financial information Summary by operation
Anglo American plc Press Release 2021 81
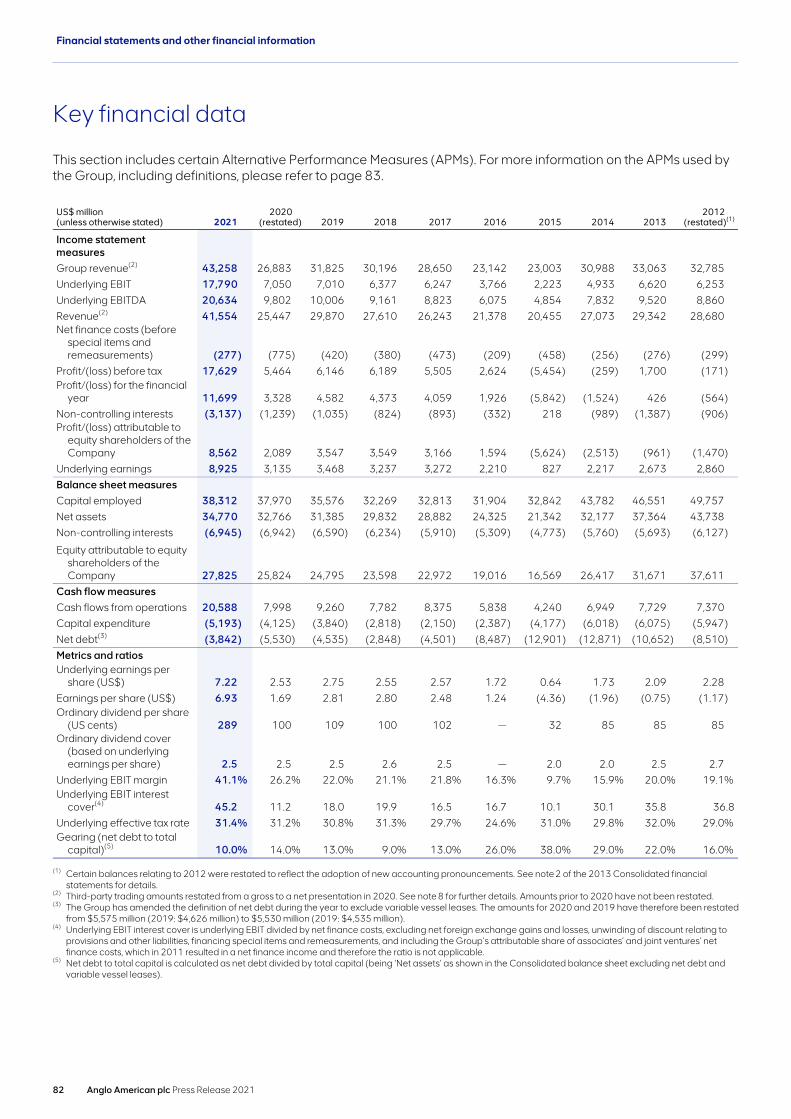
Key financial data
This section includes certain Alternative Performance Measures (APMs). For more information on the APMs used by the Group, including definitions, please refer to page 83.
US$ million (unless otherwise stated) 2021
2020 (restated) 2019 2018 2017 2016 2015 2014 2013
2012(restated)(1)
Income statement measuresGroup revenue(2) 43,258 26,883 31,825 30,196 28,650 23,142 23,003 30,988 33,063 32,785 Underlying EBIT 17,790 7,050 7,010 6,377 6,247 3,766 2,223 4,933 6,620 6,253 Underlying EBITDA 20,634 9,802 10,006 9,161 8,823 6,075 4,854 7,832 9,520 8,860 Revenue(2) 41,554 25,447 29,870 27,610 26,243 21,378 20,455 27,073 29,342 28,680 Net finance costs (before
special items and remeasurements) (277) (775) (420) (380) (473) (209) (458) (256) (276) (299)
Profit/(loss) before tax 17,629 5,464 6,146 6,189 5,505 2,624 (5,454) (259) 1,700 (171) Profit/(loss) for the financial
year 11,699 3,328 4,582 4,373 4,059 1,926 (5,842) (1,524) 426 (564) Non-controlling interests (3,137) (1,239) (1,035) (824) (893) (332) 218 (989) (1,387) (906) Profit/(loss) attributable to
equity shareholders of the Company 8,562 2,089 3,547 3,549 3,166 1,594 (5,624) (2,513) (961) (1,470)
Underlying earnings 8,925 3,135 3,468 3,237 3,272 2,210 827 2,217 2,673 2,860 Balance sheet measuresCapital employed 38,312 37,970 35,576 32,269 32,813 31,904 32,842 43,782 46,551 49,757 Net assets 34,770 32,766 31,385 29,832 28,882 24,325 21,342 32,177 37,364 43,738 Non-controlling interests (6,945) (6,942) (6,590) (6,234) (5,910) (5,309) (4,773) (5,760) (5,693) (6,127)
Equity attributable to equity shareholders of the Company 27,825 25,824 24,795 23,598 22,972 19,016 16,569 26,417 31,671 37,611
Cash flow measuresCash flows from operations 20,588 7,998 9,260 7,782 8,375 5,838 4,240 6,949 7,729 7,370 Capital expenditure (5,193) (4,125) (3,840) (2,818) (2,150) (2,387) (4,177) (6,018) (6,075) (5,947) Net debt(3) (3,842) (5,530) (4,535) (2,848) (4,501) (8,487) (12,901) (12,871) (10,652) (8,510) Metrics and ratiosUnderlying earnings per
share (US$) 7.22 2.53 2.75 2.55 2.57 1.72 0.64 1.73 2.09 2.28 Earnings per share (US$) 6.93 1.69 2.81 2.80 2.48 1.24 (4.36) (1.96) (0.75) (1.17) Ordinary dividend per share
(US cents) 289 100 109 100 102 — 32 85 85 85 Ordinary dividend cover
(based on underlying earnings per share) 2.5 2.5 2.5 2.6 2.5 — 2.0 2.0 2.5 2.7
Underlying EBIT margin 41.1% 26.2% 22.0% 21.1% 21.8% 16.3% 9.7% 15.9% 20.0% 19.1% Underlying EBIT interest
cover(4) 45.2 11.2 18.0 19.9 16.5 16.7 10.1 30.1 35.8 36.8Underlying effective tax rate 31.4% 31.2% 30.8% 31.3% 29.7% 24.6% 31.0% 29.8% 32.0% 29.0% Gearing (net debt to total
capital)(5) 10.0% 14.0% 13.0% 9.0% 13.0% 26.0% 38.0% 29.0% 22.0% 16.0%
(1) Certain balances relating to 2012 were restated to reflect the adoption of new accounting pronouncements. See note 2 of the 2013 Consolidated financial statements for details.
(2) Third-party trading amounts restated from a gross to a net presentation in 2020. See note 8 for further details. Amounts prior to 2020 have not been restated.(3) The Group has amended the definition of net debt during the year to exclude variable vessel leases. The amounts for 2020 and 2019 have therefore been restated
from $5,575 million (2019: $4,626 million) to $5,530 million (2019: $4,535 million).(4) Underlying EBIT interest cover is underlying EBIT divided by net finance costs, excluding net foreign exchange gains and losses, unwinding of discount relating to
provisions and other liabilities, financing special items and remeasurements, and including the Group’s attributable share of associates’ and joint ventures’ net finance costs, which in 2011 resulted in a net finance income and therefore the ratio is not applicable.
(5) Net debt to total capital is calculated as net debt divided by total capital (being ‘Net assets’ as shown in the Consolidated balance sheet excluding net debt and variable vessel leases).
Financial statements and other financial information
82 Anglo American plc Press Release 2021

Alternative performance measures
Introduction
When assessing and discussing the Group’s reported financial performance, financial position and cash flows, management makes reference to Alternative Performance Measures (APMs) of historical or future financial performance, financial position or cash flows that are not defined or specified under International Financial Reporting Standards (IFRS).
The APMs used by the Group fall into two categories:
– Financial APMs: These financial measures are usually derived from the financial statements, prepared in accordance with IFRS. Certain financial measures cannot be directly derived from the financial statements as they contain additional information, such as financial information from earlier periods or profit estimates or projections. The accounting policies applied when calculating APMs are, where relevant and unless otherwise stated, substantially the same as those disclosed in the Group’s Consolidated financial statements for the year ended 31 December 2020.
– Non-financial APMs: These measures incorporate certain non-financial information that management believes is useful when assessing the performance of the Group.
APMs are not uniformly defined by all companies, including those in the Group’s industry. Accordingly, the APMs used by the Group may not be comparable with similarly titled measures and disclosures made by other companies.
APMs should be considered in addition to, and not as a substitute for or as superior to, measures of financial performance, financial position or cash flows reported in accordance with IFRS. Measures used by the Group exclude the impact of certain items, which impact the financial performance and cash flows, in order to aid comparability of financial information reported. The adjustments performed to defined IFRS measures and rationale for adjustment are detailed on pages 84 to 85.
Purpose
The Group uses APMs to improve the comparability of information between reporting periods and business units, either by adjusting for uncontrollable factors or special items which impact upon IFRS measures or, by aggregating measures, to aid the user of the Annual Report in understanding the activity taking place across the Group’s portfolio.
Their use is driven by characteristics particularly visible in the mining sector:
1. Earnings volatility: The Group mines and markets commodities and precious metals and minerals. The sector is characterised by significant volatility in earnings driven by movements in macro-economic factors, primarily price and foreign exchange. This volatility is outside the control of management and can mask underlying changes in performance. As such, when comparing year-on-year performance, management excludes certain items (such as those classed as ‘special items’) to aid comparability and then quantifies and isolates uncontrollable factors in order to improve understanding of the controllable portion of variances.
2. Nature of investment: Investments in the sector typically occur over several years and are large, requiring significant funding before generating cash. These investments are often made with partners and the nature of the Group’s ownership interest affects how the financial results of these operations are reflected in the Group’s results e.g. whether full consolidation (subsidiaries), consolidation of the Group’s attributable assets and liabilities (joint operations) or equity accounted (associates and joint ventures). Attributable metrics are therefore presented to help demonstrate the financial performance and returns available to the Group, for investment and financing activities, excluding the effect of different accounting treatments for different ownership interests.
3. Portfolio complexity: The Group operates in a number of different, but complementary commodities, precious metals and minerals. The cost, value of and return from each saleable unit (e.g. tonne, pound, carat, ounce) can differ materially between each business. This makes understanding both the overall portfolio performance, and the relative performance of its constituent parts on a like-for-like basis, more challenging. The Group therefore uses composite APMs to provide a consistent metric to assess performance at the portfolio level.
Other information
Anglo American plc Press Release 2021 83
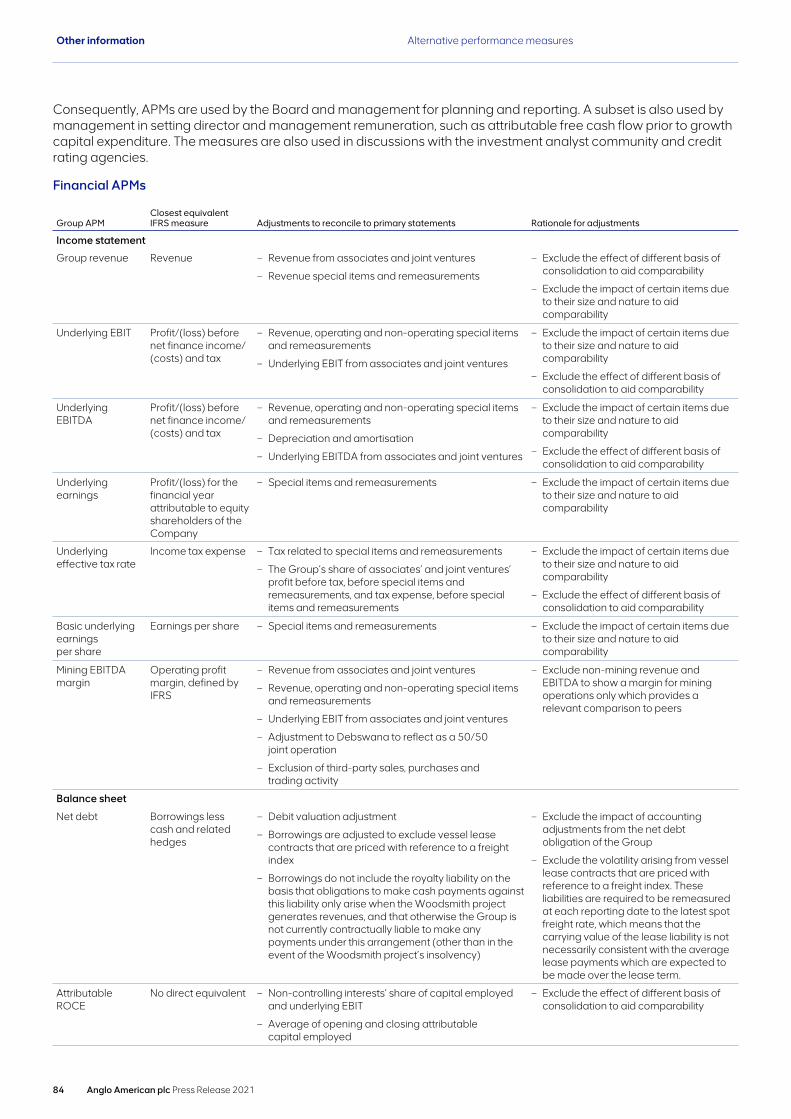
Consequently, APMs are used by the Board and management for planning and reporting. A subset is also used by management in setting director and management remuneration, such as attributable free cash flow prior to growth capital expenditure. The measures are also used in discussions with the investment analyst community and credit rating agencies.
Financial APMs
Income statement
Group revenue Revenue – Revenue from associates and joint ventures
– Revenue special items and remeasurements
– Exclude the effect of different basis of consolidation to aid comparability
– Exclude the impact of certain items due to their size and nature to aid comparability
Underlying EBIT Profit/(loss) before net finance income/(costs) and tax
– Revenue, operating and non-operating special items and remeasurements
– Underlying EBIT from associates and joint ventures
– Exclude the impact of certain items due to their size and nature to aid comparability
– Exclude the effect of different basis of consolidation to aid comparability
Underlying EBITDA
Profit/(loss) before net finance income/(costs) and tax
– Revenue, operating and non-operating special items and remeasurements
– Depreciation and amortisation
– Underlying EBITDA from associates and joint ventures
– Exclude the impact of certain items due to their size and nature to aid comparability
– Exclude the effect of different basis of consolidation to aid comparability
Underlying earnings
Profit/(loss) for the financial year attributable to equity shareholders of the Company
– Special items and remeasurements – Exclude the impact of certain items due to their size and nature to aid comparability
Underlying effective tax rate
Income tax expense – Tax related to special items and remeasurements
– The Group’s share of associates’ and joint ventures’ profit before tax, before special items and remeasurements, and tax expense, before special items and remeasurements
– Exclude the impact of certain items due to their size and nature to aid comparability
– Exclude the effect of different basis of consolidation to aid comparability
Basic underlying earnings per share
Earnings per share – Special items and remeasurements – Exclude the impact of certain items due to their size and nature to aid comparability
Mining EBITDA margin
Operating profit margin, defined by IFRS
– Revenue from associates and joint ventures
– Revenue, operating and non-operating special items and remeasurements
– Underlying EBIT from associates and joint ventures
– Adjustment to Debswana to reflect as a 50/50 joint operation
– Exclusion of third-party sales, purchases and trading activity
– Exclude non-mining revenue and EBITDA to show a margin for mining operations only which provides a relevant comparison to peers
Balance sheet
Net debt Borrowings less cash and related hedges
– Debit valuation adjustment
– Borrowings are adjusted to exclude vessel lease contracts that are priced with reference to a freight index
– Borrowings do not include the royalty liability on the basis that obligations to make cash payments against this liability only arise when the Woodsmith project generates revenues, and that otherwise the Group is not currently contractually liable to make any payments under this arrangement (other than in the event of the Woodsmith project’s insolvency)
– Exclude the impact of accounting adjustments from the net debt obligation of the Group
– Exclude the volatility arising from vessel lease contracts that are priced with reference to a freight index. These liabilities are required to be remeasured at each reporting date to the latest spot freight rate, which means that the carrying value of the lease liability is not necessarily consistent with the average lease payments which are expected to be made over the lease term.
Attributable ROCE
No direct equivalent – Non-controlling interests’ share of capital employed and underlying EBIT
– Average of opening and closing attributable capital employed
– Exclude the effect of different basis of consolidation to aid comparability
Group APMClosest equivalent IFRS measure Adjustments to reconcile to primary statements Rationale for adjustments
Other information Alternative performance measures
84 Anglo American plc Press Release 2021

Cash flow
Capital expenditure (capex)
Expenditure on property, plant and equipment
– Cash flows from derivatives related to capital expenditure
– Proceeds from disposal of property, plant and equipment
– Direct funding for capital expenditure from non‑controlling interests
– To reflect the net attributable cost of capital expenditure taking into account economic hedges
Attributable free cash flow
Cash flows from operations
– Capital expenditure
– Cash tax paid
– Dividends from associates, joint ventures and financial asset investments
– Net interest paid
– Dividends to non-controlling interests
– Capital repayment of lease obligations
– Expenditure on non-current intangible assets (excluding goodwill)
– To measure the amount of cash available to finance returns to shareholders or growth after servicing debt, providing a return to minority shareholders and meeting existing capex commitments
Sustaining attributable free cash flow
Cash flows from operations
– Cash tax paid
– Dividends from associates, joint ventures and financial asset investments
– Net interest paid
– Dividends to non-controlling interests
– Capital repayment of lease obligations
– Sustaining capital expenditure
– Capitalised operating cash flows relating to life extension projects
– To measure the amount of cash available to finance returns to shareholders or growth after servicing debt, providing a return to minority shareholders and meeting the capex commitments needed to sustain the current production base of existing assets. Sustaining attributable free cash flow is also used as an incentive measure in executives’ remuneration and is proposed to be used in LTIP 21. It is calculated as attributable free cash flow prior to growth capex and expenditure on non-current intangible assets (excluding goodwill)
Group APMClosest equivalent IFRS measure Adjustments to reconcile to primary statements Rationale for adjustments
Group revenue
Group revenue includes the Group’s attributable share of associates’ and joint ventures’ revenue and excludes revenue special items and remeasurements. Following the agreement for the disposal of the Group’s Cerrejón associate, revenue has been classified as a special item. A reconciliation to ‘Revenue’, the closest equivalent IFRS measure to Group revenue, is provided within note 3 to the Condensed financial statements.
Underlying EBIT
Underlying EBIT is ‘Operating profit/(loss)’ presented before special items and remeasurements(1) and includes the Group’s attributable share of associates’ and joint ventures’ underlying EBIT. Underlying EBIT of associates and joint ventures is the Group’s attributable share of associates’ and joint ventures’ revenue less operating costs before special items and remeasurements(1) of associates and joint ventures.
A reconciliation to ‘Profit/(loss) before net finance income/(costs) and tax’, the closest equivalent IFRS measure to underlying EBIT, is provided within note 3 to the Condensed financial statements.
Underlying EBITDA
Underlying EBITDA is underlying EBIT before depreciation and amortisation and includes the Group’s attributable share of associates’ and joint ventures’ underlying EBIT before depreciation and amortisation.
A reconciliation to ‘Profit/(loss) before net finance income/(costs) and tax’, the closest equivalent IFRS measure to underlying EBITDA, is provided within note 3 to the Condensed financial statements.
Underlying earnings
Underlying earnings is ‘Profit/(loss) for the financial year attributable to equity shareholders of the Company’ before special items and remeasurements(1) and is therefore presented after net finance costs, income tax expense and non-controlling interests.
Other information Alternative performance measures
Anglo American plc Press Release 2021 85
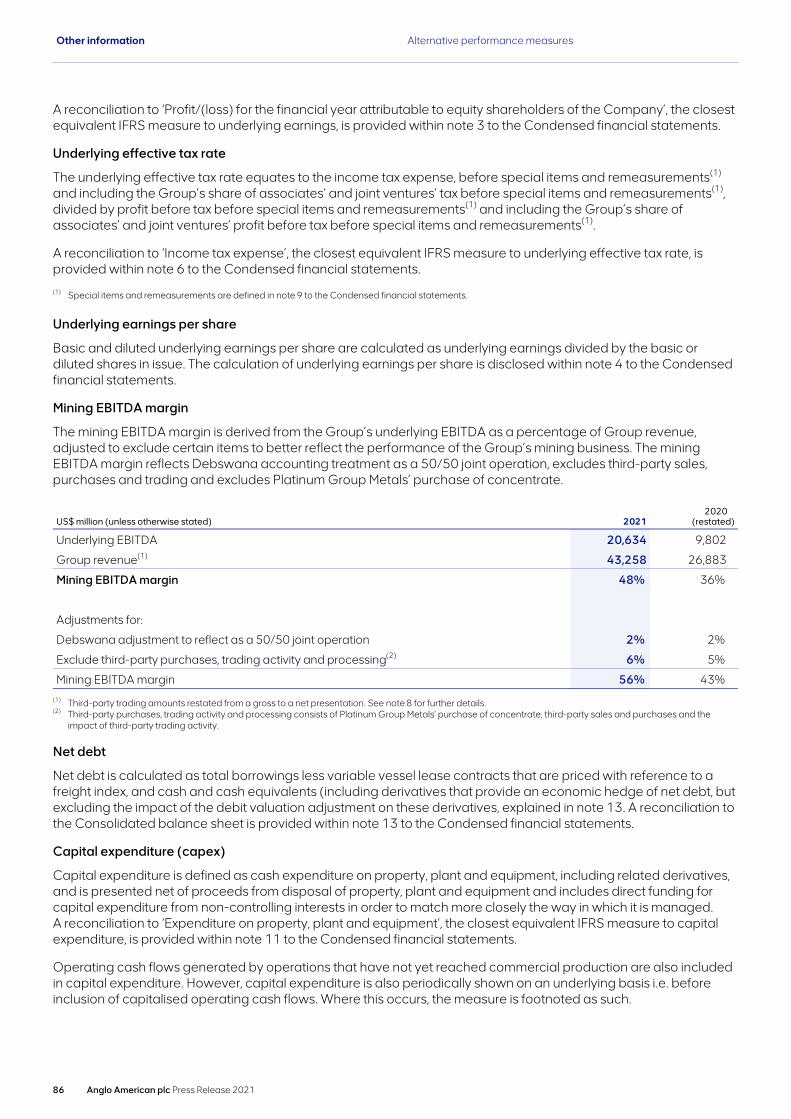
A reconciliation to ‘Profit/(loss) for the financial year attributable to equity shareholders of the Company’, the closest equivalent IFRS measure to underlying earnings, is provided within note 3 to the Condensed financial statements.
Underlying effective tax rate
The underlying effective tax rate equates to the income tax expense, before special items and remeasurements(1) and including the Group’s share of associates’ and joint ventures’ tax before special items and remeasurements(1), divided by profit before tax before special items and remeasurements(1) and including the Group’s share of associates’ and joint ventures’ profit before tax before special items and remeasurements(1).
A reconciliation to ‘Income tax expense’, the closest equivalent IFRS measure to underlying effective tax rate, is provided within note 6 to the Condensed financial statements.
(1) Special items and remeasurements are defined in note 9 to the Condensed financial statements.
Underlying earnings per share
Basic and diluted underlying earnings per share are calculated as underlying earnings divided by the basic or diluted shares in issue. The calculation of underlying earnings per share is disclosed within note 4 to the Condensed financial statements.
Mining EBITDA margin
The mining EBITDA margin is derived from the Group’s underlying EBITDA as a percentage of Group revenue, adjusted to exclude certain items to better reflect the performance of the Group’s mining business. The mining EBITDA margin reflects Debswana accounting treatment as a 50/50 joint operation, excludes third-party sales, purchases and trading and excludes Platinum Group Metals’ purchase of concentrate.
US$ million (unless otherwise stated) 20212020
(restated)
Underlying EBITDA 20,634 9,802
Group revenue(1) 43,258 26,883
Mining EBITDA margin 48% 36%
Adjustments for:
Debswana adjustment to reflect as a 50/50 joint operation 2% 2%
Exclude third-party purchases, trading activity and processing(2) 6% 5%
Mining EBITDA margin 56% 43%
(1) Third-party trading amounts restated from a gross to a net presentation. See note 8 for further details.(2) Third-party purchases, trading activity and processing consists of Platinum Group Metals’ purchase of concentrate, third-party sales and purchases and the
impact of third-party trading activity.
Net debt
Net debt is calculated as total borrowings less variable vessel lease contracts that are priced with reference to a freight index, and cash and cash equivalents (including derivatives that provide an economic hedge of net debt, but excluding the impact of the debit valuation adjustment on these derivatives, explained in note 13. A reconciliation to the Consolidated balance sheet is provided within note 13 to the Condensed financial statements.
Capital expenditure (capex)
Capital expenditure is defined as cash expenditure on property, plant and equipment, including related derivatives, and is presented net of proceeds from disposal of property, plant and equipment and includes direct funding for capital expenditure from non-controlling interests in order to match more closely the way in which it is managed. A reconciliation to ‘Expenditure on property, plant and equipment’, the closest equivalent IFRS measure to capital expenditure, is provided within note 11 to the Condensed financial statements.
Operating cash flows generated by operations that have not yet reached commercial production are also included in capital expenditure. However, capital expenditure is also periodically shown on an underlying basis i.e. before inclusion of capitalised operating cash flows. Where this occurs, the measure is footnoted as such.
Other information Alternative performance measures
86 Anglo American plc Press Release 2021
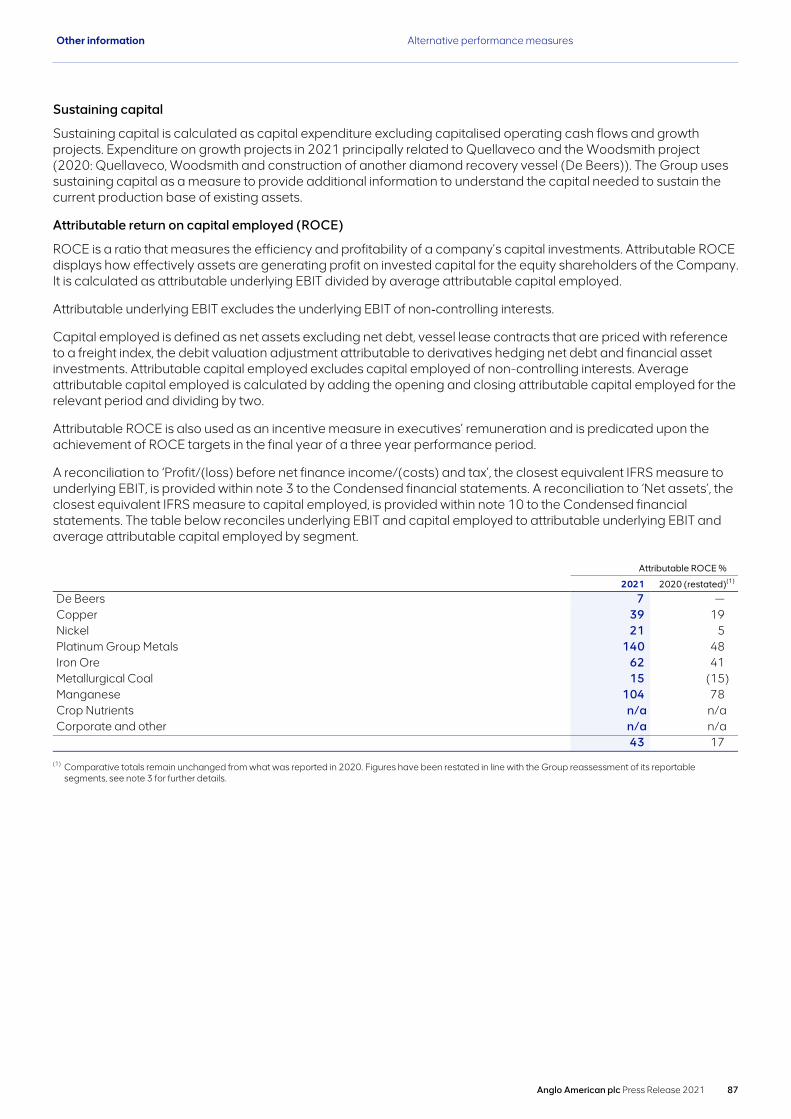
Sustaining capital
Sustaining capital is calculated as capital expenditure excluding capitalised operating cash flows and growth projects. Expenditure on growth projects in 2021 principally related to Quellaveco and the Woodsmith project (2020: Quellaveco, Woodsmith and construction of another diamond recovery vessel (De Beers)). The Group uses sustaining capital as a measure to provide additional information to understand the capital needed to sustain the current production base of existing assets.
Attributable return on capital employed (ROCE)
ROCE is a ratio that measures the efficiency and profitability of a company’s capital investments. Attributable ROCE displays how effectively assets are generating profit on invested capital for the equity shareholders of the Company. It is calculated as attributable underlying EBIT divided by average attributable capital employed.
Attributable underlying EBIT excludes the underlying EBIT of non‑controlling interests.
Capital employed is defined as net assets excluding net debt, vessel lease contracts that are priced with reference to a freight index, the debit valuation adjustment attributable to derivatives hedging net debt and financial asset investments. Attributable capital employed excludes capital employed of non-controlling interests. Average attributable capital employed is calculated by adding the opening and closing attributable capital employed for the relevant period and dividing by two.
Attributable ROCE is also used as an incentive measure in executives’ remuneration and is predicated upon the achievement of ROCE targets in the final year of a three year performance period.
A reconciliation to ‘Profit/(loss) before net finance income/(costs) and tax’, the closest equivalent IFRS measure to underlying EBIT, is provided within note 3 to the Condensed financial statements. A reconciliation to ‘Net assets’, the closest equivalent IFRS measure to capital employed, is provided within note 10 to the Condensed financial statements. The table below reconciles underlying EBIT and capital employed to attributable underlying EBIT and average attributable capital employed by segment.
Attributable ROCE %
2021 2020 (restated)(1)
De Beers 7 — Copper 39 19 Nickel 21 5 Platinum Group Metals 140 48 Iron Ore 62 41 Metallurgical Coal 15 (15) Manganese 104 78 Crop Nutrients n/a n/aCorporate and other n/a n/a
43 17
(1) Comparative totals remain unchanged from what was reported in 2020. Figures have been restated in line with the Group reassessment of its reportable segments, see note 3 for further details.
Other information Alternative performance measures
Anglo American plc Press Release 2021 87
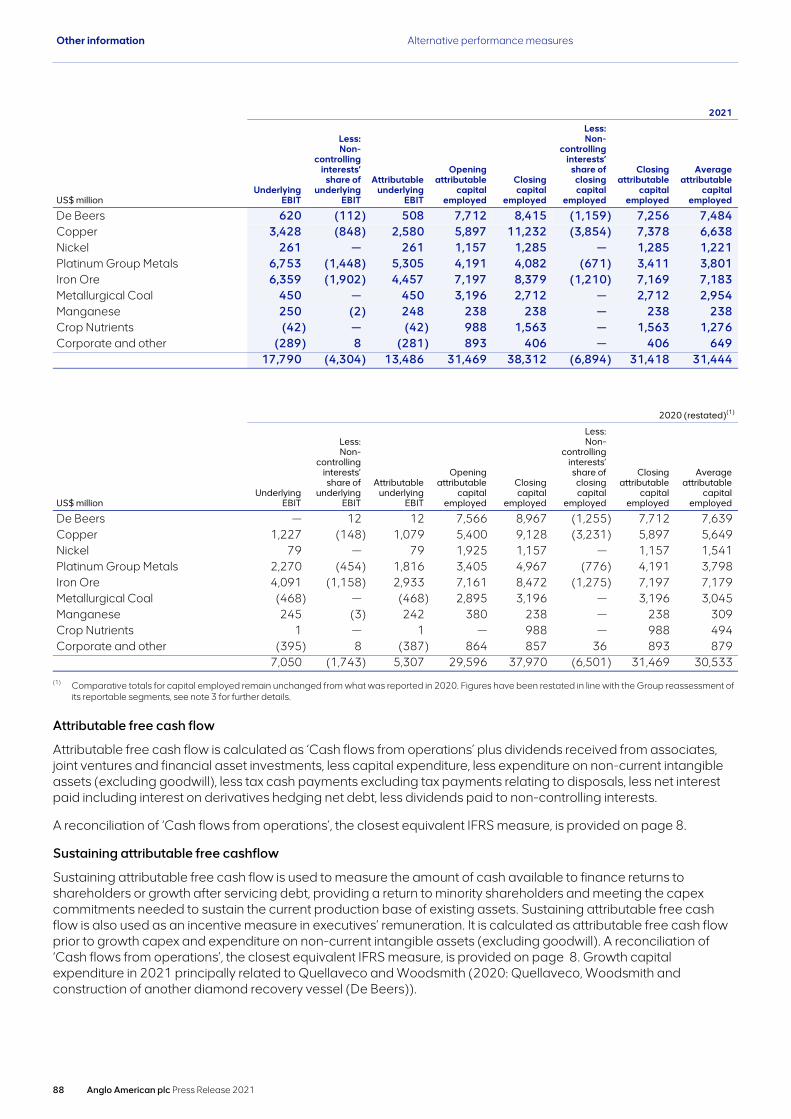
2021
US$ millionUnderlying
EBIT
Less: Non-
controlling interests’
share of underlying
EBIT
Attributable underlying
EBIT
Opening attributable
capital employed
Closing capital
employed
Less: Non-
controlling interests’
share of closing capital
employed
Closing attributable
capital employed
Average attributable
capital employed
De Beers 620 (112) 508 7,712 8,415 (1,159) 7,256 7,484 Copper 3,428 (848) 2,580 5,897 11,232 (3,854) 7,378 6,638 Nickel 261 — 261 1,157 1,285 — 1,285 1,221 Platinum Group Metals 6,753 (1,448) 5,305 4,191 4,082 (671) 3,411 3,801 Iron Ore 6,359 (1,902) 4,457 7,197 8,379 (1,210) 7,169 7,183 Metallurgical Coal 450 — 450 3,196 2,712 — 2,712 2,954 Manganese 250 (2) 248 238 238 — 238 238 Crop Nutrients (42) — (42) 988 1,563 — 1,563 1,276 Corporate and other (289) 8 (281) 893 406 — 406 649
17,790 (4,304) 13,486 31,469 38,312 (6,894) 31,418 31,444
2020 (restated)(1)
US$ millionUnderlying
EBIT
Less: Non-
controlling interests’ share of
underlying EBIT
Attributable underlying
EBIT
Opening attributable
capital employed
Closing capital
employed
Less: Non-
controlling interests’ share of
closing capital
employed
Closing attributable
capital employed
Average attributable
capital employed
De Beers — 12 12 7,566 8,967 (1,255) 7,712 7,639 Copper 1,227 (148) 1,079 5,400 9,128 (3,231) 5,897 5,649 Nickel 79 — 79 1,925 1,157 — 1,157 1,541 Platinum Group Metals 2,270 (454) 1,816 3,405 4,967 (776) 4,191 3,798 Iron Ore 4,091 (1,158) 2,933 7,161 8,472 (1,275) 7,197 7,179 Metallurgical Coal (468) — (468) 2,895 3,196 — 3,196 3,045 Manganese 245 (3) 242 380 238 — 238 309 Crop Nutrients 1 — 1 — 988 — 988 494 Corporate and other (395) 8 (387) 864 857 36 893 879
7,050 (1,743) 5,307 29,596 37,970 (6,501) 31,469 30,533
(1) Comparative totals for capital employed remain unchanged from what was reported in 2020. Figures have been restated in line with the Group reassessment of its reportable segments, see note 3 for further details.
Attributable free cash flow
Attributable free cash flow is calculated as ‘Cash flows from operations’ plus dividends received from associates, joint ventures and financial asset investments, less capital expenditure, less expenditure on non-current intangible assets (excluding goodwill), less tax cash payments excluding tax payments relating to disposals, less net interest paid including interest on derivatives hedging net debt, less dividends paid to non-controlling interests.
A reconciliation of ‘Cash flows from operations’, the closest equivalent IFRS measure, is provided on page 8.
Sustaining attributable free cashflow
Sustaining attributable free cash flow is used to measure the amount of cash available to finance returns to shareholders or growth after servicing debt, providing a return to minority shareholders and meeting the capex commitments needed to sustain the current production base of existing assets. Sustaining attributable free cash flow is also used as an incentive measure in executives’ remuneration. It is calculated as attributable free cash flow prior to growth capex and expenditure on non-current intangible assets (excluding goodwill). A reconciliation of ‘Cash flows from operations’, the closest equivalent IFRS measure, is provided on page 8. Growth capital expenditure in 2021 principally related to Quellaveco and Woodsmith (2020: Quellaveco, Woodsmith and construction of another diamond recovery vessel (De Beers)).
Other information Alternative performance measures
88 Anglo American plc Press Release 2021
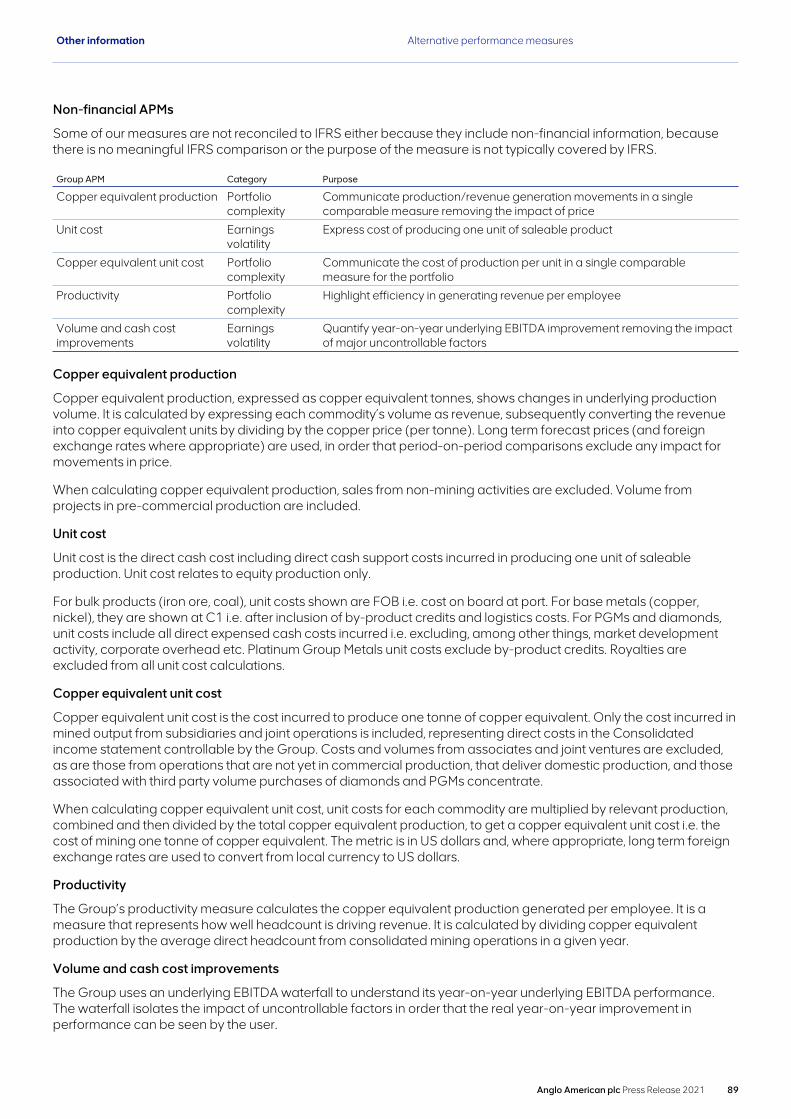
Non-financial APMs
Some of our measures are not reconciled to IFRS either because they include non-financial information, because there is no meaningful IFRS comparison or the purpose of the measure is not typically covered by IFRS.
Group APM Category Purpose
Copper equivalent production Portfolio complexity
Communicate production/revenue generation movements in a single comparable measure removing the impact of price
Unit cost Earnings volatility
Express cost of producing one unit of saleable product
Copper equivalent unit cost Portfolio complexity
Communicate the cost of production per unit in a single comparable measure for the portfolio
Productivity Portfolio complexity
Highlight efficiency in generating revenue per employee
Volume and cash cost improvements
Earnings volatility
Quantify year-on-year underlying EBITDA improvement removing the impact of major uncontrollable factors
Copper equivalent production
Copper equivalent production, expressed as copper equivalent tonnes, shows changes in underlying production volume. It is calculated by expressing each commodity’s volume as revenue, subsequently converting the revenue into copper equivalent units by dividing by the copper price (per tonne). Long term forecast prices (and foreign exchange rates where appropriate) are used, in order that period-on-period comparisons exclude any impact for movements in price.
When calculating copper equivalent production, sales from non-mining activities are excluded. Volume from projects in pre-commercial production are included.
Unit cost
Unit cost is the direct cash cost including direct cash support costs incurred in producing one unit of saleable production. Unit cost relates to equity production only.
For bulk products (iron ore, coal), unit costs shown are FOB i.e. cost on board at port. For base metals (copper, nickel), they are shown at C1 i.e. after inclusion of by-product credits and logistics costs. For PGMs and diamonds, unit costs include all direct expensed cash costs incurred i.e. excluding, among other things, market development activity, corporate overhead etc. Platinum Group Metals unit costs exclude by-product credits. Royalties are excluded from all unit cost calculations.
Copper equivalent unit cost
Copper equivalent unit cost is the cost incurred to produce one tonne of copper equivalent. Only the cost incurred in mined output from subsidiaries and joint operations is included, representing direct costs in the Consolidated income statement controllable by the Group. Costs and volumes from associates and joint ventures are excluded, as are those from operations that are not yet in commercial production, that deliver domestic production, and those associated with third party volume purchases of diamonds and PGMs concentrate.
When calculating copper equivalent unit cost, unit costs for each commodity are multiplied by relevant production, combined and then divided by the total copper equivalent production, to get a copper equivalent unit cost i.e. the cost of mining one tonne of copper equivalent. The metric is in US dollars and, where appropriate, long term foreign exchange rates are used to convert from local currency to US dollars.
Productivity
The Group’s productivity measure calculates the copper equivalent production generated per employee. It is a measure that represents how well headcount is driving revenue. It is calculated by dividing copper equivalent production by the average direct headcount from consolidated mining operations in a given year.
Volume and cash cost improvements
The Group uses an underlying EBITDA waterfall to understand its year-on-year underlying EBITDA performance. The waterfall isolates the impact of uncontrollable factors in order that the real year-on-year improvement in performance can be seen by the user.
Other information Alternative performance measures
Anglo American plc Press Release 2021 89
Three variables are normalised, in the results of subsidiaries and joint operations, for:
– Price: The movement in price between comparative periods is removed by multiplying current year sales volume by the movement in realised price for each product group.
– Foreign exchange: The year-on-year movement in exchange is removed from the current year non-US dollar cost base i.e. costs are restated at prior year foreign exchange rates. The non-US dollar cash cost base excludes costs which are price linked (e.g. purchase of concentrate from third party PGMs providers, third party diamond purchases).
– Inflation: CPI is removed from cash costs, restating these costs at the pricing level of the base year.
The remaining variances in the underlying EBITDA waterfall are in real US dollar terms for the base year i.e. for a waterfall comparing 2021 with 2020, the sales volume and cash cost variances exclude the impact of price, foreign exchange and CPI and are hence in real 2020 terms. This allows the user of the waterfall to understand the underlying real movement in sales volumes and cash costs on a consistent basis.
Other information Alternative performance measures
90 Anglo American plc Press Release 2021
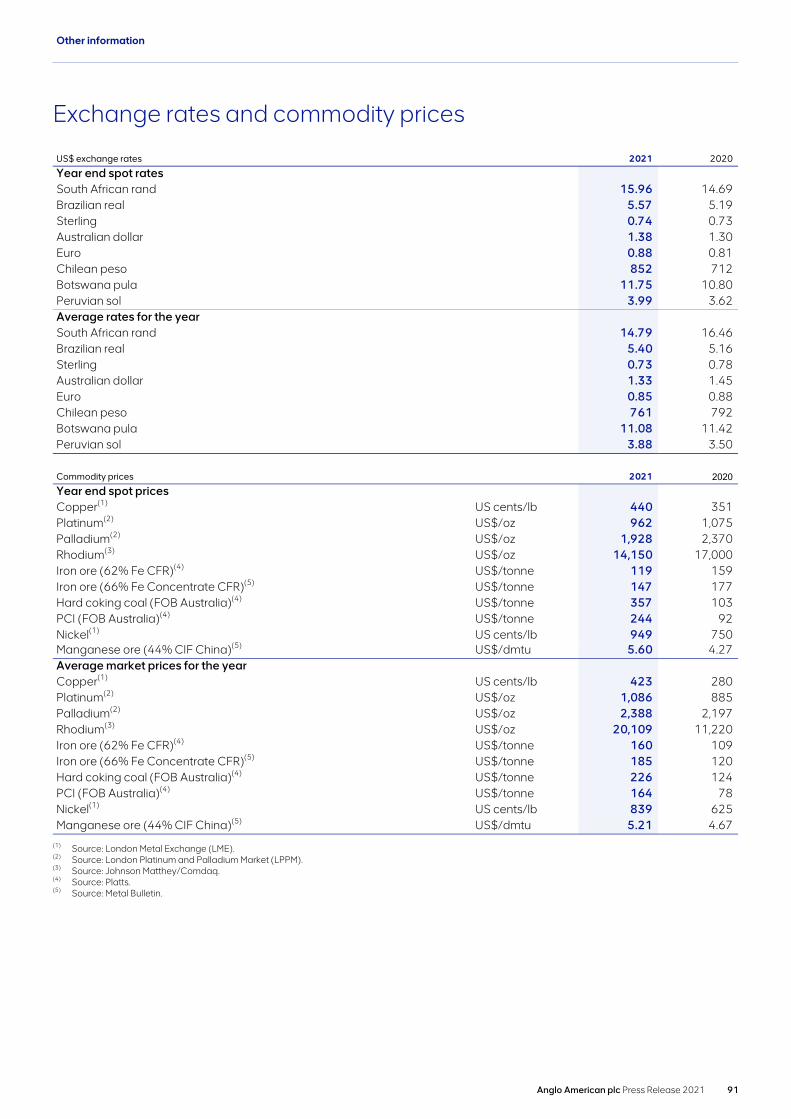
Exchange rates and commodity prices
US$ exchange rates 2021 2020
Year end spot ratesSouth African rand 15.96 14.69 Brazilian real 5.57 5.19 Sterling 0.74 0.73 Australian dollar 1.38 1.30 Euro 0.88 0.81 Chilean peso 852 712 Botswana pula 11.75 10.80 Peruvian sol 3.99 3.62 Average rates for the yearSouth African rand 14.79 16.46 Brazilian real 5.40 5.16 Sterling 0.73 0.78 Australian dollar 1.33 1.45 Euro 0.85 0.88 Chilean peso 761 792 Botswana pula 11.08 11.42 Peruvian sol 3.88 3.50
Commodity prices 2021 2020 Year end spot pricesCopper(1) US cents/lb 440 351 Platinum(2) US$/oz 962 1,075 Palladium(2) US$/oz 1,928 2,370 Rhodium(3) US$/oz 14,150 17,000 Iron ore (62% Fe CFR)(4) US$/tonne 119 159 Iron ore (66% Fe Concentrate CFR)(5) US$/tonne 147 177 Hard coking coal (FOB Australia)(4) US$/tonne 357 103 PCI (FOB Australia)(4) US$/tonne 244 92 Nickel(1) US cents/lb 949 750 Manganese ore (44% CIF China)(5) US$/dmtu 5.60 4.27 Average market prices for the yearCopper(1) US cents/lb 423 280 Platinum(2) US$/oz 1,086 885 Palladium(2) US$/oz 2,388 2,197 Rhodium(3) US$/oz 20,109 11,220 Iron ore (62% Fe CFR)(4) US$/tonne 160 109 Iron ore (66% Fe Concentrate CFR)(5) US$/tonne 185 120 Hard coking coal (FOB Australia)(4) US$/tonne 226 124 PCI (FOB Australia)(4) US$/tonne 164 78 Nickel(1) US cents/lb 839 625 Manganese ore (44% CIF China)(5) US$/dmtu 5.21 4.67
(1) Source: London Metal Exchange (LME).(2) Source: London Platinum and Palladium Market (LPPM).(3) Source: Johnson Matthey/Comdaq.(4) Source: Platts.(5) Source: Metal Bulletin.
Other information
Anglo American plc Press Release 2021 91
ANGLO AMERICAN plc(Incorporated in England and Wales – Registered number 03564138)
(the Company)
Notice of Dividend(Dividend No. 40)
Notice is hereby given that a final dividend and a special dividend on the Company’s ordinary share capital in respect of the year to 31 December 2021 will be paid as follows:Amount (United States currency) (notes 1 and 3) 168 cents per ordinary shareAmount (South African currency) (notes 2 and 4) 2519.61360 cents per ordinary shareLast day to effect removal of shares between the United Kingdom (UK) and South African (SA) registers Monday, 14 March 2022Last day to trade on the JSE Limited (JSE) to qualify for dividend Tuesday, 15 March 2022Ex-dividend on the JSE from the commencement of trading (note 5) Wednesday, 16 March 2022Ex-dividend on the London Stock Exchange from the commencement of trading Thursday, 17 March 2022
Record date (applicable to both the UK principal register and SA branch register) Friday, 18 March 2022Movement of shares between the UK and SA registers permissible from Tuesday, 22 March 2022Last day for receipt of DRIP mandate forms by Central Securities Depository Participants (CSDPs) (notes 6, 7 and 8) Friday, 1 April 2022Last day for receipt of DRIP mandate forms by the South African Transfer Secretaries (notes 6, 7 and 8) Tuesday, 5 April 2022Last day for receipt of Dividend Reinvestment Plan (DRIP) mandate forms by the UK Registrars (notes 6, 7 and 8) Friday, 1 April 2022Last day for receipt of US$:£/€ currency elections by the UK Registrars (note 3) Friday, 1 April 2022Currency conversion US$:£/€ rates announced on (note 9) Friday, 8 April 2022Payment date of dividend Tuesday, 26 April 2022
Notes 1. This amount is the aggregate of the final dividend of 118 US$ cents per ordinary share and the special dividend of 50 US$ cents per ordinary share.2. This amount is the aggregate of the final dividend of 1769.72860 Rand cents per ordinary share and the special dividend of 749.88500 Rand cents per ordinary
share.3. Shareholders on the UK register of members with an address in the UK will be paid in Sterling and those with an address in a country in the European Union which
has adopted the Euro will be paid in Euros. Such shareholders may, however, elect to be paid their dividends in US dollars provided the UK Registrars receive such election by Friday, 1 April 2022. Shareholders with an address elsewhere will be paid in US dollars except those registered on the South African branch register who will be paid in South African rand.
4. Dividend Tax will be withheld from the amount of the gross final dividend of 1769.72860 Rand cents per ordinary share and the gross special dividend of 749.88500 Rand cents per ordinary share, paid to South African shareholders at the rate of 20% unless a shareholder qualifies for exemption. After the Dividend Tax has been withheld, the net final dividend will be 1415.78288 Rand cents per ordinary share and the net special dividend will be 599.90800 Rand cents per ordinary share. Anglo American plc had a total of 1,337,577,913 ordinary shares in issue as at Wednesday, 23 February 2022. In South Africa the dividend will be distributed by Anglo American South Africa Proprietary Limited, a South African company with tax registration number 9030010608, or one of its South African subsidiaries, in accordance with the Company’s dividend access share arrangements. The final and special dividends in South African rand are based on an exchange rate of US$14.99770 taken on Wednesday, 23 February 2022, being the currency conversion date.
5. Dematerialisation and rematerialisation of registered share certificates in South Africa will not be effected by CSDPs during the period from the JSE ex‑dividend date to the record date (both days inclusive).
6. Those shareholders who already participate in the DRIP need not complete a DRIP mandate form for each dividend as such forms provide an ongoing authority to participate in the DRIP until cancelled in writing. Shareholders who wish to participate in the DRIP should obtain a mandate form from the UK Registrars, the South African Transfer Secretaries or, in the case of those who hold their shares through the STRATE system, their CSDP.
7. In terms of the DRIP, and subject to the purchase of shares in the open market, share certificates/CREST notifications are expected to be mailed and CSDP investor accounts credited/updated on or around Tuesday, 10 May 2022. CREST accounts will be credited on Friday, 29 April 2022.
8. Copies of the terms and conditions of the DRIP are available from the UK Registrars or the South African Transfer Secretaries. 9. The US$:£/€ conversion rates will be determined by the actual rates achieved by Anglo American buying forward contracts for those currencies, during the two
days preceding the announcement of the conversion rates, for delivery on the dividend payment date.
Registered office UK Registrars South African Transfer Secretaries17 Charterhouse Street Equiniti Computershare Investor Services (Pty) LimitedLondon Aspect House Rosebank Towers, 15 Biermann AvenueEC1N 6RA Spencer Road Rosebank, 2196, South AfricaUnited Kingdom Lancing Private Bag X9000
West Sussex Saxonwold, 2132BN99 6DA South Africa
United Kingdom
©Anglo American plc 2021. All rights reserved.
92 Anglo American plc Press Release 2021