X-RAY FLUORESCENCE COMBINED WITH CHEMOMETRICS FOR THE CHARACTERIZATION OF GEOLOGICAL SAMPLES: A CASE...
14
This article was downloaded by: [A. Traore] On: 23 September 2014, At: 03:45 Publisher: Taylor & Francis Informa Ltd Registered in England and Wales Registered Number: 1072954 Registered office: Mortimer House, 37-41 Mortimer Street, London W1T 3JH, UK Instrumentation Science & Technology Publication details, including instructions for authors and subscription information: http://www.tandfonline.com/loi/list20 X-RAY FLUORESCENCE COMBINED WITH CHEMOMETRICS FOR THE CHARACTERIZATION OF GEOLOGICAL SAMPLES: A CASE STUDY IN SOUTHEASTERN SENEGAL A. Traore a , P. M. Ndiaye b , M. Mbaye a , F. Diatta b & A. Wague a a Institute of Applied Nuclear Technology, University of Cheikh Anta Diop , Dakar , Senegal b Department of Geology , University of Cheikh Anta Diop , Dakar , Senegal Accepted author version posted online: 16 May 2014.Published online: 03 Sep 2014. To cite this article: A. Traore , P. M. Ndiaye , M. Mbaye , F. Diatta & A. Wague (2014) X-RAY FLUORESCENCE COMBINED WITH CHEMOMETRICS FOR THE CHARACTERIZATION OF GEOLOGICAL SAMPLES: A CASE STUDY IN SOUTHEASTERN SENEGAL, Instrumentation Science & Technology, 42:5, 593-604, DOI: 10.1080/10739149.2014.915564 To link to this article: http://dx.doi.org/10.1080/10739149.2014.915564 PLEASE SCROLL DOWN FOR ARTICLE Taylor & Francis makes every effort to ensure the accuracy of all the information (the “Content”) contained in the publications on our platform. However, Taylor & Francis, our agents, and our licensors make no representations or warranties whatsoever as to the accuracy, completeness, or suitability for any purpose of the Content. Any opinions and views expressed in this publication are the opinions and views of the authors, and are not the views of or endorsed by Taylor & Francis. The accuracy of the Content should not be relied upon and should be independently verified with primary sources of information. Taylor and Francis shall not be liable for any losses, actions, claims, proceedings, demands, costs, expenses, damages, and other liabilities whatsoever or howsoever caused arising directly or indirectly in connection with, in relation to or arising out of the use of the Content. This article may be used for research, teaching, and private study purposes. Any substantial or systematic reproduction, redistribution, reselling, loan, sub-licensing, systematic supply, or distribution in any form to anyone is expressly forbidden. Terms &
Transcript of X-RAY FLUORESCENCE COMBINED WITH CHEMOMETRICS FOR THE CHARACTERIZATION OF GEOLOGICAL SAMPLES: A CASE...

This article was downloaded by: [A. Traore]On: 23 September 2014, At: 03:45Publisher: Taylor & FrancisInforma Ltd Registered in England and Wales Registered Number: 1072954 Registeredoffice: Mortimer House, 37-41 Mortimer Street, London W1T 3JH, UK
Instrumentation Science & TechnologyPublication details, including instructions for authors andsubscription information:http://www.tandfonline.com/loi/list20
X-RAY FLUORESCENCE COMBINEDWITH CHEMOMETRICS FOR THECHARACTERIZATION OF GEOLOGICALSAMPLES: A CASE STUDY INSOUTHEASTERN SENEGALA. Traore a , P. M. Ndiaye b , M. Mbaye a , F. Diatta b & A. Wague aa Institute of Applied Nuclear Technology, University of Cheikh AntaDiop , Dakar , Senegalb Department of Geology , University of Cheikh Anta Diop , Dakar ,SenegalAccepted author version posted online: 16 May 2014.Publishedonline: 03 Sep 2014.
To cite this article: A. Traore , P. M. Ndiaye , M. Mbaye , F. Diatta & A. Wague (2014) X-RAYFLUORESCENCE COMBINED WITH CHEMOMETRICS FOR THE CHARACTERIZATION OF GEOLOGICALSAMPLES: A CASE STUDY IN SOUTHEASTERN SENEGAL, Instrumentation Science & Technology, 42:5,593-604, DOI: 10.1080/10739149.2014.915564
To link to this article: http://dx.doi.org/10.1080/10739149.2014.915564
PLEASE SCROLL DOWN FOR ARTICLE
Taylor & Francis makes every effort to ensure the accuracy of all the information (the“Content”) contained in the publications on our platform. However, Taylor & Francis,our agents, and our licensors make no representations or warranties whatsoever as tothe accuracy, completeness, or suitability for any purpose of the Content. Any opinionsand views expressed in this publication are the opinions and views of the authors,and are not the views of or endorsed by Taylor & Francis. The accuracy of the Contentshould not be relied upon and should be independently verified with primary sourcesof information. Taylor and Francis shall not be liable for any losses, actions, claims,proceedings, demands, costs, expenses, damages, and other liabilities whatsoever orhowsoever caused arising directly or indirectly in connection with, in relation to or arisingout of the use of the Content.
This article may be used for research, teaching, and private study purposes. Anysubstantial or systematic reproduction, redistribution, reselling, loan, sub-licensing,systematic supply, or distribution in any form to anyone is expressly forbidden. Terms &

Conditions of access and use can be found at http://www.tandfonline.com/page/terms-and-conditions
Dow
nloa
ded
by [
A. T
raor
e] a
t 03:
45 2
3 Se
ptem
ber
2014

X-RAY FLUORESCENCE COMBINED WITH CHEMOMETRICSFOR THE CHARACTERIZATION OF GEOLOGICAL SAMPLES:A CASE STUDY IN SOUTHEASTERN SENEGAL
A. Traore,1 P. M. Ndiaye,2 M. Mbaye,1 F. Diatta,2 and A. Wague1
1Institute of Applied Nuclear Technology, University of Cheikh Anta Diop, Dakar, Senegal2Department of Geology, University of Cheikh Anta Diop, Dakar, Senegal
& Characterization of magmatic, metamorphic, and mineralized metamorphic rock collected insoutheastern Senegal in West Africa was performed based on elemental analysis by energy dispersiveX-ray fluorescence. The rock classification scheme based on chemical composition was obtained bya combination of principal component analysis and hierarchical clustering techniques to discriminatemagmatic, metamorphic, and mineralized metamorphic rock. An improved sensitivity of signal-to-noise ratio was obtained using a thin silver X-ray excitation source with several appropriate filters.Energy dispersive X-ray fluorescence was used to characterize the major oxides, and the results werecompared to previous studies.
Keywords chemometrics, hierarchical cluster analysis, principal component analysis,rock, X-ray fluorescence
INTRODUCTION
Various methods have been employed for the analysis of silicate rock forthe determination of major and trace elements.[1] X-ray fluorescence (XRF)is used for major elements (Na, Mg, Al, Si, P, K, Ca, Ti, Mn, Fe) and traceelements (Rb, Sr, Y, Nb, Zr, Cr, Ni, Cu, Zn, Ga Pb, Th, U, La, Ce, Nd,Sm).[2–5] Instrumental Neutron activation (INAA) is used for the determi-nation of specific trace elements (Sc, Co, Cr, Cs, Hf, Ta, Th, U) and the rareearth elements (REE) (La, Ce, Nd, Sm, Eu, Tb, Yb, Lu). Alternatively, rareearths may be determined by isotope dilution mass spectrometry. Inductivelycoupled plasma techniques, such as inductively coupled plasma atomic emis-sion spectrometry (ICP-AES), are also employed for geological materials.[6]
Address correspondence to A. Traore, Institute of Applied Nuclear Technology, University ofCheikh Anta Diop. P.O. Box 5005, Dakar, Senegal. E-mail: [email protected]
Color versions of one or more of the figures in the article can be found online at www.tandfonline.com/list.
Instrumentation Science and Technology, 42:593–604, 2014Copyright # Taylor & Francis Group, LLCISSN: 1073-9149 print/1525-6030 onlineDOI: 10.1080/10739149.2014.915564
Instrumentation Science and Technology, 42:593–604, 2014Copyright # Taylor & Francis Group, LLCISSN: 1073-9149 print/1525-6030 onlineDOI: 10.1080/10739149.2014.915564
Dow
nloa
ded
by [
A. T
raor
e] a
t 03:
45 2
3 Se
ptem
ber
2014
The results of these instrumental techniques have been used to attemptto classify the geological materials,[7] specify the nature of the magmaticseries,[8–11] and identify the paleotectonic setting.[12–14]
However, most of the techniques described above require samplepreparation with possibility of errors. To overcome these difficulties, in thiswork, rock was analyzed for major, minor, and trace elements by energydispersive X-ray fluorescence spectroscopy (EDXRF) with chemometrictechniques. Although the multielemental capability and the relatively lowcosts make this technique a useful tool, there is a lack of consensus onthe selection of methods and on the estimation of the uncertainty of theresults.[15] The technique is nevertheless limited by matrix effects, mineralheterogeneity, and the surface irregularity of the sample, factors thathamper the accuracy of the results.[16] Chemometric techniques reducethese interferences[17] through spectral modeling to provide correct for
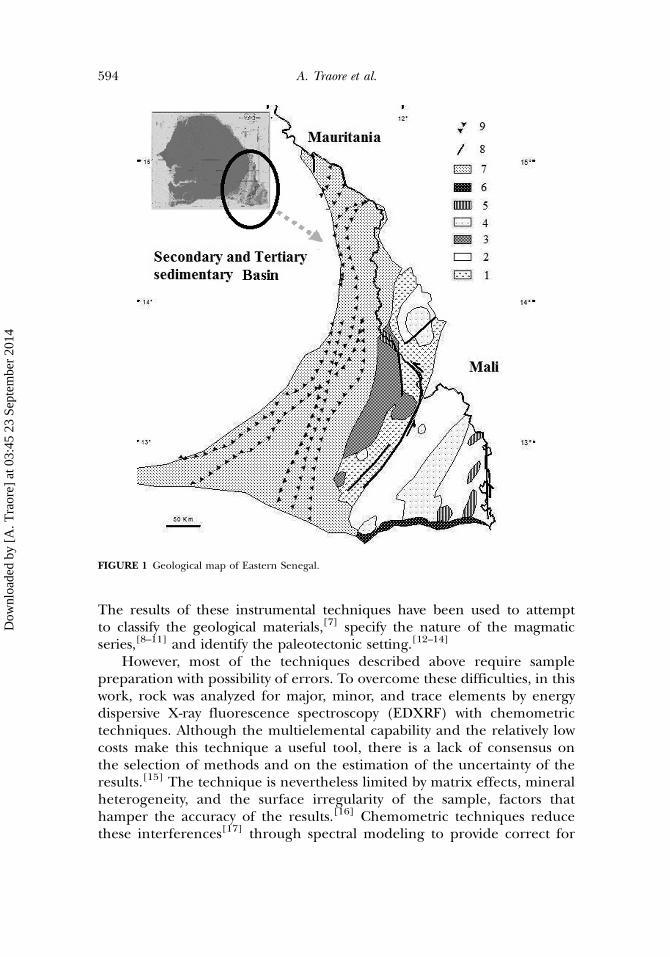
FIGURE 1 Geological map of Eastern Senegal.
594 A. Traore et al.
Dow
nloa
ded
by [
A. T
raor
e] a
t 03:
45 2
3 Se
ptem
ber
2014
matrix effects, resolution of intense overlapping spectral lines, and directcharacterization of igneous rocks. The objective of this work is to classifymagmatic, metamorphic, and mineralized metamorphic rock on the basisof elemental concentration. Oxides were characterized by EDXRF andthe results were compared to previous studies.[18]
MATERIAL AND METHODS
Geological Materials
The geological material was derived from eastern Senegal. The recentmapping[19–22,24] of this part of Senegal has distinguished three super-groups (Figure 1). The Birimian supergroup (Paleoproterozoic), illustratedin Figure 1, areas 1, 2, 3, 4, and 5, includes a Mako group, in the westregion, characterized by volcanic formations, magmatic suite, and is domi-nated by granodiorite. Its pillow lavas basalt is associated with conglomer-ates, sandstones, greywacke with andesite, and andesitic breccias. Themagmatic suite consists of several generations of pluton ranging from gab-bro to granite. The Diale-Dalema group at the east is formed by carbonates,greywacke, pelite, sandstone, and quartzite and contains andesites andrhyodacite. This group is also intersected by a magmatic suite that includesgranodiorites, monzongranites, diorites, microdiorites, rhyolites, rhyoda-cites, andesites, and trachytes.
The Segou=Madina-Kouta supergroup outcrops along the borderbetween Senegal and the Republic of Guinea and consists of meso- andneoproterozoic sedimentary rock. The Mauritanides supergroup includesa stratigraphy autochthonous area that corresponds to the Taoudeni Basin.Another domain called parautochthonous is transported oncambro-ordovician sediments that includes groups composed of felsicand sedimentary rock. The allochthonous area is in the northern part;some allochthonous units contain micaschistes, quartzites, sericitic schistes,mylonitic granite, and acid volcanic rocks. Other allochthonous units con-sist of serpentinites often associated with mylonitic quartzites, metabasalts,metagabbros, and ferruginized chloritic-schists.
XRF Analysis
XRF was performed with 100% normalization and full fundamentalparameter quantification techniques. The metal content of sodium wasdetermined by ICP-AES to be 0.40, 4.70, 5.14, and 4.12% in ultrabasite(UB), granodiorite-mylonite (D155), granodiorite (D153), and granite(D141A), respectively.
X-Ray Fluorescence and Rocks Study 595
Dow
nloa
ded
by [
A. T
raor
e] a
t 03:
45 2
3 Se
ptem
ber
2014

Samples were prepared with a flat surface without scratches and stria-tions by polishing and were cut in order to fit into the window of theXRF instrument. For small masses of sample (SAT1, SAT2, and GA), pelletswere made as a mixture of rock powder and ethylene bis-stearamide(known as Licowax or Hoechtwax HWC) as a binding agent in a ratio of1 g of rock sample to 10% of the binding agent. The mixture was thor-oughly homogenized in a planetary mill and pressed under 15 tons into adisc 32mm in diameter. The pellets were analyzed by EDXRF at 50 kVand 40mA max with a silver-anode excitation source and filters as secondarytargets for excitation (Table 1). With this configuration, matrix effects werereduced due to element overlapping and the signal-to-noise ratio wasimproved by sequentially selecting appropriate combinations of filters assecondary targets. Thus, different groups of elements were determineddepending on the target. Three replicate measurements were performedusing an analysis time of 200 s. The accuracy of the instrument was verifiedby analyzing five different standard materials: CCRMP TILL-4 (180-601),NIST 2780 (180-625), SiO2 99.995% (180-472), RCRA (180-436), and NIST2709a (180-469a).
EDXRF SPECTRAL DATA AND CHEMOMETRIC ANALYSIS
Conventional computer techniques that have been used for XRF analy-sis[26] involve searching the spectrum for characteristic peaks, followed byan iterative procedure for matching the fitted peaks and intensities. Withhigh resolution germanium detectors, the photopeaks are well resolvedand the process is relatively simple. However, with more common low res-olution detectors, such as Si (Li),[27] the process is less accurate and moretime consuming. This limits the use of such algorithms[28] for the analysisof complex matrices. To avoid this limitation, the intensities for the rockwere processed using least-squares regression analysis and statistical evalu-ation. The linear equation Y¼ aþbx was used to compute the intensity.[29]
TABLE 1 Spectrometer specifications and operating conditions
Resolution 178 eV at Mn KaWindow Thickness 12.7mm BeRating 50 kV, 40mA maximum power of the tube 2WBeam diameter 7mmFilter Elements analyAg excitation source Sb, Sn, Cd, Pd, Ag, Mo, Nb, Zr, Sr, Rh, Bi, As, Se, Au, Pb,
W, Zn, Cu, Re, Ta, Hf, Ni, Co, Fe, Mn, Cr, V, Ti, Th and USandwich of Al, Ti and Mo Ba, Sb, Sn, Cd, Pd, AgCu Filter Cr, V, Ti, Ca, KNo Filter Al, P, Si, Cl, S, Mg
596 A. Traore et al.
Dow
nloa
ded
by [
A. T
raor
e] a
t 03:
45 2
3 Se
ptem
ber
2014

Principal component analysis (PCA) is an unsupervised statistical analy-sis technique that finds linear combinations of variables describing majortrends in the data set. PCA provides a useful tool for comparison of sampleswhich variables are responsible for differences. In order to perform thedata processing for rock classification based on chemical composition,the results were characterized by a combination of PCA and hierarchicalclustering techniques. SPSS software was selected as a chemometric toolfor PCA, while Matlab 7.10 (Mathworks Natick) was used for hierarchicalcluster analysis. Mean-centuring and auto-scaling techniques were utilizedfor data pre-processing. Scaling reduces collinearity among the variablesand allows their contribution to the analysis.
RESULTS AND DISCUSSION
Several types of rock were analyzed by energy dispersive X-ray fluore-scence (EDXRF), and the results are recorded in Table 3. The elementsthat are concentrated in most geological samples and whose concentrationsvary largely among the different petrogenesis formations include barium,chromium, iron, manganese, zirconium, and thorium. Scandium wasconcentrated in the ferromagnesian minerals formed during the initialcrystallization of the rocks, as well as in phosphorous limestone and basaltictuff. As some elements are concentrated during the weathering processes
TABLE 2 Analysis of NIST SRM 2780
Element
Certified value�uncertaintymg=kg except whereindicated otherwise Average, mg=kg
Standard deviation,mg=kg
Relative standarddeviation, %
Si 34.1� 0.2% 21.82 0.09 0.41Al 8.87� 0.33% 88007.23 790.64 0.90Cd 12.1� 0.24 11.98 3.18 26.54Pb 5770� 410 5136.42 69.84 1.36As 48.8� 3.3 50.06 5.03 10.05Fe 2.78� 0.08% 27235.71 263.07 0.97K 3.4� 0.3% 34545.16 3096.47 8.96Ca 0.2� 0.02% 2052.61 45.92 2.24P 427� 40 450.37 68.19 15.14Mn 462� 21 449.38 21.12 4.70S 12630� 420 12877.18 203.46 1.58Sr 217� 18 219.85 2.82 1.28Rb 175 182.49 0.3 0.16Cu 215.5� 7.8 237.63 1.3 0.55Zn 2570� 160 2069.4 13.92 0.67Mg 5330� 200 N.D� — —
(�) Not Detected.
X-Ray Fluorescence and Rocks Study 597
Dow
nloa
ded
by [
A. T
raor
e] a
t 03:
45 2
3 Se
ptem
ber
2014

TABLE3
Analysisofge
ologicalsamplesbyEDXRF
Geo
logicalrocks
samples(L
abel)
Elemen
ts
Si(%
)Fe(%
)Mn
Ti
Cr
KCa
As
Zr
SSr
Granite(D
141A
)36
.8�0.2
2.8�0.02
674.1�48
.855
05.6�41
.3ND
1622
0.6�16
3.4
3399
3.9�19
2.8
4.6�1.3
117.8�3.1
356.8�75
.341
1.0�5.0
Granodiorite-m
ylonite(D
142)
34.6�0.13
1.7�0.02
293.2�17
.616
89.1�31
.5ND
7540
.6�99
.921
009�12
38.6�2.3
103.4�2.8
ND
136.2�1.9
Granodiorite
(D15
3)33
.3�0.2
2.9�0.02
566.4�23
.436
68.6�46
.114
.8�7.7
2530
0�30
0012
721.7�20
0.8
13�1.3
49�2.03
695.9�47
.512
6.3�1.9
Granodiorite-m
ylonite(D
155)
39.4�0.2
0.8�0.01
264.8�33
.812
28.1�14
.3ND
2069
4.2�16
9.1
3284
.2�46
.22.8�1.2
62.9�1.5
ND
54.5�1.3
BasalticTuff(D
161)
30.2�0.2
87.6�0.02
1127
.04�34
.913
319�67
1117
.8�11
.526
79.4�78
.196
581.5�22
9.9
28.5�1.4
174.2�2.4
1130
�30
367.2�3.1
Sulfidebearingbreccia
(SAT2)
ND
74.9�0.01
ND
895�48
450.5�12
.5ND
ND
599�9
67.1�2.4
2269
19�13
935.4�1.4
Ferrugineo
us
quartzite(Q
F)
14.4�0.1
37.9�0.09
772.1�10
7.9
415�54
5095
.6�34
.5ND
ND
67.9�3.8
177.0�4.0
303.7�17
7.03
ND
Uraniferoussyen
ite(S)
33.3�0.2
3.9�0.04
820�70
9600
�80
0ND
7525
.7�10
6.6
1129
60.2�26
6.6
20�10
100�10
490�60
467.5�3.6
Phosphorouslimestone(P
)17
.6�0.1
0.16
�0.00
338
.7�12
.683
5�24
26.7�7.9
329.5�73
.717
1047
.8�33
4.9
2.9�1.4
13.6�2.7
1327
.8�15
7.2
719.2�4.8
Sulfidebearingtuff(Sa)
27.9�0.1
33.7�0.1
ND
2846
�45
278�12
403.9�89
.623
04.9�50
137.5�4.03
111.8�2.8
1434
92.0�11
85.0
31�2
Peridotite-m
ylonite(301
)16
,3�0.1
20.2�0.04
2909
.1�66
.886
79.9�91
.861
3.5�15
.314
8.5�97
.828
1.9�61
.654
.3�2.04
103.8�2.3
302.4�16
4.4
ND
Sulfidebearingquartzite(332
)26
,9�0.1
17,7�0.03
3392
.8�52
.647
11.2�47
.629
2.6�7.9
3135
4.5�17
1.4
547.1�61
.471
.8�2.2
188.8�2.3
362.4�93
.732
.1�1.2
Sulfidebearing
quartzite(119
)21
,9�0.1
20,88�0.03
165.9�28
.812
05.2�40
.937
1.8�8.8
5633
.1�73
.766
9.1�36
.666
.7�2.1
46.3�2.8
1053
.1�33
.62.8�1.4
Ferrugineo
usco
ncretion
(#15
1)14
,7�0.06
3.3�0.03
897.2�67
.915
81.1�36
115.9�26
.02
8795
.6�20
3.3
2076
89.8�10
22.2
47.3�4.2
100.7�3.2
2043
9.0�13
2.0
42.6�2.1
Ferrugineo
usco
ncretion
(#15
2)34
,8�0.1
9.36
�0.06
286.9�52
.331
41.9�48
.369
.3�28
.335
38.6�15
6.4
2350
.2�61
.853
.01�3.4
319.8�5.6
436.6�37
.212
.6�1.5
Andesitic
tuff(#
154)
37,4�0.12
1.29
�0.01
392.1�49
.622
00.9�21
.1ND
3093
0.3�29
3.7
6127
.1�69
.15.5�2.5
256.1�4.3
302.3�35
.212
3.4�2.5
Mylonitic
ferrugineo
us
quartzite(317
)49
.4�0.2
4.1�0.03
33.1�9.8
ND
ND
184.2�36
.520
70�40
30�10
ND
128.9�66
.8ND
Sulfidebearingquartzite(216
)41
,7�0.2
0.8�0.01
1360
.1�43
.715
20.3�20
.111
4.8�6.2
5771
.01�56
.613
332.1�65
.315
.14�1.02
28.3�1.03
420.6�66
.211
.8�0.7
Quartzite(267
)26
,7�0.1
8,05
�0.02
280�21
.928
74�62
.114
9�12
.838
00�12
0.5
4460
�99
.026
.2�1.2
32�1.2
246�13
9.0
5.6�1
Geo
logicalrocks
samples(L
abel)
Elemen
ts
PCu
SnU
Zn
Th
ScCs
Te
Ba
Mo
Granite(D
141A
)10
71.8�20
9.6
ND
131.1�6.3
ND
16.4�2.6
ND
8.5�1.8
163.2�14
.552
0.5�15
.812
37.7�34
,83.6�1.6
Granodiorite-m
ylonite(D
142)
568.7�87
.9ND
132.6�6.1
ND
36.6�5.7
ND
9�2
170�14
523.5�15
.247
2.6�21
.6ND
Granodiorite
(D15
3)35
5.8�12
0.3
ND
124.3�6.2
6.8�3.2
31.7�3.2
ND
2.7�1.6
63.1�14
.348
6.4�15
.768
7.5�23
.8ND
Granodiorite-m
ylonite(D
155)
660�60
ND
117.9�5.7
7.3�3.1
75.7�3.6
10.3�2.0
ND
ND
467.9�14
.653
6.6�21
.7ND
BasalticTuff(D
161)
2070
�70
90�20
162.5�6.7
ND
90�10
ND
22.4�3.4
269.5�15
.157
1.3�16
.357
3.1�23
.2ND
Sulfidebearingbreccia
(SAT2)
ND
ND
141.2�9.9
ND
ND
ND
3.8�1.1
ND
456.2�24
.3ND
121�3
Ferrugineo
usquartzite(Q
F)
ND
ND
263.9�16
.3ND
29.3�8.1
ND
3.13
�1.1
1016
�38
1041
.7�40
.514
12.2�56
.6ND
598
Dow
nloa
ded
by [
A. T
raor
e] a
t 03:
45 2
3 Se
ptem
ber
2014

Uraniferoussyen
ite(S)
850�13
0ND
132.5�6.4
64.4�4.1
70�10
7.2�2.2
ND
113.3�14
.750
6.2�16
.125
3.3�21
.9ND
Phosphorouslimestone(P
)93
600�47
339
.8�12
.413
7.8�7.3
79.04�4.5
499.3�18
.8ND
24.1�4.9
181.7�16
.753
0.3�18
.134
9�25
15.3�2.2
Sulfidebearingtuff(Sa)
ND
20.02�10
.413
4.0�10
.0ND
ND
ND
2.0�1.0
174.5�26
.243
2.4�23
.735
2.03
�38
.926
.2�2.3
Peridotite-m
ylonite(301
)ND
56.8�9.5
138.3�8.2
ND
96.5�9.6
ND
4.4�1.2
140.6�18
.749
6.9�20
.325
3.02
�27
.73.0�
2.1
Sulfidebearingquartzite(332
)ND
20.8�7.4
144.7�6.8
13.7�4.0
19.4�5.5
ND
1.7�0.7
245.9�15
.755
6.1�17
.012
62�28
7.5�1.7
Sulfidebearingquartzite(119
)ND
229.1�7.8
166.8�6.8
ND
37.3�8.3
ND
3.9�01
336.2�15
.864
5.04
�17
.352
7.8�23
.6ND
Ferrugineo
usco
ncretion
(#15
1)19
19.6�83
.317
1.5�14
.7ND
ND
46.5�7.6
ND
ND
ND
ND
ND
ND
Ferrugineo
usco
ncretion
(#15
2)21
45.2�10
5.1
ND
ND
ND
37.6�7.1
ND
ND
ND
ND
ND
ND
Andesitic
tuff(#
154)
1120
.2�10
1.4
ND
ND
ND
34.1�5.9
ND
ND
ND
ND
ND
ND
Mylonitic
ferrugineo
us
quartzite(317
)45
0�11
06.6�2.9
130.9�10
.5ND
ND
ND
ND
138.4�24
.149
9.6�26
.226
0.8�35
.8ND
Sulfidebearingquartzite(216
)32
3�25
0.1
5.9�3.4
137.1�4.9
ND
15.01�3.2
ND
1.3�0.6
221.3�11
.656
9.5�12
.741
0.4�17
.5ND
Quartzite(267
)ND
ND
172.9�7.3
ND
19.8�4
ND
3.2�1.6
401.2�16
.766
6.6�18
.270
8.8�25
.9ND
Geo
logicalrocks
samples(L
abel)
Elemen
ts
Rb
VNi
Al(%
)Pd
Sb
Granite(D
141A
)52
.3�2.1
88.5�4.1
40.3�7.1
7.6�0.1
44,2�5.7
31,1�5.8
Granodiorite-m
ylonite(D
142)
26.6�1.1
29.4�9.7
40.6�6.9
7,4�0.2
41,9�5.4
35,4�5.6
Granodiorite
(D15
3)80
.4�1.8
95.2�13
.937
.6�7.4
8.8�0.4
39,3�5.6
25,6�5.8
Granodiorite-m
ylonite(D
155)
95.8�1.8
16.6�8.2
23.9�6.5
6.5�0.3
41,9�5.3
21,2�5.4
BasalticTuff(D
161)
ND
273.2�18
.737
5.7�11
.78,5�0.2
39,9�5.7
43,5�5.9
Sulfidebearingbreccia
(SAT2)
ND
130�15
.158
5.9�32
.2ND
71,7�9.7
18,8�9.04
Ferrugineo
usquartzite(Q
F)
ND
363.8�19
.514
60.1�36
.11,4�0.1
77,1�13
.819
4,4�14
.9Uraniferoussyen
ite(S)
46.2�1.6
ND
12.2�6.9
6,9�0.1
40,1�5.7
33,9�5.9
Phosphorouslimestone(P
)16
.6�1.9
91�8.0
33.6�8.1
2,5�0.2
45,2�6.5
36,8�6.7
Sulfidebearingtuff(Sa)
ND
98.7�15
.918
2.5�20
.98,2�0.3
44,6�8.9
26,9�10
.3Peridotite-m
ylonite(301
)ND
329.6�27
.113
19�23
8,6�0.2
41,6�7.3
28,6�7.5
Sulfidebearingquartzite(332
)11
1.4�2.3
173.3�14
.526
1.1�11
.44,5�0.1
41�6.0
47,4�6.3
Sulfidebearingquartzite(119
)3.6�1.3
105.4�10
.112
7.9�9.5
0,3�0.07
53,5�6.1
79,5�6.4
Ferrugineo
usco
ncretion
(#15
1)13
4.5�3.9
45.7�5.5
ND
4,9�0.1
ND
ND
Ferrugineo
usco
ncretion
(#15
2)ND
38.3�6.3
ND
8,1�0.2
ND
ND
Andesitic
tuff(#
154)
85.1�2.7
64.7�3.8
ND
7,5�0.2
ND
ND
Mylonitic
ferrugineo
us
quartzite(31
7)ND
45.9�7.3
44.4�4.9
ND
43.4�9.5
21.8�9.6
Sulfidebearingquartzite(216
)7.9�0.6
30.6�6.5
45.7�5.6
0,2�0.2
43,2�4.4
48,4�4.7
Quartzite(267
)1.2�0.9
160.7�19
.572
.9�7.9
6,1�0.2
50.4�6.3
79.9�6.8
599
Dow
nloa
ded
by [
A. T
raor
e] a
t 03:
45 2
3 Se
ptem
ber
2014
leading to the formation of the rock beds, their concentrations vary. Dueto the absence of helium flush or vacuum in the setup, sodium was notdetected, unless using an ultra-light detector window. Its presence washighly correlated with calcium.
Table 4 shows results obtained by EDXRF and inductively coupled plasma-atomic emission spectroscopy (ICP-AES). There was good agreement betweengranodiorite and diorite. The concentrations of the determined elements werereported as the concentration of the corresponding oxide. SiO2 was signifi-cantly higher in granite but lower in ultrabasite; Al2O3 was lower in dacitesbut higher in basalts; CaO was generally lower in gabbro and ultrabasites.
The PCA procedure was sorted in order of significance, where the firstcomponent was essential for the proper reconstruction of the spectralsignature and the last component contained sample specific superimposedrandom noise. By choosing a truncation value, i.e., a number of spectralcomponents, the information was separated from the noise.[30] Once thedata were autoscaled, PCA was performed convert the data structure to areduced dimension, retaining the maximum amount of variability.[31]
PCA promotes dimension reduction of the original data, modeling of data,detecting of outliers, selection of main variables, classification of samples,and prediction of sample characteristics.[32] The first four extractedcomponents accounted for nearly 92.05% of the variability of the dataset. The highest variability in the data set (74.73%) was accounted forall groups of rock. The running matrix elements used for data processingwithin the samples was Na, Al, Si, P, S, K, Sb, Ca, Te, Sc, Cs, Ti, V, Cr, Mn, Ni,Cu, W, Zn, As, Pb, Th, Rb, U, Sr, Y, Zr, Mo, Pd, and Cd.
In the first loading score, Si, Ca, S, Ti, Ni, Ba, and Zr had good contri-butions in sulfide bearing breccia (AS), peridotite (UB), andesite (AN),and ferruginous quartzite (267). Other metals, Sr, Cu, Zn, Sb, Sc, Cr,and Mn in the second, third and fourth components, also contributed tovariability in the data and the fact that their loading is the same sign mayindicate their association with other minerals.
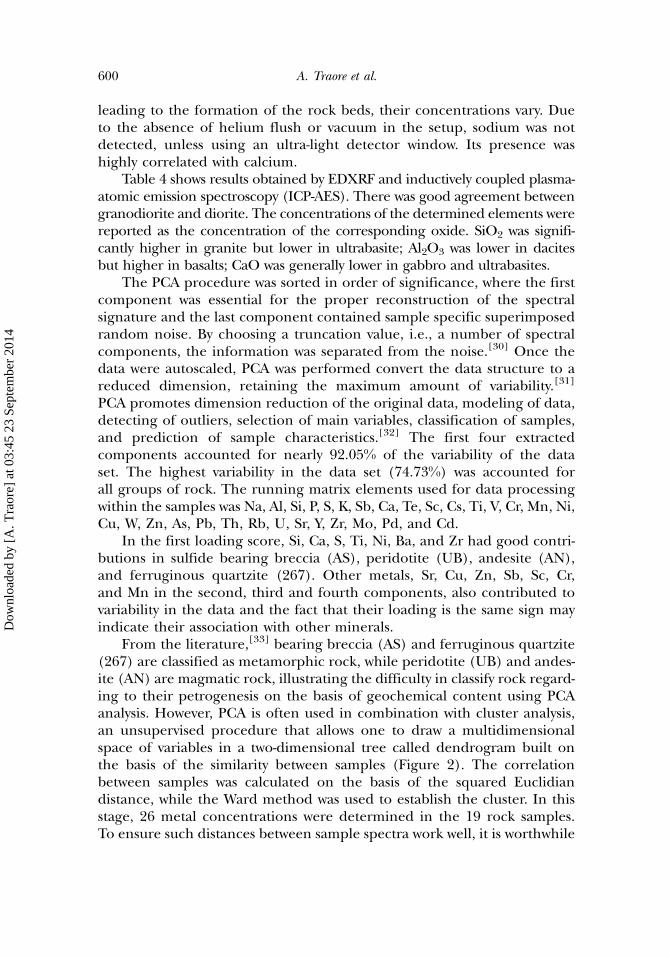
From the literature,[33] bearing breccia (AS) and ferruginous quartzite(267) are classified as metamorphic rock, while peridotite (UB) and andes-ite (AN) are magmatic rock, illustrating the difficulty in classify rock regard-ing to their petrogenesis on the basis of geochemical content using PCAanalysis. However, PCA is often used in combination with cluster analysis,an unsupervised procedure that allows one to draw a multidimensionalspace of variables in a two-dimensional tree called dendrogram built onthe basis of the similarity between samples (Figure 2). The correlationbetween samples was calculated on the basis of the squared Euclidiandistance, while the Ward method was used to establish the cluster. In thisstage, 26 metal concentrations were determined in the 19 rock samples.To ensure such distances between sample spectra work well, it is worthwhile
600 A. Traore et al.
Dow
nloa
ded
by [
A. T
raor
e] a
t 03:
45 2
3 Se
ptem
ber
2014

TABLE4
ComparisonofEDXRFan
dIC
P-AESfordeterminationofmajorelem
ents
(%)
Granite
Granodiorite
Diorite
Gab
bro
Orthogn
eiss
Ultrabasite
Andesite
Dacite
Basalte
D14
1AD15
3DIO
B31
1D15
5UB
AN
DA
B25
6B
Major
elem
ents
XRF
ICP-AES
XRF
ICP-AES
XRF
ICP-AES
XRF
ICP-AES
XRF
ICP-AES
XRF
ICP-AES
XRF
ICP-AES
XRF
ICP-AES
XRF
ICP-AES
SiO
273
.563
.860
.863
.762
.959
.04
54.4
45.7
60.8
71.3
40.2
41.0
55.6
52.0
59.1
60.4
54.4
48.3
Al 2O
321
.915
.615
.615
.310
.213
.612
.314
.012
.014
.44.4
4.9
14.0
13.7
13.1
16.5
19.6
13.9
CaO
3.7
3.9
2.0
2.7
6.8
8.2
7.9
11.5
21.0
1.9
4.8
3.08
9.2
4.1
5.02
10.2
9.8
Cr 2O
3ND
0.04
ND
0.1
0.03
0.04
0.1
0.02
ND
0.1
0.4
0.5
0.04
0,1
0.1
0.1
0.1
0.02
Fe 2O
33.3
4.6
3.4
4.8
6.4
7.1
10.2
16.5
3.4
2.9
17.6
12.5
9.4
10.2
2.1
3.7
11.4
15.9
K2O
4.9
2.6
5.6
2.9
0.7
0.6
0.1
0.2
5.6
2.9
0.1
0.2
0.2
3.3
0.1
0.3
0.1
0.3
MnO
0.1
0.1
0.05
0.1
0.1
0.1
0.1
0.3
0.05
0.2
0.3
0.2
0.1
0.2
ND
0.04
0.1
0.3
P2O
50.1
0.2
ND
0.2
ND
0.1
0.1
0.1
ND
0.1
ND
0.03
0.1
0.3
0.2
0.1
0.1
0.1
TiO
20.2
0.6
0.4
0.6
0.4
0.4
0.4
1.6
0.4
0.4
0.2
0.3
0.7
0.7
0.2
0.4
0.6
1.5
MgO
ND
1.95
ND
2.1
ND
6.1
ND
6.9
ND
3.9
8.4
28.8
ND
7.6
ND
4.5
6.5
6.0
Na 2O
NA��
4.1
NA
5.1
NA
2.9
NA
2.0
NA
4.7
NA
0.3
NA
2.6
NA
7.8
NA
3.3
(�� )
NotAvailab
le.
601
Dow
nloa
ded
by [
A. T
raor
e] a
t 03:
45 2
3 Se
ptem
ber
2014
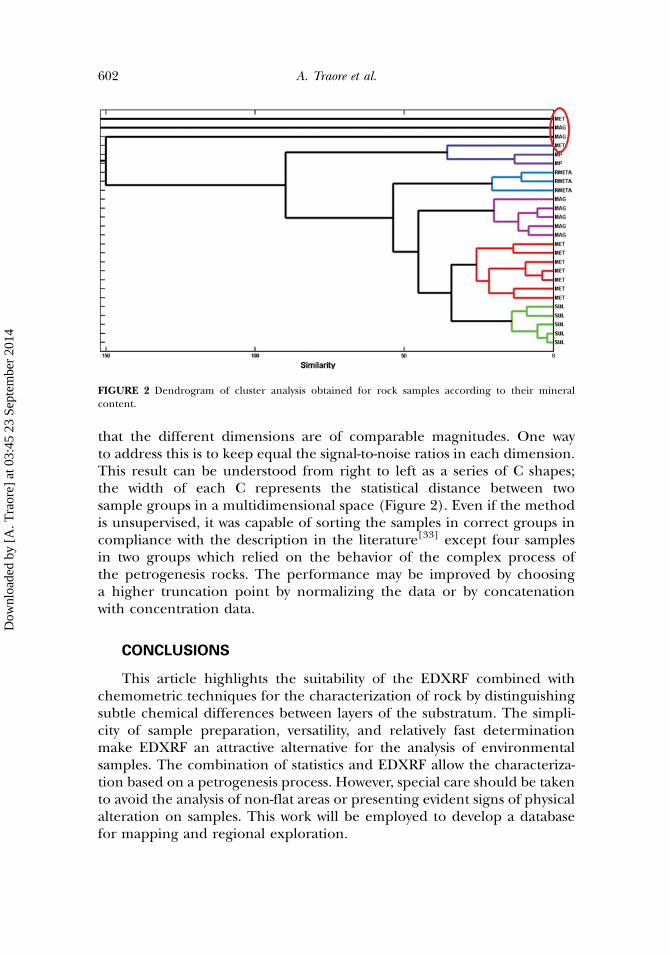
that the different dimensions are of comparable magnitudes. One wayto address this is to keep equal the signal-to-noise ratios in each dimension.This result can be understood from right to left as a series of C shapes;the width of each C represents the statistical distance between twosample groups in a multidimensional space (Figure 2). Even if the methodis unsupervised, it was capable of sorting the samples in correct groups incompliance with the description in the literature[33] except four samplesin two groups which relied on the behavior of the complex process ofthe petrogenesis rocks. The performance may be improved by choosinga higher truncation point by normalizing the data or by concatenationwith concentration data.
CONCLUSIONS
This article highlights the suitability of the EDXRF combined withchemometric techniques for the characterization of rock by distinguishingsubtle chemical differences between layers of the substratum. The simpli-city of sample preparation, versatility, and relatively fast determinationmake EDXRF an attractive alternative for the analysis of environmentalsamples. The combination of statistics and EDXRF allow the characteriza-tion based on a petrogenesis process. However, special care should be takento avoid the analysis of non-flat areas or presenting evident signs of physicalalteration on samples. This work will be employed to develop a databasefor mapping and regional exploration.
FIGURE 2 Dendrogram of cluster analysis obtained for rock samples according to their mineralcontent.
602 A. Traore et al.
Dow
nloa
ded
by [
A. T
raor
e] a
t 03:
45 2
3 Se
ptem
ber
2014
REFERENCES
1. Potts, P.J.; Olwen, W.T.; Webb, P.C. The Bulk Analysis of Silicate Rocks by Portable X-RayFluorescence: Effect of Sample Mineralogy in Relation to the Size of the Excited Volume. Geostand.Geoanalyt. Res. 1997, 21, 29–41.
2. Potts, P.J. A Handbook of Silicate Rock Analysis; Blackie: London, 1997.3. Borkhodoev, V.Y. Accuracy of the Fundamental Parameter Method for x-ray Fluorescence Analysis of
Rocks. X-ray Spectrom. 2002, 31, 209–218.4. Borkhodoev, V.Y. X-ray Fluorescence Analysis of Rocks by Fundamental Parameter Method. X-ray
Spectrom. 2002, 31, 278–279.5. Revenko, A.G. X-ray Fluorescence Analysis of Rocks, Soils and Sediments. X-ray Spectrom. 2002,
31, 264–273.6. Ramsey, M.H.; Potts, P.J.; Webb, P.C.; Watkins, P.; Watson, J.S.; Coles, B.J. An Objective Assessment of
Analytical Method Precision: Comparison of IC-AES and XRF for the Analysis of Silicate Rocks.Chem. Geol. 1994, 124, 1–19.
7. Cox, K.G.; Bell J.D.; Pankhurst, R.J. The Interpretation of Igneous Rocks; George Allen and Unwin:London, 1979.
8. Irvine, T.N.; Baragar, W.R.A. A Guide to the Chemical Classification of the Common Volcanic Rocks.Can. J. Earth Sci. 1971, 8, 523–548.
9. Miyashiro, A. Nature of Alkalic Volcanic Rock Series. Contrib. Mineral. Petrol. 1978, 66, 91–104.10. Middlemost, E.A.K. A Contribution to the Nomenclature and Classification of Volcanic Rocks.
Geol. Mag. 1980, 117, 51–57.11. Le Bas, M.J.; Le Maitre, R.W.; Streckeisen, A.; Zanettin, B. A Chemical Classification of Volcanic
Rocks Based on the Total Alkali-Silica Diagram. J. Petrol. 1986, 27, 745–750.12. Pearce, J.A.; Cann, J.R. Tectonic Setting Basic Volcanic Rocks Determined using Trace Element
Analyses. Earth Planet. Sci. Lett. 1973, 19, 290–300.13. Wood, D.A.; Joron, J.L.; Treuil, M. A Re-Appraisal of the Use of Trace Elements to Classify and
Discriminate between Magma Series Erupted in Different Tectonic Settings. Earth Planet. Sci. Lett.1979, 45, 326–336.
14. Mullen, E.D. MnO=TiO2=P2O5: A Minor Element Discriminant for Basaltic Rocks of OceanicEnvironments and its Implications for Petrogenesis. Earth Planet. Sci. Lett. 1983, 62, 53–62.
15. Dos Anjos, M.J.; Lopes, R.T.; De Jesus, E.F.O.; Asis, J.T.; Cesareo, R.; Barradas, C.A.A. QuantitativeAnalysis of Metals in Soil using X-ray Fluorescence. Spectrochimica Acta Part B Atom. Spectrosc. 2000,55, 1189–1194.
16. Potts, P.J.; West, M. Portable X-ray Fluorescence Spectrometry Capabilities for in situ Analysis.Roy. Soc. Chem. 2008.
17. Kaniu, M.I.; Angeyo, K.H.; Mangala, M.J.; Mwala, A.K.; Bartilol, S.K. Feasibility for ChemometricEnergy Dispersive X-ray Fluorescence and Scattering (EDXRFS) Spectroscopy Method for RapidSoil Quality Assessment. X-Ray Spectrom. 2011, 40, 432–440.
18. Thompson, M.; Walsh, J.N. A Handbook of Inductively Coupled Plasma Spectrometry; Blacky: Glasgow,1988.
19. Delor, C.; Coueffe, R.; Goujou, J.C.; Diallo, D.P.; Theveniaut, H.; Fullgraf, T.; Ndiaye, P.M.; Dioh, E.;Barry, T.M.M.; Metour, J. Le.; Martelet, G. Direction des Mines et de la Geologie; The Direction des Mineset de la Geologie: Dakar, 2010.
20. Goujou, J.C.; Buscail, F.; Theveniaut, H.; Dioh, E.; Delor, C.; Diallo, D.P.; Ndiaye, P.M.; Le Metour, J.;Fullgraf, T.; Caby, R.; Coueffe, R.; Martelet, G.; Villeneuve, M. Direction des Mines et de la Geologie;Dakar, 2010.
21. Fullgraf, T.; Ndiaye, P.M.; Blein, O.; Buscail, F.; Lahondere, D.; Le Metour, J.; Sergeev, S.; Tegyey, M.Silurian Magmatism in Eastern Senegal and its Significance for the Paleozoic Evolution ofNW-Gondwana. J. Afr. Earth Sci. 2013, 78, 66–85.
22. Lahondere, D.; Theveniaut, H.; Ndiaye, P.M.; Fullgraf, T.; Caby, R.; Blein, O.; Delor, C.; Diallo, D.P.;Dioh, E.; Goujou, J.C.; Buscail, F.; Le Metour, J.; Martelet, G.; Sergeev, S.; Tegyey, M.; Villeneuve, M.;Wemmer, K. Direction des Mines et de la Geologie; Dakar, 2010.
23. Sherman, J. A Theoretical Derivation of the Composition of Mixable Specimens from FluorescentX-ray Intensities. Adv. X-ray Anal. 1958, 1, 231–252.
X-Ray Fluorescence and Rocks Study 603
Dow
nloa
ded
by [
A. T
raor
e] a
t 03:
45 2
3 Se
ptem
ber
2014
24. Theveniaut, H.; Duvail, C.; Ndiaye, P.M.; Fullgraf, T.; Delor, C.; Goujou, J.C.; Buscail, F.; Diagne, E.Direction des Mines et de la Geologie; Dakar, 2010.
25. Markowick, A.A.; Grieken, V., Eds. Handbook of X-ray Spectrometry; Marcel Dekker, Inc.: New York,1993.
26. Bernasconi, G. Instruction Manual IAEA; International Atomic Energy Agency (IAEA): Vienna, 1996.27. Tull, C.R.; Ludewigt, B.A.; Lewak, D. Spectral Response of Multielement Silicon X-Ray Detectors.
IEEE Trans. Nucl. Sci. 1998, 45, 421–427.28. He, F.; Van Espen P. An Integrated System for Quantitative EDXRF Analysis based on
Fundamental Parameters. Nucl. Instrum. Meth. Phys. Res. Sec. A Acceler. Spectrom. Detect. Assoc. Equip.1990, 299, 580–583.
29. Custo, G.; Boeykens, S.; Cicerone, D.; Vazquez, C. Combined XRF Analysis and Chemometric Toolsfor a Preliminary Classification of Argentine Soils. X-ray Spectrom. 2002, 33, 132–135.
30. Brydegaard, M. Aspects of Optical Broad Band Spectroscopy And Information Extraction:Applications in Medecine And Ecology, thesis Lund University 2012.
31. Wold, S. Pattern Recognition by Means of Disjoint Principal Components Models. Patt. Recognit.1976, 8, 127–139.
32. Wold, S.; Esbensen, K.; Geladi, P. Principal Component Analysis. Chemometrics and Intelligent Labora-tory Systems. 1987, 2, 37–52.
33. Massart, D.L.; Kaufman, L. The Interpretation of Analytical Chemical Data by the Use of ClusterAnalysis; Wiley: New York, 1983, pp. 75–101.
604 A. Traore et al.
Dow
nloa
ded
by [
A. T
raor
e] a
t 03:
45 2
3 Se
ptem
ber
2014