Forest Invasibility in Communities in Southeastern New York
18
Forest invasibility in communities in southeastern New York Timothy G. Howard 1,3, *, Jessica Gurevitch 1 , Laura Hyatt 1,4 , Margaret Carreiro 2,5 & Manuel Lerdau 1 1 Department of Ecology and Evolution, State University of New York at Stony Brook, Stony Brook, NY 11794-5245, USA; 2 Louis Calder Center and Department of Biological Sciences, Fordham University, Armonk, NY 10504, USA; 3 Present Address: New York Natural Heritage Program, 625 Broadway, Albany, NY 12233-4757, USA; 4 Present Address: Rider University, Department of Biology, Science and Technology Center, Lawrenceville, NJ 08648, USA; 5 Present Address: Department of Biology, University of Louisville, Louisville, KY 40292, USA; *Author for correspondence (e-mail: [email protected]; fax: +1-518-402-8925) Received 3 March 2003; accepted in revised form 22 December 2003 Key words: calcium, community composition, exotic plants, invasion tolerance, invasive species, magnesium, nitrogen, plant community, soil resources, species richness Abstract While biological invasions have been the subject of considerable attention both historically and recently, the factors controlling the susceptibility of communities to plant invasions remain controversial. We sur- veyed 44 sites in southeastern New York State to examine the relationships between plant community characteristics, soil characteristics, and nonnative plant invasion. Soil nitrogen mineralization and nitrifi- cation rates were strongly related to the degree of site invasion (F ¼ 30.2, P < 0.0001 and F ¼ 11.8, P < 0.005, respectively), and leaf C : N ratios were negatively correlated with invasion (R 2 ¼ 0.22, P < 0.0001). More surprisingly, there was a strong positive relationship between soil calcium levels and the degree of site invasion (partial r ¼ 0.70, P < 0.01), and there were also positive relationships between invasion and soil magnesium and phosphorus. We found, in addition, a positive factor-ceiling relationship between native species diversity and invasive species diversity. This positive relationship between native and invasive diversity contradicts earlier hypotheses concerning the relationships between species diversity and invasion, but supports some recent findings. Cluster analysis distinguished two broad forest community types at our sites: pine barrens and mixed hardwood communities. Invaders were significantly more abundant in mixed hardwood than in pine barrens communities (Mann–Whitney U ¼ 682.5, P < 0.0001). Even when evaluating the mixed hardwood communities alone, invasion remained significantly positively correlated with soil fertility (calcium, magnesium, and net nitrogen min- eralization rates). Soil texture and pH were not useful predictors of the degree to which forests were invaded. Nitrogen and calcium are critical components of plant development, and species better able to take advantage of increased nutrient availability may out-perform others at sites with higher nutrient levels. These results have implications for areas such as the eastern United States, where anthropogenic changes in the availability of nitrogen and calcium are affecting many plant communities. Introduction Ecologists have studied biological invasions for many years (e.g. Elton 1958; Baker and Stebbins 1965), but recently there has been a great surge of interest in the topic (e.g. Baker et al. 1986; Drake 1989; Williamson 1996; Ricciardi et al. 2000). The study of conditions facilitating invasions and the Biological Invasions 6: 393–410, 2004. Ó 2004 Kluwer Academic Publishers. Printed in the Netherlands.
Transcript of Forest Invasibility in Communities in Southeastern New York

Forest invasibility in communities in southeastern New York
Timothy G. Howard1,3,*, Jessica Gurevitch1, Laura Hyatt1,4, Margaret Carreiro2,5
& Manuel Lerdau11Department of Ecology and Evolution, State University of New York at Stony Brook, Stony Brook, NY11794-5245, USA; 2Louis Calder Center and Department of Biological Sciences, Fordham University,Armonk, NY 10504, USA; 3Present Address: New York Natural Heritage Program, 625 Broadway,Albany, NY 12233-4757, USA; 4Present Address: Rider University, Department of Biology, Science andTechnology Center, Lawrenceville, NJ 08648, USA; 5Present Address: Department of Biology, Universityof Louisville, Louisville, KY 40292, USA; *Author for correspondence (e-mail: [email protected];fax: +1-518-402-8925)
Received 3 March 2003; accepted in revised form 22 December 2003
Key words: calcium, community composition, exotic plants, invasion tolerance, invasive species,magnesium, nitrogen, plant community, soil resources, species richness
Abstract
While biological invasions have been the subject of considerable attention both historically and recently,the factors controlling the susceptibility of communities to plant invasions remain controversial. We sur-veyed 44 sites in southeastern New York State to examine the relationships between plant communitycharacteristics, soil characteristics, and nonnative plant invasion. Soil nitrogen mineralization and nitrifi-cation rates were strongly related to the degree of site invasion (F ¼ 30.2, P < 0.0001 and F ¼ 11.8,P < 0.005, respectively), and leaf C : N ratios were negatively correlated with invasion (R2 ¼ 0.22,P < 0.0001). More surprisingly, there was a strong positive relationship between soil calcium levels andthe degree of site invasion (partial r ¼ 0.70, P < 0.01), and there were also positive relationshipsbetween invasion and soil magnesium and phosphorus. We found, in addition, a positive factor-ceilingrelationship between native species diversity and invasive species diversity. This positive relationshipbetween native and invasive diversity contradicts earlier hypotheses concerning the relationships betweenspecies diversity and invasion, but supports some recent findings. Cluster analysis distinguished twobroad forest community types at our sites: pine barrens and mixed hardwood communities. Invaderswere significantly more abundant in mixed hardwood than in pine barrens communities (Mann–WhitneyU ¼ 682.5, P < 0.0001). Even when evaluating the mixed hardwood communities alone, invasionremained significantly positively correlated with soil fertility (calcium, magnesium, and net nitrogen min-eralization rates). Soil texture and pH were not useful predictors of the degree to which forests wereinvaded. Nitrogen and calcium are critical components of plant development, and species better able totake advantage of increased nutrient availability may out-perform others at sites with higher nutrientlevels. These results have implications for areas such as the eastern United States, where anthropogenicchanges in the availability of nitrogen and calcium are affecting many plant communities.
Introduction
Ecologists have studied biological invasions formany years (e.g. Elton 1958; Baker and Stebbins
1965), but recently there has been a great surge ofinterest in the topic (e.g. Baker et al. 1986; Drake1989; Williamson 1996; Ricciardi et al. 2000). Thestudy of conditions facilitating invasions and the
Biological Invasions 6: 393–410, 2004.
� 2004 Kluwer Academic Publishers. Printed in the Netherlands.

consequences of invasion offer insight into funda-mental questions in ecology and evolution (e.g.Vitousek et al. 1987; Vitousek 1990; Crawleyet al. 1999), and is of great practical importancein providing a better understanding of the threatto ecological communities. While case studies ofparticular exotic species that elucidate the charac-teristics of successful invaders are critical (e.g.Higgins and Richardson 1996; Rejmanek andRichardson 1996), it is also equally important todetermine why some communities appear moresusceptible to invasion than others.
In his classic study reviewing invasions byplants and animals, Elton (1958) suggested invad-ers were most likely to establish viable popula-tions in disturbed and species-poor communitiesdue to the potential increase in unoccupied nichespace. Yet, evidence as to whether less diversecommunities are more vulnerable to invasionremains limited and contradictory (e.g. Pimmand Lawton 1991; Robinson et al. 1995). In arecent review, Levine and D’Antonio (1999) eval-uated data and theory linking diversity and bio-logical invasions. They found that both classicaland recent theory predicted that higher diversitycommunities would be more resistant to invasion.While a few experimental and descriptive studiessupport this predicted relationship (e.g. Tilmanet al. 1997; Symstad 2000; Dukes 2002), Levineand D’Antonio (1999) found other empiricalstudies reported that the most diverse plant com-munities were more likely to be invaded at bothsmall and large scales.
In a study of the relationship between plantspecies richness and invasion over a range of spa-tial scales and across a wide range of plant com-munity types (including forests, meadows,grasslands, and others), Stohlgren et al. (1999)concluded that exotic species primarily invadedareas of high species richness. Lonsdale (1999)also found a positive relationship on a landscapescale between degree of invasion and native spe-cies richness in a survey of 184 sites distributedglobally. Workers in systems as diverse as theSouth African fynbos, New Zealand mountainbeech forests, and North American Great Plainsgrasslands have also found a positive relationshipbetween native species richness and invasibilityby exotics (Higgins et al. 1996; Wiser et al. 1998;Smith and Knapp 1999).
Patterns of invasibility may be determined bythe particular characteristics of the resident plantspecies (Crawley et al. 1999), habitat diversity(Lonsdale 1999), or by the extent to which com-munity composition is driven by immigration vsextinction (Brown and Peet 2003). While somepatterns are beginning to emerge, the general pat-terns underlying these relationships and theircauses are not yet well understood. Severalauthors (Levine and D’Antonio 1999; Stohlgrenet al. 1999) have attributed positive relationshipsbetween diversity and invasibility to an indirectrelationship between diversity and resource avail-ability rather than to the direct effects of diver-sity in facilitating invasion.
However, little is known about the effects ofvariation in resources on invasibility, eitherwithin specific communities or more generally. Ina comparison of riparian and uplands vegetationin Great Plains grasslands, Stohlgren et al. (1998)showed that there were positive associationsbetween exotic plant richness and cover and soilpercent silt, as well as between exotic speciesrichness and soil nitrogen; productive andspecies-rich riparian zones were most susceptibleto invasion by exotic plants. Kalkhan andStohlgren (2000) reported positive associationsbetween exotic species presence and abundanceand soil texture (silt and clay) and nitrogenwithin Rocky Mountain National Park. Wooand Zedler (2002) reported increased invasion byexotic plants in wetlands experiencing anthropo-genic increases in fertility. The spread of exoticsin the nutrient-poor California serpentine barrensis slower than in more fertile oak woodlands(Williamson and Harrison 2002), and increasingnutrient availability in the barrens increases thesuccess of invasive species (Huenneke et al.1990). Such effects may be complex: disturbanceand increased resource availability may interactto increase the probability of invasion success ata site (e.g. Meekins and McCarthy 2001; Wil-liamson and Harrison 2002). Yet, soil resourcesare not always linked to invasive success (e.g.Morrison and Molofsky 1998) and when theyare, it is unclear which resources play the largestrole in influencing the susceptibility of differentcommunities to invasion.
The purpose of the present study was to exam-ine patterns of invasion both within and among
394

broad forest community types but within a singlegeographical region, to determine what factorswere most closely associated with the success ofinvasive plants. The forests we studied werelocated in southeastern New York State, USA,with sites differing in many biotic and abioticcharacteristics and ranging from heavily invadedto essentially containing only native species.Based upon initial observations, we hypothesizedthat plant invasions by exotic species would begreatest in higher diversity hardwood forests, andlower in species-poor pine barrens. We furtherhypothesized that invasion by exotic specieswould be limited by the acidic, low nutrient,sandy soils of the pine barrens, and facilitated bythe more fertile soils of the hardwood forests. Inparticular, we expected that the degree of inva-sion would be positively associated with soilnitrogen and pH, and negatively associated withsoil percent sand. To test these hypotheses andelucidate more general relationships betweeninvasion and biotic and abiotic environmentalfactors, we examined both plant community(diversity and species membership) and soil
characteristics (litter depth, pH, nitrogen, cal-cium, magnesium, cation exchange capacity,phosphorus, and soil texture). We analyzed theserelationships to determine the extent to whichthese factors were associated with the degree ofplant community invasion by exotic plant speciesas a basis for future experimental tests of theserelationships.
Materials and methods
Site selection
We surveyed community composition and soilcharacteristics at 44 sites in southeastern NewYork State (Suffolk and Westchester Counties,which are separated by Long Island Sound;Figure 1). Forest preserves are limited and tendto be small and highly fragmented in the subur-banized landscape of the New York City metro-politan region. Site choice was based upon bothavailability and to span a range of dominant veg-etation and magnitude of invasion by nonnative
Figure 1. Southeastern New York State (USA) showing the 44 sites of this survey. Circles indicate sites with little presence of inva-
sive species, triangles show sites with invasive species present.
395
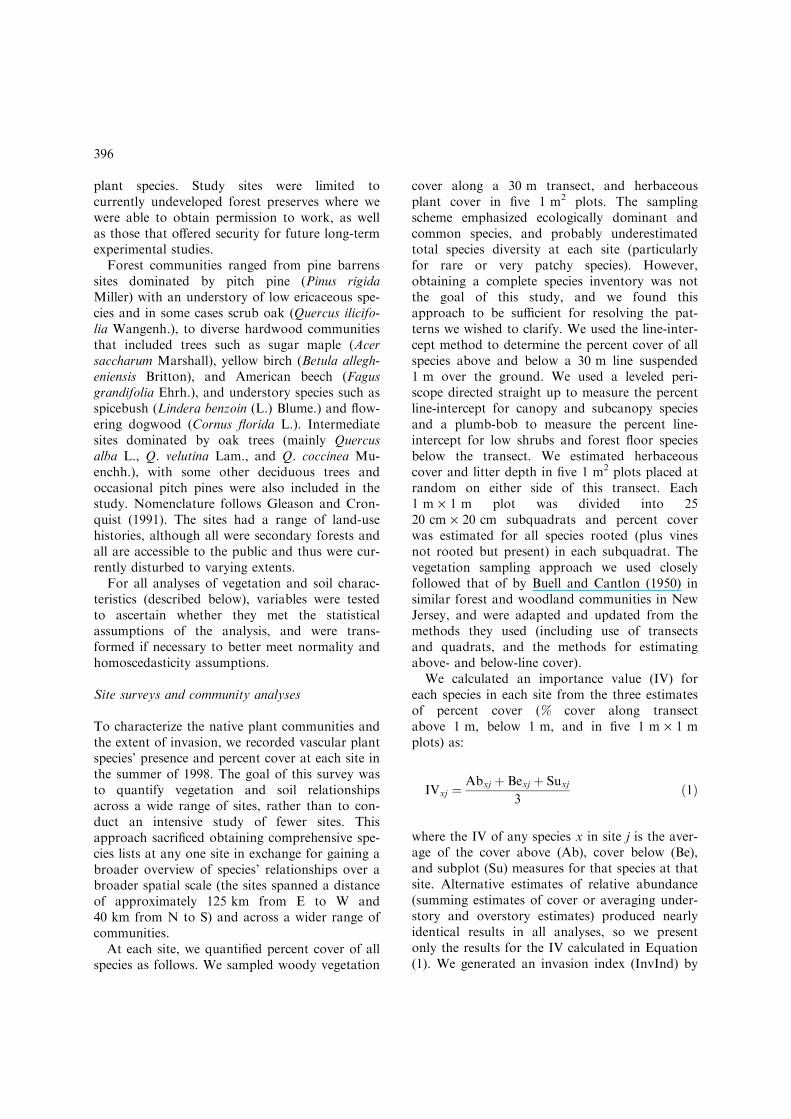
plant species. Study sites were limited tocurrently undeveloped forest preserves where wewere able to obtain permission to work, as wellas those that offered security for future long-termexperimental studies.
Forest communities ranged from pine barrenssites dominated by pitch pine (Pinus rigidaMiller) with an understory of low ericaceous spe-cies and in some cases scrub oak (Quercus ilicifo-lia Wangenh.), to diverse hardwood communitiesthat included trees such as sugar maple (Acersaccharum Marshall), yellow birch (Betula allegh-eniensis Britton), and American beech (Fagusgrandifolia Ehrh.), and understory species such asspicebush (Lindera benzoin (L.) Blume.) and flow-ering dogwood (Cornus florida L.). Intermediatesites dominated by oak trees (mainly Quercusalba L., Q. velutina Lam., and Q. coccinea Mu-enchh.), with some other deciduous trees andoccasional pitch pines were also included in thestudy. Nomenclature follows Gleason and Cron-quist (1991). The sites had a range of land-usehistories, although all were secondary forests andall are accessible to the public and thus were cur-rently disturbed to varying extents.
For all analyses of vegetation and soil charac-teristics (described below), variables were testedto ascertain whether they met the statisticalassumptions of the analysis, and were trans-formed if necessary to better meet normality andhomoscedasticity assumptions.
Site surveys and community analyses
To characterize the native plant communities andthe extent of invasion, we recorded vascular plantspecies’ presence and percent cover at each site inthe summer of 1998. The goal of this survey wasto quantify vegetation and soil relationshipsacross a wide range of sites, rather than to con-duct an intensive study of fewer sites. Thisapproach sacrificed obtaining comprehensive spe-cies lists at any one site in exchange for gaining abroader overview of species’ relationships over abroader spatial scale (the sites spanned a distanceof approximately 125 km from E to W and40 km from N to S) and across a wider range ofcommunities.
At each site, we quantified percent cover of allspecies as follows. We sampled woody vegetation
cover along a 30 m transect, and herbaceousplant cover in five 1 m2 plots. The samplingscheme emphasized ecologically dominant andcommon species, and probably underestimatedtotal species diversity at each site (particularlyfor rare or very patchy species). However,obtaining a complete species inventory was notthe goal of this study, and we found thisapproach to be sufficient for resolving the pat-terns we wished to clarify. We used the line-inter-cept method to determine the percent cover of allspecies above and below a 30 m line suspended1 m over the ground. We used a leveled peri-scope directed straight up to measure the percentline-intercept for canopy and subcanopy speciesand a plumb-bob to measure the percent line-intercept for low shrubs and forest floor speciesbelow the transect. We estimated herbaceouscover and litter depth in five 1 m2 plots placed atrandom on either side of this transect. Each1 m · 1 m plot was divided into 2520 cm · 20 cm subquadrats and percent coverwas estimated for all species rooted (plus vinesnot rooted but present) in each subquadrat. Thevegetation sampling approach we used closelyfollowed that of by Buell and Cantlon (1950) insimilar forest and woodland communities in NewJersey, and were adapted and updated from themethods they used (including use of transectsand quadrats, and the methods for estimatingabove- and below-line cover).
We calculated an importance value (IV) foreach species in each site from the three estimatesof percent cover (% cover along transectabove 1 m, below 1 m, and in five 1 m · 1 mplots) as:
IVxj ¼Abxj þ Bexj þ Suxj
3ð1Þ
where the IV of any species x in site j is the aver-age of the cover above (Ab), cover below (Be),and subplot (Su) measures for that species at thatsite. Alternative estimates of relative abundance(summing estimates of cover or averaging under-story and overstory estimates) produced nearlyidentical results in all analyses, so we presentonly the results for the IV calculated in Equation(1). We generated an invasion index (InvInd) by
396

averaging the proportion of total percent coverfor all nonnative species:
InvIndj ¼
PAbijPABtj
þP
BeijPBetj
þP
SuijPSutj
3ð2Þ
where InvIndj is the index of invasion by allnonnative species at site j; i and t represent thenonnative and the complete native and nonnativespecies pool present at that site, respectively.Although not all of the nonnative species pres-ent are actually invasive, the invasive speciesaccount for most of the cover of nonnativeplants in these forests, so for convenience we donot distinguish between invasive and noninvasivealien species.
We had no a priori natural community typesassigned to each site, nor the total number ofplant communities described by the 44 sites. Weused cluster analysis to divide our sites intogroups of similar species associations (usingPC-ORD software: v3.0; MJM software, Glene-den Beach, Oregon). We used both agglomerativeclustering (euclidean distance, Ward’s method)and divisive clustering (TWINSPAN).
We examined differences in the magnitude ofinvasion among the resulting plant associationsidentified by the cluster analyses with the non-parametric Mann–Whitney U test. We usedquantile regression analysis to evaluate the rela-tionship between the species richness and diver-sity (using the Shannon index of diversity) ofinvasive species and several other variables,including native species richness and diversity(ln-transformed at times for a better fit). Quantileregression is an extension of classical leastsquares regression. Unlike ordinary least squaresregression, which emphasizes relationships at thecenter of response distributions, quantile regres-sion can be used to examine relationships at anyquantile, including estimating those along theupper bounds of the data (Koenker and Bassett1978; Cade et al. 1999; Koenker and Hallock2001). This was particularly useful for analyzingthe relationships between invasive and native spe-cies diversity and other factors: we wished toexamine the effects of particular limiting factors,while the existence of other unmeasured factorscould create ‘envelope effects’ or triangular
distributions of the data. The quantile regressionanalysis was carried out using the R softwareplatform (The R development team Æhttp://www.R-project.orgæ) with the Quantreg package(Koenker 2002).
Litter and soil mineral components
To estimate soil quality and nutrient availabilitywe collected 12 soil cores (2 cm diameter · 18 cmdepth) randomly located within a central10 m · 10 m region of the transect at each site.After air-drying, the soil samples were bulkedinto a single sample for each site and sent to theUniversity of California Division of Agricultureand Natural Resources Analytical Laboratoryfor analysis of pH, calcium, magnesium, cationexchange capacity (CEC), Bray-phosphorus, andsoil texture (% sand, % silt, % clay). Because thethree soil texture components are not indepen-dent, and % sand varied most among sites ofthese three variables, we use % sand to representtexture. For chemical analyses, the lab created asaturated paste and estimated pH with a pHmeter, soluble calcium and magnesium by induc-tively coupled plasmic atomic emission spectro-metry, extractable phosphate using a dilute acid-fluoride extractant, and the cation exchangecapacity by barium acetate saturation and cal-cium replacement (DANR Analytical lab meth-ods of soil analysis, version 04/07/1998). Allanalyses using these soils data are based on 43sites; one set of soil samples was lost prior toanalysis.
In order to determine whether the groups elic-ited by the cluster analyses on vegetation(described above) differed in soil properties, wefirst compared the values for soil variablesbetween these groups. We used multivariate anal-ysis of variance (MANOVA; Scheiner 1993) toexamine how litter depth, pH, Ca, Mg, CEC, P,and % sand differed between the two groups ofsites elicited by the classification analysis on thevegetation. To improve the fit to normality andhomoscedasticity we transformed the values forCa, Mg, CEC, and P using the Box–Cox trans-formation (Sokal and Rohlf 1995); pH, litterdepth, and % sand met the assumptions of theanalyses fairly well and were not transformed.We also compared the correlations between the
397
magnitude of invasion at each site to these soilvariables. To test the correlation between eachfactor and invasion magnitude while the othervariables are kept constant (Sokal and Rohlf1995), we compared the partial correlation foreach variable to the magnitude of invasion, bothamong all sites and within the group of sites hav-ing the highest range of invasion.
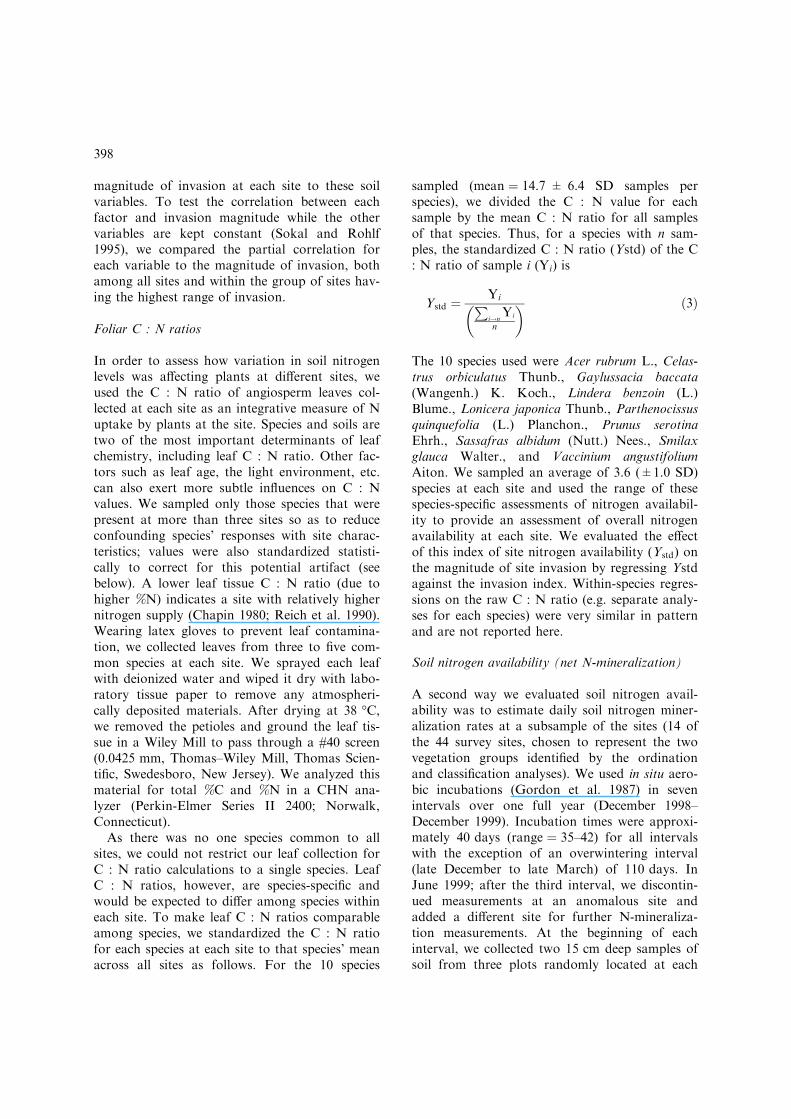
Foliar C : N ratios
In order to assess how variation in soil nitrogenlevels was affecting plants at different sites, weused the C : N ratio of angiosperm leaves col-lected at each site as an integrative measure of Nuptake by plants at the site. Species and soils aretwo of the most important determinants of leafchemistry, including leaf C : N ratio. Other fac-tors such as leaf age, the light environment, etc.can also exert more subtle influences on C : Nvalues. We sampled only those species that werepresent at more than three sites so as to reduceconfounding species’ responses with site charac-teristics; values were also standardized statisti-cally to correct for this potential artifact (seebelow). A lower leaf tissue C : N ratio (due tohigher %N) indicates a site with relatively highernitrogen supply (Chapin 1980; Reich et al. 1990).Wearing latex gloves to prevent leaf contamina-tion, we collected leaves from three to five com-mon species at each site. We sprayed each leafwith deionized water and wiped it dry with labo-ratory tissue paper to remove any atmospheri-cally deposited materials. After drying at 38 �C,we removed the petioles and ground the leaf tis-sue in a Wiley Mill to pass through a #40 screen(0.0425 mm, Thomas–Wiley Mill, Thomas Scien-tific, Swedesboro, New Jersey). We analyzed thismaterial for total %C and %N in a CHN ana-lyzer (Perkin-Elmer Series II 2400; Norwalk,Connecticut).
As there was no one species common to allsites, we could not restrict our leaf collection forC : N ratio calculations to a single species. LeafC : N ratios, however, are species-specific andwould be expected to differ among species withineach site. To make leaf C : N ratios comparableamong species, we standardized the C : N ratiofor each species at each site to that species’ meanacross all sites as follows. For the 10 species
sampled (mean ¼ 14.7 ± 6.4 SD samples perspecies), we divided the C : N value for eachsample by the mean C : N ratio for all samplesof that species. Thus, for a species with n sam-ples, the standardized C : N ratio (Ystd) of the C: N ratio of sample i (Yi) is
Ystd ¼ YiPi!n
Yi
n
� � ð3Þ
The 10 species used were Acer rubrum L., Celas-trus orbiculatus Thunb., Gaylussacia baccata(Wangenh.) K. Koch., Lindera benzoin (L.)Blume., Lonicera japonica Thunb., Parthenocissusquinquefolia (L.) Planchon., Prunus serotinaEhrh., Sassafras albidum (Nutt.) Nees., Smilaxglauca Walter., and Vaccinium angustifoliumAiton. We sampled an average of 3.6 (±1.0 SD)species at each site and used the range of thesespecies-specific assessments of nitrogen availabil-ity to provide an assessment of overall nitrogenavailability at each site. We evaluated the effectof this index of site nitrogen availability (Ystd) onthe magnitude of site invasion by regressing Ystdagainst the invasion index. Within-species regres-sions on the raw C : N ratio (e.g. separate analy-ses for each species) were very similar in patternand are not reported here.
Soil nitrogen availability (net N-mineralization)
A second way we evaluated soil nitrogen avail-ability was to estimate daily soil nitrogen miner-alization rates at a subsample of the sites (14 ofthe 44 survey sites, chosen to represent the twovegetation groups identified by the ordinationand classification analyses). We used in situ aero-bic incubations (Gordon et al. 1987) in sevenintervals over one full year (December 1998–December 1999). Incubation times were approxi-mately 40 days (range ¼ 35–42) for all intervalswith the exception of an overwintering interval(late December to late March) of 110 days. InJune 1999; after the third interval, we discontin-ued measurements at an anomalous site andadded a different site for further N-mineraliza-tion measurements. At the beginning of eachinterval, we collected two 15 cm deep samples ofsoil from three plots randomly located at each
398

site. Each sample was placed in a13 cm · 20 cm · 0.050 mm thick polyethylenebag (Fisher Scientific, Chicago, Illinois); one wastransferred directly to an insulated cold chest fortransport to the lab; the other sample was buriedback into the ground for incubation. Once trans-ported, all samples were stored at 4 �C andextracted within 72 h. In the lab, we firstremoved large debris (large roots and stones) bypassing all the soil through a 4 mm sieve. Wedetermined the water content of each fresh sam-ple by drying a 10 g subsample at 105 �C for48 h, and the ash-free dry weight by combustingall organic matter in each dried sample at 500 �Cfor 4 h. Inorganic N (NHþ
4 -N + NO�3 -N) was
extracted from a separate sample (10 g) of freshsoil with 30 ml 2 M KCl. Samples were shakenfor 1 h on an Eberbach shaker (Ann Arbor,Michigan), filtered through Whatman no. 42 fil-ter paper, acidified to pH 2 with 0.2 ml 6N HClto preserve the sample, and stored at 4 �C untilthey were analyzed. Incubated soil samples wereextracted similarly.
Soil extracts were analyzed on a TrAAcs 800nutrient autoanalyzer (Bran-Luebbe Inc., BuffaloGrove, Illinois). Nitrate concentrations weredetermined using the sulfanilamide method(Bran-Luebbe Analyzing Technologies 1986b).Ammonium was quantified using the salicylate–nitroprusside method (Bran-Luebbe AnalyzingTechnologies 1986a). We defined net nitrificationas the difference in NO�
3 -N before and after thesoil incubation, and net N-mineralization orimmobilization as the difference (plus or minusvalues, respectively) between inorganic N (NHþ
4 -N + NO�
3 -N) extracted before and after theincubation.
We obtained the net N and net NO�3 -N miner-
alized over each incubation period at each site,and then calculated the mean daily nitrificationand net nitrogen mineralization rate for each siteand incubation period. We examined the differ-ences between pine barrens and mixed hardwoodsites over the year with repeated measuresANOVA. We also combined the incubation peri-ods to obtain net N and NO�
3 -N mineralizedover the entire year to calculate mean daily min-eralization for each site for the entire year. Weused these values in tests of correlation with themagnitude of invasion.
Results
Patterns of invasion
The maximum values for diversity and richnessof nonnative species increased with the diversityand species richness of native species: there is apositive relationship between native species diver-sity and richness and a ‘ceiling’ on the diversityand richness of invasive species (called a factor-ceiling distribution, Thomson et al. 1996; or anenvelope effect, Goldberg 1987; Firbank andWatkinson 1987) (Figure 2). The regression forthe 90th quantiles for diversity and richness werestatistically significant (Shannon–Weiner diver-sity; slope ¼ 1.09, SE ¼ 0.48, P ¼ 0.029, richness;slope ¼ 3.63, SE ¼ 1.61, P ¼ 0.029).
This pattern also held when we examined onlyvines, which were the most common functionalgroup of invasives (Figure 3). The upper limit(90th quantile) to nonnative vine diversity wassignificantly positively correlated with native vinediversity (slope ¼ 0.09, SE ¼ 0.038, P ¼ 0.015).This may be because sites were either favorableplaces for vines or not, and thus native and inva-sive species responded similarly to those favor-able site characteristics.
Nonnative species were present in 26 of the 44sites. We recorded a total of 76 species across allsites, 17 of which were non-native (Table 1 listsnonnative species found in this study). Withininvaded sites, the magnitude of invasion rangedfrom 46% cover represented by nonnatives to lessthan 1%, comprising only one or two smallindividuals along the entire 30 m transect. Noone invasive species accounted for a largeproportion of the cover at a site: the highest IVwas less than 20% cover, and most of thenon-native species represented less than 10%of site cover in those sites in which they werefound. Thus, the patterns of invasion that wereport on appear more to represent the collectivebehavior of this group of invasive speciestogether, rather than being dominated by thecharacteristics of particular invaders. Invadedand uninvaded sites were spread spatiallythroughout the study region (Figure 1), suggest-ing no single regionally dominant spatial effectsuch as a single source or disturbance event onthe level of invasion.
399

Classification of the vegetation data revealedthat the two largest groups of sites formed themost consistent and strongest grouping. The finaltwo groups formed by agglomerative clusteranalysis had a large separation distance and wereidentical to the first division of the divisive clus-tering procedure (TWINSPAN). Clustering wasnearly identical when the invasive species wereremoved from the dataset, indicating the inva-sives were not driving the patterns of groupingamong sites. Ordination of the data using NMS(unpublished) confirmed these patterns, demon-strating very similar results. Hereafter, we refer
to the group of sites distinguished by high abun-dance of pine barrens species as pine barrenssites, and the second cluster of sites as mixedhardwood forest sites. Sites initially considered‘intermediate’ in composition with many treeoaks but few pitch pines usually had a heathunderstory and most often grouped with the pinebarrens sites.
The two forest types differed strongly in themagnitude of invasion. All pine barrens sitesshowed extremely low levels of invasion (themean invasion index (InvInd), indicating the pro-portion of nonnative species in the pine barrens
Richness, native species
0 2 4 6 8 10 12 14 16 18 20 22
Ric
hnes
s, n
on-n
ativ
e sp
ecie
s
0
2
4
6
8
10
Diversity, native species
1.2 1.6 2.0 2.4 2.8 3.2 3.6
Div
ersi
ty, n
on-n
ativ
e sp
ecie
s
0.0
0.4
0.8
1.2
1.6
2.0
2.4a.
b.
Figure 2. The relationship between native and invasive species diversity (using the Shannon index, a), and richness (b). The regres-
sion for the 90th quantile is shown for each graph. Native species richness was ln-transformed before evaluating its 90th quantile –
these data are back-transformed here. Each point represents one of the 44 sites. In (b), overlapping points are jittered for clarity
only.
400

sites was 0.002 ± SE 0.001) while the mixedhardwood forest sites showed a wide range in thelevels of invasion, varying from 0% to 46% coverrepresented by nonnative species (meanInvInd ¼ 0.15 ± 0.033). The mean InvInd dif-fered significantly between the two groups repre-senting pine barrens and mixed hardwood sites(Mann–Whitney U ¼ 682.5, P < 0.0001).
The degree of invasion was not correlated witheither maximum tree height or total basal area oftrees, suggesting that forests with small or youngtrees were neither more or less likely to beinvaded than those with more mature trees (therelationships between invasion and tree heightand total basal area were not statistically signifi-cant). This was true whether all sites were consid-ered together, or whether hardwood forest siteswere considered by themselves. Thus, other fac-tors appear to be more important in this systemin determining the invasibility of the forest sitesthan the sizes of the trees (and presumably thanthe maturity of the forest).
Soil and site properties – all sites
The pine barrens sites also differed greatly fromthe mixed hardwood sites in overall litter and soilmineral constituents based upon MANOVA(P < 0.0001, n ¼ 43, Table 2). The first eigenvec-tor identified in the MANOVA explained 58.7%of the total variation ( ¼ squared canonical cor-relation) and 100% of the explainable variation
(¼1st characteristic root). Calcium levelsexplained most of the variation among sites, withcation exchange capacity and litter depth havingthe next largest influences on the overall differ-ences among sites. Percent sand, pH and magne-sium levels were responsible for little of thevariation among the two community types(Table 2).
The soil factors most strongly associated withinvasion across all sites (Table 3) were calciumand nitrogen, both of which were positively asso-ciated with invasion. Other factors significantlypositively correlated with invasion were magne-sium and phosphorus, while litter depth was sig-nificantly negatively related to invasion. Partialcorrelations confirm that calcium (r ¼ 0.70),phosphorus (r ¼ 0.3) and nitrogen (r ¼ 0.83) andmagnesium (r ¼ 0.49) were correlated with inva-sion magnitude at each site when all other vari-ables were held constant (Table 3). Soil texture(represented by % sand) and cation exchangecapacity were poorly correlated with invasion.Soil pH was very low in all sites, and surpris-ingly, did not account for differences betweenpine barrens and mixed hardwood forests(Table 2), nor was it strongly related to invasion(Table 3).
The greatest variation in soil texture amongsites was in % sand and silt (Figure 4). All siteshad consistently low values of clay. Pine barrenswere found on sites with a very wide range ofsoil textures, ranging from the most to the least
Diversity, native vines
0.0 0.1 0.2 0.3 0.4 0.5 0.6 0.7 0.8
Div
ersi
ty, n
on-n
ativ
e vi
nes
0.0
0.1
0.2
0.3
0.4
0.5
0.6
0.7
Figure 3. The relationship between the diversity (Shannon index value) of native and invasive vines for sites that had vines present.
The regression for the 90th quantile (with native vine diversity back-transformed from ln-transformed regression data) is indicated.
401

Table 1. Nonnative species found in 44 surveyed sites in southern New York.
Species Habit Freq. IV
Ailanthus altissima (Miller) Swingle. Tree 2 0.004
Alliaria petiolata (Bieb.) Cavara & Grande. Biennial forb 7 0.020
Ampelopsis brevipundiculata (Maxim.) Trautv. Woody vine 2 0.013
Berberis thunbergii DC. Shrub 4 0.041
Celastrus orbiculatus Thunb. Woody vine 17 0.064
Elaeagnus umbellata Thunb. Shrub 1 0.021
Euonymous atropurpureus Jacq. Shrub 4 0.020
Ligustrum vulgare L. Shrub 1 0.043
Lonicera japonica Thunb. Woody vine 14 0.068
Lonicera tartarica L. Shrub 5 0.051
Lysimachia vulgaris L. Forb 2 0.006
Morus alba L. Tree 3 0.001
Prunus avium L. Tree 2 0.030
Rhamnus frangula L. Tall shrub 2 0.199
Robinia pseudoacacia L. Tree 4 0.094
Rosa multiflora Thunb. Shrub 6 0.025
Taraxacum officinale Weber. Forb 1 0.001
Growth form (habit), number of sites in which the species was found (frequency), and the mean abundance (IV; Equation (1))
across only those sites in which it is found are indicated.
Table 2. Multivariate analysis of variance among pine barrens sites (PB; n = 21) and mixed hardwood sites (MH; n = 22) with lit-
ter depth, soil pH, calcium, phosphorus, magnesium, cation exchange capacity, and percent sand as the dependent variables.
Statistic Value F df
(A)
Wilks Lambda 0.41 7.12* 7
Pillai’s Trace 0.59 7.12* 7
Hotelling–Lawley Trace 1.42 7.12* 7
Roy’s Greatest Root 1.42 7.12* 7
(B)
Variable Standardized canonical coefficients
Litter )0.35pH 0.19
Ca 0.97
Mg 0.14
CEC 0.72
P 0.27
% Sand 0.22
(C)
Variable PB MH
Litter 4.00 (±0.32) 2.64 (±0.28)
pH 3.38 (±0.05) 3.53 (±0.04)
Ca 0.21 (±0.02) 1.00 (±0.17)
Mg 0.43 (±0.13) 0.90 (±0.13)
CEC 11.35 (±0.68) 14.46 (±0.90)
P 8.15 (±1.14) 23.81 (±6.97)
% Sand 75.59 (±2.51) 70.14 (±2.57)
(A) The overall test among the two groups of sites. (B) The relative contribution of each variable (the standardized canonical coef-
ficients) to the overall differences among sites. Opposite signs indicate a negative correlation across groups, larger values indicate a
larger contribution to the overall differences among groups. (C) The means for each variable (±1 standard error) calculated from
untransformed data, provided here for visual comparison of the differences among variables and site types.
*P < 0.0001.
402
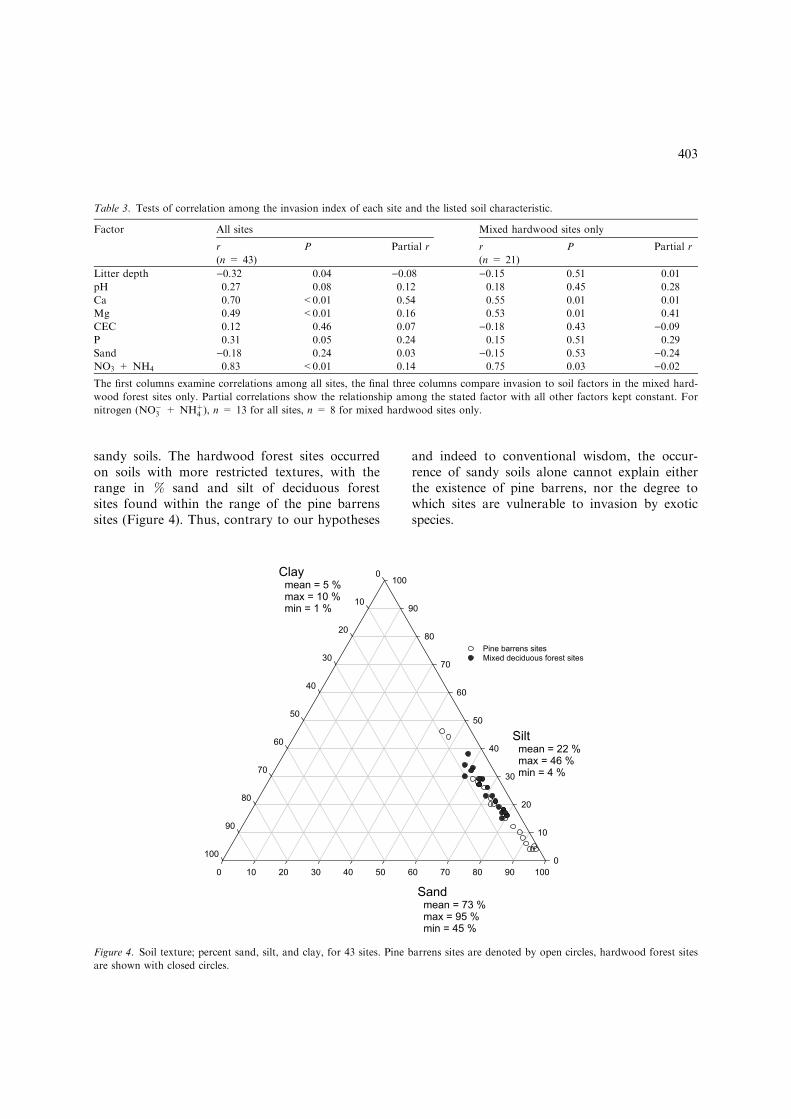
sandy soils. The hardwood forest sites occurredon soils with more restricted textures, with therange in % sand and silt of deciduous forestsites found within the range of the pine barrenssites (Figure 4). Thus, contrary to our hypotheses
and indeed to conventional wisdom, the occur-rence of sandy soils alone cannot explain eitherthe existence of pine barrens, nor the degree towhich sites are vulnerable to invasion by exoticspecies.
Table 3. Tests of correlation among the invasion index of each site and the listed soil characteristic.
Factor All sites Mixed hardwood sites only
r P Partial r r P Partial r
(n = 43) (n = 21)
Litter depth )0.32 0.04 )0.08 )0.15 0.51 0.01
pH 0.27 0.08 0.12 0.18 0.45 0.28
Ca 0.70 <0.01 0.54 0.55 0.01 0.01
Mg 0.49 <0.01 0.16 0.53 0.01 0.41
CEC 0.12 0.46 0.07 )0.18 0.43 )0.09P 0.31 0.05 0.24 0.15 0.51 0.29
Sand )0.18 0.24 0.03 )0.15 0.53 )0.24NO3 + NH4 0.83 <0.01 0.14 0.75 0.03 )0.02
The first columns examine correlations among all sites, the final three columns compare invasion to soil factors in the mixed hard-
wood forest sites only. Partial correlations show the relationship among the stated factor with all other factors kept constant. For
nitrogen (NO�3 + NHþ
4 ), n = 13 for all sites, n = 8 for mixed hardwood sites only.
Sand mean = 73 % max = 95 % min = 45 %
0 10 20 30 40 50 60 70 80 90 100
Silt mean = 22 % max = 46 % min = 4 %
0
10
20
30
40
50
60
70
80
90
100Clay mean = 5 % max = 10 % min = 1 %
0
10
20
30
40
50
60
70
80
90
100
Pine barrens sitesMixed deciduous forest sites
Figure 4. Soil texture; percent sand, silt, and clay, for 43 sites. Pine barrens sites are denoted by open circles, hardwood forest sites
are shown with closed circles.
403

Soil and site properties – mixed hardwood sitesonly
We also examined the correlations between inva-sion and these environmental variables within themixed hardwood sites alone, which ranged fromheavily invaded to almost uninvaded. Strikingly,the patterns of correlation were similar to thoseacross all sites when the analysis was restricted tothe mixed hardwood sites alone. Nitrogen, cal-cium, and magnesium showed the strongest (andonly significant) correlations with invasion(r ¼ 0.75, 0.55, and 0.52, respectively), whilemagnesium showed the strongest partial correla-tion in these hardwood forest sites (Table 3).Thus, the link between these aspects of soil fertil-ity and the degree to which a forest was invadedoccurred both within the richer mixed hardwoodforest sites as well as when a wide range of foresttypes was considered.
Nitrogen availability
The standardized leaf C : N was negativelyrelated to the extent of site invasion (R2 ¼ 0.22,P < 0.0001). Thus, sites in which plants took upless nitrogen (as indicated by leaf C : N ratios)generally had lower levels of invasion (Figure 5).That we were able to discern such a clear rela-tionship between C : N ratios and site invasion,despite the many other factors that can influenceleaf chemistry, confirms the importance of the
relationship between N availability and invasionin this study.
Daily net N-mineralization rates (combined netNO�
3 -N + NHþ4 -N production) were lower in the
pine barrens sites than in the deciduous forests atall times of the year (significant site type effect,Table 4), and this pattern was consistent through-out the year (no site type · date interaction,Table 4, Figure 6). Mean daily N-mineralizationrates were highest through the late summer andlowest in the winter months. Mean daily nitrifica-tion (NO�
3 -N) rates were substantially lower inthe pine barrens sites compared to the hardwoodforest sites (significant site type effect, Table 4).Nitrification rates in the pine barrens sites chan-ged little over the year, while nitrificationincreased greatly in the late summer and fall inthe mixed hardwood forest sites (significant sitetype · date interaction, Table 4; Figure 6). Thesignificant effect of site (nested within site type)on nitrification rate indicates strong differences innitrate production at the individual sites, and thesignificant effect of date for both analyses indi-cates a significant overall change in productionover the course of the seasons (Table 4).
Discussion
The maximum levels of invasive richness anddiversity were positively related to native species
Standardized C:N ratio
0.4 0.6 0.8 1.0 1.2 1.4 1.6
Inva
sion
Inde
x
0.0
0.1
0.2
0.3
0.4
0.5
0.6
Figure 5. Invasion index as a function of leaf C : N ratios. In order to compare among species, C : N has been standardized by
the mean C : N for each species.
404

richness and diversity (Figure 2); species-rich siteswere the most likely to be invaded (Wiser et al.1998; Levine and D’Antonio 1999; Smith and
Knapp 1999; Stohlgren et al. 1999; Levine 2000).We do not believe that native species richnessand diversity are directly responsible for higher
Figure 6. Daily net nitrogen mineralization (above) and nitrate nitrogen mineralization (below) over seven intervals from December
1998 to December 1999. Pine barrens sites (closed circles) and hardwood forest sites (open circles) were separated by the cluster
analysis.
Table 4. Repeated measures analysis for daily (A) net nitrogen and (B) nitrate production for
seven time intervals over the course of one year (December 1998–December 1999) (see Figure 8).
Effect df MS F
(A) (NHþ4 + NO�
3 )-N
Sitetype 1 0.40 30.19***
Site[sitetype] 13 0.01 1.20
Date 6 0.08 7.16***
Date · sitetype 6 0.01 0.48
Error 70 0.01
(B) NO�3 -N
Sitetype 1 0.18 11.84**
Site[sitetype] 13 0.02 6.70***
Date 6 0.01 3.45**
Date · sitetype 6 0.01 2.95*
Error 70 <0.01
*P < 0.05; **P < 0.005; ***P < 0.0001.
405

maximum levels of invasive richness and diver-sity, but suspect that other underlying factors aredetermining the limits to both native and invasiveplant species diversity. It is striking that all low-diversity sites had low levels of invasion, butwhile sites high in native diversity had a highermaximum level of invasion, some were heavilyinvaded, others had intermediate levels of inva-sion, and some high-diversity sites had a verylimited invasive species presence. This suggeststhat factors other than native species richnessand diversity are also strongly related to themagnitude of invasion by nonnative plants. Weconsider some of the potential factors limitinginvasion in these forests below.
We distinguished two broad types of communi-ties in the study, based upon cluster analyses ofvegetation composition. Pine barrens and pine–oak communities consistently had low levels ofinvasion. The hardwood forest communitiesincluded sites ranging from high to low levels ofinvasion. Pine barrens and hardwood sites alsodiffered from one another in soil resources, partic-ularly in soil nitrogen and soil calcium. Thus,across broad environmental gradients and com-munity types, invasive species were more com-monly found in communities with higher resourcelevels. The strong positive correlation betweeninvasion and soil calcium was unanticipated, andour prediction that invasions would be limited bythe sandy, acidic soils of the pine barrens was alsoincorrect: percent sand and soil acidity were notimportant in determining the degree of invasion,or even in determining whether a site supportedpine barrens or hardwood forest vegetation.
Perhaps even more striking was that the mag-nitude of invasion remained significantly posi-tively correlated with soil fertility (calcium,magnesium, and net N-mineralization rates)within the hardwood forest sites. Thus, across awide range of sites with different soils and vege-tation, as well as among a more narrow group ofsites containing similar soils and native species,these soil factors were correlated with the level ofinvasion by nonnative species.
There are several possible hypotheses toexplain the higher incidence of invasion at highersoil resource sites. One hypothesis is that thepool of invasive species available in this regionare a group of plants that happen to be those
adapted to growing in fertile soils. In fact, manyof the common exotic plants in these forests arehorticultural escapees that have been selected forgrowth in high resource (cultivated) conditions(e.g. Reichard and White 2001). If this hypothesisaccounts for the pattern of invasion here, itwould imply that the species pool is what ulti-mately limits invasions in the sites with poorsoils: if large number of horticultural plantsnative to low-nutrient sites existed and wereintroduced here, some of these species would belikely to become invasive in the pine barrens.Alternatively, it could be that only those speciesnative to high nutrient sites, with the capacity forhigh growth or reproductive rates in response tohigh resource levels, can ever become invasive. Ifthis latter hypothesis accounts for the associationbetween soil resources and site invasion, culti-vated plants native to low nutrient habitats cannever become invasive, and the pine barrens willremain resistant to invasion regardless of propa-gule availability from potential new horticulturalsources. In either case, if invaders perform betterin more fertile soils, they would be able torespond to increases in resources in greater pro-portion than would native species.
The implications of these two hypotheses forthe differential success of invasions in these for-ests at high levels of soil N and Ca are quite dif-ferent. In the first case, vigilance with regard toimporting and planting horticultural speciesnative to low resource environments may be war-ranted, and it is possible that at some time in thefuture the pine barrens and pine–oak forests thatnow hold only native species will becomeinvaded. If the second hypothesis is correct, theuninvaded hardwood preserves are most vulnera-ble to future invasions. The pine barrens andother low nutrient sites will remain dominated bynative species unless soil chemistry is substan-tially altered by N deposition. In the latter event,they will become more vulnerable to invasionthan they are presently.
Other factors may also, of course, have influ-enced the degree to which these communitieswere dominated by invasive species. While lightavailability is commonly attributed as animportant factor, indirect evidence suggests lightis not the primary factor influencing invasive suc-cess at these sites. First, the uninvaded pine bar-
406

rens sites are best described as woodlands, withhigh light levels at the forest floor. Indeed, pinebarrens sites have substantially lower percentcanopy cover than the hardwood sites, whilethere are essentially no differences betweeninvaded and uninvaded hardwood forest sites (asdetermined from hemispherical photos, unpub-lished data). Also, our results here indicate inva-sion was not correlated with total tree biomass, afactor that commonly is associated with forestfloor light availability. Distance to propagulesource is also unlikely to be a major immediateexplanation for invasibility. Sites with high andlow invasion were intermingled spatially, thusassuring that propagules of invasive species here,many of which are bird dispersed, have access toall sites in this region (Figure 1).
Site history, however, could certainly havebeen very important in determining whether vul-nerable sites were invaded or not. We suggest thefollowing scenario: in this system, soil resourcelevels appear to determine whether the sites arevulnerable or resistant to invasion. While soilsset the baseline for invasion, the degree of actualinvasion is then likely to be strongly affected bysite history and other factors secondarily. Thatis, pine barrens sites remain uninvaded (regard-less of disturbance history and propagule avail-ability) due to their low resource soils, while siteswith soils that are high in N and Ca may becomeheavily invaded or remain uninvaded, dependingupon site history and ultimately also propaguleavailability. (No forest communities were invadedbefore invasive species were heavily planted inthe region, making propagules abundant.)
The consistently strong response of invasivespecies to soil calcium was unexpected and hasnot been previously reported. Calcium is, how-ever, a critical component of many physiologicalprocesses in the plant cell (e.g. mitosis and cyto-kinesis, light-stimulated responses, auxin-medi-ated growth; Hepler and Wayne 1985). Calciumlevels are highest in the tissues of earlier succes-sional species and leaves with shorter life spans(Reich et al. 1995). This suggests that a conse-quence of the accelerated physiological processesin faster-growing species may be higher require-ments for this mineral. Also, calcium is notrecovered from leaves prior to senescence (Shaverand Chapin 1991), indicating possibly greater
demand for this mineral for faster-growing spe-cies with higher leaf turnover rates. In localitieswhere calcium is more readily available, specieswith the ability to use that calcium to sustainbetter performance should be proportionatelymore successful than others lacking those abili-ties. At low levels of soil calcium, such speciesmay not be able to produce leaves and capturecarbon at sufficiently high rates to survive.
The potential role of resource availability asan underlying cause for invasive species abun-dance may be of particular concern in regionssuch as the eastern United States, because of thelarge influences that human activities have hadon the availability of both nitrogen and calciumover the last 50 years (Aber et al. 1998; Driscollet al. 2001). These activities, particularly fossilfuel combustion and fertilizer use, have tremen-dously increased the availability of nitrogen inthese systems that have, until recently, beenstrongly limited by nitrogen (Aber et al. 1998; seealso Dukes and Mooney 1999). Acid depositionhas also led to a depletion of calcium in ecosys-tems in the northeastern US where parent rockmaterial commonly lacks any calcitic compo-nents, through the displacement of calcium fromsoil exchange sites and the movement of this dis-placed calcium into the surface groundwater dis-charge. These changes in resource availabilitycould profoundly alter the susceptibility of thesecommunities to invasions.
We do not know from examining these rela-tionships, of course, whether the higher soilnutrients are a cause or a result of the differencesin species composition, including the presence ofinvasive plants (e.g. see Evans et al. 2001). Wealso do not know from this study whether theinvasive species grow, on average, any faster thanthe native species in any sites or under any soilconditions, or whether they use soil nutrients dif-ferently. It is also possible that the invasives inthis study could thrive in the low-nutrient sitesbut have just not reached those habitats yet –but this is extremely unlikely, as all sites in thisstudy were very close to substantial populationsof invasive plants, and many of the invasive spe-cies here are bird-dispersed. These questionscannot be answered without experimentation,and are the focus of future experimental manipu-lations based on the present study.
407
It is likely is that the particular nature andtiming of the disturbance history of a site inter-acts with soil resource availability and the nonna-tive species pool to determine the degree towhich these forest communities become invaded.All of the sites we studied were subject to variousanthropogenic and natural disturbances in thepast: burning, logging, farming, hurricane blow-downs, and other various disturbances to thecanopy or the soil. These disturbances occurredat different times in the past, when different spe-cies assemblages were available for recoloniza-tion. Probability of site invasion would increasewhen the disturbance occurred at a time whenlocal species pools had high proportions of inva-sives for those sites vulnerable to invasion due tohigher soil resources.
Our research demonstrates that soil resourcelevels appear to set the boundary conditions forinvasion in a range of forest types in southeasternNew York State. A number of researchers havenoted a relationship between nitrogen availabilityand invasibility, but the marked positive relation-ship we found between invasion and soil calciumis novel. It has potentially important implicationsbecause of the rapidly changing calcium dynamicsin many ecosystems (Likens et al. 1998; Lawrenceet al. 1999; Johnson et al. 2000). If invasive spe-cies preferentially benefit from high soil calciumlevels, then the declines in Ca currently observedin many systems receiving significant N-deposi-tion may slow the spread of invasive taxa. Experi-mental studies of this potentially importantrelationship are necessary to more fully under-stand the patterns we found.
Acknowledgements
K. Brown, W. Fang, R.M. Landis, M. Miriti,R. Misra, and H. Throop helped in the field andprovided excellent discussion in lab. We thankThe Nature Conservancy’s South Fork – ShelterIsland, Long Island, and Eastern New Yorkchapters; New York Suffolk County Departmentof Parks, Recreation and Conservation; NewYork Department of Environmental Con-servation; and US Department of Energy Brook-haven National Laboratory for permission
to conduct research on their property. Wethank four anonymous reviewers for offeringsuggestions that improved this document. Thiswork was funded by The Nature ConservancyMellon Ecosystem Research Grant #HO-STEW060198NY to J. Gurevitch, M. Lerdau,and M. Carreiro.
Reference
Aber J, McDowell W, Nadelhoffer K, Magill A, Berntson
Glenn, Kamakea M, McNulty S, Currie W, Rustad L and
Fernandez I (1998) Nitrogen saturation in temperate forest
ecosystems. Bioscience 48: 921–934
Baker HG and Stebbins GL (eds) (1965) The Genetics of Col-
onizing Species. Academic Press, New York, 588 pp
Baker HG, Mooney HA and Drake JA (1986) Ecology of
Biological Invasions of North America and Hawaii.
Springer-Verlag, New York, 321 pp
Bran-Luebbe Analyzing Technologies (1986a) Ammonia in
water and wastewater. Industrial Method No. 786-86T.
Bran-Luebbe Inc, Buffalo Grove, Illinois
Bran-Luebbe Analyzing Technologies (1986b) Nitrate. Indus-
trial Method No. 782-86T. Bran-Luebbe Inc., Buffalo
Grove, Illinois
Brown RL and Peet RK (2003) Diversity and invasibility of
southern Appalachian plant communities. Ecology 84: 32–
39
Buell MF and Cantlon JE (1950) A study of two communities
of the New Jersey pine barrens and comparison of meth-
ods. Ecology 31: 567–586
Cade BS, Terrell JW and Schroeder RL (1999) Estimating
effects of limiting factors with regression quantiles. Ecology
80: 311–323
Chapin FS (1980) The mineral nutrition of wild plants.
Annual Review of Ecology and Systematics 11: 233–260
Crawley MJ, Brown SL, Heard MS and Edwards GR (1999)
Invasion-resistance in experimental grassland communities:
species richness or species identity? Ecology Letters 2: 140–
148
Drake JA (1989) Biological invasions: a global perspective.
Published on behalf of the Scientific Committee on Prob-
lems of the Environment (SCOPE) of the International
Council of Scientific Unions (ICSU) by John Wiley and
Sons, Ltd., Chichester, New York, 525 pp
Driscoll CT, Lawrence GB, Bulget AJ, Butler TJ, Cronan CS,
Eager C, Lambert KF, Likens GE, Stoddard JL and
Weathers KC (2001) Acidic deposition in the Northeastern
United States: sources and inputs, ecosystems effects, and
management strategies. BioScience 51: 180–198
Dukes JS (2002) Species composition and diversity affect
grassland susceptibility and response to invasion. Ecologi-
cal Applications 12: 602–617
Dukes JS and Mooney HA (1999) Does global change
increase the success of biological invaders? Trends in Ecol-
ogy and Evolution 14: 135–139
408

Elton CS (1958) The Ecology of Invasions by Animals and
Plants. Methuen and Co., London, 181 pp
Evans RD, Rimer R, Sperry L and Belnap J (2001) Exotic
plant invasion alters nitrogen dynamics in an arid grass-
land. Ecological Applications 11: 1301–1310
Firbank LG and Watkinson AR (1987) On the analysis of
competition at the level of the individual plant. Oecologia
71: 308–317
Gleason HA and Cronquist A (1991) Manual of Vascular
Plants of Northeastern United States and Adjacent
Canada, 2nd edn. The New York Botanical Garden, New
York, 910 pp
Goldberg DE (1987) Neighborhood competition in an old-
field plant community. Ecology 68: 1211–1223
Gordon AM, Tallas M and Van Cleve K (1987) Soil incuba-
tions in polyethylene bags: effect of bag thickness and tem-
perature on nitrogen transformations and CO2
permeability. Canadian Journal of Science 67: 65–75
Hepler PK and Wayne RO (1985) Calcium and plant develop-
ment. Annual Review of Plant Physiology 36: 397–439
Higgins SI and Richardson DM (1996) A review of models of
alien plant spread. Ecological Modelling 87: 249–265
Higgins SI, Richardson DM and Cowling RM (1996) Model-
ing invasive plant spread: the role of plant–environment
interactions and model structure. Ecology 77: 2043–2054
Huenneke LF, Hamburg SP, Koide R, Mooney HA and
Vitousek PM (1990) Effects of soil resources on plant inva-
sion and community structure in Californian serpentine
grassland. Ecology 71: 478–491
Johnson CE, Driscoll CT, Siccama TG and Likens GE (2000)
Element fluxes and landscape position in a northern Hard-
wood forest watershed ecosystem. Ecosystems 3: 159–
84
Kalkhan M and Stohlgren TJ (2000) Using multi-scale sam-
pling and spatial cross-correlation to investigate patterns
of plant species richness. Environmental Monitoring and
Assessment 64: 591–605
Koenker R (2002) The Quantreg Package Ver. 3.11. Retrieved
from http: //www.econ.uiuc.edu/~roger/research/rq/rq.html
Koenker R and Bassett G (1978) Regression quantiles. Eco-
nometrica 46: 33–50
Koenker R and Hallock KF (2001) Quantile regression. Jour-
nal of Economic Perspectives 15: 143–156
Lawrence GB, David MB, Lovett GM, Murdoch PS, Burns
DA, Stoddard JL, Baldigo BP, Porter JH and Thompson
AW (1999) Soil calcium status and the response of stream
chemistry to changing acidic deposition rates. Ecological
Applications 9: 1059–1072
Levine JM (2000) Species diversity and biological invasions:
relating local process to community pattern. Science 288:
852–854
Levine JM and D’Antonio CM (1999) Elton revisited: a
review of evidence linking diversity and invasibility. Oikos
87: 15–26
Likens GE, Driscoll CT, Buso DC, Siccama TG, Johnson
CE, Lovett GM, Fahey TJ, Reiners WA, Ryan DF,
Martin CW and Bailey SW (1998) The biogeochemistry of
calcium at Hubbard Brook. Biogeochemistry 41: 89–
173
Lonsdale WM (1999) Global patterns of plant invasions and
the concept of invasibility. Ecology 80: 1522–1536
Meekins JF and McCarthy BC (2001) Effect of environmental
variation on the invasive success of a nonindigenous forest
herb. Ecological Applications 11: 1336–1348
Morrison SL and Molofsky J (1998) Effects of genotypes, soil
moisture, and competition on the growth of an invasive
grass, Phalaris arundinacea (Reed Canary Grass). Cana-
dian Journal of Botany 76: 1939–1946
Pimm SL and Lawton JH (1991) Food web patterns and their
consequences. Nature 350: 669–675
Reich PB, Abrams MD, Ellsworth DS, Kruger EL and
Tabone TJ (1990) Fire affects ecophysiology and commu-
nity dynamics of central Wisconsin oak forest regeneration.
Ecology 71: 2179–2190
Reich PB, Ellsworth DS and Uhl C (1995) Leaf carbon and
nutrient assimilation and conservation in species of differ-
ing successional status in an oligotrophic Amazonian for-
est. Functional Ecology 9: 65–76
Reichard SH and White P (2001) Horticulture as a pathway
of invasive plant introductions in the United States. Bio-
Science 51: 103–113
Rejmanek M and Richardson DM (1996) What attributes
make some plant species more invasive? Ecology 77: 1655–
1661
Ricciardi A, Steiner WWM, Mack R and Simberloff D (2000)
Toward a global information system for invasive species.
BioScience 50: 239–244
Robinson GR, Quinn JF and Stanton ML (1995) Invasibility
of experimental habitat islands in a California winter
annual grassland. Ecology 76: 786–794
Scheiner SM (1993) MANOVA: multiple response variables
and multispecies interactions. In: Scheiner WR and Gure-
vitch J (eds) Design and Analysis of Ecological Experi-
ments, pp 94–112. Chapman & Hall, New York
Shaver GR and Chapin FSI (1991) Production: biomass rela-
tionships and element cycling in contrasting arctic vegeta-
tion types. Ecological Monographs 61: 1–31
Smith MD and Knapp AK (1999) Exotic plant species in a
C-4-dominated grassland: invasibility, disturbance, and
community structure. Oecologia 120: 605–612
Sokal RR and Rohlf FJ (1995) Biometry: The Principles and
Practice of Statistics in Biological Research, 3rd edn.
W. H. Freeman, New York, 887 pp
Stohlgren TJ, Bull K, Otsuki Y, Villa C and Lee M (1998)
Riparian zones as havens for exotic plant species in the
central grasslands. Plant Ecology 138: 113–125
Stohlgren TJ, Binkley D, Chong GW, Kalkhan MA, Schell
LD, Bull KA, Otsuki Y, Newman G, Bashkin M and
Son Y (1999) Exotic plant species invade hot spots of
native plant Diversity. Ecological Monographs 69: 25–
46
Symstad AJ (2000) A test of the effects of functional group
richness and composition on grassland invasibility. Ecology
81: 99–109
Thomson JD, Weiblen G, Thomson BA, Alfaro S and
Legendre P (1996) Untangling multiple factors in spatial
distributions: lilies, gophers, and rocks. Ecology 77: 1698–
1715
409

Tilman D, Knops J, Wedin D, Reich P, Ritchie M and
Siemann E (1997) The influence of functional diversity and
composition on ecosystem processes. Science 277: 1300–
1302
Vitousek PM (1990) Biological invasions and ecosystem pro-
cesses: towards an integration of population biology and
ecosystem studies. Oikos 57: 7–13
Vitousek PM, Loope LL and Stone CP (1987) Introduced
species in Hawaii: biological effects and opportunities for
ecological research. Trends in Ecology and Evolution 2:
224–227
Williamson J and Harrison S (2002) Biotic and abiotic limits
to the spread of exotic revegetation species. Ecological
Applications 12: 40–51
Williamson M (1996) Biological Invasions. Chapman & Hall,
London, UK
Wiser SK, Allen RB, Clinton PW and Platt KH (1998) Com-
munity structure and forest invasion by an exotic herb over
23 years. Ecology 79: 2071–2081
Woo I and Zedler JB (2002) Can nutrients alone shift a sedge
meadow towards dominance by the invasive Typha ·glauca? Wetlands 22: 509–521
410