
X-ray Bragg magnifier microscope as a linear shift invariant imaging system: image formation and...
13
X-ray Bragg magnifier microscope as a linear shift invariant imaging system: image formation and phase retrieval P. Vagoviˇ c, 1,* L. ˇ Sv´ eda, 2 A. Cecilia, 3 E. Hamann, 3 D. Pelliccia, 4 E. N. Gimenez, 5 D. Koryt´ ar, 6 K. M. Pavlov, 4,7 Z. Z ´ apraˇ zn´ y, 6 M. Zuber, 3 T. Koenig, 3 M. Olbinado, 8 W. Yashiro, 8 A. Momose, 8 M. Fiederle, 3 and T. Baumbach 3 1 Center for Free-Electron Laser Science, Deutsches Elektronen-SYnchrotron, Hamburg, Germany 2 FNSPE CTU, Prague, Czech Republic 3 ANKA Light Source, Karlsruhe Institute of Technology, Karlsruhe, Germany 4 School of Physics,Monash University, Victoria 3800, Australia 5 Diamond Light Source, England 6 Institute for Electrical Engineering, Slovak Academy of Sciences, Bratislava, Slovakia 7 University of New England, Armidale NSW 2351 Australia 8 Institute of Multidisciplinary Research for Advanced Materials, Tohoku University, Japan * [email protected] Abstract: We present the theoretical description of the image formation with the in-line germanium Bragg Magnifier Microscope (BMM) and the first successful phase retrieval of X-ray holograms recorded with this imaging system. The conditions under which the BMM acts as a linear shift invariant system are theoretically explained and supported by the experiment. Such an approach simplifies the mathematical treatment of the image formation and reconstruction as complicated propagation of the wavefront onto inclined planes can be avoided. Quantitative phase retrieval is demonstrated using a test sample and a proof of concept phase imaging of a spider leg is also presented. © 2014 Optical Society of America OCIS codes: (340.7440) X-ray imaging; (340.0340) X-ray optics; (230.1480) Bragg reflectors; (100.5070) Phase retrieval. References 1. P. Vagoviˇ c, D. Koryt´ ar, A. Cecilia, E. Hamann, L. ˇ Sv´ eda, D. Pelliccia, J. H¨ artwig, Z. Z´ apraˇ zn´ y, P. Oberta, I. Dolb- nya, K. Shawney, U. Fleschig, M. Fiederle, and T. Baumbach, “High-resolution high-efficiency X-ray imaging system based on the in-line Bragg magnifier and the Medipix detector,” J. Synchrotron Radiat. 20, 153–159 (2013). 2. W. J. Boetinger, H. E. Burdette, and M. Kuriyama, “X-ray magnifier,” Rev. Sci. Instrum. 50, 26–30 (1979). 3. M. Kuriyama, R. C. Dobbyn, R. D. Spal, H. E. Burdette, and D. Black, “Hard x-ray microscope with submi- crometer spatial resolution,” J. Res. Natl. Inst. Stand. Technol. 95, 559 (1990). 4. G. Stampanoni, R. Borchert, R. Abela, and P. R¨ uegsegger, “Bragg magnifier: A detector for submicrometer X-ray computer tomography,” J. Appl. Phys. 92, 7630–7635 (2002). 5. P. Sch¨ afer and R. K ¨ ohler, “Asymmetric Bragg reflection as X-ray magnifier,” J. Phys. D: Appl. Phys. 36, A113– A117 (2003). 6. P. Modregger, D. L¨ ubbert, P. Sch¨ afer, and R. K¨ ohler, “Magnified X-ray phase imaging using asymmetric Bragg reflection: Experiment and theory,” Phys. Rev. B. 74, 054107 1–10 (2006). 7. R. A. Senin, A. V. Buzmakov, A. V. Konovko, I. S. Smirnov, A. S. Geranin, and V. E. Asadchikov, “Gain in spatial resolution of X-ray laboratory microtomographs with enlarging X-ray optical elements,” JPCS 186 (2009). #214222 - $15.00 USD Received 16 Jun 2014; revised 22 Jul 2014; accepted 23 Jul 2014; published 28 Aug 2014 (C) 2014 OSA 8 September 2014 | Vol. 22, No. 18 | DOI:10.1364/OE.22.021508 | OPTICS EXPRESS 21508
Transcript of X-ray Bragg magnifier microscope as a linear shift invariant imaging system: image formation and...

X-ray Bragg magnifier microscope as alinear shift invariant imaging system:image formation and phase retrieval
P. Vagovic,1,∗ L. Sveda,2 A. Cecilia,3 E. Hamann,3 D. Pelliccia,4 E. N.Gimenez,5 D. Korytar,6 K. M. Pavlov,4,7 Z. Zaprazny,6 M. Zuber,3 T.
Koenig,3 M. Olbinado,8 W. Yashiro,8 A. Momose,8 M. Fiederle,3 and T.Baumbach3
1Center for Free-Electron Laser Science, Deutsches Elektronen-SYnchrotron, Hamburg,Germany
2 FNSPE CTU, Prague, Czech Republic3 ANKA Light Source, Karlsruhe Institute of Technology, Karlsruhe, Germany
4 School of Physics,Monash University, Victoria 3800, Australia5 Diamond Light Source, England
6 Institute for Electrical Engineering, Slovak Academy of Sciences, Bratislava, Slovakia7 University of New England, Armidale NSW 2351 Australia
8 Institute of Multidisciplinary Research for Advanced Materials, Tohoku University, Japan∗[email protected]
Abstract: We present the theoretical description of the image formationwith the in-line germanium Bragg Magnifier Microscope (BMM) andthe first successful phase retrieval of X-ray holograms recorded with thisimaging system. The conditions under which the BMM acts as a linearshift invariant system are theoretically explained and supported by theexperiment. Such an approach simplifies the mathematical treatment ofthe image formation and reconstruction as complicated propagation of thewavefront onto inclined planes can be avoided. Quantitative phase retrievalis demonstrated using a test sample and a proof of concept phase imagingof a spider leg is also presented.
© 2014 Optical Society of America
OCIS codes: (340.7440) X-ray imaging; (340.0340) X-ray optics; (230.1480) Bragg reflectors;(100.5070) Phase retrieval.
References1. P. Vagovic, D. Korytar, A. Cecilia, E. Hamann, L. Sveda, D. Pelliccia, J. Hartwig, Z. Zaprazny, P. Oberta, I. Dolb-
nya, K. Shawney, U. Fleschig, M. Fiederle, and T. Baumbach, “High-resolution high-efficiency X-ray imagingsystem based on the in-line Bragg magnifier and the Medipix detector,” J. Synchrotron Radiat. 20, 153–159(2013).
2. W. J. Boetinger, H. E. Burdette, and M. Kuriyama, “X-ray magnifier,” Rev. Sci. Instrum. 50, 26–30 (1979).3. M. Kuriyama, R. C. Dobbyn, R. D. Spal, H. E. Burdette, and D. Black, “Hard x-ray microscope with submi-
crometer spatial resolution,” J. Res. Natl. Inst. Stand. Technol. 95, 559 (1990).4. G. Stampanoni, R. Borchert, R. Abela, and P. Ruegsegger, “Bragg magnifier: A detector for submicrometer X-ray
computer tomography,” J. Appl. Phys. 92, 7630–7635 (2002).5. P. Schafer and R. Kohler, “Asymmetric Bragg reflection as X-ray magnifier,” J. Phys. D: Appl. Phys. 36, A113–
A117 (2003).6. P. Modregger, D. Lubbert, P. Schafer, and R. Kohler, “Magnified X-ray phase imaging using asymmetric Bragg
reflection: Experiment and theory,” Phys. Rev. B. 74, 054107 1–10 (2006).7. R. A. Senin, A. V. Buzmakov, A. V. Konovko, I. S. Smirnov, A. S. Geranin, and V. E. Asadchikov, “Gain in spatial
resolution of X-ray laboratory microtomographs with enlarging X-ray optical elements,” JPCS 186 (2009).
#214222 - $15.00 USD Received 16 Jun 2014; revised 22 Jul 2014; accepted 23 Jul 2014; published 28 Aug 2014(C) 2014 OSA 8 September 2014 | Vol. 22, No. 18 | DOI:10.1364/OE.22.021508 | OPTICS EXPRESS 21508

8. K. Hirano, Y. Takahashi, and H. Sugiyama, “Development and application of variable-magnification X-ray Braggmagnifiers,” Nucl. Instr. Meth. Phys. Res. A 741, 78 – 83 (2014).
9. P. Vagovic, D. Korytar, P. Mikulık, A. Cecilia, C. Ferrari, Y. Yang, D. Hanschke, E. Hamann, D. Pelliccia, T. A.Lafford, M. Fiederle, and T. Baumbach, “In-line Bragg magnifier based on V-shaped germanium crystals,” J.Synchrotron Radiat. 18, 753–760 (2011).
10. W. Pauli, Die allgemeinen Prinzipien der Wellenmechanik (Handb. Phys., 1933).11. G. Taylor, “The phase problem,” Acta Crystallogr. Sect. D 59, 1881–1890 (2003).12. J. R. Fienup, “Phase retrieval algorithms: a comparison,” Appl. Opt. 21, 2758–2769 (1982).13. J. R. Fienup, “Reconstruction of a complex-valued object from the modulus of its Fourier transform using a
support constraint,” J. Opt. Soc. Am. A 4, 118–123 (1987).14. R. W. Gerchberg and W. O. Saxton, “A practical algorithm for the determination of phase from image and
diffraction plane pictures,” Optik 35, 237 (1972).15. T. E. Gureyev and K. A. Nugent, “Phase retrieval with the transport-of-intensity equation. II. orthogonal series
solution for nonuniform illumination,” J. Opt. Soc. Am. A 13, 1670–1682 (1996).16. A. Burvall, U. Lundstrom, P. A. C. Takman, D. H. Larsson, and H. M. Hertz, “Phase retrieval in X-ray phase-
contrast imaging suitable for tomography,” Opt. Express 19, 10359 (2011).17. P. Cloetens, W. Ludwig, J. Baruchel, D. Van Dyck, J. Van Landuyt, J. P. Guigay, and M. Schlenker, “Holoto-
mography: Quantitative phase tomography with micrometer resolution using hard synchrotron radiation X-rays,”Appl. Phys. Lett. 75, 2912–2914 (1999).
18. P. Modregger, D. Lubbert, P. Schafer, R. Kohler, T. Weitkamp, M. Hanke, and T. Baumbach, “Fresnel diffractionin the case of an inclined image plane,” Opt. Express 16, 5141–5149 (2008).
19. D. Paganin, Coherent X-Ray Optics (Oxford University, 2006).20. A. Authier, Dynamical Theory of X-ray Diffraction (Oxford University, 2004).21. K. M. Pavlov, T. E. Gureyev, D. Paganin, Y. I. Nesterets, M. J. Morgan, and R. A. Lewis, “Linear systems with
slowly varying transfer functions and their application to x-ray phase-contrast imaging,” J. Phys. D: Appl. Phys.37, 2746 (2004).
22. K. Pavlov, T. Gureyev, D. Paganin, Y. Nesterets, M. Kitchen, K. Siu, J. Gillam, K. Uesugi, N. Yagi, M. Morgan,and R. Lewis, “Unification of analyser-based and propagation-based X-ray phase-contrast imaging,” Nucl. Instr.Meth. Phys. Res. A 548, 163–168 (2005).
23. P. Coan, E. Pagot, S. Fiedler, P. Cloetens, J. Baruchel, and A. Bravin, “Phase-contrast X-ray imaging combiningfree space propagation and Bragg diffraction,” J. Synchrotron Radiat. 12, 241–245 (2005).
24. D. Paganin and K. A. Nugent, “Noninterferometric phase imaging with partially coherent light,” Phys. Rev. Lett.80, 2586–2589 (1998).
25. T. Latychevskaia and H.-W. Fink, “Solution to the twin image problem in holography,” Phys. Rev. Lett. 98,233901 (2007).
26. M. Zuber, T. Koenig, E. Hamann, A. Cecilia, M. Fiederle, and T. Baumbach, “Characterization of 2x3 timepixassembly with a 500 um thick silicon sensor,” J. Instrum. 9, C05037 (2014).
27. J. L. Starck, F. Murtagh and A. Bijaoui, Image Processing and Data Analysis, The Multiscale Approach (Cam-bridge University, 1998).
1. Introduction
The in-line germanium Bragg Magnifier Microscope (BMM) [1] is an imaging system com-posed of highly asymmetric germanium crystals, geometrically magnifying the X-ray beam inboth the horizontal and the vertical direction. The specimen of interest is placed before theBMM and the beam containing the information about the sample is then magnified by meansof extreme asymmetric diffraction by dislocation free germanium crystals. X-ray magnificationusing this concept was initially demonstrated using asymmetric silicon crystals [2–8]. More re-cently, the use of dislocation-free germanium crystals was demonstrated to be more efficientlydue to the larger structure factor of germanium compared to silicon [9]. After the magnification,the X-ray image is detected by a single photon counting semiconductor detector (e.g. Medipixdetector was used in [1, 9]). Instead of converting X-ray photons to visible photons and mag-nifying the visible light image with a diffraction limited microscope and successive detectionwith a CCD, which is typical in many X-ray imaging schemes, the magnification of the X-raybeam itself and its direct detection provides much higher efficiency [1]. The resulting image ofthe sample is highly defocused, in practice it is the in-line hologram of the sample image, con-taining a number of Fresnel fringes. To obtain the sample image one would need to invert the
#214222 - $15.00 USD Received 16 Jun 2014; revised 22 Jul 2014; accepted 23 Jul 2014; published 28 Aug 2014(C) 2014 OSA 8 September 2014 | Vol. 22, No. 18 | DOI:10.1364/OE.22.021508 | OPTICS EXPRESS 21509

hologram, i.e. to numerically back-propagate the wavefield onto the sample plane. However,the quantity measured by the detector is the intensity (i.e. the square modulus) of the wave-field, as the phase information is lost and the back-propagation cannot be performed in a trivialway. This is know as the phase problem, the question about existence of the solution of such aproblem was firstly raised by Pauli [10], later recognised in crystallography [11] and present indifferent ways in imaging methods as well. To recover the phase shift just after the sample onecan use iterative phase retrieval algorithms [12–14], which iterate the complex wavefield backand forth between sample and detector plane, and apply known constraints on either plane.Another group of phase retrieval algorithms are based on deterministic methods [15, 16] ormeasuring the intensity of holograms at several positions along the optical axis and successivephase retrieval [17]. Typical applications of iterative phase retrieval use free-space propagation.Therefore for the successful use of iterative phase retrieval algorithms to the BMM holograms,it is absolutely crucial to understand the image formation in such a complicated system. Aphase retrieval method considering a BMM composed of two crystals including propagationonto incline planes was already proposed by [18] but the successful phase retrieval was not yetshown.In general, the BMM is not a linear shift invariant imaging system, which means that its trans-fer function varies with the position along the plane perpendicular to the optical axis. This iscaused by the propagation of the X-ray wavefield onto inclined planes and the successive spa-tial frequency compression by asymmetric diffraction in the crystals diffraction planes.In this work, we describe the conditions under which the BMM can be considered a linear shiftinvariant imaging system. The model is verified by experimental data. Furthermore, we intro-duce the model for forward image formation with a BMM and compare simulated images withthe experimental data. Finally a phase retrieval of experimental holograms of a phantom sam-ple (polystyrene spheres) and a biological sample (spider leg) is performed to show the systemimage capability.The paper is organized as follows: in Sec. 2 we describe the conditions under which the BMMacts a linear shift invariant system and compare the model with experimental data. In Sec. 3 wegive the theoretical description of the image formation in a BMM and compare the simulateddata produced with this method with experimental data taken with synchrotron x-rays. In Sec. 4we describe the iterative phase retrieval procedure that we devised to retrieve the sample imagefrom the in-line holograms. The procedure is employed to obtain quantitative phase image ofpolystyrene spheres and a proof-of-concept retrieval of spider leg micrographs. Finally, Sec. 5contains the conclusions.
2. Bragg magnifier microscope as linear shift invariant system
The BMM consists of four successive asymmetrically cut germanium crystals. The geometryof the setup was reported in [1]. In general, each asymmetric crystal (Bragg Magnifier) is nota linear shift invariant imaging system. Referring to Fig. 1, the asymmetric (non specular)reflection corresponds to the propagation of the wavefield onto an inclined plane. Therefore,when the wavefield emanating from the sample intercepts the crystal surface, the free spacepropagation distance for points at the sample plane at different positions along x-direction,is different. The consequence is that every such a point along the x-direction experiences adifferent transfer function and thereby the imaging system is not linear shift invariant (i.e. inpractice the sample image would differ if the sample would be rigidly translated along the x-direction). The mathematical modelling of image formation with such system is not trivial andalso not very practical. If the system under some circumstances can be considered as linear shiftinvariant, the transfer function of the points at the sample plane would be the same across thefield of view (FOV) at any given propagation distance. Then, the mathematical treatment would
#214222 - $15.00 USD Received 16 Jun 2014; revised 22 Jul 2014; accepted 23 Jul 2014; published 28 Aug 2014(C) 2014 OSA 8 September 2014 | Vol. 22, No. 18 | DOI:10.1364/OE.22.021508 | OPTICS EXPRESS 21510

be largely simplified because the standard free space propagators (between planes orthogonalto the optic axis) would be well suited. Clearly, when the propagation distance z in Fig. 1
x
�z
z
Figure 1. Schematic drawing of the variation of the propagation distance for the points atthe sample plane along the x-direction in the case of asymmetric diffraction.
is much larger than the propagation distance difference ∆z, the system approximates being alinear shift invariant system for practical cases. To prove this statement a simple experimentwas performed. We placed the sample – the edge of a Kapton foil – before the magnifier atopposite sides of the FOV. For each position we recorded images at two propagation distancesbetween the sample and the first Bragg Magnifier crystal. The distances were chosen to be 131mm (small distance) and 668 mm (large distance) respectively, and the results are shown in Fig.2.
0.2
0.4
0.6
0.8
1
1.2
1.4
1.6
1.8
2
-40 -20 0 20 40
Inte
nsity
(r.l.
u.)
position (pixels)
(a)(b)
(e)
0.2
0.4
0.6
0.8
1
1.2
1.4
1.6
1.8
2
-80 -60 -40 -20 0 20 40 60 80
Inte
nsity
(r.l.
u.)
position (pixels)
(c)(d)
(f)
Figure 2. The images of the Kapton edge at the opposite sides of the field of view at prop-agation distance 131 mm (a)–(b) and at the propagation distance 668 mm (c)–(d). Thecorresponding 1D profiles (e)–(f).
The in line holograms of the edges are shown in Figs. 2(a) and 2(b) for the small distance andin Figs. 2(c) and 2(d) for the large distance. A line profile, showing the intensity of the Fresnelfringes for each position and each distance are taken. At the small distance, the images of thesample at the right and left side of the FOV are not overlapping and the intensities of maindiffraction peak are not the same [Fig. 2 (e)]. For the corresponding profiles when the sampleis placed further upstream the Bragg magnifier, we can observe nearly perfectly overlapping
#214222 - $15.00 USD Received 16 Jun 2014; revised 22 Jul 2014; accepted 23 Jul 2014; published 28 Aug 2014(C) 2014 OSA 8 September 2014 | Vol. 22, No. 18 | DOI:10.1364/OE.22.021508 | OPTICS EXPRESS 21511

[Fig. 2(f)]. This results is a proof that under some circumstances e.g. if the sample is placed farenough from the BMM, this imaging system can be considered indeed as linear shift invariant.
3. Image formation with Bragg magnifier microscope
If an imaging system is linear shift invariant, then the standard Fresnel propagators (i.e. betweenthe planes perpendicular to the optical axis) can be used to model the forward problem. Inthis model, the sample is assumed to be illuminated by a plane wave. The sample itself isrepresented by its transmission function employing the thin object approximation [19]. Thewave field just after the sample is expressed as
U(x,y) =U0(x,y)T (x,y), (1)
where U0(x,y) = exp [2πi( fxx+ fyy)] is a plane wave with spatial frequencies fx, fy andx,y are the spatial coordinates at the sample plane perpendicular to the propagation direction.T (x,y) is the complex transmission function of the object in this case the projection approxi-mation is used. In order to obtain the wave-field at the detector plane we shall propagate thewavefield U(x,y) through the imaging system which is composed of sections of free spacepropagation interleaved with crystal complex amplitude functions (later for simplicity refer-ring as crystal functions). The crystal function is in principle the response of the crystal to agiven impinging plane wave which can be calculated according to dynamical theory of X-raydiffraction [20]. This can be done in the following way:
1. Calculate the Fourier transform of the wavefield after the sample and propagate it in freespace to the position of the first magnifying crystal;
2. Multiply the propagated field by the crystal function;
3. Propagate the resulting field in free space to the position of the second crystal;
4. Multiply the wavefield by the crystal function of the second crystal;
5. Repeat the two steps above for as many crystals as needed, to obtain the wavefield afterthe last crystal;
6. Propagate the resulting field in free space to the detector position.
This procedure can be expressed mathematically in the following way. A similar approachcombining free-space propagation and crystal transfer functions was used before in a moresimple type of systems [21–23]. The wave field at the position of the first crystal is
U1( fx, fy) = U( fx, fy)H1( fx, fy)z1 , (2)
where
H1( fx, fy)z1 = exp[
2πiz1
(√f 2− f 2
x − f 2z
)](3)
is the free space propagator, z1 is the distance from the sample plane to the first crystal (centralposition), f is the frequency and the symbol ˜means Fourier transform. To obtain the wave fieldafter the first crystal we multiply U1( fx, fy) by the crystal function E1
H( fx, fy). The magnifi-cation of the crystal is accomplished by rescaling the spatial frequencies by the magnificationfactor in the direction where such a crystal is diffracting. (in this particular case the horizontaldirection, x coordinate). Then the wavefield is propagated to the position of the second crystal
#214222 - $15.00 USD Received 16 Jun 2014; revised 22 Jul 2014; accepted 23 Jul 2014; published 28 Aug 2014(C) 2014 OSA 8 September 2014 | Vol. 22, No. 18 | DOI:10.1364/OE.22.021508 | OPTICS EXPRESS 21512

using the free space propagator with transformed frequencies in the horizontal direction. Thisis written:
Uc1 ( fx, fy) = U1( fx, fy)E1
H( fx, fy), (4)
U2(fx
M1, fy) = Uc
1 (fx
M1, fy)H1,2(
fx
M1, fy) (5)
where Uc1 ( fx, fy) is the propagated field U1 modified by the crystal function E1
H( fx, fy), M1 isthe magnification factor of the first crystal acting in the horizontal direction (x coordinate),U2(
fxM1
, fy) is the field with transformed frequencies in x-direction and propagated in free spaceto the position of the second crystal. To obtain the field at the position of the third crystal weapply the same procedure as above which can be expressed as follows:
Uc2 (
fx
M1, fy) = U2(
fx
M1, fy)E2
H(fx
M1, fy), (6)
U3(fx
M1M2, fy) = Uc
2 (fx
M1M2, fy)H2,3(
fx
M1M2, fy), (7)
where Uc2 (
fxM1
, fy) is the wave field modified by the second crystal and U3(fx
M1M2, fy) is the wave-
field propagated to the position of the third crystal with scaled frequencies by magnification ofthe second crystal M2 acting in the same direction as the first crystal. We repeat the same pro-cedure for the third and fourth crystal, this time the magnification is applied in the verticaldirection (y coordinate) and finally propagate the field after the fourth crystal onto the detectorplane. We write for the wave field after the third crystal and the wavefield at the position of thefourth crystal:
Uc3 (
fx
M1M2, fy) = U3(
fx
M1M2, fy)E3
H(fx
M1M2, fy), (8)
U4(fx
M1M2,
fy
M3) = Uc
3 (fx
M1M2,
fy
M3)H3,4(
fx
M1M2,
fy
M3). (9)
The fields after the fourth crystal and at the detector position are respectively:
Uc4 (
fx
M1M2,
fy
M3) = U4(
fx
M1M2,
fy
M3)E4
H(fx
M1M2,
fy
M3), (10)
UD(fx
M1M2,
fy
M3M4) = Uc
4 (fx
M1M2,
fy
M3M4)H4,D(
fx
M1M2,
fy
M3M4), (11)
where H4,D is the free space propagator for the segment between the last crystal of the BMMand the detector plane. We can rewrite the forward image formation in a simplified way bydropping the spatial coordinates as the successive multiplications of the free space propagatorsand the crystal functions (with corresponding spatial frequencies) as follows:
UD = U H1 E1H H1,2 E2
H H2,3 E3H H3,4 E4
H H4,D (12)
Finally, the observable intensity ID at the detector is given by:
ID(xD,yD) = |UD(xD,yD)|2 ∗PSF, (13)
where UD(xD,yD) is the wavefield in the spatial domain at the detector plane with spatialcoordinates xD and yD, symbol ∗ is the convolution operator and PSF is the point spreadfunction of the detector.
#214222 - $15.00 USD Received 16 Jun 2014; revised 22 Jul 2014; accepted 23 Jul 2014; published 28 Aug 2014(C) 2014 OSA 8 September 2014 | Vol. 22, No. 18 | DOI:10.1364/OE.22.021508 | OPTICS EXPRESS 21513

To test this approach we performed a numerical simulation based on Eq. (12) and comparedit with the experiment. The sample used was composed of PMMA spheres with diameter of 20µm. The used energy was 10.7 keV, the magnification factors of the four BMM crystals wereM1 = 66.36, M2 = 2.42, M3 = 70.37 and M4 = 2.44 respectively. The crystals were adjusted tothe maximum intensity of their rocking curves. This amounts to a total magnification of 160.57and 171.76 in the horizontal and vertical direction respectively. The simulation parameters wereset to the same values as used in experiment. The comparison of simulated and experimentaldata is shown in Fig. 3. The agreement between the two images is very good.
10µm
10µm
(a)(b)
Figure 3. The measured hologram of PMMA spheres at B16 of Diamond light source (a)and the forward image simulation of the single PMMA sphere (b).
Importantly, the asymmetry of the Fresnel diffraction pattern is well reproduced in the simu-lation. This effect can be simply explained to be caused partially by the different magnificationbetween the horizontal and vertical direction but mainly due to the finite distance betweencrystals magnifying in horizontal and vertical direction. In case of asymmetric diffraction, thewidth of the intrinsic rocking is a function of the asymmetry angle. For the extreme asymmet-ric diffraction the input rocking curve width ∆θin is much larger than the output rocking curvewidth ∆θout , the ratio between the two being the magnification factor for the given crystal:
∆θin
∆θout= M. (14)
As we described in the previous section, the asymmetric diffraction acts as a frequency com-pressor in the diffraction plane of each crystal, producing rescaled output spatial frequencies insuch a plane. This situation for the case of single asymmetric crystal is sketched in the Fig. 4.
The different input and output widths of the rocking curves has a very important consequencefor practical image formation. The actual free space propagation distance z before the asym-metric crystal is also rescaled to an effective propagation distance z′ behind the asymmetriccrystal. From Fig. 4 (left) and Eq. (14) we can express the effective propagation distance z′ as
z′ = ztan(∆θin/2)
tan(∆θin/(2M)). (15)
#214222 - $15.00 USD Received 16 Jun 2014; revised 22 Jul 2014; accepted 23 Jul 2014; published 28 Aug 2014(C) 2014 OSA 8 September 2014 | Vol. 22, No. 18 | DOI:10.1364/OE.22.021508 | OPTICS EXPRESS 21514

H
��in
��out
D
z
z’
ss’ ��in��
out
Figure 4. The illustration of spatial frequency transformation by the asymmetric crystalby the transforming the angular input/output widths (left) and the resulting scaling of thepropagation distance behind the asymmetric diffraction (right).
Therefore, from Eq. (15), the important consequence can be derived. The wavefield free-spacepropagates to the first asymmetric crystal then its diffracting and the spatial frequencies arecompressed in one direction (in this case in horizontal direction), then the wavefield is prop-agating again in free space to the position of the next crystal (magnifying again in horizontaldirection). In the vertical direction, the wavefield is propagated onto a real distance z but in thehorizontal direction (where the frequencies were compressed) the propagation distance is trans-formed by the Eq. 15 so the corresponding effective propagation distance z′ is much smallerin horizontal direction (depending on magnification). This means, that the highly asymmetriccrystal is practically “freezing” the free space propagation in the magnification direction whilein the perpendicular direction (after diffraction) the wavefield is propagating still onto a realdistance. Later the wavefield passes through the vertically magnifying crystals where the sameeffect occur in the vertical direction. As a result, following our geometry, the recorded holo-grams at the detector plane are propagated to longer distance in the vertical direction than in thehorizontal direction.This is the origin of the Fresnel pattern asymmetry which can be reducedby minimizing the distances between the crystals.
4. Phase retrieval
Phase retrieval from a single detected image is a common problem in coherent diffraction imag-ing, where iterative error reduction algorithms are used [12].
The phase retrieval procedures in coherent diffraction imaging are performed on the data de-tected after free space propagation (in far field or Fresnel conditions). However when using theBMM, the near field hologram acquired at the detector encodes the effect of the crystal func-tions and the relative frequency compressions. Although a unique solution to the phase retrievalfor the free-space propagation can be obtained by acquiring data at two different distances [24],this approach makes tomography applications more complicated. Therefore, a number of meth-ods were developed to reconstruct data from a single detected image non-iteratively [16]. Thisis advantageous both in terms of measurement and data analysis speed. We tested a number ofanalytical approaches on our BMM data, but with only a limited success. The reconstructionsuffered from substantial blurring and thus reduced spatial resolution. There are also many at-tempts of application of iterative algorithms [12, 25] for phase retrieval from a single image.These iterative methods provided a much higher spatial resolution in case of BMM experi-mental data. On the other hand, the reconstructed phase maps were typically very unrealistic(see Fig. 5). The algorithm used for reconstruction in this paper is a modification of the onedescribed by Latychevskaia and Fink [25]:
1. Prepare initial guess of the U(x,y), typically array equal to 1.
#214222 - $15.00 USD Received 16 Jun 2014; revised 22 Jul 2014; accepted 23 Jul 2014; published 28 Aug 2014(C) 2014 OSA 8 September 2014 | Vol. 22, No. 18 | DOI:10.1364/OE.22.021508 | OPTICS EXPRESS 21515

2. Scale the detected intensity ID(xD,yD) to have intensity equal to 1 anywhere outside thedetected object.
3. Propagate U(x,y) from the object plane through the BMM to the detector to getUD(xD,yD) .
4. Modify amplitude of UD(xD,yD) to match√
ID(xD,yD) of the detected intensityID(xD,yD).
5. Propagate modified UD(xD,yD) back through the whole system to the object plane to getan updated version of U(x,y).
6. Perform wavelet denoising on |U(x,y)| and arg(U(x,y)).
7. Modify the U(x,y) – wherever |U(x,y)|> 1 set |U(x,y)|= 2−|U(x,y)|, while preservethe phase.
8. Go back to step 3.
Wavelet filtering used in this approach is based on [27] and the multi-resolution support:First the image is decomposed based using the A-trous wavelet into several resolutions (typi-cally 3 in our case) and a residual image. This decomposition is essentially described as:
1. Take the image and calculate smoothed image using a low pass filter given for A-trouswavelet (see [27]).
2. Difference of the image and its smoothed version is the first resolution, store for process-ing.
3. Use the smoothed image as the input in the step 1 to calculate next resolution.
4. The final smoothed image is called the residual image.
All resolutions should have mean equal to 0. At each resolution we define the threshold defin-ing the significant data. Then all pixels within the threshold range are set to 0, thus consideringthem to be a noise. All other pixels having value outside the threshold are preserved, as theycontain significant data. Finally all the resolutions are summed and the residual image to obtainthe filtered one.
The thresholds mentioned above can be calculated rigorously based on the noise propagationinto different resolutions [27] and the multi-resolution support), but we have used here a moresimple approximation. We have simply set the threshold at given resolution to be a −3×σ and+3×σ , where σ is calculated as a standard deviation of pixel values at given resolution.
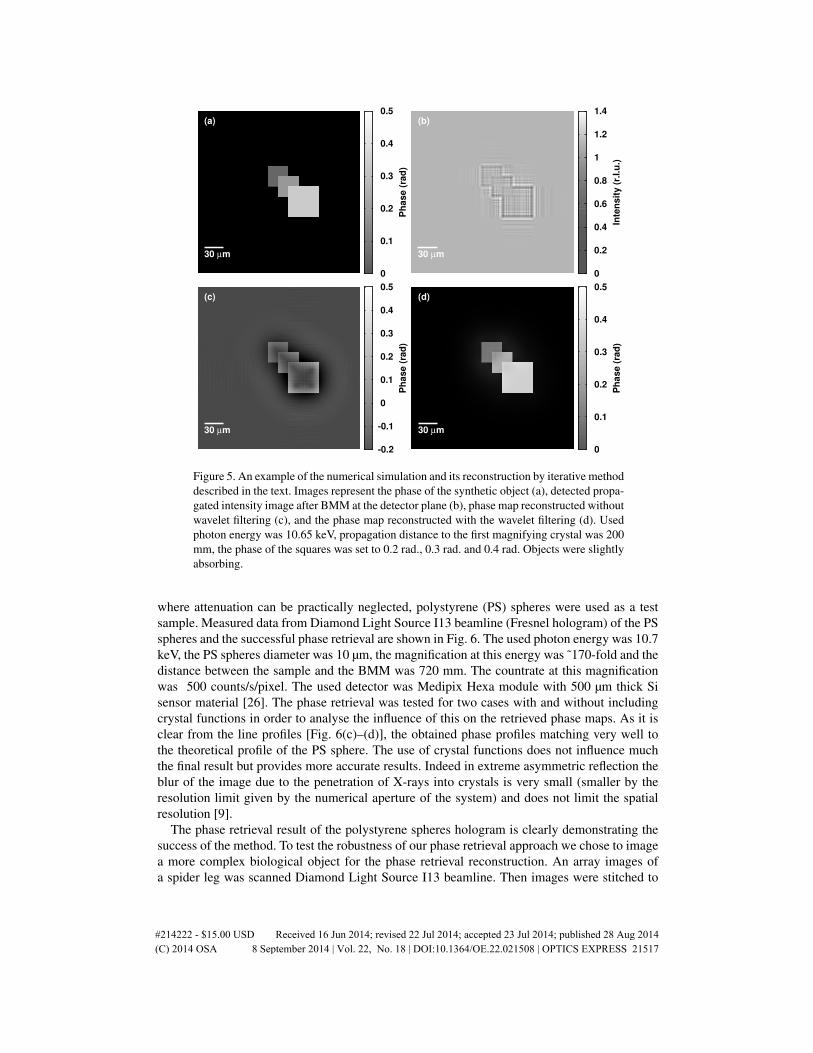
The importance of the denoising mentioned above was tested on synthetic data as shownin Fig. 5. We generated the synthetic object composed of three overlapping squares with thephase shifts of 0.2 rad, 0.3 rad and 0.4 rad [Fig. 5(a)] with small absorption. Such object waspropagated through the BMM system and the phase was retrieved following the proceduredescribed above with and without wavelet denoising. For the simulation we used photon energyof 10.65 keV and the effective pixel size after magnification 0.31 µm. From the reconstructeddata we can see very good agreement of the phase map reconstructed using wavelet filtering[Fig. 5(d)] with the phase of the synthetic object [Fig. 5(a)]. The phase map reconstructedwithout wavelet filtering suffers from artefacts and the phase values are not corresponding tothe original object.
Following the success of the method described above for synthetic data, we applied themethod to a number of experimental data. In order to test the method on a well defined sample,
#214222 - $15.00 USD Received 16 Jun 2014; revised 22 Jul 2014; accepted 23 Jul 2014; published 28 Aug 2014(C) 2014 OSA 8 September 2014 | Vol. 22, No. 18 | DOI:10.1364/OE.22.021508 | OPTICS EXPRESS 21516
0
0.2
0.4
0.6
0.8
1
1.2
1.4
Inte
ns
ity
(r.
l.u
.)
(b)
30 µm
0
0.1
0.2
0.3
0.4
0.5
Ph
as
e (
rad
)
(a)
30 µm
-0.2
-0.1
0
0.1
0.2
0.3
0.4
0.5
Ph
as
e (
rad
)
(c)
30 µm
0
0.1
0.2
0.3
0.4
0.5
Ph
as
e (
rad
)
(d)
30 µm
Figure 5. An example of the numerical simulation and its reconstruction by iterative methoddescribed in the text. Images represent the phase of the synthetic object (a), detected propa-gated intensity image after BMM at the detector plane (b), phase map reconstructed withoutwavelet filtering (c), and the phase map reconstructed with the wavelet filtering (d). Usedphoton energy was 10.65 keV, propagation distance to the first magnifying crystal was 200mm, the phase of the squares was set to 0.2 rad., 0.3 rad. and 0.4 rad. Objects were slightlyabsorbing.
where attenuation can be practically neglected, polystyrene (PS) spheres were used as a testsample. Measured data from Diamond Light Source I13 beamline (Fresnel hologram) of the PSspheres and the successful phase retrieval are shown in Fig. 6. The used photon energy was 10.7keV, the PS spheres diameter was 10 µm, the magnification at this energy was ˜170-fold and thedistance between the sample and the BMM was 720 mm. The countrate at this magnificationwas 500 counts/s/pixel. The used detector was Medipix Hexa module with 500 µm thick Sisensor material [26]. The phase retrieval was tested for two cases with and without includingcrystal functions in order to analyse the influence of this on the retrieved phase maps. As it isclear from the line profiles [Fig. 6(c)–(d)], the obtained phase profiles matching very well tothe theoretical profile of the PS sphere. The use of crystal functions does not influence muchthe final result but provides more accurate results. Indeed in extreme asymmetric reflection theblur of the image due to the penetration of X-rays into crystals is very small (smaller by theresolution limit given by the numerical aperture of the system) and does not limit the spatialresolution [9].
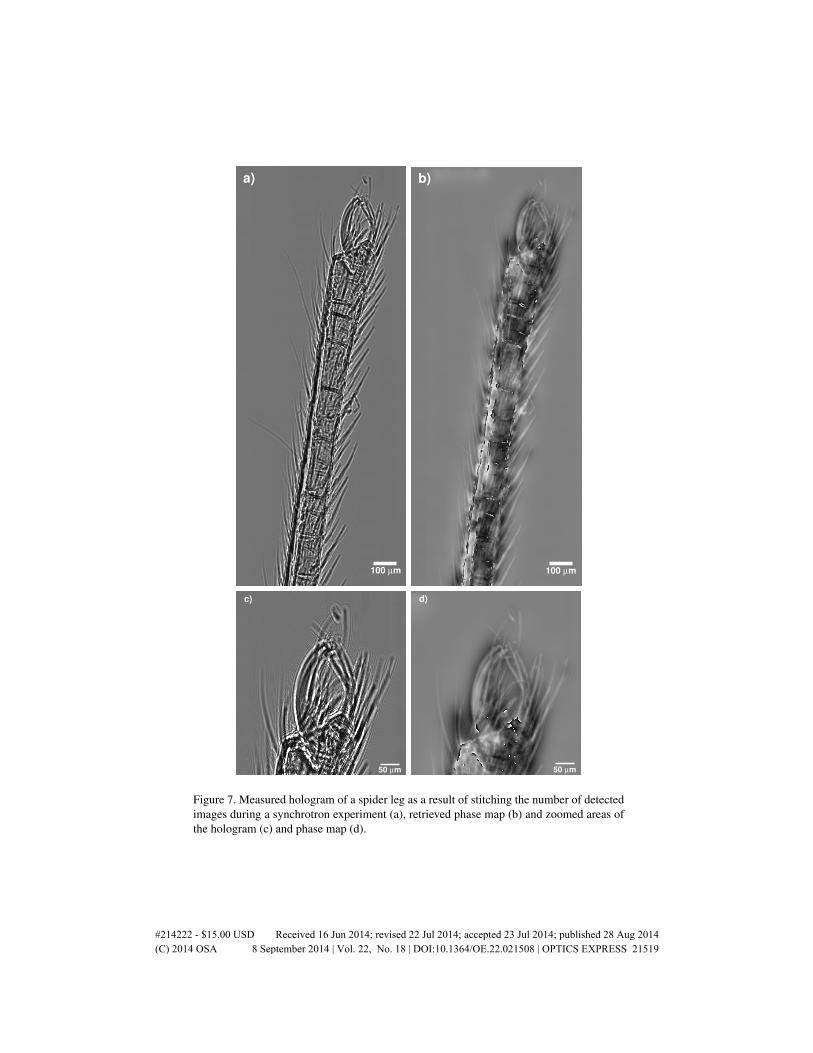
The phase retrieval result of the polystyrene spheres hologram is clearly demonstrating thesuccess of the method. To test the robustness of our phase retrieval approach we chose to imagea more complex biological object for the phase retrieval reconstruction. An array images ofa spider leg was scanned Diamond Light Source I13 beamline. Then images were stitched to
#214222 - $15.00 USD Received 16 Jun 2014; revised 22 Jul 2014; accepted 23 Jul 2014; published 28 Aug 2014(C) 2014 OSA 8 September 2014 | Vol. 22, No. 18 | DOI:10.1364/OE.22.021508 | OPTICS EXPRESS 21517

0
0.2
0.4
0.6
0.8
1
1.2
-20 -10 0 10 20Phase (rad)
Spatial axis (µm)
Line profiles, phase retrieval without CF
thtvbhbvPS
(d)
0
0.2
0.4
0.6
0.8
1
1.2
-20 -10 0 10 20
Phase (rad)
Spatial axis (µm)
Line profiles, phase retrieval using CF
thtvbhbvPS
(c)
0
0.2
0.4
0.6
0.8
1
1.2
1.4
Intensity (r.l.u.)
(a)
20µm 0
0.2
0.4
0.6
0.8
1
1.2
Phase (rad)
(b)
20µm
Figure 6. The measured in-line hologram at Diamond Light Source I13 beamline of 10 µmdiameter PS spheres (a), retrieved phase map (b), line profiles through the spheres wheret,b means top,bottom sphere, h,v means horizontal,vertical profile and PS is the theoreticalphase profile through the PS 10 µm diameter sphere. In Fig. (c) for the phase retrieval weused crystal functions (CF) and in Fig. (d) they have not been used. The used photon energywas 10.7 keV and the magnification achieved at this energy was ˜170-fold.
make a single large image and finally the phase was retrieved. The result is shown in Fig. 7. Itcan be seen that the largely defocused hologram is focused back by our algorithm so the finestructures of the sample are clearly visible. However some parts of the image suffer from phasewrapping which we believed is caused by phase vortexes generated by the sample. Indeed wedid not observe vortical structures (or their effect) in case of weak refracting samples, suchas the PS spheres and therefore we ascribe them to the sample specific rather than the BMMitself. We will investigate this problem further in future works, to reduce the problem of phasewrapping.
#214222 - $15.00 USD Received 16 Jun 2014; revised 22 Jul 2014; accepted 23 Jul 2014; published 28 Aug 2014(C) 2014 OSA 8 September 2014 | Vol. 22, No. 18 | DOI:10.1364/OE.22.021508 | OPTICS EXPRESS 21518
50 µm
c)
100 µm
a)
50 µm
d)
100 µm
b)
Figure 7. Measured hologram of a spider leg as a result of stitching the number of detectedimages during a synchrotron experiment (a), retrieved phase map (b) and zoomed areas ofthe hologram (c) and phase map (d).
#214222 - $15.00 USD Received 16 Jun 2014; revised 22 Jul 2014; accepted 23 Jul 2014; published 28 Aug 2014(C) 2014 OSA 8 September 2014 | Vol. 22, No. 18 | DOI:10.1364/OE.22.021508 | OPTICS EXPRESS 21519

5. Conclusion
We developed a single distance phase retrieval technique for the Bragg Magnifier Microscopeconsidering this imaging system to be linear shift invariant. The successful demonstration ofthis technique is shown on numerical simulation as well as on the measured phantom sampledata and biological objects. The obtained phase values are in very good agreement with theo-retical values. However, in the case of the biological samples we face the problem of the phasewrapping which in future work we would like to solve. Although images from the experimentat Spring8 BL20XU beamline are not shown here because they contain artefacts due to con-taminated crystal surfaces, we reached the count rate of 13375 counts per pixel per second indownstream hutch at the photon energy 10.72 keV. The corresponding magnification was ˜170.This means that acquisition with the time of ˜50ms provides already the images with reason-able signal-to-noise ratio at this beamline. Further optimization in terms of count rate can beachieved and the 1 ms acquisition regime with BMM is possible. This will open up the possi-bility for quantitative high resolution spatial and temporal imaging of dynamic phenomena e.g.in biological systems with a spatial resolution well below one micrometer.
Acknowledgments
We would like to acknowledge the great support in preparation of beamtimes and continuoussupport during experiments of Yoshio Suzuki and Akihisa Takeuchi from Spring8 BL20XUbeamline and Christoph Rau, Joan Vila-Comamala and Ulrich Wagner from Diamond I13beamline. Big thanks belong to Jurgen Hartwig and his colleagues from ESRF optics groupfor quick action in removing surface contamination of our germanium crystals. This work waspartly supported by the Project Research and Development Centre for Advanced X-ray Tech-nologies (ITMS code 26220220170) supported by the Research & Development OperationalProgram funded by the European Regional Development Fund and by the Grant of Scienceand Technology Assistance Agency (project No. APVV-0308-11). DP gratefully acknowledgesfunding from the Australian Research Council.
#214222 - $15.00 USD Received 16 Jun 2014; revised 22 Jul 2014; accepted 23 Jul 2014; published 28 Aug 2014(C) 2014 OSA 8 September 2014 | Vol. 22, No. 18 | DOI:10.1364/OE.22.021508 | OPTICS EXPRESS 21520