User Guide for Alcatel Telephone User Guide for Alcatel Telephone Contents

PLEASE SCROLL DOWN FOR ARTICLE
This article was downloaded by: [Oklahoma State University]On: 16 January 2010Access details: Access Details: [subscription number 784375623]Publisher RoutledgeInforma Ltd Registered in England and Wales Registered Number: 1072954 Registered office: Mortimer House, 37-41 Mortimer Street, London W1T 3JH, UK
The Professional GeographerPublication details, including instructions for authors and subscription information:http://www.informaworld.com/smpp/title~content=t788352615
Worldwide Diffusion of the Cellular Telephone, 1995-2005Jonathan C. Comer a; Thomas A. Wikle a
a Oklahoma State University,
First published on: 03 March 2008
To cite this Article Comer, Jonathan C. and Wikle, Thomas A.(2008) 'Worldwide Diffusion of the Cellular Telephone,1995-2005', The Professional Geographer, 60: 2, 252 — 269, First published on: 03 March 2008 (iFirst)To link to this Article: DOI: 10.1080/00330120701836303URL: http://dx.doi.org/10.1080/00330120701836303
Full terms and conditions of use: http://www.informaworld.com/terms-and-conditions-of-access.pdf
This article may be used for research, teaching and private study purposes. Any substantial orsystematic reproduction, re-distribution, re-selling, loan or sub-licensing, systematic supply ordistribution in any form to anyone is expressly forbidden.
The publisher does not give any warranty express or implied or make any representation that the contentswill be complete or accurate or up to date. The accuracy of any instructions, formulae and drug dosesshould be independently verified with primary sources. The publisher shall not be liable for any loss,actions, claims, proceedings, demand or costs or damages whatsoever or howsoever caused arising directlyor indirectly in connection with or arising out of the use of this material.

Worldwide Diffusion of the Cellular Telephone, 1995–2005
Jonathan C. Comer and Thomas A. WikleOklahoma State University
The mobile telephone is one of the most widely adopted innovations of the late twentieth century. Weexamine the worldwide diffusion of the cellular telephone during a decade of explosive growth. We evaluatethe influences of competition, location, and wealth on global and regional variations in cell phone penetrationand address the role that cultural differences play in technology adoption and use. Telephony measures inthe analysis vary significantly by competition type and by region, although gross national product per capitaexplains more than 75 percent of variation in cell phone penetration rates globally and nearly 90 percent inAsia. Key Words: cell phones, diffusion, telephony.
El telefono celular es una de las innovaciones mas ampliamente adoptada a finales del siglo veinte. Examinamosla difusion internacional del telefono celular durante una decada de crecimiento explosivo. Evaluamos lainfluencia de la competencia, ubicacion y riqueza sobre las variaciones globales y regionales en la penetraciondel telefono celular, y abordamos el papel que desempenan las diferencias culturales en la adopcion y usode la tecnologıa. Las medidas de telefonıa en el analisis varıan significativamente por tipo de competencia ypor region, aunque el producto nacional bruto per capita explica mas del 75 por ciento de la variacion en lastasas de penetracion del telefono celular internacionalmente, y casi un 90 por ciento en Asia. Palabras clave:telefonos celulares, difusion, telefonıa.
This “telephone” has too many shortcomings tobe seriously considered as a means of commu-nication. The device is inherently of no valueto us.
—Internal memo, Western UnionTelegraph, 1877
M iniaturization of computing equipment,improvements in radio technology, and
advancements in high-speed networking havebrought unprecedented change to informationexchange across distances. Handheld mobile(cellular) telephones can capture and displayphotographs, browse the Internet, play musicor movies, and transmit and receive e-mail ortext messages. The most remarkable aspect ofthe cell phone is the tremendous speed at whichit has been adopted by persons in nearly ev-ery country since public networks were first es-tablished in 1981 (Table 1). In 2002, cellular
customers surpassed landline customers as bothexceeded one billion subscribers (1.16 billionvs. 1.09 billion). Just three years later, cellphone subscriptions were nearly twice as nu-merous as landline connections at 2.20 billionversus 1.25 billion (International Telecommu-nication Union [ITU] 2007b).
Along with its economic impact as a con-sumer product, the cell phone has transformedthe ways people interact. Once restricted to sta-tionary nodes, cellular handsets bring privateconversations to public places such as train cars,restaurants, airport waiting areas, and movietheaters. Highway commuting time has be-come talk time and an extension of the office inWestern societies. Ultimately, meetings, infor-mal conversations, family activities, and evenreligious services can be interrupted by a ring-ing phone. By increasing accessibility, the cell
The Professional Geographer, 60(2) 2008, pages 252–269 C© Copyright 2008 by Association of American Geographers.Initial submission, September 2006; revised submissions, February, May, and June 2007; final acceptance, June 2007.
Published by Taylor & Francis, LLC.
Downloaded By: [Oklahoma State University] At: 17:00 16 January 2010

Worldwide Diffusion of the Cellular Telephone, 1995–2005 253
Table 1 Worldwide cellular telephone subscribers, 1980 to 2005
Number of main line Number of cellular Cellular growth perYear subscribers subscribers five-year span
1980 311, 685, 300 23, 500 n/a1985 405, 026, 100 750, 600 3194%1990 519, 791, 500 11, 211, 500 1494%1995 690, 895, 400 90, 781, 500 810%2000 979, 269, 900 739, 952, 100 815%2005 1, 255, 475, 400 2, 203, 086, 000 298%
Source: Data from ITU (2007b).
phone has weakened divisions separating workand leisure, enabling office queries to intrudeon recreational activities and vacations. Withthe decline of family values being a populartopic in the media and in political campaigns,the power of technology to alter interpersonalrelationships has gained considerable attention(Ito 2005). Recent media coverage (Wallis2006) has focused on the impact of electronictechnologies (instant messaging, MP3 players,the Internet, and cell phones) on students’social skills, attention spans, and effort devotedto learning. Increasing wirelessness has createdchallenges and opportunities for education,with significant implications for both privacyand participation in social networks.
Despite its ubiquity, the cell phone has gen-erated less academic interest than the personalcomputer or the Internet (Townsend 2000).Like most studies (Gorman and McIntee 2003),this article examines business and economic is-sues relating to cellular telephony, but with anexplicitly spatial focus on interregional trendsand contrasts. Considering the growing globalimportance and rapid expansion of the cellphone, few studies have assessed the influenceof space and place on this phenomenon, andwe address this deficit by examining global pat-terns of cell phone diffusion over a ten-yearspan. This article investigates factors influenc-ing both the adoption of cell phones and theiruneven spatial diffusion across regions by ask-ing three questions related to growth in cellphone subscriptions: (1) How has the rate of cellphone adoption changed over the past decade?(2) Do adoption patterns vary with respectto location and competition levels? (3) Howstrongly does wealth correlate with cell phoneadoption?
Background
A Century of Mobile CommunicationsWireless telephone was introduced more thana hundred years ago with the developmentof ship-to-ship radio communication for pas-sengers (Pool 1977). Because of bulkiness andpoor sound quality, radio telephones were im-practical for mobile applications until the late1930s when size and weight reductions permit-ted their use in police cars. In 1945, the firstcar-mounted mobile telephone system becameavailable to the public in St. Louis, and dur-ing the 1950s and 1960s mobile telephone sys-tems spread to other U.S. cities and Europeancountries including Sweden (1955), the UnitedKingdom (1959), West Germany (1968), andFinland (1970) (Garrard 1998). Design im-provements soon reduced the size and weight ofmobile phones, improving their usefulness byfacilitating operation away from automobiles.These first portables, called shoulder phonesin Japan and bag phones in the United States,established a trend toward smaller phones. In-troduced in 1984, Motorola’s 800-g DynaTAChandset was a major design innovation. Overthe next decade several companies followed bydeveloping lightweight handsets such as Sam-sung in Japan, Ericsson in Sweden, and Siemensin Germany.
Although the mobile telephone proved tobe a valuable tool for business, early systemssuffered from other limitations besides size, es-pecially in terms of caller capacity. In the 1970sthe radio spectrum for the mobile telephone ap-proached saturation levels in many urban areasas the addition of new channels began to de-grade signal quality. Named for the hexagonal-shaped regions surrounding each base station
Downloaded By: [Oklahoma State University] At: 17:00 16 January 2010

254 Volume 60, Number 2, May 2008
(Davis 1988), cellular systems were designed tomeet increasing consumer demand. In lieu ofhigh-powered transmitters, cell phones weredesigned to use only the power necessary toreach the closest base station in a network, en-abling frequencies to be reused among nonad-jacent cells (Pelton 1995).
Worldwide Diffusion of the CellularTelephoneThe utility of the cell phone extends across ageand gender. Cell phones have gained popular-ity in wealthy countries such as Norway and inthose having low average incomes such as theCongo (Puro 2002). A considerable body of re-search has examined technology diffusion (seeBrown 1981; Islam and Meade 1997; Sarkar1998). As noted by Rogers (1995) the adop-tion of new technologies begins slowly becauseof high development costs, increases rapidly ascosts decline, and eventually levels off as themarket becomes saturated. Technology diffu-sion has been shown to be influenced by ur-banization (Gatignon, Eliashberg, and Robert-son 1989) and by social, demographic, andeconomic traits, especially wealth (Takada andJain 1991; Dekimpe, Parker, and Sarvary 1998;Rouvinen 2004). As a consumer product, thecellular telephone has gained acceptance at anastonishing pace, representing one of the fastestgrowth rates of any technology in history.
A limited body of research has examined cellphone diffusion from a geographic perspec-tive. Most of these studies have considered cellphones within the technological milieu of theearly twenty-first century. For example, Shiodeet al. (2004, 350) suggest that cell phones be-long with Global Positioning System receiversand geographic information systems (both mo-bile and Internet) among location-based ser-vices, defined as “geographically-oriented dataand information services to users across mobiletelecommunication networks.” They also showthat cell phones exhibited the fastest growthand adoption among IT-related services.
Although the cell phone is not the only tech-nological advance to experience rapid growthin the twentieth century, by most measuresit has attained higher household adoptionlevels at a faster pace than other now-commontechnologies. Kellerman (2006) compares thecell phone to the automobile, the wired or
main line telephone, and the Internet. Forexample, main line telephone service increasedfrom first adoption to use by 50 percent of theU.S. population in a single decade (1900–1910)and eventually leveled out at around 90 percentin the 1990s. In contrast, the automobile tookabout thirty years (1910–1940) to reach anadoption rate of 60 percent but also peaked at90 percent in the 1990s. Since the 1960s, Ger-many, France, and the United Kingdom alsosaw increases in adoption for both cars and tele-phones, with telephones surpassing cars duringthe 1970s. Internet adoption rates from themid-1990s through 2002 mirrored those of cellphones but at slightly lower rates in the UnitedStates, the United Kingdom and Germany.
Kellerman (2006, 109) notes that such lon-gitudinal studies of personal mobility are morethan exercises in “historical curiosity” becausethey facilitate a better understanding of the dy-namic nature of other personal technologies.For example, will cell phones replace mainlines? Will virtual mobility reduce the needfor physical mobility? These questions haveimplications for existing, entrenched technol-ogy companies, for transportation infrastruc-tures, and for the global economy throughthe changing fortunes of today’s multinationaltelecommunications corporations (henceforth“telecoms”). Despite the enormous influenceof telecoms, large-scale international compar-isons of mobile media have yet to appear(Kellerman 2006). We begin to address thisdeficit by evaluating global cell phone diffusionpatterns.
Data and Methodology
Our overall objective is to evaluate factors con-tributing to spatial variations in rates of cellphone adoption. Data from the ITU are usedbecause of their consistency and comprehen-siveness for 206 countries and equivalent po-litical entities such as Hong Kong and Macau.We focus on the period 1995 to 2005 to doc-ument the meteoric growth of cell phone useduring the decade when it experienced a tran-sition from tool of the privileged to a prod-uct of mass consumer appeal. For the purposeof our study we define phone subscriptionsper one hundred people as the penetration oradoption rate and our main variable of interest.
Downloaded By: [Oklahoma State University] At: 17:00 16 January 2010

Worldwide Diffusion of the Cellular Telephone, 1995–2005 255
Additional variables include shares of both cel-lular and main line (wired) phones as a percent-age of total phones and five-year compound an-nual growth rates (CAGR)1 for both cell phonesand main line phones. Population, populationdensity, total gross domestic product (GDP),and GDP per person are also considered inour analyses (ITU 2007b). In addition, dataon the number of cell phone providers withineach country2 (ITU 2007a) are used to classifycountries as monopoly, duopoly,3 partial com-petition, or full competition.
We use these data to explore three questions.First, how have temporal and spatial patterns ofpenetration changed over the study period, par-ticularly at the regional level? Second, are theresignificant differences in penetration based onlocation and the presence or absence of com-petition? Third, how strongly is cell phonepenetration influenced by other variables andhave these influences changed over time? Thistype of analysis, usually using income, compe-tition (both mobile and fixed line), subscrip-tion prices, and governmental regulations asexplanatory variables, forms the basis of pre-dicting future cell phone growth and provideskey information for making policy decisionsin the developing world, a topic that has re-ceived much attention (Gruber 2001; Maddenand Coble-Neal 2004; Waverman, Meschi, andFuss 2005).
Given the challenge of examining the pat-terns of cell phone diffusion on a global ba-sis, our analysis follows the United Nations(UN) classification scheme employed by theITU: Africa, the Americas, Asia, Europe, andOceania. The three research questions andmethodologies are addressed in separate sec-tions using this regionalization scheme as acomparative framework.
Cell Phone Penetration and Diffusion,
1995–2005
Figure 1 summarizes change over the studyperiod by representing four measures of cellphone growth from 1995 to 2005: (A) totalcell phone subscriptions (in thousands), (B) cellphone subscriptions per one hundred people(penetration), (C) CAGR over the precedingfive years, and (D) the share of cell phonesubscriptions to all telephone subscriptions
(percentage). As Figure 1A demonstrates, cellphone usage grew rapidly over the study period,increasing from just over 90 million subscribersin 1995 to over 2.2 billion in 2005 (ITU 2007b).Although Europe and the Americas were theinitial leaders, in 2001 Asia surpassed all otherregions in total cell phone subscriptions. Morerevealing is Figure 1B, showing cell phone pen-etration over time. Here Oceania is misleadingbecause Australia and New Zealand comprise97 percent of cell phone subscriptions and 98percent of the population (ITU 2007b). Else-where, although both the Americas and Eu-rope have some very poor countries (Haiti at$445 and Moldova at $609 GDP per person),these regions are wealthier on average than Asiaand Africa and accordingly have notably higherpenetration rates. In addition to regional dif-ferences, this figure shows penetration was stillgrowing at an increasing rate across the planetin 2005 even though cell phone CAGRs havebeen declining since the global peak in 1998(Figure 1C). Africa, with the lowest penetra-tion and fewest total phone subscriptions, hasalso seen the steepest decline in CAGR, a signthat the first major wave of cell phone adoptionhas crested. Nevertheless, Africa’s CAGR wasthe highest over the decade because of large,untapped markets in which telecoms were be-ginning to operate (The Economist 2006).
One explanation for rapid growth of cellphones in Africa and Eastern Europe relativeto other regions is that main line telephoneswere historically expensive or difficult to ob-tain. Cell phones are especially important inAfrica, where other modes such as roads, postalsystems, and main line phones are frequentlyunreliable. In these places, cell phones rep-resent opportunities for first-time phone sub-scribers ( James 2002), a phenomenon knownas leapfrogging (Steinmueller 2001) that is typ-ical in less developed areas (Aoyama 2003). Asa result, Figure 1D demonstrates Africa’s leadsince 2001 in cell phones as a percentage oftotal phones.
After the fall of communism, former Sovietbloc countries needed major upgrades to tele-phone infrastructures that had suffered yearsof neglect. In lieu of rebuilding main line tele-phones, providers in these countries installedadvanced digital networks that passed over first-and second-generation mobile technologies(Singh 1999; Steinmueller 2001; Gruber 2001).
Downloaded By: [Oklahoma State University] At: 17:00 16 January 2010

256 Volume 60, Number 2, May 2008
Figure 1 Regional and global cell phone statistics, 1995–2005.
In 1995 this process was just beginning, and thehighest penetration rate in Eastern Europe wasjust 2.6 percent (Hungary). In contrast, pen-etration rates exceeded 20 percent in Norway,Sweden, and Finland in 1995. By 2005, penetra-tion in Eastern Europe ranged from 26 percent(Moldova) to 127 percent (Lithuania), and inWestern Europe only France remained below90 percent and Luxembourg led the world witha penetration rate of 155 percent (ITU 2007b).
Global snapshots of cell phone penetrationfor the beginning, middle, and end of thestudy period (Figure 2) highlight Europe’searly lead in penetration as well as Africa’slate emergence. As of 2005 large enclaves withpenetration rates of less than 5 percent were
still apparent in Central Africa and SouthwestAsia. Having descriptively reviewed temporaland spatial trends in cell phone characteristics,we pursue more rigorous and quantifiable ex-planations for these patterns in the next twosections.
Variation of Telephony Variables
across Competition Levels
and Regions
A key factor in the growth and diffusion ofcellular phones has been competition (Gruberand Verboven 2001; Wallsten 2001). Whereasinvestments in main line infrastructure make
Downloaded By: [Oklahoma State University] At: 17:00 16 January 2010

Worldwide Diffusion of the Cellular Telephone, 1995–2005 257
Figure 2 Global cell phone penetration, 1995–2005.
it inefficient to have more than one oper-ator within a geographic area, numerouscellular networks can function within thesame geographic region. In addition, smallerinvestment costs enable cellular systems toexpand into areas where main line service is noteconomical. A logical assumption is that opencellular competition within a country wouldfacilitate more rapid growth in subscriptionsthan in countries with limited competitionor monopolies (Gruber 2001). We use ITUdata measuring competition levels to evaluatethe influence of competition on cell phonediffusion. The ITU categorizes countries asmonopolies (nineteen countries), duopolies(one country), partial competition (fifty-fivecountries), and full competition (eighty-fivecountries), with forty-six countries unclassified(ITU 2007a). Combining the duopoly withmonopoly countries to form a category with
effectively no competition leaves three robustcategories of competition (none, partial, full).
Analysis of variance differentiates the influ-ence of competition with respect to the spreadof cellular penetration. Six telephony attributesmoderately vary among competition levels(significant at the 0.10 level) whereas GDPdoes not vary significantly (Table 2). The mostsignificant difference across competition levelsis cell phones’ share of total phones, with mo-nopolies averaging below 60 percent comparedto nearly 75 percent for countries with somecompetition. For all three phone penetrationmeasures (total, cell, and main line), the threecompetition levels vary significantly from oneanother, with monopolies always having thelowest penetration rates and full competitionthe highest. These measures demonstratethe restrictive nature of telephone access incountries with little or no phone competition.
Downloaded By: [Oklahoma State University] At: 17:00 16 January 2010

258 Volume 60, Number 2, May 2008
Table 2 Analysis of variance of telephony variables, by competition level, 2005
Variable Competition Countries M F statistic Significance
Cell phone CAGR (2000–2005) None 19 54.6Partial 52 64.8Full 84 47.8Total 155 54.4 2.5 0.085
Cell phones per one hundred people None 17 31.5Partial 55 40.3Full 84 51.6Total 156 45.4 3.0 0.052
Cell phones as percentage of total phones None 20 58.5Partial 55 73.9Full 85 73.2Total 160 71.6 7.1 0.001
Main line CAGR (2000–2005) None 19 7.1Partial 55 5.6Full 81 3.5Total 155 4.7 2.6 0.079
Main lines per one hundred people None 16 15.7Partial 55 17.3Full 80 23.9Total 151 20.6 2.6 0.077
Total lines per one hundred people None 15 46.0Partial 55 55.5Full 81 74.9Total 151 65.0 3.2 0.043
Gross domestic product per person ($) None 14 5,435Partial 52 7,961Full 82 9,284Total 148 8,455 0.6 0.552
Note: CAGR = compound annual growth rate.Source: Data from ITU (2007a, 2007b).
However, most of these countries are attempt-ing to catch up as cell phone and main lineCAGR values are higher for countries withmonopolies or partial competition than forthose with full competition.
A parallel analysis of variance using regionaldivisions provides evidence of the uneven spa-tial diffusion of telephony. Table 3 shows re-sults for the same variables shown in Table 2, byregion. All variables are significantly differentacross regions to the 0.000 significance level.Although the degrees of freedom vary slightly,the F values are generally comparable for thevariables tested. A review of significance pastthree decimal points reveals that the three pen-etration measures (cell, main line, and total)exhibit the most interregional differences andthey all follow a consistent pattern with Eu-rope having the highest penetration and Africathe lowest. Cell phones as a percentage of totalphones and cell phone CAGR echo the resultsshown in Figures 1C and 1D. Africa has ex-perienced the highest growth since 2000 andcell phones comprise the largest share of to-
tal phones there. With respect to main lineCAGR, Europe is adding the fewest main lineconnections and Asia and Africa have the high-est growth rates as they attempt to catch up intotal telephone connections.
Influence of Wealth on Cell Phone
Penetration
Ahn and Lee (1999) find that the probabil-ity of subscribing to telephone service is posi-tively correlated with per capita GDP. This as-sertion is also suggested by Kellerman (2006)and Shiode et al. (2004) but largely on thebasis of qualitative observations. Waverman,Meschi, and Fuss (2005) measure this im-pact with a cross-sectional model of poorercountries. Regression analysis is used hereto quantify the extent to which socioeco-nomic traits influence cell phone penetra-tion. As a starting point, variables evaluated aspotential predictors of mobile phone penetra-tion included GDP per person (ITU 2007b),
Downloaded By: [Oklahoma State University] At: 17:00 16 January 2010

Worldwide Diffusion of the Cellular Telephone, 1995–2005 259
Table 3 Analysis of variance of telephony variables by region, 2005
Variable Region Countries M F statistic Significance
Cell phone CAGR (2000–2005) Africa 50 83.2Americas 43 45.5Asia 44 58.7Europe 45 31.1Oceania 14 47.3Total 196 54.9 9.6 0.000
Cell phones per one hundred people Africa 55 16.5Americas 42 49.7Asia 44 40.9Europe 42 86.0Oceania 15 28.3Total 198 44.6 39.7 0.000
Cell phones as percentage of total phones Africa 55 83.2Americas 43 71.6Asia 47 65.9Europe 45 68.5Oceania 15 65.9Total 205 72.3 7.7 0.000
Main line CAGR (2000–2005) Africa 51 6.5Americas 35 3.8Asia 47 8.2Europe 43 0.3Oceania 11 3.0Total 187 4.8 8.8 0.000
Main lines per one hundred people Africa 50 3.9Americas 35 24.2Asia 44 17.3Europe 41 42.1Oceania 11 17.4Total 181 20.6 38.8 0.000
Total lines per one hundred people Africa 51 17.6Americas 35 67.6Asia 43 56.5Europe 41 126.7Oceania 10 48.6Total 180 63.2 46.3 0.000
Gross domestic product per person ($) Africa 47 1,408Americas 41 7,684Asia 40 7,024Europe 38 20,412Oceania 6 8,353Total 172 8,651 17.6 0.000
Note: CAGR = compound annual growth rate.Source: Data from ITU (2007b).
education (United Nations 2006), and agestructures and GDP growth rates (Central In-telligence Agency 2007). Several factors favorthe exclusive use of GDP per person in log-arithmic form. First, although most socioeco-nomic variables have strong correlations withpenetration, GDP produces the highest corre-lation and the best log-linear fit with cell phonepenetration. The preeminence of GDP occursfor every year of analysis (1995–2005), for aglobal model, and for analysis conducted sepa-rately for each region. Second, as collected bythe ITU (2007b), GDP is uniform and reli-able and is reported for most of the 206 coun-
tries and political entities through 2005. Fi-nally, there is moderately high multicollinearitybetween the other factors and they all correlatesignificantly with GDP.
A logarithmic transformation of GDP perperson is necessary to use linear regression, asscatterplots of the raw variables display con-cave shapes in all regions except Oceania (n =6). Log-linear plots produce more linear trendswith higher r2 values and smaller standarderrors. Globally, GDP per person is heavilyskewed to the right, partially because of out-liers such as Luxembourg ($69,027 in 2005). Atthe other extreme it should be noted that over
Downloaded By: [Oklahoma State University] At: 17:00 16 January 2010

260 Volume 60, Number 2, May 2008
Figure 3 Scatterplot of gross domestic product (GDP) per person and cell phone penetration, world,2005.
half the world’s countries produce less than$1,000 GDP per person. In logarithmic formGDP per person in 2005 is a strong predictor ofglobal cell phone penetration with a coefficientof determination (r2) of 0.776. Figure 3 demon-strates that the highest GDP and cell penetra-tion values (top-right quadrant) are within Eu-ropean and American countries, although thesecountries are also more scattered around the re-gression line than low-GDP, low-penetrationcountries. Also, a number of Asian countrieshave incomes and penetration rates similar toEurope including Hong Kong, Macau, Singa-pore, South Korea, and Taiwan in East Asiaand Bahrain, Kuwait, and Qatar in SouthwestAsia.
Although global models might be appropri-ate for representing regional variations in cellphone penetration, they might be less usefulfor showing local trends. Global and regionalregression models also fail to account for theinfluence of hard-to-quantify cultural and so-cial influences on the adoption of new tech-nologies. Therefore, the following brief sec-
tions present regional regression analyses forfour of the five major UN classifications usedin this analysis plus some discussion pertain-ing to unique local circumstances that affectpenetration. Summary statistics for these re-gional models are given in Table 4. We omitdiscussion of Oceania because only six of itsfifteen countries in the ITU data set have re-ported GDP values. We conclude the analy-sis with a review of changes that have takenplace during the period between 1995 and2005.
Table 4 Comparison of regression models, GDPper person vs. penetration, 2005
Region Countries r2 F statistic Significance
Oceania 6 0.952 78.5 0.001Asia 39 0.865 237.9 0.000Africa 47 0.578 61.7 0.000Europe 38 0.573 48.4 0.000Americas 40 0.405 25.8 0.000World 170 0.776 580.4 0.000
Source: Data from ITU (2007b).
Downloaded By: [Oklahoma State University] At: 17:00 16 January 2010

Worldwide Diffusion of the Cellular Telephone, 1995–2005 261
Africa’s Rapid Cellular ExpansionAlthough trailing the rest of the world in cellphone penetration, since 2000 Africa has ex-perienced the fastest cell phone growth rates.Africa’s r2 value for GDP and penetration is0.578 (Figure 4A). Although the model is agood fit below $2,000 (logarithm value 3.30),above this figure there is wide variation incell phone penetration with South Africa po-sitioned ahead of the pack as others, includ-ing Libya, lag behind. This disparity capturesthe dichotomies of African connectivity over-all; the region has the lowest phone penetra-tion rates but the highest growth rates as itovercomes a late start in the mobile phone era.Africa’s recent growth can be partly explainedby the historical paucity and unreliability ofmain lines coupled with a delayed entry intothe mobile era owing to the lagging economicdevelopment of the region. As a result, todaymobile phones substitute (leapfrog) main linesthat can still take years to obtain in develop-ing countries (Madden and Coble-Neal 2004;Waverman, Meschi, and Fuss 2005), whereas inmany other parts of the world cell phones com-plement main lines (Ahn and Lee 1999; Gru-ber 2001). Especially in developed nations likethe United States, such complementarities existbecause a large percentage of cellular calls areplaced to main line numbers, and thus the cellphone’s usefulness depends on the ubiquity ofthe main line network (Gruber 2001).
The factors that most set Africa apart interms of the use of telephony, however, mightbe the different ways Africans use cell phonescompared to people in other regions and thepotential developmental impact of cell phones.As business tools, cell phones are often sharedwithin extended families or even villages. Aleading approach to microlending providesfunds to women for cell phones, which theythen rent out by the call (The Economist2005b). Cell phones are used in rural Africato access commodity prices, improving thebargaining power of rural businesses that dealwith wholesalers ( James 2002), and a growingtrend is the use of text messages as cash creditsin lieu of actual cash transactions, both forbusinesses and individuals (The Economist2005a). Furthermore, cell phone diffusion isconsidered important in improving Africa’seconomic situation rather than as a by-productof the booming, Western, technology-based
societies. A recent study (Waverman, Meschi,and Fuss 2005) finds that an extra ten phonesper hundred people in developing countriesraises GDP growth by 0.6 percent. Thisstudy touts cell phones as an avenue to bettereconomic development. With a rapid influx offoreign telecom providers entering the Africanmarket, long-absent competition could usherin a new era of affordable, ubiquitous cellphone coverage (The Economist 2006).
An Early Mobile Culture in EuropeEurope’s first cellular system was introducedin Sweden, Norway, and Finland in 1981. De-spite its early lead in the establishment of cel-lular systems, Europe’s cellular networks suf-fered from compatibility problems, making itdifficult for subscribers to use their phones out-side of country-based calling areas. As a result,compatibility and standards issues quickly be-came critical (Agar 2005) and led to the de-velopment of a pan-European cellular systemcalled Groupe Speciale Mobile (GSM), todayknown as Global System for Mobile Commu-nications. By permitting compatibility amongnetworks, GSM has been an important factorin Europe’s lead in cellular penetration. Al-though cell phone growth rates have slowedconsiderably (Figure 1C), Europe still has thesecond-highest number of cell phone subscrip-tions (Figure 1A) and the highest cell phonepenetration rate (Figure 1B), with Luxembourg(155 percent), Lithuania (127 percent), andItaly (124 percent penetration) comprising theworld’s top three countries in penetration rate(ITU 2007b). Penetration rates above 100 per-cent occur when individuals own more than onecell phone, often purchasing separate subscrip-tions for business and personal use. In 2005,nineteen countries had cell phone penetrationrates above 100 percent (ITU 2007b).
Europe has higher penetration rates than theUnited States and a greater tendency to use textmessaging, but both Europeans and Americanshave generally shunned Internet applicationsthat are wildly popular in Japan, even thoughthe technology is presently available and of-fered on many models. Instead, Europeansand Americans still predominantly prefer per-sonal computers for surfing the Internet, andmobile commerce (M-commerce) has to datebeen considered a “flop” in the United States
Downloaded By: [Oklahoma State University] At: 17:00 16 January 2010

262 Volume 60, Number 2, May 2008
Figure 4 Scatterplot of gross domestic product (GDP) per person and cell phone penetration, Africaand Europe, 2005.
Downloaded By: [Oklahoma State University] At: 17:00 16 January 2010
Worldwide Diffusion of the Cellular Telephone, 1995–2005 263
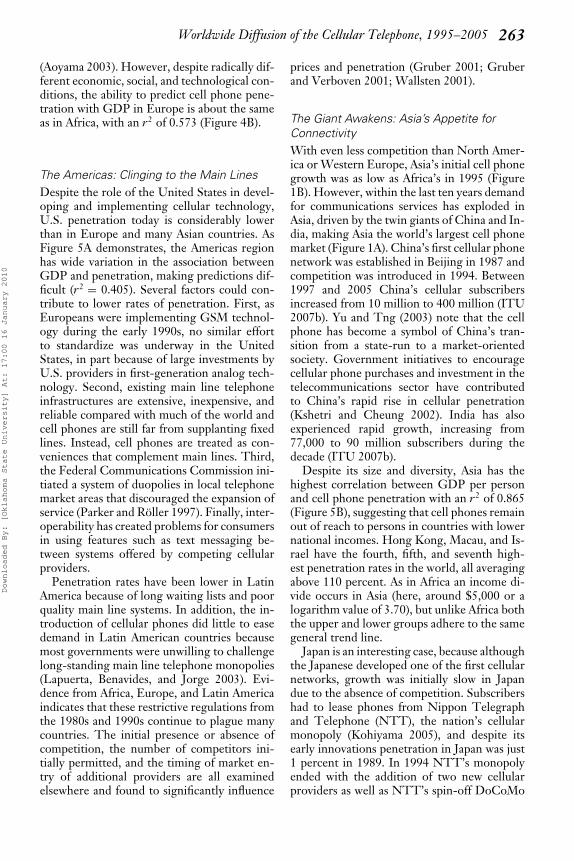
(Aoyama 2003). However, despite radically dif-ferent economic, social, and technological con-ditions, the ability to predict cell phone pene-tration with GDP in Europe is about the sameas in Africa, with an r2 of 0.573 (Figure 4B).
The Americas: Clinging to the Main LinesDespite the role of the United States in devel-oping and implementing cellular technology,U.S. penetration today is considerably lowerthan in Europe and many Asian countries. AsFigure 5A demonstrates, the Americas regionhas wide variation in the association betweenGDP and penetration, making predictions dif-ficult (r2 = 0.405). Several factors could con-tribute to lower rates of penetration. First, asEuropeans were implementing GSM technol-ogy during the early 1990s, no similar effortto standardize was underway in the UnitedStates, in part because of large investments byU.S. providers in first-generation analog tech-nology. Second, existing main line telephoneinfrastructures are extensive, inexpensive, andreliable compared with much of the world andcell phones are still far from supplanting fixedlines. Instead, cell phones are treated as con-veniences that complement main lines. Third,the Federal Communications Commission ini-tiated a system of duopolies in local telephonemarket areas that discouraged the expansion ofservice (Parker and Roller 1997). Finally, inter-operability has created problems for consumersin using features such as text messaging be-tween systems offered by competing cellularproviders.
Penetration rates have been lower in LatinAmerica because of long waiting lists and poorquality main line systems. In addition, the in-troduction of cellular phones did little to easedemand in Latin American countries becausemost governments were unwilling to challengelong-standing main line telephone monopolies(Lapuerta, Benavides, and Jorge 2003). Evi-dence from Africa, Europe, and Latin Americaindicates that these restrictive regulations fromthe 1980s and 1990s continue to plague manycountries. The initial presence or absence ofcompetition, the number of competitors ini-tially permitted, and the timing of market en-try of additional providers are all examinedelsewhere and found to significantly influence
prices and penetration (Gruber 2001; Gruberand Verboven 2001; Wallsten 2001).
The Giant Awakens: Asia’s Appetite forConnectivityWith even less competition than North Amer-ica or Western Europe, Asia’s initial cell phonegrowth was as low as Africa’s in 1995 (Figure1B). However, within the last ten years demandfor communications services has exploded inAsia, driven by the twin giants of China and In-dia, making Asia the world’s largest cell phonemarket (Figure 1A). China’s first cellular phonenetwork was established in Beijing in 1987 andcompetition was introduced in 1994. Between1997 and 2005 China’s cellular subscribersincreased from 10 million to 400 million (ITU2007b). Yu and Tng (2003) note that the cellphone has become a symbol of China’s tran-sition from a state-run to a market-orientedsociety. Government initiatives to encouragecellular phone purchases and investment in thetelecommunications sector have contributedto China’s rapid rise in cellular penetration(Kshetri and Cheung 2002). India has alsoexperienced rapid growth, increasing from77,000 to 90 million subscribers during thedecade (ITU 2007b).
Despite its size and diversity, Asia has thehighest correlation between GDP per personand cell phone penetration with an r2 of 0.865(Figure 5B), suggesting that cell phones remainout of reach to persons in countries with lowernational incomes. Hong Kong, Macau, and Is-rael have the fourth, fifth, and seventh high-est penetration rates in the world, all averagingabove 110 percent. As in Africa an income di-vide occurs in Asia (here, around $5,000 or alogarithm value of 3.70), but unlike Africa boththe upper and lower groups adhere to the samegeneral trend line.
Japan is an interesting case, because althoughthe Japanese developed one of the first cellularnetworks, growth was initially slow in Japandue to the absence of competition. Subscribershad to lease phones from Nippon Telegraphand Telephone (NTT), the nation’s cellularmonopoly (Kohiyama 2005), and despite itsearly innovations penetration in Japan was just1 percent in 1989. In 1994 NTT’s monopolyended with the addition of two new cellularproviders as well as NTT’s spin-off DoCoMo
Downloaded By: [Oklahoma State University] At: 17:00 16 January 2010

264 Volume 60, Number 2, May 2008
Figure 5 Scatterplot of gross domestic product (GDP) per person and cell phone penetration, Americasand Asia, 2005.
Downloaded By: [Oklahoma State University] At: 17:00 16 January 2010

Worldwide Diffusion of the Cellular Telephone, 1995–2005 265
(Do Communications on the Mobile) and in1995 penetration had increased to 9 percent(ITU 2007b). DoCoMo introduced i-mode in1999, a digital phone that features high-speedaccess to the Internet as well as text, music,and video (Ito 2005), and Japan’s penetrationsteadily climbed to 75 percent in 2005 (ITU2007b).
Despite the success of text messaging in acountry where vocal public cell phone conver-sations are considered impolite (Okabe and Ito2005), Japan, like the United States, has an ex-cellent main line telephone system and com-plementarities of main lines and cell phoneshave kept cell phone penetration rates belowwhat would be predicted by income. However,Japan and the United States have experiencednotably different evolutionary paths of digi-tal and mobile communications. These differ-ences are as much cultural as technological, butonly recently have the “sociogeographical” in-fluences gained attention (Aoyama 2003) as thecell phone has come to be seen as “located inspecific social, cultural, and historical contexts”(Ito 2005, 5). This is in contrast to the Internet,which is still studied as a homogeneously usedglobal product.
Significant differences in cell phone use to-day between the United States and Japan thatstem from divergent cultural factors include:(1) Japanese reliance on using cell phones fore-mail as an outgrowth of the youth pagermovement of the 1990s (Miyata et al. 2005),(2) development of social standards and evenregulations concerning the use of cell phoneson Japanese public transportation (Okabe andIto 2005), (3) much heavier use in Japanof cell phones for Internet browsing due tolower levels of PC ownership (Ito 2005), and(4) the dominance of PC-based electronic com-merce (E-commerce) in the United States com-pared to the explosion of cell-phone-based M-commerce in Japan (Aoyama 2003). In each ofthese instances, historical, cultural, technolog-ical, and even environmental differences (i.e.,population density) combine to create uniquecircumstances that influence cell phone use andpenetration today.
Changing Influences on Cell PhonePenetration, 1995–2005We conclude the analysis by tracking changesin correlations between cell phone penetration
and the other telephony variables, as well aswith GDP per person (Figure 6). Of greatestinterest, the correlation between GDP per per-son and penetration has increased in strengthfrom 0.671 in 1995 to a peak of 0.890 in 2004and GDP thus has become a stronger correlatewith cell phone penetration over time. This re-sult bolsters our decision to make GDP the pri-mary explanatory variable and aligns with otherstudies that have found strong connections be-tween income and cell phone adoption (Ahnand Lee 1999; Kellerman 2006).
As expected, main line and total phone pene-tration rates correlate closely with cell phonepenetration, with Pearson’s r values rangingfrom 0.71 to 0.84 for main lines and 0.80 to 0.97for total phones. The relation between mainline and cell phone penetration is of specific in-terest as it relates to the competition question.Through 2002 the correlation between thesetwo penetration measures steadily increased buthas since declined. This change coincides withother research, in which earlier complemen-tarities of cell phones and main lines as docu-mented in Eastern Europe (Gruber 2001) andworldwide (Ahn and Lee 1999) might be giv-ing way to substitution effects as documentedin Western Europe (Gruber and Verboven2001) and worldwide (Madden and Coble-Neal2004). People in some developed countries areabandoning their main lines and people in de-veloping countries see mobile phones as theirfirst and best opportunity to obtain cheap, reli-able phone service.
Throughout the study period, both cell andmain line phone CAGR have correlated nega-tively, but weakly, with cell phone penetration.Cell phone penetration has climbed steadily up-ward (Figure 1B) and cell phone CAGR appearsto have precipitously dropped (Figure 1C), pro-ducing the weak negative correlation. How-ever, it must be noted that compound annualgrowth is still at least 20 percent in all regionsand is outpacing population growth. Thus, thenumber of cell phones worldwide (Figure 1A)and cell phone penetration (Figure 1B) showno signs of abatement and cell phone penetra-tion is forecast to grow through at least 2010 inmany parts of the world (Shiode et al. 2004).
Finally, it is noteworthy that the strengthin correlation between cell phones as a per-centage of total phones and cell phone pene-tration has decreased since 1998 and presently
Downloaded By: [Oklahoma State University] At: 17:00 16 January 2010

266 Volume 60, Number 2, May 2008
Figure 6 Correlations of cell phonepenetration with other telephony vari-ables, 1995–2005. GDP = gross do-mestic product; CAGR = compoundannual growth rate.
is nearing zero. This is the only relationshipin Figure 6 that has noticeably changed since1995. The case of Africa helps demonstrate thisphenomenon, as it has the highest value for cellphones as a percentage of total phones (83%in 2005 and rapidly increasing) but converselythe lowest penetration rate (fifteen cell phonesper one hundred people and slowly increasing).Although Africa has had the highest CAGRthrough the study period, its delayed entry intomobile telephony means that modest numericalgains in numbers of cell phones translate intohuge growth rates. The mobilization of Africais underway as large telecoms are finally willingto take the financial risks of operating in thatmarket and the growth potential is still veryhigh (The Economist 2006).
As noted earlier, mobile phones are clearly asubstitute for main line phones in most Africancountries. In the rest of the world the evidenceis mixed but a transition from substitution ef-fects (Gruber and Verboven 2001; Madden andCoble-Neal 2004) to complementarities (Ahnand Lee 1999; Gruber 2001) has been postu-lated here. In preliminary analyses, we foundweak correlations between the other variablesand cell phones as a percentage of total phones
(r < |0.5|) and nearly all of the longitudinal cor-relations trended toward zero between 1995and 2005. It is therefore not surprising thatthe correlation of cell phone penetration andcell phone “market” share is becoming moreunpredictable over time as these two variablescapture notably different aspects of the mobilemarket worldwide.
Discussion and Conclusions
The cell phone and the Internet are techno-logical contemporaries, having both emergedin the 1990s as widely used consumer and busi-ness tools, and perhaps as a consequence theyhave often been studied together and with sim-ilar approaches. Unlike the Internet, however,the cell phone is much less inhibited by illit-eracy and the availability of electricity in thedeveloping world. As a result, diffusion andpenetration of the cell phone has outpaced theInternet (Kellerman 2006) to become a nearlyubiquitous business and consumer commod-ity. The diverse ways it is used worldwide aregenerating a body of scholarship focusing onvarious aspects of the cell phone phenomenon.The complementary uses of main lines and cell
Downloaded By: [Oklahoma State University] At: 17:00 16 January 2010

Worldwide Diffusion of the Cellular Telephone, 1995–2005 267
phones in the United States, the high level oftext messaging and M-commerce in Japan, andthe economic importance of the cell phone toAfrican merchants all typify the spatial uneven-ness of cell phone usage worldwide as well as itsdiverse economic impacts, both potential andrealized (Waverman, Meschi, and Fuss 2005).
Competition and wealth are frequently citedfactors in understanding the global diffusionof the cell phone. These are logical assertionsbut the influence of wealth has only occasion-ally been supported with quantitative or statis-tical evidence (Shiode et al. 2004; Kellerman2006). Competition and pricing have receivedmore attention, although recent works (Parkerand Roller 1997; Wallsten 2001; Gruber 2001;Madden and Coble-Neal 2004) have focusedon the impacts of duopolies versus monopoliesas well as the timing and entry of additionalproviders into such systems. In this study, weuse readily available, consistently collected datato evaluate often anecdotal claims about theinfluences of wealth and competition on cellphone diffusion over the past decade. We findmoderately significant differences in penetra-tion stemming from uneven competition lev-els, strongly significant penetration differencesby region, and a moderately strong althoughregionally variant correlation between incomeand penetration.
This study was not unduly constrained by anyspecific data limitations in the ITU data setsemployed, other than the typical concerns thatarise when making use of secondary data setsand of some missing observations. However,there are clearly other influences on cell phonepenetration, not all of which can be quanti-fied. As noted in the discussion about Japan,any given country or place has a unique setof circumstances that influences how peopleadopt and use new technologies. Through 2000there were few efforts to take local traits intoaccount, and an implicit assumption of most re-search has been that both cell phones and theInternet have relatively similar societal and eco-nomic impacts. However, scholars have begunto think about, if not quantify, the extent towhich culture, social conditions, and historicaluses of technology in various places influencethe adoption and expansion of technologies likethe cell phone. Greater attention has also fo-cused on cell phones as a cause rather than ef-fect of economic growth.
Although more attention today is being paidto locally unique influences on technologyadoption, by necessity these studies are gener-ally ideographic in nature and require focusedsurveys of target populations (e.g., Miyaki 2005;Miyata et al. 2005). Such studies provide evi-dence of differing uses by age, gender, residen-tial location, socioeconomic status, and so on,but serve to complement rather than replaceglobal studies. Even when national-level datacan be obtained regarding the size of certaineconomic sectors and the use of technology,data collection, and definitional differences be-tween countries require careful analysis andlimit the scope of such research to small subsetsof the world. Examples of this approach includeAoyama’s (2003) comparison of E-commerceand M-commerce in Japan and the UnitedStates, and Gorman and McIntee’s (2003) studyof the impacts of wireless infrastructure onthe existing U.S. core–periphery urban pattern.Such studies also require detailed historical re-search on the places under study to better un-derstand why events like cell phone adoptionhave unfolded differently in different places.
As a consequence, until the ITU or anotherorganization undertakes much more detaileddata collection concerning the diverse uses oftechnology worldwide, these types of studieswill have to be very localized and case-specificat one extreme or very broad and globally com-parative at the other. Continued research isneeded from both directions to build a largerbody of research on the intricate relationshipbetween culture and technology. Over time,syntheses of results may coalesce into a bodyof theory to help us better understand and pre-dict the diffusion of cell phones, as well as othertechnologies.
The cell phone is still a relatively new con-sumer item, having been common in devel-oped countries for only a little over a decade.However, unlike most other recent technolo-gies, functionality is evolving rapidly and thecell phone has become a necessity in manyplaces at a faster rate than other comparabletechnologies. As a result, the cell phone was re-cently designated as the invention that mostchanged American life since 1982 (Acohidoet al. 2007). Apple’s iPhone exemplifies theconstant reinvention of the cell phone, al-though most of its functions already exist inDoCoMo’s i-mode phones. The iPhone fea-
Downloaded By: [Oklahoma State University] At: 17:00 16 January 2010

268 Volume 60, Number 2, May 2008
tures not only a full-function mobile phonebut also a widescreen display that can showvideo and Web pages, provide e-mail com-munication, and display maps (Apple Corpo-ration 2007). This might lead more Americansand Europeans toward M-commerce and cellphone Web surfing like occurs in Japan to-day. A consequence of such innovativeness, offuture location-based service applications, andof multiple subscriptions per person in devel-oping countries, is that cell phones might notreach a saturation peak as rapidly as other tech-nologies (Shiode et al. 2004). Whereas mainline adoption appears to have peaked at 90 per-cent in the developed world (Kellerman 2006),cell phone penetration should continue to growgiven the current global and regional trends ofcell phone adoption and diffusion presented inthis article. �
Notes
1CAGR is computed by the ITU (2006) as[(Pv/P0)(1/n)] – 1, where Pv is the present value, P0 isthe beginning value, and n is the number of periods.
2No competition level is recorded for 46 of the 206countries in the ITU database.
3Only one country, Kazakhstan, is coded as aduopoly. As a result, it is grouped with all monopolycountries for analyses that are conducted with acompetition variable. This approach is supported byParker and Roller (1997), who found that duopoliesdo not lower prices as much as situations where thereare three or more competitors.
Literature Cited
Acohido, B., J. Hopkins, J. Graham, and M. Kessler.2007. 25 years of “eureka” moments. http://www.usatoday.com/news/top25-inventions.htm (lastaccessed 24 May 2007).
Agar, Jon. 2005. Constant touch: A global history of themobile phone. Cambridge, U.K.: Totem Books.
Ahn, H., and M.-H. Lee. 1999. An econometric anal-ysis of the demand for access to mobile telephonenetworks. Information Economics and Policy 11 (3):297–305.
Aoyama, Y. 2003. Sociospatial dimensions of tech-nology adoption: Recent m-commerce and e-commerce developments. Environment and Plan-ning A 35 (7): 1201–21.
Apple Corporation. 2007. iPhone. http://www.apple.com/iphone/(last accessed 24 May 2007).
Brown, L. A. 1981. Innovation diffusion: A new perspec-tive. New York: Methuen.
Central Intelligence Agency. 2007. The world factbook.https://www.cia.gov/library/publications/the-world-factbook/index.html (last accessed 24 May2007).
Davis, J. H. 1988. Cellular mobile telephone ser-vices. In Managing innovation: Cases from the ser-vices industries, ed. B. R. Guile and J. B. Quinn,144–64. Washington, DC: National AcademyPress.
Dekimpe, M. G., P. M. Parker, and M. Sarvary.1998. Staged estimation of international diffusionmodels: An application to global cellular telephoneadoption. Technological Forecasting and Social Change57 (1–2): 105–32.
Economist, The. 2005a. Calling across the divide. 12March 2005, 74.
———. 2005b. The real digital divide. 12 March2005, 11.
———. 2006. Out of Africa; Mobile telecoms. 9 De-cember 2006, 75.
Garrard, G. A. 1998. Cellular communications: World-wide market development. Norwood, MA: ArtechHouse.
Gatignon, H., J. Eliashberg, and T. S. Robertson.1989. Modeling multinational diffusion patterns:An efficient methodology. Marketing Science 8 (3):231–47.
Gorman, S. P., and A. McIntee. 2003. Tethered con-nectivity? The spatial distribution of wireless in-frastructure. Environment and Planning A 35 (7):1157–71.
Gruber, H. 2001. Competition and innovation: Thediffusion of mobile telecommunications in Cen-tral and Eastern Europe. Information Economics andPolicy 13 (1): 19–34.
Gruber, H., and F. Verboven. 2001. The diffusionof mobile telecommunications services in the Eu-ropean Union. European Economic Review 45 (3):577–88.
International Telecommunication Union (ITU).2007a. ICT regulatory database. http://www.itu.int/ITU-D/ICTEYE/Regulators/Regulators.aspx# (last accessed 24 May 2007).
———. 2007b. ICT statistics database. http://www.itu.int/ITU-D/ICTEYE/Indicators/Indicators.as-px# (last accessed 24 May 2007).
———. 2006. World telecommunication/ICT in-dicators, March 2006. http://www.itu.int/ITU-D/ICTEYE/Indicators/WTI Technotes.pdf (lastaccessed 24 May 2007).
Islam, T., and N. Meade. 1997. The diffusion ofsuccessive generations of a technology: A moregeneral model. Technological Forecasting and SocialChange 56 (1): 49–60.
Ito, M. 2005. Introduction. In Personal, portable, pedes-trian: Mobile phones in Japanese life, ed. M. Ito, D.Okabe, and M. Matsuda, 1–16. Cambridge, MA:MIT Press.
Downloaded By: [Oklahoma State University] At: 17:00 16 January 2010

Worldwide Diffusion of the Cellular Telephone, 1995–2005 269
James, J. 2002. Information technology, transactionscosts and patterns of globalization in developingcountries. Review of Social Economy 60 (4): 507–19.
Kellerman, A. 2006. Personal mobilities. New York:Routledge.
Kohiyama, K. 2005. A decade in the developmentof mobile communications in Japan (1993–2002).In Personal, portable, pedestrian: Mobile phones inJapanese life, ed. M. Ito, D. Okabe, and M. Mat-suda, 61–74. Cambridge, MA: MIT Press.
Kshetri, N., and M. K. Cheung. 2002. What fac-tors are driving China’s mobile diffusion? ElectronicMarkets 12 (1): 22–26.
Lapuerta, C., J. Benavides, and S. Jorge. 2003. Reg-ulation and competition in mobile telephony in LatinAmerica. Washington, DC: Inter-American Devel-opment Bank.
Madden, G., and G. Coble-Neal. 2004. Economicdeterminants of global mobile telephony growth.Information Economics and Policy 16 (4): 519–34.
Miyaki, Y. 2005. Keitai use among Japanese elemen-tary and junior high school students. In Personal,portable, pedestrian: Mobile phones in Japanese life, ed.M. Ito, D. Okabe, and M. Matsuda, 277–99. Cam-bridge, MA: MIT Press.
Miyata, K., J. Boase, B. Wellman, and K. Ikeda. 2005.The mobile-izing Japanese: Connecting to the In-ternet by PC and webphone in Yamanashi. In Per-sonal, portable, pedestrian: Mobile phones in Japaneselife, ed. M. Ito, D. Okabe, and M. Matsuda, 143–64.Cambridge, MA: MIT Press.
Okabe, D., and M. Ito. 2005. Keitai in public trans-portation. In Personal, portable, pedestrian: Mobilephones in Japanese life, ed. M. Ito, D. Okabe, and M.Matsuda, 205–17. Cambridge, MA: MIT Press.
Parker, P. M., and L.-H. Roller. 1997. Collusiveconduct in duopolies: Multimarket contact andcross-ownership in mobile telephone industry. TheRAND Journal of Economics 28 (2): 304–22.
Pelton, J. N. 1995. Wireless and satellite telecommuni-cations: The technology, the market and the regulations.Upper Saddle River, NJ: Prentice Hall.
Pool, I. D., ed. 1977. The social impact of the telephone.Cambridge, MA: MIT Press.
Puro, J.-P. 2002. Finland: A mobile culture. In Per-petual contact: Mobile communication, private talk,public performance, ed. J. E. Katz and M. Aakhus,19–29. Cambridge, U.K.: Cambridge UniversityPress.
Rogers, E. M. 1995. Diffusion of innovations, 4th ed.New York: The Free Press.
Rouvinen, P. 2004. Diffusion of digital mobile telephony:Are developing countries different? Research Paper2004/13 the United Nations University WorldInstitute for Development Economics Research(UNU-WIDER).
Sarkar, J. 1998. Technological diffusion: Alternatetheories and historical evidence. Journal of EconomicSurveys 12 (2): 131–76.
Shiode, N., C. Li, M. Batty, P. Longley, andD. Maguire. 2004. The impact and penetrationof location-based services. In Telegeoinformatics:Location-based computing and services, ed. H. A.Karimi and A. Hammad, 349–66. Boca Raton, FL:CRC Press.
Singh, J. P. 1999. Leapfrogging development? The polit-ical economy of telecommunications restructuring. Al-bany: State University of New York Press.
Steinmueller, W. E. 2001. ICTs and the pos-sibilities for leapfrogging by developing coun-tries. International Labour Review 140 (2): 193–210.
Takada, H., and D. Jain. 1991. Cross-national anal-ysis of diffusion of consumer durable goods in Pa-cific Rim countries. Journal of Marketing 55 (2):48–54.
Townsend, A. M. 2000. Life in the real-time city:Mobile telephones and urban metabolism. Journalof Urban Technology 7 (2): 85–104.
United Nations. 2006. Social indicators.http://unstats.un.org/unsd/demographic/products/socind/statistics.htm (last accessed 24 May 2007).
Wallis, C. 2006. The multitasking generation. TimeMagazine 27 March 2006, 48–55.
Wallsten, S. J. 2001. An econometric analysis of tele-com competition, privatization, and regulation inAfrica and Latin America. The Journal of IndustrialEconomics 49 (1): 1–19.
Waverman, L., M. Meschi, and M. Fuss. 2005. Theimpact of telecoms on economic growth in devel-oping countries. The Vodafone Policy Paper Series2:10–23.
Yu, L., and T. H. Tng. 2003. Culture and design formobile phones in China. In Machines that becomeus: The social context of personal communication tech-nology, ed. J. E. Katz, 187–98. New Brunswick, NJ:Transaction.
JONATHAN C. COMER is an Associate Pro-fessor in the Department of Geography atOklahoma State University, Stillwater, OK 74078.E-mail: [email protected]. His research inter-ests include wireless communication, rural trans-portation issues, and professional sport stadium lo-cation patterns.
THOMAS A. WIKLE is a Professor in the Depart-ment of Geography at Oklahoma State University,Stillwater, OK 74078. E-mail: [email protected] research interests include wireless communica-tions and volunteer organizations.
Downloaded By: [Oklahoma State University] At: 17:00 16 January 2010
Copyright © 2022 FDOKUMEN