C:\Working Papers\10923.wpd - National Bureau of Economic ...
Upload
khangminh22Category
view
4download
0
Working Papers Series
Globalization of Financial Institutions:Evidence from Cross-Border BankingPerformance
By: Allen N. Berger, Robert DeYoung,Hesna Genay and Gregory F. Udell
Working Papers SeriesResearch Department
WP 99-25

Globalization of Financial Institutions:Evidence from Cross-Border Banking Performance
Allen N. BergerBoard of Governors of the Federal Reserve System
Washington, DC 20551 U.S.A.and
Wharton Financial Institutions CenterPhiladelphia, PA 19104 U.S.A.
Robert DeYoung *Federal Reserve Bank of Chicago
Chicago, IL 60604 U.S.A.
Hesna GenayFederal Reserve Bank of Chicago
Chicago, IL 60604 U.S.A.
Gregory F. UdellKelley School of Business, Indiana University
Bloomington, IN 47405 U.S.A.
Forthcoming in:Brookings-Wharton Papers on Financial Services,
Robert E. Litan and Anthony Santomero, eds., vol. 3, 2000.
JEL classification codes: G21, G28, G34, E58, L89Key words: Banks, Mergers, Small businesses, X-efficiency, International Finance.
The opinions expressed do not necessarily reflect those of the Federal Reserve Board, the Chicago Reserve Bank,or their staffs. The authors thank Bob McCormack and Raghu Rajan for insightful discussants’ comments;Charles Calomiris, Ed Ettin, Bob Litan, Tony Santomero, and other participants at the Brookings-Whartonconference and seminars at Purdue University and the Federal Reserve Bank of Kansas City for their clarifyingremarks; Emilia Bonaccorsi, Nicola Cetorelli, Gayle DeLong, Michel Dietsch, Carmine Di Noia, Larry Goldberg,Iftekhar Hasan, Ana Lozano-Vivas, Loretta Mester, Stewart Miller, Phil Molyneux, Darren Pain, Jose Pastor,Rudi Vander Vennet, Ingo Walter, and Juergen Weigand for invaluable help with the preparation of this article;and Kelly Bryant, Portia Jackson, Rita Molloy, and Ozlen Savkar for outstanding research assistance.
* Please address all correspondence to Robert DeYoung, Economic Research Department, Federal Reserve Bankof Chicago, 230 South LaSalle Street, Chicago, IL 60604, 312-322-5396 (voice), 312-322-2357 (fax),[email protected].

Globalization of Financial Institutions:Evidence from Cross-Border Banking Performance
Abstract
We address the causes, consequences, and implications of the cross-border consolidation of financial institutionsby reviewing several hundred studies, providing comparative international data, and estimating cross-borderbanking efficiency in France, Germany, Spain, the U.K., and the U.S. during the 1990s. We find that, on average,domestic banks have higher profit efficiency than foreign banks. However, banks from at least one country (theU.S.) appear to operate with relatively high efficiency both at home and abroad. If these results continue to hold,they do not preclude successful international expansion by some financial firms, but they do suggest limits toglobal consolidation.

1
1. Introduction
Mergers and acquisitions among very large financial institutions are becoming more frequent in markets
around the world, attracting the attention of policy makers, researchers, and the financial press, and continually
reshuffling the rankings of the world’s largest financial service firms. Most of these “megamergers” have
combined commercial banking organizations within a single nation. In the U.S., recent mergers and acquisitions
(M&As) between large banking organizations — such as BankAmerica-NationsBank, Banc One-First Chicago
and Norwest-Wells Fargo — rank among the largest M&As in terms of market values in any industry in U.S.
history. In Europe, megamergers like UBS-Swiss Bank Corp. are similarly creating giant banking organizations
that are well in excess of the sizes of the world’s largest banks of just a few years past. In Japan, the three-way
combination of Fuji Bank, Dai-Ichi Kangyo Bank, and Industrial Bank of Japan is creating the world’s first
trillion dollar bank.
More to the point of this paper, there is also a trend toward cross-border M&As between large financial
service firms in different nations. These cross-border M&As often involve large universal-type institutions that
provide multiple types of financial services in multiple nations. One prominent example is the Deutsche Bank-
Bankers Trust megamerger, which provided a leading European universal bank greater access to wholesale
commercial and investment banking resources in the U.S. In Europe, there has been considerable cross-border
consolidation of all types of financial institutions following substantial deregulation of cross-border economic
activity in both financial and nonfinancial markets. For the securities and insurance industries, the market values
of cross-border M&As involving European financial institutions have actually exceeded the values of within-
nation M&As in recent years (Berger, Demsetz, and Strahan 1999).
The increased M&A activity raises important research and policy questions about the causes and
consequences of consolidation and the future structure of the financial services industry. There is an extensive
research literature on the motives for and consequences of consolidation, covering efficiency, market power, and
managerial topics. Presumably, much of the increase in consolidation represents market responses to deregulation
that made it more possible and less costly to consolidate, such as the Riegle-Neal Act in the U.S. and the Single
Market Programme in the European Union (EU). Future consolidation may be motivated by recent policy
changes, such as the Gramm-Leach-Bliley Act in the U.S. and monetary union in the EU. These policy changes
2
may precipitate further consolidation of large institutions, with important social consequences for systemic risk,
the safety net, monetary policy, etc., as well as for efficiency and market power in the financial services industry.
In this paper, we address these issues in three main ways. First, we extensively review several hundred
research studies on the causes and consequences of consolidation, covering the topics of efficiency, market power,
managerial, and government motives and consequences. Second, we provide a number of relevant descriptive
statistics, including data comparing financial systems in different nations, information on cross-border provision
of financial services through both cross-border lending and the establishment of physical presences in foreign
nations, and the market values of within-nation and cross-border M&As. The literature review and descriptive
statistics are intended in part to provide reference material to promote future research. Third, we analyze cross-
border banking efficiency in five home countries. This analysis is designed to address our main hypotheses
(described below) about cross-border banking efficiency, and which may help foretell the extent to which global
financial institutions may penetrate financial markets around the world.
For our purposes, we broadly define the efficiency effects of consolidation to include any cost, revenue,
or risk factors that affect shareholder value other than changes in the exercise of market power in setting prices.
While we acknowledge the importance of factors other than efficiency in consolidation decisions, our approach
reflects a presumption that cross-border consolidation is sustainable in the long-run only if it increases efficiency
or does not reduce efficiency substantially. In this framework, we expect that foreign-owned institutions would
be at least as efficient on average as domestic institutions. Efficiently managed organizations would gain shares
in foreign markets and export their superior skills or policies and procedures to other nations. However, the
empirical evidence in the literature (and in our own analysis below) typically finds the opposite result – foreign
institutions are generally less efficient than domestic institutions. We analyze what is underlying this mysterious
finding by developing and testing two main hypotheses, the home field advantage hypothesis versus the global
advantage hypothesis.
Under the home field advantage hypothesis, domestic institutions are generally more efficient than
institutions from foreign nations. This advantage could occur in part because of organizational diseconomies to
operating or monitoring an institution from a distance. Operating problems could include turf battles between
staff in different nations or high costs and turnover in persuading managers to work abroad. Monitoring

3
problems may make it difficult to evaluate the behavior and effort of managers in a distant market or make it
difficult to determine how well they are performing relative to other institutions in that market. Organizational
diseconomies may also make it difficult to establish and maintain some retail deposit relationships with
households or lending relationships with small and mid-sized enterprises, because such accounts may require local
information and a local focus. The home field advantage could also occur in part because of barriers other than
distance, including differences in language, culture, currency, regulatory and supervisory structures, other country-
specific market features, bias against foreign institutions, or other explicit or implicit barriers. The home field
advantage may be manifested as disadvantages to foreign banks in terms of higher costs of providing the same
financial services or lower revenues from problems in providing the same quality and variety of services as
domestic institutions.
Under the global advantage hypothesis, some efficiently managed foreign institutions are able to
overcome these cross-border disadvantages and operate more efficiently than the domestic institutions in other
nations. These organizations may have higher efficiency when operating in other nations by spreading their
superior managerial skills or best-practice policies and procedures over more resources, lowering costs. They
may also raise revenues through superior investment or risk management skills, by providing superior service
quality/variety that some customers prefer, or by obtaining diversification of risks that allows them to undertake
higher risk-higher expected return investments.
We consider two forms of the global advantage hypothesis. Under the general form, efficiently managed
foreign banks headquartered in many nations are able to overcome any cross-border disadvantages and operate
more efficiently than domestic banks in other nations. Under the limited form of the hypothesis, only the
efficient institutions in one or a limited number of nations with specific favorable market or
regulatory/supervisory conditions in their home countries can operate more efficiently than domestic institutions
in other nations. Home country favorable market conditions may include stiff product market competition that
provides a proving ground for efficient organizations, an active market for corporate control that prevents cross-
border consolidation that reduces shareholder value, access to a well-developed securities market that allows for
exploitation of scope efficiencies, or access to an educated labor force with the ability to adapt to new
technologies, new financial instruments, and new techniques for risk management. Favorable

4
regulatory/supervisory conditions may include access to universal banking powers to offer multiple types of
financial services, relatively relaxed prudential regulation or supervision or strong safety net guarantees that allow
the organizations to undertake high risk-high expected return financial strategies. As will be seen, distinguishing
empirically between these two forms of the global advantage hypothesis is an important key to unlocking the
mystery of why foreign institutions are on average less efficient than domestic institutions and to determining why
prior studies may have drawn a starkly different conclusion from our conclusion given below.
We test these two main hypotheses using data from five home countries – France, Germany, Spain, the
UK, and the U.S. – countries for which data on a significant number of foreign-owned commercial banks are
available. We also extend our analysis by including foreign banks from other nations such as Canada, Italy,
Japan, the Netherlands, South Korea, and Switzerland. For each home country, we estimate separate cost and
profit frontiers from which we estimate domestic and foreign bank efficiency. The hypothesis tests compare the
mean domestic bank efficiency against the mean efficiency of banks from each foreign nation.
This empirical approach improves upon prior cross-border tests of the home field advantage versus
global advantage hypothesis, which either a) examined foreign and domestic efficiency in only one country, which
cannot alone distinguish between the hypotheses because the institutions from that home country might have a
global advantage, b) did not distinguish among nations of foreign ownership, which cannot test the limited form
of the global advantage hypothesis, and/or c) combined data from different home countries to estimate efficiency
jointly or pooled the efficiency estimates from banks in the several countries, which creates problems of
comparison because of significant differences in the market and regulatory/supervisory environments of these
nations. None of the prior studies have all three of these drawbacks, but all have at least one to our knowledge.
We address these drawbacks by a) examining the efficiency of foreign and domestic banks in five different home
countries, rather than one; b) distinguishing among nations of origin of foreign institutions to test the limited form
of the global advantage hypothesis; and c) conducting completely separate analyses of data from banks located
in different countries to avoid problems created by differences in economic environments. While our method
taxes the availability of the data by relying on smaller sample sizes, it better allows us to distinguish among the
hypotheses we are testing.
1.1 An overview of the paper
5
Section 2 presents some background information, including trends in cross-border provision of financial
services, regulatory changes that have fostered cross-border consolidation, and trends in cross-border M&As.
By way of preview, the data indicate that commercial banks and other depositories remain a primary source of
firm finance in most industrialized nations; that cross-border flows of bank finance remain large relative to cross-
border issues of debt and equity securities; and that cross-border M&As of financial institutions have been
increasing in recent years.
Section 3 reviews the extant research evidence on the efficiency motives and consequences of cross-
border consolidation of financial institutions. By way of preview, the extensive prior research suggests very few
strong conclusions regarding the efficiency effects of cross-border consolidation. The scale, scope, and product
mix efficiency literatures provide very little information on cross-border performance, which may differ from the
scale, scope, and mix effects within a single nation. The X-efficiency research is more promising, but also does
not provide solid evidence on the hypotheses. The literatures on the X-efficiency effects of M&As, international
comparisons of X-efficiency, and the X-efficiency effects of deregulation all have various deficiencies for
examining cross-border efficiency. The literature on the X-efficiencies of foreign versus domestic institutions
within a single nation — the most important type of evidence in our opinion for evaluating our hypotheses — also
has some drawbacks in implementation, which are addressed in our empirical analysis in Section 5.
Section 4 reviews extant research evidence on non-efficiency motives for and consequences of cross-
border consolidation. By way of preview, the literature suggests that market power motives, managerial motives,
and governmental motives all play important roles in consolidation decisions and outcomes. Perhaps most
significant, the consolidation of financial institutions appears to occur frequently in response to government
deregulation that makes M&As more possible and/or less costly to consummate.
Section 5 reports our tests of the home field advantage and global advantage hypotheses for cross-border
bank ownership in the five home countries noted earlier. By way of preview, we find that domestic banks
generally have higher cost and profit efficiency than foreign banks on average, although these differences are not
always statistically significant. This is consistent with most of the findings in the extant literature, where it has
been interpreted as supporting the home field advantage hypothesis. However, we do not draw this same
conclusion. Rather, by digging deeper and disaggregating the results by foreign nation of origin, we find that the

6
data appear to reject the home field advantage hypothesis in favor of the limited form of the global advantage
hypothesis. These results, should they continue to hold in the future, may have important implications for the
future structure of financial markets. The finding that foreign banks are less efficient on average than domestic
banks suggests that efficiency considerations may limit the global consolidation of the financial services industry
and leave substantial market shares for domestic institutions. However, our finding in favor of the limited form
of the global advantage hypothesis also suggests that additional cross-border consolidation may be in the offing,
and that financial institutions from some countries may capture disproportionate shares of global market.
Section 6 summarizes our main results, draws conclusions based on the results, qualifies the conclusions
with a number of caveats, and suggests directions for future research. Appendix 1 contains a comparative
overview of structure of credit markets in major industrialized nations.
2. Some background on cross-border financial services and institutions
This section provides a backdrop for our investigation of the cross-border consolidation of the financial
services industry. We begin with a brief discussion of recent trends in the cross-border provision of financial
services. Next, we examine deregulation that has reduced impediments to cross-border ownership of financial
institutions. Finally, we investigate whether M&As of financial institutions have increased in the wake of this
deregulation.
2.1 Trends in cross-border provision of financial services
One of the factors motivating cross-border consolidation of financial institutions may be the increase in
the general level of economic integration across national borders. Reductions in trade barriers, declines in
transportation costs, and advancements in communications technology in recent years have led to an acceleration
of international economic integration. International transactions in goods and services account for an ever
increasing fraction of the world economy. For example, trade in goods increased from 21% of world GDP in
1987 to 30% by 1997 (World Bank, 1999).
The recent increase in international commerce has created a demand for international financial services.
A financial institution can use a variety of channels to deliver financial services to a business customer in a
foreign country. The institution can provide the services directly to the foreign business from its home country
headquarters. The institution can participate in a syndicate that finances a large loan or securities issue that is
7
originated by another financial institution that is located in the foreign country. Finally, the institution can obtain
a physical presence in the foreign country (by acquiring a financial institution there or by opening a branch or
subsidiary) and provide the service in the foreign country.
This latter of these distribution channels — establishing a physical presence — entails a number of costs,
such as the organizational diseconomies to operating or monitoring an institution from a distance or other cross-
border disadvantages. However, establishing a physical presence in the foreign country offers some potentially
offsetting advantages, including a) more effective servicing and monitoring of retail customers, and b) an
opportunity to compete for retail and wholesale customers in the foreign country. As shown in subsection 2.3
below, recent deregulation has reduced the costs of this delivery channel.
Securities markets also reflect the trend toward globalization. International issues of debt securities,
equity securities, and cross-border flows of bank funds have all increased in recent years. From 1993 through
1998, international bonds (bonds issued by foreign residents plus Eurobond issues) increased from a little over
$1.3 trillion to over $2.6 trillion, which doubled from 8% to 16% the share of international bonds to total bonds
outstanding in world markets. (All data in this paragraph are from BIS, 1999, and are stated in terms of 1982
dollars for purposes of comparisons.) International equity issues have also increased substantially, from less than
$50 billion in 1996 to over $70 billion in 1998 in real terms. Despite these increases, the international flow of
bank funds remains at least as large as international bond issues, and is substantially larger than international
equity issues. For example, in 1998 international syndicated loan facilities totaled $574 billion, compared to
about $413 billion for net debt security issues and a little over $70 billion of international equity issues.
Similarly, the international assets of banks reporting to the BIS totaled nearly $7 trillion in 1998, compared to
the $2.63 trillion of international debt securities mentioned above. In other words, banks are the largest conduit
of international flows of capital.
2.2 Regulatory changes that have fostered the consolidation of financial institutions
The deregulation of geographic restrictions and the harmonization of regulatory and supervisory
environments have provided important boosts to the consolidation of financial institutions. A sequence of laws
over the past two decades, often referred to as the Single Market Programme, has made it more possible and less
costly for financial institutions in operate across national borders within the EU. The First Banking Co-

8
ordination Directive of 1977 created a framework for establishing a single banking market across the Member
States of the EU. The First Directive established minimum requirements for authorizing credit institutions; it
introduced (but did not implement) the concept of ‘national treatment’ by which a foreign branch would be
subject to the banking restrictions of its home country rather than the host country; it forbade host countries from
denying entry of a foreign bank on the basis of ‘economic need’; and it began the process of unifying prudential
regulations across the Member States. The Single European Act of 1986 in effect created a single uninterrupted
economic marketplace stretching across the EU. It went into effect in February 1992, and eliminated all physical,
legal, and technical barriers to the cross-border movement of labor, goods, services, and (importantly for financial
institutions) capital. The Second Banking Co-ordination Directive of 1989 liberalized the trade of financial
services across EU borders. It introduced a single banking license valid throughout the EU; limited branching
and product mix restrictions to those imposed by a bank’s home country regulators; ended the practice of
requiring cross-border branches to hold extra-normal levels of capital; and harmonized minimum capital
requirements across countries (although for purposes of monetary policy and prudential regulation it allowed host
countries to set liquidity ratios). Importantly, the Second Directive made universal banking the norm in the EU
by default: any nation not allowing these powers risked putting its own banks at a competitive disadvantage. The
Second Directive was implemented in 1993 and 1994. At the same time, a series of directives was introduced
to achieve a European single securities market and to establish a ‘single passport’ for investment firms (Benink,
1993; Molyneux, Altunbas, and Gardner, 1995).
In the U.S., a series of less well-coordinated deregulatory actions has enabled increased consolidation
of financial institutions. In the 1980s, most of the individual states began to pass laws permitting out-of-state
bank holding companies to enter into their state via acquisition of an existing bank. These state rule changes,
which were often extended only on a reciprocal basis to banking companies in states with similar laws, gradually
eroded the existing federal restrictions on interstate banking. The Riegle-Neal Act of 1994 eliminated most of
the remaining restrictions on interstate banking and branching and thus legitimized and extended the state rule
changes. Riegle-Neal was fully implemented in June 1997, although some states opted-in early and other states
enacted legislation to temporarily delay its implementation. Riegle-Neal did for geographic expansion in the U.S.
what the Second Directive did for geographic expansion in the EU, but until recently, U.S. banking laws still

9
forbade most types of universal banking. Over time, however, the restrictions on separation of commercial
banking from securities and insurance activities were gradually eroding. For example, the Federal Reserve began
allowing commercial bank holding companies to underwrite corporate debt and equity on a restricted basis
through Section 20 affiliates in 1987. The initial revenue limit from this underwriting was raised from 5% of the
subsidiary's total revenue to 10% in 1989 and to 25% in 1996. The recently passed Graham-Leach-Bliley Act
of 1999 effectively removed many of the remaining restrictions on combining commercial banking, securities
underwriting, and insurance in consolidated organizations.
2.3 Trends in cross-border M&As of financial institutions
Figures 2.1 and 2.2 display the aggregate value (purchase price in 1998 dollars) of financial institution
M&As in the U.S. and the EU from 1986 to 1998 (two-year moving averages). The figures include M&As both
between and among commercial banks, insurance companies, and securities firms.1 The figures show the annual
trends for three different types of M&As. In Figure 2.1, domestic M&As are combinations of two institutions
within the U.S., entry M&As are acquisitions of U.S. firms by non-U.S. firms, and expansion M&As are
acquisitions of non-U.S. firms by U.S. firms. In Figure 2.2, the corresponding items are intra-EU M&As, entry
M&As, and expansion M&As.
The figures reveal three similarities between the U.S. and the EU M&A trends. First, the value of
domestic or Intra-EU M&As has generally exceeded the value of cross-border (entry and/or expansion) M&As.
Second, the values of all three types of M&As have generally increased over time. Third, the value of cross-
border M&As has increased disproportionately in recent years. However, there are some differences in exact
timing and detail across the two figures, and these differences are broadly consistent with the differences in
regulatory history and more recent changes in regulation.
The U.S. trends are dominated by domestic M&As throughout, reflecting the state and federal interstate
banking rule changes during the 1980s and 1990s. The large jump at the end of the U.S. domestic M&A time
series is attributable primarily to a small number of very large M&As (e.g., Citicorp-Travelers, BankAmerica-
NationsBank, Banc One-First Chicago and Norwest-Wells Fargo). Cross-border M&As involving U.S. financial
institutions increased substantially since the mid-1990s, although they are still small relative to domestic M&As.
M&A activity in the EU was virtually nil at the start of our sample period, but began to increase rapidly

10
around 1987. The value of intra-EU M&As began to decline around 1992, and then increased again in the late
1990s. The two inflection points (1987 and 1992) correspond roughly with the passage and implementation of
the Single Europe Act and the Second Banking Directive. Entry and expansion M&As involving EU institutions
was very small for most of the sample, but took off in the mid-1990s. By the end of the sample period, the value
of international M&As into and out of the EU was on a par with the value of intra-EU M&As.2
3. The motives for and consequences of cross-border consolidation: Efficiency factors
Different economic agents have different motives in consolidation decisions. Shareholders may engage
in cross-border consolidation activity in order to maximize value by increasing improving the financial
institution's efficiency and/or increasing their market power in setting prices. Cross-border consolidation may
also be driven by the personal motives of professional managers when corporate governance structures do not
sufficiently align managerial incentives with those of shareholders. In addition, governments often play important
roles in constraining or encouraging cross-border consolidation activity by changing the explicit or implicit
regulatory or supervisory limits on consolidation, by directly approving or disapproving individual M&As, or
by providing M&A assistance during periods of financial crisis. Consistent with the roles played by shareholders,
managers, and governments, we divide our review of the motives for and consequences of cross-border
consolidation of financial institutions into four categories: efficiency, market power, managerial, and government.
In this section, we review the extant evidence on efficiency as it relates to cross-border consolidation. We review
the evidence on the latter three categories in Section 4 below.
We define efficiency improvements from consolidation in the broadest possible terms here to include any
effects that increase the consolidating firms’ existing shareholder value other than increasing the exercise of
market power in setting prices. This definition includes the possibility that cross-border consolidation may allow
the institutions to achieve a superior scale, scope, or mix of output. Cross-border consolidation may also be
associated with changes in managerial behavior or organizational focus that increase shareholder value by
improving X-efficiency. To the extent that cross-border consolidation improves scale, scope, product mix, or
X-efficiency, the global advantage hypothesis may be supported and to the extent that cross-border consolidation
decreases these different types of efficiency, the home field advantage hypothesis may be supported. As will be
demonstrated, one type of efficiency analysis — the X-efficiency of foreign versus domestic institutions within

11
the same country — is particularly relevant for testing our two main hypotheses.
3.1 Scale, scope, and product mix efficiency
Efficiency gains from exploiting scale economies is often cited as a motivation for financial institution
consolidation. Potential improvements in scope and product mix efficiencies may also be a motivating factor,
particularly for universal-type consolidation. We consider cost (scale, scope, and product mix) efficiencies first,
followed by revenue efficiencies, and finally efficiencies related to the risk-expected return tradeoff.
3.1.1 Cost scale, scope, and product mix efficiency
Practitioners often refer to the need for large scale to reduce average costs to competitive levels.
However, most of the research on bank scale economies found that the average cost curve had a relatively flat
U-shape with medium-sized banks being slightly more cost scale efficient than either large or small banks.
Average costs were usually found to be minimized somewhere in the wide range between about $100 million and
$10 billion in assets (Hunter and Timme 1986, Berger, Hanweck, and Humphrey 1987, Ferrier and Lovell 1990,
Hunter, Timme, and Yang 1990, Noulas, Ray, and Miller 1990, Berger and Humphrey 1991, Mester 1992b,
Bauer, Berger, and Humphrey 1993, Clark 1996). Similar U-shaped average cost curves or conflicting cost scale
results were found for securities firms (Goldberg, Hanweck, Keenan, and Young 1991) and insurance companies
(Grace and Timme 1992, Yuengert 1993, Gardner and Grace 1993, Hanweck and Hogan 1996, Rai 1996,
Toivanen 1997, McIntosh 1998, Cummins and Zi 1998).3 These findings generally suggest no cost scale
efficiency gains and possibly cost scale efficiency losses from further consolidation of the type of large
institutions typically involved in international activity. Consistent with this, a recent study that simulated pro
forma M&As between large banks in different nations in the EU found that these M&As were more likely to
increase costs than to decrease them (Altunbas, Molyneux, and Thornton 1997).
Most of this research used data on financial institutions from the 1980s, and it is possible that recent
technological progress may have increased scale economies in producing financial services, creating opportunities
to improve cost scale efficiency through consolidation, even for large institutions. The tools of financial
engineering, such as derivative contracts, off-balance-sheet guarantees, and risk management may be more
efficiently exploited by large institutions. In addition, financial and regulatory innovations in securities activities
(such as 144A private placements and the shift toward bought deals in underwriting) may be relevant only for

12
large commercial and investment banks.4 Moreover, some new delivery methods for customer services, such as
Internet banking, phone centers, and ATMs, and may also exhibit greater economies of scale than traditional
branching networks (Radecki, Wenninger, and Orlow 1997). As well, advances in payments technology may also
have created scale economies in back-office operations and network economies that may be more easily exploited
by large institutions (Bauer and Hancock 1993, Bauer and Hancock 1995, Bauer and Ferrier 1996, Hancock,
Humphrey, and Wilcox 1999). Consistent with these arguments, some recent research on bank cost scale
efficiency using data from the 1990s suggests that there may be substantial scale economies even at larger bank
sizes, possibly due in part to technological progress (Berger and Mester 1997). An important caveat is that these
technologies embodying scale economies may currently or in the future be accessed at low cost by small
institutions through franchising or outsourcing to firms specializing in the technologies or through shared access
to networks.
There have been a number studies of cost scope and product mix efficiencies of providing multiple
products within a single type of financial institution, e.g., providing deposits and loans within a commercial bank.
Scope efficiencies are often difficult to estimate because there are usually no specializing firms in the data
sample, creating extrapolation problems for evaluating costs of hypothetical specializing firms with zero outputs
for some products. As a result, many studies use measures of product mix efficiencies that evaluate at points near
zero outputs or use concepts such as expansion-path subadditivity which combine scale and product mix
efficiencies. Although there are exceptions, these studies usually found very little evidence of substantial cost
scope or product mix economies or diseconomies within the banking, securities, or insurance industries (Kellner
and Mathewson 1983, Berger, Hanweck, and Humphrey 1987, Mester 1987,1993, Hunter, Timme, and Yang
1990, Berger and Humphrey 1991, Goldberg, Hanweck, Keenan, and Young 1991, Grace and Timme 1992,
Ferrier, Grosskopf, Hayes, and Yaisawarng 1993, Hanweck and Hogan 1996, Noulas, Miller, and Ray 1993,
Pulley and Humphrey 1993, Rai 1996, Toivanen 1997, Meador, Ryan, and Shellhorn 1998, Berger, Cummins,
Weiss, and Zi 1999).
For cross-border consolidation, it is particularly important to evaluate the scope and product mix
efficiencies of universal-type institutions -- i.e., the effects of combinations among commercial banks, securities
firms, and insurance companies -- because the institutions engaging in cross-border consolidation are often of

13
this type. Cost economies from universal-type combinations may be realized from sharing physical inputs like
offices or computer hardware; employing common information systems, investment departments, account service
centers, or other operations; obtaining capital by issuing public or private debt and/or equity in larger issue sizes
that reduce the impact of fixed costs; or reusing managerial expertise or information. For example, a consolidated
commercial bank and insurer may lower total costs by cross-selling, using each other’s customer data base at a
lower cost than building and maintaining two data bases. Similarly, information reusability (Greenbaum,
Kanatas, and Venezia 1989) may reduce costs when a universal bank acting as an underwriter conducts due
diligence on a customer with whom it has had a lending or other relationship (Rajan 1996). The evidence on the
underwriting activities of Section 20 subsidiaries of U.S. bank holding companies (BHCs) is consistent with this
hypothesis — these companies certify their private information about companies with whom they have had a
lending relationship when they are underwriting their securities (Gande, Puri, Saunders, and Walter 1997).
However, cost scope and product mix diseconomies may also arise because of coordination and
administrative costs from offering a broad range of products, often outside the senior management’s area of core
competence (Winton 1999). Universal banking may also be associated with less financial innovation because
of reduced incentives of commercial banks and investment banks to produce innovative financial solutions to
attract corporate customers from one another (Boot and Thakor 1996).
It is not known how well the research just reviewed on cost scope and product mix efficiencies within
a type of financial institution represent the efficiencies across institution types. The relatively few studies of the
scope and product mix efficiencies associated with universal banking in continental Europe are mixed. One study
of European universal banking found very small scope economies (Allen and Rai 1996), one study found some
limited evidence of scope economies, but no consistent evidence of expansion-path subadditivity (Vander Vennet
1999), and one study found mostly diseconomies of producing loans and investment services within German
universal banks (Lang and Welzel 1998). However, these studies may not be good predictors of universal banking
as it evolves in the future. Specifically, commercial banking and underwriting in the banking-oriented continental
Europe of the past may bear little resemblance to commercial banking and underwriting activities in market-
oriented financial systems such as the U.S., the U.K., and possibly continental Europe and elsewhere in the future.
3.1.2 Revenue scale, scope, and product mix efficiency

14
It is important to consider revenue efficiencies as well as cost efficiencies when evaluating cross-border
or global consolidation. The increase in scale associated with consolidation may create revenue scale economies
because some customers may need or prefer the services of larger institutions. For example, large wholesale
customers may need loan facilities or issue public debt or equity in quantities that cannot be handled by small
institutions. However, some small customers may prefer the more personalized or relationship-based services
often associated with small financial institutions, creating revenue scale diseconomies.
A related revenue efficiency effect that is particularly relevant for cross-border consolidation concerns
the benefits from serving customers that operate in multiple nations, which often require or benefit from the
services of financial institutions that operate in the same set of nations. That is, multinational nonfinancial firms
may want to do business with multinational financial institutions. Presumably, the cross-border consolidation
of financial institutions in recent years derives at least in part from the cross-border consolidation of nonfinancial
industries (and vice versa as well). Part of this revenue efficiency comes from financial institutions following
their existing customers across international borders, maintaining the benefits of existing relationships. For
example, some analyses found that many foreign banks initially entered the U.S. to help service home country
clients that were starting U.S. operations (Goldberg and Saunders 1981, Budzeika 1991, Grosse and Goldberg
1991, Seth and Quijano 1993, Terrell 1993). One analysis found that foreign direct investment in a U.S. state
was a positive determinant of foreign banking assets in the state, also consistent with follow-your-customer
behavior (Goldberg and Grosse 1994).
Financial institutions may also be able to exploit revenue scope and product mix economies by cross-
selling different types of financial services. These revenue scope economies may occur because of consumption
complementarities arising from reductions in consumer search and transactions costs. For example, some
customers may be willing to pay more for the convenience of one-stop shopping for their commercial banking
and insurance needs. Similarly, a corporate customer may prefer to reveal its private information to a single
consolidated entity that provides its commercial and investment banking needs. Revenue economies can also
arise from sharing the reputation that is associated with a brand name that customers recognize and prefer. These
reputation economies might arise, for instance, if a universal bank levers off its reputation built in commercial
banking when forging a stronger reputation in investment banking, or vice versa (Rajan 1996).

15
Consolidation of different types of financial institutions may alternatively create revenue scope
diseconomies. Such diseconomies may arise if specialists from different types of financial services have better
knowledge and expertise in their areas and can better tailor products for individual customers, and thereby charge
higher prices than joint producers. Revenue scope diseconomies might also arise to the extent that combining
commercial banking and investment banking creates the appearance of conflicts of interest. The market may
underprice securities underwritten by a universal bank for its existing loan customers because of concerns that
the proceeds from the issue will be used to pay off (or otherwise enhance the value of) distressed loans extended
to that customer by the bank. As a result, commercial loan customers might shy away from using their own
universal bank’s underwriting services. The empirical research suggests that universal banks have successfully
addressed this problem (e.g., Ang and Richardson 1994; Kroszner and Rajan 1994, 1997; Puri 1994, 1996,
Gande, Puri, Saunders, and Walter 1997; and Gande, Puri, and Saunders 1998).
A few recent studies have examined the effects of financial institution scale, scope, and product mix on
revenue efficiency and profit efficiency (which incorporates both cost and revenue efficiency). The scale results
are ambiguous, with some evidence of mild ray scale efficiencies in terms of joint consumption benefit for
customers (Berger, Humphrey, and Pulley 1996), and profit efficiency sometimes being highest for large
institutions (Berger, Hancock, and Humphrey 1993, Berger, Cummins, Weiss, and Zi 1999, Cummins and Weiss
2000), sometimes being highest for small institutions (Berger and Mester 1997), and sometimes about equal for
large and small institutions (Clark and Siems 1997). In terms of scope and product mix efficiencies, one study
found little or no revenue scope efficiency between deposits and loans in terms of charging customers for joint
consumption benefits (Berger, Humphrey, and Pulley 1996), while a study found revenue scope diseconomies
from providing life insurance and property-liability insurance together, consistent with a greater ability of
specialists to tailor products to their customers' needs (Berger, Cummins, Weiss, and Zi 1999). Studies of profit
scope efficiencies both within banking and within insurance found that joint production is more efficient for some
firms and specialization is more efficient for others (Berger, Hancock, and Humphrey 1993, Berger, Cummins,
Weiss, and Zi 1999). One study of universal banks in Europe found that they typically had both higher revenues
and higher profitability than specializing institutions (Vander Vennet 1999).
3.1.3 Risk-expected-return tradeoff scale, scope, and product mix efficiency

16
The prospect of efficiency gains from improvements in the risk-expected return tradeoff may also
motivate cross-border consolidation. The greater scale, more diverse scope or mix of financial services, or
increased geographical spread of risks associated with cross-border consolidation may improve the institutions'
risk-expected return tradeoff. This improved tradeoff fits into our broad definition of efficiency gains to the
extent that the increased diversification reduces the impact on shareholder wealth of the expected costs associated
with financial distress, bankruptcy, and loss of franchise value.
Taking the risk-expected return tradeoff into account also allows for possible scale, scope, and product
mix efficiencies in managing risk. For example, larger institutions may be able to deploy sophisticated models
of credit and market risks more efficiently. In addition, for commercial banks and other regulated/supervised
financial institutions, regulatory rules like prompt corrective action and supervisors with discretion may restrict
the activities or impose other costs on institutions in poor financial conditions, giving additional value to keeping
risks low. Note that an improvement in the risk-expected return tradeoff does not necessarily mean that the
institutions would have lower risk -- they may still choose a higher risk-higher expected return point on the
improved frontier.5
We note that these risk considerations would not affect shareholder value and therefore would not be
included in our definition of efficiency under an assumption of perfect capital markets with no informational
opacity, no distress/bankruptcy/franchise costs, and no regulatory/supervisory intervention. Investors in perfect
capital markets would diversify their own risks by owning shares of different institutions and thereby negate any
diversification value from the institutions they own purchasing other institutions.
However, capital markets imperfections may be quite important for financial institutions. Under the
modern theory of financial intermediation (e.g., Diamond 1984,1991, Boyd and Prescott 1986, Boot and Thakor
1997), financial institutions are delegated monitors with economies of scale and/or comparative advantages in
the production of information about informationally opaque assets. These institutions exist to solve these
information problems, and diversification of large pools of the opaque assets is part of this solution. In addition,
many small financial institutions are owner-managed, and the owner/managers have a substantial portion of their
personal or family wealth invested in their institutions. Diversifying this risk away by selling a substantial
portion of their investment is problematic because of loss of control and because of the illiquidity of institutions

17
that are not publicly traded. Thus, these institutions are likely managed in a way that reflects the risk aversion
of their owners.6
Financial institutions are also concerned with risk because of government regulation and supervision.
Governments typically provide a safety net for at least some of their nations' financial institutions, which absorbs
some of the losses or provides liquidity in the event of the failure or distress of the institutions. The safety net
may include deposit insurance, unconditional payment guarantees, access to the discount window, help in
arranging private-sector funding or M&A partners, forbearance, or other explicit or implicit government
guarantees. It is often argued that the safety net provides moral hazard incentives to take on more risk than would
otherwise be the case, and that this incentive to risk-taking becomes stronger as an institution’s equity capital or
charter value gets very low (e.g., Merton 1977, Marcus 1984, Keeley 1990). However, prudential
regulation/supervision works in the opposite direction, imposing costs on risk-taking and giving incentives for
value maximizing institutions to reduce risk to avoid penalties. Prudential regulations designed to deter risk-
taking include risk-based capital requirements, risk-based deposit insurance premiums, prompt correct action
rules, legal lending limits, etc., and prudential supervision includes regularly scheduled examinations backed by
threats of cease-and-desist orders, withdrawal of deposit insurance, closure, limits on growth, and prohibition of
dividend payments, etc.
Some empirical evidence suggests that large U.S. banking organizations appear to act in a risk-averse
fashion, trading off between risk and expected return (e.g., Hughes, Lang, Mester, and Moon 1996,1997, Hughes
and Mester 1998). However, it is difficult to determine whether this tradeoff is for the benefit of shareholders
versus whether managers of professionally-managed institutions are protecting their own job security at the
expense of shareholder value. Managerial incentives with regard to risk are discussed below.
The available empirical evidence research also suggests that at least some types of cross-border
consolidation are likely to improve the risk-expected return tradeoff. The literature on commercial banks in the
U.S. generally found that larger, more geographically diversified institutions tend to have better risk-expected
return tradeoffs (e.g., McAllister and McManus 1993, Hughes, Lang, Mester, and Moon 1996,1997,1999,
Hughes and Mester 1998, Demsetz and Strahan 1997). Similarly, international diversification has been found
to improve the risk-expected return tradeoff and profit efficiency in the reinsurance industry (e.g., Cummins and
18
Weiss 2000). More relevant to the issue of universal-type financial institutions, some simulation-type studies
combined the rates of return earned by U.S. banking organizations and other financial institutions from the 1970s
and 1980s with mixed results (Kwast 1989, Rosen, Lloyd-Davies, Kwast, and Humphrey 1989, Boyd, Graham,
and Hewitt 1993). Another study of U.S. firms also found that risk could be reduced by combining banks with
securities firms and insurance companies (Saunders and Walter 1994). Other studies of combining commercial
banking and insurance companies in the U.K. (Llewellyn 1996) and combining commercial banking organizations
with securities firms in the U.S. (Kwan 1998) showed favorable results for the risk-expected return frontier.7
To get further insight as to the potential for improvements in the risk-expected return frontier from
geographic diversification, Table 3.1 gives information about the distribution of bank earnings across nations.
The table shows the means and correlations of bank earnings across international borders, giving information
for the U.S., Japan, and all but one of the EU nations (insufficient data were available for Ireland). The data are
for 1979-1996, except as noted. The correlations across nations are quite low. These nations often had changes
in regulatory/supervisory structure that were not coordinated, they had different currencies, and their economies
were usually not well integrated. However, it is surprising just how much lower the correlations among bank
earnings across these nations are and how many of the correlations are negative. Even within the EU -- which
has moved closer to the model of the U.S. national market by harmonizing regulatory/supervisory structures,
beginning the process of monetary union, and removing tariffs and entry barriers -- the correlations are
surprisingly low. For each of the 14 EU nations shown, there are at least three negative correlations of bank
earnings with those of the 13 other EU nations. These data suggest very strong diversification possibilities and
opportunities to improve the institutions' risk-expected return tradeoffs through cross-border consolidation, even
within the EU.
3.2 X-efficiency
Improvements in X-efficiency may also be an important motive for and consequence of cross-border
consolidation. Improvements in X-efficiency — movements toward the optimal point on the best-practice
efficient frontier — may be accomplished through consolidation if the M&A improves the managerial quality of
the organization or changes its focus. X-efficiency may be improved, for example, if the acquiring institution
is more efficient ex ante and tends to bring the efficiency of the target up its own level by spreading its superior

19
managerial expertise or policies and procedures over more resources. Alternatively, the M&A event itself may
have the effect of awakening management to the need for improvement or may be used as an excuse to implement
substantial unpleasant restructuring.8
We consider both cost and profit X-efficiency.9 Cost X-efficiency improvements occur when an
institution moves closer to what a best-practice institution's cost would be for producing the same output bundle
using the same input prices and other environmental conditions. Profit X-efficiency improvements occur when
an institution moves closer to the profit of a best-practice institution under the same conditions. Profit X-
efficiency is a more inclusive concept than cost X-efficiency. Profit X-efficiency incorporates cost X-efficiency,
the effects of scale, scope, and product mix on both costs and revenues, and to some degree the effects of changes
in the risk-expected return tradeoff. Profit X-efficiency also corresponds better to the concept of value
maximization than cost X-efficiency, since value is determined from both costs and revenues. Differing types
of profit X-efficiency are discussed below.
We review the results of four types of X-efficiency studies. The first is the effects of M&As on financial
institution X-efficiency. These are important to the prospects for X-efficiency gains from cross-border
consolidation, given that cross-border market penetrations are usually performed via M&As, rather than via
opening new branch offices. Second, we examine the research on international comparisons of financial
institution X-efficiency. This bears on our hypotheses, in that the institutions from one or a few nations are more
likely to expand across borders under the limited form of the global advantage hypothesis if the institutions from
these nations are much more X-efficient than those from other nations. Third, we review the research evidence
on the X-efficiencies of foreign versus domestic institutions within a single nation. This is the most important
type of evidence in our opinion for evaluating the global advantage versus home field advantage hypotheses
because it is the only direct evidence on the extent to which financial institutions are able to monitor and control
their subsidiaries operating in other nations. Finally, we examine evidence on the effects of deregulation,
especially the reduction of entry barriers, on X-efficiency. This may contribute to the debate on the hypotheses,
given that this type of deregulation precedes most cross-border consolidation.
3.2.1 The effects of financial institution M&As on X-efficiency
The extant research suggests a substantial potential for X-efficiency improvement from consolidation.

20
Average X-inefficiencies on the order of about 20% of costs and about 50% potential profits are typical findings
(Berger and Humphrey 1997). Simulation evidence also suggests that large X-efficiency gains are possible if
the best-practice acquirers reform the practices of inefficient targets (Savage 1991, Shaffer 1993).
The research also suggests that many institutions engage in M&As for the purpose of improving X-
efficiency. Many studies have found that acquiring institutions are more efficient ex ante than targets (Berger
and Humphrey 1992b, Altunbas, Maude, and Molyneux 1995, Focarelli, Panetta, and Salleo 1998, Pilloff and
Santomero 1998, Rhoades 1998, Vander Vennet 1998, Cummins, Tennyson, and Weiss 1999, Fried, Lovell and
Yaisawarng 1999, Cummins and Weiss 2000). It has also been found that acquiring banks bid more for targets
when the M&A would lead to significant diversification gains, consistent with a motive to improve the risk-
expected return tradeoff and increase profit X-efficiency (Benston, Hunter and Wall 1995).
A number of studies measured the change in cost X-efficiency after M&As. Studies of U.S. commercial
banking generally show very little or no cost X-efficiency improvement on average from the M&As of the 1980s,
on the order of 5% of costs or less (Berger and Humphrey 1992b, Rhoades 1993, DeYoung 1997, Peristiani
1997). Studies of U.S. banks and other types of financial institutions using 1990s data are mixed, but sometimes
showed more cost efficiency gains (Berger 1998, Rhoades 1998, Cummins, Tennyson, and Weiss 1999, Fried,
Lovell, and Yaisawarng 1999). Studies of M&As of credit institutions in Europe found that some groups of
M&As, particularly cross-border consolidations, tended to improve cost efficiency, whereas other types tended
to decrease cost efficiency (Vander Vennet 1996,1998). Studies of Italian banks (Resti 1998) and U.K. building
societies (Haynes and Thompson 1999) found significant cost efficiency gains following M&As.
Studies of profit X-efficiency usually paint a more favorable picture of M&As. Studies of the profit
efficiency effects of U.S. bank M&As from the 1980s and early 1990s found that M&As improved profit
efficiency, and that this improvement could be linked to an increased diversification of risks and an improved
risk-expected return tradeoff (Akhavein, Berger, and Humphrey 1997, Berger 1998). After consolidation, the
institutions tended to shift their asset portfolios from securities to loans, have more assets and loans per dollar
of equity, and to raise additional uninsured purchased funds at reduced rates, consistent with a more diversified
portfolio. Other studies using similar measures to profit X-efficiency found consistent results (Fixler and
Zieschang 1993, Berger and Mester 1999, Hughes, Lang, Mester, and Moon 1999).

21
There are also a number of event studies of the effects of M&As on stock market values. The change
in the total market value for the acquiring and target institutions together (adjusted for changes in overall stock
market values) provides an estimate of the effect of the M&A on shareholder value, which embodies the present
value of expected future changes in all types of efficiency plus changes in the expected exercise of market power
over prices. Although these effects cannot be disentangled, in some circumstances, inferences can be made about
whether the market expects improvements in efficiency. Specifically, since it is unlikely that M&As would reduce
market power, a finding of a decrease in market value would suggest an expected deterioration in efficiency and
a find of no change in market value would signal either no change or a decrease in expected efficiency.
The empirical results for U.S. data are mixed. Some studies found increases in the combined value
around the times of M&A announcements (Cornett and Tehranian 1992, Zhang 1995), others found no
improvement in combined value (Hannan and Wolken 1989, Houston and Ryngaert 1994, Pilloff 1996), while
still others found that the measured effects depended upon the characteristics of the M&A (Houston and Ryngaert
1996,1997, Siems 1996). A study of domestic and cross-border M&As involving U.S. banks found more value
created by the cross-border M&As, although it also found that more concentrated geographic and activity focus
had positive effects on value (DeLong 1999). One study found that foreign banks that enter the U.S. via
acquisition tend to acquire domestic banks that already have performance problems, and despite achieving some
performance improvements at the target bank, generally are not successful in raising the acquired banks'
performance up to the levels of their domestic peers (Peek, Rosengren, and Kasirye 1999).
There is some evidence that M&As in Europe increase combined value. One study that examined M&As
among banks and between banks and insurers in Europe found positive combined returns mostly driven by
domestic bank-to-bank deals and diversification of banks into insurance (Cybo-Ottone and Murgia 1998). This
study attributed the differences in findings from many of the U.S. studies to differences in structure and regulation
in Europe. However, another study of European bank M&As found that abnormal combined returns were not
significantly different from zero (van Beek and Rad 1997).
3.2.2 International comparisons of X-efficiency
A number of studies compared the average X-efficiency of institutions in different nations, focusing on
the operations of institutions operating within each nation, rather than cross-border operations. For example, one

22
study evaluated the efficiency of banks operating within Norway, within Sweden, and within Finland relative to
a common frontier made up of the best-practice institutions from the three nations (Berg, Forsund, Hjalmarsson,
and Suominen 1993). Similar studies compared the average X-efficiencies of institutions across different sets
of nations (e.g., Fecher and Pestieau 1993, Bergendahl 1995, Bukh, Berg, and Forsund 1995, Allen and Rai 1996,
Ruthenberg and Elias 1996, European Commission 1997, Pastor, Perez, and Quesada, 1997, Bikker, 1999,
Maudos, Pastor, Perez, and Quesada 1999a, Wagenvoort and Schure 1999). The results often showed that some
institutions of some nations are substantially more efficient than the institutions of other nations, although the
ordering among nations sometimes differed across the studies. We also note that Swedish banks tended to be
measured as superior performers, despite the fact that these banks suffered a crisis in the early 1990s requiring
substantial government intervention, and that U.S. banks sometimes were measured as inferior performers,
despite the common cross-border result that U.S. banks tend to be more efficient than foreign competitors in the
U.S.
While these studies may be informative, they are not very helpful for evaluating the global advantage
versus home field advantage hypotheses for two main reasons. First, the economic environments faced by
financial institutions differ across nations in important ways. It is likely that measured X-efficiency would vary
considerably with the amount of supervisory and regulatory intervention in the financial system. As well, nations
differ significantly in the intensity of competition among their financial institutions, in the level and quality of
service associated with their financial products, in their capital market development, and in their markets for labor
and other factors of production, all of which may affect measured efficiency. As a result, a finding of greater X-
efficiency for institutions in one nation does not necessarily imply that they would be more efficient in the
environments of other nations.
Second, and more important, even if all of the environmental differences did not exist or were well
controlled for with econometric procedures, the performance of institutions within their own borders may not be
representative of how well they may perform as foreign-owned entities in other nations, which is the information
most pertinent to testing our hypotheses. Even if institutions are very efficient in their home country, they may
have difficulty in other nations in part because of organizational diseconomies to operating or monitoring an
institution from a distance or because of difficulties in overcoming differences in language, culture, currency,

23
regulation, and other barriers.
Some recent studies have made progress in dealing with the first problem by controlling for some of the
environmental differences across nations. These studies include variables measuring banking market conditions
(e.g., income per capita, population, deposit, and branching densities), market structure and regulation (e.g.,
concentration ratio, average equity capital ratio, risk, and firm specialization (Pastor, Lozano, and Pastor 1997,
Maudos, Pastor, Perez, and Quesada 1999b, Pastor 1999, Pastor, Lozano-Vivas, and Hasan 1999, Dietsch and
Lozano-Vivas forthcoming). Of course, control variables for a firm’s environment, risk, and specialization are
often specified in efficiency measurement, but these recent studies have taken this further by investigating the
effects of these variables on measured efficiency. In one case, these environmental variables, along with the
efficiency scores, have been used to predict what the efficiency of institutions from one country would be if they
operated in another country (Pastor, Lozano-Vivas, and Hasan 1999). These authors studied commercial banks
in 10 European nations (Belgium, Denmark, France, Germany, Italy, Luxembourg, the Netherlands, Portugal,
Spain, the U.K.) and predict, for example, that banks from Spain, Denmark, Portugal, and Belgium would have
high efficiency scores if they cross into other European nations.
Although this research is interesting, we caution against drawing such strong conclusions about cross-
border performance from it. It is difficult to control for environmental differences across nations. More
important, not even perfect environmental controls address the second problem of potential organizational
diseconomies and other difficulties in operating or monitoring financial institutions across borders.
3.2.3 The X-efficiency of foreign versus domestic institutions within a single nation
Some recent studies have compared the X-efficiencies of foreign versus domestic institutions operating
within the borders of a single nation. This avoids the econometric problem of controlling for all the environmental
differences across nations, since all of the institutions studied face essentially the same environmental conditions.
More important for our purposes, this is only direct evidence on the extent to which financial institutions are able
to monitor and control operations on a cross-border basis, which is critical to distinguishing between the home
field advantage and global advantage hypotheses.
Studies of U.S. data generally found that foreign-owned banks are significantly less cost efficient on
average than domestic banks (Hasan and Hunter 1996, Mahajan, Rangan, and Zardkoohi 1996, Chang, Hasan,

24
and Hunter 1998) and less profit X-efficient on average than domestic institutions (DeYoung and Nolle 1996).
Unfortunately, this type of evidence alone cannot distinguish between our hypotheses. The data are consistent
with both the home field advantage hypothesis and with a case of the limited form of the global advantage
hypothesis in which U.S. banks tend to be the most efficient. The data are also consistent another case of the
limited form of the global advantage hypothesis in which foreign banks from a limited group of other nations tend
to be more efficient than the domestic U.S. banks, but this cannot be determined because the authors did not break
out their data by foreign nation of origin. More evidence is needed to differentiate among these hypotheses —
data from more home countries and disaggregation of the results by nation of foreign ownership.
Some of the research on other nations found that foreign institutions have about the same average
efficiency as domestic institutions. One study found that foreign banks in EU countries that were acquired in the
past three years had about the same cost efficiency as domestic banks (Vander Vennet 1996); one study found
that foreign banks in Spain are about equally profit efficient to domestic banks (Hasan and Lozano-Vivas 1998),
and one study found that foreign banks in India were somewhat more efficient than domestic banks held by
private sector investors, but that both were less efficient than domestic banks held by the government
(Bhattacharya, Lovell, and Sahay 1997). Again, the results were not reported by nation of origin, making it
difficult to narrow down which hypotheses are consistent with the data. If the banks from some of the foreign
nations tend to have higher efficiency than those from the home country and other foreign nations, this would
support the limited form of the global advantage hypothesis.
Some other research using data from non-U.S. countries found very different results. These studies
measured profit efficiency for 14 home countries (Belgium, France, Germany, Italy, Switzerland, Portugal, Spain,
Australia, Canada, Denmark, the Netherlands, Chile, Mexico, the U.K.), classified into four groups based on
banking system development and regulatory/supervisory environment (Miller and Parkhe 1999, Parkhe and Miller
1999). They found that domestic banks were more efficient on average than foreign institutions (including U.S.-
owned banks), although foreign banks from the same type of environment as the host nation generally fared better
than other foreign institutions. Although they appropriately measured separate frontiers for the institutions
located in each country, they pooled the efficiency estimates from the foreign and domestic banks in the several
nations in each group (after normalizing the estimates to have a common mean and standard deviation), which

25
may create problems of comparison because of the different environments of these nations. Their logit analysis
of whether foreign bank efficiency is above versus below the mean takes into account the signs, but not the
magnitudes of the efficiency differences.
3.2.4 The X-efficiency effects of deregulation
One of the most important issues in the current policy debate is the effect of deregulation on efficiency,
given that much of the observed cross-border consolidation has followed significant deregulation. For example,
as discussed above, much of the consolidation within the EU has followed reductions in its cross-border entry
barriers and harmonization of its regulatory structures.
Most of the studies measuring performance change over time use the concept of productivity change,
rather than X-efficiency change. Productivity change is a measure of the change over time in the performance
of an industry as a whole (rather than an individual institution) and incorporates both changes in managerial best
practice in the industry and changes in cross-section X-efficiency or dispersion from best practice.
A number of studies examined productivity change during the banking deregulation in the U.S. (e.g.,
Hunter and Timme 1991, Berger and Humphrey 1992a, Bauer, Berger, and Humphrey 1993, Humphrey 1993,
Elyasiani and Mehdian 1995, Devaney and Weber 1996, Wheelock and Wilson 1996, Humphrey and Pulley
1997, Alam 1998, Berger and Mester 1999). It was often found that measured cost productivity declined in the
1980s primarily because depositors got the benefit of higher interest rates after the deposit rate ceilings were
lifted. The increase in competition appeared to be primarily a social good, although it was measured as a poorer
performance for the banking industry.10 Recent research suggested that the decline in measured cost productivity
may have continued well into the 1990s, but that improvements in revenues more than offset the higher costs,
yielding improvements in profit productivity (Berger and Mester 1999). The data were consistent with the
hypothesis that banks offered wider varieties or higher quality of financial services that raised costs but also
raised revenues by more than the cost increases, and that banks involved in M&As were responsible for much
of these findings.
The results of deregulation in other individual nations were sometimes found to be favorable to financial
institution performance, as in Norway (Berg, Forsund, and Jansen 1992) and Turkey (Zaim 1995) and sometimes
found to be mixed or unfavorable, as in Spain (Lozano 1998, Grifell-Tatje and Lovell 1997, Hasan, Hunter, and

26
Lozano-Vivas forthcoming). Finally, one study of the changes in productivity, cost X-efficiency, and profit X-
efficiency in a number of EU nations from 1992 to 1996 found small improvements in efficiency and attributed
most of the changes in productivity to technological progress, rather than the effects of EU deregulation (Dietsch,
Ferrier, and Weill 1998).
3.3 Implications of the efficiency research
The efficiency research reviewed here, while extensive, suggests very few strong conclusions regarding
the efficiency effects of cross-border consolidation. The scale efficiency literature is somewhat uncertain, but
suggests that there may be gains from large scale consolidation based on technological, financial, and regulatory
changes in the 1990s. The scope and product mix efficiencies literature also provides mixed results and very little
information on cross-industry efficiencies. The scale, scope, and product mix literatures also provide little
information on cross-border performance, which may differ from the scale, scope, and mix effects within a single
nation without significant internal entry barriers or differences in language, culture, regulation, etc. that may raise
the costs of becoming large.
The X-efficiency research reviewed here is more promising, but also does not provide solid evidence
regarding cross-border efficiency nor does it distinguish well between our home field advantage and global
advantage hypotheses. The literature on the effects of M&As on financial institution X-efficiency often suggest
efficiency gains, but most of the evidence is based on within-nation consolidation, which does not take into
account organizational diseconomies or other difficulties in operating or monitoring across borders. The literature
on international comparisons of X-efficiency has significant problems in estimating efficiency against a common
frontier because market and regulatory/supervisory differences are so great. More important, this literature does
not address the issue of potential organizational diseconomies and other difficulties of cross-border operations.
The literature on the X-efficiency effects of deregulation found somewhat mixed results, but mostly focused on
deregulation within a nation, rather than the types of deregulation that facilitate cross-border consolidation.
The evidence on the X-efficiencies of foreign versus domestic institutions within a single nation is the
most important type of evidence in our opinion for evaluating our hypotheses, because it is the only direct
evidence on the extent to which financial institutions are able to monitor and control their subsidiaries operating
in other nations. However, the extant literature does not provide much guidance for distinguishing between the

27
hypotheses because the prior studies either a) examined foreign and domestic efficiency in only one country,
which cannot alone distinguish between the hypotheses because the institutions from that home country might
have a global advantage, b) did not distinguish among nations of foreign ownership, which cannot test the limited
form of the global advantage hypothesis that institutions from only one or a limited number of foreign nations
have an advantage, and/or c) combined efficiency information from different home countries, which creates
problems of comparison because of significant differences in the market and regulatory/supervisory environments
of these nations. None of the prior studies have all three of these drawbacks, but all have at least one to our
knowledge. We address these drawbacks in our original empirical in Section 5 below by a) examining the
efficiency of foreign and domestic banks in five different home countries, rather than one; b) distinguishing
among nations of origin of foreign institutions to test the limited form of the global advantage hypothesis; and
c) conducting completely separate analyses of data from banks located in different countries to avoid problems
of comparison because of differences in the economic environments across nations.
4. The motives for and consequences of cross-border consolidation: Topics other than efficiency
We complete our review of the extant research evidence on the motives for and consequences of cross-
border consolidation, covering topics other than efficiency. Specifically, we cover market power motives and
consequences (subsection 4.1); managerial motives and consequences (subsection 4.2); and government motives
and social consequences (subsection 4.3).
4.1 Market power motives for and consequences of cross-border consolidation
Most of the research on the market power effects of consolidation focuses on M&As within a single
nation and their effects on small retail customers. More specifically, the focus is typically on the effects of M&As
between institutions that are in the same local market on small depositors and small businesses. These in-market
M&As may increase local market concentration and allow the consolidated institution to increase shareholder
value by setting prices less favorable to small retail customers (e.g., lower deposit rates, higher small business
loan rates). Consistent with this focus, it has been found that U.S. households and small businesses almost
always choose a local financial institution (Kwast, Starr-McCluer, and Wolken 1997).
4.1.1 The effects of cross-border consolidation on market power over retail customers
Cross-border consolidation does not directly increase local market concentration for the products

28
typically purchased by small retail customers. Nonetheless, cross-border consolidation may affect the exercise
of market power over these customers by: a) affecting consolidation within nations; b) changing the competitive
dynamic among cross-border institutions; and/or c) enhancing competitive rivalry by increasing the contestability
of domestic banking markets. We discuss each of these possibilities in order.
4.1.1.1 The effects of cross-border consolidation on consolidation within nations
Cross-border consolidation or the threat of it may lead to consolidation of financial institutions within
nations, raising local market concentration. To protect previously existing market power or entrenched
management, institutions within nations may engage in M&As to help fend off potential foreign competitors.
In addition, efficiency motives may help motivate the local M&As. When reductions in cross-border entry
barriers create opportunities to improve scale, scope, product mix or X-efficiencies by invading the markets in
other nations, institutions may first engage in in-nation M&As to grow large enough to compete in international
markets.
The research evidence generally suggests that higher local market concentration that may be created by
consolidation within a nation is likely to raise market power in setting prices on retail financial services. Studies
on the effects of bank M&As on pricing found that M&As that involve very substantial increases in local market
concentration tend to raise market power in setting prices, but the effects of other M&As were ambiguous
(Akhavein, Berger, and Humphrey 1997, Sapienza 1998, Simons and Stavins 1998, Prager and Hannan 1999).
Other studies usually found that banks in more concentrated markets charge higher rates on small business loans
and pay lower rates on retail deposits (e.g., Berger and Hannan 1989,1997, Hannan 1991), and that their deposit
rates were "sticky" or slow to respond to changes in open-market interest rates, consistent with the exercise of
market power (Hannan and Berger 1991, Neumark and Sharpe 1992, Hannan 1994, Jackson 1997). It has been
suggested that market power over small customers may have declined in recent years because of an increase in
the degree of contestability of financial services markets and new technologies for delivering financial services,
but the empirical evidence on this issue is mixed (Hannan 1997, Cyrnak and Hannan 1998, Radecki 1998).
4.1.1.2 The market power consequences of competing in many markets
Cross-border consolidation may also affect the exercise of market power within individual markets even
if there is no change in local market concentration for several reasons. First, at least to some extent, institutions

29
tend to charge uniform prices throughout the organization, even when the local market structures differ
substantially across the markets in which they compete. For example, one study found that large U.S. banks often
set uniform rates for deposits and loans across geographic markets within a state or region, although the reasons
for this are not clear (Radecki 1998). Uniform pricing may occur because it is easier to administer, because of
public relations concerns about fairness, or because of other factors.
Evidence on bank fees on retail deposit and payments services shows very little relationship with
measures of local market concentration in the 1990s, and that multistate BHCs tend to charge higher fees to retail
customers than other banks (Hannan 1998). These results similarly suggest that factors other than local market
concentration are important in the exercise of market power. For example, this pricing strategy may be designed
to help engineer a shift from serving small customers toward serving large customers.
In addition, cross-border consolidation may result in the same institutions competing against each other
in multiple countries. The theory of multimarket contact suggests that if firms face each other in multiple
markets, there could be either more or less market power exercised. There could be more exercise of market
power because the firms may mutually forbear. That is, they may set high prices rather than compete to avoid
retaliation in other markets. There could also be less exercise of market power, at least in the short run, if firms
price strategically to signal their costs or to drive competitors out of business. The data are mixed as to the
effects of multimarket contact on prices for retail banking products (Mester 1987,1992a, Pilloff 1999).
4.1.1.3 The effects of cross-border consolidation on market contestability
Finally, cross-border consolidation or the threat of cross-border entry may reduce the exercise of market
power because of increased market contestability. One way this may occur is if the existing financial institutions
in a market alter their limit pricing behavior, setting prices more favorable to customers to deter foreign entry.
This may also occur if efficient foreign producers enter and provide services at more favorable prices and take
market share away from inefficient local producers that were formerly protected by cross-border entry barriers.
In the EU, a key prediction of the 1988 Cecchini study (Commission of the European Communities 1988a,b)
on the impact of the Single Market Programme was that cross-border competition would create considerable
potential for prices to converge and fall to the level of the lowest cost producers.
Indeed, the creation of a single market for financial services in the EU is an important test of this
30
phenomenon. Since the adoption of the Treaty of Rome in 1957, the EU has adopted legislation designed to
promote competition in financial services through the creation of a single banking license and harmonization of
regulation (Molyneux, Altunbas and Gardner 1996). The adoption of a single currency is likely to increase
financial institution competition further by reducing entry barriers and by lowering currency risk, which may
increase the willingness of some customers to shop for financial services in other nations. It is argued in
subsection 4.3.3 below that the deepening of capital markets in the EU is likely to provide additional competition
to banks in the most banking-oriented nations of continental Europe. This encroachment of securities markets
may increase the competitive pressure on banks by giving business customers additional opportunities to raise
capital by issuing commercial paper, public debt, or public equity in place of bank loans and by giving savers
additional opportunities to invest in money market funds, mutual funds, or other traded assets in place of bank
deposits (De Bandt and Davis 1998).
There has been some recent empirical investigation into the issue of whether the single market for
financial services in the EU has succeeded in terms of this policy objective. The evidence generally suggests that
only a modest impact of the regulatory changes on loan, fee and deposit prices (European Commission 1997).
The impact does not appear to be uniform across countries. Specifically, the decline in prices tended to be
greater in countries where regulation had been the tightest prior to the implementation of the Second Banking
Directive in 1993 such as Spain, Portugal, and Greece. Also, the modest decline in prices was somewhat greater
for corporate services than retail services.
Several studies have also analyzed changes in market power using econometric models. One study used
the Rosse-Panzar statistic to evaluate changes in competitive conditions in banking in major EU nations between
1986 and 1989 and found that the monopolistic competition that prevailed at the beginning of the period did not
change substantially over time (Molyneux, Lloyd-Williams, and Thornton 1994). Another study of the EU used
similar methodology and found no major change in competitive banking conditions between 1989 and 1996
(Bikker and Groeneveld 1998). However, one study found more price competition that was linked to interest rate
deregulation in individual countries (Cerasi, Chizzolini, and Ivaldi 1998).
A caveat to this analysis is that there may not be a single uniform market for financial services even in
one nation. For example, one study found that foreign banks in Switzerland exercised more market power than

31
domestic banks suggesting that foreign and domestic financial services might be at least somewhat differentiated
products (Shaffer 1999). Such differentiation tends to limit the potential for reductions in market power and price
convergence from reductions in barriers to entry.
4.1.2 The effects of cross-border consolidation on market power over wholesale customers
The impact of cross-border consolidation on the wholesale market for financial services might be quite
different from its impact on retail markets. One the one hand, it may be difficult to exercise market power against
large wholesale customers because these customers often have sufficient resources to choose among many
suppliers on a global basis, and because product differentiation may be less important in wholesale commercial
banking, securities, and insurance service markets than in retail markets. On the other hand, the number of
suppliers in wholesale markets is considerably smaller than in retail markets, and cross-border consolidation may
reduce the number of wholesale financial institutions. For example, the ten-firm concentration ratios in U.S.
domestic corporate stock and bond underwriting and in Euromarket underwriting exceed 80% and 50%,
respectively (Investment Dealers Digest 1999). Evidence from the 1980s also suggests the presence of some
market power in the securities industry (Hayes, Spence, and van Praag Marks 1983, Pugel and White 1985).
More recent work sheds further light on this market. A study of the mid-size IPO market in the U.S.
found that over 90% of the issues paid precisely the same 7% underwriting fee (Chen and Ritter 1999). The
authors argued that in the absence of market power, the percentage fee would be declining in issue size due to
economies of scale in spreading fixed costs. In addition, IPO fees in other nations (e.g., Australia, Japan, Hong
Kong, Europe) are approximately half as high (Lee, Lochhead, Ritter, and Zhao 1996). These data suggest that
there is market power exercised in pricing for this mid-issue size range in the U.S. market. However, that for
large deals, spreads were found to be lower and clustering was absent (Chen and Ritter 1999). Arguably, the mid-
issue size range may be more of a national market while the large-size range may be more of a global market.
Deregulation may have affected the competitiveness of the wholesale securities industry. As noted
above, the Federal Reserve began allowing BHCs to underwrite corporate debt and equity through Section 20
affiliates in 1987, and the restrictions were later further relaxed. While BHCs have not had as much impact on
the equity side of the market, they have made a significant impact on the debt side. For example, in 1998 six
BHCs were listed among the top fifteen underwriters of investment grade debt (Investment Dealers Digest 1999).

32
Recent studies found evidence that a decline in underwriting fees has been associated with BHC entry into this
market (e.g., Beatty, Thompson and Vetsuypens 1998, Gande, Puri, and Saunders 1998). This evidence,
combined with the data on high prices in the U.S., suggests that cross-border consolidation may have the potential
to reduce the exercise of market power in the mid-issue size IPO market and other national wholesale financial
markets. However, it is also possible that cross-border consolidation might increase the exercise of market power
in the large-size IPO market and other global wholesale financial markets.
An additional concern is how cross-border M&As between commercial banking organizations and
investment banks (e.g., Deutsche Bank-Morgan Grenfell/Bankers Trust-Alex. Brown) will affect pricing given
that universal-type organizations simultaneously operate in two key markets in which wholesale customers raise
funds. These combinations create universal banks which may potentially acquire power over customer access
to both the private and public markets, although the effect may be limited if at least one of the markets is
competitive (Rajan 1994, 1996).
4.2 Managerial motives for and consequences of cross-border consolidation
Cross-border consolidation may be driven in some cases by managerial motives, rather than the goal of
maximizing shareholder value. In professionally managed organizations, entrenched managers may make
decisions regarding cross-border consolidation based on their own preferences for compensation, perquisites,
power, job security, etc. As will be shown, cross-border consolidation may either strengthen or weaken the hands
of entrenched managers directly by affecting the market for corporate control or governance, or indirectly by
changing the market power of their firms.
4.2.1 Managerial motives for cross-border consolidation
Consistent with the presence of these agency problems, there is evidence that banking organizations may
overpay for acquisitions when corporate governance structures do not sufficiently align managerial incentives
with those of owners. For example, banks that have addressed control problems through high levels of
managerial shareholdings and/or concentrated ownership experience higher (or less negative) abnormal returns
when they become acquirers than other acquirers. In addition, abnormal returns at bidder banks are increasing
in the sensitivity of the CEO's pay to the performance of the firm and to the share of outsiders on the board of
directors (Allen and Ceboyan 1991, Subrahmanyam, Rangan, and Rosenstein 1997, Cornett, Hovakimian, Palia,

33
and Tehranian 1998). Moreover, bank managers with more stock-based wealth or compensation tend to make
fewer acquisitions (Bliss and Rosen 1999). This evidence suggests that entrenched managers with little pay
sensitivity to performance or few constraints imposed by outside directors may engage in M&As that do not
maximize shareholder wealth.
The corporate finance literature has identified size-related compensation and perquisites as key motives
behind the decisions of professional managers (e.g., Murphy 1985, Jensen and Murphy 1990), and these may play
important roles in the cross-border consolidation decisions of some financial institution managers. However, to
the extent that the compensation boost from consolidation is linked to firm performance, consolidation in general
is value maximizing and not reflective of exploitative behavior on the part of management. Compensation studies
in both corporate finance (e.g., Jensen and Murphy 1990, Hall and Liebman 1998) and in banking (e.g., Barro
and Barro 1990, Hubbard and Palia 1995) generally show positive links between managerial compensation and
both firm performance and firm size, consistent with the both efficiency and managerial motives for
consolidation. Also consistent with managerial motives, a recent study also found that CEO compensation rose
after bank M&As, even if the stock price fell (Bliss and Rosen 1999). However, the personal compensation
motive may not be as great in cross-border consolidation decisions in banking as it formerly was, or as it is
elsewhere. Research has found that the sensitivity of pay to performance in banking has increased since
deregulation (e.g., Crawford, Ezzell, and Miles 1995, Hubbard and Palia 1995); that compensation in banking
may be more sensitive to performance than other industries (e.g., Houston and James 1995); and that pay-
performance sensitivity may be greater at large banks (e.g., Demsetz and Saidenberg 1999), which tend to be
those engaging in cross-border consolidation.
Perquisite consumption by managers may likewise be a motive behind some cross-border financial
institution consolidation. Evidence of expense preference behavior has been found in banking in a number of
studies (e.g., Hannan and Mavinga 1980, Smirlock and Marshall 1983, James 1984, Brickley and James 1987,
Mester 1989, 1991). This literature often found that the data were consistent with managers exercising
preferences for additional employees, and of course consolidation is the most straightforward way to increase
number of employees. There is also some evidence that consumption of perquisites and reduced work effort by
managers may be related to market power, so there may be additional incentives to engage in types of

34
consolidation that increase market power. Similarly, managers may engage in cross-border consolidation because
of the prestige or hubris associated with managing a larger or more expansive empire (Roll 1986).
The corporate finance literature has also identified diversification of personal risk as a motive behind
the decisions of professional managers (e.g., Amihud and Lev 1981, Morck, Shleifer, and Vishny 1990, May
1995). Financial institution managers may engage in cross-border consolidation that diversify the risks of the
institution beyond the point that would be in the interest of shareholders for the purpose of enhancing their own
job security and protecting the value of their firm-specific human capital. As discussed above, there is evidence
that large commercial banking organizations act in a risk-averse fashion, although this evidence does not by itself
necessarily imply non-value maximizing behavior. However, other work has specifically linked managerial
control to bank behavior and found that managerially controlled banks exhibit less risk (Saunders, Strock, and
Travlos 1990).
In some circumstances, however, maximizing job security could encourage management to increase
institution risk. If the financial institution is in a declining industry, managers may have incentives to increase
risk in order to increase the probability that their institution is one of the survivors (Gorton and Rosen 1995).
Managers may also try to enhance their job security by preventing some cross-border consolidation that
would otherwise be in the interest of shareholders. As discussed above, managers may try to protect their jobs
by engaging in domestic M&As. This may help fend off hostile takeovers or prevent foreign entry by creating
institutions that are too large to be taken over easily, or by taking over the market niche of potential foreign
entrants. Other evidence also suggests that managers may try to prevent their institutions from becoming
takeover targets. One study found that banks in which managers hold a greater share of the stock are less likely
to be acquired, consistent with the possibility that managers with large ownership stakes block outside
acquisitions to protect their jobs (Hadlock, Houston, and Ryngaert 1999).
4.2.2 Consequences of cross-border consolidation for the pursuit of managerial goals
Cross-border consolidation or its threat could also affect the magnitude of the corporate governance
problems in the financial services industry, although the net impact could go either way. As the evidence above
suggests, managers may be able to exercise their own preferences rather than maximize shareholder wealth
because of weaknesses in corporate control systems. These weaknesses may more often occur for regulated

35
financial institutions than nonfinancial corporations, since regulatory requirements may inhibit an active takeover
market for institutions that are not maximizing value. In the U.S. and other nations that have prohibited or
significantly constrained universal banking, there may be substantial barriers to the acquisition of commercial
banks by other types of institutions. The regulatory approval/disapproval process and other prudential
requirements may also deter some acquirers. The evidence is consistent with these arguments. Hostile takeovers
that replace management are rare in U.S. banking (Prowse 1997), although they do occur (e.g., Wells Fargo-First
Interstate). An alternative explanation for the paucity of hostile takeovers of large, publicly traded U.S. banks
is that strong internal corporate controls at these firms prevent entrenchment by adequately disciplining managers,
making private market discipline less necessary (Demsetz, Saidenberg, and Strahan 1997).
Cross-border consolidation may address these control problems by improving managerial incentives and
monitoring, particularly if more efficiently controlled organizations tend to acquire less efficiently controlled
institutions. However, it is also possible that the monitoring of managers may worsen after cross-border
consolidation. As discussed above, one reason for the home field advantage hypothesis is that it may be difficult
for organizations to monitor the managers of their foreign subsidiaries.
Cross-border consolidation may also strengthen or weaken the hands of entrenched managers by
affecting the market power of financial institutions. Market power might complicate corporate governance by
giving managers more leeway to pursue their own goals. The exercise of market power in setting prices may
increase profits and raise shareholder value and allow managers to proceed according to their own objectives
without being easily detected. Consistent with this, one study found that U.S. banks in more concentrated local
markets had substantially lower cost efficiency (Berger and Hannan 1998). Also consistent with this argument,
a number of studies found little effect of concentration on bank profits, even though concentration tends to
increase market power in pricing (e.g., Berger 1995, Maudos 1996, Berger and Hannan 1997, Berger, Bonime,
Covitz, and Hancock 1999). Presumably, some of the profits from the exercise of market power were diverted
to higher perquisite consumption, other expense preference behavior, and/or a reduced effort to maximize
efficiency or a "quiet life" for the managers. As discussed in the prior subsection, cross-border consolidation or
its threat may increase or decrease the exercise of market power.
The net effect of cross-border consolidation on the behavior of managers in pursuing their own

36
objectives directly through affecting corporate control or indirectly through affecting market power is unknown.
However, if the effects of removing cross-border entry barriers is similar to the effect of removing state barriers
in the U.S., the data suggest that these actions are likely to refocus managers toward improving efficiency in place
of satisfying their personal goals. Corporate control appears to have improved as intrastate and interstate banking
deregulation increased the number of potential acquirers, reduced the market share of poorly run banks, and
generally improved performance (Schranz 1993, Hubbard and Palia 1995, Jayaratne and Strahan 1996,1998).
4.3 Government motives for and social consequences of cross-border consolidation
Governments also play important roles in constraining or encouraging consolidation activity.
Governments often restrict the types of M&As permitted by putting explicit limits on cross-border M&As or
M&As between different types of financial institutions (e.g., commercial banks with investment banks).
Similarly, governments may require that foreign entry occur by M&A with existing domestic institutions, rather
than by opening new offices, to help protect the franchise value of domestic institutions. Governments also affect
consolidation directly through approval/disapproval decisions for individual M&As. During periods of financial
crisis, governments sometimes provide financial assistance or otherwise aid in the consolidation of troubled
financial institutions or acquire these institutions in part or in whole themselves.
Governments may also affect cross-border consolidation decisions in less explicit ways. Any decisions
that affect the cross-border consolidation of nonfinancial firms or international trade -- such as European
Monetary Union or tariffs/quotas on other nations -- affect the efficiency motives behind cross-border
consolidation. As discussed above, revenue efficiency may increase from cross-border consolidation as the
consolidated institutions can better serve customers that operate in multiple nations. Government actions that
harmonize or fail to harmonize financial systems or payments systems may affect cross-border consolidation
decisions as well. It has been argued that despite the removal of many of the explicit cross-border entry barriers
within the EU, cross-border consolidation of commercial banks in Europe may have been relatively sparse
because of differences in the use of paper versus book entry, settlement cycles and methods, and payments
systems (Giddy, Saunders and Walter 1996, White 1998). As well, European and other cross-border
consolidation may be tempered by structural differences among the capital markets, tax, and regulatory regimes
of the nations (Lannoo and Gros 1998).

37
There are a number of potential motives underlying some of these government actions or inactions. It
has been argued that in some cases, governments may also block foreign takeovers or permit M&As within the
nation for reasons of national pride – governments may wish to have the largest institutions in their nations be
domestically owned (Boot 1999). In contrast, it has also been argued that harmonization and other government
actions to permit more cross-border entry may reflect an increased strength of interest groups that benefit from
technological innovations and globalization of financial services (Kroszner 1999). Alternatively, it has been
argued that these actions may simply reflect regulators' official acquiescence to de facto entry that was already
occurring Kane (1999a).
It may reasonably be argued that consolidation of banks across state and industry borders within the U.S.
and across international borders in Europe and elsewhere have been driven in significant part by government
deregulation. The time series we presented in Figures 2.1 and 2.2 showed an association between geographic
market deregulation and the volume of financial institution M&A activity, especially in the EU. In the U.S., the
removals of restrictions on interstate banking starting in the 1980s and concluding with the Riegle-Neal Interstate
Banking and Branching Efficiency Act of 1994 (which permits interstate branching in almost all states) permitted
the managers of commercial banks to pursue efficiency, market power, and other goals through consolidation.
Research evidence suggests that much of the consolidation was related to this deregulation (Berger, Kashyap,
and Scalise 1995, Jayaratne and Strahan 1998). In addition, the liberalization of Glass-Steagall restrictions on
banking powers -- in which the Federal Reserve allowed BHCs to underwrite corporate debt and equity through
Section 20 affiliates within limits -- permitted a number of M&As between BHCs and securities firms (Gande,
Puri, and Saunders 1998, Saunders 1999). While real limits remain on nationwide interstate consolidation in the
U.S., the recently passed Graham-Leach-Bliley Act removed many of the remaining restrictions on combining
commercial banking, investment banking and insurance activities.11 If this U.S. experience is representative,
similar consolidation across borders in the EU may be forthcoming as a result of the banking directives and other
harmonizations of regulatory/supervisory structures. The implementation of monetary union may also increase
cross-border consolidation by increasing trade, by reducing the currency conversion costs of institutions operating
in multiple nations, and by reducing costs to consumers of purchasing services from foreign institutions.12
In the remainder of this section, we discuss the research findings for some of the major social

38
consequences of cross-border consolidation, systemic risk and the government safety net (subsection 4.3.1);
availability and prices of financial services for small retail customers (4.3.2); availability and prices of financial
services for large wholesale customers (4.3.3); and other macroeconomic effects (4.3.4). Other goals of
government goals and policies (e.g., enforcement of the Community Reinvestment Act) are excluded here.
4.3.1 Systemic risk and safety net consequences of cross-border consolidation
Systemic risk may be broadly defined as the risk that credit or liquidity problems of one or more financial
market participants creates substantial credit or liquidity problems for participants elsewhere in the financial
system. The contagion effects can be transferred through the financial system through failures to settle in the
payments system, through panic runs that follow the revelation of one or more institutions' problems, or through
falling prices, liquidity problems, or markets failing to clear when large volumes of securities are offered for sale
simultaneously.
Changes in systemic risk from cross-border consolidation have important potential social consequences,
including possible financial market gridlock, problems in the payments system, and difficulties in implementing
monetary policy, as well as the costs of financial distress, bankruptcy, and loss of franchise value to other
institutions caught up in the contagion. Much of the overall justification for the government safety net and other
government involvement in financial institution supervision and regulation rests on systemic risk concerns.
Cross-border consolidation may affect systemic risk and the government's cost of maintaining the safety
net if the consolidation changes the risks of individual institutions involved in the M&As. It may also affect
systemic risk by increasing the sizes of the institutions. This may increase systemic risk because the systemic
consequences of the failures of larger and larger institutions may be increasingly more severe. However, systemic
risks may also decrease if the smaller number of larger institutions increases the efficiency of monitoring by
government supervisors or other market participants.
Systemic risk may also either increase or decrease with cross-border consolidation. On the one hand,
the effects of a systemic crisis within one nation may be mitigated because some of the institutions are diversified
across national borders and can use their foreign operations as sources of strength. On the other hand, these
transfers of funds may help spread a crisis by weakening the institutions in the other nations.
Cross-border consolidation may also expand the safety net and raise the government's cost of

39
maintaining the safety net in at least four other ways. First, if the government provides more safety net protection
to larger institutions because they may be considered "too big to fail" or for other reasons, then safety net costs
are increased by consolidation which creates larger institutions that receive stronger explicit or implicit
government guarantees. Thus, in addition to the moral hazard incentive to take on more risk, the presence of the
safety net also may encourage consolidation by institutions trying to become too big to fail (e.g., Kane 1999b,
Saunders and Wilson 1999). To offset these costs, governments use prudential regulation/supervision to try to
control risk-taking, and may block or discourage M&As that appear likely to increase safety net or systemic risk
costs substantially.
Second, cross-border consolidation may expand the safety net by extending government guarantees to
types of financial institutions that normally receive much less safety net protection. Consolidation that creates
universal-type institutions by combining commercial banks with securities firms or insurance companies may
extend the safety net because commercial banks typically receive much more protection than these other types
of institutions. Much of the current debate over operating structure centers on the issue of how best to control
this potential extension of the safety net (e.g., Kwast and Passmore forthcoming, Whalen forthcoming). The
potential costs of extending the safety net may be the greatest for combinations of commercial banks with
nonfinancial firms, which typically receive much less government protection (Boyd, Chang, and Smith 1998).
Third, cross-border consolidation may expose one government's safety net to losses incurred by the
offices or subsidiaries of its institutions operating in other nations. That is, when a domestic institution acquires
offices or subsidiaries in other nations, the home country safety net may be exposed to the risk that those foreign
entities bear losses and drain some or all of the equity of the home country parent institution. This may be
particularly costly in some small nations in which the size of potential financial institution losses from abroad
and at home are very large relative to the nation's GDP (Dermine 1999b). However, to some extent, these
additional safety net exposures are offset by reduced exposures in the host foreign nations.
Fourth, cross-border consolidation may increase the cost of coordinating the regulatory responses among
various national authorities to the failures of large banking organizations. For instance, national central banks
in the EU, rather than the European Central Bank, have the lender-of-last-resort responsibilities under the
Maastricht Treaty. The cost of resolving future failures among pan-European banking organizations might be

40
higher due to differences in the incentives of national governments to bail out various institutions and the impact
of these policies on European monetary policy (Dermine 1999b, Wihlborg 1999).
4.3.2 Availability and prices of financial services for small retail customers
Cross-border consolidation may also raise social concerns about the availability and prices of financial
services for retail customers who often depend on locally-based financial institutions. As discussed above, cross-
border consolidation may be associated with increases or decreases in efficiency or with increases or decreases
in the market power of financial institutions over small retail depositors and borrowers. These changes in
efficiency or market power may in turn result in either more or less favorable availability and prices of services
for these customers. Rather than go into detail on all of these possible causes and consequences, we concentrate
here on the evidence on three specific ways in which cross-border consolidation may affect financial institutions'
supplies of retail services -- increases in financial institution scale, increases in organizational complexity, and
dynamic changes in focus or organizational behavior associated with the cross-border consolidation process itself.
4.3.2.1 The effects of increases in financial institution scale on the supply of retail services
The increases in financial institution scale associated with cross-border consolidation may induce the
institutions to shift away from providing certain services to small retail customers. This may occur because large
institutions may encounter Williamson (1967, 1988) type organizational diseconomies from providing these retail
services alongside the capital market services provided to wholesale customers that typically purchase services
from multinational financial institutions. This may be particularly the case for relationship-based services to
small retail customers, such as some types of small business loans which demand intimate knowledge of
customer, business owner, and local market. 13 It may be costly to provide these services in institutions that
primarily provide wholesale services to customers that operate in global markets. In addition, if the financial
institutions face upward sloping supply curves of funds, the improved opportunities to provide funds to large
wholesale customers may crowd out funding to small retail customers.
It is also possible that the large, diversified financial institutions that result from cross-border
consolidation may provide an efficient, stable flow of retail services to small customers, particularly during times
of financial stress. The institutions that consolidate across borders may be better able to withstand financial
crises in any one nation and continue to provide services to its households and small businesses. In contrast,

41
small, undiversified institutions may more often have to withdraw credit and other service from small customers
in times of financial stress. Moreover, even in periods without financial stress, the large, institutions created by
cross-border consolidation may act as efficient internal capital markets that allocate financial resources across
borders where and when they are most productive.
The research evidence is consistent with the prediction that increases in financial institution scale are
associated with reduced supplies of small business credit by these institutions. Several studies found that large
U.S. banks devote lesser proportions of their assets to small business lending than small institutions (e.g., Berger,
Kashyap, and Scalise 1995, Keeton 1995, Levonian and Soller 1995, Berger and Udell 1996, Peek and Rosengren
1996, Strahan and Weston 1996, Berger, Saunders, Scalise, and Udell 1998). As banks get larger, their
proportions of assets devoted to small business lending (measured by domestic commercial and industrial loans
to borrowers with bank credit less than $1 million) declines from about 9% of assets for small banks (assets
below $100 million) to about 2% for very large banks (assets over $10 billion).
Some evidence also suggests that it is specifically relationship-dependent small business borrowers that
tend to receive less credit from large banks. One study found that large banks tend to charge about 1 percentage
point less on small businesses loans and require collateral about 25% less often than small banks, other things
equal (Berger and Udell 1996). These data suggest that large banks tend to issue small business loans to higher-
quality transactions-based credits, rather than relationship-based loans that tend to have higher interest rates and
collateral requirements. Similarly, one study found that large U.S. banks tend to base their small business loan
approval decisions more on financial ratios, whereas the existence of a prior relationship with the borrowing firm
mattered more to decisions by small banks (Cole, Goldberg, and White 1999). Consistent with this, another study
found that large U.S. banks more often lend to larger, older, more financially secure businesses, consistent with
the predicted focus on transactions-driven lending, and vice versa for small banks focusing on relationship-driven
lending (Haynes, Ou, and Berney 1999).
The data are also consistent with the argument that large financial institutions may provide efficient,
stable flows of retail credit services. One study found that during the U.S. credit crunch of the early 1990s, a $1
decline in equity capital at a small bank reduced business lending more than a $1 decline at a large bank and that
the financial distress of large financial institutions had fewer adverse effects on the health of small businesses

42
in their states (Hancock and Wilcox 1998). Other studies found that loan growth by banks in multibank BHCs
was less constrained by the banks' own financial conditions than by the financial condition of their holding
company, consistent with the argument that BHCs serve as internal capital markets to provide efficient, stable
loan funding (Houston, James, and Marcus 1997, Houston and James 1998).
4.3.2.2 The effects of increases in organizational complexity on the supply of retail services
The arguments about the effects of increased organizational complexity from cross-border consolidation
are similar to those for increased financial institution scale. Many of the institutions engaging in cross-border
consolidation are likely to 1) add layers of management; 2) expand the number of nations in which they operate;
and/or 3) increase the number of different types of wholesale financial services they provide. Similar to the
effects of increases in financial institution scale, it may be difficult to maintain strong local relationships and
process relationship-based information when 1) there are more layers of management through which to pass the
local information; 2) there are more local conditions to monitor; and/or 3) there are more wholesale businesses
drawing the attention of the institution. Also similar to the arguments for scale above, the increased
organizational complexity may improve stability in the delivery of retail credit and other services, as risks may
be better diversified and/or more sources of financial strength are available.
Two dimensions of complexity that have been studied are out-of-state ownership and multibank BHC
affiliation in the U.S. Out-of-state ownership is analogous to foreign ownership, and multibank BHC affiliation
is analogous to being a separately chartered entity in a multinational financial institution. Out-of-state ownership
was usually found to have a negative effect on small business credit (Keeton 1995, Berger and Udell 1996,
Berger, Saunders, Scalise, and Udell 1998, Berger, Bonime, Goldberg, and White 1999), although one study
found no effect (Whalen 1995) and one study found that recent interstate acquisitions may provide at least a
temporary offsetting boost to small business lending (Berger, Saunders, Scalise, and Udell 1998). Multibank
BHC affiliation was also generally found to have a negative effect on small business lending (Berger and Udell
1996, Berger, Bonime, Goldberg, and White 1999, DeYoung, Goldberg, and White 1999). However, empirical
analyses that specified simultaneously multiple dimensions of organizational complexity generally found mixed
results with some dimensions of complexity positively associated with small business lending and other
dimensions negatively associated (e.g., Berger and Udell 1996, Berger, Saunders, Scalise, and Udell 1998,

43
Berger, Bonime, Goldberg, and White 1999).
4.3.2.3 The dynamic effects of the consolidation process on the supply of retail services
The cross-border consolidation process itself may also be associated with dynamic changes in the
treatment of retail customers. M&As are dynamic events that often involve significant changes in organizational
focus that might shift the organizations away from or toward serving retail customers. There also may be
disruptions during the consolidation process that affect the ability to serve retail customers during the transition
period and may drive away some retail customers. Other changes in organizational focus/managerial behavior
associated with cross-border consolidation may also alter the availability and pricing of services to small
customers. For example, the consolidated institution may change the policies and procedures of the foreign
subsidiary to bring them into accord with the acquirer's pre-consolidation focus on either retail or wholesale
services.
Also important are the external effects of cross-border consolidation, or the dynamic reactions of other
institutions in the same markets as the consolidating institutions. The changes in competitive conditions created
by the cross-border M&As may affect the behavior of rival institutions that may either augment or offset the
actions of the consolidating firms. For example, if consolidating institutions reduce their availability of credit
to some small businesses, other institutions may pick up some of the dropped credits if it is value maximizing
for them to do so. Only by including these external effects can the total effects of cross-border consolidation be
determined.
A number of studies analyzed the effects of U.S. bank M&As on small business lending by the
consolidating institutions (e.g., Keeton 1996, 1997, Peek and Rosengren 1996, 1998, Strahan and Weston 1996,
1998, Craig and Santos 1997, Kolari and Zardkoohi 1997a,b, Zardkoohi and Kolari 1997, Walraven 1997,
Berger, Saunders, Scalise, and Udell 1998). The measured outcomes are inclusive of any effects of the changes
in the institutions' scale and organizational complexity, as well any changes in their focus or managerial behavior
associated with the consolidation process. The most relevant results for predicting the effects of cross-border
consolidation are those for M&As in which one or more of the banking organizations is large, given that the
institutions involved in cross-border consolidation are typically quite large. The literature generally found a
reduction in small business lending from this type of M&A (although M&As between small organizations were

44
often found to increase small business lending).
Some research also measured the external effect or dynamic responses to consolidation of other financial
institutions in the same local markets. One study found that increases in small business lending of other banks
in the same local market tended to offset much, if not all of the negative effects on small business lending of
M&As, although this external effect was not precisely measured (Berger, Saunders, Scalise, and Udell 1998).
In contrast, another study found a very small external effect of M&As on the lending of small banks in the same
market, and the measured effect depended on the age of the bank, with the positive effect primarily occurring for
more mature small banks (Berger, Bonime, Goldberg, and White 1999).
Another way the external effect may be manifested is through increased market entry. That is, there may
be an external effect in terms of additional provision of services by institutions that were not in the market prior
to consolidation. One way that this might occur is that loan officers who leave the consolidated institution take
some of their relationship-based loan portfolios with them and start a de novo bank. This effect may be
substantial, given that studies have found the result that recent entrants tend to lend much more to small
businesses than do other banks of comparable size (Goldberg and White 1998, DeYoung 1998, Berger, Bonime,
Goldberg, and White 1999, DeYoung, Goldberg, and White 1999). However, the research on the effects of
M&As on entry are mixed -- one study found that M&As increase the probability of entry (Berger, Bonime,
Goldberg, and White 1999) and another found that M&As decrease the probability (Seelig and Critchfield 1999).
Finally, some studies have examined the treatment of small business borrowers and depositors based on
the consolidation of their banks, other banks in the market, or the size distribution of banks in their markets.
Their results may be viewed as indicative of the net effect of consolidation on the supply of retail services,
inclusive of the effects of the consolidating institutions and the external reactions of other preexisting and entering
firms. One study examined the probability that small business loan applications will be denied by consolidating
banks and other banks in their local markets and found no clear positive or negative effects (Cole and Walraven
1998). Another study examined a number of dimensions of how well the borrower is treated after its lender is
acquired and found mixed results for the effects of consolidation on satisfaction of borrowing needs, loan
approval/rejection, shopping for lenders, loan rates, etc. (Scott and Dunkelberg 1999). A third study found that
the probability that a small firm obtains a line of credit or pays late on its trade credit does not depend in an

45
important way on the presence of small banks in the market (Jayaratne and Wolken 1999). A fourth study
examined the effects of M&As on the number of bank branches in local markets in the U.S. and found that only
in-market M&As reduced the number of branches per capita, but other M&As that would be analogous to cross-
border consolidation had little effect on branch office availability (Avery, Bostic, Calem, and Canner 1999). The
results of these studies and the other evidence summarized here suggest that the total effects of consolidation on
retail customers may be relatively small.
4.3.3 Availability and prices of financial services for large wholesale customers
Cross-border consolidation of the financial services industry may also raise issues about the availability
and prices of financial services for wholesale customers. Two separate trends have been occurring that may affect
wholesale customers, which must be distinguished. The first is the consolidation of the institutions that are
associated with wholesale capital markets. These institutions include securities firms, universal banks,
commercial banks, and other institutions that underwrite securities, act as brokers, traders, and market makers
in the secondary markets, and/or offer other wholesale corporate financing products such as derivatives or M&A
advisory services. There is also consolidation of the stock, bond, and derivatives exchanges, the institutions that
comprise the secondary market on which the securities are traded.
The second trend is the globalization of wholesale capital markets, which may occur without the
consolidation of financial institutions. This trend arguably began with the first Eurobond underwriting in 1964.
The Euromarket began in London and has now spread to other locations such as the Bahamas, Singapore,
Bahrain, Hong Kong, the U.S., and Japan. There has also been a trend toward globalization in the corporate
securities and derivatives markets. For example, the New York Stock Exchange and the London Stock Exchange
now both list substantial numbers of foreign companies.
Importantly, the trends toward consolidation of institutions and globalization of markets are intertwined.
For example, some of the wholesale institution consolidation may be associated with economies of scale in the
global markets into which the customers issue new securities. For example, with the advent of the "bought deal"
in the Eurobond market and its spread to the U.S. (facilitated by the Rule 415, shelf registration), investment
banks are required to commit large sums of capital nearly instantaneously. Cross-border consolidation provides
an important avenue for financial institutions to amass the scale and scope needed to raise capital to underwrite

46
in this global market. Wholesale customers, in turn, may benefit from a lower issuance cost in the primary
market.
Institution consolidation and market globalization are also intertwined in the secondary markets, where
larger markets beget larger institutions and vice versa. Examples of this are the signing of the strategic alliance
between the London Stock Exchange and the Deutsche Bourse in July 1998 and the signing of a memorandum
of understanding among eight European exchanges (Amsterdam, Brussels, Frankfurt, London, Madrid, Milan,
Paris, Switzerland) in May 1999 to work toward harmonization of their markets and establish a Pan-European
equity market. In these two cases, the introduction of the euro may have been a key facilitating event, reducing
the segmentation of wholesale capital markets along national lines. There have also been other efforts to
consolidate exchanges across national and currency boundaries (e.g., EUREX and the CBOT), and more may be
forthcoming.
There may be considerable benefits to issuers and investors when exchanges consolidate. Viewed as
networks, exchanges can increase the utility of their customers as they increase their size (Economides 1993,
1996). Greater size may create economies of scale in clearing and settlement and improve liquidity, which may,
in turn, lower the cost of capital to the customers who list their securities on these exchanges. Modeled as
networks, it can be shown that integration among stock exchanges, particularly in the form of "implicit" mergers,
may promote social welfare (Di Noia 1999, 2000). Implicit mergers involve agreements among exchanges to
cross-list, but do not involve total and legal integration. Benefits arise out of network externalities (customer
utility rises with exchange membership) and some competition is preserved because the mergers are not explicit.
Cross-border mergers and alliances can also allow participants to defray transactions and operating costs and
enable them to introduce new technologies (ECB 1999, Steinherr 1999). It is also possible that technological
advances that provide alternative delivery channels (e.g. electronic links and screen trading) may create new
sources of competition and lead to specialization in the provision of exchange services (Dermine 1999a, Di Noia
1999, 2000, Steinherr 1999). In either case, increased competition and consolidation among exchanges can lead
to more efficient provision of listing and trading services, increase the attractiveness of capital markets to
investors, and lower the cost of capital to listing firms. The evidence on scale economies associated with the size
of exchanges themselves (as opposed to ancillary activities such as clearing and settlement) suggest that they may

47
be limited although there may be significant X-efficiency gains available from consolidation (Cybo-Ottone, Di
Noia, and Murgia 2000). However, estimation of economies of scale in securities exchanges is problematic
because of difficulties associated with determining the inputs and the outputs and because many of the M&As
have not yet reached fruition (Cybo-Ottone, Di Noia, and Murgia 2000).
Another segment of the customer market that may benefit from consolidation of the securities markets
is high growth, often technology-based, start-up firms, although such firms do not fit our classification of
wholesale customers. High growth start-ups often require substantial private external equity financing in the
earlier stages of their growth cycle from individual investors ("angels") or from formal venture capitalists (Berger
and Udell 1998). As a condition for investment, both types of private equity investors require a viable exit
strategy, a market where they can sell their equity stake via an initial public offering (IPO) if the firm is
successful. An IPO, in turn, requires a vibrant small cap stock market -- something that is currently absent in
continental Europe. The development of such a market (possibly out of EASDAQ or Euro.NM) could lead to
a significant increase in high-tech entrepreneurial activity similar to the U.S.
4.3.3.1 Banking-oriented finance versus markets-oriented finance
An analysis of the effects of consolidation on wholesale customers must also be viewed in the context
of a separate but closely related phenomenon -- changes in the mix of funding between intermediated markets
(intermediated finance) and securities markets (direct finance). The principal contrast is between a "markets-
oriented" financial system like the U.S. and a "banking-oriented" system like Germany.
Tables 4.1 and 4.2 provide an indication of the differences among countries in terms of the mix between
intermediated and direct finance. Specifically, they demonstrate that U.S. financial system lies substantially
closer to the market-oriented end of this spectrum than the financial systems of other industrialized nations.
Table 4.1 shows that in 1997 the total banking assets in the U.S. were equal only 52% as large as the market
capitalization of the U.S. stock and bond markets, while the ratio for all of the other countries (excepting
Luxembourg) was considerably greater, indicating that the financial systems in other industrialized nations are
much more bank-oriented. Table 4.2 provides corroborating evidence from corporate balance sheets. In 1994,
debt securities provided more than four times as much financing (82% versus 18%) for U.S. corporations than
did bank loans. In contrast, bank loans were more important sources of financing than debt securities in Canada,

48
Japan, and most European countries. The data in these tables reflect the fact that U.S. securities markets are more
developed than of other nations, and thus are relatively more important than banks as a source of external finance
for U.S. corporations.
These differences also reflect a tradeoff between liquidity and corporate governance mechanisms.14 In
the U.S., highly-developed securities markets reduce the cost of capital by increasing liquidity to investors.
However, managerial control problems are exacerbated by the atomistic ownership of large corporations. This
problem is addressed in the U.S. system primarily through the market for corporate control (i.e., the takeover
market), through performance-based managerial compensation, and through monitoring by market outsiders and
institutions (e.g., large bondholders, bond rating agencies). In Japan and Germany, however, the corporate
governance problem is addressed by the consolidation of ownership of corporations in large financial institutions,
rather than the stock market. This reduces the incentive (free rider) problem in monitoring management that
arises when ownership is diffuse. The parallel growth of these two types of systems among developed economies,
it has been argued, may have been principally due to the evolution of different legal environments (Prowse 1995).
For example, regulatory constraints in Germany and Japan against issuing corporate bonds and commercial paper
were major factors in promoting bank dependence among large firms. It can also be argued that banking-oriented
systems may be better suited to solve moral hazard and adverse selection problems in lending. This suggests that
a banking-oriented system may be the preferred architecture for countries with poor information infrastructures
such as the formerly centrally planned economies of Eastern Europe (Udell and Wachtel 1995). Banking-oriented
systems may also offer better intertemporal risk-sharing at the cost of less cross-sectional risk taking than
markets-oriented systems (Allen and Gale 1997).
The legal and economic institutions that determine whether a country’s financial system is markets-
oriented or banking-oriented can change over time. For example, a series of legislative changes in France between
1978 and 1984 were designed to increase the role of capital markets and reduce the dependence of French
companies on bank financing. The reduction in bank finance in France between 1983 and 1994 suggests that
those changes were effective. Equity and bond markets in most European countries have grown significantly in
recent years, due in part to regulatory changes like the “Big Bang” in the UK and the deregulation of guilder-
denominated bond issues in the Netherlands (Bisignano 1991, Bowen, Hoggarth, and Pain 1999).
49
While financial institution consolidation and changes in financing mix are often discussed together, they
need not occur together. It is conceivable, for example that continental Europe could experience considerable
consolidation of both its securities markets and its banking markets but remain predominantly a banking-oriented
system. Alternatively, consolidation could be accompanied by a shift in mix towards the securities markets and
away from the intermediated markets. Similarly, the proportions of funding through universal-type institutions
versus separate commercial banks, securities firms, and insurance companies could conceivably either increase
or decrease, depending in part on which types of consolidation occur.
A shift from a banking-oriented system to a markets-oriented system in continental Europe or Japan
could have a significant impact on large companies. Such a shift could arise, for example, if the network and
scale efficiency benefits from consolidation of the securities markets are sufficiently large relative the benefits
from consolidation of banks and other financial intermediaries discussed in earlier sections that they drive a shift
in the mix toward direct finance at the expense of intermediated finance. The net benefit to large companies
would depend in part on whether the reduction in the cost of capital from issuing liquid securities is greater than
any increase in the cost of capital from a shift in governance mechanisms.
Of course a shift toward a markets-oriented financial system would likely be facilitated by growth --
possibly through consolidation -- of the investment banking industry that provides wholesale services in the
primary and secondary markets. This growth may be skewed towards universal banking if universal banking is
characterized by economies of scope (discussed earlier). There has already been a wave of nonfinancial M&A
activity in Europe that has precipitated fierce competition for advisory business. Intra-European merger and
acquisition activity between 1985 and 1988 averaged $43 billion per year versus $280 billion per year between
1995 and 1998 (Securities Data Company). In order for European universal banks to compete for this business
-- particularly against U.S. investment banks who have acquired substantial expertise in the M&A advisory
business -- they either have to develop this expertise internally or acquire it externally. It appears, for example,
that in part Deutsche Bank has acquired this expertise by purchasing British and U.S. investment banks (Morgan
Grenfell and Alex. Brown). Similarly, domestic institutions in Asia may seek to acquire foreign investment banks
to compete in the burgeoning Asian IPO business. To the extent that these type of acquisitions in the securities
industry improve scale and scope efficiency and/or increase overall competitiveness, the cost of capital to larger
50
companies should decline as a result of lower underwriting spreads and advisory fees.
A change in financial mix might also have an impact that operates through a link between mix and firm
capital structure. However, the evidence on the impact of different financial systems on capital structure of firms
is ambiguous. One study suggested that the differences between banking- and markets-oriented systems are
reflected more in the sources of financing, and less in the capital structure of firms (Rajan and Zingales 1995).
In contrast, two other studies found significant differences in the capital structures of companies across European
countries (Rivaud-Danset, Dubocage, and Salais 1998, Delbreil, Cano, Friderichs, Gress, Paranque, Partsch, and
Varetto 1998).
However, there is also evidence that this type of disintermediation away from banking-based finance to
markets-based finance has not occurred in Europe. One study of flow of funds data in France, Germany, and the
U.K. found no general trend (except in France) towards disintermediation or movement towards a markets-
oriented system (Schmidt, Hackethal, and Tyrell 1999). In contrast, there may be a lengthening of the
intermediation chain. It may be argued that the development of new financial products have primarily created
markets for intermediaries, rather than end-users of these products (Allen and Santomero 1998). Consistent with
this argument, most of the European funds (nearly 80% in some countries) are controlled by banking
organizations (ECB 1999), and banks distribute more than half of these funds (Otten and Schweitzer 1998).
4.3.4 Other macroeconomic consequences of cross-border consolidation15
The consolidation of the financial services industry may have a number of macroeconomic effects. The
most obvious of these would be the effects of any improvements in the efficiency of financial institutions (as
discussed above), which may affect the economy through a reduction in the cost of capital. Depending on the
degree of competition in financial markets, some of any gains may accrue to the issuers of financial claims in the
form of a reduced cost of capital and/or to savers in the form of higher returns on their investments. In the
intermediated markets, interest rates on loans might decrease and interest rates on deposits might increase. In
the securities markets, trade execution, liquidity, access, and price may improve.
Other potential impacts of consolidation on the macroeconomy may operate through monetary policy.
Traditional monetary theory argues that the transmission mechanism of monetary policy operates either through
an interest rate or a money channel. For the most part, this traditional theory was built on models of the economy

51
in which there were only two assets, (non-interest bearing) money and (interest bearing) securities. Banks play
a very passive role in these models, limited to benign caretakers of the money supply constrained by reserve
requirements. Under the traditional theory, consolidation would have very little effect on the operation of
monetary policy.
Relatively recently, however, a competing theory has emerged in which banks play a critical role. Under
this "bank lending view," monetary policy in part operates through bank lending behavior.16 The reduction in
bank reserves that accompanies a monetary policy tightening results in some banks reducing their supplies of
loans. This reduction in loan supply forces some borrowers to reduce real spending and slow the macroeconomy
because alternative means of funding are unavailable or unaffordable, at least in the short term (Bernanke and
Blinder 1988). The effect is disproportionately greater on small bank-dependent companies that do not have
access to the securities markets.17
Under the bank lending view, the impact of the monetary policy may depend on the structure of the
banking industry. Small banks may be much more sensitive to shifts in monetary policy because their access to
non-deposit money market funding is significantly less than large banks. The evidence suggests that small bank
lending is more sensitive to changes monetary policy than large bank lending and that this sensitivity is greatest
for those small banks who are the least liquid (Kashyap and Stein 1995, 1997a,b, Gibson 1996). It has been
argued that countries with a higher fraction of bank-dependent borrowers, weaker banking systems, and fewer
market alternatives to intermediated finance may be much more sensitive to monetary policy shocks (Kashyap
and Stein 1997a). The nations of the EU were ranked according to these criteria. The U.K., Belgium and the
Netherlands appeared to be the least sensitive to lending channel, whereas Italy and Portugal appeared to be the
most sensitive (Kashyap and Stein 1997a). These asymmetric responses across member countries to a shift in
monetary policy should continue under the common monetary policy of the European Central Bank.
Bank consolidation may reduce the effect of the lending channel in part by creating larger institutions
with greater access to capital markets. In addition, cross-border consolidation may also reduce the effect of
monetary policy through the lending channel by diversifying the effects of any one nation's monetary policy. To
the extent that monetary policies are independent, the multinational banks can use more of the reserves from their
operations in the nation with the looser monetary policy to lend in the nation with the tighter monetary policy.

52
Of course, this last effect is nullified to the extent that monetary policies tend to be coordinated or, in the case
of the EU, there is a common monetary policy for multiple nations.
Financial service industry consolidation might also affect nonfinancial firms' access to funding and the
macroeconomy by affecting the number of potential sources of funding. While consolidation does reduce the
number of financial institutions, in some cases it may also increase the number of options available. If
consolidation is associated with a shift from a banking-oriented system towards a market-oriented system, this
could increase the menu of alternative markets in which firms may obtain financing. For example, the highly
developed private placement market and the junk bond market in the U.S. represent alternatives to bank loan
financing for lower quality firms. For investment grade firms, the commercial paper market and the medium term
note market represent alternatives to the bank loan market. There is some evidence to suggest that firms shift
their funding sources as macroeconomic conditions change, such as shifting from bank loans to commercial paper
in the U.S. (Kashyap, Stein, and Wilcox 1993, 1996). Small firms may also benefit to the extent that larger firms
increase their commercial paper issuance to finance more trade credit to small firms (Calomiris, Himmelberg, and
Wachtel 1995). More generally, it may be the case that the impact of macroeconomic crises on economic activity
may be mitigated by diversification across funding sources, as firms may shift sources when one source of
funding fails (Greenspan 1999). It should be noted, however, that credit crunches may be correlated across
markets. For example, evidence suggests that a contraction of supply occurred simultaneously in the early 1990s
in the U.S. across three different markets -- the bank loan market, the junk bond market, and the below-
investment grade segment of the private placement market (Carey, Prowse, Rea and Udell 1993).
5. Tests of Home Field Advantage versus Global Advantage Using International Data
In this section, we present our efficiency analysis of cross-border banking. We evaluate the relative
efficiency of foreign versus domestic commercial banks in five ‘home’ countries -- France, Germany, Spain, the
U.K., and the U.S. For each home country, we estimate separate cost and alternative profit frontiers and compare
the efficiency of foreign and domestic banks. We also extend our tests by including foreign banks from other
nations — we present efficiency statistics in all cases for which we have data for at least three banks from a given
foreign nation. We use these relative efficiency comparisons to test the home field advantage hypothesis versus
the two forms of the global advantage hypothesis discussed above. We test these hypotheses in light of the prior

53
research on cross-border X-efficiency, which often found that foreign banks were less efficient than domestic
banks and concluded that the evidence supported the home field advantage hypothesis. However, as discussed
above in Section 3.3, the methodologies used in these previous studies may not be able to properly distinguish
among the hypotheses. We address the drawbacks in the prior methodologies by: a) examining the performance
of foreign and domestic banks in five different home countries; b) distinguishing among nations of origin of
foreign institutions to test the limited form of the global advantage hypothesis; and c) conducting completely
separate analyses of data from banks located in different countries to avoid problems of comparison because of
differences in the economic environments across nations.
5.1 A brief summary of the estimation methods
Performing separate efficiency estimations in each of the five home countries allows us to specify the
cost and alternative profit functions differently in each of these countries, depending on the activities in which
banks are permitted to engage. This is especially relevant for universal banking powers, which were more often
present in European nations than in the U.S. Separate treatment also allows us to adjust the specification and the
estimation procedures when certain variables are available for one country but not for others.
Although we feel that our approach offers a number of methodological improvements, our approach does
tax the availability of the data. Since we do not pool data across countries, each of our home country efficiency
frontiers are estimated with fewer degrees of freedom. We limit our analysis to home countries for which our data
sets contain a) data on enough banks to estimate the cost and profit frontiers with reasonable accuracy, and b)
data for at least three foreign banks from at least two foreign nations during the sample period. Fortunately, our
results suggest that these data limitations do not pose major problems. As shown below, we are still able to test
domestic versus foreign efficiency for a large number of nation-pairs, many of which yield statistically and
economically significant results.
5.1.1 Estimating X-efficiency for banks in the U.S.
In this subsection, we present a nontechnical overview of the procedures used to estimate cost and
alternative profit X-efficiency for banks in the U.S. In the following subsection we describe how we altered these
estimation procedures for the other four home countries. A more detailed technical appendix is available from
the authors.

54
Both cost efficiency and alternative profit efficiency measure how well a bank performs relative to a
"best-practice" institution that produces the same output bundle under the same environmental conditions. Cost
efficiency is measured from a standard cost function that specifies the quantities of four variable outputs
(consumer loans, business loans, real estate loans, securities), the quantity of one fixed output (off-balance-sheet
activity), the quantities of two fixed inputs (physical capital, financial equity capital), the prices of three variable
inputs (purchased funds, core deposits, labor), and the ratio of market-average nonperforming loans to total loans
(to control for business environment of the bank). The cost function is estimated using the Fourier-flexible
functional form, which has been shown to fit banking data better than more conventional functional forms
(McAllister and McManus 1993, Mitchell and Onvural 1996, Berger, Cummins, and Weiss 1997, Berger and
DeYoung 1997, and Berger, Leusner, and Mingo 1997). Because this functional form fits the data globally,
rather than just around the mean of the data, it allows us to measure more accurately the relative performance of
banks with starkly different output bundles or other characteristics.
Alternative profit efficiency is derived from a profit function with the same right-hand-side variables as
the cost function and is estimated using the same functional form. As described elsewhere (Berger and Mester
1997), alternative profit efficiency is a particularly useful concept when some of the standard assumptions of
perfect markets do not hold.18 Importantly, alternative profit efficiency may capture some of the revenue effects
of differences in investment or risk management skills that are not captured in cost efficiency, which neglects
differences in revenue across banks. Alternative profit efficiency may also capture some of the revenue benefits
of cross-border risk diversification if banks use these diversification gains as an opportunity to invest in higher
risk/higher expected return projects. Finally, alternative profit efficiency may reflect revenue differences
associated with service quality or product variety. For example, banks may "skimp" on loan underwriting, loan
monitoring, cross-selling, customer convenience, or other activities important for producing high quality financial
services and high levels of interest and non-interest revenue (Berger and DeYoung 1997). Since it is difficult to
control for service quality, this skimping may mistakenly be measured as high cost efficiency (i.e., lower costs
for a given quantity of output), but may be captured at least in part as low alternative profit efficiency, which
captures both costs and revenues.
These efficiency measures have a fundamental advantage over simple accounting-based cost and profit
55
performance ratios. The efficiency measures statistically remove the effects of differences in output bundles,
input prices, etc. that affect accounting-based performance ratios, but are not necessarily related to the efficiency
or managerial quality of the organization. This may be particularly important when comparing foreign and
domestic banks, which often have different output mixes. Thus, we reduce the potential problem of "comparing
apples to oranges" by controlling for output mix and other non-efficiency factors when comparing the
performance of foreign and domestic banks within a home country.
We use alternative profit efficiency as our main performance measure to test the home field and global
advantage hypotheses, because it is a more comprehensive measure that includes both costs and revenues. We
use cost efficiency as an ancillary measure to diagnose whether differences in profit efficiency are rooted in cost
control, revenue generation, or both, and to compare our results to the previous cross-border cost efficiency
literature.
We estimate the U.S. cost and alternative profit functions using data on 2,123 banks with greater than
$100 million in gross total assets (1998 dollars) and continuous, complete annual data for the six-year period
from 1993 through 1998. Using the results of these estimations, we calculate cost efficiency and alternative
profit efficiency for every bank in the data set (1,940 domestic banks and 43 foreign banks) using the
distribution-free method, which distinguishes efficiency differences from random error by averaging the cost or
profit function residuals over time (Berger 1993). We exclude small banks from the analysis because the vast
majority of banks owned by international banking organizations are large, and because the efficiency data for the
other four home countries generally include only large banks. The data are taken from the Call Report. Table
5.1 displays summary statistics for the data used in the U.S. efficiency estimations.
5.1.2 Estimating X-efficiency for banks in France, Germany, Spain, and the U.K.
We alter the U.S. specification in a number of ways to estimate efficiency for banks in France, Germany,
Spain, and the U.K. First, we take our data from the Fitch-IBCA database, which presents financial statement
data from financial institutions in different nations using internally consistent accounting definitions. This
database reports a more limited amount of financial information than does the U.S. Call Report, and reports this
information for a sample of (mostly large) financial institutions in each country. Second, we specify the European
cost and profit functions using the quantities of four variable outputs (total loans, total non-equity securities, total
56
equity securities, and commission revenues), the quantity of one fixed input (equity capital), and the prices of two
variable inputs (labor and borrowed funds). This different specification partly reflects the broader insurance and
securities powers of European banks (which we capture in the equity securities and commission revenues
variables), and partly reflects the reduced level of detail in the IBCA database. Third, we use definitions supplied
by IBCA to identify and retain commercial banking firms, and to identify and discard other types of financial
institutions. This further insures that we are estimating performance and testing our hypotheses based on a
relatively homogeneous group of firms across nations. Fourth, we observe commercial banks in these countries
annually over the six-year time period from 1992 through 1997 (rather than 1993 through 1998 in the U.S.), and
include in the estimations any commercial bank that appears in the database in at least four of those six years.
Our final samples included 215 commercial banks in France (158 domestic and 57 foreign); 206 commercial
banks in Germany (121 domestic and 85 foreign); 76 commercial banks in Spain (60 domestic and 16 foreign);
124 commercial banks for the profit function in the U.K. (63 domestic and 61 foreign); and 57 banks for the cost
function in the U.K. (26 domestic and 31 foreign). Table 5.2 displays summary statistics for the data used in
these estimations.
5.1.3 Overall X-efficiency estimates
Our overall cost efficiency estimates (i.e., not differentiating between domestic and foreign ownership)
are consistent with those found in the previous literature. The average estimated cost efficiency for banks in
France is 70.9%, for banks in Germany is 79.3%, for banks in Spain is 91.5%, for banks in the U.K. is 79.2%,
and for banks in the U.S. is 77.4%. An average cost efficiency of 70.9% as in France indicates that a best-
practice bank producing the same output bundle under the same environmental conditions as the average bank
could do so for an estimated 70.9% of the costs. The average estimated alternative profit efficiency for banks
in France is 44.2%, for banks in Germany is 52.2%, for banks in Spain is 67.1%, for banks in the U.K. is 66.1%,
and for banks in the U.S. is 66.7%. An average alternative profit efficiency of 44.2% as in France indicates that
the average bank earns only an estimated 44.1% of the profits of a best-practice bank producing the same output
bundle under the same environmental conditions.
We again emphasize that the efficiency estimates for one home country are not comparable to the
efficiency estimates for the other four home countries. For example, the 91.5% mean cost efficiency for banks

57
operating in Spain does not indicate that the average bank operating in Spain is more cost efficient than the
average bank operating in the other home countries. The efficiency differences across home countries reflect
market factors (e.g., the degree of competition, the development of securities markets, and the quality of the labor
force), regulatory/supervisory factors (e.g., the enforcement of prudential limits on risk taking) and differences
in specification of the frontier. In our tests below, we evaluate the home field advantage and global advantage
hypotheses only by comparing domestic bank efficiency versus foreign bank efficiency within each of our home
countries. While this approach better allows us to distinguish among the main hypotheses, it unavoidably reduces
sample sizes and statistical significance.
5.2 The relationship between the cross-border efficiency results and the hypotheses
Although we estimate ten separate efficiency frontiers (cost and profit for five home countries) and use
the results to test the comparative efficiencies of a large number of nation-pairs, we can classify our results into
four simple possible outcomes. In this section, we identify each of these four possible outcomes, map each
outcome into support for or rejection of the home field versus global advantage hypotheses, and identify the
implications of each outcome for the future of global integration of the financial services industry.
The first possible outcome is that foreign institutions are generally found to be less efficient than
domestic institutions. This would support the home field advantage hypothesis that organizational diseconomies
of operating or monitoring an institution from a distance or other advantages for domestic banks (e.g., language,
culture, regulation, other barriers) are too difficult to overcome in most cases, even for efficiently operated cross-
border organizations. This outcome, if it extrapolates to the future, may suggest that efficiency problems could
limit the degree of globalization of financial institutions.
The second possible outcome is that foreign institutions are generally found to be more efficient than
domestic institutions. This would support the general form of the global advantage hypothesis that efficiently
managed foreign banks headquartered in many nations are able to overcome any cross-border disadvantages and
operate more efficiently than the domestic banks. As discussed above, the higher efficiency may result from
spreading superior managerial skills or best-practice policies and procedures, by obtaining diversification of risks
that allows for higher risk-higher expected return investments, and/or by providing superior service
quality/variety that raises revenues. This second outcome, if it extrapolates to the future, may suggest that

58
efficient institutions from many nations could successfully expand on a global basis, limited only by non-
efficiency constraints, such as regulatory/supervisory intervention or other barriers to entry.
The third possible outcome is that foreign institutions headquartered in one or a limited number of
nations are found to be more efficient than domestic institutions. This would support the limited form of the
global advantage hypothesis in which only efficiently managed foreign banks headquartered in nations with
specific favorable conditions in their home countries are able to overcome any cross-border disadvantages and
operate more efficiently than the domestic banks. This third outcome, if it extrapolates to the future, may suggest
that efficient institutions from this limited group of nations could successfully expand on a global basis if the
conditions fostering their higher efficiency remain intact and if non-efficiency barriers do not prevent their
expansion.
Finally, if neither domestic nor foreign institutions are found to be systematically more efficient – which
essentially corresponds to all outcomes other than the first three listed here — then neither the home field
advantage nor the global advantage hypotheses are supported by the data. This final potential outcome, if it
extrapolates to the future, may suggest that global consolidation may be more likely to turn on issues other than
efficiency maximization, such as managerial motives and government actions.
5.3 Empirical results
Table 5.3 shows the results of our cross-border alternative profit efficiency tests. Each cell of the table
shows the mean estimated efficiency for banks in the group (top number), the number of observations (middle
number), and the standard error of the mean estimated efficiency (bottom number). Each of the five columns of
the table corresponds to an alternative profit frontier estimated for banks operating in one of the five home
countries in our analysis. The first row displays the mean profit efficiency of the domestic banks in each home
country. The second row displays the mean efficiency for all the foreign banks in each home country, without
regard to their nation of ownership. The rows in the bottom panel correspond to subsets of foreign banks,
grouped according to their nation of ownership. Cells with fewer than three foreign banks are left blank. The
superscripts ** and * indicate that the mean efficiency of foreign banks in the cell is significantly higher than the
mean for domestic banks at the 5 and 10 percent levels of significance in two-tailed tests, respectively. Similarly,
the superscripts ## and # indicate that the mean efficiency of foreign banks in the cell is significantly lower than

59
the domestic bank mean. Table 5.4 is constructed in similar fashion, except that the cells display estimates of
cost efficiency.
The results displayed in Tables 5.3 and 5.4 can be summarized as follows. In most countries, domestic
banks are found to have both higher mean profit efficiency and higher mean cost efficiency than the mean of all
foreign banks operating in that country, although these differences are not always statistically significant. This
result is consistent with most of the findings in the extant literature. This result has been previously interpreted
as supporting the home field advantage hypothesis, but we do not draw this same conclusion. Rather, by
disaggregating the results by foreign nation of origin, we find that the data appear to reject the home field
advantage hypothesis in favor of the limited form of the global advantage hypothesis. As shown below, the
disaggregated results suggest that domestic banks may be more efficient than banks from most foreign countries;
may be about equally efficient with banks from some foreign countries; but may be less efficient than banks from
one of the foreign countries.
5.3.1 Domestic bank efficiency versus foreign bank efficiency
In France, Germany, and the U.K., cost efficiency and alternative profit efficiency are both higher on
average for domestic banks than foreign banks. Some of these differences are small, although in Germany and
the U.K. the difference in profit efficiency is economically large, over 4% of potential profits.
In Spain and the U.S., domestic banks exhibit either higher cost efficiency than foreign banks, or higher
profit efficiency than foreign banks, but not both. In Spain, mean domestic cost efficiency is about 2.1% of costs
higher than mean foreign bank cost efficiency, but on average domestic banks are less profit efficient than foreign
banks by about 5.4% of potential profits. This implies that while domestic Spanish banks may have a slight cost
advantage over their foreign rivals, their lower revenues overwhelm their lower costs. This may be due to making
poor investment choices, to poor risk diversification that requires a relatively low risk-low expected return choice
of investments, or to poor service quality such as skimping on expenditures necessary to monitor and service
customers.
In the U.S., domestic banks are more profit efficient on average than foreign banks by a wide margin,
25.1% of potential profits, but domestic banks are on average slightly less cost efficient than foreign banks by
2.9% of costs. Both differences are statistically significant. The much higher profit efficiency suggests that the

60
extra spending by U.S. domestic banks are likely not due to waste or inefficiency -- rather, these higher expenses
more likely reflect efforts to produce a quality or variety of financial services that generate substantially greater
revenues.19
5.3.2 Disaggregating foreign bank efficiency by nation of ownership
Thus far, our results are consistent with the main finding of the prior research in this field, i.e., that the
average domestic bank is generally more efficient than the average foreign bank. In four of our five home
countries, mean domestic bank profit efficiency is higher than mean foreign bank profit efficiency. In some cases,
particularly the U.S., this efficiency edge is also economically large, accounting for a substantial percentage of
potential profits.. However, we cannot draw conclusions about our hypotheses without also disaggregating these
results by nation of origin for the foreign banks. We show this disaggregation in the bottom panels of Tables 5.3
and 5.4.
In France, domestic banks have slightly higher mean cost and profit efficiency than foreign banks on
average, but this masks considerable heterogeneity across the foreign banks by nation of origin. For example,
U.S.-owned banks in France have the highest mean profit efficiency of 64.85%, which is more than 20% of
potential profits higher than domestic French banks, and the difference is statistically significant. Interestingly,
the Netherlands-owned banks in France have much higher measured cost efficiency, but much lower measured
profit efficiency than domestic French banks, suggesting poor revenue performance for these banks. In contrast,
Italian-owned banks in France have higher measured profit efficiency, but much lower cost efficiency than the
domestic French banks.
In Germany, as in France, heterogeneity among the foreign institutions is again apparent once the results
are disaggregated by nation of origin. Again, the U.S.-owned banks have the highest mean profit efficiency of
all foreign institutions, and again the U.S.-owned institutions posted a higher mean profit efficiency than domestic
banks (although the difference is not statistically significant). Note that domestic German banks have statistically
higher mean profit efficiency than foreign banks from the Netherlands, Switzerland, and the UK, although the
foreign UK banks have statistically higher cost efficiency than the domestic German banks. Again, these mixed
cases suggest that studies that use only the less comprehensive cost efficiency measure can be misleading, because
this measure does not account for differences in the ability to generate revenues. There is weak evidence that the

61
strong profit efficiency of German domestic banks carries over to their foreign operations in France, although this
result is not statistically significant and we do not have any data from German banks in foreign nations other than
France to determine whether German banks may have a global advantage.
In Spain, our database contained only two foreign nations (France and the U.S.) that operated at three
banks. On average, both of these sets of foreign banks are more profit efficient than the domestic banks,
providing further evidence against the home field advantage hypothesis in Spain. The cost efficiency results
continue to differ from the profit results in Spain, suggesting that most of profit efficiency advantage of the
foreign banks is on the revenue side.
In the U.K., domestic banks have higher mean cost efficiency and higher mean profit efficiency than all
of the foreign nations operating in the U.K. However, none of these differences are statistically significant, and
they do not suggest that U.K. banks have a global advantage. U.K. banking organizations have only three or
more banks in one other home country in our data set, Germany, where the cost and profit efficiency of U.K.
banks are both statistically and economically significantly lower than domestic German banks. Thus, while it
may be hard for foreign banks to do business in the U.K., U.K.-owned banks do not appear to be particularly
efficient players outside their home country.
In the U.S., domestic banks have higher mean profit efficiency than the foreign banks from all other
nations, and the difference is usually statistically significant and economically large. The much higher profit
efficiency and somewhat lower cost efficiency of domestic U.S. banks relative to foreign banks in the U.S.
suggests a strong advantage for U.S. domestic banks on the revenue side of the ledger. Furthermore, unlike the
results for the other home countries, the domestic profit efficiency advantage of U.S. banks does not disappear
when these banks go abroad — U.S.-owned banks earn higher-than-domestic levels of profit efficiency in France,
Germany, and Spain.
Overall, these disaggregated data tend to support rejection of the home field advantage hypothesis in
favor of the limited form of the global advantage hypothesis. In three of the five home countries, foreign banks
from at least one other nation are more efficient on average than domestic banks, contrary to the predictions of
the home field advantage hypothesis. Banks from one nation, the U.S., exhibit mean efficiency levels that are
higher than domestic banks in all but one of the other home countries, supporting the limited form of the global

62
advantage hypothesis. Banks from Germany also exhibit high mean efficiency levels both at home and abroad,
although the foreign performance of German banks is based on a single, statistically insignificant result in only
one foreign country. These data suggest that some efficient institutions from the U.S. (and perhaps Germany)
have overcome the difficulties of imposed by distance, language, culture, etc., and are able to operate in foreign
countries above the mean domestic efficiency levels, possibly because of specific favorable market or
regulatory/supervisory conditions at home. However, determination of which home market conditions might give
these banks an advantage is beyond the scope of this study.
A potential problem with our finding of support for the limited form of the global advantage hypothesis
is a banking organization may use transfer pricing or other accounting methods to shift profits from an affiliate
in one country to an affiliate in another country for tax, regulatory, or other reasons. Thus, the generally high
efficiency performance of the U.S. banks in other nations could reflect a shifting of net cash flow out of the
domestic banks in the U.S. toward their foreign affiliates, and the poor performance of domestic Spanish banks
could reflect a shifting of net cash flow to the Spanish-owned institutions in other nations. However, there are
three pieces of evidence that suggest that this is not the case, and that banks which perform well abroad also tend
to perform well at home. First, we find that U.S. banks are more profit efficient at home as well as abroad. This
suggests a true efficiency advantage for U.S. banks, rather than simply a shift of net cash flow overseas.. Second,
we find some evidence that the poor performance of Spanish banks at home is mirrored by similarly poor
performance abroad. Our French data set contains two Spanish-owned banks (not displayed in Tables 5.3 or 5.4
because we constrained our tests to include only foreign-owned banks in groups of three or more), and these two
banks had relatively low average profit efficiency (0.320) and a relatively high average cost efficiency of (0.850),
figures that are consistent with the domestic performance of Spanish banks. Third, another study of cross-
regional bank efficiency in the U.S. found that banking organizations that do well in other regions also tend to
do well in their home region (Berger and DeYoung 1999). This supports a "national advantage hypothesis" which
is similar to the global advantage hypothesis tested here, rather than accounting shifts of income.
5.4 Robustness tests using U.S. regional data
Although our main finding supports a global advantage for U.S. banks, we also find that domestic banks
tend to have higher efficiency on average than foreign banks, consistent with previous studies of cross-border

63
efficiency. In this section we use the larger and more detailed U.S. bank data set to further investigate the reasons
for this result. First, we examine whether the higher average efficiency of domestic banks is caused by the
diseconomies of operating or monitoring subsidiaries a long distance from headquarters versus by the difficulties
of overcoming cross-border differences such as language, culture, and regulations. Second, we examine whether
the higher average efficiency of domestic banks arises simply because foreign banks tend to locate in regions
where it is difficult for both foreign and domestic banks to earn high profits.
We address the first question by dividing the U.S. into eight distinct geographic regions and evaluating
the "cross-regional efficiency" of the U.S. domestic banks. That is, we compare the estimated efficiency of 1,883
"within-region" banks (domestic U.S. banks operating in the region in which their organization is headquartered)
to the estimated efficiency of 57 "out-of-region" banks (domestic U.S. banks operating in a region different from
the one in which their organization is headquartered). The results of these tests are shown in Table 5.5, and they
suggest a modest efficiency advantage to cross-regional ownership. Large banks owned by out-of-region
organizations have a statistically significant cost efficiency edge of 3.1% of costs and a statistically insignificant
profit efficiency edge of 2.3% of potential profits over banks owned within the region.20 Given that the U.S. is
a relatively homogenous nation with potentially large distances between banks and their headquarters, these
results suggest that any organizational diseconomies of operating or monitoring subsidiaries from a distance can
be overcome by efficient organizations. If these results extrapolate to the cross-border context, they suggest that
other barriers — such as differences in language, culture, regulatory/supervisory structures, currency, or monetary
policy — more likely explain why domestic banks tend to be more efficient than foreign banks on average.
We address the second of these questions by comparing the efficiencies of foreign and domestic banks
in the U.S. within each of these geographic regions. The results of these tests are shown in Table 5.6, and they
are consistent the results in Tables 5.3 and 5.4 that suggested an advantage for U.S. banks. The 43 foreign banks
operate in just four of the eight U.S. regions (Mideast, Great Lakes, Southeast, and Far West), and are
predominantly located in the regions that include the international banking centers of New York (Mideast),
Chicago (Great Lakes), and San Francisco (Far West). In three of these four regions, the average foreign bank
has significantly lower profit efficiency the average domestic bank, the only exception being the Southeast region
with only two foreign banks. Furthermore, in three of the four regions there is no significant difference between

64
foreign bank and domestic bank cost efficiency. Foreign banks' locational choices do not appear to be driving
our results.
5.5 Implications of the tests of home field advantage versus global advantage
If the results of this research extrapolate to the future, they may have important implications for the
structure of globalized financial markets. The finding here and in the literature that foreign banks are less
efficient on average than domestic banks in most countries, if it continues into the future, suggests that efficiency
considerations may limit the global consolidation of the financial services industry. Domestically-based
institutions would continue to play a large role in the provision of financial services. Nonetheless, our results also
suggest that some banking organizations can operate in foreign countries at or above the efficiency levels of
domestic banks, paving the way for some additional global consolidation. Furthermore, the ability to operate
efficiently across borders appears to be linked to nation of ownership -- only the U.S. banks were able to operate
efficiently across borders on a reasonably consistent basis. If this U.S. advantage continues, U.S.-based
organizations may capture a significant share of any future globalization of financial institutions.
A potential goal of future research might be to try to determine which conditions in the U.S. might have
fostered their apparent efficiency advantage. If it is based on market conditions like securities market
development, then there is little that can be done by policy makers to affect financial institution efficiency. If
instead, it is based on regulatory/supervisory factors like the deregulation of geographic restrictions and deposit
interest rates, relatively easy bank chartering, then policy makers may have an important influence. If
deregulation is important, then this might predict strong cross-border efficiency gains from the Single Market
Programme in the EU and other liberalizations in other parts of the globe.
Our results may also have important implications for research methodology. As stated above, while the
aggregated results in the top two rows of Tables 5.3 and 5.4 alone appear to support the home field advantage
hypothesis, but the more detailed results in the bottom panels of these two tables reveal the support for the limited
form of the global advantage hypothesis. These results suggest disaggregation by foreign nation of ownership
in future research.
Our results also suggest that it is important to include a substantial number of different nations in the
analyses. Had we a) only used European data in this study, our results may have supported the home field

65
advantage hypothesis, since the nation with the global advantage would have been excluded; b) only used data
from a single home country, our results would have supported either the home field advantage, the global
advantage, or the limited global advantage hypothesis, depending on which country we investigated; and c) been
able to expand our database to include additional home countries, we may have found global advantages for banks
from additional countries as well.
Finally, our results support the future use of complete separate analyses of data from each home country.
Estimating efficiency jointly or pooling the efficiency estimates from institutions in different countries may create
problems of comparison because of significant differences in the environments of these countries.
6. Summary and Conclusions
In this paper, we address the causes and consequences of the cross-border consolidation of financial
institutions and the implications of this consolidation for the integration of global financial markets. First, we
extensively review several hundred research studies on the causes and consequences of consolidation. Second,
we provide comparative data on financial systems in different nations, trends in cross-border financing by banks
and other financial institutions, and trends in cross-border M&As of financial institutions. Third, we perform
an original analysis of cross-border banking efficiency in France, Germany, Spain, the U.K., and the U.S. during
the 1990s. On average, we find that domestic banks in these countries have both higher cost efficiency and higher
profit efficiency than foreign banks operating in that country -- a result that is consistent with most of the findings
in the extant literature, where it has been interpreted as supporting the home field advantage hypothesis.
However, after disaggregating our results by foreign nation of origin, we find that the data appear to reject the
home field advantage hypothesis in favor of the limited form of the global advantage hypothesis. The
disaggregated results suggest that domestic banks may be more efficient than foreign banks from most foreign
countries; may be about equally efficient with foreign banks from some foreign countries; but may be less
efficient than foreign banks from one (the U.S.) of the foreign countries.
These results, should they continue to hold in the future, may have important implications for the
structure of globalized financial markets, for financial institution policy, and for future research. First, the finding
here and in the extant literature that foreign banks are less efficient on average than domestic banks suggests that
efficiency considerations may limit the global consolidation of the financial services industry. Thus,

66
domestically-based institutions would continue to play a large role in the provision of financial services. Second,
our finding that some banking organizations can operate in foreign countries at or above the efficiency levels of
domestic banks suggests that additional global consolidation of financial markets may be in the offing. Third,
our finding that banking organizations from some countries, particularly the U.S., are better able to operate
efficiently across borders suggests that financial institutions from these countries may capture disproportionate
shares of international financial services business in the future. Fourth, if future research finds that U.S. banks
derive their apparent efficiency advantage from U.S. regulatory/supervisory conditions (e.g., easy geographic
mobility) rather than from U.S. market conditions (e.g., a well developed securities market), then one might
predict cross-border efficiency gains from similar liberalizations in other nations such as the Single Market
Programme in the EU. Finally, our results suggest that future empirical investigations in this area should include
a substantial number of home countries and institutions from a substantial number of foreign nations in the
analysis. The results also suggest that researchers disaggregate their analysis by foreign nation of ownership.
These changes appear to be important for discerning between the home field advantage and global advantage
hypotheses.
Because we base our conclusions on empirical results generated over a relatively short period of time,
for a relatively short list of countries, and for a relatively small number of foreign banks, we make them
cautiously and propose a number of important caveats. First, all five of the home countries we analyze are
advanced economies; banks in many less advanced economies may be less likely to have home field advantages.
Similarly, the patterns of relative domestic versus foreign bank efficiency may be substantially different in
important countries which we were not able to include in our analysis due to data limitations (e.g., China, Japan,
Russia). Second, the pattern of home field and global advantages that we reveal in our tests is likely to change
over time. For example, the introduction of a common European currency, the full implementation of laws
allowing expanded powers for banks, and the continued trend of M&As away from domestic deals and toward
cross-border deals, could alter the balance of home field and global advantages. Third, while we focus on the
performance of financial institutions that have acquired or established a physical presence in foreign countries,
financial institutions can also provide cross-border financial services at a distance from their home country
headquarters. Financial institutions that excel in one of these cross-border delivery channels might not excel at

67
the other, and in the future we may see institutions from different countries choosing different combinations of
these channels, perhaps depending upon whether they seek to provide retail services abroad. Fourth, because our
tests employ accounting data for banks which are in most cases subsidiaries of larger banking organizations, it
is possible that our results may be capturing the effects of transfer pricing that shifts profits from an affiliate in
one country to an affiliate in another country for tax, regulatory, or other reasons. However, our results contain
several pieces of evidence that run counter to this argument. For example, we find that banks with the best
domestic performance also perform well abroad, and banks with the weakest performance abroad also perform
poorly at home, suggesting that the underlying efficiency advantages and disadvantages of these banks may
overwhelm the effects of any tax/regulatory profit shifting.

68
References
Akhavein, Jalal D., Allen N. Berger, and David B. Humphrey. 1997. “The Effects of Bank Megamergers on Efficiencyand Prices: Evidence from the Profit Function.” Review of Industrial Organization 12: 95-139.
Alam, Ila. M. S. 1998. “A Non-Parametric Approach for Assessing Productivity Dynamics of Large Banks.” TulaneUniversity.
Allen, Franklin and Douglas Gale. 1997. “Financial Markets, Intermediaries, and Intertemporal Smoothing.” Journalof Political Economy 105(3): 523-546.
Allen, Franklin and Anthony M. Santomero. 1998. “The Theory of Financial Intermediation.” Journal of Banking andFinance 21: 1461-1485.
Allen, Linda and Anoop Rai. 1996. “Operational Efficiency in Banking: An International Comparison.” Journal ofBanking and Finance 20: 655-672.
Allen, Linda and A. Sinan Cebenoyan. 1991. “Bank Acquisitions and Ownership Structure: Theory and Evidence.”Journal of Banking and Finance 15(2): 425-448.
Allen, Linda, Anthony Saunders, and Gregory F. Udell. 1991. “The Pricing of Retail Deposits: Concentration andInformation.” Journal of Financial Intermediation 1(4): 335-361.
Altunbas, Yener, David Maude, and Phil Molyneux. 1995. “Efficiency and Mergers in the UK (retail) Banking Market.”Bank of England.
Altunbas, Yener, Phil Molyneux, and John Thornton. 1997. “Big Bank Mergers in Europe--An Analysis of the CostImplications.” Economica 64 317-329.
Amihud, Yakov and Baruch Lev. 1981. “Risk Reduction as a Managerial Motive for Conglomerate Mergers.” Journalof Economics 12(2): 605-617.
Ang, James S. and Terry Richardson. 1994. “The Underwriting Experience of Commercial Bank Affiliates Prior to theGlass-Steagall Act: A Re-examination of Evidence for Passage of the Act.” Journal of Banking and Finance18(2): 351-395.
Avery, Robert, Raphael N. Bostic, Paul Calem, and Glenn Canner. 1999. “Consolidation and Bank Branching Patterns.”Journal of Banking and Finance 23 (2-4): 497-532.
Bank for International Settlements. 1999. International Banking and Financial Market Developments. August 1998and August 1999.
Barro, Jason R., and Robert J. Barro. 1990. “Pay, Performance and Turnover of Bank CEOs.” Journal of LaborEconomics 8 (4): 448-481.
Bauer, Hans and Dietrich Domanski. 1999. “The Changing German Banking Industry: Where do We Come from andWhere are We Heading to?” In The Monetary and Regulatory Implications of Changes in the BankingIndustry. Bank for International Settlements Conference Papers 7 (March): 208-225.

69
Bauer, Paul W., Allen N. Berger, Gary D. Ferrier, and David B. Humphrey. 1998. “Consistency Conditions forRegulatory Analysis of Financial Institutions: A Comparison of Frontier Efficiency Methods,” Journal ofEconomics and Business 50 (2): 85-114.
Bauer, Paul W., Allen N. Berger, and David B. Humphrey. 1993. “Efficiency and Productivity Growth in U.S.Banking.” The Measurement of Productive Efficiency: Techniques and Applications. edited by Harold O. Fried,C.A. Knox Lovell, and Shelton S. Schmidt. Oxford: Oxford University Press: 386-413.
Bauer, Paul W. and Gary D. Ferrier. 1996. “Efficiency Measurement Issues for Payments Processing.” Journal ofMoney, Credit and Banking 28(4): 1004-1039.
Bauer, Paul W. and Diana Hancock. 1993. “The Efficiency of the Federal Reserve in Providing Check ProcessingServices.” Journal of Banking and Finance 17(3): 287-311.
Bauer, Paul W. and Diana Hancock. 1995. “Scale Economies and Technical Change in the Federal Reserve AutomatedClearinghouse Payment Process.” Federal Reserve Bank of Cleveland Economic Review 33: 14-29.
Beatty, Randolph P., R. Thompson, and Michael R. Vetsuypens. 1998. “Issuance Costs and Regulatory Change in theInvestment Banking Industry.” Southern Methodist University.
Beduc, Louis, Francoise Ducruezet, and Pierre P. Stephanopoli.1991. “The French Financial System.” In BankingStructure in Major Countries, edited by George G. Kaufman. Massachusetts: Kluwer Academic Publishers:245-293.
Benink, Harald A. 1993. Financial Integration in Europe. Dordrecht, the Netherlands: Kluwer Academic Publishers.
Benston, George J., William C. Hunter, and Larry D. Wall. 1995. “Motivations for Bank Mergers and Acquisitions:Enhancing the Deposit Insurance Put Option Versus Earnings Diversification.” Journal of Money, Credit, andBanking 27(3): 777-788.
Berg, Sigbjorn Atle, Finn Forsund, Lennart Hjalmarsson, and Matti Suominen. 1993. “Banking Efficiency in the NordicCountries.” Journal of Banking and Finance 17: 371-388.
Berg, Sigbjorn Atle, Finn R. Forsund, and Eilev S. Jansen. 1992. "Malmquist Indices of Productivity Growth Duringthe Deregulation of Norwegian Banking, 1980-89.” Scandinavian Journal of Economics, 94 (Supplement):S211-S228.
Bergendahl, Goran. 1995. "DEA and Benchmarks for Nordic Banks.” Gothenburg University. Gothenburg,Sweden (December).
Berger, Allen N. 1993. “’Distribution-Free’ Estimates of Efficiency in the U.S. Banking Industry and Tests of theStandard Distributional Assumptions.” Journal of Productivity Analysis 4(3): 261-292.
Berger, Allen N. 1995. “The Profit-Structure Relationship in Banking--Tests of Market-Power and Efficient-StructureHypotheses.” Journal of Money, Credit, and Banking 27(2): 404-431.
Berger, Allen N. 1998. “The Efficiency Effects of Bank Mergers and Acquisition: A Preliminary Look at the 1990sData.” In Bank Mergers & Acquisitions, edited by Y. Amihud and G. Miller. Boston, MA. Kluwer Academic:79-111.

70
Berger, Allen N., Seth D. Bonime, Daniel M. Covitz, Diana Hancock. 2000. “Why Are Bank Profits So Persistent?The Roles of Product Market Competition, Informational Opacity, and Regional/Macroeconomic Shocks.”Journal of Banking and Finance, forthcoming.
Berger, Allen N., Seth D. Bonime, Lawrence G. Goldberg, Lawrence J. White. 1999. “The Dynamics of Market Entry:The Effects of Mergers and Acquisitions on De Novo Entry and Small Business Lending in the BankingIndustry.” Board of Governors of the Federal Reserve System.
Berger, Allen N., J. David Cummins, Mary A. Weiss. 1997. “The Coexistence of Multiple Distribution Systems forFinancial Services: The Case of Property-Liability Insurance.” Journal of Business 70(4): 515-546.
Berger, Allen N., J. David Cummins, Mary A. Weiss, and Hongmin Zi. 1999. “Conglomeration Versus Strategic Focus:Evidence from the Insurance Industry.” Board of Governors of the Federal Reserve System.
Berger, Allen N., Rebecca S. Demsetz, and Philip E. Strahan. 1999. “The Consolidation of the Financial ServicesIndustry: Causes, Consequences, and Implications for the Future.” Journal of Banking and Finance 23 (2-4):135-194.
Berger, Allen N., and Robert DeYoung. 1997. “Problem Loans and Cost Efficiency in Commercial Banks.” Journalof Banking and Finance 21(6): 849-870.
Berger, Allen N., and Robert DeYoung. 1999. “The Efficiency Effects of Nationwide Banking.” Board of Governorsof the Federal Reserve System.
Berger, Allen N., Diana Hancock, and David B. Humphrey. 1993. “Bank Efficiency Derived from the Profit Function.”Journal of Banking and Finance 17(2-3): 317-347.
Berger, Allen N. and Timothy H. Hannan. 1989. “The Price-Concentration Relationship in Banking.” Review ofEconomics and Statistics 71 (May): 291-299.
Berger, Allen N., and Timothy H. Hannan. 1997. “Using Measures of Firm Efficiency to Distinguish Among AlternativeExplanations of the Structure-Performance Relationship.” Managerial Finance 23: 6-31.
Berger, Allen N., and Timothy H. Hannan. 1998. “The Efficiency Cost of Market Power in the Banking Industry: A Testof the “Quiet Life” and Related Hypotheses.” Review of Economics and Statistics 80(3): 454-465.
Berger, Allen N., Gerald A. Hanweck, and David B. Humphrey. 1987. “Competitive Viability in Banking: Scale, Scope,and Product Mix Economies.” Journal of Monetary Economics 20(3): 501-520.
Berger, Allen N. and David B. Humphrey. 1991. “The Dominance of Inefficiencies over Scale and Product MixEconomies in Banking.” Journal of Monetary Economics 28(1): 117-148.
Berger, Allen N. and David B. Humphrey. 1992a. “Measurement and Efficiency Issues in Commercial Banking.”Output Measurement in the Service Sectors, National Bureau of Economic Research, Studies in Income andWealth, 56, edited by Zvi Griliches, University of Chicago Press: 245-279.
Berger, Allen N. and David B. Humphrey. 1992b. “Megamergers in Banking and the Use of Cost Efficiency as anAntitrust Defense.” Antitrust Bulletin, 37 (Fall), 541-600.

71
Berger, Allen N. and David B. Humphrey. 1997. “Efficiency of Financial Institutions: International Survey andDirections for Future Research.” European Journal of Operational Research 98: 175-212.
Berger, Allen N., David B. Humphrey, and Lawrence B. Pulley. 1996. “Do Consumers Pay for One-Stop Banking?Evidence from an Alternative Revenue Function.” Journal of Banking and Finance 20(9): 1601-1621.
Berger, Allen N., Anil K. Kashyap, and Joseph M. Scalise. 1995. “The Transformation of the U.S. Banking Industry:What a Long, Strange Trip It's Been.” Brookings Papers on Economic Activity 2: 55-201.
Berger, Allen N., John H. Leusner, and John J. Mingo. 1997. “The Efficiency of Bank Branches.” Journal of MonetaryEconomics 40(1): 141-162.
Berger, Allen N. and Loretta J. Mester. 1997. “Inside the Black Box: What Explains Differences in the Efficiencies ofFinancial Institutions?” Journal of Banking and Finance 21: 895-947.
Berger, Allen N. and Loretta J. Mester. 1999. “What Explains the Dramatic Changes in Cost and Profit Performanceof the U.S. Banking Industry?” Board of Governors of the Federal Reserve System.
Berger, Allen N., Anthony Saunders, Joseph M. Scalise, and Gregory F. Udell. 1998. “The Effects of Bank Mergersand Acquisitions on Small Business Lending.” Journal of Financial Economics 50(2): 187-229.
Berger, Allen N. and Gregory F. Udell. 1995. “Relationship Lending and Lines of Credit in Small Firm Finance.”Journal of Business 68 (July): 351-382.
Berger, Allen N. and Gregory F. Udell, 1996. “Universal Banking and the Future of Small Business Lending.” InUniversal Banking: Financial System Design Reconsidered, edited by Anthony Saunders and Ingo Walter.Burr Ridge, IL: Irwin Publishing: 558-627.
Berger, Allen N. and Gregory F. Udell. 1998. “The Economics of Small Business Finance: The Roles of Private Equityand Debt Markets in the Financial Growth Cycle.” Journal of Banking and Finance 22(6-8): 613-673.
Berlin, Mitchell and Loretta J. Mester. 1998. “On the Profitability and Cost of Relationship Lending.” Journal ofBanking and Finance 22(6-8): 873-897.
Bernanke, Ben S. and Alan Blinder. 1988. “Credit, Money, And Aggregate Demand.” American Economic Review 78:435-439.
Bernanke, Ben S. and Mark Gertler. 1995. “Inside The Black Box: The Credit Channel Of Monetary PolicyTransmission.” Journal of Economic Perspectives 9: 27-48.
Bernanke, Ben S., Mark Gertler, and Simon Gilchrist. 1996. “The Financial Accelerator, and the Flight to Quality.”Review of Economics and Statistics 78: 1-15.
Bhattacharya, Amar, C. A. Knox Lovell, and P. Sahay. 1997. “The Impact of Liberalization on the Productive Efficiencyof Indian Commercial Banks.” European Journal of Operational Research 98: 332-345.
Bikker, Jacob A. 1999. “Efficiency in the European Banking Industry: An Exploratory Analysis to Rank Countries.”De Nederlandsche Bank. Amsterdam, the Netherlands.
Bikker, Jacob A. and Johannes M. Groeneveld. 1998. “Competition and Concentration in the EU Banking Industry.”
72
Der Nederlandsche Bank. The Netherlands.
Birchler, Urs W. and Georg Rich. 1991. “Bank Structure in Switzerland.” In Banking Structure in Major Countries,edited by George G. Kaufman. Massachusetts: Kluwer Academic Publishers: 389-427.
Bisignano, Joseph. 1991. “Banking in the European Economic Community: Structure, Competition, and Public Policy.”In Banking Structure in Major Countries, edited by George G. Kaufman. Massachusetts: Kluwer AcademicPublishers: 155-244.
Blackwell, David and Drew B. Winters. 1997. “Banking Relationships and the Effect of Monitoring on Loan Pricing.”Journal of Financial Research 20(2): 275-289.
Bliss, Richard T. and Richard J. Rosen. 1999. “CEO Compensation and Bank Merger.” Indiana University.
Boot, Arnoud W. A. 1999. “European Lessons on Consolidation in Banking.” Journal of Banking and Finance 23(2-4): 609-613.
Boot, Arnoud W. A. and Anjan V. Thakor. 1996. “Banking Structure and Financial Innovation.” In Universal Banking:Financial System Design Reconsidered, edited by Anthony Saunders and Ingo Walter. Irwin Publishing: 161-204.
Boot, Arnoud W.A. and Anjan V. Thakor. 1997. “Financial System Architecture.” Review of Financial Studies 10(3):693-733.
Bowen, Alex, Glenn Hoggarth, and Darren Pain. 1999. “The recent revolution of the U.K. banking industry and someimplications for financial stability.” In The Monetary and Regulatory Implications of Changes in the BankingIndustry. Bank for International Settlements Conference Papers 7 (March): 251-294.
Boyd, John H., Chun Chang, and Bruce D. Smith. 1998. “Moral Hazard Under Commercial and Universal Banking.”Federal Reserve Bank of Minneapolis Working Paper No. 585.
Boyd, John H., Stanley L. Graham, and R. Shawn Hewitt. 1993. “Bank Holding Company Mergers with NonbankFinancial Firms: Effects on the Risk of Failure.” Journal of Banking and Finance 17(1): 43-63.
Boyd, John H. and Edward C. Prescott. 1986. “Financial Intermediary-Coalitions.” Journal of Economic Theory 38(2):211-232.
Braun, Christian, Dominik Egli, Andreas Fischer, Bertrand Rime, and Christian Walter. 1999. “The Restructuring ofthe Swiss Banking System.” In The Monetary and Regulatory Implications of Changes in the BankingIndustry. Bank for International Settlements Conference Papers 7 (March): 70-97.
Brickley, J., and Christopher M. James, 1987. "The Takeover Market, Corporate Board Compensation, and OwnershipStructure: The Case of Banking," Journal of Law and Economics 30 (April): 161-180.
Brookes, Martin. 1999. “The Impact of EMU on Portfolio Management.” In European Banking after EMU, edited byChristopher Hurst and Rien Wagenvoort. European Investment Bank Papers 4(1): 19-33.
Bruni, Franco. 1990. “Banking and Financial Reregulation Towards 1992:The Italian Case.” In European Banking inthe 1990s, edited by Jean Dermine. Cambridge, MA: Basil Blackwell, Inc.: 231-257.

73
Budzeika, George. 1991. “Determinants of the Growth of Foreign Banking Assets in the United States.” FederalReserve Bank of New York Research Paper 9112, (May).
Bukh, P. N. D., Sigbjorn Atle Berg, and Finn R. Forsund. 1995. "Banking Efficiency in the Nordic Countries: A Four-Country Malmquist Index Analysis.” University of Aarhus. Denmark (September).
Calomiris, Charles, Charles Himmelberg, and Paul Wachtel. 1995. “Commercial Paper, Corporate Finance and theBusiness Cycle: A Microeconomic Perspective.” Carnegie-Rochester Series on Public Policy 42: 203-250.
Caminal, Ramon, Jordi Gual, and Xavier Vives. 1990. “Competition in Spanish Banking.” In European Banking inthe 1990s, edited by Jean Dermine. Basil Blackwell, Inc.: 261-305.
Carey, Mark, Stephen Prowse, John Rea, and Gregory Udell. 1993, “Recent Developments in the Market for PrivatelyPlaced Debt.” Federal Reserve Bulletin: 77-92.
Cargill, Thomas F. and Shoichi Royama, 1992. “The Evolution of Japanese Banking and Finance.” In BankingStructure in Major Countries, edited by George G. Kaufman. Massachusetts: Kluwer Academic Publishers:333-388.
Cerasi, Vittoria, Barbara Chizzolini, and Marc Ivaldi. 1998. “Sunk Costs and Competitiveness of European Banks afterDeregulation.” LSE Financial Markets Group Discussion Paper 290 (April).
Chang, C. Edward, Iftekhar Hasan, and William C. Hunter. 1998. “Efficiency of Multinational Banks: An EmpiricalInvestigation,” Applied Financial Economics 8(6): 1-8.
Chen, Hsuan-Chi and Jay R. Ritter. 1999. “The Seven Percent Solution.” Journal of Finance (forthcoming).
Clark, Jeffrey. 1996. “Economic Cost, Scale Efficiency and Competitive Viability in Banking.” Journal of Money,Credit, and Banking 28: 342-364.
Clark, Jeffrey and Thomas F. Siems. 1997. “Competitive Viability in Banking: Looking Beyond the Balance Sheet.”Federal Reserve Bank of Dallas, Financial Industry Studies Working Paper No. 5-97.
Cole, Rebel A. 1998. The Importance of Relationships to the Availability of Credit.” Journal of Banking and Finance22(6-8): 959-977.
Cole, Rebel A., Lawrence G. Goldberg, and Lawrence J. White. 1999. “Cookie-Cutter Versus Character: The MicroStructure of Small Business Lending by Large and Small Banks.” in Business Access to Capital and Credit,edited by Richard W. Lang. Federal Reserve Bank of Dallas: 362-389.
Cole, Rebel A. and Nicholas Walraven. 1998. “Banking Consolidation and the Availability of Credit to SmallBusiness.” Federal Reserve Board.
Commission of the European Communities. 1988a. European Economy: The Economics of 1992. No. 35. Brussels:EU (March).
Commission of the European Communities. 1988b. The “Cost of Non-Europe” In Financial Services. Brussels: EU.
Cornett, Marcia Milton, G. Hovakimian, Darius Palia, and Hassan Tehranian. 1998. “The Impact of the Manager-Shareholder Conflict on Acquiring Bank Returns.”

74
Cornett, Marcia Milton, and Hassan Tehranian. 1992. “Changes in Corporate Performance Associated with BankAcquisitions.” Journal of Financial Economics 31(2): 211-234.
Craig, Ben R. and Joao A. C. Santos. 1997. “Banking Consolidation: Impact on Small Business Lending.” FederalReserve Bank of Cleveland.
Crawford, Anthony J., John R. Ezzell, and James A. Miles. 1995. “Bank CEO Pay-Performance Relations and theEffects of Deregulation.” Journal of Business 68(2): 231-256.
Cummins, J. David, Sharon L. Tennyson, and Mary A. Weiss. 1999. “Consolidation and Efficiency in the US LifeInsurance Industry.” Journal of Banking and Finance 23(2-4): 325-357.
Cummins, J. David and Mary A. Weiss. 2000. “The Global Market for Reinsurance: Consolidation, Capacity, andEfficiency.” Brookings-Wharton Papers on Financial Services 3.
Cummins, J. David and Hongmin Zi. 1998. “Comparison of Frontier Efficiency Methods: An Application to the U.S.Life Insurance Industry.” Journal of Productivity Analysis 10(2): 131-152.
Cybo-Ottone, Alberto, Carmine Di Noia, and Maurizio Murgia. 2000. “Recent Developments in the Structure ofSecurities Markets” Brookings-Wharton Papers on Financial Services. Forthcoming.
Cybo-Ottone, Alberto and Maurizio Murgia. 1998. “Mergers and Shareholder Wealth in European Banking.”Associazione Bancaria Italiana.
Cyrnak, Anthony and Timothy H. Hannan. 1998. “Bank Lending to Small Businesses and the Use of CRA Loan Datato Measure Market Structure.” Federal Reserve Board.
De Bandt, Olivier. 1998. “EMU and the Structure of the European Banking System”. Paper prepared for the SUERFCFS Conference: The Euro: Challenge and Opportunity for Financial Markets.” Frankfurt, Germany.November 15-17, 1998.
De Bandt, Olivier. 1999. “EMU and the Structure of the European Banking System.” In The Monetary and RegulatoryImplications of Changes in the Banking Industry. Bank for International Settlements Conference Papers 7(March): 121-141.
De Bandt, Olivier, and E. Philip Davis. 1998. “Competition, Contestability and Market Structure in European BankingSectors on the Eve of EMU: Evidence from France, Germany and Italy with a Perspective on the UnitedStates.” Paper presented at the VII Tor Vergata Financial Conference on “Post Euro Competition and Strategyamong Financial Systems and Bank-Firm Relations.” Rome, Italy. November 26-27, 1998.
de Boissieu, Christian. 1997. “The French Banking Sector in the Light of European Financial Integration.” In EuropeanBanking in the 1990s, ed. Jean Dermine. Cambridge, MA: Basil Blackwell, Inc.: 183-226.
Delbreil, Michel, Jose Ramon Cano, Hans Friderichs, Benoit Gress, Bernard Paranque, Franz Partsch, and FrancoVaretto. 1998. Net Equity and Corporate Financing in Europe: A Comparative Analysis of German,Austrian, Spanish, French and Italian Manufacturing Companies With Share Capital during the Period1991-1993. European Committee of Central Balance Sheet Offices, Working Group on Net Equity.
DeLong, Gayle L. 1999. “Domestic and International Bank Mergers: Shareholder Gains from Focusing versus
75
Diversifying.” Baruch College.
Demsetz, Rebecca S. and Marc R. Saidenberg. 1999. “Looking Beyond the CEO: Executive Compensation at Banks.”Federal Reserve Bank of New York.
Demsetz, Rebecca S., Marc R. Saidenberg, and Philip E. Strahan. 1997. “Agency Problems and Risk Taking at Banks,”Federal Reserve Bank of New York, Staff Report #29 (September).
Demsetz, Rebecca S. and Phillip E. Strahan. 1997. “Diversification, Size, and Risk at Bank Holding Companies.”Journal of Money, Credit, and Banking 29(3): 300-13.
Dermine, Jean. 1998. “Eurobanking, The Strategic Issues.” Paper prepared for the SUERF Colloquium on The Euro:A Challenge And Opportunity For Financial Markets, Frankfurt, Germany, October 15-17, 1998.
Dermine, Jean. 1999a. “European Capital Markets: Does the Euro Matter?” In European Capital Markets with a SingleCurrency, edited by Jean Dermine and Pierre Hillion. Oxford: Oxford University Press: 1-32.
Dermine, Jean, 1999b. “The Economics of Bank Mergers in the European Union, A Review of the Public PolicyIssues.” INSEAD Fontainebleau, France.
Dermine, Jean. 1999c. “The Case for a European-wide Strategy.” In European Banking after EMU, edited byChristopher Hurst and Rien Wagenvoort. European Investment Bank Papers 4(1): 137-143.
Dermine, Jean and Pierre Hillion. (ed.) 1999. European Markets with a Single Currency. Oxford University Press.
Devaney, Michael and Warren Weber. 1996. “Productivity Growth, Market Structure, and Technological Change:Evidence from the Rural Banking Sector.” Southeast Missouri University.
DeYoung, Robert. 1997. “Bank Mergers, X-Efficiency, and the Market for Corporate Control.” Managerial Finance23: 32-47.
DeYoung, Robert. 1998. “Comment on Goldberg and White.” Journal of Banking and Finance 22: 868-872.
DeYoung, Robert, Lawrence G. Goldberg, and Lawrence J. White. 1999. “Youth, Adolescence, and Maturity at Banks:Credit Availability to Small Business in an Era of Banking Consolidation.” Journal of Banking and Finance23(2-4): 463-492.
DeYoung, Robert and Iftekhar Hasan. 1998. “The Performance of De Novo Commercial Banks: A Profit EfficiencyApproach.” Journal of Banking and Finance 22(5): 565-587.
DeYoung, Robert, Iftekhar Hasan, and Bruce Kirchhoff. 1998. “The Impact of Out-Of-State Entry on the CostEfficiency of Local Commercial Banks.” Journal of Economics and Business 50(2): 191-203.
DeYoung, Robert and Daniel E. Nolle. 1996. “Foreign-Owned Banks in the U.S.: Earning Market Share or Buying It?”Journal of Money, Credit, and Banking 28(4): 622-636.
Dietsch, Michel, Gary Ferrier, and Laurent Weill. 1998. “Banking Efficiency and European Integration: Productivity,Cost and Profit Approaches.” Universite Robert Schuman de Strasbourg, France.
Dietsch, Michel and Ana Lozano-Vivas. Forthcoming “How the Environment Determines Banking Efficiency: A

76
Comparison between French and Spanish Industries.” Journal of Banking and Finance.
Diamond, Douglas W. 1984. “Financial Intermediation and Delegated Monitoring.” Review of Economic Studies 51(3):393-414.
Diamond, Douglas W. 1991. “Monitoring and Reputation: The Choice between Bank Loans and Directly Placed Debt.”Journal of Political Economy 99(4): 689-721.
Di Noia, Carmine. 1999. "The Stock-Exchange Industry: Network Effects, Implicit Mergers, and CorporateGovernance." Commissione Nazionale per le Società e La Borsa. Quaderni di Finanza. no. 33.
Di Noia, Carmine. 2000. "Competition and Integration among Stock Exchanges in Europe: Network Effects, ImplicitMergers and Remote Access." The European Financial Management Journal. Forthcoming.
Economides, Nicholas. 1993. “Network Economics with Application to Finance.” Financial Markets, Institutions, andInstruments 5: 1-89.
Economides, Nicholas. 1996. “The Economics of Networks.” International Journal of Industrial Organization 14 (6):673-699.
Elyasiani, Elyas, and Seyed M. Mehdian. 1995. “The Comparative Efficiency Performance of Small and Large U.S.Commercial Banks in the Pre- and Post-deregulation Eras.” Applied Economics 27: 1069-1079.
European Central Bank. 1999. “Possible Effects of EMU on the EU Banking Systems in the Medium to Long Term.” Frankfurt, Germany.
European Commission. 1997. “Impact on Services: Credit Institutions and Banking.” The Single Market Review 2:4.
Fazio, Antonio. 1999a. “The Restructuring of the Italian Banking System.” Statement to the Joint Session of the SixthCommittees of the Italian Senate and Chamber of Deputies (April 20, 1999). Rome.
Fazio, Antonio. 1999b. “The Italian Banking System, Competition, Efficiency, Growth.” Speech given to the AnnualMeeting of the Italian Bankers’ Association (June 23, 1999). Rome.
Fecher, Fabienne and Pierre Pestieau. 1993. “Efficiency and Competition in O.E.C.D. Financial Services”. In TheMeasurement of Productive Efficiency: Techniques and Applications, edited by Harold O. Fried, C.A. KnoxLovell, and Shelton S. Schmidt, Oxford University Press, U.K.: 374-385.
Ferrier, Gary D., Shawna Grosskopf, Kathy Hayes, and Suthathip Yaisawarng. 1993. “Economies of Diversificationin the Banking Industry: A Frontier Approach.” Journal of Monetary Economics 31: 229-249.
Ferrier, Gary D. and C. A. Knox Lovell. 1990. “Measuring Cost Efficiency in Banking: Econometric and LinearProgramming Evidence.” Journal of Econometrics 46(1-2): 229-245.
Fixler, Dennis and Kimberly Zieschang. 1993. “An Index Number Approach to Measuring Bank Efficiency: AnApplication to Mergers.” Journal of Banking and Finance 17(2-3): 437-450.
Focarelli, Dario, Fabio Panetta, and Carmelo Salleo. 1998. “Why Do Banks Merge: Some Empirical Evidence FromItaly.” In The Changing European Financial Landscape. European Summer Institute Centre for Economic

77
Policy Research: 62-87.
Fried, Harold O., C. A. Knox Lovell, and Suthathip Yaisawarng. 1999. “The Impact of Mergers on Credit Union ServiceProvision.” Journal of Banking and Finance 23(2-4): 367-86.
Fuentes, Ignacio and Teresa Sastre. 1999. “Implications of Restructuring in the Banking Industry: the Case of Spain.”In The Monetary and Regulatory Implications of Changes in the Banking Industry. Bank for InternationalSettlements Conference Papers 7 (March): 98-120.
Gande, Amar, Manju Puri, Anthony Saunders, and Ingo Walter. 1997. “Bank Underwriting of Debt Securities: ModernEvidence.” The Review of Financial Studies 10(4): 1175-1202.
Gande, Amar, Manju Puri, and Anthony Saunders. 1998. “Bank Underwriting of Debt Securities: Modern Evidence.”The Review of Financial Studies 10(4): 1175-1202.
Gande, Amar, Manju Puri, and Anthony Saunders. 1999. “Bank entry, competition and the market for corporatesecurities underwriting.” Journal of Financial Economics 54(2): forthcoming.
Gardner, Lisa and Martin F. Grace. 1993. “X-Efficiency in the U.S. Life Insurance Industry.” Journal of Banking andFinance 17(2-3): 497-510.
Genay, Hesna. 1998. “Assessing the Condition of Japanese Banks: How Informative are Accounting Earnings?” FederalReserve Bank of Chicago Economic Perspectives Fourth Quarter: 12-34.
Gibson, Michael, 1996. “The Bank Lending Channel of Monetary Policy Transmission: Evidence from a Model of BankBehavior that Incorporates Long-term Customer Relationships.” Federal Reserve Board.
Giddy, Ian, Anthony Saunders, and Ingo Walter. 1996. “Alternative Models for Clearance and Settlement: The Caseof the Single European Capital Market.” Journal of Money, Credit and Banking 28(4): 986-1000.
Goldberg, Lawrence G. and Robert Grosse. 1994. “Location Choice of Foreign Banks in the United States.” Journalof Economics and Business 46, 367-379.
Goldberg, Lawrence G., Gerald A. Hanweck, Michael Keenan, and Allister Young. 1991. “Economics of Scale AndScope in the Securities Industry.” Journal of Banking and Finance 15: 91-107.
Goldberg, Lawrence G. and Denise Johnson. 1990. “The Determinants of US Banking Activity Aboard”. Journal ofInternational Money and Finance 9: 123-137.
Goldberg, Lawrence G. and Anthony Saunders. 1981. “The Determinants of Foreign Banking Activity in the UnitedStates.” Journal of Banking and Finance 5: 17-32.
Goldberg, Lawrence G. and Lawrence J. White. 1998. “De Novo Banks and Lending to Small Businesses.” Journalof Banking and Finance 22(6-8): 851-867.
Gorton, Gary and Richard Rosen. 1995. “Corporate control, Portfolio Choice, and the Decline of Banking.” Journalof Finance 50 (December): 1377-1420.

78
Grace, Martin and Stephen G. Timme. 1992. “An Examination of Cost Economies in the United States Life InsuranceIndustry.” Journal of Risk and Insurance 59(1): 72-103.
Greenbaum, Stuart, George Kanatas, and Itzhak Venezia. 1989. “Equilibrium Loan Pricing Under the Bank ClientRelationship.” Journal of Banking and Finance 13: 221-235.
Greenspan, Alan. 1999. Speech to the World Bank Group and International Monetary Fund (September 27).
Grifell-Tatje, Emili and C. A. Knox Lovell. 1996. “Deregulation and Productivity Decline: The Case of Spanish SavingsBanks.” European Economic Review 40(6): 1281-1303.
Grosse, Robert and Lawrence G. Goldberg. 1991. “Foreign Bank Activity in the United States: An Analysis by Countryof Origin.” Journal of Banking and Finance 15: 1093-1112.
Gual, Jordi. 1999. “Deregulation, Integration and Market Structure in European Banking.” IESE, University of Navarra.
Hadlock, Charles J., Joel F. Houston, and Michael Ryngaert. 1999. “The Role of Managerial Incentives in BankAcquisitions.” Journal of Banking and Finance 23(2-4): 221-49.
Hall, Brian J. and Jeffrey B. Liebman, 1998. “Are CEOs Really Paid Like Bureaucrats?” Quarterly Journal ofEconomics 103: 653-691.
Hancock, Diana, David B. Humphrey, and James A. Wilcox. 1999. “Cost Reductions in Electronic Payments: The Rolesof Consolidation, Economies of Scale, and Technical Change.” Journal of Banking and Finance 23(2-4): 391-421.
Hancock, Diana and James A. Wilcox. 1998. “The ‘Credit Crunch’ and the Availability of Credit to Small Business.”Journal of Banking and Finance 22(6): 983-1014.
Hannan, Timothy H. 1991. “Bank Commercial Loan Markets and the Role of Market Structure: Evidence from Surveysof Commercial Lending.” Journal of Banking and Finance 15(1): 133-149.
Hannan, Timothy H. 1994. “Asymmetric Price Rigidity and the Responsiveness of Customers to Price Changes: TheCase of Deposit Interest Rates.” Journal of Financial Services Research 8(4): 257-267.
Hannan, Timothy H. 1997. “Market Share Inequality, the Number of Competitors, and the HHI: An Examination ofBank Pricing.” Review of Industrial Organization 12(1): 23-35.
Hannan, Timothy H. 1998. “Bank Fees and Their Variation Across Banks And Locations.” Working Paper, FederalReserve Board.
Hannan, Timothy H. and Allen N. Berger. 1991. “The Rigidity of Prices: Evidence from the Banking Industry.”American Economic Review 81(4): 938-945.
Hannan, Timothy H. and Ferdinand Mavinga. 1980. “Expense Preference and Managerial Control: The Case of theBanking Firm.” Bell Journal of Economics 11(2): 671-682.
Hannan, Timothy H. and John D. Wolken. 1989. “Returns to Bidders and Targets in the Acquisition Process: Evidencefrom the Banking Industry.” Journal of Financial Services Research 3(1): 5-16.

79
Hanweck, Gerald A and Arthur Hogan. 1996. “The Structure of the Property/Casualty Insurance Industry,” Journalof Economics & Business 48: 141-55.
Hasan, Iftekhar and William C. Hunter. 1996. “Efficiency of Japanese Multinational Banks in the United States,”Research in Finance 14: 157-173.
Hasan, Iftekhar, William C. Hunter, and Ana Lozano-Vivas. (forthcoming). “Deregulation, Strategy, Bank Performance,and Efficiency: Spanish Experience.” In European Banking issues: Historical and ContemporaryPerspectives, edited by Irene Fenel-Henigman. JAI Press.
Hasan, Iftekhar and Ana Lozano-Vivas. 1998. “Foreign Banks, Production Technology, and Efficiency: SpanishExperience.” Working Paper presented at the Georgia Productivity Workshop III. Athens, Georgia.
Hayes, Samuel L. III, Michael Spence, and David Van Praag Marks. 1983. Competition in the Investment BankingIndustry. Cambridge, MA, Harvard University Press.
Haynes, George W., Charles Ou, and Robert Berney. 1999. “Small Business Borrowing From Large And Small Banks.”In Business Access to Capital and Credit, edited by Richard W. Lang. Federal Reserve Bank of Dallas: 287-327.
Haynes, Michael and Steve Thompson. 1999. “The Productivity Effects Of Bank Mergers: Evidence From The UKBuilding Societies.” Journal of Banking and Finance 23: 825-846.
Hoshi, Takeo and Anil Kashyap. 1999. “The Japanese Banking Crisis: Where did it come from and how will it end?”In the NBER Macroeconomics Annual 1999 forthcoming.
Houston, Joel F. and Christopher M. James. 1995. “CEO Compensation and Bank Risk - Is Compensation in BankingStructured to Promote Risk Taking?” Journal of Monetary Economics 36: 405-432.
Houston, Joel F. and Christopher M. James. 1998. “Do Bank Internal Capital Markets Promote Lending?” Journal ofBanking and Finance 22(6-8): 899-918.
Houston, Joel F., Christopher M. James, and David Marcus. 1997. “Capital Market Frictions and The Role of InternalCapital Markets in Banking.” Journal of Financial Economics 46(2): 135-164.
Houston, Joel F. and Michael D. Ryngaert. 1994. “The Overall Gains from Large Bank Mergers.” Journal of Bankingand Finance 18(6): 1155-76.
Houston, Joel F. and Michael D. Ryngaert. 1996. “The Value Added by Bank Acquisitions: Lessons from Wells Fargo'sAcquisition of First Interstate.” Journal of Applied Corporate Finance 9: 74-82.
Houston, Joel F. and Michael D. Ryngaert. 1997. “Equity Issuance and Adverse Selection: A Direct Test UsingConditional Stock Offers.” Journal of Finance 52(1): 197-219.
Hubbard, R. Glenn and Darius Palia. 1995. “Executive Pay and Performance: Evidence from the U.S. BankingIndustry.” Journal of Financial Economics 39(1): 105-130.
Hubbard, R. Glenn, Kenneth Kuttner, and Darius Palia. 1998. “Are There Bank Effects in Borrowers’ Costs of Funds?Evidence from a Matched Sample of Borrowers and Banks.” Columbia University.

80
Hughes, Joseph P., William Lang, and Loretta J. Mester, and Choon-Geol Moon. 1996. “Efficient Banking UnderInterstate Branching.” Journal of Money, Credit, and Banking 28(4): 1043-1071.
Hughes, Joseph P., William Lang, Loretta J. Mester, and Choon-Geol Moon. 1997. “Recovering Risky TechnologiesUsing the Almost Ideal Demand System: An Application to U.S. Banking.’” Federal Reserve Bank ofPhiladelphia Research Working Paper No. 97-8.
Hughes, Joseph P., William Lang, Loretta J. Mester, and Choon-Geol Moon. 1999. “The Dollars and Sense of BankConsolidation.” Journal of Banking and Finance 23(2-4): 291-324.
Hughes, Joseph P. and Loretta J. Mester. 1998. “Bank Capitalization and Cost: Evidence of Scale Economies in RiskManagement and Signaling.” Review of Economics and Statistics 80(2): 314-325.
Humphrey, David B. 1993. “Cost and Technical Change: Effects from Bank Deregulation.” Journal of ProductivityAnalysis 4: 9-34.
Humphrey, David B. and Lawrence B. Pulley. 1997. “Banks’ Responses to Deregulation: Profits, Technology, andEfficiency.” Journal of Money, Credit, and Banking 29(1): 73-93.
Hunter, William C. and Stephen G. Timme. 1986. “Technical Change, Organizational Form, and the Structure of BankProduction.” Journal of Money, Credit and Banking 18(2): 152-166.
Hunter, William. C. and Stephen G. Timme. 1991. “Technological Change and Production Economies in Large USCommercial Banking.” Journal of Business 64: 339-362.
Hunter, William C., Stephen G. Timme, and Won Keun Yang. 1990. “An Examination of Cost Subadditivity andMultiproduct Production in Large U.S. Banks.” Journal of Money, Credit and Banking 22(4): 504-525.
Hurst, Christopher and Rien Wagenvoort. (ed.) 1999. European Banking after EMU. European Investment BankPapers 4(1).
Investment Dealers Digest, January 11, 1999: 30-33.
Jackson, William E. III. 1997. “Market Structure and the Speed of Price Adjustments: Evidence of Non-monotonicity.”Review of Industrial Organization 12(1): 37-57.
James, Christopher. 1984. “An Analysis of the Effect of State Acquisition Laws on Managerial Efficiency: The Caseof the Bank Holding Company Acquisitions.” Journal of Law and Economics 27(1): 211-26.
Jayaratne, Jith and Philip E. Strahan. 1996. “The Finance-Growth Nexus: Evidence from Bank Branch Deregulation.”Quarterly Journal of Economics 111: 639-670.
Jayaratne, Jith and Philip E. Strahan. 1998. “Entry Restrictions, Industry Evolution and Dynamic Efficiency: Evidencefrom Commercial Banking.” Journal of Law and Economics 41: 239-273.
Jayaratne, Jith and John D. Wolken. 1999. “How Important are Small Banks to Small Business Lending? New Evidencefrom a Survey to Small Businesses.” Journal of Banking and Finance 23(2-4): 427-458.
Jensen, Michael C. and Kevin J. Murphy. 1990. “Performance Pay and Top-Management Incentives.” Journal of

81
Political Economy 98: 225-264.
Kane, Edward J. 1999a. “How Offshore Financial Competition Disciplines Exit Resistance by Incentive-ConflictedBank Regulators.” National Bureau of Economic Research Working Paper No. 7156 (June).
Kane, Edward J. 1999b. “ When Should A Conscientious Central Banker Challenge A Banking Megamerger?” BostonCollege.
Kashyap, Anil K. and Jeremy C. Stein. 1995. “The Impact Of Monetary Policy On Bank Balance Sheets.” Carnegie-Rochester Conference Series on Public Policy 42: 151-195.
Kashyap, Anil K. and Jeremy C. Stein. 1997a. “The role of banks in Monetary Policy: A survey with Implications forthe European Monetary Union.” Federal Reserve Bank of Chicago Economic Perspectives 11(5): 2-18.
Kashyap, Anil K. and Jeremy C. Stein. 1997b. “What Do a Million Banks Have to Say About the Transmission ofMonetary Policy.” National Bureau of Economic Research Working Paper No. 6056 (June).
Kashyap, Anil K., Jeremy C. Stein, and David W. Wilcox. 1993. “Monetary Policy and Credit Conditions: Evidencefrom the Composition of External Finance.” American Economic Review 83(1): 78-98.
Kashyap, Anil K., Jeremy C. Stein, and David W. Wilcox. 1996. “Monetary Policy and Credit Conditions: Evidencefrom the Composition of External Finance: Reply.” American Economic Review 86(1): 310-14.
Keeley, Michael. 1990. “Deposit Insurance, Risk, and Market Power in Banking.” American Economic Review 80:1183-1200.
Keeton, William R. 1995. “Multi-Office Bank Lending to Small Businesses: Some New Evidence.” Federal ReserveBank of Kansas City Economic Review 80 (2): 45-57.
Keeton, William R. 1996. “Do Bank Mergers Reduce Lending to Businesses and Farmers? New Evidence From TenthDistrict States.” Federal Reserve Bank of Kansas City Economic Review 81 (3): 63-75.
Keeton, William R. 1997. “The Effects of Mergers on Farm and Business Lending at Small Banks: New Evidence fromTenth District States.” Federal Reserve Bank of Kansas City.
Kellner, S. and G. Frank Mathewson. 1983. “Entry, Size Distribution, Scale, and Scope Economies in the Life InsuranceIndustry.” Journal of Business 56: 25-44.
Kolari, James and Asghar Zardkoohi. 1997a. “The Impact of Structural Change in the Banking Industry on SmallBusiness Lending.” Report to the Small Business Administration.
Kolari, James and Asghar Zardkoohi. 1997b. “Bank Acquisitions and Small Business Lending.” Texas A&MUniversity .
Kroszner, Randall S. 1999. “Is the Financial System Politically Independent? Perspectives on the Political Economyof Banking and Financial Regulation.” University of Chicago (June).
Kroszner, Randall S. and Raghuram G. Rajan. 1994. “Is the Glass-Steagall Act Justified? A Study of the U.S.Experience with Universal Banking Before 1933.” American Economic Review 84(4): 810-832.

82
Kroszner, Randall S. and Raghuram G. Rajan. 1997. “Organizational Structure and Credibility: Evidence fromCommercial Bank Securities Activities before the Glass-Steagall Act.” Journal of Monetary Economics 39:475-516.
Kwan, Simon. 1998. “Securities Activities by Commercial Banking Firms’ Section 20 Subsidiaries: Risk, Return, andDiversification Benefits.” Federal Reserve Bank of San Francisco Working Paper No. 98-10 (October).
Kwast, Myron L. 1989. “The Impact of Underwriting and Dealing on Bank Returns and Risks.” Journal of Bankingand Finance 13(1): 101-125.
Kwast, Myron L. and S. Wayne Passmore. Forthcoming. “The Subsidy Provided By The Federal Safety Net: TheoryAnd Evidence.” Journal of Financial Services Research.
Kwast, Myron L., Martha Starr-McCluer, and John D. Wolken. 1997. “Market Definition and the Analysis of Antitrustin Banking.” Antitrust Bulletin 42(4): 973-995.
Lang, William W. and Leonard I. Nakamura. 1989. “Information Losses in a Dynamic Model of Credit .” Journal ofFinance 44(3): 730-746.
Lang, Gunter and Peter Welzel. 1998. “Technology and Cost Efficiency in Universal Banking: A Thick FrontierApproach.” Journal of Productivity Analysis 10(1): 63-84.
Lannoo, Karel and Daniel Gros. 1998. “Capital Markets and EMU: Report of a CEPS Working Party.” Centre forEuropean Policy Studies.
Lee, Inmoo, Scott Lochhead, Jay Ritter, and Quanshi Zhao. 1996. “The Costs of Raising Capital.” Journal of FinancialResearch 19: 59-74.
Levonian, Mark and J. Soller. 1995. “Small Banks, Small Loans, Small Business.” Federal Reserve Bank of SanFrancisco.
Llewellyn, David. T. 1992. “The British Financial System.” In Banking Structure in Major Countries, edited by GeorgeG. Kaufman. Massachusetts: Kluwer Academic Publishers: 429-468.
Llewellyn, David. T. 1996. “Universal Banking and the Public Interest: A British Perspective.” In Universal Banking:Financial System Design Reconsidered, edited by Anthony Saunders, and Ingo Walter. Irwin Publishing: 161-204.
Lozano, Ana. 1998. “Efficiency and Technical Change for Spanish Banks.” Applied Financial Economics 8: 289-300.
Mahajan, Arvind, Nanda Rangan, and Asghar Zardkoohi. 1996. “Cost Structures in Multinational and DomesticBanking.” Journal of Banking and Finance 20(2): 238-306.
Marcus, Alan J. 1984. “Deregulation and Bank Financial Policy.” Journal of Banking and Finance 8(4): 557-65.
Matherat, Sylvie and Jean-Luc Cayssials. 1999. “The likely impact of changing financial environment and bankrestructuring on financial stability: The case of France since the mid-1980s.” In The Monetary and RegulatoryImplications of Changes in the Banking Industry. Basle, Switzerland: Bank for International Settlements: 168-187.

83
Maudos, Joaquin. 1996. “Market Structure and Performance in Spanish Banking Using a Direct Measure of Efficiency.”University of Valencia. Valencia, Spain.
Maudos, Joaquin, Jose Manuel Pastor, Francisco Perez, and Javier Quesada. 1999a. “Cost and Profit Efficiency inEuropean Banks.” Instituto Valenciano de Investigaciones Economicas (IVIE). Valencia, Spain.
Maudos, Joaquin, Jose Manuel Pastor, Francisco Perez, and Javier Quesada. 1999b. “The Single European Market andBank Efficiency: The Importance of Specialization.” Instituto Valenciano de Investigaciones Economicas(IVIE), Valencia, Spain.
May, Don O. 1995. “Do Managerial Motives Influence Firm Risk Reduction Strategies.” The Journal of Finance 50:1291-1308.
Mayer, Colin. 1999. “European Capital Markets: Competition between Systems.” In European Banking after EMU,edited by Christopher Hurst and Rien Wagenvoort. European Investment Bank Papers 4(1): 47-57..
McAllister, Patrick H. and Douglas A. McManus. 1993. “Resolving the Scale Efficiency Puzzle in Banking.” Journalof Banking and Finance 17(2-3): 389-405.
McCauley, Robert N. and White William R. 1997. “The Euro and European Financial Markets.” Bank for InternationalSettlements Working Papers Number 41.
McIntosh, James. 1998. “Scale Efficiency in a Dynamic Model of Canadian Insurance Companies.” Journal of Risk& Insurance 65: 303-17.
Meador, Joseph W., Harley E. Ryan, Jr., and Carolin D. Schellhorn. 1998. “Product Focus Versus Diversification:Estimates of X-Efficiency for the U.S. Life Insurance Industry.” Northeastern University.
Merrill Lynch & Co., Inc. 1999. “EMU: A Catalyst for Change in the European Financial Services Industry.” InInstitutional Investor, edited by David Fairlamb. European Editor and the Economist Intelligence Unit.
Merton, Robert. 1977. “An Analytic Derivation of the Cost of Deposit Insurance and Loan Guarantees.” Journal ofBanking and Finance 1: 3-11.
Mester, Loretta J. 1987. “Multiple Market Contact Between Savings and Loans.” Journal of Money, Credit, andBanking 19(4): 538-549.
Mester, Loretta J. 1989. “Testing for Expense Preference Behavior: Mutual Versus Stock Savings and Loans.” RANDJournal of Economics 20: 483-498.
Mester, Loretta J. 1991. “Agency Costs Among Savings and Loans.” Journal of Financial Intermediation 1: 257-278.
Mester, Loretta J. 1992a. “Perpetual Signaling with Imperfectly Correlated Costs,” RAND Journal of Economics 23(4):548-563.
Mester, Loretta J. 1992b. “Traditional and Nontraditional Banking: An Information-Theoretic Approach.” Journal ofBanking and Finance 16(3): 545-566.
Mester, Loretta J. 1993. “Efficiency in the Savings and Loan Industry.” Journal of Banking and Finance 17(2-3): 267-
84
286.
Mester, Loretta J. 1997. "Measuring Efficiency at U.S. Banks: Accounting for Heterogeneity is Important." EuropeanJournal of Operational Research 98(2): 230-242.
Mester, Loretta J., Leonard. I. Nakamura, and Micheline Renault. 1998. “Checking Accounts and Bank Monitoring.”Federal Reserve Bank of Philadelphia Working Paper No. 98-25.
Milbourn, Todd T., Arnoud W.A. Boot, and Anjan Thakor. 1999. “Megamergers and Expanded Scope: Theories ofBank Size and Activity Diversity.” Journal of Banking and Finance 23(2-4): 195-214.
Miller, Stewart R. and Arvind Parkhe. 1999. “Home-Country Environment as a Source of InternationalCompetitiveness: An Analysis of the Global Banking Industry.” Michigan State University.
Mitchell, Karlyn and Nur M. Onvural. 1996. “Economies of Scale and Scope at Large Commercial Banks: Evidencefrom the Fourier Flexible Functional Form.” Journal of Money, Credit, and Banking 28(2): 178-99.
Molyneux, Philip, Yener Altunbas, and Edward Gardener, 1996. Efficiency in European Banking. Chichester, England:John Wiley & Sons, Ltd.
Molyneux, Philip, D.M. Lloyd-Williams, and John Thornton, 1994. “Competitive Conditions in European Banking.”Journal of Banking and Finance 18(3): 445-459.
Morck, Randal, Andrei Shleifer, and Robert W. Vishny. 1990. “Do Managerial Objectives Drive Bad Acquisitions?”Journal of Finance 45: 31-49.
Morgan Stanley Dean Witter. 1998. Consolidation and the Eurobanks: Survivability and the ‘Selfish Gene’. UnitedKingdom and Europe Investment Research. (October).
Murphy, Kevin J. 1985. “Corporate Performance and Managerial Remuneration: An Empirical Analysis.” Journal ofAccounting and Economics 7 (1-3): 11-42.
Nakamura, Leonard. I. 1993. “Commercial Bank Information: Implications for the Structure of Banking.” In StructuralChange in Banking, edited by M. Klausner and L.J. White. Irwin: 131-160.
Neumark, David and Steven A. Sharpe. 1992. “Market Structure and the Nature of Price Rigidity: Evidence from theMarket for Consumer Deposits.” Quarterly Journal of Economics 107(2): 657-680.
Nolle, Daniel E. 1995. "Banking Industry Consolidation: Past Changes and Implications," Office of the Comptrollerof the Currency Working Paper 95-1 (April).
Noulas, Athanasios G., Stephen M. Miller, Subhash C. Ray. 1993. “Regularity Conditions and Scope Estimates: TheCase of Large-Sized U.S. Banks.” Journal of Financial Services Research 7(3): 235-48.
Noulas, Athanasios G., Subhash C. Ray, and Stephen M. Miller. 1990. “Returns to Scale and Input Substitution forLarge U.S. Banks.” Journal of Money, Credit, and Banking 22(1): 94-108.
Otten, Roger and Mark Scweitzer. 1998. “A Comparison between the European and the U.S. Mutual Fund Industry.”Maastricht University.

85
Parker, Miles. 1999. “The Development of Mutual Funds in Europe: Recent Trends and Financial Implications.”University of Warwick/ Bank of England.
Parkhe, Arvind and Stewart R. Miller. 1999. “Is There a Liability of Foreignness in Global Banking? An EmpiricalTest of U.S. Banks' X-Efficiency.” Michigan State University.
Pastor, Gonzalo. 1993. “Financial Liberalization in Spain.” In Spain: Converging with the European Community,edited by Michel Galy, Gonzalo Pastor, and Thierry Pujol. International Monetary Fund Occasional Paper 101(February): 13-22.
Pastor, Jose Manuel. 1999. “Credit Risk and Efficiency in the European Banking Systems: A Three Stage Analysis.”Instituto Valenciano de Investigaciones Economicas (IVIE). Valencia, Spain.
Pastor, Jose Manuel, Francisco Perez, and Javier Quesada. 1997. “Efficiency Analysis in Banking Firms: AnInternational Comparison.” European Journal of Operational Research 98: 396-408.
Pastor, Jesus T., Ana Lozano-Vivas, and Iftekhar Hasan. 1999. “Cross-border Performance of the European BankingSystems.” Universidad de Malaga, Spain.
Pastor, Jesus T., Ana Lozano-Vivas, and Jose Manuel Pastor. 1997. “Efficiency of European Banking Systems: ACorrection by Environmental Variables.” Instituto Valenciano de Investigaciones Economicas (IVIE), Valencia,Spain.
Peek, Joe and Eric S. Rosengren. 1996. “Small Business Credit Availability: How Important Is Size of Lender?” InFinancial System Design: The Case for Universal Banking, edited by Anthony Saunders and Ingo Walter.Irwin Publishing: 628-655.
Peek, Joe and Eric S. Rosengren. 1998. “Bank Consolidation and Small Business Lending: It’s Not Just Bank Size ThatMatters.” Journal of Banking and Finance 22(6): 799-819.
Peek, Joe, Eric S. Rosengren, and Faith Kasirye. 1999. “The Poor Performance of Foreign Bank Subsidiaries: Were theProblems Acquired or Created?” Journal of Banking and Finance 23(2-4): 579-604.
Peristiani, Stavros. 1997. “Do Mergers Improve the X-efficiency and Scale Efficiency of U.S. banks? Evidence fromthe 1980s.” Journal of Money, Credit, and Banking 29(3): 326-337.
Petersen, Mitchell A. and Raghuram G. Rajan. 1994. “The Benefits of Firm-Creditor Relationships: Evidence fromSmall Business Data.” Journal of Finance 49 (1): 3-37.
Petersen, Mitchell A. and Raghuram G. Rajan. 1995. “The Effect of Credit Market Competition on LendingRelationships.” Quarterly Journal of Economics 110(2): 407-443.
Pfister, Christian and Thierry Grunspan. 1999. “Some Implications of Bank Restructuring for French Monetary Policy.”In The Monetary and Regulatory Implications of Changes in the Banking Industry. Bank for InternationalSettlements Conference Papers 7 (March): 188-207.
Pilloff, Steven J. 1996. “Performance Changes and Shareholder Wealth Creation Associated with Mergers of PubliclyTraded Banking Institutions.” Journal of Money, Credit, and Banking 28(3): 294-310.

86
Pilloff, Steven J. 1999. “Multimarket Contact in Banking.” Review of Industrial Organization 14: 163-192.
Pilloff, Steven J. and Anthony M. Santomero. 1998. “The Value Effects of Bank Mergers and Acquisitions.” In BankMergers & Acquisitions, edited by Y. Amihud and G. Miller. Kluwer Academic: 59-78.
Pozdena, Randall Johnston and Volbert Alexander. 1992. “Bank Structure in Germany.” In Banking Structure in MajorCountries, edited by George G. Kaufman. Massachusetts: Kluwer Academic Publishers: 555-590.
Prager, Robin A. and Timothy H. Hannan. 1999. “Do Substantial Horizontal Mergers Generate Significant PriceEffects? Evidence from the Banking Industry.” Journal of Industrial Economics 46(4): 433-452.
Prowse, Stephen D. 1995. “Corporate Governance in an International Perspective: A Survey of Corporate ControlMechanisms Among Large Firms in the U.S., U.K., Japan and Germany.” Financial Markets, Institutions andInstruments 4(1).
Prowse, Stephen D. 1997. “Alternative Methods of Corporate Control in Commercial Banks.” Journal of FinancialResearch 20(4): 509-527.
Pugel, Thomas A. and Lawrence J. White. 1985. “An Analysis of the Competitive Effects of allowing commercial BankAffiliates to Underwrite Corporate Securities.” In Deregulating Wall Street: Commercial Bank Penetrationof the Corporate Securities Market, edited by Ingo Walter. Wiley: 93-139.
Pulley, Lawrence and David Humphrey. 1993. “The Role of Fixed Costs and Cost Complementarities in DeterminingScope Economies and the Cost of Narrow Banking Proposals.” Journal of Business 66(3): 437-462.
Puri, Manju. 1994. “The Long-Term Default Performance of Bank Underwritten Security Issues.” Journal of Bankingand Finance 18, 397-418.
Puri, Manju. 1996. “Commercial Banks in Investment Banking: Conflict of Interest or Certification Role?” Journalof Financial Economics 40(3): 373-401.
Radecki, Lawrence J. 1998. “The Expanding Geographic Reach of Retail Banking Markets.” Federal Reserve Bank ofNew York Economic Policy Review 4(2): 15-34.
Radecki, Lawrence J., John Wenninger, and D. K. Orlow. 1997. “Industry Structure: Electronic Delivery’s PotentialEffects on Retail Banking.” Journal of Retail Banking Services 19(4): 57-63.
Rai, Anoop, 1996, “Cost Efficiency of International Insurance Firms,” Journal of Financial Services Research 10:213-33.
Rajan, Raghuram G. 1994. “An Investigation into the Economics of Extending Bank Powers.” University of Chicago.
Rajan, Raghuram G. 1996. “The Entry of commercial Banks into the Securities Business: A Selective Survey ofTheories and Evidence.” In Universal Banking: Financial System Design Reconsidered, edited by AnthonySaunders and Ingo Walter. Irwin: 282-302.
Rajan, Raghuram G. and Luigi Zingales. 1995. “What Do We Know about Capital Structure? Some Evidence fromInternational Data.” Journal of Finance 50 (5): 1421-1460.

87
Resti, Andrea. 1998. “Regulation Can Foster Mergers, Can Mergers Foster Efficiency? The Italian Case.” Journal ofEconomics and Business 50(2): 157-169.
Rhoades, Stephen A. 1993. “The Efficiency Effects of (In-Market) Horizontal Bank Mergers.” Journal of Banking andFinance 17(2-3): 411-422.
Rhoades, Stephen A. 1998. “The Efficiency Effects of Bank Mergers: An Overview of Case Studies of Nine Mergers.”Journal of Banking and Finance 22(3): 273-291.
Rivaud-Danset, Dorothe, Emmanuelle Dubocage, and Robert Salais. 1998. “Comparison Between the FinancialStructure of SME Versus Large Enterprise Using the BACH Data Base.” Universite Paris-Nord – Faculte deSciences Economiques. (December)
Roll, Richard. 1986. “The Hubris Hypothesis of Corporate Takeovers.” Journal of Business 59(2), Part 1: 197-216.
Rosen, Richard J., Peter R. Lloyd-Davies, Myron L. Kwast, and David B. Humphrey. 1989. “New Banking Powers:A Portfolio Analysis of Bank Investment in Real Estate.” Journal of Banking and Finance 13 (3): 355-366.
Ruthenberg, David and Ricky Elias. 1996. “Cost Economies and Interest Rate Margins in a Unified European BankingMarket.” Journal of Economics and Business 48 (3): 231-249.
Saidenberg, Marc R. and Philip E. Strahan. 1999. “Are Banks Still Important for Financing Large Businesses?” FederalReserve Bank of New York, Current Issues in Economics and Finance 5 (12): 1-6.
Sapienza, Paola. 1998. “The Effects of Banking Mergers on Loan Contracts.” Northwestern University.
Saunders, Anthony. 1999. “Consolidation and Universal Banking.” Journal of Banking and Finance 23(2-4): 693-695.
Saunders, Anthony, Elizabeth Strock, and Nicholas Travlos. 1990.“Ownership Structure, Deregulation, and Bank Risk-taking.” Journal of Finance 45: 643-654.
Saunders, Anthony and Ingo Walter. 1994. Universal Banking in the United States: What Could We Gain? WhatCould We Lose? Oxford University Press.
Saunders, Anthony and Berry K. Wilson. 1999. “The Impact of Consolidation and Safety-Net Support on Canadian,U.S. and U.K. Banks:1893-1992.” Journal of Banking and Finance 23 (2-4) 537-571.
Savage, D. T. 1991. “Mergers, Branch Closings, and Cost Savings.” Board of Governors of the Federal ReserveSystem.
Schmidt, Reinhard H., Andreas Hackethal, and Tyrell Marcell. 1999. “Disintermediation and the Role of Banks inEurope: An International Comparison.” Journal of Financial Intermediation 8: 36-67.
Schrantz, Mary S. 1993. “Takeovers Improve Firm Performance: Evidence from the Banking Industry.” Journal ofPolitical Economy 101 (April): 299-326.
Scott, Jonathan A. and William C. Dunkelberg. 1999. “Bank consolidation and small business lending: A small firmperspective.” In Business Access to Capital and Credit, edited by Richard W. Lang. Federal Reserve Bank ofDallas: 328-361.

88
Sealey, Calvin W., Jr. and James T. Lindley. 1977. “Inputs, Outputs, and a Theory of Production and Cost at DepositoryFinancial Institutions.” Journal of Finance 32(4): 1251-1266.
Seelig, Steven A. and Timothy Critchfield. 1999. “Determinants of De Novo Entry in Banking.” Federal DepositInsurance Corporation Working Paper 99-1.
Seth, Rama and Alicia Quijano. 1993. “Growth in Japanese Lending and Direct Investment in the United States.” Japanand the World Economy 5: 363-372.
Shaffer, Sherrill. 1993. “Can Megamergers Improve Bank Efficiency?” Journal of Banking and Finance 17: 423-436.
Shaffer, Sherrill. 1999. “Ownership Structure and Market Conduct Among Swiss Banks.” University of Wyoming.
Siems, Thomas F. 1996. “Bank Mergers and Shareholder Wealth: Evidence from 1995's Megamerger Deals.” FederalReserve Bank of Dallas Financial Industry Studies August: 1-12.
Simons, Katerina and Joanna Stavins. 1998. “Has Antitrust Policy in Banking Become Obsolete?” Federal ReserveBank of Boston New England Economic Review March-April 1998: 13-26.
Smirlock, Michael and William Marshall. 1983. “Monopoly Power and Expense-Preference Behavior: Theory andEvidence to the Contrary.” Bell Journal of Economics 14(1): 166-178.
Steinherr, Alfred. 1999. “European Futures and Options Markets in a Single Currency Environment.” In EuropeanCapital Markets with a Single Currency, edited by Jean Dermine and Pierre Hillion. Oxford: OxfordUniversity Press: 171-204.
Strahan, Philip E. and James P. Weston. 1996. “Small Business Lending and Bank Consolidation: Is There Cause forConcern?” Federal Reserve Bank of New York Current Issues in Economics and Finance 2: 1-6.
Strahan, Philip E. and James P. Weston. 1998. “Small Business Lending and the Changing Structure of the BankingIndustry.” Journal of Banking and Finance 22(6-8): 821-845.
Subrahmanyam, Vijaya, Nanda Rangan, and Stuart Rosenstein. 1997. “The Role of Outside Directors in BankAcquisitions.” Financial Management 26(3): 23-36.
Sullivan, Richard and Kenneth Spong. 1998. “Does Manager Wealth and Insider Ownership Influence Risk? A Lookat Ownership Structure, Manager Wealth, and Risk in Commercial Banks.” Federal Reserve Bank of KansasCity Financial Industry Perspectives December: 15-40.
Szego, Giorgio P. and Vittoria Szego. 1992. “The Structure of the Italian Financial System.” In Banking Structure inMajor Countries, edited by George G. Kaufman. Massachusetts: Kluwer Academic Publishers: 293-331.
Terrell, Henry S. 1993. “U.S. Branches and Agencies of Foreign Banks: A New Look.” Federal Reserve Bulletin 79(October): 913-925.
Toivanen, Otto. 1997. “Economies of Scale and Scope in the Finnish Non-Life Insurance Industry.” Journal of Bankingand Finance 21: 759-779.
Toyoma, Haruyuki. 1999. “The Monetary, Regulatory, and Competitive Implications of the Restructuring of the

89
Japanese Banking Industry.” In The Monetary and Regulatory Implications of Changes in the BankingIndustry. Bank for International Settlements Conference Papers 7 (March): 295-318.
Udell, Gregory F. and Paul Wachtel. 1995. “Financial System Design for Formerly Planned Economies: Defining theIssues.” Financial Markets Institutions and Instruments 4(2) May.
van Beek, Luuk and Alireza Tourani Rad. 1997. “Market Valuation of Bank Mergers in Europe” Financial Services.Amsterdam.
Vander Vennet, Rudi. 1996. “The Effect of Mergers and Acquisitions on the Efficiency and Profitability of EC CreditInstitutions.” Journal of Banking and Finance 20(9): 1531-1558.
Vander Vennet, Rudi. 1998. “Causes and Consequences of EU Bank Takeovers.” In The Changing EuropeanLandscape, edited by Sylvester Eijffinger, Kees Koedijk, Marco Pagano, and Richard Portes, Centre forEconomic Policy Research. Brussel, Belgium: 45-61.
Vander Vennet, Rudi. 1999. “Cost and Profit Dynamics in Financial Conglomerates and Universal Banks in Europe.”University of Ghent. Belgium.
Wagenvoort, Rien and Paul Schure. 1999. “Who are Europe’s Efficient Bankers?” In European Banking after EMU,edited by Christopher Hurst and Rien Wagenvoort. European Investment Bank Papers 4(1): 105-126.
Walraven, Nicholas. 1997. “Small Business Lending by Banks Involved in Mergers.” Board of Governors of theFederal Reserve Finance and Economics Discussion Series 97-25.
Whalen, Gary. 1995. “Out-of-State Holding Company Affiliation and Small Business Lending.” Office of theComptroller of the Currency Economic and Policy Analysis Working Paper 95-4.
Whalen, Gary. Forthcoming. “Trends in Organizational Form and their Relationship to Performance: The Case ofForeign Securities Subsidiaries of U.S. Banking Organizations.” Journal of Financial Services Research.
Wheelock, David C. and Paul W. Wilson. 1996. “Technical Progress, Inefficiency, and Productivity Change in U.S.Banking, 1984-1993.” Federal Reserve Bank of St. Louis.
White, William. 1998. “The Coming Transformation of Continental European Banking.” Bank for InternationalSettlements Working Paper No. 54.
Wihlborg, Clas. 1999. “Supervision of Banks after EMU.” In European Banking after EMU, edited by ChristopherHurst and Rien Wagenvoort. European Investment Bank Papers 4(1): 71-81.
Williamson, Oliver. 1967. “The Economics of Defense Contracting: Incentives and Performance.” In Issues in DefenseEconomics, edited R. McKean. New York: Columbia University Press.
Williamson, Oliver. 1988. “Corporate Finance and Corporate Governance.” Journal of Finance 43 (3): 567-591.
Winton, Andrew. 1999. “Don’t Put All Your Eggs in One Basket? Diversifiaction and Specialization in Lending.”University of Minnesota.
World Bank. 1999. “Integration with the Global Economy.” World Development Indicators.

90
Yuengert, Andrew. 1993. “The Measurement of Efficiency in Life Insurance: Estimates of a Mixed Normal-GammaError Model.” Journal of Banking and Finance 17(2-3): 483-496.
Zaim, Osman. 1995. “The Effect of Financial Liberalization on the Efficiency of Turkish Commercial Banks.” AppliedFinancial Economics 5 (5): 257-264.
Zardkoohi, Asghar and James Kolari. 1997. “The Effect of Structural Changes in the U.S. Banking Industry on SmallBusiness Lending.” Texas A&M University.
Zhang, Hao. 1995. “Wealth Effects of U.S. Bank Takeovers.” Applied Financial Economics 5(5): 329-336.

91
Appendix 1. The Structure of Credit Markets in Different Countries21
This appendix provides a brief overview of regulatory changes in different countries (section A1.1);
describes the structure of credit markets in various countries (section A1.2); and presents descriptive statistics
for domestic and foreign banks in different nations (section A1.3).
A1.1 Regulatory changes in different countries
Traditionally, financial service firms have been heavily regulated and protected from competition. As
a result, credit market structures in most countries have been highly fragmented and specialized on the basis of
region, product line, and/or clientele. In the U.S., the operations of credit unions, thrifts, commercial banks,
securities firms, and insurance companies were kept separate, and banks were restricted to a single state. In
Japan, commercial banking, securities business, and insurance services were provided by separate entities.
Banking services were highly segmented by both region and product line, and were provided by major Japanese
banks (city, long-term credit, and trust banks), regional banks, financial institutions for small business,
government financial institutions, financial institutions for agriculture, forestry, and fisheries, and the post office.
In France, universal banks belonging to the French Bankers’ Association (AFB) were distinct from mutual banks,
cooperative banks, savings and provident banks with narrow business and/or regional focus, and were also
distinct from finance companies, securities houses, brokerage firms, and other specialized institutions. The
German system contained large universal banks, regional banks (and their central giro organizations), private
banks, savings banks (and their central organizations), credit cooperatives, and specialized credit institutions like
the Postal System and building loan associations. In Italy, the operations of public law banks, private banks,
cooperative banks, savings and pledge banks, rural banks, and special credit institutions (e.g. industrial credit,
real estate, agriculture, and fishery institutions) were separate. In Spain, competition among commercial and
savings banks, as well as credit cooperatives, was limited by regulation. In Switzerland, a universal banking
country, financial services were provided by large banks, cantonal and savings banks, rural banks, specialized
credit institutions, and finance companies. In the U.K., clearing banks, investment banks, and building societies
served distinct markets.
In addition to functional and geographic separation of credit institutions, credit markets were often
characterized by interest rate regulations, restrictions on the form and composition of the assets and liabilities

92
of institutions, and barriers to entry and exit. In a number of countries, such as France, Germany, Italy, and
Switzerland, the central and local governments were involved directly in the provision of financial services by
fiat or through direct ownership of banks.
Over the past two decades, there has been considerable deregulation of the activities of credit institutions.
In the U.S., deposit interest rates were deregulated, the restrictions on interstate banking were mostly removed,
thrift powers were expanded, and most of the Glass-Steagall restrictions on banking powers were recently
removed, as discussed above in Section 2. Since the 1980s, the lines separating various types of commercial
banks in Japan have blurred and competition has intensified, as interest rates were deregulated, rules governing
security issues were liberalized, and the permissible range of products were expanded. The “Japanese Big Bang”
reforms that began to be implemented in 1997, and still continue, will tear down the barriers separating
commercial banks, securities firms, and insurance.
In Europe, the Single Market Programme described in Section 2 effectively removed many of the cross-
border restrictions on financial institutions. The individual nations also engaged in their own deregulation.
During the late 1970s and early 1980s, legal changes in France encouraged the development of capital markets
and introduction of new financial products. The major changes introduced by the Banking Act of 1984 overhauled
the banking markets and greatly diminished the distinctions between the different types of institutions. In Italy,
a legal framework for investment funds was introduced in 1983, branching restrictions were relaxed in 1989, the
Banking Law of 1993 eliminated operational distinctions among credit institutions, and the Consolidated Law
on Financial Intermediation of 1998 provided flexibility in the portfolio management activities of credit
institutions. In Spain, a series of deregulations starting in the 1970s liberalized interest rates and branching,
expanded the permissible activities of savings banks, removed operational differences between commercial and
savings banks, removed restrictions on the activities of foreign banks, and (through changes in the tax laws)
provided the framework for the development of investment funds. In the U.K., credit and exchange controls were
removed during the 1970s and 1980s, permissible activities of building societies were expanded during the 1980s
and 1990s, and securities markets were deregulated with the “Big Bang” in 1986.
A1.2 The structure of credit markets in different countries

93
Table A1.1 shows market structure in the Group of Ten countries. Owing to historical restrictions on
branching and unit banking laws, the U.S. banking market appears to be more fragmented than markets in other
nations. In 1997, the U.S. had the largest number of credit institutions (22,331) and the smallest number of
number of inhabitants per institution (11,997).
The market share of commercial banks in the number of institutions and branches vary across countries.
In France, Spain, and the U.S., the number of banks and their branches exceeds the number of other institutions.
In France, commercial banks and financial companies accounted for 53.4% and 29.7%, respectively, of all credit
institutions in 1998 (table A1.2). In Spain, commercial banks account for the majority of institutions and
branches (table A1.6). Similarly, in the U.S., insured commercial banks outnumber the insured savings
institutions, credit unions, and other banks. In contrast, in Germany, Italy, and Japan, commercial banks and their
offices represent a small fraction of the total banking markets. In Germany, commercial banks account for 9.5%
of the total number of institutions and 11.4% of the total branch offices; credit cooperatives and their central
institutions, savings banks, regional giro institutions and special credit institutions account for the remainder
(table A1.3). Similarly, in Italy, limited company banks and foreign banks account for 29.6% of the total number
of institutions (table A1.4), while cooperatives and mutual banks constitute the bulk of the remainder of
institutions. In Japan, special purpose financial institutions (e.g. for financing of small businesses, agriculture,
and fisheries) account for the majority of institutions and branches; Japanese commercial banks account for only
6.7% of the total number of institutions and 19.2% of the branches (table A1.5). However, in all markets,
commercial banks have the largest market shares in terms of assets (tables A1.2--A1.8).
Banks in Belgium, France, Netherlands, and the U.K. appear to have the most branches per institution.
The smaller number of branches per institution in Italy and the U.S. are remnants of historical restrictions on
branching. In fact, since the 1989 deregulation of limits on branching, Italy has seen a 24% increase in the
number of branches. Similarly, while the number of branches of U.S. institutions declined significantly over the
1990-93 period, there has been a slight increase in more recent years.
There has been an overall general decline in the number of institutions and their branches in the 1990s
(table A1.1), with a corresponding increase in the number of inhabitants per institution and per branch (table
A1.1).22 France, Germany, Japan, and the U.S. have experienced the largest declines in the number of

94
institutions. In terms of the number of institutions, this decline has been relatively larger in the U.S. and Japan,
but in percentage terms the restructuring was of the same order of magnitude in these four countries. In most
countries, the majority of restructuring has occurred among small institutions. The reduction in the number of
German and Japanese institutions has been primarily among cooperative and rural banks. In the U.K., most of
the restructuring has occurred as a result of M&A activity among domestic banks, and primarily among the
smaller institutions.23 Similarly, of the 44 exits from the Italian banking market that occurred in 1997, 32
involved mutual and cooperative banks (Bank of Italy, Annual Report 1998).
The share of total banking assets held by the largest five institutions has increased in all major countries
except Norway (table A1.1). Canada, Finland, Portugal, and Sweden have experienced the largest increases in
market concentration, while concentration ratios have been more stable in France, Japan, and Switzerland.
Overall, concentration ratios in Germany, Italy, the U.K., and the U.S. are less than in other countries. Although
national markets within continental Europe are fairly concentrated, the shares held by the top 5 institutions in
continental Europe as a whole are relatively small (about 12%, not shown in tables, De Bandt, 1999). It has been
argued that the potential impact of market integration and deregulation on EU-wide concentration ratio is likely
to be influenced by the extent to which competition is based on fixed or variable costs (Gual, 1999).
A1.3 Activities of domestic and foreign banks in different countries
In recent years, the share of banking assets held by foreign banks has increased in most countries (table
A1.1). In addition to providing more competition, the increase in foreign bank presence can alter the types of
services provided by banking organizations in individual markets. For instance, entry by foreign banks that focus
more on investment banking services might provide additional services to corporate customers. The data from
France, Germany, Spain, the U.K., and the U.S. (tables A1.9 through A1.13) reveal three interesting patterns in
the operations of foreign banks: (1) In each banking market, there are significant differences in the operations
and profitability of foreign versus domestic banks; (2) in each country, there are significant differences in the
business focus and profitability of banks from different foreign nations; and (3) banks headquartered in a single
nation vary their business focus across foreign markets.24
Except for the U.S., foreign banks are smaller than domestic banks in every nation.25 With the exception
of banks in Spain, foreign banks invest a greater fraction of their assets in securities and have lower ratios of

95
loans to total assets than domestic banks. In France and Germany, foreign banks finance similar fraction of their
assets with deposits as domestic banks. Foreign banks are more reliant on deposits than domestic banks in Spain,
while foreign banks in the U.K. and the U.S. have a lower ratio of total deposits to total assets. In most countries,
domestic banks have more retail deposits (demand, time, and savings) than foreign banks. The latter rely more
heavily on “other deposits” which is mostly composed of interbank deposits. Furthermore, in most countries,
foreign banks have lower net interest income than domestic banks. The lower concentration of assets in loans,
greater use of interbank deposits, and lower interest income for foreign banks suggest that foreign banks focus
less on traditional banking intermediation and more on other banking services than domestic banks. The data
also suggest that domestic banks are generally more profitable than foreign banks. This simple comparison of
accounting profitability is consistent with our evidence on profit X-efficiency shown in Section 5.
Among foreign banks of different origin, there are significant differences in the operations of U.S.,
European, and Japanese banks in each market. For instance, in France and Germany, foreign banks from other
European countries appear to focus more on traditional intermediation than U.S. banks. European banks have
higher ratios of loans to total assets and deposits to total assets (particularly, demand deposits) than U.S. banks.
In addition, U.S. banks earn more commission income per unit of assets than European banks in France, Spain,
and the U.K. With the exception of Germany, Japanese banks are less profitable and focus more on security
investments than their U.S. and European counterparts. These patterns suggest that foreign banks in any given
country are not homogeneous and that treating them as a group, as is often done in the research literature
summarized in Section 3, can obscure important differences.
The data also suggest that banks headquartered in a single nation vary their business focus across foreign
markets. For instance, U.S. banks operating in France, Germany, and the U.K. invest a greater fraction of their
assets in securities and finance a lower fraction of their assets through deposits than U.S. banks operating in
Spain. The extent to which U.S. banks invest in equity securities also varies from market to market, ranging from
0.38% of total assets in Germany to nearly 4% in the U.K. Similarly, European foreign banks operating in France
and Germany appear to focus more on traditional banking (loans, retail deposits) than European banks in Spain,
the U.K., and the U.S. These results suggest that banks from the same country alter their business focus across
the foreign markets in which they operate.

96
Source: Securities Data Company. Notes: "Expansion M&As" are acquisitions of foreign firms by domesticfirms. "Entry M&As" are acquisitions of domestic firms by foreign firms. We treat the EU as a single economicregion, so that the "intra-EU M&As" in Figure 2.2 is analogous to the "domestic M&As" in Figure 2.1.
Figure 2.2 -- Value of M&As in the EU($ 1998 millions, two-year moving averages)
$0$5,000
$10,000$15,000$20,000$25,000$30,000
1986 1988 1990 1992 1994 1996 1998
intra-EU M&As expansion M&As entry M&As
Figure 2.1 -- Value of M&As in U.S.($1998 millions, two-year moving averages)
$0
$50,000
$100,000
$150,000
$200,000
$250,000
1986 1988 1990 1992 1994 1996 1998$0
$10,000
$20,000
$30,000
$40,000
$50,000
domestic M&As
expansion M&As (right) entry M&As (right)

97
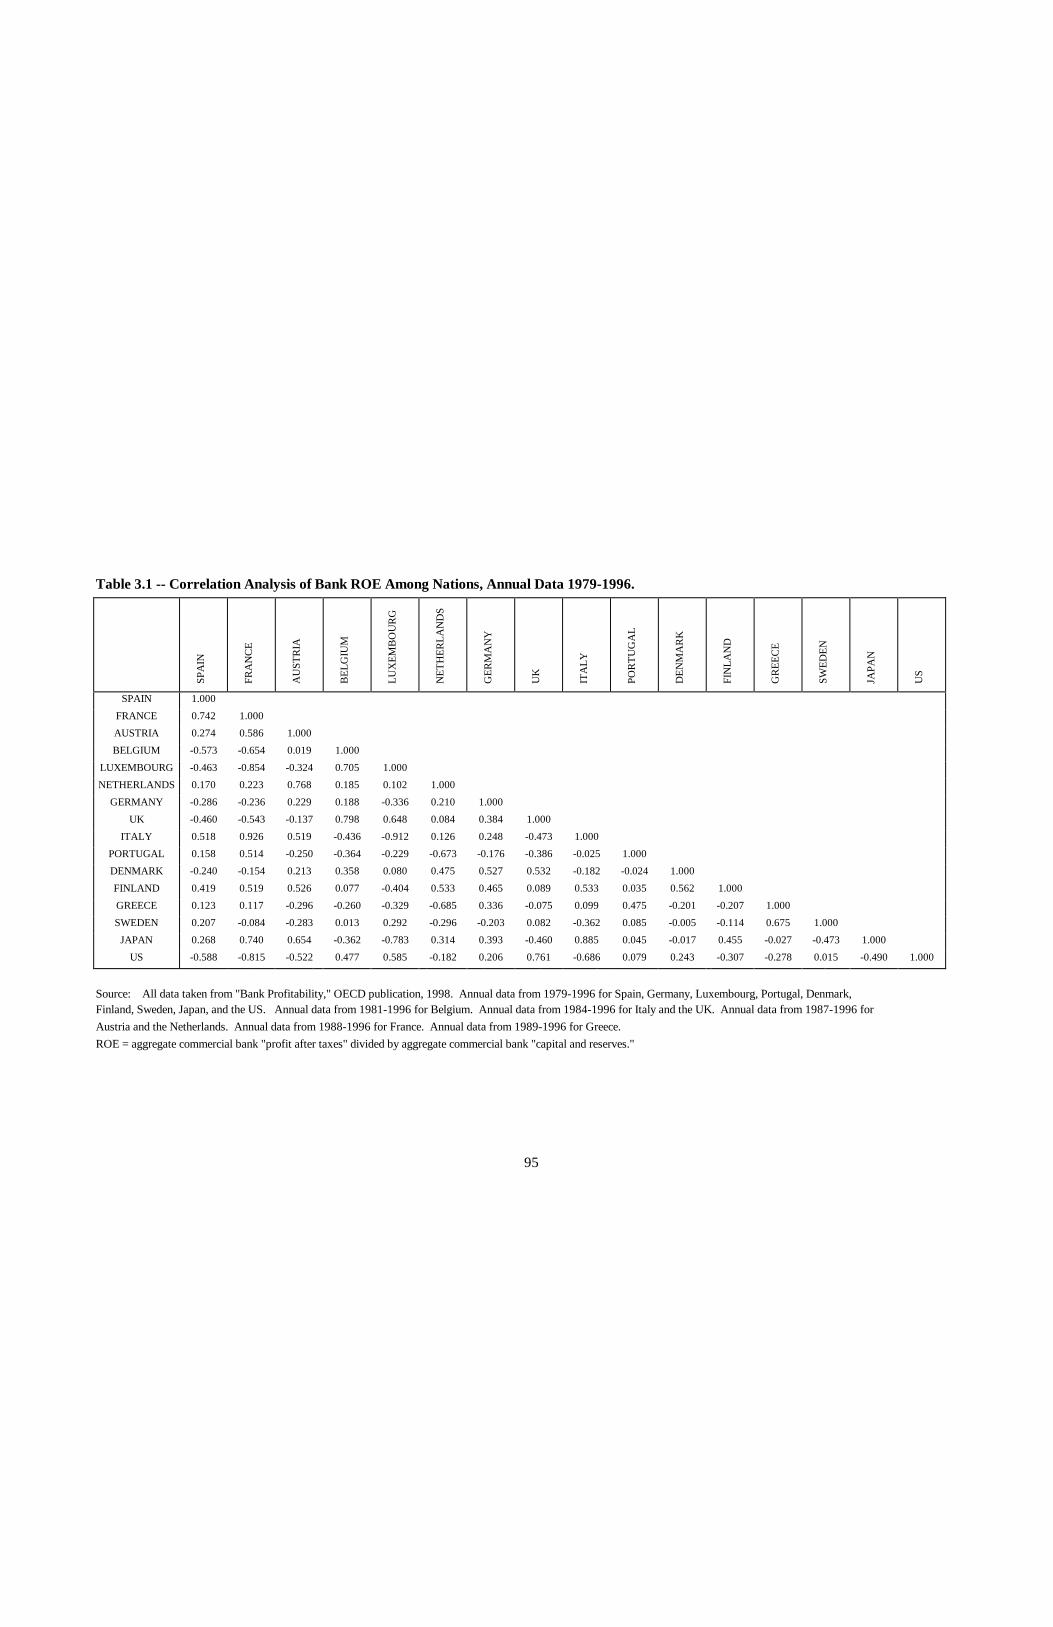
95
Table 3.1 -- Correlation Analysis of Bank ROE Among Nations, Annual Data 1979-1996.
SPA
IN
FRA
NC
E
AU
STR
IA
BEL
GIU
M
LUX
EMB
OU
RG
NET
HER
LAN
DS
GER
MA
NY
UK
ITA
LY
POR
TUG
AL
DEN
MA
RK
FIN
LAN
D
GR
EEC
E
SWED
EN
JAPA
N
US
SPAIN 1.000
FRANCE 0.742 1.000
AUSTRIA 0.274 0.586 1.000
BELGIUM -0.573 -0.654 0.019 1.000
LUXEMBOURG -0.463 -0.854 -0.324 0.705 1.000
NETHERLANDS 0.170 0.223 0.768 0.185 0.102 1.000
GERMANY -0.286 -0.236 0.229 0.188 -0.336 0.210 1.000
UK -0.460 -0.543 -0.137 0.798 0.648 0.084 0.384 1.000
ITALY 0.518 0.926 0.519 -0.436 -0.912 0.126 0.248 -0.473 1.000
PORTUGAL 0.158 0.514 -0.250 -0.364 -0.229 -0.673 -0.176 -0.386 -0.025 1.000
DENMARK -0.240 -0.154 0.213 0.358 0.080 0.475 0.527 0.532 -0.182 -0.024 1.000
FINLAND 0.419 0.519 0.526 0.077 -0.404 0.533 0.465 0.089 0.533 0.035 0.562 1.000
GREECE 0.123 0.117 -0.296 -0.260 -0.329 -0.685 0.336 -0.075 0.099 0.475 -0.201 -0.207 1.000
SWEDEN 0.207 -0.084 -0.283 0.013 0.292 -0.296 -0.203 0.082 -0.362 0.085 -0.005 -0.114 0.675 1.000
JAPAN 0.268 0.740 0.654 -0.362 -0.783 0.314 0.393 -0.460 0.885 0.045 -0.017 0.455 -0.027 -0.473 1.000
US -0.588 -0.815 -0.522 0.477 0.585 -0.182 0.206 0.761 -0.686 0.079 0.243 -0.307 -0.278 0.015 -0.490 1.000
Source: All data taken from "Bank Profitability," OECD publication, 1998. Annual data from 1979-1996 for Spain, Germany, Luxembourg, Portugal, Denmark,Finland, Sweden, Japan, and the US. Annual data from 1981-1996 for Belgium. Annual data from 1984-1996 for Italy and the UK. Annual data from 1987-1996 forAustria and the Netherlands. Annual data from 1988-1996 for France. Annual data from 1989-1996 for Greece.ROE = aggregate commercial bank "profit after taxes" divided by aggregate commercial bank "capital and reserves."

96
Table 4.1 -- Credit Market Intermediation and Capital Markets, 1997The ratio of book value to credit institutions’ total assets to the capitalization of bond and equity markets.
Total Assets of Credit Institutions / (Equity + Bond Market Capitalization)Austria 3.41Belgium 2.04Canada 0.92Denmark 0.97Finland 1.13France 2.35Germany 1.88Italy 1.26Japan 2.31Luxembourg 0.33Netherlands 1.03Portugal 2.87Spain 2.91Sweden 1.04U.K. 1.41U.S. 0.52Sources: Total assets of credit institutions: Europe: European Central Bank. “Possible Effects of EMU on the EUBanking System in the Medium and Long Term.” February 1999. U.S.: Board of Governors of the Federal ReserveSystem. “Flow of Funds Accounts of the United States.” First Quarter, 1999. Canada: Bank of Canada. “Review.”Spring 1999. Japan: Bank of Japan. “Economic Statistics Monthly.” March 1999. Capitalization of bond and equitymarkets: International Federation of Stock Exchanges (FIBV). http://www.fibv.com (October 16, 1999).
Table 4.2 -- Relative Shares of Bank Loans and Debt Securities at Nonfinancial Firms in VariousCountries, 1983 and 1994. (in percent; each row sums to 100%)
BankLoans
DebtSecurities
BankLoans
DebtSecurities
Belgium 1983 84.6 15.4 Japan 1983 94.5 5.51994 91.0 9.0 1995 90.4 9.6
Canada 1983 68.6 31.4 Netherlands 1983 92.9 7.11994 61.9 38.1 1994 82.7 17.3
Finland 1983 69.9 30.1 Norway 1983 29.7 70.31994 57.4 42.6 1994 10.8 89.2
France 1989 44.1 55.9 Spain 1983 83.7 16.31995 21.6 78.4 1994 80.0 20.0
Germany 1985 51.1 48.9 U.K. 1983 83.9 16.11994 56.9 43.1 1994 72.8 27.2
Italy 1983 74.4 25.6 U.S. 1983 36.4 63.61995 85.7 14.3 1994 18.0 82.0
Sources: U.K. data supplied by Darren Pain, Bank of England. Germany data taken from Bauer and Domanski (1999). Data from all other countries taken from: OECD, “Financial Statements of Nonfinancial Enterprises, 1996.” Notes: “Bank loans” includes all short- and long-term loans from depository institutions. “Debt Securities” includes all short-and long-term bills, notes, bonds, and debentures.

97
Table 5.1 -- Summary Statistics for U.S. Data
domestic banks foreign banksprofits/assets 0.0269 0.0170
(.00950) (.0118)costs/assets 0.0413 0.0416
(.00846) (.00910)consumer loans/assets 0.0952 0.0488
(.101) (.0872)business loans/assets .140 .242
(.0925) (.181)real estate loans/assets .353 .274
(.137) (.190)securities/assets 0.3970 0.4220
(.132) (.180)off-balance sheet/assets 0.0197 0.0895
(.0399) (.124)equity/assets 0.0929 0.1050
(.0272) (.0696)market nonperforming loans/assets 0.0000 0.0000
(.00000543) (.00000506)price of purchased funds 0.0400 0.0416
(.00883) (.00599)price of core deposits 0.0221 0.0168
(.00771) (.0102)price of labor (thousands of 1998 $) 39.3000 60.2000
(8.41) (14.6)gross total assets (millions of 1998 $) 1277.7220 4472.7890
(9,798.282) (8,571.339)number of banks 1940 43number of observations 11,640 258
Notes: Data from the Call Reports. The costs, profits, variable outputs, fixed outputs,and fixed inputs were scaled by gross total assets in table, but not in the regressions.

98
Table 5.2 -- Summary Statistics for European DataFrance France Germany Germany Spain Spain UK UK
domestic foreign domestic foreign domestic foreign domestic foreignbanks banks banks banks banks banks banks banks
profits/assets 0.0143 0.0088 0.0142 0.0111 0.0188 0.0081 0.0121 0.0037(0.0194) (0.0299) (0.0174) (0.0191) (0.0256) (0.0135) (0.0206) (0.0282)
costs/assets 0.0969 0.0963 0.0790 0.0845 0.0959 0.1018 0.0289 0.0624(0.0572) (0.0496) (0.0356) (0.0439) (0.0445) (0.0382) (0.0327) (0.0441)
loans/assets 0.5365 0.4572 0.5996 0.3572 0.4508 0.5563 0.4429 0.2565(0.2778) (0.2991) (0.2290) (0.2752) (0.2299) (0.2116) (0.3182) (0.2325)
non-equity 0.4131 0.5114 0.3951 0.6463 0.5206 0.4403 0.4923 0.6475 securities/assets (0.2620) (0.2989) (0.2211) (0.2790) (0.2373) (0.2165) (0.3285) (0.2608)equity 0.0239 0.0121 0.0092 0.0033 0.0348 0.0069 0.0323 0.0189 securities/assets (0.0700) (0.0236) (0.0160) (0.0085) (0.0877) (0.0101) (0.1352) (0.0809)commission 0.0170 0.0102 0.0103 0.0164 0.0118 0.0097 0.0118 0.0057 income/assets (0.0312) (0.0257) (0.0188) (0.0333) (0.0099) (0.0104) (0.0397) (0.0200)equity/assets 0.0879 0.1040 0.0732 0.1329 0.1399 0.0842 0.1506 0.1708
(0.0899) (0.1069) (0.0647) (0.1416) (0.1386) (0.0869) (0.1810) (0.1345)price of borrowed funds 0.0056 0.0595 0.0498 0.0515 0.0674 0.0689 0.0514 0.0509
(0.0138) (0.0131) (0.0107) (0.0117) (0.0163) (0.0159) (0.0102) (0.6669)price of labor (thousands 61.8500 65.8220 110.7222 133.8141 17.7960 16.7892 31.1824 36.7001 of 1997 home currency) (7.4410) (4.1122) (19.8552) (15.7091) (3.2683) (3.3591) (9.6702) (6.2216)total assets (millions of 8126.00 1435.67 16970.70 3106.06 5824.16 1741.76 6181.40 2730.37 1997 home currency) (32727.00) (2533.53) (65489.12) (6580.76) (14121.72) (1683.17) (16023.29) (6095.86)number of banks 158 57 121 85 60 16 26 31number of observations 867 312 642 439 329 83 231 238Notes: Data from Fitch-IBCA. The costs, profits, variable outputs, fixed outputs, and fixed inputs were scaled by gross totalassets in the table, but not in the regressions. For Spain, price of labor equals salaries and benefits/total assets. For U.K.,costs are included only for 57 banks.

99
Table 5.3 -- Cross-Border Alternative Profit Efficiency Home country: France Germany Spain UK USAll domestic banks 0.4459 0.5404 0.6596 0.6833 0.673
158 121 60 63 19400.0214 0.0231 0.0232 0.0270 0.0034
All foreign banks 0.4308 0.4946 0.7138 0.6373 0.418##57 85 16 61 43
0.0279 0.0240 0.0340 0.0273 0.0411
all other EU banks 0.4082 0.4545 0.7465* 0.6627 0.62834 23 11 9 6
0.0327 0.0446 0.0395 0.0948 0.0675Belgium banks 0.2619## -- -- -- --
60.0505
Canada banks -- -- -- -- 0.532##11
0.0347France banks -- 0.5539 0.7699** -- --
5 60.0847 0.0399
Germany banks 0.4866 -- -- -- --6
0.0811Italy banks 0.6178** 0.4517 -- -- --
10 40.0674 0.1706
Japan banks -- 0.4591 -- 0.6406 0.258##17 10 14
0.0487 0.0462 0.069Luxembourg banks -- -- -- 0.5669 --
30.0861
Netherlands banks 0.3884 0.3571## -- -- 0.6285 5 3
0.0720 0.0789 0.1396South Korea banks -- -- -- -- 0.257##
40.1477
Switzerland banks 0.6059 0.4196## -- 0.648 --3 7 5
0.2066 0.0569 0.1111UK banks -- 0.3368## -- -- --
40.0772
US banks 0.6485* 0.5845 0.7243 0.5801 --6 17 3 12
0.1230 0.0536 0.0469 0.0679Each cell contains: mean efficiency, number of banks, standard error. Superscripts ** and * (or ## and #)indicate cell mean is significantly higher (or lower) than domestic mean at 5 and 10 percent levels.

100
Table 5.4 -- Cross-Border Cost Efficiency Home country: France Germany Spain UK USAll domestic banks 0.7122 0.7966 0.9195 0.8061 0.773
158 121 60 26 19400.0126 0.0099 0.0062 0.0158 0.0019
All foreign banks 0.6995 0.7889 0.899 0.7792 0.801**57 85 16 31 43
0.0211 0.0120 0.0128 0.0234 0.0141
all other EU banks 0.7189 0.7648 0.9088 0.75 0.855**34 23 11 5 6
0.0274 0.0197 0.0139 0.0709 0.0381Belgium banks 0.675 -- -- -- --
60.0563
Canada banks -- -- -- -- 0.833**11
0.0189France banks -- 0.7453 0.8979 -- --
5 60.0604 0.0176
Germany banks 0.7294 -- -- -- --6
0.0576Italy banks 0.6566 0.7847 -- -- --
10 40.0493 0.0220
Japan banks -- 0.8195 -- 0.7939 0.75417 5 14
0.0297 0.0483 0.0246Luxembourg banks -- -- -- -- --
Netherlands banks 0.9117** 0.8172 -- -- 0.8675 5 3
0.0476 0.0463 0.0729South Korea banks -- -- -- -- 0.866**
40.0431
Switzerland banks 0.7517 0.7576 -- -- --3 7
0.1327 0.0257UK banks -- 0.7177# -- -- --
40.0454
US banks 0.7169 0.768 0.8598 0.7769 --6 17 3 6
0.0752 0.0276 0.0450 0.0598Each cell contains: mean efficiency, number of banks, standard error. Superscripts ** and * (or ## and #)indicate cell mean is significantly higher (or lower) than domestic mean at 5 and 10 percent levels.

101
Table 5.5 -- Cross-Regional Cost and Profit Efficiency, Domestic U.S. Banks
cost alternativeefficiency profit efficiency
Banks in same region as 0.767 0.672its headquarters 1883 1883
0.0019 0.0033Banks in different region 0.798 ** 0.695than its headquarters 57 57
0.0154 0.0303The cells contain: mean efficiency, number of observations, standard error of thesubsample mean. ** and * indicate that cell mean is significantly higher than thecell in top row at the 5% and 10% levels. ## and # indicate that cell mean issignificantly lower than the cell in top row at the 5% and 10% levels.
Table 5.6 -- Regional Analysis of Domestic vs. Foreign U.S. Bank Efficiency
A. Alternative Profit Efficiency
Bank's Location: New Eng. Mideast Great Lakes Plains Southeast Southwest Rocky Mt. Far WestDomestic banks 0.612 0.614 0.645 0.667 0.701 0.746 0.800 0.647
64 269 437 264 505 205 57 1390.0206 0.0099 0.0058 0.0080 0.0058 0.0101 0.0183 0.0137
Foreign banks -- 0.221 ## 0.554 ## -- 0.859 ** -- -- 0.481 ##17 13 2 11
0.0622 0.0416 0.0572 0.0598
B. Cost Efficiency
Bank's Location: New Eng. Mideast Great Lakes Plains Southeast Southwest Rocky Mt. Far WestDomestic banks 0.798 0.779 0.785 0.780 0.765 0.749 0.792 0.748
64 269 437 264 505 205 57 1390.0111 0.0053 0.0039 0.0049 0.0034 0.0055 0.0132 0.0081
Foreign banks -- 0.808 0.828 ** -- 0.738 -- -- 0.77017 13 2 11
0.0277 0.0172 0.0550 0.0248The cells contain: mean efficiency, number of observations, standard error of the subsample mean.
U.S. Bureau of Economic Analysis (BEA) Regional Definitions:New England (Connecticut, Maine, Massachusetts, New Hampshire, Rhode Island, Vermont); Mideast (Delaware, District of Columbia, Maryland, New Jersey, New York, Pennsylvania); Great Lakes (Illinois, Indiana, Michigan, Ohio,Wisconsin); Plains (Iowa, Kansas, Minnesota, Missouri, Nebraska, North Dakota, South Dakota); Southeast (Alabama,Arkansas, Florida, Georgia, Kentucky, Louisiana, Mississippi, North Carolina, South Carolina, Tennessee, Virginia,West Virginia); Southwest (Arizona, New Mexico, Oklahoma, Texas); Rocky Mountain (Colorado, Idaho, Montana, Utah,Utah); Far West (Alaska, California, Hawaii, Nevada, Oregon, Washington).
** and * indicate that cell mean is significantly higher than the cell in top row at the 5% and 10% levels.## and # indicate that cell mean is significantly lower than the cell in top row at the 5% and 10% levels.

102
Table A1.1 The Structure of Banking Markets in the Group of Ten Countries.
Panel A. Number of credit institutions, market share of the five largest institutions, and the number andmarket share of the branches and subsidiaries of foreign banks.
Total number ofcredit institutions
Percentchange
The market shareof the five largest
institutions intotal assets
Market shares of the branchesand subsidiaries of foreign banks
1990 1997 1990-97 1990 1997 Number
Assetshare,1995(%)
Asset share,1997 (%)
Belgium 122 136 11.48 48 57 71 28.4 36.3Canada 2,920 2,413 -17.36 55 78 n.a. n.a. n.a.France 779 519 -33.38 52 57 305 12.2 12.2c
Germany 4,594 3,409 -25.79 13.9 16.1 153 4.2 4.3Italy 1,065 937 -12.02 24 25 61 5.4 6.8
Japana 6,279 4,266 -32.06 30 31 142 2.1 4.9Netherlands 153 127 -16.99 73 79 49 9.7 7.7
Sweden 138 125 -9.42 70 90 18 9.8 1.6Switzerland 458 362 -20.96 45 49 18 11.8 n.a.
U.K. 637 553 -13.19 22 28 387 51.6 52.1U.S. b 31,842 22,331 -29.87 9 17 460 21.7 20.7
Panel B. Number of branches of credit institutions and number of inhabitants per institution and branch.
Branches Number of inhabitants perinstitution
Number of inhabitants perbranch
Number Number PercentChange Number Number Percent
Change Number Number PercentChange
1990 1997 1990-97 1990 1997 1990-97 1990 1997 1990-97Belgium 13,452 9,041 -32.79 81,815 74,853 -8.51 742 1,126 51.75Canada 13,269 13,642 2.81 9,188 12,598 37.11 2,022 2,228 10.19France 42,536 46,639 9.65 72,677 113,102 55.62 1,331 1,259 -5.41
Germany 77,326 59,695 -22.80 17,354 24,083 38.78 1,031 1,375 33.37Italy 32,162 39,936 24.17 54,056 61,366 13.52 1,790 1,440 -19.55
Japan 68,142 69,022 1.29 19,686 29,578 50.25 1,814 1,828 0.77Netherlands 8,161 7,071 -13.36 98,092 123,261 25.66 1,839 2,214 20.39
Sweden 5,136 3,624 -29.44 62,227 70,800 13.78 1,672 2,442 46.05Switzerland 8,021 6,995 -12.79 14,746 19,604 32.94 842 1,015 20.55
U.K. 41,431 35,234 -14.96 90,082 106,691 18.44 1,385 1,675 20.94U.S. 107,703 73,538 -31.72 7,881 11,997 52.23 2,330 3,643 56.35
a The total banking assets are calculated as the sum of the banking and trust assets of domestically chartered banks and foreign banks,and excludes the assets of credit cooperatives and other financial intermediaries.b Does not include the agencies or representative offices of foreign banks. The numbers inclusive of these offices are 864 in 1996 and828 in 1997.c For 1995. Source: De Bandt (1999).Sources: Number of credit institutions and branches: Bank for International Settlements, Statistics on the Payments Systems inthe Group of Ten Countries. Market share of the five largest institutions: For Germany, Portugal, and the U.K., De Bandt (1999);for the remainder, Bank for International Settlements, International Banking and Financial Market Developments, August 1999. Branches and subsidiaries of foreign banks: Sources: For Europe excluding Switzerland, ECB (1999); for Switzerland, Bank forInternational Settlements, Statistics on the Payments Systems in the Group of Ten Countries, 1995 and 1998; for Japan, Bank ofJapan, Economic Statistics Monthly, October 1997 and March 1999 issues; for the U.S., the Board of Governors of the FederalReserve System, Structure and Share Data for U.S. Offices of Foreign Banks.

103
Table A1.2 Credit Markets in France, 1998
Institutions Share (%) Total assets in billions ofFFr Share (%)
Banks 359 29.67 9,952.0 48.58 Domestic 172 14.21 n.a. n.a. Majority foreign-owned banks 98 8.10 n.a. n.a. Branches of foreign banks 89 7.36 n.a. n.a.Mutual and cooperative banks 124 10.25 3,240.0 15.82Savings and provincial institutions 34 2.81 3,988.5 19.47Financial companies 646 53.39 1,996.4 9.75Specialized financial institutions 26 2.15 1,172.9 5.73Municipal credit banks 21 1.74 n.a. n.a.Total 1,210 100.00 20,484.1 100.00Source: Banque de France, Annual Report (Annual Report to the President of the Republic and Parliament by GovernorJean-Claude Trichet), 1996 and 1998; and Banque de France, Bulletin de la Banque de France, SupplementStatistiques, 2e trimestre 1997 and 4e trimestre 1998. Note: n.a. indicates not available.
Table A1.3 Credit Markets in Germany, 1998
Banking group Number Branch offices ForeignBranches
Foreignsubsidiaries
Total assets(billion DM)
Share ofbusinessvolume,
1997(%)c
Commercial banks 325 6,833 197 229 3,337 24.8Large banks 4 4,353 148 183 1,729a 9.8Regional banks and others 187 2,179 49 46 1,355 12.7Branches of foreign banks 84 75 n.a. n.a. 196 1.7Private banks 50 226 n.a. n.a. n.a. 0.6
Savings banks 594 18,327 3 1 1,780 18.6Regional giro institutions 13 443 43 45 1,838 18.3Cooperatives 2,249 16,139 9 2 1,017 10.7Cooperative central institutions 4 26 9 16 394 3.8Special purpose creditinstitutions
221 18,175 n.a. n.a. n.a. 9.4
Memo: Majority foreign-owned banksb
69 630 n.a. n.a. 441 2.7
a Total assets were available only for the “Big Three.”b Majority foreign-owned banks that are classified in the categories “regional banks and other commercial banks, ”“private banker, ” and “mortgage banks. ”c Business volume is the sum of balance sheet total plus endorsement liabilities arising from rediscounted bills and billssent for collection from the banks’ portfolio prior to maturity.Sources: Data provided by Juergen Weigand, Indiana University and supplemented with data from DeutscheBundesbank, Statistisches Beiheft zum Monatsbericht 1, Bankenstatistik, September 1999; Bauer and Domanski, (1999).Note: n.a. indicates not available.

104
A1.4 Credit Markets in Italy, 1997
Number of BranchesNumber of Banks in Italy Abroad
Limited company banks accepting short-term funds
190 18,026 93
Limited company banks accepting mediumand long-term funds
32 98 --
Cooperative banks 69 4,357 9Mutual banks 586 2,659 --Central credit and refinancing institutions 6 28 --Branches of foreign banks 55 82 --Total 935 25,250 102Source: Bank of Italy. Annual Report for 1997.
Table A1.5 Credit Markets in Japan, March 1998
Institutions Branches Total assets(billions of yen)
Market share(%)
Domestically licensed banks a 174 16,380 886,619.0 66.67 City banks 10 3,348 457,340.8 34.39 Regional banks 64 7,902 200,288.9 15.06 Second Tier Regional banks 64 4,675 69,867.1 5.25 Trust banks 33 385 73,113.6 5.50 Long-term credit banks 3 70 85,962.8 6.46Foreign banks 93 144 60,285.5 4.53Financial institutions for small businessesb 752 12,301 188,931.5 14.21Financial institutions for Agriculture, Forestry,and Fisheryc
2,796 16,172 194,082.0 14.59
Government Financial Institutions 2 211 n.a. n.a.Post office 1 24,638 n.a. n.a.Total 3,992 86,226 1,329,918.0 100.00a Assets in the banking accounts only, including the assets of overseas branches of domestic banks.b Includes Shinkin banks, the Zenshinren Bank, the Shoko Chukin Bank, credit cooperatives, the Shinkumi FederationBank, Labor Credit Associations, and the National Federation of Labor Credit Associations.c Includes the Norinchukin Bank, agricultural cooperatives, Credit Federations of Agricultural Cooperatives, fisherycooperatives, Credit Federations of Fishery Cooperatives, and Mutual Insurance Federations of AgriculturalCooperatives.Source: Bank of Japan, Economic Statistics Monthly March 1999 No. 624. Note: n.a. indicates not available.
Table A1.6 Credit Markets in Spain, 1996
Number ofinstitutions
Number ofbranches
Total assets(millions of
pesetas)Market share (%)
Commercial banks 107 17,863 42,306 57.11Savings banks 50 15,863 27,837 37.58Credit cooperatives 97 3,289 2,560 3.46Foreign banks 56 134 1,377 1.86Total 310 36,809 74,080 100.00Source: Data provided by Ana Lozano-Vivas, Universidad de Malaga, Spain.

105
Table A1.7A Credit Markets in the U.K.Number of banks, 1997
UK incorporated 212Incorporated outside the UK 342Total 554
Representative offices(2) 215Foreign banks in UK [(1)+(2)] 557
Table A1.7B Share of banking assets by bank type, 1996UK Banks Foreign banksRetail 37.9 USA 8.2Investment 2.2 Japan 9.7Other 3.4 Other 38.6Total UK banks 43.5 Total Foreign banks 56.5Source: Bowen, Hoggarth, and Pain (1999).
Table A1.8 Credit Markets in the U.S., 1998
Number of institutions Total Domestic Assets (billions ofUSD)
DomesticallyOwned
ForeignOwned Totala Domestically
OwnedForeignOwned Totala
Insured commercialbanksb 35,002 384 71.11 26,486 2,052 88.82
Savings and loans andinsured savings banksb 3,112 11 6.28 2,959 51 9.37
Federally insured creditunions 11,023 0 22.15 395 0 1.23
Other banksc 227 1 0.46 188 0 0.59Total 49,364 396 100.00 30,028 2,103 100.00a Sum of domestically and foreign-owned.b At the end of 1998, insured commercial banks had 132,688 branches and savings institutions had 14,138branches.c Cooperative banks, industrial banks, and nonbank banks.Source: Federal Reserve System, National Information Center.

106
Table A1.9 Commercial banks in France, 1991-1997Foreign banksDomestic
banks Total U.S. Japanese European All otherNumber of banks 198 67 10 2 41 14Number of observations 982 352 43 9 212 88Total assets (in billions of 1982dollars)
5.37 1.01## 1.39## 0.16## 1.24## 0.35##
As a percentage of total assetsGross loans 51.11 41.38## 24.81## 18.17## 46.12## 40.44##Net loans 51.04 41.19## 24.79## 18.17## 46.00## 39.97##Securities 42.09 53.15** 65.19** 76.18** 48.69** 55.64** Equity Securities 1.91 1.08## 2.16 0.03## 1.17## 0.43##Cash 0.60 0.49 0.09## 0.00## 0.32## 1.15##Fixed assets 0.98 1.32** 1.07 0.87 1.41** 1.27Other assets 5.31 3.85## 8.86 4.77 3.58## 1.97##Total deposits 76.34 78.01 63.33## 57.65# 82.09** 77.43 Demand deposits 16.53 10.09## 3.07## 0.00## 12.23## 9.38## Time deposits 6.84 2.14## 0.07## 0.00## 2.78## 1.82## Savings deposits 26.08 25.54 20.72 0.13## 29.68** 20.51## Other deposits 26.89 40.25** 39.48** 57.52** 37.41** 45.72**Other debt 13.82 10.95## 16.89 18.89 10.01## 9.47##Loan loss reserves 0.12 0.50** 0.04## 0.00## 0.24 1.41**Equity capital 9.68 10.54 19.72** 23.46* 7.66## 11.69**Net interest income 3.03 2.75# 3.27 1.69# 2.23## 3.86**Net commission income 1.38 0.71## 1.33 0.94 0.74## 0.31##Operating profits before provisions 1.38 0.94## 2.06* 0.57# 0.43## 1.68Loan loss provisions 1.08 1.52* 0.27## -0.00## 1.75* 1.75*Operating profits 0.30 -0.58## 1.78** 0.57 -1.32## -0.07Salary expense 1.82 1.58## 1.25## 1.07## 1.76 1.59##ROA 0.22 -0.03## 1.27** 0.06 -0.38## 0.18Memo:ROE (%) -3.47 -5.64 7.67** 1.56* -11.85## 2.08**“**” and “*” (or “##” and “#”) indicate significantly higher (lower) values for foreign banks than domesticbanks at the 5% and 10% levels.The numerator for ROA and ROE is after-tax net income, which equals operating profits plus net specialincome minus taxes.Source: FitchIBCA’s Bankscope database, February 1999.

107
Table A1.10 Commercial Banks in Germany, 1991-1997Foreign banksDomestic
banks Total U.S. Japanese European All otherNumber of banks 116 84 14 19 30 21Number of observations 322 308 44 72 124 68Total assets (in billions of1982 dollars)
4.84 1.52# 3.53 0.73## 1.84# 0.46##
As a percentage of total assetsGross loans 52.50 31.32## 29.63## 17.44## 42.45## 26.80##Securities 43.86 64.90** 61.92** 81.08** 53.65** 70.21** Equity Securities 1.24 0.44## 0.38## 0.88 0.32## 0.25##Cash 1.82 1.34## 0.58## 0.22## 2.16 1.53Fixed assets 0.92 0.69## 0.63 0.42## 0.67## 1.04Other assets 0.90 1.76** 7.24** 0.84 1.07 0.43##Total deposits 80.58 79.76 78.35 65.09## 85.98** 84.88** Demand deposits 10.31 8.37## 9.35 2.24## 12.45 6.80## Time deposits 10.37 1.49## 0.79## 0.00## 2.55## 1.57## Savings deposits 23.41 15.98## 19.38 7.64## 18.94## 17.20## Other deposits 36.49 53.92** 48.82** 55.20** 52.04** 59.30**Other debt 3.55 1.07## 0.76## 1.09## 1.24## 0.94##Equity capital 11.81 15.12** 9.83 31.88** 8.42## 13.00Net interest income 2.58 2.10## 2.14 2.22 2.05## 2.02##Net commission income 0.66 1.32** 1.26 1.68** 1.36** 0.89**Operating profits beforeprovisions
0.77 0.76 0.63 0.88 0.59 1.05
Loan loss provisions 0.46 0.30# 0.46 -0.09## 0.48 0.28Operating profits 0.31 0.46 0.17 0.96** 0.11 0.77**Salary expense 1.41 1.71** 1.96 1.63 1.95** 1.20##ROA 0.20 0.17 0.08## 0.32* 0.07## 0.27Memo:ROE (%) 1.91 1.17## 1.01## 1.12## 0.82## 1.98“**” and “*” (or “##” and “#”) indicate significantly higher (lower) values for foreign banks than domesticbanks at the 5% and 10% levels.The numerator for ROA and ROE is after-tax net income, which equals operating profits plus net specialincome minus taxes.Source: FitchIBCA’s Bankscope database, February 1999.
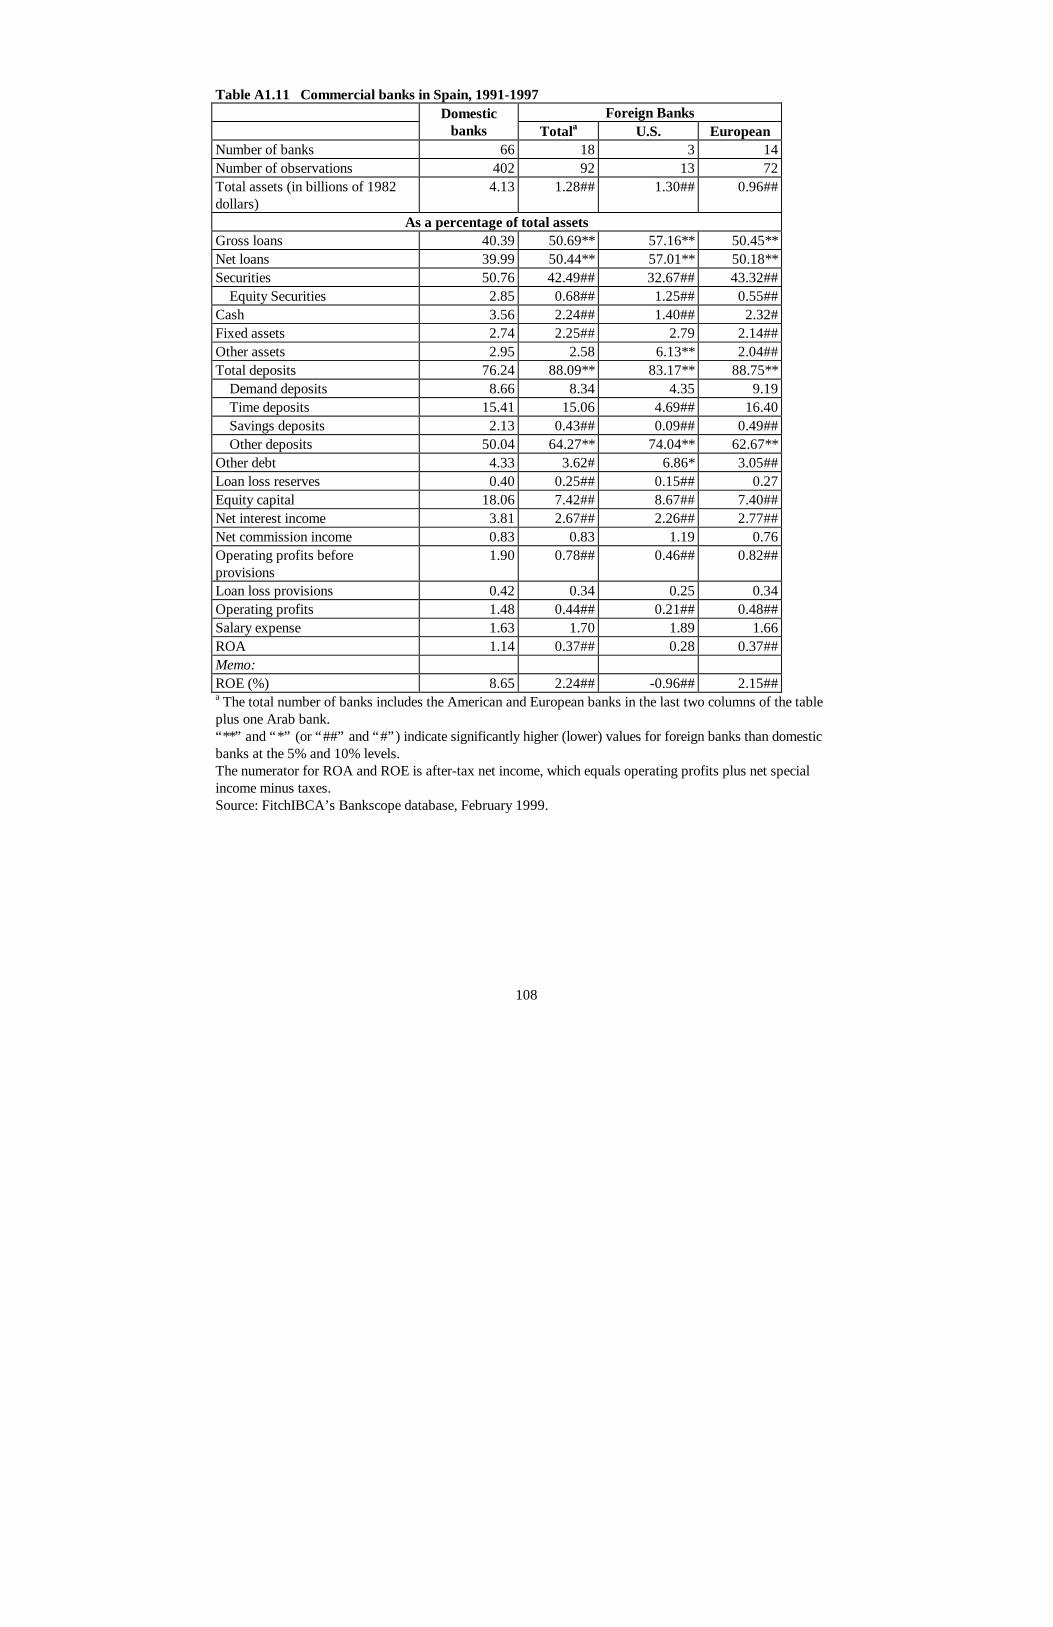
108
Table A1.11 Commercial banks in Spain, 1991-1997Foreign BanksDomestic
banks Totala U.S. EuropeanNumber of banks 66 18 3 14Number of observations 402 92 13 72Total assets (in billions of 1982dollars)
4.13 1.28## 1.30## 0.96##
As a percentage of total assetsGross loans 40.39 50.69** 57.16** 50.45**Net loans 39.99 50.44** 57.01** 50.18**Securities 50.76 42.49## 32.67## 43.32## Equity Securities 2.85 0.68## 1.25## 0.55##Cash 3.56 2.24## 1.40## 2.32#Fixed assets 2.74 2.25## 2.79 2.14##Other assets 2.95 2.58 6.13** 2.04##Total deposits 76.24 88.09** 83.17** 88.75** Demand deposits 8.66 8.34 4.35 9.19 Time deposits 15.41 15.06 4.69## 16.40 Savings deposits 2.13 0.43## 0.09## 0.49## Other deposits 50.04 64.27** 74.04** 62.67**Other debt 4.33 3.62# 6.86* 3.05##Loan loss reserves 0.40 0.25## 0.15## 0.27Equity capital 18.06 7.42## 8.67## 7.40##Net interest income 3.81 2.67## 2.26## 2.77##Net commission income 0.83 0.83 1.19 0.76Operating profits beforeprovisions
1.90 0.78## 0.46## 0.82##
Loan loss provisions 0.42 0.34 0.25 0.34Operating profits 1.48 0.44## 0.21## 0.48##Salary expense 1.63 1.70 1.89 1.66ROA 1.14 0.37## 0.28 0.37##Memo:ROE (%) 8.65 2.24## -0.96## 2.15##a The total number of banks includes the American and European banks in the last two columns of the tableplus one Arab bank.“**” and “*” (or “##” and “#”) indicate significantly higher (lower) values for foreign banks than domesticbanks at the 5% and 10% levels.The numerator for ROA and ROE is after-tax net income, which equals operating profits plus net specialincome minus taxes.Source: FitchIBCA’s Bankscope database, February 1999.

109
Table A1.12 Commercial banks in Great Britain, 1991-1997
Foreign BanksDomesticbanks Total U.S. Japanese European All other
Number of banks 34 36 6 7 4 19Number of observations 140 153 24 19 30 80Total assets (in billions of1982 dollars)
8.21 3.12## 12.73 1.50## 0.20## 0.90##
As a percentage of total assetsGross loans 44.15 27.47## 30.57## 9.90## 28.61## 30.29##Net loans 42.81 26.51## 30.12## 9.75## 27.39## 29.07##Securities 53.18 61.84** 51.16 66.52** 61.07** 64.21** Equity Securities 0.99 1.89 3.83 3.28 4.01 0.17##Cash 2.56 2.54 1.99 1.09 1.66 3.37Fixed assets 0.82 0.85 0.51# 0.22## 0.81 1.12Other assets 3.29 8.27** 16.21** 22.42** 9.07** 2.23##Total deposits 79.37 66.98## 54.77## 45.16## 71.29# 74.21## Demand deposits 22.73 6.44## 2.19## 1.70## 7.04## 8.63## Other deposits 24.81 37.09** 47.06** 39.97** 30.38 35.93**Other debt 11.46 22.52** 44.32** 63.67** 16.37 8.52##Loan loss reserves 0.22 0.02 0.00 0.00 0.00 0.03Equity capital 12.47 15.57** 7.58## 9.05## 14.82 19.80**Net interest income 2.26 1.33## 0.82## 0.54## 1.33## 1.66##Net commission income 0.80 0.41## 0.84 0.02## 0.56# 0.33##Operating profits beforeprovisions
1.00 0.59## 0.73 0.08## 0.75 0.61##
Loan loss provisions 0.44 0.14## 0.01## 0.01## 0.14## 0.20#Operating profits 1.39 0.71## 0.80## -0.23## 0.99 0.82##Salary expense 0.82 0.87 0.78 0.24## 1.46 0.82ROA 1.09 0.56## 0.60## -0.16## 0.68# 0.67##Memo:ROE (%) 12.83 5.32## 10.17 -1.32## 5.39## 5.41##“**” and “*” (or “##” and “#”) indicate significantly higher (lower) values for foreign banks than domesticbanks at the 5% and 10% levels.The numerator for ROA and ROE is after-tax net income, which equals operating profits plus net specialincome minus taxes.Source: FitchIBCA’s Bankscope database, February 1999.

110
Table A1.13 Large Commercial banks in the U.S., 1993-1998Foreign banksDomestic
banks Total Japanese European All otherNumber of banks 1,940 43 14 9 20Number of observations 11,640 258 84 54 120Mean of gross total assets(in billions of 1982 dollars)
0.79 2.77** 2.54** 7.66** 0.73
As a percentage of total assetsGross loans 58.66 56.35## 56.83 50.48## 58.64Net loans 57.74 55.20## 55.41 49.46## 57.64Securities 27.27 26.20 24.08# 29.97 25.98 Equity Securities 0.16 0.15 0.14 0.30 0.09##Cash 4.83 9.09** 13.02** 9.75** 6.05**Fixed assets 1.69 1.54 0.53## 0.81## 2.59**Other assets 7.40 6.68 5.40# 8.69 6.66Total deposits 83.49 74.20## 57.57## 74.51## 85.70** Demand deposits (domestic only) 24.62 19.82## 13.71## 17.06## 25.34 Time and Savings deposits 52.89 36.66## 20.48## 37.81## 47.47## Other deposits 5.97 17.72** 23.38** 19.64** 12.89**Other debt 6.29 14.20** 26.06** 17.07** 4.61##Loan loss reserves 0.92 1.14** 1.42** 1.02 1.00*Equity capital 9.29 10.46** 14.94** 7.40## 8.69##Net interest income 4.07 3.14## 2.44## 2.90## 3.73##Other fee income 0.34 0.34 0.34 0.31 0.36Operating profits before provisions 2.00 1.56## 1.72## 1.54## 1.45##Loan loss provisions 0.24 0.33* 0.21 0.22 0.45**Operating profits 1.76 1.23## 1.51# 1.32## 1.00##Salary expense 1.54 1.43## 1.22## 1.19## 1.68**ROA 1.23 0.79## 0.90## 0.93## 0.64##Memo:ROE (%) 13.57 8.86## 6.33## 13.01 8.77##“**” and “*” (or “##” and “#”) indicate significantly higher (lower) values for foreign banks than domesticbanks at the 5% and 10% levels.The numerator for ROA and ROE is after-tax net income, which equals operating profits plus net specialincome minus taxes. Large is defined as over $100 million in gross total assets (real 1998 dollars) in each ofthe six years.Source: U.S. Call Reports and National Information Center (NIC).

111
Endnotes
1 These graphs were constructed from Securities Data Company’s database on Worldwide Mergers andAcquisitions, which records all public and private corporate transactions valued at $1 million or more thatinvolved at least 5% of the ownership of a company. These figures will not exactly match those reported in othersources. For example, small banks are seldom publicly traded, most securities firms are partnerships, and manyinsurance firms are mutually owned by policyholders. While this is an incomplete reckoning of all M&As, it doescapture the majority of total M&A value.
2 About three-quarters of the value of the intra-EU acquisitions shown in Figure 2.2 was generated by ‘truly’domestic M&As (i.e., both target firm and acquiring firm were from the same EU member nation), indicative ofdomestic market consolidation similar to, but occurring later than, the domestic consolidation in the U.S. However, the truly domestic M&As have declined as a fraction of total EU merger activity since the mid-1990s.
3 It is also sometimes argued that scale efficiency gains from consolidation will be most prevalent when thecombining institutions have substantial local market overlap, allowing for the closing of retail branch offices andconsolidation of back-office operations. However, studies of the scale efficiency effects of bank in-market M&Asand research on branch office scale efficiency suggested little or no gain from this source (Berger and Humphrey1992b, Rhoades 1993, Akhavein, Berger, and Humphrey 1997, Berger, Leusner, and Mingo 1997, Berger 1998).
4 Unlike conventional private placements 144A private placements can be traded and underwritten on a firmcommitment basis. A "bought deal" occurs when an investment bank commits in a firm commitmentunderwriting before syndicating the risk.
5 Of course, some combinations of financial institutions can worsen risk-expected return tradeoffs. For example,a commercial bank may be more likely to fail and/or have higher bankruptcy costs in the event of failure if it iscombined with another type of financial institution with lower expected return or higher variance of returns thatare highly correlated with those of the bank.
6 Consistent with this, Sullivan and Spong (1998) found evidence that owner/managers of small banks that havea substantial portion of their wealth invested in their banks tend to pursue safer strategies,
7 Institutions may also achieve risk diversification through cross-border lending or investments, or through asecondary market in financial instruments. They may buy loans, (non-asset backed or original or primary)securities or asset-backed securities issued in other countries, or engage in derivative contracts with foreigninstitutions.
8 M&As that diversify the institution may also improve X-efficiency in the long term through expanding the skillset of managers (Milbourn, Boot, and Thakor 1999).
9 Some efficiency analyses using linear programming techniques such as data envelopment analysis do not useprices and so do not calculate costs or profits. Instead of using cost or profit X-efficiency, they focus onminimizing inputs for given outputs or maximizing outputs for given inputs, but the concepts are similar.
10 Consistent with this conclusion, one study found a positive external effect of consolidation following interstatebanking deregulation. Out-of-state entry was associated with increased cost X-efficiency in the long term(DeYoung, Hasan, Kirchhoff 1998).
11 Regarding restrictions on nationwide interstate banking, the Riegle-Neal Act caps the total bank and thriftdeposits that any organization may reach by M&A to 30% in a single state and 10% nationally.

112
12 The effects of monetary union on financial institutions and capital markets has been examined extensivelyelsewhere (e.g., Dermine 1998, 1999a-c, De Bandt 1998, De Bandt and Davis 1998, Morgan Stanley Dean Witter1998, McCauley and White 1998, White 1998, Dermine and Hillion 1999, ECB 1999, Hurst and Wagenvoort1999, Merrill Lynch & Co., Inc. 1999).
13 Research evidence supports the notion that banks use relationships to garner information about smallbusinesses and that small businesses benefit from these relationships. U.S. small businesses with strongerbanking relationships have been found to receive loans with lower rates and fewer collateral requirements, be lessdependent on trade credit, enjoy greater credit availability, and have more protection against the interest rate cyclethan other small businesses (e.g., Lang and Nakamura 1989, Petersen and Rajan 1994, 1995, Berger and Udell1995, Blackwell and Winters 1997, Berlin and Mester 1998, Cole 1998, Hubbard, Kuttner, and Palia 1998). Thedata also suggest that banks gather valuable private information from depositors and in some cases use thisinformation in credit decisions (Allen, Saunders, and Udell 1991, Nakamura 1993, Mester, Nakamura, andRenault 1998). For a detailed review of the relationship literature, see Berger and Udell (1998).
14 Tables 4.1 and 4.2 give only a rough indication of this tradeoff. Specifically, in Table 2.1 the size of the stockmarket itself is not as important as the ownership of stock. In addition, it does not account for double countingsuch as in Germany and Japan where banks own a significant fraction of stocks. The ideal would be a breakdownof external finance (both private and public debt and equity) in terms of whether they were passively owned areactively owned. This would take into account the strong individual ownership of equity in the U.S. and the proxyownership of equity in Germany by banks. Data limitations, however, prevented such an analysis. The closestto this type of breakdown was a study that estimated this for just the equity side (Prowse 1995). That study alsoshowed that the U.K. was similar to the U.S. in terms of being skewed toward individually-owned and passively-owned equity.
15 Note that systemic risk and safety net consequences of cross-border consolidation, which may haveimportant macroeconomic consequences, are covered earlier in subsection 4.3.1.
16 See Kashyap and Stein (1997a) for a more detailed summary of the bank lending view and a survey of theempirical literature.
17 Under an alternative credit channel mechanism, the "balance sheet channel" or "financial accelerator," thetightening of monetary policy works in part because the associated higher interest rates impair collateral valuesor otherwise reduce the net worth of certain borrowers, diminishing their ability to obtain funds. This channeldiffers from the bank lending channel in that it implies a reduction in the demand for credit, rather than areduction in the supply of credit in response to monetary policy tightening (Bernanke and Gertler 1995, Bernanke,Gertler, and Gilchrist 1996).
18 Alternative profit efficiency generally yields similar findings to standard profit efficiency, which specifiesoutput prices rather than quantities in the profit function (Berger and Mester 1997). Standard profit efficiencyis more problematic to estimate because output prices have to be approximated by balance sheet and incomestatement ratios. In addition, by controlling for output prices, standard profit efficiency may not account as wellfor advantages that cross-regional organizations may have in terms of risk diversification and enhanced servicequality/variety.
19 Our findings for the U.S. differ notably from prior efficiency studies of foreign banks in the U.S. banks. Asreviewed in Section 3 above, a number of studies using 1980s data found relatively low cost efficiency and/orrelatively low profit efficiency for foreign banks operating in the U.S. Our results suggest that foreign-ownedbanks in the U.S. have improved their cost efficiency over the past decade, but that their profit efficiency has

113
continued to lag, possibly due in part to turnover of these institutions. Since the 1980s, foreign banks from somecountries (e.g., Japan) have reduced their U.S. presence, while foreign banks from other countries (e.g., theNetherlands) have increased their U.S. presence. Thus, while domestic U.S. banks appear to continue to be moreefficient than foreign-owned banks, the underlying characteristics of this difference may have changed.
20 This result may be stronger than it at first appears, because the extra operational costs of a multibank holdingcompany (a required organizational structure for interstate banks during most of our sample period) biasesagainst finding cross-regional efficiency.
21 Other studies provide more detailed descriptions of credit markets in these and other countries. Berger,Kashyap, and Scalise (1995) discussed the U.S. market. The French market was discussed by Beduc, Ducruezet,and Stephanopoli (1992), de Boissieu (1990), Matherat and Cayssials (1999), and Pfister and Grunspan (1999). Bauer and Domanski (1999) and Pozdena and Alexander (1992) covered the German system. The Italian systemwas discussed in Bruni (1990), Fazio (1999a and 1999b), and Szego and Szego (1992). The Japanese marketwas covered by Cargill and Royama (1992), Genay (1998), Hoshi and Kashyap (1999), and Toyama (1999). The Spanish market was discussed by Caminal, Gual, and Vives (1990), Pastor (1993), and Fuentes and Sastre(1999). Birchler and Rich (1992) and Braun, Egli, Fischer, Rime and Walter (1999) discussed the Swiss market.The U.K. market was discussed in Bowen, Hoggarth, and Pain (1999) and Llewellyn (1992).
22 In some countries, such as France and Italy, the restructuring has also involved significant decreases in the roleof the state in the banking industry. For instance, in France, the number of public institutions has declined from92 in 1984 to 23 in 1997 (Matherat and Cayssials, 1999). In Italy, the share of total banking assets held by banksin which the state has a majority control has declined from 68% in 1992 to 20% in 1998 (Fazio, 1999b).
23 Another notable development in the U.K. markets has been the demutualization of building societies and theconversion of these societies into banks. Also, while the number of domestic institutions declined over 1990-1997, there was a significant increase in the number of foreign banks operating in the U.K. (Bowen, Hoggarth,and Pain, 1999).
24 The samples used to construct tables A1.9 through A1.13 differ from the samples used in our analysis in thepaper. Although the data were obtained from the same raw data bases, the samples used in tables A1.9-A1.13were filtered in the following fashion. To remove the impact of mergers, bank-year observations for which theannual growth in inflation-adjusted assets was more than 50% in absolute value were excluded. We also excludedbanks which reported negative values of book-value capital, and banks in the lower and higher 1% of thedistributions of ROA and ROE to remove the influence of these outliers on the mean values.
25 The large size of foreign banks relative domestic banks in the U.S. may be due to our sampling methodology. Our definition of large banks in the U.S. (assets greater than $100 million) is small by international standards.
Copyright © 2022 FDOKUMEN


![Yugoslav Myths [IESIR Bratislava Working Papers 2007]](https://static.fdokumen.com/doc/165x107/631b96d03e8acd9977057f7f/yugoslav-myths-iesir-bratislava-working-papers-2007.jpg)