WORKING PAPERS Developments in education in Palanpur ...
27
WORKING PAPERS Developments in education in Palanpur, a village in Uttar Pradesh Ruth Kattumuri and Dinesh Kumar Tiwari __________________________________________________________ ASIA RESEARCH CENTRE WORKING PAPER 49
-
Upload
khangminh22 -
Category
Documents
-
view
1 -
download
0
Transcript of WORKING PAPERS Developments in education in Palanpur ...

WORKING PAPERS
Developments in education in Palanpur, a village in Uttar Pradesh
Ruth Kattumuri and Dinesh Kumar Tiwari
__________________________________________________________
ASIA RESEARCH CENTRE WORKING PAPER 49

2
Developments in education in Palanpur, a village in Uttar Pradesh
Dr Ruth Kattumuri
Co-Director of the Asia Research Centre and India Observatory at the London School of Economics.
Email: [email protected]
Dinesh Kumar Tiwari
Researcher at The National Council of Applied Economic Research (NCAER).
All rights reserved. Apart from any fair dealing for the purpose of research or private study, or criticism or review, no part of this publication may be reproduced, stored in a retrieval system or transmitted in any form or by any means without the prior permission by the publisher or author (2011).
For further information, please contact:
Asia Research Centre (ARC)
London School of Economics & Political Science
Houghton Street
London
WC2A 2AE
United Kingdom
E-mail: [email protected]
www.lse.ac.uk/collections/AsiaResearchCentre
___________________________________________________________
ASIA RESEARCH CENTRE WORKING PAPER 49

3
Developments in education in Palanpur, a village in Uttar Pradesh
Ruth Kattumuri (London School of Economics) and Dinesh Kumar Tiwari (NCAER)
Abstract This paper examines developments in literacy and education in Palanpur. We consider schooling facilities and other related services available in this village and its neighbourhood. Schooling levels are analysed in the context of gender and social groups. Some obstacles for children and young people attempting to pursue education are discussed. Education levels and services are considerably lower than that of Moradabad district and Uttar Pradesh state averages. However there is evidence of major improvements in education in the last decade. In particular, the progress in education of girls and across social groups since the last Palanpur study in 1993 is noteworthy. The infrastructure, availability of teachers and other services in the school have also improved. Acknowledgement We greatly appreciate the valuable advice and guidance from Nicholas Stern. The research assistance from Diya Bhatnagar and fieldwork support from Hemandra Ahirwar and Gajanand Ahirwar has been very helpful. It has been enjoyable to work with the Palanpur team both current and the experts who have been involved in the study of this village since 1974. We are grateful for funding support from Department for International Development, UK, which enabled the sixth round of this village study.

4
I Introduction India’s adult literacy rate of 63 percent lies near the middle of the developing countries as a whole but is low relative to the emerging market economies (Human Development Report 2010, see Table 1). Table 1. Literacy rates for some countries Rank Country Literacy Rate %
26 UK 99 65 Russia 99.5 73 Brazil 90 89 China 93.7 91 Sri Lanka 90.6 110 South Africa 89 119 India 62.8 125 Pakistan 54 157 Ethiopia 35.9 160 Mali 26.2
Reference: Human Development Report (HDR), 2010 Note: Adult literacy rate is for those aged 15 years and older between 2005-2008.
Provisional population results from census 2011 in India indicate improvements in overall literacy rates (74 percent - male 82, female 66) from the levels in census 2001 (65 percent – male 75, female 54). Literacy rate in India for census and in other national constitutional context is defined as the ability of a person, aged 7 and above, to read and write with understanding in any language. A person who can merely read but cannot write is not classified as literate. Any formal education or minimum educational standard is not necessary to be considered literate (Parasaran et al. 2001). Unless otherwise specified, we consider literacy rates for those aged 7 and above in relation to this definition.
Palanpur is a north Indian village situated in Moradabad district in western Uttar Pradesh (UP). It is located about 200 kilometres off Delhi and 31 kilometres South of the main city of Moradabad. The closest town is Chandausi, which is 13 kilometres from Palanpur. The longitudinal studies in this village provide valuable data sets across six decades (Himanshu and Stern 2011). The sixth round of fieldwork was undertaken in Palanpur during October 2008 to March 2010. A research team was based in the village for a population survey of this village across two rabi and kharif seasons during 2008 to 2010. A random sample of households was given diaries to record their daily work related activities including their daily income and expenditure. This enabled us to generate rich and detailed data on all aspects of the village. With the advanced technology available this time round, the data from all surveys have been converted into electronic form, which will be made publicly available.
It has been possible to collect in-depth data about various social aspects during the survey in 2008-2010. Detailed quantitative data has been obtained on various aspects of village life including family structures, schooling levels and facilities, health and nutrition, status of women, caste, relationships, delinquency, availability and functioning of public services, religious and other public institutions, as well as politics in the village. This survey also benefits from qualitative data available from

5
participant observations and focus group discussions. Qualitative analyses have been used to substantiate quantitative analyses where relevant.
In this paper, we examine descriptive analyses of literacy and education levels. Some trends and changes are compared across the various survey rounds where possible, with particular focus on the last twenty-five years. The indicators of literacy and education from the village are compared with district and state levels. The government education schemes and their effectiveness in the village are discussed. This paper benefits from qualitative data gained through participant observation and discussions with residents in the village.
After this first introductory section, the second section focuses on literacy rates. The third section examines education. Section four provides a summary and discussion of access, efficiency and quality of education in the context of the findings from this village study. A team of researchers were based in the village for two years for data collection for the sixth round of this village study. Other members of the team visited the village regularly. Thus it has been possible to generate very rich data. This paper provides a preliminary analysis of the data on education. There is plenty of scope for further analyses of the rich data that has been collected in the two years of fieldwork. Suggestions for further research are indicated at the end of section four. II. Literacy rates The preliminary results from census 2011 indicate improvements in literacy rates for the state of Uttar Pradesh (70 percent according to census 2011 from 57 in 2001, see Table 3).
Uttar Pradesh (UP) is the most populous state in India and contributes 16.5% of the total population of 1.21 billion (Census of India 2011). If UP were an independent country, its population of 199 million, would rank among the most populous countries in the world - between Brazil and Pakistan (Table 2). UP’s human development ranks among countries with low indices. While the literacy rate is higher than the levels in Pakistan, Ethiopia and Mali, the current literacy rate of 70 percent in census 2011 continues to rank UP among the poorest countries of Africa, namely Sudan and Rwanda.
Table 2. UP global ranking by Population and Literacy
Countries World Rank
Population Countries HDI Rank
Adult Literacy Rate %
Brazil 5 202,946,979 Rwanda 152 70.3 UP 5.5 199,581,477 UP* 57.4 (70 in 2011) Pakistan 6 179,374,092 Sudan 154 69.3
Source: HDR 2010; Census of India 2001 and 2011; http://www.geohive.com/ * UP literacy rate represents literacy of people aged 7 and above, number in brackets represents the literacy rate for 2011
6
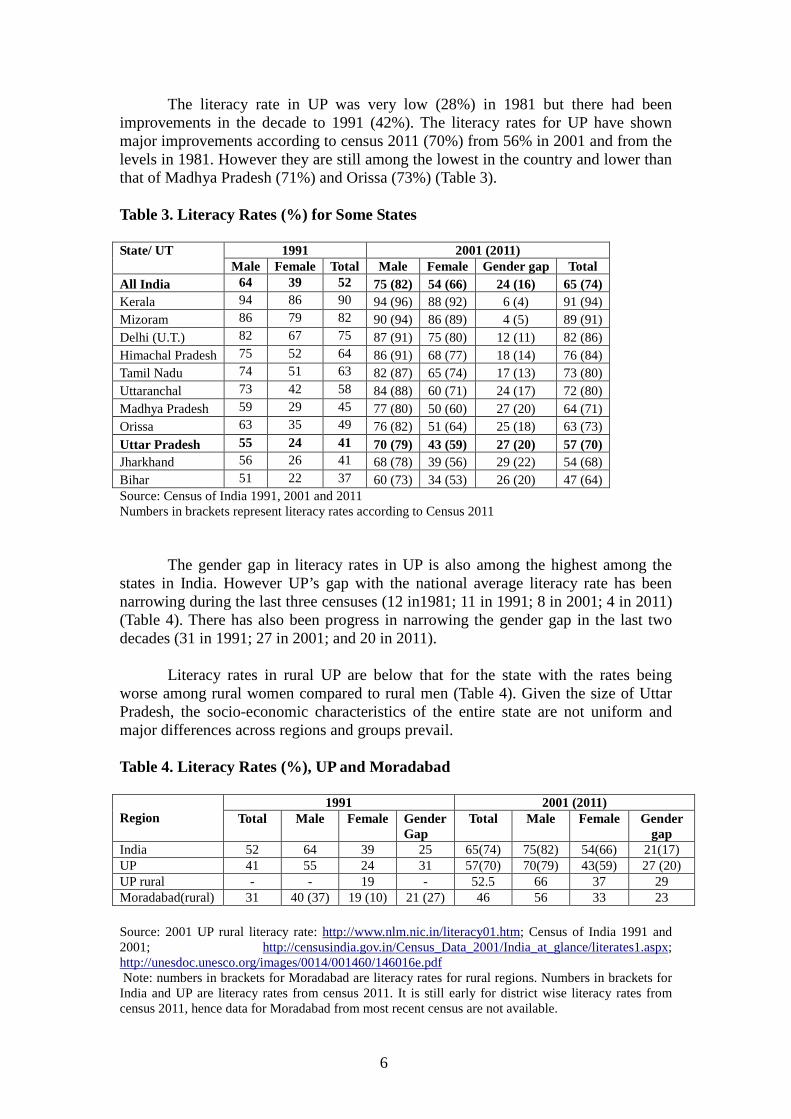
The literacy rate in UP was very low (28%) in 1981 but there had been improvements in the decade to 1991 (42%). The literacy rates for UP have shown major improvements according to census 2011 (70%) from 56% in 2001 and from the levels in 1981. However they are still among the lowest in the country and lower than that of Madhya Pradesh (71%) and Orissa (73%) (Table 3). Table 3. Literacy Rates (%) for Some States
1991 2001 (2011) State/ UT Male Female Total Male Female Gender gap Total
All India 64 39 52 75 (82) 54 (66) 24 (16) 65 (74) Kerala 94 86 90 94 (96) 88 (92) 6 (4) 91 (94) Mizoram 86 79 82 90 (94) 86 (89) 4 (5) 89 (91) Delhi (U.T.) 82 67 75 87 (91) 75 (80) 12 (11) 82 (86) Himachal Pradesh 75 52 64 86 (91) 68 (77) 18 (14) 76 (84) Tamil Nadu 74 51 63 82 (87) 65 (74) 17 (13) 73 (80) Uttaranchal 73 42 58 84 (88) 60 (71) 24 (17) 72 (80) Madhya Pradesh 59 29 45 77 (80) 50 (60) 27 (20) 64 (71) Orissa 63 35 49 76 (82) 51 (64) 25 (18) 63 (73) Uttar Pradesh 55 24 41 70 (79) 43 (59) 27 (20) 57 (70) Jharkhand 56 26 41 68 (78) 39 (56) 29 (22) 54 (68) Bihar 51 22 37 60 (73) 34 (53) 26 (20) 47 (64) Source: Census of India 1991, 2001 and 2011 Numbers in brackets represent literacy rates according to Census 2011
The gender gap in literacy rates in UP is also among the highest among the states in India. However UP’s gap with the national average literacy rate has been narrowing during the last three censuses (12 in1981; 11 in 1991; 8 in 2001; 4 in 2011) (Table 4). There has also been progress in narrowing the gender gap in the last two decades (31 in 1991; 27 in 2001; and 20 in 2011).
Literacy rates in rural UP are below that for the state with the rates being worse among rural women compared to rural men (Table 4). Given the size of Uttar Pradesh, the socio-economic characteristics of the entire state are not uniform and major differences across regions and groups prevail. Table 4. Literacy Rates (%), UP and Moradabad
1991 2001 (2011) Region Total Male Female Gender
Gap Total Male Female Gender
gap India 52 64 39 25 65(74) 75(82) 54(66) 21(17) UP 41 55 24 31 57(70) 70(79) 43(59) 27 (20) UP rural - - 19 - 52.5 66 37 29 Moradabad(rural) 31 40 (37) 19 (10) 21 (27) 46 56 33 23 Source: 2001 UP rural literacy rate: http://www.nlm.nic.in/literacy01.htm; Census of India 1991 and 2001; http://censusindia.gov.in/Census_Data_2001/India_at_glance/literates1.aspx; http://unesdoc.unesco.org/images/0014/001460/146016e.pdf Note: numbers in brackets for Moradabad are literacy rates for rural regions. Numbers in brackets for India and UP are literacy rates from census 2011. It is still early for district wise literacy rates from census 2011, hence data for Moradabad from most recent census are not available.

7
Moradabad district, located in Uttar Pradesh, has a population of 2,761,620, with the proportion of males being 54%; male population is 1,494,220 and female population is 1,267,400 (Census of India 2001). A large majority of the population is rural (68%); rural population is 1,877,570 and urban is 884,050. The main occupations in this district are agriculture and allied activities. There have been improvements in literacy rates in Moradabad district (46%) between 1991 and 2001, however the levels are lower than that of its state and the gender gap is higher than the levels for UP (Table 4).
Table 5 shows literacy rates during the first Palanpur survey and the last three surveys. The 1993 survey found the literacy rates in Palanpur to be close to the corresponding figures of 1991 census for Moradabad district (Lanjouw and Stern 1998). The literacy rates in Palanpur in 2009 are lower than the corresponding literacy rates for women in Moradabad as of census 2001. Table 5. Literacy Rates (%) across some survey years in Palanpur Years Total Males Females Gender gap 1957 - 18 0.5 17.5 1983 15 30 6 24 1993 23 37 9 28 2009 40 57 24 33
The 1983 survey had showed progress in literacy rates for men in Palanpur (Table 5). The changes in male literacy rates were modest in 1993 compared with the levels in 1983. Male literacy rates are much higher in the most recent survey in 2009 compared to the levels in 1993. The literacy rates in census 2001 for rural UP were 66 for men and 37 for women and these rates are likely to be higher in census 2011. Thus literacy levels in Palanpur are far behind the levels in UP and more so for women.
In terms of both literacy and gender differentials, India is middling amongst developing countries. These differentials in UP are among the lowest in the country. The levels in Moradabad district are lower than the differentials for UP state and the levels in Palanpur village lag behind the levels in Moradabad. Gender and literacy The large differences in literacy rates between men and women continue to persist in the overall population in Palanpur. The development in female literacy had been slow in the previous five decades (Table 5). An important change in 2009 is the progress in female literacy to 24 percent from below 10 percent in 1993. While female literacy rates have improved, they have been slower than the changes in male literacy and hence the gender gap in the overall population of Palanpur has been increasing over the survey years. Literacy by age The age-wise distribution of literacy shows some improvements with 85 percent of males and 44 percent females aged 15-19 reported to be literate in 2009 (Table 6).
8
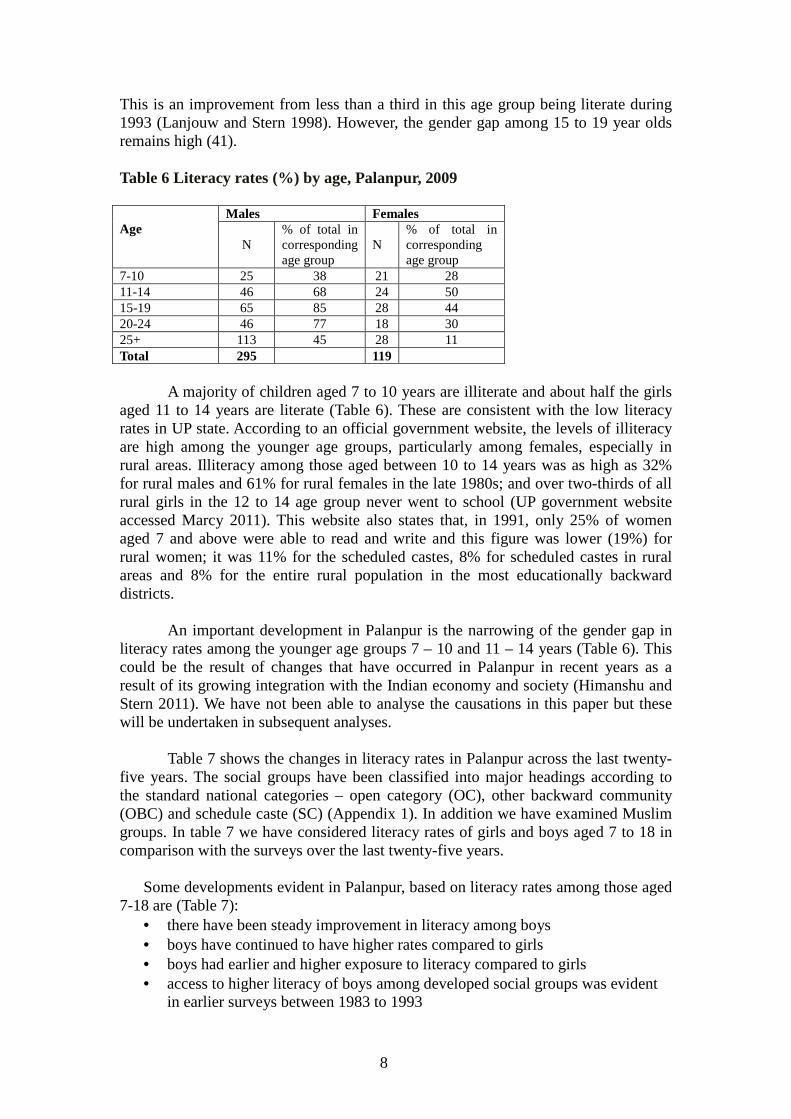
This is an improvement from less than a third in this age group being literate during 1993 (Lanjouw and Stern 1998). However, the gender gap among 15 to 19 year olds remains high (41). Table 6 Literacy rates (%) by age, Palanpur, 2009
Males Females Age
N % of total in corresponding age group
N
% of total in corresponding age group
7-10 25 38 21 28 11-14 46 68 24 50 15-19 65 85 28 44 20-24 46 77 18 30 25+ 113 45 28 11 Total 295 119
A majority of children aged 7 to 10 years are illiterate and about half the girls aged 11 to 14 years are literate (Table 6). These are consistent with the low literacy rates in UP state. According to an official government website, the levels of illiteracy are high among the younger age groups, particularly among females, especially in rural areas. Illiteracy among those aged between 10 to 14 years was as high as 32% for rural males and 61% for rural females in the late 1980s; and over two-thirds of all rural girls in the 12 to 14 age group never went to school (UP government website accessed Marcy 2011). This website also states that, in 1991, only 25% of women aged 7 and above were able to read and write and this figure was lower (19%) for rural women; it was 11% for the scheduled castes, 8% for scheduled castes in rural areas and 8% for the entire rural population in the most educationally backward districts.
An important development in Palanpur is the narrowing of the gender gap in literacy rates among the younger age groups 7 – 10 and 11 – 14 years (Table 6). This could be the result of changes that have occurred in Palanpur in recent years as a result of its growing integration with the Indian economy and society (Himanshu and Stern 2011). We have not been able to analyse the causations in this paper but these will be undertaken in subsequent analyses.
Table 7 shows the changes in literacy rates in Palanpur across the last twenty-five years. The social groups have been classified into major headings according to the standard national categories – open category (OC), other backward community (OBC) and schedule caste (SC) (Appendix 1). In addition we have examined Muslim groups. In table 7 we have considered literacy rates of girls and boys aged 7 to 18 in comparison with the surveys over the last twenty-five years.
Some developments evident in Palanpur, based on literacy rates among those aged 7-18 are (Table 7):
• there have been steady improvement in literacy among boys • boys have continued to have higher rates compared to girls • boys had earlier and higher exposure to literacy compared to girls • access to higher literacy of boys among developed social groups was evident
in earlier surveys between 1983 to 1993

9
• access to higher literacy among boys was evident across all economic groups (based on land ownership) since 1983
• improvements in literacy of boys are evident among disadvantaged social groups in the recent survey in 2009
• gender gap is gradually narrowing over the last two decades • literacy rates among girls have nearly tripled between 1993 and 2009 • there have been major improvements in literacy among girls in developed
social groups between 1993 to 2009 • the improvements in literacy among girls from disadvantaged social groups is
notable. • there is evidence of modest improvements in literacy rates of Jatab girls • there have been major improvements in literacy rates among girls across all
economic groups between 1993 and 2009 Table 7. Literacy rates (%) in Palanpur, ages 7-18
1983 1993 2009 Social Groups Boys Girls Boys Girls Boys Girls Overall 34 12 50 15 68 43 OC Thakur 43 (12/28) 14.7 (5/34) 70 (26/37) 32 (9/28) 74 (34/46) 70 (19/27) Pasi 43 (6/14) 0 (0/9) 64 (7/11) 44 (4/9) 100 (3/3) 50 (2/4) Muslim 31.8 (7/22) 0 (0/12) 38.9 (7/18) 0 (0/15) Teli 41.2 (7/17) 0 (0/9) 50 (3/6) 0 (0/3) 72 (13/18) 60 (12/20) Dhobi 0 (0/5) 0 (0/3) 50 (3/6) 0 (0/3) 44 (4/9) 0 (0/4) Carpenter - - - - 67 (2/3) 50 (1/2) OBC Murao 14 (4/29) 6.3 (1/6) 47 (15/32) 6 (2/36) 67 (29/43) 43 (19/44) Dhimar 17 (2/12) 0 (0/4) 46 (6/13) 17 (1/16) Gadaria 42 (5/12) 12 (2/17) 30 (3/10) 17 (3/18) 50 (6/12) 37.5 (6/16) Kashyap - - - - 56 (9/16) 50 (6/12) SC (Jatab) 14 (3/22) 0 (0/11) 24 (7/29) 0 (0/14) 55 (16/29) 10 (3/30) Others 44 (4/9) 63 (5/8) 83 (10/12) 17 (2/12) 100 (1/1) 0 (0/0) Land Ownership 0.5 to 1.99 bighas per capita
25 (9/36) 4.2 (1/24) 57 (21/37) 2.3 (1/35) 67 (62/93) 46 (39/84)
2 to 2.99 bighas per capita
30 (8/27) 6.7 (1/15) 46 (13/28) 23.5 (4/17) 59 (13/ 22) 47 (8/17)
3 to 4.99 bighas per capita
25 (8/32) 16.7 (6/36) 67 (12/18) 17 (4/23) 75 (9/12) 50 (7/14)
+5 bighas per capita
60 (9/15) 8 (1/12) 50 (10/20) 18 (2/11) 80 (4/5) 100 (2/2)
Note: the numbers in brackets represent the number of individuals who are literate over the total number of children belonging to the sample and to this particular year and social group. ‘others’ includes Srivastav & Balmiki; p.c. - per capita

10
The major changes among Thakur, Pasi, Murao and Dhimar boys happened between 1983 and 1993. Further improvements can be seen among Murao boys between 1993 and 2009. Major improvements are evident among Jatab boys between the last two survey rounds. The improvements in literacy rates among boys have continued across all economic groups.
Literacy rates among Thakur girls have more than doubled between 1993 and
2009 (Table 7). There are modest improvements among girls in OBC and Muslim communities but less than one-tenth of Jatab girls are literate. There is also evidence of improvements in literacy levels among girls in families who own less than 3 bighas per capita.
Land ownership has only tentatively been used here as a proxy indicator of
economic position to examine the influence of wealth on education for the purposes of these preliminary analyses (Bakshi 2008). It is likely that land ownership may not help to predict the relationship between wealth and education very clearly (Dreze and Kingdon 2001). These are preliminary analyses and we will examine the relationship with wealth and status variables in future papers. Literacy and social groups There have been major improvements in male literacy rates among the population of Palanpur between 1993 and 2009. While the literacy rates of Thakur male continued to progress and the literacy rates among Murao men has doubled (Table 8). The majority of Muslim men are literate in 2009 compared to a fifth in 1993. There has been notable improvement in literacy rates among Jatab men and a fifth are currently literate, which is nearly double the levels in 1993.
Women in no other social groups, except Kayasth, were able to read and write in 1957 and near-universal illiteracy persisted over the past five decades of the survey until 1993 (Lanjouw and Stern 1998). The literacy rates for women show remarkable improvements in 2009. The literacy rates among Thakur women have doubled since 1993 (Table 8). The progress among Murao and Muslim women is notable. Table 8. Literacy rates in different survey years, by social groups
Male Literacy Rate (7+) Female Literacy Rate (7+) Social Groups 1957 1962 1974 1983 1993 2009 1957 1962 1974 1983 1993 2009 Thakur 41 59 62 48 56 88 - 8 11 8 19 41 Murao 11 29 42 37 39 82 - 3 - 1 2 20 Muslim 5 20 10 23 20 54 - - - - 2 18 Jatab 3 12 3 4 12 22 - 3 - - - 5 Kayasth 100 100 100 100 100 100 67 50 67 100 100 100 Other 14 33 26 23 38 50 - 3 4 4 8 5 All Grps 18 34 34 30 37 57 0.5 3 6 6 9 24

11
Summary of literacy in Palanpur There has been major progress in literacy in Palanpur. The overall literacy in the village, while still low in 2009, has more than doubled and increased to over 50 percent (from 23 percent in 1993). There has been steady progress during the last twenty-five years, with a more rapid change in the last decade. This trend in the village is similar to the general changes in UP, although the levels themselves are lower than those of Moradabad district and the state.
The majority of males across all social groups were literate in 2009. There have been improvements in literacy rates among Jatabs; however the levels are low with only about one-fifth being literate.
While gender inequality in literacy persists, there is evidence of a narrowing of the gender gap in Palanpur in the last decade, similar to the change in the state.
This study found remarkable improvements in literacy rates among the younger population (ages 7 to 18). The gender gap has narrowed and there have been improvements across all social and economic groups of the younger population since the last survey in 1993.
The great advantage of the Palanpur study is that having researchers based in the village for two years has provided valuable insights, which will enable us to better understand the causes and processes of the changes. The causation for the improvements will be analysed in future papers. III Education In the above section we have examined literacy levels, which measure the ability to read and write irrespective of any formal education. In this section we examine whether children in Palanpur had ever been enrolled. If they had attended school, then the schooling levels have been recorded. The education levels of those who are currently in schooling have been analysed in this section. We also examine issues related to access, effectiveness and quality of education in the village. Schooling facilities The early 1990s saw the creation of programmes to enable access to primary education for all children in India. The ‘basic education project’ was started in UP in 1993 and covered 17 districts. The Uttar Pradesh Sabhee Ke Liye Shiksha Pariyojana Parishad (providing education for all) was set up in May 1993 to administer the basic education project. The objectives of the programme included the following – (i) provide access to primary education for all children up to 14 years, (ii) enable universal participation until they complete primary through formal and non-formal education programmes, (iii) suggest ideas for greater gender equality in education and female empowerment, (iv) make necessary interventions to provide equal education opportunities for children from scheduled caste, scheduled tribe and the poorest sections of society (see reference, UP education for all, 2011). Sarva Shiksha Abhiyan (universal education system) was started in 16 districts in UP in 2002 and expanded to

12
cover all 70 districts in UP. This programme aims to achieve universal elementary education for all within a certain time period and was mandated by the 86th amendment to the Constitution of India. Under this programme, education was made a fundamental right to provide free and compulsory schooling for children aged 6 – 14 years. It aimed to achieve universal elementary education of satisfactory quality by 2010 (see reference, UP education for all, 2011).
UP state has been making major investments to improve levels and quality of education in recent years (see reference, UP education facts, 2011). The state has also recognised and supported the continuing role of the private sector in expanding education. Schools in the state are either managed by the government or by private trusts. Hindi is used as a medium of instruction in most of the schools except the central government schools that are affiliated to the Central Board of Secondary Education (CBSE) or Council for Indian Schools Certificate Examinations (ICSE) boards. A primary school is required to be present at a distance of 1.5 kilometres (km) and upper primary school at 3 km. A secondary school is present at every 8 km in rural areas and there is a secondary school for girls in every block. Efforts are being made to establish at least one degree college in every block. Table 9 provides a list of schooling facilities available in the state. Thus the state has been investing in improving access to schooling. Table 9. Schools in Uttar Pradesh
Category. Total Number Number of Teachers
Teacher-Student Ratio
Pre-Primary School 50 - -
Primary School 94476 312669 42
Elementary School 20675 103943 30
Secondary School 3149 31343 39 Senior Secondary School
5190
Pre Degree /Junior College
- 109030 41
Board of Intermediate / Secondary Education
676 (Arts/Sc./Com.)
- -
Degree College 34 - Source: UP Education facts, 2011
In Moradabad district there are 1991 primary schools, 682 junior high school,
386 high schools and 386 intermediate, 12 graduate and 10 post-graduate colleges (Moradabad District Profile 2010).
The children in Palanpur have access to both public and private schools (Table 10). A government primary school is in the village itself. They also have access to a private primary school in Peepli, a government secondary school in Akrauli and a private secondary school in Amarpur Kashi. Akrauli and Amarpur Kashi are about 3 km from Palanpur and students either walk or travel by bicycle. Students can walk to the government school in Akrauli. The students in the private secondary school are from better off families and a majority of them cycle to Amarpur Kashi.
13
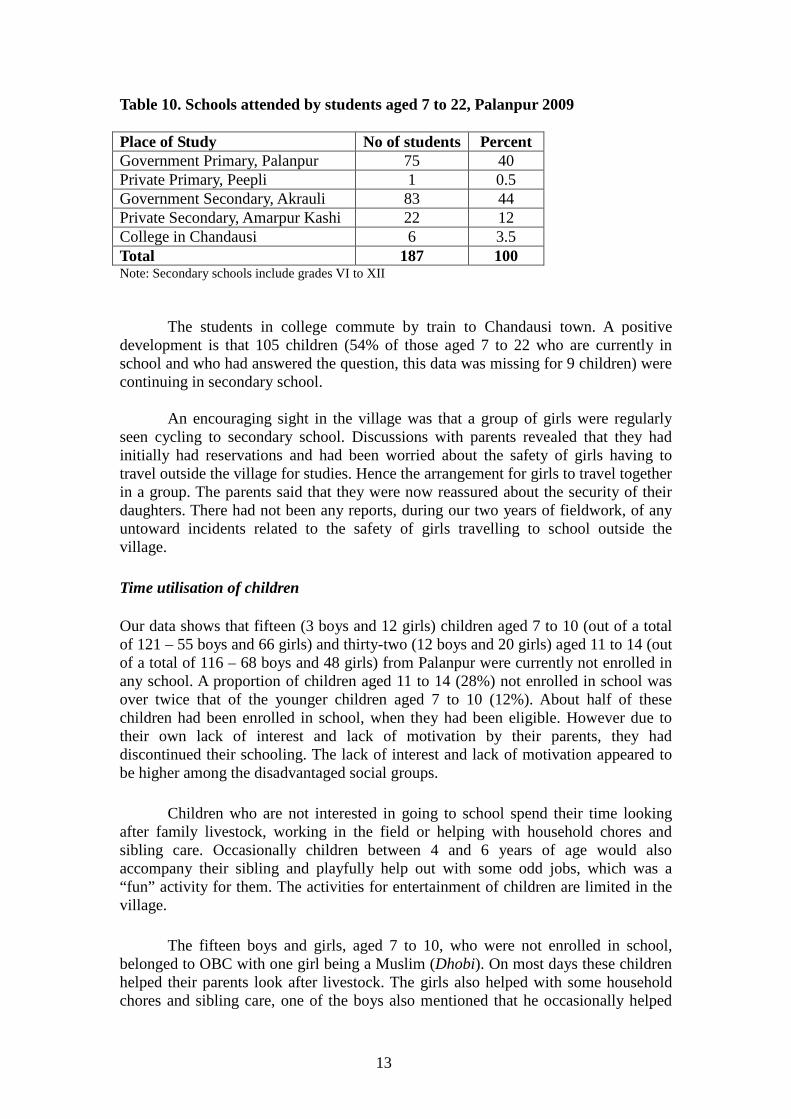
Table 10. Schools attended by students aged 7 to 22, Palanpur 2009
Note: Secondary schools include grades VI to XII
The students in college commute by train to Chandausi town. A positive development is that 105 children (54% of those aged 7 to 22 who are currently in school and who had answered the question, this data was missing for 9 children) were continuing in secondary school.
An encouraging sight in the village was that a group of girls were regularly seen cycling to secondary school. Discussions with parents revealed that they had initially had reservations and had been worried about the safety of girls having to travel outside the village for studies. Hence the arrangement for girls to travel together in a group. The parents said that they were now reassured about the security of their daughters. There had not been any reports, during our two years of fieldwork, of any untoward incidents related to the safety of girls travelling to school outside the village. Time utilisation of children Our data shows that fifteen (3 boys and 12 girls) children aged 7 to 10 (out of a total of 121 – 55 boys and 66 girls) and thirty-two (12 boys and 20 girls) aged 11 to 14 (out of a total of 116 – 68 boys and 48 girls) from Palanpur were currently not enrolled in any school. A proportion of children aged 11 to 14 (28%) not enrolled in school was over twice that of the younger children aged 7 to 10 (12%). About half of these children had been enrolled in school, when they had been eligible. However due to their own lack of interest and lack of motivation by their parents, they had discontinued their schooling. The lack of interest and lack of motivation appeared to be higher among the disadvantaged social groups.
Children who are not interested in going to school spend their time looking after family livestock, working in the field or helping with household chores and sibling care. Occasionally children between 4 and 6 years of age would also accompany their sibling and playfully help out with some odd jobs, which was a “fun” activity for them. The activities for entertainment of children are limited in the village.
The fifteen boys and girls, aged 7 to 10, who were not enrolled in school, belonged to OBC with one girl being a Muslim (Dhobi). On most days these children helped their parents look after livestock. The girls also helped with some household chores and sibling care, one of the boys also mentioned that he occasionally helped
Place of Study No of students Percent Government Primary, Palanpur 75 40 Private Primary, Peepli 1 0.5 Government Secondary, Akrauli 83 44 Private Secondary, Amarpur Kashi 22 12 College in Chandausi 6 3.5 Total 187 100
14
with looking after his sibling. They occasionally (the data suggests an average of 6 days in a year) helped with a little sowing and transplanting and weeding on small plots. On occasion (on average, less than 2 days a year) they are given some pocket money (not exceeding Rs. 30/-) when they do some work in the fields.
The older boys and girls aged 11 to 14, from all social groups, helped with work on their farms, not exceeding twenty days in a year. Boys helped with farm work more than girls. For helping with farm work, they were occasionally paid spending money (a maximum of Rs. 50 for a day’s work during peak cultivation days). On other days they helped look after cattle, with girls helping more with cleaning and looking after livestock at home and boys helping more with taking cattle out for grazing. Girls also helped with work around the house including cleaning and cooking and sibling care. Boys occasionally helped with sibling care.
The children who were enrolled in school also lend an extra pair of helping hands to help with cultivation activities during peak times during rabi and kharif seasons. One hundred and three (53 boys and 50 girls) students aged 7 to 10, and 79 (52 boys and 27 girls) students aged 11 to 14, reported helping with cultivation, looking after livestock, household chores and sibling care. They helped with cultivation activities to a varying degree for not exceeding 20 days in a year. Older boys helped with these activities most often, followed by younger boys. The older children were more interested, to work in other people’s farms so that they could earn spending money. Some children mentioned that they could spend the money during annual fairs and other events in the neighbourhood.
Both boys and girls helped look after livestock, household chores and sibling care, with girls helping more within the house. Sibling care included going to school together.
Thus as established during 1993 study “child labour” does not seem to be an issue in Palanpur as they are not engaged in income-earning activities for their families. Like children anywhere they were involved with helping with family chores, which included farming and looking after livestock in the village. Any money they earned was mostly used for the benefit and pleasure of the children. Education levels The last twenty-five years have seen progress in school enrolment of Palanpur children aged 7 – 18. Eighty percent of all boys were enrolled in school during 2009 (Table 11). The gender gap is high with less than half (47 percent) of the girls being enrolled in school.
There have been steady increases since 1983 and the current enrolment of boys from more developed social groups is fairly high (Thakur is 85% and Pasi is 100%). The improvement in enrolment of boys from Muslim and OBC groups began later and shows improvements between 1993 and 2009. There have been major improvements in enrolment of boys from Jatabs (67%) and Muslim’s (58%) in 2009, although the levels of enrolment are lower than in the other social groups. There have

15
been steady improvements in enrolment of boys across all economic categories (by land ownership).
The improvements in enrolment of girls since 1993 are remarkable; however, the levels remain generally low. The majority of girls from Thakur (67%), Pasi (75%) and Kashyap (69%) communities were enrolled in school. The improvements in enrolment of Muslim girls are noteworthy (Table 11). Around a tenth (13%) of Jatab girls were enrolled compared to none in 1993. There have been major improvements in enrolment of girls among all economic groups since 1993. Table 11. Proportion of children who had been enrolled in school, ages 7-18
1983 1993 2009 Boys Girls Boys Girls Boys Girls
Overall 80 (200/249) 47(102/219) OC Thakur 62 (29/47) 16 (8/49) 75 (40/53) 39 (19/48) 85 (51/60) 67 (33/49) Pasi 58 (11/19) 17 (2/12) 64 (9/14) 33 (5/15) 100 (3/3) 75 (3/4) Muslim Teli 39 (9/23) 0 (0/13) 48 (10/21) 0 (0/20) 89 (24/27) 50 (16/32) Dhobi 0 (0/5) 0 (0/7) 43 (3/7) 0 (0/3) 58 (7/12) 100 (4/4) Carpenter - - - - 100 (3/3) 33 (1/3) OBC Murao 56 (29/52) 3 (1/36) 58 (31/53) 9 (5/56) 78 (51/65) 44 (26/59) Dhimar 40 (6/15) 0 (0/7) 76 (13/17) 15 (2/13) - - Gadaria 44 (7/16) 17 (4/24) 47 (8/17) 18 (4/22) 94 (17/18) 40 (8/20) Kashyap - - - - 75 (15/20) 69 (11/16) SC (Jatab) 15 (4/27) 0 (0/14) 39 (12/31) 0 (0/21) 67 (24/36) 12.5 (4/32) Others 40 (4/10) 54.5 (6/11) 55.5 (5/9) 40 (4/10) 100 (3/3) 0 (0/0) Land Ownership 0.5-1.99 bighas p.c. 47 (16/34) 0 (0/12) 62 (51/82) 17 (15/89) 79 (100/127) 49 (55/113) 2- 2.99 bighas per cap 52 (22/42) 6 (2/33) 49 (19/39) 14 (4/29) 72 (18/25) 54.5 (12/22) 3- 4.99 bighas per cap 39 (24/61) 12 (7/58) 72 (18/25) 30 (10/33) 96 (23/24) 52 (13/25) +5 bighas p.c 47 (27/57) 10 (5/50) 56 (18/32) 19 (4/21) 75 (6/8) 40 (2/5) Note: the numbers in brackets represent the number of children who were enrolled in school over the total number of children belonging to the sample and to this particular year and social group. ‘others’ includes Srivastav & Balmiki; p.c. - per capita Social inequalities in education Pre-schooling in India starts around 4 years and can be continued for children up to 6 years of age. Primary or elementary schooling normally includes children between the ages 5-12 (in grades I to V). Middle school includes children aged 13-14 (grades VI-VIII); inter includes students between ages 14-15 (in grades XI-X); and secondary school includes pupils between ages 16-19 (grades XI and XII). Finally, students in college (UG and PG) are generally aged 19-22.

16
In Palanpur, many children began their formal education later than 5 years of age, so that children older than twelve years of age were still in primary school. For example, the data indicates that seven students aged 13 were studying in grades III, IV and V and were still in primary school. Three students aged fifteen were studying in grade VI. Additionally, six students aged seventeen were found to be studying in grade VIII. There are various reasons explaining this discrepancy. In addition to parents formally enrolling their children in school at an older age, many children took gaps in their education, as a result of irregularity or poor academic record and sometimes had to repeat certain grades. Table 12. Proportion of children having completed primary education (%), ages 12-18
1983 1993 2009 Social Groups Boys Girls Boys Girls Boys Girls
Overall 28.6 3.6 41.3 6.4 55 31 OC Thakur 40 (8/20) 0 (0/16) 66.7 (16/24) 10 (2/20) 65 (20/31) 60 (9/15) Pasi 42.8 (6/14) 0 (0/5) 28.6 (2/7) 0 (0/6) 100 (2/2) 100 (2/2) Muslim 26.7 (4/15) 0 (0/6) 10 (1/10) 0 (0/12) Teli 33.3 (4/12) 0 (0/4) 16.7 (1/6) 0 (0/10) 67 (6/9) 30 (3/10) Dhobi 0 (0/3) 0 (0/2) 0 (0/4) 0 (0/2) 34 (1/3) 100 (1/1) Carpenter - - - - 100 (1/1) 0 (0/1) OBC Murao 28.6 (6/21) 0 (0/7) 40 (8/20) 4.4 (1/23) 54 (15/28) 8 (2/24) Dhimar 14.3 (1/7) 0 (0/1) 25 (2/8) 0 (0/4) Gadaria 0 (0/9) 0 (0/10) 50 (2/4) 7 (1/14) 87 (7/8) 50 (5/10) Kashyap - - - - 50 (5/10) 67 (4/6) SC (Jatab) 11.1 (1/5) 0 (0/4) 17 (4/24) 0 (0/9) 24 (4/17) 0 (0/12) Others 20 (1/5) 60 (3/5) 83 (10/12) 33 (2/6) 0 (0/1) 0 (0/1) Land Ownership
0.5 to 1.99 bighas per
capita
16.7 (4/24) 0 (0/12) 27 (6/22) 0 (0/24) 57 (32/56) 34 (15/44)
2 to 2.99 bighas per capita
23.5 (4/17) 0 (0/10) 55(11/20) 18 (2/11) 69 (9/13) 50 (4/8)
3 to 4.99 bighas per capita
24 (5/21) 0 (0/16) 50 (6/12) 5.6 (1/18) 57 (4/7) 20 (2/10)
+5 bighas per capita
54.5 (6/11) 0 (0/5) 38 (5/13) 0 (0/7) 100 (4/4) 50 (1/2)
Note: the numbers in brackets represent the number of children having completed their primary education over the total number of children belonging to the sample and to this particular year and social group.
The proportion of children aged 12 – 18 who have completed primary education is presented in Table 12. The improvements are similar to the improvements in literacy rates. A majority of boys (55%) and about one-third of the girls have completed primary education in 2009, which are major developments since 1993. Thus there have been remarkable improvements in the last twenty-five in the proportion of children who have completed primary education, albeit the levels being

17
low. There have been improvements across all social groups, with the improvements among Muslims and Jatabs occurring in the last decade. The gender gap has also narrowed between the two survey periods. The improvements across all economic groups are also remarkable.
There have been dramatic improvements in the proportion of girls who have completed primary schooling since 1993. The majority of girls aged 12 to 18 years from Thakurs (60%), Pasi (both girls in this age group) and Kashyap (67%) have completed primary schooling (Table 12). There have been notable improvements among Muslims girls who have completed primary education. While there are modest improvement in literacy rates among Jatab girls, they have been entirely left behind in terms of primary education even in 2009, since none of the 12 girls aged 12 to 18 have completed primary education.
There is evidence of remarkable improvements in the proportion of girls who have completed primary schooling across all economic groups since 1993, albeit levels being low (by land ownership). A positive development is that about a third of the girls from families in the lowest economic group (own less than 2 bighas per capita) have completed primary education (Table 12). Table 13. Education levels of those aged 7 – 22 who were in schooling, Palanpur 2009
Social Groups Primary Middle Secondary College Total N % N % N % N % N OC 21 36 22 38 12 21 3 5 Thakur 19 35 20 37 11 21 3 7 53 (27%) Pasi 2 40 2 40 1 20 0 0 5 (2.5%) Vishwas - - - 0 0 0 Bhatnagar - - - 0 0 0 Muslim 20 60 10 30 3 10 0 0 Teli 15 62 8 33 1 5 0 0 24 (12%) Dhobi 3 50 1 17 2 33 0 0 6 (3%) Carpenter 2 67 1 33 0 0 0 0 3 (1.5%) OBC 48 53 25 27 17 18 3 3 Murao 30 61 8 16 11 22 2 4 49 (25%) Dhimar 9 50 7 39 1 6 1 5 18 (9%) Gadaria 6 28 10 48 5 24 0 0 21 (11%) Shrivastav 3 100 0 0 0 0 0 0 3 (1.5%) SC (Jatab) 10 71 3 21 1 8 0 0 14 (7%) Total 99 51 60 31 31 15 6 3 196 Note: Primary (Grade I-V), Middle (Grade VI-VIII), Secondary (Grade IX-XII), College (UG&PG)
Among all those in Palanpur aged between 7 to 22 years who are currently in schooling, a majority are in primary (51%) and middle schools (31%) (Table 13). Fifteen percent are in secondary school and 3 percent are in college. There have been improvements in schooling among the social groups. Among those who are in secondary schooling, those from OBC (51%) exceed those in OC (39%). There was

18
also one Jatab boy who was in secondary school. Among the 6 students who were in college, half were from OBC (2 Murao and 1 Dhimar) and the other half from OC (3 Thakur). The only post-graduate student is a Thakur. None of the other communities had students in college.
About 80 percent of the children currently in school in Palanpur will be achieving the goal set by the state of at least eight years of schooling. Thakurs and Muraos had higher education levels. The majority of Muslim children were in primary and middle schools (90%) and 3 children were in secondary school. An important development is that 13 Jatab children were in primary and middle schools and one boy was in secondary school (Table 13). Thus there are major improvements, however inequalities continue to exist in education levels between gender and social groups. IV Discussion and Summary UP has been scaling up education initiatives for achieving universal education in the state. To improve school attendance, the Sarva Shiksha Abhiyan in UP introduced awarding graded colours to children according to their monthly attendance. Green was for best attendance, yellow for mediocre and red for the least (GoI DoSE 2011). This has been reported to be providing an incentive for children to aspire for green colour.
UP claimed to be the first state to implement the Right to Education Act 2009 to provide free and compulsory primary education for children aged 6 to 14 years (The Hindu 2009). In the first phase of its implementation, the government planned to focus on teachers, financial resources and additional classrooms. The education department of the state also plans to make all efforts to motivate children working in roadside restaurants, railways stations, bus stops and other places to enrol in schools. To achieve this the government planned to provide children “food, books and even clothes,” (The Hindu 2009). Mayawati, a lady from the Dalit community had been chief minister for three short terms between 1995 and 2003, and she became chief minister in UP for a fourth term in 2007. Her being a woman and from the Dalit community is providing a source of inspiration. Additionally, she is attempting to provide leadership and commitment to improve education and welfare programmes for disadvantaged groups and women, which could be a driver for change in the state. Sonia Gandhi in a recent lecture praised her as a symbol of women’s empowerment from a section of society subjected to discrimination (TNN 2011).
The developments in Palanpur over the last twenty-five years to the time of the survey in 2009 can be described as a ‘yes…. but’ story. Two hundred and sixty two children (161 boys and 101 girls), from Palanpur were attending school in 2009. Over one third of these (99 - 57 boys and 43 girls) were registered at the government primary school in the village. Our analyses show that there has been remarkable progress in schooling of children in Palanpur in the last decade. The majority of boys have completed primary education. There have been major improvements in girls having completed primary education, albeit the levels being low. There was evidence of a reduction in the gender gap in literacy rates among younger children. As schooling of girls is beginning to catch up at the younger ages, it is having a positive influence in reducing the gender gap. There was evidence of a remarkable reduction

19
in gender gaps in schooling levels across social groups, with the reduction being modest among the disadvantaged social groups. The trends among social groups for education are similar to that reported by Lanjouw and Stern (1998). Thakurs are keener to educate their children compared to all other social groups; Jatab and Muslim boys are less likely to attend school than boys from other groups; and girls are less likely to go to school than boys of all social groups. However, there is evidence of remarkable improvements in 2009 in schooling of children from OBC and Muslims. There have been modest improvements in girls from the Muslim community having completed primary education. However, the majority (60%) of Muslim parents send their daughters to a Madrasah situated at Peepli Mosque. There have been modest improvements in schooling of Jatab boys but Jatab girls are left behind in that none has completed primary education even in 2009.
Our results show that about 18 percent of students are currently in secondary or higher education. The number of students from backward community in secondary school exceeds the numbers from open category. This is a major development that children across social groups are being educated beyond primary school. There has been progress in education levels across all economic groups in the village.
Discussions with residents in Palanpur revealed that some had mixed perceptions about education. Some mentioned that an illiterate person, referred to as ‘kubadd’, has a meaningless existence. A majority agreed that being able to read and write was an important requirement. On the other hand some residents (about 10 people during informal discussions) also questioned the importance or need of education as they expressed that having an education was not being very helpful to secure jobs. For this failure, they also questioned the poor quality of the education being provided in the region and mentioned that even after 2 or 3 years of schooling many children could not read or write. However a minority of residents expressed these attitudes, and results show that parents are increasingly making greater effort to enable their children to be educated.
The developments in education in Palanpur can be attributed to an interaction of several factors. As Moradabad district, UP state and India are changing, these developments are also tricking into Palanpur and this village has become more closely integrated in India (Himanshu and Stern 2011). The developments in the state and district have provided additional opportunities for people in the village. As men and women are increasingly moving into non-farm jobs and are commuting out to work their perspectives begin to change thereby changing the aspirations they have for their children’s future. Several government initiatives to enhance education have been introduced in the last decade and they are being implemented, albeit slow and weak. The evidence of developments in education in the village is being enabled through the availability of opportunities, exposure and growing aspirations. As younger children are exposed to the outside world, their goals and objectives would also influence their pursuits.
Government initiatives are also intended to be inclusive in enhancing opportunities for girls and women and disadvantaged social groups. The progress in education levels among girls and social groups can be attributed to a combination of factors including scholarships being provided for children from disadvantaged groups, moving out and exposure to the wider world and integration into the wider economy.

20
A driver for improvements in the education of girls, revealed in discussions with people in the village, is also that of the growing demand for brides who are educated.
This study is a preliminary analysis and in subsequent analyses we will explore the factors, including exposure to media, which might be influencing the developments in education.
There has been a boost in political will to improve education in UP, however, this study and other research reveals weaknesses in implementation and the goal of achieving universal education in the state has some way to go (Bajpai et. al. 2005, Dreze and Kingdon 2001, Pritchett and Pande 2011). The challenges of access, efficiency and quality of education continue to persist; these are discussed further in the context of Palanpur in the following sections. Access Inequalities in access to education by gender and social group continue to persist. While attitudes are changing, the parents (expressed in group discussions) give less preference to schooling for girls compared to boys. The economic benefits to the family from the male child continue to be a strong driver for investment into education and other occupational promotion of sons (Lanjouw and Stern 1998).
The drop-out rate for young girls, especially after completing primary schooling, is high across all social groups. Girls are generally ‘meant to’ make good housewives by taking care of household responsibilities and looking after the needs of her husband and children. Thus girls themselves expressed less preference for education as revealed in group discussions. It was perceived that a girl child was a cost on the family resources when she would marry to go to her in-laws home and hence additional investment in a girl’s education had no economic returns for the family. However, based on group discussions with parents, they now increasingly realise that their daughters should also be educated. Thus about 40 percent of the parents said that the girls should be made to complete at least primary school. It might be that the perception of the role of women is changing based on evidences elsewhere in the state. A pull factor is also that their daughters can be married to educated grooms, and the demand for educated brides is also increasing. They perceive this as an economic or sound return to the family if the girl might be able to work apart from the improvements in the family status of a son-in-law who is educated and employed.
The traditional attitudes in Palanpur continue to have defined division of roles for older men and women, with men being the breadwinners and women being the nurturers and housekeepers in the family. This division of labour has been accepted as normal and in the past they just got on with it. These attitudes continued to thrive when there was lack of access to quality education and opportunities and benefits deriving from education. The opportunities for economic independence of girls are still minimal in the current scheme of things among the residents of this village. In the recent decade there have been imperceptible changes in attitude toward the role of women. There is evidence of the changing attitude in the role of girls. There has been progress in the education of younger girls as revealed in this study. Himanshu and Stern (2011) show that there has been 4% growth in real wages for women for non-

21
farm jobs. Further, the post of pradhan (village head) was reserved for a woman during elections in 2010 and a woman is currently the village head. Some details of the status of women in Palanpur have been examined by Sinha and Coppoleta (2011).
Sometimes discrimination by teachers toward schedule caste pupils de-motivated and excluded them from going to school. An example was revealed in the story of two Jatab households who said that their daughters (one from each family) were not enrolled anymore in the school because “the teacher … used to ask them to sweep the school with a broom everyday. Eventually the older of the two girls was put off and refused to sweep the class saying she was coming to school to study. Both the girls then stopped going to school, and finally their names were struck off the rolls”. While this shows improvement in that the girl was able to speak out, this also provides evidence that children from disadvantaged social groups still face challenges being educated.
There was no evidence of any monitoring and evaluation of the government-sponsored facilities in the village, so that there appeared to be no accountability or effective performance by the teachers and in the management of resources. The government had given grants to improve the infrastructure of the village school and to provide facilities at the school including building toilets for the boys and girls. While the infrastructure for primary schooling in the village has improved, the facilities were inadequate and the toilets that were built were kept locked so that the children could not use them.
The role of parental motivation in schooling decisions plays a vital role in determining the education attainment of their children. However, once they have registered their children in primary school, a majority of parents (about 70 percent) in Palanpur feel that their responsibility for educating their children has been completed and there is nothing more for them to do to ensure the performance or continuation of their children’s education.
In the case of first generation school goers, the responsibility rests heavily on the children as well. The motivation for children to study after school does not exist and very few children were found to be doing their homework or doing any reading or writing at home. In addition, the facilities for children to study are poor in the village in general. There was shortage of supply of electricity in the village. Secondary school students were having difficulty to study for their final exams due to a lack of electricity in the summer. A group of students took the initiative of getting together and rented a house in Chandausi for two months of to study until they completed their exams. There was evidence of growing motivation for education among the children in Palanpur.
Thus, difficulties in access to education in Palanpur persist. However, there have been major improvements in the last decade.

22
Efficiency and Quality The infrastructure of government primary school in the village has improved and it has a pucca building, albeit basic, with five rooms and includes a kitchen for cooking mid-day meals.
Lack of quality schooling facilities was a main concern expressed by parents in Palanpur. Thereby better off and educated parents send their children to private school, as they were reportedly better than the government schools. Some parents expressed that they preferred sending their children to private school because although the quality of teaching was not better there, at least there is no absenteeism by teachers and the children were taught something. Thus parents are not very satisfied with the education services being provided. However, we did not see any evidence of parental involvement in the functioning of the services. Lack of quality teaching and absenteeism is a common problem in schools, more so in rural India.
Pritchett and Pande (2011) presented that quality of government primary schooling is very low in rural India. Absenteeism of teaches is well known to be a major problem in rural government primary schools in India (Narayan and Mooij 2010). In addition, shortage of teachers is also a general concern for primary school across India. A study by UNICEF India (2006) reported that 19% of the total primary schools are single teacher schools that cater to nearly 12% of the total enrolment in primary classes. The UNICEF study also found that Uttar Pradesh had difficulties in providing even a single teacher in 921 primary schools. Though enrolment rates have gone up, there has not been a corresponding increase in the number of teachers. Thus while the number of schools and teacher students ratios as shown in Table 9 indicate a positive scenario, finding quality teachers continues to be a major challenge in UP.
Two permanent teachers and one shiksha mitra (assistant teacher) have been sanctioned for the government primary school in Palanpur. However lack of teachers to fill these posts is an ongoing problem. The two teachers and the assistant have to teach 5 grades in the primary school, so that the students are often grouped into one or two classes, with all of them sitting together or grades I to III sitting together and grades IV and V sitting together. Further absenteeism is high so that not all three were available to teach on most days; as a result, sometimes there was only one teacher for all 5 grades. The assistant teacher was not responsible for teaching, so that when she/he was the only teacher available in school the children would not have any teaching on that day.
Finding teachers as well as retaining teachers at the government primary school in Palanpur was a problem. During the two years of our fieldwork, when we first started there had been a male teacher at the government primary school in Palanpur. Those who sent their children to the government school were aware of its poor standards and complained about the quality of teachers saying “he was drunk when he teaching”, or “he is not interested in teaching”. He then left the school and a lady teacher was appointed. She had been irregular in attending the school and later she moved to the home of her parents-in-law when her husband died and the school was left with no teacher for some time. Towards the end of our survey, a male teacher had been appointed, in focused discussions with him regarding finding additional teachers for the school, he said that although there were permanent jobs for

23
government teachers, lack of teachers was a major problem. Thus while the primary school in Palanpur required more teachers and the government had jobs available, finding teachers was a challenge. So he was teaching 5 classes with one assistant. Our observations were that regularity and quality of teaching continued to be a problem at the government primary school. Further there appeared to be no mechanisms for accountability of teachers.
Finding residents in the village to teach did not appear to be possible either. There was one young man in Palanpur who was interested in pursuing a career in teaching. He had completed his under-graduation and was waiting for admission into a teacher training programme. He had taken the initiative to earn money by taking tuitions for younger students. In discussions about his willingness to teach at the village primary school, he did not appear keen to either volunteer or do part-time teaching for payment.
Discussions with residents revealed that there had been a private school in the village during 2006. An assistant teacher from the village, together with a teacher from another village had been running this school. The assistant teacher got a job in a government school and the private school had to be shut down due to lack of teachers. Teachers are keen to obtain jobs in government schools because it offers them a secure position and income. Permanent positions offer job security for teachers, which could be helpful to recruit people. On the other hand, they are also problematic in compromising accountability and performance by teachers. Often once they are made permanent, they became secure in their position and their motivation to perform their duties appeared to be compromised with other self-interests.
Lack of quality teachers is an additional challenge. Even when teachers were present at the primary school in the village, there was no evidence of active teaching being done regularly in the class. They were often seen standing around watching passers by or sitting and chatting with each other, thus they mainly appeared to be maintaining some order or giving them some exercise. Thus quality of teaching does not seem to have changed much compared to the situation in earlier surveys (Lanjouw and Stern 1998).
However, an incident may be suggestive that at least some children appeared to be able to read and write in spite of the lack of quality teaching. When one of the students in grade III was tested, her notebook had several lessons completed and she was able to read well. It was interesting that the student knew her work when it appears that the quality of the teaching is poor. It might be possible that the children learn to read from each other and from their older siblings. Perhaps the girl sitting in the front row was one of the brighter students in the class. While the knowledge of the children and performance of teachers cannot be evaluated on the basis of asking a single child to read, it was evident that children were learning to read and write at the school. It is also common practice for students to go for tuitions in order to prepare for and pass their exams, which was one way of overcoming the problem of lack of teaching in schools. We hope to examine these issues further in subsequent papers.

24
Future Research This paper is based on preliminary descriptive analyses. There is lot more work to be done for refining, merging and compiling data. The data has currently been drawn from at least two different questionnaire and data files, which require further work for consistency checks. This paper has mainly examined education levels of those who are currently in schooling. The education of the overall population needs to be examined further in the context of additional demographic characteristics including marital status. We would like to analyse the data further and examine causal relationships and conduct significance tests. Data relating to the levels of spending for education has also been collected and we have yet to analyse this data.
In addition the following questions will be examined – (i) mechanisms involved in the substantial changes in education that have happened, in terms of parental decision (as demand) and public supply and the institutional and social mechanisms are at work; (ii) what were the priorities and processes for parents and children for choosing private or government school; the level of education completed and related aspects; (iii) parents’ perceptions about quality of education, reward and so on. These will be examined in subsequent papers drawing on the value added from this in-depth study of the village.

25
References Bajpai, Nirupam, Ravindra H. Dholakia and Jeffrey D. Sachs (2005). Scaling Up Primary Education Services in Rural India. CGSD Working Paper No. 28. Centre on Globalisation and Sustainable Development. The Earth Institute at Columbia University. http://www.earthinstitute.columbia.edu/cgsd/documents/RuralEducationPaper.pdf accessed 26th April 2011. Bakshi, Aparajita (2008). Social Inequality in Land Ownership in India: a study with particular reference to West Bengal. http://www.networkideas.org/featart/jan2008/Land_Ownership.pdf accessed 10th April 2011. Bersier, Florian (2008). Education in Rural India: Perspective from a North-Indian Village. Master’s dissertation, Department of Quantitative Economics and Finance, Ecole Polytechnique. http://www.csh-delhi.com/publications/downloads/articles/Education_florian_berseir.pdf. Census of India 2001 & 2011. Census of India website: office of the registrar general. http://censusindia.gov.in/ most recent access 26th April 2011. Create 2009. Educational access in India: Country policy brief. Consortium for Research on Education, Access, Transition and Equity (CREATE). http://www.create-rpc.org Dreze, Jean and Geeta Gandhi Kingdon (2001). School participation in rural India. Review of Development Economics, volume 5, issue 1, pp. 1–24. GoI DoSE (accessed 20th April 2011). Sarva Shiksha Abhiyan. Government of India Department of School Education and Literacy. http://www.education.nic.in/ssa/ssa_5.asp. Himanshu and Nicholas Stern (2011). India and an Indian Village: 50 years of economic development in Palanpur, Asia Research Centre Working Paper No.43 Human Development Report (2010). The real wealth of nations: Pathways to human development. UNDP. http://hdr.undp.org/en/reports/global/hdr accessed 6th April 2011. Kambampati and Pal (2001). Role of parental literacy in explaining gender difference: evidence from child schooling in India. The European Journal of Development Research, volume 13, pp. 97–119. https://secure.palgrave-journals.com/ejdr/journal/v13/n2/abs/ejdr200119a.html accessed 3rd April 2011.
Krishna Narayan and Jos Mooij (2010). Solutions to Teacher Absenteeism in Rural Government Primary Schools in India: A Comparison of Management Approaches. The Open Education Journal, volume 3, 63-71.

26
Lanjouw, P. & Nicholas H Stern (1998). Economic Development in Palanpur over Five Decades, Oxford University Press. Muralidharan, Karthik and Michael Kramer (2006). Public and Private Schools in Rural India. http://www.dise.in/Downloads/Use%20of%20Dise%20Data/Karthi%20Muralidharan%20and%20Michael%20Kremer.pdf accessed 12th March 2011. Moradabad District Profile (2010). Introduction and some indicators. http://www.nlrindia.org/index.php?section=12&category=60%20Uttar%20Pradesh&page=528 accessed 12th April 2011. Parasaran K, V. Mohini Giri, Abid Hussain, N C Saxena, EAS Sarma (2001). Literacy in the context of the constitution of India. A consultation paper for the National commission to review the working of the constitution. http://lawmin.nic.in/ncrwc/finalreport/v2b1-5.htm accessed 2nd February 2011. Pritchett, Lant and Varad Pande (accessed 26th April 2011). Making Primary Education Work for India’s Rural Poor – A Proposal for Effective Decentralization. A World Bank presentation. http://siteresources.worldbank.org/PSGLP/Resources/PritchettPande.pdf Sinha Dipa and Rosalinda Coppoletta (2011). The invisible half: women’s status in Palanpur. Asia Research Centre Working Paper No.50 The Hindu (2009). Uttar Pradesh to implement Right to Education Act 2009. Lucknow, 9th December 2009. http://thehindu.com/education/article62404.ece TNN (2011). Sonia praises Mayawati, calls her symbol of women's empowerment. http://articles.timesofindia.indiatimes.com/2011-03-19/india/29145751_1_dalit-outfit-sonia-gandhi-mayawati accessed 10th March 2011. UNICEF India (2006). Global Campaign for Education – more teachers needed. http://www.unicef.org/india/education_1551.htm accessed 15th March 2011. UP education facts (accessed 10th April 2011). http://www.upeducation.net/Facts/ UP education for all (accessed 27th April 2011). http://www.upefa.com/upefa/detail.php?chk=menu&vlmid=70 UP government website (accessed 12th March 2011). http://upgov.nic.in/upinfo/up_eco.html.

27
Appendix A: Social classifications in Palanpur The caste system practised in Palanpur will be discussed in details in a paper at a later stage. Here we present a summary of caste classifications. The caste system is a social stratification, which has existed historically in India is a form of social stratification of people based on the nature of work done by people. They were hierarchical and were classified into four castes and one out-caste and ranked as follows: Brahmin – priests and scholars Kshatriya – rulers, warriors, landowners, legal, public administrators Vaishya – merchants Shudra – service providers, skilled and unskilled labourers, craftsmen Harijans – were outcastes considered to be so low as not to be classified among the social groups but referred to as ‘harijan’ or ‘pariah’. Their jobs, such as cleaning toilets and disposing the dead, were considered unclean. Thus they were called untouchables and treated as unworthy of any association with people outside their own group. The reservation system in India is an attempt to provide opportunities for education and employment for people from disadvantaged social and economic backgrounds through positive discrimination. The reservation system classifies people by caste and sub-castes into the following categories: Open Category (OC) – includes Brahmins and other upper castes. Thakur, Pasi, Vishwas and Bhatnagar are among the upper castes in Palanpur. Backward Community (BC)/Other Backward Community (OBC) – is the largest grouping and includes several sub-sects from among Vaishya and Shudra castes. The Mandal Commission (set up in 1979 to identify the socially or educationally backward) included about 3000 castes under OBC, which includes about 52% of the total population in India. Teli (oil producers), Dhobi (washermen/women), Carpenter, Chamar, Murao (historically landless labourers), Dhimar, Gadaria, Kashyap, Kayasth and Srivastav from Palanpur are classified among BC and OBC. Schedule Caste (SC) and Schedule Tribe (ST) – includes the most backward communities (approximately 16% of total population) and tribal communities (about 7% of population). Jatabs in Palanpur are classified as schedule caste. A proportion of seats/jobs are reserved for people belonging to BC/OBC and SC/ST groups in government and public sector institutions. The Supreme Court stipulates that reservations cannot exceed 50% (approximately 28% for OBC, 15% for SC and 7% for ST) in total. There are some variations in the proportion of reservation between states. This policy continues to remain controversial.