Women in Palanpur: An Empirical Study of the Determinants ...
52
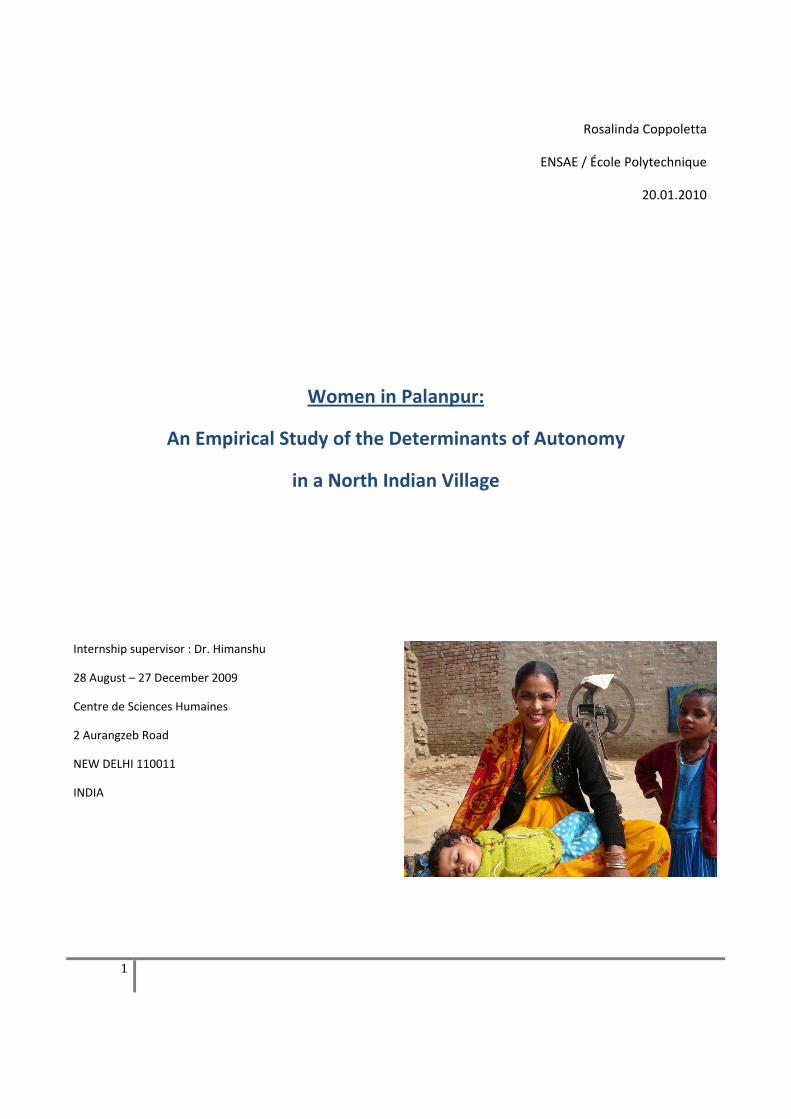
1 Rosalinda Coppoletta ENSAE / École Polytechnique 20.01.2010 Women in Palanpur: An Empirical Study of the Determinants of Autonomy in a North Indian Village Internship supervisor : Dr. Himanshu 28 August – 27 December 2009 Centre de Sciences Humaines 2 Aurangzeb Road NEW DELHI 110011 INDIA
-
Upload
khangminh22 -
Category
Documents
-
view
0 -
download
0
Transcript of Women in Palanpur: An Empirical Study of the Determinants ...
1
Rosalinda Coppoletta
ENSAE / École Polytechnique
20.01.2010
Women in Palanpur:
An Empirical Study of the Determinants of Autonomy
in a North Indian Village
Internship supervisor : Dr. Himanshu
28 August – 27 December 2009
Centre de Sciences Humaines
2 Aurangzeb Road
NEW DELHI 110011
INDIA
2
English abstract1
This paper examines women status in Palanpur, a north Indian village which growth and development have been studied
over almost 6 decades by many economists. It uses quantitative data about married women in Palanpur in 2008‐2009 to
examine women’s autonomy, to what extent they have a control over their life, access to resources and information. Thus,
I first picture women’s life in Palanpur, their low but increasing level of education, their low participation in the labour
market and early marriage. I then focus on six autonomy indicators ‐ economic decision‐making, paid work, mobility,
freedom from threat, media exposure and civic life ‐ and show differences within the village. The two opposing groups are
on the one hand “high caste”, educated, young or wealthy women who rank very low for the indicators of mobility or
proportion of women working but likely to have much more often access to Media, more often their own account and less
often beaten by their husband. On the other hand, old, “scheduled class” women or those in poorer household may have
more mobility because they have to work and participate more in civic life, but will rank lower for indicators correlated to
wealth. Even if the global status of Palanpur women is relatively low, there should be some changes with the fact that
female literacy rates are impressively increasing, carrying the hope that Palanpur women will take their faith into their
hands and achieve higher levels of autonomy.
Résumé en français
Ce mémoire traite du statut des femmes de Palanpur, un village du nord de l’Inde dont le développement économique a
été étudié sur 6 décennies par de nombreux économistes. Il utilise des données quantitatives sur les femmes mariées de
Palanpur en 2008‐2009 et étudie l’autonomie des femmes, c’est‐à‐dire dans quelle mesure elles contrôlent leur vie,
l’accès aux ressources et l’information. Je décris d’abord la vie des femmes à Palanpur, leur niveau d’éducation bas mais
croissant, leur faible participation au marché du travail et mariage précoce. Je me concentre ensuite sur six indicateurs
d’autonomie – décision économique, travail rémunéré, mobilité, absence de violence domestique, exposition aux médias
et vie civique – et je montre des différences intra‐village. Les deux groupes qui s’opposent sont d’un côté les femmes de
“haute caste”, éduquées, jeunes ou aisés qui sont peu mobiles mais ont plus de chaces d’avoir accès aux médias, un
compte à leur nom et être moins souvent battues par leur mari. De l’autre côté, des femmes plus agées, de “basse caste”
ou dans des ménages pauvres sont plus mobiles parce qu’elles travaillent plus souvent et participent plus à la vie civique,
mais ont des scores plus bas pour les indicateurs corrélés aux revenus. Cependant, bien que le statut global des femmes
de Palanpur soit très bas, des changements devraient se produire en raison de l’augmentation impressionnante des taux
de scolarisation, donnant espoir que les femmes de Palanpur vont prendre leur destin en main et arriver à des niveaux
d’autonomie plus élevés.
1 Many thanks to Himanshu and Dipa who made this internship possible. I am grateful to the entire Palanpur team for welcoming me, and in particular to Nicholas Stern, Peter Lanjouw, Ruth Kattumuri and Jean Drèze. I am also grateful to Manju and to the village investigators Dinesh and Hemendra, who helped me a lot in Palanpur for the interviews and the data cleaning, and were always ready to tell me the anecdotes corresponding to every household. I am naturally very grateful to all the village women for their kindness and time they always took to answer our questions. I would finally like to thank the participants to the presentation at CSH and especially Dr. Preet Rustagi for her helpful comments.
3
Table of Contents Introduction ............................................................................................................................................................................................................................ 4 I. Presentation of the village of Palanpur ......................................................................................................................................................................... 5
1) The surveys in Palanpur ......................................................................................................................................................................................... 5 2) Uttar Pradesh ......................................................................................................................................................................................................... 5 3) The Palanpur village ............................................................................................................................................................................................... 6 4) Castes in the village ................................................................................................................................................................................................ 7 5) A woman’s life in Palanpur or western Uttar Pradesh ........................................................................................................................................... 7
a) From birth to widowhood ................................................................................................................................................................................ 7 b) Exceptions ........................................................................................................................................................................................................ 9 c) Gender inequalities .........................................................................................................................................................................................11
II. Presentation of the Data ..............................................................................................................................................................................................12 III. Women in Palanpur: general situation with quantitative data .............................................................................................................................13
1) Some demographic facts .......................................................................................................................................................................................13 2) Education of women in Palanpur ..........................................................................................................................................................................14
a) Palanpur married women................................................................................................................................................................................14 b) Palanpur unmarried girls .................................................................................................................................................................................16
3) Outside work for women in Palanpur ...................................................................................................................................................................17 4) Marriage and fertility ............................................................................................................................................................................................19
a) Changes between 1993 and 2008 ...................................................................................................................................................................19 b) Age at marriage in 2009 ..................................................................................................................................................................................20 c) Fertility ............................................................................................................................................................................................................22
5) Other explanatory factors: parents and household wealth ...................................................................................................................................24 a) Parents’ village ................................................................................................................................................................................................24 b) Household wealth ...........................................................................................................................................................................................26
IV. How to measure the status of women ..................................................................................................................................................................27 1) Terminology ..........................................................................................................................................................................................................27 2) Women status and happiness: some considerations ............................................................................................................................................27
V. Differences in autonomy for women in Palanpur: a detailed study .............................................................................................................................31 1) Presentation of the Autonomy Indicators for Palanpur Women ...........................................................................................................................31
a) Economic decision‐making ..............................................................................................................................................................................31 b) Paid outside work ............................................................................................................................................................................................32 c) Mobility ...........................................................................................................................................................................................................32 d) Domestic violence ...........................................................................................................................................................................................33 e) Exposure to Media ..........................................................................................................................................................................................34 f) Civic life ...........................................................................................................................................................................................................35
2) Indicators and explanatory factors: first considerations .......................................................................................................................................36 a) Age ..................................................................................................................................................................................................................36 b) Caste ...............................................................................................................................................................................................................37 c) Age at marriage ...............................................................................................................................................................................................37 d) Distance to parents .........................................................................................................................................................................................37 e) Education ........................................................................................................................................................................................................37 f) Wealth .............................................................................................................................................................................................................38
3) Multiple regressions: a detailed analysis of women autonomy ............................................................................................................................38 a) Economic decision‐making ..............................................................................................................................................................................39 b) Paid work ........................................................................................................................................................................................................39 c) Mobility ...........................................................................................................................................................................................................40 d) Freedom from threat ......................................................................................................................................................................................40 e) Media exposure ..............................................................................................................................................................................................41 f) Civic life ...........................................................................................................................................................................................................41
4) Correlation between autonomy indicators ...........................................................................................................................................................41 VI. Conclusion .............................................................................................................................................................................................................42 VII. References ............................................................................................................................................................................................................43
1) Bibliography ..........................................................................................................................................................................................................43 2) List of figures .........................................................................................................................................................................................................44 3) List of Tables .........................................................................................................................................................................................................44
VIII. Tables ....................................................................................................................................................................................................................46
4
Introduction
The surveys conducted in the little village of Palanpur over almost 6 decades made this village and data unique. However,
most of the previous studies and questionnaires done in Palanpur were focused on households or men. In early years it
was because social norms would not allow the newly arrived researchers to speak to women, but they got eventually the
opportunity to talk to some of them and added qualitative data about women in the major book “Palanpur Development
over Five Decades” by Lanjouw and Stern (1998). Nevertheless, the first attempt to collect quantitative data about
women’s autonomy was made only recently, in 2008‐2009. I will therefore start with a general picture of a woman’s life in
rural north India and in Palanpur in particular. I will then focus on these women’s autonomy, defined as “the extent to
which [women] have an equal voice in matters affecting themselves and their families, control over material and other
resources, access to knowledge and information, the authority to make independent decisions, freedom from constraints
on physical mobility, and the ability to forge equitable power relationships within families” (Jejeebhoy, 2000).
One could wonder why I should focus on women status as it should be included already in previous studies where the
whole household was examined. The point is that, contrarily to classical economics where the resources are shared in an
optimal way in the household and the decisions made without conflict between husbands and wives, the reality in the
field is different. It is therefore important to assess the gender relations within the couple, the interactions with the
women’s parents and with the community. It is now well‐known that the status of women has important demographic
implications in terms of “quantity” of children and “quality” of child‐raising, which will then on the long term be a major
determinant for growth and development.
I will first introduce the village of Palanpur1, given that the Indian context in particular the one in Uttar Pradesh is quite
specific and needs some explanations for people who are not used to it. I there describe the role of women2 in Palanpur
and in western Pradesh in general, but will keep the detailed findings of this study for the following parts. In the second
part, I present the data used for this study. The third part gives some descriptive statistics about women’s lives in Palanpur
nowadays. The fourth part deals with the type of indicators that should be chosen to evaluate women’s status and gives a
review of the literature on this topic. The fifth part gives the results of the study for Palanpur and the sixth section
concludes.
1 A very interesting aspect of my internship was that, even if the data was collected when I arrived, it was not entered yet. I therefore started doing half of the data‐entry, then checked and corrected it, either comparing with the other questionnaires and old data we had, or by going to the village and asking again some questions. I also took some time to interview married women in the village and typed the interviews of the unmarried women previously done, in order to have qualitative data and understand better the different issues. Then only could I start this study.
2 All the names in the report are modified for anonymity reasons. The initials of the old and the new name pairwise correspond, and I mostly used names that do exist in the village.
5
I. Presentation of the village of Palanpur
This section presents the village of Palanpur and should enlighten the western‐Uttar Pradesh context to readers who are
not familiar with it. Before starting with the study of Palanpur women, I thus introduce some characteristics of the village
and more generally of rural Indian society. Readers of the Palanpur books may skip this part, as it is largely based on
Lanjouw and Stern (1998).
1) The surveys in Palanpur
Palanpur is a village in the district of Moradabad, in western Uttar Pradesh in India. It is well‐known in the development
economics world because of the numerous papers and the two books published on it, as surveys have been done in this
village since 1957. The main goal was to provide information about the mechanisms of development, and how growth
enhances equality, development of schooling, migrations, etc. The first two surveys were conducted in 1957‐1958 and
1962‐3 by Professors from the Agricultural Economics Research Centre of Delhi University. A 3rd one occurred in 1974‐5 by
Christopher Bliss (Oxford University) and Nicholas Stern (London School of Economics) ‐ it gave birth to the 1st book about
Palanpur (Bliss and Stern, 1982). A 4th survey was done in 1983‐4 by Jean Drèze (Delhi School of Economics) and Naresh
Sharma (University of Hyderabad). A short 5th round was done in 1993, which lead to the publication of a 2nd book,
Lanjouw and Stern (1998). The present survey started in April 2008 and will end in spring 2010.
2) Uttar Pradesh
One important point in order to understand the women issues presented later is that Uttar Pradesh is one of the least
developed states in India, both in terms of wealth and in terms of human development. It indeed combines a high
incidence of poverty in terms of conventional income based indicators (e.g. the “head‐count ratio”) with exceptionally
high levels of mortality, fertility, under‐nutrition, illiteracy, and related indicators of endemic deprivation. Uttar Pradesh
ranks last among all major Indian states according to most estimates, and is also a region of extreme social inequalities,
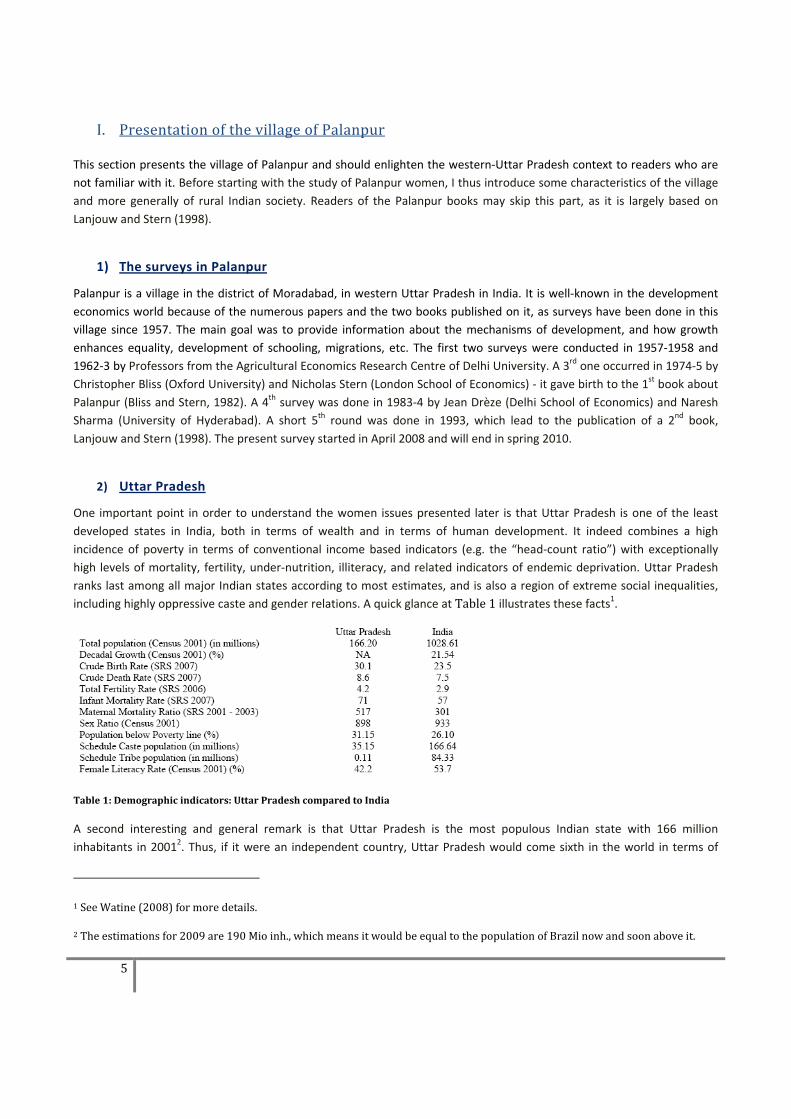
including highly oppressive caste and gender relations. A quick glance at Table 1 illustrates these facts1.
Table 1: Demographic indicators: Uttar Pradesh compared to India
A second interesting and general remark is that Uttar Pradesh is the most populous Indian state with 166 million
inhabitants in 20012. Thus, if it were an independent country, Uttar Pradesh would come sixth in the world in terms of
1 See Watine (2008) for more details.
2 The estimations for 2009 are 190 Mio inh., which means it would be equal to the population of Brazil now and soon above it.
6
population size, just between Brazil (5th) and Pakistan (7th). Besides, it would rank as one of the least developed countries
in the world, with, for instance, literacy and mortality rates comparable to those of the poorest countries of sub‐Saharian
Africa. The situation is obviously not homogeneous in the whole state. Moradabad District, where Palanpur is located,
experienced relatively rapid economic growth since the beginning of the “Green Revolution” and is now one of the more
prosperous regions of U.P. However, the Moradabad District does not fare particularly well in terms of indicators of well‐
being in comparison with the other four regions and districts. Women status being a major determinant of demographic
growth, studying it and raising awareness could help improve Uttar Pradesh’s development.
3) The Palanpur village
Palanpur is situated in the District of Moradabad in western Uttar Pradesh and is located about 200 kms of Delhi (5 hours
by train), 31 kms South of the city of Moradabad and 13kms North of Chandausi, the closest town. The railway line
connecting these two town runs just outside the village and train is the main mean of transport used by villagers to get
into nearby cities, allowing men to go there in the morning and coming back in the evening easily. The main activity in the
village is farming for men and domestic work for women, with two major seasons to fit the climate: rabi (November–May)
and kharif (June–November).
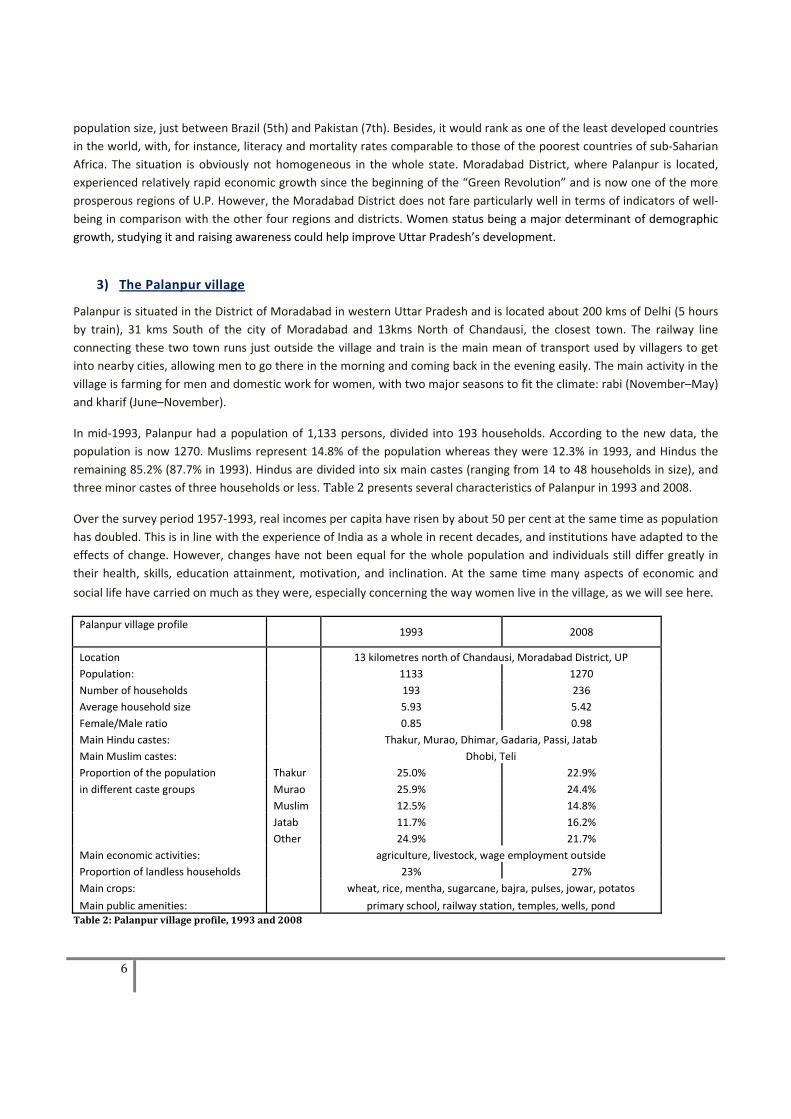
In mid‐1993, Palanpur had a population of 1,133 persons, divided into 193 households. According to the new data, the
population is now 1270. Muslims represent 14.8% of the population whereas they were 12.3% in 1993, and Hindus the
remaining 85.2% (87.7% in 1993). Hindus are divided into six main castes (ranging from 14 to 48 households in size), and
three minor castes of three households or less. Table 2 presents several characteristics of Palanpur in 1993 and 2008.
Over the survey period 1957‐1993, real incomes per capita have risen by about 50 per cent at the same time as population
has doubled. This is in line with the experience of India as a whole in recent decades, and institutions have adapted to the
effects of change. However, changes have not been equal for the whole population and individuals still differ greatly in
their health, skills, education attainment, motivation, and inclination. At the same time many aspects of economic and
social life have carried on much as they were, especially concerning the way women live in the village, as we will see here.
Palanpur village profile 1993 2008
Location 13 kilometres north of Chandausi, Moradabad District, UP
Population: 1133 1270
Number of households 193 236
Average household size 5.93 5.42
Female/Male ratio 0.85 0.98
Main Hindu castes: Thakur, Murao, Dhimar, Gadaria, Passi, Jatab
Main Muslim castes: Dhobi, Teli
Proportion of the population Thakur 25.0% 22.9%
in different caste groups Murao 25.9% 24.4%
Muslim 12.5% 14.8%
Jatab 11.7% 16.2%
Other 24.9% 21.7%
Main economic activities: agriculture, livestock, wage employment outside
Proportion of landless households 23% 27%
Main crops: wheat, rice, mentha, sugarcane, bajra, pulses, jowar, potatos
Main public amenities: primary school, railway station, temples, wells, pond Table 2: Palanpur village profile, 1993 and 2008
7
4) Castes in the village
Caste still plays a major role in the village life, in particular concerning women’s lives. Caste and social class are very
correlated and we will thus use them to have a first understanding of the differences within the village.
The “top” position in Palanpur's caste hierarchy is occupied by the Thakurs. Thakurs are a martial caste, and quite a few of
them have been able to find employment in the army and the police, or as night watchmen and security guards. The
majority, however, are now engaged in a combination of cultivation (they have good land endowments) and wage
employment in urban areas. The lifestyle of Thakur women in Palanpur closely follows traditional high‐caste norms. These
include the seclusion of young married women, abstention from work outside the house, and no widow remarriage. Thus,
Thakur women mostly stay at home and their honour is to be seen as little as possible outside their home.
The second largest caste in Palanpur's Hindu population is that of the Muraos. Their traditional occupation is cultivation,
and this remains the basis of their subsistence and culture. They have the best land endowments in the village, and rarely
sell land or lease it out. Their attitudes and values are: hard work, frugality, self‐reliance, and conformism, among others.
Murao women will more often be found working in fields than Thakur women, even if rich Murao landowners have an
increasing preference in keeping their women at home. This is linked to upward economic mobility, as it is a way for
Muraos to show that their social status becomes closer to the Thakurs’ (see Deliège 2004, p. 30).
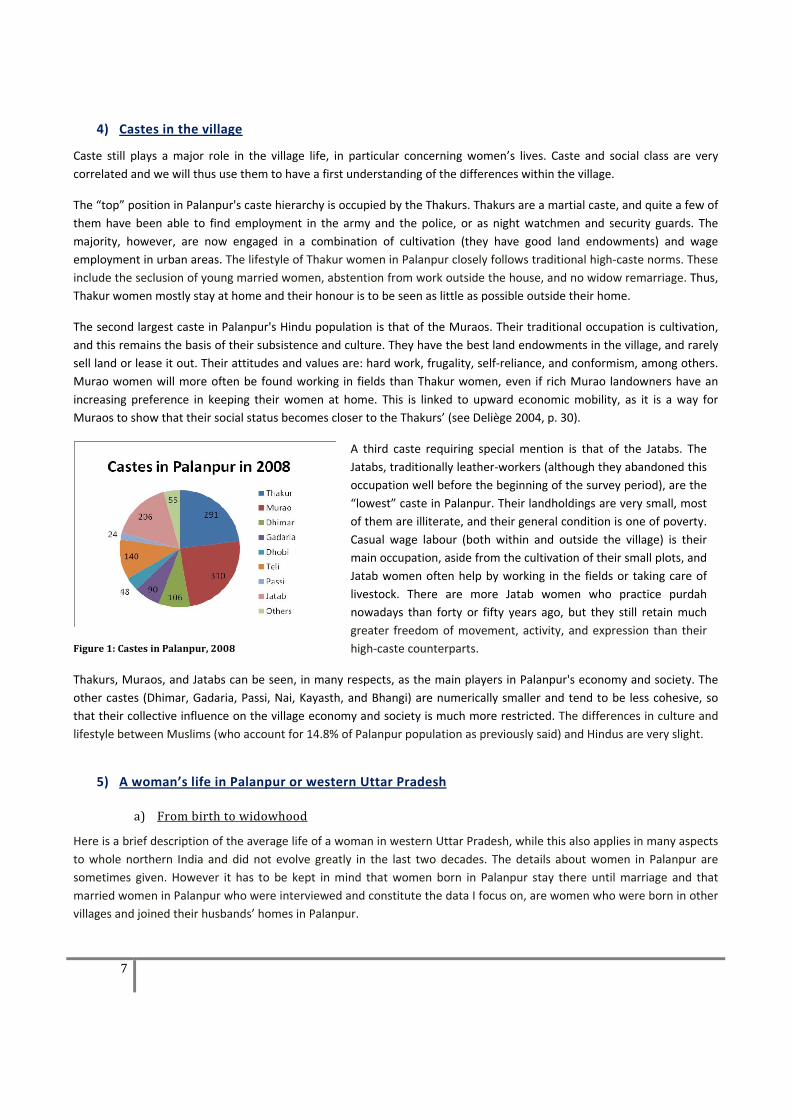
Figure 1: Castes in Palanpur, 2008
A third caste requiring special mention is that of the Jatabs. The
Jatabs, traditionally leather‐workers (although they abandoned this
occupation well before the beginning of the survey period), are the
“lowest” caste in Palanpur. Their landholdings are very small, most
of them are illiterate, and their general condition is one of poverty.
Casual wage labour (both within and outside the village) is their
main occupation, aside from the cultivation of their small plots, and
Jatab women often help by working in the fields or taking care of
livestock. There are more Jatab women who practice purdah
nowadays than forty or fifty years ago, but they still retain much
greater freedom of movement, activity, and expression than their
high‐caste counterparts.
Thakurs, Muraos, and Jatabs can be seen, in many respects, as the main players in Palanpur's economy and society. The
other castes (Dhimar, Gadaria, Passi, Nai, Kayasth, and Bhangi) are numerically smaller and tend to be less cohesive, so
that their collective influence on the village economy and society is much more restricted. The differences in culture and
lifestyle between Muslims (who account for 14.8% of Palanpur population as previously said) and Hindus are very slight.
5) A woman’s life in Palanpur or western Uttar Pradesh
a) From birth to widowhood
Here is a brief description of the average life of a woman in western Uttar Pradesh, while this also applies in many aspects
to whole northern India and did not evolve greatly in the last two decades. The details about women in Palanpur are
sometimes given. However it has to be kept in mind that women born in Palanpur stay there until marriage and that
married women in Palanpur who were interviewed and constitute the data I focus on, are women who were born in other
villages and joined their husbands’ homes in Palanpur.
8
Symptoms of unequal treatment of male and female children in Palanpur can be observed from the moment of birth.
When I was in the village on November 7th, 2009, we heard there had been a Jatab boy born this day because of a little
music band playing for the occasion; the neighbour woman admitted that they would not have hired it in case of the birth
of a girl. Even if more and more parents say in interviews that they do not make differences in educating girls and boys,
there are still inequalities of care, especially in case of illness.
A girl child's chances of receiving education are low even if they are now increasing. The problem still remains that after
completing 5th grade in Palanpur, she would have to go to the next village Akroli in order to continue education (3km
away, which means one hour walking) which is not always acceptable for the parents; in other villages without an own
primary school, it is even worse. When she does not go to school, the typical girl spends most of her time in domestic
work, games, and (if her parents cultivate) field work on family plots. Among the domestic tasks undertaken by female
children, taking care of younger siblings is the most common one. In Palanpur as elsewhere in Uttar Pradesh, women
marry relatively early.
Standard marriage practices include caste endogamy, village exogamy, hypergamy, and patrilocality. That is, normally a
young woman is married to a boy of the same caste, in another village, and preferably into a family of somewhat higher
status; after marriage, she leaves her parental village and is incorporated in her husband's family. In Palanpur, these
practices apply — with nuances — to all castes, and also among Muslims.
The final departure of a young bride to her husband's family usually takes place a few months after the marriage
ceremony. If the girl was married very young, it may also be some years after marriage, and be preceded by a ritual called
“gona”. It is more than a simple change of residence and literally marks the “transfer” of the young woman from one
family to another. After that, a woman is expected to make only short, occasional visits to her parents' village. In her
husband's village, she usually lives, at least to begin with, not only with her husband but also with some of her in‐laws —
most likely her parents‐in‐law but possibly also brothers‐in‐law and their nuclear families.
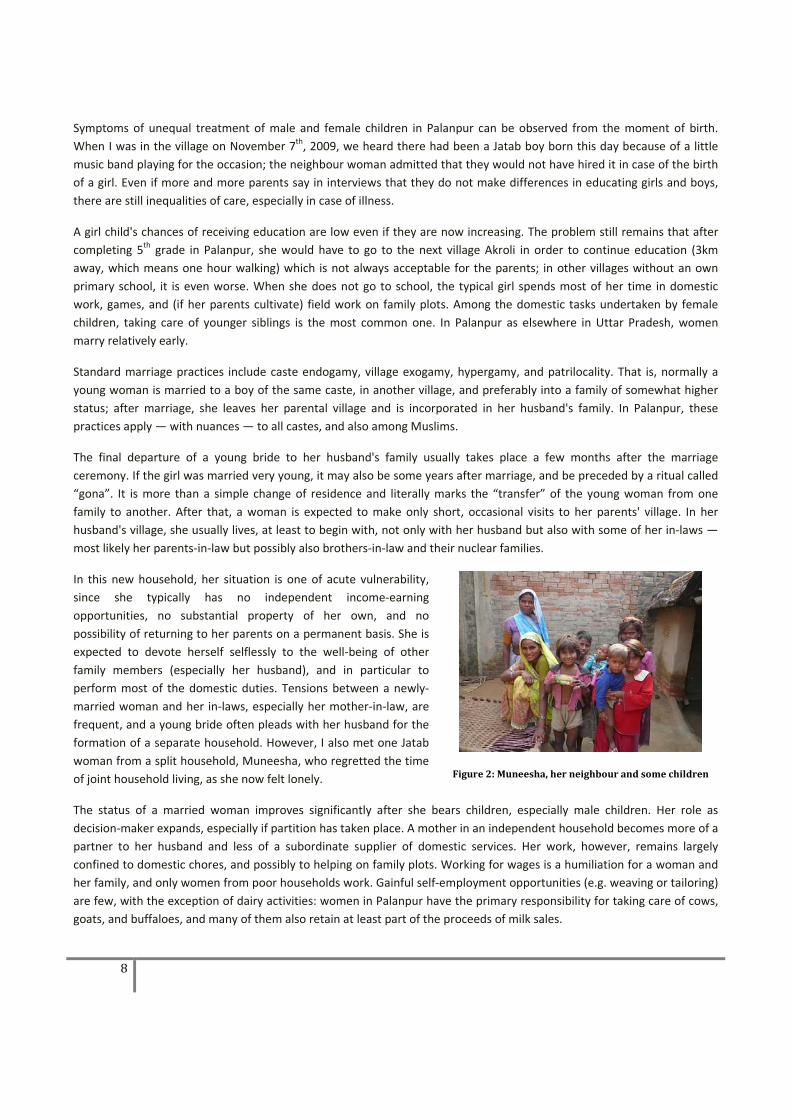
In this new household, her situation is one of acute vulnerability,
since she typically has no independent income‐earning
opportunities, no substantial property of her own, and no
possibility of returning to her parents on a permanent basis. She is
expected to devote herself selflessly to the well‐being of other
family members (especially her husband), and in particular to
perform most of the domestic duties. Tensions between a newly‐
married woman and her in‐laws, especially her mother‐in‐law, are
frequent, and a young bride often pleads with her husband for the
formation of a separate household. However, I also met one Jatab
woman from a split household, Muneesha, who regretted the time
of joint household living, as she now felt lonely.
Figure 2: Muneesha, her neighbour and some children
The status of a married woman improves significantly after she bears children, especially male children. Her role as
decision‐maker expands, especially if partition has taken place. A mother in an independent household becomes more of a
partner to her husband and less of a subordinate supplier of domestic services. Her work, however, remains largely
confined to domestic chores, and possibly to helping on family plots. Working for wages is a humiliation for a woman and
her family, and only women from poor households work. Gainful self‐employment opportunities (e.g. weaving or tailoring)
are few, with the exception of dairy activities: women in Palanpur have the primary responsibility for taking care of cows,
goats, and buffaloes, and many of them also retain at least part of the proceeds of milk sales.
9
While the child‐bearing period leads to some improvement in a woman's status and position within the family, it is also a
time of intense physical strain. Family planning practices are relatively limited in Palanpur, leading to high fertility rates
and short birth spacing. However, in particular wives of men who work in neighbour towns begin reporting that they use
contraception, even if the decision and purchase of it is always done by the men.
Repeated pregnancies take an enormous toll on women's general health, and put their lives at immediate risk at the time
of delivery. A delivery almost invariably takes place at home with the help of a local “dai” (midwife) with no formal
training, and it is only recently that awareness of the elementary hygiene of child delivery has become reasonably
widespread in the village. Women avoid going to the government hospital because they fear they will necessarily be
delivered there by caesarean (abdominal delivery), which is not true, and because of the lack of doctors, care and
available medicine there, which is unfortunately often true. One woman, the ASHA1, is paid to inform women of the village
during pregnancy and to take them to the hospital for delivery, but even if her salary is incentive‐based (600 Rs per
women taken to the hospital) the knowledge of it and the trust in her are mitigated in the village. Delivery in a private
hospital is rarely used at it costs 3000‐4000 Rs and even about 15000 in case of a caesarean (which will thus be carried out
more often than necessary), but there at least the medical staff takes care of the women most of the time.
The restricted possiblities in employment opportunities puts women in a situation of
overwhelming dependence on the earning capacity of adult men. In households with a
single adult male (a common pattern in Palanpur, particularly among the landless), a
spell of sickness or unemployment for the male earner can have disastrous
consequences, not to mention the aftermath of permanent disability or death.
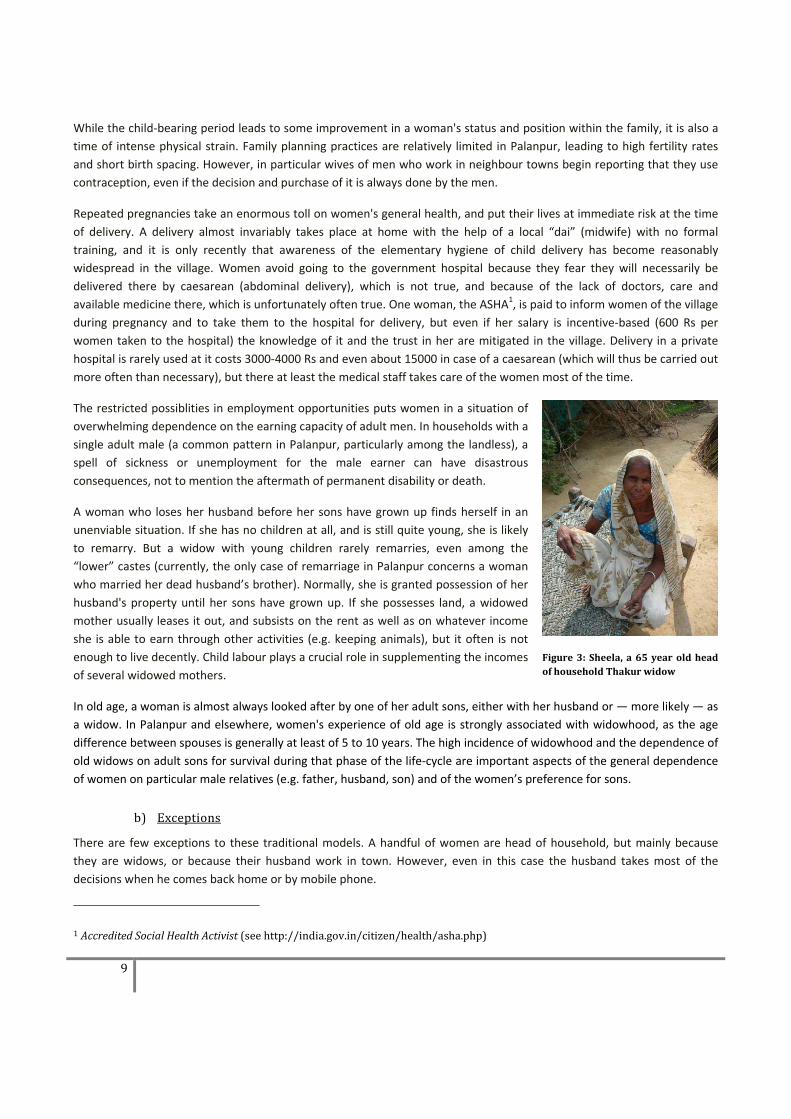
A woman who loses her husband before her sons have grown up finds herself in an
unenviable situation. If she has no children at all, and is still quite young, she is likely
to remarry. But a widow with young children rarely remarries, even among the
“lower” castes (currently, the only case of remarriage in Palanpur concerns a woman
who married her dead husband’s brother). Normally, she is granted possession of her
husband's property until her sons have grown up. If she possesses land, a widowed
mother usually leases it out, and subsists on the rent as well as on whatever income
she is able to earn through other activities (e.g. keeping animals), but it often is not
enough to live decently. Child labour plays a crucial role in supplementing the incomes
of several widowed mothers.
Figure 3: Sheela, a 65 year old head of household Thakur widow
In old age, a woman is almost always looked after by one of her adult sons, either with her husband or — more likely — as
a widow. In Palanpur and elsewhere, women's experience of old age is strongly associated with widowhood, as the age
difference between spouses is generally at least of 5 to 10 years. The high incidence of widowhood and the dependence of
old widows on adult sons for survival during that phase of the life‐cycle are important aspects of the general dependence
of women on particular male relatives (e.g. father, husband, son) and of the women’s preference for sons.
b) Exceptions
There are few exceptions to these traditional models. A handful of women are head of household, but mainly because
they are widows, or because their husband work in town. However, even in this case the husband takes most of the
decisions when he comes back home or by mobile phone.
1 Accredited Social Health Activist (see http://india.gov.in/citizen/health/asha.php)
10
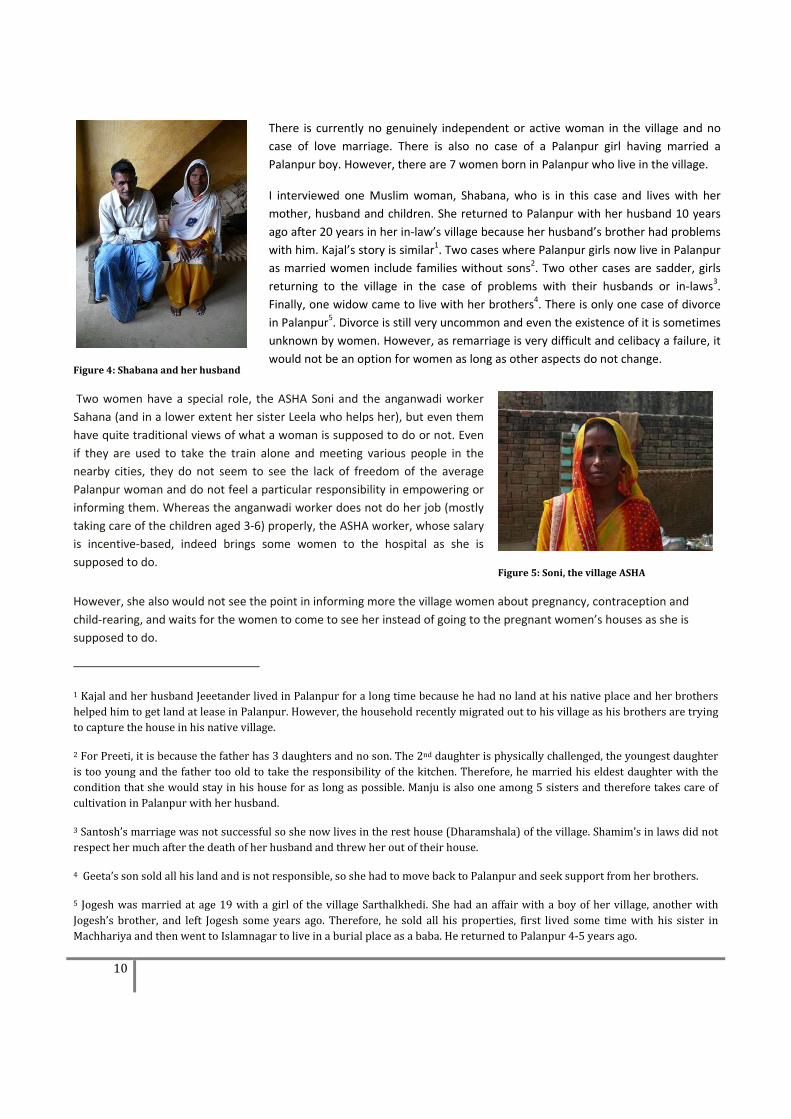
Figure 4: Shabana and her husband
There is currently no genuinely independent or active woman in the village and no
case of love marriage. There is also no case of a Palanpur girl having married a
Palanpur boy. However, there are 7 women born in Palanpur who live in the village.
I interviewed one Muslim woman, Shabana, who is in this case and lives with her
mother, husband and children. She returned to Palanpur with her husband 10 years
ago after 20 years in her in‐law’s village because her husband’s brother had problems
with him. Kajal’s story is similar1. Two cases where Palanpur girls now live in Palanpur
as married women include families without sons2. Two other cases are sadder, girls
returning to the village in the case of problems with their husbands or in‐laws3.
Finally, one widow came to live with her brothers4. There is only one case of divorce
in Palanpur5. Divorce is still very uncommon and even the existence of it is sometimes
unknown by women. However, as remarriage is very difficult and celibacy a failure, it
would not be an option for women as long as other aspects do not change.
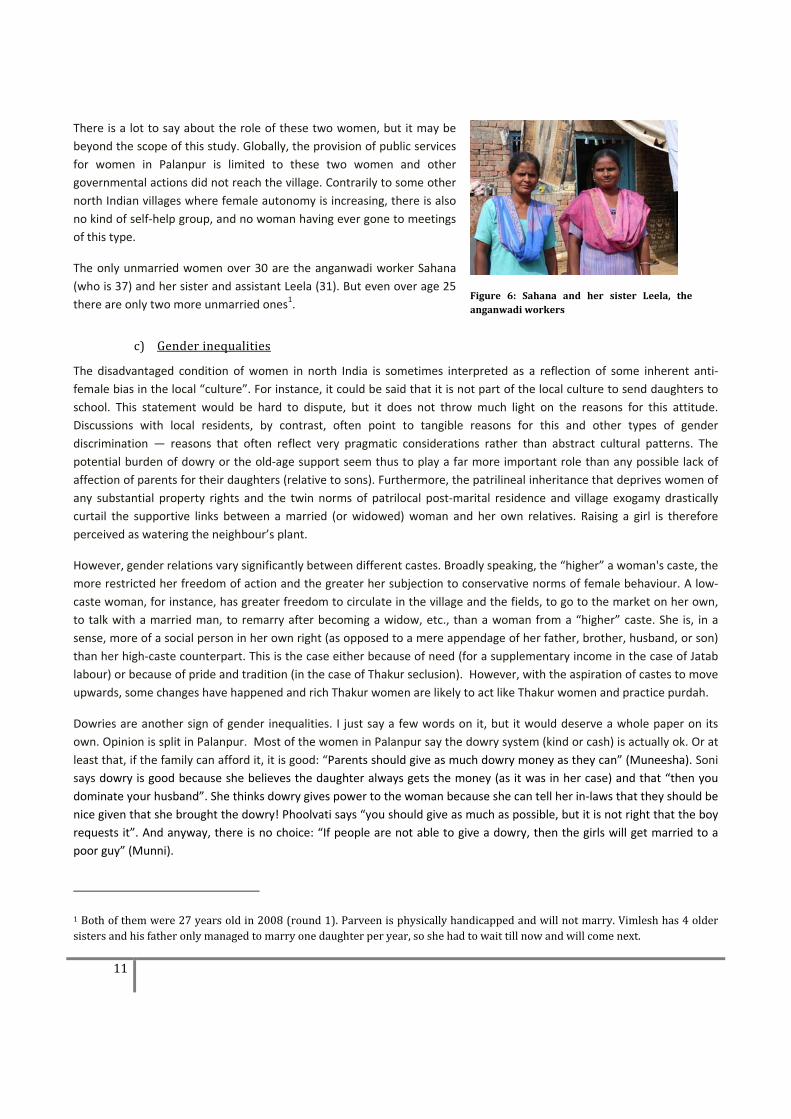
Two women have a special role, the ASHA Soni and the anganwadi worker
Sahana (and in a lower extent her sister Leela who helps her), but even them
have quite traditional views of what a woman is supposed to do or not. Even
if they are used to take the train alone and meeting various people in the
nearby cities, they do not seem to see the lack of freedom of the average
Palanpur woman and do not feel a particular responsibility in empowering or
informing them. Whereas the anganwadi worker does not do her job (mostly
taking care of the children aged 3‐6) properly, the ASHA worker, whose salary
is incentive‐based, indeed brings some women to the hospital as she is
supposed to do.
Figure 5: Soni, the village ASHA
However, she also would not see the point in informing more the village women about pregnancy, contraception and
child‐rearing, and waits for the women to come to see her instead of going to the pregnant women’s houses as she is
supposed to do.
1 Kajal and her husband Jeeetander lived in Palanpur for a long time because he had no land at his native place and her brothers helped him to get land at lease in Palanpur. However, the household recently migrated out to his village as his brothers are trying to capture the house in his native village.
2 For Preeti, it is because the father has 3 daughters and no son. The 2nd daughter is physically challenged, the youngest daughter is too young and the father too old to take the responsibility of the kitchen. Therefore, he married his eldest daughter with the condition that she would stay in his house for as long as possible. Manju is also one among 5 sisters and therefore takes care of cultivation in Palanpur with her husband.
3 Santosh’s marriage was not successful so she now lives in the rest house (Dharamshala) of the village. Shamim’s in laws did not respect her much after the death of her husband and threw her out of their house.
4 Geeta’s son sold all his land and is not responsible, so she had to move back to Palanpur and seek support from her brothers.
5 Jogesh was married at age 19 with a girl of the village Sarthalkhedi. She had an affair with a boy of her village, another with Jogesh’s brother, and left Jogesh some years ago. Therefore, he sold all his properties, first lived some time with his sister in Machhariya and then went to Islamnagar to live in a burial place as a baba. He returned to Palanpur 4‐5 years ago.
11
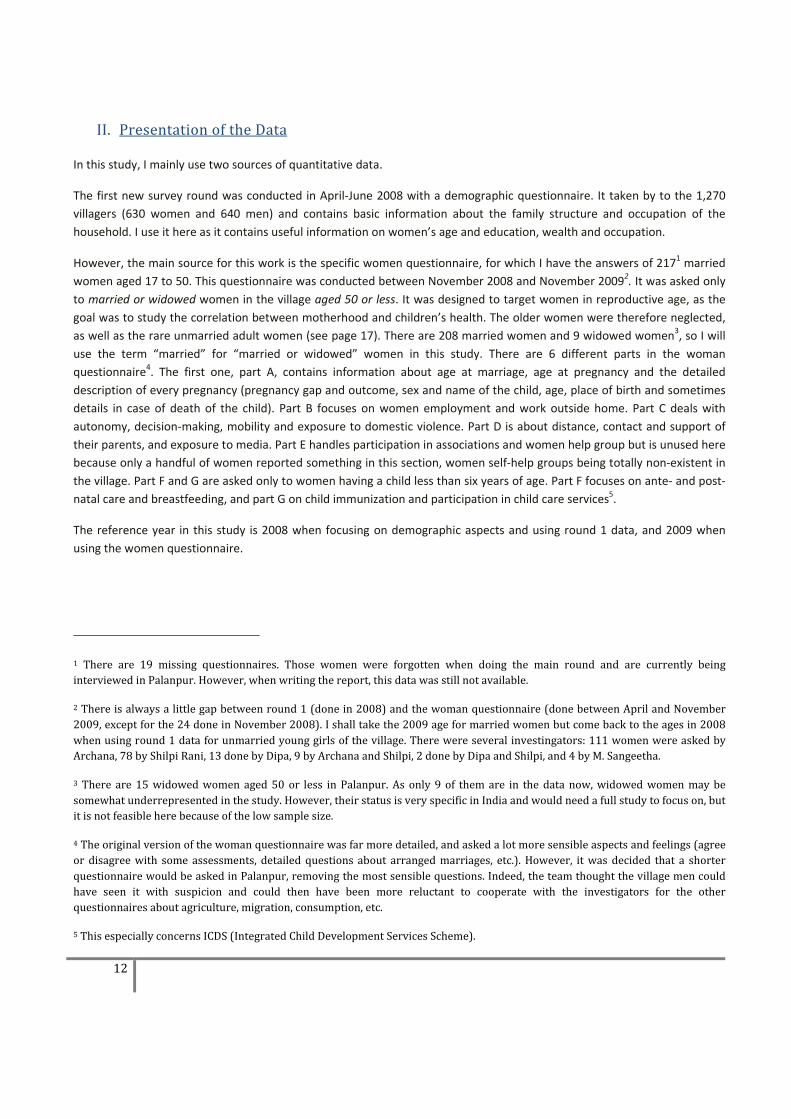
There is a lot to say about the role of these two women, but it may be
beyond the scope of this study. Globally, the provision of public services
for women in Palanpur is limited to these two women and other
governmental actions did not reach the village. Contrarily to some other
north Indian villages where female autonomy is increasing, there is also
no kind of self‐help group, and no woman having ever gone to meetings
of this type.
The only unmarried women over 30 are the anganwadi worker Sahana
(who is 37) and her sister and assistant Leela (31). But even over age 25
there are only two more unmarried ones1.
Figure 6: Sahana and her sister Leela, the anganwadi workers
c) Gender inequalities
The disadvantaged condition of women in north India is sometimes interpreted as a reflection of some inherent anti‐
female bias in the local “culture”. For instance, it could be said that it is not part of the local culture to send daughters to
school. This statement would be hard to dispute, but it does not throw much light on the reasons for this attitude.
Discussions with local residents, by contrast, often point to tangible reasons for this and other types of gender
discrimination — reasons that often reflect very pragmatic considerations rather than abstract cultural patterns. The
potential burden of dowry or the old‐age support seem thus to play a far more important role than any possible lack of
affection of parents for their daughters (relative to sons). Furthermore, the patrilineal inheritance that deprives women of
any substantial property rights and the twin norms of patrilocal post‐marital residence and village exogamy drastically
curtail the supportive links between a married (or widowed) woman and her own relatives. Raising a girl is therefore
perceived as watering the neighbour’s plant.
However, gender relations vary significantly between different castes. Broadly speaking, the “higher” a woman's caste, the
more restricted her freedom of action and the greater her subjection to conservative norms of female behaviour. A low‐
caste woman, for instance, has greater freedom to circulate in the village and the fields, to go to the market on her own,
to talk with a married man, to remarry after becoming a widow, etc., than a woman from a “higher” caste. She is, in a
sense, more of a social person in her own right (as opposed to a mere appendage of her father, brother, husband, or son)
than her high‐caste counterpart. This is the case either because of need (for a supplementary income in the case of Jatab
labour) or because of pride and tradition (in the case of Thakur seclusion). However, with the aspiration of castes to move
upwards, some changes have happened and rich Thakur women are likely to act like Thakur women and practice purdah.
Dowries are another sign of gender inequalities. I just say a few words on it, but it would deserve a whole paper on its
own. Opinion is split in Palanpur. Most of the women in Palanpur say the dowry system (kind or cash) is actually ok. Or at
least that, if the family can afford it, it is good: “Parents should give as much dowry money as they can” (Muneesha). Soni
says dowry is good because she believes the daughter always gets the money (as it was in her case) and that “then you
dominate your husband”. She thinks dowry gives power to the woman because she can tell her in‐laws that they should be
nice given that she brought the dowry! Phoolvati says “you should give as much as possible, but it is not right that the boy
requests it”. And anyway, there is no choice: “If people are not able to give a dowry, then the girls will get married to a
poor guy” (Munni).
1 Both of them were 27 years old in 2008 (round 1). Parveen is physically handicapped and will not marry. Vimlesh has 4 older sisters and his father only managed to marry one daughter per year, so she had to wait till now and will come next.
12
II. Presentation of the Data
In this study, I mainly use two sources of quantitative data.
The first new survey round was conducted in April‐June 2008 with a demographic questionnaire. It taken by to the 1,270
villagers (630 women and 640 men) and contains basic information about the family structure and occupation of the
household. I use it here as it contains useful information on women’s age and education, wealth and occupation.
However, the main source for this work is the specific women questionnaire, for which I have the answers of 2171 married
women aged 17 to 50. This questionnaire was conducted between November 2008 and November 20092. It was asked only
to married or widowed women in the village aged 50 or less. It was designed to target women in reproductive age, as the
goal was to study the correlation between motherhood and children’s health. The older women were therefore neglected,
as well as the rare unmarried adult women (see page 17). There are 208 married women and 9 widowed women3, so I will
use the term “married” for “married or widowed” women in this study. There are 6 different parts in the woman
questionnaire4. The first one, part A, contains information about age at marriage, age at pregnancy and the detailed
description of every pregnancy (pregnancy gap and outcome, sex and name of the child, age, place of birth and sometimes
details in case of death of the child). Part B focuses on women employment and work outside home. Part C deals with
autonomy, decision‐making, mobility and exposure to domestic violence. Part D is about distance, contact and support of
their parents, and exposure to media. Part E handles participation in associations and women help group but is unused here
because only a handful of women reported something in this section, women self‐help groups being totally non‐existent in
the village. Part F and G are asked only to women having a child less than six years of age. Part F focuses on ante‐ and post‐
natal care and breastfeeding, and part G on child immunization and participation in child care services5.
The reference year in this study is 2008 when focusing on demographic aspects and using round 1 data, and 2009 when
using the women questionnaire.
1 There are 19 missing questionnaires. Those women were forgotten when doing the main round and are currently being interviewed in Palanpur. However, when writing the report, this data was still not available.
2 There is always a little gap between round 1 (done in 2008) and the woman questionnaire (done between April and November 2009, except for the 24 done in November 2008). I shall take the 2009 age for married women but come back to the ages in 2008 when using round 1 data for unmarried young girls of the village. There were several investingators: 111 women were asked by Archana, 78 by Shilpi Rani, 13 done by Dipa, 9 by Archana and Shilpi, 2 done by Dipa and Shilpi, and 4 by M. Sangeetha.
3 There are 15 widowed women aged 50 or less in Palanpur. As only 9 of them are in the data now, widowed women may be somewhat underrepresented in the study. However, their status is very specific in India and would need a full study to focus on, but it is not feasible here because of the low sample size.
4 The original version of the woman questionnaire was far more detailed, and asked a lot more sensible aspects and feelings (agree or disagree with some assessments, detailed questions about arranged marriages, etc.). However, it was decided that a shorter questionnaire would be asked in Palanpur, removing the most sensible questions. Indeed, the team thought the village men could have seen it with suspicion and could then have been more reluctant to cooperate with the investigators for the other questionnaires about agriculture, migration, consumption, etc.
5 This especially concerns ICDS (Integrated Child Development Services Scheme).
13
III. Women in Palanpur: general situation with quantitative data
After this general introduction about the life of a woman in western Uttar Pradesh, we shall give some quantitative facts
about what life is for a woman in Palanpur. The data used afterwards contains only married women and it is thus important
to look in detail at the marital characteristics of this population. I want to study the autonomy of women nowadays and in
Palanpur, in order to focus in the next part on explanatory factors for differences within the village. When it is possible, I
will compare their current status with their status before, using 1993 data1, or with other places, taking NFHS data for
either rural India or Uttar Pradesh.
1) Some demographic facts
One generally important aspect of women discrimination is the gender bias. In some parts of India, especially Uttar
Pradesh, the male to female ratio shows significant inequalities, explained by female infanticide or less care given to girls
during early childhood. However, the demographic survey round made in Palanpur in 2008 shows that 47% of children aged
0‐4 are boys and 53% are girls (for the same age group in 1993 there were 57% of boys and 43% of girls). A reason could be
that contrarily to other places in India, Palanpur women have very little access (or just do not use it) to pre‐natal check‐ups,
and hence cannot practice gender‐biased abortion. But the relative neglect of girls in their early childhood is supported by
some interviews and by the investigators’ observation that in case of illness, parents rather go to the doctor for a boy.
Looking at NFHS 3 data, rural India seems to be much more gender biased than urban India. It shows that 21.3% of married
women with 2 living daughters do not want more children, compared to 66.5% of those who have one son and 1 daughter
and 71.4% of those who have two sons. Even if mothers may enjoy having girls, it is not enough. This bias also does exist in
towns, but is lower there as the percentages are 51.9% (two girls) compared to 84.2% (one son and one daughter) and
78.3% (two sons).
In the case of Palanpur, Watine (2008) calculates that in both 1983 and 2008, the number of boys in the nuclear family has
a more negative impact than the number of girls on the “additional child decision”: on average, having one supplementary
son reduces of 0.569 (2008 data) and 0.414 (1983 data) the probability of having a supplementary child, whereas this figure
is only 0.392 (2008) and 0,301 (1983) for one girl. Furthermore, he shows that 220 out of 268 females born between 1993
and 2008 survived (which means 82.1%), whereas it was the case for 214 over 244 men (87.7%).
Looking at the results from the first part of the women questionnaire2, there are 912 reported pregnancies. 433 are/were
boys and 423 girls, the remaining 56 missing values being mostly miscarriages and abortions. The percentage of the live
births3 that are currently alive is globally 80.5% but 82.5% for boys and 78.4% for girls. Added to the miscarriages, still births
or abortions that may be girl‐biased, this may show pre‐natal and ante‐natal gender discriminations in Palanpur.
1 However, as I mentioned before, there is few quantitative data available from previous rounds.
2 This section contains detailed information about every pregnancy (pregnancy gap and outcome, sex and name of the child, age, place of birth and sometimes details in case of death of the child), the pregnancy outcome being live birth, still birth, miscarriage, abortion and currently pregnant. This was made for all married or widowed women aged 17 to 49 who were asked, and naturally contains adult children.
3 In the other cases, the sex is often not reported. There are only 10 male and 5 female still birth, 1 female miscarriage and 1 female abortion reported. In the 71 other cases where the pregnancy outcome was not live birth, no sex was reported. Therefore I work rather with the life birth for the gender questions, even if having known the sex of the aborted children would have been even more interesting.
14
2) Education of women in Palanpur
Even if education is not absolutely vital for village women as they do not have many
possibilities to work outside (see page 17), it is a major determinant for autonomy
and bargaining power vis‐a‐vis their husband. I will therefore present the education
first of married women and then of unmarried girls in Palanpur.
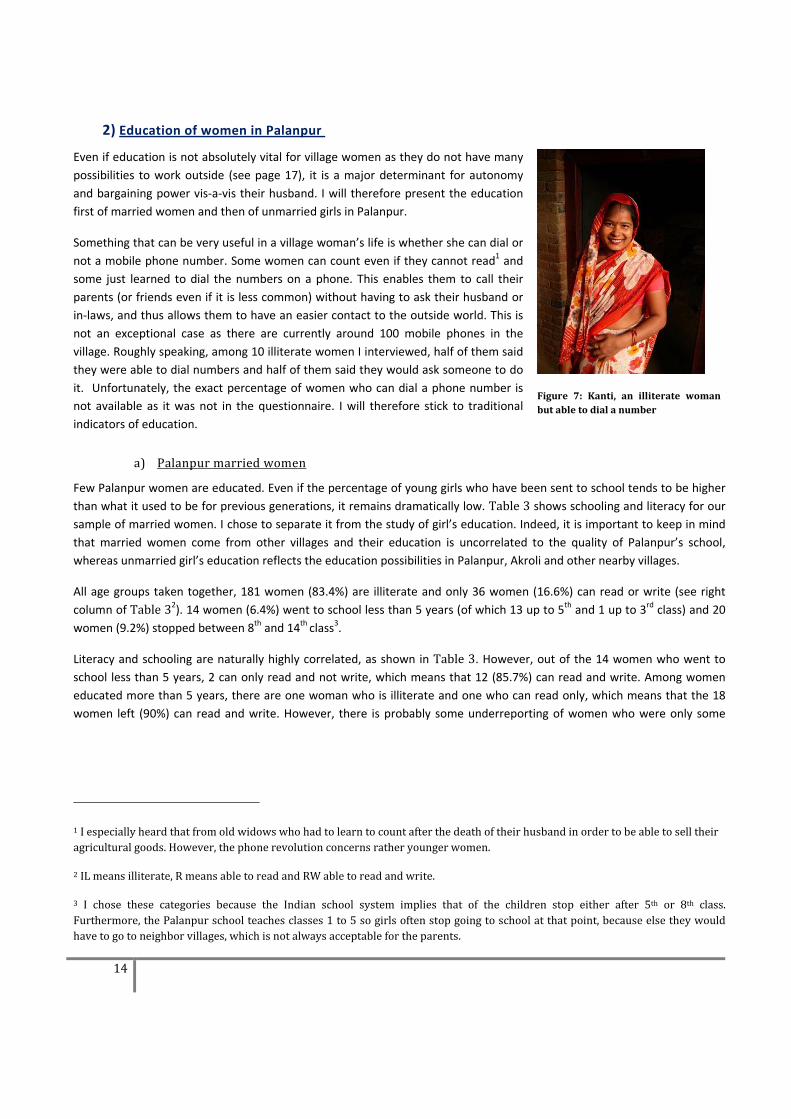
Something that can be very useful in a village woman’s life is whether she can dial or
not a mobile phone number. Some women can count even if they cannot read1 and
some just learned to dial the numbers on a phone. This enables them to call their
parents (or friends even if it is less common) without having to ask their husband or
in‐laws, and thus allows them to have an easier contact to the outside world. This is
not an exceptional case as there are currently around 100 mobile phones in the
village. Roughly speaking, among 10 illiterate women I interviewed, half of them said
they were able to dial numbers and half of them said they would ask someone to do
it. Unfortunately, the exact percentage of women who can dial a phone number is
not available as it was not in the questionnaire. I will therefore stick to traditional
indicators of education.
Figure 7: Kanti, an illiterate woman but able to dial a number
a) Palanpur married women
Few Palanpur women are educated. Even if the percentage of young girls who have been sent to school tends to be higher
than what it used to be for previous generations, it remains dramatically low. Table 3 shows schooling and literacy for our sample of married women. I chose to separate it from the study of girl’s education. Indeed, it is important to keep in mind
that married women come from other villages and their education is uncorrelated to the quality of Palanpur’s school,
whereas unmarried girl’s education reflects the education possibilities in Palanpur, Akroli and other nearby villages.
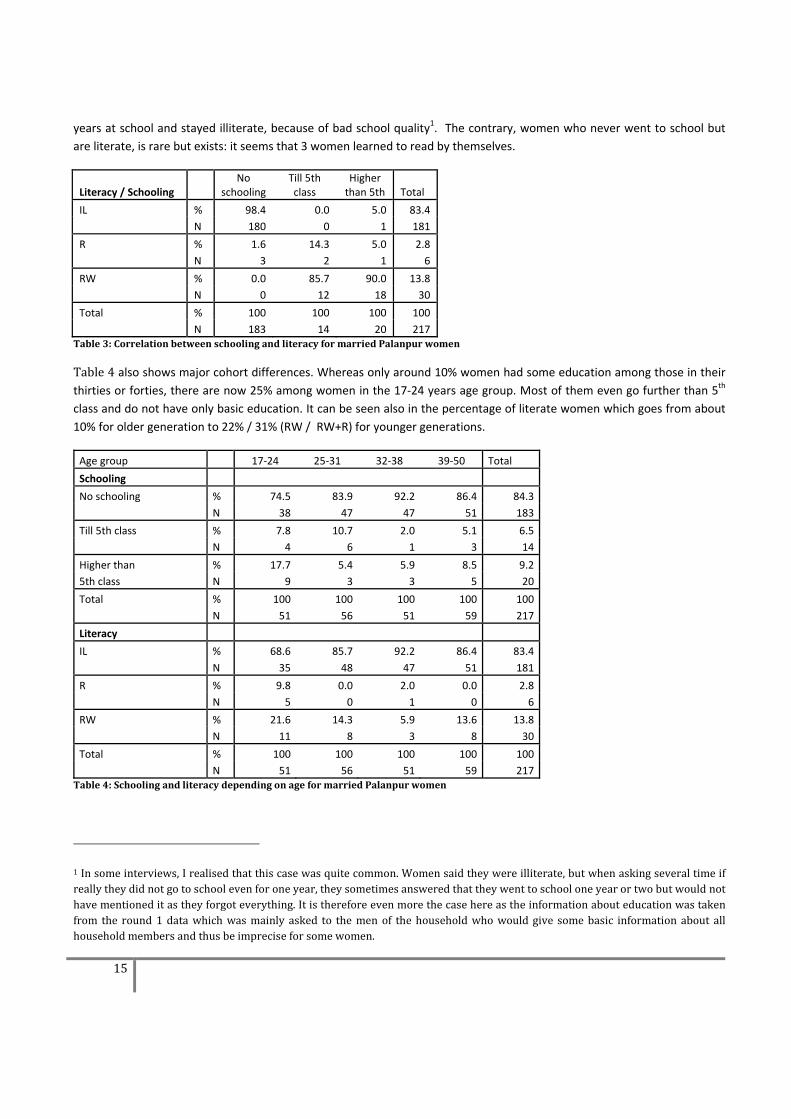
All age groups taken together, 181 women (83.4%) are illiterate and only 36 women (16.6%) can read or write (see right
column of Table 32). 14 women (6.4%) went to school less than 5 years (of which 13 up to 5th and 1 up to 3rd class) and 20
women (9.2%) stopped between 8th and 14th class3.
Literacy and schooling are naturally highly correlated, as shown in Table 3. However, out of the 14 women who went to
school less than 5 years, 2 can only read and not write, which means that 12 (85.7%) can read and write. Among women
educated more than 5 years, there are one woman who is illiterate and one who can read only, which means that the 18
women left (90%) can read and write. However, there is probably some underreporting of women who were only some
1 I especially heard that from old widows who had to learn to count after the death of their husband in order to be able to sell their agricultural goods. However, the phone revolution concerns rather younger women.
2 IL means illiterate, R means able to read and RW able to read and write.
3 I chose these categories because the Indian school system implies that of the children stop either after 5th or 8th class. Furthermore, the Palanpur school teaches classes 1 to 5 so girls often stop going to school at that point, because else they would have to go to neighbor villages, which is not always acceptable for the parents.
15
years at school and stayed illiterate, because of bad school quality1. The contrary, women who never went to school but
are literate, is rare but exists: it seems that 3 women learned to read by themselves.
Literacy / Schooling No
schooling Till 5th class
Higher than 5th Total
IL % 98.4 0.0 5.0 83.4
N 180 0 1 181
R % 1.6 14.3 5.0 2.8
N 3 2 1 6
RW % 0.0 85.7 90.0 13.8
N 0 12 18 30
Total % 100 100 100 100
N 183 14 20 217Table 3: Correlation between schooling and literacy for married Palanpur women
Table 4 also shows major cohort differences. Whereas only around 10% women had some education among those in their
thirties or forties, there are now 25% among women in the 17‐24 years age group. Most of them even go further than 5th
class and do not have only basic education. It can be seen also in the percentage of literate women which goes from about
10% for older generation to 22% / 31% (RW / RW+R) for younger generations.
Age group 17‐24 25‐31 32‐38 39‐50 Total
Schooling
No schooling % 74.5 83.9 92.2 86.4 84.3
N 38 47 47 51 183
Till 5th class % 7.8 10.7 2.0 5.1 6.5
N 4 6 1 3 14
Higher than % 17.7 5.4 5.9 8.5 9.2
5th class N 9 3 3 5 20
Total % 100 100 100 100 100
N 51 56 51 59 217
Literacy
IL % 68.6 85.7 92.2 86.4 83.4
N 35 48 47 51 181
R % 9.8 0.0 2.0 0.0 2.8
N 5 0 1 0 6
RW % 21.6 14.3 5.9 13.6 13.8
N 11 8 3 8 30
Total % 100 100 100 100 100
N 51 56 51 59 217Table 4: Schooling and literacy depending on age for married Palanpur women
1 In some interviews, I realised that this case was quite common. Women said they were illiterate, but when asking several time if really they did not go to school even for one year, they sometimes answered that they went to school one year or two but would not have mentioned it as they forgot everything. It is therefore even more the case here as the information about education was taken from the round 1 data which was mainly asked to the men of the household who would give some basic information about all household members and thus be imprecise for some women.
16
There are naturally differences among castes. Thakurs represent 65% of educated women whereas they only account for
30% of the total population of the sample. All the other castes are under‐represented, Muraos also ranking quite bad. Some
other castes traditionally rank higher in terms of education but the small sample size does not allow here to be conclusive.
9 out of the 14 women educated till class 5th and 13 out of the 20 educated more are Thakur, and the recent trend of
sending girls more to school could in that way be restricted only to Thakur girls.
The positive aspect about education is thus that there seems to be some changes, when looking at women of different age
groups. We have seen the changes for women coming from different villages, and in Palanpur itself this process is even
faster as the school in Akroli attracts more and more children and in particular girls.
b) Palanpur unmarried girls
Defining a sample is not easy. If one takes into account children that are too young, the percentage of those who go to
higher education is not relevant. Studying girls aged more than 17 starts to become critical because some of them may have
migrated out for marriage and some girls aged 18 in the village are married women. I chose to take boys and girls aged 14
to 17 included. The higher number of boys in the sample may indicate that some girls already migrated out, but all the girls
aged up to 17 in Palanpur are unmarried so there is no bias coming from a woman from outside1. As we study basic and not
higher education, the lower threshold of 14 is also acceptable, corresponding to the gap of the end of the 8th class where
most of the girls drop out of school2.
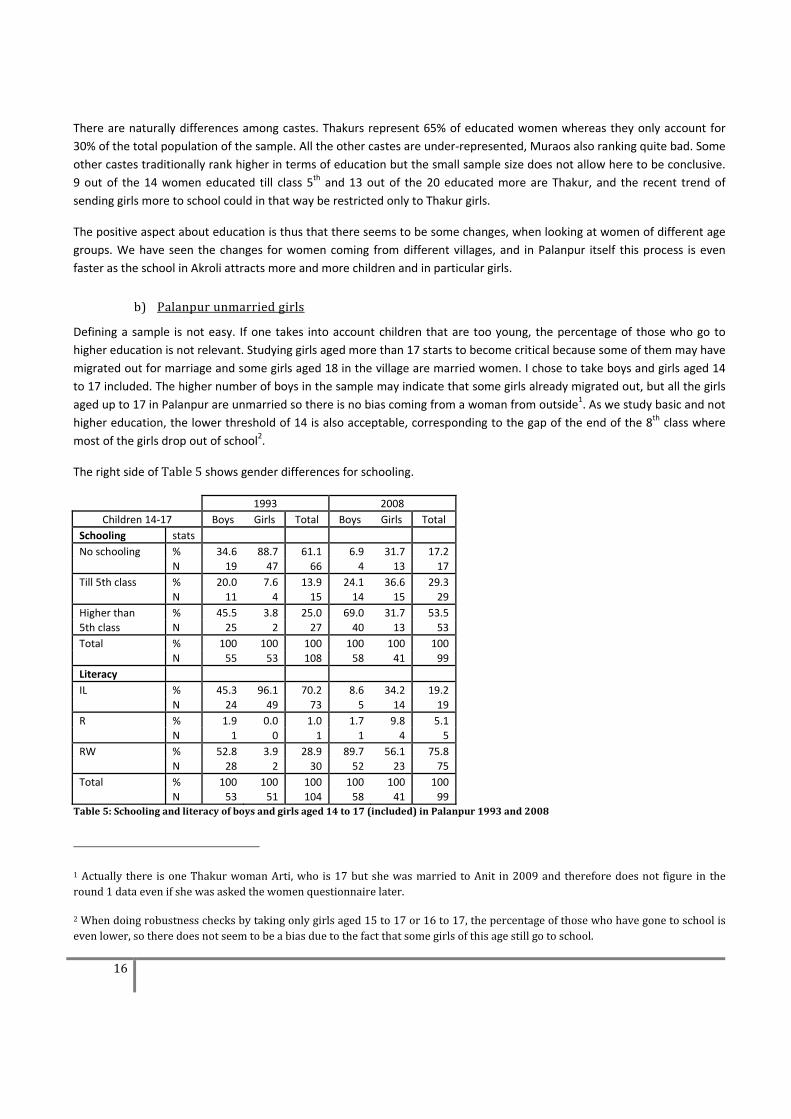
The right side of Table 5 shows gender differences for schooling.
1993 2008
Children 14‐17 Boys Girls Total Boys Girls Total
Schooling stats
No schooling % 34.6 88.7 61.1 6.9 31.7 17.2
N 19 47 66 4 13 17
Till 5th class % 20.0 7.6 13.9 24.1 36.6 29.3
N 11 4 15 14 15 29
Higher than % 45.5 3.8 25.0 69.0 31.7 53.5
5th class N 25 2 27 40 13 53
Total % 100 100 100 100 100 100
N 55 53 108 58 41 99
Literacy
IL % 45.3 96.1 70.2 8.6 34.2 19.2
N 24 49 73 5 14 19
R % 1.9 0.0 1.0 1.7 9.8 5.1
N 1 0 1 1 4 5
RW % 52.8 3.9 28.9 89.7 56.1 75.8
N 28 2 30 52 23 75
Total % 100 100 100 100 100 100
N 53 51 104 58 41 99 Table 5: Schooling and literacy of boys and girls aged 14 to 17 (included) in Palanpur 1993 and 2008
1 Actually there is one Thakur woman Arti, who is 17 but she was married to Anit in 2009 and therefore does not figure in the round 1 data even if she was asked the women questionnaire later.
2 When doing robustness checks by taking only girls aged 15 to 17 or 16 to 17, the percentage of those who have gone to school is even lower, so there does not seem to be a bias due to the fact that some girls of this age still go to school.
17
There are still 34% illiterate girls compared to 9% illiterate boys, and 32% of girls have an education higher than 5th class
compared to 69% of boys. However, even if girls are worse off than boys, they are better off than women used to be.
Compared to the 83% illiterate among all married women, or even the 69% among married women aged 17‐24, the 34%
illiterate girls do not seem so many anymore.
One could say that this discrepancy is due to difference in school opportunities between villages, and not to a temporal
change within Palanpur. This may be part of the explanation as Palanpur, having its own primary school and a secondary
school 3km away is not the worse off village. However, qualitative data and values for 1993 confirm that there was indeed a
change within the village over time.
Table 5 thus also shows the comparison between these two survey years. We see a dramatic increase in the percentage of
children who have gone to school, especially for girls. The percentage of those who have never gone to school went down
from 89% to 32% in 15 years, and the percentage of illiterate girls from 96% to 34%. Even if there are still improvements to
do, this huge change may have impacts on the autonomy of women.
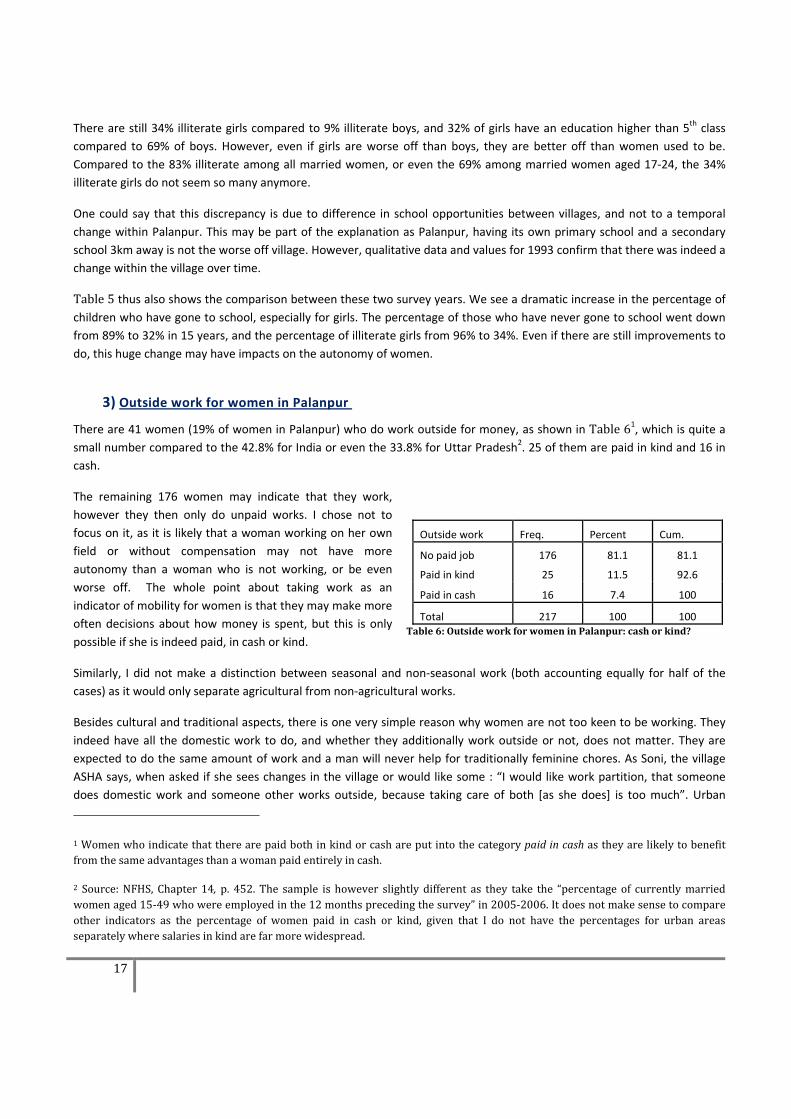
3) Outside work for women in Palanpur
There are 41 women (19% of women in Palanpur) who do work outside for money, as shown in Table 61, which is quite a small number compared to the 42.8% for India or even the 33.8% for Uttar Pradesh2. 25 of them are paid in kind and 16 in
cash.
The remaining 176 women may indicate that they work,
however they then only do unpaid works. I chose not to
focus on it, as it is likely that a woman working on her own
field or without compensation may not have more
autonomy than a woman who is not working, or be even
worse off. The whole point about taking work as an
indicator of mobility for women is that they may make more
often decisions about how money is spent, but this is only
possible if she is indeed paid, in cash or kind.
Outside work Freq. Percent Cum.
No paid job 176 81.1 81.1
Paid in kind 25 11.5 92.6
Paid in cash 16 7.4 100
Total 217 100 100 Table 6: Outside work for women in Palanpur: cash or kind?
Similarly, I did not make a distinction between seasonal and non‐seasonal work (both accounting equally for half of the
cases) as it would only separate agricultural from non‐agricultural works.
Besides cultural and traditional aspects, there is one very simple reason why women are not too keen to be working. They
indeed have all the domestic work to do, and whether they additionally work outside or not, does not matter. They are
expected to do the same amount of work and a man will never help for traditionally feminine chores. As Soni, the village
ASHA says, when asked if she sees changes in the village or would like some : “I would like work partition, that someone
does domestic work and someone other works outside, because taking care of both [as she does] is too much”. Urban
1 Women who indicate that there are paid both in kind or cash are put into the category paid in cash as they are likely to benefit from the same advantages than a woman paid entirely in cash.
2 Source: NFHS, Chapter 14, p. 452. The sample is however slightly different as they take the “percentage of currently married women aged 15‐49 who were employed in the 12 months preceding the survey” in 2005‐2006. It does not make sense to compare other indicators as the percentage of women paid in cash or kind, given that I do not have the percentages for urban areas separately where salaries in kind are far more widespread.
18
Indian women have found the solution, employing maids. This does not exist in Palanpur even if it exists in other villages,
maybe because there are no very big landowners who could afford it.
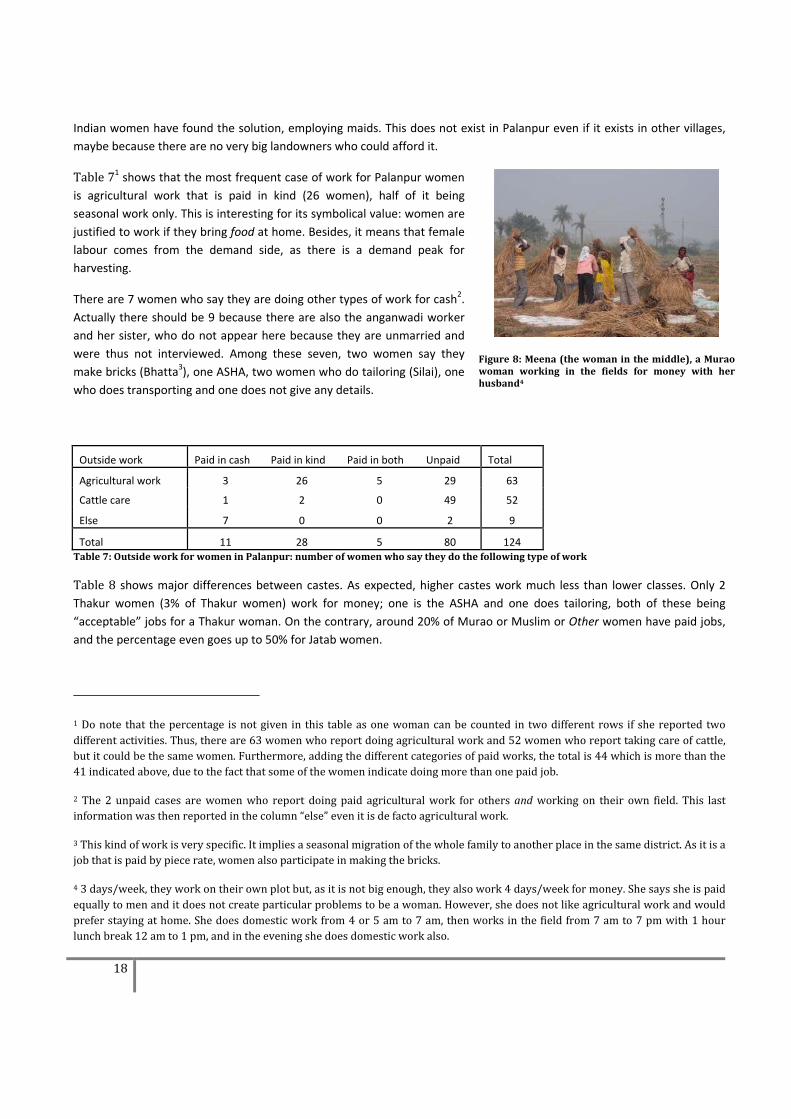
Table 71 shows that the most frequent case of work for Palanpur women
is agricultural work that is paid in kind (26 women), half of it being
seasonal work only. This is interesting for its symbolical value: women are
justified to work if they bring food at home. Besides, it means that female
labour comes from the demand side, as there is a demand peak for
harvesting.
There are 7 women who say they are doing other types of work for cash2.
Actually there should be 9 because there are also the anganwadi worker
and her sister, who do not appear here because they are unmarried and
were thus not interviewed. Among these seven, two women say they
make bricks (Bhatta3), one ASHA, two women who do tailoring (Silai), one
who does transporting and one does not give any details.
Figure 8: Meena (the woman in the middle), a Murao woman working in the fields for money with her husband4
Outside work Paid in cash Paid in kind Paid in both Unpaid Total
Agricultural work 3 26 5 29 63
Cattle care 1 2 0 49 52
Else 7 0 0 2 9
Total 11 28 5 80 124 Table 7: Outside work for women in Palanpur: number of women who say they do the following type of work
Table 8 shows major differences between castes. As expected, higher castes work much less than lower classes. Only 2
Thakur women (3% of Thakur women) work for money; one is the ASHA and one does tailoring, both of these being
“acceptable” jobs for a Thakur woman. On the contrary, around 20% of Murao or Muslim or Other women have paid jobs,
and the percentage even goes up to 50% for Jatab women.
1 Do note that the percentage is not given in this table as one woman can be counted in two different rows if she reported two different activities. Thus, there are 63 women who report doing agricultural work and 52 women who report taking care of cattle, but it could be the same women. Furthermore, adding the different categories of paid works, the total is 44 which is more than the 41 indicated above, due to the fact that some of the women indicate doing more than one paid job.
2 The 2 unpaid cases are women who report doing paid agricultural work for others and working on their own field. This last information was then reported in the column “else” even it is de facto agricultural work.
3 This kind of work is very specific. It implies a seasonal migration of the whole family to another place in the same district. As it is a job that is paid by piece rate, women also participate in making the bricks.
4 3 days/week, they work on their own plot but, as it is not big enough, they also work 4 days/week for money. She says she is paid equally to men and it does not create particular problems to be a woman. However, she does not like agricultural work and would prefer staying at home. She does domestic work from 4 or 5 am to 7 am, then works in the field from 7 am to 7 pm with 1 hour lunch break 12 am to 1 pm, and in the evening she does domestic work also.
19
Outside work stats No paid job Paid in kind Paid in cash Total
By caste
Thakur % 96.88 0 3.13 100
N 62 0 2 64
Murao % 80.39 11.76 7.84 100
N 41 6 4 51
Jatab % 50 33.33 16.67 100
N 15 10 5 30
Muslims % 84.38 9.38 6.25 100
(Dhobi,Teli) N 27 3 2 32
Others % 77.5 15 7.5 100
N 31 6 3 40
By age group
17‐24 % 92.16 5.88 1.96 100
N 47 3 1 51
25‐31 % 76.79 17.86 5.36 100
N 43 10 3 56
32‐38 % 72.55 15.69 11.76 100
N 37 8 6 51
39‐50 % 83.05 6.78 10.17 100
N 49 4 6 59
Total % 81.11 11.52 7.37 100
N 176 25 16 217 Table 8: Outside work for Palanpur women by caste and age group
Age is less an explanation for outside work. Except for newly married women who rarely work (only 8%, of which 3 Jatab
and one Dhimar women), the activity rate is around 17‐27% and does not depend linearly on the age of women. Younger
women are more often paid in kind and older women in cash, but the sample may not be big enough to be conclusive.
4) Marriage and fertility
a) Changes between 1993 and 2008
Age at marriage is a major issue concerning women autonomy. As described earlier, all Palanpur women are married at
their parent’s choice. However, the earlier it happens, the less they will have a say in their in‐law’s place at the beginning.
There is nevertheless a slow change, as girls used to be married around 13 or 15 earlier, and it rather tends to be around 17
or 18 nowadays. It is naturally true that a lot of factors influence the moment a daughter gets married (dowry, number of
siblings and rank, network, etc.). Thus, a late marriage can also just mean that the parents were too poor to marry their
daughters all at once and needed time to collect the money for the youngest one, and not a specific women empowerment
strategy. But even then, one could argue that her later marriage – even if undesired – may give her more bargaining power
and autonomy as she is not a teenager anymore.
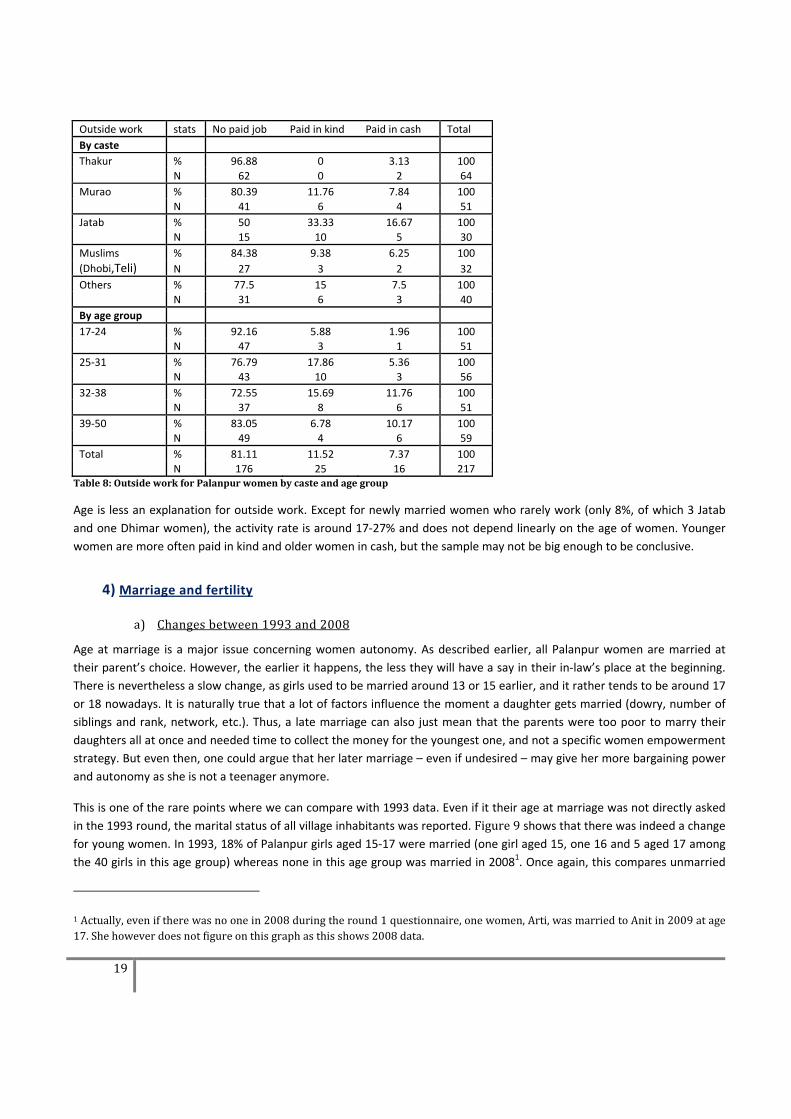
This is one of the rare points where we can compare with 1993 data. Even if it their age at marriage was not directly asked
in the 1993 round, the marital status of all village inhabitants was reported. Figure 9 shows that there was indeed a change for young women. In 1993, 18% of Palanpur girls aged 15‐17 were married (one girl aged 15, one 16 and 5 aged 17 among
the 40 girls in this age group) whereas none in this age group was married in 20081. Once again, this compares unmarried
1 Actually, even if there was no one in 2008 during the round 1 questionnaire, one women, Arti, was married to Anit in 2009 at age 17. She however does not figure on this graph as this shows 2008 data.
20
girls in Palanpur (as it would be difficult to know precisely at what age they were married and left the village1) to newly
married women who came to Palanpur.
It could mean that parents in Palanpur like
their boys to marry young girls and send their
own daugthers later, but qualitative data
suggest there is no difference about age at
marriage in Palanpur and in the villages
around. In the 18‐20 and 21‐23 age groups, it
is even more the case. 71% of girls aged 18 to
20 were married in 1993 compared to 45% in
2008, and 81% of girls aged 21 to 23,
compared to 62% in 2008. Around age 24,
more or less all girls are married, Palanpur
girls have left the village for their in‐laws’
houses and the only women left of this age
group in the village are more or less recently
married women. Figure 9: Marital status of women in Palanpur by age group, 1993 and 2008
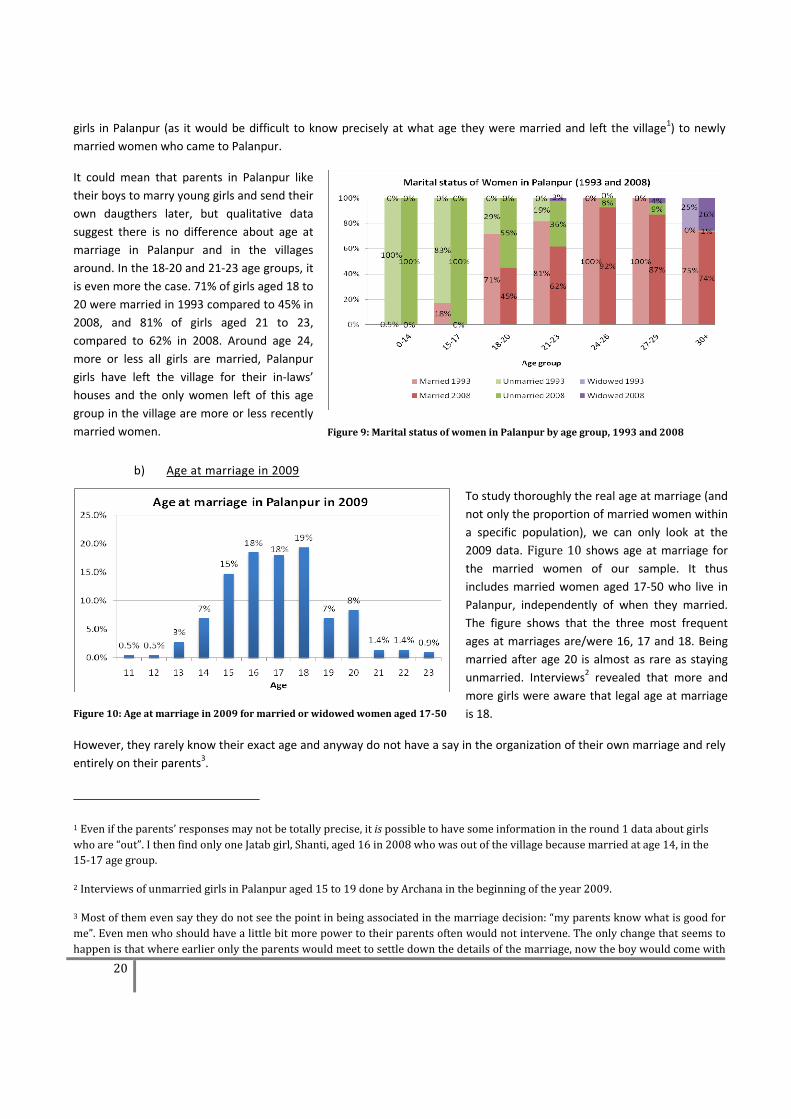
b) Age at marriage in 2009
Figure 10: Age at marriage in 2009 for married or widowed women aged 1750
To study thoroughly the real age at marriage (and
not only the proportion of married women within
a specific population), we can only look at the
2009 data. Figure 10 shows age at marriage for
the married women of our sample. It thus
includes married women aged 17‐50 who live in
Palanpur, independently of when they married.
The figure shows that the three most frequent
ages at marriages are/were 16, 17 and 18. Being
married after age 20 is almost as rare as staying
unmarried. Interviews2 revealed that more and
more girls were aware that legal age at marriage
is 18.
However, they rarely know their exact age and anyway do not have a say in the organization of their own marriage and rely
entirely on their parents3.
1 Even if the parents’ responses may not be totally precise, it is possible to have some information in the round 1 data about girls who are “out”. I then find only one Jatab girl, Shanti, aged 16 in 2008 who was out of the village because married at age 14, in the 15‐17 age group.
2 Interviews of unmarried girls in Palanpur aged 15 to 19 done by Archana in the beginning of the year 2009.
3 Most of them even say they do not see the point in being associated in the marriage decision: “my parents know what is good for me”. Even men who should have a little bit more power to their parents often would not intervene. The only change that seems to happen is that where earlier only the parents would meet to settle down the details of the marriage, now the boy would come with
21
Table 9 shows differences between age groups. As expected after the comparison with the 1993 data, women in the older generations
married earlier. There is around 1.6 years difference in age at marriage
for 30 years age difference, so we can roughly say that every decade,
women marry half a year later1. Where the usual age at marriage was
roughly 16 three decades ago, it is now approximately 18. It is also
interesting to note that, whereas the average age at marriage is around
17, none of the girls aged 17 (or less) today, is married.
Age at marriage in 2009
age group Mean Std. Dev. Freq.
17‐24 17.78 1.79 51
25‐31 17.41 1.89 56
32‐38 16.35 2.26 51
39‐50 16.17 1.88 59
Total 16.91 2.06 217 Table 9: Age at marriage for married women in Palanpur in 2009, by age group
It is nonsense if one thinks that if those girls had been married, they would not live in Palanpur anymore. However,
statistically speaking there should be as many women leaving Palanpur for marriage than young women coming from other
villages who married a man in Palanpur. And the point is that none of them are aged less than 17, which can be seen as an
improvement in women’s condition even if it is rather a proof of a change in other villages than in Palanpur itself.
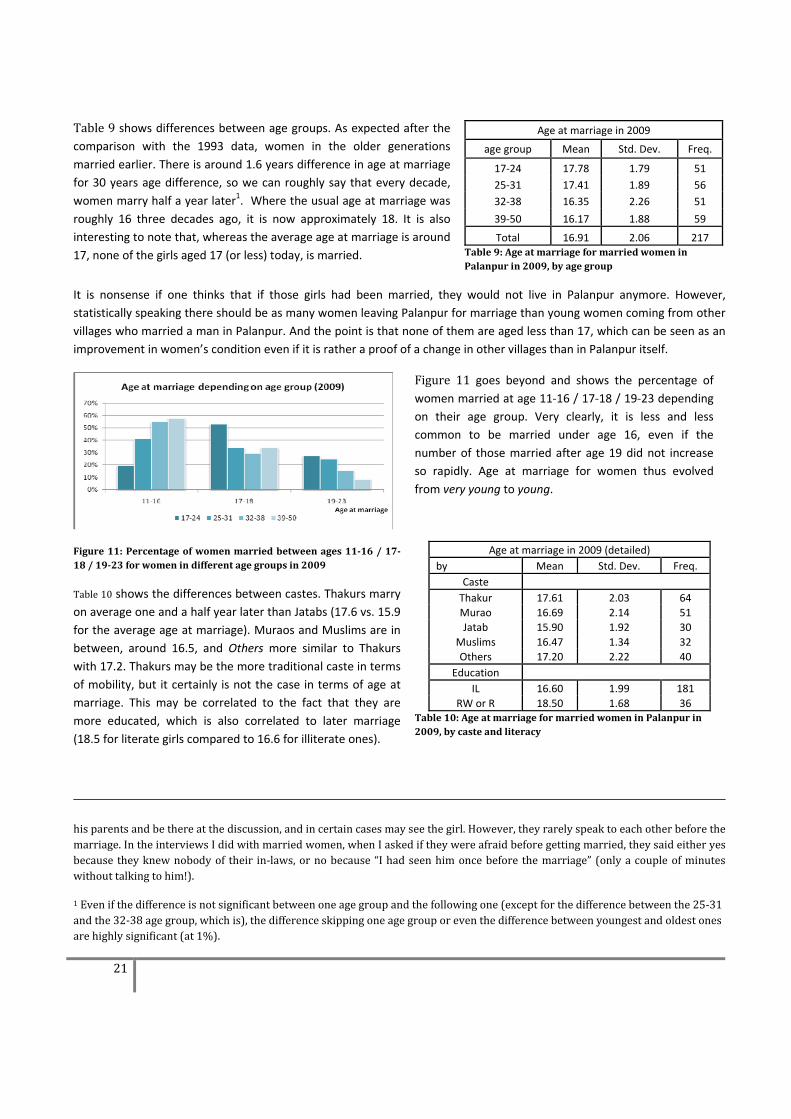
Figure 11: Percentage of women married between ages 1116 / 1718 / 1923 for women in different age groups in 2009
Figure 11 goes beyond and shows the percentage of
women married at age 11‐16 / 17‐18 / 19‐23 depending
on their age group. Very clearly, it is less and less
common to be married under age 16, even if the
number of those married after age 19 did not increase
so rapidly. Age at marriage for women thus evolved
from very young to young.
Age at marriage in 2009 (detailed)
by Mean Std. Dev. Freq.
Caste
Thakur 17.61 2.03 64
Murao 16.69 2.14 51
Jatab 15.90 1.92 30
Muslims 16.47 1.34 32
Others 17.20 2.22 40
Education
IL 16.60 1.99 181
RW or R 18.50 1.68 36 Table 10: Age at marriage for married women in Palanpur in 2009, by caste and literacy
Table 10 shows the differences between castes. Thakurs marry
on average one and a half year later than Jatabs (17.6 vs. 15.9
for the average age at marriage). Muraos and Muslims are in
between, around 16.5, and Others more similar to Thakurs
with 17.2. Thakurs may be the more traditional caste in terms
of mobility, but it certainly is not the case in terms of age at
marriage. This may be correlated to the fact that they are
more educated, which is also correlated to later marriage
(18.5 for literate girls compared to 16.6 for illiterate ones).
his parents and be there at the discussion, and in certain cases may see the girl. However, they rarely speak to each other before the marriage. In the interviews I did with married women, when I asked if they were afraid before getting married, they said either yes because they knew nobody of their in‐laws, or no because “I had seen him once before the marriage” (only a couple of minutes without talking to him!).
1 Even if the difference is not significant between one age group and the following one (except for the difference between the 25‐31 and the 32‐38 age group, which is), the difference skipping one age group or even the difference between youngest and oldest ones are highly significant (at 1%).
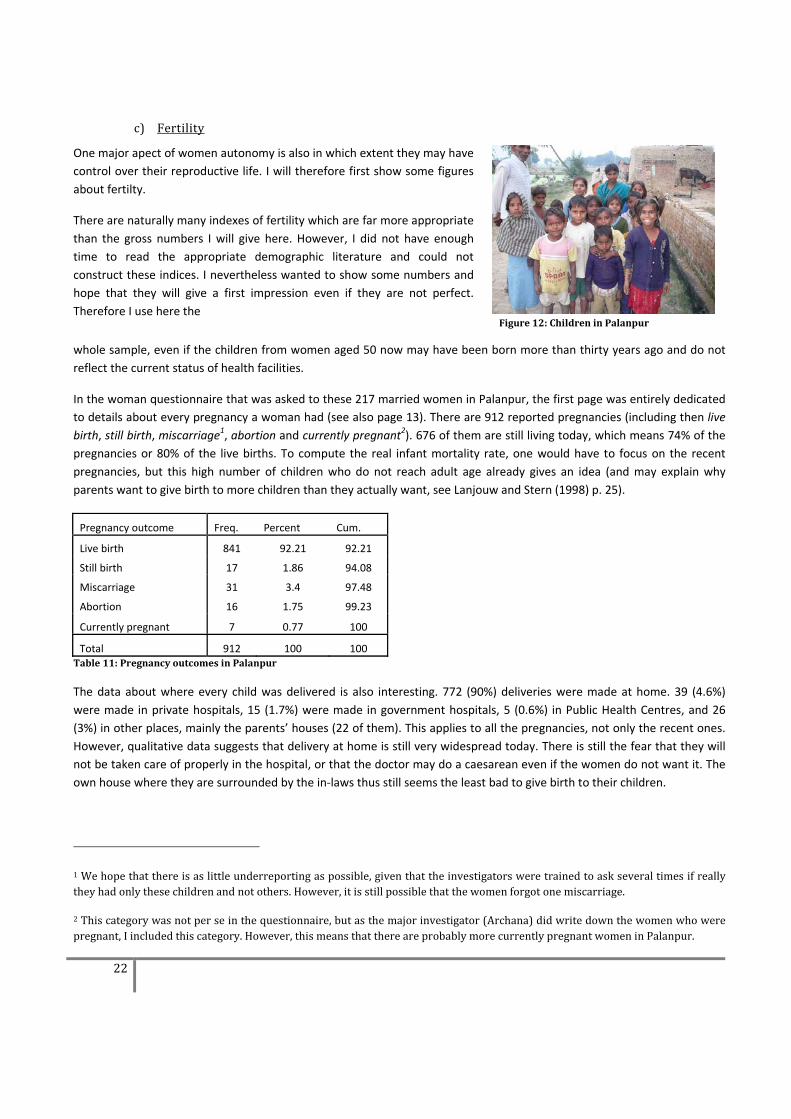
22
c) Fertility
One major apect of women autonomy is also in which extent they may have
control over their reproductive life. I will therefore first show some figures
about fertilty.
There are naturally many indexes of fertility which are far more appropriate
than the gross numbers I will give here. However, I did not have enough
time to read the appropriate demographic literature and could not
construct these indices. I nevertheless wanted to show some numbers and
hope that they will give a first impression even if they are not perfect.
Therefore I use here the Figure 12: Children in Palanpur
whole sample, even if the children from women aged 50 now may have been born more than thirty years ago and do not
reflect the current status of health facilities.
In the woman questionnaire that was asked to these 217 married women in Palanpur, the first page was entirely dedicated
to details about every pregnancy a woman had (see also page 13). There are 912 reported pregnancies (including then live
birth, still birth, miscarriage1, abortion and currently pregnant2). 676 of them are still living today, which means 74% of the
pregnancies or 80% of the live births. To compute the real infant mortality rate, one would have to focus on the recent
pregnancies, but this high number of children who do not reach adult age already gives an idea (and may explain why
parents want to give birth to more children than they actually want, see Lanjouw and Stern (1998) p. 25).
Pregnancy outcome Freq. Percent Cum.
Live birth 841 92.21 92.21
Still birth 17 1.86 94.08
Miscarriage 31 3.4 97.48
Abortion 16 1.75 99.23
Currently pregnant 7 0.77 100
Total 912 100 100 Table 11: Pregnancy outcomes in Palanpur
The data about where every child was delivered is also interesting. 772 (90%) deliveries were made at home. 39 (4.6%)
were made in private hospitals, 15 (1.7%) were made in government hospitals, 5 (0.6%) in Public Health Centres, and 26
(3%) in other places, mainly the parents’ houses (22 of them). This applies to all the pregnancies, not only the recent ones.
However, qualitative data suggests that delivery at home is still very widespread today. There is still the fear that they will
not be taken care of properly in the hospital, or that the doctor may do a caesarean even if the women do not want it. The
own house where they are surrounded by the in‐laws thus still seems the least bad to give birth to their children.
1 We hope that there is as little underreporting as possible, given that the investigators were trained to ask several times if really they had only these children and not others. However, it is still possible that the women forgot one miscarriage.
2 This category was not per se in the questionnaire, but as the major investigator (Archana) did write down the women who were pregnant, I included this category. However, this means that there are probably more currently pregnant women in Palanpur.
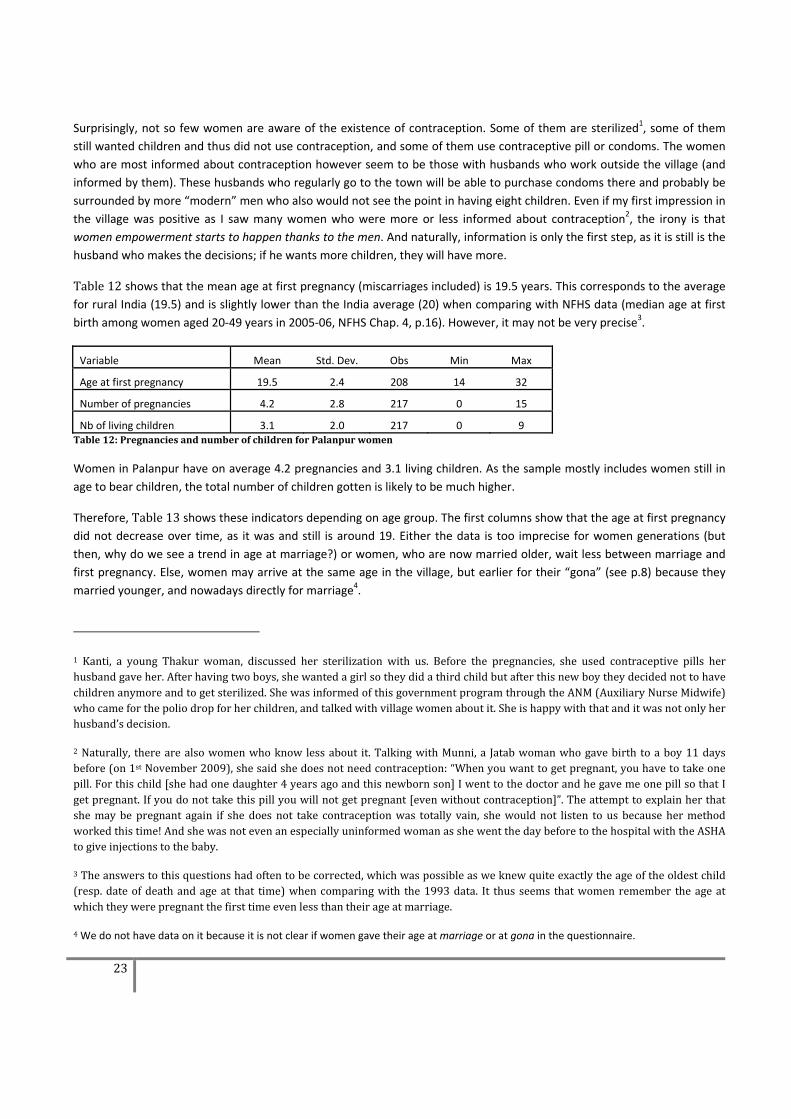
23
Surprisingly, not so few women are aware of the existence of contraception. Some of them are sterilized1, some of them
still wanted children and thus did not use contraception, and some of them use contraceptive pill or condoms. The women
who are most informed about contraception however seem to be those with husbands who work outside the village (and
informed by them). These husbands who regularly go to the town will be able to purchase condoms there and probably be
surrounded by more “modern” men who also would not see the point in having eight children. Even if my first impression in
the village was positive as I saw many women who were more or less informed about contraception2, the irony is that
women empowerment starts to happen thanks to the men. And naturally, information is only the first step, as it is still is the
husband who makes the decisions; if he wants more children, they will have more.
Table 12 shows that the mean age at first pregnancy (miscarriages included) is 19.5 years. This corresponds to the average
for rural India (19.5) and is slightly lower than the India average (20) when comparing with NFHS data (median age at first
birth among women aged 20‐49 years in 2005‐06, NFHS Chap. 4, p.16). However, it may not be very precise3.
Variable Mean Std. Dev. Obs Min Max
Age at first pregnancy 19.5 2.4 208 14 32
Number of pregnancies 4.2 2.8 217 0 15
Nb of living children 3.1 2.0 217 0 9 Table 12: Pregnancies and number of children for Palanpur women
Women in Palanpur have on average 4.2 pregnancies and 3.1 living children. As the sample mostly includes women still in
age to bear children, the total number of children gotten is likely to be much higher.
Therefore, Table 13 shows these indicators depending on age group. The first columns show that the age at first pregnancy
did not decrease over time, as it was and still is around 19. Either the data is too imprecise for women generations (but
then, why do we see a trend in age at marriage?) or women, who are now married older, wait less between marriage and
first pregnancy. Else, women may arrive at the same age in the village, but earlier for their “gona” (see p.8) because they
married younger, and nowadays directly for marriage4.
1 Kanti, a young Thakur woman, discussed her sterilization with us. Before the pregnancies, she used contraceptive pills her husband gave her. After having two boys, she wanted a girl so they did a third child but after this new boy they decided not to have children anymore and to get sterilized. She was informed of this government program through the ANM (Auxiliary Nurse Midwife) who came for the polio drop for her children, and talked with village women about it. She is happy with that and it was not only her husband’s decision.
2 Naturally, there are also women who know less about it. Talking with Munni, a Jatab woman who gave birth to a boy 11 days before (on 1st November 2009), she said she does not need contraception: “When you want to get pregnant, you have to take one pill. For this child [she had one daughter 4 years ago and this newborn son] I went to the doctor and he gave me one pill so that I get pregnant. If you do not take this pill you will not get pregnant [even without contraception]”. The attempt to explain her that she may be pregnant again if she does not take contraception was totally vain, she would not listen to us because her method worked this time! And she was not even an especially uninformed woman as she went the day before to the hospital with the ASHA to give injections to the baby.
3 The answers to this questions had often to be corrected, which was possible as we knew quite exactly the age of the oldest child (resp. date of death and age at that time) when comparing with the 1993 data. It thus seems that women remember the age at which they were pregnant the first time even less than their age at marriage.
4 We do not have data on it because it is not clear if women gave their age at marriage or at gona in the questionnaire.
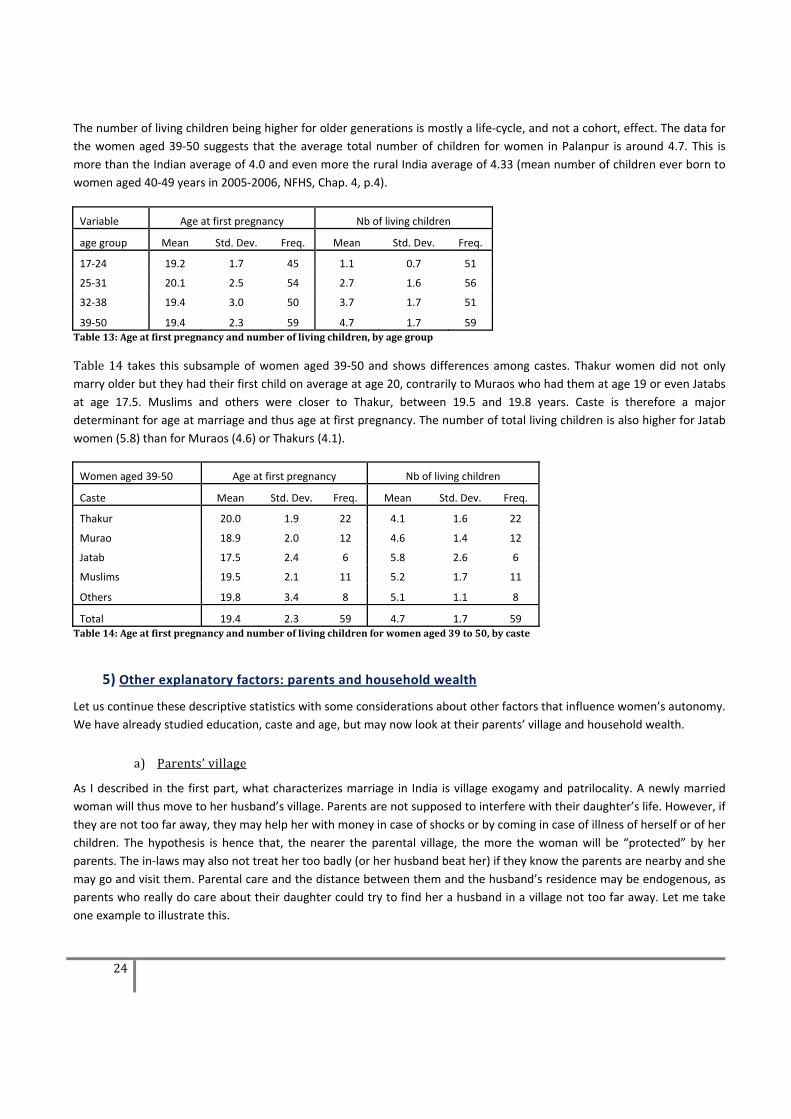
24
The number of living children being higher for older generations is mostly a life‐cycle, and not a cohort, effect. The data for
the women aged 39‐50 suggests that the average total number of children for women in Palanpur is around 4.7. This is
more than the Indian average of 4.0 and even more the rural India average of 4.33 (mean number of children ever born to
women aged 40‐49 years in 2005‐2006, NFHS, Chap. 4, p.4).
Variable Age at first pregnancy Nb of living children
age group Mean Std. Dev. Freq. Mean Std. Dev. Freq.
17‐24 19.2 1.7 45 1.1 0.7 51
25‐31 20.1 2.5 54 2.7 1.6 56
32‐38 19.4 3.0 50 3.7 1.7 51
39‐50 19.4 2.3 59 4.7 1.7 59 Table 13: Age at first pregnancy and number of living children, by age group
Table 14 takes this subsample of women aged 39‐50 and shows differences among castes. Thakur women did not only
marry older but they had their first child on average at age 20, contrarily to Muraos who had them at age 19 or even Jatabs
at age 17.5. Muslims and others were closer to Thakur, between 19.5 and 19.8 years. Caste is therefore a major
determinant for age at marriage and thus age at first pregnancy. The number of total living children is also higher for Jatab
women (5.8) than for Muraos (4.6) or Thakurs (4.1).
Women aged 39‐50 Age at first pregnancy Nb of living children
Caste Mean Std. Dev. Freq. Mean Std. Dev. Freq.
Thakur 20.0 1.9 22 4.1 1.6 22
Murao 18.9 2.0 12 4.6 1.4 12
Jatab 17.5 2.4 6 5.8 2.6 6
Muslims 19.5 2.1 11 5.2 1.7 11
Others 19.8 3.4 8 5.1 1.1 8
Total 19.4 2.3 59 4.7 1.7 59 Table 14: Age at first pregnancy and number of living children for women aged 39 to 50, by caste
5) Other explanatory factors: parents and household wealth
Let us continue these descriptive statistics with some considerations about other factors that influence women’s autonomy.
We have already studied education, caste and age, but may now look at their parents’ village and household wealth.
a) Parents’ village
As I described in the first part, what characterizes marriage in India is village exogamy and patrilocality. A newly married
woman will thus move to her husband’s village. Parents are not supposed to interfere with their daughter’s life. However, if
they are not too far away, they may help her with money in case of shocks or by coming in case of illness of herself or of her
children. The hypothesis is hence that, the nearer the parental village, the more the woman will be “protected” by her
parents. The in‐laws may also not treat her too badly (or her husband beat her) if they know the parents are nearby and she
may go and visit them. Parental care and the distance between them and the husband’s residence may be endogenous, as
parents who really do care about their daughter could try to find her a husband in a village not too far away. Let me take
one example to illustrate this.
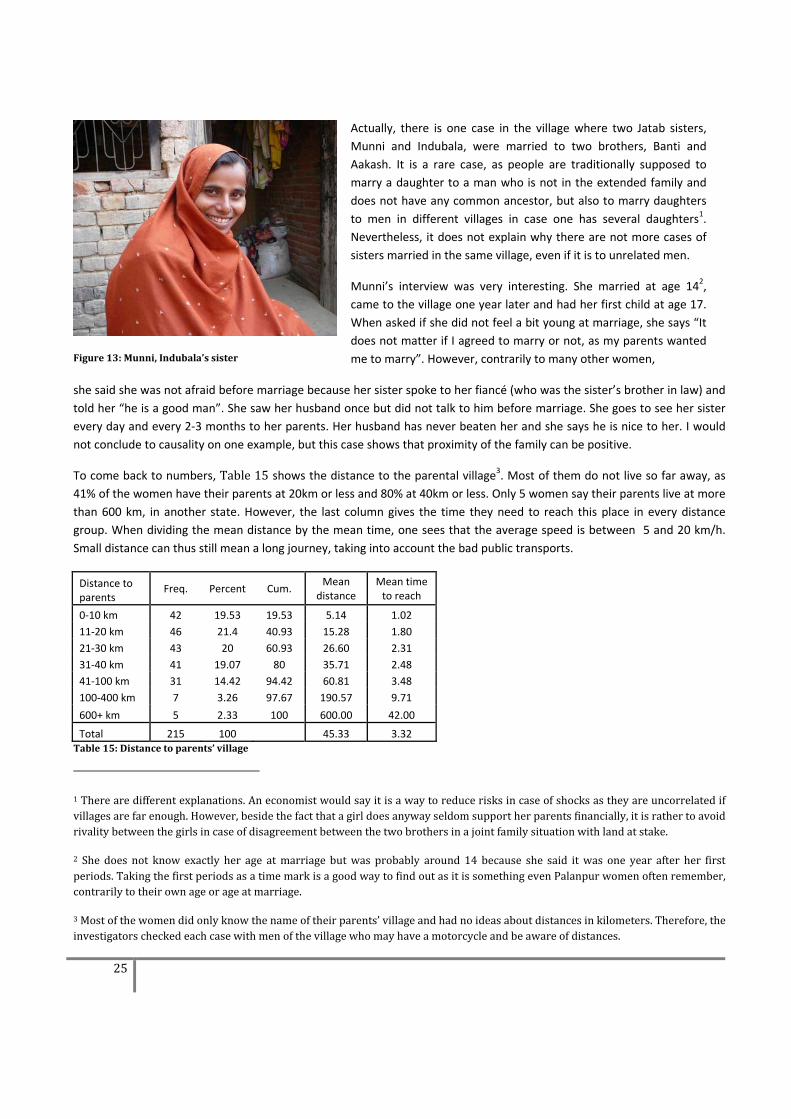
25
Figure 13: Munni, Indubala’s sister
Actually, there is one case in the village where two Jatab sisters,
Munni and Indubala, were married to two brothers, Banti and
Aakash. It is a rare case, as people are traditionally supposed to
marry a daughter to a man who is not in the extended family and
does not have any common ancestor, but also to marry daughters
to men in different villages in case one has several daughters1.
Nevertheless, it does not explain why there are not more cases of
sisters married in the same village, even if it is to unrelated men.
Munni’s interview was very interesting. She married at age 142,
came to the village one year later and had her first child at age 17.
When asked if she did not feel a bit young at marriage, she says “It
does not matter if I agreed to marry or not, as my parents wanted
me to marry”. However, contrarily to many other women,
she said she was not afraid before marriage because her sister spoke to her fiancé (who was the sister’s brother in law) and
told her “he is a good man”. She saw her husband once but did not talk to him before marriage. She goes to see her sister
every day and every 2‐3 months to her parents. Her husband has never beaten her and she says he is nice to her. I would
not conclude to causality on one example, but this case shows that proximity of the family can be positive.
To come back to numbers, Table 15 shows the distance to the parental village3. Most of them do not live so far away, as
41% of the women have their parents at 20km or less and 80% at 40km or less. Only 5 women say their parents live at more
than 600 km, in another state. However, the last column gives the time they need to reach this place in every distance
group. When dividing the mean distance by the mean time, one sees that the average speed is between 5 and 20 km/h.
Small distance can thus still mean a long journey, taking into account the bad public transports.
Distance to parents
Freq. Percent Cum. Mean
distance Mean time to reach
0‐10 km 42 19.53 19.53 5.14 1.02
11‐20 km 46 21.4 40.93 15.28 1.80
21‐30 km 43 20 60.93 26.60 2.31
31‐40 km 41 19.07 80 35.71 2.48
41‐100 km 31 14.42 94.42 60.81 3.48
100‐400 km 7 3.26 97.67 190.57 9.71
600+ km 5 2.33 100 600.00 42.00
Total 215 100 45.33 3.32 Table 15: Distance to parents’ village
1 There are different explanations. An economist would say it is a way to reduce risks in case of shocks as they are uncorrelated if villages are far enough. However, beside the fact that a girl does anyway seldom support her parents financially, it is rather to avoid rivality between the girls in case of disagreement between the two brothers in a joint family situation with land at stake.
2 She does not know exactly her age at marriage but was probably around 14 because she said it was one year after her first periods. Taking the first periods as a time mark is a good way to find out as it is something even Palanpur women often remember, contrarily to their own age or age at marriage.
3 Most of the women did only know the name of their parents’ village and had no ideas about distances in kilometers. Therefore, the investigators checked each case with men of the village who may have a motorcycle and be aware of distances.
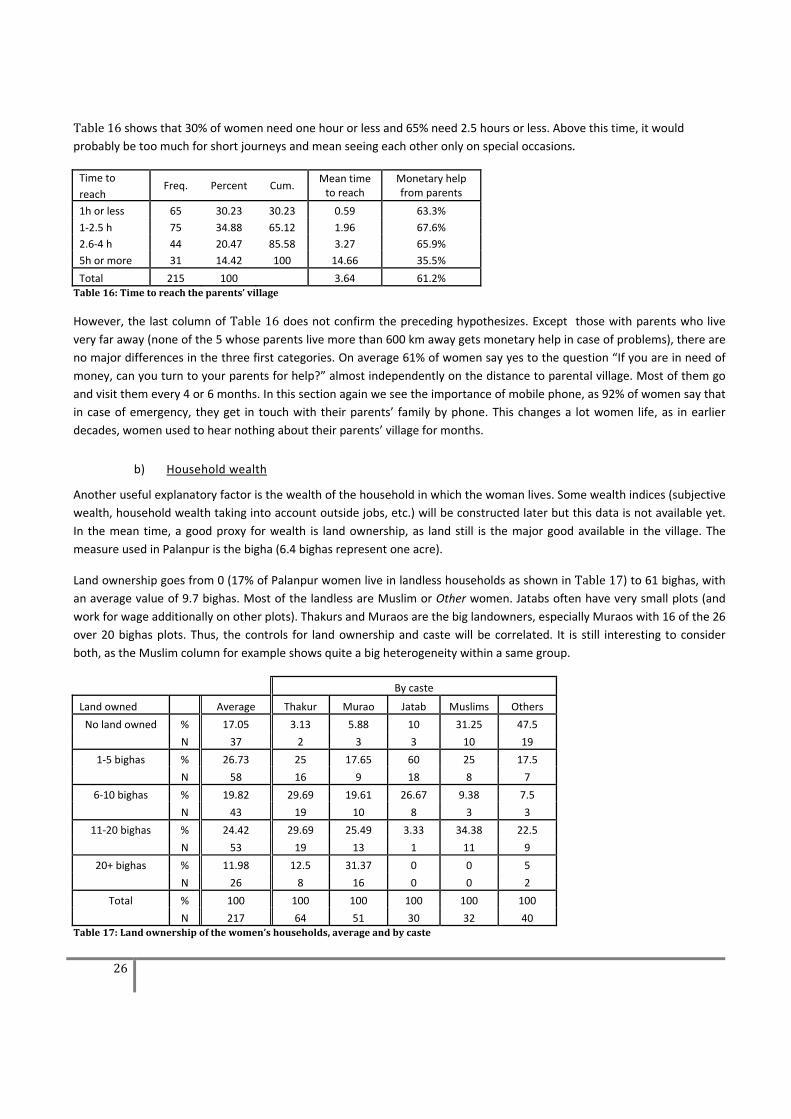
26
Table 16 shows that 30% of women need one hour or less and 65% need 2.5 hours or less. Above this time, it would
probably be too much for short journeys and mean seeing each other only on special occasions.
Time to
reach Freq. Percent Cum.
Mean time to reach
Monetary help from parents
1h or less 65 30.23 30.23 0.59 63.3%
1‐2.5 h 75 34.88 65.12 1.96 67.6%
2.6‐4 h 44 20.47 85.58 3.27 65.9%
5h or more 31 14.42 100 14.66 35.5%
Total 215 100 3.64 61.2% Table 16: Time to reach the parents’ village
However, the last column of Table 16 does not confirm the preceding hypothesizes. Except those with parents who live
very far away (none of the 5 whose parents live more than 600 km away gets monetary help in case of problems), there are
no major differences in the three first categories. On average 61% of women say yes to the question “If you are in need of
money, can you turn to your parents for help?” almost independently on the distance to parental village. Most of them go
and visit them every 4 or 6 months. In this section again we see the importance of mobile phone, as 92% of women say that
in case of emergency, they get in touch with their parents’ family by phone. This changes a lot women life, as in earlier
decades, women used to hear nothing about their parents’ village for months.
b) Household wealth
Another useful explanatory factor is the wealth of the household in which the woman lives. Some wealth indices (subjective
wealth, household wealth taking into account outside jobs, etc.) will be constructed later but this data is not available yet.
In the mean time, a good proxy for wealth is land ownership, as land still is the major good available in the village. The
measure used in Palanpur is the bigha (6.4 bighas represent one acre).
Land ownership goes from 0 (17% of Palanpur women live in landless households as shown in Table 17) to 61 bighas, with an average value of 9.7 bighas. Most of the landless are Muslim or Other women. Jatabs often have very small plots (and
work for wage additionally on other plots). Thakurs and Muraos are the big landowners, especially Muraos with 16 of the 26
over 20 bighas plots. Thus, the controls for land ownership and caste will be correlated. It is still interesting to consider
both, as the Muslim column for example shows quite a big heterogeneity within a same group.
By caste
Land owned Average Thakur Murao Jatab Muslims Others
No land owned % 17.05 3.13 5.88 10 31.25 47.5
N 37 2 3 3 10 19
1‐5 bighas % 26.73 25 17.65 60 25 17.5
N 58 16 9 18 8 7
6‐10 bighas % 19.82 29.69 19.61 26.67 9.38 7.5
N 43 19 10 8 3 3
11‐20 bighas % 24.42 29.69 25.49 3.33 34.38 22.5
N 53 19 13 1 11 9
20+ bighas % 11.98 12.5 31.37 0 0 5
N 26 8 16 0 0 2
Total % 100 100 100 100 100 100
N 217 64 51 30 32 40 Table 17: Land ownership of the women’s households, average and by caste
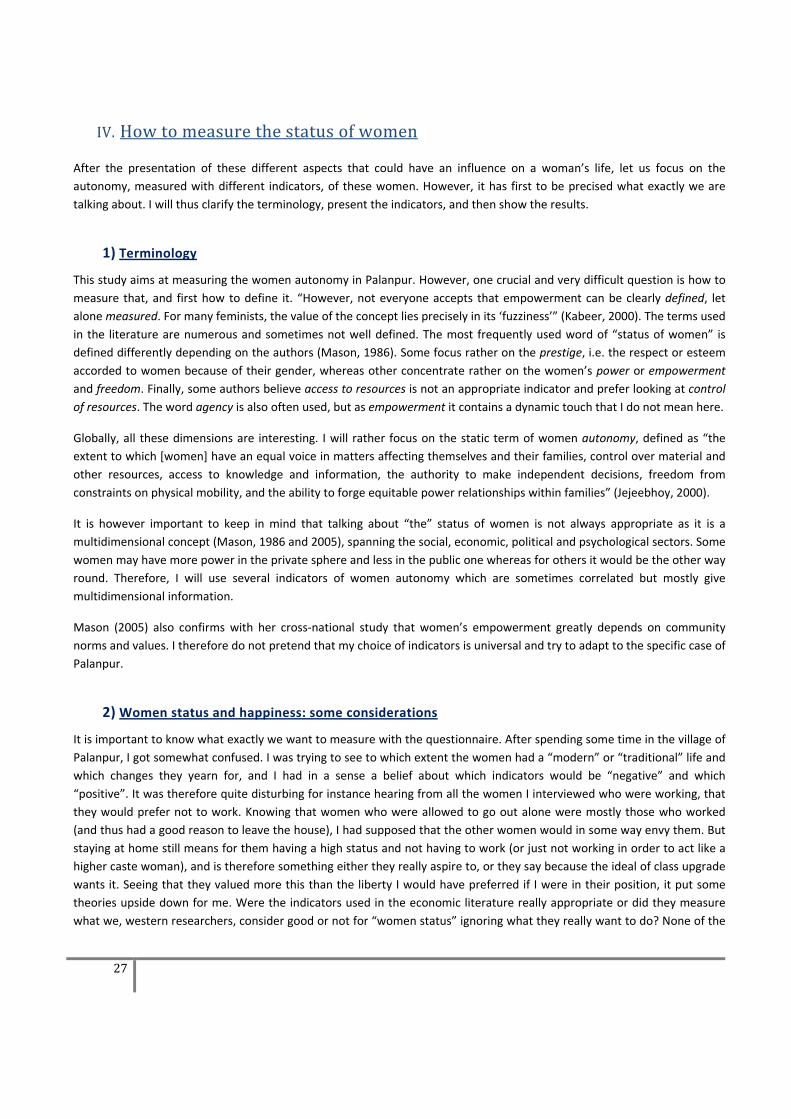
27
IV. How to measure the status of women
After the presentation of these different aspects that could have an influence on a woman’s life, let us focus on the
autonomy, measured with different indicators, of these women. However, it has first to be precised what exactly we are
talking about. I will thus clarify the terminology, present the indicators, and then show the results.
1) Terminology
This study aims at measuring the women autonomy in Palanpur. However, one crucial and very difficult question is how to
measure that, and first how to define it. “However, not everyone accepts that empowerment can be clearly defined, let
alone measured. For many feminists, the value of the concept lies precisely in its ‘fuzziness’” (Kabeer, 2000). The terms used
in the literature are numerous and sometimes not well defined. The most frequently used word of “status of women” is
defined differently depending on the authors (Mason, 1986). Some focus rather on the prestige, i.e. the respect or esteem
accorded to women because of their gender, whereas other concentrate rather on the women’s power or empowerment
and freedom. Finally, some authors believe access to resources is not an appropriate indicator and prefer looking at control
of resources. The word agency is also often used, but as empowerment it contains a dynamic touch that I do not mean here.
Globally, all these dimensions are interesting. I will rather focus on the static term of women autonomy, defined as “the
extent to which [women] have an equal voice in matters affecting themselves and their families, control over material and
other resources, access to knowledge and information, the authority to make independent decisions, freedom from
constraints on physical mobility, and the ability to forge equitable power relationships within families” (Jejeebhoy, 2000).
It is however important to keep in mind that talking about “the” status of women is not always appropriate as it is a
multidimensional concept (Mason, 1986 and 2005), spanning the social, economic, political and psychological sectors. Some
women may have more power in the private sphere and less in the public one whereas for others it would be the other way
round. Therefore, I will use several indicators of women autonomy which are sometimes correlated but mostly give
multidimensional information.
Mason (2005) also confirms with her cross‐national study that women’s empowerment greatly depends on community
norms and values. I therefore do not pretend that my choice of indicators is universal and try to adapt to the specific case of
Palanpur.
2) Women status and happiness: some considerations
It is important to know what exactly we want to measure with the questionnaire. After spending some time in the village of
Palanpur, I got somewhat confused. I was trying to see to which extent the women had a “modern” or “traditional” life and
which changes they yearn for, and I had in a sense a belief about which indicators would be “negative” and which
“positive”. It was therefore quite disturbing for instance hearing from all the women I interviewed who were working, that
they would prefer not to work. Knowing that women who were allowed to go out alone were mostly those who worked
(and thus had a good reason to leave the house), I had supposed that the other women would in some way envy them. But
staying at home still means for them having a high status and not having to work (or just not working in order to act like a
higher caste woman), and is therefore something either they really aspire to, or they say because the ideal of class upgrade
wants it. Seeing that they valued more this than the liberty I would have preferred if I were in their position, it put some
theories upside down for me. Were the indicators used in the economic literature really appropriate or did they measure
what we, western researchers, consider good or not for “women status” ignoring what they really want to do? None of the
28
village women seemed to really want things to be different and I could not figure out if they were really totally resigned
about their life, or just realistic, or lying because they thought they should not admit to strangers their dreams, etc. 1
This leads us to the major question: what do we want to measure? For me, after some days in the village, the whole point
was: are Palanpur women happy? The economic literature about subjective well‐being (SWB) is increasingly significant, also
about developing countries even if it started in the developed countries. However, it is rather rarely focused on women.
Most of the surveys are made in a way women are not alone when interviewed by the surveyor and I thus doubt they would
really share their intimate feeling with them. The case of Palanpur is in that aspect a better example as the women were
mostly alone (or at most surrounded by female members of the family) when interviewed. Furthermore, they had fewer
incentives to not tell the truth as it is totally uncorrelated to potential gains (contrarily to studies preceding field actions)
and were familiar with us as they trusted in the two surveyors who had already lived in the village for more than one year.
Trying to answer the question of happiness of Palanpur women is relatively difficult. The major point I realized while
interviewing some women is that they did not seem aware of the others’ well‐being, actions and dreams. The section about
women help group in the questionnaire was totally utopian as only a handful of women reported something. But even
when asked if they had a friend in the village, almost all women reported no. This does not necessarily imply that all women
are desperate, as they could get on well with their relatives they would not have cited as friends, but it shows that there is
little communication between women in the village. Most of them would report they casually chat with a neighbour when
she passes by, but it often does not go further. Even the inter‐generational communication seems quite bad, as women did
not seem aware of how things were earlier. To put it in a nutshell, Palanpur women know only what happens to them, now.
They don’t know what happens to others, they don’t know what happened before, they don’t dare imagine how things will
or could be in the future.
However, in a way, this could exactly be the reason why they say they are satisfied with their lives. They don’t dream of
something else (i.e. a world were a woman could go out alone or would not be beaten by her husband if she did a mistake
doing some household work) because they do not feel like they could do it2. Education naturally also plays a role, as well as
traditions3.
1 About willingness to accept their situation, see Moore, Choudhary and Singh. (1998): “One can illustrate these linguistic problems by
looking at the pair of Hindi words sukh and dukh, that are often translated as ‘happiness’ and ‘unhappiness’, and are sometimes cited as
indigenous equivalents of ‘wellbeing’ and ‘ill‐being’. That may be true in some situations, but, like many terms in all languages, sukh and
dukh have a range of meanings that are dependent on the context in which they are used. Sukh also has connotations of ‘willing
acceptance of one’s lot in life’ – an idea that can generate very strong emotions in a society where caste divisions are both strong and
increasingly contested. Dependent on context, dukh can be read to imply either (a) a perverse, contrary or even punishable unwillingness
to accept one’s ascribed place in society or (b) an admirable willingness to challenge outmoded and oppressive social distinctions.
Because of this ambiguity, it is especially likely that respondents’ replies to questions couched in terms of sukh‐dukh may be very tactical,
and heavily influenced by their perception of the questioner, why the question is being asked, and the potential dangers or benefits of
giving one answer rather than another.”
Therefore, in the women interviews, we tackled the problem as they also propose: “The other way of tackling this problem of the
plasticity of extended concepts of poverty is simply to ask poor people ‘What are your problems in life?’ ”
2 Another explanation is that they realize the things that are bad in their lives (for example their husband beating them). However,
knowing or believing they have no options, they have to tell themselves and us that it is normal in order to bear it.
3 Let us read Kahneman’s quotation (2005) in our terms, as Camfield (2006) does:”Everyone is surprised by how happy [the poor/these
unfree women] can be. The reason is that they are not [poor/unfree] full time. They do other things. They enjoy their meals, their friends.
They read the news. It has to do with the allocation of attention (Kahneman, 2005)”. Therefore, Camfield suggests: “Studying wellbeing
29
It is possible to view SWB as the difference of the current status of their life ś and the point they would like to achieve s.
One can naturally write it as a function of this difference but it does not change things. In this model, a woman would be
most satisfied if her way of life corresponded to the ideal life she dreamed of, independently of whether this means a
“modern” or a “traditional” life (but it is not because slaves are happy that we should not abolish slavery. I will come back
to this point later).
SWB = ś(e, w, par, com, trad, oth) ‐ s(e, w, par, com, trad, oth)
where SWB is the subjective well‐being, ś the current status of her life and s the desired point she wants to achieve, e is
education, w is her working status, par the parents, trad traditions, com the community and oth are other factors that could
influence their well‐being, some of them possibly different from one woman to the other.
Note that s and ś are highly subjective and should describe the way in which they assess themselves their lives. This model
takes the functions describing the set of characteristics of their current life, in a sense their quality of life. Usually, the
literature rather links rather the SWB with poverty (Diener and Biswas‐Diner, 2005) or women empowerment with poverty
(“At the same time certain strands of policy discourse have identified female empowerment as an effective means for
reducing poverty”, Shahra Razavi, 2000). However, for women it is in a sense different as poverty per se is less the major
focus and determinant of their well‐being. This does not mean that women less feel the effect of poverty, but contrarily to
men their life is more influenced by other factors (autonomy, decision‐making, etc.) than by only economic factors.
Nevertheless, one can be inspired by the literature about SWB and poverty to study the link between SWB and women
status, as you can be poor and happy as well as unfree and happy1.
An interesting point is that, moving upwards e, it does not clearly imply a higher well‐being. In other words, the major
“improvement” for the village girls is education, which goes together with walking to the village of Akroli, chatting with
other girls and meeting boys. It should influence their ideal life. However, whether ś increases also to compensate it in
future or not will depend on the working possibilities for women in the village, their parents’ and the community’s
agreement to let them decide more about their lives, and a lot of other factors. If empowerment means the ability of
making the important choices as Kabeer says (Kabeer, 2000, p.28), then education can improve women’s awareness of the
existence of different alternatives, but not necessarily give access to them. Similarly, Eswaran and Malhotra (2009) show
that more female autonomy may lead to more conflicts and increase domestic violence from the husbands, as a way to
keep control over them.
This basically means that I am not sure that Palanpur women will actually be more satisfied of their own life in twenty years,
even if it is difficult to say as the function s itself may evolve or not, depending on psychological factors of how they see the
changes. However, shall we say the situation is worse even if objectively it may become better?
rather than poverty enables researchers to explore what poor people have and are able to do, rather than focusing on their deficits (…).
This should produce more credible and respectful representations of people’s lives to inform development policy and practice, hopefully
leading to development that creates the conditions for people to experience wellbeing, rather than undermining their existing
strategies.”
1 For example, let us read in our context this quotation of Diener and Biswas‐Diner (2005): “However, not only can the quality of
participatory research be variable, but it often starts with the value‐laden term ‘poverty’ and so misses the opportunity to understand
people’s lives in their own terms (Cooke & Kothari, 2001; White & Pettit, 2004). This includes acknowledging not only that people in
developing countries may not characterize themselves as poor, and that if they do, they may not see their lives wholly in terms of lack or
deprivation, which is often the way they are regarded by researchers and practitioners of international development”.
30
Fact is that Palanpur women can only gain in self‐consciousness as the current situation (without friends, without self‐
groups) is as low as it can be. They may become aware of the rights they don’t have and of the fact that they could change
things. However, predicting the evolution of the SWB curve during this process is very tough, and therefore in this case not
necessarily the best instrument to use.
As I mentioned earlier, it is not because slaves are happy that we should not abolish slavery. It is difficult to keep a neutral
look on the indicators, but it is in some way possible to assess the degree of liberty / autonomy and control over resources
of these women. Focusing rather on these indicators may sometimes seem pretentious – we, educated researchers, know
what the ideal of the rights and liberties of a woman are – but can lead to a better way of measuring their status and way of
life compared to the men’s way of life1. The basic idea is that their preferences are deformed by ignorance, habit and
traditions. This directly leads to the literature about preferences and liberty from Smith, Kant, Rawls, Sen. For a more
detailed approach of this broad subject, refer to Nussbaum (2000):
“One of the things this liberal tradition has emphasized is that people’s preference for basic liberties can itself be manipulated
by tradition and intimidation; thus a position that refuses to criticize entrenched desire, while sounding democratic on its face,
may actually serve democratic institutions less well than one that takes a strong normative stand about such matters, to some
extend independently of people’s exiting desires. (…) Our question is: under what conditions are preferences a good guide to
such fundamental issues of social choice and under what conditions might we be justified in departing from or criticizing some
of them in the name of important norms such as justice and human capability?”
This led me to the conclusion that the well‐being topic was essential in order to keep in mind that growth and development
are not the only thing to focus on – how it is lived by the inhabitants being at least as important. However, it also became
clear that the subjective perception of these women was not the only thing to focus on (and that anyway this questionnaire
was not designed to answer these questions). It is not because Palanpur women say they are happy and satisfied with their
life that we should conclude in this study that everything is great and nothing should change in Palanpur.
1 Razavi (2000) seems to have the same type of questions: “This also raises difficult methodological questions, such as the tension between objective criteria (…) and subjective criteria (…). While reference to some objective criteria of well‐being is clearly needed in order to get us away from the utilitarian insistence in taking subjective preferences as the only criteria for making judgments about values
and welfare, there is also a need for women’s own perceptions and values to find some space in these discussions if only because they allow us to better understand the choices that women make”.
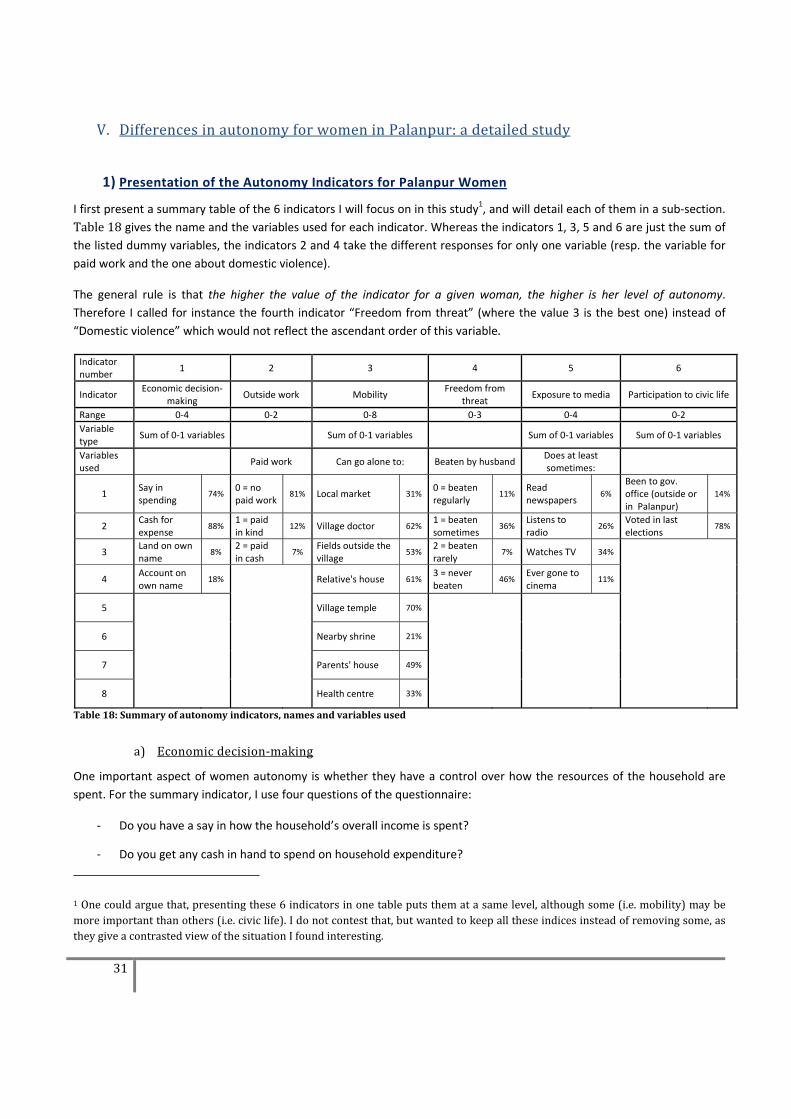
31
V. Differences in autonomy for women in Palanpur: a detailed study
1) Presentation of the Autonomy Indicators for Palanpur Women
I first present a summary table of the 6 indicators I will focus on in this study1, and will detail each of them in a sub‐section.
Table 18 gives the name and the variables used for each indicator. Whereas the indicators 1, 3, 5 and 6 are just the sum of
the listed dummy variables, the indicators 2 and 4 take the different responses for only one variable (resp. the variable for
paid work and the one about domestic violence).
The general rule is that the higher the value of the indicator for a given woman, the higher is her level of autonomy.
Therefore I called for instance the fourth indicator “Freedom from threat” (where the value 3 is the best one) instead of
“Domestic violence” which would not reflect the ascendant order of this variable.
Indicator number
1 2 3 4 5 6
Indicator Economic decision‐
making Outside work Mobility
Freedom from threat
Exposure to media Participation to civic life
Range 0‐4 0‐2 0‐8 0‐3 0‐4 0‐2
Variable type
Sum of 0‐1 variables Sum of 0‐1 variables Sum of 0‐1 variables Sum of 0‐1 variables
Variables used
Paid work Can go alone to: Beaten by husband Does at least sometimes:
1 Say in spending
74% 0 = no paid work
81% Local market 31% 0 = beaten regularly
11% Read newspapers
6%
Been to gov. office (outside or in Palanpur)
14%
2 Cash for expense
88% 1 = paid in kind
12% Village doctor 62% 1 = beaten sometimes
36% Listens to radio
26% Voted in last elections
78%
3 Land on own name
8% 2 = paid in cash
7% Fields outside the village
53% 2 = beaten rarely
7% Watches TV 34%
4 Account on own name
18% Relative's house 61% 3 = never beaten
46% Ever gone to cinema
11%
5 Village temple 70%
6 Nearby shrine 21%
7 Parents' house 49%
8 Health centre 33%
Table 18: Summary of autonomy indicators, names and variables used
a) Economic decision‐making
One important aspect of women autonomy is whether they have a control over how the resources of the household are
spent. For the summary indicator, I use four questions of the questionnaire:
‐ Do you have a say in how the household’s overall income is spent?
‐ Do you get any cash in hand to spend on household expenditure?
1 One could argue that, presenting these 6 indicators in one table puts them at a same level, although some (i.e. mobility) may be more important than others (i.e. civic life). I do not contest that, but wanted to keep all these indices instead of removing some, as they give a contrasted view of the situation I found interesting.
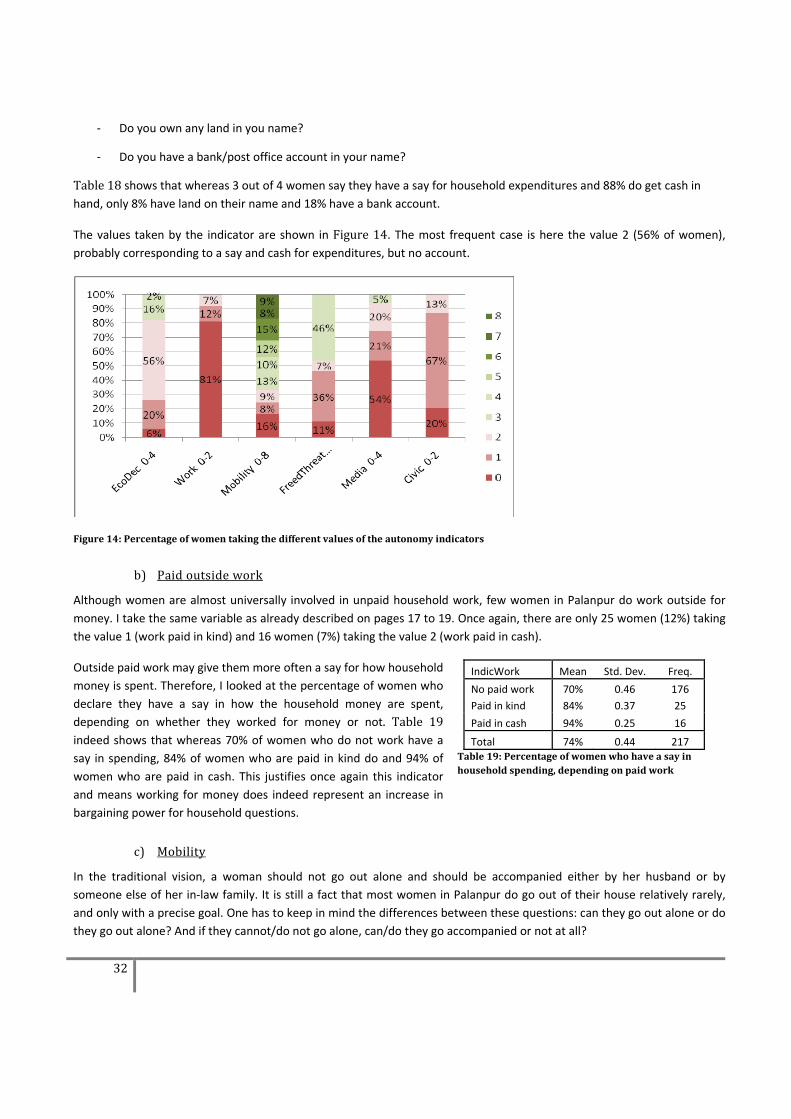
32
‐ Do you own any land in you name?
‐ Do you have a bank/post office account in your name?
Table 18 shows that whereas 3 out of 4 women say they have a say for household expenditures and 88% do get cash in
hand, only 8% have land on their name and 18% have a bank account.
The values taken by the indicator are shown in Figure 14. The most frequent case is here the value 2 (56% of women),
probably corresponding to a say and cash for expenditures, but no account.
Figure 14: Percentage of women taking the different values of the autonomy indicators
b) Paid outside work
Although women are almost universally involved in unpaid household work, few women in Palanpur do work outside for
money. I take the same variable as already described on pages 17 to 19. Once again, there are only 25 women (12%) taking
the value 1 (work paid in kind) and 16 women (7%) taking the value 2 (work paid in cash).
Outside paid work may give them more often a say for how household
money is spent. Therefore, I looked at the percentage of women who
declare they have a say in how the household money are spent,
depending on whether they worked for money or not. Table 19 indeed shows that whereas 70% of women who do not work have a
say in spending, 84% of women who are paid in kind do and 94% of
women who are paid in cash. This justifies once again this indicator
and means working for money does indeed represent an increase in
bargaining power for household questions.
IndicWork Mean Std. Dev. Freq.
No paid work 70% 0.46 176
Paid in kind 84% 0.37 25
Paid in cash 94% 0.25 16
Total 74% 0.44 217 Table 19: Percentage of women who have a say in household spending, depending on paid work
c) Mobility
In the traditional vision, a woman should not go out alone and should be accompanied either by her husband or by
someone else of her in‐law family. It is still a fact that most women in Palanpur do go out of their house relatively rarely,
and only with a precise goal. One has to keep in mind the differences between these questions: can they go out alone or do
they go out alone? And if they cannot/do not go alone, can/do they go accompanied or not at all?
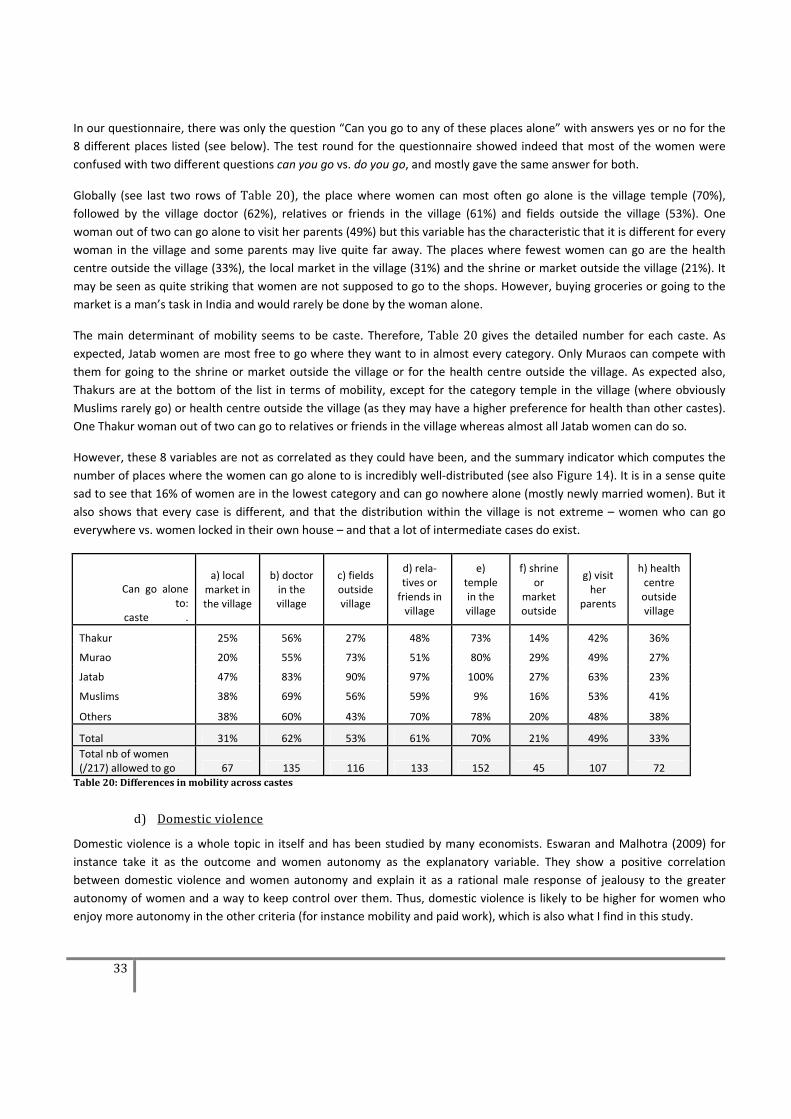
33
In our questionnaire, there was only the question “Can you go to any of these places alone” with answers yes or no for the
8 different places listed (see below). The test round for the questionnaire showed indeed that most of the women were
confused with two different questions can you go vs. do you go, and mostly gave the same answer for both.
Globally (see last two rows of Table 20), the place where women can most often go alone is the village temple (70%),
followed by the village doctor (62%), relatives or friends in the village (61%) and fields outside the village (53%). One
woman out of two can go alone to visit her parents (49%) but this variable has the characteristic that it is different for every
woman in the village and some parents may live quite far away. The places where fewest women can go are the health
centre outside the village (33%), the local market in the village (31%) and the shrine or market outside the village (21%). It
may be seen as quite striking that women are not supposed to go to the shops. However, buying groceries or going to the
market is a man’s task in India and would rarely be done by the woman alone.
The main determinant of mobility seems to be caste. Therefore, Table 20 gives the detailed number for each caste. As
expected, Jatab women are most free to go where they want to in almost every category. Only Muraos can compete with
them for going to the shrine or market outside the village or for the health centre outside the village. As expected also,
Thakurs are at the bottom of the list in terms of mobility, except for the category temple in the village (where obviously
Muslims rarely go) or health centre outside the village (as they may have a higher preference for health than other castes).
One Thakur woman out of two can go to relatives or friends in the village whereas almost all Jatab women can do so.
However, these 8 variables are not as correlated as they could have been, and the summary indicator which computes the
number of places where the women can go alone to is incredibly well‐distributed (see also Figure 14). It is in a sense quite sad to see that 16% of women are in the lowest category and can go nowhere alone (mostly newly married women). But it
also shows that every case is different, and that the distribution within the village is not extreme – women who can go
everywhere vs. women locked in their own house – and that a lot of intermediate cases do exist.
Can go alone to:
caste .
a) local market in the village
b) doctor in the village
c) fields outside village
d) rela‐tives or friends in village
e) temple in the village
f) shrine or
market outside
g) visit her
parents
h) health centre outside village
Thakur 25% 56% 27% 48% 73% 14% 42% 36%
Murao 20% 55% 73% 51% 80% 29% 49% 27%
Jatab 47% 83% 90% 97% 100% 27% 63% 23%
Muslims 38% 69% 56% 59% 9% 16% 53% 41%
Others 38% 60% 43% 70% 78% 20% 48% 38%
Total 31% 62% 53% 61% 70% 21% 49% 33%
Total nb of women (/217) allowed to go 67 135 116 133 152 45 107 72 Table 20: Differences in mobility across castes
d) Domestic violence
Domestic violence is a whole topic in itself and has been studied by many economists. Eswaran and Malhotra (2009) for
instance take it as the outcome and women autonomy as the explanatory variable. They show a positive correlation
between domestic violence and women autonomy and explain it as a rational male response of jealousy to the greater
autonomy of women and a way to keep control over them. Thus, domestic violence is likely to be higher for women who
enjoy more autonomy in the other criteria (for instance mobility and paid work), which is also what I find in this study.
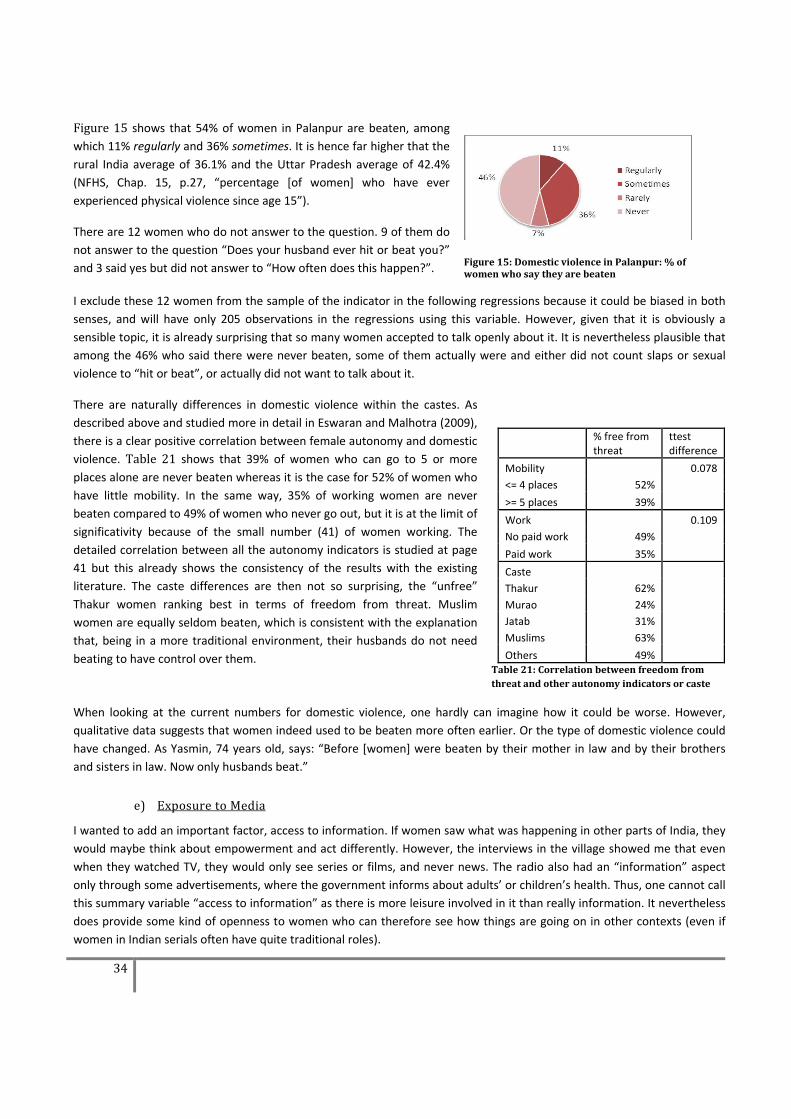
34
Figure 15 shows that 54% of women in Palanpur are beaten, among
which 11% regularly and 36% sometimes. It is hence far higher that the
rural India average of 36.1% and the Uttar Pradesh average of 42.4%
(NFHS, Chap. 15, p.27, “percentage [of women] who have ever
experienced physical violence since age 15”).
There are 12 women who do not answer to the question. 9 of them do
not answer to the question “Does your husband ever hit or beat you?”
and 3 said yes but did not answer to “How often does this happen?”.
Figure 15: Domestic violence in Palanpur: % of women who say they are beaten
I exclude these 12 women from the sample of the indicator in the following regressions because it could be biased in both
senses, and will have only 205 observations in the regressions using this variable. However, given that it is obviously a
sensible topic, it is already surprising that so many women accepted to talk openly about it. It is nevertheless plausible that
among the 46% who said there were never beaten, some of them actually were and either did not count slaps or sexual
violence to “hit or beat”, or actually did not want to talk about it.
There are naturally differences in domestic violence within the castes. As
described above and studied more in detail in Eswaran and Malhotra (2009),
there is a clear positive correlation between female autonomy and domestic
violence. Table 21 shows that 39% of women who can go to 5 or more
places alone are never beaten whereas it is the case for 52% of women who
have little mobility. In the same way, 35% of working women are never
beaten compared to 49% of women who never go out, but it is at the limit of
significativity because of the small number (41) of women working. The
detailed correlation between all the autonomy indicators is studied at page
41 but this already shows the consistency of the results with the existing
literature. The caste differences are then not so surprising, the “unfree”
Thakur women ranking best in terms of freedom from threat. Muslim
women are equally seldom beaten, which is consistent with the explanation
that, being in a more traditional environment, their husbands do not need
beating to have control over them.
% free from threat
ttest difference
Mobility 0.078
<= 4 places 52%
>= 5 places 39%
Work 0.109
No paid work 49%
Paid work 35%
Caste
Thakur 62%
Murao 24%
Jatab 31%
Muslims 63%
Others 49% Table 21: Correlation between freedom from threat and other autonomy indicators or caste
When looking at the current numbers for domestic violence, one hardly can imagine how it could be worse. However,
qualitative data suggests that women indeed used to be beaten more often earlier. Or the type of domestic violence could
have changed. As Yasmin, 74 years old, says: “Before [women] were beaten by their mother in law and by their brothers
and sisters in law. Now only husbands beat.”
e) Exposure to Media
I wanted to add an important factor, access to information. If women saw what was happening in other parts of India, they
would maybe think about empowerment and act differently. However, the interviews in the village showed me that even
when they watched TV, they would only see series or films, and never news. The radio also had an “information” aspect
only through some advertisements, where the government informs about adults’ or children’s health. Thus, one cannot call
this summary variable “access to information” as there is more leisure involved in it than really information. It nevertheless
does provide some kind of openness to women who can therefore see how things are going on in other contexts (even if
women in Indian serials often have quite traditional roles).
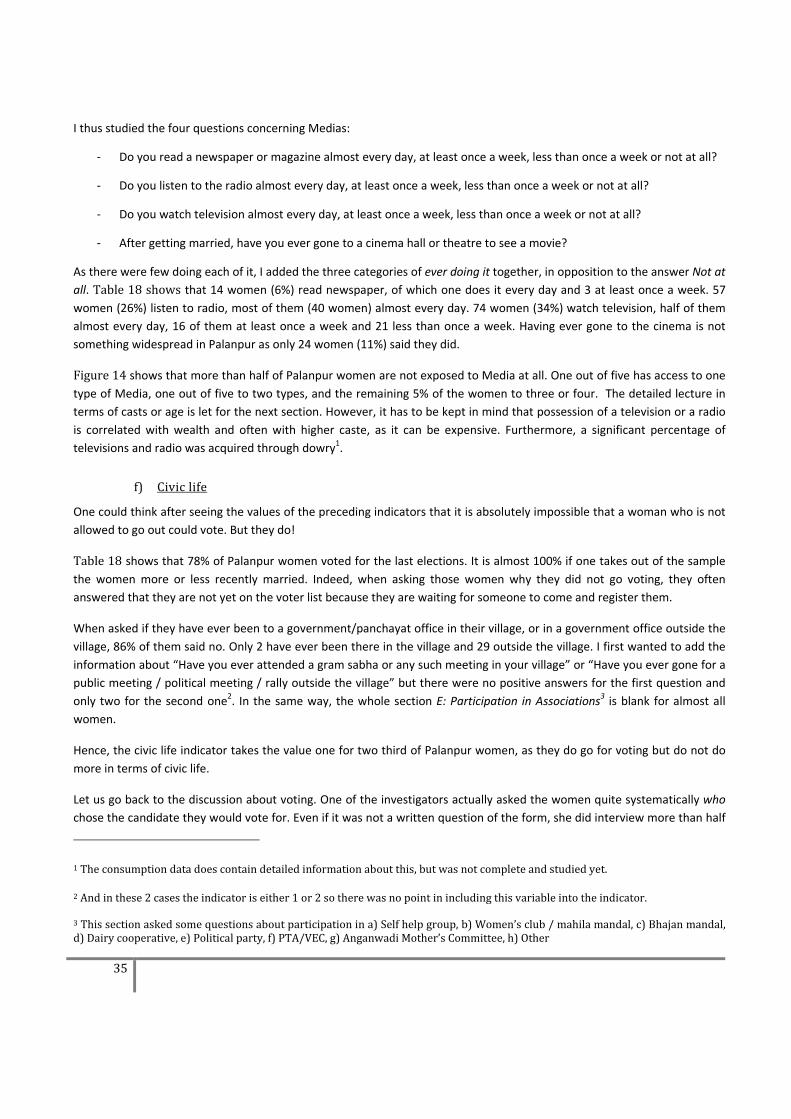
35
I thus studied the four questions concerning Medias:
‐ Do you read a newspaper or magazine almost every day, at least once a week, less than once a week or not at all?
‐ Do you listen to the radio almost every day, at least once a week, less than once a week or not at all?
‐ Do you watch television almost every day, at least once a week, less than once a week or not at all?
‐ After getting married, have you ever gone to a cinema hall or theatre to see a movie?
As there were few doing each of it, I added the three categories of ever doing it together, in opposition to the answer Not at
all. Table 18 shows that 14 women (6%) read newspaper, of which one does it every day and 3 at least once a week. 57
women (26%) listen to radio, most of them (40 women) almost every day. 74 women (34%) watch television, half of them
almost every day, 16 of them at least once a week and 21 less than once a week. Having ever gone to the cinema is not
something widespread in Palanpur as only 24 women (11%) said they did.
Figure 14 shows that more than half of Palanpur women are not exposed to Media at all. One out of five has access to one
type of Media, one out of five to two types, and the remaining 5% of the women to three or four. The detailed lecture in
terms of casts or age is let for the next section. However, it has to be kept in mind that possession of a television or a radio
is correlated with wealth and often with higher caste, as it can be expensive. Furthermore, a significant percentage of
televisions and radio was acquired through dowry1.
f) Civic life
One could think after seeing the values of the preceding indicators that it is absolutely impossible that a woman who is not
allowed to go out could vote. But they do!
Table 18 shows that 78% of Palanpur women voted for the last elections. It is almost 100% if one takes out of the sample
the women more or less recently married. Indeed, when asking those women why they did not go voting, they often
answered that they are not yet on the voter list because they are waiting for someone to come and register them.
When asked if they have ever been to a government/panchayat office in their village, or in a government office outside the
village, 86% of them said no. Only 2 have ever been there in the village and 29 outside the village. I first wanted to add the
information about “Have you ever attended a gram sabha or any such meeting in your village” or “Have you ever gone for a
public meeting / political meeting / rally outside the village” but there were no positive answers for the first question and
only two for the second one2. In the same way, the whole section E: Participation in Associations3 is blank for almost all
women.
Hence, the civic life indicator takes the value one for two third of Palanpur women, as they do go for voting but do not do
more in terms of civic life.
Let us go back to the discussion about voting. One of the investigators actually asked the women quite systematically who
chose the candidate they would vote for. Even if it was not a written question of the form, she did interview more than half
1 The consumption data does contain detailed information about this, but was not complete and studied yet.
2 And in these 2 cases the indicator is either 1 or 2 so there was no point in including this variable into the indicator.
3 This section asked some questions about participation in a) Self help group, b) Women’s club / mahila mandal, c) Bhajan mandal, d) Dairy cooperative, e) Political party, f) PTA/VEC, g) Anganwadi Mother’s Committee, h) Other
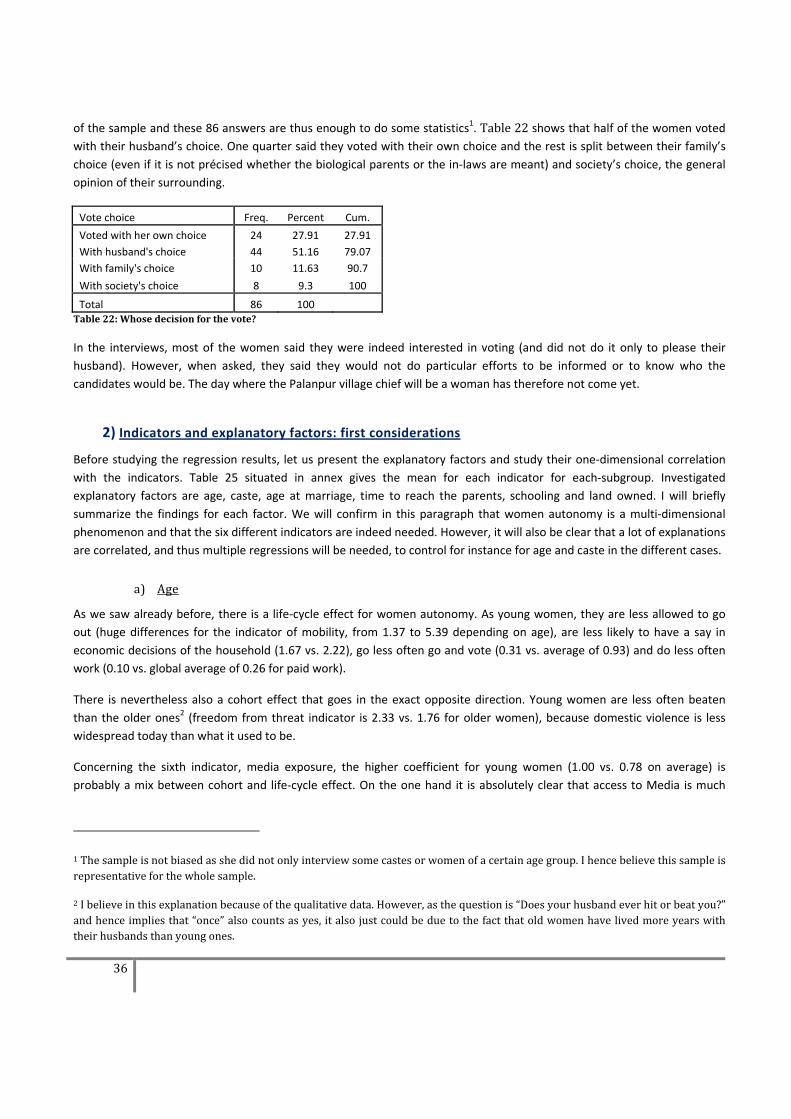
36
of the sample and these 86 answers are thus enough to do some statistics1. Table 22 shows that half of the women voted
with their husband’s choice. One quarter said they voted with their own choice and the rest is split between their family’s
choice (even if it is not précised whether the biological parents or the in‐laws are meant) and society’s choice, the general
opinion of their surrounding.
Vote choice Freq. Percent Cum.
Voted with her own choice 24 27.91 27.91
With husband's choice 44 51.16 79.07
With family's choice 10 11.63 90.7
With society's choice 8 9.3 100
Total 86 100 Table 22: Whose decision for the vote?
In the interviews, most of the women said they were indeed interested in voting (and did not do it only to please their
husband). However, when asked, they said they would not do particular efforts to be informed or to know who the
candidates would be. The day where the Palanpur village chief will be a woman has therefore not come yet.
2) Indicators and explanatory factors: first considerations
Before studying the regression results, let us present the explanatory factors and study their one‐dimensional correlation
with the indicators. Table 25 situated in annex gives the mean for each indicator for each‐subgroup. Investigated
explanatory factors are age, caste, age at marriage, time to reach the parents, schooling and land owned. I will briefly
summarize the findings for each factor. We will confirm in this paragraph that women autonomy is a multi‐dimensional
phenomenon and that the six different indicators are indeed needed. However, it will also be clear that a lot of explanations
are correlated, and thus multiple regressions will be needed, to control for instance for age and caste in the different cases.
a) Age
As we saw already before, there is a life‐cycle effect for women autonomy. As young women, they are less allowed to go
out (huge differences for the indicator of mobility, from 1.37 to 5.39 depending on age), are less likely to have a say in
economic decisions of the household (1.67 vs. 2.22), go less often go and vote (0.31 vs. average of 0.93) and do less often
work (0.10 vs. global average of 0.26 for paid work).
There is nevertheless also a cohort effect that goes in the exact opposite direction. Young women are less often beaten
than the older ones2 (freedom from threat indicator is 2.33 vs. 1.76 for older women), because domestic violence is less
widespread today than what it used to be.
Concerning the sixth indicator, media exposure, the higher coefficient for young women (1.00 vs. 0.78 on average) is
probably a mix between cohort and life‐cycle effect. On the one hand it is absolutely clear that access to Media is much
1 The sample is not biased as she did not only interview some castes or women of a certain age group. I hence believe this sample is representative for the whole sample.
2 I believe in this explanation because of the qualitative data. However, as the question is “Does your husband ever hit or beat you?” and hence implies that “once” also counts as yes, it also just could be due to the fact that old women have lived more years with their husbands than young ones.
37
easier nowadays than earlier. On the other hand, it is likely that young women who are not allowed to go out or to work,
and have not so many children yet, do watch more television or listen to radio than they would in ten or twenty years.
The question about well‐being is thus in a sense reduced to the gap between younger and older women: is it preferable to
be at home and watch TV all day, or going out to work and having more decisional power but be occasionally beaten?
b) Caste
In terms of paid work and mobility, Jatab women are hugely ahead (0.67 vs. average of 0.26 and 5.38 vs. average of 3.93).
However this often is the case only because of financial necessity and does not always imply that they have more autonomy
for going out for leisure. In economic decision‐making and civic life, all the castes have similar means. Thakur and Muslim
women are beaten least often (2.15 and 2.33), and Murao and Jatab women most (1.41 and 1.55). Finally, Thakur and Other
women enjoy most Medias (1.16 vs. mean of 0.78), but probably because they can afford a television and a radio and do
not have to work outside.
c) Age at marriage
The only cases where age at marriage seems significant are for mobility, freedom from threat, media exposure and civic life.
However, it is exactly opposite to the order of the coefficients for age group, meaning that age at marriage is probably too
much correlated to age to be significant per se. Thus, women married between age 11 and 16 are more mobile (4.45 vs.
2.46 for women married between 19 and 23) but this is the case most probably because there are only older women and no
newly married woman in this category.
d) Distance to parents
The coefficients for the distance to the parents in kilometres and the time needed to reach their village were very similar,
and I hence kept only the time. We expect the effect to increase or decrease strictly along the time needed to reach the
parents’ village. However, it is really the case for only one of the indicators. Indeed, it seems that women whose parents
live nearer have more exposure to media (decreasing coefficient from 0.91 to 0.61). It is somewhat difficult to explain; one
attempt could be to say that if parents who care more live nearer to their daughters and gave a higher dowry, it is likely
that there was a radio or a TV among it. But the distance to the parents is probably too much correlated to other aspects
like caste to be really significant for the other aspects.
e) Education
Here again, we saw that schooling and literacy were very correlated so I just kept schooling. And once again I am looking for
any clear‐cut increase or decrease. It is the case for media exposure given that women who went to school more than 5
years have much more access to Media than women who never went to school (1.85 vs. 0.64). However, as these are
mostly Thakur women of wealthy families, it does not necessarily mean a causal effect from education to Media. Indeed, it
may suggest that going to school has increased their preference for information or leisure, as well as it could be due to
wealth and caste. Only the multiple regression in the next part will allow to conclude.
This is also enlightened by the coefficients for mobility. One could wonder why having gone to school reduces mobility
compared to women who never went to school (2.71 and 2.95 vs. 3.99). It is here only the case because educated girls are
young Thakur girls. As discussed before, in order to have a real increase in autonomy when education goes up, you need
also other factors to go with it (as for example a higher employment level).
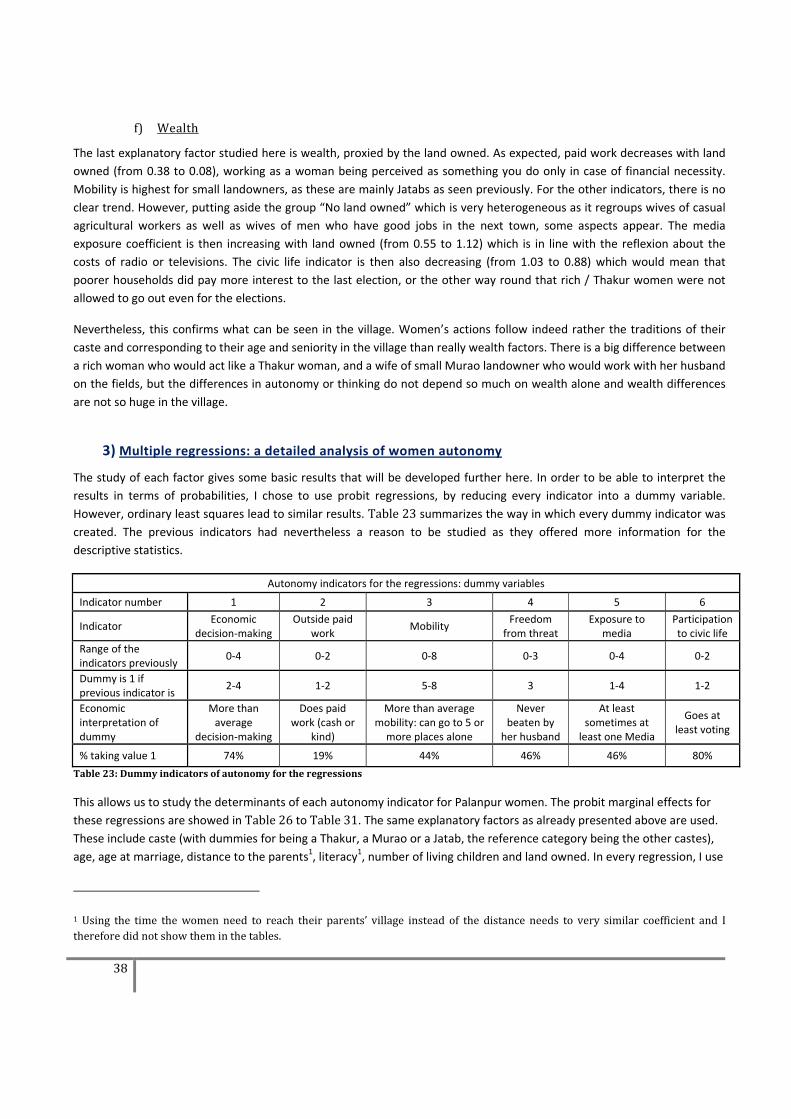
38
f) Wealth
The last explanatory factor studied here is wealth, proxied by the land owned. As expected, paid work decreases with land
owned (from 0.38 to 0.08), working as a woman being perceived as something you do only in case of financial necessity.
Mobility is highest for small landowners, as these are mainly Jatabs as seen previously. For the other indicators, there is no
clear trend. However, putting aside the group “No land owned” which is very heterogeneous as it regroups wives of casual
agricultural workers as well as wives of men who have good jobs in the next town, some aspects appear. The media
exposure coefficient is then increasing with land owned (from 0.55 to 1.12) which is in line with the reflexion about the
costs of radio or televisions. The civic life indicator is then also decreasing (from 1.03 to 0.88) which would mean that
poorer households did pay more interest to the last election, or the other way round that rich / Thakur women were not
allowed to go out even for the elections.
Nevertheless, this confirms what can be seen in the village. Women’s actions follow indeed rather the traditions of their
caste and corresponding to their age and seniority in the village than really wealth factors. There is a big difference between
a rich woman who would act like a Thakur woman, and a wife of small Murao landowner who would work with her husband
on the fields, but the differences in autonomy or thinking do not depend so much on wealth alone and wealth differences
are not so huge in the village.
3) Multiple regressions: a detailed analysis of women autonomy
The study of each factor gives some basic results that will be developed further here. In order to be able to interpret the
results in terms of probabilities, I chose to use probit regressions, by reducing every indicator into a dummy variable.
However, ordinary least squares lead to similar results. Table 23 summarizes the way in which every dummy indicator was
created. The previous indicators had nevertheless a reason to be studied as they offered more information for the
descriptive statistics.
Autonomy indicators for the regressions: dummy variables
Indicator number 1 2 3 4 5 6
Indicator Economic
decision‐making Outside paid
work Mobility
Freedom from threat
Exposure to media
Participation to civic life
Range of the indicators previously
0‐4 0‐2 0‐8 0‐3 0‐4 0‐2
Dummy is 1 if previous indicator is
2‐4 1‐2 5‐8 3 1‐4 1‐2
Economic interpretation of dummy
More than average
decision‐making
Does paid work (cash or
kind)
More than average mobility: can go to 5 or more places alone
Never beaten by
her husband
At least sometimes at least one Media
Goes at least voting
% taking value 1 74% 19% 44% 46% 46% 80%
Table 23: Dummy indicators of autonomy for the regressions
This allows us to study the determinants of each autonomy indicator for Palanpur women. The probit marginal effects for
these regressions are showed in Table 26 to Table 31. The same explanatory factors as already presented above are used.
These include caste (with dummies for being a Thakur, a Murao or a Jatab, the reference category being the other castes),
age, age at marriage, distance to the parents1, literacy1, number of living children and land owned. In every regression, I use
1 Using the time the women need to reach their parents’ village instead of the distance needs to very similar coefficient and I therefore did not show them in the tables.
39
household fixed effects (vce cluster command) to take into account the fact that the unknown error terms are more closely
related among women in the same household rather than across different household2.
a) Economic decision‐making
The first columns of Table 26 study the influence of different explanatory factors on the probability to have at least some
say in the decisions of the household and access to cash. This indicator takes the value one if the woman has at least 2 of
the 4 characteristics among say in spending, getting cash for expense, having land on own name and having an account on
own name.
The only factor that plays a role is age. A woman who is 10 years older than another will have 10% more chance to have a
say in economic decisions as defined by this indicator. However, all the other factors, caste, age at marriage, parents,
literacy etc. seem to have no direct influence on the economic decision‐making. Even with combinations of different
factors3, nothing is significant. It seems that the group of women who do have some economic decisional power and the
group of those who do not differs only a little bit in age but on average not in the other characteristics.
I thus wondered whether it was the fault of my indicator or not. Therefore, I took the variables that constitute it and ran
again the regressions separately. The variable for getting cash for expense and the one about having a say in the household
expenditures both lead to the same results: except for age, nothing was significant. However, the summarized variable
Having an account or land on own name does lead to interesting results, as shown in the other columns of Table 26.
The descriptive table page 31 showed that whereas having a say in household spending or getting cash are quite
widespread (74% and 88%), there are far less women who have an account or land (50 women, 23%). Table 26 thus shows that these 50 women are in a sense privileged ones. A Thakur woman has 17% more chances and a Jatab woman 14% less
chances to have an account or land than other women. Murao women are in‐between. However, wealth per se measured
by the land owned by the household is not a significant determinant, as column (15) shows. Thus, a Thakur woman who is
in a big land‐owner household would not have more chances to have an account or land on her name than a less wealthy
Thakur woman. Age is once again a determinant, as well as the number of living children and the distance to the parents.
However, these coefficients are very small (between 0 and 2%), and do not lead to major differences.
In brief, even if belonging to a “higher” caste augments the probability for a woman to access “modern” economic decision‐
making in the form of a bank account or the legal propriety of land, there do not seem to be major differences for every‐day
economic decisions in Palanpur.
b) Paid work
Table 27 shows much more differences within Palanpur. As already seen in the descriptive statistics, a Thakur woman has
19% less and a Jatab woman 26% more chances to be working for money. Age does not influence working linearly. The
other important factor is literacy. Taken separately, a literate woman has 13% less chances to be working. However, column
(8) shows that this is due entirely to caste and the significativity of it disappears when controlling for castes. The same
1 It is very similar to the schooling variable indicating the number of years the women went to school. I thus chose to keep only the literacy variable, as it even summarizes the results from schooling and gives a 0 (illiterate) ‐ 1 (read and write or read only) result.
2 Furthermore, the results are not biased by extreme households, as women are mostly alone (156 women) or two (24), and only three households contain 3 women and one four.
3 I do not show all the columns with the combined coefficients for matters of visibility and space.
40
happens for the number of children (+3%) and the land owned (‐0.82% per bigha) as the effect is not significant anymore
when controlling for age and caste. This is confirmed in the last column, which takes all the coefficients together.
Castes, originally bound to a particular profession, are still nowadays the major explanation for the difference in activity for
Palanpur women.
c) Mobility
Jatab women still have the monopoly of mobility in the village, as shown in Table 28. The probability for a Jatab woman to
be allowed to go to at least 5 (out of the asked 8) places alone is indeed 32% higher than for other castes. The coefficient
for being a Thakur woman is not significant, but it is (‐16%**) if you take it separately (and thus compare Thakur women to
all the other castes in the village).
However, mobility is an interesting example as it also depends on other factors. Thus, being 10 years older increases the
probability of being allowed to go out by 30%! Age at marriage is also significant (the older you marry, the less you go out),
but it is then absorbed by age and caste as shown in columns (4) and (5). Being literate reduces mobility, but as for age at
marriage, it is probably liked with “high” castes and traditional norms.
The number of children you have also increases mobility, with a gain of 13% per child. Controlling for caste and age, this
effect is still there even if it is reduced to 6%. These multiple regressions certainly cannot prove causality, but it is in line
with qualitative data. For a given age, a woman with a child would need and be allowed to go to the doctor for him for
instance, whereas a woman without children would not go out. Even for cases where the child would not be the reason for
going out, it is socially better accepted to see a woman walking in the village holding a child’s hand than a woman alone, as
if children were chaperones to their mothers. This is explained by the fact that a first birth means in some extent an outside
exposure (having to go to the doctor and for the delivery itself) and brings to an end the period of seclusion as a newly
married woman.
Equally interesting is the effect of land ownership. Even after controlling for age and caste, women in big land owner
families are less often authorized to go out. The coefficient shows that the probability to be allowed to go out for a woman
in a family with 10 bighas more would be 15% lower. This confirms the qualitative data, where it is said that one way to
show wealth for a man (within a given cast) consist in secluding his wife.
d) Freedom from threat
In matters of domestic violence, there are again differences within castes. Whereas Thakurs are within the average of the
group of Other women, Murao and Jatab women are much more often beaten. This is still the case even if a bit lower
controlling for all the other factors, as column (14) of Table 29 shows. A Murao woman still has 28% more and a Jatab
woman 19% more chances to be beaten at least occasionally.
Age and age at marriage both influence positively freedom from threat, i.e. older women (+1%) or women married later
(+4%/5%) are less often beaten. However, the effect of late marriage disappears when controlling for caste, as probably it
means not being a Jatab women (who are, as we saw, married earlier and beaten more often than average).
Distance to parents, literacy and the number of children do only affect the results after controlling for age and caste. For
instance, the 23% higher probability of being free from threat for literate woman is highly correlated to the fact that most
literate women are Thakur, and may not mean that having gone to school per se makes a woman more aware that she
should rebel against her husband beating her.
41
e) Media exposure
Can you afford a television or a radio? Are you literate and able to read a newspaper? Do you have a busy day with work
and child care or do you have time to have leisure? All these are factors that influence Media exposure. Table 30 shows the determinants of whether you do at least sometimes use at least one Media.
Land ownership is not significant in columns (12) and (13), but maybe because the group of landless is too heterogeneous
(some of these women do have access to Media because their husbands have good jobs in town) and thus not a so brilliant
proxy for wealth. Time certainly is a parameter but the effect of the number of children (‐4%) disappears when controlling
for age and caste.
Nevertheless, education is definitely highly significant, as a literate woman will have between 34% and 45% (depending on
the other controls) more chances to be exposed to Medias. Even within a caste and within an age group, a literate woman is
more interested in watching TV or listening to the radio.
Age at marriage is even significant (+4% in column 14) after controlling for everything, and is not only due to a cohort or a
literacy effect. This may reflect that parents who wanted to marry their daughter later may have been more educated
themselves and given their daughter the taste to be open to outside world.
f) Civic life
This last index, which mostly captures the women who go out for voting, is less interesting as the differences within
Palanpur stay mostly unexplained. Even if some coefficients are significant, nothing is anymore when putting all the
variables together in column (14).
This is mainly due to the fact that there are two antagonistic forces. On the one hand, the number of living children (+9%),
the caste (+13% for Muraos, +12% for Jatabs) or the age at marriage (+5%) push the probability of participating in civic life
up. On the other hand, literacy (‐29%) strongly goes into the other direction. This last fact is strange if one thinks education
could on the contrary drive people to be interested in civic life, but is probably due to the big correlation between Thakur
women and literacy. It thus mean that a Thakur woman, even if she is literate and interested in voting, may not be allowed
to go there as a newly married woman because she would have to mix up with everybody at the voting place.
4) Correlation between autonomy indicators
We saw that results are contrasted depending on the indicator used. Let us describe two extreme types of women. There is
on the one hand the newly married, educated and wealthy Thakur woman who is kept at home and does not work, but has
much more often access to Media and is rarely beaten. On the other hand, we would have an old Jatab woman from a poor
family who does paid work and thus can go out alone, but was married young and has a lot of children to take care of, has
neither access to Media nor has she an account, and her drunk husband beats her.
Can we conclude which woman is happier? Can we conclude which woman is more autonomous? Both are equally difficult.
If just adding the six indicators into one, they would maybe have both an average mark. I tried to do that, weighting the
indicators with a Principal component analysis, but it does not make really sense. However, what we can do is looking closer
at the correlations between the indicators. Table 24 shows that most of the coefficients are positively correlated to each
other, excepted from exposure to Media and partly freedom from threat (which is consistent with the image pictured above
from the unfree Thakur women who nevertheless watches TV and is rarely beaten). The other coefficients are correlated,
but not so much as one could think (around 20%), confirming the necessity of this multidimensional analysis.
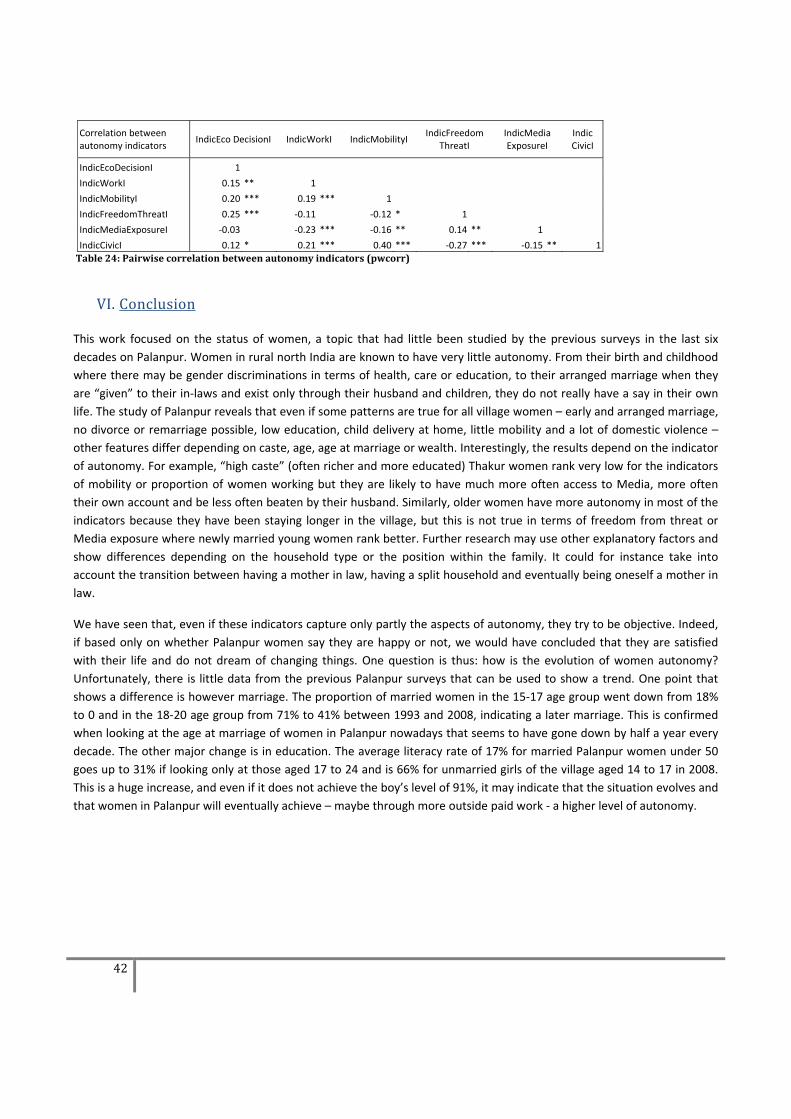
42
Correlation between autonomy indicators
IndicEco DecisionI IndicWorkI IndicMobilityI IndicFreedom
ThreatI IndicMedia ExposureI
Indic CivicI
IndicEcoDecisionI 1
IndicWorkI 0.15 ** 1
IndicMobilityI 0.20 *** 0.19 *** 1
IndicFreedomThreatI 0.25 *** ‐0.11 ‐0.12 * 1
IndicMediaExposureI ‐0.03 ‐0.23 *** ‐0.16 ** 0.14 ** 1
IndicCivicI 0.12 * 0.21 *** 0.40 *** ‐0.27 *** ‐0.15 ** 1
Table 24: Pairwise correlation between autonomy indicators (pwcorr)
VI. Conclusion
This work focused on the status of women, a topic that had little been studied by the previous surveys in the last six
decades on Palanpur. Women in rural north India are known to have very little autonomy. From their birth and childhood
where there may be gender discriminations in terms of health, care or education, to their arranged marriage when they
are “given” to their in‐laws and exist only through their husband and children, they do not really have a say in their own
life. The study of Palanpur reveals that even if some patterns are true for all village women – early and arranged marriage,
no divorce or remarriage possible, low education, child delivery at home, little mobility and a lot of domestic violence –
other features differ depending on caste, age, age at marriage or wealth. Interestingly, the results depend on the indicator
of autonomy. For example, “high caste” (often richer and more educated) Thakur women rank very low for the indicators
of mobility or proportion of women working but they are likely to have much more often access to Media, more often
their own account and be less often beaten by their husband. Similarly, older women have more autonomy in most of the
indicators because they have been staying longer in the village, but this is not true in terms of freedom from threat or
Media exposure where newly married young women rank better. Further research may use other explanatory factors and
show differences depending on the household type or the position within the family. It could for instance take into
account the transition between having a mother in law, having a split household and eventually being oneself a mother in
law.
We have seen that, even if these indicators capture only partly the aspects of autonomy, they try to be objective. Indeed,
if based only on whether Palanpur women say they are happy or not, we would have concluded that they are satisfied
with their life and do not dream of changing things. One question is thus: how is the evolution of women autonomy?
Unfortunately, there is little data from the previous Palanpur surveys that can be used to show a trend. One point that
shows a difference is however marriage. The proportion of married women in the 15‐17 age group went down from 18%
to 0 and in the 18‐20 age group from 71% to 41% between 1993 and 2008, indicating a later marriage. This is confirmed
when looking at the age at marriage of women in Palanpur nowadays that seems to have gone down by half a year every
decade. The other major change is in education. The average literacy rate of 17% for married Palanpur women under 50
goes up to 31% if looking only at those aged 17 to 24 and is 66% for unmarried girls of the village aged 14 to 17 in 2008.
This is a huge increase, and even if it does not achieve the boy’s level of 91%, it may indicate that the situation evolves and
that women in Palanpur will eventually achieve – maybe through more outside paid work ‐ a higher level of autonomy.
43
VII. References
1) Bibliography
Bliss C.J., and N. H. Stern (1982), Palanpur, The Economy of an Indian village, Oxford University Press
Bloom S., D. Wypij D. and M. Das Gupta (2001), Dimensions of Women’s Autonomy and the Influence on Maternal Health Care Utilization in a North Indian City, Demography, Vol. 38, No. 1, 67‐78
Camfield L. (2006), The Why and How of Understanding 'Subjective' Wellbeing: Exploratory Work by the WeD Group in Four Developing Countries, Working Paper 26, Wellbeing in Developing Countries Research Group
Deliège, R. (2004), Les castes en Inde aujourd’hui, Sociologie d’aujourd’hui, Presses Universitaires de France
Dharmalingam A. and S. Philip Morgan (1996), Women’s Work, Autonomy and Birth Control: Evidence From Two South Indian Villages, Population Studies, Vol. 50, No. 2
Diener E. and R. BiswasDiner (2005), Psychological Empowerment and subjective wellbeing, in D. Narayan‐Parker (ed.) Measuring empowerment: crossdisciplinary perspectives, Chap. 6, World Bank Publications
Dyson T. and M. Moore (1983), On kinship structure, female autonomy and demographic behavior in India, Population and Development Review, Vol. 9, No.1, 35‐60
Eswaran, M. and N. Malhotra (2009), Domestic Violence and Womens Autonomy: Evidence from India, Working Paper, University of British Columbia
Ghuman S., H.J. Lee and H.L. Smith (2004), Measurement of women’s autonomy according to women and their husbands: Results from five Asian countries, Social Science Research 35, 1‐28
Jejeebhoy S. (2000),Women's Autonomy in Rural India: Its Dimensions, Determinants and the Influence of Context, in H.B. Presser and G. Sen (eds.) Women's empowerment and demographic processes: moving beyond Cairo Chap. 9, Oxford University Press
Kabeer N. (2000), Resources, Agency, Achievements: Reflections on the Measurement of Women’s Empowerment in
Shahra Razavi (ed.) Gendered poverty and well‐being, Chap.2, Blackwell
Lanjouw P. and N.H. Stern (eds.) (1998), Economic Development in Palanpur over Five Decades, Clarendon Press, Oxford, 1998.
Maneja C.A. (2002), Women, Weaving, and the Web: An Analysis of Rural Indian Women’s Agency in Attaining Economic Empowerment, Unpublished master’s thesis, Georgetown University, Washington, DC Mason K.O. (1986), The Status of Women: Conceptual and Methodological Issues in Demographic Studies, Sociological Forum, Vol. 1 No. 2, Springer
Mason K.O. (2005), Measuring Women’s Empowerment: Learning from CrossNational Research, in D. Narayan‐Parker (ed.) Measuring empowerment: crossdisciplinary perspectives, Chap. 4, World Bank Publications
Moore M., M. Choudhary and N. Singh (1998), How can we know what they want? Understanding local perceptions of poverty and illbeing in Asia, IDS Working Paper No. 8, Brighton, Sussex
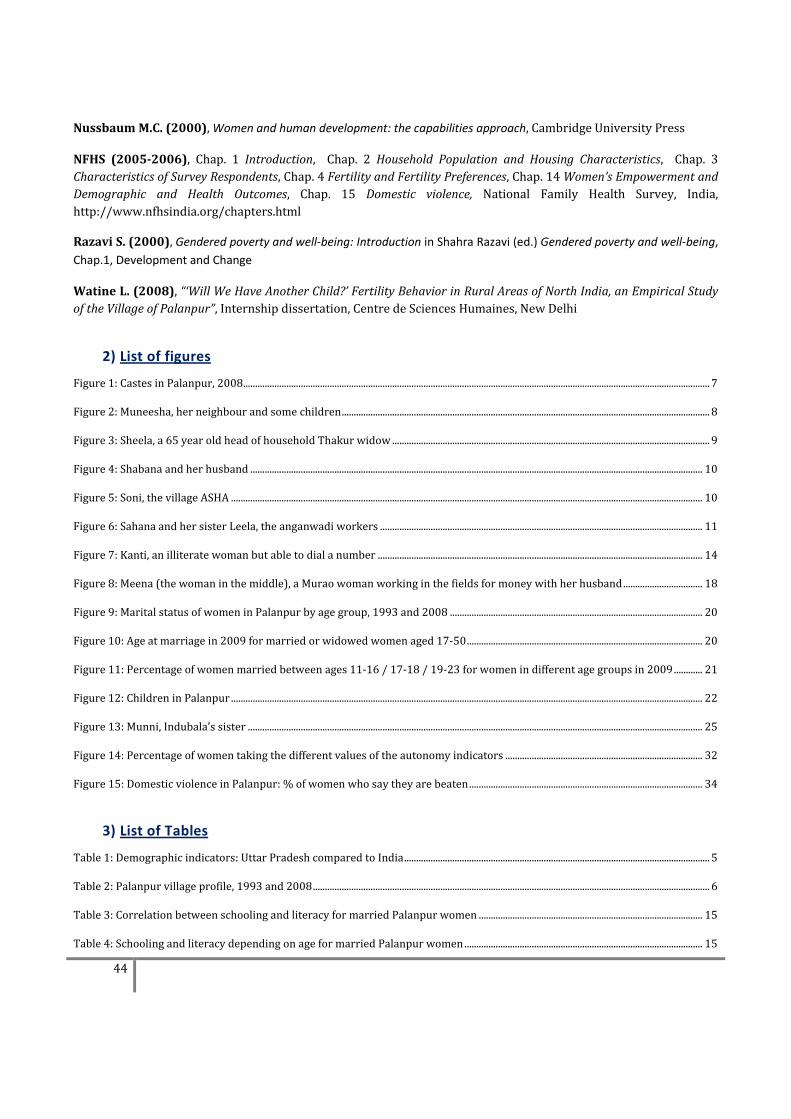
44
Nussbaum M.C. (2000), Women and human development: the capabilities approach, Cambridge University Press
NFHS (20052006), Chap. 1 Introduction, Chap. 2 Household Population and Housing Characteristics, Chap. 3 Characteristics of Survey Respondents, Chap. 4 Fertility and Fertility Preferences, Chap. 14 Women’s Empowerment and Demographic and Health Outcomes, Chap. 15 Domestic violence, National Family Health Survey, India, http://www.nfhsindia.org/chapters.html
Razavi S. (2000), Gendered poverty and well‐being: Introduction in Shahra Razavi (ed.) Gendered poverty and well‐being, Chap.1, Development and Change
Watine L. (2008), “‘Will We Have Another Child?’ Fertility Behavior in Rural Areas of North India, an Empirical Study of the Village of Palanpur”, Internship dissertation, Centre de Sciences Humaines, New Delhi
2) List of figures
Figure 1: Castes in Palanpur, 2008 .................................................................................................................................................................................................. 7
Figure 2: Muneesha, her neighbour and some children ......................................................................................................................................................... 8
Figure 3: Sheela, a 65 year old head of household Thakur widow .................................................................................................................................... 9
Figure 4: Shabana and her husband ............................................................................................................................................................................................ 10
Figure 5: Soni, the village ASHA .................................................................................................................................................................................................... 10
Figure 6: Sahana and her sister Leela, the anganwadi workers ...................................................................................................................................... 11
Figure 7: Kanti, an illiterate woman but able to dial a number ....................................................................................................................................... 14
Figure 8: Meena (the woman in the middle), a Murao woman working in the fields for money with her husband ................................. 18
Figure 9: Marital status of women in Palanpur by age group, 1993 and 2008 ......................................................................................................... 20
Figure 10: Age at marriage in 2009 for married or widowed women aged 17‐50 .................................................................................................. 20
Figure 11: Percentage of women married between ages 11‐16 / 17‐18 / 19‐23 for women in different age groups in 2009 ............ 21
Figure 12: Children in Palanpur .................................................................................................................................................................................................... 22
Figure 13: Munni, Indubala’s sister ............................................................................................................................................................................................. 25
Figure 14: Percentage of women taking the different values of the autonomy indicators .................................................................................. 32
Figure 15: Domestic violence in Palanpur: % of women who say they are beaten ................................................................................................. 34
3) List of Tables
Table 1: Demographic indicators: Uttar Pradesh compared to India ............................................................................................................................... 5
Table 2: Palanpur village profile, 1993 and 2008 ..................................................................................................................................................................... 6
Table 3: Correlation between schooling and literacy for married Palanpur women ............................................................................................. 15
Table 4: Schooling and literacy depending on age for married Palanpur women ................................................................................................... 15
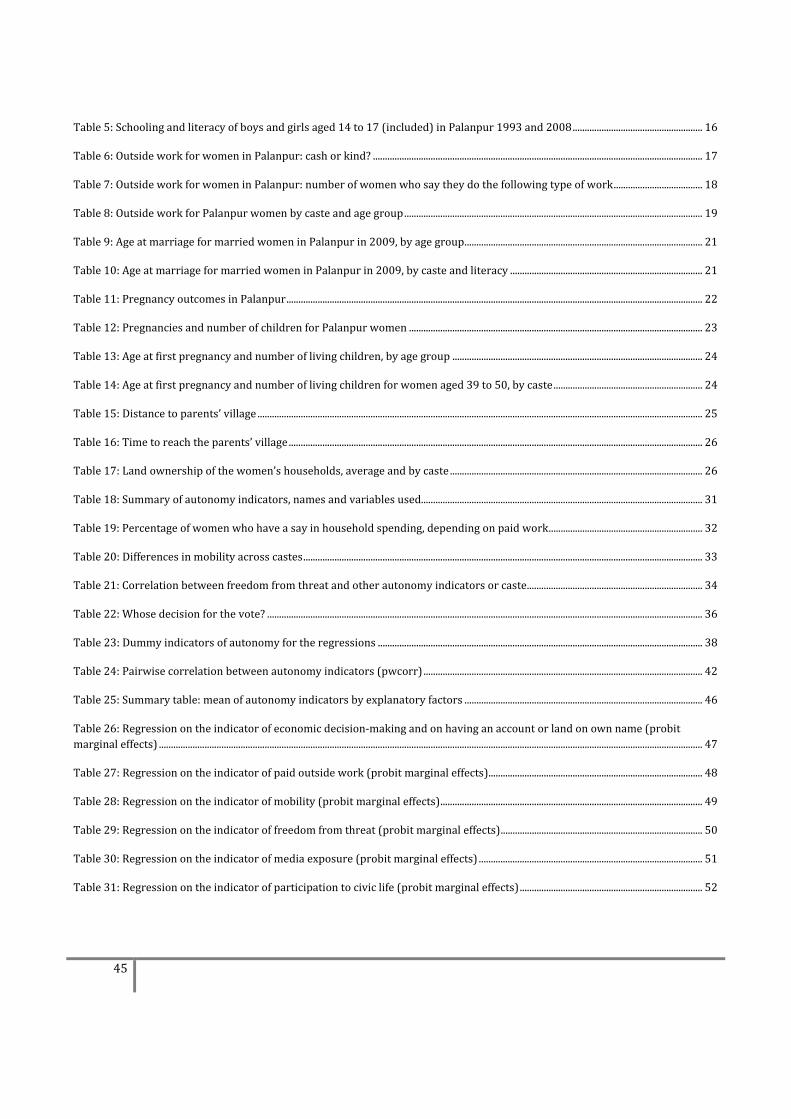
45
Table 5: Schooling and literacy of boys and girls aged 14 to 17 (included) in Palanpur 1993 and 2008 ...................................................... 16
Table 6: Outside work for women in Palanpur: cash or kind? ......................................................................................................................................... 17
Table 7: Outside work for women in Palanpur: number of women who say they do the following type of work ..................................... 18
Table 8: Outside work for Palanpur women by caste and age group ............................................................................................................................ 19
Table 9: Age at marriage for married women in Palanpur in 2009, by age group ................................................................................................... 21
Table 10: Age at marriage for married women in Palanpur in 2009, by caste and literacy ................................................................................ 21
Table 11: Pregnancy outcomes in Palanpur ............................................................................................................................................................................. 22
Table 12: Pregnancies and number of children for Palanpur women .......................................................................................................................... 23
Table 13: Age at first pregnancy and number of living children, by age group ........................................................................................................ 24
Table 14: Age at first pregnancy and number of living children for women aged 39 to 50, by caste .............................................................. 24
Table 15: Distance to parents’ village ......................................................................................................................................................................................... 25
Table 16: Time to reach the parents’ village ............................................................................................................................................................................ 26
Table 17: Land ownership of the women’s households, average and by caste ......................................................................................................... 26
Table 18: Summary of autonomy indicators, names and variables used..................................................................................................................... 31
Table 19: Percentage of women who have a say in household spending, depending on paid work ................................................................ 32
Table 20: Differences in mobility across castes ...................................................................................................................................................................... 33
Table 21: Correlation between freedom from threat and other autonomy indicators or caste ......................................................................... 34
Table 22: Whose decision for the vote? ..................................................................................................................................................................................... 36
Table 23: Dummy indicators of autonomy for the regressions ....................................................................................................................................... 38
Table 24: Pairwise correlation between autonomy indicators (pwcorr) .................................................................................................................... 42
Table 25: Summary table: mean of autonomy indicators by explanatory factors ................................................................................................... 46
Table 26: Regression on the indicator of economic decision‐making and on having an account or land on own name (probit marginal effects) .................................................................................................................................................................................................................................. 47
Table 27: Regression on the indicator of paid outside work (probit marginal effects) ......................................................................................... 48
Table 28: Regression on the indicator of mobility (probit marginal effects) ............................................................................................................. 49
Table 29: Regression on the indicator of freedom from threat (probit marginal effects) .................................................................................... 50
Table 30: Regression on the indicator of media exposure (probit marginal effects) ............................................................................................. 51
Table 31: Regression on the indicator of participation to civic life (probit marginal effects) ............................................................................ 52
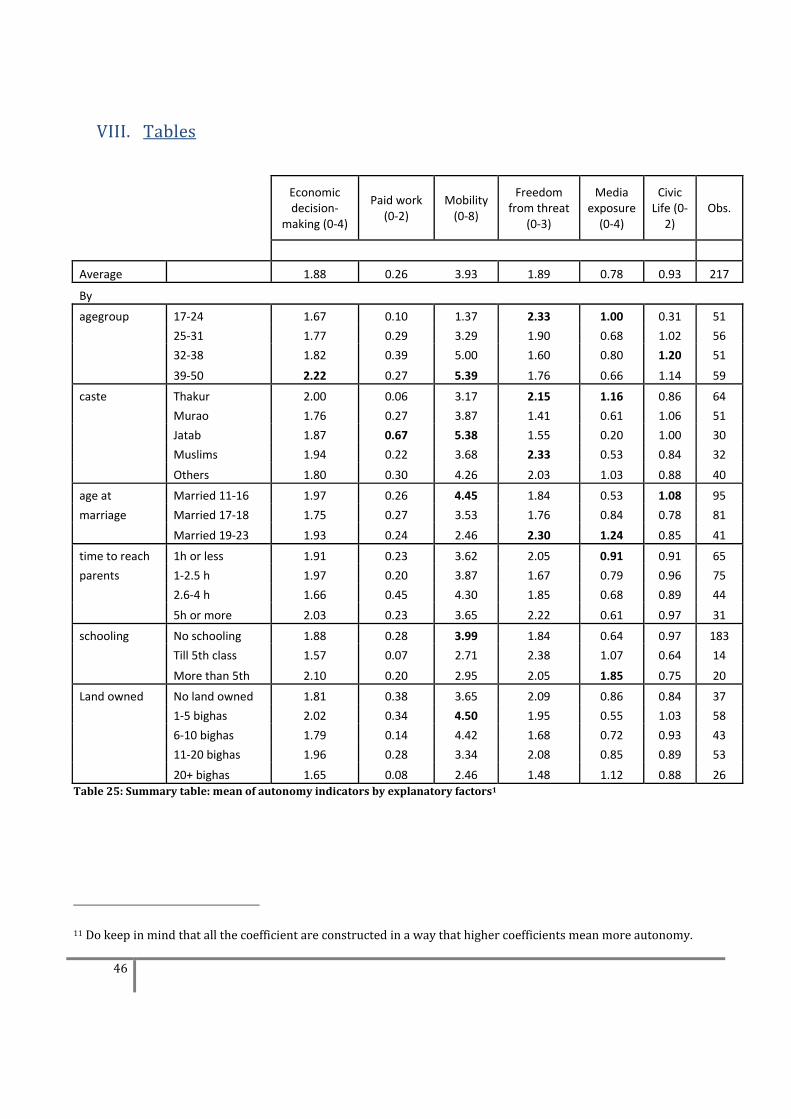
46
VIII. Tables
Economic decision‐
making (0‐4)
Paid work (0‐2)
Mobility (0‐8)
Freedom from threat
(0‐3)
Media exposure (0‐4)
Civic Life (0‐2)
Obs.
Average 1.88 0.26 3.93 1.89 0.78 0.93 217
By
agegroup 17‐24 1.67 0.10 1.37 2.33 1.00 0.31 51
25‐31 1.77 0.29 3.29 1.90 0.68 1.02 56
32‐38 1.82 0.39 5.00 1.60 0.80 1.20 51
39‐50 2.22 0.27 5.39 1.76 0.66 1.14 59
caste Thakur 2.00 0.06 3.17 2.15 1.16 0.86 64
Murao 1.76 0.27 3.87 1.41 0.61 1.06 51
Jatab 1.87 0.67 5.38 1.55 0.20 1.00 30
Muslims 1.94 0.22 3.68 2.33 0.53 0.84 32
Others 1.80 0.30 4.26 2.03 1.03 0.88 40
age at Married 11‐16 1.97 0.26 4.45 1.84 0.53 1.08 95
marriage Married 17‐18 1.75 0.27 3.53 1.76 0.84 0.78 81
Married 19‐23 1.93 0.24 2.46 2.30 1.24 0.85 41
time to reach 1h or less 1.91 0.23 3.62 2.05 0.91 0.91 65
parents 1‐2.5 h 1.97 0.20 3.87 1.67 0.79 0.96 75
2.6‐4 h 1.66 0.45 4.30 1.85 0.68 0.89 44
5h or more 2.03 0.23 3.65 2.22 0.61 0.97 31
schooling No schooling 1.88 0.28 3.99 1.84 0.64 0.97 183
Till 5th class 1.57 0.07 2.71 2.38 1.07 0.64 14
More than 5th 2.10 0.20 2.95 2.05 1.85 0.75 20
Land owned No land owned 1.81 0.38 3.65 2.09 0.86 0.84 37
1‐5 bighas 2.02 0.34 4.50 1.95 0.55 1.03 58
6‐10 bighas 1.79 0.14 4.42 1.68 0.72 0.93 43
11‐20 bighas 1.96 0.28 3.34 2.08 0.85 0.89 53
20+ bighas 1.65 0.08 2.46 1.48 1.12 0.88 26 Table 25: Summary table: mean of autonomy indicators by explanatory factors1
11 Do keep in mind that all the coefficient are constructed in a way that higher coefficients mean more autonomy.
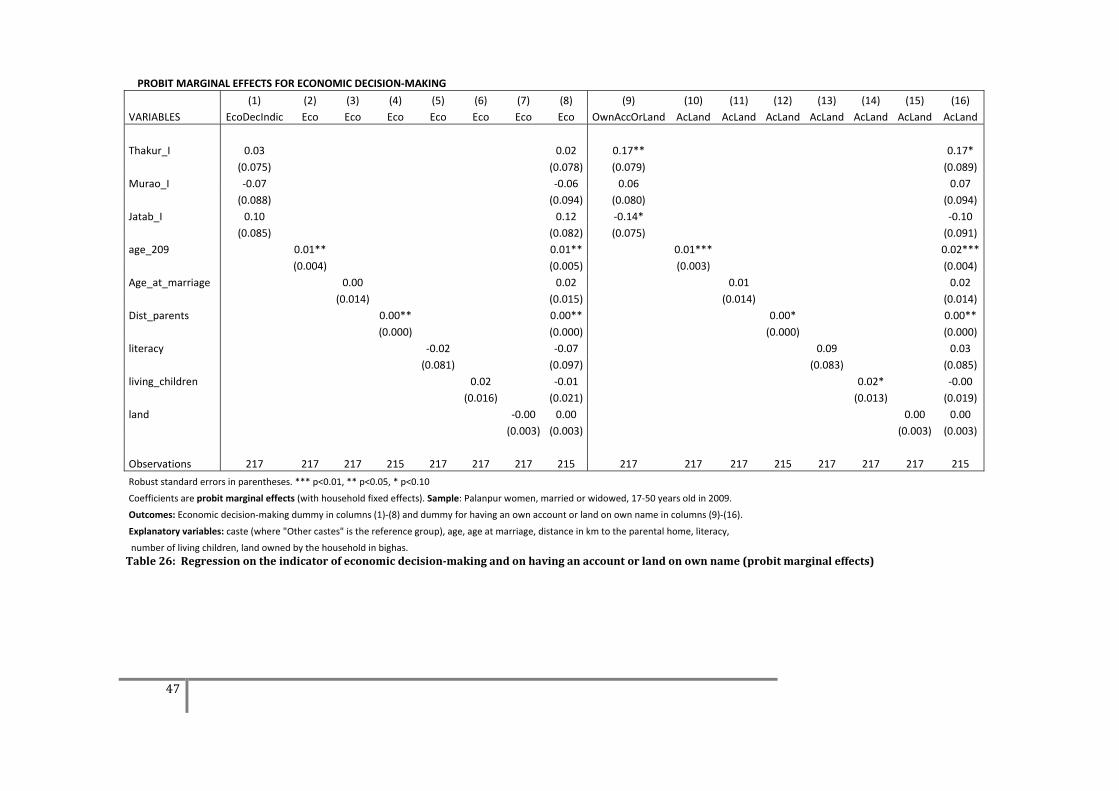
47
PROBIT MARGINAL EFFECTS FOR ECONOMIC DECISION‐MAKING
(1) (2) (3) (4) (5) (6) (7) (8) (9) (10) (11) (12) (13) (14) (15) (16)
VARIABLES EcoDecIndic Eco Eco Eco Eco Eco Eco Eco OwnAccOrLand AcLand AcLand AcLand AcLand AcLand AcLand AcLand
Thakur_I 0.03 0.02 0.17** 0.17*
(0.075) (0.078) (0.079) (0.089)
Murao_I ‐0.07 ‐0.06 0.06 0.07
(0.088) (0.094) (0.080) (0.094)
Jatab_I 0.10 0.12 ‐0.14* ‐0.10
(0.085) (0.082) (0.075) (0.091)
age_209 0.01** 0.01** 0.01*** 0.02***
(0.004) (0.005) (0.003) (0.004)
Age_at_marriage 0.00 0.02 0.01 0.02
(0.014) (0.015) (0.014) (0.014)
Dist_parents 0.00** 0.00** 0.00* 0.00**
(0.000) (0.000) (0.000) (0.000)
literacy ‐0.02 ‐0.07 0.09 0.03
(0.081) (0.097) (0.083) (0.085)
living_children 0.02 ‐0.01 0.02* ‐0.00
(0.016) (0.021) (0.013) (0.019)
land ‐0.00 0.00 0.00 0.00
(0.003) (0.003) (0.003) (0.003)
Observations 217 217 217 215 217 217 217 215 217 217 217 215 217 217 217 215
Robust standard errors in parentheses. *** p<0.01, ** p<0.05, * p<0.10
Coefficients are probit marginal effects (with household fixed effects). Sample: Palanpur women, married or widowed, 17‐50 years old in 2009.
Outcomes: Economic decision‐making dummy in columns (1)‐(8) and dummy for having an own account or land on own name in columns (9)‐(16). Explanatory variables: caste (where "Other castes" is the reference group), age, age at marriage, distance in km to the parental home, literacy, number of living children, land owned by the household in bighas. Table 26: Regression on the indicator of economic decisionmaking and on having an account or land on own name (probit marginal effects)
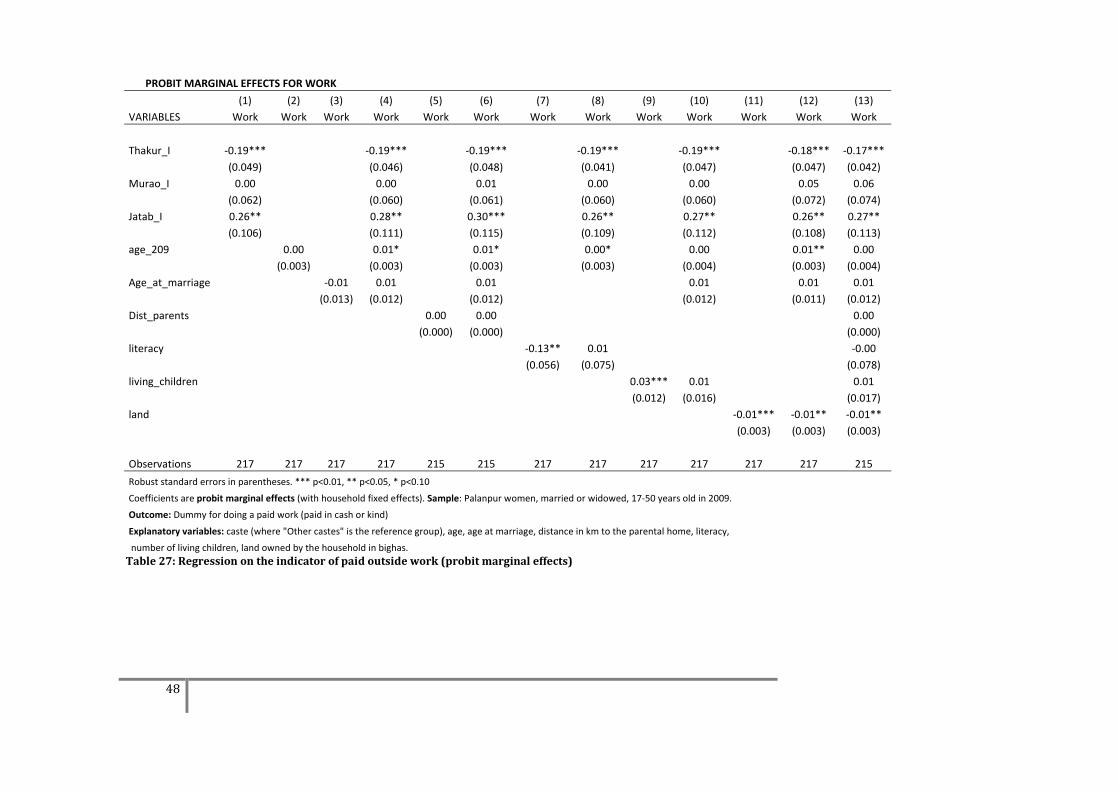
48
PROBIT MARGINAL EFFECTS FOR WORK
(1) (2) (3) (4) (5) (6) (7) (8) (9) (10) (11) (12) (13)
VARIABLES Work Work Work Work Work Work Work Work Work Work Work Work Work
Thakur_I ‐0.19*** ‐0.19*** ‐0.19*** ‐0.19*** ‐0.19*** ‐0.18*** ‐0.17***
(0.049) (0.046) (0.048) (0.041) (0.047) (0.047) (0.042)
Murao_I 0.00 0.00 0.01 0.00 0.00 0.05 0.06
(0.062) (0.060) (0.061) (0.060) (0.060) (0.072) (0.074)
Jatab_I 0.26** 0.28** 0.30*** 0.26** 0.27** 0.26** 0.27**
(0.106) (0.111) (0.115) (0.109) (0.112) (0.108) (0.113)
age_209 0.00 0.01* 0.01* 0.00* 0.00 0.01** 0.00
(0.003) (0.003) (0.003) (0.003) (0.004) (0.003) (0.004)
Age_at_marriage ‐0.01 0.01 0.01 0.01 0.01 0.01
(0.013) (0.012) (0.012) (0.012) (0.011) (0.012)
Dist_parents 0.00 0.00 0.00
(0.000) (0.000) (0.000)
literacy ‐0.13** 0.01 ‐0.00
(0.056) (0.075) (0.078)
living_children 0.03*** 0.01 0.01
(0.012) (0.016) (0.017)
land ‐0.01*** ‐0.01** ‐0.01**
(0.003) (0.003) (0.003)
Observations 217 217 217 217 215 215 217 217 217 217 217 217 215
Robust standard errors in parentheses. *** p<0.01, ** p<0.05, * p<0.10
Coefficients are probit marginal effects (with household fixed effects). Sample: Palanpur women, married or widowed, 17‐50 years old in 2009.
Outcome: Dummy for doing a paid work (paid in cash or kind)
Explanatory variables: caste (where "Other castes" is the reference group), age, age at marriage, distance in km to the parental home, literacy,
number of living children, land owned by the household in bighas.
Table 27: Regression on the indicator of paid outside work (probit marginal effects)
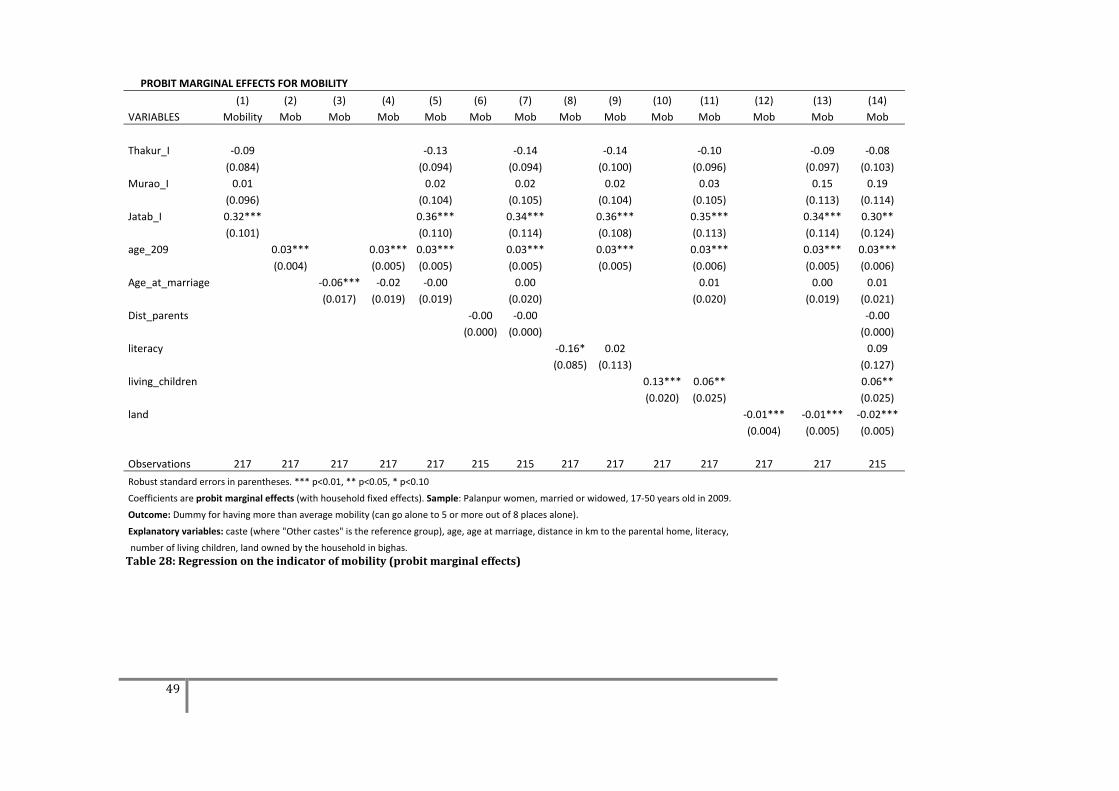
49
PROBIT MARGINAL EFFECTS FOR MOBILITY
(1) (2) (3) (4) (5) (6) (7) (8) (9) (10) (11) (12) (13) (14)
VARIABLES Mobility Mob Mob Mob Mob Mob Mob Mob Mob Mob Mob Mob Mob Mob
Thakur_I ‐0.09 ‐0.13 ‐0.14 ‐0.14 ‐0.10 ‐0.09 ‐0.08
(0.084) (0.094) (0.094) (0.100) (0.096) (0.097) (0.103)
Murao_I 0.01 0.02 0.02 0.02 0.03 0.15 0.19
(0.096) (0.104) (0.105) (0.104) (0.105) (0.113) (0.114)
Jatab_I 0.32*** 0.36*** 0.34*** 0.36*** 0.35*** 0.34*** 0.30**
(0.101) (0.110) (0.114) (0.108) (0.113) (0.114) (0.124)
age_209 0.03*** 0.03*** 0.03*** 0.03*** 0.03*** 0.03*** 0.03*** 0.03***
(0.004) (0.005) (0.005) (0.005) (0.005) (0.006) (0.005) (0.006)
Age_at_marriage ‐0.06*** ‐0.02 ‐0.00 0.00 0.01 0.00 0.01
(0.017) (0.019) (0.019) (0.020) (0.020) (0.019) (0.021)
Dist_parents ‐0.00 ‐0.00 ‐0.00
(0.000) (0.000) (0.000)
literacy ‐0.16* 0.02 0.09
(0.085) (0.113) (0.127)
living_children 0.13*** 0.06** 0.06**
(0.020) (0.025) (0.025)
land ‐0.01*** ‐0.01*** ‐0.02***
(0.004) (0.005) (0.005)
Observations 217 217 217 217 217 215 215 217 217 217 217 217 217 215
Robust standard errors in parentheses. *** p<0.01, ** p<0.05, * p<0.10
Coefficients are probit marginal effects (with household fixed effects). Sample: Palanpur women, married or widowed, 17‐50 years old in 2009.
Outcome: Dummy for having more than average mobility (can go alone to 5 or more out of 8 places alone). Explanatory variables: caste (where "Other castes" is the reference group), age, age at marriage, distance in km to the parental home, literacy, number of living children, land owned by the household in bighas. Table 28: Regression on the indicator of mobility (probit marginal effects)
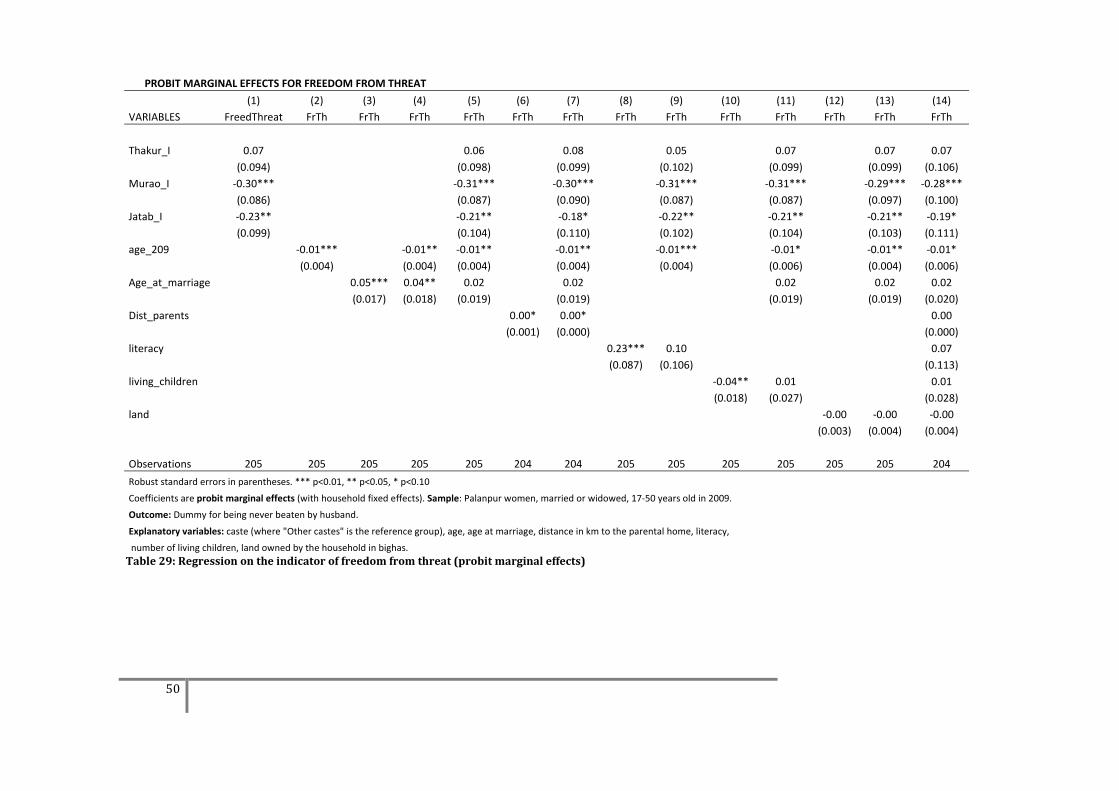
50
PROBIT MARGINAL EFFECTS FOR FREEDOM FROM THREAT
(1) (2) (3) (4) (5) (6) (7) (8) (9) (10) (11) (12) (13) (14)
VARIABLES FreedThreat FrTh FrTh FrTh FrTh FrTh FrTh FrTh FrTh FrTh FrTh FrTh FrTh FrTh
Thakur_I 0.07 0.06 0.08 0.05 0.07 0.07 0.07
(0.094) (0.098) (0.099) (0.102) (0.099) (0.099) (0.106)
Murao_I ‐0.30*** ‐0.31*** ‐0.30*** ‐0.31*** ‐0.31*** ‐0.29*** ‐0.28***
(0.086) (0.087) (0.090) (0.087) (0.087) (0.097) (0.100)
Jatab_I ‐0.23** ‐0.21** ‐0.18* ‐0.22** ‐0.21** ‐0.21** ‐0.19*
(0.099) (0.104) (0.110) (0.102) (0.104) (0.103) (0.111)
age_209 ‐0.01*** ‐0.01** ‐0.01** ‐0.01** ‐0.01*** ‐0.01* ‐0.01** ‐0.01*
(0.004) (0.004) (0.004) (0.004) (0.004) (0.006) (0.004) (0.006)
Age_at_marriage 0.05*** 0.04** 0.02 0.02 0.02 0.02 0.02
(0.017) (0.018) (0.019) (0.019) (0.019) (0.019) (0.020)
Dist_parents 0.00* 0.00* 0.00
(0.001) (0.000) (0.000)
literacy 0.23*** 0.10 0.07
(0.087) (0.106) (0.113)
living_children ‐0.04** 0.01 0.01
(0.018) (0.027) (0.028)
land ‐0.00 ‐0.00 ‐0.00
(0.003) (0.004) (0.004)
Observations 205 205 205 205 205 204 204 205 205 205 205 205 205 204
Robust standard errors in parentheses. *** p<0.01, ** p<0.05, * p<0.10
Coefficients are probit marginal effects (with household fixed effects). Sample: Palanpur women, married or widowed, 17‐50 years old in 2009.
Outcome: Dummy for being never beaten by husband. Explanatory variables: caste (where "Other castes" is the reference group), age, age at marriage, distance in km to the parental home, literacy, number of living children, land owned by the household in bighas. Table 29: Regression on the indicator of freedom from threat (probit marginal effects)
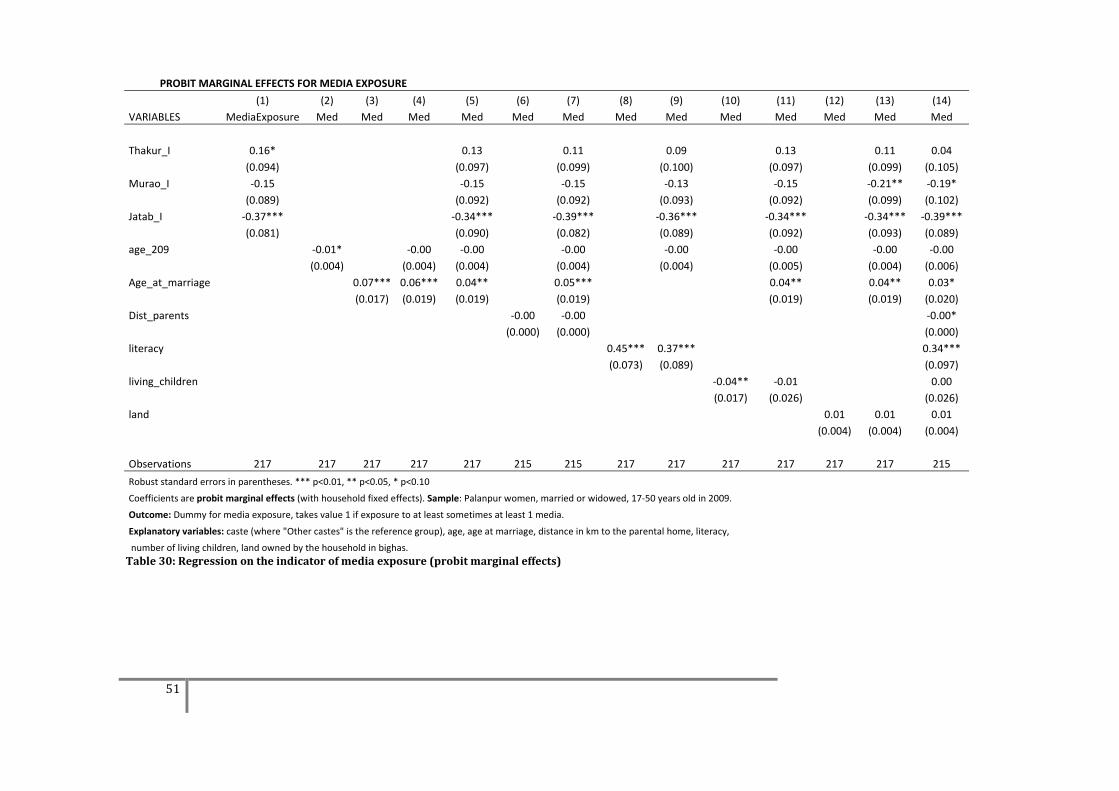
51
PROBIT MARGINAL EFFECTS FOR MEDIA EXPOSURE
(1) (2) (3) (4) (5) (6) (7) (8) (9) (10) (11) (12) (13) (14)
VARIABLES MediaExposure Med Med Med Med Med Med Med Med Med Med Med Med Med
Thakur_I 0.16* 0.13 0.11 0.09 0.13 0.11 0.04
(0.094) (0.097) (0.099) (0.100) (0.097) (0.099) (0.105)
Murao_I ‐0.15 ‐0.15 ‐0.15 ‐0.13 ‐0.15 ‐0.21** ‐0.19*
(0.089) (0.092) (0.092) (0.093) (0.092) (0.099) (0.102)
Jatab_I ‐0.37*** ‐0.34*** ‐0.39*** ‐0.36*** ‐0.34*** ‐0.34*** ‐0.39***
(0.081) (0.090) (0.082) (0.089) (0.092) (0.093) (0.089)
age_209 ‐0.01* ‐0.00 ‐0.00 ‐0.00 ‐0.00 ‐0.00 ‐0.00 ‐0.00
(0.004) (0.004) (0.004) (0.004) (0.004) (0.005) (0.004) (0.006)
Age_at_marriage 0.07*** 0.06*** 0.04** 0.05*** 0.04** 0.04** 0.03*
(0.017) (0.019) (0.019) (0.019) (0.019) (0.019) (0.020)
Dist_parents ‐0.00 ‐0.00 ‐0.00*
(0.000) (0.000) (0.000)
literacy 0.45*** 0.37*** 0.34***
(0.073) (0.089) (0.097)
living_children ‐0.04** ‐0.01 0.00
(0.017) (0.026) (0.026)
land 0.01 0.01 0.01
(0.004) (0.004) (0.004)
Observations 217 217 217 217 217 215 215 217 217 217 217 217 217 215
Robust standard errors in parentheses. *** p<0.01, ** p<0.05, * p<0.10
Coefficients are probit marginal effects (with household fixed effects). Sample: Palanpur women, married or widowed, 17‐50 years old in 2009.
Outcome: Dummy for media exposure, takes value 1 if exposure to at least sometimes at least 1 media. Explanatory variables: caste (where "Other castes" is the reference group), age, age at marriage, distance in km to the parental home, literacy, number of living children, land owned by the household in bighas. Table 30: Regression on the indicator of media exposure (probit marginal effects)
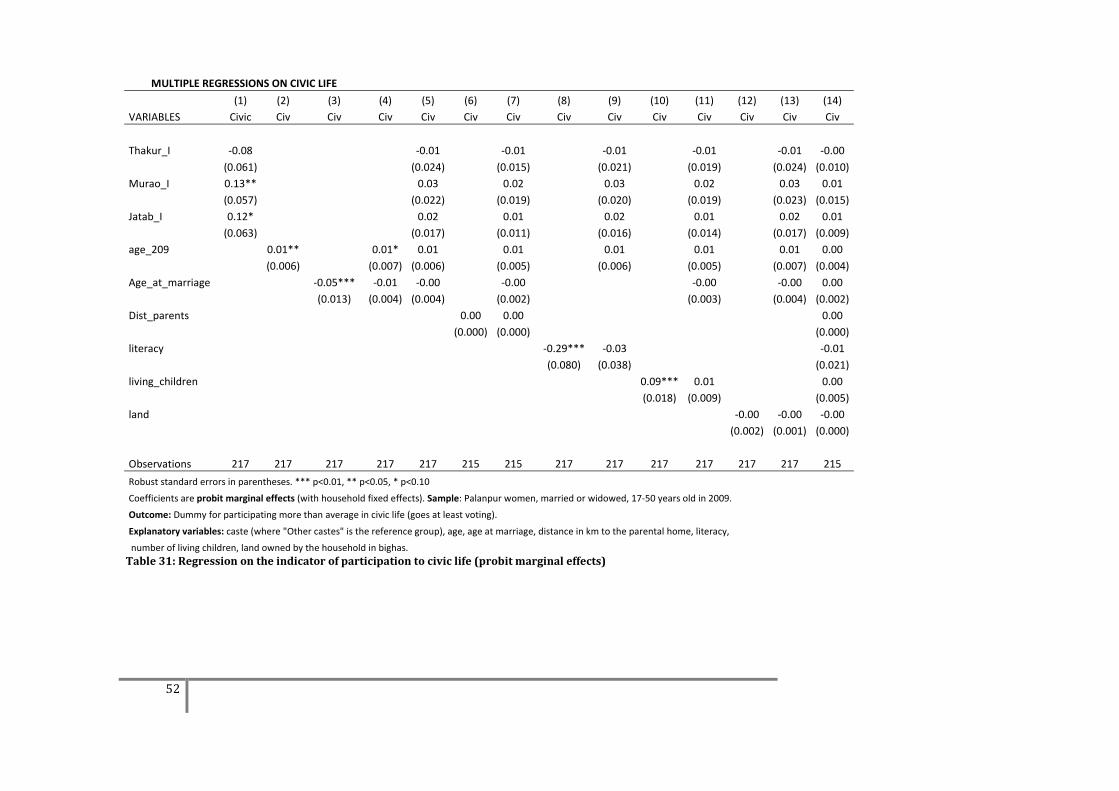
52
MULTIPLE REGRESSIONS ON CIVIC LIFE
(1) (2) (3) (4) (5) (6) (7) (8) (9) (10) (11) (12) (13) (14)
VARIABLES Civic Civ Civ Civ Civ Civ Civ Civ Civ Civ Civ Civ Civ Civ
Thakur_I ‐0.08 ‐0.01 ‐0.01 ‐0.01 ‐0.01 ‐0.01 ‐0.00
(0.061) (0.024) (0.015) (0.021) (0.019) (0.024) (0.010)
Murao_I 0.13** 0.03 0.02 0.03 0.02 0.03 0.01
(0.057) (0.022) (0.019) (0.020) (0.019) (0.023) (0.015)
Jatab_I 0.12* 0.02 0.01 0.02 0.01 0.02 0.01
(0.063) (0.017) (0.011) (0.016) (0.014) (0.017) (0.009)
age_209 0.01** 0.01* 0.01 0.01 0.01 0.01 0.01 0.00
(0.006) (0.007) (0.006) (0.005) (0.006) (0.005) (0.007) (0.004)
Age_at_marriage ‐0.05*** ‐0.01 ‐0.00 ‐0.00 ‐0.00 ‐0.00 0.00
(0.013) (0.004) (0.004) (0.002) (0.003) (0.004) (0.002)
Dist_parents 0.00 0.00 0.00
(0.000) (0.000) (0.000)
literacy ‐0.29*** ‐0.03 ‐0.01
(0.080) (0.038) (0.021)
living_children 0.09*** 0.01 0.00
(0.018) (0.009) (0.005)
land ‐0.00 ‐0.00 ‐0.00
(0.002) (0.001) (0.000)
Observations 217 217 217 217 217 215 215 217 217 217 217 217 217 215
Robust standard errors in parentheses. *** p<0.01, ** p<0.05, * p<0.10
Coefficients are probit marginal effects (with household fixed effects). Sample: Palanpur women, married or widowed, 17‐50 years old in 2009.
Outcome: Dummy for participating more than average in civic life (goes at least voting). Explanatory variables: caste (where "Other castes" is the reference group), age, age at marriage, distance in km to the parental home, literacy, number of living children, land owned by the household in bighas. Table 31: Regression on the indicator of participation to civic life (probit marginal effects)