Working Papers in Trade and Development - CiteSeerX
79
Working Papers in Trade and Development Production Networks and Trade Patterns: East Asia in a Global Context Prema-chandra Athukorala October 2009 Working Paper No. 2009/15 The Arndt-Corden Division of Economics ANU College of Asia and the Pacific
-
Upload
khangminh22 -
Category
Documents
-
view
3 -
download
0
Transcript of Working Papers in Trade and Development - CiteSeerX

Working Papers in
Trade and Development
Production Networks and Trade Patterns:
East Asia in a Global Context
Prema-chandra Athukorala
October 2009
Working Paper No. 2009/15
The Arndt-Corden Division of Economics ANU College of Asia and the Pacific

1

2
Production Networks and Trade Patterns:
East Asia in a Global Context
Prema-chandra Athukorala The Arndt-Corden Division of Economics
College of Asia and the Pacific The Australian National University
Corresponding Address : Prema-chandra Athukorala
The Arndt-Corden Division of Economics College of Asia and the Pacific
The Australian National University Canberra ACT 0200
Email: [email protected]
October 2009 Working paper No. 2009/15

3
This Working Paper series provides a vehicle for preliminary circulation of research results in the fields of economic development and international trade. The series is intended to stimulate discussion and critical comment. Staff and visitors in any part of the Australian National University are encouraged to contribute. To facilitate prompt distribution, papers are screened, but not formally refereed. Copies may be obtained from WWW Site http://rspas.anu.edu.au/economics/publications.php

4
Production Networks and Trade Patterns:
East Asia in a Global Context
Prema-chandra Athukorala
Arndt-Corden Division of Economics Crawford School of Economics and Government
Australian National University E-mail: [email protected]
Abstract: This paper examines the implications of global production sharing for economic integration in East Asia, with emphasis on the behaviour of trade flows in the wake of the 2008 global economic crisis. It is found that, while ‘network trade’ has generally grown faster than total world trade in manufacturing, the degree of dependence of East Asia on this new form of international specialisation is proportionately larger than elsewhere in the world. Trade within production networks has certainly strengthened economic interdependence among countries in the region, with China playing a pivotal role as the premier centre of final assembly. However, this, contrary to the popular belief, has not lessened the dependence of export dynamism of these countries on the global economy. The rise of global production sharing has strengthened the case for a global, rather than a regional, approach to trade and investment policymaking. Key words: production sharing, trade patterns, East Asia, China JEL Classification: F10, F14, O53

5
Production Networks and Trade Patterns:
East Asia in a Global Context
1. Introduction
Global production sharing— the break-up of the production process into geographically separated
stages— has been an increasingly important facet of economic globalisation over the past three
decades. 1 With a modest start in electronics and clothing industries, multinational production
networks have gradually evolved and spread into many industries such as sport footwear,
automobiles, televisions and radio receivers, sewing machines, office equipment, power and
machine tools, cameras and watches, and printing and publishing. This great transformation in
world trade has been underpinned by three mutually reinforcing developments. First, rapid
advancements in production technology have enabled the industry to slice the value chain into
finer, ‘portable’, components. Second, technological innovations in communication and
transportation have shrunk the distance that once separated the world’s nations, and improved the
speed, efficiency and economy of coordinating geographically dispersed production processes.
This has facilitated the establishment of ‘services links’ to combine various fragments of the
production process in a timely and cost-effective manner. Third, liberalisation policy reforms in
both home and host countries have considerably removed barriers to trade and investment (Jones
2000; Jones and Kierzkowski 2001).
Global production sharing has evolved through three distinct phases. At the formative
stage, the production sharing involved locating small fragments of the production process in a
low-cost country and reimporting the assembled components to be incorporated in the final
product. Subsequently, production networks began to encompass many countries engaged in the
assembly process at different stages, resulting in multiple border crossings by product fragments
before they are incorporated in the final product. As international networks of parts and
comments supply have become firmly established, producers in advanced countries have begun to
move the final assembly of an increasing range of consumer durables (for example, computers,
1 The term ‘production sharing’ was coined by Drucker (1977). In the recent literature an array of alternative terms have bee used to describe this phenomenon, including ‘international production fragmentation’, ‘vertical specialisation’, ‘slicing the value chain’ and ‘outsourcing’.

6
cameras, TV sets and motor cars) to overseas locations in order to be physically closer to their
final users and/or take advantage of cheap labour.
In the case of standard consumer goods such as clothing and footwear, global production
sharing normally takes place through arm’s length relationships, with international buyers playing
a key role in linking producers and sellers in developed countries (Helleiner 1973, Gereffi et al.
2005). Production sharing within vertically integrated global industries such as electronics,
electrical goods and automotive, on the other hand, has evolved in a different manner. In the
beginning, the process essentially involved a multinational enterprise (MNE) setting up an
overseas subsidiary to perform some of the functions that it once did at home. As production
operations in the host countries became firmly established, production process in these industries
eventually has begun to spread beyond the MNEs. MNE subsidiaries began to subcontract some
activities to local (host-country) firms, providing the latter with detailed specifications and even
fragments of their own technology. At the same time, many firms which were not part of MNE
networks began to procure components globally through arm’s length trade. However, the bulk
of global production sharing within high-tech industries still takes place under the aegis of MNEs.
This is because the production of final goods requires highly customized and specialized
components whose quality cannot be verified or assured by a third party. Even if it were possible,
it is difficult to write a contract between the final producer and input supplier which would fully
specify product quality (Antras 2005).
There is a sizeable theoretical literature examining the causes and modalities of global
production sharing.2 This literature has demonstrated the fragility of the conventional approach to
trade flow analysis which is based on the notion that countries trade in goods that are produced
from start to finish in just one country. Global production sharing opens up opportunities for
countries to specialize in different slices (different tasks) of the production process depending on
their relative cost advantage and other relevant economic fundamentals. In this context, the
decisions of how much to produce and for which market have to be combined with decisions of
where to produce and with what degree of intra-product specialisation. Consequently, trade flow
analysis based on data coming from a reporting system designed at a time when countries were
trading only in final goods naturally distorted values of exports and imports leading to a
falsification of the nature of emerging trade patterns. The degree of falsification is likely to
2 Spenser 2005, Helpman 2007 and Feenstra 2008 provide extensive surveys.

7
increase over time as more complex production networks are created with an ever increasing
number of participating.
The purpose of this paper is to examine the size and dynamics of global production
sharing and network trade in East Asia with special emphasis on the regional and global
integration of countries in the region. The paper is organised as follows. Section 2 discusses the
procedure followed in extracting data from the UN trade data tapes and data quality. Section 3
examines the nature and extent of global network trade and the role of East Asia countries in this
new global division of labour. Section 4 probes inter-country differences in the intensity of
network trade, with the aim of broadening our understanding of East Asia’s relative position
within global production networks. Section 5 deals with the implications of this new form of
international exchange for intra-regional trade and for creating new supply-side
complementariness among countries in the region, with emphasis on the emerging role of China
in regional production networks. In Section 6 the latest available data are pieced together to
examine the role of network trade in determining the impact of the global crisis on export
performance of East Asian economies. The final section presents policy inferences.
2. Data
Previous studies have used two alternative approaches to quantifying the magnitude and pattern
of trade taking place within global production networks (‘network trade’).3 The first approach
relies on records kept by OECD countries (in particular the US and the European Union) in
connection with special tariff provisions on overseas processing and assembly of domestically
produced components (‘outward processing trade (OPT) statistics’) (Helleiner 1973, Sharpton
1975, USITC 1999, Gorg 2000). OPT record provide data on parts and components exported
from source countries and assembled goods received in turn. However, the OPT schemes only
cover a limited range of products, and the actual product coverage has varied significantly both
3 A number of recent studies have used imported input content of industrial production, estimated using input-output tables, to measure the growth of global production sharing in world trade at the industry/country level (growth in the measured degree of imported-input dependence between two time points is interpreted as an indicator of the growth of global production sharing) (Dean et al. 2007; Hummels et al. 2001). This approach is not relevant for the present study, which aims to examine the patterns and determinants of production-sharing driven trade flows.

8
within and among countries over time. Perhaps more importantly, recent trends in unilateral trade
and investment liberalization, and the proliferation of bilateral and regional economic integration
agreements, have significantly reduced the importance of such tariff concessions in promoting
global sourcing (and therefore the actual utilization of these schemes). Moreover, by their very
nature, these administrative records leave out cross-border transitions among third countries
within global production networks.
The second approach, pioneered by Yeats (2001) and pursued in a number of recent
studies (Ng and Yeats 2003, Athukorala 2005, Athukorala and Yamashita 2008, Kimura 2006)
involves delineating trade in parts and components, using individual-country trade statistics
extracted from the UN trade data reporting system (Comtrade database). This approach permits a
comprehensive and consistent coverage of parts and components trade encompassing a large
number of countries. But, it suffers from two major limitations to the commodity coverage of
network trade. First, the commodity coverage is limited to parts and components which can be
directly identifiable based on the commodity nomenclature of the US Standard International
Trade Classification (SITC). These items are confined to the product classes of machinery and
transport equipment (SITC 7) and SITC 8. However, there is evidence that global production
sharing has been spreading beyond SITC 7 and 8 to other product categories, such as
pharmaceutical and chemical products (which fall under SITC 5) and machine tools and various
metal products (SITC 6). Second, and more importantly, even if we ignore problem of under
coverage, parts and components are only one of the facets of network trade; As we have noted at
the outset, there as been a notable expansion of network activities from pure component
production/assembly and to final assembly. Moreover, the relative importance of these two tasks
varies among countries, and over time in a given country, making it problematic to use data on
parts and components trade as a general indicator of the trends and evolving patterns of network
trade over time and across countries.
The analysis in this paper makes use of data extracted from the US trade data system
following a procedure which aims to redress these two limitations (to the extent permitted by the
nature of data availability). We use a list of parts and components encompassing the entire
spectrum of manufacturing trade. The list was complied by mapping parts and components in the
UN Broad Economic Classification (BEC) Registry (available at http:/www.
unstats.un.org/unsd/cr/registry) in the product list of the WTO Information Technology
Agreement with the Harmonise System (HS) of trade classification at the six digit level.

9
Information gathered from firms-level surveys conducted in Thailand and Malaysia was used to
fill gaps in the list. The full list of parts and components is given in the Appendix. Data
compiled at the HS 6-digit level were converted to SITC for the final analysis using the UN HS-
SITC concordance.
There is no hard and fast rule applicable to distinguishing between parts and components
and assembled products in international trade data. The only practical way of doing this is to
focus on the specific industries in which network trade is heavily concentrated. Once these
industries are identified assembly trade can be tentatively estimated as the difference between
parts and components, directly identified based on our list, and recorded trade in these product
categories. Guided by the available literature on production sharing, we identified seven product
categories: office machines and automatic data processing machines (SITC 75),
telecommunication and sound recording equipment (SITC 76), semiconductors and
semiconductor devices (SITC 772 and 776); electrical goods (SITC 77 – 772 -776), road vehicles
(SITC 78), professional and scientific equipment (SITC 87) and photographic apparatus (SITC
88). It is quite reasonable to assume that these product categories contain virtually no products
produced from start to finish in a given country. However, admittedly the estimates based on this
list do not provide a full coverage of final assembly in world trade. For instance, outsourcing of
final assembly does takes place in various miscellaneous product categories such as clothing,
furniture, sport goods and leather products. However, it is not possible to meaningfully delineate
parts and components and assembled goods in reported trade in these product categories because
they contain a significant (yet unknown) share of ‘horizontal’ trade. Likewise, assembly activities
in software trade have recorded impressive expansion in recent years, but these are lumped
together in the UN data system with ‘special transactions’ under SITC 9. However, the magnitude
of the bias resulting from the failure to cover these items is unlikely to be substantial because
network trade in final assembly is heavily concentrated in the product categories covered in our
decomposition (Yeats 2003, Krugman 2008).
As regards country coverage, Asia is defined here to encompass the economies of East
Asia. East Asia includes Japan, and Developing East Asia (DEA), which covers the newly
industrialized economies (NIEs) in North Asia (Republic of Korea, Taipei, China and Hong Kong,
China), People’s Republic of China (PRC) and members of the Association of Southeast Asian
Nations (ASEAN). Among the ASEAN countries, only the six largest economies ―Indonesia,
Malaysia, the Philippines, Thailand, Singapore and Vietnam― are covered in the statistical

10
analysis; Brunei, Cambodia, Lao PDR and Myanmar are excluded because of data limitations.
The East Asian experience is examined in the wider global context, focusing on the region’s
performance relative to the North American Free Trade Area (NAFTA) and the European Union
(EU).
The data are tabulated using importer records, which are considered to be more
appropriate for analysing trade patterns than the corresponding exporter records. Compared to
country records, importer records are also presumably less susceptible to double-counting and
erroneous identification of the source/destination country in the presence of entrepot trade (for
example, PRC’s trade through Hong Kong and Indonesia’s trade through Singapore) (Ng and
Yeats 2003: Appendix 1; Feenstra et al. 1999). Some countries also fail to properly report goods
shipped from their own export-processing zones; they tend to be grouped into one highly
aggregated category of ‘special transactions’ under SITC 9. It is difficult to find a satisfactory
solution for these problems, but it is generally believed that data compiled from importer records
are less susceptible to recording errors and reveals the origin and composition of trade more
accurately than other records, because there are normally important legal penalties for incorrectly
specifying this information on customs declarations. Data for Taipei, China (which is not
covered in the UN data system) are obtained from the trade database (based on the same
classification system) of the Council for Economic Planning and Development, Taipei. The
analysis covers the period from 1992 to 2007. The year 1992 was selected as the starting point
because by this time, countries accounting for over 95% of total world manufacturing trade had
adopted the revised data reporting system. Meanwhile, 2007 was the most recent year for which
data were available for all reporting countries.

11
3. East Asia in Global Production Networks
Rapid export growth has been the hallmark of East Asia’s rise in the global economy. The
combined share of East Asian countries in world non-oil exports recorded a three-fold increase,
from 11% to 33%, between 1969/70 and 2006/7.4 The region accounted for over 40% of the total
increment in world exports over this period. In the 1970s and 1980s, Japan dominated the
region’s trade, accounting for nearly 60% of its exports and imports. The picture has changed
dramatically over the past two decades with the share of developing East Asian countries,
increasing rapidly in face of a relative decline is Japan’s position in World trade. By the middle of
this decade these countries accounted for over 80% of total regional trade. The rise of China has
been the dominant factor behind this structural shift, but the other countries in the region
(Taiwan, Korea, and the ASEAN countries) have also increased their world market shares.
Rapid export growth in East Asia has been underpinned by a pronounced shift in export
structure away from primary commodities and toward manufacturing. By 2005/07 manufacturing
accounted for 92% of total exports from Asia, up from 78% four decades ago. Within
manufacturing, machinery and transport equipment (SITC 7), and especially information and
communication technology (ICT) products and electrical goods have played a pivotal role in this
structural shift. The share of Asia in world machinery and transport equipment exports increased
from 14.5% in 1994/95 to 42.4% in 2006/07, with DEA accounting for over four-fifths of the
increment. By 2006/07, over 58% of total world ICT exports originated from Asia, with China
alone accounting for 23%. In electrical goods, China’s world market share increased from 3.1%
to 20.6% between these two years. As we will see below, export dynamism in these product lines
has been driven by the ongoing process of global production sharing and the increasingly deep
integration of East Asian countries into the global production networks.
Table 1 presents data on world trade based on global production sharing (‘network trade’)
and East Asia’s relative position in this new international exchange. World network trade
4 Trade magnitudes throughout the paper are measured in current US dollars unless otherwise indicated. Inter-temporal comparison calculations are made for the two-year averages relating to the end points of the period under study, so as to reduce the impact of year to year fluctuations of trade flows. All data reported, unless otherwise stated, are compiled from the UN Comtrade database.

12
increased from US$ 1207 billion (about 23.8% of total exports) in 1992/93 to US$4525 billion
(45.5%) in 2006/07, accounting for over a half of the total increment in world manufacturing
exports between these two years. There has been a palpable shift in global production sharing
away from mature industrial economies towards developing countries and in particular towards
East Asia. The share of developing countries in total network exports increased from 22.0% in
1992/3 to 45.7 % in 2005/6, driven primarily by the growing importance of East Asian countries
in global production sharing (Figure 1). The share of East Asia (including Japan) increased from
32.2 % in 1992/93 to 40.3% in 2006/7, despite a notable decline in Japan’s share, from 18.4% to
9.5%. The major driving force has been PRC whose share increased from 2.1% to 14.5%.
Within East Asia, world market shares of ASEAN countries, with the exception of Singapore,
have grown faster than the regional average. The mild decline in Singapore’s share reflects a
marked shift in its role in global production networks for high-tech industries, away from the
standard assembly and testing activities to oversight functions, product design, and capital and
technology-intensive tasks in the production process. Some, if not most, of these new activities
are in the form of services and are therefore not captured in merchandise trade data (Wong 2007,
Athukorala 2008).
Between 1992/3 and 2006/7 there has been a sharp increase in the share of parts and
components (henceforth referred to as ‘components’ for brevity) across all countries in the region
(table 1, last column). In all countries except China and Thailand components accounted for well
over a half of total network export (and imports) by 2006/07. Components share is particularly
high among the countries in ASEAN. There is a remarkable similarity in component share figures
on export and import side across countries reflecting overlapping specialisation patterns in
component assembly and testing among countries in the region.
Table 2 presents comparative statistics on the share of network trade in total
manufacturing exports and imports at the country/country group level. It is evident that the share
of network trade of East Asia is much higher, compared to all other regions in the world. In
2006/07, exports within production networks accounted for over 60.3% of total manufacturing
trade in East Asia, compared to the world average of 50.9%. Within East Asia, ASEAN countries
stand out for their heavy dependence on production fragmentation trade – a critical part of their
export dynamism. In 2006/07, network export accounted for 66% of total manufacturing exports
in ASEAN, up from 56.8% in 1992/93. The patterns observed on export and import sides are
strikingly similar reflecting growing cross border trade within production networks.

13
A comparison of the data on the share of components in total exports and imports (Table
2) highlights an important difference between PRC and the rest of DEA. In PRC, components
accounted for a much larger share of imports (44.2% in 2006/07) compared to exports (25.6%). In
other East Asian countries, the percentage shares are broadly similar on the import and export
sides, reflecting their predominant involvement in component production/assembly within
regional production networks. Figure 2 illustrates the nature of PRC’s involvement within
regional production networks. The bulk of components used in final assembly in PRC comes
from other countries in the region. At the same time, final goods (total exports minus
components) account for an overwhelming share of PRC’s exports to the rest of the world, mostly
to the US and EU. In 2005/6, components accounted for a mere 12% of total PRC exports to the
rest of the world. The share of components in PRC’s total manufacturing imports from East Asia
increased from 18% in 1994/5 to over 44% in 2006/7. Within manufacturing, this share is much
larger in machinery and transport equipment imports, at nearly three-fourths in 2006/7.
Interestingly, although PRC’s importance as a market for the rest of East Asia has increased
during the period under study, the importance of the region for PRC’s export expansion has
declined notably. For instance, only 32% of PRC’s total manufacturing exports were destined for
regional markets in 2006/7, compared to 53.3% in 1994/5. By contrast, on the import side, the
regional share increased from 20% to 32.7% between the same period. Overall, these patterns
reflect PRC’s important role as the premier final assembly centre, linking the rest of East Asia
with the rest of the world through global production networks.
Data on the composition of network trade are summarized by major country groups in
Table 3. A striking feature of network trade in East Asia is its heavy concentration in electrical
machinery, semiconductor devices in particular. In all countries/regions, component trade is
heavily concentrated in the machinery and transport equipment sector (SITC 7). This sector
accounts for over 90% of the combined component trade of SITC 7. Within SITC 7, both
component exports and imports of East Asia are heavily concentrated in electronics and electrical
industries. Semiconductors and other electronics components (components within SITC 77) alone
accounted for 50% of component exports from East Asia in 2006/07. Adding components of
telecommunication equipment (SITC 76) and office and automated data processing machines
(SITC 75) to these items increases the concentration ratio to almost 90 per cent of total exports of
components. The balance consists largely of electrical machinery (SITC 77 and auto parts (SITC
78). Concentration of component trade on electronics is much larger in AFTA (over 60%)

14
compared to the regional average. Electronics and electrical products are also major areas of
activity in other countries/regions. But the trade patterns of these countries/regions are
characterized by a significant presence of other items, in particular automotive components
(components of motor vehicles (SITC 78) and other transport equipment (SITC 79). For instance,
components of these two product categories accounted for a mere 4.7% of total component
exports in developing East Asia in 2005/6 compared to over a third in NAFTA and EU15.
Moreover, unlike in NAFTA and EU15, shares of automotive components in East Asian imports
are much higher compared to exports. This asymmetry is an indication of their relatively low
level of participation in network trade.
The relatively low levels of network trade in automobile and transport equipment in East
Asian countries cannot be explained in terms of their competitive edge in electronics and
electrical industries alone. The total trade figures behind these export shares show that export
growth in these products during 1992-2007 was much slower (a mere 5% in current US dollar
terms) compared to over 20% in NAFTA and over 15% in EU15. There are two possible reasons
for this contrast which deserve further study. First, in most East Asian countries, binding content
protection requirements for the domestic production of automotives and tariffs on final products
(usually side by side with low or zero tariffs on components) remained relatively high until
recently (Abrenica 1999). Tariff protection and content protection requirements usually lead to
more components being produced domestically. They also tend to retard exports not only because
of the incentive bias against exports, but also because domestic market-oriented production
usually does not achieve the quality standards and cost competitiveness required for export
success. Second, unlike electronics and electrical industries, components in the automotive
industry ,5 are generally characterized by low value-to-weight ratios, which make it too costly to
use air transport for timely delivery (Hummels 2007). This could well be an important
consideration for locating parts and component producing/assembly plants close to the final
assembly plants within automobile production networks: the data point to a heavy concentration
of international trade in automotive components within NAFTA (Klier and Rubenstein 2006) and
EU (Anderton and di Mauro 2008) compared to East Asia and other regions.
5 Air shipping is the mode of transport for over two-thirds of electronics exports from Singapore, Philippine, Thailand and Malaysia (estimate based on US Trade Commission data on trade by mode of transport during 2000-2005).

15
4. Determinants of East Asia’s Growing Role in Network Trade
We have seen that while rapid growth of global production sharing is a global phenomenon, East
Asia is unique in the world for its pre-eminent position in this new form of international
exchange. For developing East Asian countries, the world market share in fragmentation-based
trade has increased at a much faster rate than that of either NAFTA or EU countries. What
explain this East Asian dominance in network trade? This issue is central to our understanding of
the determinants of inter-country difference in the intensity of network trade, particularly because
of the pessimistic prognoses prevailed in the 1990s about the future of network trade in East Asia
in the aftermaths of the formation of NAFTA in 1991 and the integration of some new countries
emerging from the former Soviet Union with the rest of Europe. There were speculations at the
time that significant tariff reduction, proximity to industrial countries and relatively low wages by
regional standards (though not compared to some East Asian countries) would confer important
advantages on Mexico (in penetrating the US market) and countries on the European periphery
(in penetrating the EU), resulting in an erosion in East Asia’s relative position (Kierzkowski
2001; Kaminski and Ng 2005).
At least four factors seem to have underpinned East Asia’s continued attractiveness as a
centre of global production sharing. First, Asia exhibits great diversity in labour supply
conditions and wages ranging from Japan and the four high income NIEs to the second-tier
countries in Southeast Asia and to Vietnam. Over the past two decades wages in Korea, Taiwan
and Hong Kong have rapidly been approaching the developed-country levels. But, despite rapid
growth, manufacturing wages in PRC and other latecomers to export-oriented industrialisation in
East Asia (Malaysia, Thailand, Vietnam and the Philippines) remain lower than or comparable to
those in countries on the European periphery and Mexico (Table 4 ). In particular, China’s
average hourly compensation in manufacturing is only a more 3% of that in the USA. Moreover,
there are significant differences in wages among countries in the region, providing a basis for
shift in activities to lower wage sources within the region and rapid expansion of intra-regional
product sharing systems, permitting
Second, the relative factor cost advantage has been supplemented by relatively more
favourable trade and investment policy regimes and better port and communication systems that

16
facilitate trade by reducing the cost of maintaining ‘services links’ in global production sharing
(Carruthers et al. 2003, Arvis et al. 2007). Most countries in the region, including PRC, rank
favourably in the World Bank’s global logistics performance index (LPI) (Table 5). Singapore, by
far the biggest transhipment hub in the region, tops the overall logistics quality ranking in the
world. The other major transhipment hub in the region, Hong Kong, China, is eighth in the global
ranking. According to data on inward FDI, East Asia has been the most favoured region in the
world for global spread MNE operations (Athukorala 2007, Chapter 2).
Third, as first-comers in this area of international specialization, countries in Southeast
Asia (in particular Malaysia, Singapore and Thailand) seem to offer considerable agglomeration
advantages for companies that are already located there. Site selection decisions of MNEs
operating in assembly activities are strongly influenced by the presence of other key market
players in a given country or neighboring countries. Having enjoyed a long period of successful
operation in the region, many MNEs (particularly US-owned ones) have significantly upgraded
the technical activities of their regional production networks, and assigned global production
responsibilities to local affiliates (specifically Singapore, and more recently Malaysia and
Thailand [Athukorala 2008, Borrus et al., 2000, McKendrick et al., 2000)). When selecting new
sites, MNEs operating in assembly activities are strongly influenced by the presence of other key
market players in a given country or neighbouring countries. With a long period of successful
operation in the region, many MNEs (particularly those based in the United States) have
significantly upgraded technical activities in their regional production networks in East Asia and
assigned global production responsibilities to affiliates located in more mature countries (in
particular Singapore and Taiwan, and also Malaysia in recent years).
Forth, for over three decades there has been rapid economic expansion in several countries
in the region, and this seems to have brought about ‘market thickness’, with a positive impact on
the location of outsourcing activity (Grossman and Helpman 2005). The term market thickness
here refers to the diversification of the composition of traded goods of a country as an outcome of
rapid growth and structural transformation.
Finally, PRC’s emergence as the premier low-cost assembly centre in the word in a wide
range of electrical and electronics products has boosted components production and assembly
activities in other countries in the region. PRC’s role is particularly important in this connection

17
because of its hinterland advantage (a la Jones 2000); PRC is endowed with vast supply of labour,
which can be readily brought into production activities to meet changing international demand,
without causing large disturbances in factor prices (Jones 2000, Chapter 3).
Table 6 reports the preliminary results of an econometric exercise undertaken to examine
determinants of inter-country difference in network trade intensity with emphasis on East Asia’s
unique role in this new form of international exchange.
The estimation equation is,
QX = + 1YW + 2PGDP +3RWG +5RER + 5LPI + 6DIST + 7DCH +8DEA
+9DASN +10DODC + T + ij
where QX is the volume of the country’s exports (export value deflated by world price). The
explanatory variables are defined below (with the expected sign of the regression coefficient in
brackets):
YW World income (weighted average GNP of the ten major importing countries
PGDP Real GDP per capita (+),
RWG Manufacturing wage relative to that of trading partners (-)
RER (+) Real exchange rate: world price (expressed in domestic currency), PW relative to
domestic price (PD) (+),
LPI Word Bank index of logistic performance (trade-related institutional setting and
infrastructure) (+)
DST Distance to major trading partner countries (-)
DCH Intercept dummy variable for PRC (+ or -)
DEA Intercept dummy variable for developing East Asian countries (other than PRC)
(+ or -)
DASN Intercept dummy variable for ASEAN member countries (+ or -)
DODC Intercept dummy variable for other developing countries Korea (+ or -)
T A set of time dummy variables to capture year-specific ‘fixed’ effects
A constant term, and
A stochastic error term, representing the omitted other influences on bilateral
trade.

18
YW in included to capture the impact of world demand on export performance. Distance
(DST) is a proxy for transport (shipping) costs and other costs associated with time lags such as
internet charges, spoilage, and costs associated with physical distance such as ignorance of
foreign customs and tastes. Distance can in fact be a more important influence on component
trade compared to final trade, because of multiple border-crossings involved in the value adding
chain. Technological advances during the post-World War II era have certainly contributed to a
remarkable reduction in international communication cost. There is, however, evidence that the
geographical ‘distance’ is still a key factor in determining international transport costin
particular shipping costand delivery time (Evans and Harrigan 2003). The quality of trade-
related logistics (LIP) has received increased emphasis in recent years as a key determinant of
trade performance of developing countries. In particular, a country with better infrastructure (such
as well established broadband networking) is presumably a preferable location for global sourcing
because of lower cost of establishing service links. PGDP aims to capture the impact of the level
of economic advancement on export performance, operating through channels other than logistics
quality. We can hypothesize that GDP per capita has a positive effect on export performance; as
countries grow richer, the scale of industrial output becomes conducive to global production
sharing.
The relative wage (RWG) is presumably a major factor impacting on the global spread of
fragmentation-based specialisation (Jones and Kierzkowski 2001a&b). In a context where both
capital and components have become increasingly mobile, relative cost of production naturally
becomes an important consideration in cost-border production. The real exchange rate, RER
captures the overall international competitiveness of the economy in traded-goods production.
Country group dummies .for PRC (DCH), other developing East Asian countries (DEA) and other
developing countries (DODC) are added (treating developed countries as the base dummy) to
allow for the possible deviation in the overall levels of exports from these country groups from
that of developed countries, after controlling for the other explanatory variables. Finally, the time-
specific fixed effects (T) are included to control for general technological change and other time-
varying factors.
The model was estimated using annual panel data for manufacturing trade of 41 countries
over the period 1992-2007. The country list includes all countries each of which accounted for

19
0.1% or more of total world manufacturing exports in 2000/1. Of these, Hong Kong was
combined with China because of its peculiar trade links with the latter.6 The trade data are
compiled from the importers’ records (CIF) of the UN Comtrade database following the
procedure detailed in Section 2. The data on LPI came from the newly-developed Logistics
Performance Index database of the World Bank (Arvis et al 2007). DST is the export-share
weighted distance between a given country and its ten major export destinations, as reflected in
export data for 2000. The data on distance come from the trade patterns data base of the French
Institute for Research on the International Economy (CEPII). The CEPIT distance measure is a
composite measure of the bilateral great-circle distance between major cities of each country
compiled by taking into account the trading significance of each city in each country. World
market shares of the ten major export destinations in 2000/1 are used in compiling the distance
for a given country. The same weighting procedure is used in compiling data series of RWG and
RER. For details on data sources and methods of variable construction see Appendix 1 (to be
added).
We used both pooled OLS and random effects estimators and opted for the pooled OLS
as our preferred estimator, based on the Bruesch-Pagan Lagrange multiplier test. The alternative
fixed effect estimator is not appropriate because our model contains a number of time-invariant
variables. However the coefficient estimates of the time varying variables were found to be
remarkably resilient to the use of the fixed effects estimator after deleting the other (time
invariant) variables.
To comment on the results, the coefficients of GDP and PGDP are quite consistent with the
a priori expectation. Interestingly, the coefficient of PGDP is much larger in magnitude in all three
cases compared to that of final and total export equations. This finding is consistent with the
postulate that, when controlled for other relevant variables, the stage of development (which
captures various prerequisites needed for providing efficient services links) has a positive impact on
the attractiveness of a country as a location for components production/assembly within global
production networks. The results for the distance variable (DST) provide strong support for the
hypothesis that cost of transportation and other distance-related costs are an important determinant
of trade flows. Interestingly, the distance coefficient in the component equation is much larger
6 We also treated Hong Kong as a separate country in experimental runs and found that results were insensitive to this alternative specification.

20
compared to that in total and final goods equations7 . This difference is consistent with the
hypothesis that component production/assembly, given the multiple border crossing involved in the
production process, is much more sensitive to transport cost. Logistic quality (LPI) is a significant
determinant of trade in both parts and components, and final goods. The coefficient of the relative
manufacturing wages (RWG) is statistically significant with the expected sign in both equations.
Thus, there is strong empirical support for the hypothesis that relative wage differentials are a
significant determinant of cross border trade both in components and final products. However,
interestingly the magnitude of the coefficient on RWG in the final goods equation is much larger
compared to that in the parts and component equation. The coefficient of real exchange rate (RER)
has the expected (positive) signs in all three equations but is (marginally) significant only in the
equation for total exports. This implies that, the overall international competitiveness of the
economy, unlike competitiveness in terms of wages, does not have a direct bearing upon a
country’s in network trade.
The results for the intercept dummies for PRC, developing East Asian countries (excluding
China) and ASEAN are statically significant with positive signs. By contrast, the coefficient of
the dummy for the other developing countries is statistically significant with the negative sign.
These estimates are consistent with the superior performance of countries in East Asia in global
production sharing from a comparative global perspective. They also consistent with the
inference of Athukorala (2009) relating to the complementarity (rather than competition) among
these countries in their participation within global production networks. Among the three East
Asia dummies, the coefficient of the dummy for ASEAN is much larger in magnitude (almost
three times of tat of DCH and DEA). The explanation for this unique results for ASEAN lies
perhaps in economic history, the early choice of the region (firstly Singapore and subsequently
Malaysia and other countries) by MNEs as a location of outsourcing activities (Athukorala 2007).
Moreover, rapid economic expansion for over three decades in a number of countries in the
region has presumably brought about ‘market thickness’ (the economic depth of trading nations)
which positively impact on the location of outsourcing activity.
In sum, the results of the regression analysis are consistent with the a priori views of the
sources of East Asia’s dominance in global network trade. First, the region is well placed to
benefit from fragmentation-based specialisation countries in terms of relative wages. Second,
7 The differences are statistically significant at one-percent level or better.

21
relative cost advantage arising from these wage patterns seems to have been nicely complemented
by the quality of trade related logistics. Third, ‘First comer’ advantage, and market thickness and
agglomeration benefits evolved over a long period of time seems to have played a pivotal role.
The latter two factors would have jointly brought about significant cost advantages in maintaining
‘services links’ in production networks in the region.
5. Production networks and Trade Patterns
We have already drawn attention to the importance of fragmentation-based trade in East Asia. We
now examine the implications of this new form of international specialization for the relative
importance of intra-regional versus global economic integration.
There is a vast literature on what may be termed ‘standard trade data analysis’ based on
the traditional notion of horizontal specialisation in which trade is an exchange of goods that are
produced from start to finish in just one country. This literature unequivocally points to a
persistent increase in intra-regional trade in East Asia, whether or not Japan is included, from
about the early 1980s. 8 This evidence figures prominently in the current regional debate
concerning the establishment of regional trading arrangements covering some or all countries in
East Asia. Another implication of the highly publicized apparent trade integration in the region
was the so called ‘decoupling’ thesis, which was a popular theme in the Asian policy circles in
the first decade of the new millennium until the onset of the recent financial crisis.9 This thesis
held that East Asian region had become a self-contained economic entity with potential for
maintaining its own growth dynamism independent of the economic outlook for the traditional
developed market economies.
The above discussion on the emerging patterns of intra-regional component trade casts
doubts on the validity of these inferences. We have seen that component trade has played a much
more important role in trade expansion in East Asia compared to the rest of the world.
8 See for example Drysdale and Garnaut 1997; Frankel and Wei 1997; and Park and Shin 2009. 9 See Yoshitomi (2007) and Park and Shin (2009) and the works cited therein.

22
Conventional trade flow analysis can yield an unbiased picture of regional economic integration
only if parts and components and final trade follow the same geographic patterns. If component
trade has a distinct intraregional bias, as one would reasonably anticipate in a context of growing
network trade in the region, then the conventional trade flow analysis is bound to yield a
misleading picture in regards to the relative importance of intra-regional trade, as compared to
global trade, for growth dynamism in the region. This is because growth based on assembly
activities depends on the demand for final goods, which in turn depends on extra-regional growth.
Table 7 reports data on component intensity (percentage shares of parts and components)
in bilateral flows of manufacturing trade. The data vividly show that components accounts for a
much larger share in intra-regional trade in East Asia compared to these countries world trade and
trade with EU and NAFTA. Moreover, the share of components in total intra-regional imports is
much larger than in exports, and has increased at a faster rate; this reflects the fact that the region
relies more on the rest of the world as a market for final goods than as a market for components.
Within East Asia, ASEAN countries stand out for the high share of components in their intra-
regional trade flows. The share of components in total intra-regional exports in ASEAN countries
increased from 34.6% in 1992/3 to 61.4% in 2006/7. On the import side, the increase was from
75.3 per cent to 84.4 per cent. According to country-level data (not reported here, for brevity), the
share of components in manufacturing exports and imports amounted to over four-fifths in
Singapore, Malaysia and the Philippines and over two-thirds in Thailand. South Korea and
Taipei, China are also involved in sizeable trade in components with the other countries in the
region.
Intra-regional trade shares estimated separately for total manufacturing trade, component
trade and final manufacturing trade (that is, total manufacturing trade less component trade) are
reported in Table 8. The table covers trade in East Asia and three sub-regions therein which
relate to contemporary Asian policy debate on regional integration. Data for NAFTA and EU are
reported for comparative purposes. Estimates are given for total trade (imports + exports) as well
as for exports and imports separately in order to illustrate possible asymmetry in trade patterns
resulting from East Asia’s increased engagement in fragmentation-based international exchange.
Trade patterns depicted by the unadjusted (standard) trade data affirm the ‘received’ view that
Asia, in particular East Asia, has become increasingly integrated through merchandise trade. In
2006/7 intra-regional trade accounted for 55.1% of total manufacturing trade, up from 53.2% in
1992/3. The level of intra-regional trade in East Asia was higher than that of NAFTA throughout

23
this period and was rapidly approaching the level of EU-15. For developing East Asia (Asia
excluding Japan) and ASEAN +3, the ratios are lower than the aggregate regional figure, but they
have increased at a much faster rate. The intra-regional trade share of ASEAN has been much
lower compared to the other two sub-regions. This asymmetry in intra-regional trade in East
Asia reflects the unique nature of the involvement of Japan and China in regional production
networks. From about the late 1980s Japan’s manufacturing trade relations with the rest of East
Asia have been predominantly in the form of using the region as an assembly base for meeting
demand in the region and, more importantly for exporting to the rest of the world (Athukorala and
Yamashita 2008). The emergence of China as a leading assembly centre within regional
production networks since the early 1990s further amplified this trade asymmetry. That is, China
is importing parts and components from the other East Asia countries to assemble final products
which are predominantly destined for markets in the rest of the world (Athukorala 2009a).
However the picture changes significantly when parts and components are netted out:
intra East Asian share in final trade (total trade – parts and components) in 2006/7 was 46.4,
down from 50.3% in 1992/3. The estimates based on unadjusted data and data on final trade are
vastly different for East Asia, particularly for DEA and ASEAN. Both the level of trade in the
two given years and the change over time in intra-regional trade shares are significantly lower for
estimates based on final trade. Interestingly, we do not observe such a difference in estimates for
NAFTA and EU.
The intra-regional shares calculated separately for imports and exports clearly illustrate
the risk of making inferences about regional trade integration based on total (imports + exports)
data. There is a notable asymmetry in the degree of regional trade integration in East Asia.
Unlike in EU and NAFTA, in East Asia the increase over time in intraregional trade ratio (both
measured using unadjusted data and data for final trade) has emanated largely from rapid increase
in intra-regional imports; the expansion in intra-regional exports has been consistently slower.
The dependence of East Asia (and country sub-groups therein) on extra-regional markets (in
particular those NAFTA and EU) for export-led growth is far greater than is revealed by the
standard intra-regional trade ratios commonly used in the debate on regional economic
integration. For instance, in 2006/7 only 43.9% of total East Asian manufacturing exports was
absorbed within the region, compared to an intra-regional share of 64.4% in total manufacturing
imports. For developing East Asia the comparable figures was 33.4% and 46.7% respectively.

24
This asymmetry is clearly seen across all sub-regions within East Asia. The asymmetry between
intra-regional shares of import and exports is therefore much sharper when the parts and
components are netted out. This is understandable given the heavy ‘component bias’ in Asian
intra-regional trade and the multiple border-crossing of parts and components within regional
production networks. On the export side, the intra-regional share of final goods declined
continuously from 46% in 1995 to 37% in 2007, whereas intra-regional import share increased
from 56% to 63% between these two time points. The observed asymmetry in intra-regional
trade in East Asia reflects the unique nature of the involvement of Japan and China in regional
production networks.
In sum, these data support the hypothesis that, where fragmentation-based trade is
expanding rapidly, the standard trade flow analysis can generate misleading inferences regarding
the process of economic integration through trade. When data on assembly trade are excluded
from trade flows, these estimates suggest that extra-regional trade is much more important than
intra-regional trade for continued growth in East Asia, whether or not Japan is included. Thus, the
rising importance of product fragmentation seems to have strengthened the case for a global
approach to trade and investment policymaking rather than a regional one.
6. Production Networks and Trade Flows in the Crisis
A striking feature of the global economy following the onset of the on-going global financial
crisis has been the precipitous drop in global trade at a faster rate than in the Great Depression
(Eichengreen and O’Rourke 2009, Krugman 2009). From April 2008 to June 2009 world trade
contracted by about 20% which amounted to almost the total contraction in world trade during the
first thirty months (starting in April 1929) of the Great Depression.10 Interestingly, trade
contraction experienced by the East Asian countries during this period has been even greater than
the contraction in world trade (Figure 3, Table 9 ).
Krugman (2009) points to the vertical integration of global production (the rise of globe
production sharing) as a possible explanation for the surprisingly large trade contrition in the
present crisis compared to the Great Depression. Vertical integration of production implies that a
10 Numbers derived from Figure 4 in Eichengreen and O’Rourke 2009.

25
given degree of contraction in demand for a final (assembled) product has ramifications over
trade flows from many other countries which are involved in the production chain. Given that
global production sharing is much more important for trade expansion in East Asia compared to
other countries this explanation also seems relevant for East Asia’s greater trade contraction
compared to overall trade contraction at the global level. However, there are also a number of
other factors relevant for explaining larger contraction in trade volume in the current crisis. These
include, much larger contraction of trade credit, a greater share of consumer durables in
contemporary world trade compared to the 1930s, and the effect of recent advances in
communication technology on inventory cycle and just-in-time procurement practices. The
current state of data availability does not permit us to systematically delineate the impact of
production sharing on trade contraction while appropriately controlling for these other possible
factors. What we attempt to do in this section is to put together readily available data which have
some bearing on this issue in order to set the stage for further analysis.
All major East Asian countries (including China which was expected to cushion the rest
of East Asia against a global economic collapse) experienced a precipitous trade contraction from
about the last quarter of 2008 (Table 10). The remarkably synchronized nature of the trade
contraction across countries in the region, both on import and export sides, is generally consistent
with close trade ties among the East Asian countries forged within regional production networks.
Among the East Asian countries Japan is by far the worst hit. A large share of Japan’s
exports consists of capital goods and high-end durable consumer goods, such as cars and
electrical machinery, machine tools and their components. Exports of capital goods and high-end
consumer durables are heavily concentrated in the US and other developed-country markets and
therefore are directly exposed to the global economic decline. On the other hand, contrary to the
predictions of the decoupling enthusiasts, Japan’s growing exports to China have been indirectly
affected by decline in final (assembled) exports from China (Fukao and Yuan 2009). The degree
of export contraction suffered by Taiwan and Korea has been much smaller compared to Japan,
but, on average, notabll higher compared to the other East Asian countries. As in the case of
Japan, growing exports to China does not seem to have provided a cushion against collapse in
world demand for these two countries. The relatively lower degree of export contraction
experienced by Korea, Taiwan and the second-tier exporting countries in the region compared to
Japan could possibly reflect consumer preference for price-competitive low-end products in the
crisis context.

26
An inspection of growth rates of exports by destination provides no support for the view
that East Asian economies have become less susceptible to the world-wide trade contraction
because of the regional growth dynamism. China’s imports from most countries in the region
have contracted at a much faster rate compared to exports, perhaps an indication of stocking of
imported parts and components by Chinese firms given the gloomy outlook for exports. China’s
imports from Japan, Korea and Taiwan have shrunk more rapidly (at an average rate of 23.5%)
than imports from other countries. This is not surprising, given the dominant role played by the
former countries in the supply of parts and components to ICT assembly activities in China which
are heavily exposed to contraction in import demand in the USA and other developed countries.
Interestingly, intra-regional trade in East Asia has in general contracted at a faster rate compared
to the regional trade with the USA and EU.
The data on export and import growth of China provide further evidence of the
synchronized nature of the trade shock of the global economic crisis (Table 11). In the first
quarter of 2009 China’s exports to the USA contracted by 15.4% accompanied by contraction in
exports to East Asia and the three sub-regions therein even at slightly higher rates (over 20%).
China imports from most countries in the region have generally contracted at a much faster rate
compared to exports, perhaps an indication of destocking of imported parts and components by
Chinese firms given the gloomy market outlook for exports. Overall China’s intra-regional
imports have contracted at a much faster rate compared to her imports from the USA and EU.
The available data on trade growth of China and Singapore by major commodity category
are reported in Tables12 and 13. A notable pattern observable for manufacturing exports from
these data is the relatively sharper contraction in the category of machinery exports (in which
network trade in heavily concentrated) compared to other product categories, in particular
traditional labour intensive products (textile and garments, footwear and other miscellaneous
manufactures). Exports belonging to machinery and transport equipment category, in particular
ICT products and electronics are predominantly consumer durables the demand for which is
generally more susceptible to income contraction. In traditional labour intensive products,
developing country producers have the ability to perform better purely on the basis of cost
competitiveness even in a context of depressed demand.

27
Data on growth of manufacturing imports to the US are summarised in Table 14. A
common pattern observable across the ten source countries covered is that component imports
have generally contracted at a faster rate compared with total imports and final goods imports.
This pattern is consistent with the view that in face of contraction in world demand, stock
adjustment takes place at a faster rate in intermediate goods compared to final goods. The data
also shoes that the rate of contraction in final imports from China has been much smaller
compared to the dramatic contraction in imports from Japan. This perhaps reflects the fact that
under depressed market conditions consumers tends to substitute low-end products for high-ed
products. (To be expanded on)
7. Concluding remarks
Global production sharing has become an integral part of the economic landscape of East Asia.
Trade within global production networks has been expanding more rapidly than conventional
final-good trade. The degree of dependence on this new form of international specialization is
proportionately larger in East Asia, in particular in ASEAN, than in North America and Europe.
A highly important recent development in international fragmentation of production has been the
rapid integration of China into the regional production networks. This development is an
important counterpoint to the popular belief that China’s global integration would crowd out
other countries’ opportunities for international specialization. China’s imports of components
from countries in ASEAN and other developing East Asia countries have grown rapidly, in line
with the equally rapid expansion of manufacturing exports from China to extra-regional markets,
mostly North America and Europe. The migration of some production processes within vertically
integrated high-tech industries to China opens up opportunities for producing original-equipment-
manufactured goods and back-to-office service operations in other countries. China’s emergence
as a major trading power and an investment location is not a ‘zero sum proposition’ from the
perspective of the region. Rather it seems to have added further dynamism to region-wide MNE
operations.
Production fragmentation has certainly played a pivotal role in the continued dynamism of
the East Asian economies and increasing intra-regional economic interdependence. This does not,
however, mean that the process has contributed to lessening the region’s dependence on the
global economy. The high intra-regional trade shares reported in recent studies largely reflect
rapidly expanding intra-regional trade in components. There is no evidence of rapid intra-regional
trade integration in final products. In fact, the region’s growth based on vertical specialisation
28
depends inexorably on its extra-regional trade in final goods, and this dependence has increased
over the years. Extra-regional trade is likely to remain the engine of growth of the region in the
foreseeable future. Put simply, growing trade in components has made the East Asian region
increasingly reliant on extra-regional trade for its growth. This inference is basically consistent
with the behavior of trade flows following the onset of the global financial crisis. The
remarkably synchronized nature of the trade contraction across countries in the region is
generally consistent with close trade ties among the East Asian countries forged within regional
production networks. China has failed to provide cushion giants this export contraction as
postulated by the decoupling thesis.
The rise of product fragmentation has strengthened the case for a global, rather than a
regional, approach to trade and investment policymaking. Given the global orientation of the
region’s economies, we question whether there would be any significant positive pay-off from
current efforts to promote regional cooperation, unless they recognize the principle of ‘open
regionalism’. With both the current Doha Round and APEC apparently floundering and
directionless, this is one of the major multilateral policy challenges of our time.
In any case, It is doubtful whether FTA approach to trade liberalization is feasible in a
context where global production networks are rapidly expanding, seamlessly encompassing many
industries and countries. In reality, trade effect of any FTA would depend very much on the
nature of rules of origin built into it. Trade-distorting effects of rules of origin are presumably
more detrimental to network trade than to conventional final-goods trade, because of the inherent
difficulties in defining the ‘product’ for duty exemption and because of the transaction costs
associated with the bureaucratic supervision of the amount of value added in production coming
from various sources. Formulating ROOs for network-related trade is rather complicated
business. The conventional value-added criterion is not virtually applicable to this trade because
the products involved are low-value added by their very nature. The only viable option is to go
for ‘change in tariff lines’ based’ ROOs, but this leads to insurmountable administrative problems
because trade in electrical and electronics goods and the related parts and components belong to
the same tariff codes at the HS-6 digit level, which is the normal base for designing this type of
ROOs. Moreover, the process of global production sharing is characterized by continuous
emergence of ‘new’ products. Given the obvious administrative problems involved in revising
ROOs in tandem, emergence of new products naturally opens up room for unnecessary
administrative delays and/or tweaking of rules as a means of disguised protection.

29
Appendix: List of Parts and Components1
Seriel Codes Codes Nomenclatures Number HS SITC-Rev 3
1 392113 58291 Plates, sheets etc. Nesoi, cellular polyurethanes 2 392119 58291 Plates, sheets etc. Nesoi, cellular plastic nesoi
3 381800 59850 Chem elem doped, used in electron, discs Wafers Etc 4 420400 61210 Articles of leather used in machinery/mech applian 5 400920 62142 Pipe, reinforced/combine w/metal only, w/o fittin 6 400930 62143 Pipe, reinforced/combine w/ textiles, w/o fitting 7 400940 62144 Pipe, reinforced/combine w/ material, w/o fitting 8 400950 62145 Tubes, pipe etc, vulcan soft rubber, with fitting 9 401021 62921 Endless Transms Blt, Trapz, Circumfrn >60cm <180c
10 401022 62921 Endless Transms Blt, Circumference > 180cm < 240c 11 401011 62929 Conveyor belts or belting reinforced with metal 12 401012 62929 Conveyor belts reinforced with textile materials 13 401013 62929 Conveyor belts reinforced only with plastics 14 401019 62929 Conveyor belts/belting of vulcanize rubber, nesoi 15 401023 62929 Endless Synchron Blt, Circumference >60cm <150cm 16 401024 62929 Endless Synchron Blt, Circumference >150cm <198cm 17 401029 62929 Transmission belt/belting, of vulcanize rub, neso 18 401699 62999 Articles of soft vulcanized rubber nesoi
19 401693 62999 Gasket, washers & other seals, of vulcanized rub 20 580710 65621 Textile labels, badges etc, not embroidered, woven 21 560311 65720 Nonwovens of manmade filaments weighing < 25 g/m2 22 560312 65720 Nonwovens, of mmf weighing > 25 g/m2 but < 70 g/m2 23 560790 65751 Twine, cord whet/nt plait impreg w/rub/plast neso 24 560122 65771 Wadding; other articles of wadding of manmade fib
25 591110 65773 Text fabric for card clothing & other tech uses 26 591120 65773 Bolting cloth, whether or not made-up 27 591131 65773 Textile fabrics etc, papermaking, under 650 g/m2 28 591132 65773 Textile fabrics etc, papermaking, 650 g/m2 or more 29 590900 65791 Textile hosepiping and similar textile tubing 30 591000 65792 Transmsn/convyr belt,tex mat,whthr/nt reinfcd, ctd 31 681310 66382 Brake linings a pads, asbestos, oth minrls, celuls 32 700711 66471 Toughnd safety gls of size a shape for vehcls etc 33 700721 66472 Laminated safety glass for vehicles, aircraft etc. 34 700910 66481 Rear-view mirrors for vehicles 35 701710 66591 Lab, hygienic, pharmaceut glswr, fusd qurtz/silica 36 702000 66599 Articles Of Glass, Nesoi (used in lectronics)\ 37 820220 69551 Bandsaw blades, and base metal parts thereof 38 820231 69552 Circ saw blds bse mtl w wrkng pt of steel 39 820239 69553 Circ saw blades,bse mtl,wrkng pt oth thn stl,prts

30
40 820240 69554 Chn sw blds (lngths o ct to sz) a pts, bs mtl 41 820291 69555 Straight saw blades for working metal, bs mtl 42 820299 69559 Saw blades nesoi and parts, of base metal nesoi 43 820810 69561 Knvs a cttng blds f mtl wrkng a prts 44 820820 69561 Knvs a cttng blds f wood wrkng a prts 45 820830 69561 Kns a cttng blds f ktchn appln o fd ind mach a pts 46 820840 69561 Knvs a cttng blds f agric o frstry mach, a pts 47 820890 69561 Oth knvs a cttng blds f mach or mech eqp, pts b mt 48 820900 69562 Plates, sticks tips etc f tools unmountd cermets 49 820713 69563 Rck drlng earth borng tls wrkng pt cermets, & pts 50 820719 69563 Interchangeable tools for hand or machines;& parts 51 820720 69564 Dies drw o extr mtl a pts thrf 52 820730 69564 Tools for pressing, stamping or punching, b m pts 53 820740 69564 Tools for tapping or threading, pts, of bs mtl 54 820750 69564 Tools for drilling other than rock drill, b m pts 55 820760 69564 Tools for boring or broaching, and pts, base mtl 56 820770 69564 Tools for milling, and parts, base metal 57 820780 69564 Tools for turning of base metal 58 820790 69564 Interchangeable tools nesoi, and parts, base mtl 59 821194 69680 Blades for knives, nesoi 60 821195 69680 Handles bs mtl fr knives wth cuttng blades nt 8208 61 830230 69915 Oth bs metl mountngs fttngs etc for motor vehicles 62 830810 69933 Hooks, eyes and eyelets, of base metal 63 830890 69933 Clasps, buckles etc and parts of base metal, nesoi
64 732010 69941 Leaf springs and leaves therefor, of iron or steel 65 732020 69941 Helical springs of iron or steel 66 840290 71191 Super-heated water boilers & steam genrtn boil pts 67 840490 71192 Parts for aux plt for blrs,cond for stm,vpr pr unt 68 840690 71280 Parts for steam and other vapor turbines 69 840710 71311 Aircraft engines (spark-ignition/rotary int cmbus) 70 840910 71319 Parts for aircraft engines (sp-ign, rot or comp) 71 840731 71321 Sprk-ign piston eng f veh ex railwy not ovr 50 cc 72 840732 71321 Spark-Igntn Recprctng Pistn Engine Etc Nov 250cc 73 840733 71321 Spark-igntn recrctng pistn eng etc >250 nov1000cc 74 840734 71322 Spark-igntn recprcting piston engine etc > 1000 cc 75 840820 71323 Compression-igntn int combustion piston engine etc 76 840729 71332 Inboard engines for marine propulsion 77 840810 71333 Marine compress-ignin combustion piston engine etc 78 840790 71381 Spark-igntn rcprctng/rotary int combstn eng, nesoi 79 840991 71391 Spark-ignition int combustion piston eng pts nesoi 80 840999 71392 Spark-ignition reciprocating int com pistn eng pts

31
81 841111 71441 Turbojets of a thrust not exceeding 25 kn 82 841112 71441 Turbojets of a thrust exceeding 25 kn 83 841210 71449 Reaction engines other than turbojets 84 841121 71481 Turbopropellers of a power not exceeding 1,100 kw 85 841122 71481 Turbopropellers of a power exceeding 1,100 kw 86 841181 71489 Gas turbines of a power not exceeding 5,000 kw 87 841182 71489 Gas turbines of a power exceeding 5,000 kw 88 841191 71491 Turbojet and turboproller parts 89 841199 71499 Gas turbine parts nesoi 90 850110 71610 Electric motors of an output not exceeding 37.5 w 91 850131 71620 Dc motors & generators w output n ov 750 w
92 850132 71620
Dc Motors & Generators W Output > 750w; N Ov 75 Kw
93 850133 71620
Dc Motors & Generators W Output > 75kw; N Ov 375kw
94 850134 71620 Dc motors & generators of output exceeding 375 kw 95 850120 71631 Universal ac/dc motors of an output > 37.5 w 96 850140 71631 Ac motors nesoi, single-phase 97 850151 71631 Ac motors, multi-phase, output not exceeding 750 w 98 850152 71631 Ac Motors,Multi-Phase;Output > 750w Not Over 75 Kw 99 850153 71631 Ac motors, multi-phase, of an output > 75 kw
100 850220 71651 Generating set w spark-ignition int combustion eng 101 850300 71690 Parts of electric motors, generators & sets 102 841090 71819 Parts, inc regulators, for hydraulic turb & wtr wh 103 840140 71878 Parts of nuclear reactors 104 841290 71899 Engine and motor parts, nesoi 105 843290 72119 Agric hort/forest machy & lawn/ground roller parts 106 843390 72129 Parts for harvester, grass mowers, sorting egg etc 107 843490 72139 Parts of milking machines and dairy machinery 108 843590 72198 Pts,pres,crush&sim mac,use in mfg of fruit juices 109 843691 72199 Parts of poultry-keep mac or poultry incub & brood 110 843699 72199 Pts for agric, hort, forest, bee-keep mach nesoi 111 843141 72391 Buckets, shovels, grabs & grips for derricks etc 112 843142 72392 Bulldozer or angledozer blades 113 843143 72393 Parts for boring or sinking machinery, nesoi 114 843149 72399 Parts and attachments nesoi for derricks etc. 115 845230 72439 Sewing machine needles 116 845240 72439 Furniture, bases & covers for sewing mach & parts 117 845290 72439 Parts for sewing machines, nesoi 118 844820 72449 Pt & access for mach for extruding mm text mtl etc 119 844831 72449 Card clothing

32
120 844832 72449 Pts of mach for prepar textile fibrs ex card cloth 121 844833 72449 Spindles,spin flyers,spin rings & ring travellers 122 844839 72449 Pts & access for spinning, winding mach etc nesoi 123 844811 72461 Dob & jac;card reduc,copy,punch,assm mac as aux mc 124 844819 72461 Auxiliary mac for text machines (head 8444 - 8447) 125 844841 72467 Shuttles for looms 126 844842 72467 Reeds for looms, healds and heald-frames 127 844849 72467 Parts & acces of weav mach or their aux mach,nesoi 128 844851 72468 Sinkers needles & oth arts used in formng stitches 129 844859 72468 Pts & access nesoi for mach for knittng, braid etc 130 845390 72488 Parts of mach f prep or make art of hides,leather 131 845090 72491 Pts of household or lndry-typ wash mac inc wsh/dry 132 845190 72492 Pts for wash/clean, pasting floor covers etc 133 843991 72591 Parts of mach f make pulp of fibr cellulosic matl 134 843999 72591 Pts for machy mkg or finishing paper or paperboard 135 844190 72599 Pts of mac fr make up paper pulp,paper/papbrd,cut 136 844250 72635 Print type, blocks, cylinders etc for print purpse 137 844090 72689 Parts for bookbind mach, inc book-sew machines 138 844240 72691 Parts of mach & equip f make print blocks, etc 139 844390 72699 Pts for print machy & mach anchillary to printing 140 843790 72719 Parts of mach f clean,sort, mill grain,veg,ex farm 141 843890 72729 Parts of mach of ch 84, nesoi,ind prep food,drink 142 846691 72819 Parts for machines of heading 8464 143 846692 72819 Parts for machines of heading 8465 144 847490 72839 Parts of mach for sorting etc earth stone ores etc 145 847590 72851 Parts of mach for assmbl elec lamp etc mfg glsswre 146 847790 72852 Pts mach for work rubber/plast/mfg rbbr/plstc prod 147 847890 72853 Parts of mach,nesoi,for prep or making up tobacco 148 847990 72855 Pts of mach/mechncl appl w indvdul function nesoi 149 846610 73511 Tool holdrs & self-opening dieheads for machines 150 846620 73513 Work holders for machine tools 151 846630 73515 Dividing heads & ot spec attachments for mach tool 152 846693 73591 Parts and accessories for use with mach tool nesoi 153 846694 73595 Parts for machines of heading 8462 or 8463 154 845490 73719 Pts for converters ladles etc used in met foundry 155 845530 73729 Rolls for metal-rolling mills 156 845590 73729 Parts for metal rolling mills exc rolls for rol mi 157 851590 73739 Pt elect laser ultrasonic,etc,hot spray metal mach 158 846890 73749 Machy & appr pts for soldrng brazng weldng, nesoi 159 841690 74128 Parts of furnace burners 160 851490 74135 Parts for ind, lab furnaces,ovens or heating equip

33
161 841790 74139 Parts of ind or lab furn & oven,incinerat, nonelec 162 841891 74149 Furniture for refrigeration or freezing equipment 163 841899 74149 Refrigerator freezer and heat pump parts nesoi 164 841520 74155 Automotive air conditioners 165 841590 74159 Parts, nesoi, of air conditioning machines 166 840590 74172 Pts,prod gas,wtr gas,acetylene gas,wtr pro gas gen 167 841990 74190 Parts for machinery plant or lab equipment etc 168 841330 74220 Fuel, lub/cooling med pumps for int comb pistn eng 169 841391 74291 Parts of pumps for liquids 170 841392 74295 Parts of liquid elevators 171 842123 74363 Oil or fuel filters for internal combustion engine 172 842131 74364 Intake air filters for internal combustion engines 173 841490 74380 Air/gas pump, compressor and fan etc parts, nesoi 174 842191 74391 Parts of centrifuges, including centrifugal dryers 175 842199 74395 Filter/purify machine & apparatus parts 176 870990 74419 Parts for works trucks w/o lift equip 177 842542 74443 Jacks and hoists,hydraulic,exc blt-in jack systems 178 843110 74491 Pts for pulley tackle, hoist ex skip, winches, etc 179 843120 74492 Pts of frk lft trks & works trks with lift or hndl 180 843131 74493 Parts of elevators, exc cont action,sk hoist,escal 181 843139 74494 Pts for lifting, hndlng, loading/unldng mach nesoi 182 846791 74519 Parts of chain saws 183 846792 74519 Parts of pneumatic tools for working in the hand 184 846799 74519 Parts for hd tools self-con nonelectric motr neso 185 842290 74529 Parts for machines for dishwashing, packing, etc 186 842390 74539 Weighing machine weights & pts of weighing machine 187 842490 74568 Pts for mechanical appliance project liquid etc 188 842091 74593 Cylinders f rolling mach, exc f metals or glass 189 842099 74593 Parts,nesoi,f folling mach, exc f metals or glass 190 847690 74597 Parts of automatic vending machines 191 848210 74610 Ball bearings 192 848220 74620 Tapered roll brg, incl cone & roller assemblies 193 848230 74630 Spherical roller bearings 194 848240 74640 Needle roller bearings 195 848250 74650 Cylindrical roller bearing nesoi 196 848280 74680 Oth ball or roll brg, inc combined ball/roll brgs 197 848291 74691 Balls, needles and rollers for bearings 198 848299 74699 Parts of bearings, nesoi 199 848110 74710 Pressure-reducing valves 200 848120 74720 Valves f oleohydraulic or pneumatic transmissions 201 848130 74730 Check valves

34
202 848140 74740 Safety or relief valves 203 848180 74780 Taps cocks etc f pipe vat inc thermo control nesoi 204 848190 74790 Pts f taps etc f pipe vat inc press & thermo cntrl 205 848310 74810 Transmission shafts (inc cam-&crank-shaft), etc. 206 848320 74821 Housed bearings, incorp ball or roller bearings 207 848330 74822 Bearing housings; plain shaft bearings 208 731519 74839 Parts of articulated link chain of iron or steel 209 848340 74840 Gears; ball or roller screws; gear boxes, etc 210 848350 74850 Flywheels and pulleys, including pulley blocks 211 848360 74860 Clutches & shaft couplings (inc universal joints) 212 848390 74890 Toothed wheels,chain sprockets&oth trans elem; pts 213 848410 74920 Gaskets, metal layers, or other matl, mech seals 214 848490 74920 Sets or assortments of gaskets and similar joints 215 848510 74991 Ships' or boats' propellers and blades therefor 216 848420 74999 Mechanical seals 217 848590 74999 Machine parts with no electric features nesoi 218 847149 75230 Digital adp mac & units,entered as systems, nesoi 219 847150 75230 Digital processing units, n.e.s.o.i. 220 847160 75260 Adp input or output units, storage or not, nesoi 221 847170 75270 Automatic data processing storage units, n.e.s.o.i 222 847180 75290 Automatic data processing units, n.e.s.o.i. 223 847190 75290 Adp mac&unts thereof;mag/opt rder,trnscrb,proc dat 224 900990 75910 Parts and accessories of photocopying apparatus 225 847350 75990 Pts suitble fr use w mac of 2/more head 8469-8472 226 847310 75991 Typewriter & word process mach parts & accessories 227 847340 75993 Parts and accessories of office machines, nesoi 228 847321 75995 Parts of electronic calculating machines 229 847329 75995 Parts for mach,nesoi, incorp calculating device 230 847330 75997 Parts & accessories for adp machines & units 231 852721 76211 Radiobroadcast receivers for motor vehicles w rcos 232 852729 76212 Radiobroadcast receivers for motor vehicles nesoi 233 852731 76281 Radiobroadcast receivers,nesoi,with sound recorder 234 852732 76282 Radiobroadcast receivers,nesoi,with clock wo p & r 235 852739 76289 Radiobroadcast receivers nesoi 236 852520 76432 Transmission appr incorporating reception apparats 237 852790 76481 Reception appr radio-telephon/telegraph etc nesoi 238 851790 76491 Pt elect appr f line telephony or telegraphy etc. 239 851890 76492 Pts micro-head-ear-phone,elect snd ampl sets etc 240 852910 76493 Antennas and antenna reflectors and parts 241 852990 76493 Pts,ex antenna,for trnsmssn,rdr,radio,tv,etc nesoi 242 852210 76499 Pickup cartridgesfor sound recorders

35
243 852290 76499 Pts & access f sound/video reproducing,record appr 244 850421 77111 Liq Dielect Transformer Power Handl Cap Nov 650kva 245 850422 77111 Liq Dielect Transfrm Pwr Hnd Cap >650 Nov 10t Kva 246 850423 77111 Liq Dielect Transfrm Power Hand Cap > 10t Kva 247 850432 77119 Transformers, nesoi,> 1 kva but =< 16 kva 248 850433 77119 Transf nesoi, power handling cap >16 nov 500 kva 249 850434 77119 Transformers, nesoi, > 500 kva 250 850450 77125 Electrical inductors nesoi 251 850490 77129 Pts for elect transformers static converters indct 252 853400 77220 Printed circuits 253 853310 77231 Fixed carbon resistors, composition or film type 254 853321 77232 Fixed resistors, nesoi, pwr hand cap nov 20 w 255 853329 77232 Fixed resistors nesoi > 20 w power hdlg cpcy 256 853331 77233 Wirewound variable resistors, < 20 w 257 853339 77233 Wirewnd var resist inc rheostats etc nesoi 258 853340 77235 Variable resistors inc rheostat & potntiomtr nesoi 259 853390 77238 Parts for resistors, rheostats, potetiometers 260 853510 77241 Fuses for electrical apparatus, voltage > 1000 v 261 853521 77242 Automatic circuit breakers > 1000 v but < 72.5 kv 262 853529 77243 Auto circt breaker voltage 72.5 kv or more 263 853530 77244 Isolating Switch & Make-&-Break Swtch Volt > 1000v 264 853540 77245 Lightning arresters,voltage limiters,surge suppres 265 853590 77249 Elect appr f prtct to elect circt >1000 v nesoi 266 853610 77251 Fuses for voltage not exceeding 1000 v 267 853620 77252 Auto circuit breakers voltage not exceeding 1000 v 268 853630 77253 Other apparatus for protecting elc crts =< 1000 v 269 853641 77254 Relays for a voltage not exceeding 60 v 270 853649 77254 Relays For Voltage Over 60v More But Nt Over 1000v 271 853650 77255 Elect switches f voltage not over 1000 v, nesoi 272 853661 77257 Lampholders For Voltage Not Over 1000v 273 853669 77258 Elect plugs & sockets f voltage not over 1000 v 274 853690 77259 Elect appr f prtct to elect circt nov 1000 v nesoi 275 853710 77261 Controls etc w elect appr f elect cont nov 1000 v 276 853720 77262 Controls etc w elect appr f elect cont over 1000 v 277 853810 77281 Boards, panels, consoles etc of 8537 less apts 278 853890 77282 Pt f elect appr f elect circt; f elct contrl nesoi 279 854411 77311 Insulated winding wire of copper 280 854419 77311 Insulated winding wire, nesoi 281 854420 77312 Insulated coaxial cable & oth coaxial elect condct 282 854430 77313 Insulated wiring sets for vehicles ships aircraft 283 854441 77314 Insulated electric conductors =< 80 v with cntrs

36
284 854449 77314 Insulated electric conductors =< 80 v nesoi 285 854451 77315 Electrical Conductors > 80 But =< 1000v W Cnctrs 286 854459 77315 Elec Cond Ov 80v Nov 1000v Not Fitted W Connector 287 854460 77317 Electric conductors for voltage exceeding 1000 v 288 854470 77318 Insulated optical fiber cables with indvuly sh fbr 289 854610 77322 Electrical insulators of glass 290 854620 77323 Electrical insulators of ceramics 291 854690 77324 Electrical insulators, nesoi 292 854710 77326 Insulating fittings of ceramics for electrical mch 293 854720 77328 Insulating fittings for machines made of plastic 294 854790 77329 Inslt fit ex ceram/plas;elec cond tb/jnt,bmtl etc 295 902230 77423 X-ray tubes 296 902290 77429 X-ray/hi tnsn genr cntr pnl & dsk exm/trtmnt tb pt 297 851090 77549 Parts of electric shavers and hair clippers 298 850990 77579 Pts electromech domestc appl slf-cont elect motors 299 851690 77589 Pts f heaters,hairdressing appr,flt iron,stove etc 300 854011 77611 Cathode-ray tv picture tubes, color inc monitor 301 854012 77612 Cathode-ray tv picture tubes, black and white etc 302 854020 77621 Tv camera tbs; image cnvrtr & intnsfr; phtocthd tb 303 854040 77623 Data/graphic display tubes,color, w/ pitch < 0.4 m 304 854050 77623 Data/graphic display tubes, monochrome 305 854060 77623 Cathode-ray tubes, n.e.s.o.i. 306 854071 77625 Magnetron microwave tubes 307 854072 77625 Klystron microwave tubes 308 854079 77625 Microwave tubes, nesoi 309 854081 77627 Receiver or amplifier tubes 310 854089 77627 Thermionic and other cathode tubes nesoi 311 854091 77629 Parts of cathode-bay tubes 312 854099 77629 Parts of cathode tubes, nesoi 313 854110 77631 Diodes ex photosensitive or light-emitting diodes 314 854121 77632 Transistors ex photosenitive,disspation rate < 1 w 315 854129 77633 Transistors, other than photosensitive, nesoi 316 854130 77635 Thyristors, diac & triac, ex photosensitive device 317 854140 77637 Photosnsitve semicndctr dvice inc phtvltc cell etc 318 854150 77639 Semicndctr dvice ex photosensitive/photovoltaic cl 319 854212 77641 Cards incorp. Elec. Integrated crct (smart cards) 320 854213 77641 Metal oxide semiconductors(mos),mono digital inte 321 854214 77641 Monolithic digital integ circuits,bipolar tchnolg 322 854219 77641 Monolithic integrated circuits, digital, nesoi 323 854230 77643 Electronic monolithic integrated circuit,n.e.s.o. 324 854240 77645 Electronic hybrid integrated circuits

37
325 854250 77649 Electronic microassemblies 326 854160 77681 Mounted piezoelectric crystals 327 854190 77688 Parts for diodes, transistors & smlr semiconductrs 328 854290 77689 Electronic integrated circuits and mcrssmbls parts 329 850710 77812 Lead-acid batteries of a kind used for stg engines 330 850720 77812 Lead-acid storage batteries nesoi 331 850730 77812 Nickel-cadmium storage batteries 332 850740 77812 Nickel-iron storage batteries 333 850780 77812 Storage batteries nesoi 334 850690 77817 Primary battery and cell parts 335 850790 77819 Pts elect storage batteries inc separators thereof 336 853929 77821 Filament lamps ex ultraviolet/infrared lamps nesoi 337 853921 77821 Tungsten halogen electric filament lamps 338 853922 77821 Filament lamp power nov 200 w & voltage over 100 v 339 853931 77822 Discharge lamps, (ex ultraviolet), fluorescent 340 853932 77822 Mercury or sodium vapor lamps; metal halide lamps 341 853939 77822 Discharge lamps ex ultrvilt flurscnt ht cthde lamp 342 853910 77823 Sealed beam electric lamp units 343 853941 77824 Arc lamps 344 853949 77824 Ultraviolet or infrared lamps 345 853990 77829 Parts for elect filament, discharge or arc lamps 346 851110 77831 Internal combustion engine spark plugs 347 851120 77831 Internal combustion engine magnetos, magneto-dynam 348 851130 77831 Distributors; ignition coils 349 851140 77831 Internal combustion engine starter motors 350 851150 77831 Internal combustion engine generators, nesoi 351 851180 77831 Elect igntn/start eq f spark/comp eng; genrt nesoi 352 851190 77833 Pts elect igntn/start equip; generators & cut-outs 353 851210 77834 Lighting or visual signaling equipment for bicycle 354 851220 77834 Elect lighting/visual signlng eq ex for bicycles 355 851230 77834 Electrical sound signaling equipment for mtr vhl 356 851240 77834 Wndshield wipr dfrstr & dmstr for cycle/mtr vehcle 357 851290 77835 Pt elect lghtng/sgnlng eq wndshield wpr dfrstr etc 358 850890 77848 Electromechanical hand tool parts 359 853210 77861 Fixed capacitors, 50-60 hz, power, cpcty =>.5 kvar 360 853221 77862 Tantalum electrolytic fixed capacitors 361 853222 77863 Aluminum electrolytic fixed capacitors 362 853223 77864 Ceramic dielectric,single layer fixed capacitors 363 853224 77865 Ceramic dielectric, multilayer fixed capacitors 364 853225 77866 Dielectric fixed capacitors of paper or plastics 365 853229 77867 Fixed capacitors, nesoi

38
366 853230 77868 Variable or adjustable (pre-set) capacitors 367 853290 77869 Parts for electrical capacitors 368 854311 77871 Particle accelerators,ion implanters for smcndctrs 369 854319 77871 Particle accelerators, nesoi 370 854390 77879 Pt elec mach & appr w individual functions, nesoi 371 850511 77881 Permanent magnets made of metal 372 850519 77881 Permanent magnets made of materials o/t metal 373 850520 77881 Electromagnetic couplings, clutches and brakes 374 850530 77881 Electromagnetic lifting heads 375 850590 77881 Electromagnets,clamps, similr hldng devices & part 376 853010 77882 Electrical signaling or traffic control eqpt rail 377 853080 77882 Electrical signaling or traffic control eqpt,nesoi 378 853090 77883 Parts for elc signaling, traffic, safety equipmnt 379 853190 77885 Parts of electric sound or visual signaling aprts 380 854511 77886 Carbon electrodes of a kind used for furnaces 381 854519 77886 Carbon electrodes nesoi 382 854520 77886 Electrical carbon or graphite brushes 383 854590 77886 Electrical carbon or graphite articles, nesoi 384 854890 77889 Electrical parts of machinery nesoi in chapter 85 385 870600 78410 Chas w eng f trac, mtr veh f pass/gd & special pur 386 870710 78421 Bodies f mtr car/vehicles for transporting persons 387 870790 78425 Bodies f road tractors and motor veh(pub tran,etc) 388 870810 78431 Bumpers and parts, for motor vehicles 389 870821 78432 Safety seat belts for motor vehicles 390 870829 78432 Pts & access of bodies of motor vehicles, nesoi 391 870831 78433 Mounted brake linings for motor vehicles 392 870839 78433 Brakes and servo-brakes & pts for motor vehicles 393 870840 78434 Gear boxes for motor vehicles 394 870850 78435 Drive axles with differential for motor vehicles 395 870860 78436 Non-driving axles & pts thereof for motor vehicles 396 870870 78439 Road wheels & pts & accessories for motor vehicles 397 870880 78439 Suspension shock absorbers for motor vehicles 398 870891 78439 Radiators for motor vehicles 399 870892 78439 Mufflers and exhaust pipes for motor vehicles 400 870893 78439 Clutches and parts thereof for motor vehicles 401 870894 78439 Steering wheels, columns & boxes f motor vehicles 402 870899 78439 Parts and accessories of motor vehicles, nesoi 403 871411 78535 Saddles and seats of motorcycles 404 871419 78535 Parts of motorcycles, nesoi 405 871420 78536 Parts & accsries of carriages for disables persons 406 871491 78537 Frames and forks, and prts for bicycles etc.

39
407 871492 78537 Wheel rims and spokes for bicycles etc. 408 871493 78537 Hubs,other than coster brakn hubs,hb brks,spk,whls 409 871494 78537 Brakes, incl coaster brkng hubs,hub brks,prts,nes 410 871495 78537 Saddles for bicycles etc. 411 871496 78537 Pedals and crank-gear, parts of bicycles etc. 412 871499 78537 Parts and acessories nesoi of bicycles etc. 413 871690 78689 Pts trailers, semi-trailer & ot veh n mech propeld 414 860711 79199 Truck assemblies for self-propelled railway veh 415 860712 79199 Truck assemblies, railway, nesoi 416 860719 79199 Truck axles and wheels & pts, etc for rail vehicls 417 860721 79199 Airbrakes and parts thereof 418 860729 79199 Brakes, except airbrakes, and parts thereof 419 860730 79199 Hooks & oth coupling devices buffers & pts thereof 420 860791 79199 Parts, nesoi, of locomotives 421 860799 79199 Pts of railway/tramway exc locomo/rollg stck nesoi 422 880310 79291 Propellr rotor & pts of gliders & a/c, n-pwrd/pwrd 423 880320 79293 Undcarrge & pts gliders & a/c, non-powered/powered 424 880330 79295 Parts of airplanes or helicopters, nesoi 425 880390 79297 Parts of non-powered & powered aircraft etc nesoi 426 732211 81211 Radiators for centrl htng and parts, cast iron 427 732219 81211 Radiators for cntrl htng and parts, ios exc cstirn 428 732290 81215 Air htrs a hot air dist nt elec htd wfan, prts ios 429 840390 81219 Parts for central heating boilers 430 851390 81380 Parts for portable electric lamps nesoi 431 940591 81391 Parts for lamps etc. Of glass 432 940592 81392 Parts for lamps etc. Of plastic 433 940599 81399 Parts for lamps and lighting fittings, nesoi 434 940110 82111 Seats of a kind used for aircraft 435 940120 82112 Seats of a kind used for motor vehicles 436 940190 82119 Parts of seats (ex medical, barber, dental etc) 437 940390 82180 Parts of furniture, nesoi 438 621220 84552 Girdles & panty girdles, knit or crocheted or not 439 621230 84552 Corsets, knitted or crocheted or not 440 621290 84552 Braces suspenders garters art parts kt o ct 441 650300 84841 Felt hats & other felt headgear from heading 6501 442 650400 84842 Hats&othr hdgr,plaitd/assembld strips any material 443 650700 84848 Hdbands, linings, cvrs, frms, vsrs, etc chinstraps 444 900590 87119 Parts etc of binoculars, optical telescropes etc 445 901290 87139 Pts for microscopes, exc optical; diffraction 446 901190 87149 Pts & accessories for compound optical microscopes 447 901390 87199 Pts of liq crystal device, laser&oth optical,nesoi

40
448 902890 87319 Pt acces gas lqd elec supply mtr inc clbrating mtr 449 902920 87325 Speedometers and tachometers; stroboscopes 450 902990 87329 Pts for revolution counters, odometer, etc 451 901490 87412 Pts, for direct find compasses, navigational inst 452 901590 87414 Parts and accessories for surveying etc nesoi 453 901790 87424 Pts, for drawing etc & inst for measuring lgth ins 454 903190 87426 Pts, of mach nesoi in this chap,& profile projectr 455 902690 87439 Pts, inst & apprts measure/check variables liq/gas 456 902490 87454 Pts, machine & appln, test hardness/strength, etc 457 902590 87456 Pts, hydrometers, therometers, pyrometers, etc 458 903210 87461 Thermostats 459 903220 87463 Manostats 460 903290 87469 Pts, autom regulating/controlling inst & apprts 461 903090 87479 Pts of inst f meas elect quat alpha beta inzng rdt 462 903300 87490 Pts, nesoi for machines,appln,inst/appts of chap90 463 900662 88112 Photo flashbulbs, flashcubes and the like 464 900661 88113 Photo discharge lamp (electronic) flashlght apprts 465 900669 88113 Photographic flashlight apparatus nesoi 466 900691 88114 Parts and accessories for still photo cameras 467 900699 88115 Pts, photographic flashlight exc nesoi 468 900791 88123 Parts and accessories for cinema cameras 469 900792 88124 Parts and accessories for cinema projectors 470 900890 88134 Pts, of image projector,enlarger&reducer exc cinem 471 901090 88136 Pts & access of apprt & equip for photo/cinema lab 472 900390 88422 Parts for frames and mountings, spectacles, etc 473 900211 88431 Objctve lenses pts access for cameras projectr etc 474 900219 88432 Objective lenses and parts, nesoi 475 900220 88433 Filters & parts & accessories for instr & appratus 476 900290 88439 Prism, mirrors, mounted & parts & accessorie, neso 477 910400 88571 Inst panel clk & clk simlr,for vehicle,aircrft,etc 478 911110 88591 Wtch cases,prcs metal or metal clad w prcs metal 479 911120 88591 Watch cases of base metals, gold or silver plated 480 911180 88591 Watch cases, nesoi 481 911190 88591 Parts for watch cases of any material 482 911210 88597 Clock cases of metal 483 911280 88597 Clock cases of other than metal 484 911290 88597 Parts for clock cases, nesoi 485 911011 88598 Complete movements of watches,unassem/ptly assembl 486 911012 88598 Incomplete movements of watches, assembled 487 911019 88598 Rough movements of watches 488 911090 88598 Compl clk movemnt, unassemble/ptly assem,rough etc

41
489 911410 88599 Clock or watch springs, including hair springs 490 911420 88599 Clock or watch jewels 491 911430 88599 Clock or watch dials 492 911440 88599 Clock or watch plates and bridges 493 911490 88599 Parts for clocks or watches, nesoi 494 930610 89121 Cartridges for riveting or similar tools & parts 495 930529 89195 Parts of sport shotgun and rifles, nesoi 496 482110 89281 Paper and paperboard labels of all kinds, printed
497 392630 89395 Fittings for furniture, coachwork etc, of plastics 498 950291 89423 Doll garments and accessories, footwear & headwr 499 950299 89423 Doll parts and accessories nesoi 500 852440 89860 Magnet tapes fr reproducing other than sound/image
501 852452 89865
Mag Tape,Sound or Image,Recorded,Ovr 4mm N/O 6.5mm
502 852453 89867 Magnetic Tape and 0r Image,Recorded,Ovr 6.5mm Wide 503 852460 89879 Recorded, cards incorp. A magnetic stripe 504 852491 89879 Ohtr recorded media,nesoi,for reprod othr than s/i 505 852499 89879 Recorded media for reproducing snd or image, nesoi 506 852431 89879 Laser discs for reproducing other than sound/image 507 852439 89879 Discs for laser reading systems, nesoi 508 920910 89890 Metronomes, tuning forks and pitch pipes 509 920920 89890 Mechanisms for music boxes 510 920930 89890 Music instrument strings 511 920991 89890 Parts and accessories for pianos 512 920992 89890 Pts & accessories for string music inst nesoi 513 920993 89890 Pts & accessories for keyboard pipe organs etc. 514 920994 89890 Pts & accessories for musical inst of heading 9207 515 920999 89890 Pts & accessories for musical instruments nesoi 516 961390 89935 Parts of lighters, except flints and wicks 517 660310 89949 Handles and knobs for umbrellas, whips etc. 518 660320 89949 Umbrella frames, mounted, shaft/stick 519 660390 89949 Parts, trimmings & access of umbrellas etc. 520 960610 89983 Press-fasteners, snap-fastners & press-studs& pts 521 960621 89983 Buttons of plastics, not covered with text materls 522 960622 89983 Buttons,of base metal,not coverd w textile mat 523 960719 89985 Slide fasteners, nesoi
524 960720 89986 Parts of slide fasteners 525 670100 89992 Skins & oth parts of birds w feathers processed
Note: 1 Listed in ascending order of SITC codes

42
References
Andeeton, Robert and Filippo di Mauro (2008), ‘Globalisation and the trade Channels in the Euro Area’, in in Filippo do Mauro, Stephanie Dees and Warwick McKibbin (eds.), Globalisation, Regionalism and Economic Interdependence, Cambridge: Cambridge University Press, 102-125.
Antràs, P. (2005) ‘Incomplete Contracts and the Product Cycle,’ American Economic Review, 95(4), pp.1054-1073.
Arvis, Jean-Francois, M. Mustra, J. Panzer, L. Ojala and T. Naula. (2007), Connecting to Compete: Trade Logistics in the Global Economy: The Logistic Performance Index and Its Indicators. Washington DC: World Bank.
Athukorala, Prema-chandra. (2005) Product Fragmentation and Trade Patterns in East Asia. Asian Economic Papers, 4(3):1-27.
Athukorala, Prema-chandra (2008) ‘Singapore and ASEAN in the New Regional Division of Labour’, Singapore Economic Review53(3) 479-508.
Athukorala, Prema-chandra. (2009), ‘The Rise of China and East Asian Export Performance: Is the Crowding-out Fear Warranted?’ World Economy, 32(2): 234–66.
Athukorala, Prema-chandra and Nobuaki Yamashita (2008), ‘Patterns and Determinants of Production Fragmentation in World Manufacturing Trade’ in Filippo do Mauro, Stephanie Dees and Warwick McKibbin (eds.), Globalisation, Regionalism and Economic Interdependence, Cambridge: Cambridge University Press, 45-72.
Athukorala, Prema-chandra, Nobuaki Yamashita (2009), ‘Global Production Sharing and Sino-US Trade Relations’, China and World Economy, 17(2), 39-56.
Borrus, Michael, Dieter Earnst and Stephen Haggard (2000), International Production Networks in Asia: Rivalry or Riches?. London: Rutledge.
Brown, Clair and Greg Linden (2005), ‘Offshoring in the Semiconductor Industry: A Historical Perspective’, in Lael Brainard and Susan M. Collins (eds.), The Brookings Trade Forum 2005: Offshoring White-Collar Work: The Issues and Implications (pp.270-333). Washington DC: Brooking Institution Press.
Dean, Judith, K.C. Fung and Zhi Wang (2008), ‘Measuring the Vertical Specialization in Chinese Trade’, USITC Working Paper, Washington, DC: U.S. International Trade Commission.
Drysdale, Peter and Ross Garnaut. (1997) ‘The Pacific: An Application of a General Theory of Economic Integration’, in C. Fred Bergsten and Marcus Noland (eds), Pacific Dynamism and the International Economic System, Washington DC: Institute for International Economics, 183-224.
Drucker, Peter (1977), ‘The Rise of Production Sharing’, The Wall Street Journal, March 15, p. 8. Eichengreen, Barry and Kevin O’Rourke (2009), ‘A Tale of Two Depressions’, 1 September,
http:/www.voxeu.org/index.php?q=node/3421 Evans, Carolyn and James Harrigan (2003), ‘Distance, Time and Specialization’, National
Bureau of Economic Research (NBER) Working Paper 9729, Cambridge, Mass: NBER. Feenstra, Robert (1998), ‘Integration of Trade and Disintegration of production in the Global
Economy’, Journal of economic Perspectives, 14(4): 31-50. Feenstra, Robert C. (2008), Óffshoring in the Global Economy (The Ohlin Lectures 2008),
Stockholm School of Economics. Feenstra, RC, RE Lipsey, H Deng, AC Ma and H Mo (2005), ‘World Trade Flows, 1962-2000’,
National Bureau of Economic Research (NBER) Working Paper 11040, Cambridge, MA: NBER. (http:/www.nber.org/papers/w11040).

43
Feenstra, Robert C., W. Hai, W. T. Woo and S. Uao (1999) ‘Discrepancies in international trade data: an application to China–Hong Kong Entrepôt trade’, American Economic Review, 89(2): 338–343.
Frankel, Jeffrey A. and Wei, S-J. (1997) ‘ The New Regionalism and Asia: Impact and Policy Options’, in Arvind Panagariya, M.G. Quibria and Narhari Rao (eds), The Global Trading System and Developing Asia, Oxford: oxford University Press, 83-130.
Fukao, Kyoji, and Tangjun Yuan. 2009. Why is Japan so heavily affected by the global economic crisis? www.voxeu.org. 8 June.
Gereffi, Gary, John Humphrey and Timothy Sturgeon (2005), ‘The Governance of Global Value Chains. Review of International Political Economy, 12(1): 78-104.
Gorg, H. (2000), Fragmentation and trade: US inward processing trade in the EU. Weltwirtschaftliches Archiv, 136 (3): 403-422.
Grossman, Gene M. & Elhanan Helpman (2005), ‘Outsourcing in a global economy’, Review of Economic Studies, 72 (1):135-159.
Helleiner, Gerand K. (1973), ‘Manufactured Exports from Less-Developed Countries and Multinational Firms’, Economic Journal, 83(329): 21-47.
Helpman, Elhanan (2006), ‘Trade, FDI, and the Organization of Firms’, Journal of Economic Literature, 154: 589-630. http://www.econ.ucdavis.edu/faculty/fzfeens/pdf/Feenstra_Ohlin_Lecture_2008.pdf
Hummels, David, Jun Ishii and Kei-Mu Yi. (2001), ‘The nature and growth of Vertical Specialization in World Trade’, Journal of International Economics, 54(1): 75-96.
Hummels, David. (2007) ‘Transport Costs and International Trade in the Second Era of Globalization. Journal of Economic Perspectives, 21(2): 131-154.
Jones, Ronald W. (2000), Globalization and the theory of input trade. Cambridge, Mass.: MIT Press.
Jones, Ronald W. and H. Kierzkowski. (2001), ‘Globalization and the consequences of international fragmentation’, in R. Dornbusch, G. Calvo & M. Obstfeld (eds.), Money, factor mobility and trade: the festschrift in honor of Robert A. Mundell (pp. 365-381). Cambridge, Mass.: MIT Press.
Carruthers, Robin, Jitendra N. Bajpai and David Hummels ( 2003 ), Trade and Logistics: An East Asian Perspective’, n Hathie Krumn and Homi Kraras (eds.), East Asia Integrates: A Trade Policy Agenda for Shares Growth, Washington DC: World Bank.
Kierzkowski, H. (2001), ‘Joining the global economy: experience and prospects of the transition economies’, in S.W. Arndt & H. Kierzkowski (eds.), Fragmentation: New Production Patterns in the World Economy (pp. 231-253). Oxford: Oxford University Press.
Kimura, Fukunari (2006), ‘International Production and Distribution Networks in East Asia: 18 Facts, Mechanics, and Policy Implications”’, Asian Economic Policy Review, 1(1), 346-347.
Krugman, Paul R. (2008), ‘Trade and Wages, Reconsidered’, Brookings Papers on Economic Activity 1: Macroeconomics, 103- 138.
Krugnam, Paul (2009), ‘The Return of Depression Economics’, Linoel Robbins Lectures (PPT presentation and th summary by Geoff Riley, ‘Paul Krugman at LSE), http/cep.lse.ac.uk/_new/events/special_post.asp.
McKendrick, D. G., Doner, R. F. & Haggard, S. (2000), From Silicon Valley to Singapore: location and competitive advantage in the hard disk drive industry. Stanford, Cal: Stanford University Press.
Ng, F. and A.Yeats (2001), ‘Production sharing in East Asia: who does what for whom, and why?’, In L. K. Cheng & H. Kierzkowski (eds.), Global production and trade in East Asia (pp. 63-109). Boston: Kluwer Academic Publishers.

44
Ng, F. and A.Yeats (2003), ‘Major trade trends in East Asia: what are their implications for regional cooperation and growth?’, Policy Research Working Paper 3084, Washington DC: World Bank.
Park, Y. C. and K. Shin (2009) Economic Integration and Changes in the Business Cycle in East Asia: Is the Region Decoupling from the Rest of the World?. Asian Economic Papers 8(1), 107-140
Quah, Danny T. (1997), ‘Increasingly Weightless Economies’, Bank of England Quarterly Bulletin, Feb.: 49-56.
Rangan, S. and R. Lawrence (1999), A prism on globalization, Washington DC: Brookings Institution Press.
Sharpton, Michael. (1975), ‘International Subcontracting. Oxford Economic Papers, 27(1): 94-135.
Spenser, Barbara J. (2005), ‘International Outsourcing and Incomplete Contracts’, Canadian Journal of Economics, 38(4): 1107-1135.
Sturgeon, T.J. (2003), ‘What Really goes on in Silicon Valley? Spatial clustering and dispersal in modular production networks. Journal of Economic Geography, 3: 199–225.
USITC (United State International Trade Commission) 1999. Production sharing: use of U.S. components and material in foreign assembly operations, 1995-1998. USITC Publication 3265, Washington DC: USITC.
Wong, Hpo Kam. (2007), ‘The Remaking of Singapore’s High-Tech Enterprise System’, in Henry S. Rowen, Marguerite G. Hancock and Lilliam F. Miller (eds.), Making IT: The Rise of Asian in High Tech (pp.123-174). Standford, CA: Stanford University Press.
Yeats, Alexander (2001), ‘Just How Big is Global Production Sharing?’, in Seven Arndt and Henryk Kierzkowski (eds), Fragmentation: New Production Patterns in the World Economy (pp. 108-43). New York: Oxford University Press,
Yi, K. (2003), ‘Can vertical specialization explain the growth of world trade’, Journal of Political Economy, 111 (1): 52-102.

45
Table 1: Geographic profile of world manufacturing trade: total trade and network trade (a) Exports
Total manufacturing Network products
Parts
And components
Final assembly Total
Share of parts and
components in
network products (%)
1992/3 2006/07 1992/3 2006/07 1992/3 2006/07 1992/3 2006/07 1992/3 2006/07
East Asia 28.3 34.0 29.6 42.8 34.1 37.5 32.2 40.3 39.0 56.5
Japan 12.3 7.2 15.2 9.1 20.8 9.9 18.4 9.5 35.0 51.3
Developing East Asia 16.0 26.8 14.4 33.7 13.3 27.6 13.8 30.9 44.3 58.1
PRC 4.5 14.3 1.7 13.5 2.4 15.7 2.1 14.5 35.0 49.4
Hong Kong, China 1.8 0.7 1.5 0.8 1.2 0.5 1.3 0.7 46.8 65.2
Taipei, China 2.9 2.5 3.7 4.0 2.0 2.2 2.7 3.2 58.4 67.2
Republic of Korea 2.3 3.4 2.2 5.6 2.0 3.7 2.1 4.7 45.0 63.5
ASEAN 4.5 6.0 5.2 9.8 5.8 5.5 5.6 7.8 39.9 66.9
Indonesia 0.6 0.6 0.1 0.5 0.1 0.5 0.1 0.5 40.3 56.1
Malaysia 1.2 1.7 1.7 3.4 1.9 1.8 1.8 2.6 40.5 68.1
Philippines 0.3 0.7 0.5 1.8 0.2 0.4 0.4 1.2 61.6 82.1
Singapore 1.5 1.4 2.3 2.6 2.6 1.0 2.5 1.9 38.7 74.1
Thailand 0.8 1.3 0.6 1.4 0.9 1.8 0.8 1.6 32.7 47.5
Vietnam 0.0 0.3 0.0 0.1 0.0 0.1 0.0 0.1 23.6 59.2
South Asia 0.9 1.3 0.1 0.4 0.1 0.2 0.1 0.3 44.1 72.7
India 0.6 1.0 0.1 0.4 0.1 0.2 0.1 0.3 47.2 73.5
Oceania 0.4 0.4 0.3 0.3 0.3 0.3 0.3 0.3 45.6 51.2
NAFTA 17.2 14.0 25.3 16.2 20.6 16.6 22.6 16.4 47.5 52.6
Mexico 1.2 2.2 2.7 2.8 1.5 3.8 2.0 3.3 57.7 45.1
EU15 41.3 35.4 39.2 29.3 35.3 31.4 37.0 30.3 44.9 51.5
Developed countries 72.4 56.6 76.7 52.7 78.6 56.1 77.8 54.3 41.8 51.7
Developing countries 27.6 43.4 20.8 46.8 22.9 44.4 22.0 45.7 40.1 54.6
World 100.0 100.0 100.0 100.0 100.0 100.0 100.0 100.0 42.4 53.2
2651 8892 511 2409 696 2116 1207 4525

46
(b) Imports
East Asia 21.7 23.7 30.1 36.6 14.3 18.1 21.0 28.1 61.2 70.3
Japan 4.1 3.5 4.0 3.8 3.0 3.3 3.4 3.5 49.9 57.7
Developing East Asia 17.6 20.3 26.1 32.8 11.2 14.9 17.6 24.5 63.4 72.1
PRC 2.9 7.1 3.0 11.5 1.5 6.0 2.2 9.0 59.3 69.0
Hong Kong, China 4.4 3.6 5.4 6.3 2.8 2.1 3.9 4.4 59.4 78.2
Taipei, China 2.1 1.6 3.1 2.3 1.4 1.2 2.1 1.8 62.1 69.9
Republic of Korea 2.0 2.2 3.1 2.5 1.1 1.6 1.9 2.1 67.4 64.8
ASEAN 6.2 5.8 11.5 10.2 4.4 4.0 7.4 7.3 66.1 74.9
Indonesia 0.8 0.4 1.1 0.3 0.3 0.3 0.6 0.3 74.7 58.0
Malaysia 1.4 1.3 3.0 2.4 1.1 1.2 1.9 1.9 66.7 69.4
Philippines 0.4 0.5 0.6 1.2 0.2 0.4 0.4 0.8 68.6 77.9
Singapore 2.3 2.1 4.8 4.5 2.0 1.5 3.2 3.2 64.6 77.7
Thailand 1.3 1.1 2.0 1.4 0.8 0.6 1.3 1.0 66.2 74.4
Vietnam 0.0 0.4 0.0 0.3 0.0 0.2 0.0 0.2 66.2
South Asia 0.9 1.3 0.7 1.1 0.4 0.9 0.6 1.0 56.4 59.1
India 0.5 1.1 0.4 0.9 0.2 0.8 0.3 0.8 62.2 57.4
NAFTA 16.6 18.6 31.8 19.6 8.5 17.9 18.5 18.8 73.7 56.3
Mexico 1.8 2.4 2.7 3.2 1.0 2.0 1.7 2.6 67.4 65.5
EU15 42.0 35.2 45.5 29.9 7.5 15.9 23.8 23.5 81.9 68.8
Developed countries 71.4 61.1 82.7 52.3 68.8 66.8 74.7 59.0 47.3 47.8
Developing countries 28.6 38.9 17.3 47.7 31.2 33.2 25.3 41.0 29.3 62.8
World 100.0 100.0 100.0 100.0 100.0 100.0 100.0 100.0 42.8 54.0
2627 8813 514 2409 687 2055 1201 4464
Source: data compiled from UN Comtrade database.

47
Table 2: Share of Network products in Manufacturing Trade, 1992/3 and 2006/7 (%)
Parts and components Final assembly Total Network products
1992/3 2006/7 1992/3 2006/7 1992/3 2006/7
(a) Exports
East Asia 20.2 34.1 31.6 26.2 51.8 60.3
Japan 23.9 34.4 44.5 32.6 68.4 67.0
Developing East Asia 17.3 34.0 21.8 24.5 39.1 58.5
PRC 7.4 25.6 13.7 26.2 21.1 51.8
Hong Kong, China 15.8 33.3 18.0 17.8 33.8 51.1
Taipei, China 24.7 44.2 17.6 21.6 42.3 65.8
Republic of Korea 18.1 44.2 22.2 25.4 40.3 69.5
ASEAN 22.7 44.2 34.1 21.9 56.8 66.1
Indonesia 3.8 21.5 5.6 16.8 9.3 38.4
Malaysia 27.7 53.6 40.7 25.1 68.4 78.8
Philippines 32.9 71.7 20.5 15.6 53.4 87.3
Singapore 29.0 49.3 45.9 17.2 74.9 66.5
Thailand 14.1 29.9 29.0 33.0 43.1 62.9
Vietnam --- 11.0 --- 7.6 --- 18.5
South Asia 2.3 8.2 2.9 3.1 5.1 11.3
India 3.0 10.4 3.4 3.8 6.4 14.2
NAFTA 28.4 31.2 31.4 28.1 59.7 59.3
Mexico 42.1 34.6 30.8 42.1 72.9 76.6
EU15 18.3 22.4 22.4 21.1 40.7 43.5
Developed countries 20.4 25.2 28.5 23.6 48.9 48.8
Developing countries 14.6 29.2 21.8 24.3 36.4 53.6
World 19.3 27.1 26.3 23.8 45.5 50.9
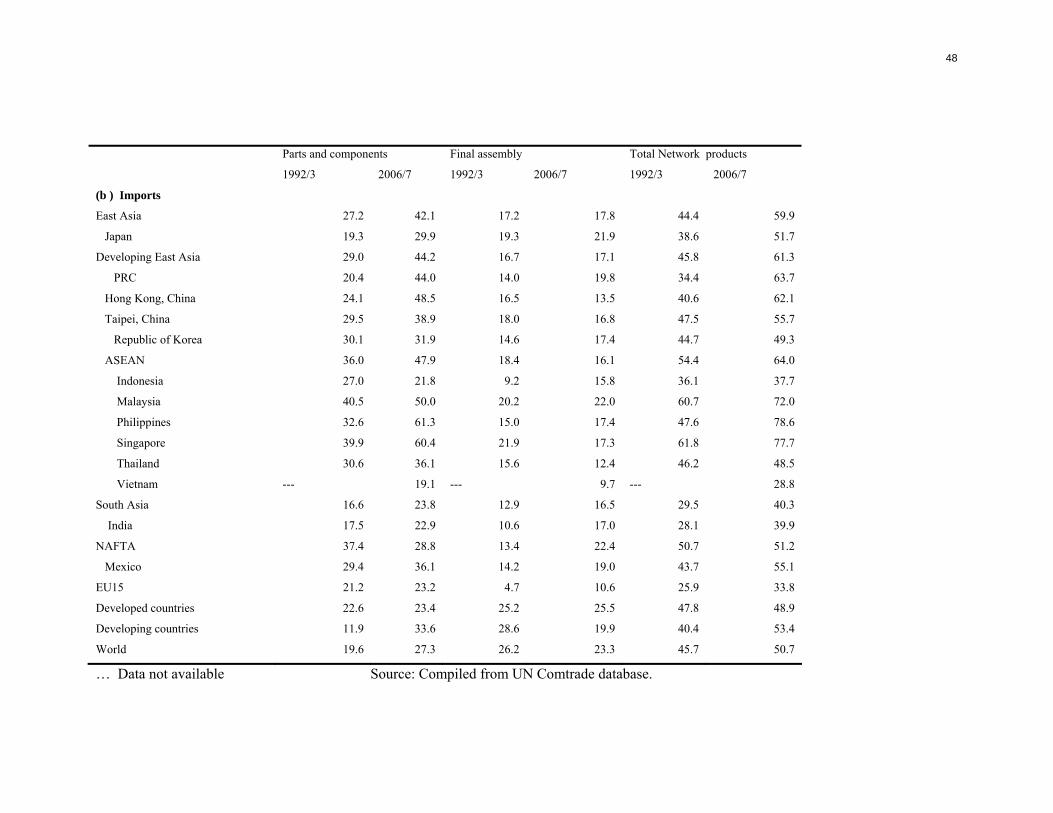
48
Parts and components Final assembly Total Network products
1992/3 2006/7 1992/3 2006/7 1992/3 2006/7
(b ) Imports
East Asia 27.2 42.1 17.2 17.8 44.4 59.9
Japan 19.3 29.9 19.3 21.9 38.6 51.7
Developing East Asia 29.0 44.2 16.7 17.1 45.8 61.3
PRC 20.4 44.0 14.0 19.8 34.4 63.7
Hong Kong, China 24.1 48.5 16.5 13.5 40.6 62.1
Taipei, China 29.5 38.9 18.0 16.8 47.5 55.7
Republic of Korea 30.1 31.9 14.6 17.4 44.7 49.3
ASEAN 36.0 47.9 18.4 16.1 54.4 64.0
Indonesia 27.0 21.8 9.2 15.8 36.1 37.7
Malaysia 40.5 50.0 20.2 22.0 60.7 72.0
Philippines 32.6 61.3 15.0 17.4 47.6 78.6
Singapore 39.9 60.4 21.9 17.3 61.8 77.7
Thailand 30.6 36.1 15.6 12.4 46.2 48.5
Vietnam --- 19.1 --- 9.7 --- 28.8
South Asia 16.6 23.8 12.9 16.5 29.5 40.3
India 17.5 22.9 10.6 17.0 28.1 39.9
NAFTA 37.4 28.8 13.4 22.4 50.7 51.2
Mexico 29.4 36.1 14.2 19.0 43.7 55.1
EU15 21.2 23.2 4.7 10.6 25.9 33.8
Developed countries 22.6 23.4 25.2 25.5 47.8 48.9
Developing countries 11.9 33.6 28.6 19.9 40.4 53.4
World 19.6 27.3 26.2 23.3 45.7 50.7
… Data not available Source: Compiled from UN Comtrade database.

49
Table 3: Commodity composition of network trade, 2006/7 (%) EA Japan DEA China TW+K ASEAN Malaysia NAFTA Mexico EU15 World
(a) Parts and component exports
Chemicals (SITC 5) 0.1 0.2 0.1 0.1 0.1 0.1 0.0 0.3 0.1 0.5 0.3
Resource based products (SITC 6 - SITC 68) 2.0 3.5 1.6 2.0 1.6 1.0 0.5 3.9 3.3 5.4 3.7
Machinery and transport equipment (SITC 7) 93.7 91.1 94.4 93.8 93.4 96.6 98.0 89.5 87.2 87.3 90.7
Power generating machines (71) 3.1 7.5 1.9 2.2 1.7 1.7 0.3 17.1 10.3 12.9 9.2
Specialized industrial machine (72) 3.8 6.7 3.0 3.6 1.7 3.5 3.3 5.0 2.2 6.8 5.0
Metal working machine (73) 0.5 1.2 0.4 0.4 0.5 0.2 0.1 0.7 0.1 1.4 0.9
General industrial machinery (74) 2.3 3.3 2.0 2.8 1.3 1.7 1.0 4.6 4.3 6.8 4.2
ICT products 67.1 43.9 73.3 67.6 76.7 78.8 87.1 30.2 31.3 26.3 45.8
Office machines and automatic data processing machines (75) 12.2 6.5 13.7 17.6 8.5 13.3 16.5 4.6 2.8 3.8 7.7
Telecommunication and sound recording equipment (76) 18.9 8.4 21.8 30.2 19.1 12.8 18.4 7.4 16.0 8.8 13.2
Semiconductors and semiconductor devices (772+776) 36.0 29.0 37.9 19.9 49.1 52.6 52.1 18.2 12.5 13.6 24.9
Electrical goods (77 - 772 - 776) 10.7 13.8 9.9 13.4 6.4 7.9 5.1 12.0 20.8 10.0 11.3
Road vehicles (78) 5.7 13.3 3.7 3.5 5.3 2.5 1.0 14.6 17.5 19.0 11.9
Other transport equipment (79) 0.5 1.4 0.3 0.2 0.3 0.3 0.1 5.3 0.5 4.2 2.5
Miscellaneous manufacturing (SITC 8) 4.2 5.1 3.9 4.0 5.0 2.3 1.5 6.3 9.5 6.8 5.3
Professional and scientific equipment (87) 1.0 1.9 0.8 1.1 0.4 0.6 0.3 0.2 0.0 0.6 0.7
Photographic apparatus (88) 0.7 0.8 0.7 0.7 0.5 0.6 0.2 1.5 0.6 2.9 1.6
Total 100 100 100 100 100 100 100 100 100 100 100
US$ billion 1032 220 812 324 232 233 82 390 67 706 2409
(b) Parts and component imports EA Japan DEA China TW+K ASEAN Malaysia NAFTA Mexico EU15 World
Chemicals (SITC 5) 0.2 0.1 0.2 0.2 0.2 0.1 0.1 0.3 0.5 0.4 0.3
Resource based products (SITC 6 - SITC 68) 1.7 2.7 1.6 1.9 1.9 1.6 1.2 4.3 4.7 4.5 3.7
Machinery and transport equipment (SITC 7) 94.0 90.4 94.4 93.7 93.0 95.6 95.9 89.9 90.4 88.7 90.7
Power generating machines (71) 3.9 8.2 3.4 2.9 3.6 4.4 3.1 11.8 8.3 12.1 9.2
Specialized industrial machine (72) 3.7 4.8 3.5 2.4 3.7 6.0 1.7 4.7 1.6 5.9 5.0
Metal working machine (73) 0.7 1.0 0.6 0.8 1.0 0.5 0.5 0.8 0.8 1.0 0.9
General industrial machinery (74) 1.9 3.9 1.6 1.4 2.3 2.0 1.4 4.3 3.5 5.9 4.2
ICT products 67.3 53.3 68.9 72.5 68.9 58.6 59.6 37.1 46.7 32.8 45.8
Office machines and automatic data processing machines (75) 8.7 7.4 8.8 6.7 4.6 9.7 12.9 7.8 5.7 7.6 7.7

50
Telecommunication and sound recording equipment (76) 11.2 11.8 11.1 10.0 5.9 8.9 5.9 14.7 18.8 11.8 13.2
Semiconductors and semiconductor devices (772+776) 47.4 34.1 48.9 55.7 58.4 40.0 40.8 14.6 22.2 13.4 24.9
Electrical goods (77 - 772 - 776) 12.2 11.4 12.3 9.3 9.0 18.8 26.7 10.9 12.7 9.7 11.3
Road vehicles (78) 3.3 6.0 3.0 3.7 3.9 3.3 2.2 17.5 16.0 17.6 11.9
Other transport equipment (79) 1.1 1.9 1.0 0.7 0.8 2.1 0.8 2.7 0.7 3.7 2.5
Miscellaneous manufacturing (SITC 8) 4.1 6.8 3.8 4.2 5.0 2.6 2.8 5.5 4.4 6.4 5.3
Professional and scientific equipment (87) 0.9 1.4 0.9 0.7 0.8 0.7 0.5 0.5 0.2 0.7 0.7
Photographic apparatus (88) 0.8 1.1 0.8 0.8 0.9 0.5 0.4 1.0 1.0 2.3 1.6
Total 100 100 100 100 100 100 100 100 100 100 100
US$ billion 881 91 790 276 116 238 58 473 77 720 2409
EA Japan DEA China TW+K ASEAN Malaysia NAFTA Mexico EU15 World
(c ) Network product (parts and components + assembly) exports
Chemicals (SITC 5) 0.1 0.1 0.1 0.1 0.1 0.0 0.0 0.2 0.0 0.2 0.2
Resource based products (SITC 6 - SITC 68) 1.2 1.8 0.9 1.0 1.0 0.7 0.3 2.1 1.5 2.8 2.0
Machinery and transport equipment (SITC 7) 89.7 87.5 90.3 91.6 84.0 94.7 95.9 86.0 88.1 87.9 88.1
Power generating machines (71) 1.8 3.8 1.1 1.1 1.1 1.2 0.2 9.0 4.6 6.6 4.9
Specialized industrial machine (72) 2.1 3.5 1.7 1.8 1.1 2.3 2.2 2.6 1.0 3.5 2.7
Metal working machine (73) 0.3 0.6 0.2 0.2 0.3 0.1 0.0 0.4 0.0 0.7 0.5
General industrial machinery (74) 1.3 1.7 1.2 1.4 0.9 1.2 0.7 2.4 2.0 3.5 2.3
ICT products 60.5 33.2 68.9 69.2 59.7 78.3 86.8 27.6 36.6 22.9 41.1
Office machines and automatic data processing machines (75) 19.6 8.2 23.1 29.0 8.7 27.0 29.7 7.2 7.1 7.6 12.4
Telecommunication and sound recording equipment (76) 18.7 9.0 21.7 28.3 16.1 14.9 20.7 9.6 23.8 7.9 13.1
Semiconductors and semiconductor devices (772+776) 22.2 16.0 24.2 11.8 34.9 36.4 36.4 10.8 5.8 7.5 15.7
Electrical goods (77 - 772 - 776) 9.7 8.1 10.2 14.2 6.1 6.4 4.7 8.2 14.3 8.5 9.3
Road vehicles (78) 12.7 35.0 5.9 3.2 12.6 4.4 0.9 26.5 29.2 36.4 23.0
Other transport equipment (79) 1.3 1.6 1.2 0.7 2.3 0.9 0.3 9.3 0.3 5.7 4.4
Miscellaneous manufacturing (SITC 8) 9.1 10.6 8.7 7.3 14.9 4.6 3.7 11.8 10.4 9.1 9.8
Professional and scientific equipment (87) 5.5 5.8 5.4 4.0 11.0 2.6 2.6 8.2 5.9 5.9 6.3
Photographic apparatus (88) 2.3 3.6 1.9 2.4 1.2 1.3 0.5 1.3 0.6 1.8 2.1
Total 100 100 100 100 100 100 100 100 100 100 100
US$ billion 1826 428 1398 656 359 348 120 739 147 1366 4517

51
EA Japan DEA China TW+K ASEAN Malaysia NAFTA Mexico EU15 World
(d ) Network product (parts and components + assembly) Imports
Chemicals (SITC 5) 0.1 0.1 0.1 0.2 0.1 0.1 0.1 0.2 0.4 0.2 0.2
Resource based products (SITC 6 - SITC 68) 1.2 1.5 1.2 1.3 1.3 1.2 0.8 2.4 3.1 2.2 2.0
Machinery and transport equipment (SITC 7) 85.5 82.5 85.9 80.8 81.0 92.4 93.0 87.4 84.7 89.1 88.1
Power generating machines (71) 2.7 4.7 2.4 2.0 2.4 3.2 2.2 6.7 5.4 6.0 5.0
Specialized industrial machine (72) 2.6 2.8 2.6 1.6 2.4 4.5 1.2 2.7 1.1 2.9 2.7
Metal working machine (73) 0.5 0.6 0.5 0.5 0.7 0.4 0.4 0.5 0.5 0.5 0.5
General industrial machinery (74) 1.3 2.3 1.2 1.0 1.5 1.5 1.0 2.4 2.3 2.9 2.3
ICT products 59.8 48.0 61.5 59.5 55.0 59.2 62.6 35.9 41.1 32.1 40.6
Office machines and automatic data processing machines (75) 12.6 15.8 12.1 10.8 7.7 12.9 12.7 10.8 9.4 12.8 12.3
Telecommunication and sound recording equipment (76) 11.3 12.5 11.2 8.9 7.1 8.7 5.7 16.3 15.4 12.3 13.1
Semiconductors and semiconductor devices (772+776) 35.9 19.7 38.2 39.8 40.2 37.5 44.2 8.8 16.3 7.0 15.2
Electrical goods (77 - 772 - 776) 10.4 11.2 10.3 8.1 10.8 14.1 18.5 10.8 11.4 8.9 9.4
Road vehicles (78) 4.9 9.3 4.3 4.9 5.0 4.9 3.8 25.3 21.7 30.4 23.3
Other transport equipment (79) 3.2 3.7 3.1 3.2 3.1 4.7 3.4 3.1 1.2 5.4 4.4
Miscellaneous manufacturing (SITC 8) 13.2 15.9 12.8 17.7 17.6 6.3 6.1 10.0 11.9 8.5 9.8
Professional and scientific equipment (87) 8.3 9.5 8.1 13.5 9.4 3.7 3.7 6.2 8.5 5.1 6.1
Photographic apparatus (88) 3.2 3.9 3.1 2.4 6.1 1.6 1.1 1.8 1.4 2.0 2.2
Total 100 100 100 100 100 100 100 100 100 100 100
US$ billion 1254 158 1096 401 173 320 83 839 117 1453 4455

52
Table 4: Hourly Compensation Cost of Manufacturing Production Workers in selected countries relative to the USA level (%) (Two-year averages) 1989/90 1999/00 2006/7
PRC … 2.9 3.21
Hong Kong SAR 20.6 27.7 23.7
Japan 85.0 107.6 81.5
Indonesia4 2.2 2.9 3.13
Korea, Republic of 22.8 39.2 62.6
Malaysia4 6.7 7.9 7.53
Philippine 5.02 3.9 4.3
Singapore 23.9 37.0 34.9
Thailand4 3.9 6.0 6.2
Taiwan 25.4 28.6 27.0
Vietnam4 … 1.2 1.13
Brazil 17.62 22.4
Mexico 10.0 9.9 10.6
Czech Republic … 14.8 20.7
Hungary … 14.5 29.0
Ireland 79.0 72.9 112.3
Memo item
USA, hourly compensation $ 14.61 19.51 24.4
Notes:
1 Average for 2005 and 2006. 2 Average for 1991 and 1992. 3 Average for 2004 and 2005. 4 Estimates based on annual wage. … Data not available.
Source: US Bureau of Labor Statistics website (ftp.bls.gov) and ILO,
Yearbook of Labor Statistics (for estimates for Malaysia, Thailand and Indonesia)

53
Table 5: World Bank Logistic Performance Index and its Composite Indices (circa 2006) Sub Indices Composite index Country Customs Infra-
Structure International shipments
Logistics competence
Tracking & tracing
Domestic logistics
Timeliness Index Global raking2
Korea, Rep. 3.2 3.4 3.4 3.6 3.6 2.7 3.9 3.5 25 PRC 3.0 3.2 3.3 3.4 3.4 3.0 3.7 3.3 30 Hong Kong, SAR 3.8 4.1 3.8 4.0 4.1 2.7 4.3 4.0 8 Indonesia 2.7 2.8 3.1 2.9 3.3 2.8 3.3 3.0 43 Malaysia 3.4 3.3 3.4 3.4 3.5 3.1 4.0 3.5 27 Philippines 2.6 2.3 2.8 2.7 2.7 3.3 3.1 2.7 65 Singapore 3.9 4.3 4.0 4.2 4.3 2.7 4.5 4.2 1 Thailand 3.0 3.2 3.2 3.3 3.3 3.2 3.9 3.3 31 Vietnam 2.9 2.5 3.0 2.8 2.9 3.3 3.2 2.9 53 Memorandum Items Hi High income countries 3.45 3.66 3.52 3.64 3.71 2.58 4.05 3.67 Upper middle income countries 2.64 2.7 2.84 2.8 2.83 2.94 3.31 2.85 Lower middle income 2.31 2.27 2.48 2.4 2.45 3.01 2.93 2.47 Low income 2.12 2.06 2.32 2.29 2.25 2.99 2.71 2.29 Europe 2.39 2.39 2.61 2.53 2.55 2.97 3.04 2.59 Latin America & Caribbean 2.38 2.38 2.55 2.52 2.58 2.97 3.02 2.57 Sub-Saharan Africa 2.21 2.11 2.36 2.33 2.31 2.98 2.77 2.35
Note: (1) This is based on a worldwide survey of the global freight forwarders and express carriers complemented by a number of qualitative and quantitative indicators of the domestic logistics environment, institutions, and performance of supply chains. Logistic quality of the individual countries covered are assed using a 5-point scale (1 for the worst performance and 5 for the best) focusing on seven areas of performance are: (a) efficiency of the clearance process by customs and other border agencies; (b) quality of transport and information technology infrastructure; (c) Ease and affordability of arranging international shipments; (d) Competence of the local logistics industry; (e) ability to track and trace international shipments, (f) domestic logistic costs, (g) timeliness of shipment in reaching destination. The composite LPI index has be constructed by combining the seven sub indices using the principal component analysis. (2) Ranking (in descending order) among 150 countries Source: Arvis et al (2007)

54
Table 6: Determinants of Manufacturing trade (Random Effects estimate)1
Total Parts and components
Final
World income +0.82 (15.55)***
+0.62 (11.87)***
+0.82 (15.47)***
Per capita GNP +0.23 (4.66)***
+0.56 (9.90)***
+0.21 (4.20)***
Real exchange rate + 0.12 (1.56)*
+0.06 (0.59)***
+0.05 (0.26)***
Logistic performance index +1.27 (6.71)***
+1.80 (7.24)***
+1.29 (5.88)***
Relative wage -0.25 (2.65)***
-0.24 (2.57)*
-0.34 (6.99)***
Distance to export markets -0.79 (13.77)***
-0.82 (12.12)***
-0.79 (13.97)***
PRC dummy +1.61 (4.41)***
+2.25 (4.92)***
+1.57 (4.01)***
ASEN dummy +2.61 (3.43)***
+3.25 (3.95)***
+2.57 (3.23)***
DEA dummy +1.28 (10.77)***
+1.57 (14.37)***
+1.25 (9.32)***
DODC dummy -0.26 (1.76)*
-0.17 (0.87)
-0.27 (1.82)*
Constant term -9.58 (7.02)***
-9.28 (6.13)****
-9.73 (6.48)***
Number of observation
656
656
656
Number of countries 41 41 41 R-sq 0.76 0.80 0.75 F 233.14 342.84 236.47 Root MSE 1.48 1.69 1.49 1. T-ratios of regression coefficients (based on robust standard errors) are given in brackets, with the level of statistical significance is denoted as: *** one percent, ** five percent and * ten percent. Country coverage:
Argentina Costa Rica India Mexico Russian Federation Switzerland
Australia Czech Rep. Indonesia Netherlands Singapore Thailand
Austria Denmark Ireland Norway Slovakia Turkey
Belgium Finland Israel Philippines Slovenia United Kingdom
Brazil France Italy Poland South Africa USA
Canada Germany Japan Portugal Spain
China Hungary Malaysia Rep. of Korea Sweden

55
Table 7: Share of parts and components in bilateral trade flows, 2006/7 (%)
Reporting country EA Japan DEA PRC ASEAN NAFTA EU15 World
(a) Exports
East Asia (EA) 1992/3 23.6 13.9 24.9 18.5 32.1 21.1 17.7 20.2
2006/7 47.6 32.9 50.1 51.6 54.5 25.1 24.1 34.1
Japan 1992/3 28.9 0.0 28.9 18.9 31.4 25.5 20.9 23.9
2006/7 42.0 0.0 42.0 41.5 47.9 31.5 30.4 34.4
Developing East Asia (DEA) 1992/3 20.1 13.9 21.6 17.8 32.8 17.0 14.7 17.3
2006/7 48.1 33.4 53.9 0.0 65.2 22.7 21.6 34.0
PRC 1992/3 8.7 6.0 9.4 0.0 14.6 5.8 6.0 7.4
2006/7 36.2 25.2 40.6 0.0 49.1 17.1 16.3 25.6
Korea 1992/3 19.2 15.6 21.0 9.5 25.6 20.6 16.3 18.1
2006/7 61.9 51.5 63.5 57.3 63.7 36.6 26.8 44.2
Taipei, China 1992/3 24.1 19.5 25.3 22.8 29.8 23.9 31.9 24.7
2006/7 51.5 59.0 50.5 39.5 61.2 35.0 37.6 44.2
ASEAN 1992/3 29.4 18.0 32.6 7.7 34.6 21.1 17.3 22.7
2006/7 58.2 39.9 61.4 64.0 56.0 32.1 33.9 44.2
NAFTA 1992/3 30.0 26.7 31.5 15.7 36.8 29.0 30.4 28.4
2006/7 46.7 36.5 49.8 34.8 67.9 28.8 30.6 31.2
EU15 1992/3 17.4 10.0 20.5 20.0 24.3 23.1 18.4 18.3
2006/7 31.4 18.7 34.8 30.4 46.5 22.1 22.0 22.4
(b) Imports
East Asia (EA) 1992/3 35.5 43.5 30.3 8.2 49.8 42.8 23.3 27.2
2006/7 51.7 48.8 52.8 34.8 68.3 54.7 33.1 42.1
Japan 1992/3 19.3 0.0 19.3 5.2 28.1 35.2 12.3 19.3
2006/7 34.2 0.0 34.2 23.1 44.9 41.0 18.9 29.9
Developing East Asia (DEA) 1992/3 37.8 43.8 32.9 9.0 55.6 45.3 27.7 29.0
2006/7 55.5 47.7 59.5 0.0 74.3 40.3 31.7 44.2
China 1992/3 24.6 25.0 23.7 0.0 11.5 19.7 23.5 20.4
2006/7 55.2 47.5 59.2 0.0 74.0 40.1 31.6 44.0
Korea 1992/3 36.1 35.2 38.8 5.5 45.2 35.3 16.5 30.1
2006/7 33.0 26.6 38.1 26.1 55.7 38.9 22.9 31.9
Taiwan 1992/3 37.2 36.5 39.4 6.6 44.4 29.9 19.8 29.5
2006/7 46.7 33.8 58.3 44.1 68.8 40.2 28.0 38.9
ASEAN10 1992/3 41.6 40.6 42.6 11.9 50.4 45.2 28.0 36.0
2006/7 50.3 47.2 51.4 40.1 55.9 67.5 41.7 47.9
NAFTA 1992/3 36.5 44.1 29.5 6.3 41.2 47.6 35.5 37.4
2006/7 29.4 39.3 26.0 17.7 40.5 36.3 25.1 28.8
EU15 1992/3 22.2 26.1 18.5 4.7 24.3 36.0 20.5 21.2
2006/7 25.0 33.6 22.8 14.9 37.9 34.1 22.1 23.4
Source: Compiled from UN Comtrade database.

56
Table 8: Intra-regional shares of Manufacturing Trade: Total, Parts and Components, and Final Trade (%), 1992/3 and 2006/07 East Asia Developing
East Asia
ASEAN NAFTA EU15
Total manufacturing
Exports 47.2 38.2 20.7 44.4 61.2
1992/3 43.9 33.4 18.4 48.1 56.9
2006/7
Imports
1992/3 58.2 34.9 15.5 36.3 64.1
2006/7 64.4 46.7 20.8 32 57.9
Trade (exports +
imports)
1992/93 53.2 36.5 17.8 39.9 62.6
2006/7 55.1 40 20.1 38.4 57.4
Parts and components
Exports
1992/3 50.2 42.6 30.3 43.5 62.3
2006/7 61.1 53.9 25.4 46.9 55.9
Imports
1992/3 65.9 35.3 20.2 39.5 58
2006/7 66.9 50.9 22.9 39.9 55.2
Trade
1992/3 57.7 38.7 24.2 41.4 60.1
2006/7 62.9 52.1 23.1 43.2 55.5
Final goods
Exports
1992/3 46.6 36.8 16.1 44.7 60.9
2006/7 36.9 28.3 15.9 48.7 57
Imports
1992/3 55.4 34.7 12.9 35.3 65.6
2006/7 63.0 42.8 20.6 30.2 58.5
Trade
1992/3 50.3 35.7 14.3 39.4 63.2
2006/7 44.4 34.1 18.1 37.3 57.7
Notes:Source: Compiled from UN Comtrade database, and Trade Data CD-ROM, Council
for Economic Planning and Development, Taipei (for data on Taiwan)

57
Table 9: Growth of total merchandise exports and imports, 2007Q1–2009Q1 (Year-on-year % change)1 2008Q1 2008Q2 2008Q3 2008Q4 2009Q1 2009Q2 Exports East Asia (EA) 20.6 21.0 19.3 -5.6 -30.1 -32.5 Developing EA 19.0 21.3 19.9 -4.7 -26.6 -27.2 ASEAN 18.9 26.9 22.9 -10.3 -36.8 -39.3 Japan
22.9
16.4
15.2
-8.1
-42.1
-41.1
HK 10.5 8.3 5.7 -2.1 -21.0 -23.4 China 21.1 22.4 23.0 4.6 -20.1 -22.7 Korea 17.4 23.2 27.1 -9.9 -24.5 -20.1 Taiwan 17.4 18.2 7.6 -24.6 -35.9 -28.3 Indonesia 31.9 29.4 27.9 -5.3 -32.5 -33.2 Malaysia 19.4 28.5 21.6 -12.6 -27.6 -28.2 Philippines -2.0 -0.6 2.0 -22.3 -33.9 -36.3 Singapore 21.7 26.4 21.2 -12.9 -30.7 -31.2 Thailand 25.5 25.5 27.2 -10.2 -23.0 -24.4 Viet Nam 27.7 31.8 37.5 6.0 -14.8 -11.7 India 37.9 37.4 24.7 -8.0 -19.8 -20.2 Imports East Asia (EA) 29.6 29 29.8 -4.1 -32.5 -33.1 Developing EA 29 28.9 26.6 -8.0 -32.1 -34.2 ASEAN 37.9 36.2 32.6 -5.0 -37.2 -36.7 Japan
25.6
26.8
35.8
8.3
-29.0
-28.5
Hong Kong 12.0 9.6 7.0 -4.0 -20.8 -22.3 China 29.4 32.9 25.9 -8.0 -30.8 -31.7 Korea 29.0 30.5 42.9 -8.8 -32.8 -35.6 Taiwan 26.1 19.2 20.3 -21.9 -45.9 -46.3 Indonesia 91.6 96.1 82.3 33.3 -35.9 -36.2 Malaysia 16.1 17.3 14.5 -17.1 -36.8 -36.1 Philippines 22.1 8.4 4.5 -23.4 -30.3 -31.3 Singapore 32.1 35.4 32.9 -9.3 -30.0 -28.1 Thailand 39.6 25.7 37.8 3.8 -39.7 -40.5 Vietnam 69.0 61.0 22.8 -8.2 -36.5 -34.1 India 52.2 36.8 53.5 6.9 -21.6 -23.2 1 Growth rates calculated using current US$ values. Source: Compiled from CIEM database

58
Table 10: Export growth by destination region/country, 2007Q1- February 2009 (Year-on-year %)2 East
Asia
Japan DEA2 PRC ASEAN US EU World
East Asia (EA)
2008Q1 18.1 15 18.8 17.8 23.8 16.8 -1.5 20.6
2008Q2 19.6 16 20.8 22.8 25.1 15.8 5.4 21.0
2008Q3 16.5 18.4 17.4 14.5 21.5 14.3 5.8 19.3
2008Q4 -9.6 5.9 -12.6 -17 -10.1 -5.9 -8 -5.6
2009Q1 -29.6
2009Q2 -27.5
2009July -27.6
Developing EA
2008Q1 17.2 14.6 16.7 17.2 21.8 15.2 -1.9 19
2008Q2 20.6 16.8 20.2 23.5 24.5 16.9 5.1 21.3
2008Q3 17.4 19.6 16.7 13.5 21.4 15.5 5.7 19.9
2008Q4 -9.2 9.2 -13.6 -16.3 -11.8 -3.8 -7.7 -4.7
2009Q1 -24.2
2009Q2 -25.3
2009July -24.3
ASEAN
2008Q1 15.9 21.9 13.6 12.4 15.9 4.4 -10.3 21.7
2008Q2 22.2 19 22.4 31 22.8 3.4 -1.2 25.5
2008Q3 19.2 23.5 18.4 23.5 18.8 3.9 -6.6 22.1
2008Q4 -10.4 16.3 -16.2 -17 -15.8 -12.4 -18.5 -11.9
2009Q1 -31.0
2009Q2 -31.7
2009July -28.7
Japan
2008Q1 24.9 24.4 24.5 31.9 7.9 23.9 22.9
2008Q2 20.5 19.8 26 24.9 1.4 10.2 16.4
2008Q3 19.7 19.7 21.4 24.2 -4.6 8.3 15.2
2008Q4 -7.1 -7.3 -4.7 3.6 -16.2 -16.1 -8.1
2009Q1 -43.2 -43.5 -41.5 -37.7 -49.8 -43.9 -44.4
2009Q2 -45.8 -45.8 -39 -51.5 -58 -54.2 -34.9
2009July -39.3
Hong Kong, China

59
2008Q1 12.7 -1.4 13.7 11.6 36.6 8.4 -0.9 10.5
2008Q2 9 -0.4 9.6 8 27.6 8.2 -1.4 8.3
2008Q3 4.6 3.4 4.6 3.9 12.6 10 0.6 5.7
2008Q4 0.1 4 -2.4 -2.4 2.3 -0.6 -7.8 -2.1
2009Q1 -30.6 3.3 -32.7 -34.5 -19.8 -2 -7 -21.3
2009Q2 -16.5 -24.4 -15.5 -14.1 -19.3 -36.1 -36.7 -22.6
China
2008Q1 23.7 12.1 31.2 31.2 5.4 25.0 16.3
2008Q2 25.1 18.0 29.2 29.2 12.2 29.7 19.0
2008Q3 28.2 18.1 33.9 33.9 15.3 23.5 20.2
2008Q4 4.5 7.9 2.7 2.7 0.7 4.1 0.9
2009Q1 -22.9 -16.7 -26.3 -26.3 -15.4 -22.6 -21.1
2009Q2 -25.6 -23.8 -26.5 -26.5 -18.5 -26.6 -23.5
2009July -24.8 -20.1 -27.1 -27.1 -14.1 -26.0 -21.7
Korea
2008Q1 19 12.3 19.9 20.5 35.5 18.4 -2.7 17.4
2008Q2 29.4 16.8 30.7 33.7 38.8 10.1 5.6 23.2
2008Q3 24.9 14.5 25.6 21.5 48.5 17.4 9.9 27.1
2008Q4 -17.4 -11.5 -20.1 -24.1 -5.6 -15.4 -6.2 -9.9
2009Q1 -37.1 -34.3 -38.1 -38.6 -37.7 -40.3 -27.9 -20.1
2009Q2 -20.8 -31.3 -19.2 -13.4 -33.8 -26 -18.2 -23.4
Taipei, China
2008Q1 22.3 -0.7 25 41.5 30.7 12.1 -0.6 17.4
2008Q2 21.7 18.3 21.4 38.3 19.8 14.8 -1.4 18.2
2008Q3 6.4 21.5 4.9 8.9 12.2 9.2 3.4 7.6
2008Q4 -29.7 4.9 -33.6 -39.6 -23.7 -14.8 -16.4 -24.6
2009Q1 -51.9 -17.8 -55.8 -63.5 -51.1 -32.7 -26.5 44
2009Q2 -26.8 -10.5 -29.2 -32.6 -36.6 -34.7 -24.7 -28.2
2009July -35.9
Indonesia
2008Q1 40.1 32.2 40.8 44.4 39.9 17.4 13.3 31.9
2008Q2 27.3 11.9 36.7 29.6 38.6 18.2 20.4 29.4
2008Q3 28.7 35.7 20.1 32.5 18.9 18.3 20.6 27.9
2008Q4 -6.1 -3.6 -9 -19.5 -2.5 -4.5 -3.3 -5.3
2009Q1 -31.9
2009Q2 -26.0

60
2009July -23.7
Malaysia
2008Q1 12.9 25.2 9.7 13.8 13.9 2.9 -17.6 19.4
2008Q2 28.2 23.9 28.6 55.2 23.4 -3.7 -0.3 28.5
2008Q3 23.9 27.2 23.6 38 21 1.2 -9.5 21.6
2008Q4 -5.8 43.6 -16.7 -18.3 -15.2 -14.2 -22.1 -12.6
2009Q1 -27.8 -3.6 -34.8 -33.3 -38.5 -29.3 -33.1 -28.7
2009Q2 -11.1 -1 -12.5 6.9 -21.1 -35.5 -31.5 -35.4
2009July -33.7
Philippines
2008Q1 0.8 12.4 -2.6 1.5 -0.9 3.3 -2
2008Q2 5.9 13.5 3.9 14.1 -6.8 3.8 -0.6
2008Q3 6.4 8.5 5.8 3.5 3.6 -4.6 2
2008Q4 -24.5 -12 -28.6 -35.3 -39.8 -18.3 -22.4
2009Q1 -50.4 -38.3 -54.4 -67.6 -53.6 -33.6 -30.4
2009Q2 -19.7
2009July -9.7
Singapore
2008Q1 23.4 28.8 21.4 8.7 22.6 9.7 -3.3 21.7
2008Q2 27.4 31.8 26.6 23.4 31 25.1 -5 26.4
2008Q3 21 14.8 22 21 23.8 12.6 -10.6 21.2
2008Q4 -16.8 -8.3 -17.8 -19.3 -17.8 -12.8 -19.3 -12.9
2009Q1 -45.2 -35.1 -46.9 -53.4 -47.4 -22.4 -47.3 -31.9
2009Q2 -29.3 -37.8 -27.6 -19.2 -33.2 -34.8 -46.5 -33.0
2009July -29.9
Thailand
2008Q1 23.7 9.5 27.9 26 32.6 19 10.2 25.5
2008Q2 27.9 18.8 30.5 22.9 42.9 11.6 7.6 25.5
2008Q3 24.8 23.3 25.4 15.8 37.5 15 14.3 27.2
2008Q4 -12.3 -6.4 -15.1 -5.6 -20.5 -9 -11.7 -10.2
2009Q1 -37.1 -20.9 -41.3 -47.7 -39.2 -29.5 -29.5 -22.2
2009Q2 -23.4
1 Growth rates calculated using current US$ values.
2.Developing East Asia (East Asia excluding Japan)
Source: Compiled from the database.

61
Table 11: China: Growth of total merchandise exports and imports by trading partner countries, 2007Q1 – 2009Q1 (Year-on-year parentage change, current US$ ) 2008Q1 2008Q2 2008Q3 2008Q4 2009Q1 2009Q2 2009July
(a) Exports
East Asia (EA) 23.7 25.1 28.2 4.5 -22.9 -25.6 -24.8
Developing EA 31.2 29.2 33.9 2.7 -26.3 -26.5 -27.1
ASEAN 34.2 26.0 27.4 2.8 -22.6 -16.8 -17.4
Japan 12.1 18.0 18.1 7.9 -16.7 -23.8 -20.1
Korea 33.1 38.3 52.9 7.5 -29.2 -36.6 -41.1
Taipei, China 15.4 21.1 17.3 -10.4 -34.5 -38.8 -29.7
Hong Kong, China 10.8 6.5 11.0 -9.9 -24.0 -21.6 -19.0
Indonesia 33.2 41.5 54.8 20.2 -26.4 -21.0 -31.8
Malaysia 33.3 28.2 20.8 7.1 -23.9 -12.2 -5.8
Philippines 30.4 22.8 34.5 1.3 -11.8 -18.7 -23.7
Singapore 15.3 5.9 17.1 -0.6 -17.1 -12.3 -22.4
Thailand 37.2 42.1 38.3 5.9 -27.3 -29.6 -24.2
Vietnam 88.8 45.1 16.0 -11.1 -30.0 -15.9 15.4
USA 5.4 12.2 15.3 0.7 -15.4 -18.5 -14.1
North America 5.9 11.6 15.1 2.1 -15.1 -19.0 -15.0
EU 25.0 29.7 23.5 4.1 -22.6 -26.6 -26.0
Total export 16.3 19.0 20.2 0.9 -21.1 -23.5 -21.7
(b) Imports
East Asia 18.8 24.1 13.2 -18.1 -33.3 -22.8 -19.4
Developing EA 19.6 24.3 10.8 -23.6 -34.7 -23.5 -18.8
ASEAN 19.9 23.8 12.7 -18.9 -33.8 -22.1 -12.8
Japan 17.0 23.7 18.7 -5.0 -29.8 -21.4 -20.6
Korea 14.9 25.0 14.8 -18.5 -26.6 -18.8 -18.9
Taiwan 24.5 24.2 5.0 -33.3 -43.9 -29.9 -25.4
Hong Kong 26.0 -2.5 11.0 -21.4 -49.1 -32.9 -33.3
Indonesia 31.7 30.3 17.3 -13.5 -38.0 -18.4 -5.6
Malaysia 18.4 29.5 22.4 -16.1 -25.0 -17.0 -8.8
Philippines 12.7 5.7 -23.2 -48.6 -61.3 -51.7 -38.9
Singapore 6.7 35.5 27.4 -9.3 -23.7 -28.2 -10.3
Thailand 26.0 22.9 15.8 -5.6 -29.2 -6.6 -0.8
Vietnam 64.3 19.0 69.4 6.8 -7.9 23.6 -23.7
USA 29.7 23.0 15.7 3.7 -17.7 -13.1 -12.4
North America 28.6 23.4 16.4 2.8 -18.1 -12.5 -12.0
EU 25.9 33.0 22.7 2.3 -14.7 -11.2 -7.4
Total imports 21.2 25.0 15.1 -12.2 -28.3 -19.6 -16.6
1 Growth rates calculated using current US$ values.
Source: Compiled from CIEM database

62
Table 12: PRC: Growth of total merchandise exports and imports by commodity category, 2008Q1– 2009Q1 (Year-on-year % change, current US$)
2008Q1 2008Q2 2008Q3 2008Q4 2009Q1 2009Q2
Exports
Total exports 21.1 22.4 23.0 4.6 -20.1 -178.2
Primary 16.3 24.9 29.9 8.6 -17.9 -13.6
Agro-based raw material 10.6 7.5 8.5 7.5 -16.3 -7.3
Manufacturing 21.2 23.8 22.0 2.6 -20.7 -18.2
Products of the Chemical or Allied Industries 48.5 54.0 42.2 3.1 -25.2 -24.9
Plastics and Articles thereof, Rubber and Articles 13.8 10.1 16.1 10.7 -21.1 -17.1
Textiles and Textile Articles 22.5 5.3 4.1 8.0 -11.4 2.6
Footwear, Headgear, Umbrellas, etc 14.7 14.4 19.7 21.3 -1.3 7.2
Base Metals & Articles Of Base Metal 23.3 18.5 26.4 22.0 -9.0 -1.5
Machinery and Mechanical Appliances, etc (ME) 15.9 -15.7 20.9 4.3 -31.6 -38.8
Electronics 6.2 12.5 61.5 17.2 -33.5 -36.5
Electrical Machinery and Equipment 20.3 27.0 20.4 -1.1 -21.5 -19.5
Vehicles, Aircraft, Vessels etc 18.8 26.5 22.9 5.1 -18.4 -16.6
Miscellaneous Manufactured Articles 41.5 39.0 31.7 9.1 -17.0 -19.7
Optical, Photographic, Cinematographic, etc 21.6 27.5 18.6 -5.4 -24.0 -22.3
(b) Imports
2008Q1 2008Q2 2008Q3 2008Q4 2009Q1 2009Q2
Total imports 29.4 32.9 25.9 -8.0 -30.8 -25.4
Primary 73.5 74.9 72.5 5.2 -40.7 -35.3
Manufacturing 16.3 19.1 11.4 -12.1 -26.2 -21.1
Products of the Chemical or Allied Industries 19.6 23.5 19.6 -10.5 -23.9 -18.2
Plastics and Articles thereof, Rubber and Articles 16.3 22.5 22.7 -15.6 -29.2 20.1
Textiles and Textile Articles 6.3 2.7 -3.4 -9.2 -22.8 -22.8
Footwear, Headgear, Umbrellas, etc 47.5 47.7 24.8 12.6 -2.8 -18.7
Base Metals & Articles Of Base Metal 14.1 5.8 8.3 -15.0 -26.3 -16.9
Machinery and Mechanical Appliances, etc (ME) 11.7 18.0 9.8 -10.7 -24.1 -17.9
Electronics 16.3 19.9 15.0 -1.0 -19.8 -19.5
Electrical Machinery and Equipment 9.5 17.1 7.4 -15.2 -26.3 -17.4
Vehicles, Aircraft, Vessels etc 20.0 28.5 14.4 -1.3 -17.1 -22.1
Miscellaneous Manufactured Articles 11.6 20.8 1.4 -8.1 -5.4 1.6
Optical, Photographic, Cinematographic, etc 42.3 35.1 9.8 -21.4 -40.2 -33.5
Source: Compiled from CEIM database.

63
Table 13: Singapore: Growth of total merchandise exports and imports by commodity category, 2008Q1– 2009Q1
(Year-on-year % change, current US$)
2007Q1 2007Q2 2007Q3 2007Q4 2008Q1 2008Q2 2008Q3 2008Q4 2009Q1 2009Q2 2009Jul
(a) Exports
Total excl. Petroleum 4.2 1.4 5.2 0.7 3.2 1.6 -1.9 -12.6 -23.7 -17.7 -13.0
Primary products excl. petroleum 18.9 6.9 11.1 15.6 9.4 19.2 10.5 -0.6 -18.1 -16.2 -5.0
Mineral Fuels 0.8 12.5 0.7 48.2 61.6 64.2 75.3 -9.4 -40.6 -45.5 -44.5
Manufactures 3.8 1.2 5.1 0.2 3.0 1.0 -2.3 -13.0 -23.9 -17.8 -13.3
Chemicals and Chemical Products (CH) 15.1 16.3 20.8 3.4 -3.1 -5.5 -9.0 -31.2 -24.1 -9.8 -1.3
Resource-based manufactured Goods 25.5 19.3 22.3 10.2 2.2 15.9 4.7 -13.2 -21.5 -25.5 -27.5
Machinery and Transport Equipment 0.4 -2.4 0.8 -1.1 3.6 1.8 -1.6 -11.2 -27.1 -20.7 -15.9
Electronics Valves -0.8 -6.7 0.9 -0.1 3.1 2.2 -0.7 -17.3 -29.5 -16.4 -16.7
Parts for Office & DP Machines 0.9 9.2 -6.7 -1.1 -1.5 -6.3 5.8 -11.2 -35.9 -32.4 -20.4
Communication Equipment -3.0 0.3 3.0 -14.9 -14.3 -11.1 -26.6 -38.1 -37.4 -46.0 -35.0
Electrical Machinery 1.6 -3.5 4.7 -2.6 1.3 -9.4 -11.7 -21.9 -39.0 -20.9 -19.4
Electrical Circuit Apparatus -9.4 -9.4 -4.5 0.0 0.1 2.3 -8.3 -18.6 -35.4 -25.9 -12.0
Miscellaneous Manufactured Articles 1.6 5.3 6.0 1.3 11.3 -2.0 0.4 0.9 -18.2 -4.8 -1.4
Disc Media Products & Plastic Articles 12.4 11.3 12.6 -5.5 8.5 -2.9 10.2 6.1 -23.1 -3.8 -4.9
Scientific Instruments & Apparatus 6.6 22.1 8.3 12.0 20.2 -4.8 -10.0 0.4 -11.5 3.8 20.7
Photographic Supplies, Watches & Optical Goods -21.7 -16.9 4.5 3.2 15.8 8.9 2.4 -0.7 -13.8 -9.3 -6.7
(b) Imports
Total excl. Petroleum 3.8 1.1 2.8 3.8 8.3 7.6 5.8 -10.1 -25.2 -22.0 -19.0

64
Primary products excl. petroleum 9.8 14.2 12.2 18.8 18.5 16.0 20.0 3.5 -6.1 -6.5 -4.5
Mineral Fuels -0.9 13.2 -8.2 59.1 75.3 69.9 87.3 0.3 -36.2 -43.5 -43.7
Manufactures 3.5 0.5 2.4 3.2 7.9 7.2 5.1 -10.8 -26.1 -22.8 -19.9
Chemicals and Chemical Products (CH) 2.8 13.6 0.1 6.1 8.5 -2.1 9.7 -16.5 -32.7 -15.7 -14.5
Resource-based manufactured Goods 19.4 5.6 10.9 7.8 13.0 17.0 22.1 5.0 -18.9 -30.2 -30.9
Machinery and Transport Equipment 1.8 -1.8 1.2 1.0 7.7 7.8 2.5 -12.7 -26.9 -22.9 -19.8
Electronics Valves -1.4 -8.6 0.9 5.7 1.0 -2.7 -1.0 -19.3 -32.4 -21.0 -15.7
Parts for Office & DP Machines -8.1 4.3 4.0 4.6 -1.9 -7.2 5.3 -1.3 -36.2 -35.3 -32.2
Communication Equipment -0.3 -6.5 1.1 -14.2 -14.7 -7.2 -19.1 -31.3 -28.0 -30.0 -31.6
Electrical Machinery -3.1 -17.4 -17.5 -17.5 -2.7 2.7 -1.1 -6.5 -40.6 -25.3 -17.6
Electrical Circuit Apparatus -7.4 -7.7 -7.8 -2.5 -4.1 0.0 -3.4 -21.7 -35.1 -25.4 -21.4
Miscellaneous Manufactured Articles 3.2 4.4 4.4 12.7 2.9 0.8 2.4 -9.1 -21.8 -18.3 -11.6
Disc Media Products & Plastic Articles 10.5 14.2 8.3 28.5 15.6 7.8 17.2 -6.3 -27.0 -18.4 -8.2
Scientific Instruments & Apparatus 0.1 6.2 0.7 -5.5 -9.3 -13.1 -2.5 -10.0 -19.9 -16.6 -10.0
Photographic Supplies, Watches & Optical Goods 4.0 -1.6 9.4 14.2 2.0 8.9 -2.9 -10.5 -23.5 -18.6 -15.4
Source: Compiled from CEIM database.

65
Table 14: Growth manufacturing imports to the USA (Y-o-Y, %), 2008Q1-2009July
2008Q1 2008Q2 2008Q3 2008Q4 2009Q1 2009Q2 2009July
East Asia (EA)
Total manufacturing 2.0 4.1 4.9 -6.8 -22.3 -24.2 -22.0
Parts and components -2.5 3.9 2.6 -14.3 -29.1 -29.3 -23.9
Assembly 6.0 8.5 4.8 -13.6 -30.6 -25.9 -21.6
Total network trade1 2.6 6.7 4.0 -13.8 -30.0 -27.2 -22.4
Developing EA
Total manufacturing 1.1 4.5 7.5 -3.9 -15.4 -18.7 -19.0
Parts and components -4.3 4.6 4.2 -12.8 -25.2 -26.1 -22.2
Assembly 5.3 9.8 10.0 -9.5 -17.6 -15.5 -16.1
Total network trade1 1.4 7.8 7.9 -10.6 -20.5 -19.4 -18.3
ASEAN
Total manufacturing 0.4 1.8 -2.3 -15.2 -26.5 -24.1 -16.2
Parts and components -6.5 4.3 -2.6 -21.2 -32.5 -31.1 -15.8
Assembly 3.0 4.8 -6.3 -25.1 -39.6 -36.5 -26.5
Total network trade1 -2.1 4.6 -4.7 -23.5 -36.5 -34.2 -22.1
Japan
Total manufacturing 4.6 2.9 -4.1 -16.6 -42.3 -42.5 -33.5
Parts and components 1.6 2.1 -1.0 -17.7 -37.1 -37.4 -28.5
Assembly 7.5 6.0 -6.7 -23.2 -55.0 -49.6 -35.2
Total network trade1 5.3 4.5 -4.7 -21.4 -49.0 -45.3 -33.0
Korea
Total manufacturing 0.4 7.6 11.5 -0.2 -15.1 -23.1 -25.1
Parts and components -11.3 0.2 1.9 -14.4 -32.1 -33.3 -26.2
Assembly 4.3 13.9 14.4 -2.1 -9.4 -12.6 -17.7
Total network trade1 -1.2 9.3 10.0 -5.9 -16.5 -19.0 -20.4
Taipei, China
Total manufacturing 5.8 2.8 4.1 -10.3 -28.5 -32.3 -22.9
Parts and components 11.8 12.1 3.9 -16.4 -30.8 -33.1 -21.2
Assembly 11.0 6.4 12.5 -7.5 -31.4 -32.0 -21.5
Total network trade1 11.0 9.3 7.8 -12.4 -31.1 -32.6 -21.3
PRC
Total manufacturing 1.3 5.3 10.1 -0.6 -11.2 -16.0 -18.4
Parts and components -1.6 5.9 7.7 -8.7 -20.2 -22.3 -23.6
Assembly 7.0 10.9 14.9 -6.1 -11.7 -9.3 -12.8
Total network trade1 3.7 9.0 12.4 -7.0 -14.8 -14.0 -16.5
Mexico

66
Total manufacturing 2.8 3.9 -4.2 -11.8 -25.2 -27.6 -17.0
Parts and components -3.6 -4.3 -7.6 -15.1 -31.0 -32.7 -17.7
Assembly 10.1 12.0 -6.6 -11.8 -21.6 -23.8 -11.3
Total network trade1 3.3 4.1 -7.1 -13.2 -26.0 -27.8 -14.1
World
Total manufacturing 2.9 4.5 3.5 -9.2 -25.4 -29.3 -25.1
Parts and components -0.3 1.8 0.0 -13.7 -28.4 -31.7 -24.8
Assembly 4.5 7.2 -0.1 -16.5 -31.9 -30.1 -22.6
Total network trade1 2.3 4.8 0.0 -15.4 -30.4 -30.8 -23.5
1 Parts and components + final assembly.
Source: Compiled from US International Trade Commission on-line database.

67
Figure 1: East Asia in world network trade: Share in world exports by country groups
(%)
( a) Parts and components
0
5
10
15
20
25
30
35
40
45
50
1992
1993
1994
1995
1996
1997
1998
1999
2000
2001
2002
2003
2004
2005
2006
2007
World e
xport
shar
e (%
)EA DEA DEA ex. China ASEAN6
(b) Final assembly
0
5
10
15
20
25
30
35
40
45
50
1992
1993
1994
1995
1996
1997
1998
1999
2000
2001
2002
2003
2004
2005
2006
2007
Wo
rld
exp
ort
sh
are
(%)
EA DEA DEA ex. China ASEAN6
(c) Total network exports
0
5
10
15
20
25
30
35
40
45
50
1992
1993
1994
1995
1996
1997
1998
1999
2000
2001
2002
2003
2004
2005
2006
2007
Wo
lrd
exp
ort
sh
are
(%)
EA DEA DEA ex. China ASEAN6
Source: Based on data compiled from UN Comtrade database.

68
Figure 2: Parts and components in China’s Manufacturing trade, 1992 -2007
A: Manufacturing exports
0
10
20
30
40
50
60
70
1992
1993
1994
1995
1996
1997
1998
1999
2000
2001
2002
2003
2004
2005
2006
2007
Sh
are
(%
)
P&C share in total total exports
P&c share in exports to East Asia
East Asian share in total P&C exports
A: Manufacturing imports
0
5
10
15
20
25
30
35
40
45
50
1992
1993
1994
1995
1996
1997
1998
1999
2000
2001
2002
2003
2004
2005
2006
2007
shar
e (
%)
P&C share in total imports
P&c share in imports from East Asia
East Asian share in total P&C imports
Source: Based on data compiled from UN Comtrade database.

69
Figure 3: Growth of merchandise trade: East Asia, Developing East Asia and
ASEAN, January 2008 – July 2009 (Y-O-Y, %)
(a) Exports
-50
-40
-30
-20
-10
0
10
20
30
40
Jan-0
8
Feb-0
8
Mar-08
Apr-08
May-
08
Jun-0
8
Jul-08
Aug-0
8
Sep-0
8
Oct
-08
Nov-
08
Dec-
08
Jan-0
9
Feb-0
9
Mar-09
Apr-09
May-
09
Jun-0
9
Jul-09
Export
s g
row
th (Y-O
-Y), %
East Asia
Developing East Asia
ASEAN
(b) Imports
-50
-40
-30
-20
-10
0
10
20
30
40
50
Jan-0
8
Feb-0
8
Mar-
08
Apr-
08
May-
08
Jun-0
8
Jul-08
Aug-0
8
Sep-0
8
Oct
-08
Nov-
08
Dec-
08
Jan-0
9
Feb-0
9
Mar-
09
Apr-
09
May-
09
Jun-0
9
Jul-09
Import
gro
wth
(Y
-O-Y
), %
East Asia
Developing East Asia
ASEAN
Source: Based on data compiled from CEIM database.
70
Working Papers in Trade and Development
List of Papers (including publication details as at 2009)
99/1 K K TANG, ‘Property Markets and Policies in an Intertemporal General Equilibrium Model’.
99/2 HARYO ASWICAHYONO and HAL HILL, ‘‘Perspiration’ v/s ‘Inspiration’ in
Asian Industrialization: Indonesia Before the Crisis’. 99/3 PETER G WARR, ‘What Happened to Thailand?’. 99/4 DOMINIC WILSON, ‘A Two-Sector Model of Trade and Growth’. 99/5 HAL HILL, ‘Indonesia: The Strange and Sudden Death of a Tiger Economy’. 99/6 PREMA-CHANDRA ATHUKORALA and PETER G WARR, ‘Vulnerability to a
Currency Crisis: Lessons from the Asian Experience’. 99/7 PREMA-CHANDRA ATHUKORALA and SARATH RAJAPATIRANA,
‘Liberalization and Industrial Transformation: Lessons from the Sri Lankan Experience’.
99/8 TUBAGUS FERIDHANUSETYAWAN, ‘The Social Impact of the Indonesian
Economic Crisis: What Do We Know?’ 99/9 KELLY BIRD, ‘Leading Firm Turnover in an Industrializing Economy: The Case
of Indonesia’. 99/10 PREMA-CHANDRA ATHUKORALA, ‘Agricultural Trade Liberalization in
South Asia: From the Uruguay Round to the Millennium Round’. 99/11 ARMIDA S ALISJAHBANA, ‘Does Demand for Children’s Schooling Quantity
and Quality in Indonesia Differ across Expenditure Classes?’ 99/12 PREMA-CHANDRA ATHUKORALA, ‘Manufactured Exports and Terms of
Trade of Developing Countries: Evidence from Sri Lanka’. 00/01 HSIAO-CHUAN CHANG, ‘Wage Differential, Trade, Productivity Growth and
Education.’ 00/02 PETER G WARR, ‘Targeting Poverty.’ 00/03 XIAOQIN FAN and PETER G WARR, ‘Foreign Investment, Spillover Effects and
the Technology Gap: Evidence from China.’ 00/04 PETER G WARR, ‘Macroeconomic Origins of the Korean Crisis.’ 00/05 CHINNA A KANNAPIRAN, ‘Inflation Targeting Policy in PNG: An Econometric
Model Analysis.’

71
00/06 PREMA-CHANDRA ATHUKORALA, ‘Capital Account Regimes, Crisis and
Adjustment in Malaysia.’ 00/07 CHANGMO AHN, ‘The Monetary Policy in Australia: Inflation Targeting and
Policy Reaction.’ 00/08 PREMA-CHANDRA ATHUKORALA and HAL HILL, ‘FDI and Host Country
Development: The East Asian Experience.’ 00/09 HAL HILL, ‘East Timor: Development Policy Challenges for the World’s Newest
Nation.’ 00/10 ADAM SZIRMAI, M P TIMMER and R VAN DER KAMP, ‘Measuring Embodied
Technological Change in Indonesian Textiles: The Core Machinery Approach.’ 00/11 DAVID VINES and PETER WARR, ‘ Thailand’s Investment-driven Boom and
Crisis.’ 01/01 RAGHBENDRA JHA and DEBA PRASAD RATH, ‘On the Endogeneity of the
Money Multiplier in India.’ 01/02 RAGHBENDRA JHA and K V BHANU MURTHY, ‘An Inverse Global
Environmental Kuznets Curve.’ 01/03 CHRIS MANNING, ‘The East Asian Economic Crisis and Labour Migration: A
Set-Back for International Economic Integration?’ 01/04 MARDI DUNGEY and RENEE FRY, ‘A Multi-Country Structural VAR Model.’ 01/05 RAGHBENDRA JHA, ‘Macroeconomics of Fiscal Policy in Developing
Countries.’ 01/06 ROBERT BREUNIG, ‘Bias Correction for Inequality Measures: An application to
China and Kenya.’ 01/07 MEI WEN, ‘Relocation and Agglomeration of Chinese Industry.’ 01/08 ALEXANDRA SIDORENKO, ‘Stochastic Model of Demand for Medical Care
with Endogenous Labour Supply and Health Insurance.’ 01/09 A SZIRMAI, M P TIMMER and R VAN DER KAMP, ‘Measuring Embodied
Technological Change in Indonesian Textiles: The Core Machinery Approach.’ 01/10 GEORGE FANE and ROSS H MCLEOD, ‘Banking Collapse and Restructuring in
Indonesia, 1997-2001.’ 01/11 HAL HILL, ‘Technology and Innovation in Developing East Asia: An
Interpretive Survey.’ 01/12 PREMA-CHANDRA ATHUKORALA and KUNAL SEN, ‘The Determinants of
Private Saving in India.’

72
02/01 SIRIMAL ABEYRATNE, ‘Economic Roots of Political Conflict: The Case of Sri Lanka.’
02/02 PRASANNA GAI, SIMON HAYES and HYUN SONG SHIN, ‘Crisis Costs and
Debtor Discipline: the efficacy of public policy in sovereign debt crises.’ 02/03 RAGHBENDRA JHA, MANOJ PANDA and AJIT RANADE, ‘An Asian
Perspective on a World Environmental Organization.’ 02/04 RAGHBENDRA JHA, ‘Reducing Poverty and Inequality in India: Has
Liberalization Helped?’ 02/05 ARCHANUN KOHPAIBOON, ‘Foreign Trade Regime and FDI-Growth Nexus:
A Case Study of Thailand.’ 02/06 ROSS H MCLEOD, ‘Privatisation Failures in Indonesia.’ 02/07 PREMA-CHANDRA ATHUKORALA, ‘Malaysian Trade Policy and the 2001
WTO Trade Policy Review.’ 02/08 M C BASRI and HAL HILL, ‘Ideas, Interests and Oil Prices: The Political
Economy of Trade Reform during Soeharto’s Indonesia.’ 02/09 RAGHBENDRA JHA, ‘Innovative Sources of Development Finance – Global
Cooperation in the 21st Century.’ 02/10 ROSS H MCLEOD, ‘Toward Improved Monetary Policy in Indonesia.’ 03/01 MITSUHIRO HAYASHI, ‘Development of SMEs in the Indonesian Economy.’ 03/02 PREMA-CHANDRA ATHUKORALA and SARATH RAJAPATIRANA, ‘Capital
Inflows and the Real Exchange Rate: A Comparative Study of Asia and Latin America.’
03/03 PETER G WARR, ‘Industrialisation, Trade Policy and Poverty Reduction:
Evidence from Asia.’ 03/04 PREMA-CHANDRA ATHUKORALA, ‘FDI in Crisis and Recovery: Lessons from
the 1997-98 Asian Crisis.’ 03/05 ROSS H McLEOD, ‘Dealing with Bank System Failure: Indonesia, 1997-2002.’ 03/06 RAGHBENDRA JHA and RAGHAV GAIHA, ‘Determinants of Undernutrition in
Rural India.’ 03/07 RAGHBENDRA JHA and JOHN WHALLEY, ‘Migration and Pollution.’ 03/08 RAGHBENDRA JHA and K V BHANU MURTHY, ‘A Critique of the
Environmental Sustainability Index.’ 03/09 ROBERT J BAROO and JONG-WHA LEE, ‘IMF Programs: Who Is Chosen and
What Are the Effects?

73
03/10 ROSS H MCLEOD, ‘After Soeharto: Prospects for reform and recovery in Indonesia.’
03/11 ROSS H MCLEOD, ‘Rethinking vulnerability to currency crises: Comments on
Athukorala and Warr.’ 03/12 ROSS H MCLEOD, ‘Equilibrium is good: Comments on Athukorala and
Rajapatirana.’ 03/13 PREMA-CHANDRA ATHUKORALA and SISIRA JAYASURIYA, ‘Food Safety
Issues, Trade and WTO Rules: A Developing Country Perspective.’ 03/14 WARWICK J MCKIBBIN and PETER J WILCOXEN, ‘Estimates of the Costs of
Kyoto-Marrakesh Versus The McKibbin-Wilcoxen Blueprint.’ 03/15 WARWICK J MCKIBBIN and DAVID VINES, ‘Changes in Equity Risk
Perceptions: Global Consequences and Policy Responses.’ 03/16 JONG-WHA LEE and WARWICK J MCKIBBIN, ‘Globalization and Disease: The
Case of SARS.’ 03/17 WARWICK J MCKIBBIN and WING THYE WOO, ‘The consequences of China’s
WTO Accession on its Neighbors.’ 03/18 MARDI DUNGEY, RENEE FRY and VANCE L MARTIN, ‘Identification of
Common and Idiosyncratic Shocks in Real Equity Prices: Australia, 1982 to 2002.’ 03/19 VIJAY JOSHI, ‘Financial Globalisation, Exchange Rates and Capital Controls in
Developing Countries.’ 03/20 ROBERT BREUNIG and ALISON STEGMAN, ‘Testing for Regime Switching in
Singaporean Business Cycles.’ 03/21 PREMA-CHANDRA ATHUKORALA, ‘Product Fragmentation and Trade
Patterns in East Asia.’ 04/01 ROSS H MCLEOD, ‘Towards Improved Monetary Policy in Indonesia: Response
to De Brouwer’ 04/02 CHRIS MANNING and PRADIP PHATNAGAR, ‘The Movement of Natural
Persons in Southeast Asia: How Natural? 04/03 RAGHBENDRA JHA and K V BHANU MURTHY, ‘A Consumption Based
Human Development Index and The Global Environment Kuznets Curve’ 04/04 PREMA-CHANDRA ATHUKORALA and SUPHAT SUPHACHALASAI, ‘Post-
crisis Export Performance in Thailand’ 04/05 GEORGE FANE and MARTIN RICHARDSON, ‘Capital gains, negative gearing
and effective tax rates on income from rented houses in Australia’ 04/06 PREMA-CHANDRA ATHUKORALA, ‘Agricultural trade reforms in the Doha
Round: a developing country perspective’

74
04/07 BAMBANG-HERU SANTOSA and HEATH McMICHAEL, ‘ Industrial
development in East Java: A special case?’ 04/08 CHRIS MANNING, ‘Legislating for Labour Protection: Betting on the Weak or
the Strong?’ 05/01 RAGHBENDRA JHA, ‘Alleviating Environmental Degradation in the Asia-
Pacific Region: International cooperation and the role of issue-linkage’ 05/02 RAGHBENDRA JHA, RAGHAV GAIHA and ANURAG SHARMA, ‘Poverty
Nutrition Trap in Rural India’ 05/03 PETER WARR, ‘Food Policy and Poverty in Indonesia: A General Equilibrium
Analysis’ 05/04 PETER WARR, ‘Roads and Poverty in Rural Laos’ 05/05 PREMA-CHANDRA ATHUKORALA and BUDY P RESOSUDARMO, ‘The
Indian Ocean Tsunami: Economic Impact, Disaster Management and Lessons’ 05/06 PREMA-CHANDRA ATHUKORALA, ‘Trade Policy Reforms and the Structure
of Protection in Vietnam’ 05/07 PREMA-CHANDRA ATHUKORALA and NOBUAKI YAMASHITA,
‘Production Fragmentation and Trade Integration: East Asia in a Global Context’ 05/08 ROSS H MCLEOD, ‘Indonesia’s New Deposit Guarantee Law’ 05/09 KELLY BIRD and CHRIS MANNING, ‘Minimum Wages and Poverty in a
Developing Country: Simulations from Indonesia’s Household Survey’ 05/10 HAL HILL, ‘The Malaysian Economy: Past Successes, Future Challenges’ 05/11 ZAHARI ZEN, COLIN BARLOW and RIA GONDOWARSITO, ‘Oil Palm in
Indonesian Socio-Economic Improvement: A Review of Options’ 05/12 MEI WEN, ‘Foreign Direct Investment, Regional Geographical and Market
Conditions, and Regional Development: A Panel Study on China’ 06/01 JUTHATHIP JONGWANICH, ‘Exchange Rate Regimes, Capital Account
Opening and Real Exchange Rates: Evidence from Thailand’ 06/02 ROSS H MCLEOD, ‘Private Sector Lessons for Public Sector Reform in Indonesia’ 06/03 PETER WARR, ‘The Gregory Thesis Visits the Tropics’ 06/04 MATT BENGE and GEORGE FANE, ‘Adjustment Costs and the Neutrality of
Income Taxes’ 06/05 RAGHBENDRA JHA, ‘Vulnerability and Natural Disasters in Fiji, Papua New
Guinea, Vanuatu and the Kyrgyz Republic’

75
06/06 PREMA-CHANDRA ATHUKORALA and ARCHANUN KOHPAIBOON, ‘Multinational Enterprises and Globalization of R&D: A Study of U.S-based Firms
06/07 SANTANU GUPTA and RAGHBENDRA JHA, ‘Local Public Goods in a
Democracy: Theory and Evidence from Rural India’ 06/08 CHRIS MANNING and ALEXANDRA SIDORENKO, ‘The Regulation of
Professional Migration in ASEAN – Insights from the Health and IT Sectors’ 06/09 PREMA-CHANDRA ATHUKORALA, ‘Multinational Production Networks and
the New Geo-economic Division of Labour in the Pacific Rim’ 06/10 RAGHBENDRA JHA, RAGHAV GAIHA and ANURAG SHARMA, ‘On
Modelling Variety in Consumption Expenditure on Food’ 06/11 PREMA-CHANDRA ATHUKORALA, ‘Singapore and ASEAN in the New
Regional Division of Labour’ 06/12 ROSS H MCLEOD, ‘Doing Business in Indonesia: Legal and Bureaucratic
Constraints’ 06/13 DIONISIUS NARJOKO and HAL HILL, ‘Winners and Losers during a Deep
Economic Crisis; Firm-level Evidence from Indonesian Manufacturing’ 06/14 ARSENIO M BALISACAN, HAL HILL and SHARON FAYE A PIZA, ‘Regional
Development Dynamics and Decentralization in the Philippines: Ten Lessons from a ‘Fast Starter’’
07/01 KELLY BIRD, SANDY CUTHBERTSON and HAL HILL, ‘Making Trade Policy in
a New Democracy after a Deep Crisis: Indonesia 07/02 RAGHBENDRA JHA and T PALANIVEL, ‘Resource Augmentation for Meeting
the Millennium Development Goals in the Asia Pacific Region’ 07/03 SATOSHI YAMAZAKI and BUDY P RESOSUDARMO, ‘Does Sending Farmers
Back to School have an Impact? A Spatial Econometric Approach’ 07/04 PIERRE VAN DER ENG, ‘De-industrialisation’ and Colonial Rule: The Cotton
Textile Industry in Indonesia, 1820-1941’ 07/05 DJONI HARTONO and BUDY P RESOSUDARMO, ‘The Economy-wide Impact
of Controlling Energy Consumption in Indonesia: An Analysis Using a Social Accounting Matrix Framework’
07/06 W MAX CORDEN, ‘The Asian Crisis: A Perspective after Ten Years’ 07/07 PREMA-CHANDRA ATHUKORALA, ‘The Malaysian Capital Controls: A
Success Story? 07/08 PREMA-CHANDRA ATHUKORALA and SATISH CHAND, ‘Tariff-Growth
Nexus in the Australian Economy, 1870-2002: Is there a Paradox?,

76
07/09 ROD TYERS and IAN BAIN, ‘Appreciating the Renbimbi’ 07/10 PREMA-CHANDRA ATHUKORALA, ‘The Rise of China and East Asian Export
Performance: Is the Crowding-out Fear Warranted? 08/01 RAGHBENDRA JHA, RAGHAV GAIHA AND SHYLASHRI SHANKAR,
‘National Rural Employment Guarantee Programme in India — A Review’ 08/02 HAL HILL, BUDY RESOSUDARMO and YOGI VIDYATTAMA, ‘Indonesia’s
Changing Economic Geography’ 08/03 ROSS H McLEOD, ‘The Soeharto Era: From Beginning to End’ 08/04 PREMA-CHANDRA ATHUKORALA, ‘China’s Integration into Global
Production Networks and its Implications for Export-led Growth Strategy in Other Countries in the Region’
08/05 RAGHBENDRA JHA, RAGHAV GAIHA and SHYLASHRI SHANKAR,
‘National Rural Employment Guarantee Programme in Andhra Pradesh: Some Recent Evidence’
08/06 NOBUAKI YAMASHITA, ‘The Impact of Production Fragmentation on Skill
Upgrading: New Evidence from Japanese Manufacturing’ 08/07 RAGHBENDRA JHA, TU DANG and KRISHNA LAL SHARMA, ‘Vulnerability
to Poverty in Fiji’ 08/08 RAGHBENDRA JHA, TU DANG, ‘ Vulnerability to Poverty in Papua New
Guinea’ 08/09 RAGHBENDRA JHA, TU DANG and YUSUF TASHRIFOV, ‘Economic
Vulnerability and Poverty in Tajikistan’ 08/10 RAGHBENDRA JHA and TU DANG, ‘Vulnerability to Poverty in Select Central
Asian Countries’ 08/11 RAGHBENDRA JHA and TU DANG, ‘Vulnerability and Poverty in Timor- Leste 08/12 SAMBIT BHATTACHARYYA, STEVE DOWRICK and JANE GOLLEY,
‘Institutions and Trade: Competitors or Complements in Economic Development?
08/13 SAMBIT BHATTACHARYYA, ‘Trade Liberalizaton and Institutional
Development’ 08/14 SAMBIT BHATTACHARYYA, ‘Unbundled Institutions, Human Capital and
Growth’ 08/15 SAMBIT BHATTACHARYYA, ‘Institutions, Diseases and Economic Progress: A
Unified Framework’ 08/16 SAMBIT BHATTACHARYYA, ‘Root causes of African Underdevelopment’

77
08/17 KELLY BIRD and HAL HILL, ‘Philippine Economic Development: A Turning Point?’
08/18 HARYO ASWICAHYONO, DIONISIUS NARJOKO and HAL HILL,
‘Industrialization after a Deep Economic Crisis: Indonesia’ 08/19 PETER WARR, ‘Poverty Reduction through Long-term Growth: The Thai
Experience’ 08/20 PIERRE VAN DER ENG, ‘Labour-Intensive Industrialisation in Indonesia, 1930-
1975: Output Trends and Government policies’ 08/21 BUDY P RESOSUDARMO, CATUR SUGIYANTO and ARI KUNCORO,
‘Livelihood Recovery after Natural Disasters and the Role of Aid: The Case of the 2006 Yogyakarta Earthquake’
08/22 PREMA-CHANDRA ATHUKORALA and NOBUAKI YAMASHITA, ‘Global
Production Sharing and US-China Trade Relations’ 09/01 PIERRE VAN DER ENG, ‘ Total Factor Productivity and the Economic Growth in
Indonesia’ 09/02 SAMBIT BHATTACHARYYA and JEFFREY G WILLIAMSON, ‘Commodity
Price Shocks and the Australian Economy since Federation’ 09/03 RUSSELL THOMSON, ‘Tax Policy and the Globalisation of R & D’ 09/04 PREMA-CHANDRA ATHUKORALA, ‘China’s Impact on Foreign Trade and
Investment in other Asian Countries’ 09/05 PREMA-CHANDRA ATHUKORALA, ‘Transition to a Market Economy and
Export Performance in Vietnam’ 09/06 DAVID STERN, ‘Interfuel Substitution: A Meta-Analysis’ 09/07 PREMA-CHANDRA ATHUKORALA and ARCHANUN KOHPAIBOON,
‘Globalization of R&D US-based Multinational Enterprises’ 09/08 PREMA-CHANDRA ATHUKORALA, ‘Trends and Patterns of Foreign
Investments in Asia: A Comparative Perspective’ 09/09 PREMA-CHANDRA ATHUKORALA and ARCHANUN KOHPAIBOON,’ Intra-
Regional Trade in East Asia: The Decoupling Fallacy, Crisis, and Policy Challenges’
09/10 PETER WARR, ‘Aggregate and Sectoral Productivity Growth in Thailand and
Indonesia’ 09/11 WALEERAT SUPHANNACHART and PETER WARR, ‘Research and
Productivity in Thai Agriculture’ 09/12 PREMA-CHANDRA ATHUKORALA and HAL HILL, ‘Asian Trade: Long-Term
Patterns and Key Policy Issues’

78
09/13 PREMA-CHANDRA ATHUKORALA and ARCHANUN KOHPAIBOON, ‘East
Asian Exports in the Global Economic Crisis: The Decoupling Fallacy and Post-crisis Policy Challenges’.
09/14 PREMA-CHANDRA ATHUKORALA, ‘Outward Direct Investment from India’ 09/15 PREMA-CHANDRA ATHUKORALA, ‘Production Networks and Trade
Patterns: East Asia in a Global Context’