The relationship between eye movement and vision develops before birth
Upload
manchesterCategory
view
1download
0
Schizophrenia Research xxx (2008) xxx–xxx
SCHRES-03768; No of Pages 8
Contents lists available at ScienceDirect
Schizophrenia Research
j ourna l homepage: www.e lsev ie r.com/ locate /schres
ARTICLE IN PRESS
Progressive brain structural changes mapped as psychosis develops in‘at risk’ individuals
Daqiang Sun a,b, Lisa Phillips c, Dennis Velakoulis a, Alison Yung d, Patrick D. McGorry d,Stephen J. Wood a, Theo G.M. van Erp b, Paul M. Thompson e, Arthur W. Toga e,Tyrone D. Cannon b,⁎, Christos Pantelis a,f
a Melbourne Neuropsychiatry Centre, Department of Psychiatry, The University of Melbourne and Melbourne Health, Parkville, Victoria, Australiab Clinical Neuroscience Laboratory, Departments of Psychology and Psychiatry and Biobehavioral Sciences, University of California, 1285 Franz Hall, Los Angeles, CA90095-1563, USAc Department of Psychology, The University of Melbourne, Parkville, Victoria, Australiad ORYGEN Research Centre, Department of Psychiatry, The University of Melbourne and Melbourne Health, Parkville, Victoria, Australiae Laboratory of Neuro Imaging, Department of Neurology, UCLA School of Medicine, Los Angeles, CA 90095-1563, USAf Howard Florey Institute, Parkville, Victoria, Australia
a r t i c l e i n f o
⁎ Corresponding author. Tel.: +1 310 206 8765; fax:E-mail address: [email protected] (T.D. Cann
0920-9964/$ – see front matter. Published by Elseviedoi:10.1016/j.schres.2008.11.026
Please cite this article as: Sun, D., et al.individuals, Schizophr. Res. (2008), doi:10
a b s t r a c t
Article history:Received 13 October 2008Received in revised form 20 November 2008Accepted 21 November 2008Available online xxxx
Background: Schizophrenia and related psychoses are associated with brain structuralabnormalities. Recent findings in ‘at risk’ populations have identified progressive changes invarious brain regions preceding illness onset, while changes especially in prefrontal andsuperior temporal regions have been demonstrated in first-episode schizophrenia patients.However, the timing of the cortical changes and their regional extent, relative to the emergenceof psychosis, has not been clarified. We followed individuals at high-risk for psychosis todetermine whether structural changes in the cerebral cortex occur with the onset of psychosis.We hypothesized that progressive volume loss occurs in prefrontal regions during thetransition to psychosis.
Methods: 35 individuals at ultra-high risk (UHR) for developing psychosis, of whom 12experienced psychotic onset by 1-year follow-up (‘converters’), participated in a longitudinalstructural MRI study. Baseline and follow-up T1-weighted MR images were acquired andlongitudinal brain surface contractions were assessed using Cortical Pattern Matching.
Results: Significantly greater brain contraction was found in the right prefrontal region in the‘converters’ compared with UHR cases who did not develop psychosis (‘non-converters’).
Conclusions: These findings show cortical volume loss is associatedwith the onset of psychosis,indicating ongoing pathological processes during the transition stage to illness. The prefrontalvolume loss is in line with structural and functional abnormalities in schizophrenia, suggestinga critical role for this change in the development of psychosis.
Published by Elsevier B.V.
Keywords:SchizophreniaMRIBrain mappingLongitudinalProdromeUltra-high risk
1. Introduction
Schizophrenia and related psychoses are associated withbrain structural and functional abnormalities. In structuralmagnetic resonance imaging (MRI) studies, brain volumereductions have been found in both chronic and first-episode
+1 310 794 9740.on).
r B.V.
, Progressive brain stru.1016/j.schres.2008.11.0
schizophrenia patients (Shenton et al., 2001) and also inaffective disorder (Strakowski et al., 2005), but whether thereis ongoing brain tissue loss prior to, or following, onset ofthese psychoses, is less clear (Mathalon et al., 2003;Weinberger and McClure 2002). Although accumulatingdata have shown that various brain regions experienceprogressive tissue loss after the first psychotic onset ofschizophrenia (Ho et al., 2003; Lieberman et al., 2005;Nakamura et al., 2007; Salisbury et al., 2007; van Haren
ctural changes mapped as psychosis develops in ‘at risk’26

2 D. Sun et al. / Schizophrenia Research xxx (2008) xxx–xxx
ARTICLE IN PRESS
et al., 2007), the timing and regional pattern of these changesremain unclear, and it is unknownwhether these changes arecaused by the effect of long-term illness or medications(Pantelis et al., 2005).
Two studies to date have attempted to address thesequestions by identifying individuals at heightened risk forpsychosis due tomental state change and/or family history, andby tracking brain changes from pre-onset stages throughtransition to illness. Pantelis and colleagues (Pantelis et al.,2003a) examined gray matter changes in individuals at ultra-high risk (UHR) for psychosis followed for 1 year to assess thoseconverting to psychosis (‘converters’) compared to ‘non-converters’. The converters showed gray matter loss in the leftinferior frontal region, leftmedial and inferior temporal regionsand bilaterally in the cingulate, but the group by timeinteraction did not reach significance. Job and colleagues (Jobet al., 2005) reported gray matter loss in the left inferiortemporal gyrus, left uncus and the right cerebellum in theirgenetic high-risk subjectswhodeveloped schizophrenia duringor beyond a 2-year follow-up period. However, no significantgroup differences in gray matter loss were found in a directcomparison to subjects who did not develop schizophrenia orhealthy controls. Both studies suggested that tissue loss occursover time among individuals at risk for psychosis, but neitherstudy was adequately powered to compare rates of loss amongconverters relative to non-converters. Since the brain under-goes developmental changes during adolescence and earlyadulthood, particularly in prefrontal cortex, the observed graymatter reduction may not be pathologic but, rather, develop-mental in nature (Pantelis et al., 2007). Therefore, whether thechanges are related to the onset of psychosis remainsunanswered, and can only be determined by a between-groupcomparison in a longitudinal design.
Table 1Ultra-high-risk intake and exit criteria
Intake criteria
Group 1: attenuated psychotic symptoms• Presence of at least one of the following symptoms: ideas of reference, odd beliefsand speech, odd behavior and appearance (2–3 on unusual thought content scale; 1disorganization scale of BPRS)
•Heldwith a reasonable degree of conviction, as defined bya score of 2 on the compre• Frequency of symptoms: at least several times per week• Change in mental state present for at least 1 week and not longer than 5 yearsGroup 2: brief limited intermittent psychotic symptoms (BLIPS)• Transient psychotic symptoms: presence of at least one of the following — ideas othinking and speech (4+ on unusual thought content scale; 3+ on hallucinations scaby a score of 3 or more on the CASH rating scale for delusions] or 4+ on conceptu
• Duration of episode of less than 1 week• Symptoms resolve spontaneously• The BLIP must have occurred within the past yearGroup 3: trait and state risk factors• First-degree relative with a DSM-IV psychotic disorder or schizotypal personality• Significant decrease inmental state or functioning:maintained for at least 1 month and• The decrease in functioning occurred within the past yearExit criteria: acute psychosis• Presence of at least one of the following symptoms: hallucinations (defined by a scorscore of 4 or more on the unusual thought content scale of the BPRS or a score ofconviction, as defined by a score of 3 or more on the CASH rating scale for delusionsdisorganization scale BPRS])
• Frequency of symptoms is at least several times a week• Duration of mental state change is longer than 1 weekBPRS=brief psychiatric rating scale; CASH=comprehensive assessment of symptomfor identifying people as high risk for psychosis. People are included if they meet c
Please cite this article as: Sun, D., et al., Progressive brain struindividuals, Schizophr. Res. (2008), doi:10.1016/j.schres.2008.11.0
In the present study, we assessed subtle cortical changesduring illness transition, using higher resolution MRI imagesin a larger sample of the Melbourne UHR subjects. We usedCortical Pattern Matching to directly compare longitudinalbrain surface contractions in converters with non-convertersfollowed for 1 year. Cortical Pattern Matching is an advancedbrainwarping technique that can achieve accurate anatomicalcorrespondence between brain surfaces, after which point-wise statistical comparisons were performed. It has provensuccessful in detecting longitudinal changes of cortical graymatter density and thickness in normal and pathologicaldevelopment and degeneration (Thompson et al., 2004). Brainsurface contraction is defined as the subvoxel-resolutiondistance between anatomically corresponding brain surfacepoints of baseline and follow-up brain scans, the measure ofwhich is an integrated part of Cortical Pattern Matching(Sowell et al., 2001). We hypothesized that greater brainsurface contraction occurs in UHR converters compared withnon-converters and that these changes are most pronouncedin frontal brain regions previously shown to be affected inschizophrenia (Cannon et al., 2002; Ho et al., 2003; Liebermanet al., 2005; van Haren et al., 2007).
2. Method
2.1. Participants
Participants were recruited from the Personal Assessmentand Crisis Evaluation (PACE) Clinic, a clinical researchprogram for prodromal patients in Melbourne, Australia(Yung et al., 2004). Criteria for identification of the UHRsubjects are listed in Table 1. Validated criteria for onset ofacute psychosis have also been developed (Table 1) (Yung
or magical thinking, perceptual disturbance, paranoid ideation, odd thinking–2 on hallucinations scale; 2–3 on suspiciousness scale or 1–3 on conceptual
hensive assessment of symptoms and history (CASH) rating scale for delusions
f reference, magical thinking, perceptual disturbance, paranoid ideation, oddle; 4+ on suspiciousness scale [or it is held with strong conviction, as definedal disorganization scale of BPRS)
disorder (as defined by DSM-IV)not longer than 5 years (reduction inGAF scale of 30points frompremorbid level)
e of 3 ormore on the hallucinations scale of the BPRS); delusions (defined by a4 or more on the suspiciousness scale of the BPRS, or it is held with strongor formal thought disorder [defined by a score of 4 or more on the conceptual
s and history; GAF=global assessment of function scale. These are the criteriariteria for one or more of the three groups.
ctural changes mapped as psychosis develops in ‘at risk’26

3D. Sun et al. / Schizophrenia Research xxx (2008) xxx–xxx
ARTICLE IN PRESS
et al., 2003). Trained psychologists or psychiatrists conductedthe clinical interviews and determined whether participantsmet UHR intake criteria and criteria for acute psychosis (Yunget al., 2004).
The UHR subjects were aged between 14 and 30 years atintake, had not experienced a previous psychotic episode orreceived neuroleptic medication, did not have a neurologicaldisorder, and were not intellectually disabled (IQN70).
The study was approved by the local research and ethicscommittee in Melbourne, Australia, and by the InternalReview Board at the University of California, Los Angeles,USA. After complete description of the study to the subjects,written informed consent was obtained.
Clinical assessments andMRI scans were conducted at twotime points. The planned follow-up time was 1 year, unlessonset of psychosis occurred earlier. In the latter cases, thesecond assessment was conducted as soon as possible aftertransition. In practice, however, the interval time varied forreasons including difficulty in maintaining contact with theparticipants, and treatment needs taking priority.
Thirty-five UHR participants who had both baseline andfollow-up scans were included. Twelve participants devel-oped a full psychotic episode over the follow-up period. Thediagnostic breakdown of psychotic disorders in converterswas: schizophrenia (n=4); schizoaffective disorder (1); bipo-lar disorder (2); major depression with mood incongruentpsychotic symptoms (3); brief psychotic episode (1); andpsychosis not otherwise specified (1). At follow-up, non-converters had either no psychiatric diagnosis (n=14), orwere diagnosed with non-psychotic disorders (major depres-sion 4; dysthymia 2; obsessive–compulsive disorder 1; gen-eral anxiety disorder 1; eating disorder 1). There was nosignificant difference in gender, handedness, premorbid IQ,age, and inter-scan interval between the converters and non-converters (Table 2). Complete information on medicationswas not available. At follow-up scans, one converter was onrisperidone (3 mg/day), one on chlorpromazine (150 mg/day)and valproate (1500 mg/day), and the other was oncitalopram (20 mg/day) and valproate (1500 mg/day); onenon-converter was on venlafaxine (225 mg/day) at follow-up.Three converters and 6 non-converters had records for drug
Table 2Demographic data of ultra-high-risk individuals
Converters(n=12)
Non-converters(n=23)
p value
Sex (male/female) 7/5 12/11 0.728Handedness(right/mixed/left)
10/0/2 18/1/4 0.760
Premorbid IQ 94.3±13.6 93.3±13.7 0.947Age at 1st scan(years)
19.5±5.1 (13.9–29.1) 20.2±4.0 (14.3–27.5) 0.662
Age at 2nd scan(years)
20.7±5.2 (15.4–30.9) 21.6±4.0 (15.4–28.5) 0.581
Days between scans 443±186 (237–826) 511±289 (329–1361) 0.469Age of onset(years)
20.1±5.0 (15.3–29.5)
Days between 1stscan and onset
211±141 (84–538)
Days between onsetand 2nd scan
232±144 (15–534)
Data are mean±SD (range) unless otherwise stated.
Please cite this article as: Sun, D., et al., Progressive brain struindividuals, Schizophr. Res. (2008), doi:10.1016/j.schres.2008.11.0
use (including tetrahydrocannabinol, cocaine, and LSD)during the follow-up period. No head injuries were recorded.
All but one subject (n=20) who participated in a previouslongitudinal study using low-resolution T2-weighted andproton density images (Pantelis et al., 2003a) were includedin the present analysis; the one case was excluded because T1-weighted images were not available. The presentstudy incorporates 15 new participants (3 converted, 12 non-converted) and utilizes previously unpublished high-resolutionT1-weighted anatomical images obtained at baseline andfollow-up.
2.2. Image processing and analysis
All participants were scanned twice on a 1.5T GeneralElectric Signa MRI scanner. A three-dimensional volumetricspoiled gradient recalled echo (SPGR) sequence generated124 contiguous, 1.5 mm coronal slices. Imaging parameterswere: TE=3.3 ms; TR=14.3 ms; flip angle, 30°; matrix size,256×256; field of view, 24×24 cm matrix; voxel dimensions,0.938×0.938×1.5 mm. A numerical code was used to ensureblind analysis of data.
For each scan, a radio-frequency bias field correction wasperformed. The cerebral image was extracted from theremainder of each head image, and was manually refined forfurther accuracy. The baseline and follow-up brain imageswere coregistered to a standard 3D coordinate space (Maz-ziotta et al., 1995) with 9 degree-of-freedom linear transfor-mations, while image scales were corrected using intracranialvolumes. Cortical Pattern Matching was performed in thestandard space.
For each scan, a cortical surface model was extracted usingan automated method (MacDonald et al., 2000). In thisprocess, a spherical mesh surface was continuously deformedto fit the cortical surface that best differentiated brain tissueand cortical CSF, and a high-resolution surface modelrepresenting 65,536 brain surface points was created. Oneach hemisphere of the surface model, 17 major anatomicallandmark curves were manually traced following major sulci.In addition, a set of 8 control curves along the longitudinalfissure that delineate the lateral surface and the medialsurface were traced. The tracing protocol is available on theInternet (http://www.loni.ucla.edu/~esowell/edevel/new_s-ulcvar.html). All sulci and control curves were traced by animage analyst blind to subject demographics and diagnosis.The reliability of tracing was tested on 6 standard brainsurfaces, and the average distance between the sulcal curvestracing by the current analyst and the standard sulcal curveswas b2 mm in most regions.
The brain surfaces and curves were then flattened to a 2Dplane, and average curves were created by averaging thepositions of the same curves across all subjects. The brainsurfaces were elastically warped to each other based onmatching individual curves to their corresponding averagecurves in the 2D plane, while the coordinate positions of eachsurface point in their 3D space were preserved.
The distance between a center position of the brain (theorigin of the standard space, approximately at the midlinedecussation of the anterior commissure) and each brainsurface point was calculated (Sowell et al., 2001). Thedifference of the above radial distances between the follow-
ctural changes mapped as psychosis develops in ‘at risk’26

4 D. Sun et al. / Schizophrenia Research xxx (2008) xxx–xxx
ARTICLE IN PRESS
up and baseline brain surfaces at each anatomically corre-sponding point was defined as brain surface contraction,which reflected local tissue loss or growth over time. Theresulting values at all brain surface voxels were then assignedto the corresponding voxel location in the group averagesurface to create composite maps of brain surface contraction.
2.3. Statistical analysis
Individual brain surface contraction was annualized bydividing the contraction value in millimeters by the between-scan interval in years, and this surface contraction rate wastaken as the primary variable for the following statisticalanalyses. The contraction rate was used as a parsimoniouscontrol for different between-scan intervals among subjects,and should not be extrapolated beyond the range of thefollow-up period. T-tests were performed to compare surfacecontraction rates between the two UHR groups at each brainsurface points, and P-maps were generated. Standard permu-tation tests were conducted to confirm that the significantchanges were not purely by chance. We conducted 100,000randomized permutations (randomly assigning subjects togroups) in the frontal, parietal, occipital, and temporal lobes.Between-group differences were considered significant if lessthan 5% (pb0.05) of the results from all random permutationsexceeded the difference detected in the groupings. In addition,
Fig. 1. (Colored). Maps of average brain surface contraction rates and u
Please cite this article as: Sun, D., et al., Progressive brain struindividuals, Schizophr. Res. (2008), doi:10.1016/j.schres.2008.11.0
we compared the converters with the non-converters with nopsychiatric diagnoses at follow-up, using the same statisticalmethod as above.
3. Results
3.1. Between-group difference
Fig. 1 shows the average brain surface contraction rate(mm/year) both for individuals who converted to psychosisand individuals who did not convert and the maps ofstatistical significance (p values, uncorrected for multiple-voxel comparisons) in between-group comparison. In con-trast to the average rate of surface contraction in non-converters, the magnitude of which was less than 0.2 mm/year (upper row), the converters showed greater brain surfacecontraction in bilateral dorsolateral prefrontal regions, with amaximum magnitude of 0.4 mm/year (middle row). In thebetween-group comparison, prefrontal regions showed themost prominent difference. There was no major regionwhereconverters showed less contraction or greater expansion thannon-converters.
Using permutation tests with p-value at 0.05 as thepredefined threshold, the between-group difference in rightfrontal lobe remained significant (p=0.030), while thedifferences in left frontal lobe showed trends towards
ncorrected p-maps of converters vs. non-converters comparison.
ctural changes mapped as psychosis develops in ‘at risk’26
5D. Sun et al. / Schizophrenia Research xxx (2008) xxx–xxx
ARTICLE IN PRESS
significance (p=0.077). No significant results appeared inother regions of interest.
Compared to the 14 non-converters with no psychiatricdiagnoses, the converters also showed greater contractionrate in the prefrontal region, but with the smaller sample size,the difference was not significant in the permutation tests(Fig. 2).
3.2. Method validation
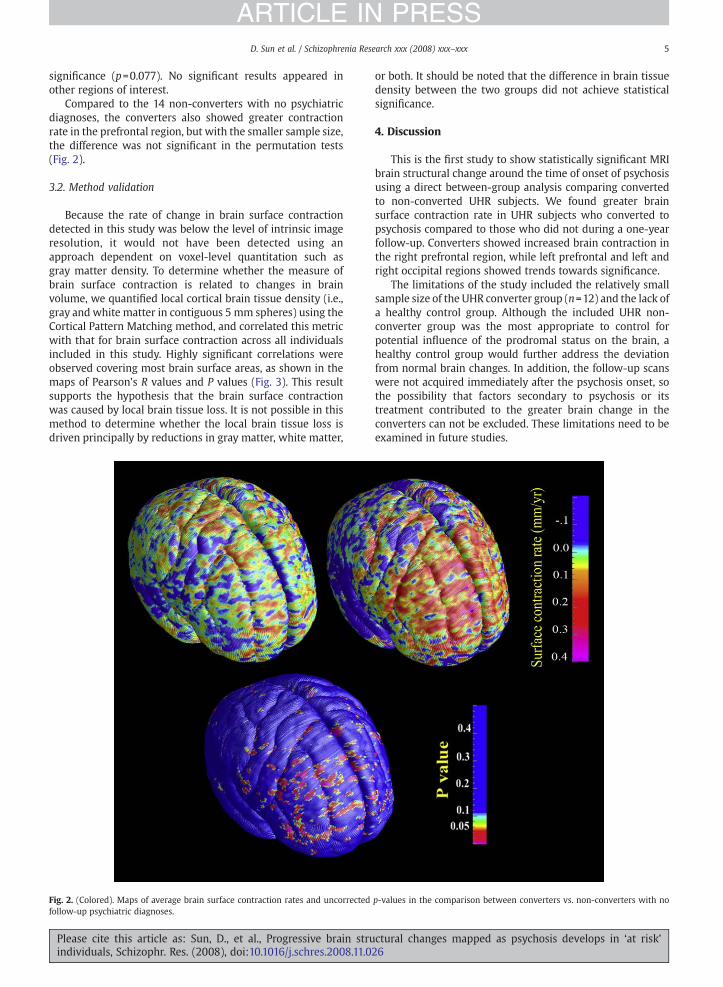
Because the rate of change in brain surface contractiondetected in this study was below the level of intrinsic imageresolution, it would not have been detected using anapproach dependent on voxel-level quantitation such asgray matter density. To determine whether the measure ofbrain surface contraction is related to changes in brainvolume, we quantified local cortical brain tissue density (i.e.,gray and white matter in contiguous 5 mm spheres) using theCortical Pattern Matching method, and correlated this metricwith that for brain surface contraction across all individualsincluded in this study. Highly significant correlations wereobserved covering most brain surface areas, as shown in themaps of Pearson’s R values and P values (Fig. 3). This resultsupports the hypothesis that the brain surface contractionwas caused by local brain tissue loss. It is not possible in thismethod to determine whether the local brain tissue loss isdriven principally by reductions in gray matter, white matter,
Fig. 2. (Colored). Maps of average brain surface contraction rates and uncorrectedfollow-up psychiatric diagnoses.
Please cite this article as: Sun, D., et al., Progressive brain struindividuals, Schizophr. Res. (2008), doi:10.1016/j.schres.2008.11.0
or both. It should be noted that the difference in brain tissuedensity between the two groups did not achieve statisticalsignificance.
4. Discussion
This is the first study to show statistically significant MRIbrain structural change around the time of onset of psychosisusing a direct between-group analysis comparing convertedto non-converted UHR subjects. We found greater brainsurface contraction rate in UHR subjects who converted topsychosis compared to those who did not during a one-yearfollow-up. Converters showed increased brain contraction inthe right prefrontal region, while left prefrontal and left andright occipital regions showed trends towards significance.
The limitations of the study included the relatively smallsample size of the UHR converter group (n=12) and the lack ofa healthy control group. Although the included UHR non-converter group was the most appropriate to control forpotential influence of the prodromal status on the brain, ahealthy control group would further address the deviationfrom normal brain changes. In addition, the follow-up scanswere not acquired immediately after the psychosis onset, sothe possibility that factors secondary to psychosis or itstreatment contributed to the greater brain change in theconverters can not be excluded. These limitations need to beexamined in future studies.
p-values in the comparison between converters vs. non-converters with no
ctural changes mapped as psychosis develops in ‘at risk’26
Fig. 3. (Colored). Maps of correlation between brain surface contraction and volume reduction of local brain tissue (n=35).
6 D. Sun et al. / Schizophrenia Research xxx (2008) xxx–xxx
ARTICLE IN PRESS
In a prior report using lower-resolution T2 and protondensity dual-echo image data on a subset of the subjects fromthis study, no significant differences were found in graymatter changes between converters and non-converters(Pantelis et al., 2003a). In the present study, additionalconverters and non-converters were involved in the compar-ison, in which higher resolution T1 scans were used, therebyproviding additional sensitivity and statistical power. Further,a new parameter of longitudinal brain change, brain surfacecontraction, with resolution at a sub-voxel level, was adopted,in contrast to the gray matter density analysis used in theprevious voxel-based morphometry analysis. In combinationwith the cortical pattern matching method, which provides aprecise brain surface registration across subjects, the surfacecontraction measurement showed an advantage in detectingsubtle changes. The maximum group-mean local brainsurface contraction rate was less than 0.3 mm/year, which iswithin one third of the image voxel size. Such a subtle changecould not be detected by any metric dependent on a voxel-level or coarser resolution, e.g., gray matter density. Themeasure of gray matter density also relies on the accuracy ofimage tissue classification, which can be confounded bypartial volume effects. Although in the prior study significantgraymatter reductionwas found for converters (but not in thecomparison between converters and non-converters) inseveral brain regions including the cingulate, parahippocam-pal gyrus, and the cerebellum, these regions were notexamined in this surface-based approach.
Although the mixed diagnoses of the converters at follow-up make it difficult to associate the observed changes with aparticular psychotic disorder, it is intriguing to note that theprogressive surface contraction in the prefrontal region is inlinewith findings on schizophrenia from several perspectives.
Please cite this article as: Sun, D., et al., Progressive brain struindividuals, Schizophr. Res. (2008), doi:10.1016/j.schres.2008.11.0
The prefrontal cortex is involved in working memory,executive function and other higher-order cognitive func-tions, all of which are impaired in schizophrenia, withevidence for such deficits in high-risk cohorts (Brewer et al.,2006). In postmortem neuropathological studies, the pre-frontal region shows increased neuronal packing (Selemonet al., 1995) and reduced dendritic spines (Glantz and Lewis2000) without significant decrease in neuronal number(Pakkenberg 1993). Defects in oligodendrocytes and myelinin the prefrontal region have also been reported in schizo-phrenia and in bipolar disorder (Tkachev et al., 2003). Corticalmapping in twins discordant for schizophrenia shows bothgenetic and disease-specific influences on graymatter deficitsin the prefrontal region (Cannon et al., 2002), and severalsusceptibility genes for schizophrenia have been found to beassociated with prefrontal structural or functional abnormal-ities (Cannon et al., 2005; Egan et al., 2001). In longitudinalMRI studies of schizophrenia, frontal volume reduction hasalso been found (Ho et al., 2003; Lieberman et al., 2005;Nakamura et al., 2007; Sun et al., 2008; van Haren et al.,2007). Non-schizophrenic psychotic disorders, includingaffective forms of psychosis, may share some susceptibilitygenes and underlying neuropathological features in commonwith schizophrenia (Craddock et al., 2006). Therefore, it isplausible that the prefrontal change is shared by schizo-phrenia and other psychotic disorders.
The observation of progressive brain tissue loss during theperiod of onset of psychosis is predicted by theories ofschizophrenia that emphasize involvement of abnormal neuro-developmental processes (Cannon et al., 2003; Feinberg 1982–83; Pantelis et al., 2003b;Woods 1998). For example, it has beensuggested that the onset of schizophrenia may be associatedwith an abnormal acceleration of the neuroregressive processes
ctural changes mapped as psychosis develops in ‘at risk’26

7D. Sun et al. / Schizophrenia Research xxx (2008) xxx–xxx
ARTICLE IN PRESS
that occur as part of normal brain development in adolescence,such as synaptic pruning. It is of interest in this regard that graymatter reduction in the region detected as showing differentialsurface contraction among the high-risk cases who convertedto psychosis (superior frontal gyrus) has been linked toschizophrenia-related sequence variations in the Disrupted-In-Schizophrenia-1 (DISC1) gene (Cannon et al., 2005), which isknown to regulate neurite outgrowth, synaptogenesis, andother aspects of brain growth and plasticity (Porteous et al.,2006).
By including non-converters who could not be differen-tiated from subjects who were pre-psychotic at intake as acomparison group, some identifiable trait or state factorsshared by these two cohorts were controlled for. These factorsinclude prodromal symptoms, recreational drug use, anddevelopmental brain changes that are normally occurringduring adolescence and early adulthood. However, thefollow-up scans were not acquired during or immediatelyafter the psychosis onset, so it is possible that factors sec-ondary to psychosis or its treatment contributed to the greaterbrain change in the converters.
Elevated levels of stress hormones have been considered asource of hippocampal volume reduction in depression andother psychiatric conditions, including schizophrenia (Phillipset al., 2006). In a recent study of a larger sample of the UHRsubjects, larger pituitary volumes were found in those whowere pre-psychotic, and this was associated with proximity totransition to illness (Garner et al., 2005), suggesting stress-related changes occur even prior to psychosis onset. Stressand other disease processes may interact to cause the brainstructural changes and the emergence/exacerbation of psy-chosis (Phillips et al., 2006). This is consistent with amultiple-hit model of psychosis (Pantelis et al., 2005), and hasimportant implications for the prevention and interventionof psychotic disorders.
While we cannot rule out an effect of antipsychoticmedications, drug treatment is not likely to be a major sourceof the observed changes. The results from primate studiesexamining antipsychotic effects on brain volume are conflict-ing. While one study showed proliferation of glial cells butnot neuronal density change following chronic antipsychoticdrug exposure (Selemon et al., 1999), another study reportedbrain weight loss and volume reduction in animals afterchronic exposure (Dorph-Petersen et al., 2005). Antipsychoticmedications have also been associated with brain volumechanges in human subjects. Typical and atypical drugs haveshown different effects in volumetric studies (Liebermanet al., 2005), with the latter being associated with less brainvolume reduction or even volume increase. In the presentstudy the majority of converted subjects received low-doserisperidone (an atypical antipsychotic drug) after onset ofpsychosis.
In summary, by using advanced methods optimized fordetecting subtle local surface contraction, we found signifi-cant prefrontal volume loss around the time of psychosisonset in a unique ultra-high-risk cohort. These findingsencourage further study to isolate the cellular and molecularmechanisms underlying the onset of a psychotic illness and todetermine whether such changes are differential in thedevelopmental course of different clinically defined syn-dromes involving psychotic symptoms.
Please cite this article as: Sun, D., et al., Progressive brain struindividuals, Schizophr. Res. (2008), doi:10.1016/j.schres.2008.11.0
Role of funding sourceThis research and the clinical research structure of PACE were supported
by project grants from the National Health & Medical Research Council(NHMRC; grant IDs: 145627, 145737, 970598, 981112, 970391), NHMRCProgram Grant (ID: 350241), Victorian Health Promotion Foundation, theStanley Foundation, and Ian Potter Foundation. Drs. Velakoulis and Woodwere supported as Research Officers with funding from the NHMRC.Dr. McGorry was supported by a NARSAD Distinguished Investigator Award.Dr. Wood is currently supported by a Clinical Career Development Awardfrom the NHMRC (ID: 359223) and a NARSAD Young Investigator Award.Dr. Thompson is supported by NIH grants AG016570, LM05639, EB01651, andRR019771. Image analysis and statistical analysis were supported by NIHgrants MH65078 to Dr. Cannon and GM072978 (Center for ComputationalBiology) to Dr. Toga.
The sponsors of the study had no role in the study design, collection,analysis, interpretation of data, writing of the report, and in the decision tosubmit the paper for publication.
ContributorsCannon, Sun, and Pantelis had full access to all of the data in the study
and take responsibility for the integrity of the data and the accuracy of thedata analysis; Pantelis, Velakoulis, Wood, Phillips, Yung, and McGorrydesigned the study; Yung, Phillips, McGorry, Pantelis, Velakoulis, and Woodacquired the data; Sun, Thompson, and van Erp undertook the statisticalanalysis; Sun, Cannon, Pantelis, Wood, Phillips, Yung, and McGorry analyzedand interpreted the data; Sun wrote the first draft of the manuscript; allauthors contributed to and have approved the final manuscript.
Conflict of interestAll authors report no competing interests.
AcknowledgementsThis research and the clinical research structure of PACE were supported
by project grants from the National Health & Medical Research Council(NHMRC; grant IDs: 145627, 145737, 970598, 981112, 970391), NHMRCProgram Grant (ID: 350241), Victorian Health Promotion Foundation, theStanley Foundation, and Ian Potter Foundation. Drs. Velakoulis and Woodwere supported as Research Officers with funding from the NHMRC.Dr. McGorry was supported by a NARSAD Distinguished Investigator Award.Dr. Wood is currently supported by a Clinical Career Development Awardfrom the NHMRC (ID: 359223) and a NARSAD Young Investigator Award.Dr. Thompson is supported by NIH grants AG016570, LM05639, EB01651, andRR019771. Image analysis and statistical analysis were supported by NIHgrants MH65078 to Dr. Cannon and GM072978 (Center for ComputationalBiology) to Dr. Toga.
References
Brewer, W.J., Wood, S.J., Phillips, L.J., Francey, S.M., Pantelis, C., Yung, A.R.,Cornblatt, B., McGorry, P.D., 2006. Generalised and specific cognitiveperformance in clinical high-risk cohorts: a review highlighting potentialvulnerability markers for psychosis. Schizophr. Bull. 32 (3), 538–555.
Cannon, T.D., Hennah,W., van Erp, T.G., Thompson, P.M., Lonnqvist, J., Huttunen,M., Gasperoni, T., Tuulio-Henriksson, A., Pirkola, T., Toga, A.W., Kaprio, J.,Mazziotta, J., Peltonen, L., 2005. Association ofDISC1/TRAXhaplotypeswithschizophrenia, reduced prefrontal gray matter, and impaired short- andlong-term memory. Arch. Gen. Psychiatry 62 (11), 1205–1213.
Cannon, T.D., Thompson, P.M., van Erp, T.G., Toga, A.W., Poutanen, V.P.,Huttunen, M., Lonnqvist, J., Standerskjold-Nordenstam, C.G., Narr, K.L.,Khaledy, M., Zoumalan, C.I., Dail, R., Kaprio, J., 2002. Cortex mappingreveals regionally specific patterns of genetic and disease-specific gray-matter deficits in twins discordant for schizophrenia. Proc. Natl. Acad.Sci. U. S. A. 99 (5), 3228–3233.
Cannon, T.D., van Erp, T.G., Bearden, C.E., Loewy, R., Thompson, P., Toga, A.W.,Huttunen, M.O., Keshavan, M.S., Seidman, L.J., Tsuang, M.T., 2003. Earlyand late neurodevelopmental influences in the prodrome to schizo-phrenia: contributions of genes, environment, and their interactions.Schizophr. Bull. 29 (4), 653–669.
Craddock, N., O'Donovan, M.C., Owen,M.J., 2006. Genes for schizophrenia andbipolar disorder? Implications for psychiatric nosology. Schizophr. Bull.32 (1), 9–16.
Dorph-Petersen, K.A., Pierri, J.N., Perel, J.M., Sun, Z., Sampson, A.R., Lewis, D.A.,2005. The influence of chronic exposure to antipsychotic medications onbrain size before and after tissue fixation: a comparison of haloperidol
ctural changes mapped as psychosis develops in ‘at risk’26

8 D. Sun et al. / Schizophrenia Research xxx (2008) xxx–xxx
ARTICLE IN PRESS
and olanzapine in macaque monkeys. Neuropsychopharmacology 30 (9),1649–1661.
Egan, M.F., Goldberg, T.E., Kolachana, B.S., Callicott, J.H., Mazzanti, C.M.,Straub, R.E., Goldman, D., Weinberger, D.R., 2001. Effect of COMT Val108/158 Met genotype on frontal lobe function and risk for schizophrenia.Proc. Natl. Acad. Sci. U. S. A. 98 (12), 6917–6922.
Feinberg, I., 1982. Schizophrenia: caused by a fault in programmed synapticelimination during adolescence? J. Psychiatr. Res. 17, 319–334.
Garner, B., Pariante, C.M., Wood, S.J., Velakoulis, D., Phillips, L., Soulsby, B.,Brewer, W.J., Smith, D.J., Dazzan, P., Berger, G.E., Yung, A.R., van denBuuse, M., Murray, R., McGorry, P.D., Pantelis, C., 2005. Pituitary volumepredicts future transition to psychosis in individuals at ultra-high risk ofdeveloping psychosis. Biol. Psychiatry 58 (5), 417–423.
Glantz, L.A., Lewis, D.A., 2000. Decreased dendritic spine density onprefrontal cortical pyramidal neurons in schizophrenia. Arch. Gen.Psychiatry 57 (1), 65–73.
Ho, B.C., Andreasen, N.C., Nopoulos, P., Arndt, S., Magnotta, V., Flaum, M.,2003. Progressive structural brain abnormalities and their relationship toclinical outcome: a longitudinal magnetic resonance imaging study earlyin schizophrenia. Arch. Gen. Psychiatry 60 (6), 585–594.
Job, D.E., Whalley, H.C., Johnstone, E.C., Lawrie, S.M., 2005. Grey matterchanges over time in high risk subjects developing schizophrenia.Neuroimage 25 (4), 1023–1030.
Lieberman, J.A., Tollefson, G.D., Charles, C., Zipursky, R., Sharma, T., Kahn, R.S.,Keefe, R.S., Green, A.I., Gur, R.E., McEvoy, J., Perkins, D., Hamer, R.M., Gu,H., Tohen, M., 2005. Antipsychotic drug effects on brain morphology infirst-episode psychosis. Arch. Gen. Psychiatry 62 (4), 361–370.
MacDonald, J.D., Kabani, N., Avis, D., Evans, A.C., 2000. Automated 3-Dextraction of inner and outer surfaces of cerebral cortex from MRI.Neuroimage 12 (3), 340–356.
Mathalon, D.H., Rapoport, J.L., Davis, K.L., Krystal, J.H., 2003. Neurotoxicity,neuroplasticity, and magnetic resonance imaging morphometry. Arch.Gen. Psychiatry 60, 846–848.
Mazziotta, J.C., Toga, A.W., Evans, A., Fox, P., Lancaster, J., 1995. A probabilisticatlas of the human brain: theory and rationale for its development TheInternational Consortium for Brain Mapping, (ICBM). Neuroimage 2 (2),89–101.
Nakamura, M., Salisbury, D.F., Hirayasu, Y., Bouix, S., Pohl, K.M., Yoshida, T.,Koo, M.S., Shenton, M.E., McCarley, R.W., 2007. Neocortical gray mattervolume in first-episode schizophrenia and first-episode affectivepsychosis: a cross-sectional and longitudinal MRI study. Biol. Psychiatry62 (7), 773–783.
Pakkenberg, B., 1993. Total nerve cell number in neocortex in chronicschizophrenics and controls estimated using optical disectors. Biol.Psychiatry 34 (11), 768–772.
Pantelis, C., Velakoulis, D., McGorry, P.D., Wood, S.J., Suckling, J., Phillips, L.J.,Yung, A.R., Bullmore, E.T., Brewer, W., Soulsby, B., Desmond, P., McGuire,P.K., 2003a. Neuroanatomical abnormalities before and after onset ofpsychosis: a cross-sectional and longitudinal MRI comparison. Lancet361 (9354), 281–288.
Pantelis, C., Yucel, M., Wood, S.J., McGorry, P.D., Velakoulis, D., 2003b. Earlyand late neurodevelopmental disturbances in schizophrenia and theirfunctional consequences. Aust. N. Z. J. Psychiatry 37 (4), 399–406.
Pantelis, C., Yucel,M.,Wood, S.J., Velakoulis, D., Sun, D., Berger, G., Stuart, G.W.,Yung, A., Phillips, L., McGorry, P.D., 2005. Structural brain imagingevidence for multiple pathological processes at different stages of braindevelopment in schizophrenia. Schizophr. Bull. 31 (3), 672–696.
Pantelis, C., Velakoulis, D.,Wood, S.J., Yucel, M., Yung, A.R., Phillips, L.J., Sun, D.Q.,McGorry, P.D., 2007. Neuroimaging and emerging psychotic disorders: theMelbourne ultra-high risk studies. Int. Rev. Psychiatry 19 (4), 371–381.
Please cite this article as: Sun, D., et al., Progressive brain struindividuals, Schizophr. Res. (2008), doi:10.1016/j.schres.2008.11.0
Phillips, L.J., McGorry, P.D., Garner, B., Thompson, K.N., Pantelis, C., Wood, S.J.,Berger, G., 2006. Stress, the hippocampus and the hypothalamic–pituitary–adrenal axis: implications for the development of psychoticdisorders. Aust. N. Z. J. Psychiatry 40 (9), 725–741.
Porteous, D.J., Thomson, P., Brandon, N.J., Millar, J.K., 2006. The genetics andbiology of DISC1—an emerging role in psychosis and cognition. Biol.Psychiatry 60, 123–131.
Salisbury, D.F., Kuroki, N., Kasai, K., Shenton, M.E., McCarley, R.W., 2007.Progressive and interrelated functional and structural evidence of post-onset brain reduction in schizophrenia. Arch. Gen. Psychiatry 64 (5),521–529.
Selemon, L.D., Rajkowska, G., Goldman-Rakic, P.S., 1995. Abnormally highneuronal density in the schizophrenic cortex. Amorphometric analysis ofprefrontal area 9 and occipital area 17. Arch. Gen. Psychiatry 52 (10),805–818 discussion 819–820.
Selemon, L.D., Lidow, M.S., Goldman-Rakic, P.S., 1999. Increased volume andglial density in primate prefrontal cortex associated with chronicantipsychotic drug exposure. Biol. Psychiatry 46 (2), 161–172.
Shenton, M.E., Dickey, C.C., Frumin, M., McCarley, R.W., 2001. A review of MRIfindings in schizophrenia. Schizophr. Res. 49 (1–2), 1–52.
Sowell, E.R., Thompson, P.M., Tessner, K.D., Toga, A.W., 2001. Mappingcontinued brain growth and gray matter density reduction in dorsalfrontal cortex: inverse relationships during postadolescent brainmaturation. J. Neurosci. 21 (22), 8819–8829.
Strakowski, S.M., Delbello, M.P., Adler, C.M., 2005. The functional neuroa-natomy of bipolar disorder: a review of neuroimaging findings. Mol.Psychiatry 10 (1), 105–116.
Sun, D., Stuart, G.W., Jenkinson, M., Wood, S.J., McGorry, P.D., Velakoulis, D.,van Erp, T.G., Thompson, P.M., Toga, A.W., Smith, D.J., Cannon, T.D.,Pantelis, C., 2008. Brain surface contraction mapped in first-episodeschizophrenia: a longitudinal magnetic resonance imaging study. Mol.Psychiatry, doi:10.1038/mp.2008.34 advance online publication 8 July.
Thompson, P.M., Hayashi, K.M., Sowell, E.R., Gogtay, N., Giedd, J.N., Rapoport,J.L., de Zubicaray, G.I., Janke, A.L., Rose, S.E., Semple, J., Doddrell, D.M.,Wang, Y., van Erp, T.G., Cannon, T.D., Toga, A.W., 2004. Mapping corticalchange in Alzheimer's disease, brain development, and schizophrenia.Neuroimage 23 (Suppl 1), S2–18.
Tkachev, D., Mimmack, M.L., Ryan, M.M., Wayland, M., Freeman, T., Jones, P.B.,Starkey, M., Webster, M.J., Yolken, R.H., Bahn, S., 2003. Oligodendrocytedysfunction in schizophrenia and bipolar disorder. Lancet 362 (9386),798–805.
van Haren, N.E., Hulshoff Pol, H.E., Schnack, H.G., Cahn, W., Mandl, R.C.,Collins, D.L., Evans, A.C., Kahn, R.S., 2007. Focal gray matter changes inschizophrenia across the course of the illness: a 5-year follow-up study.Neuropsychopharmacology 32 (10), 2057–2066.
Weinberger, D.R., McClure, R.K., 2002. Neurotoxicity, neuroplasticity, andmagnetic resonance imaging morphometry: what is happening in theschizophrenic brain? Arch. Gen. Psychiatry 59 (6), 553–558.
Woods, B.T., 1998. Is schizophrenia a progressive neurodevelopmentaldisorder? Toward a unitary pathogenetic mechanism. Am. J. Psychiatry155 (12), 1661–1670.
Yung, A., Phillips, L., McGorry, P.D., 2004. Treating Schizophrenia in theProdromal Phase. Taylor & Francis, London.
Yung, A.R., Phillips, L.J., Yuen, H.P., Francey, S.M., McFarlane, C.A., Hallgren, M.,McGorry, P.D., 2003. Psychosis prediction: 12-month follow up of a high-risk (“prodromal”) group. Schizophr. Res. 60 (1), 21–32.
ctural changes mapped as psychosis develops in ‘at risk’26
Copyright © 2022 FDOKUMEN