This document was withdrawn on 6 November 2017. - GOV.UK
322
Water resources and conservation: Assessing the eco-hydrological requirements of habitats and species understanding water for wildlife This document was withdrawn on 6 November 2017.
-
Upload
khangminh22 -
Category
Documents
-
view
2 -
download
0
Transcript of This document was withdrawn on 6 November 2017. - GOV.UK

Water resources and conservation: Assessingthe eco-hydrological requirements of habitatsand species
understandingwater for wildlife
This do
cumen
t was
with
drawn o
n 6 N
ovem
ber 2
017.

We are the Environment Agency. It’s our job to look after yourenvironment and make it a better place – for you, and forfuture generations.
Your environment is the air you breathe, the water you drinkand the ground you walk on. Working with business,Government and society as a whole, we are making yourenvironment cleaner and healthier.
The Environment Agency. Out there, making your environmenta better place.
Published by:
Environment Agency
Rio House
Waterside Drive, Aztec West
Almondsbury, Bristol BS32 4UD
Tel: 0870 8506506
Email: [email protected]
www.environment-agency.gov.uk
© Environment Agency
All rights reserved. This document may be reproduced with
prior permission of the Environment Agency.
April 2007
This do
cumen
t was
with
drawn o
n 6 N
ovem
ber 2
017.

Brief summary
1. Introduction
2. Species and habitats
2.2.1 Coastal and halophytic habitats
2.2.2 Freshwater habitats
2.2.3 Temperate heath, scrub and grasslands
2.2.4 Raised bogs, fens, mires, alluvial forests and bog woodland
2.3.1 Invertebrates
2.3.2 Fish and amphibians
2.3.3 Mammals
2.3.4 Plants
2.3.5 Birds
3. Hydro-ecological domains and hydrological regimes
4 Assessment methods
5. Case studies
6. References
7. Glossary of abbreviations
Contents
Contents
Environment Agency in partnership with Natural England and Countryside Council for Wales Understanding water for wildlife
This do
cumen
t was
with
drawn o
n 6 N
ovem
ber 2
017.

Brief summary
Brief summary
The Habitats Regulations (the UK law which enforces the Habitats Directive) requireus to undertake an appropriate assessment of new or existing consents, permissionsand other authorisations and evaluate effects on sites supporting habitats or specieslisted within the Habitats Directive. These sites are known as ‘European sites’ andtheir habitats or species are commonly referred to as ‘interest features’.
As part of PSA3 we are also investigating the impacts of abstraction on designatedSites of Special Scientific Interest (SSSIs). For this we have a target to bring into‘favourable condition’ 95 per cent of all SSSIs in England by 2010. The impacts ofabstraction on sites supporting Biodiversity Action Plan (BAP) species or habitats andother sites of local importance will also be investigated across England and Wales.
This document is mainly intended to inform staff undertaking or reviewingappropriate assessments for abstraction licences. The assessment of abstractionlicences is the responsibility of our Water Resources function who work very closelywith our other functions and Natural England or the Countryside Council for Waleswhen undertaking appropriate assessments. The document can also be used toinform other RSA investigations which do not have a Habitats Directive driver.
The document aims to provide:
• Up-to-date information on the hydrological needs and sensitivity of ecologicalfeatures considered to have fresh water resource requirements.
• A framework that can be used to structure and inform associated hydro-ecologicalassessments of conservation sites using a risk analysis approach based on thesource-pathway-receptor concept.
• Advice on decision making within the context of multi-functional (in-combination)assessments, together with outline information on the generic issues which may arise.
• Information on common methods (or techniques) frequently used to inform hydro-ecological assessments.
• Case examples of assessments.
The Restoring Sustainable Abstraction (RSA) Programme was setup by the Environment Agency in 1999 to identify and cataloguethose sites which may be at risk from unsustainable abstraction.The RSA Programme covers work required by the HabitatsDirective, Public Service Agreement PSA3, Biodiversity ActionPlans and undesignated sites of local importance.
Environment Agency in partnership with Natural England and Countryside Council for Wales Understanding water for wildlife
This do
cumen
t was
with
drawn o
n 6 N
ovem
ber 2
017.

1.1 Background
1.2 Purpose and scope
1.3 Document contents
1.4 How to use the document
Introduction1
< Main contents
This do
cumen
t was
with
drawn o
n 6 N
ovem
ber 2
017.

1.1 BackgroundThe Restoring Sustainable Abstraction (RSA)Programme was set up by the Environment Agency in1999 to identify and catalogue those sites which maybe at risk from unsustainable abstraction. The RSAProgramme is a way of prioritising and progressivelyexamining and resolving these concerns.
There are a number of pieces of legislation andGovernment policy that require the environmentaleffects of abstraction to be examined. The bulk of workwithin RSA is to investigate the impacts of abstractionon sites designated under the Habitats Directive (ECDirective on the Conservation of Natural Habitats andWild Fauna and Flora (Council Directive 92/43/EEC). InEngland we are also investigating the possible impactof abstraction on nationally designated Sites of SpecialScientific Interest (SSSI) as part of a Public ServiceAgreement (PSA). It may also be necessary to takeaction on other sites not designated under the Habitatsand Birds directives or as SSSIs.
The Conservation (Natural Habitats, &c.) Regulations,1994, (the Habitats Regulations), make provision forimplementing the Habitats Directive in Great Britain.The Regulations require us as a competent authority tocarry out an appropriate assessment prior to giving anyconsent, permission or other authorisation for a planor project that is likely to have a significant effect on aEuropean site. This extends to a review of existingpermissions and consents, as required underRegulations 48 and 50 of the Habitats Regulations. Theconclusion of an assessment should enable us toascertain whether or not there is an adverse effect onthe integrity of the site.
Public Service Agreements (PSA) are a contractbetween the Treasury and a Government department todeliver a number of performance targets. PSA 3 is aDefra target to bring into ‘favourable condition’ 95 percent of all nationally important wildlife sites (SSSIs) inEngland by 2010. Whilst this PSA target applies only toEngland, it will involve those sites which are wholly orpartly within the boundary of our Welsh region butwhich lie geographically within England.
This document has been commissioned by theEnvironment Agency in association with NaturalEngland and the Countryside Council for Wales (CCW).It aims to provide a framework to support, bothinternally and externally, the appropriate assessmentprocess and the review of existing consents, permits
and other authorisations. The focus of the guidance ison Water Resource functional issues and has beendesigned to provide information for both the review ofexisting abstraction licences and the determination ofnew abstraction licence applications that directly orindirectly affect European sites.
Although the document has principally been developedfor application to sites supporting species and habitatsof European importance, the approaches proposed areapplicable to other RSA sites and in the wider contextof assessing hydro-ecological impact. Consequently thedocument could be used when assessing the effects ofabstraction across a wide range of sites.
1.2 Purpose and scopeThis document has been written primarily for AgencyWater Resources and Conservation staff and NaturalEngland/CCW Conservation Officers involved in theappropriate assessment process. However it is hopedthat it may also prove useful to non-technicalstakeholders by providing support to the process. It provides a high level summary of background andsupporting information for those undertakingappropriate assessment or wishing to understand theprocess.
This is a ‘live’ document which is intended to beexpanded and updated as new information becomesavailable.
We recommend that you do not save any part of thisdocument but that you revisit the website to view thedocument as required. This ensures that you are usingthe most up to date version.
1.3 Document contentsInformation contained is as follows:
• Section 1 – Structure and how to use the document.• Section 2 – Summary information on the Water
Resource requirements of species and habitatsdesignated under the Habitats Directive withreference to other completed and on-going Research& Development.
• Section 3 – Provides a framework for linking speciesand habitats into a series of hydro-ecological‘domains’ (i.e. broad habitat classes) influenced byhydrological ‘regimes’ e.g. surface water,groundwater.
• Section 4 – Suggested approaches (also referred to
1. Introduction
Introduction 1.1 – 1.3
Environment Agency in partnership with Natural England and Countryside Council for Wales Understanding water for wildlife
< Section divider
This do
cumen
t was
with
drawn o
n 6 N
ovem
ber 2
017.

as techniques) giving background information onecological and hydrological tools and methodologiestogether with some advice on selection.
• Section 5 – Case studies showing how some of theapproaches have been applied in practice.
Information from Sections 2 and 3 can be used, asrequired, to help select the methods outlined inSection 4.
1.4 How to use the documentIt can be used in a variety of ways depending on theexperience of the user. More experienced staff familiarwith the techniques and issues involved may want touse it as a useful ‘toolbox’ of techniques and source ofreferences to further information. Less experiencedusers or non-technical readers may want to use it togain an overview of the different types of sites, andhow different features and hydro-ecological domainsrelate to each other.
The structure of the document is illustrateddiagrammatically in Figure 1.1. Appropriateassessment is primarily concerned with risk of impactto European features, so the source-pathway-receptormodel of risk assessment provides a useful basis forthe assessment.
Of fundamental importance is the vulnerability (orsensitivity) of the European features to changes in thefreshwater regime. In Section 2 summary information isprovided on the water resource requirements of 32habitats and 27 species listed in Annexes I and II ofthe Habitats Directive, and most likely to be impactedby freshwater changes. Requirements of SPA birdspecies listed in Annexes of the Birds Directive arecovered in a single summary.
The European features cannot be considered inisolation from the ecosystem in which they occur, socharacterisation and assessment of impacts shouldusually be carried out on the site as a whole. Section 3defines a series of hydro-ecological domains andsubdomains i.e. broad habitat classes used todescribe the ecohydrological environment in which thefeatures are most likely to be found. These domainsand sub-domains are not intended to create a newclassification system, but are proposed simply as aframework to set the features in context and enable anoverview of the hydrological processes that may beoperating at sites. Table 3.1 relates the Europeanfeatures to the domains and subdomains where theymay occur.
When characterising a site it is essential to understandwhich hydrological processes are operating aspathways by which impacts may occur. Tables 3.2 and3.3 relate the hydro-ecological domains to thehydrological regimes, that may be present.
There are a number of influences, or potential sources,which can impact a site and these may include:
• Agency consented activities, e.g. abstraction,discharges;
• Non-Agency consented activities, e.g. developmentplanning; and
• Non-consented activities, e.g. non licensedabstractions or diffuse pollution.
The impact of water abstractions has to be assessed interms of the ‘in-combination’ effect with otherabstractions as well as other consented activities, suchas consented effluent discharges. Due regard shouldalso be given to other influences on the site such assite management. Table 3.4 details the main influencesand through which hydrological regime they mayimpact upon a site.
Section 4 provides summary information on the mainmethods/techniques available to assist in carrying outappropriate assessment. These have been brokendown into five main groups:
• Baseline data;• Hydrological/hydrometric data;• Ecological data;• Tools for interpretation & site characterisation;• Tools for impact assessment.
Choice of method depends on a number of factors andthese are discussed in Section 4.3. Table 4.1 relatesavailable methods to the hydrological regimesoperating at the site. One of the factors that mayinfluence choice of method is the sensitivity ofindividual species within a particular domain and thisis recognised by the link from features to methodsshown in Figure 1.1.
Section 5 provides examples of case studies fordifferent domains and Table 5.2 shows which methodswere used when undertaking these various casestudies.
Introduction 1.4
Environment Agency in partnership with Natural England and Countryside Council for Wales Understanding water for wildlife
< Section divider
This do
cumen
t was
with
drawn o
n 6 N
ovem
ber 2
017.

Introduction: Fig. 1.1 Structure of document 1.4
Environment Agency in partnership with Natural England and Countryside Council for Wales Understanding water for wildlife
S2 Features
Case studies for different domains
ReceptorsTable 3.1
Table 3.2/3.3
Table 4.1
Table 5.1
Table 3.4
Pathways
Sources(influences)
S3 Hydro-ecologicaldomains
Methods/techniques
S3 Hydrologicalregimes
Fig 1.1 Structure of document
Finding your way around this PDFpublicationHyperlinks are used in this PDF publication to help youto get to the information you need more quickly. Theseare included in the main contents and section dividercontents pages and will show the hand icon whenyou scroll over them with your mouse. Click to activatethe links.
Hyperlinks are also positioned bottom left in the footerthroughout the document. These return you to thenearest section divider. There is also a hyperlink oneach section divider which can then be used to takeyou back to the main contents.
For exampleTo get to the Rutland Water case study:
In the main contents, click on ‘5. Case studies’.This will take you to section 5 divider and the fullsection contents. Click on ‘Rutland Water’.
As section 2 is a large section you can either click on‘2. Species and habitats’ in the main contents to takeyou to the section divider listing the full contents. Or click the sub section e.g ‘2.3.1 Invertebrates’ to take you straight to that sub section.
To return to the main contents in all cases:
Click ‘< Section divider’ in the footer to return to thenearest section dividerClick ‘< Main contents’ bottom left on the divider toreturn to the main contents page.
< Section divider
This do
cumen
t was
with
drawn o
n 6 N
ovem
ber 2
017.

2.1 Introduction
2.2 Guidance summary notes on the waterresource requirements of particularhabitats
2.2.1 Coastal and halophytic habitats
– Atlantic salt meadow (Glauco-Puccinellietalia maritimae)
– Estuaries
– Humid dune slacks
– Inland salt meadow
– Large shallow inlets and bays
– Mudflats and sandflats not covered byseawater at low tide
– Salicornia and other annuals colonisingmud and sand
– Spartina swards (Spartinion maritimae)
– Coastal lagoons
2.2.2 Freshwater habitats
– Natural dystrophic lakes and ponds
– Hard oligo-mesotrophic waters withbenthic vegetation of Chara spp
– Natural eutrophic lakes withMagnopotamion or Hydrocharition –type vegetation
– Oligotrophic to mesotrophic standingwaters with vegetation of theLittorelletea uniflorae and/or Isoëto-nanojuncetea
– Watercourses of plain to montanelevels with Ranunculion fluitantis andCallitricho-batrachion vegetation
– Oligotrophic waters containing very fewminerals of sandy plains (Littorelletaliauniflorae)
– Mediterranean temporary ponds
Species andhabitats2
2.2.3 Temperate heath, scrub and grasslands
– Molinia meadows on calcareous, peatyor clayey-silt-laden soils (Molinioncaeruleae)
– Northern atlantic wet heaths with Ericatetralix
– Lowland hay meadows (Alopecuruspratensis, Sanguisorba officinalis)
– Temperate atlantic wet heaths withErica ciliaris and Erica tetralix
2.2.4 Raised bogs, fens, mires, alluvial forestsand bog woodland
– Tilio-Acerion forests
– Alkaline fens and calcium richspringwater fed fens
– Alluvial forest with Alnus glutinosa andFraxinus excelsior (Alno-Padion, Alnionincanae, Salicion albae)
– Alpine pioneer formations of theCaricion bicoloris-atrofuscae
– Blanket bogs
– Bog woodlands
– Calcareous fens with Cladium mariscusand species of the Caricion davallianae
– Depressions on peat substrates of theRhynchosporion
– Petrifying springs with tufa formation(Cratoneurion)
– Raised bog (Ombrotrophic bog)
– Transition mires and quaking bogs
2.3 Guidance summary notes on the waterresource requirements of particularspecies
< Main contents
This do
cumen
t was
with
drawn o
n 6 N
ovem
ber 2
017.

2.3.1 Invertebrates
– Desmoulin’s whorl snail (Vertigomoulinsiana)
– Geyer’s whorl snail (Vertigo geyeri)
– Narrow-mouthed whorl snail (Vertigoangustior)
– Ramshorn snail (Anisus vorticulus)
– Round-mouthed whorl snail (Vertigogenesii)
– Freshwater pearl mussel (Margaritiferamargaritifera)
– Southern damselfly (Coenagrionmercuriale)
– White-clawed crayfish(Austropotamobius pallipes)
– Fisher’s estuarine moth (Gortyna boreliilunata)
– Marsh fritillary butterfly (Euphydryasaurinia)
2.3.2 Fish and amphibians
– Sea lamprey (Petromyzon marinus)
– Brook lamprey (Lampetra planeri)
– River lamprey (Lampetra fluviatilis)
– Allis shad (Alosa alosa)
– Twaite shad (Alosa fallax)
– Atlantic salmon (Salmo salar)
– Spined loach (Cobitis taenia)
– Bullhead (Cottus gobio)
– Great crested newt (Triturus cristatus)
Species andhabitats continued2
2.3.3 Mammals
– Barbastelle bat (Barbastellabarbastellus)
– Otter (Lutra lutra)
2.3.4 Plants
– Slender green-feather moss(Drepanocladus vernicosus)
– Petalwort (Petalophyllum ralfsii)
– Marsh saxifrage (Saxifraga hirculus)
– Creeping marshwort (Apium repens)
– Floating water plantain (Luroniumnatans)
– Fen orchid (Liparis loeselii)
– Shore dock (Rumex rupestris)
2.3.5 Birds
– SPA bird species
– Habitat descriptions
– Species descriptions
2.4 Eco-hydrological guidelines for lowlandwetland plant communities
2.5 Other sources of information
< Main contents
This do
cumen
t was
with
drawn o
n 6 N
ovem
ber 2
017.
Species and habitats Guidance notes – Habitats 2.1 – 2.2
Environment Agency in partnership with Natural England and Countryside Council for Wales Understanding water for wildlife
2.1 IntroductionA review has been carried out of present knowledge onthe specific hydrological (and in particular the freshwater resource) requirements for European designatedhabitats and species (known as interest features). Thespecies and habitats included within the review arethose that are found within cSACs and SPAs throughoutEngland and Wales.
The results of the review, are presented as a series ofhydro-ecological requirement summary sheets coveringthe likely water resource requirements for 31 habitatsand 28 species (not including birds which are coveredseparately). These habitats and species do notrepresent the full list of habitats and speciesdesignated but only comprise those identified ashaving some level of dependence on freshwater.
The summary sheets thus produced are intended toprovide a basic ecological description of each habitatand species identified which will be of use as a startingpoint but do not provide a comprehensive review of allavailable material. Where information is available,issues pertaining to their water resource requirementsare identified in addition to other parametersconsidered likely to have significant implications for thehealth or status of the interest feature. A list of keyreferences is identified within each note together withany known projects (either current or future) providingfurther research. The lists include many references tomore detailed sources such as the JNCC website andvarious LIFE projects.
Many of these interest features have hydro-ecologicalrequirements, which may also apply to a broad range ofspecies and/or habitats that may occur at the samesites. Consequently the information provided in thisdocument may be applied to a wider range of speciesand habitats than those listed. However, care must betaken when using the information in this way, andfurther advice should be sought from specialistconservation staff within the Agency, Natural Englandand CCW.
2. Species and habitats
Sections 2.2 includes the habitats summary sheets.
Section 2.3 includes the species summary sheets.
Section 2.4 makes reference to the report Eco-hydrological Guidelines for Lowland Wetland PlantCommunities which is available on the EnvironmentAgency website.
Section 2.5 highlights other R&D projects of particularrelevance to this manual.
2.2 Guidance summary notes on thewater resource requirementsof particular habitatsA series of hydro-ecological summary sheets has beenproduced for a range of habitats designated asEuropean interest features identified as having somelevel of dependence on freshwater. Each habitatsummary includes the following sub-sections:
• General information – provides background to thehabitat and its occurrence;
• A description which provides more detailedinformation on the community type;
• Key influences – examines the effects of waterquantity, water quality etc on the habitat;
• Current and future work – summarises key researchthat has recently been completed or is on-goingspecifically looking at the habitat being described;
• Key references – sets out a bibliography that can beused to gather further information if required.
Each summary sheet presents the most up-to-dateinformation currently available on the requirements ofeach habitat, and identifies areas where furtherresearch is required or is on-going. The user will be ableto interrogate these sheets to help build a conceptualunderstanding of the optimal hydrological conditionsfor the habitat and whether these allow favourableconditions to be achieved. It is envisaged that summarysheets will be periodically updated as researchimproves our understanding of the hydro-ecologicalrequirements of each habitat.
< Section divider
This do
cumen
t was
with
drawn o
n 6 N
ovem
ber 2
017.

2.2.1 Coastal andhalophytic habitatsThe following summary has been compiled using key reference papersprovided by Environment Agency, Natural England and CCW staff. It providesa summary of relevant information on the freshwater requirements of thedifferent coastal habitat types. For further information refer to referenceslisted in each summary.
– Atlantic salt meadow (Glauco-Puccinellietalia maritimae)
– Estuaries
– Humid dune slacks
– Inland salt meadow
– Large shallow inlets and bays
– Mudflats and sandflats not covered by seawater at low tide
– Salicornia and other annuals colonising mud and sand
– Spartina swards (Spartinion maritimae)
– Coastal lagoons
Species and habitats Guidance notes – Habitats Coastal and halophytic habitats 2.2.1
Environment Agency in partnership with Natural England and Countryside Council for Wales Understanding water for wildlife
< Section divider
This do
cumen
t was
with
drawn o
n 6 N
ovem
ber 2
017.
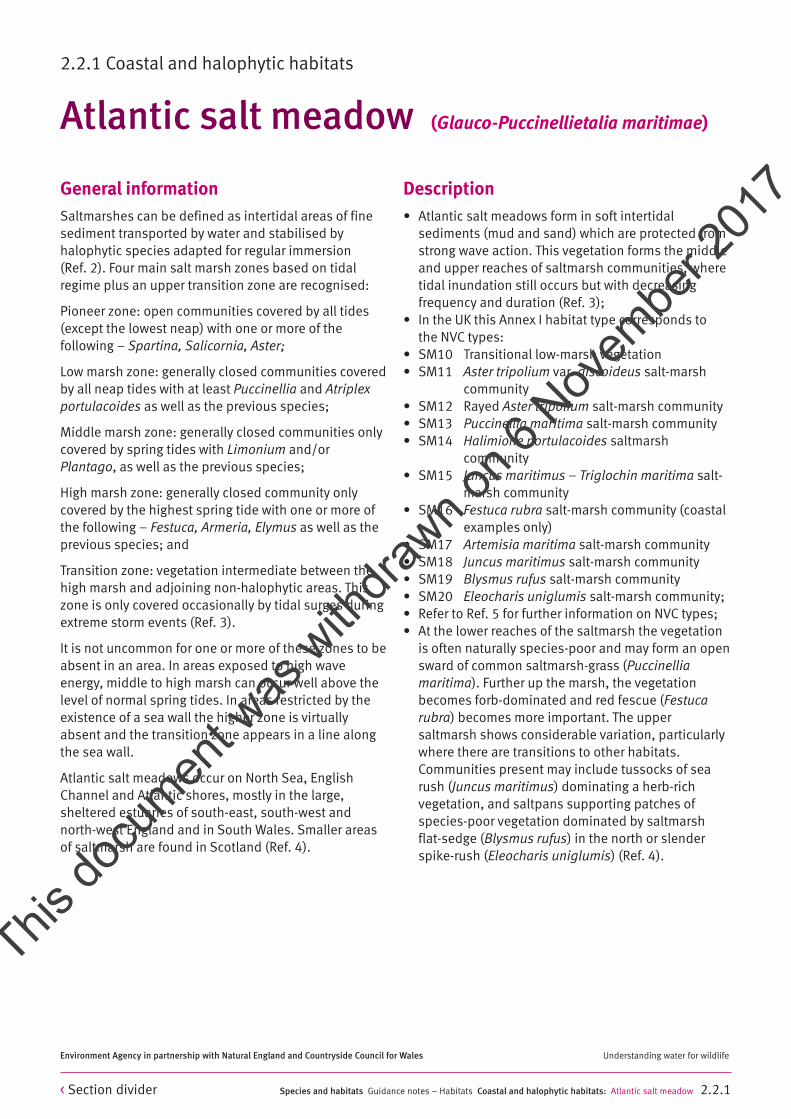
General informationSaltmarshes can be defined as intertidal areas of finesediment transported by water and stabilised byhalophytic species adapted for regular immersion (Ref. 2). Four main salt marsh zones based on tidalregime plus an upper transition zone are recognised:
Pioneer zone: open communities covered by all tides(except the lowest neap) with one or more of thefollowing – Spartina, Salicornia, Aster;
Low marsh zone: generally closed communities coveredby all neap tides with at least Puccinellia and Atriplexportulacoides as well as the previous species;
Middle marsh zone: generally closed communities onlycovered by spring tides with Limonium and/orPlantago, as well as the previous species;
High marsh zone: generally closed community onlycovered by the highest spring tide with one or more ofthe following – Festuca, Armeria, Elymus as well as theprevious species; and
Transition zone: vegetation intermediate between thehigh marsh and adjoining non-halophytic areas. Thiszone is only covered occasionally by tidal surges duringextreme storm events (Ref. 3).
It is not uncommon for one or more of these zones to beabsent in an area. In areas exposed to high waveenergy, middle to high marsh can occur well above thelevel of normal spring tides. In areas restricted by theexistence of a sea wall the higher zone is virtuallyabsent and the transition zone appears in a line alongthe sea wall.
Atlantic salt meadows occur on North Sea, EnglishChannel and Atlantic shores, mostly in the large,sheltered estuaries of south-east, south-west andnorth-west England and in South Wales. Smaller areasof saltmarsh are found in Scotland (Ref. 4).
Description• Atlantic salt meadows form in soft intertidal
sediments (mud and sand) which are protected fromstrong wave action. This vegetation forms the middleand upper reaches of saltmarsh communities, wheretidal inundation still occurs but with decreasingfrequency and duration (Ref. 3);
• In the UK this Annex I habitat type corresponds to the NVC types:
• SM10 Transitional low-marsh vegetation• SM11 Aster tripolium var. discoideus salt-marsh
community• SM12 Rayed Aster tripolium salt-marsh community• SM13 Puccinellia maritima salt-marsh community• SM14 Halimione portulacoides saltmarsh
community• SM15 Juncus maritimus – Triglochin maritima salt-
marsh community• SM16 Festuca rubra salt-marsh community (coastal
examples only)• SM17 Artemisia maritima salt-marsh community• SM18 Juncus maritimus salt-marsh community• SM19 Blysmus rufus salt-marsh community• SM20 Eleocharis uniglumis salt-marsh community;• Refer to Ref. 5 for further information on NVC types;• At the lower reaches of the saltmarsh the vegetation
is often naturally species-poor and may form an opensward of common saltmarsh-grass (Puccinelliamaritima). Further up the marsh, the vegetationbecomes forb-dominated and red fescue (Festucarubra) becomes more important. The uppersaltmarsh shows considerable variation, particularlywhere there are transitions to other habitats.Communities present may include tussocks of searush (Juncus maritimus) dominating a herb-richvegetation, and saltpans supporting patches ofspecies-poor vegetation dominated by saltmarshflat-sedge (Blysmus rufus) in the north or slenderspike-rush (Eleocharis uniglumis) (Ref. 4).
Species and habitats Guidance notes – Habitats Coastal and halophytic habitats: Atlantic salt meadow 2.2.1
Environment Agency in partnership with Natural England and Countryside Council for Wales Understanding water for wildlife
Atlantic salt meadow (Glauco-Puccinellietalia maritimae)
2.2.1 Coastal and halophytic habitats
< Section divider
This do
cumen
t was
with
drawn o
n 6 N
ovem
ber 2
017.

Key influencesWater resources• Saltmarsh flora communities are dominated by
halophytic species. Freshwater influences are likelyto be of localised importance (Ref. 9);
• The herb component of Atlantic salt meadow mayrequire freshwater inputs to encourage diversity. Atthe local scale it is possible that freshwater inputsmay affect species spatial distribution and diversity,although this is likely to be restricted to the areaimmediately surrounding the input, due to dilutionwith marine water (Ref. 9); and
• Further assessment is required to ascertain thefreshwater requirements and their significance forAtlantic salt meadow.
Other influences• Coastal processes are considered the principle
influence on saltmarsh. Such processes affect theheight of sediments in relation to sea levels andsalinity, which in turn affects species compositionand distribution (Ref. 9);
• Many saltmarsh areas have been lost as a result ofland reclaim for agricultural purposes.Anthropogenic influences on this habitat typeinclude waste tipping, drowning by barrageconstruction, recreational pressures, oil pollutionand eutrophication (caused by sewage effluent andagricultural run-off); and
• Many of the issues such as grazing, turf cutting andalteration to freshwater inputs are not considered toaffect pioneer communities, but may have significantimplications for mid to high salt marsh zones (Ref. 3).
Current and future workJNCC and EHSNI have completed a saltmarsh review in2002. Details on all aspects of saltmarsh and theirmanagement are included. Refer to Ref. 3.
Hydrological reviews for a number of SACs have beenundertaken by Entec. These reports provide adiscussion on considerations for particular sites, andalthough site specific, provide useful information forthe assessment of impacts on this habitat type.
Species and habitats Guidance notes – Habitats Coastal and halophytic habitats: Atlantic salt meadow 2.2.1
Environment Agency in partnership with Natural England and Countryside Council for Wales Understanding water for wildlife
< Section divider
This do
cumen
t was
with
drawn o
n 6 N
ovem
ber 2
017.

Key referencesGeneral description1. Allen, J. R. L. and Pye, K. (1992). Salt Marshes: Morphodynamics, Conservation and Engineering Significance.Cambridge University Press, Cambridge.
2. Boorman, L.A. (1995). ‘Sea level rise and the future of the British coast’. Coastal Zone Topics: Process, Ecologyand Management; 1: 10-13.
3. JNCC & EHSNI (2002). Saltmarsh Review: An overview of coastal salt marshes, their dynamic and sensitivitycharacteristics for conservation and management. L.A. Boorman, JNCC and EHSNI, Peterborough.
4. McLeod, CR, Yeo, M, Brown, AE, Burn, AJ, Hopkins, JJ, & Way, SF (eds.) (2002). The Habitats Directive: selectionof Special Areas of Conservation in the UK. 2nd edn. Joint Nature Conservation Committee, Peterborough.www.jncc.gov.uk/SACselection
5. Rodwell, J. S. (ed) (1991). British Plant Communities: Maritime communities and vegetation of open habitats:Volume 5. Joint Nature Conservation Committee. Cambridge University Press, Cambridge.
6. Stump, R.J. (1983). ‘The process of sedimentation on the surface of a salt marsh’.
Estuarine, Coastal and Shelf Science; 17:495-508.
7. UK Biodiversity Group. (1999). Tranche 2 Action Plans: Volume V Maritime Species and Habitats. English Nature,Peterborough.
Site specific studies8. Betts, S. & Lawson, R. (2002). Hydro-ecological Review of Selected European Sites within the Agency’s AnglianRegion: Blackwater Estuary SPA/cSAC/ SSSI. Entec Ltd, Newcastle.
9. Green, C. & Robson, G. (2002). Hydro-ecological Review of Selected European Sites within the Agency’s AnglianRegion: Alde-Ore SSSI. Entec Ltd, Newcastle.
10. Green, C. & Robson, G. (2002). Hydro-ecological Review of Selected European Sites within the Agency’s AnglianRegion: Foulness SSSI. Entec Ltd, Newcastle.
Supporting references11. Brooke, J., Landin, M., Meakins, N. & Adnitt, C. (1999). The Restoration of Vegetation on Saltmarshes. Researchand Development Technical Report W208. Environment Agency, Bristol.
Consideration of birds12. Ravenscroft, N.O.M. (1998). Associations of wintering waterfowl with freshwater on the mudflats of EastAnglian estuaries. Report to the Environment Agency, English Nature and Suffolk Wildlife Trust.
13. Ravenscroft, N.O.M., Beardhall, C.H., Cottle, R., Willett, P. & Wright, M.T. (1997). The distribution of winteringwaterfowl around freshwater flows over the mudflats of the Orwell Estuary, England. Report to the EnvironmentAgency and English Nature.
Other Annex I habitats to be considered with Atlantic salt meadow are, spartina swards, mudflats and sandflatsnot covered by seawater at low tide, coastal lagoons, temperate atlantic wet heath with Erica ciliaris and Ericatetralix and also estuaries.
Species and habitats Guidance notes – Habitats Coastal and halophytic habitats: Atlantic salt meadow 2.2.1
Environment Agency in partnership with Natural England and Countryside Council for Wales Understanding water for wildlife
< Section divider
This do
cumen
t was
with
drawn o
n 6 N
ovem
ber 2
017.
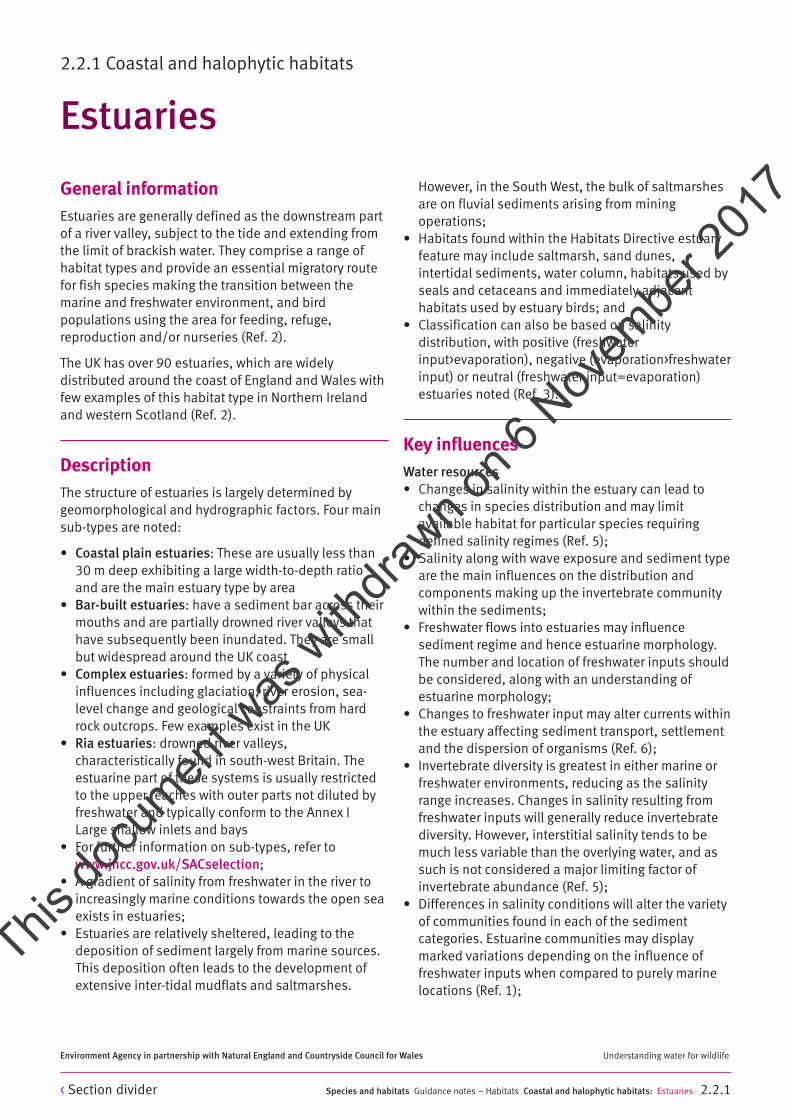
General informationEstuaries are generally defined as the downstream partof a river valley, subject to the tide and extending fromthe limit of brackish water. They comprise a range ofhabitat types and provide an essential migratory routefor fish species making the transition between themarine and freshwater environment, and birdpopulations using the area for feeding, refuge,reproduction and/or nurseries (Ref. 2).
The UK has over 90 estuaries, which are widelydistributed around the coast of England and Wales withfew examples of this habitat type in Northern Irelandand western Scotland (Ref. 2).
DescriptionThe structure of estuaries is largely determined bygeomorphological and hydrographic factors. Four mainsub-types are noted:
• Coastal plain estuaries: These are usually less than30 m deep exhibiting a large width-to-depth ratioand are the main estuary type by area
• Bar-built estuaries: have a sediment bar across theirmouths and are partially drowned river valleys thathave subsequently been inundated. They are smallbut widespread around the UK coast
• Complex estuaries: formed by a variety of physicalinfluences including glaciation, river erosion, sea-level change and geological constraints from hardrock outcrops. Few examples exist in the UK
• Ria estuaries: drowned river valleys,characteristically found in south-west Britain. Theestuarine part of these systems is usually restrictedto the upper reaches with outer parts not diluted byfreshwater and typically conform to the Annex I Large shallow inlets and bays
• For further information on sub-types, refer towww.jncc.gov.uk/SACselection;
• A gradient of salinity from freshwater in the river toincreasingly marine conditions towards the open seaexists in estuaries;
• Estuaries are relatively sheltered, leading to thedeposition of sediment largely from marine sources.This deposition often leads to the development ofextensive inter-tidal mudflats and saltmarshes.
However, in the South West, the bulk of saltmarshesare on fluvial sediments arising from miningoperations;
• Habitats found within the Habitats Directive estuaryfeature may include saltmarsh, sand dunes,intertidal sediments, water column, habitats used byseals and cetaceans and immediately adjacenthabitats used by estuary birds; and
• Classification can also be based on salinitydistribution, with positive (freshwaterinput>evaporation), negative (evaporation>freshwaterinput) or neutral (freshwater input=evaporation)estuaries noted (Ref. 3).
Key influencesWater resources• Changes in salinity within the estuary can lead to
changes in species distribution and may limitavailable habitat for particular species requiringdefined salinity regimes (Ref. 5);
• Salinity along with wave exposure and sediment typeare the main influences on the distribution andcomponents making up the invertebrate communitywithin the sediments;
• Freshwater flows into estuaries may influencesediment regime and hence estuarine morphology.The number and location of freshwater inputs shouldbe considered, along with an understanding ofestuarine morphology;
• Changes to freshwater input may alter currents withinthe estuary affecting sediment transport, settlementand the dispersion of organisms (Ref. 6);
• Invertebrate diversity is greatest in either marine orfreshwater environments, reducing as the salinityrange increases. Changes in salinity resulting fromfreshwater inputs will generally reduce invertebratediversity. However, interstitial salinity tends to bemuch less variable than the overlying water, and assuch is not considered a major limiting factor ofinvertebrate abundance (Ref. 5);
• Differences in salinity conditions will alter the varietyof communities found in each of the sedimentcategories. Estuarine communities may displaymarked variations depending on the influence offreshwater inputs when compared to purely marinelocations (Ref. 1);
Species and habitats Guidance notes – Habitats Coastal and halophytic habitats: Estuaries 2.2.1
Environment Agency in partnership with Natural England and Countryside Council for Wales Understanding water for wildlife
Estuaries
2.2.1 Coastal and halophytic habitats
< Section divider
This do
cumen
t was
with
drawn o
n 6 N
ovem
ber 2
017.

• Freshwater inputs may be considered important forbird utilisation of this habitat, although it is not yetclear. It is possible that birds do rely on freshwaterinputs for preening and drinking, and as such theseinputs are important for the development of localniches (Ref. 9 & 10); and
• There is also evidence of a link between freshwaterflows to estuaries and the ability of migratory fish tonavigate their way upstream.
Other influences• Other environmental parameters to which the biota
of estuaries are sensitive include hydrographicalchanges and water activity (i.e. storm events) andtidal elevation change (e.g. sea level rise);
• Changes to the hydrographic regime are ofconsiderable importance to the physical, chemicaland biological integrity of estuaries. Such changesmay alter the sedimentary regime, which may impacton the sediment health, the nature of infaunalcommunities present and consequently its use bypredators (Ref. 1). Storm events can also result in the‘scouring’ of benthic communities, causingreductions in biomass. Generally, the determiningfactors affecting such habitats are wave, current andwind action;
• Disruption of sediment supply from marine andcoastal sources can adversely affect the sedimentbudget of muddy estuaries, or reduce the inputof sand, which often predominates at the mouth of estuaries;
• For details on the sensitivity of particular specieswithin estuarine habitats, refer to www.marlin.ac.uk;and
• Anthropogenic activities known to have an impact onthe estuary feature include:– Land reclamation activities;– Coastal squeeze caused by hard defence
structures preventing landward migration ofintertidal sediments;
– Barrages (amenity, storm-surge and tidal energy);– Organic enrichment;– Industrial and domestic effluent discharge;– Oil spills and tanker accidents; – Sea-level rise; and– Recreation (including bait digging);– Dredging; and– Introduction of non-native species (Ref. 1).
Current and future workHydrological reviews for a number of SACs have beenundertaken by Entec. These reports provide adiscussion on considerations for particular sites, andalthough site specific, provide useful information forthe assessment of impacts on this habitat type. A substantial amount of work has also been undertakenby the Severn Estuary Partnership Group.
A complete list of all projects commissioned onestuarine topics can be obtained from the HabitatsDirective Estuaries Co-ordinator.
Consult the MarLIN website for work recently completed(and ongoing) on sensitivities of marine habitat:(www.marlin.ac.uk/Bio_pages/Bio_Scripts/Habitats_info_intro.htm).
Species and habitats Guidance notes – Habitats Coastal and halophytic habitats: Estuaries 2.2.1
Environment Agency in partnership with Natural England and Countryside Council for Wales Understanding water for wildlife
< Section divider
This do
cumen
t was
with
drawn o
n 6 N
ovem
ber 2
017.

Key referencesGeneral description1. Elliot, M., Nedwell., S., Jones, N. V., Read, S. J., Cutts, N. D & Hemingway, K. L. (1998). Intertidal sand andmudflats & subtidal mobile sandbanks: An overview of dynamic and sensitivity characteristics for conservationmanagement of marine SACs (volume II). Scottish Association for Marine Science (UK Marine SACs Project).
2. McLeod, CR, Yeo, M, Brown, AE, Burn, AJ, Hopkins, JJ, & Way, SF (eds.) (2002) The Habitats Directive: selection ofSpecial Areas of Conservation in the UK. 2nd edn. Joint Nature Conservation Committee, Peterborough.www.jncc.gov.uk/SACselection
3. McLusky, D.S. (1989). The Estuarine Ecosystem. Blackie, Glasgow.
4. Rodwell J. S. (ed) (1991). British Plant Communities: Maritime communities and vegetation of open habitats:Volume 5. Joint Nature Conservation Committee. Cambridge University Press, Cambridge.
Site specific studies5. Betts, S. & Lawson, R. (2002). Hydro-ecological Review of Selected European Sites within the Agency’s AnglianRegion: Blackwater Estuary SPA/cSAC/ SSSI. Entec Ltd, Newcastle.
6. Green, C. & Robson, G. (2002a). Hydro-ecological Review of Selected European Sites within the Agency’s AnglianRegion: Foulness SSSI. Entec Ltd, Newcastle.
7. Green, C. & Robson, G. (2002b). Hydro-ecological Review of Selected European Sites within the Agency’s AnglianRegion: Alde-Ore Estuary SSSI. Entec Ltd, Newcastle.
8. Green, C. & Robson, G. (2001). Hydro-ecological Review of Selected European Sites within the Agency’s AnglianRegion: Dengie SSSI. Entec Ltd, Newcastle.
Supporting referencesConsideration of birds utilising the estuary9. Ravenscroft, N. O. M. (1998). Associations of wintering waterfowl with freshwater on the mudflats of East Anglianestuaries. Report to the Environment Agency, English Nature and Suffolk Wildlife Trust.
10. Ravenscroft, N.O.M., Beardhall, C.H., Cottle, R., Willett, P. & Wright, M.T. (1997). The distribution of winteringwaterfowl around freshwater flows over the mudflats of the Orwell Estuary, England. Report to the EnvironmentAgency and English Nature.
Annex I habitats to be considered with estuaries are mudflats and sandflats not covered by seawater at low tide,large shallow inlets and bays, salicornia and other annuals colonising mud and sand, spartina swards and Atlanticsalt meadows. The Annex II species that should be considered are the allis shad (Alosa alosa), twaite shad (Alosaalosa), river lamprey (Lampetra fluviatilis), sea lamprey (Petromyzon marinus) and atlantic salmon (Salmo salar).
Species and habitats Guidance notes – Habitats Coastal and halophytic habitats: Estuaries 2.2.1
Environment Agency in partnership with Natural England and Countryside Council for Wales Understanding water for wildlife
< Section divider
This do
cumen
t was
with
drawn o
n 6 N
ovem
ber 2
017.

General informationDune slacks are low-lying areas within dune systemsthat are seasonally flooded. They occur primarily on thelarger dune systems in the UK, particularly in the westand north where the wetter climate favours theirdevelopment. The range of communities found inhumid dune slacks is considerable and dependent onthe structure of the dune system, its successionalstage, the chemical composition of the dune sand, andthe prevailing climatic conditions (Ref. 3).
Owing to the cool wet climate of the UK, humid duneslacks are a prominent feature of dunes in the UK. Duneslacks are widespread but local in the UK and thehabitat type exhibits considerable ecological variation(Ref. 4).
Description• Humid dune slacks occur on calcareous sand where
vegetation is similar to that of small sedge mires(mires with low-growing sedges), or on acidic duneswhere the vegetation may have affinities to wet heath(Ref. 6);
• Slacks usually have a free-draining shingle base or adamp sand base (Ref. 4);
• Nutrient levels of soils are normally low and calciumcontent high (Ref. 8);
• Creeping willow is often found in dune slackvegetation and the boundaries between humid duneslacks and dunes with Salix repens ssp. argentea areoften diffuse and difficult to define on the ground.Sites where creeping willow is dominant areexcluded from the dune slack habitat type (Ref. 3);
• In the UK, humid dune slacks are represented by theNVC types:– SD13 Sagina nodosa – Bryum pseudotriquetrum
dune-slack community– SD14 Salix repens – Campylium stellatum dune-
slack community– SD15 Salix repens – Calliergon cuspidatum
dune-slack community– SD16 Salix repens – Holcus lanatus dune-slack
community– SD17 Potentilla anserina – Carex nigra dune-
slack community• Refer to Rodwell (1991) for further information on
NVC types;
• Dune slacks are often rich in plant species. Flora ischiefly composed of marsh plants commonly foundoutside the dune system, with very few speciesconfined to the dune slack habitat. Notable speciesfound include the fen orchid (Liparis loeselli),petalwort (Petalophyllum ralfsii) and shore dock(Rumex rupestris) (Ref. 3);
• Species within dune slacks show extrememorphological modifications in response to excess ordeficiency of water. The lower limit of many species iscontrolled by submergence, though precisely how, isnot known (Ref. 6);
• Coastal slacks are considered transient features,liable to sea water flooding or to obliteration by thegrowth of embryo dunes (Ref. 6); and
• A range of other wetland types, in particular swamp,mire and tall herb fen communities occur on somedunes. These communities are not confined to dunes,although they comprise an important part of themosaic of vegetation characteristic of dune slack(Ref. 3).
Key influencesWater resources• True dune slacks are predominantly fed by rain water.
They are characterised by a pattern of pronouncedannual water table fluctuations related to thelandform of the dune system, climate, and the natureof the underlying sediment (Ref. 6);
• The maintenance of suitable hydrological conditionsis considered essential to the survival of this habitattype. Variations in the extent and duration of floodingof the dune surface are deemed very important indetermining species composition and structure ofdune slack vegetation. Such conditions can alsoinfluence the breeding of aquatic species, includingthe rare natterjack toad (Bufo calamita) (Ref. 2);
• The distribution of a number of species within duneslacks is critically related to the mean water table level(Van der Lann 1979 as cited in Jones (1993)). Somedune slack species are adapted to changes in theduration and depth of flooding, with a number noted tomigrate up and down a height gradient in dune slacksin response to wet and dry period. Bog pimpernel(Anagallis tenella), jointed rush (Juncus articulatus) andlesser spear-wort (Ranunculis flammula) are allconfined to wet sites subject to flooding while marram
Species and habitats Guidance notes – Habitats Coastal and halophytic habitats: Humid dune slacks 2.2.1
Environment Agency in partnership with Natural England and Countryside Council for Wales Understanding water for wildlife
Humid dune slacks
2.2.1 Coastal and halophytic habitats
< Section divider
This do
cumen
t was
with
drawn o
n 6 N
ovem
ber 2
017.

(Ammophila arenaria) and restharrow (Ononis repens)are almost always found on ground above the level ofthe water table (Ref. 2 & 4);
• Slacks at the seaward edge and centre of a dunesystem aquifer typically exhibit a large annualgroundwater range, whilst slacks adjacent topermanent water bodies or areas at the centre oflarge parabolic slacks demonstrate much reducedranges, which may amount to 50% of the maximum(Ref. 2);
• The vegetation of wet slacks (SD14 and SD17) isconsidered groundwater dependent. Thegroundwater table rarely falls more than 1.2 m belowthe soil surface in well-developed slacks, with winterflooding from 0.1 to 0.5 m in depth. The rooting zoneis rarely out of contact with the capillary fringe of thewater table, and moderately low redox potentialsmay develop during the early summer months (Ref.2, 6 & 8);
• The water table of dry slacks (SD16) may rangebetween 0.5 and 2.0 m below the ground surfaceduring the summer months, with soil profiles out ofcapillary contact with the water table throughout thegrowing season. Winter flooding only occursexceptionally, and is usually short in duration (Ref. 2& 6);
• The effects of an increase in the average water tablelevel are difficult to predict, and it is not possible toseparate the ecological effects of an increasednutrient load from an increase in mean groundwaterlevel (Ref. 2); and
• Human interference of the natural groundwaterregime of British coastal dunes is not consideredlarge scale, with upland catchments, deepgroundwater abstraction and reservoirs meetingwater resource needs (Ref. 2).
Other influences• Dune slacks are dynamic features. The continued
creation of new dune slacks, often from blowouts, isconsidered highly desirable in order to maintain thecommunities characteristic of the early successionalstages of dune development (Ref. 4);
• Other factors likely to affect the health and status ofhumid dune slacks include loss through urban andindustrial development, sea defence andstabilisation, waste disposal and military defenceusage (Ref. 4);
• Additions of nitrogen, phosphorus and potassiumwill lead to striking changes in the vegetation (Ref. 9);
• Severe grazing by rabbits will degrade humid duneslack habitats and reduce diversity (Ref. 8); and
• The effect of a global rise in sea level on naturalhydrological processes in dune systems may haveimplications for dune stability (Ref. 4).
Current and future workEnglish Nature (now Natural England) published areport in 2006 on the eco-hydrological guidelines ofdune habitats (Ref. 1).
Species and habitats Guidance notes – Habitats Coastal and halophytic habitats: Humid dune slacks 2.2.1
Environment Agency in partnership with Natural England and Countryside Council for Wales Understanding water for wildlife
< Section divider
This do
cumen
t was
with
drawn o
n 6 N
ovem
ber 2
017.
Key referencesGeneral description1. Davy A.J., Grootjans A.P. Hiscock K. and Petersen J. 2006 Development of eco-hydrological guidelines for dunehabitats-phase 1. English Nature Report 696. Available: http://www.english-nature.org.uk/pubs/publication/PDF/696.pdf
2. Jones, P. S. (1993). ‘The importance of hydrological processes in sand dune ecosystems’ in The Dunes of theSefton Coast. D. Atkinson & J. Houston (ed). National Museum and Galleries, Merseyside.
3. McLeod, CR, Yeo, M, Brown, AE, Burn, AJ, Hopkins, JJ, & Way, SF (eds.) (2002). The Habitats Directive: selectionof Special Areas of Conservation in the UK. 2nd edn. Joint Nature Conservation Committee, Peterborough.www.jncc.gov.uk/SACselection
4. Packam, J. R. & Willis, A. J. (1997). Ecology of Dunes, Saltmarsh and Shingle. Chapman and Hays, London.
5. Radley, G. P. (1994). Sand Dune Vegetation Survey of Great Britain: Part 1-England. Joint Nature ConservationCommittee, Peterborough.
6. Ranwell, D. S. (1972). Ecology of Salt Marshes and Sand Dunes. Chapman & Hall, London.
7. Rodwell J. S. (ed) (1991). British Plant Communities: Maritime communities and vegetation of open habitats:Volume 5. Joint Nature Conservation Committee. Cambridge University Press, Cambridge.
8. Van Beckhoven, K. (1992). ‘Effects of groundwater manipulation on soil processes and vegetation in wet duneslacks’, in Coastal Dune: Geomorphology, Ecology and Management for Conservation. R. W. G. Carter, T. G. F. Curtis& M. J. Sheehy-Skeffington (ed). A. A. Balkema, Rotterdam.
9. Willis, A. (1985). ‘Plant Diversity and Change in a Species-rich Dune System. Trans. Bot. Soc. Edinb. Vol 44:291-308.
Supporting referencesOther Annex I habitats to be considered with humid dune slacks are water courses of plain to montane levels withRanunculion fluitantis and Callitricho-Batrachion vegetation, also calcareous fens with Cladium mariscus andspecies of the Caricion davallianae. The Annex II species that should be considered with humid dune slacks arepetalwort (Petalophyllum ralfsii), shore dock (Rumex rupestris), fen orchid (Liparis loeselli), narrow-mouthed whorlsnail (Vertigo angustior) and also the floating water plantain (Luronium natans).
Species and habitats Guidance notes – Habitats Coastal and halophytic habitats: Humid dune slacks 2.2.1
Environment Agency in partnership with Natural England and Countryside Council for Wales Understanding water for wildlife
< Section divider
This do
cumen
t was
with
drawn o
n 6 N
ovem
ber 2
017.

General informationInland saltmarsh (salt meadow) can develop wherenatural or artificial saline conditions prevail, and wherethe land is not subject to intensive management. It isnow deemed a rare habitat type, having declineddramatically in the past 50 years in all areas where itoccurs. The destruction of much of the natural habitatcan be traced back to early salt-production activities(Ref. 1).
Pasturefields Salt Marsh in the West Midlands is one ofthree sites known to exist in the UK. Inland salt meadowat this site is formed by a natural salt spring, derivedfrom solution of the subterranean salt-bearing rocks ofthe Keuper series (Ref. 3). The site covers approximately0.5 hectares (Ref. 4). The remaining two inland saltmeadow sites are found on the Upton Warren PoolsSSSI (in Worcestershire), and Napton (Warwickshire),with the later representing a weak saline spring feature.
Description• Inland salt meadows refer to non-coastal sites
supporting the Festuca rubra and Spergularia marina– Puccinellia distans salt-marsh community types.These correspond under the National VegetationClassification community types to SM16 and SM23respectively (Ref. 1);
• Distinctive plant associations are observed withinthis habitat type and usually reflect differences insalinity, waterlogging and poaching;
• Sea plantain (Plantago maritima), a notablehalophytic plant is found in inland salt meadows; and
• Where salinity levels are high (i.e. around salt pans)common saltmarsh-grass (Puccinellia maritime),lesser sea-spurrey (Spergularia marina), saltmarshrush (Juncus gerardii) and sea arrowgrass (Triglochinmaritimum) predominate.
Key influencesWater resources• Little information exists on the hydrological
requirements of inland salt meadows;• A hydrogeological assessment carried out at
Pasturefields Salt Marsh in 1994 identified brinesprings in areas of localised permeability, with muchof the area’s geological deposits described asimpermeable (Ref. 2);
• Major threats to the health and status of inland saltmeadows pertain to changes in the hydrologicalregimes (Ref. 2); and
• Freshwater influences on inland salt meadow sitesfavour the establishment of swards of red fescue(Festuca rubra).
Other influences• Drainage of agricultural land is considered to be the
most significant threat to inland salt meadows (Ref 1).
Current and future workNo current or future research on the water resourcerequirements of inland salt meadows has beenidentified within the confines of this study.
Species and habitats Guidance notes – Habitats Coastal and halophytic habitats: Inland salt meadow 2.2.1
Environment Agency in partnership with Natural England and Countryside Council for Wales Understanding water for wildlife
Inland salt meadow
2.2.1 Coastal and halophytic habitats
Key referencesGeneral description1. McLeod, CR, Yeo, M, Brown, AE, Burn, AJ, Hopkins, JJ, & Way, SF (eds.) (2002) The Habitats Directive: selection ofSpecial Areas of Conservation in the UK. 2nd edn. Joint Nature Conservation Committee, Peterborough.www.jncc.gov.uk/SACselection
Site specific studies2. Aspinwall & Company. (1994). NRA (Severn Trent Region) Hydrologeological Assessment of Sites of ScientificInterest: Final Report: Pasturefields Salt Marsh SJ992 248 Staffordshire. Aspinwall & Company, Leeds.
3. English Nature. (1986). Notification Citation for Pasturefields Salt Marsh. English Nature, Peterborough.
4. Staffordshire Biodiversity Action Plan Steering Group. (2001). Staffordshire Biodiversity Action Plan. Edited by J.Webb and J. Smith, 2nd Edition, Staffordshire Wildlife Trust, Staffordshire.
< Section divider
This do
cumen
t was
with
drawn o
n 6 N
ovem
ber 2
017.
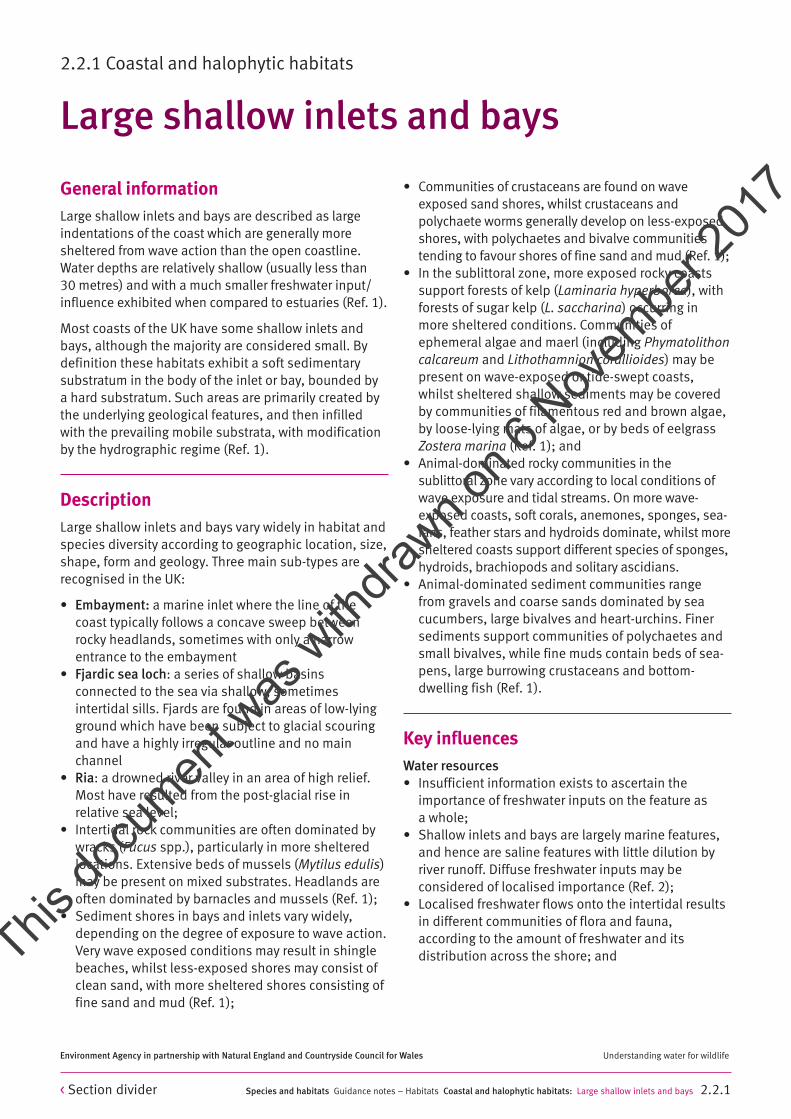
General informationLarge shallow inlets and bays are described as largeindentations of the coast which are generally moresheltered from wave action than the open coastline.Water depths are relatively shallow (usually less than 30 metres) and with a much smaller freshwater input/influence exhibited when compared to estuaries (Ref. 1).
Most coasts of the UK have some shallow inlets andbays, although the majority are considered small. Bydefinition these habitats exhibit a soft sedimentarysubstratum in the body of the inlet or bay, bounded bya hard substratum. Such areas are primarily created bythe underlying geological features, and then infilledwith the prevailing mobile substrata, with modificationby the hydrographic regime (Ref. 1).
DescriptionLarge shallow inlets and bays vary widely in habitat andspecies diversity according to geographic location, size,shape, form and geology. Three main sub-types arerecognised in the UK:
• Embayment: a marine inlet where the line of thecoast typically follows a concave sweep betweenrocky headlands, sometimes with only a narrowentrance to the embayment
• Fjardic sea loch: a series of shallow basinsconnected to the sea via shallow, sometimesintertidal sills. Fjards are found in areas of low-lyingground which have been subject to glacial scouringand have a highly irregular outline and no mainchannel
• Ria: a drowned river valley in an area of high relief.Most have resulted from the post-glacial rise inrelative sea level;
• Intertidal rock communities are often dominated bywracks (Fucus spp.), particularly in more shelteredlocations. Extensive beds of mussels (Mytilus edulis)may be present on mixed substrates. Headlands areoften dominated by barnacles and mussels (Ref. 1);
• Sediment shores in bays and inlets vary widely,depending on the degree of exposure to wave action.Very wave exposed conditions may result in shinglebeaches, whilst less-exposed shores may consist ofclean sand, with more sheltered shores consisting offine sand and mud (Ref. 1);
• Communities of crustaceans are found on waveexposed sand shores, whilst crustaceans andpolychaete worms generally develop on less-exposedshores, with polychaetes and bivalve communitiestending to favour shores of fine sand and mud (Ref. 1);
• In the sublittoral zone, more exposed rocky coastssupport forests of kelp (Laminaria hyperborea), withforests of sugar kelp (L. saccharina) occurring inmore sheltered conditions. Communities ofephemeral algae and maerl (including Phymatolithoncalcareum and Lithothamnion corallioides) may bepresent on wave-exposed or tide-swept coasts,whilst sheltered shallow sediments may be coveredby communities of filamentous red and brown algae,by loose-lying mats of algae, or by beds of eelgrassZostera marina (Ref. 1); and
• Animal-dominated rocky communities in thesublittoral zone vary according to local conditions ofwave exposure and tidal streams. On more wave-exposed coasts, soft corals, anemones, sponges, sea-fans, feather stars and hydroids dominate, whilst moresheltered coasts support different species of sponges,hydroids, brachiopods and solitary ascidians.
• Animal-dominated sediment communities rangefrom gravels and coarse sands dominated by seacucumbers, large bivalves and heart-urchins. Finersediments support communities of polychaetes andsmall bivalves, while fine muds contain beds of sea-pens, large burrowing crustaceans and bottom-dwelling fish (Ref. 1).
Key influencesWater resources• Insufficient information exists to ascertain the
importance of freshwater inputs on the feature asa whole;
• Shallow inlets and bays are largely marine features,and hence are saline features with little dilution byriver runoff. Diffuse freshwater inputs may beconsidered of localised importance (Ref. 2);
• Localised freshwater flows onto the intertidal resultsin different communities of flora and fauna,according to the amount of freshwater and itsdistribution across the shore; and
Species and habitats Guidance notes – Habitats Coastal and halophytic habitats: Large shallow inlets and bays 2.2.1
Environment Agency in partnership with Natural England and Countryside Council for Wales Understanding water for wildlife
Large shallow inlets and bays
2.2.1 Coastal and halophytic habitats
< Section divider
This do
cumen
t was
with
drawn o
n 6 N
ovem
ber 2
017.

• Freshwater inputs may be considered important forbirds utilising this habitat, although it is not yet clear.It is possible that birds do rely on freshwater inputsfor preening and drinking, and as such freshwaterinputs are important for the development of localniches (Ref. 3 & 4).
Other influences• The degree of wave exposure is considered a critical
factor in determining habitat and species diversity ofshallow inlets and bays, as it affects communitiesboth on the shore and in the sublittoral zone (Ref. 2).
Current and future workA hydrological review was undertaken by Entec forHamford Water, a SSSI with large inlets and bays as aninterest feature of the site. This report provides usefulinformation for the assessment of impacts on the largeshallow inlet and bay habitat type.
Species and habitats Guidance notes – Habitats Coastal and halophytic habitats: Large shallow inlets and bays 2.2.1
Environment Agency in partnership with Natural England and Countryside Council for Wales Understanding water for wildlife
Key referencesGeneral description1. McLeod, CR, Yeo, M, Brown, AE, Burn, AJ, Hopkins, JJ, & Way, SF (eds.) (2002). The Habitats Directive: selectionof Special Areas of Conservation in the UK. 2nd edn. Joint Nature Conservation Committee, Peterborough.www.jncc.gov.uk/SACselection
Site specific studies2. Betts, S. & Lawson, R. (2001). Hydro-ecological Review of Selected European Sites within the Agency’s AnglianRegion: Hamford Water SSSI. Entec Ltd, Newcastle.
Supporting referencesConsideration of birds3. Ravenscroft, N. O. M. (1998). Associations of wintering waterfowl with freshwater on the mudflats of East Anglianestuaries. Report to the Environment Agency, English Nature and Suffolk Wildlife Trust.
4. Ravenscroft, N.O.M., Beardhall, C.H., Cottle, R., Willett, P. & Wright, M.T. (1997). The distribution of winteringwaterfowl around freshwater flows over the mudflats of the Orwell Estuary’, England. Report to the EnvironmentAgency and English Nature.
Other Annex I habitats to be considered with large shallow inlets and bays are mudflats and sandflats not coveredby seawater at low tide, salicornia and other annuals colonising mud and sand, spartina swards, estuaries andatlantic salt meadows.
< Section divider
This do
cumen
t was
with
drawn o
n 6 N
ovem
ber 2
017.

General informationMudflats are highly productive areas, which togetherwith other intertidal habitats, support large numbers ofpredatory birds and fish (Ref. 5). Mudflats and sandflatscan reflect low or high energy conditions dependingupon their exposure to waves and/ or tidal currents.
Low energy areas are characterised by shallow slopes,high water content, low permeability and porosity, highcarbon to nitrogen ratios, high organic loading, highmicrobial populations and high sediment stability(Ref. 1). High energy sediment shores are characterisedby steeper shore profiles, which are well drained withhigh porosity and permeability due to large interstitialspaces, a low organic load and sparse microbialpopulations (Ref. 2).
Mudflats and sandflats not covered by sea water at lowtide occur widely throughout the UK.
DescriptionThe physical structure of intertidal flats ranges frommobile, coarse-sand beaches on wave-exposed coaststo stable, fine-sediment mudflats in estuaries and othermarine inlets. Three broad categories have beendevised:
• Clean sands: represent highly mobile environments,occurring on open coast beaches and in bays wherewave action or strong tidal currents prevent thedeposition of finer silt. Species inhabiting cleansands tend to be robust, and mobile includingamphipod crustaceans, some polychaete worms andcertain bivalve molluscs (Ref. 3)
• Muddy sands: occur on more sheltered shores of theopen coast, at the mouths of estuaries or behindbarrier islands. Relatively stable sediment conditionsallow for a wide range of species to inhabit thesubstrate. Lugworm (Arenicola marina), otherpolychaete worms, and bivalve molluscs have allbeen noted. Eelgrass (Zostera spp.) beds may bepresent on certain shores (Ref. 3)
• Muds: the sediment of these areas is typically stableand dominated by polychaete worms and bivalvemollusc communities. These areas may also supportvery high densities of the laver spire snail (Hydrobiaulvae) (Ref. 3).
• The above categories display a continuous gradationbetween them with flora and fauna communities thatalso vary according to sediment type, stability andsalinity (Ref. 3).
Key influencesWater resources• Freshwater inputs do not feature as a principle
environmental factor for mudflats. However,consideration should be given to those speciespresent which may require freshwater inputs, or thepresence of localised areas with reduced salinityconditions, where specific invertebrate communitiesare found;
• Freshwater mediated currents are only important inestuarine and coastal areas receiving runoff. In suchenvironments, vertical stratification caused bysalinity differences will influence the transport ofsediment, dispersive stages of organisms and theirdistribution (Ref. 1);
• The large scale effect of freshwater entering anintertidal area will depend on the volume. At hightide, the influence of freshwater inputs may increaseas it mixes with the saline marine water. Seasonalitycan also affect freshwater input with greater flows inthe winter and low flows in the summer. However,the dilution effect of the freshwater will dependlargely on two factors, the volume of freshwaterentering the site, and the mixing rate within the site(Ref. 1);
• At a local scale, the distribution of individual speciesmay be influenced within the vicinity of anyfreshwater flows. Intertidal biotopes will experiencelarge-scale localised changes in community structureif there is a substantial change in the salinitycondition experienced. The distribution of estuarineinvertebrates is influenced by several factorsincluding substrate type and salinity. In areas oflowered salinity, the macroinvertebrate fauna ispredominantly of the Petersen Macoma community,characteristic species being: common cockle(Cerastoderma edule), mud shrimp (Corophiumvolutator), laver spire shell and ragworm (Hedistediversicolor). With a slight increase in the proportion
Species and habitats Guidance notes – Habitats Coastal and halophytic habitats: Mudflats and sandflats 2.2.1
Environment Agency in partnership with Natural England and Countryside Council for Wales Understanding water for wildlife
Mudflats and sandflats not covered byseawater at low tide
2.2.1 Coastal and halophytic habitats
< Section divider
This do
cumen
t was
with
drawn o
n 6 N
ovem
ber 2
017.

of sand, the polychaetes catworm (Nephtyshombergii) and lugworm occur. In slightly coarserareas, eelgrass beds may develop (Ref. 4);
• Invertebrate diversity is greatest in either marine orfreshwater environments, reducing as the salinityrange increases. Changes in salinity resulting fromfreshwater inputs will generally reduce invertebratediversity. However, interstitial salinity tends to bemuch less variable than the overlying water, and assuch is not considered a major limiting factor ofinvertebrate abundance (Ref. 8); and
• Differences in salinity conditions will alter the varietyof communities found in each of the sedimentcategories. Mudflat and sandflat habitats, and theassociated communities, found in estuaries maydisplay marked variations depending on theinfluence of freshwater inputs when compared topurely marine locations (Ref. 1).
Other influences• Other environmental parameters to which the
biota of mudflats and sandflats are sensitive include hydrographical changes and water activity(i.e. storm events) and tidal elevation change (e.g. sea level rise);
• Changes to the hydrographic regime are ofconsiderable importance to the physical, chemicaland biological integrity of mudflat and sandflats.Such changes may alter the sedimentary regimewhich may impact on the sediment health, the natureof infaunal communities present and consequentlyits use by predators (Ref. 1). Storm events can alsoresult in the ‘scouring’ of benthic communities,causing reductions in biomass. Generally, thedetermining factors affecting such habitats are wave,current and wind action;
• Anthropogenic activities known to have an impact onthe features of this habitat type include landreclamation activities, hard sea defences, barrages(amenity, storm-surge and tidal energy) maintenancedredging (for navigation), organic enrichment,industrial and domestic effluent discharge, oil spillsand tanker accidents, sea-level rise, recreationincluding bait digging, introduction of non-nativespecies and intertidal shell fisheries (Ref 1); and
• Consideration of birds utilising mudflats andsandflats is required. Refer to the estuaries summaryfor supporting references.
Current and future projectsHydrological reviews for a number of SACs have beenundertaken by Entec. These reports provide adiscussion on considerations for particular sites, andalthough site specific, provide useful information forthe assessment of impacts on this habitat type.
Environment Agency, Southern Region commissioned aproject to determine the importance of freshwater flowsto estuarine bird populations, entitled ‘FreshwaterFlows across Mudflats’.
Consult the MarLIN website for work recently completed(and ongoing) on sensitivities of marine habitats:(www.marlin.ac.uk/Bio_pages/Bio_Scripts/Habitats_info_intro.htm).
Species and habitats Guidance notes – Habitats Coastal and halophytic habitats: Mudflats and sandflats 2.2.1
Environment Agency in partnership with Natural England and Countryside Council for Wales Understanding water for wildlife
< Section divider
This do
cumen
t was
with
drawn o
n 6 N
ovem
ber 2
017.

Key referencesGeneral description1. Elliot, M., Nedwell., S., Jones, N. V., Read, S. J., Cutts, N. D & Hemingway, K. L. (1998). Intertidal sand andmudflats & subtidal mobile sandbanks: An overview of dynamic and sensitivity characteristics for conservationmanagement of marine SACs (volume II). Scottish Association for Marine Science (UK Marine SACs Project).
2. Little, C. (2000). The Biology of Soft Shores and Estuaries. Oxford University Press.
3. McLeod, CR, Yeo, M, Brown, AE, Burn, AJ, Hopkins, JJ, & Way, SF (eds.) (2002) The Habitats Directive: selection ofSpecial Areas of Conservation in the UK. 2nd edn. Joint Nature Conservation Committee, Peterborough.www.jncc.gov.uk/SACselection
4. Rodwell J. S. (ed) (1991). British Plant Communities: Maritime communities and vegetation of open habitats:Volume 5. Joint Nature Conservation Committee. Cambridge University Press, Cambridge.
5. UK Biodiversity Group, 1999. Tranche 2 Action Plans: Volume V Maritime Species and Habitats. English Nature,Peterborough.
Site specific studies6. Betts, S. (2002). Hydro-ecological Review of Selected European Sites within the Agency’s Anglian Region:Saltfleetby – Theddlethorpe SSSI. Entec Ltd, Newcastle.
7. Green, C. & Robson, G. (2001). Hydro-ecological Review of Selected European Sites within the Agency’s AnglianRegion: Dengie SSSI. Entec Ltd, Newcastle.
8. Green, C. & Robson, G. (2002). Hydro-ecological Review of Selected European Sites within the Agency’s AnglianRegion: Foulness SSSI. Entec Ltd, Newcastle.
Supporting referencesConsideration of birds utilising the estuary9. Ravenscroft, N. O. M. (1998). Associations of wintering waterfowl with freshwater on the mudflats of East Anglianestuaries. Report to the Environment Agency, English Nature and Suffolk Wildlife Trust.
10. Ravenscroft, N.O.M., Beardhall, C.H., Cottle, R., Willett, P. & Wright, M.T. (1997). The distribution of winteringwaterfowl around freshwater flows over the mudflats of the Orwell Estuary, England. Report to the EnvironmentAgency and English Nature.
Other Annex I habitats to be considered with mudflats and sandflats not covered by seawater at low tide areestuaries, large shallow inlets and bays, salicornia and other annuals colonising mud and sand, atlantic saltmeadows (Glauco-Puccinellietalia maritimae) spartina swards (Spartinion maritimae) and coastal lagoons.
Species and habitats Guidance notes – Habitats Coastal and halophytic habitats: Humid dune slacks 2.2.1
Environment Agency in partnership with Natural England and Countryside Council for Wales Understanding water for wildlife
< Section divider
This do
cumen
t was
with
drawn o
n 6 N
ovem
ber 2
017.

General informationSaltmarshes can be defined as intertidal areas of finesediment transported by water and stabilised byhalophytic species adapted for regular immersion (Ref. 2). Four main salt marsh zones based on tidalregime plus an upper transition zone are recognised:
• Pioneer zone: open communities covered by all tides(except the lowest neap) with one or more of thefollowing – Spartina, Salicornia, Aster;
• Low marsh zone: generally closed communitiescovered by all neap tides with at least Puccinellia andAtriplex portulacoides as well as the previousspecies;
• Middle marsh zone: generally closed communitiesonly covered by spring tides with Limonium and/orPlantago, as well as the previous species;
• High marsh zone: generally closed community onlycovered by the highest spring tide with one or moreof the following – Festuca, Armeria, Elymus as well asthe previous species; and
• Transition zone: vegetation intermediate between thehigh marsh and adjoining non-halophytic areas. Thiszone is only covered occasionally by tidal surgesduring extreme storm events (Ref. 3).
It is not uncommon for one or more of these zones to beabsent in an area. In areas exposed to high waveenergy, middle to high marsh can occur well above thelevel of normal spring tides. In areas restricted by theexistence of a sea wall the higher zone is virtuallyabsent and the transition zone appears in a line alongthe sea wall.
Salicornia and other annuals colonising mud and sandis widespread in the saltmarshes of England and Walesbut restricted in Scotland and Northern Ireland becauseof a lack of new sediment for saltmarsh development(Ref. 4).
Description• The annual glassworts (Salicornia spp.), a pioneer
saltmarsh species, is often found growing inmonostands or with common cordgrass (Spartinaanglica) in the lowest intertidal zones. This species isable to tolerate conditions of complete and longinundations with seawater, high wave energies andlow nutrient conditions (Ref. 4);
• Glassworts and other annuals colonising mud andsand in the UK are represented by the NVCcommunities:
• SM7 Arthrocnemum perenne stands• SM8 Annual Salicornia salt-marsh community• SM9 Suaeda maritima salt-marsh community• SM27 Ephemeral salt-marsh vegetation with Sagina
maritima• SM7, SM8 and SM9 contain open stands of perennial
glasswort (Sarcocornia perennis), glasswort(Salicornia spp.), and/or annual seablite (Suaedamaritima). The density of these plants can vary andmay be lower on sites with sandier substrate (Ref. 4);
• Other species that are found in association includecommon saltmarsh-grass (Puccinellia maritima),common cord-grass (Spartina anglica) and sea aster(Aster tripolium) (Ref. 4);
• The glassworts are highly adaptable, growing in allsediment textures (shingle, sand, silt and clay), andare believed to be tolerant of turbid and moderatelycontaminated conditions such as those found inmarinas and ports (Ref. 3);
• Annual glassworts generally colonise slopes, flatsand shelves around -1.0 m below mean sea level(Ref. 10);
• It colonises intertidal mud and sandflats in areasprotected from strong wave action and is animportant precursor to the development of morestable saltmarsh vegetation; and
• It also develops at the lower reaches of saltmarsheswhere the vegetation is frequently flooded by thetide, and can also colonise open creek sides,depressions or pans within saltmarshes, as well asdisturbed areas of upper saltmarsh (Ref. 10).
Species and habitats Guidance notes – Habitats Coastal and halophytic habitats: Salicornia and other annuals 2.2.1
Environment Agency in partnership with Natural England and Countryside Council for Wales Understanding water for wildlife
Salicornia and other annualscolonising mud and sand
2.2.1 Coastal and halophytic habitats
< Section divider
This do
cumen
t was
with
drawn o
n 6 N
ovem
ber 2
017.

Key influences
Water resources
• Due to their halophytic nature, freshwater input isnot considered a principle environmental parameterfor pioneer species such as Salicornia. Mid to highsaltmarsh zones are more likely to be influenced byfreshwater inputs if herb and grass species arepresent (Ref. 7, 8 & 9);
• Freshwater and its influence on salinity was also notconsidered to be a significant factor on the health orstatus of this habitat type (Ref. 1); and
• Freshwater inputs may be considered important forbird utilisation of this habitat, although it is not yetclear. It is possible that birds do rely on freshwaterinputs for preening and drinking, and as such areimportant for the development of local niches(Refs. 11 & 12).
Other influences• Allen and Pye (1992) evaluated factors responsible
for the occurrence and distribution of saltmarsh. Itwas concluded that coastal physical processes(wind, tide and wave energy, sediment supply,climate change and geological setting), ecologicalprocesses and anthropogenic activity are principlefactors governing distribution.
Current and future projectsJNCC and EHSNI have recently completed a saltmarshreview (2002). Details on all aspects of saltmarsh andtheir management are included (Ref. 3).
Hydrological reviews for a number of SACs have beenundertaken by Entec. These reports provide adiscussion on considerations for particular sites, andalthough site specific, provides useful information forthe assessment of impacts on this habitat type.
Species and habitats Guidance notes – Habitats Coastal and halophytic habitats: Salicornia and other annuals 2.2.1
Environment Agency in partnership with Natural England and Countryside Council for Wales Understanding water for wildlife
< Section divider
This do
cumen
t was
with
drawn o
n 6 N
ovem
ber 2
017.

Key referencesGeneral description1. Allen, J. R. L. and Pye, K. (1992). Salt Marshes: Morphodynamics, Conservation and Engineering Significance.Cambridge University Press, Cambridge.
2. Boorman, L.A. (1995). ‘Sea level rise and the future of the British coast’. Coastal Zone Topics: Process, Ecologyand Management; 1: 10-13.
3. JNCC & EHSNI (2002). Saltmarsh Review: An overview of coastal salt marshes, their dynamic and sensitivitycharacteristics for conservation and management. L.A. Boorman, JNCC and EHSNI, Peterborough.
4. McLeod, CR, Yeo, M, Brown, AE, Burn, AJ, Hopkins, JJ, & Way, SF (eds.) (2002). The Habitats Directive: selectionof Special Areas of Conservation in the UK. 2nd edn. Joint Nature Conservation Committee, Peterborough.www.jncc.gov.uk/SACselection
5. Stump, R.J. (1983). ‘The process of sedimentation on the surface of a salt marsh’. Estuarine, Coastal and ShelfScience; 17:495-508.
6. UK Biodiversity Group. (1999). Tranche 2 Action Plans: Volume V Maritime Species and Habitats. English Nature,Peterborough.
Site specific studies7. Betts, S. & Lawson, R. (2002). Hydro-ecological Review of Selected European Sites within the Agency’s AnglianRegion: Blackwater Estuary SPA/cSAC/ SSSI. Entec Ltd, Newcastle.
8. Green, C. & Robson, G. (2001). Hydro-ecological Review of Selected European Sites within the Agency’s AnglianRegion: Dengie SSSI. Entec Ltd, Newcastle.
9. Green, C. & Robson, G. (2002). Hydro-ecological Review of Selected European Sites within the Agency’s AnglianRegion: Foulness SSSI. Entec Ltd, Newcastle.
Supporting references10. Brooke, J., Landin, M., Meakins, N. & Adnitt, C. (1999). The Restoration of Vegetation on Saltmarshes. Researchand Development Technical Report W208. Environment Agency, Bristol.
Consideration of birds11. Ravenscroft, N. O. M. (1998). Associations of wintering waterfowl with freshwater on the mudflats of EastAnglian estuaries. Report to the Environment Agency, English Nature and Suffolk Wildlife Trust.
12. Ravenscroft, N.O.M., Beardhall, C.H., Cottle, R., Willett, P. & Wright, M.T. (1997). The distribution of winteringwaterfowl around freshwater flows over the mudflats of the Orwell Estuary, England. Report to the EnvironmentAgency and English Nature.
Other Annex I habitats to be considered with Salicornia and other annuals colonising mud and sand are spartinaswards, mudflats and sandflats not covered by seawater at low tide, large shallow inlets and bays, coastal lagoonsand estuaries. The Annex II species that also need to be considered is the narrow mouthed whorl snail (Vertigoangustior).
Species and habitats Guidance notes – Habitats Coastal and halophytic habitats: Salicornia and other annuals 2.2.1
Environment Agency in partnership with Natural England and Countryside Council for Wales Understanding water for wildlife
< Section divider
This do
cumen
t was
with
drawn o
n 6 N
ovem
ber 2
017.

General informationSaltmarshes can be defined as intertidal areas of finesediment transported by water and stabilised byhalophytic species adapted for regular immersion (Ref. 2). Four main saltmarsh zones based on tidalregime plus an upper transition zone are recognised:
• Pioneer zone: open communities covered by all tides(except the lowest neap) with one or more of thefollowing – Spartina, Salicornia, Aster;
• Low marsh zone: generally closed communitiescovered by all neap tides with at least Puccinellia andAtriplex portulacoides as well as the previousspecies;
• Middle marsh zone: generally closed communitiesonly covered by spring tides with Limonium and/orPlantago, as well as the previous species;
• High marsh zone: generally closed community onlycovered by the highest spring tide with one or moreof the following – Festuca, Armeria, Elymus as well asthe previous species; and
• Transition zone: vegetation intermediate between thehigh marsh and adjoining non-halophytic areas. Thiszone is only covered occasionally by tidal surgesduring extreme storm events (Ref. 4).
It is not uncommon for one or more of these zones to beabsent in an area. In areas exposed to high waveenergy, middle to high marsh can occur well above thelevel of normal spring tides. In areas restricted by theexistence of a sea wall the higher zone is virtuallyabsent and the transition zone appears in a line alongthe sea wall.
Four species occur in the UK, the native small cord-grass (Spartina maritima); the naturalised non-nativesmooth cord-grass (S. alterniflora), the sterile hybridTownsend’s cord-grass (S. x townsendii (crossing of S.alterniflora and S. maritima)) and invasive fertilecommon cord-grass (S. anglica (crossing of S.alterniflora and S. maritima)).
Small cord-grass, smooth cord-grass and Townsend’scord-grass are limited by climatic factors. Smallcord-grass has experienced a decline in distributionthroughout the UK, but substantial populations stillexist on the Essex coast (Ref. 4).
Description• Cord-grass (Spartina spp.) colonises a wide range of
substrates, from very soft muds to shingle in areassheltered from strong wave action. It occurs on theseaward fringes of saltmarshes and creek-sides andmay also colonise old pans in the upper saltmarsh(Ref. 4);
• Communities containing cord-grass speciescorresponds to the NVC types:
• SM4 Spartina maritima salt-marsh community• SM5 Spartina alterniflora salt-marsh community• SM6 Spartina anglica salt-marsh community• Only saltmarshes with native small cord-grass,
smooth cord-grass and Townsend’s cord-grass areproposed for conservation (Ref. 3).
Key influencesWater resources• Due to their halophytic nature, freshwater input is
not considered a principle environmental parameterfor pioneer species such as Spartina. Other speciespresent in the mid to high saltmarsh zones are morelikely to be influenced by freshwater inputs into thehabitat. Insufficient information exists to make a trueassessment as to the importance of freshwater (Ref. 7 & 8);
• Freshwater and its influence on salinity was notconsidered to be a significant factor on the health orstatus of this habitat type (Ref. 1); and
• Freshwater inputs may be considered important forbird utilisation in this habitat, although it is not yetclear. It is possible that birds do rely on freshwaterinputs for preening and drinking, and as such areimportant for the development of local niches(Refs. 10 & 11).
Other influences• Allen and Pye (1992) evaluated factors responsible
for the occurrence and distribution of salt marsh. Itwas concluded that coastal physical processes(wind, tide and wave energy, sediment supply,climate change and geological setting), ecologicalprocesses and anthropogenic activity are principlefactors governing distribution; and
Species and habitats Guidance notes – Habitats Coastal and halophytic habitats: Spartina swards 2.2.1
Environment Agency in partnership with Natural England and Countryside Council for Wales Understanding water for wildlife
Spartina swards (Spartinion maritimae)
2.2.1 Coastal and halophytic habitats
< Section divider
This do
cumen
t was
with
drawn o
n 6 N
ovem
ber 2
017.

• Many saltmarsh areas have been lost as a result ofland reclaim for agricultural purposes.Anthropogenic influences on this habitat typeinclude waste tipping, drowning by barrageconstruction, recreational pressures, oil pollutionand eutrophication (caused by sewage effluent andagricultural run-off).
Current and future projectsJNCC and EHSNI have completed a saltmarsh review in2002. Details on all aspects of saltmarsh and theirmanagement are included (refer to Ref.3).
Hydrological reviews for a number of SACs have beenundertaken by Entec. These reports provide adiscussion on considerations for particular sites, andalthough site specific, provide useful information forthe assessment of impacts on this habitat type.
Species and habitats Guidance notes – Habitats Coastal and halophytic habitats: Spartina swards 2.2.1
Environment Agency in partnership with Natural England and Countryside Council for Wales Understanding water for wildlife
Key referencesGeneral description1. Allen, J. R. L. and Pye, K. (1992). Salt Marshes: Morphodynamics, Conservation and Engineering Significance.Cambridge University Press, Cambridge.
2. Boorman, L.A. (1995). ‘Sea level rise and the future of the British coast’. Coastal Zone Topics: Process, Ecologyand Management; 1: 10-13.
3. JNCC & EHSNI (2002). Saltmarsh Review: An overview of coastal salt marshes, their dynamic and sensitivitycharacteristics for conservation and management. L.A. Boorman, JNCC and EHSNI, Peterborough.
4. McLeod, CR, Yeo, M, Brown, AE, Burn, AJ, Hopkins, JJ, & Way, SF (eds.) (2002). The Habitats Directive: selectionof Special Areas of Conservation in the UK. 2nd edn. Joint Nature Conservation Committee, Peterborough.www.jncc.gov.uk/SACselection
5. Stump, R.J. (1983). ‘The process of sedimentation on the surface of a salt marsh’. Estuarine, Coastal and ShelfScience; 17:495-508.
6. UK Biodiversity Group. (1999), UK Biodiversity Group Tranche 2 Action Plans – Volume V:Maritime species andhabitats, HMSO, London.
Site specific studies7. Betts, S. & Lawson, R. (2002). Hydro-ecological Review of Selected European Sites within the Agency’s AnglianRegion: Blackwater Estuary SPA/cSAC/ SSSI. Entec Ltd, Newcastle.
8. Green, C. & Robson, G. (2002). Hydro-ecological Review of Selected European Sites within the Agency’s AnglianRegion: Foulness SSSI. Entec Ltd, Newcastle.
Supporting references9. Brooke, J., Landin, M., Meakins, N. & Adnitt, C. (1999). The Restoration of Vegetation on Saltmarshes. Researchand Development Technical Report W208. Environment Agency, Bristol.
Consideration of birds10. Ravenscroft, N. O. M. (1998). Associations of wintering waterfowl with freshwater on the mudflats of EastAnglian estuaries. Report to the Environment Agency, English Nature and Suffolk Wildlife Trust.
11. Ravenscroft, N.O.M., Beardhall, C.H., Cottle, R., Willett, P. & Wright, M.T. (1997). The distribution of winteringwaterfowl around freshwater flows over the mudflats of the Orwell Estuary, England. Report to the EnvironmentAgency and English Nature.
Other Annex I habitats to be considered with Spartina swards are salicornia and other annuals colonising mud andsand, atlantic salt meadow mudflats and sandflats not covered by seawater at low tide, large shallow inlets andbays, coastal lagoons and also estuaries.
< Section divider
This do
cumen
t was
with
drawn o
n 6 N
ovem
ber 2
017.

General informationCoastal lagoons are described as areas of shallow,coastal salt water which are wholly or partially separatedfrom the sea by sandbanks, shingle or, less frequently,rocks or other hard substrata. They retain a proportion oftheir water at low tide and may develop as brackish, fullysaline or hyper-saline water bodies (Ref. 4).
Ecological and geographical variations between lagoonhabitats exist and consequently a number ofclassification schemes have evolved. Sheader andSheader (1989) classified UK coastal lagoons into fivemain sub-types based on their physiography. The fivesub-types are isolated lagoons, percolation lagoons,silled lagoons, sluiced lagoons and lagoonal inlets.
Coastal lagoons are relatively uncommon in the UK,with sub-types exhibiting very restricted distributionpatterns (Ref. 6).
DescriptionCoastal lagoons are divided into five main sub-types:• Isolated lagoons: separated completely from the sea
or estuary by a barrier of rock or sediment. Seawaterenters by limited groundwater seepage or by over-topping of the sea barrier. Salinity is variable but mayremain high due to water loss by evaporation. Theyare often transient features with a limited life-span
• Percolation lagoons: separated from the sea byshingle banks. Seawater enters by percolatingthrough the shingle or occasionally by over-toppingthe bank (e.g. in storms). Tidal range is normallysignificantly reduced and salinity may vary. They arenormally formed by natural processes of sedimenttransport and as such may be transient features whichare eroded and swept away over a period of years ordecades, or infilled by shingle bank movement
• Silled lagoons: retain water at all states of the tide bya barrier of rock, termed the ‘sill’. There is usually littletidal rise-and-fall. This may be out of phase with theadjacent sea. Seawater input is regular (i.e. on mosttides) and salinity may be seasonally variable. Theselagoons are potentially long-lived with extinctionoccurring over extended periods of time
• Sluiced lagoons: are formed where the naturalmovement of water between the lagoon and the seais modified by artificial structures such as a culvert
under a road or valved sluices. Tidal range isdependent upon the sluice efficiency and may bevery low. Longevity is comparable with silledlagoons. Communities present in sluiced lagoonsvary according to the type of substrate and salinity
• Lagoonal inlets: are formed when seawater entersthe lagoonal inlet on each tide, usually through anopen but narrow connection to the sea. Salinity isusually high, particularly at the seaward part of theinlet. The tidal range is usually marked and in phasewith the adjacent sea. This salinity gradientsignificantly increases the habitat and speciesdiversity of the sites in which it occurs. Longevity iscomparable with silled lagoons;
• Salinity conditions in coastal lagoons can vary frombrackish to hypersaline (0.5-30 ppt to excess of 35ppt). Flora and fauna communities vary according tothe physical characteristics and salinity regime of theparticular lagoon (Ref. 6);
• Flora and fauna found to exist within coastal lagoonsare usually divided into those which are essentiallyfreshwater origin, marine/brackish species andthose only associated with coastal lagoons (Ref. 7).Bamber et al (1992) identified six suites of species:
• Freshwater/low salinity species• Lagoonal species• Euryhaline (able to live in a wide range of salinities)
specialist species tolerant of estuarine conditions• Stenohaline (adapted to a narrow range of salinities)
marine specialist lagoonal species• Estuarine species pre-adapted to lagoonal
conditions• Estuarine species incidental in lagoons; and• All lagoonal specialist species require specific
environmental conditions. A large number oflagoonal specialist species are closely related to fullymarine rather than estuarine or freshwater species(Ref. 3). Species requiring specific environmentalconditions provided within saline lagoons includethe starlet sea anemone (Nematostella vectensis),lagoon sandworm (Armandia cirrhosa), lagoonsand-shrimp (Gammarus insensibilis) and foxtailstonewort (Lamprothamnium papulosum) (Ref. 6).
Species and habitats Guidance notes – Habitats Coastal and halophytic habitats: Coastal lagoons 2.2.1
Environment Agency in partnership with Natural England and Countryside Council for Wales Understanding water for wildlife
Coastal lagoons
2.2.1 Coastal and halophytic habitats
< Section divider
This do
cumen
t was
with
drawn o
n 6 N
ovem
ber 2
017.

Key influencesWater resources• Despite the marine nature of communities found in
coastal lagoon habitats, freshwater inputs into thesystem, where they exist are likely to be important tomaintain the salinity regime. Water abstraction orchanges to freshwater inputs may affect water levelsand the salinity regime of some lagoons;
• It is important to note that salinity in coastal lagoonsmay vary in the short term (over tidal cycles),medium term (in response to rainfall) and longerterm (in response to seasonality and drought);
• The freshwater input for coastal lagoons is usuallysupplied through rainwater, and surface drainage.The importance of freshwater input is site specific,but a freshwater supply is not always considerednecessary to a saline lagoon (Ref. 4 & 5). The numberof freshwater species present within the habitat canbe used as an indicator of the freshwater influence;
• Many coastal lagoons existing in England and Walesare transient features. Changes in salinity regimesthat shift sites to a more freshwater environment maylead to the establishment of terrestrial communitiessuch as fen carr (Ref. 8). High freshwater inputs canresult in the establishment of marsh vegetation andthe loss of specialist species associated with coastallagoons (Ref. 1);
• Where there are hypersalinity problems, freshwaterinputs can be used to address issues raised; and
• In some lagoons where the seawater exchangeexceeds freshwater supply, and where the lagoonoutlet can readily dispense peaks of freshwaterinput, salinity gradients produced are thought toassist in increasing the diversity of species found inthe site (Ref. 4).
Other influences• As a distinct habitat, the essence of saline lagoons
is their tidal restriction, or low hydrodynamic state(Ref. 1). The exchange of saline (sea-) water into thelagoon system is considered one of the mostimportant criteria for successful maintenance ofhabitat (Ref. 5 & 7);
• When considering the sensitivity of a lagoon toimpacts, it is necessary to consider the type of lagoonand its exchange with the sea; its size and thecommunities and species present. Threats to theintegrity of the lagoon habitat in the UK includePhragmites spp. encroachment, interference withmargins from grazing animals, infilling from shinglebank encroachment, land reclaim or otherdevelopments, degradation by excavation for shingle-bank redevelopment, sea-level rise and coastalerosion, changes in saline water ingress into lagoonsystems, input of pollution from surrounding land (e.g. nutrient enrichment), and toxic contaminationfrom surrounding land and tidal inputs;
• Due to the limited exchange with the sea (andassociated reduced flushing time of dissolved orsuspended materials), coastal lagoons areparticularly sensitive to changes in nutrient loadingassociated with anthropogenic activities; and
• Optimal criteria for specialist, marine, lagoonalspecies using a hypothetical saline lagoon(according to Ref. 4) require at least 60% of the waterto persist in the lagoon at all times of the year at allstates of the tide; salinity to vary over the range of15-40‰, the sea-water input to exceed freshwaterinput, a muddy-sand substratum to sandy-mudsubstratum, rocky substratum for specialist hardsubstratum biotopes, shelter from wind effects,aspect ratio issues depths of up to one metre, andshallow margins.
Current and future projectsIn 2001 The Countryside Council for Wales reviewedsaline lagoons in Wales (Ref. 2).
English Nature(now Natural England) commissioned thedevelopment of a saline lagoon habitat inventory forEngland. The project has developed a GIS inventory forthe saline lagoon Biodiversity Action Plan (BAP) PriorityHabitats for England, based on existing accurateinformation.
Species and habitats Guidance notes – Habitats Coastal and halophytic habitats: Coastal lagoons 2.2.1
Environment Agency in partnership with Natural England and Countryside Council for Wales Understanding water for wildlife
< Section divider
This do
cumen
t was
with
drawn o
n 6 N
ovem
ber 2
017.

Key referencesGeneral description1. Bamber, R. N. (1997). Assessment of saline lagoons within Special Areas of Conservation. English Nature Report235. English Nature, Peterborough.
2. Bamber, R.N., Evans, N.J., Sanderson, W.G. & Whittall, A. (2001). Coastal saline lagoons and pools in Wales:review and proposals. Countryside Council for Wales, Science Report 464.
3. Bamber, R. N. & Barnes, R. S. K. (1996). Coastal and Seas of the United Kingdom, Region 10 South-westEngland: Seaton to Roseland Peninsula. Joint Nature Conservation Committee, Peterborough, Chapter 3-4.
4. Bamber, R. N., Gilliland, P. M. & Shardlow, E. A. (2001). Saline Lagoons: A guide to their management andcreation. English Nature, Peterborough.
5. Bamber, R. N., Batten, S. D., Sheader, M. & Bridgewater, N. D. (1992). ‘On the ecology of brackish water lagoonsin Great Britain’, Aquatic Conservation: Marine and Freshwater Ecosystems. Volume 2: 65-94.
6. McLeod, CR, Yeo, M, Brown, AE, Burn, AJ, Hopkins, JJ, & Way, SF (eds.) (2002). The Habitats Directive: selection ofSpecial Areas of Conservation in the UK. 2nd edn. Joint Nature Conservation Committee, Peterborough.www.jncc.gov.uk/SACselection
7. Sheader, M. & Sheader, A. (1989). Coastal saline ponds of England and Wales: an overview. Nature ConservancyCouncil CSD Report 1009. Nature Conservancy Council, Peterborough.
8. UK Biodiversity Group. (1999), UK Biodiversity Group Tranche 2 Action Plans – Volume V: Maritime species andhabitats, HMSO, London.
Site specific studies9. Covey, R. (1999). ‘The saline lagoon survey of Scotland’. In Scotlands Living Coast. Ed. Baxter, J. M., Duncan, K.,Atkins, S. & Lees, G. HMSO, London, pp150-165.
10. Johnson, C. & Gilliland. P. M. (2000). Investigation and management of water quality (nutrients) in salinelagoons based on a case study from the Chesil and the Fleet European marine site. UK Marine SACs Project. EnglishNature, Peterborough.
Supporting referencesOther Annex I habitats to be considered with coastal lagoons are mudflats and sandflats not covered by seawaterat low tide, salicornia and other annuals colonising mud and sand, spartina swards (Spartinion maritimae) andatlantic salt meadows.
Species and habitats Guidance notes – Habitats Coastal and halophytic habitats: Coastal lagoons 2.2.1
Environment Agency in partnership with Natural England and Countryside Council for Wales Understanding water for wildlife
< Section divider
This do
cumen
t was
with
drawn o
n 6 N
ovem
ber 2
017.

2.2.2 FreshwaterhabitatsThe following summaries have been compiled using key reference papersprovided by Environment Agency and Natural England staff. They provide asummary of relevant information on the freshwater requirements offreshwater habitats. For further information, refer to references listed beloweach habitat account.
– Natural dystrophic lakes and ponds
– Hard oligo-mesotrophic waters with benthic vegetation of chara spp
– Natural eutrophic lakes with Magnopotamion or Hydrocharition – type vegetation
– Oligotrophic to mesotrophic standing waters with vegetation of the Littorelletea uniflorae and/orIsoëto-nanojuncetea
– Watercourses of plain to montane levels with Ranunculion fluitantis and Callitricho-batrachionvegetation
– Oligotrophic waters containing very few minerals of sandy plains (Littorelletalia uniflorae)
– Mediterranean temporary ponds
Species and habitats Guidance notes – Habitats Freshwater habitats: Natural dystrophic lakes and ponds 2.2.2
Environment Agency in partnership with Natural England and Countryside Council for Wales Understanding water for wildlife
< Section divider
This do
cumen
t was
with
drawn o
n 6 N
ovem
ber 2
017.

General informationDystrophic pools are peaty, often very acidic waterbodies which are poor in plant nutrients. Due to theexposure to peat their waters are usually stained darkbrown (Ref. 1). Most examples of this habitat are small(<5 hectares in extent), shallow and contain a limitedrange of flora and fauna. Fringing vegetation is acharacteristic of the habitat and several notable scarcedragonfly species are associated with thesewaterbodies (Ref. 1).
Dystrophic water bodies are closely linked to thedistribution of peat, and are particularly frequent onlarge areas of blanket peat in northern Britain such asthe Scottish Flow Country. In England and Wales theyare less numerous, but have a widespread distribution.Lowland sites have particular value for natureconservation because of the rarity of the habitat type inEngland and Wales (Ref. 3).
Description• Dystrophic pools most often occur on blanket bogs
and are characterised by peaty water, dominated bybog-mosses (Sphagnum spp.) and lesserbladderwort (Utricularia minor) in northern regions(Ref. 3);
• Some dystrophic lakes have developed a‘schwingmoor’ where bog-mosses are found inassociation with cottongrass (Eriophorumangustifolium) and white water-lily (Nymphaea alba)(Ref. 1);
• Many of these habitat types occur on blanket bogs,plains or valley bottoms and may include isolatedseasonal pools, collections of irregularly-shapedsemi-permanent waters and ordered linear orconcentric arrays of pools and small lochs (Ref. 1).
Key influencesWater resources• The small size and volume of these water bodies
makes them particularly susceptible to drainage andchanges in nearby hydrology (Ref. 2);
• Abstraction is unlikely to be a significant issue formost of these sites due to their predominantlyremote upland location. However, the possibility ofimpact from abstraction should be considered inlowland catchments affected by human influences.
Other influences• Peat extraction and forestry pose the biggest threats
to this habitat type;• Changes to land management, such as over grazing
and/or drainage, is also a significant threat (Ref. 2);and
• Eutrophication may be a threat in lowlandcatchments where the incidence of diffuse pollutionand run-off is likely to be higher.
Species and habitats Guidance notes – Habitats Freshwater habitats: Natural dystrophic lakes and ponds 2.2.2
Environment Agency in partnership with Natural England and Countryside Council for Wales Understanding water for wildlife
Natural dystrophic lakes and ponds
2.2.2 Freshwater habitats
< Section divider
This do
cumen
t was
with
drawn o
n 6 N
ovem
ber 2
017.

Species and habitats Guidance notes – Habitats Freshwater habitats: Natural dystrophic lakes and ponds 2.2.2
Environment Agency in partnership with Natural England and Countryside Council for Wales Understanding water for wildlife
Key references1. Joint Nature Conservation Committee, freshwater habitats 3160 natural dystrophic lakes and ponds. RetrievedMarch 13, 2006, from http://www.jncc.gov.uk/ProtectedSites/SACselection/habitat.asp?FeatureIntCode=H3160
2. Joint Nature Conservation Committee (JNCC). 2005. Common Standards Monitoring Guidance for StandingWaters. Joint Nature Conservation Committee, Peterborough.
3. McLeod CR, Yeo M, Brown AE, Burn AJ, Hopkins JJ and Way SF, 2002 The Habitats Directive: selection of SpecialAreas of Conservation in the UK, second edition. Joint Nature Conservation Committee: Peterborough.
Further reading4. Carvalho L and Monteith D, 1999 Conservation objectives of Oligotrophic and Dystrophic lake types.Environmental Change Research Centre, University College London. Research report number 71, Report to EnglishNature EIT 20/23/01.
5. Duigan C, Kovach W, Palmer M. 2006. Vegetation Communities of British Lakes: a revised classification. JointNature Conservation Committee (JNCC), Peterborough.
6. European Commission. 2003. Interpretation of European Union Habitats. EUR25. European Commission, DGEnvironment, Nature and Biodiversity.http://ec.europa.eu/environment/nature/nature_conservation/eu_enlargement/2004/pdf/habitats_im_en.pdf
7. Mosto PE, Ferguson E, Norodone N, Perez C and Wojz J, 2000 Algae as Water Quality Indicators of DystrophicPonds. Journal of Physiology, 36, 3, 22.
< Section divider
This do
cumen
t was
with
drawn o
n 6 N
ovem
ber 2
017.
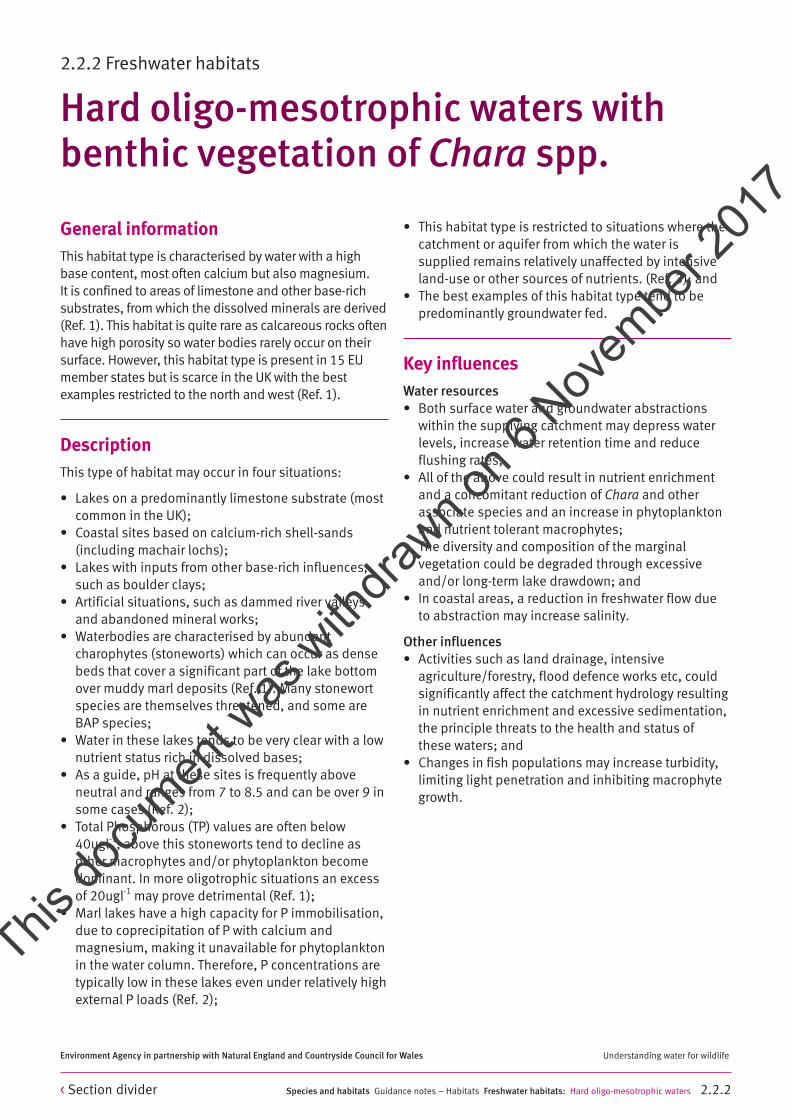
General informationThis habitat type is characterised by water with a highbase content, most often calcium but also magnesium. It is confined to areas of limestone and other base-richsubstrates, from which the dissolved minerals are derived(Ref. 1). This habitat is quite rare as calcareous rocks oftenhave high porosity so water bodies rarely occur on theirsurface. However, this habitat type is present in 15 EUmember states but is scarce in the UK with the bestexamples restricted to the north and west (Ref. 1).
DescriptionThis type of habitat may occur in four situations:
• Lakes on a predominantly limestone substrate (mostcommon in the UK);
• Coastal sites based on calcium-rich shell-sands(including machair lochs);
• Lakes with inputs from other base-rich influences,such as boulder clays;
• Artificial situations, such as dammed river valleysand abandoned mineral works;
• Waterbodies are characterised by abundantcharophytes (stoneworts) which can occur as densebeds that cover a significant part of the lake bottomover muddy marl deposits (Ref. 1). Many stonewortspecies are themselves threatened, and some areBAP species;
• Water in these lakes tends to be very clear with a lownutrient status rich in dissolved bases;
• As a guide, pH at these sites is frequently aboveneutral and ranges from 7 to 8.5 and can be over 9 insome cases (Ref. 2);
• Total Phosphorous (TP) values are often below 40ugl-1, above this stoneworts tend to decline asother macrophytes and/or phytoplankton becomedominant. In more oligotrophic situations an excessof 20ugl-1 may prove detrimental (Ref. 1);
• Marl lakes have a high capacity for P immobilisation,due to coprecipitation of P with calcium andmagnesium, making it unavailable for phytoplanktonin the water column. Therefore, P concentrations aretypically low in these lakes even under relatively highexternal P loads (Ref. 2);
• This habitat type is restricted to situations where thecatchment or aquifer from which the water issupplied remains relatively unaffected by intensiveland-use or other sources of nutrients. (Ref. 3); and
• The best examples of this habitat type tend to bepredominantly groundwater fed.
Key influencesWater resources• Both surface water and groundwater abstractions
within the supplying catchment may depress waterlevels, increase water retention time and reduceflushing rates;
• All of the above could result in nutrient enrichmentand a concomitant reduction of Chara and otherassociate species and an increase in phytoplanktonand nutrient tolerant macrophytes;
• The diversity and composition of the marginalvegetation could be degraded through excessiveand/or long-term lake drawdown; and
• In coastal areas, a reduction in freshwater flow dueto abstraction may increase salinity.
Other influences• Activities such as land drainage, intensive
agriculture/forestry, flood defence works etc, couldsignificantly affect the catchment hydrology resultingin nutrient enrichment and excessive sedimentation,the principle threats to the health and status ofthese waters; and
• Changes in fish populations may increase turbidity,limiting light penetration and inhibiting macrophytegrowth.
Species and habitats Guidance notes – Habitats Freshwater habitats: Hard oligo-mesotrophic waters 2.2.2
Environment Agency in partnership with Natural England and Countryside Council for Wales Understanding water for wildlife
Hard oligo-mesotrophic waters withbenthic vegetation of Chara spp.
2.2.2 Freshwater habitats
< Section divider
This do
cumen
t was
with
drawn o
n 6 N
ovem
ber 2
017.

Species and habitats Guidance notes – Habitats Freshwater habitats: Hard oligo-mesotrophic waters 2.2.2
Environment Agency in partnership with Natural England and Countryside Council for Wales Understanding water for wildlife
Key references1. Joint Nature Conservation Committee, Freshwater Habitat 3140 Hard oligo-mesotrophic waters with benthicvegetation of Chara spp. Retrieved March 10, 2006, fromhttp://www.jncc.gov.uk/ProtectedSites/SACselection/habitat.asp?FeatureIntCode=H3140
2. Joint Nature Conservation Committee (JNCC). 2005. Common Standards Monitoring Guidance for StandingWaters. Joint Nature Conservation Committee, Peterborough.
3. McLeod CR, Yeo M, Brown AE, Burn AJ, Hopkins JJ and Way SF, 2002 The Habitats Directive: selection of SpecialAreas of Conservation in the UK. Joint Nature Conservation Committee: Peterborough.
Further reading4. Centre of Research on Nature, Forest and Wood (Bemblous, Belgium), 2002 Habitat 3140 hard oligo-mesotrophic waters with benthic vegetation of Chara formations, In: Habitats Directive 92/43/EEC Description ofAnnex I Habitats.
5. European Commission. 2003. Interpretation of European Union Habitats. EUR25. European Commission, DGEnvironment, Nature and Biodiversity.http://ec.europa.eu/environment/nature/nature_conservation/eu_enlargement/2004/pdf/habitats_im_en.pdf
6. Stewart NF. 2004. Important Stonewort Areas of the United Kingdom. Plantlife International, Salisbury.
< Section divider
This do
cumen
t was
with
drawn o
n 6 N
ovem
ber 2
017.

General informationNatural eutrophic lakes with Magnopotamion orHydrocharition-type vegetation have levels of nutrientsgreater than those of dystrophic, oligotrophic, ormesotrophic waters, this typically results in highernatural productivity and species richness (Ref. 4).
Magnopotamion vegetation are dominated bysubmerged rooted perennials such as Potamogetonperfoliatus, P. lucens, P. praelongus, P. coloratus andvarious submerged associates such as Myriophyllumspicatum and Ceratophyllum demersum.
Hydrocharition-type vegetation are largely free-floatingsurface communities with species such as Lemna spp.,Hydrocharis morsusranae and Stratiodes aloides.
Unfortunately, many eutrophic lakes have recently beendamaged by excessive nutrient enrichment, whichresults in hypertrophic conditions and a reduction inspecies- richness (Ref. 3). Undamaged examples ofthese lakes are now uncommon in European countriesand the exact status of this habitat type is unknown(Ref. 3) as naturally occurring eutrophic lakes cannoteasily be distinguished from non-natural eutrophiclakes or enriched examples of other lake types(e.g. Chara lakes) (Ref. 4 & 3). No comprehensive dataexists on the extent of this habitat type in the UK.
DescriptionThree sub-types of this habitat may be identified (Ref. 3):
– (a) southern eutrophic lakes– (b) northern or western eutrophic lakes and – (c) coastal eutrophic lakes;
• Magnopotamion vegetation is generally sensitive toadverse impacts such as eutrophication or physicaldisturbance;
• Hydrocharition-type vegetation is rare in lakes and inthe UK seems to be confined to Northern Ireland. Inthe rest of the UK the most complete expression ofthis community type is found in the ditch systems ofthe Norfolk Broads;
• As a guide, pH is generally > 7 and >9 (Ref. 2);• Both N and P are important chemical controls, with
most systems tending to be P limited, although thisshould be established on an individual system basis(Ref. 2);
• Water hardness and pH play a role in determining theamount of TP available for uptake in the watercolumn (Ref. 2); and
• Where aquatic macrophyte communities are healthyphytoplankton is controlled within the water columnby a combination of shading and nutrient uptake bymacrophytes.
Key influencesWater resources• The most significant threat to eutrophic waters is
nutrient enrichment; • Abstraction within a lake or its contributory
catchment can reduce water levels, reduce flushingrates and increase residence time, therebyexacerbating nutrient enrichment. Deterioration inmarginal vegetation can also occur if drawdown isexcessive and desiccation prolonged; and
• A reduction in freshwater flow to coastal sites mayincrease salinity.
Other influences• Organic and inorganic fertiliser inputs as well as land
use changes can cause eutrophication or siltationand may damage biological communities in thesehabitats. This can be from point source or diffusepollution;
• The introduction of non-native plants and animalscan destabilise the ecosystem. For example, Zebramussel colonies are able to smother plants stemsand lake substrates and densities greater than120,000 individuals m2 are not unusual (Ref. 1);Ecological impacts include exclusion of native swanmussels, reduced food availability for organismsdependent upon phytoplankton and increasednutrient and sediment loading from waste material;
Species and habitats Guidance notes – Habitats Freshwater habitats: Natural eutrophic lakes 2.2.2
Environment Agency in partnership with Natural England and Countryside Council for Wales Understanding water for wildlife
Natural eutrophic lakes withMagnopotamion or Hydrocharition-type vegetation
2.2.2 Freshwater habitats
< Section divider
This do
cumen
t was
with
drawn o
n 6 N
ovem
ber 2
017.

• Introduction of fish, the removal of predators ormanipulation of fish stocks may alter the natural fishcommunity and detrimentally impact the invertebrateand plant communities. This can result in a ‘forwardswitch’ to turbid, phytoplankton dominatedconditions; and
• Recreational activities such as boating and otherphysical disturbance may reduce the cover of aquaticplants and disturb sediment. The former will allowlight penetration into the water whilst the latter canrelease nutrients, mainly P, into the water column.These can then favour a switch to a phytoplanktondominated system.
Ongoing workThe UK Lakes Habitat Action Plan group is currently(2006/2007) carrying out an exercise to identify theextent of this resource in the UK.
Species and habitats Guidance notes – Habitats Freshwater habitats: Natural eutrophic lakes 2.2.2
Environment Agency in partnership with Natural England and Countryside Council for Wales Understanding water for wildlife
Key references1. Environment and Heritage Service 2001, Fact Sheet; Zebra Mussels Edition.http://www.ehsni.gov.uk/pubs/publications/ZMFSheet.pdf
2. Joint Nature Conservation Committee, 2005. Common Standards Monitoring Guidance for Standing Waters.Peterborough.
3. Joint Nature Conservation Committee, Freshwater habitats 3150 natural eutrophic lakes with Magnopotamion orHydrocharition-type vegetation. Retrieved March 13, 2006, fromhttp://www.jncc.gov.uk/ProtectedSites/SACselection/habitat.asp?FeatureIntCode=H3150
4. McLeod CR, Yeo M, Brown AE, Burn AJ, Hopkins JJ and Way SF, 2002 The Habitats Directive: selection of SpecialAreas of Conservation in the UK, second edition. Joint Nature Conservation Committee: Peterborough.
Further reading5. Moss B, Madgewick J and Phillips G, 1996 A guide to restoration of nutrient enriched shallow lakes. EnvironmentAgency and the Broads Authority.
6. European Commission. 2003. Interpretation of European Union Habitats. EUR25. European Commission, DGEnvironment, Nature and Biodiversity.http://ec.europa.eu/environment/nature/nature_conservation/eu_enlargement/2004/pdf/habitats_im_en.pdf
7. UK Biodiversity Steering Group, 1998 Eutrophic standing waters, a Habitat Action Plan, in: UK Biodiversity GroupTranche 2 Action Plans – Volume II: Terrestrial and Freshwater Habitats. HMSO:London.
< Section divider
This do
cumen
t was
with
drawn o
n 6 N
ovem
ber 2
017.

General informationThe clear soft water which characterises oligotrophic tomesotrophic standing waters contains low to moderatelevels of plant nutrients and supports a characteristicassemblage of plant species. The vegetation communityis characterised by aquatic short perennial vegetation,with shore-weed (Littorella uniflora) often a dominantcomponent (Ref. 3) although in some situations it maybe absent as other characteristic species of theLittorelletea flora become more abundant. For exampleL. uniflora tends to be a constant in younger stands, asit is a good coloniser, and wave action probably favoursits abundance while in more sheltered, deeper watersthe abundance of Lobelia dortmanna can exceed thatof L. uniflora (Ref. 1).
Water bodies of this type are widespread throughoutEurope, particularly in mountainous areas whereoligotrophic waters are more common thanmesotrophic examples. They are also widespreadthroughout upland parts of the UK, particularly in Walesand Scotland although many sites are small and largerlakes have often been modified by human activity(Ref. 2). Examples of this habitat may be found in Lochnan Cat on Ben Lawers in the central highlands, LlynCau within the Cadair Idris range in Gwynedd, tarnsin the Lake District, high fells in Cumbria, Ullswater in Cumbria and temporary ponds in the New Forest,Hampshire. The latter is also representative ofoligotrophic waters containing few minerals of sandyplains (Littorelletalia uniflorae) (Ref. 3).
Mesotrophic standing waters potentially have thehighest biodiversity of any standing water habitat(Ref. 2) and also contain some species that onlyoccur within this habitat. However, they tend to occur in less upland locations and are more vulnerable to human influences.
Description• Plant and animal biomass is often low in oligotrophic
standing waters, which are usually clear with sparsephytoplankton populations. These lakes also tend tobe larger, deeper and due to being locatedpredominantly in the uplands of the north and westtend to have a more rocky littoral zone than theirlowland counterparts (Ref. 3 & 4);
• Marginal components of the plant community can beexposed on the lake shores during summer or timesof drought (Ref. 3);
• The Littorelletea flora contains a good number ofcharacteristic species such as Littorella uniflora,Isoetes lacustris, Isoetes echinospora and Lobeliadortmanna. These waters also support othercharacteristic and associate species which should beconsidered (Ref. 2);
• Characteristic species of oligotrophic waterscontaining few minerals of sandy plains(Littorelletalia uniflorae) also include Littorellauniflora, Isoetes lacustris, Isoetes echinospora andLobelia dortmanna. Other characteristic andassociate species also occur and need to beconsidered (Ref. 2); and
• Mesotrophic standing waters have the potential tosupport a more diverse flora with charcteriasticspecies including Potamogeton spp, Nitella spp,Sparganium natans, Najas flexilis and Persicariaamphibia (Ref. 2).
Species and habitats Guidance notes – Habitats Freshwater habitats: Oligotrophic to mesotrophic standing waters 2.2.2
Environment Agency in partnership with Natural England and Countryside Council for Wales Understanding water for wildlife
Oligotrophic to mesotrophic standingwaters with vegetation of theLittorelletea uniflorae and/or Isoëto-nanojuncetea
2.2.2 Freshwater habitats
< Section divider
This do
cumen
t was
with
drawn o
n 6 N
ovem
ber 2
017.

Key influencesWater resources• Water resources requirements of oligotrophic to
mesotrophic standing waters are likely to be sitespecific; and
• Changes in the availability of water throughabstraction, drainage or drought may be detrimentalto this habitat through changes in both hydrologyand water quality. Abstraction may depress waterlevels, increase water retention time and reduceflushing rates, which may exacerbate nutrientenrichment, cause deterioration of marginalvegetation through drawdown and cause shallowlakes to dry out.
Other influences• Eutrophication, acidification and sedimentation are
the greatest threats to this habitat type;• L. uniflora, L. dortmanna and Isoetes prefer
oligotrophic waters and eutrophication hascontributed to their decline (Ref. 4). Eutrophicationstimulates phytoplankton blooms which shade outaquatic macrophytes and can cause deoxygenationof the water column resulting in fish kills;
• Acidification may occur in areas with sensitivegeology and soils as a result of atmosphericdeposition. Intensive forestry practices associatedwith coniferous plantations have also been linked to acidification of upland waters. This can lead to damage or loss of certain plant species(e.g. Myriophyllum alterniflorum), the invertebratefauna and fish populations;
• Organic pollution, siltation, heavy metals andthermal pollution may also influence the condition of these habitats, and sedimentation can releasenutrients and increase turbidity, inhibiting lightpenetration and macrophyte growth (Ref. 4);
• Fish stocking can be a problem if inappropriatespecies are stocked, high stocking densities occur orsupplementary feeding takes place and may lead tothe loss of natural fish population and affect plantand invertebrate communities (Ref. 2); and
• Recreational activities such as boating may directlydamage aquatic plants, increase turbidity and causebank side erosion. The suppression of macrophytecommunities by these mechanisms may promotealgal growth. (Ref. 2 & 4).
Associated habitats/speciesAnnex II species – floating water plantain (Luronium natans)
SAC habitats – oligotrophic waters containing fewminerals of sandy plains (Littorelletalia uniflorae)
Current and future workAll of the Acid Water Monitoring Network (AWMN) sites are relevant to this habitatwww.ukawmn.ucl.ac.uk/site15/index.htmAdditionally, data from some Environmental ChangeNetwork sites is relevant www.ecn.ac.uk/sites.htm
Species and habitats Guidance notes – Habitats Freshwater habitats: Oligotrophic to mesotrophic standing waters 2.2.2
Environment Agency in partnership with Natural England and Countryside Council for Wales Understanding water for wildlife
< Section divider
This do
cumen
t was
with
drawn o
n 6 N
ovem
ber 2
017.

Key references1. Joint Nature Conservation Committee (JNCC). 2005. Common Standards Monitoring Guidance for StandingWaters. Joint Nature Conservation Committee, Peterborough.
2. Joint Nature Conservation Committee, Freshwater Habitats 3130 Oligotrophic to mesotrophic standing waterswith vegetation of the Littorelletea uniflorae and/or of the Isoeto-nanojuncetea. Retrieved, March 10, 2006, fromhttp://www.jncc.gov.uk/ProtectedSites/SACselection/habitat.asp?FeatureIntCode=H3130
3. Rodwell J.S. (ed). 1995. British Plant Communities Volume 4. Aquatic Communities, Swamps and Tall-Herb Fens.Cambridge University Press.
4. The UK Biodiversity Steering Group, 1995 Standing Open Water habitat Statement and Mesotrophic Lakes, aCosted Action Plan, In: Biodiveristy: the UK Steering Group Report, Volume II: Action Plans. HMSO: London.
Further reading5. Carvalho L and Monteith D, 1999 Conservation objectives for Oligotrophic and Dystrophic lake types.Environmental Change Research Centre, University College London, Research Report Number 71. Report to EnglishNature 20/23/01.
6. McLeod CR, Yeo M, Brown AE, Burn AJ, Hopkins JJ and Way SF, 2002 The Habitats Directive: selection of SpecialAreas of Conservation in the UK, second edition. Joint nature Conservation Committee: Peterborough.
7. Duigan C, Kovach W, Palmer M. 2006. Vegetation Communities of British Lakes: a revised classification. JointNature Conservation Committee (JNCC), Peterborough.
8. Also needs ref to EU Interpretation Manual.
9. European Commission. 2003. Interpretation of European Union Habitats. EUR25. European Commission, DGEnvironment, Nature and Biodiversity.http://ec.europa.eu/environment/nature/nature_conservation/eu_enlargement/2004/pdf/habitats_im_en.pdf
10. Palmer MA, 1992 A botanical classification of standing waters in Great Britain and a method for the use ofmacrophyte for assessing changes in water quality. Research and survey in nature conservation number 19, NatureConservancy Council: Peterborough.
Species and habitats Guidance notes – Habitats Freshwater habitats: Oligotrophic to mesotrophic standing waters 2.2.2
Environment Agency in partnership with Natural England and Countryside Council for Wales Understanding water for wildlife
< Section divider
This do
cumen
t was
with
drawn o
n 6 N
ovem
ber 2
017.

General informationWatercourses of plain to montane levels withRanunculion fluitantis and Callitricho-Batrachion (CB)vegetation are freshwater habitats characterised by theabundance of certain aquatic vegetation. Thisvegetation generally consists of a mixture of speciessuch as water-crowfoots Ranunculus spp., subgenusBatrachium; water-starworts Callitriche; aquaticmosses, especially Fontinalis spp; pondweedsPotamogeton spp. and various other aquatic, marginaland floating-leaved plants. The presence of this plantassemblage provides shelter and food for a wide varietyof fish and invertebrates, and may modify water flowand encourage localised flow and substrate diversity,especially over the summer months when the plants arein growth.
Such rivers (or rivers supporting these plantcommunities) are widespread in the UK and occur in awide range of rivers from sluggish, eutrophic rivers inthe Norfolk Broads to fast-flowing oligo-mesotrophicrivers in upland areas. These support a variety ofdistinct plant communities. Plant communities arestrongly influenced by geology and river flow regime,and those provisionally described in the UK may differfrom communities found in other European countries.
Description• CB community variance is linked to geology and river
type. In each habitat type, a different assemblage ofaquatic plants occurs;
• CB communities are characteristic of flowing waterconditions and commonly associated with riffles andstable gravel-pebble substrate. Silt is generallyrestricted to macrophyte beds and river margins;
• Semi-natural water courses characterised byCallitricho-Batrachion communities will contain adiverse range of flow types and physical habitatsincluding riffle-pool sequences, marginal deadwaterand exposed riverine sediments; and
• Scientific information relevant to the ecologicalrequirements of rivers with CB plant communities inthe British Isles and in Europe is limited.
Key influencesWater resources• The effects of flow are of great importance for lotic
macrophytes, and will determine which plantsoccupy specific locations in the channel;
• Stream size and flow will determine community type,as individual species are adapted to specific flowtypes in several ways, such as anchoring strength(Ref. 3);
• Alteration of flow regime will affect channel flora andmay cause a change in the composition of thesubstrate. The growth pattern of Ranunculuspenicillatus subsp. pseudofluitans has beendemonstrated to coincide with maximum flow inchalk streams. (Ref. 7);
• The season and extent of inundation is critical to thedevelopment and stability of winterbourne plantcommunities (ephemeral spring-fed headwaterstreams) (Ref. 5);
• Spates in rivers with predominantly uplandcatchments often lead to a reduction or the loss ofchannel macrophytes through washout (Ref. 7);
• Winterbournes and headwaters subject toabstraction and drought will exhibit a decline in theextent and condition of CB plant communities and anincrease in species characteristic of slower flowssuch as Callitriche stagnalis and Rorippa nasturtium-aquaticum. Marginal plant species may increase incover and long periods of drying will lead to atransition with terrestrial grasses (Ref. 7);
• Haslam (1987) observed Canadian pondweed(Elodea canadensis) and Ranunculus cover toincrease in hill stream communities in years of lowrainfall, whilst Ranunculus fluitans (which requiresswift water for good growth) declined (Ref. 7); and
• The impact of abstraction and low flow is greatest inmodified catchments where retention time for waterentering the catchment is reduced.
Other influences• Geology and soil type are important in determining
the character of plant communities in rivers; • Plant community diversity will be greater in river
systems with mixed geology;
Species and habitats Guidance notes – Habitats Freshwater habitats: Watercourses of plain to montane levels 2.2.2
Environment Agency in partnership with Natural England and Countryside Council for Wales Understanding water for wildlife
Watercourses of plain to montane levelswith Ranunculion fluitantis andCallitricho-batrachion vegetation
2.2.2 Freshwater habitats
< Section divider
This do
cumen
t was
with
drawn o
n 6 N
ovem
ber 2
017.

• Water quality parameters (alkalinity, pH, nitrate,phosphate, potassium and suspended solids) willinfluence species composition. For suggestedphosphorus levels for main river types refer to (Ref. 6);
• Siltation, induced by low flows and channelmodification, will impact upon macrophytecommunities. The accumulation of silt deposits andincreased turbidity will decrease light and smothermacrophytes, causing a shift in species composition(Ref. 1) and preventing regeneration;
• Overgrazing of banks leads to reduction incommunity diversity, siltation (see above), increasedscour and proliferation of ruderal species includingHimalayan Balsam;
• Increased nutrient supply may lead to an overallreduction in species diversity, and increase thepresence of pollution tolerant species. More extremenutrient increases lead to an overall impoverishmentof the community, with algae dominating (Ref. 1). It is
also thought that high nutrient levels may make thecomponent species more susceptible to wash outunder high flows; Increased pesticide and herbicideloading may be detrimental (Ref. 4);
• The introduction of non-native species such as Japanese Knotweed (F.japonica), Himalayan Balsam (I.glandulifera), and Giant Hogweed (H. mantegazzianum) may be detrimental to this habitat type (Ref. 4); and
• A healthy community of marginal vegetation is alsoimportant.
Current and future workThe LIFE in UK Rivers Project is developing conservationstrategies and monitoring protocols for use on riversdesignated as Special Areas of Conservation under theEuropean Union Habitats Directive. Refer to the LIFE inUK Rivers website for further information.
Species and habitats Guidance notes – Habitats Freshwater habitats: Watercourses of plain to montane levels 2.2.2
Environment Agency in partnership with Natural England and Countryside Council for Wales Understanding water for wildlife
Key referencesGeneral description & habitat details1. Grieve, N. & Newman, J. (2002). Ecological requirements of water courses characterised by Ranunculionfluitantis and Callitricho-batrachion vegetation (Draft). LIFE in UK Rivers Project. http://www.english-nature.org.uk/lifeinukrivers/ecological.html
2. Haslam, S. M. (1987). River Plants of Western Europe. Cambridge University Press, Cambridge.
3. Haslam, S. M. (1978). River Plants. Cambridge University Press, Cambridge.
4. Hatton-Ellis TW and Grieve N, 2003 Ecological Requirements of Water Courses Characterised by Ranunculionfluitantis and Callitricho-Batrachion Vegetation. Conserving Natura 2000 Rivers Ecology Series 11. English Nature:Peterborough.
5. Holmes, N. T. H. (1996). Classification of Winterbournes. Environment Agency, Bristol.
6. Mainstone, C. P., Parr, W. & Day, M. (2000). Phosphorus and River Ecology – tackling sewage inputs. EnglishNature/Environment Agency.
7. McLeod, CR, Yeo, M, Brown, AE, Burn, AJ, Hopkins, JJ, & Way, SF (eds.) (2002). The Habitats Directive: selection ofSpecial Areas of Conservation in the UK. 2nd edn. Joint Nature Conservation Committee, Peterborough. Available:www.jncc.gov.uk/SACselection
Supporting referencesAnnex I habitats associated with water courses of plain to montane levels with Ranunculion fluitantis andCallitricho-Batrachion vegetation to be considered are; Humid dune slacks, Atlantic salmon, Sea lamprey, River lamprey, Allis shad, Brook lamprey, Bullhead and Floating water-plantain.
For further information refer to guidance notes produced.
< Section divider
This do
cumen
t was
with
drawn o
n 6 N
ovem
ber 2
017.

General informationOligotrophic waters containing very few minerals ofsandy plains are restricted to sandy plains that areacidic and low in nutrients, and therefore very scarce.The water is typically very clear and moderately acidic.The habitat type is characterised by the presence of theLittorelletalia type vegetation (Ref. 2);
Only four sites have been identified in the UK that areconsidered to represent high-quality examples. Theseoccur in Dorset (Little Sea); on fluvio-glacial deposits inthe New Forest (Hatchet Pond); the Cheshire Plain (OakMere); and on more recent sand deposits of marineorigin in the Outer Hebrides (South Uist Machair). LittleSea in Dorset is a land locked lake on sand dunes witha heathland catchment. The catchment area of the NewForest (Hatchet Pond) and of the Cheshire Plain (OakMere) site is acid lowland heath, with the Machair lochsin the Outer Hebrides being acid moorland (Ref. 2).
Description• Littorelletalia type vegetation is characterised by the
presence of water lobelia (Lobelia dortmanna),shoreweed (Littorella uniflora), or quillwort (Isoeteslacustris). Only one of these species needs to bepresent to conform with the definition of this Annex Ihabitat type; and
• Typically the vegetation consists of zones in whichthe individual species form submerged,monospecific lawns (Ref. 2).
Key influencesWater resources• There appears to be little information available on
the hydrological requirements of this habitat type;and
• Of what is known of the hydrological regime at OakMere in the Cheshire Plains, water level fluctuationshave been implicated in the decline of themacroinvertebrate community between 1980 and1996. The study concluded that an initial recovery ofthe macroinvertebrate community had occurred since1996, but that further recovery would depend uponthe maintenance of water levels. (Ref. 3);
• Water abstraction may depress water levels, increasewater retention time and reduce flushing rates. Thismay exacerbate nutrient enrichment, causedeterioration of marginal vegetation throughdrawdown and cause shallow lakes to dry out. Forcoastal sites, a reduction in the throughput offreshwater may increase salinity; and
• As the plant species tend to grow in distinct zonesthis habitat type may be particularly susceptible todrawdown, Littorella may grow in the drawdown zone but changes to hydrological regime may affectthis species.
Other influences• Destruction of lowland heaths, land drainage and
nutrient enrichment has contributed to the scarcity ofthis habitat type (Ref. 3); and
• Oligotrophic waters, by definition, have low levels ofdissolved nutrients and as such, water qualityrequirements may focus on associated variables,such as pH and dissolved oxygen. Detailed data onthe water quality of lowland sites only exists for OakMere, but limited data is available for the South UistSAC sites (Ref. 1).
Species and habitats Guidance notes – Habitats Freshwater habitats: Oligotrophic waters containing very few minerals 2.2.2
Environment Agency in partnership with Natural England and Countryside Council for Wales Understanding water for wildlife
Oligotrophic waters containing very fewminerals of sandy plains (Littorelletalia uniflorae)
2.2.2 Freshwater habitats
< Section divider
This do
cumen
t was
with
drawn o
n 6 N
ovem
ber 2
017.

Current and future workThe Environment Agency and landowners currently carryout monitoring of pH and water level informally at OakMere (Ref. 1) but no other projects have been identifiedwithin the confines of this study.
An Environment Agency R&D project ‘Development ofGIS Based Inventory of Standing Waters for England andWales’ is ongoing. This is a GIS–linked database of allstanding waters and includes information ondesignations, modelled nutrient loads amongst others.
Species and habitats Guidance notes – Habitats Freshwater habitats: Oligotrophic waters containing very few minerals 2.2.2
Environment Agency in partnership with Natural England and Countryside Council for Wales Understanding water for wildlife
Key referencesGeneral description & habitat details1. Carvalho, L., Monteith, D. (1999). Conservation objectives for Oligotrophic and Dystrophic lake types.Environmental Change Research Centre. University College London. Research Report No. 71. Report to EnglishNature. Contract No. EIT 20/23/01.
2. McLeod, C.R., Yeo, M., Brown, A.E., Burn, A.J., Hopkins, J.J., & Way, S.F. (eds.) (2002). The Habitats Directive:selection of Special Areas of Conservation in the UK. 2nd edn. Joint Nature Conservation Committee, Peterborough.www.jncc.gov.uk/SACselection
Site specific hydrological consideration studies3. Labadz, J.C., Harding, R.J., Potter, A. & Butcher, D.P. (2000). Oak Mere SSSI, cSAC: NGR SJ575676. Progressreport (working draft) to English Nature/ECUS. Dept of Land-Based Studies, Nottingham Trent University.
Supporting referencesThe Annex I habitat Oligotrophic to mesotrophic standing waters and Annex II species floating water plantain(Luronium natans) should be considered with this habitat.
< Section divider
This do
cumen
t was
with
drawn o
n 6 N
ovem
ber 2
017.

General informationMediterranean temporary ponds are winter-floodedareas, which periodically dry out to give a vegetationcomposition rich in annuals; many of which arenationally rare species, and principally confined to thishabitat type. Species confined to Mediterraneantemporary ponds include pygmy rush (Juncuspygmaeus), pennyroyal (Mentha pulegium) and yellowcentaury (Cicendia filiformis).
The habitat has been divided into two main pool types, a more acid pool community of trampled and grazedareas, often found on flooded trackways, and a basicpool type on serpentine rock. The Lizard heath inCornwall represents the only UK site where significantareas of the basic pool type have been recorded (Ref. 4).
Description• The DETR Lowland Pond Survey (1996) found
temporary ponds (which include the Mediterraneanhabitat type) to be more shaded, have organic richsediments, but to be less silty than their permanentequivalents. Exceptions to this are noted, andinclude the Lizard where Mediterranean ponds arelargely unshaded;
• The acid pool type contains an importantassemblage of rare species, including pigmy rush,the three-lobed crowfoot (Ranunculus tripartitus) andyellow centaury. A number of pools also supportimportant invertebrate populations, including thewater beetles Graptodytes flavipes and Dryopsstriatellus;
• Ponds are usually fish free and support fewerinvertebrate predators than permanent ponds due totheir periodic drying-out (Ref. 2); and
• The invertebrate fauna of temporary ponds in the UKis characterised by taxa that are mobile or tolerant tofluctuating water levels and periodic desiccation.They are commonly used by amphibians, including(although rarely) the great crested newt (Trituruscristatus) (Ref. 5).
Key influencesWater resources• Little data exists on the relationship between
hydrological regime and the status of theMediterranean temporary pond habitat; and
• Mediterranean temporary ponds are more likely to be fed by near surface runoff than more permanentponds, and less likely to be spring fed (Ref. 3);
Other influences• The disuse of trackways that once ensured the
creation of the acid type pond habitat may havereduced its distribution (Ref. 4). However it is theupgrading of such tracks to road status that isconsidered the major threat to Mediterraneantemperate ponds;
• Given the shallow nature of Mediterranean temporaryponds soil drainage for agriculture or urbandevelopment will destroy this habitat;
• The small water volumes of temporary ponds implythey are likely to be highly susceptible to pollution;and
• A lack of awareness and recognition of this habitattype has resulted in their destruction throughinfilling, or by deepening for the creation ofpermanent ponds (Ref. 6). However, on the Lizard,the loss of Mediterranean temporary ponds are morelikely to be through reduced disturbance alongtrackways or infilling to improve trackways.
Current and future workThe University of Plymouth is currently undertakingresearch on the ecology, status and management ofMediterranean temporary ponds in the UK (Ref. 1).
An Environment Agency R&D project ‘Development ofGIS Based Inventory of Standing Waters for England andWales’ is ongoing. This is a GIS–linked database of allstanding waters and includes information ondesignations, modelled nutrient loads amongst others.
Species and habitats Guidance notes – Habitats Freshwater habitats: Mediterranean temporary ponds 2.2.2
Environment Agency in partnership with Natural England and Countryside Council for Wales Understanding water for wildlife
Mediterranean temporary ponds2.2.2 Freshwater habitats
< Section divider
This do
cumen
t was
with
drawn o
n 6 N
ovem
ber 2
017.

Species and habitats Guidance notes – Habitats Freshwater habitats: Mediterranean temporary ponds 2.2.2
Environment Agency in partnership with Natural England and Countryside Council for Wales Understanding water for wildlife
Key referencesGeneral description & habitat details1. Bilton, D., Staff Homepage. University of Plymouth. Web Access 13/11/02.http://www.biology.plymouth.ac.uk/staff/Bilton/Dbilton.htm
2. Buckley, J (2001). The conservation and management of amphibians in UK temporary ponds, with particularreference to Natterjack Toads. In: European Temporary Ponds: A Threatened Habitat. Freshwater Forum. Volume 17.Edited by David Sutcliffe. Freshwater Biological Association.
3. DETR, (1998). Lowland Ponds Survey 1996. Final Report. Department of the Environment, Transport and the Regions.
4. McLeod, C.R., Yeo, M., Brown, A.E., Burn, A.J., Hopkins, J.J., & Way, S.F. (eds.) (2002). The Habitats Directive:selection of Special Areas of Conservation in the UK. 2nd edn. Joint Nature Conservation Committee, Peterborough.www.jncc.gov.uk/SACselection
5. Nicolet, P. (2001). Temporary ponds in the UK: a critical biodiversity resource for freshwater plants and animals.In: European Temporary Ponds: A Threatened Habitat. Freshwater Forum. Volume 17. Edited by David Sutcliffe.Freshwater Biological Association.
6. Williams, P., Biggs, J., Fox, G., Nicolet, P., Whitfield, M. (2001). History, origins and importance of temporaryponds. In: European Temporary Ponds: A Threatened Habitat. Freshwater Forum. Volume 17. Edited by DavidSutcliffe. Freshwater Biological Association.
Supporting referencesThe Annex II Great Crested Newt (Triturus cristatus) species should be considered with Mediterranean temporaryponds habitat.
< Section divider
This do
cumen
t was
with
drawn o
n 6 N
ovem
ber 2
017.

2.2.3 Temperateheath, scrub andgrasslandsThe following summaries have been compiled using key reference papersprovided by Environment Agency and Natural England staff. They provide asummary of relevant information on the freshwater requirements of thetemperate habitats. For further information, refer to references listed beloweach habitat account.
– Molinia meadows on calcareous, peaty or clayey-silt-laden soils (Molinion caerulea)
– Northern atlantic wet heaths with Erica tetralix
– Lowland hay meadows (Alopecurus pratensis, Sanguisorba officinalis)
– Temperate atlantic wet heaths with Erica ciliaris and Erica tetralix
Species and habitats Guidance notes – Habitats Temperate heath, scrub and grasslands 2.2.3
Environment Agency in partnership with Natural England and Countryside Council for Wales Understanding water for wildlife
< Section divider
This do
cumen
t was
with
drawn o
n 6 N
ovem
ber 2
017.

General informationMolinia meadows are primarily found on moist,moderately base-rich peats and peaty gley soils, oftenwith fluctuating water tables. They usually occur ascomponents of wet pastures or fens, and often formmosaics with dry grassland, heath, mire and scrubcommunities. Molinia meadows are widely butdiscontinuously distributed throughout the UK, withconcentrations in south-west England, western andcentral Wales, East Anglia, northern England and thesouth-west of Northern Ireland (Ref. 4).
A number of Molinia meadows hold populations ofnotable species, including the Cambridge milk parsley(Selinum carvifolia), vipers grass (Scorzonera humilis),soft-leaved sedge (Carex montana), and the marshfritillary butterfly (Euphydryas aurinia).
Description• Molinia meadows are distinctive in character,
containing various species-rich types of fen meadowand rush pasture (Ref. 8);
• Molinia grasslands in the UK are represented by twoNVC types:– M24 Molinia caerulea – Cirsium dissectum fen-meadow– M26 Molinia caerulea – Crepis paludosa mire
• The M25 NVC type is a Molinia based community,which is not part of the SAC type. Some stands arespecies-rich and of high conservation value,particularly in the lowlands;
• A full description of these NVC types can be found inRef. 7;
• This habitat type includes the most species-rich ofthe Molinia grasslands in the UK, in which purplemoor-grass (Molinia caerulea) is accompanied by awide range of associated species which includerushes, sedges and herbs (Ref. 4);
• The sharp-flowered rush (Juncus acutiflorus) isgenerally abundant (Ref. 8);
• The vegetation often occurs in a mosaic with patchesof wet heath, dry grassland, swamp and scrub (Ref. 8), and can also represent transitions to these other communities; and
• The more impoverished forms of Molinia pasture onacidic substrates are excluded from the Annex Idefinition (Ref. 4).
Key influencesWater resources• The ecological requirements for Molinia meadows is
not fully understood, however, the integrity of themeadow may be affected by changes to thehydrological regime, and is likely to be a key factorpreventing vegetation change. Abstraction maytherefore affect this habitat type;
• Critical influences on Molinia grasslands are thehydrology and water quality status including base-status (Ref. 8);
• The hydrological regimes necessary for this habitatare narrowly defined. More data is required beforeconclusions can be drawn (Ref. 6);
• Molinia meadows occur in a number of situations. Inlowland landscapes, M24 and M26 both occur wherethe water table is near the ground surface (Ref. 6).These conditions are typically found on undulatingplateaux and hillsides as well as in stream and river valleys;
• M26 occurs in upland situations associated withflushed slopes in enclosed sub-montane meadowsand pastures or as part of the toposequence aroundopen waters and mires (Ref. 7);
• When hydrological requirements are not met, speciesthat are not present in high frequencies in Moliniagrasslands can increase and invade, changing thecomposition of the grassland (Ref. 6); and
• Catchment hydrology can also have an impact where itmay alter run-off or reduce local water tables (Ref. 6).
Species and habitats Guidance notes – Habitats Temperate heath, scrub and grasslands: Molinia meadows 2.2.3
Environment Agency in partnership with Natural England and Countryside Council for Wales Understanding water for wildlife
Molinia meadows on calcareous, peatyor clayey-silt-laden soils (Molinion caerulea)
2.2.3 Temperate heath, scrub and grasslands
< Section divider
This do
cumen
t was
with
drawn o
n 6 N
ovem
ber 2
017.

Other influences• It has been suggested that soils for Molinia meadows
are generally poor in nutrients. Alterations of thecatchments nutrient budget can affect this habitat(Ref. 6);
• Atmospheric deposition may also contribute to thenutrient budgets of this habitat (Ref. 6);
• Regular grazing and hay cutting of Molinia meadowsis required (Ref. 6); and
• Long term climate change may affect Moliniameadows, particularly through decreasinggroundwater recharge (Ref. 6).
Current and future workDr. David Gowing of the Open University and CranfieldUniversity has conducted extensive research into theecohydrological requirements of plants, particularlygrasslands and meadows (Ref. 2).
Species and habitats Guidance notes – Habitats Temperate heath, scrub and grasslands: Molinia meadows 2.2.3
Environment Agency in partnership with Natural England and Countryside Council for Wales Understanding water for wildlife
Key referencesGeneral description & habitat details1. Benstead, P., Drake, M., Jóse, P., Mountford, O., Newbold, C. & Treweek, J. (1997). The Wet Grassland Guide:Managing floodplain and coastal grasslands for wildlife. Royal Society for the Protection of Birds. Sandy Beds.
2. Gowing et al 2002 The water-regime requirements and the response to the hydrological change of grasslandplant communities. Final Report to DEFRA (conservation management division)) Project BD1310: London.
3. Joint Nature Conservation Committee, 6410 Molinia meadows on calcerous, peaty or clayey-silt-laden soils.Available: http://www.jncc.gov.uk/Protectedsites/SACselection/habitat.asp?FeatureIntCode=H6410 Accessed23/02/07.
4. McLeod, CR., Yeo, M., Brown, A.E., Burn, A.J., Hopkins, J.J., & Way, S.F. (eds.) (2002). The Habitats Directive:selection of Special Areas of Conservation in the UK. 2nd edn. Joint Nature Conservation Committee,Peterborough. www.jncc.gov.uk/SACselection
5. Mountford et al 2005 Development of eco-hydrological guidelines for wet heaths – phase 1. Available:http://www.english-nature.org.uk/pubs/publication/PDF/620.pdf Accessed: 23rd Feb 2007.
6. Robertson, H. J. & Jefferson, R. G. (2000). Monitoring the Condition of lowland grassland SSSIs, English NatureResearch Report No 315. Volume I English Nature, Peterborough.
7. Rodwell, J.S (ed) (1991). British Plant Communities: Volume 2: Mires & Heaths. Cambridge: CambridgeUniversity Press.
8. UK Biodiversity Group. (1999). UK Biodiversity Group Tranche 2 Action Plans – Volume VI: Terrestrial andfreshwater species and habitats, HMSO, London.
9. Wheeler et al 2004 Ecohydrological Guidelines for Lowland Wetland Plant Communities Available:http://publications.environment-agency.gov.uk/pdf/GEAN0305BIPZ-e-e.pdf Accessed 23rd Feb 2007.
Supporting referencesAnnex I habitat types to be considered with the Molinia meadow habitat are calcareous fens with Cladiummariscus and species of the Caricion davalliana alkaline fens calcium-rich springwater-fed fens. The Annex IIspecies that should be considered are the marsh fritillary (Euphydryas aurinia) and narrow-mouthed whorl snail.Birds of lowland wet and dry grasslands should also be looked at.
< Section divider
This do
cumen
t was
with
drawn o
n 6 N
ovem
ber 2
017.

General informationWet heaths usually occur on acidic, nutrient-poorsubstrates, such as shallow peats or sandy soils withimpeded drainage. Mixtures of cross-leafed heath (Ericatetralix), heather (Calluna vulgaris), grasses, sedgesand bog-mosses (Sphagnum spp) typically dominatethem (Ref. 8).
Northern Atlantic wet heaths with Erica tetralix occurthroughout the UK but populations present in southernand central England are highly localised. Wet heathsbecome more extensive in coverage in the cool and wetnorth and west of the UK, particularly in the ScottishHighlands. The area covered by wet heath issignificantly smaller than that covered by blanket bogsor dry heath (Ref. 8).
DescriptionWet heaths occur in several types of ecologicalgradient:
• In the drier areas of the south and east, wet heathsare local and often restricted to the transition zonebetween European dry heaths and constantly wetvalley mires;
• In the uplands they occur most frequently ingradients between dry heath or other dry, acidhabitats and blanket bogs;
• At high altitude in the Scottish Highlands wet heathsoccur in mosaics with Alpine and Boreal heaths(lichens and northern or montane species may bewell-represented in these situations); and
• Flushed wet heaths are especially frequent in areasof high rainfall, and occur as topogenous fens,usually in channels within heath or grasslandvegetation (Ref. 8).
In the UK, wet heath corresponds to the NVCcommunities:
– H5 Erica vagans – Schoenus nigricans heath– M14 Schoenus nigricans – Narthecium
ossifragum mire – M15 Scirpus cespitosus – Erica tetralix wet heath– M16 Erica tetralix – Sphagnum compactum
wet heath
• Refer to Ref. 10 for further details on NVC typecompositions;
• On the Lizard in Cornwall, Cornish heath (Ericavagans) growing with S. nigricans, cross-leavedheath and purple moor grass (Molinia caerulea)forms a distinctive and unique form of wet heath (H5Erica – Schoenus heath), found nowhere else inEurope (Ref. 8);
• A further very local wet heath type is Schoenus –Narthecium mire (M14), which is mainly associatedwith transitions from heath to valley bog at a smallnumber of lowland sites in southern Britain (Ref. 8);
• Scirpus – Erica wet heath (M15) is found in areas ofmoderate to high rainfall, and is typical of wet heathvegetation in the north and west of the UK. Cross-leaved heath and heather are typically accompaniedby abundant deergrass (Trichophorum cespitosum)and purple moor-grass (Ref. 8); and
• Erica – Sphagnum wet heath (M16) is characteristicof drier climates in the south and east, and is usuallydominated by mixtures of cross-leafed heath,heather and purple moor grass (Ref. 8).
Key influencesWater resources• Cross-leafed heath is most prevalent on areas of
shallow slope, particularly when this leads to anaccumulation of water. The substratum is typicallywaterlogged and poorly aerated with a high organiccontent (Ref. 2);
• Wet heath may be completely inundated for periodsduring the winter months but summer soil surfaceconditions can be very dry on bare or exposed areas(Ref.12);
• The distribution and abundance of purple moorgrass, cross-leafed heath and heather are largelydetermined by the depth to the water table and thedegree and duration of water-logging. Co-existenceby all three species requires a balance betweenwaterlogging, fluctuating water levels and sub-surface flow (Ref. 13);
• The change from a fluctuating to a constantly highwater table is correlated with a decrease in theimportance of heather and an increased proportionof cross-leafed heath (Ref. 13);
Species and habitats Guidance notes – Habitats Temperate heath, scrub and grasslands: Wet heaths with Erica tetralix 2.2.3
Environment Agency in partnership with Natural England and Countryside Council for Wales Understanding water for wildlife
Northern atlantic wet heathswith Erica tetralix
2.2.3 Temperate heath, scrub and grasslands
< Section divider
This do
cumen
t was
with
drawn o
n 6 N
ovem
ber 2
017.

• Experiments conducted to determine the effect ofwater level and soil moisture on growth, droughtresistance and leaf transpiration in four heathlandspecies, which included cross-leafed heath indicatedthat (refer to Ref. 5):
• All species grow best at a water level of -8 cm• Cross-leafed heath is the most tolerant of
permanently saturated soils (water level of 0 cm) andof high substrate drought conditions. It also toleratesconditions almost as dry as bell heather, a speciestypical of dry heath
• Dorset heath is less resistant to high substratedrought conditions;
• With the exception of Michael (1996) there is littlepublished quantitative information on the soil waterregimes of wet heaths (Ref. 7); and
• Refer to Refs. 12 and 15 for further information onthe water level requirements of a number of species.
Other influences• Heathland habitats are dependent upon base-
deficient (acidic) soils with low nutrient status (Refs.12 & 14);
• When phosphorus or nitrogen availability isincreased, cross-leafed heath is out competed bypurple moor grass, which responds quicker toincreased nutrient availability (Refs. 1 & 3);
• The percentage cover of cross-leafed heath isenhanced with rising carbon dioxide and hydrogensulphide concentrations in the ground water(Ref.15);
• A high level of soil organic matter may be importantfor Erica species but further research is required todetermine the relationship between soil organicmatter and cross-leafed heath. Organic substrateshave a better moisture retention capacity thanmineral substrates (Ref. 4); and
• In addition to changes in water resources, lowlandheathlands are subject to a range of pressures,including inappropriate grazing management, scrubencroachment, pollution and fire which lead tohabitat loss and fragmentation.
Current and future workRecent work includes guidelines on the eco-hydrologicalrequirements of wet heaths compiled by English Nature(now Natural England) and the Centre for Ecology andHydrology (Ref. 9). In 2004 The Environment Agencypublished Eco-hydrological guidelines for lowlandwetland communities (Ref. 16). Both documents providedetails that may be of use in assessing the requirementsof North Atlantic Wet Heaths.
Species and habitats Guidance notes – Habitats Temperate heath, scrub and grasslands: Wet heaths with Erica tetralix 2.2.3
Environment Agency in partnership with Natural England and Countryside Council for Wales Understanding water for wildlife
< Section divider
This do
cumen
t was
with
drawn o
n 6 N
ovem
ber 2
017.

Species and habitats Guidance notes – Habitats Temperate heath, scrub and grasslands: Wet heaths with Erica tetralix 2.2.3
Environment Agency in partnership with Natural England and Countryside Council for Wales Understanding water for wildlife
Key referencesGeneral description & habitat details1. Aerts, R. and Berendse, F. (1988). ‘The effects of increased nutrient availability on vegetation dynamics in wetheathlands’. Vegetatio. 76: 63-69.
2. Bannister, P. (1966). ‘Biological Flora of the British Isles: Erica tetralix’. Journal of Ecology. 52: 795-813.
3. Berendse, F. and Aerts, R. (1984). ‘Competition between Erica tetralix L. and Molinia caerulea (L.) Moench as affectedby the availability of nutrients’. Acta Oecol/Oeceol Plant. 5(19): 3-14. (as cited in Aerts and Berendse, 1988).
4. Girmingham, (1992). As cited in Clarke, C.T., (1997). ‘Role of soils in determining sites for lowland heathlandreconstruction in England’. Restoration Ecology. 5: 256-264.
5. Gloaguen, J.C. (1987). ‘On the water relations of four heath species’. Vegetatio. 70: 29-32.
6. Haskins, L. (2000). ‘Heathlands in an urban setting – effects of urban development on heathlands of south-eastDorset’. British Wildlife. April 2000: 229-237.
7. Humphries, R.N., Benyon, P.R. & Leverton, R.E. (1995). ‘Hydrological performance of a reconstructed heathlandsoil profile’. Land Contamination & Reclamation. 3(2): 101-103.
8. McLeod, C.R., Yeo, M., Brown, A.E., Burn, A.J., Hopkins, J.J., & Way, S.F. (eds.) (2002). The Habitats Directive:selection of Special Areas of Conservation in the UK. 2nd edn. Joint Nature Conservation Committee, Peterborough.www.jncc.gov.uk/SACselection
9. Mountford et al 2005 Development of eco-hydrological guidelines for wet heaths – phase 1. Available:http://www.english-nature.org.uk/pubs/publication/PDF/620.pdf Accessed: 23rd Feb 2007.
10. Newbold, C. & Mountford, O. (1997). Water level requirements of wetland plants and animals. English NatureFreshwater Series No 5. English Nature, Peterborough.
11. Rodwell, J.S. (ed.) (1991) British plant communities – Vol.II : Mires & Heaths. Joint Nature Conservancy Council,Cambridge University Press, Cambridge.
12. Rose, R.J. & Webb, N.R. (2000). Restoration of Wet Heath Scoping Study. Centre for Ecology & Hydrologyreport to DTI.
13. Rutter, A.J. (1955). ‘The composition of wet-heath vegetation in relation to the water-table’. Journal of Ecology.43: 407-443 (as cited in Bannister, 1966).
14. Tubbs, C. (1985). ‘The decline and present status of the English lowland heaths and their vertebrates’. Focuson Nature Conservation. 11: 1-20.
15. Webster, J.R. (1962). ‘The composition of wet-heath vegetation in relation to the aeration of the ground waterand the soil. I. Field studies of ground-water and soil aeration in several communities’. Journal of Ecology. 50: 639-50 (as cited in Bannister, 1966).
16. Wheeler et al 2004 Ecohydrological Guidelines for Lowland Wetland Plant Communities Available:http://publications.environment-agency.gov.uk/pdf/GEAN0305BIPZ-e-e.pdf Accessed 23rd Feb 2007.
Supporting referencesThe following Annex I habitat types and Annex II species which should be considered with Northern Atlantic wetheaths with Erica tetralix; blanket bogs, calcareous fens with Cladium mariscus and species of the Cariciondavallianae. The great crested newt and southern damselfly should also be refered to.
< Section divider
This do
cumen
t was
with
drawn o
n 6 N
ovem
ber 2
017.

General informationThis Annex I type comprises species-rich hay meadowson moderately fertile soils of river and tributaryfloodplains. Most examples are cut annually for hay,with light aftermath grazing. Seasonal floodingmaintains an input of nutrients (Ref 6). Lowland HayMeadows are species rich areas, which occur on fertilesoils of river and tributary floodplains. Most examplesare cut or grazed and seasonal flooding maintainsnutrient input (Ref. 6). It is estimated that this habitattype covers less than 1500 hectares in total andsurvives at small scattered sites (Ref. 8). This habitatoccurs throughout Europe but is rare in the UK,inhabiting central and southern England as well as theWelsh borders. There are particularly importantconcentrations in the flood plains of the River Thamesand its tributaries, and those associated with the Valeof York rivers, especially the Derwent (Ref. 8).
Agricultural intensification has contributed to thedecline of this habitat type which is estimated to havereceeded by 97 per cent over the past 50 years and arecontinuing to decline at 2-10 per cent annually (Ref. 8).
DescriptionThis habitat type is characterised by species-richswards containing frequent red fescue (Festuca rubra),crested dog’s-tail (Cynosurus cristatus), meadow foxtail(Alopercurus pratensis), great burnet (Sanguisorbaofficinalis), meadow sweet (Filipendula ulmaria) andmeadow buttercup (Ranunculus acris) and provides theprimary habitat of the Fritillaria meleagris in the UK(Ref. 6). This habitat type corresponds to the NationalVegetation Classification type MG4 Alopecuruspratensis-Sanguisorba officinalis grassland (Ref. 6).
Key influencesWater resources• A reduction in inundation frequency and duration in
lowland hay meadows as a result of irrigation, landdrainage, flood defences, surface and ground waterabstraction, floodplain gravel abstraction or changesin the climate has contributed to the decline of thishabitat type (Ref. 8).
Other influences• Lowland hay meadows have been declining due to a
reduction in the quality and quantity of their habitatand its fragmentation resulting from:
• Agricultural improvement through drainage,ploughing, re-seeding, fertiliser treatment, slurryapplication, conversion to arable land and a shiftfrom hay-making to silage production (Ref. 8)
• Abandonment and the invasion of bracken(Pteridium aquilinum) and scrub (Ref. 8)
• A reduction in water quality due to eutrophication,application of herbicides and pesticides,atmospheric deposition and acidification
• Floristic impoverishment due to grazing pressures(Ref. 8).
Current and future workSeveral studies currently in progress are investigatingpossibilities for establishing species-rich grasslands bycessation of nutrient inputs, seeding and turfing withwild species and arable reversion (Ref. 8).
Species and habitats Guidance notes – Habitats Temperate heath, scrub and grasslands: Lowland hay meadows 2.2.3
Environment Agency in partnership with Natural England and Countryside Council for Wales Understanding water for wildlife
Lowland hay meadows(Alopecurus pratensis, Sanguisorba officinalis)
2.2.3 Temperate heath, scrub and grasslands
< Section divider
This do
cumen
t was
with
drawn o
n 6 N
ovem
ber 2
017.

Species and habitats Guidance notes – Habitats Temperate heath, scrub and grasslands: Lowland hay meadows 2.2.3
Environment Agency in partnership with Natural England and Countryside Council for Wales Understanding water for wildlife
Key references1. Blackstock TH, Rimes CA, Stevens DP, Jefferson RG, Robertson HJ, Mackintosh J and Hopkins JJ, 1999 The extentof semi-natural grassland communities in lowland England and Wales: a review of conservation surveys 1978-96.Grass and Forage Science, 54, 1, 1-18.
2. Fuller RM, 1987 The changing extent and conservation interest of lowland grasslands in England and Wales: areview of grassland surveys 1930-84. Biological Conservation, 40, 281-300.
3. Jefferson RG, 1997 Distribution, status and conservation of Alopercurus pratensis – Sanguisorba officinalis floodplain meadows in England. English Nature Research Report 249: Peterborough.
4. Jefferson RG and Robertson HJ, 1996 Lowland grassland – a strategic review and action plan. English NatureResearch Report 163: Peterborough.
5. Jefferson RG and Robertson HJ, 1996 Lowland grassland – wildlife value and conservation status. English NatureResearch Report 169: Peterborough.
6. Joint Nature Conservation Committee, 6510 Lowland hay meadows (Alopecurus pratensis, Sanguisorbaofficinalis). Retrieved March 14, 2006 http://www.jncc.gov.uk/ProtectedSites/SACselection/habitat.asp?FeatureIntCode=H6510
7. Rodwell JS, 1992 British Plant Communities Volume 3, Grasslands and Montane Communities. University Press:Cambridge.
8. UK Biodiversity Action Plan, Habitat Action Plan Lowland Meadows. Retrieved 14 March 06 fromhttp://www.ukbap.org.uk/UKPlans.aspx?ID=10
Supporting referencesLowland hay meadows are an important habitat for the corncrake (Crex crex) and a number of farmland birdsincluding the skylark (Alauda arvensis) and the Fritillaria meleagris in the UK (Ref. 8 & 6).
< Section divider
This do
cumen
t was
with
drawn o
n 6 N
ovem
ber 2
017.

General informationHeaths containing the cross-leaved heath (Erica tetralix)or the nationally rare Dorset heath (E. ciliaris) aregenerally found on acid soils with slightly impededdrainage, although in Cornwall they extend onto drysoils. The abundance of Dorset heath differentiates thishabitat from other Annex I heath types (Ref. 8).
Dorset heath is at the northern limit of its presentdistribution in the UK. It has been suggested that thenorthern range may be limited by lower summertemperatures acting on the maturation of seed (Ref. 13). This form of heathland is confined to warm,oceanic locations in the UK. It is a rare habitat,occurring naturally only in Dorset and Cornwall (Ref. 8).
Description• Temperate Atlantic wet heaths with Dorset heath and
crossed-leaved heath often contain heather (Callunavulgaris) and varying proportions of bell heather(Erica cinerea). Other associated species includepurple moor-grass (Molinia caerulea), bristle bent(Agrostis curtisii) and dwarf gorse (Ulex minor), withthe latter being replaced by western gorse (U. gallii)in south-west England (Ref. 8).
This habitat type is not recognised as a distinctcommunity in the NVC but includes forms of thefollowing communities in which Dorset heath isabundant:
• H3 Ulex minor – Agrostis curtisii heath• H4 Ulex gallii – Agrostis curtisii heath• M16 Erica tetralix – Sphagnum compactum wet heath• M21 Narthecium ossifragum – Sphagnum
papillosum valley mire;• Refer to Ref. 11 for further details on NVC type
compositions; and• These heaths may grade into wetter heath and bog
communities, notably valley mires with bog-moss(Sphagnum spp.) and bog asphodel (Nartheciumossifragum) (Ref. 8).
Key influencesWater resources• In the UK, cross-leaved heath and Dorset heath
generally grow on soils that are permanently orfrequently waterlogged (Ref. 7);
• Wet heath may be completely inundated for periodsduring the winter months but summer soil surfaceconditions can be very dry on bare or exposed areas(Ref. 14);
• In Cornwall, Dorset heath occurs at a number oflocalities where soil conditions are drier and in onecase it has been recorded growing on turf-clad stonewalls (Ref. 13);
• The distribution and abundance of purple moorgrass, cross-leaved heath and heather are largelydetermined by the depth to the water table and thedegree and duration of water-logging. Co-existenceby all three species requires a balance betweenwaterlogging, fluctuating water levels and sub-surface flow (Ref. 15);
• The change from a fluctuating to a constantly highwater table is correlated with a decrease in theimportance of heather and an increased proportionof cross-leaved heath (Ref. 15);
• Experiments conducted to determine the effect ofwater level and soil moisture on growth, droughtresistance and leaf transpiration in four heathlandspecies, which included cross-leaved heathindicated that (Ref. 5):
• All species grow best at a water level of -8 cm• Cross-leaved heath is the most tolerant of
permanently saturated soils (water level of 0 cm) andof high substrate drought conditions. It also toleratesconditions almost as dry as bell heather, a speciestypical of dry heath
• Dorset heath is less resistant to high substratedrought conditions
• With the exception of Michael (1996) there is littlepublished quantitative information on the soil waterregimes of wet heaths (Ref. 7); and
• Refer to Rose & Webb (2000) and Newbold &Mountford (1997) for further information on thewater level requirements of a number of species.
Species and habitats Guidance notes – Habitats Temperate heath, scrub and grasslands: Temperate atlantic wet heaths 2.2.3
Environment Agency in partnership with Natural England and Countryside Council for Wales Understanding water for wildlife
Temperate atlantic wet heaths withErica ciliaris and Erica tetralix
2.2.3 Temperate heath, scrub and grasslands
< Section divider
This do
cumen
t was
with
drawn o
n 6 N
ovem
ber 2
017.

Other influences• Within Dorset populations of Dorset heath, growth is
most prolific in the wet heath zone where there isshallow peat. In this situation the plants root intoboth the peat layer and the underlying mineral soiland may, in such circumstances, dominate thevegetation (Ref. 13);
• Poorly aerated soils with a high organic content arepreferred (Ref. 2). Organic substrates have a bettermoisture retention capacity than mineral substrates(Ref. 4);
• Heath habitats are dependent upon base-deficient(acidic) soils with low nutrient status (Ref. 14 & 15);
• When phosphorus or nitrogen availability isincreased, cross-leaved heath is out competed bypurple moor grass, which responds quicker toincreased nutrient availability (Ref. 1 & 3);
• The percentage cover of cross-leaved heath isenhanced with rising carbon dioxide and hydrogensulphide concentrations in the ground water (Ref. 16); and
• Lowland heaths are subject to a range of pressuresincluding habitat loss and fragmentation, pollutionand fire (Ref. 6).
Current and future workRecent work includes guidelines on the eco-hydrologicalrequirements of wet heaths compiled by English Nature(now Natural England) and the Centre for Ecology andHydrology (Ref.10). In 2004 The Environment Agencypublished Eco-hydrological guidelines for lowlandwetland communities (Ref. 17). Both documents providedetails that may be of use in assessing the requirementsof Temperate Atlantic Wet Heaths.
Species and habitats Guidance notes – Habitats Temperate heath, scrub and grasslands: Temperate atlantic wet heaths 2.2.3
Environment Agency in partnership with Natural England and Countryside Council for Wales Understanding water for wildlife
< Section divider
This do
cumen
t was
with
drawn o
n 6 N
ovem
ber 2
017.
Key referencesGeneral description & habitat details1. Aerts, R. and Berendse, F. (1988). ‘The effects of increased nutrient availability on vegetation dynamics in wetheathlands’. Vegetatio. 76: 63-69.
2. Bannister, P. (1966). ‘Biological Flora of the British Isles: Erica tetralix’. Journal of Ecology. 52: 795-813.
3. Berendse, F. & Aerts, R. (1984). ‘Competition between Erica tetralix L. and Molinia caerulea (L.) Moench as affectedby the availability of nutrients’. Acta Oecol/Oeceol Plant. 5(19): 3-14. (as cited in Aerts and Berendse, 1988).
4. Girmingham, (1992). As cited in Clarke, C.T. (1997). ‘Role of soils in determining sites for lowland heathlandreconstruction in England’. Restoration Ecology. 5: 256-264.
5. Gloaguen, J.C. (1987). ‘On the water relations of four heath species’. Vegetatio. 70: 29-32.
6. Haskins, L. (2000). ‘Heathlands in an urban setting – effects of urban development on heathlands of south-eastDorset’. British Wildlife. April 2000: 229-237.
7. Humphries, R.N., Benyon, P.R. & Leverton, R.E. (1995). ‘Hydrological performance of a reconstructed heathlandsoil profile’. Land Contamination & Reclamation. 3(2): 101-103.
8. McLeod, C.R., Yeo, M., Brown, A.E., Burn, A.J., Hopkins, J.J., & Way, S.F. (eds.) (2002). The Habitats Directive:selection of Special Areas of Conservation in the UK. 2nd edn. Joint Nature Conservation Committee, Peterborough.www.jncc.gov.uk/SACselection
9. Michael, N. (1996). Lowland Heathland in England: A Natural Areas Approach. English Nature Research ReportNo 170. English Nature, Peterborough.
10. Mountford et al 2005 Development of eco-hydrological guidelines for wet heaths – phase 1. Available:http://www.english-nature.org.uk/pubs/publication/PDF/620.pdf Accessed: 23rd Feb 2007.
11. Newbold, C. & Mountford, O. (1997). Water level requirements of wetland plants and animals. English NatureFreshwater Series No 5. English Nature, Peterborough.
12. Rodwell, J.S. (ed.) (1991) British plant communities – Vol.2 : Mires & Heath. Cambridge. Cambridge University Press.
13. Rose, R.J., Bannister, P. & Chapman, S.B. (1996). ‘Biological Flora of the British Isles: Erica ciliaris L’. Journal ofEcology. 84: 617-628.
14. Rose, R.J. & Webb, N.R. (2000). Restoration of Wet Heath Scoping Study. Centre for Ecology & Hydrology reportto DTI.
15. Rutter, A.J. (1955). ‘The composition of wet-heath vegetation in relation to the water-table’. Journal of Ecology.43: 407-443 (as cited in Bannister, 1966).
16. Webster, J.R. (1962). ‘The composition of wet-heath vegetation in relation to the aeration of the ground waterand the soil. I. Field studies of ground-water and soil aeration in several communities’. Journal of Ecology.50: 639-50 (as cited in Bannister, 1966).
17. Wheeler et al 2004 Ecohydrological Guidelines for Lowland Wetland Plant Communities Available:http://publications.environment-agency.gov.uk/pdf/GEAN0305BIPZ-e-e.pdf Accessed 23rd Feb 2007.
Supporting referencesThe following Annex I habitats and Annex II species types should be considered with temperate Atlantic wetheaths with Erica ciliaris and Erica tetralix: european dry heaths, blanket bogs, alpine and boreal heaths,calcareous fens with Cladium mariscus and species of the Caricion davallianae and southern damselfly(Coenagrion mercuriale).
Species and habitats Guidance notes – Habitats Temperate heath, scrub and grasslands: Temperate atlantic wet heaths 2.2.3
Environment Agency in partnership with Natural England and Countryside Council for Wales Understanding water for wildlife
< Section divider
This do
cumen
t was
with
drawn o
n 6 N
ovem
ber 2
017.

2.2.4 Raised bogs,fens, mires, alluvialforests and bog woodlandThe following accounts are intended to provide a summary of relevantinformation on the freshwater requirements of raised bogs, fens, mires,alluvial forests and bog woodlands. For many of the habitat types there isvery little published material directly associated with them and as such thesesummaries should be treated with the necessary precautions. For furtherinformation, refer to references listed in each habitat summary.
– Tilio-Acerion forests
– Alkaline fens and calcium rich springwater fed fens
– Alluvial forest with Alnus glutinosa and Fraxinus excelsior (Alno-Padion, Alnion incanae, Salicionalbae)
– Alpine pioneer formations of the Caricion bicoloris-atrofuscae
– Blanket bogs
– Bog woodlands
– Calcareous fens with Cladium mariscus and species of the Caricion davallianae
– Depressions on peat substrates of the Rhynchosporion
– Petrifying springs with tufa formation (Cratoneurion)
– Raised bog (Ombrotrophic bog)
– Transition mires and quaking bogs
Species and habitats Guidance notes – Habitats Raised bogs, fens, mires, alluvial forests and bog woodland 2.2.4
Environment Agency in partnership with Natural England and Countryside Council for Wales Understanding water for wildlife
< Section divider
This do
cumen
t was
with
drawn o
n 6 N
ovem
ber 2
017.
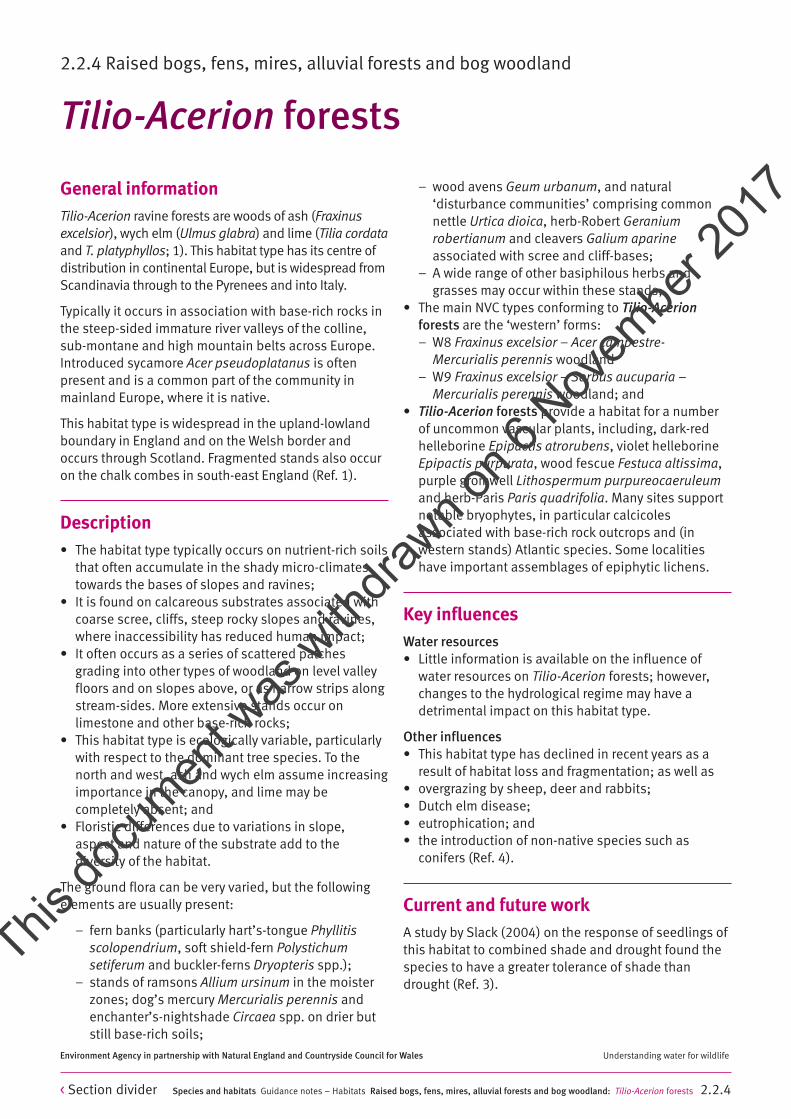
General informationTilio-Acerion ravine forests are woods of ash (Fraxinusexcelsior), wych elm (Ulmus glabra) and lime (Tilia cordataand T. platyphyllos; 1). This habitat type has its centre ofdistribution in continental Europe, but is widespread fromScandinavia through to the Pyrenees and into Italy.
Typically it occurs in association with base-rich rocks inthe steep-sided immature river valleys of the colline,sub-montane and high mountain belts across Europe.Introduced sycamore Acer pseudoplatanus is oftenpresent and is a common part of the community inmainland Europe, where it is native.
This habitat type is widespread in the upland-lowlandboundary in England and on the Welsh border andoccurs through Scotland. Fragmented stands also occuron the chalk combes in south-east England (Ref. 1).
Description• The habitat type typically occurs on nutrient-rich soils
that often accumulate in the shady micro-climatestowards the bases of slopes and ravines;
• It is found on calcareous substrates associated withcoarse scree, cliffs, steep rocky slopes and ravines,where inaccessibility has reduced human impact;
• It often occurs as a series of scattered patchesgrading into other types of woodland on level valleyfloors and on slopes above, or as narrow strips alongstream-sides. More extensive stands occur onlimestone and other base-rich rocks;
• This habitat type is ecologically variable, particularlywith respect to the dominant tree species. To thenorth and west, ash and wych elm assume increasingimportance in the canopy, and lime may becompletely absent; and
• Floristic differences due to variations in slope, aspect and nature of the substrate add to thediversity of the habitat.
The ground flora can be very varied, but the followingelements are usually present:
– fern banks (particularly hart’s-tongue Phyllitisscolopendrium, soft shield-fern Polystichum setiferum and buckler-ferns Dryopteris spp.);
– stands of ramsons Allium ursinum in the moisterzones; dog’s mercury Mercurialis perennis andenchanter’s-nightshade Circaea spp. on drier butstill base-rich soils;
– wood avens Geum urbanum, and natural‘disturbance communities’ comprising commonnettle Urtica dioica, herb-Robert Geraniumrobertianum and cleavers Galium aparineassociated with scree and cliff-bases;
– A wide range of other basiphilous herbs andgrasses may occur within these stands;
• The main NVC types conforming to Tilio-Acerionforests are the ‘western’ forms: – W8 Fraxinus excelsior – Acer campestre-
Mercurialis perennis woodland– W9 Fraxinus excelsior – Sorbus aucuparia –
Mercurialis perennis woodland; and• Tilio-Acerion forests provide a habitat for a number
of uncommon vascular plants, including, dark-redhelleborine Epipactis atrorubens, violet helleborineEpipactis purpurata, wood fescue Festuca altissima,purple gromwell Lithospermum purpureocaeruleumand herb-Paris Paris quadrifolia. Many sites supportnotable bryophytes, in particular calcicolesassociated with base-rich rock outcrops and (inwestern stands) Atlantic species. Some localitieshave important assemblages of epiphytic lichens.
Key influencesWater resources• Little information is available on the influence of
water resources on Tilio-Acerion forests; however,changes to the hydrological regime may have adetrimental impact on this habitat type.
Other influences• This habitat type has declined in recent years as a
result of habitat loss and fragmentation; as well as• overgrazing by sheep, deer and rabbits; • Dutch elm disease; • eutrophication; and • the introduction of non-native species such as
conifers (Ref. 4).
Current and future workA study by Slack (2004) on the response of seedlings ofthis habitat to combined shade and drought found thespecies to have a greater tolerance of shade thandrought (Ref. 3).
Species and habitats Guidance notes – Habitats Raised bogs, fens, mires, alluvial forests and bog woodland: Tilio-Acerion forests 2.2.4
Environment Agency in partnership with Natural England and Countryside Council for Wales Understanding water for wildlife
Tilio-Acerion forests
2.2.4 Raised bogs, fens, mires, alluvial forests and bog woodland
< Section divider
This do
cumen
t was
with
drawn o
n 6 N
ovem
ber 2
017.

Species and habitats Guidance notes – Habitats Raised bogs, fens, mires, alluvial forests and bog woodland: Tilio-Acerion forests 2.2.4
Environment Agency in partnership with Natural England and Countryside Council for Wales Understanding water for wildlife
Key references1. Joint Nature Conservation Committee, 9180 Tilio-Acerion forests of slopes, screes and ravines. Retrieved March30, 2006 from http://www.jncc.gov.uk/protectedsites/sacselection/habitat.asp?FeatureIntCode=H9180
2. European Nature Information System, Factsheet for Tilio-Acerion forests. Retrieved March 30, 2006 fromeunis.eea.int/habitats-factsheet.jsp
3. Slack L, 2004 Responses of temperate woody seedlings to shade and drought: do trade-offs limit potential nichedifferentiation? Oikos 107, 1.
4. UK Biodiversity Action Plan, Upland mixed ashwoods. Retrieved March 30, 2006 fromwww.ukbap.org.uk/UKPlans.aspx?ID=3
Supporting referencesTilio-Acerion forests should be considered with the netted carpet moth (Eustromia reticulatum), pearl borderedfritillary (Boloria euphrosyne), high brown fritillary (Argynnis adippe) and dormouse (Muscardinus avellanarius;Ref. 4).
< Section divider
This do
cumen
t was
with
drawn o
n 6 N
ovem
ber 2
017.

General informationFens are divided into two major groups based upontheir topography and hydrology, topogenous fens andsoligenous fens (Ref. 6). Topogenous fens are formedwhere the topography creates a basin-type watercollection system with little water movement out of thesystem. Three sub-types are recognised, open-watertransition fens, flood plain fens and basin fens.Soligenous fens are formed where sloping terrainprovides a continuous supply of flowing water. Threesub-types are recognised, valley fens, flush fens andcalcareous spring fens. Both fen types are groundwater-fed systems.
Calcareous spring fens develop around freshwatersprings rich in calcium. The water feeding these fenswells up from the ground and often deposits a whitecrust known as ‘tufa’ on the ground vegetation. Sitesare usually very small and often occur within largerwetland systems (Ref. 6).
Alkaline fens occur over a wide geographical rangethroughout the UK, but are uneven and localised indistribution. Important concentrations of this habitatare found in East Anglia, Cumbria, and north-westWales. Alkaline fen vegetation has declineddramatically in the past century throughout the UK, andin many parts of the country only small, fragmentedstands survive (Ref. 6).
Description• Few studies have been undertaken on spring-fed fen
sites and the factors determining vegetationcomposition and productivity (Ref. 4); and
• Alkaline fens contain a complex assemblage ofvegetation types characteristic of sites with tufaand/or peat formation, a high water table and acalcareous base-rich water supply (Ref. 4).
Core vegetation is short sedge mire (mire with low-growing sedge vegetation). Alkaline fens aretransposed into the NVC types:
– M9 Carex rostrata – Calliergoncuspidatum/giganteum mire
– M10 Carex dioica – Pinguicula vulgaris mire
– M13 Schoenus nigricans – Juncus subnodulosusmire;
• A full description of these NVC classifications can befound in Rodwell 1991 (Ref. 7); and
• At most sites, transition to a range of other fenvegetation types is well marked. Alkaline fens mayoccur with various other vegetation types includingswamps (in particular species-poor stands of greatfen-sedge Cladium mariscus), wet grasslands(particularly various types of purple moor-grassMolinia caerulea grassland) and areas rich in rushspecies (Juncus spp.). This habitat has also found tooccur with fen carr, wet heath and acid bogs (Ref. 4).
Key influencesWater resources• Species which constitute the fen habitat type are
considered to be either critically dependent orsupported by groundwater (Ref. 10). The response offen vegetation to groundwater abstraction is difficultto generalise as sensitivity to hydrological changewill vary between communities (Ref. 6);
• The seepage of groundwater is essential for theconservation of the typically mesotrophic characterof the fens (Ref. 9);
• Abstraction of water from boreholes will producelocalised depressions in groundwater-water levels,termed a cone of depression. A reduction inpressures may lead to a decline or cessation inspring flow, to the detriment of the alkaline fenhabitat (Ref. 6);
• The hydrological response of fen communities tochange is not simply limited to a seasonal decline inwater level tables but also to increases in themagnitude and frequency of water table fluctuations,and increases in the duration of water table levelchanges. Such alterations may lead to an increase inthe depth of aeration of the peat profile.Decomposing and dewatered peat may undergoirreversible physical changes and even if the systemis re-watered the response of the fen water table maynot be re-established in the same way (Ref. 3);
Species and habitats Guidance notes – Habitats Raised bogs, fens, mires, alluvial forests and bog woodland: Alkaline fens 2.2.4
Environment Agency in partnership with Natural England and Countryside Council for Wales Understanding water for wildlife
Alkaline fens and calcium rich springwater fed fens
2.2.4 Raised bogs, fens, mires, alluvial forests and bog woodland
< Section divider
This do
cumen
t was
with
drawn o
n 6 N
ovem
ber 2
017.

• Alkaline fens experience lateral water movementderived from the mineral ground. The water table(and usually the site) is strongly sloping and withwater movement maintained primarily bygroundwater discharge (Ref. 2);
• Fairly high and constant summer water tables arerequired with the absence of protracted or deepwinter flooding (Ref. 2); and
• Absence of strongly reducing conditions in therooting zone (caused by water flow and often bysubsurface water tables) (Ref. 2).
Other influences• Specific hydrochemical processes (especially calcite
precipitation) associated with degassing ofdischarging groundwater and concomitantPhosphorus adsorption (Ref. 2);
• Spring-fed, rich-fen sites are irrigated by base-richgroundwater discharge of high pH (>6.0), calcium,iron and hydrogen carbonate (HCO3) concentrations(Ref. 1);
• Oligotrophic to mesotrophic soil water conditions arerequired (Ref. 1); and
• The maintenance of the nutrient status and movingwater conditions are regarded as important factors, if not more, than water levels in alkaline fen habitats(Ref. 1).
Current and future workDrs. B. Wheeler and S. Shaw of the Department ofAnimal and Plant Sciences, University of Sheffield haveprovided an international lead on wetland research formany years. They have related the hydrogeology toplant communities and Natura 2000 interest features inmany East Anglian fens in producing the first edition of
the Wetland Framework. It arose from a collaborativeproject between Sheffield University, the EnvironmentAgency and English Nature. It is continuing over thenext two years to encompass fen types not adequatelyrepresented in East Anglia, bringing in the CountrysideCouncil for Wales as an additional partner. The work hasalso proposed an updated approach to theclassification of wetlands, based on their defininglandscape features and recurring water supplymechanisms (WETMECS).
English Nature (now Natural England) have published areport on the eco-hydrological guidelines for wet heathswhich may be of use when assessing the requirementsof alkaline fens (Ref.5) The Environment Agency haspublished guidelines for lowland wetland communities(Ref.12).
Species and habitats Guidance notes – Habitats Raised bogs, fens, mires, alluvial forests and bog woodland: Alkaline fens 2.2.4
Environment Agency in partnership with Natural England and Countryside Council for Wales Understanding water for wildlife
< Section divider
This do
cumen
t was
with
drawn o
n 6 N
ovem
ber 2
017.

Species and habitats Guidance notes – Habitats Raised bogs, fens, mires, alluvial forests and bog woodland: Alkaline fens 2.2.4
Environment Agency in partnership with Natural England and Countryside Council for Wales Understanding water for wildlife
Key referencesGeneral description & habitat details1. Boyer, M. L. H. &Wheeler, B. D. (1989). ‘Vegetation Patterns in Spring-fed Calcareous Fens: Calcite Precipitationand Constraints on Fertility’, Journal of Ecology, 77:597-609.
2. Environment Agency (1998). Evaluating the Impact of Groundwater Abstraction on Key Conservation Sites, Stage1 Reports for AMP 3, Phase 1, Environment Agency, Anglian Region.
3. Fojt, W. (2000). East Anglian fens and groundwater abstraction, English Nature Research Reports, No 30. EnglishNature, Peterborough.
4. McLeod, C.R., Yeo, M., Brown, A.E., Burn, A.J., Hopkins, J.J., & Way, S.F. (eds.) (2002). The Habitats Directive:selection of Special Areas of Conservation in the UK. 2nd edn. Joint Nature Conservation Committee, Peterborough.www.jncc.gov.uk/SACselection
5. Mountford J.O, Rose R.J, and Bromley J. 2005. Development of eco-hydrological guidelines for wet heaths-phase1. English Nature Report Number 620. Available: http://www.english-nature.org.uk/pubs/publication/PDF/620.pdf
6. O’Connell, C. (2001). Irish Fens Information Sheets. Irish Peatland Conservation Council, Web Accesshttp://www.ipcc.ie/infofensfs.html
7. Rodwell J. S. (ed) (1991). British Plant Communities: Mires & Heaths Volume 2. Joint Nature ConservationCommittee. Cambridge University Press, Cambridge
8. UK Biodiversity Action Plan, Fens. Retreived 15th Feb 2007. Available:http://www.ukbap.org.uk/UKPlans.aspx?ID=18
9. Verhoeven, J., Boudewijn, B., &Vermeer, H. (1985). ‘Species composition of small fens in relation to the nutrientstatus of the peat soil and the ground water’, Colloques phytosociologiques XIII, Végétation et Géomorphologie,815-824.
10. Wheeler, B.D. & Shaw, S.C. (2000). A Wetland Framework for Impact Assessment at Statutory Sites in EasternEngland, R&D Technical Report W6-068/TR1, University of Sheffield, Sheffield.
11. Wheeler, B.D & Shaw, S.C (1995) Fen habitats and the EC Habitats and Species Directive, Reports to the JNCC.
12. Wheeler B.D, Gowing D.J., Shaw S.C, Mountford J.O and Money R.P. 2004 Ecohydrological guidelines forlowland wetland plant communities. Eds A.W. Brookes, P.V. Jose and M.I. Whiteman. Environment Agency (AnglianRegion). Available: http://publications.environment-agency.gov.uk/pdf/GEAN0305BIPZ-e-e.pdf
Supporting referencesAnnex I habitats and Annex II species to be considered with alkaline fens include calcareous fens with Cladiummariscus and species of the Caricion davallianae, petrifying springs with tufa formation (Cratoneurion) and marshsaxifrage (Saxifraga hirculus). Also geyer’s whorl snail (Vertigo geyeri), marsh fritillary Euphydryas aurinia),slender feather moss (Drepanocladus vernicosus), fen orchid (Liparis loeselii), alpine pioneer formations of theCaricion bicoloris-atrofuscae, Alluvial forests with Alnus glutinosa and Fraxinus excelsior (Alno-Padion, Alnionincanae, Salicion albae), molinia meadows on calcareous, peaty or clayey-silt-laden soils (Molinion caerulea) andthe round-mouthed whorl snail (Vertigo genesii) should be considered.
< Section divider
This do
cumen
t was
with
drawn o
n 6 N
ovem
ber 2
017.

General informationAlluvial forests with Alnus glutinosa and Fraxinusexcelsior (Alno-Padion, Alnion incanae, Salicion albae)habitat covers a range of riparian woodland types. Thesehabitats have been much reduced in coveragethroughout Europe by drainage, clearance for agricultureand river management schemes to prevent flooding.
Grey alder is not native in the UK (and not relevant to UKin this habitat type) and the black poplar is poorlydeveloped as an extensive high-forest type, though itmay occur locally as linear stands along the edges ofwatercourses. Clearance of riverine woodland haseliminated most true alluvial forests in the UK. Manysurviving fragments, as elsewhere in Europe, arefragmentary and often of recent origin. However,residual alder woods do frequently occur in associationwith other woodland types or with other wetlandhabitats such as fens (Ref. 9).
DescriptionThe NVC System recognises three main communities ofthe Alno-Padion alluvial forest. In order of “wetness”,these are:
• Alnus glutinosa-Carex paniculata swamps (W5);• A. glutinosa-Urtica dioica (W6);• A glutinosa-Fraxinus excelsior-Lysmachia nemorum
woods (W7);• These communities are divided into a number of sub-
communities;• Key species apart from the plants in alder woodlands
include a number of dependent invertebrates such asthe moths, dingy shell, alder kitten and pale tussock,a number of crane fly species, sawflies, and gallmites. Alder seed cones provide a winter food sourcefor a number of finches such as siskin and redpoll,older trees may provide habitat for bats such asDaubenton’s, and the woods provide cover for otter;
• W5 woodlands are widespread but local in theEnglish lowlands with the reed sub-community morecommon, refer to Ref. 8 for JNCC distribution maps;
• Yellow loosestrife alder woods are more typical ofEast Anglia while the rarer golden saxifrage woodsoccur mainly in the Weald. W2a willow fen has a
similar distribution, predominating in East Angliawith further examples in Cheshire;
• W6 woodlands are widespread, but confined to un-drained floodplains, eutrophic mires or other siteswhere continued periodic flooding with activealluvial deposition occurs; and
• W7 woodlands are more characteristic of woodedvalleys of slightly sharper relief and are consequentlymore common on the fringes of the uplands in thenorth and west of the UK and areas such as theWeald in south-east England.
Key influencesWater resources• Alder (A. glutinosa) achieves dominance in woodlands
where light levels are high and the substrate is verywet or permanently inundated. It is therefore a typicalspecies of the waters edge where both requirementsare met. Alder is weakly competitive and declines inconditions of decreasing water levels that allow othertree species to colonise, with light competition thelikely principle factor (Ref. 4);
• The W5 and W6 communities are essentially those oflowland habitats where the ground is level and wateris derived from surface flow or groundwater inputs.The W5 swamp community is characteristic of theedges of standing or very slow moving waters. Theyare also found on flood-plain mires but are notnormally in close proximity to the river channel, orvalley mires. They are permanently wet andwaterlogged but do not generally receive direct andregular alluvial inputs from surface flows, thoughsome flood-plain mires on the more extensive flood-plains may experience occasional inundation. Thesesystems normally rely on ground-water inputs ofbase-rich waters from chalks, limestones orcalcareous sandstones. W5a, reed and W5b, yellowloosestrife sub-communities represent a seraltransition from open waters to drier woodland. TheW5c golden saxifrage sub-community is commonlyassociated with seepage zones in other woodlandtypes. Fen carr of the W2a sub community has similarcharacteristics to W5a and b;
Species and habitats Guidance notes – Habitats Raised bogs, fens, mires, alluvial forests and bog woodland: Alluvial forest 2.2.4
Environment Agency in partnership with Natural England and Countryside Council for Wales Understanding water for wildlife
Alluvial forest with Alnus glutinosa andFraxinus excelsior (Alno-Padion, Alnion incanae, Salicion albae)
2.2.4 Raised bogs, fens, mires, alluvial forests and bog woodland
< Section divider
This do
cumen
t was
with
drawn o
n 6 N
ovem
ber 2
017.

• W6 alder-nettle woods are generally typical ofconditions of alluvial deposition and nutrientenrichment derived from periodic flooding from riverchannels. A similar woodland type may develop frominputs of particularly nutrient-rich groundwaters. Asdescribed above, the degree of soil wetness andfrequency of flooding with its associated inputs ofsilt and organic matter, determine the nature of thesub-community with willow species forming acommon riverside fringe. The importance of waterlevel fluctuations in determining the sub-communityzonation is shown by Van Splunder et al. (1995).They noted how the distribution of the larger willowspecies in alluvial woodlands is related to the waterlevels at seeding time while black poplar, with alonger seed viability, germinates at lower soilmoisture levels. As water levels in the flood plainsoils decreases with an increase in height away fromthe river channel, the cover of alder decreases andother tree species occur with ash being one of thefirst to achieve dominance. The community thentypically grades into an oak/ash or an oak/elmassociation, the community depending on soil typeand geography;
• Valley side woodlands W7 are less susceptible towater management issues within the main riverchannel, but may be vulnerable to operations thataffect the ground water inputs either fromabstractions or other developments that mayinterrupt the supply;
• The W7 alder-ash-yellow pimpernel woods describedin the NVC rely mainly on ground water suppliedeither laterally as springline flow from the rock strataor from subsurface flows down the valley slopes; and
• Continuing demands on water resources renders fenhabitats in general vulnerable to vegetation changearising from fluctuating water levels, eutrophication,or from succession to drier woodland types followingdecreases in water level.
Other influences• Variation in the UK alderwood community arises from
differences in the soil nutrient status or the nutrientssupplied by water inputs, geography andtopography;
• With a pH tolerance of around 4.5 – 8, alder avoidsmore acid substrates typical of sphagnum miresand bogs;
• W5 and W6 commonly stand on organic-rich soils ordeposits of fen peat;
• Historically the drainage of marshes and fens withagricultural intensification has reduced the cover ofthe W5 woodland. W6 have also suffered losses fromsimilar activities. Where woodlands remain, theriparian zones are typically contracted to regulateriver flows and reduce the area and frequency offlooding (Ref. 18 & 19). More complete levels of floodprotection, e.g. embankments, which preventflooding altogether and the concomitant processesof alluvium and nutrient deposition, may eliminatesome riparian woodland types (Ref. 18) and result inchanges to the species composition, woodlandstructure and aspects of soil chemistry;
• In some of the smaller basin or valley mire systemswhere peat levels are building, there may be anatural succession to more open sphagnumdominated mires with loss of alder as substrateacidity increases (reviewed in Ref. 15);
• Nutrient pollution may result in changes to theground flora from a more species-rich low-herbcommunity to a tall-herb type dominated by nettle inW7. Changes in the ground flora can also arise fromcolonisation by invasive alien plant species of whichHimalayan balsam (Impatiens glandulifera) is themost significant for riverside alder woods; and
• The implications of the disease in alder caused by thefungus Phytophthora for native alder woods in the UKand Europe have yet to be established (Ref. 3).
Current and future workEnglish Nature (now Natural England) have published aresearch report on the eco-hydrological guidelines forwet woodlands which includes a section on alluvialforests. English Nature Research Report number 619should be consulted (Ref. 2).
Species and habitats Guidance notes – Habitats Raised bogs, fens, mires, alluvial forests and bog woodland: Alluvial forest 2.2.4
Environment Agency in partnership with Natural England and Countryside Council for Wales Understanding water for wildlife
< Section divider
This do
cumen
t was
with
drawn o
n 6 N
ovem
ber 2
017.

Species and habitats Guidance notes – Habitats Raised bogs, fens, mires, alluvial forests and bog woodland: Alluvial forest 2.2.4
Environment Agency in partnership with Natural England and Countryside Council for Wales Understanding water for wildlife
Key referencesGeneral description & habitat details1. Anon. (1994). The Management of semi-natural woodlands: wet woodlands. Practice Guide 008 Anon. ForestryCommission.
2. Barsoum N, Anderson R, Broadmeadow S, Bishop H and Nisbet T, 2005 Eco-hydrological guidelines for wetwoodland – Phase I. English Nature Research Reports Number 619, English Nature: Peterborough.
3. Carbiener, R. & Tremolieres, M. (1990) ‘The Rhine rift valley ground-water river interactions. Evolution of theirsusceptibility to pollution’. Regulated Rivers Research & Management 5 (5), 374-390.
4. Eschenbach, C. (2000) ‘The effect of light acclimation of single leaves on whole tree growth and competition –an application of the tree growth model ALMIS’. Ann. For. Sci. 57, 599-609.
5. Gibbs, J. N. Lipscombe, M. A. & Pierce, A. J. (1999) ‘The impact of Phytophthora disease on riparian populationsof the common alder (Alnus glutinosa) in southern Britain’. European J. of Forest Pathol. 29, 39-50.
6. Grime, J. P. Hodgson, J. G. & Hunt, R. (1998) ‘Comparative Plant Ecology; a functional approach to commonBritish species. Unwin Hyman, London.
7. Grosse, W. & Schroeder, P. (1984) ‘Oxygen supply of roots by gas transport in alder trees’. Z. Naturforsch 39c,1186-1188.
8. Hall, J E, Kirby, K J, & Whitbread, A M (2001). National Vegetation Classification field guide to woodland. JointNature Conservation Committee, Peterborough.
9. McLeod, C.R., Yeo, M., Brown, A.E., Burn, A.J., Hopkins, J.J., & Way, S.F. (eds.) (2002). The Habitats Directive:selection of Special Areas of Conservation in the UK. 2nd edn. Joint Nature Conservation Committee, Peterborough.www.jncc.gov.uk/SACselection
10. McVean, D. N. (1953) ‘Biological flora of the British Isles: Alnus glutinosa (L) Gaertn. (A. rotundifolia Stokes)’.Journal of Ecology 41 (2), 447-466.
11. McVean, D. N. (1955) ‘Ecology of Alnus glutinosa (L) Gaertn. Fruit formation’. Journal of Ecology 43, 46 – 60.
12. McVean, D. N. (1955) ‘Ecology of Alnus glutinosa (L) Gaertn. II. Seed distribution and germination’. Journal ofEcology 43, 61 – 71.
13. McVean, D. N. (1956) ‘Ecology of Alnus glutinosa (L) Gaertn. III. Seedling establishment’. Journal of Ecology 44,195-218.
14. McVean, D. N. (1956) ‘Ecology of Alnus glutinosa (L) Gaertn’. IV. Root System. Journal of Ecology Vol 44, 219-225.
15. McVean, D. N. (1956) ‘Ecology of Alnus glutinosa (L) Gaertn. V. Notes on some British alder populations’.Journal of Ecology Vol 44, 321-330.
16. Peterken, G. F. (1996) Natural Woodland. Ecology and Conservation in Northern Temperate Regions. CambridgeUniversity Press, Cambridge.
17. Rodwell JA (ed.) (1991) British Plant Communities, Vol. 1. Woodlands and Scrub. Cambridge University Press,Cambridge.
18. Sanchez-Perez J. M., Tremolieres, M. & Carbiener, R. (1991) ‘Comptes Rendus de l’Academie des Sciences’,Serie III Sciences de la Vie 3/2 (8), 395-402.
19. Schnitzler, A. (1995) ‘Successional status of trees in gallery forests along the river Rhine’. J. Vegetation Sci. 6(4), 479-486.
20. Tremolieres, M. Sanchez-Perez, T. M. Schitzler, A. & Schmitt, D. (1998) ‘Impact of river management history oncommunity structure, species composition and nutrient status on the Rhine alluvial hardwood forest’. Plant Ecol.135 (1), 59-78.
< Section divider
This do
cumen
t was
with
drawn o
n 6 N
ovem
ber 2
017.

Supporting referencesOther Annex I habitats to be considered with alluvial forests are calcareous fens with Cladium mariscus andspecies of the Caricion davallianae, alkaline fens calcium-rich springwater-fed fens. The Annex II species thatshould be considered are the barbastelle bat (Barbastella barbastellus) and the otter (Lutra lutra).
Species and habitats Guidance notes – Habitats Raised bogs, fens, mires, alluvial forests and bog woodland: Alluvial forest 2.2.4
Environment Agency in partnership with Natural England and Countryside Council for Wales Understanding water for wildlife
< Section divider
This do
cumen
t was
with
drawn o
n 6 N
ovem
ber 2
017.

General informationAlpine pioneer formation of the Caricion bicoloris-atrofuscae is a type of flush mire that occurs only athigh altitude. The characteristic plant communitiescolonise open substrates, which are constantlysubjected to flushes by surface seepage of cold, base-rich water. Alpine pioneer formations are amongst thefew remaining natural plant communities in the UK andare maintained by harsh climatic and soil conditions(Ref. 2).
This habitat type is rare in the UK and largely restrictedto the Scottish Highlands, where it is consideredrelatively widespread. Outliers exist in northernEngland and North Wales (Durham in Cumbria andConwy, Gwynedd). Alpine pioneer formations are rarelyextensive, but contain some of the rarest plant speciesin the UK (Ref. 2).
DescriptionAlpine pioneer formation vegetation consists of mixturesof small sedges, rushes, small herbs and bryophytes,including many arctic-alpine species. Four NVC types arerecognised for high-altitude stands:
– M10 Carex dioica – Pinguicula vulgaris mire– M11 Carex demissa – Saxifraga aizoides mire– M12 Carex saxatilis mire– M34 Carex demissa – Koenigia islandica flush
(Ref. 2);• Differences in altitude, geographic location, length of
snow-lie, the nature of the substrate, and the amountof water flushing the communities result in variationsin this habitat type (Ref. 2);
• Generally the habitat is characterised by thepresence of a number of rare species and include the scorched alpine-sedge (Carex atrofusca), bristlesedge (C. microglochin), alpine rush (Juncusalpinoarticulatus), chestnut rush (J. castaneus), two-flowered rush (J. biglumis), three-flowered rush(J. triglumis), false sedge (Kobresia simpliciuscula)and Scottish asphodel (Tofieldia pusilla). There isalso a range of calcicolous mosses, (mosses whichgrow in habitats rich in calcium) some of which arerare (Ref. 2);
• Other uncommon species may occur, and include thehair sedge (C. capillaris), sheathed sedge (C.vaginata) and variegated horsetail (Equisetumvariegatum) (Ref. 2);
• Commoner species characteristic of this habitatinclude yellow sedge (C. viridula), carnation grass(C. panicea), flea sedge (C. pulicaris), russet sedge(C. saxatilis), jointed rush (J. articulatus), commonbutterwort (Pinguicula vulgaris), yellow saxifrage(Saxifraga aizoides), alpine bistort (Persicariavivipara), alpine meadow-rue (Thalictrum alpinum)and the moss Blindia acuta (Ref. 2); and
• This habitat usually forms mosaics and showscomplex transitions to other upland Annex I habitattypes (Ref. 2).
Key influencesWater resources• No published information on the specific
hydrological requirements of alpine pioneerformations of the Caricion bicoloris-atrofuscae wasobtained within the confines of this project.However, it is likely that any activity which reducesthe constant flushing of alpine pioneer formations ofthe Caricion bicoloris-atrofuscae, will have a negativeimpact on the status of this habitat;
• Carex dioica – Pinguicula vulgaris (M10) miresrequire consistent maintenance of a high water-table,although considerable seasonal fluctuations dooccur at some sites. However, fluctuationsexperienced probably do not leave the fen matdesiccated for long periods of time. Carex demissa –Saxifraga aizoides (M11) mires require vigorousflushing (Ref. 3);
• Direct snow-melt, rather than lateral flushing, mayprovide Carex saxatilis (M12) mires with much of thesoil moisture required for their continuous irrigation.Snow-melt may have an effect by diluting base-enrichment or induce sufficient surface-leaching toallow the good representation of non-calcicolousspecies (Ref. 3); and
Species and habitats Guidance notes – Habitats Raised bogs, fens, mires, alluvial forests and bog woodland: Alpine pioneer formations 2.2.4
Environment Agency in partnership with Natural England and Countryside Council for Wales Understanding water for wildlife
Alpine pioneer formations of theCaricion bicoloris-atrofuscae
2.2.4 Raised bogs, fens, mires, alluvial forests and bog woodland
< Section divider
This do
cumen
t was
with
drawn o
n 6 N
ovem
ber 2
017.

• The arctic-subantarctic climate where the Carexdemissa – Koenigia islandica (M34) community isfound and vigorous flushing by circumneutral (moreor less neutral) and oligotrophic waters (poor innutrients), are probably of most importantparameters for this species composition, helping tomaintain its open nature (Ref.3).
Other influences• No information was obtained on additional pressures
and influences on alpine pioneer formations of theCaricion bicoloris-atrofuscae within the confines ofthis project.
Current and future workNo current or future projects pertaining to thehydrological regime of alpine pioneer formations of theCaricion bicoloris-atrofuscae in the UK were identifiedwithin the confines of this study.
Environment Agency in partnership with Natural England and Countryside Council for Wales Understanding water for wildlife
Key referencesGeneral description & habitat details1. European Nature Information System, Alpine pioneer formations of the Caricion bicoloris-atrofuscae factsheet.Retrieved March 29, 2006 from http://eunis.eea.eu.int/habitats-factsheet.jsp?idHabitat=10152
2. McLeod, C.R., Yeo, M., Brown, A.E., Burn, A.J., Hopkins, J.J., & Way, S.F. (eds.) (2002). The Habitats Directive:selection of Special Areas of Conservation in the UK. 2nd edn. Joint Nature Conservation Committee, Peterborough.www.jncc.gov.uk/SACselection
3. Rodwell, J.S. (Ed.), (1991). British Plant Communities. Volume 2. Mires and Heaths. Joint Nature ConservationCommittee. Cambridge University Press. Cambridge.
4. Tucker G, 2003 Review of the impacts of heather and grassland burning in the uplands on soils, hydrology andbiodiversity. English Nature Research Reports, Number 550, English Nature: Peterborough.
Supporting referencesAt some sites in the Scottish Highlands, alpine pioneer formations occur in association with petrifying springs withtufa formation (Cratoneurion), temperate Atlantic wet heaths with Erica ciliaris and Erica tetralix and alkaline fensand calcium-rich springwater-fed fens.
Species and habitats Guidance notes – Habitats Raised bogs, fens, mires, alluvial forests and bog woodland: Alpine pioneer formations 2.2.4< Section divider
This do
cumen
t was
with
drawn o
n 6 N
ovem
ber 2
017.

General informationBlanket bogs are extensive peatlands, which have formedin areas of high rainfall and low evapotranspiration. Theseconditions have allowed peat to develop not only in wethollows but over large expanses of undulating ground(Ref. 3). Blanket bogs are essentially shallow bogs thatform a ‘blanket’ like layer over poor soils leached byconstant flushing with rainwater (Ref. 8). Their averagedepth is 2.6 metres (Ref. 4).
Blanket bogs are found in the north and west of the UK,extending from Devon in the south to Shetland in thenorth. Scirpus – Eriophorum mire predominates in thewest, while Calluna – Eriophorum mire are abundant inthe east and at higher altitudes. Erica – Sphagnum mireis widely but patchily distributed (Ref. 3).
DescriptionThe most abundant blanket bog habitat types in the UKare represented by the NVC types:
• M17 Scirpus cespitosus – Eriophorum vaginatumblanket mire;
• M18 Erica tetralix – Sphagnum papillosum raisedand blanket mire;
• M19 Calluna vulgaris – Eriophorum vaginatumblanket mire;
• M20 Eriophorum vaginatum blanket and raised mire • M25 Molinia caerulea – Potentilla erecta mire;• A full description of these NVC classifications can be
found in Ref. 7;• Although they are mostly ombrotrophic (rain fed),
lateral flow and contact with rock outcrops mean theycontain species associated with fen and bog habitat;
• Blanket bogs show variations related to climaticfactors. These are particularly illustrated by thevariety of patterning within the bog surfaces indifferent parts of the UK. An important element indefining variation is the relative proportion of poolson the bog surface. In general, the proportion ofsurface patterning occupied by permanent poolsincreases to the north and west of the habitat’sdistribution (Ref. 3);
• Climatic factors also influence the floristiccomposition of bog vegetation. Many of the bogs inthe Hebrides and Northern Ireland have affinities totypes in western Ireland. These sites all exhibit moreoceanic influences in their composition. Blanketbogs found towards the eastern limit of distributionshow more continental affinities (Ref. 3); and
• Variety within the bog vegetation mirrors the aboveaffinities, and altitude. The number of associatedhabitats and communities (springs, flushes, fens andheath), is greater in the milder, wetter, geologicallyand topographically more complex north and westsites (Ref. 3).
Key influencesWater resources• The hydrological mechanisms of blanket bogs are not
readily quantified (Ref. 1). Sites designated for theirblanket bog habitat differ in hydrological regime andcomplexity, making it impossible to quantify waterrequirements in set measurements for the habitat asa whole. As such only broad based water resourcerequirements taken from literature reviewed can beoutlined. It is thus imperative to assess hydrologicalrequirements on a site by site basis;
• Blanket bogs develop under conditions of waterlogging, but are not confined to landscapes with poordrainage, and can cloak whole landscapes, (Ref. 9);
• Vertical water exchanges between upper and lowerpeat horizons are important for bog geochemistry(Ref. 6);
• The structure of blanket bogs dictates a hydrologicalresponse which favours surface water runoff overevapotranspiration (Ref. 6);
• The comparatively high topographic gradients ofblanket bogs result in much higher groundwaterflows than in other types of peatlands (Ref. 6) whichcan give rise to erosion;
• The topographic structure of the substrate can beindicative of groundwater flow patterns and can beused to predict distribution; and
• The water table needs to be at a level to sustainpermanent pooling. The extent of this pooling cannotbe quantified due to topographical differencesbetween sites.
Species and habitats Guidance notes – Habitats Raised bogs, fens, mires, alluvial forests and bog woodland: Blanket bogs 2.2.4
Environment Agency in partnership with Natural England and Countryside Council for Wales Understanding water for wildlife
Blanket bogs
2.2.4 Raised bogs, fens, mires, alluvial forests and bog woodland
< Section divider
This do
cumen
t was
with
drawn o
n 6 N
ovem
ber 2
017.

Other influences• The greatest single cause of raised bog habitat loss is
through afforestation (Ref. 8);• Drainage, heavy grazing, peat cutting and
atmospheric pollution have also caused habitat loss(Ref. 8);
• Water inputs primarily originate from precipitationand therefore are low in solutes. Significantincreases in the base or nutrient status of the systemwill alter the vegetation composition to favour non-bog species (Ref. 1);
• Water chemistry has a strong influence on mireformation. Groundwater affecting topogeneous andsologeneous mires can supply them with nutrientsfrom a local or regional catchment outside thesystem (Ref. 1);
• Climate change may have a significant impact on thestatus of the raised bog habitat (Ref. 3); and
• Extensive erosion, particularly at its climatic limits,can cause total loss of this resource.
Current and future workThe LIFE peatlands project has produced a series ofreports on the restoration of blanket bogs in the northof Scotland. For more information please see:www.lifepeatlandsproject.com/intro.asp
Dr. B. Wheeler, Dr. S. Shaw and Dr. R. Lindsay of theUniversity of Sheffield run the Sheffield WetlandsResearch Centre, a key bog research centre.
Species and habitats Guidance notes – Habitats Raised bogs, fens, mires, alluvial forests and bog woodland: Blanket bogs 2.2.4
Environment Agency in partnership with Natural England and Countryside Council for Wales Understanding water for wildlife
Key referencesGeneral description & habitat details1. Burton, R.G.O. and Hodgson, J. M. (1987). Lowland Peat in England and Wales Soil Survey of England and Wales,Harpenden.
2. LIFE Peatlands Project – Restoring active blanket bog of European Importance in the North of Scotland. RetrievedMarch 27, 2006 from http://www.lifepeatlandsproject.com/intro.asp
3. McLeod, CR, Yeo, M, Brown, AE, Burn, AJ, Hopkins, JJ, & Way, SF (eds.) (2002). The Habitats Directive: selectionof Special Areas of Conservation in the UK. 2nd edn. Joint Nature Conservation Committee, Peterborough.www.jncc.gov.uk/SACselection
4. O’Connell, C. (2002). Blanket Bogs (Information Sheets) Irish Peatland Conservation Councilhttp://www.ipcc.ie/infoblanketbogfs.html
5. Patterson G and Anderson R, 2000 Forests and Peatland Habitats. Forestry Commission Guideline Note:Edinburgh. Retrieved March 27, 2006 from http://www.forestry.gov.uk/pdf/fcgn1.pdf/$FILE/fcgn1.pdf
6. Price, J. S. (2000). Groundwater and geochemical processes in blanket bogs Quebec 2000:The MillenniumWetland Event, August 6 to 12,2000, Quebec City.
7. Rodwell J. S. (1991). British Plant Communities: Mires & Heaths Volume 2. Joint Nature Conservation Committee.Cambridge University Press, Cambridge.
8. Scottish Wildlife Trust. (2001). Peatlands Information Sheet 4.01, Conservation-habitatshttp://www.swt.org.uk/publications/infosheets.asp
9. UK Biodiversity Group. (1999). UK Biodiversity Group Tranche 2 Action Plans – Volume VI: Terrestrial andfreshwater species and habitats, HMSO, London.
Supporting referencesAnnex I habitats to be considered with blanket bogs include temperate Atlantic wet heath with Erica ciliaris andErica tetralix, northern atlantic wet heaths, bog woodlands, depressions in peat substrates and natural dystrophiclakes and ponds.
< Section divider
This do
cumen
t was
with
drawn o
n 6 N
ovem
ber 2
017.

General informationThe true bog woodland habitat type has recently beenrecognised in the UK as a rare habitat type of stableopen woodland on peat, rather than a successionalstage of tree colonisation arising from, for example,changes in land-use, management and the waterregime. Current knowledge on the distribution andextent of the bog woodland habitat type is limited.
Bog woodland is not described as a separatecommunity in the NVC system (Ref. 10). Scottishexamples are essentially a combination of open Scotspine woodland growing on deep peat supporting mirecommunities such as M18 (Erica tetralix-Sphagnumpapillosum) or M19 (Calluna vulgaris-Eriophorumvaginatum). Those in England and Wales are more likelyto be composed of birch and sallow (NVC W4). The JNCChas issued a description for such habitat types in theUK (www.jncc.gov.uk).
Description• Trees on bogs/mires are slow growing due to the less
than optimum conditions and a sparse scattering ismaintained by many areas of the bog surface beingtoo wet to support tree growth;
• Trees are stunted but may achieve considerable agewith a Scottish example citing trees to be over 350years old. Growth is self-limiting with enlarging treesgradually sinking into the bog, dying off as the rootsbecome waterlogged; and
• Dead timber is a feature of bog woodlands.
Key influencesWater resources• The precise ecological requirements for the bog
woodland habitat type are not fully understood,though integrity of the bog, particularly in relation towater supply, is likely to be a key issue in limiting thecover of trees.
Other influences• Limiting factors in addition to surface wetness is
likely to be the species composition of the bog flora.Highly acidic substrates provided by the Sphagnum
mosses results in relatively adverse pH conditions fortree colonisation. Kelly (1993) showed thedistribution of trees on Irish bogs to be associatedwith localised flushing. This allowed for conditionswhere pH, oxygen levels and nutrients were slightlyelevated; and
• The primary impacts of soligenous bogs andombrogenous bogs arise from direct changes in land-use, such as bog drainage and peat extraction inraised mire systems. This has often led to thecolonisation of secondary woodland from theperipheral lagg stream courses, onto the peat body,or directly from forestry introductions.
Current and future workEnglish Nature (now Natural England) has published areport on the eco-hydrolgical guidelines for wetwoodlands which includes a section on alluvial forests.English Nature Research Report number 619 should beconsulted (Ref. 1).
Mire restoration is attracting considerable attention inboth academic research (for recent reviews see Wheeler1995, Wheeler et al. 1998, Lindsay 1999) and inpractical conservation initiatives (e.g. RSPB 2001). Mirerestoration is also undertaken with funding under theEuropean LIFE initiative. One such project is being co-ordinated by the Forestry Commission in the New Forest([email protected]).
A sub-group of The British Ecological Society, the MiresResearch Group, share information and facilitatecontacts between researchers in this area. The currentsecretary of the group is Dr. D. Pearce of the School ofBiological and Molecular Sciences, Oxford BrookesUniversity.
The University of Sheffield is regarded as one of the keycentres for research on peatlands. Dr. B. Wheeler in theDepartment of Animal and Plant Sciences at theUniversity, and Dr. S. Shaw in the Sheffield WetlandsResearch Centre (SWeRC), which forms part of theGeography Department, are the key contacts. TheSchool of Biosciences at the University of East Londonalso conducts research on mires and peatlands. Thekey contact for this institution is Dr. R. Lindsay.
Species and habitats Guidance notes – Habitats Raised bogs, fens, mires, alluvial forests and bog woodland: Bog woodlands 2.2.4
Environment Agency in partnership with Natural England and Countryside Council for Wales Understanding water for wildlife
Bog woodlands
2.2.4 Raised bogs, fens, mires, alluvial forests and bog woodland
< Section divider
This do
cumen
t was
with
drawn o
n 6 N
ovem
ber 2
017.

Species and habitats Guidance notes – Habitats Raised bogs, fens, mires, alluvial forests and bog woodland: Bog woodlands 2.2.4
Environment Agency in partnership with Natural England and Countryside Council for Wales Understanding water for wildlife
Key referencesGeneral description & habitat details1. Barsoum N, Anderson R, Broadmeadow S, Bishop H and Nisbet T, 2005 Eco-hydrological guidelines for wetwoodland – Phase I. English Nature Research Reports Number 619, English Nature: Peterborough. Available:www.english-nature.org.uk/pubs/publication/PDF/619R.pdf
2. Cross, J. R. (1987). ‘Unusual stands of birch on bogs’. Irish Naturalists’ Journal 22: 305-310.
3. Cross, J. R. (1990). The raised bogs of Ireland: their ecology, status and conservation. Unpublished report to theMinister of State at the Department of Finance, Dublin.
4. Douglas, C. & Grogan. H. (1985). Survey to locate raised bogs of scientific interest in counties Galway (E) andRoscommon. Part II. Internal report. Forest and Wildlife Service, Dublin.
5. Joint Nature Conservation Commission, 91D0 Bog woodland. Retrieved 30 March 2006 fromhttp://www.jncc.gov.uk/ProtectedSites/SACselection/habitat.asp?FeatureIntCode=H91D0
6. Kelly, M. L. (1993). Hydrology, hydrochemistry and vegetation of two raised bogs in County Offaly. Ph.D thesis,Trinity College Dublin.
7. Lindsay, R. A. (1999). Peatland restoration. In: Proceedings of Ramsar European Regional Workshop, Riga, 1998.Ramsar Bureau, Gland.
8. Osvald, H. (1949). ‘Notes on the vegetation of British and Irish mosses’. Acta Phytogeographic Suecica 26: 1-62.
9. Rodwell, J. A. (ed.) (1991). British Plant Communities, Vol. 1. Woodlands and Scrub. Joint Nature ConservationCommittee. Cambridge University Press, Cambridge.
10. Rodwell J. A. (ed.) 1991. British Plant Communities, Vol. 2. Mires and Heaths. Cambridge University Press,Cambridge.
11. RSPB (2001). Futurescapes; large scale habitat restoration for wildlife and people. RSPB.
12. UK Biodiversity Action Plan, Wet woodlands. Retrieved March 30, 2006 fromwww.ukbap.org.uk/UKPlans.aspx?ID=4
13. Wheeler, B. D. & Proctor, M. C. F. (2000). Ecological gradients, subdivisions and terminology of north-westEuropean mires. J. Ecol. 88 (2) 187-203.
14. Wheeler, B. D. & Shaw, S. C. (1995). Restoration of Damaged Peatlands (with Particular Reference to LowlandRaised Bogs Affected by Peat Extraction). HMSO, London.
15. Wheeler, B. D., S. C. Shaw, R. P. Money & Meade, R. (1998). ‘Assessing priorities and approaches to therestoration of damaged lowland bogs in northwest Europe’. In: Peatland Restoration and Reclamation: Techniquesand Regulatory Considerations. Malterer, T., K. Johnson and J. Stewart (eds.). Proceedings of the International PeatSymposium, 14-18 July, 1998, Duluth, Minnesota.
Supporting referencesOther Annex I habitats to be considered with bog woodlands are:
• Active raised bogs;• Degraded raised bogs still capable of natural regeneration;• Blanket bogs;• Transition mires and quaking bogs; and• Depressions on peat substrates of the Rhynchosporion.
For further information refer to relevant guidance notes.
< Section divider
This do
cumen
t was
with
drawn o
n 6 N
ovem
ber 2
017.
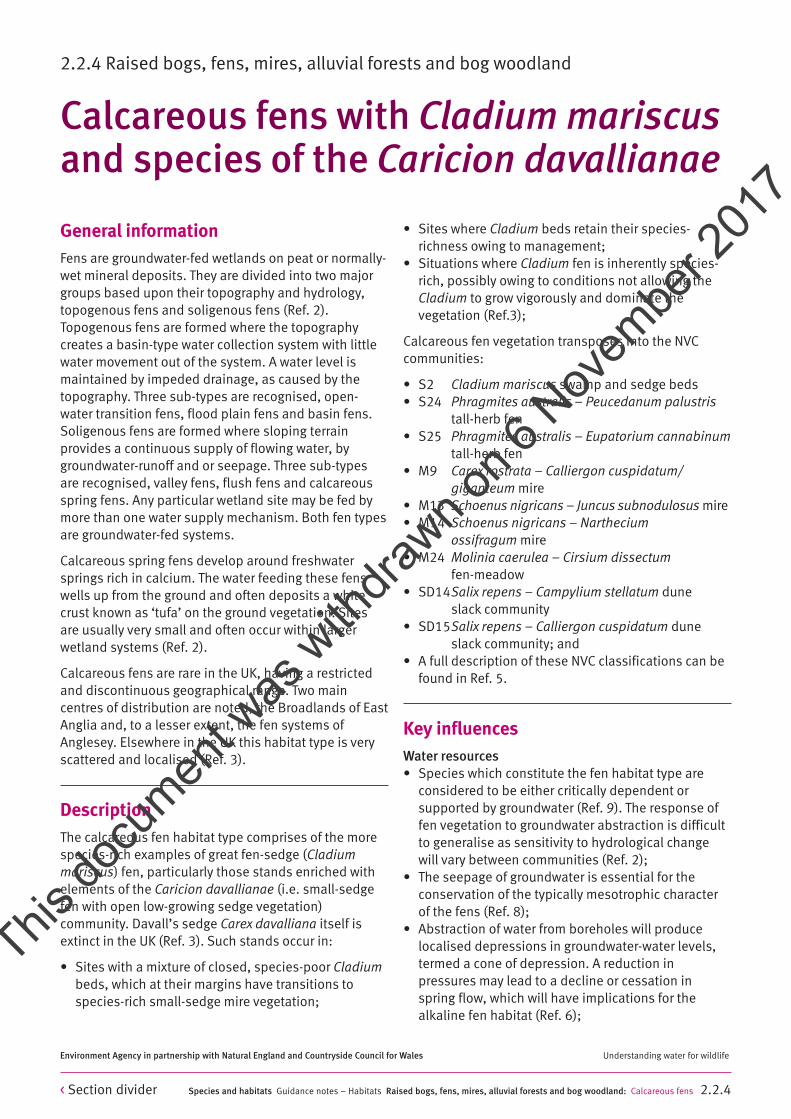
General informationFens are groundwater-fed wetlands on peat or normally-wet mineral deposits. They are divided into two majorgroups based upon their topography and hydrology,topogenous fens and soligenous fens (Ref. 2).Topogenous fens are formed where the topographycreates a basin-type water collection system with littlewater movement out of the system. A water level ismaintained by impeded drainage, as caused by thetopography. Three sub-types are recognised, open-water transition fens, flood plain fens and basin fens.Soligenous fens are formed where sloping terrainprovides a continuous supply of flowing water, bygroundwater-runoff and or seepage. Three sub-typesare recognised, valley fens, flush fens and calcareousspring fens. Any particular wetland site may be fed bymore than one water supply mechanism. Both fen typesare groundwater-fed systems.
Calcareous spring fens develop around freshwatersprings rich in calcium. The water feeding these fenswells up from the ground and often deposits a whitecrust known as ‘tufa’ on the ground vegetation. Sitesare usually very small and often occur within largerwetland systems (Ref. 2).
Calcareous fens are rare in the UK, having a restrictedand discontinuous geographical range. Two maincentres of distribution are noted, the Broadlands of EastAnglia and, to a lesser extent, the fen systems ofAnglesey. Elsewhere in the UK this habitat type is veryscattered and localised (Ref. 3).
DescriptionThe calcareous fen habitat type comprises of the morespecies-rich examples of great fen-sedge (Cladiummariscus) fen, particularly those stands enriched withelements of the Caricion davallianae (i.e. small-sedgefen with open low-growing sedge vegetation)community. Davall’s sedge Carex davalliana itself isextinct in the UK (Ref. 3). Such stands occur in:
• Sites with a mixture of closed, species-poor Cladiumbeds, which at their margins have transitions tospecies-rich small-sedge mire vegetation;
• Sites where Cladium beds retain their species-richness owing to management;
• Situations where Cladium fen is inherently species-rich, possibly owing to conditions not allowing theCladium to grow vigorously and dominate thevegetation (Ref.3);
Calcareous fen vegetation transposes into the NVCcommunities:
• S2 Cladium mariscus swamp and sedge beds• S24 Phragmites australis – Peucedanum palustris
tall-herb fen • S25 Phragmites australis – Eupatorium cannabinum
tall-herb fen • M9 Carex rostrata – Calliergon cuspidatum/
giganteum mire • M13 Schoenus nigricans – Juncus subnodulosus mire • M14 Schoenus nigricans – Narthecium
ossifragum mire • M24 Molinia caerulea – Cirsium dissectum
fen-meadow • SD14Salix repens – Campylium stellatum dune
slack community• SD15Salix repens – Calliergon cuspidatum dune
slack community; and • A full description of these NVC classifications can be
found in Ref. 5.
Key influencesWater resources• Species which constitute the fen habitat type are
considered to be either critically dependent orsupported by groundwater (Ref. 9). The response offen vegetation to groundwater abstraction is difficultto generalise as sensitivity to hydrological changewill vary between communities (Ref. 2);
• The seepage of groundwater is essential for theconservation of the typically mesotrophic characterof the fens (Ref. 8);
• Abstraction of water from boreholes will producelocalised depressions in groundwater-water levels,termed a cone of depression. A reduction inpressures may lead to a decline or cessation inspring flow, which will have implications for thealkaline fen habitat (Ref. 6);
Species and habitats Guidance notes – Habitats Raised bogs, fens, mires, alluvial forests and bog woodland: Calcareous fens 2.2.4
Environment Agency in partnership with Natural England and Countryside Council for Wales Understanding water for wildlife
Calcareous fens with Cladium mariscusand species of the Caricion davallianae
2.2.4 Raised bogs, fens, mires, alluvial forests and bog woodland
< Section divider
This do
cumen
t was
with
drawn o
n 6 N
ovem
ber 2
017.

• The hydrological response of fen communities tochange is not simply limited to a seasonal decline inwater level tables. Increases in the magnitude andfrequency of water table fluctuations and the durationof water table level changes will also affect communitycomposition. Such alterations may lead to an increasein the depth of aeration of the peat profile.Decomposing and dewatered peat may also undergoirreversible physical changes and even if the system isre-watered the response of the fen water table may notbe re-established in the same way (Ref. 2);
• Calcareous fens are usually found in areas with ahigh piezometric head and permanently high watertable. Natural seasonal fluctuations do still occur inthese areas (Ref. 9);
• Rarer fen species tend to be confined to wetter sites(Ref. 6); and
• The great fen sedge can persist for long periods indry conditions in the East Anglian region.
Other influences• Calcareous fens can be found in a large range of
calcium conditions, but generally favour low fertilityconditions (mean fertility 7.0)(Ref. 6);
• Water pH usually ranges from 4.8-7.1; and• In rich fens there is no apparent relationship
between conductivity and species density; howeverrarer fen species have an aversion for conditions ofvery high ionic strength (Ref. 6)
Current and future workThe Countryside Council for Wales has an activeprogramme of positive management of calcerous fensthat is focused on National Nature Reserves and aims torestore favourable conditions at key sites. In addition,The Broads Authority also conducts a fen managementprogramme in association with Natural England. Dr. B.Wheeler, Dr. S. Shaw and Dr. R. Lindsay run theSheffield Wetlands Research Centre based at SheffieldUniversity, which carries out key bog research.
English Nature (now Natural England) have published areport on the eco-hydrological guidelines for wet heathswhich may be of use when assessing the requirementsof calcerous fens (Ref. 4) The Environment Agency haspublished guidelines for lowland wetland communities(Ref. 10).
Species and habitats Guidance notes – Habitats Raised bogs, fens, mires, alluvial forests and bog woodland: Calcareous fens 2.2.4
Environment Agency in partnership with Natural England and Countryside Council for Wales Understanding water for wildlife
< Section divider
This do
cumen
t was
with
drawn o
n 6 N
ovem
ber 2
017.

Species and habitats Guidance notes – Habitats Raised bogs, fens, mires, alluvial forests and bog woodland: Calcareous fens 2.2.4
Environment Agency in partnership with Natural England and Countryside Council for Wales Understanding water for wildlife
Key referencesGeneral description & habitat details1. Fojt, W. (2000). East Anglian fens and groundwater abstraction, English Nature Research Reports, No 30. EnglishNature, Peterborough.
2. O’Connell, C. (2001). Irish Fens Information Sheets. Irish Peatland Conservation Council, Web Accesshttp://www.ipcc.ie/infofensfs.html
3. McLeod, CR, Yeo, M, Brown, AE, Burn, AJ, Hopkins, JJ, & Way, SF (eds.) (2002) The Habitats Directive: selection ofSpecial Areas of Conservation in the UK. 2nd edn. Joint Nature Conservation Committee, Peterborough.www.jncc.gov.uk/SACselection
4. Mountford J.O, Rose R.J, and Bromley J. 2005. Development of eco-hydrological guidelines for wet heaths-phase1. English Nature Report Number 620. Available: http://www.english-nature.org.uk/pubs/publication/PDF/620.pdf
5. Rodwell J. S. (ed) (1991). British Plant Communities: Mires & Heaths Volume 2. Joint Nature ConservationCommittee. Cambridge University Press, Cambridge.
6. Shaw, S.C & Wheeler, B.D. (date). Comparative survey of habitat conditions and management characteristics ofherbaceous rich-fen vegetation types, Contract Surveys No 6 University of Sheffield.
7. UK Biodiversity Action Plan, Fens, Retreived March 28, 2006, fromhttp://www.ukbap.org.uk/UKPlans.aspx?ID=18
8. Verhoeven, J., Boudewijn, B., &Vermeer, H. (1985). ‘Species composition of small fens in relation to the nutrientstatus of the peat soil and the ground water’, Colloques phytosociologiques XIII, Végétation et Géomorphologie,815-824.
9. Wheeler, B.D. & Shaw, S.C. (2000). A Wetland Framework for Impact Assessment at Statutory Sites in EasternEngland, R&D Technical Report W6-068/TR1, University of Sheffield, Sheffield.
10. Wheeler B.D, Gowing D.J., Shaw S.C, Mountford J.O and Money R.P. 2004 Ecohydrological guidelines forlowland wetland plant communities. Eds A.W. Brookes, P.V. Jose and M.I. Whiteman. Environment Agency (AnglianRegion). Available: http://publications.environment-agency.gov.uk/pdf/GEAN0305BIPZ-e-e.pdf
Supporting referencesAnnex I habitats and Annex II species that should be considered with calcareous fens are alkaline fens Calcium-rich springwater-fed fens, petrifying springs with tufa formation (Cratoneurion), marsh saxifrage (Saxifragahirculus) whorl snail (Vertigo geyeri), marsh fritillary (Euphydryas aurinia); humid dune slacks, fen orchid Liparisloeselii), slender feather moss (Drepanocladus vernicosus), alluvial forests with Alnus glutinosa and (Fraxinusexcelsior (Alno-Padion, Alnion incanae, Salicion albae), molinia meadows on calcareous, peaty or clayey-silt-ladensoils (Molinion caeruleae), northern Atlantic wet heaths with Erica tetralix and temperate atlantic wet heaths.
< Section divider
This do
cumen
t was
with
drawn o
n 6 N
ovem
ber 2
017.

General informationDepressions on peat substrates of the Rhynchosporionrepresent a rare habitat type in the UK with a narrowvariation in ecological range and restricted(discontinuous) geographical distribution. The largestcoverage of this habitat type is found on heaths insouthern England and on blanket and raised bogs inwestern Britain. One example of this habitat is foundoutside this range in East Anglia (Ref.4).
Description• Depressions on peat substrates of the
Rhynchosporion occur in complex mosaics withlowland wet heath, valley mires, transition mires, onthe margins of bog pools, and in hollows in bothraised and blanket bogs;
• The vegetation is typically very open, and usuallycharacterised by an abundance of white beaksedge(Rhynchospora alba), the bog moss (Sphagnumdenticulatum), round-leaved sundew (Droserarotundifolia) and, in relatively base-rich sites, brownmosses such as Drepanocladus revolvens andScorpidium scorpioides. The nationally scarce brownbeak-sedge (R. fusca) and marsh clubmoss(Lycopodiella inundata) also occur in this habitat(Ref. 4);
• Algal mats are often well-developed;• On lowland heaths in southern and eastern England,
this habitat occurs on humid, bare or recentlyexposed peat in three distinct situations:
• In and around the edges of seasonal bog pools,particularly on patterned areas of valley mire
• In flushes on the edges of valley mires in heaths• In artificially disturbed areas, such as along
footpaths, trackways, abandoned ditches and in oldpeat-cuttings (Ref. 4); and
• In southern localities, depressions on peat substratesof the Rhynchosporion are often associated with NVCcommunity M21 Narthecium ossifragum – Sphagnumpapillosum mire (in southern localities), while in thenorth and west (within active raised bogs and blanketbogs) depressions usually form part of the transitionbetween bog pools (M1Sphagnum auriculatum andM2 Sphagnum cuspidatum/recurvum bog poolcommunities) and the surrounding bog vegetation(mainly M17 Scirpus cespitosus – Eriophorumvaginatum blanket mire and M18 Erica tetralix –Sphagnum papillosum raised and blanket mire) (Ref. 4).
Key influencesWater resources• No specific data on the water resource requirements
of depressions on peat substrates of theRynchosporion was found. Refer to the raised bogguidance note for considerations; and
• Information of the hydro-ecological requirements ofvalleys mires would also be of assistance, but wasnot covered in this project.
Other influences• No specific data on factors affecting depressions on
peat substrates of the Rynchosporion were found.Refer to the raised bog guidance note forconsiderations.
Species and habitats Guidance notes – Habitats Raised bogs, fens, mires, alluvial forests and bog woodland: Depressions on peat 2.2.4
Environment Agency in partnership with Natural England and Countryside Council for Wales Understanding water for wildlife
Depressions on peat substrates of theRhynchosporion
2.2.4 Raised bogs, fens, mires, alluvial forests and bog woodland
Depressions on peat substrates occur as a sub-habitat on raised bogs and valleymires. Refer to the raised bog habitat summary for an overview of the likelyparameters, which may influence the integrity of this habitat type.
< Section divider
This do
cumen
t was
with
drawn o
n 6 N
ovem
ber 2
017.

Current and future workThe LIFE peatlands project has produced a series ofreports on the restoration of mires in the UK. For moreinformation please see:www.lifepeatlandsproject.com/intro.asp
Dr. B. Wheeler, Dr. S. Shaw and Dr. R. Lindsay of theUniversity of Sheffield run the Sheffield WetlandsResearch Centre, a key bog research centre.
A sub-group of the British Ecological Society, the MiresResearch Group shares information and facilitatecontacts between researchers in this field. The contactfor this group is Dr. D. Pearce of the School of Biologicaland Molecular Sciences at Oxford Brookes University.Additionally, the University of Sheffield undertakes agreat deal of research at the Sheffield WetlandsResearch Centre (SWeRC).
Species and habitats Guidance notes – Habitats Raised bogs, fens, mires, alluvial forests and bog woodland: Depressions on peat 2.2.4
Environment Agency in partnership with Natural England and Countryside Council for Wales Understanding water for wildlife
Key referencesGeneral description & habitat details:1.Baird AJ, Price JS, Roulet NT and Heathwaite AL, 2004 Special Issue of Hydrological Processes Wetland Hydrologyand Eco-Hydrology. Hydrological Processes, 18.
2. Gerdol R and Bragazza L, 2001 Syntaxonomy and community ecology of mires in the Rhaetian Alps (Italy),Phytocoenologia, 31 (2), 271-299.
3. Joint Nature Conservation Committee, 7150 Depressions on peat substrates of the Rhynchosporion. RetrievedMarch 27, 2006 from http://www.jncc.gov.uk/protectedsites/SACselection/habitat.asp?FeatureIntCode=H7150
4. McLeod, C.R., Yeo, M., Brown, A.E., Burn, A.J., Hopkins, J.J., & Way, S.F. (eds.) (2002). The Habitats Directive:selection of Special Areas of Conservation in the UK. 2nd edn. Joint Nature Conservation Committee, Peterborough.www.jncc.gov.uk/SACselection
5. Rodwell, J. A. (ed.) (1991). British Plant Communities, Vol. 2. Mires and Heaths. Joint Nature Conservancy.Cambridge University Press, Cambridge.
Supporting referencesOther Annex I habitats to be considered with depressions in peat substrates are active raised bogs, blanket bogs,transition mires and bog woodlands.
< Section divider
This do
cumen
t was
with
drawn o
n 6 N
ovem
ber 2
017.

General informationPetrifying springs with tufa formation (Cratoneurion) arefound within the classifications of fenland habitat. Referto the guidance note on alkaline fens for more detailedinformation on fenlands.
Tufa formations are associated with hard-water springs,where groundwater rich in calcium bicarbonate reachesthe surface. On contact with the air, carbon dioxide islost from the water and a hard deposit of calciumcarbonate (tufa) is formed. These conditions are mostprevalent in areas underlain by limestone or othercalcareous rocks such as the uplands of northernEngland and the Scottish Highlands (Ref. 5).
Petrifying springs with tufa formation is a relatively rarephenomenon in the UK occurring as small, scatteredflushes, with a small total area (Ref. 5).
Description• Tufa-forming spring-heads are characterised by the
swelling yellow-orange mats of the mossesCratoneuron commutatum and C. filicinum. Many rare,lime-loving (calcicole) species live in the moss carpet,particularly arctic-alpine species, such as bird’s-eyeprimrose (Primula farinosa), Scottish asphodel(Tofieldia pusilla), alpine bartsia (Bartsia alpina) andfalse sedge (Kobresia simpliciuscul) (Ref. 5);
• Two main NVC types are associated with tufaformations:
• M37 Cratoneuron commutatum – Festuca rubraspring (widely distributed)
• M38 Cratoneuron commutatum – Carex nigra spring(found only at moderate to high altitudes andcontains rare arctic-alpine species);
• A full description of these NVC classifications can befound in Rodwell (1991); and
• This habitat type often associated with alkaline fens,where they may form prominent upwelling masses ofshort open vegetation around the spring-heads thatfeed the fen system. There may also be transitions toa wide range of other habitats, particularlycalcareous grassland, acid grassland, heath,limestone pavements, and calcareous cliff and scree(Ref. 5).
Key influencesWater resources• The precise ecological requirements for this habitat
type are not fully understood, though it is known thatthis community is especially vulnerable to changes inthe hydrological regime. This will be especiallyproblematic to those species found within hollows,but also to the calcite precipitation process (Ref. 3);
• The seepage of groundwater is essential for theconservation of the typically mesotrophic characterof the fens (Ref. 7);
• The M37 NVC vegetation type is a community ofground vegetation kept permanently moist byirrigation with base rich calcareous and generallyoligotrophic waters. It is dependent on the kind ofsustained irrigation common in areas of higherrainfall (Ref. 6); and
• M38 is confined to montane springs and flushesstrongly irrigated by base-rich, calcareous andoligotrophic waters (Ref. 6).
Other influences• Specific hydrochemical processes (especially calcite
precipitation) associated with degassing ofdischarging groundwater and concomitantPhosphorus adsorption (Ref. 2);
• Spring fed, rich-fen sites are irrigated by base-richgroundwater discharge of high pH (>6.0), Calcium,Iron and hydrogen carbonate (HCO3) concentrations(Ref. 1); and
• Oligotrophic to mesotrophic soil water.
Current and future workThe LIFE peatlands project has produced a series ofreports on the restoration of the mires in the UK.Available: www.lifepeatlandsproject.com/ intro.asp
Dr. B. Wheeler, Dr. S. Shaw and Dr. R. Lindsay of theUniversity of Sheffield run the Sheffield WetlandsResearch Centre.
Species and habitats Guidance notes – Habitats Raised bogs, fens, mires, alluvial forests and bog woodland: Petrifying springs 2.2.4
Environment Agency in partnership with Natural England and Countryside Council for Wales Understanding water for wildlife
Petrifying springs with tufa formation (Cratoneurion)
2.2.4 Raised bogs, fens, mires, alluvial forests and bog woodland
< Section divider
This do
cumen
t was
with
drawn o
n 6 N
ovem
ber 2
017.

Species and habitats Guidance notes – Habitats Raised bogs, fens, mires, alluvial forests and bog woodland: Petrifying springs 2.2.4
Environment Agency in partnership with Natural England and Countryside Council for Wales Understanding water for wildlife
Key referencesGeneral description & habitat details1. Boyer, M.L.H & Wheeler, B.D. (1989). Vegetation Patterns in Spring-fed Calcareous Fens: Calcite Precipitationand Constraints on Fertility, Journal of Ecology, 77,597-609.
2. Environment Agency (1998). Evaluating the Impact of Groundwater Abstraction on Key Conservation Sites, Stage1 Reports for AMP 3, Phase 1, Environment Agency, Anglian Region.
3. Fojt, W. (2000). East Anglian fens and groundwater abstraction, English Nature Research Reports, No 30.
4. Joint Nature Conservation Committee, 7220 Petrifying springs with tufa formation (Cratoneurion). RetrievedMarch 28, 2006 from http://www.jncc.gov.uk/protectedsites/sacselection/habitat.asp?FeatureIntCode=H7220
5. McLeod, C.R., Yeo, M., Brown, A.E., Burn, A.J., Hopkins, J.J., & Way, S.F. (eds.) (2002). The Habitats Directive:selection of Special Areas of Conservation in the UK. 2nd edn. Joint Nature Conservation Committee, Peterborough.www.jncc.gov.uk/SACselection
6. Rodwell JA (ed.) (1991). British Plant Communities, Vol. 2. Mires and Heaths. Cambridge. University Press,Cambridge.
7. Verhoeven, J., Boudewijn, B., &Vermeer, H. (1985). Species composition of small fens in relation to the nutrientstatus of the peat soil and the ground water, Colloques phytosociologiques XIII, Végétation et Géomorphologie,815-824.
Supporting referencesAnnex I habitats to be considered with petrifying springs with tufa formation include alkaline fens, calcium richspringwater-fed fens, alpine pioneer formations of the Caricion bicoloris-atrofuscae, calcareous fens with Cladiummariscus and species of the Caricion davallianae. The Annex II species that should be considered are the marshsaxifrage (Saxifraga hirculus), geyer’s whorl snail (Vertigo geyeri), slender feather moss (Drepanocladusvernicosus).
< Section divider
This do
cumen
t was
with
drawn o
n 6 N
ovem
ber 2
017.

General informationAnnex I of the EC Habitats Directive includes two raisedbog habitats, active raised bog, which includes areasthat still support a significant amount of peat formingvegetation and bogs where active formation is at atemporary standstill (induced from fire or climaticcycles); and degraded raised bogs, which are areas thathave experienced wide spread disruption to thehydrological regime of the peat body, leading topronounced surface desiccation or peat wastage andthe loss of species or changes to the composition ofspecies assemblages (Ref. 9). The degraded raised boghabitat includes only those sites which are ‘capable ofnatural regeneration’, that is, where the hydrology canbe repaired and where, with appropriate rehabilitationmanagement, there is a reasonable expectation of re-establishing vegetation with peat-forming capabilitywithin 30 years (Ref. 7).
Raised bogs are peatland ecosystems, which develop,primarily, but not exclusively, in lowland areasincluding the head of estuaries, along river floodplainsand in topographic depressions. At these localitiesdrainage may be impeded by a high groundwater table,or by low permeability substrata such as estuarine,glacial or lacustrine clays. The resultant waterloggedconditions provide an anaerobic environment, whichslows down the decomposition of plant material,leading to peat accumulation. The continual accrual ofpeat elevates the bog surface above regionalgroundwater levels to form a gently-curving dome fromwhich the term ‘raised bog’ is derived. The thickness ofthe peat mantle varies considerably but can exceed 12metres (Ref. 9).
Raised bogs are widespread but unevenly distributedthroughout the UK. Notable concentrations are in thecentral belt of Scotland, the Solway region on theEngland/Scotland border, north-west England,Northern Ireland and mid Wales. Degraded raised bogsoccur throughout the range of raised bogs in the UK andare believed to be more extensive than active raisedbogs (Ref. 7).
Description• The surface of raised bog habitats typically displays a
distinctive microtopography, with patterns ofhummocks and hollows rich in Sphagnum and otherpeat-forming species;
• The principal NVC types found on active raised bogsare: – M1 Sphagnum auriculatum bog pool community– M2 Sphagnum cuspidatum/recurvum bog pool
community– M3 Eriophorum angustifolium bog pool community– M18 Erica tetralix – Sphagnum papillosum raised
and blanket mire – M19 Calluna vulgaris – Eriophorum vaginatum
blanket mire – M20 Eriophorum vaginatum blanket and
raised mire;• A full description of these NVC classifications can be
found in Ref. 8;• Patches of the Annex I Depressions on peat
substrates of the Rhynchosporion may be foundaround bog pools (Ref. 7);
• Classical descriptions of the habitat report raisedbogs to have discrete lens-shaped peat domes withflat or imperceptibly sloping topography and a haloof fen vegetation in the zone where water drainingfrom the bog meets that from adjoining mineral soils.This is known as the ‘lagg’. The lagg zone normallyhas greater plant nutrient availability, is morealkaline and shows greater species diversity, with a predominance of sedge (Carex spp.); and
• Peat digging and other practices have resulted in there being no example of a raised bog habitatthat conforms exactly to classic descriptions. The selection of sites for designation has beenundertaken to ensure remnant lagg vegetation hasbeen included.
Species and habitats Guidance notes – Habitats Raised bogs, fens, mires, alluvial forests and bog woodland: Raised bog 2.2.4
Environment Agency in partnership with Natural England and Countryside Council for Wales Understanding water for wildlife
Raised bog (Ombrotrophic bog)
2.2.4 Raised bogs, fens, mires, alluvial forests and bog woodland
This summary encompasses both the Annex I active raised bogs and degraded raisedbogs still capable of natural regeneration habitats. Refer to the general informationsection for reasons why these two habitat types have been combined. For furtherinformation on raised bogs, refer to key references listed below.
< Section divider
This do
cumen
t was
with
drawn o
n 6 N
ovem
ber 2
017.

Key influencesWater resources• The hydrological mechanisms for which raised bog
habitats depend on are not readily quantified (Ref. 9& 10). Designated sites differ in both theirhydrological regime and complexity, making itimpossible to quantify water requirements in setmeasurements for the habitat as a whole. As suchonly broad based water resource requirements canbe discussed and sites will need to be assessedindividually;
• Water inputs for raised bogs are believed to bederived solely from precipitation (thus termedombrotrophic bogs), although groundwater rechargemay yet prove to be a factor at a few sites (Ref. 5) ;
• Raised bogs rely on waterlogged conditions to retaintheir characteristic features. The water supply ofwetlands may be regarded as one of their fundamentaldefining features. Alterations to the rate of water losswill also destabilise these habitats (Ref. 10);
• Raised bogs develop from other bog types,commonly the basin or floodplain mire (Ref. 1). Thismire is exclusively dependent upon precipitation forits water supply, with the water tablecharacteristically mounded above the regionalgroundwater table by impeded precipitation drainage(Ref. 10); and
• Water flow may be of importance to plant growth anddistribution, affecting oxidation-reduction potentialsand nutrient availability. Detailed studies on waterflow in this habitat are limited, in part because ofdifficulties in obtaining meaningful estimates of flowrates (Ref. 8).
Other influences• Raised bog vegetation can occur in regions with
periodic protracted summer droughts. Thepossession of a surface layer, which has importanthydro-regulation functions, appears to be animportant mechanism by which it is able towithstand such conditions (Ref. 10). The destructionor alteration of this vegetation layer will havesignificant implications on the long-term stability ofthe raised bog habitat as a whole (Ref. 9);
• Given water inputs are from precipitation alone,these habitats are likely to be low in solutes.Significant increases in the base or nutrient status ofthe system will alter the vegetation in favour of non-bog species (Ref. 9). Groundwater affectingtopogeneous and sologeneous mires may supplythem with nutrients from a local or regionalcatchment outside the system (Ref.1);
• Soil pH is important. This parameter summarisesother hydrochemical attributes, includingconcentration of phytotoxic metals with pH relatedsolubilities (Ref. 9). Bogs are generally acidic(pH<5.5) predominantly occurring on peat, but havebeen recorded on mineral soils (Ref. 10);
• Peat extraction, landfill development, builtdevelopment, forestry, pollution (includingatmospheric nitrogen deposition), livestock andgame management, and climate change all have thepotential to disrupt the balance of conditions withinbog habitats and lead to their partial or totaldestruction (Ref. 9); and
• Raised bogs are particularly susceptible toatmospheric contaminants, given they are more orless exclusively rainwater fed, and particular plantspecies making up the community may ‘scavenge’solutes. Sulphur dioxide and its derivatives(bisulphite), nitrogen oxides and its derivatives(in particular nitrate and ammonia), the mainconstitutes of acid rain are most likely to affect plantsgrowing on raised bogs (Ref. 10).
Current and future workMire restoration is attracting considerable attention inboth academic research (for recent reviews see Wheeler(1995), Wheeler et al. (1998) & Lindsay (1999)) and inpractical conservation initiatives (e.g. RSPB 2001), UKBiodiversity Group (1999).Mire restoration has beenundertaken with funding under the European LIFEinitiative.
A sub-group of The British Ecological Society, the MiresResearch Group, share information and facilitatecontacts between researchers in this area. The currentsecretary of the group is Dr. D. Pearce of the School ofBiological and Molecular Sciences, Oxford BrookesUniversity.
The University of Sheffield is regarded as one of the keycentres for research on peatlands. Dr. B. Wheeler in theDepartment of Animal and Plant Sciences at theUniversity, and Dr. S. Shaw in the Sheffield WetlandsResearch Centre (SWeRC), which forms part of theGeography Department, are the key contacts. TheSchool of Biosciences at the University of East Londonalso conducts research on mires and peatlands. Thekey contact for this institution is Dr. R. Lindsay.
Species and habitats Guidance notes – Habitats Raised bogs, fens, mires, alluvial forests and bog woodland: Raised bog 2.2.4
Environment Agency in partnership with Natural England and Countryside Council for Wales Understanding water for wildlife
< Section divider
This do
cumen
t was
with
drawn o
n 6 N
ovem
ber 2
017.
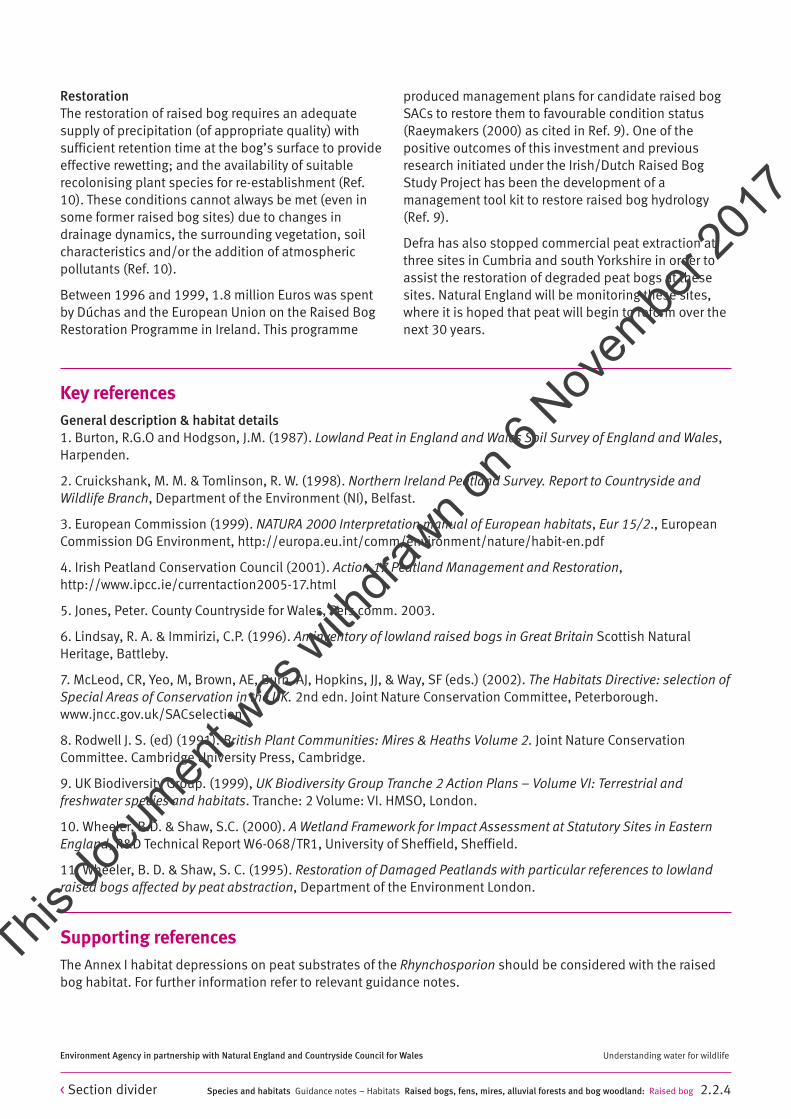
Key referencesGeneral description & habitat details1. Burton, R.G.O and Hodgson, J.M. (1987). Lowland Peat in England and Wales Soil Survey of England and Wales,Harpenden.
2. Cruickshank, M. M. & Tomlinson, R. W. (1998). Northern Ireland Peatland Survey. Report to Countryside andWildlife Branch, Department of the Environment (NI), Belfast.
3. European Commission (1999). NATURA 2000 Interpretation manual of European habitats, Eur 15/2., EuropeanCommission DG Environment, http://europa.eu.int/comm/environment/nature/habit-en.pdf
4. Irish Peatland Conservation Council (2001). Action 17 Peatland Management and Restoration,http://www.ipcc.ie/currentaction2005-17.html
5. Jones, Peter. County Countryside for Wales, Pers comm. 2003.
6. Lindsay, R. A. & Immirizi, C.P. (1996). An inventory of lowland raised bogs in Great Britain Scottish NaturalHeritage, Battleby.
7. McLeod, CR, Yeo, M, Brown, AE, Burn, AJ, Hopkins, JJ, & Way, SF (eds.) (2002). The Habitats Directive: selection ofSpecial Areas of Conservation in the UK. 2nd edn. Joint Nature Conservation Committee, Peterborough.www.jncc.gov.uk/SACselection
8. Rodwell J. S. (ed) (1991). British Plant Communities: Mires & Heaths Volume 2. Joint Nature ConservationCommittee. Cambridge University Press, Cambridge.
9. UK Biodiversity Group. (1999), UK Biodiversity Group Tranche 2 Action Plans – Volume VI: Terrestrial andfreshwater species and habitats. Tranche: 2 Volume: VI. HMSO, London.
10. Wheeler, B.D. & Shaw, S.C. (2000). A Wetland Framework for Impact Assessment at Statutory Sites in EasternEngland, R&D Technical Report W6-068/TR1, University of Sheffield, Sheffield.
11. Wheeler, B. D. & Shaw, S. C. (1995). Restoration of Damaged Peatlands with particular references to lowlandraised bogs affected by peat abstraction, Department of the Environment London.
Supporting referencesThe Annex I habitat depressions on peat substrates of the Rhynchosporion should be considered with the raisedbog habitat. For further information refer to relevant guidance notes.
Species and habitats Guidance notes – Habitats Raised bogs, fens, mires, alluvial forests and bog woodland: Raised bog 2.2.4
Environment Agency in partnership with Natural England and Countryside Council for Wales Understanding water for wildlife
RestorationThe restoration of raised bog requires an adequatesupply of precipitation (of appropriate quality) withsufficient retention time at the bog’s surface to provideeffective rewetting; and the availability of suitablerecolonising plant species for re-establishment (Ref.10). These conditions cannot always be met (even insome former raised bog sites) due to changes indrainage dynamics, the surrounding vegetation, soilcharacteristics and/or the addition of atmosphericpollutants (Ref. 10).
Between 1996 and 1999, 1.8 million Euros was spentby Dúchas and the European Union on the Raised BogRestoration Programme in Ireland. This programme
produced management plans for candidate raised bogSACs to restore them to favourable condition status(Raeymakers (2000) as cited in Ref. 9). One of thepositive outcomes of this investment and previousresearch initiated under the Irish/Dutch Raised BogStudy Project has been the development of amanagement tool kit to restore raised bog hydrology(Ref. 9).
Defra has also stopped commercial peat extraction atthree sites in Cumbria and south Yorkshire in order toassist the restoration of degraded peat bogs at thesesites. Natural England will be monitoring these sites,where it is hoped that peat will begin to reform over thenext 30 years.
< Section divider
This do
cumen
t was
with
drawn o
n 6 N
ovem
ber 2
017.
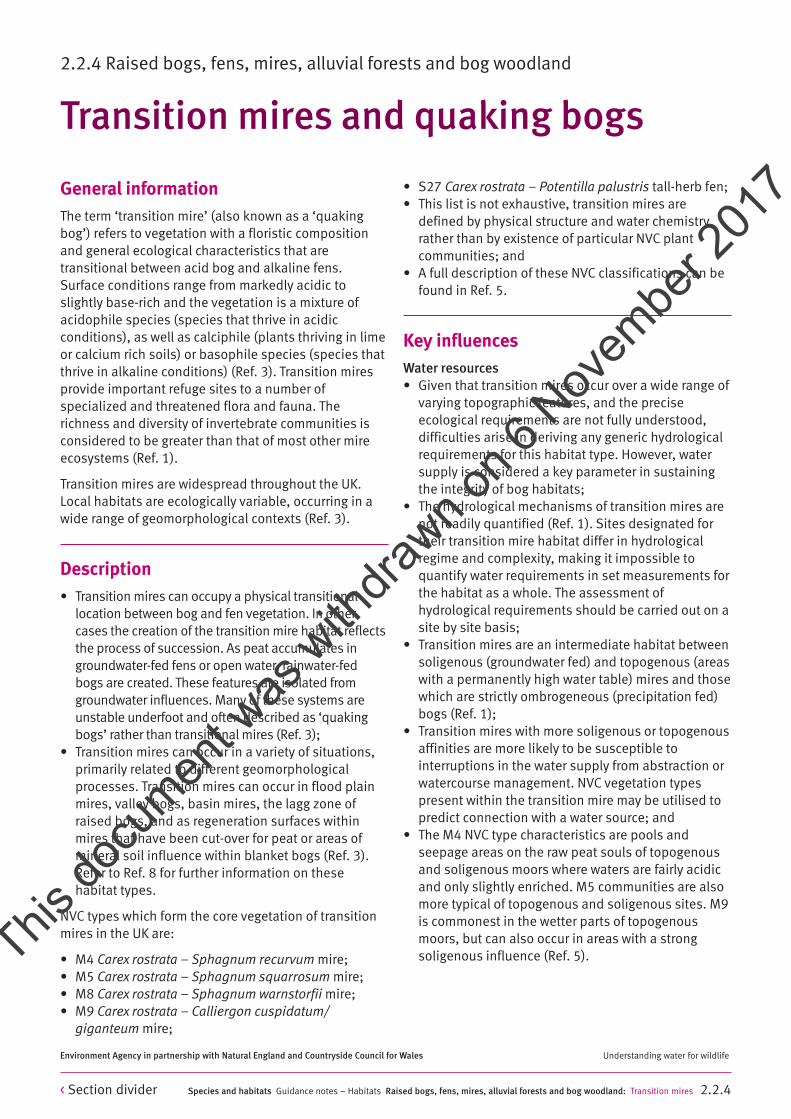
General informationThe term ‘transition mire’ (also known as a ‘quakingbog’) refers to vegetation with a floristic compositionand general ecological characteristics that aretransitional between acid bog and alkaline fens.Surface conditions range from markedly acidic toslightly base-rich and the vegetation is a mixture ofacidophile species (species that thrive in acidicconditions), as well as calciphile (plants thriving in limeor calcium rich soils) or basophile species (species thatthrive in alkaline conditions) (Ref. 3). Transition miresprovide important refuge sites to a number ofspecialized and threatened flora and fauna. Therichness and diversity of invertebrate communities isconsidered to be greater than that of most other mireecosystems (Ref. 1).
Transition mires are widespread throughout the UK.Local habitats are ecologically variable, occurring in awide range of geomorphological contexts (Ref. 3).
Description• Transition mires can occupy a physical transitional
location between bog and fen vegetation. In othercases the creation of the transition mire habitat reflectsthe process of succession. As peat accumulates ingroundwater-fed fens or open water, rainwater-fedbogs are created. These features are isolated fromgroundwater influences. Many of these systems areunstable underfoot and often described as ‘quakingbogs’ rather than transitional mires (Ref. 3);
• Transition mires can occur in a variety of situations,primarily related to different geomorphologicalprocesses. Transition mires can occur in flood plainmires, valley bogs, basin mires, the lagg zone ofraised bogs, and as regeneration surfaces withinmires that have been cut-over for peat or areas ofmineral soil influence within blanket bogs (Ref. 3).Refer to Ref. 8 for further information on thesehabitat types.
NVC types which form the core vegetation of transitionmires in the UK are:
• M4 Carex rostrata – Sphagnum recurvum mire; • M5 Carex rostrata – Sphagnum squarrosum mire; • M8 Carex rostrata – Sphagnum warnstorfii mire;• M9 Carex rostrata – Calliergon cuspidatum/
giganteum mire;
• S27 Carex rostrata – Potentilla palustris tall-herb fen; • This list is not exhaustive, transition mires are
defined by physical structure and water chemistryrather than by existence of particular NVC plantcommunities; and
• A full description of these NVC classifications can befound in Ref. 5.
Key influencesWater resources• Given that transition mires occur over a wide range of
varying topographic features, and the preciseecological requirements are not fully understood,difficulties arise in deriving any generic hydrologicalrequirements for this habitat type. However, watersupply is considered a key parameter in sustainingthe integrity of bog habitats;
• The hydrological mechanisms of transition mires arenot readily quantified (Ref. 1). Sites designated fortheir transition mire habitat differ in hydrologicalregime and complexity, making it impossible toquantify water requirements in set measurements forthe habitat as a whole. The assessment ofhydrological requirements should be carried out on asite by site basis;
• Transition mires are an intermediate habitat betweensoligenous (groundwater fed) and topogenous (areaswith a permanently high water table) mires and thosewhich are strictly ombrogeneous (precipitation fed)bogs (Ref. 1);
• Transition mires with more soligenous or topogenousaffinities are more likely to be susceptible tointerruptions in the water supply from abstraction orwatercourse management. NVC vegetation typespresent within the transition mire may be utilised topredict connection with a water source; and
• The M4 NVC type characteristics are pools andseepage areas on the raw peat souls of topogenousand soligenous moors where waters are fairly acidicand only slightly enriched. M5 communities are alsomore typical of topogenous and soligenous sites. M9is commonest in the wetter parts of topogenousmoors, but can also occur in areas with a strongsoligenous influence (Ref. 5).
Species and habitats Guidance notes – Habitats Raised bogs, fens, mires, alluvial forests and bog woodland: Transition mires 2.2.4
Environment Agency in partnership with Natural England and Countryside Council for Wales Understanding water for wildlife
Transition mires and quaking bogs
2.2.4 Raised bogs, fens, mires, alluvial forests and bog woodland
< Section divider
This do
cumen
t was
with
drawn o
n 6 N
ovem
ber 2
017.

Other influencesTransition mires are largely occupied by peat-formingplant communities which develop at the surface ofoligotrophic or meso-oligotrophic water, sometimeswell above the substratum. There is generally littlemineral or nutrient supply to such communities and as such changes to the nutrient status via inputs(e.g. agricultural runoff) may alter the status and health of this habitat (Ref. 1).
Current and future workThe LIFE peatlands project has produced a series ofreports on the restoration of the mires in the UK.Available: www.lifepeatlandsproject.com/ intro.asp
English Nature (now Natural England) have published areport on the eco-hydrological guidelines for wet heathswhich may be of use when assessing the requirementsof transition mires and quaking bogs (Ref. 4) TheEnvironment Agency has published guidelines forlowland wetland communities (Ref. 9)
Species and habitats Guidance notes – Habitats Raised bogs, fens, mires, alluvial forests and bog woodland: Transition mires 2.2.4
Environment Agency in partnership with Natural England and Countryside Council for Wales Understanding water for wildlife
Key referencesGeneral description & habitat details:1. Devillers, P., Rédei T., Zimányi Zs., Barabás S. & Horváth F (2002). Transition mires. Web Access:http://www.botanika.hu/project/habhun/habitats/545.html
2. Joint Nature Conservation Committee, 7140 Transition mires and quaking bogs. Retrieved 15 Feb 2007.http://jncc.gov.uk/ProtectedSites/SACSelection/habitat.asp?FeatureIntCode=H7140
3. McLeod, CR, Yeo, M, Brown, AE, Burn, AJ, Hopkins, JJ, & Way, SF (eds.) (2002). The Habitats Directive: selectionof Special Areas of Conservation in the UK. 2nd edn. Joint Nature Conservation Committee, Peterborough.www.jncc.gov.uk/SACselection.
4. Mountford J.O, Rose R.J, and Bromley J. 2005. Development of eco-hydrological guidelines for wet heaths-phase1. English Nature Report Number 620. Available: http://www.english-nature.org.uk/pubs/publication/PDF/620.pdf
5. Rodwell, J. A. (ed.) (1991). British Plant Communities, Vol. 2. Mires and Heaths. Cambridge University Press,Cambridge.
6. Wheeler, B. D. & Shaw, S. C. A. (2000). Wetland Framework for Impact Assessment at Statutory Sites in EasternEngland, R&D Technical Report W6-068/TR1, University of Sheffield.
7. Wheeler, B.D., & Shaw, S.C. (1995). Restoration of Damaged Peatlands (with Particular Reference to LowlandRaised Bogs Affected by Peat Extraction). HMSO, London.
8. Wheeler, B.D., & Shaw, S.C. (1992). Biological indicators of the dehydration and changes to East Anglian fenspast and present, English Nature Reports No 20. English Nature, Peterborough.
9. Wheeler B.D, Gowing D.J., Shaw S.C, Mountford J.O and Money R.P. 2004 Ecohydrological guidelines for lowlandwetland plant communities. Eds A.W. Brookes, P.V. Jose and M.I. Whiteman. Environment Agency (Anglian Region).Available: http://publications.environment-agency.gov.uk/pdf/GEAN0305BIPZ-e-e.pdf
Supporting referencesAnnex I habitats and Annex II species to be considered with transition mires include fen orchid Liparis loeselii, Bogwoodland and depressions on peat substrates of the Rhynchosporion.
< Section divider
This do
cumen
t was
with
drawn o
n 6 N
ovem
ber 2
017.

Species and habitats Guidance notes – Species 2.3 – 2.3.1
Environment Agency in partnership with Natural England and Countryside Council for Wales Understanding water for wildlife
2.3 Guidance summary notes on the water resource requirementsof particular speciesA series of hydro-ecological summary sheets has beenproduced for a range of species designated asEuropean interest features identified as having somelevel of dependence on freshwater. Each speciessummary includes the following sections:
• General information – provides background to thespecies and their occurrence;
• Habitat preferences- describes the range andcharacter of the habitats where specific species(or particular communities) typically occur;
• Key influences – examines the effects of waterquantity, water quality etc on the species and its habitat;
• Current and future work – summarises key researchthat has recently been completed or is on-goingspecifically looking at the species being described;
• Key references – sets out a bibliography that can beused to gather further information if required.
Each summary sheet generally presents the most up-to-date information available on the requirements of eachspecies, and identifies areas where further research isrequired or is on-going. The user will be able tointerrogate these sheets to help build a conceptualunderstanding of the optimal hydrological conditionsfor the species and whether these allow favourablecondition to be achieved. It is envisaged that summarysheets will be periodically updated as researchimproves our understanding of the hydro-ecologicalrequirements of each species.
< Section divider
This do
cumen
t was
with
drawn o
n 6 N
ovem
ber 2
017.

2.3.1 InvertebratesThe following summaries are not based on an exhaustive literature review but compiled using key reference papers provided by Agency, NaturalEngland and CCW staff. These notes are intended to provide a summary ofrelevant information on the hydrological requirements of the listedinvertebrates. For further information, refer to key references listed in thesummaries.
– Desmoulin’s whorl snail (Vertigo moulinsiana)
– Geyer’s whorl snail (Vertigo geyeri)
– Narrow mouthed whorl snail (Vertigo angustior)
– Ramshorn snail (Anisus vorticulus)
– Round mouthed whorl snail (Vertigo genesii)
– Freshwater pearl mussel (Margaritifera margaritifera)
– Southern damselfly (Coenagrion mercuriale)
– White-clawed crayfish (Austropotamobius pallipes)
– Fisher’s estuarine moth (Gortyna borelii lunata)
– Marsh fritillary butterfly (Euphydryas aurinia)
< Section divider
This do
cumen
t was
with
drawn o
n 6 N
ovem
ber 2
017.

General informationThe Desmoulin’s whorl snail (Vertigo moulinsiana) isthe largest of the eleven species of whorl snail living inthe UK. It is a climbing species, living over a highvertical range at different times of the year. The body ofthe animal is a light grey or white colour with a darkergrey to black head and tentacles and a brown shell. Itoccurs principally in a band from east Dorset to north-west Norfolk, although it has been found in other areasoutside this key area. The Desmoulin’s whorl snail wasonce more widely distributed in the UK, but its retreat isbelieved to be partly due to a gradual cooling since theclimatic optimum c. 5000 years ago (Ref. 1).
Habitat preferences• Desmoulin’s whorl snail lives in permanently wet,
usually calcareous, swamps, fens and marshes,bordering rivers or in river floodplains, lakes andponds. It is most often found in open situations(Ref. 1);
• Humidity is important;• The snail has been recorded on a wide range of
plants, usually on tall monocotyledons includingsedges (Carex riparis, C. acutiformis, C. paniculata, C. elata), saw sedge (Cladium mariscus), reedmace(Typha latifolia and T. angustifolia), branched bur-reed (Sparaganium erectum), iris (Iris pseudacorus)and reed canary grass (Phalaris arundinacea). Inmany English sites the most typical habitats are openareas of sweet reed grass (Glyceria maxima). Refer tothe LIFE report for details on each particular habitattype (Ref. 1); and
• Originally only considered to occupy old, long-established calcareous wetlands, recent studieshave found the snail to successfully occupy habitatsthat have arisen from relatively recent watercoursemanipulation (i.e. habitat creation schemes such asnew wetlands adjacent to rivers which have beenengineered for other purposes) and which aresubject to other management practices such asgrazing, burning and mowing (Ref. 1).
Key influencesWater resources• High ground water levels throughout the year are
considered to be one of the most important factorsinfluencing the distribution of Desmoulin’s whorlsnail (Ref. 2);
• A detailed study of the Kennet and LambournFloodplain and the Norfolk Valley fens foundmaximum V.moulinsiana densities at locations wherewater levels were above the ground surfacethroughout the year and where the mean annualwater levels were more than 0.25 metres above thesurface (Ref. 6);
• Water levels must remain close to the surface so thatthe ground remains at least moist for most of thesummer, although some seasonal drying may beacceptable;
• The relatively high ground-water level is also likely tocontribute to maintaining high humidity in thevegetation;
• Conditions must not become wet enough to allowaquatic plants such as water-cress (Rorripanasturtium-aquatilis) to become dominant;
• Drainage of wetlands is considered a principal causeof the species’ decline throughout its Europeanrange (Ref. 1); and
• Encroachment by scrub and/or alien plants may beinduced under dry conditions. Alien plant speciesmay also increase shade, reducing the suitability ofthe habitat to the snail.
Other influences• There is currently no quantitative information on the
relationship between Desmoulin’s whorl snail andwater quality (Ref. 1);
• Pollution, which has the potential to alter the plantcommunity composition or structure, may impact onthe status of the snail. Key water quality concernsmay include elevated phosphate and nitrate levels,and organic pollution;
• The use of pesticides and herbicides may impact onthe snail population. No information into its effectswas reviewed or found to be available on this topic;
• The canalisation of rivers, deepening of drainagechannels, and creation of vertical profiles to riverbanks provide unsuitable habitat for the snail;
Species and habitats Guidance notes – Species Invertebrates: Desmoulin’s whorl snail 2.3.1
Environment Agency in partnership with Natural England and Countryside Council for Wales Understanding water for wildlife
Desmoulin’s whorl snail (Vertigo moulinsiana)
2.3.1 Invertebrates
< Section divider
This do
cumen
t was
with
drawn o
n 6 N
ovem
ber 2
017.

• The regular cutting of riparian margins of rivers andtidying of riverside paths constitutes unfavourablemanagement for the species. In particular theintroduction of cutting or burning programmes atsites where there is no history of these activities arelikely to have greater impact on snail populationsthan areas with historic management; and
• Changes in land use (e.g. from rough pasture ormeadow to improved grassland) and increased levelsof grazing may reduce snail populations.
Current and future workThe LIFE in UK Rivers Project is developing conservationstrategies and monitoring protocols for use on riversdesignated as Special Areas of Conservation under theEuropean Union Habitats Directive. Refer to the LIFE inUK Rivers website for further information.
A workshop on the four target Vertigo species was heldin 2002, its proceedings were collated into the article:Speight MCD, Moorkens E and Falker G 2003Proceedings of the workshop on conservation biologyof European Vertigo species (Dublin, April 2002) Heldia,5, 7, 1-183.
Species and habitats Guidance notes – Species Invertebrates: Desmoulin’s whorl snail 2.3.1
Environment Agency in partnership with Natural England and Countryside Council for Wales Understanding water for wildlife
Key referencesGeneral description/biology & habitat details1. Killeen, I. (2002). The ecological requirements of Desmoulin’s whorl snail Vertigo moulinsiana. LIFE in UK RiversProject. http://www.english-nature.org.uk/lifeinukrivers/ecological.html
2. Killeen, I.J. & Stebbings, R.E. (1997). A34 Newbury bypass. Results of monitoring the translocated habitat forVertigo moulinsiana. First annual report. Unpublished report. Mott MacDonald, Winchester.
3. Pokryszko, B.M. (1992). Life history of Vertigo pusilla (O.F. Miller, 1774 Gastropoda: Pulmonata: Vertiginidae).In: E Gittenberger & J Goud (eds), Proceedings of the ninth international malacological conference. NationalMuseum of Natural History, Edinburgh. pp. 247-256.
4. Pokryszko, B.M. (1990). The Vertiginidae of Poland (Gastropoda: Pulmonata: Pupilloidea) – a systematicmonograph. Annales Zoologici, Warsaw 43: 133-257.
5. Tattersfield, P & McInnes R, 2003 The hydrological requirements of Vertigo moulinsiana on three candidateSpecial Areas of Conservation in England (Gastropdoa, Pulmonata: Vertiginidae). Heldia 5:7, 135-147.
Site specific studies6. Killeen, I.J. (2001a). A survey to assess the status & distribution of Desmoulin’s whorl snail, Vertigo moulinsianaat Sweat Mere SSSI, Shropshire. English Nature, (Unpublished report).
7. Killeen, I.J. (2001b). Surveys of EU Habitats Directive Vertigo species in England: 3. Vertigo moulinsiana. Part 1:Summary and Monitoring Protocol. English Nature Research Report, Peterborough.
8. Killeen, I.J. (2001c). Surveys of EU Habitats Directive Vertigo species in England: 3. Vertigo moulinsiana. Part 2:The River Avon SAC. English Nature Research Report, Peterborough.
9. Killeen, I.J. (2001e). Surveys of EU Habitats Directive Vertigo species in England: 3. Vertigo moulinsiana. Part 4:The Waveney and Little Ouse Valley Fens SAC. English Nature Research Report, Peterborough.
Supporting referencesCalcareous wetland and fen habitats should be considered (but not limited to) with the Desmoulin’s whorl snail.
< Section divider
This do
cumen
t was
with
drawn o
n 6 N
ovem
ber 2
017.
General informationThe tiny Geyer’s whorl snail (Vertigo geyeri) is currentlyfound in North Wales, northern England, the ScottishHighlands, the Inner Hebrides, and Northern Ireland. Intotal it has been recorded in approximately 30 localities(Ref. 5). This mollusc feeds on algae/bacteria onvegetation and decaying humic or plant material (Ref. 2).
Habitat preferences• Throughout its range, the Geyer’s whorl snail is found
in relatively exposed, constantly humid calcareousflush-fens that are fed by tufa-depositing springs(Ref. 5);
• It requires dense cover of low-growing grasses andsedges relatively free from Sphagnum and othermosses (Ref. 5); and
• Black bog-rush (Schoenus nigricans) and yellowsedge (Carex viridula) have been found at allrecorded Geyer’s whorl snail habitat sites (Ref. 5).
Key influencesWater resources• Little data exists on the relationship between the
hydrological regime and the status of the Geyer’swhorl snail; and
• The habitat of the Geyer’s whorl snail is believed tobe vulnerable to destruction from drainage andchanges in the hydrological regime (Refs. 4 & 5).
Other influences• Fossil records indicate that the Geyer’s whorl snail
was once common in lowland England. Climaticchange and drainage by man is believed to have ledto a dramatic contraction of its range (Refs. 5 & 4);and
• The snail’s habitat is vulnerable to changes in grazinglevels and trampling by humans and animals (Ref. 6).
Current and future workA conference on the four target vertigo species was heldin 2002. The proceedings can be found in: SpeightMCD, Moorkens E and Falkner G, 2003 Proceedings ofthe workshop on conservation biology of EuropeanVertigo species (Dublin, April 2002) Heldia, 5, 7, 1-183.
Horsak and Hajek (2005) have published a study on thehabitat preferences of V.geyeri in Europe. Their resultssuggest that it may be found in a range of differenthabitats, including sites relatively poor in carbonates.Their findings indicate that the distribution of V.geyerifollows that of the fen vegetative species Primulafarinosa, Carex dioica, C.hostiana, C.lepidocarpa andPingulicula vulgaris. It avoids areas with Sphagnumspecies (Ref. 3).
Species and habitats Guidance notes – Species Invertebrates: Geyer’s whorl snail 2.3.1
Environment Agency in partnership with Natural England and Countryside Council for Wales Understanding water for wildlife
Geyer’s whorl snail (Vertigo geyeri)
2.3.1 Invertebrates
< Section divider
This do
cumen
t was
with
drawn o
n 6 N
ovem
ber 2
017.

Species and habitats Guidance notes – Species Invertebrates: Geyer’s whorl snail 2.3.1
Environment Agency in partnership with Natural England and Countryside Council for Wales Understanding water for wildlife
Key referencesGeneral description/biology & habitat details1.Cameron R, 2003 Life-cycles, molluscan and botanical associations of Vertigo angustior and Vertigo geyeri(Gastropoda, Pulmonata: Vertiginidae). Heldia, 5, 95-110.
2. Cameron R, 2003 Species accounts for snails of the genus Vertigo listed in Annex II of the Habitats DirectiveV.angustior, V.genesii, V.geyeri and V.moulinsiana (Gastropoda, Pulmonata:Vertiginidae). Heldia, 5, 151-170.
3. Horsak M and Hajek M, 2005 Habitat requirements and distribution of Vertigo Geyeri (Gastropods:Pulmonata) inwestern carpathian rich fens. Journal of Conchology, 38, 6, 683-69.
4. JNCC (1991). Invertebrates and other insects. In: British Red Data Book. Ed. J.H. Bratton. JNCC, Peterborough.
5. McLeod, C.R., Yeo, M., Brown, A.E., Burn, A.J., Hopkins, J.J., & Way, S.F. (eds.) (2002). The Habitats Directive:selection of Special Areas of Conservation in the UK. 2nd edn. Joint Nature Conservation Committee, Peterborough.www.jncc.gov.uk/SACselection
6. UK Biodiversity Group. (1995). UK UKBAP Action Plan Species Action Plan: Whorl snail (Vertigo geyeri). In:Biodiversity: The UK Steering Group Report – Volume II: Action Plans. HMSO, London.
Supporting referencesAnnex I habitats to be considered with the Geyer’s whorl snail are alkaline fens and petrifying springs with tufaformation (Cratoneurion).
< Section divider
This do
cumen
t was
with
drawn o
n 6 N
ovem
ber 2
017.

General informationThe tiny narrow-mouthed whorl snail (Vertigo angustior)is found in only eight widely scattered localities inEngland, Wales and Scotland (Ref. 2).
Habitat preferences• The narrow-mouthed whorl snail is primarily found
in marshy ground of high, even humidity and flowinggroundwater. Areas must not be subjected to deep orprolonged flooding or periodic desiccation (Ref. 1 & 2);
• Unshaded conditions are required by the snail whichinhabits short vegetation (grasses, mosses or lowherbs) which are quickly warmed by the sun. Thevegetation may be grazed by cattle (Ref. 1 & 2);
• The narrow-mouthed snail has been found in wet base-rich meadows, in coastal marshes, dune slacks andmaritime turf, and in depressions within limestonepavement; several of these habitats are listed in AnnexI of the Habitats Directive (Ref. 1 & 2); and
• In the UK the largest known population is foundwhere freshwater seeps onto the upper edges of asaltmarsh in South Wales. However, elsewhere inEurope calcareous fen is the species’ most typicalhabitat (Ref. 1 & 2).
Key influencesWater resources• Little data exists on the relationship between
hydrological regime and the status of the narrow-mouthed whorl snail; and
• The disturbance of hydrological conditions essentialto the habitat of this species is regarded as theprimary threat to its status (Ref. 1).
Other influences• All habitats of the narrow-mouthed snail are fragile
and may be easily destroyed by drainage,afforestation or other changes in land-use (Ref. 1);
• At Oxwich, natural erosion of the dunes has alteredtidal patterns, leading to increased deposition ofsediment. Deposition of material is gradually raisingthe land surface of the dune-saltmarsh transitionzone, leading to drier conditions and scrubencroachment. Seepage from the dunes is thoughtto keep the transition zone damp, but can fail indrought years (Ref. 1).
Current and future workA workshop on the conservation of the four targetVertigo species was held in 2002 and its proceedingswere collated in the article: Speight MCD, Moorkens Eand Falkner G, 2003 Proceedings of the workshop onconservation biology of the European Vertigo species(Dublin, April 2002) Heldia, 5, 7, 1-183.
Population monitoring is being carried out by CCW ontwo sites in Wales.
Species and habitats Guidance notes – Species Invertebrates: Narrow mouthed whorl snail 2.3.1
Environment Agency in partnership with Natural England and Countryside Council for Wales Understanding water for wildlife
Narrow mouthed whorl snail (Vertigo angustior)
2.3.1 Invertebrates
< Section divider
This do
cumen
t was
with
drawn o
n 6 N
ovem
ber 2
017.
Species and habitats Guidance notes – Species Invertebrates: Narrow mouthed whorl snail 2.3.1
Environment Agency in partnership with Natural England and Countryside Council for Wales Understanding water for wildlife
Key referencesGeneral description/biology & habitat details1. JNCC (1991). Invertebrates and other insects. In: British Red Data Book. Ed. J.H. Bratton. JNCC, Peterborough.
2. McLeod, C.R., Yeo, M., Brown, A.E., Burn, A.J., Hopkins, J.J., & Way, S.F. (eds.) (2002). The Habitats Directive:selection of Special Areas of Conservation in the UK. 2nd edn. Joint Nature Conservation Committee,Peterborough. www.jncc.gov.uk/SACselection
Further readingCameron R, 2003 Species accounts for snails of the genus Vertigo listed in Annex II of the habitat directive:V.angustior, V. genesii, V.geyeri and V.moulinsiana (Gastropoda, Pulmonata: Vertiginidae). Heldia, 5, 151-170.
Cameron R, 2003 Life-cycles, molluscan and botanical associations of Vertigo angustior and Vertigo geyeri(Gastropoda, Pulmonata: Vertiginidae). Heldia, 5, 95-110.
Supporting referencesAnnex I habitats to be considered with the narrow-mouthed whorl snail are humid dune slacks, salicornia and other colonising mud and sand and Molinia meadows on calcareous, peaty or clayey silt-laden soils(Molinion caeruleae).
< Section divider
This do
cumen
t was
with
drawn o
n 6 N
ovem
ber 2
017.

General informationThe Lesser whirlpool Ram’s-horn Snail (Anisusvorticulus) is a small aquatic snail with a flattenedspiral shell of approximately 5mm in diameter (Ref. 2).It has been declining from the UK since the 1960s,although the reason for decline is not clear. Populationsmay be found at sites in Norfolk, Suffolk and Sussexand a recent survey has found a re-colonised ditchsystem in Suffolk, which may be a result of improvingwater quality (Ref. 1 & 2).
Habitat preferences• A.vorticulus occurs in unpolluted, calcareous waters
in well-vegetated marsh drains and is often foundwith a number of other rare and vulnerable molluscsincluding Segmentina nitida and may be foundfloating on the surface amongst duckweed (Lemna spp.) (Ref. 1);
• It prefers ditches or channels of >3m in width and>1m in depth with a diverse flora but little emergentvegetative cover and often occurs in ditches in wetfields that flood in winter as this may be important inenabling young snails to colonise new ditches; and
• A. vorticulus distribution is largely dependent onaspect and water temperature and can often berestricted to one side of a ditch.
Key influencesWater resources• Conversion of grazing marshes to arable farming with
associated water table lowering may be affectingpopulations of the Ramshorn snail.
Other influences• A. vorticulus populations are sensitive to nutrient
enrichment and water pollution; although, specificparameters have not been available; and
• Ditch clearance, conversion of grazing levels andother land use changes may restrict or fragment itshabitat (Ref. 2).
Current and future workSurveys are currently being undertaken on thepopulations in East Anglia and ditches wherepopulations have previously been found will beresurveyed and adjacent ditches will be checked forsigns of colonisation.
A study by Watson and Ormerod (Ref. 3) suggests thatthe distribution of A. vorticulus is not related tovegetation structure but vegetation diversity. This studyalso indicates that the snail has declined in areas whereditches became wider and deeper with more open water.The authors correlated the distribution of A. vorticuluswith calcium, pH, BOD, water depth and the percentageof ditches colonised by amphibious vegetation.
Species and habitats Guidance notes – Species Invertebrates: Ramshorn snail 2.3.1
Environment Agency in partnership with Natural England and Countryside Council for Wales Understanding water for wildlife
Ramshorn snail (Anisus vorticulus)
2.3.1 Invertebrates
Key references1. Joint Nature Conservation Committee, Invertebrate species: molluscs 4056 Ramshorn snail A. vorticulus.Retrieved 28 February 2007 from: www.jncc.gov.uk/ProtectedSites/SACselection/species.asp?FeatureIntCode=S4056
2. UKBAP, Action Plan for Anisus vorticulus. Retrieved 28 February, 2007, from www.ukbap.org.uk/UKPlans.aspx?ID=99
3. Watson A M and Ormerod S J, 2004 The distribution of three uncommon freshwater gastropods in the drainageditches of British grazing marshes. Biological Conservation, 118, 455-466.
4. Willing MJ and Killeen I J, 1998 The freshwater snail Anisus vorticulus in ditches in Suffolk, Norfolk and WestSussex. English Nature Reports Number 287.
5. Willing MJ and Killeen IJ, 1999 Anisus vorticulus, a rare and threatened water snail. British Wildlife, 10:6, 412-418.
Supporting referencesUnpolluted, calcareous waters and well vegetated marsh drains and ditches should be considered with A. vorticulus.
< Section divider
This do
cumen
t was
with
drawn o
n 6 N
ovem
ber 2
017.

General informationThe round-mouthed whorl snail (Vertigo genesii) is a tinyboreal and alpine species, considered a relict of the faunaand flora of the late glacial period. Seven populations areknown in the UK, with most occupying two uplandregions; Upper Teesdale, in Durham, and the Blair Athollarea in Perthshire. The species has also been recordedfurther north in Scotland on the Black Isle (Ref. 2).
Habitat preferences• In the UK, the round-mouthed whorl snail is found in
calcareous flushes, often with an arctic-alpineelement (Ref. 2).
Key influencesWater resources• Little data exists on the relationship between
hydrological regime and the status of the round-mouthed whorl snail but it is likely that the species issusceptible to hydrological changes.
Other influences• Once abundant in lowland England (Ref. 1), post-
glacial climatic change and forest growth is believedto have led to a dramatic contraction of its range (Ref. 2); and
• The small, isolated nature of the sites where itsurvives makes the populations vulnerable toaccidental damage (Ref. 2).
Current and future workA workshop on the conservation biology of Vertigospecies was held in April 2002. The primary objective ofthe workshop was to collate as much data as possible(in an easily accessible format) on the conservation ofthe Vertigo angustior, V. genesii, V. geyeri and V.moulinsiana. Researchers involved have reported onrecent work undertaken in Europe, including:
• Ecology and conservation issues of the Vertigo spp.in Central Europe;
• Distribution, status and conservation of Vertigo spp.in Scandinavia, Bavaria and Hungary;
• Autecological and monitoring studies carried out onVertigo spp. in Wales;
• Review of Vertigo spp. habitats in Britain;• Survey and monitoring work on a Vertigo angustior
site in Ireland;• Hydrological studies on Vertigo moulinsiana at some
sites in England;• Surveys of Vertigo geyeri in Ireland; and• Survey methods for Vertigo genesii.
A workshop on the conservation of the four targetVertigo species was held in 2002 and its proceedingswere collated in the article: Speight MCD, Moorkens Eand Falkner G, 2003 Proceedings of the workshop onconservation biology of the European Vertigo species(Dublin, April 2002) Heldia, 5, 7, 1-183.
Species and habitats Guidance notes – Species Invertebrates: Round mouthed whorl snail 2.3.1
Environment Agency in partnership with Natural England and Countryside Council for Wales Understanding water for wildlife
Round mouthed whorl snail (Vertigo genesii)
2.3.1 Invertebrates
Key referencesGeneral description/biology & habitat details1. JNCC (1991). Invertebrates and other insects. In: British Red Data Book. Ed. J.H. Bratton, JNCC, Peterborough.
2. McLeod, C.R., Yeo, M., Brown, A.E., Burn, A.J., Hopkins, J.J., & Way, S.F. (eds.) (2002). The Habitats Directive:selection of Special Areas of Conservation in the UK. 2nd edn. Joint Nature Conservation Committee, Peterborough.www.jncc.gov.uk/SACselection
Supporting referencesThe Annex I alkaline fen habitat should be considered with the round mouthed whorl snail. For further informationrefer to guidance notes produced.
< Section divider
This do
cumen
t was
with
drawn o
n 6 N
ovem
ber 2
017.

General informationThe freshwater pearl mussel (Margaritiferamargaritifera) is a bivalve mollusc, which can grow to140mm in length. Formerly widespread in England, thefreshwater pearl mussel has declined rapidly, with verylittle active recruitment observed and is nowconsidered highly endangered. Its life span is highlyvariable between populations, but generally the musseldevelops slowly and can live for over 100 years, butmay not reach sexual maturity until they are 10-15 yearsof age (Ref. 7).
Fertilised eggs develop in a pouch on the gills of thefreshwater pearl mussel, with larvae (termed glochidia)released from females from July to September. Theseeggs remain in the water, but a small number attachthemselves to the gill filaments of host fish (salmonand brown trout and sea trout), where they remain untilthe following spring. This mechanism allows the musselto colonise suitable habitat further upstream.Consideration of host fish is therefore essential.
Habitat preferences• The typical substrate preference of freshwater pearl
mussels are small sand patches stabilised amongstlarge stones or boulders in fast-flowing rivers andstreams;
• Cool, well-oxygenated soft water, free of pollution orturbidity is required;
• Riffle areas with mixtures of rocks, cobbles, sand,with low organic content are important habitats,particularly for juveniles (Ref. 7);
• Adult mussels live in dense beds in substrates ofmixed cobble, stone and sand at the tail end of poolsor in the moderate flow channels of river bends; and
• Stable channels with little bed transport (except infloods) are important features.
Key influencesWater resources• The influence of stream hydrological processes on
microhabitat (in particular how it effects juvenilerecruitment) is poorly understood;
• Slight hydrological changes may result in freshwaterpearl mussel habitat degradation. Studies to datereport minimum/maximum depths and velocities forM. margaritifera, M. laevis and M. falcate within theranges of 0.1-2 m and 0.1-2 m/s (Ref. 6); No absolutevalues are available for a minimum suitable flowvelocity (Ref. 7);
• Low summer flows may reduce oxygen levels,increase temperatures and allow the formation ofalgal mats. The uncovering of shallow riffle areas andaggregation of detrital silt may be detrimental tojuvenile populations;
• Moderate flooding may have a positive effect incleaning silts from gravel beds and riffles. Autumnflows can wash out algal mats and sedimentsaccumulated over the summer; and
• High flows (e.g. severe floods) can remove musselsfrom their beds. This is of particular concern forfuture populations where recruitment is currently nottaking place (Ref. 7).
Other influences• Freshwater pearl mussels prefer oligotrophic
conditions. Critical parameters affecting recruitmentare BOD, calcium and phosphate levels. Phosphatelevels should not exceed 0.03 mg/l and conductivityshould be less than 100 uS/cm (Ref. 2);
• Increased nitrate concentrations were observed byBauer (1998) to increase adult mortality (Ref 1).Research has indicated that nitrate levels should notexceed 1.0 mg/l although higher values may beencountered in the UK (Ref. 2);
• Pearl mussels are sensitive to pollution during all lifestages, with juveniles considered far less tolerantthan adults are. Particular vulnerabilities are fromthose pollutants likely to affect the host fish, andmetal and pesticide accumulation in adults;
• Freshwater pearl mussels prefer waters with aslightly less than neutral pH (7.5 or less) (Ref. 1);
• Gradient may affect mussel distribution indirectly bydetermining the stability of the substrata (Ref. 7);
• Siltation induced by increased sediment loads anddetrital production (from eutrophication) can alterthe interstitial environment of the substrate andsuffocate young mussels;
• Channel modification can impede flow, increaseflooding and alter substrate distribution. Dredging,canalisation, scouring and weir construction workshave the potential to cause local populationextinctions;
Species and habitats Guidance notes – Species Invertebrates: Freshwater pearl mussel 2.3.1
Environment Agency in partnership with Natural England and Countryside Council for Wales Understanding water for wildlife
Freshwater pearl mussel (Margaritifera margaritifera)
2.3.1 Invertebrates
< Section divider
This do
cumen
t was
with
drawn o
n 6 N
ovem
ber 2
017.

• The long-term survival of the freshwater musseldepends upon host availability. Introduced non-native salmonids species such as rainbow trout mayout-compete native fish species and have indirectimplications for mussel populations (Ref. 7); and
• Illegal pearl mussel fishing.
Current and future workThe LIFE in UK Rivers Project is developing conservationstrategies and monitoring protocols for use on riversdesignated as Special Areas of Conservation under theEuropean Union Habitats Directive. Refer to the LIFE inUK Rivers website for further information.
Research into population genetics using DNA analysesis also underway and an initial study using RAPDtechniques has suggested that physical factors act ongenetic variation and that there are differences invariability within populations (Ref. 4).
The Environment Agency is currently investigating thefeasibility of breeding M. margaritifera in captivity.Specifically examining whether it is possible usingyoung capture salmon as hosts and releasing them in the wild.
Species and habitats Guidance notes – Species Invertebrates: Freshwater pearl mussel 2.3.1
Environment Agency in partnership with Natural England and Countryside Council for Wales Understanding water for wildlife
Key referencesGeneral description/biology & habitat details1. Bauer, G. (1988). Threats to the freshwater pearl mussel in Central Europe. Biol. Cons., 45: 239-253.
2. Oliver, (2000). Conservation Objectives for the freshwater pearl mussel Margaritifera margaritifera L. Report forEnglish Nature, Peterborough.
3. Reis J, 2003 The freshwater pearl mussel (Margaritifera margaritifera L.) rediscovered in Portugal and threats toits survival. Biological Conservation, 114, 447-452
4. Skinner A, Young M and Hastie L, 2003 Ecology of the Freshwater Pearl Mussel, Conserving Natura 2000 RiversEcology Series Number 2. Life in UK Rivers, Scottish Natural Hertiage: Edinburgh.
5. UK Biodiversity Action Plan, Species Action Plan. Retrieved 20 Feb 2006 fromhttp://www.ukbap.org.ukUKPlans.aspx?ID=437
6. Vannote, R.L. & Minshall, G.W. (1982). Fluvial processes and local lithology controlling abundance, structure andcomposition of mussel beds. Proceedings of the National Academy of Science, USA 79, 4103-4107.
7. Young, M. (2001). The ecological requirements for freshwater pearl mussel (Draft). LIFE in UK Rivers Project. http://www.english-nature.org.uk/lifeinukrivers/ecological.html
8. Young, M. R., Hastie, L. C. & Cooksley, S. L (2002). A monitoring protocol for the freshwater pearl musselMargaritifera, margaritifera(Draft), Ocean Laboratory & Centre for Ecology, Newburgh.
Supporting referencesAll Annex I freshwater habitats should be considered in the context of this species. The Atlantic salmon (Salmosalar) should also be considered.
< Section divider
This do
cumen
t was
with
drawn o
n 6 N
ovem
ber 2
017.

General informationThe southern damselfly (Coenagrion mercuriale) is oneof the five members of the genus Coenagrion currentlyfound in the UK. Distribution of this species is mainly insouth west England and in South Wales, generally atlow altitudes (usually less than 90 m above sea level). Ithas declined in many places and appears to be presentonly in low numbers at most of its localities. Itspresence in the UK represents the northern boundary ofits range. The southern damselfly is blue and black incolouration and is a member of the ‘blue damselflies’grouping (Ref. 10).
Habitat preferences• The southern damselfly is found in heathland
stream/valley mires, calcareous fenland and watermeadow ditch systems surrounding chalk streams;
• There is no consistent trend in plant species used bythe southern damselfly. Ideal emergence sitescontain plants with rigid stems which are less proneto being blown in the wind Hypericum elodes andPotamogeton polygonifolius were used in themajority of heathland sites where populations arefound. Glyceria maxima, Apium nodiflorum, andNasturtium officinale were used in chalk streamwater meadow sites, on average a low to mediumcover of submerged and emergent vegetation (0.2 –0.6m) Ref. 5;
• A range of NVC community types are associated withthe southern damselfly (refer to Ref. 10); and
• The majority of watercourses where the southerndamselfly is found fall within a pH range of 7.0 – 7.5although pH is not thought to determine distribution(Ref. 4).
Key influencesWater resources• Southern damselfly populations require
watercourses with slow to moderate flow. Strange(1999) found adult populations in chalk stream watermeadow systems to be concentrated on channelflows where water velocities ranged from 7.5 to 20cm/s (Ref. 9). In areas with fast flowing mainchannels, the shallow stream margins or areas ofdense vegetation can be utilised;
• Water flow rates in the larval habitats studied byPurse & Thompson (2002a) in the Glan-yr-afon Uchaf,Pembrokeshire were found to range from 2 to 15 cm/s;
• Water abstraction may alter the movement of waterthrough meadow systems and reduce groundwaterspring flow, affecting habitat suitability;
• Water currents of around 10 cms-1 (maximum of35cm s-1) allow for a minimum oxygen concentrationof 2.5 – 3.0 mg/l-1. Oxygen levels have been cited asan important factor in the distribution of thesouthern damselfly (Ref. 8);
• Permanent conduction of water and proximity tosprings or groundwater are cited as important factorsin determining habitat suitability (Ref. 3); and
• Springs maintain a higher than average temperaturein winter and are more constant in temperaturethroughout the year, preventing freezing over ordrying up (Ref. 8).
Other influences• The southern damselfly tends to favour habitats
where the water is unpolluted, has high oxygenconcentrations and the conductivity is generally low(less than 150 uS/cm), but levels up to 500 uS/cmhave been recorded (Ref. 10);
• Studies have found phosphate levels to be less than0.025 mg/l in most watercourses and sites occupiedby the southern damselfly. There are howeverexceptions to this (Ref. 10);
• Nitrates levels are generally low (less than 0.2 mg/l)in southern damselfly habitats (Ref. 10);
• Habitat fragmentation has affected populations.Overzealous clearance of channel vegetation canpose a serious threat to populations if undertaken atcertain stages of the life cycle; and
• Alteration of grazing regimes may affect the status ofsouthern damselfly populations. Moderate grazingregimes are needed to reduce the establishment ofscrub and invading emergents.
Current and future workThe LIFE in UK Rivers Project is developing conservationstrategies and monitoring protocols for use on riversdesignated as Special Areas of Conservation under theEuropean Union Habitats Directive. Refer to the LIFE inUK Rivers website for further information.
Species and habitats Guidance notes – Species Invertebrates: Southern damselfly 2.3.1
Environment Agency in partnership with Natural England and Countryside Council for Wales Understanding water for wildlife
Southern damselfly (Coenagrion mercuriale)
2.3.1 Invertebrates
< Section divider
This do
cumen
t was
with
drawn o
n 6 N
ovem
ber 2
017.

Species and habitats Guidance notes – Species Invertebrates: Southern damselfly 2.3.1
Environment Agency in partnership with Natural England and Countryside Council for Wales Understanding water for wildlife
Key referencesGeneral description/biology & habitat details1. Berrie, A.D. (1992). The chalkstream environment. Hydrobiologia, 248, 3-9.
2. Buchwald, R. (1989). Die Bedeutung der Vegetation fur die Habitatbindung einiger Libellenarten der Quellmooreund Fliessgewasser. Phytocoenologia, 17, 307-448.
3. Burchwald, R. (1994). Zur Bedeutung der Vegetation fur die Habitatbindung einiger Libellenarten derQuellmoore und Fliessgewasser. Phyocoenologia, 17, 307-448.
4. Corbet, P. S. (1999). Dragonflies: Behaviour and ecology of Odonata. Harley Books, Colchester.
5. Purse, B. (2002) R & D Leaflet W1-021/L: Conservation of the Southern Damselfly. Environment Agency.
6. Purse B.V. and Thompson D.J. (2002a). Voltinism and larval growth pattern in Coenagrion mercuriale (Odonata:Coenagrionidae) at its northern range margin. European Journal of Entomology, 99, 11-18.
7. Purse B.V. and Thompson D.J. (2002b). Reproductive morphology and behaviour in Coenagrion mercuriale(Charpentier) (Zygoptera: Coenagrionidae). Odonatologica.
8. Sternberg, K., Buchwald, R. & Röske, W. (1999). Coenagrion mercuriale (Charpentier, 1840) – Helm Azurjungfer.In The Dragonflies of Baden Wurttemburg, ed. K. Sternberg & R. Buchwald. Eugen Ulmer Press, Stuttgart.
9. Strange, A. (1999). Distribution of Southern Damselfly on the River Itchen, Ecological Planning and Research forEnglish Nature and the Environment Agency.
10. Thompson, D., Purse, B. & Rouquette, J. (2002). Ecological requirements of the southern damselfly (Coenagrionmercuriale Charpentier (Draft). Document provided in confidence. LIFE in UK Rivers Project. http://www.english-nature.org.uk/lifeinukrivers/ecological.html)
Further reading11. B.Purse (2002) R & D Technical Report W1 – 021/TR: The Ecology and Conservation of the Southern Damselfly(Coenagrion mercuriale – Charpentier) in Britain.
12. Rouquette JR and Thompson DJ, 2005 Habitat associations of the endangered damselfy, Coenagrionmercuriale, in a water meadow ditch system in southern England. Biological Conservation, 123, 225-235.
Supporting referencesAnnex I habitats to be considered with the southern damselfly are; North Atlantic wet heaths with Erica tetralix,Temperate Atlantic wet heaths with Erica ciliaris and Erica tetralix; and Ranunculus habitats.
< Section divider
This do
cumen
t was
with
drawn o
n 6 N
ovem
ber 2
017.

General informationThe distribution of the white-clawed crayfish(Austropotamobius pallipes) is governed by geologyand water quality. The species can be found in a varietyof locations including canals, streams, rivers, lakes,reservoirs and water-filled quarries, where it occupiescryptic habitats. Populations are concentrated innorthern and central England. They are largelynocturnal, with breeding taking place from Septemberto November when water temperatures drop below 10˚Cfor an extended period (Ref. 1).
Habitat preferences• White-clawed crayfish occur in relatively hard,
mineral-rich waters on calcareous and rapidlyweathering rocks;
• Populations in the UK are associated with chalk,limestone or sandstone deposits in water bodieswhere calcium content is a minimum of 5 mg/l andpH ranges between 6.5-9.0 (Ref. 1); and
• Flowing water habitats in which the white-clawedcrayfish is found often have undermined,overhanging banks; sections which exhibitheterogeneous flow patterns; cobbles and rockriffles; roots and woody vegetation; and under water-saturated logs.
Key influencesWater resources• The white-clawed crayfish typically inhabits
watercourses with depth ranging between 0.75-1.25 m. The species may also occur in veryshallow streams (0.05 m depth) and in deeper, slow-flowing rivers (2.5 m depth);
• Populations occur in both still and running water.White-clawed crayfish can survive in rivers with astrong flow, providing suitable refuges such as weirsand boulders are present;
• They can occur in shallow riffles and in streams lessthan 0.5m wide with water depths of just a fewcentimetres;
• Low water levels can increase the white-clawedcrayfish’s vulnerability to predation;
• Flow conditions which affect bankside vegetationand submerged plant communities may have indirect
consequences to white-clawed crayfish; and• Increased silt loads (and turbidity) caused by land
practices or flow changes (natural and induced) canclog the gills of crayfish. No quantitative data isavailable.
Other influences• White clawed crayfish are susceptible to acute
pollution incidents caused by spills of organicmaterial with a high BOD (e.g. cattle slurry). In asimulated experiment, Foster & Turner (Ref. 3) foundthat increased ammonia concentrations and reducedoxygen conditions caused significant mortalities. Themajority of records show the white-clawed crayfish tooccupy waters with GQA classifications of A or B, andhigh BMWP scores;
• Oxygen levels below 5 mg/l for more than a few daysin summer months may cause stress (Ref. 7);
• Porcelain disease (Thelohania contejeani) andcrayfish plague (Aphanomyces astaci) affect thewhite-clawed crayfish. Porcelain disease is rarelyfatal, but crayfish plague can cause mass mortalities;
• Submerged plant communities and banks arerequired for refuge;
• The presence of overhanging bankside vegetation(for shelter, food and cover) may determine crayfishabundance (Ref. 1);
• Direct predation and competition by the introducedsignal crayfish (Pacifastacus leniusculus) has thepotential to eliminate white-clawed crayfishpopulations. Signal crayfish may also act as vectorsof the crayfish plague;
• Other non-native crayfish also have the potential tooutcompete the white-clawed crayfish for resources;and
• Susceptibility to biocides is noted. One studydemonstrated crayfish sensitivity at concentrationsof 0.0042 mg/l, with levels above 0.208 mg/l toxic.An EQS for the protection of freshwater life has beenproposed at 0.1 mg/l (AA) and 1 mg/l.
Current and future workThe LIFE in UK Rivers Project has developedconservation strategies and monitoring protocols foruse on rivers designated as Special Areas ofConservation under the European Union HabitatsDirective. Refer to the LIFE in UK Rivers website forfurther information.
Species and habitats Guidance notes – Species Invertebrates: White-clawed crayfish 2.3.1
Environment Agency in partnership with Natural England and Countryside Council for Wales Understanding water for wildlife
White-clawed crayfish (Austropotamobius pallipes)
2.3.1 Invertebrates
< Section divider
This do
cumen
t was
with
drawn o
n 6 N
ovem
ber 2
017.

Species and habitats Guidance notes – Species Invertebrates: White-clawed crayfish 2.3.1
Environment Agency in partnership with Natural England and Countryside Council for Wales Understanding water for wildlife
Key referencesGeneral description/biology & habitat details1. Holdich, D. (2001). Ecological requirements of the white clawed crayfish Austropotamobius pallipes(Lereboullet). LIFE in UK Rivers Project. http://www.english-nature.org.uk/lifeinukrivers/ecological.html
2. Holdich D, 2003 Ecology of the White-clawed crayfish, conserving Natura 2000 Rivers, Ecology Series No.1English Nature: Peterborough.
3. Foster, J. & Turner, C. (1993). Toxicity of field simulated farm waste episodes to the crayfish Austropotamobiuspallipes (Lereboullet): elevated ammonia and reduced dissolved oxygen concentrations. Freshwater Crayfish, 9,249-258.
4. Gil-Sanchez J and Alba-Tercedor J 2001 Ecology of the native and introduced crayfishes Austropotamobiuspallipes and Procambarus clarkii in southern Spain and implications for conservation of the native species.Biological Conservation, 105, 75-80.
5. Joint Nature Conservation Committee, Invertebrate Species:arthropods Austropotamobius pallipes. RetrievedFeb 21 2006 from http://www.jncc,gov.uk/protectedSites/SACselection/species.asp?FeatureIntCode=S1092
6. UK Biodiversity Action Plan, Species Action Plan Retrieved Feb 21, 2006, fromhttp://www.ukbap.org.uk/UKPlans.aspx?ID=124
< Section divider
This do
cumen
t was
with
drawn o
n 6 N
ovem
ber 2
017.

General informationFisher’s estuarine moth, G. borelii lunata is an insectrestricted to a small area of sea-walls and coastalgrassland in north Essex (although a small colony inKent may also exist; Ref. 1). The moth has a widespreadbut localised European distribution and is limited bythe availability of food sources as it feeds exclusivelyon Peucedanum, P. officinale, or Sea Hog’s Fennel inEngland (Ref. 4). G. borelii lunata lays its eggs on theFennel and the larvae hatch in late spring, feeding onits stems and then later boring into the roots of theplant (Ref. 4). After pupation, the adult moths emerge in autumn with a wingspan of 42-60mm (Ref. 4). Thespecies is nocturnal and sedentary with only a fewmoths ever found more than 10 metres away from afood plant. The total UK population has been estimatedto be 1000-5000 adults (Ref. 3). Recent genetic studieshave indicated that the British form of the moth may bean endemic subspecies, distinct from the population inmainland Europe (Ref. 2). The decline of this species inBritain may be due to sea-level rise and the loss orfragmentation of its habitat.
Habitat preferences• The Fisher’s moth inhabits marshy fields, raised
banks, offshore islands and wasteland where the SeaHog’s Fennel is present.
Key influencesWater resources• G. borelii lunata may be directly affected by sea level
rise; or • Indirectly impacted if hydrological changes alter the
availability of Sea Hog’s Fennel (Ref. 1).
Other influences• Changes in land use, such as agricultural
intensification can reduce the habitat of G. boreliilunata; additionally, any changes that affect thehabitat of Sea Hog’s Fennel may also impact the moth.
Current and future workStudies on the population and distribution of the SeaHog’s Fennel are on-going, please see Supportingreferences.
Species and habitats Guidance notes – Species Invertebrates: Fisher’s estuarine moth 2.3.1
Environment Agency in partnership with Natural England and Countryside Council for Wales Understanding water for wildlife
Fisher’s estuarine moth (Gortyna borelii lunata)
2.3.1 Invertebrates
Key references1. ARKive, Fisher’s estuarine moth (Gortyna borelii lunata). Retrieved February 23, 2006, from:http://www.arkive.org/species/ARK/invertebrates_terrestrial_and_freshwater/Gortyna_borelii_lunata/more_info.html
2. Essex Biodiversity Project, Essex Biodiversity Action Plan. Retrieved February 21, 2006, from:http://www.essexbiodiversity.org.uk/species.htm#moth2
3. Gibson C, 2000 The conservation of Gortyna borelii lunata (freyer; Lep: Noctuidae). Entomologist’s Record andJournal of Variation, 112, 1, 1-5.
4. Joint Nature Conservation Committee, Invertebrate species: arthropods Gortyna borelii. Retrieved February 21,2006, from: http://www.jncc.gov.uk/ProtectedSites/SACselection/species.asp?FeatureIntCode=S4035
5. Ringwood Z, Hill J and Gibson C, 2004 Conservation management of Gortyna borelii lunata (Lepidoptera:Noctuidae) in the United Kingdom. Journal of Insect Conservation, 8, 173-183.
Supporting referencesSeveral studies involving Sea Hog’s Fennel have been undertaken, please see:
6. Iley M and Ringwood Z, 2004, Progress report on research trials to establish Sea Hog’s Fennel Peucedanum officinaleL. at Abbots Hall Farm, Gt. Wigborough. Retrieved February 21, 2006, from:http://www.essexbiodiversity.org.uk/projects/progress_report_on_trials_establish_seahogs.pdf (PDF, 213966 bytes)Estuaries should be considered with the Fisher’s moth.
< Section divider
This do
cumen
t was
with
drawn o
n 6 N
ovem
ber 2
017.

General informationThe marsh fritillary (Euphydryas aurinia) is found in arange of habitats in the UK, but is essentially agrassland butterfly. Populations are known tooccasionally occur on wet heath, bog margins andwoodland clearings. The appearance of the marshfritillary butterfly is highly variable, with markeddifferences within and across populations noted. Theupper sides of the wings are dark brown, stronglymarked with cream and orange square spots, most ofwhich are arranged in bands. The under sides arebrighter, orange with cream spots (Ref. 6).
Populations vary greatly in size from year to year andare, at least in part, related to cycles of attack fromparasitic wasps. Another key factor is weatherconditions in late May/early June. During this timepopulations are heavily dependent on favourableconditions. Adults tend to be sedentary and remain in a series of linked metapopulations, forming numeroustemporary sub-populations (Ref. 6 & 4).
Numbers have declined dramatically across Europesince records started, with the UK and Spain nowconstituting the greatest proportion of remainingpopulations. Although formerly widespread in centraland eastern England, important centres of distributionare now in South-west England (particularly Devon,Dorset and Wiltshire), South and west Wales, Cumbriaand western Scotland (Ref. 8 & 1).
Habitat preferencesColonies of the marsh fritillary primarily occur in twocontrasting biotypes:
• 1. Damp unimproved acidic grassland; • 2. Dry, calcareous grassland; • Requirements for the marsh fritillary are considered
different between the two habitats, and requirefurther investigation;
• In damp unimproved acidic grassland habitats, thesites are generally flat with vegetation dominated bytussocky, coarse grasses (Molinia caerulea on acidicsoils and Deschampsia caespitosa on more neutralsoils). Historical grazing (nearly always by cattle orponies) is also characteristic of the sitesmanagement (Ref. 10). Breeding areas are generallyopen and unshaded, though many are sheltered
either by scattered scrub or by adjacent woodland(Ref. 2); The 2001 Foot and Mouth Disease outbreakaffected sites where historic seasonal grazingpatterns had been established;
• The occurrence of the butterfly on calcareousgrassland in the UK is a recent observation. Itappears that colonisation of calcareous grasslandhas occurred after the switch from sheep to cattle onsome lowland hills around 100 years ago. (Ref. 11);
• The larval food plant required by the marsh fritillaryis the devil’s-bit scabious (Succisa pratensis). Largeleaves are generally required for egg-laying, althoughsmall leaves are utilised in chalk downland habitats;
• Colonies can survive in fairly short-grazed turfon chalk grassland (e.g. 2-5 cm) if the food plant(devil’s-bit scabious) is sufficiently abundant (Ref. 7);
• The adult marsh fritillary feeds on nectar and mayhave a preference for thistles (Carduus spp. andCirsium spp.);
• South and west-facing slopes are favoured withnorth-facing slopes not used (Ref. 5); and
• As a weak flyer, topographic shelter or the presenceof scrub is required.
Key influencesWater resources• No information on the water resource requirements
of the marsh fritillary were identified;• Water resources are not believed to be a major
parameter involved in the decline of the marshfritillary butterfly. However, high water tables onmany of this species damp acidic grassland habitatsites have rendered the ground too heavy forcultivation, re-seeding or other development. Thishas been a major contributory factor to the survivalof the marsh fritillary butterfly at these locations.Field drainage is thus a serious threat; and
• Consideration of the water requirements of the larval food plant is required.
Other influences• The marsh fritillary is a basking insect, and utilises
solar radiation to raise its body temperature abovethe ambient. Basking sites are chosen on the basisof their solar radiation absorbance-reflectioncharacteristics (Ref. 7);
• Loss of habitat through agricultural improvement ofmarshy and chalk/limestone grasslands and changesin management practices (i.e. large burns or burning
Species and habitats Guidance notes – Species Invertebrates: Marsh fritillary butterfly 2.3.1
Environment Agency in partnership with Natural England and Countryside Council for Wales Understanding water for wildlife
Marsh fritillary butterfly (Euphydryas aurinia)
2.3.1 Invertebrates
< Section divider
This do
cumen
t was
with
drawn o
n 6 N
ovem
ber 2
017.

without grazing) will affect marsh fritillary populations;• Changes in grazing stock practices may reduce
habitat availability and food plant source abundance(e.g. sheep generally consume devil’s-bit scabiousand create a tight sward); and
• Fragmentation and isolation of habitats will impacton populations.
Current and future work
Current and future work being undertaken to conserve themarsh fritillary in the UK are outlined in Ref. 10. Extensivesurveys are to be carried out on Dartmoor by the NationalPark Authority, and collection of data from Islay in theInner Hebrides and Salisbury Plain are also proposed.
A European LIFE project on Salisbury Plain is proposedin an attempt to improve the quantity and quality ofavailable breeding habitat.
A PhD undertaken by K. Porter (1981) on ‘Thepopulation dynamics of small colonies of the butterflyEuphydras aurinia’ may provide additional informationon this species. Access to this document was notpossible through the British Library. Work from a PhDundertaken by Francien van Soest and sponsored byEnglish Nature (Devon) should soon be available on thehabitat preference of the marsh fritillary in relation toculm grassland.
Work continues on influencing Countryside Stewardshipand other Defra agrienvironment initiatives (Ref. 3)
Species and habitats Guidance notes – Species Invertebrates: Marsh fritillary butterfly 2.3.1
Environment Agency in partnership with Natural England and Countryside Council for Wales Understanding water for wildlife
Key referencesGeneral description/biology & habitat details1. Asher, J., Warren, M., Fox, R., Harding, P., Jeffcoate, G. & Jeffcoate, S., 2001. The Millennium Atlas of Butterflies inBritain and Ireland. Oxford University Press.
2. Barnett, L.K., Warren, M.S. (1995). Species Action Plan: Marsh Fritillary Euphydryas aurinia. ButterflyConservation, Dorset.
3. Bourn, N.A.D. & Warren, M.S., 1996. The Impact of Land Enhancement Schemes on the Marsh Fritillary Butterfly,Euphydryas aurinia: A Preliminary Review in England. Butterfly Conservation, Wareham.
4. Bulman, C., 2001. Conservation Biology of the Marsh fritillary butterfly Euphydryas aurinia. PhD Thesis Univ. Leeds.
5. Hobson, R., Bourn, N, Warren, M., (2002). Conserving the Marsh Fritillary in Britain. British Wildlife. 13(6): 404-411.
6. McLeod, CR, Yeo, M, Brown, AE, Burn, AJ, Hopkins, JJ, & Way, SF (eds.) (2002). The Habitats Directive: selection ofSpecial Areas of Conservation in the UK. 2nd edn. Joint Nature Conservation Committee, Peterborough.www.jncc.gov.uk/SACselection
7. Nature Conservancy Council. (1986). The management of chalk grassland for butterflies. Butterflies under ThreatTeam, Nature Conservancy Council. Peterborough.
8. Porter, K. (1982). ‘Basking behaviour in larvae of the butterfly Euphydryas aurinia. OIKOS Vol 38, pp 308-312.
9. UK biodiversity Action Plan, Marsh Fritillary (Eurodryasaurinia) Retrieved Feb 24, 2006 from:www.ukbap.org.uk/UKPlans.aspx?ID=300
10. UK Biodiversity Steering Group. (1995). Marsh Fritillary (Euphydryas aurinia). In: Biodiversity: The UK SteeringGroup Report – Volume II: Action Plans. Annex G. pp:136-137.
11. Warren, M.S. (1990). The conservation of Euphydryas aurinia in the United Kingdom. In: Colloquy on the BerneConvention invertebrates and their conservation. pp:71-74. Environmental Encounter Series, No. 10. Strasbourg:Council of Europe.
Supporting referencesThe Annex I habitats to be considered with the marsh fritillary butterfly are: Molinia meadows on calcareous, peatyor clayey-silt-laden soils (Molinion caeruleae); Alkaline fens Calcium-rich springwater fed fens; Temperate Atlanticwet heaths with Erica ciliaris and Erica tetralix; and Calcareous fens with Cladium marisus and species of theCaricion davallianae.
< Section divider
This do
cumen
t was
with
drawn o
n 6 N
ovem
ber 2
017.

2.3.2 Fish andamphibiansThe following summaries have been compiled using key reference papersprovided by Environment Agency and Natural England staff. They provide asummary of relevant information on the freshwater requirements of fish andamphibians. For further information, refer to references listed below eachhabitat account.
– Sea lamprey (Petromyzon marinus)
– Brook lamprey (Lampetra planeri)
– River lamprey (Lampetra fluviatilis)
– Allis shad (Alosa alosa)
– Twaite shad (Alosa fallax)
– Atlantic salmon (Salmo salar)
– Spined loach (Cobitis taenia)
– Bullhead (Cottus gobio)
– Great crested newt (Triturus cristatus)
Species and habitats Guidance notes – Species Fish and amphibians: Sea lamprey 2.3.2
Environment Agency in partnership with Natural England and Countryside Council for Wales Understanding water for wildlife
< Section divider
This do
cumen
t was
with
drawn o
n 6 N
ovem
ber 2
017.

General informationThe sea lamprey, Petromyzon marinus, belongs to agroup known as Agnatha, or jawless fish, which is themost primitive of all living vertebrates. Not true fish,their bodies are made of cartilage and their mouth issurrounded by a round, sucker-like disc within whichare strong, horny rasping teeth. Spawning occurs in lateMay to July when water temperatures reach at least 15degrees centigrade. Adult lampreys often die followingspawning (Ref. 7). After hatching, juvenile lampreysleave the nest and drift downstream, burrowing intosuitable silt beds (Ref. 7). Following metamorphosisbetween July and September, the lamprey migratedownstream and out to sea (Ref. 7). Juvenile lampreyfilter feed on various unicellular organisms includingciliates, eugledoids and rhizopods, while adult lampreyare parasitic and feed on salmon, basking shark, codand sturgeon and may travel to considerable depths tofind prey (Ref. 7). Although P. marinus is fairlywidespread in UK rivers, its populations have recentlydeclined, current strongholds are the rivers Wye andSevern Rivers (Ref. 3). Outside of the UK P. marinus maybe found along Atlantic coastal areas of western andnorthern Europe between Norway and theMediterranean as well as in the eastern parts of NorthAmerica (Ref. 3).
Habitat preferences• P. marinus favour larger streams and rivers but may
be found in a range of habitat types (Ref. 5);• Lamprey normally breed in high quality, deep, fast
flowing rivers with clean gravels (Ref. 3). Nests areoften constructed from gravel pebble substrate (9.5-50.8 mm in diameter); and
• Sand must be available for eggs to adhere. Larvalnursery beds are found at the edges of streams andrivers, away from the main current.
Key influencesWater resources• Water abstraction and land drainage may create
unstable habitats through varying water levels andthese activities may also dewater the marginalhabitats used by larvae;
• High flows may reduce access to spawning sites andsweep eggs and larvae downstream into the sea. Lowflows may prevent migration through shallow watersand physical barriers. However, adults prefer flows ofapproximately 0.4 m3s-1 and an adequate flow of atleast 8-10 cms-1 is necessary over the nest forsuccessful spawning (Ref. 7);
• Water depth at spawning sites varies from 0.05-1.52 m, with an extreme of 3.7 metres. Depth in nursery areas ranges from 0.01-1 metre but is most often between 0.4-0.5 metres;
• Migration is influenced by tides and river flows andmay be inhibited by shallow water or artificialbarriers such as weirs and sluices; and
• Sea lamprey may also be at risk from entrainment.
Other influences• The removal or siltation of gravel used in spawning
areas may damage the habitat and inhibit spawning.The optimum particle size for larval silt beds in 0.18-0.38 mm with a gradient ranging from 1.9-5.7 m/km;
• Sea lamprey are sensitive to pollution and riversshould be of GQA chemical Class B for adult lampreyand Class A for spawning. Sufficient oxygenconcentrations are also important (Ref. 7 & 3);
• Water temperature is an important factor during the life cycle of and successful hatching andmetamorphosis, and critical spawning temperaturesrange from 8.5-12 degrees centigrade (Ref. 5 & 6); and
• Larvae may be predated by eels, sticklebacks andother fish, as well as birds such as heron, and adultsea lamprey may be attacked during spawning (Ref. 7).
Current and future workThe LIFE in UK Rivers Project has developedconservation strategies and monitoring protocols for P. marinus and are available from: www.english-nature.org.uk/lifeinukrivers/species/lamprey.html
Species and habitats Guidance notes – Species Fish and amphibians: Sea lamprey 2.3.2
Environment Agency in partnership with Natural England and Countryside Council for Wales Understanding water for wildlife
Sea lamprey (Petromyzon marinus)
2.3.2 Fish and amphibians
< Section divider
This do
cumen
t was
with
drawn o
n 6 N
ovem
ber 2
017.

Species and habitats Guidance notes – Species Fish and amphibians: Sea lamprey 2.3.2
Environment Agency in partnership with Natural England and Countryside Council for Wales Understanding water for wildlife
Key references1. Alabaster JS and Lloyd, 1970 Water quality criteria for freshwater fish. Butterworths: London.
2. Applegate, 1950 Natural history of the Sea Lamprey, Petromyzon marinus, in Michigan. Special ScientificReport, U.S. Fish and Wildlife Service, 55, 1-237.
3. ARKive, Sea Lamprey (Petromyzon marinus). Retrieved March 8, 2006 fromhttp://www.arkive.org/species/ARK/fish/Petromyzon_marinus/more_info.html
4. Bird DJ, Potter IC, Hardisty MW and Baker BI, 1994 Morphology, body size and behaviour of recently-metamorphosed sea lampreys, Petromyzon marinus, from the lower River Severn, and their relevance to the onsetof parasitic feeding. Journal of Fish Biology, 44, 1, 67-74.
5. Entec, 2000a River Eamont acceptable Drought Oder flow regime recommendation: suitability for Britishlamprey. Environment Agency: Penrith.
6. Entec, 2000b Generically acceptable flows for British lamprey. Environment Agency: Penrith.
7. Maitland PS, 2003 Ecology of the River, Brook and Sea Lamprey. Conserving Natura 2000 Rivers Ecology SeriesNo. 5, English Nature: Peterborough. Available: http://www.english-nature.org.uk/lifeinukrivers/species/lamprey.pdf
8. Morman RH, Cuddy DW and Rugen PC, 1980 Factors influencing the distribution of Sea Lamprey (Petromyzonmarinus) in the Great Lakes. Canadian Journal of Fisheries and Aquatic Sciences, 37, 1811-1826.
Supporting referencesHabitats that should be considered with P. marinus are water courses of plain to montane levels with Ranunculionfluitantis and Callitrichol-Batachion vegetation and estuaries.
< Section divider
This do
cumen
t was
with
drawn o
n 6 N
ovem
ber 2
017.
General informationThe brook lamprey, Lampetra planeri, is a primitive,jawless fish resembling an eel. It is a non-migratoryfreshwater species, occurring in streams andoccasionally in lakes in north-west Europe (Ref. 9). Nottrue fish, the bodies of L. planeri are made of cartilageand their mouth is surrounded by a round, sucker-likedisc within which are strong, horny rasping teeth.Unlike sea and river lampreys which are anadromous, L.planeri live entirely in freshwater and are non-parasitic.The brook lamprey has declined in some areas of theUK but is still widespread and common in parts ofEngland. In Europe it extends from Sweden to France(Ref. 3). Unlike its close relatives, the sea and riverlamprey, the brook lamprey is not parasitic and feeds byfiltering fine organic particles such as diatoms andprotozoans as well as detritus from the substratesurface (Ref. 10).
Habitat preferences• L. planeri lives in small streams, rivers and lakes with
clean gravel beds to spawn in and silt or sandy areasfor the larvae (Ref. 3). L. planeri tend to spawn insections of the river where the current is not toostrong (Ref. 9). Spawning occurs in British riverswhen the water temperatures reach 10-11 degreescentigrade (Ref. 10).
Key influencesWater resources• Water abstraction and land drainage can create
unstable habitats through the variance of waterlevels and change flow, reducing the suitable habitat particularly for the larvae;
• Recent studies have indicated that larvae inhabitareas with flows of 0.4 to 0.5ms-1 and depths of0.25 metres;
• Surveys have indicated that L. planeri prefer areas withrooted macrophytes’ and changes in flow or depthwhich may reduce this vegetative presence could havea negative impact on the lamprey (Ref. 10); and
• Water depth in nursery areas should range from 0.1-1metres and the installation of gauging weirs mayhave a detrimental impact on the brook lamprey andtheir spawning (Ref. 3).
Other influences• A decline in water quality, particularly resulting from
pollution and eutrophication has contributed to thedecline in L. planeri. In the absence of specifictolerance data for this species it must be assumedthat conditions in all parts of any river where brooklampreys occur, or pass through on migration, are atleast UK Water Quality Class B (Ref. 10);
• Oxygen tension is a major factor in the maintenanceof the burrowing habit of larvae (Ref. 10);
• Water temperature is also important for successfulhatching and for metamorphosis, which may onlyoccur at 12 degrees centigrade;
• Stream bed stability is also important and larvae maybe absent from beds characterised by frequent sanddrift. Siltation of the substrate may also smotherspawning gravels and nursery silts as it createsanoxic conditions; and
• L. planeri can be affected by the placement ofobstacles and the inadequacy of fish screens onintakes which can entrain lamprey.
Current and future workThe LIFE in UK Rivers Project has developedconservation strategies and monitoring protocols forthe L. planeri and are available from: www.english-nature.org.uk/lifeinukrivers/species/lamprey.html
Species and habitats Guidance notes – Species Fish and amphibians: Brook lamprey 2.3.2
Environment Agency in partnership with Natural England and Countryside Council for Wales Understanding water for wildlife
Brook lamprey (Lampetra planeri)
2.3.2 Fish and amphibians
< Section divider
This do
cumen
t was
with
drawn o
n 6 N
ovem
ber 2
017.

Species and habitats Guidance notes – Species Fish and amphibians: Brook lamprey 2.3.2
Environment Agency in partnership with Natural England and Countryside Council for Wales Understanding water for wildlife
Key references1. APEM, 1996 A survey of six English rivers for lamprey. English Nature: Peterborough.
2. APEM, 1997 Monitoring guidelines for lampreys. English Nature: Peterborough.
3. ARKive, Brook Lamprey (Lampetra planeri). Retrieved March 8, 2006 fromhttp://www.arkive.org/species/ARK/fish/Lampetra_planeri/more_info.html
4. Duncan W, 1996 Brook lamprey survey on the upper River Endrick. Scottish Natural Heritage: Edinburgh.
5. Entec, 2000a River Eamont acceptable Drought Order flow regime recommendation: suitability for Britishlamprey. Environment Agency: Penrith.
6. Entec, 2000b Generically acceptable flows for British Lamprey. Environment Agency: Penrith.
7. Gardiner R, Taylor R and Armstrong J, 1995 Habitat assessment and survey of lamprey populations occurring inareas of conservation interest. Scottish natural Heritage: Edinburgh.
8. Gardiner R and Stewart D, 1997 Spawning habitat assessment and survey of lamprey populations occurring inareas of conservation interest. Scottish Natural Heritage: Edinburgh.
9. Joint Nature Conservation Committee, 1096 Brook Lamprey Lampetra planeri. Retrieved March 8, 2006 fromhttp://www.jncc.gov.uk/ProtectedSites/SACselection/species.asp?FeatureIntCode=S1096
10. Maitland PS, 2003 Ecology of the River, Brook and Sea Lamprey. Conserving Natura 2000 Rivers Ecology Series No.5, English Nature: Peterborough. Available: http://www.english-nature.org.uk/lifeinukrivers/species/lamprey.pdf
11. Maitland PS and Lyle AA, 2000 Distribution of lampreys in the River Teith. Report to Scottish Natural Heritage:Edinburgh.
12. McLeod CR, Yeo M, Brown AE, Burn AJ, Hopkins JJ and Way SF, 2002 The Habitats Directive: selection of SpecialAreas of Conservation in the UK, second edition. Joint Nature Conservation Committee: Peterborough.
Further informationWater courses of plain to montane levels with Ranunculion fluitantis and Callitricho-Batrachion vegetation shouldalso be considered with the brook lamprey.
< Section divider
This do
cumen
t was
with
drawn o
n 6 N
ovem
ber 2
017.

General informationThe river lamprey, Lampetra fluviatilis, belongs to agroup known as Agnatha, or jawless fish, which is themost primitive of all living vertebrates. Not true fish,their bodies are made of cartilage and their mouth issurrounded by a round, sucker-like disc within whichare strong, horny rasping teeth. Adults migrateupstream into rivers to reach spawning areas and layeggs in crude nests, shallow depressions created bylifting away stones, and die shortly after spawning (Ref.8). After hatching the larvae burrow into sandy or siltyareas until they metamorphose after a few years ofdevelopment (Ref. 8). Unlike its close relative, thebrook lamprey, L. fluviatilis is a parasitic organismwhich feeds on the flesh of a variety of estuarine fish.
L. fluviatilis is only found in western Europe where it hasa wide distribution from southern Norway to thewestern Mediterranean. In the UK, L. fluviatilis has awide distribution with young lampreys (ammocoetes)occurring in many rivers from the Great Glen in Scotlandsouthwards. Declines have been recorded over the lastcentury as a result of pollution, river engineering andbarriers, particularly those that inhibit spawning asL. fluviatilis are an anadromous species (Ref. 8 & 7).Because of known declines throughout the species’European range, UK populations of river lamprey arenow internationally important (Ref. 2).
Habitat preferences• River lampreys are often found in association with
the sea and brook lamprey but may also occur ontheir own;
• They prefer rivers of high water quality and watertemperatures of 10-11 degrees centigrade (Ref. 2);
• Nursery areas for lamprey larvae occur in beds ofsand where deposition features occur in the river sothat the larvae may burrow into the substrate andfilter feed before metamorphosing;
• A diversity of habitat is also important and L. fluviatilis prefer areas with riffles, pools, gravel beds and bars; and
• As river lamprey feed on estuarine fish as adults, it isimportant that estuarine conditions are suitable withlow levels of pollution and suitable prey (Ref. 8).
Key influencesWater resources• Water abstraction and land drainage can create
unstable habitats for lamprey through varying waterlevels and may be detrimental to larvae if marginalhabitat is reduced or unsuitable flow regimesproduced;
• Water depth in nursery areas may range from 0.01-1 metre and water depth for spawning oftenranges from 0.2-1.5 metres;
• Larval nursery beds are often found at the edges ofstreams and rivers, distanced from the main current.Flows of 8-10 cms-1 have been recorded over larvaeburrows;
• Adult lamprey prefer flows of 1-2ms-1 and larvaeprefer flows of 1 – 50 cms-1 (1). High flows duringspates are detrimental to river lamprey as they mayprohibit access to spawning sites or sweep eggs andlarvae downstream. Low flows may also inhibitmigration through shallow waters and passage overphysical barriers or exacerbate the impacts of poorwater quality; and
• Lamprey are also at risk from entrainment by waterintakes.
Other influences• River lamprey are sensitive to pollution, particularly
heavy metals and pesticides, eutrophication and areintolerant of low oxygen concentrations, particularly aslarvae and require 4 mgl-1 to migrate (Ref. 8) . Riversshould be of GQA chemical Class B where migrationoccurs, and Class A in spawning areas (Ref. 2);
• Studies have indicated that water temperature is alsoan important parameter during the lamprey life cycle,critical spawning water temperatures normally rangefrom 8.5-12 degrees centigrade;
• Adult lamprey feed predominantly in estuaries,which must support healthy populations of prey suchas flounder, sprat, sea trout and herring;
• Barriers may inhibit upstream migration of lampreyfrom their nursery areas to spawning grounds andthe removal of vegetation or its alterations may bedetrimental; and
• The removal or siltation of gravel in spawning areaswill inhibit spawning.
Species and habitats Guidance notes – Species Fish and amphibians: River lamprey 2.3.2
Environment Agency in partnership with Natural England and Countryside Council for Wales Understanding water for wildlife
River lamprey (Lampetra fluviatilis)
2.3.2 Fish and amphibians
< Section divider
This do
cumen
t was
with
drawn o
n 6 N
ovem
ber 2
017.

Current and future workThe LIFE in UK Rivers Project has developedconservation strategies and monitoring protocols forthe L. fluviatilis and are available from: www.english-nature.org.uk/lifeinukrivers/ species/lamprey.html
Species and habitats Guidance notes – Species Fish and amphibians: River lamprey 2.3.2
Environment Agency in partnership with Natural England and Countryside Council for Wales Understanding water for wildlife
Key references1. APEM, 1996 A survey for six English rivers for lamprey. English Nature: Peterborough.
2. ARKive, River Lamprey (Lampetra fluviatilis). Retrieved March 8, 2006, fromhttp://www.arkive.org/species/ARK/fish/Lampetra_fluviatilis/more_info.html
3. Entec, 2000a River Eamont acceptable Drought Order flow regime recommendation: suitability for Britishlamprey. Environment Agency: Penrith.
4. Entec, 2000b Generically acceptable flows for British Lamprey. Environment Agency: Penrith.
5. Goodwin CE, Griffiths D, Dick JTA and Elwood RW, 2006 A freshwater-feeding Lampetra fluviatilis L. populationsin Lough Neagh, Northern Ireland. Journal of Fish Biology, 68, 628-633.
6. Jang MH and Lucas MC, 2005 Reproductive ecology of the river lamprey. Journal of Fish Biology, 66, 2, 499-512.
7. Joint Nature Conservation Committee, 1099 River Lamprey Lampetra fluviatilis. Retrieved March 8, 2006 fromhttp://www.jncc.gov.uk/ProtectedSites/SACselection/species.asp?FeatureIntCode=S1099
8. Maitland PS, 2003 Ecology of the River, Brook and Sea Lamprey. Conserving Natura 2000 Rivers Ecology Series No.5, English Nature: Peterborough. Available: http://www.english-nature.org.uk/lifeinukrivers/species/lamprey.pdf
Supporting referencesHabitats which should be considered with L. fluviatilis are water courses of plain to montane levels withRanunculion fluitantis and Callitricho-Batrachion vegetation and estuaries.
< Section divider
This do
cumen
t was
with
drawn o
n 6 N
ovem
ber 2
017.

General informationThe allis shad is a member of the herring family(Clupeidae) and may be found in shallow coastal watersand estuaries as well as large rivers during the breedingseason where it spawns. Spawning occurs from May toJuly when non-adhesive eggs are laid in gravel beds inshallow waters and hatch 4-8 days later (Ref. 6 & 10).The shad population has declined significantlythroughout Europe in recent years and only in smallnumbers around the coast of Britain. Although the allisshad may spawn in the Solway Firth, there is notdefinite evidence of spawning stocks in the UK (Ref. 6).
Habitat preferences• In a marine environment, A. alosa have been
recorded from depths of 10-150 metres and areexclusively planktivorous. A suitable estuarinehabitat is important for allis shad both for passage ofadults and as a nursery ground for juveniles (Ref. 6).
• In freshwater, A. alosa require a clear migration routeto spawning grounds, suitable resting pools andclean gravels at the spawning area. Juveniles requirea slow-flowing nursery above the estuary afterhatching (Ref. 6). The narrowest river in Britainsupporting A. alosa spawning is the River Teme,which is approximately 20 metres wide. It has beensuggested that the upstream migration from theestuary is catalysed by water temperature increasesto 10-14o Celsius (Ref. 6).
Key influencesWater resources• A. alosa require suitable river flows to allow them
passage to a spawning ground and adequate waterdepths. Abstraction may also be detrimental to shadas low flows may prevent access to upstreamspawning grounds as well as exacerbate the impactof poor water quality (Ref. 3 & 6);
• Studies have suggested that any significantmanagement of channels which removes restingpools or creates stretches of fast flow (>2m s-1) or veryshallow water (<10 cm) must be avoided along theshads migration route (Ref. 6);
• Crecco et al. (1986) suggested that climatic factorssuch as river flow, rainfall and temperature during
May and June are major regulatory factors for shadpopulations. Their study produced a model, whichfound that flow and rainfall accounted for 80-90 percent of stock recruitment variability (Ref. 4 & 5);
• High flows, particularly from June to September, maybe detrimental to A. alosa as eggs and fry may beswept downstream to the sea; additionally, shadhave difficulty swimming upstream if the flowexceeds 2m s-1; and
• Shad can be entrained by various water intakes iftheir design and/or intake velocity allows(Ref. 9).
Other influences• A. alosa need a migration route that is free of
obstacles, such as navigation weirs, hydropowerbarrages and other in-stream barriers which havecontributed to the population decline of the shadwhich may also be lost to water intakes (Ref. 6);
• Shad have also declined from areas with historicallypoor water quality such as the Thames and have notyet returned. A. alosa require a UK water quality classof B or greater;
• The eggs are quite sensitive to temperatures below16 degrees Celsius (Ref. 3) so there may be impactsfrom regulation and compensation releases fromreservoirs; and
• Habitat fragmentation or destruction, particularly theloss of suitable substrate for spawning (which oftenoccurs in faster currents at the end of pools wheregravely shallows begin and where there is amaximum penetration of gravels by currents) andexcess of siltation which can inhibit oxygen uptakeby gills or egg membrane.
Current and future workThe LIFE in UK Rivers Project is developing conservationstrategies and monitoring protocols for use on riversdesignated as Special Areas of Conservation under theEuropean Union Habitats Directive. Refer to the LIFE inUK Rivers website for further information.
A workshop on the four target Vertigo species was heldin 2002, its proceedings were collated into the article:Speight MCD, Moorkens E and Falker G 2003Proceedings of the workshop on conservation biologyof European Vertigo species (Dublin, April 2002) Heldia,5, 7, 1-183.
Species and habitats Guidance notes – Species Fish and amphibians: Allis shad 2.3.2
Environment Agency in partnership with Natural England and Countryside Council for Wales Understanding water for wildlife
Allis shad (Alosa alosa)
2.3.2 Fish and amphibians
< Section divider
This do
cumen
t was
with
drawn o
n 6 N
ovem
ber 2
017.

Species and habitats Guidance notes – Species Fish and amphibians: Allis shad 2.3.2
Environment Agency in partnership with Natural England and Countryside Council for Wales Understanding water for wildlife
Key references1. Acolas ML, Anras B, Veron V, Jourdan H, Sabatie MR and Bagliniere JL, 2004 An assessment of the upstreammigration and reproductive behavious of allis shad (Alosa alosa) using acoustic tracking. ICES Journal of MarineScience, 61, 8, 1291-1304
2. Bagliniere J L, Sabatie M R, Rochard E, Alexandrino P and Aprahamian M W, (in press) The allis shad (Alosaalosa, Linneaus): biology, cology, range and status of populations. Transactions of the American Fisheries Society.
3. Cassou-Leins F and Cassou-Leins J J, 1981 Recherches sur la biologie et l’halieutique des mirgrateurs de laGaronne et principalement de l’alose Alosa alosa L. PhD Thesis, University of Toulouse.
4. Crecco V A and Savoy T F, 1987 Review of recruitment mechanisms of the American Shad; the critical period andmatch-mismatch hypotheses re-examined. American Fisheries Society Symposium, 1, 455-468.
5. Crecco V A, Savoy T F and Whitworth W, 1986 Effect of density dependent and climatic factors in American Shad(Alosa sapidissima) recruitment, a predictive approach. Canadian Journal of Fisheries and Aquatic Sciences, 43,457-463.
6. Maitland PS and Hatton-Ellis TW, 2003 Ecology of the Allis and Twaite Shad. Conserving Natura 2000 RiversEcology Series Number 3. English Nature: Peterborough.
7. McLeod C R, Yeo M, Brown A E, Burn A J, Hopkins J J and Way S F, 2002 The Habitats Directive: selection of SpecialAreas of Conservation in the UK, second edition. JNCC: Peterborough. Available: www.jncc.gov.uk/SACselection
8. Mennesson-Boisneau C, Boisneau P and Postic A, 1999 Abondance de la grande Alose (Alosa alosa, L) dans laLoire: analyses des facteurs de variabilite de 1984 a d’un modele de recruitment. DIREN Centre/Agence, 47p.
9. Taverny C, 1990 An attempt to estimate Alosa alosa and Alosa fallax juvenile mortality caused by three types ofhuman activity in the Gironde Estuary, 1985-1986. Goteborg, Sweeden 31 May-3 June 1988: Pudoc, Wageningen,215-229.
10. UK Biodiversity Action Group, Species Action Plan for Alosa alosa. Retrieved February 27, 2006, from:http://www.ukbap.org.uk/UKPlans.aspx?ID=84
Supporting referencesThe Allis shad should be considered with; Water courses of plain to montane levels with Ranunculion fluitantis andCallitricho-Batrachion vegetation and Estuaries
< Section divider
This do
cumen
t was
with
drawn o
n 6 N
ovem
ber 2
017.

General informationThe twaite shad (Alosa fallax) is a member of the herringfamily Clupeidae. A. fallax occurs along the west coast ofEurope, from southern Norway to the easternMediterranean Sea and in the lower reaches ofaccessible rivers along these coasts; in Britain theymay be found in the Severn, Wye, Usk and Twyi Rivers(Ref. 12). At maturity, adult twaite shad stop feeding and gather in the estuaries of suitable rivers in earlysummer to move upstream and spawn. Spawning occursin flowing water over stones and gravel and the eggshatch in 4-6 days (Ref. 12). The juvenile fish feed oninvertebrates but move onto larger crustaceans as theymature (Ref. 12). Several studies have suggested thatriver flow, rainfall and temperature are major regulatoryfactors for shad populations (Refs. 2 & 4 & 5).
Habitat preferences• Twaite shad have been found in marine habitats of
10-110 metres with a preference for water 10-20meters deep. A suitable estuarine habitat is requiredfor shad, both for the passage of adults and as anursery ground for juveniles (Ref. 12); and
• In freshwater, A. fallax require a clear migration routeto spawning grounds, suitable resting pools andclean gravels at the spawning area. Juveniles requirea slow-flowing nursery area in fresh water above theestuary after hatching (Ref. 12). It has beensuggested that the upstream migration from estuaryis triggered when the water temperature rises to 10-14o Celsius (Ref. 12). The twaite shad spawning runsare also influenced by estuarine tides and river flows,although migration has been recorded at relativelyhigh discharge levels, if flows are too high then thenumber may drop (Ref. 12).
Key influencesWater resources• A. fallax require suitable river flows to allow them
passage to a suitable spawning ground andadequate water depths of 45 centimetres to 3metres. Research indicates that egg density declineswith depth (Ref. 12);
• Studies have suggested that any significantmanagement of channels which removes restingpools or creates stretches of fast flow (>2m s-1) or veryshallow water (<10 cm) must be avoided along theshads migration route (Ref. 12); and
• Abstraction may also be detrimental to shad as lowflows may inhibit access to spawning grounds andexacerbate the impact of poor water quality.
Other influences• A. fallax need a migration route free of obstacles
such as navigation weirs and hydropower barrageswhich have contributed to the reduction inpopulation; the shad may also be consumed byindustrial water intakes (Ref. 8 & 12);
• Shad have also declined from areas with historicallypoor water quality such as the Thames and have notyet returned and it has been suggested that A. fallaxrequire a UK water quality class of B or greater (Ref. 12);
• Water temperatures are important and spawningoften occurs at temperatures between 18-22o Celsiuswhile larvae prefer waters between 17-24o Celsius(Ref. 12);
• Overfishing has also contributed to the decline ofA. fallax;
• Habitat fragmentation or destruction, particularly theloss of suitable substrate for spawning (which oftenoccurs in faster currents at the end of pools wheregravelly shallows begin and where there is amaximum penetration of gravels by currents); and
• Siltation of rivers can inhibit oxygen uptake by gills oregg membranes and has also contributed to shaddecline on some rivers. Shad are often found inwaters with 4-5 mgO2l
-1 (Ref. 10).
Current and future workThe Life in UK Rivers project has developed a guide tothe ecology, conservation and monitoring of the allisshad and is available at: www.english-nature.org.uk/lifeinukrivers/species/shad.html
Species and habitats Guidance notes – Species Fish and amphibians: Twaite shad 2.3.2
Environment Agency in partnership with Natural England and Countryside Council for Wales Understanding water for wildlife
Twaite shad (Alosa fallax)
2.3.2 Fish and amphibians
< Section divider
This do
cumen
t was
with
drawn o
n 6 N
ovem
ber 2
017.

Species and habitats Guidance notes – Species Fish and amphibians: Twaite shad 2.3.2
Environment Agency in partnership with Natural England and Countryside Council for Wales Understanding water for wildlife
Key references1. Aprahamian M W, Baglinier J L, Sabatie M R, Alexandrion P, Thiel R and Aprahamian C, (in press) Biology, statusand conservation of the anadromous twaite shad, Alosa fallax fallax (Lacepede). Transactions of the AmericanFisheries Society.
2. Aprahamian MW and Aprahamian C D, 2001 The influence of water temperature and low on year class strengthof twaite shad (Alosa fallax fallax) from the River Severn, England. Bulletin Francais de la Peche et de laPisciculture, 362/363.
3. Aprahamian M W, 1982 Aspects of the biology of the twaite shad, Alosa fallax fallax (Lacepede), in the RiversSevern and Wye, Liverpool, 349pp + annexes.
4. Crecco V A and Savoy T F, 1987 Review of recruitment mechanisms of the American Shad; the critical period andmatch-mismatch hypotehses re-examined. American Fisheries Society Symposium, 1, 455-468.
5. Crecco V A, Savoy T F and Whitworth W, 1986 Effect of density dependent and climatic factors in American Shad(Alosa sapidissima) recruitment, a predictive approach. Canadian Journal of Fisheries and Aquatic Sciences, 53,457-463.
6. Gerkens M and Theil, 2001 A comparison of different habitats as nursery areas for twaite shad (Alosa fallax,Lacepede) in the tidal freshwater region of the Elbe River, Germany. Bulletin Francais de la Peche et de laPisciculture 362, 773-784.
7. Gregory J and Clabburn P, 2003 Avoidance behaviour of Alosa fallax to pulsed ultrasound and its potential as atechnique for monitoring clupeid spawning migration in a shallow river. Aquatic Living Resources, 16, 2, 313-316.
8. Maitland PS and Hatton-Ellis, 2003 Ecology of the Allis and Twiate Shad. Conserving Natura 2000 Rivers EcologySeries Number 3, English Nature: Peterborough. Available: http://www.english-nature.org.uk/lifeinukrivers/species/shad.html
9. Moller H and Scholz U, 1991 Avoidance of oxygen-poor zones by fish in the Elbe River. Journal of AppliedIchthyology, 7, 176-182.
10. Taverny C, 1990 An attempt to estimate Alosa alosa and Alosa fallax juvenile mortality caused by three types ofhuman activity in the Gironde Estuary, 1985-1986. Goteborg, Sweden 31 May-3 June 1988: Pudoc, Wageningen,215-229.
11. Taverny C, 1991 Peche, biologie, ecologie des Aloses dans le Systeme Gironde-Garonne-Dordogne. PhD Thesis,University of Bordeaux.
12. UK Biodiversity Action Group, Action Plan for Alosa fallax. Retrieved on February 28, 2006 from:http://www.ukbap.org.uk/UKPlans.aspx?ID=85
Supporting referencesEstuaries and watercourses of plain to montane levels with Ranunculion fluitantis and Callitricho-Batrachionvegetation should be considered with the twaite shad.
< Section divider
This do
cumen
t was
with
drawn o
n 6 N
ovem
ber 2
017.
General informationThe Atlantic salmon (Salmo salar) is an anadromousspecies (adults migrate from the sea to freshwater forbreeding) which can reach up to 1.5 metres in lengthand can live for up to 10 years. Historically, this specieswas distributed in all countries whose rivers enter theNorth Atlantic, but its current distribution has beenrestricted by anthropogenic factors, particularly man-made barriers which impede its movement and poorwater quality. Atlantic salmon may be found in suitableriver systems unaffected by poor water quality andmigration barriers throughout Britain (Ref. 3). Althoughimprovements in water quality have allowed S. salar toreturn to rivers such as the Taff, there has been a steadydecline in British waters in recent years.
Habitat preferences• The suitability of a habitat for juvenile salmon
depends upon water depth (17-76 centimetres),water velocity (25-90cm s-1), streambed substratumcomposition and refuge availability (Ref. 3). Typically,S. salar spawn in transitional areas between poolsand riffles where the flow is accelerating and depthdecreasing as well as gravel of suitable coarseness(Ref. 3);
• Salmon fry and parr may be found in shallow, fast-flowing water with a moderately coarse substrate andcover, suitable cover for juveniles includes areas ofdeep water, surface turbulence, loose substrate,large rocks, overhanging vegetation, woody debrisand/or aquatic vegetation (Ref. 3); and
• Salmon <7cm in length require habitat in pebblyriffles without boulders; as they mature they move toa cobble/boulder habitat with greater depth,>300millimetres.
Key influencesWater resources• Upstream river migration for S. salar occurs at higher
flows and may be catalyzed by an increase in flow.Solomon et al. (1999) suggests that the thresholdflow required to induce salmon to enter a river fromthe sea varied from 101 per cent to 284 per cent ofthe Q95 (or the flow exceeded 95 per cent of the
time; Ref. 3). Spawning and nursery areas must beaccessible to adult salmon and should provideadequate depth and velocity for juveniles (Ref. 3);
• Successful incubation of ova and emergence of fry isdependent on the adequate flow of water throughgravel and previous studies have found that a level of<10 percent fines below 83 mm of water allow 50 percent fry emergence (1);
• Yearling and older parr need a depth of 20-40centimetres and velocity of 60 to 75 cm s-1;
• A previous study has also indicated that the ability ofsalmon to negotiate barriers to upstream migration isheightened when the depth of the pool below is1:1.25 (Ref. 3);
• Similar studies on juveniles have concluded that aflow of 0.03 m3 s-1 per metre of channel width areadequate (Ref. 3);
• A possible consequence of river regulation may bethat freshets may not be sufficient in magnitude orfrequency to provide adequate migrationopportunities for adult salmon (Ref. 3). Previousstudies have suggested that salmon commencedupstream migration when the flow reached a level of0.084 m3 s-1 per metre of channel width and thatpeak migration occurred at a flow of 0.2 m3 s-1 permetre width (Ref. 3);
• Salmon may be at risk of entrainment, and • Temperature changes as a result of regulation and
compensation releases may impact on salmon.
Other influences• S. salar require very good water quality, typically that
found in upland streams and spring-fed chalkstreams, they are particularly sensitive to heavymetals, sheep dip, organic chemicals and increasedacidity;
• General Quality Assessment (GQA) defines salmonidwaters as being of grade A or B;
• Salmon waters are typified by the presence of high-scoring (Biological Monitoring Working Party, BMWP)pollution-intolerant invertebrate taxa such as mayflyand stonefly nymphs;
• Changes in sea surface temperature, fish farmingand industrial fishing can exacerbate the loss orfragmentation of habitat suitable for S. salar (Ref. 3).Sea lice resulting from fish farming and parasitescan also detrimentally impact the salmon;
• Increased predation by birds/seals or exploitation by humans;
Species and habitats Guidance notes – Species Fish and amphibians: Atlantic salmon 2.3.2
Environment Agency in partnership with Natural England and Countryside Council for Wales Understanding water for wildlife
Atlantic salmon (Salmo salar)
2.3.2 Fish and amphibians
< Section divider
This do
cumen
t was
with
drawn o
n 6 N
ovem
ber 2
017.

• The management of rivers can increase reduce flowand increase siltation, decreasing the area availablefor spawning and suspended solids may choke fishor disrupt feeding behaviour; and
• Artificial barriers preventing upstream migrationrestrict the distribution and abundance of salmonpopulations.
Current and future workThe LIFE in UK Rivers project has developed anecological guide, conservation strategies andmonitoring protocols for S. salar available at:www.english-nature.org.uk/lifeinukrivers/species/salmon.html
Species and habitats Guidance notes – Species Fish and amphibians: Atlantic salmon 2.3.2
Environment Agency in partnership with Natural England and Countryside Council for Wales Understanding water for wildlife
Key references1. Anon, 2003 Guidance on managing salmon and formulating Salmon Action Plans in accordance with theHabitats Regulations on Special Area of Conservation rivers. Fisheries Technical Advisory Group guidance paper.
2. Heggenes J, 1990 Habitat utilisation and preferences in juvenile Atlantic salmon (Salmo salar) in streams.Regulated Rivers Research and Management, 5, 341-54.
3. Hendry K and Cragg-Hine K, 2003 Ecology of the Atlantic Salmon, Salmo salar, Conserving Natura 2000 RiversEcology Series Number 7. English Nature: Peterborough.
4. Hendry K and Cragg-Hine D, 1997 Restoration of riverine salmon habitats. Fisheries Technical Manual 4.Environment Agency: Bristol.
5. McLeod CR, Yeo M, Brown AE, Burn AJ, Hopkins JJ and Way SF, 2002 The Habitats Directive: selection of SpecialAreas of Conservation in the UK, second edition. Joint Nature Conservation Committee, Peterborough. Available:www.jncc.uk/SACselection
6. National Rivers Authority, 1994 Implementation of the EC freshwater fish directive: water quality requirementsfor the support of fish life. Water quality services number 20, NRA: Bristol.
7. Solomon DJ, Sambrook HT and Broad KJ, 1999 Salmon Migration and River Flow: Results of tracking radio taggedsalmon in six rivers in South west England. Research and Development Publication 4. Environment Agency: Bristol.
8. Stewart L, 1973 Environmental engineering and monitoring in relation to salmon management. InternationalAtlantic Salmon Foundation, special publications series 4, 1, 297-316.
Further informationHabitats associated with the Atlantic salmon are: Watercourses of plain to montane levels with Ranunculionfluitantis and Callitricho-Batrachion vegetation; estuaries; and the freshwater pearl mussel.
< Section divider
This do
cumen
t was
with
drawn o
n 6 N
ovem
ber 2
017.

General informationThe spined loach (Cobitis taenia) a small bottom-dwelling fish, usually less than 12 cm in length. It hasa strongly patterned laterally compressed body and its mouth is surrounded by six barely visible barbells(Ref. 9). In the UK the spined loach appears to berestricted to five east-flowing river systems in easternEngland – the Rivers Trent, Welland, Witham, Nene andGreat Ouse, with their associated waterways (Ref. 2). It is thought to be widely distributed within thesesystems, but detailed information is lacking since it is often over looked in fish surveys (Ref. 3).
Habitat preferences• Spined loach has a restricted microhabitat
associated with its specialised feeding mechanism.Using its complex branchial apparatus to filter-feed,it requires fine but well-oxygenated sediments; and;
• Optimal habitat consists of patchy submergedmacrophyte cover (and possibly emergents) which is important for spawning and a sandy, siltysubstrate into which juvenile fish tend to burythemselves (Ref. 9).
Key influencesWater resources• There is little available information on specific water
quantity or quality requirements of the spined loach.Data available are concentrated on flow velocities;
• An indirect relationship between flow regimes anddistribution may exist in response to the relationshipbetween macrophyte density and water flow (Ref. 4);
• The spined loach may favour low water velocity(Ref. 4). A study on the Great Ouse found thisspecies to select low flows (mean 15 cm/s) andavoid higher flows (mean 29cm/s) (Ref. 2); and
• In high winter flows individuals becomeconcentrated in deeper, slacker areas (Ref. 8).
Other influences• The spined loach tolerates a pH range of 5-10, with
preferred conditions at 7 (taken from HabitatGeschiktheid Index model: Kliene modderkruiper &Habitat suitability index model for spined loach –Witteveen & Bos unpubl. Data, as cited in Ref 3);
• Predation from a range of omnivorous andcarnivorous species may be a major factorinfluencing the distribution pattern of the spinedloach. Benthivorous species, in particular carp andbream are likely to constitute the largest threat.These two species can alter the sedimentcharacteristics, which has implications for the entireecology of the habitat (Ref. 3); and
• The abundance of refuges such as macrophytes maybe critical in determining the strength of recruitmentand any long term population viability (Ref. 4).
Current and future workCopp and Vilizzi (2004) examined the microhabitat useof C. taenia in the Great River Ouse basin. Their findingsindicate that water velocity and filamentous algae werethe most influential variables in determiningmicrohabitat suitability and that the preferred watervelocities decreased with age for C. taenia (Ref. 1).
Recent research by Natural England and Entec hasoutlined the occurrence of spined loach throughoutEngland and some of its sensitivity to diffuse pollution(Ref. 10).
Natural England and the Environment Agency haverecently produced the following: Genetics and ecology ofspined loach in England: implications for conversationmanagement. Science report SC000026/SR
Species and habitats Guidance notes – Species Fish and amphibians: Spined loach 2.3.2
Environment Agency in partnership with Natural England and Countryside Council for Wales Understanding water for wildlife
Spined loach (Cobitis taenia)
2.3.2 Fish and amphibians
< Section divider
This do
cumen
t was
with
drawn o
n 6 N
ovem
ber 2
017.

Species and habitats Guidance notes – Species Fish and amphibians: Spined loach 2.3.2
Environment Agency in partnership with Natural England and Countryside Council for Wales Understanding water for wildlife
Key referencesGeneral description/biology & habitat details1. Copp GH and Vilizzi, 2004 Spatial and ontogenetic variability in the microhabitat use of stream-dwelling spinedloach (Cobitis taenia) and stone loach (Barbatula barbatula). Journal of Applied Ichthyology, 20, 6, 440-451.
2. English Nature. (1997). The habitat and management requirements of spined loach Cobitis taenia. EnglishNature Report No 244. English Nature, Peterborough.
3. English Nature. (1999). Survey of selected sites and habitats for spined loach Cobitis taenia. English NatureReport No 303. English Nature, Peterborough.
4. Macronato, A, & Rasotto, M. B. (unspecified) ‘The biology of a population of spined loach, Cobitis taenia’.L. Bolletino di Zoologia, 56(1), 73-80.
5. McLeod, CR, Yeo, M, Brown, AE, Burn, AJ, Hopkins, JJ, & Way, SF (eds.) (2002). The Habitats Directive: selectionof Special Areas of Conservation in the UK. 2nd edn. Joint Nature Conservation Committee, Peterborough.www.jncc.gov.uk/SACselection
6. Nunn AD, Cowx IG and Harvey JP, 2003 Note on the ecology of spined loach in the lower River Trent, England.Fisheries Management and Ecology, 10, 117-121.
7. Perrow, M. R. & Jowitt, A. J. D. (1997). Influences on macrophytes on the structure and function of fishcommunities. Unpublished report to the Broads Authority, UK.
8. Robotham, P.W.J (1981). ‘Age, growth and reproduction of a population of spined loach Cobitis taenia (L)’.Hydrobiologia, 61, 161-167.
9. Wildlife Trust Species Action Plan for Spined Loach. Website Access: 2002http://www.wildlife(bcnp).org.uk/bedsbap/pdf/spdloach.pdf
10. Wildlife Sites at Risk from Diffuse Agricultural Pollution. English Nature Research Reports, Number 551. EnglishNature: Peterborough. Available: http://www.english-nature.org.uk/pubs/publication/PDF/551.pdf
< Section divider
This do
cumen
t was
with
drawn o
n 6 N
ovem
ber 2
017.

General informationThe bullhead (Cottus gobio) is the only freshwaterspecies of cottidae found in the UK. This small speciesis easily identified from its large head (eyes on top) anddorso-ventrally flattened tapering body modified for lifeon the bottom of flowing waters. Bullheads also lack aswim bladder, a further adaptation to its benthichabitat. The species is widely distributed in Europe,and common in England and Wales. It is absent fromIreland and only present in a small number catchmentsin Scotland. The bullhead is only considered indigenousto east and some southern English rivers.
Bullheads appear to be territorial and are consideredsedentary. Feeding primarily occurs at dusk (andpresumably dawn), with benthic invertebrates makingup the bulk of their diet (Ref. 4).
Habitat preferences• Bullheads predominantly occur in stony streams and
rivers where flows are moderate and waters areoxygen rich. These range from high altitude beds tothe chalk streams of southern England. Bullheads arealso commonly found in streams without a stonysubstrate (e.g. clay dominated catchments) andpopulations are equally sustainable in habitatswhere cover is afforded by substrate other thangravel i.e. tree roots and other in-stream material;
• Differences in population densities, sexual maturityand longevity are apparent between bullheadpopulations (Refer to Ref. 4 for further information);
• Spawning takes place from February to June. Varioushabitats are required by bullheads according to theirdifferent life stages;
• Coarse, hard substrates of clean, gravel and stonesare required for breeding. Males are territorial andencourage females to lay their sticky eggs underlarge, flat stones. Males then defend the nest andcare for the eggs until hatching;
• Shallow stony riffles are important habitat for youngfish (<1 year); and
• Sheltered areas created by natural wooded riparianmargins (woody debris, tree roots, leaf litter,macrophytes and large stones) are preferred(especially during daylight hours) by adult bullhead.
Key influencesWater resources• Water depth is not considered critical to the bullhead,
provided it is >5 cm. Bullheads present in lakes havebeen found in depths of up to 20 m (Ref. 1);
• Moderate water velocity is required with studies todate suggesting 10-40 cm/sec. These conditionsare often associated with riffles. Slack water refugesare also necessary for all life stages during high flows (Ref. 4);
• It has been suggested that bullheads are likely tosuffer under low flow conditions. Studies haveshown that where low flows have been reversed,bullhead populations have recovered (Ref. 4);
• Low flows can increase temperatures and reduceoxygen levels. This can directly affect egg survivaland indirectly affect adult males who then ‘fan’ eggswhen oxygen levels become reduced;
• Low flows may lead to the siltation of preferred stonysubstrates; and
• Bullheads are generally found in water of moderatevelocity, but may tolerate considerable flow velocitythrough utilising microhabitat refuges such as largestones and debris. Differences in velocities havebeen observed between studies (Ref. 4).
Other influences• Shade and cover are important habitat requirements
for the bullhead through the provision of protectionfrom predation;
• Vertical structures and barriers greater than 18-20 cmwill impede movement, causing populationfragmentation (Ref 4);
• Bullheads are vulnerable to a wide range ofpredators. Known predators include brown trout andsignal crayfish (Pacifastacus leniusculus);
• Signal crayfish may also compete for shelter andfood and reduce recruitment through predation ofbullhead eggs;
• Channelisation which changes natural flow regimesand sediment dynamics may remove suitablesubstrate and reduce available habitat for thebullhead. Excessive management of riparian treesand the clearance of woody debris / leaf litter duringroutine operations to maintain flood defencecapacity are also likely to affect bullhead abundance;
• Bullheads appear to be particularly sensitive totemperature. The critical thermal limits are -4.2 and27.7oC (Ref. 2);
Species and habitats Guidance notes – Species Fish and amphibians: Bullhead 2.3.2
Environment Agency in partnership with Natural England and Countryside Council for Wales Understanding water for wildlife
Bullhead (Cottus gobio)
2.3.2 Fish and amphibians
< Section divider
This do
cumen
t was
with
drawn o
n 6 N
ovem
ber 2
017.

• Little work has been undertaken on water qualityrequirements. There is no published information on the tolerance of bullheads to typical freshwaterpollutants which include nutrients and heavy metals(Ref. 4);
• Given the territorial nature and poor dispersal abilityof bullheads, they are likely to be less able torecolonise areas after a pollution incident;
• Utzinger et al (1998) found bullheads directlydownstream of sewage treatment works, although inlower densities than observed upstream. Providedoxygen saturation is high, bullhead may tolerate the
presence of nitrogen compounds (Ref. 5); and• Activities likely to increase siltation rates may affect
bullhead populations through the reduction inavailable habitat.
Current and future workThe LIFE in UK Rivers Project is developing conservationstrategies and monitoring protocols for use on riversdesignated as Special Areas of Conservation under theEuropean Union Habitats Directive. Refer to the LIFE inUK Rivers website for further information.
Species and habitats Guidance notes – Species Fish and amphibians: Bullhead 2.3.2
Environment Agency in partnership with Natural England and Countryside Council for Wales Understanding water for wildlife
Key referencesGeneral description/biology & habitat details1. Crisp, D. T. & Mann, R. H. K. (1991). Effects of impoundment on populations of bullhead, Cottus gobio L. andminnow, Phoxinus phoxinus (L.), in the basin of Cow Green Reservoir. Journal of Fish Biology, 38, 731-740.
2. Elliot, J.M. and Elliot, J.A. (1995). ‘The critical thermal limits for the bullhead, Cottus gobio, from threepopulations in north-west England’. Freshwater Biology, 33: 411-418.
3. Roussel, J.M. and Bardonnet, A. (1996). Differences in habitat use by day and night for brown trout (Salmotrutta) and sculpin (Cottus gobio) in a natural brook: multivariate and multi-scale analyses. Cybium, 20: 45-53.
4. Tomlinson, M. L. & Perrow, M. R. (2002). The Ecological Requirements of the bullhead (Cottus gobio L.) (Draft).LIFE in UK Rivers Project. http://www.english-nature.org.uk/lifeinukrivers/ecological.html
5. Utzinger, J., Roth, C. and Peter, A. (1998). Effects of environmental parameters on the distribution of bullheadCottus gobio with particular consideration of the effects of obstructions. Journal of Applied Ecology, 35: 882-892.
Supporting referencesWatercourses of plain to montane levels with Ranunculion fluitantis and Callitricho-Batachion vegetation shouldalso be considered with the bullhead.
< Section divider
This do
cumen
t was
with
drawn o
n 6 N
ovem
ber 2
017.

General informationThe great crested newt (Triturus cristatus) is the largestof all the newt species occurring in the UK. As an adult itcan reach up to 17 cm in length, although size variationis apparent between populations. The great crestednewt is dark, often black in colour, with fine white spotson its lower flanks (Ref. 13). Its skin is granular and thebelly is predominately an orange or yellow colouring,with black blotches (Ref. 12). In the spring to earlysummer period, the adult males have two jagged crestsalong the back and tail.
Distribution of this species is widespread throughoutmuch of England and Wales, although its abundance inthe south-west England, mid Wales and Scotland isdescribed as sparse. The total UK population isrelatively large and is distributed over sites that varygreatly in their ecological character (Ref. 7).
Habitat preferences• Great crested newts are mainly found in lowland
habitats;• They occupy both natural and semi-natural aquatic
habitats including marshes, reed beds, spring-fedponds, pingos, bog pools, sand dune pools and ox-bow lakes (Ref. 3);
• The newt is commonly recorded in artificially createdponds and terrestrial habitats, many of which havebeen greatly modified by human activity (Ref. 12);
• Deep open water is required for breeding withabundant macrophytes (Ref. 7);
• Scrub or woodland (deciduous and coniferous) is required by adults for foraging;
• The species appears to prefer medium sizedbreeding ponds, around 50-200m2 (Ref. 13); and
• Recent research has indicated that presence ofT. cristatus increases significantly with the densityof ponds in an area (Ref. 10).
Key influencesWater resources• Water must be present in the great crested newts
breeding water body until September to allow larvaeto emerge successfully (Ref. 1);
• Ponds that dry for short periods in late summer, or inoccasional years may provide favourable conditionsby ensuring fish do not dominant the system (Ref. 3);and
• The great crested newt tends to favour water that isrelatively deep, allowing for its size and breedinghabits (Ref. 8).
Other influences• Great crested newt larva appear to require fish free
ponds for development, as they tend to prefer openwater rather than hiding in weeds with the larva fromother newt species (Ref. 1);
• Terrestrial scrub/woodland habitat within 200 m of thebreeding pond is required by the adult population, aminimum area of 0.4 ha has been estimated (Ref. 9).Forestry activities can therefore influence the healthand status of populations (Ref .5);
• The great crested newt prefers hard waters with a pHbetween 5-6.5 and calcium concentrations between5-10 mg/l (Ref. 3);
• Fragmentation of the landscape can cause localextinction of great crested newt populations(Ref. 7); and
• Populations distributed across a dense network offarm ponds are considered more robust (Ref. 13).
Current and future workDr. Richard Griffiths of the University of Kent has beenresearching the success of T.cristatus translocation,which has increased dramatically since 1990. Hisresults have suggested that although the number ofnew ponds created compensated for the number lost,there was an overall net loss of aquatic habitat. Despitethis loss of habitat the findings indicate that breedingat most sites one-year post-development wassuccessful. Long-term results from such sites are not yetavailable.
The Great Crested Newt Conservation Handbook whichwas produced in 2001 will be updated shortly.Additionally, the Environment Agency will beimplementing a new national amphibian recordingscheme including T. cristatus among other species.
Species and habitats Guidance notes – Species Fish and amphibians: Great crested newt 2.3.2
Environment Agency in partnership with Natural England and Countryside Council for Wales Understanding water for wildlife
Great crested newt (Triturus cristatus)
2.3.2 Fish and amphibians
< Section divider
This do
cumen
t was
with
drawn o
n 6 N
ovem
ber 2
017.
Species and habitats Guidance notes – Species Fish and amphibians: Great crested newt 2.3.2
Environment Agency in partnership with Natural England and Countryside Council for Wales Understanding water for wildlife
Key referencesGeneral description/biology & habitat details1. Atkins, W. (1998), ‘‘Catch 22’ For the Great Crested Newt. Observations on the breeding ecology of the GreatCrested Newt Triturus cristatus and its implications for the conservation of the species’, British HerpetologicalSociety Bulletin, No 63.
2. Beebee, T.J.C. (1987). ‘Eutrophication of Heath land Ponds at a Site in Southern England: Causes and Effects,with Particular Reference to the Amphibia’, Biological Conservation, 42, 39-52.
3. Cooke A.S. & Frazer, J.F.D. (1976). ‘Characteristics of Newt Breeding Sites’, J.Zool, Vol 178, pp 223-236.
4. Edgar PW, Griffiths R A and Foster JP, 2005 Evaluation of translocation as a tool for mitigating developmentthreats to great crested newts (Triturus cristatus) in England, 1990-2001. Biological Conservation, 122, 45-52.
5. English Nature (1994). Facts about the great crested newts, English Nature, Peterborough.
6. Environment Agency, 2003 Development and Implementation of a Pilot Monitoring Programme for the GreatCrested Newt, Triturus cristatus. R& D Technical Summary W1-068/1/TS.
7. Hayward, R. Oldham, R. S., Watt, P.J., Head, S. M. (2000). ‘Dispersion Patterns of Young Great Crested Newts(Triturus cristatus)’. Herpetological Journal. Vol 10, 129-136.
8. Langton, T., Beckett, C. and Foster, J. (2001). Great Crested Newt Conservation Handbook, Froglife, Suffolk.
9. Latham D. M., Oldham R. S. (1996). ‘Woodland Management and the Conservation of the Great Crested Newt(Triturus Cristatus)’, Aspects of Applied Biology, 44.
10. Leuven,RS, den Hartog, C, Christiaans,MC, Hiijligers, W. (1986). ‘Effects of acidification on the distributionpatterns and the reproductive success of amphibians’, Experienta 42, 495-503.
11. McLeod, C.R., Yeo, M., Brown, A.E., Burn, A.J., Hopkins, J.J., & Way, S.F. (eds.) (2002). The Habitats Directive:selection of Special Areas of Conservation in the UK. 2nd edn. Joint Nature Conservation Committee, Peterborough.www.jncc.gov.uk/SACselection
12. Oldham, R.S., Keeble J., Swan, M., Jeffcote, M. (1994). ‘Evaluating the Sustainability of Habitat for the GreatCreated Newt (Triturus Cristatus)’. Herpetological Journal Vol 10, 143-155.
13. Oldham, R. S., Humphries, R.N. (2000). ‘Evaluation the Characteristics of Great Crested Newt (Trituruscristatus) Translocation’, Herpetological Journal, Vol 10, 183-190.
Supporting referencesAnnex I habitats to be considered with the great crested newt are; Natural eutrophic lakes with Magnopotamion orHyrdocharition-type vegetation; Mediterranean temperate ponds; North Atlantic wet heathlands with Erica tetralix;and refer to guidance notes produced for these habitats.
< Section divider
This do
cumen
t was
with
drawn o
n 6 N
ovem
ber 2
017.

2.3.3 MammalsThe following summaries are not based on an exhaustive literature review but compiled using key reference papers and websites provided byEnvironment Agency, Natural England and CCW staff. These notes areintended to provide a summary of relevant information on the hydrologicalrequirements of the listed mammals. For further information, refer to keyreferences listed in the summaries.
– Barbastelle bat (Barbastella barbastellus)
– Otter (Lutra lutra)
Species and habitats Guidance notes – Species Mammals 2.3.3
Environment Agency in partnership with Natural England and Countryside Council for Wales Understanding water for wildlife
< Section divider
This do
cumen
t was
with
drawn o
n 6 N
ovem
ber 2
017.

General informationThe barbastelle (Barbastella barbastellus) is a medium-sized bat that is easily identified by its distinctivefeatures, which make it unlike any other bat in Europe.The fur is almost black, usually with very pale or goldenbrown tips. The ears are very broad with the inner edgesjoined together across the forehead (Ref. 2).
The barbastelle is one of the UK’s rarest mammals withfew maternity roost sites known. It is widely distributedacross southern England and Wales but may besignificantly under-recorded within its range (Ref. 2).
Habitat preferences• The ecology of the barbastelle is poorly-known. In
Europe, it is believed to be an upland and forestspecies while in the UK it seems to prefer woodedriver valleys (Ref. 2);
• Most UK records come from caves or abandonedmines, which are important hibernation sites;
• Barbastelles forage in mixed habitats, usually overwater (Ref. 2). They feed mainly on Lepidoptera takenin flight, but may also glean insects and spiders fromvegetation (Ref. 4);
• Barbastelles appear to select cracks and crevices inwood for breeding, mostly in old or damaged trees.Cracks and crevices in the timbers of old buildingsmay also be used (Ref. 2);
• Maternity colonies may move between suitablecrevices within a small area, such as a piece ofwoodland or a complex of buildings (Ref. 2); and
• In spring and autumn, barbastelles are frequentlyfound behind the loose bark of trees (Ref. 1).
Key influencesWater resources• There is little published material directly associated
with water resource requirements of the barbastelle,however flightlines of foraging bats frequently followsmall rivers or streams, particularly in spring (Ref. 1);and
• Maintenance of open water within woodlands hasbeen suggested to help preserve barbastelle habitat(Ref. 1).
Other influences• Threats to the barbastelle are poorly understood, but
its low population density and slow populationgrowth make it particularly vulnerable to habitat loss.Fragmentation of ancient deciduous woodlandhabitat, and the loss, destruction and disturbance ofroosts or potential roosts in buildings, trees andunderground sites may pose significant threats to thestatus of this species;
• Reduction in the bats food source (Lepidoptera andother insects) due to habitat simplification,instigated by fertiliser use and intensive grazing willimpact on populations (Ref. 4);
• The microclimate of the area surrounding roost sitesand within these sites is important to ensure warmthfor rapid development of juveniles and reduce therisk of mortality (Ref. 1); and
• The species is very sensitive to disturbance.
Current and future workThe barbastelle is the subject of a Species RecoveryProgramme (Phase 1 project funded by English Nature)and is included in the DETR (now Defra) sponsoredNational Bat Monitoring Programme which aims toestablish baseline data and propose long-termmonitoring protocol (Ref. 4).
Research is currently being carried out in Norfolk,Surrey, Devon, Hampshire and the Isle of Wight tolocate roosts and identify habitat requirements ofthe barbastelle bat (Ref. 3).
A study by Wickramasinghe et al. (2003 Ref. 5) foundthat bat activity and foraging was significantly higher onorganic than conventional farms, potentially as a resultof unfragmented habitat and higher densities of insects.
Parsons et al. (2003) have recently completed a surveyof swarming sites for B. barbastellus and theirimportance (Ref. 3).
Species and habitats Guidance notes – Species Mammals: Barbastelle bat 2.3.3
Environment Agency in partnership with Natural England and Countryside Council for Wales Understanding water for wildlife
Barbastelle bat (Barbastella barbastellus)
2.3.3 Mammals
< Section divider
This do
cumen
t was
with
drawn o
n 6 N
ovem
ber 2
017.

Species and habitats Guidance notes – Species Mammals: Barbastelle bat 2.3.3
Environment Agency in partnership with Natural England and Countryside Council for Wales Understanding water for wildlife
Key referencesGeneral description/biology & habitat details1. Greenaway, F. (2001). The Barbastelle in Britain. British Wildlife, 12: 327-34.
2. McLeod, C.R., Yeo, M., Brown, A.E., Burn, A.J., Hopkins, J.J., & Way, S.F. (eds.) (2002). The Habitats Directive:selection of Special Areas of Conservation in the UK. 2nd edn. Joint Nature Conservation Committee, Peterborough.www.jncc.gov.uk/SACselection
3. Parsons KN, Jones G, Davidson-Watts I and Greenaway F, 2003 Swarming of bats at underground sites in Britain– implications for conservation. Biological Conservation, 111, 63-70.
4. UK Biodiversity Group. (1998). Species Action Plan: Barbastelle Bat (Barbastella barbastellus). UK BiodiversityGroup Tranche 2 Action Plans – Volume I: Vertebrates and vascular plants. HMSO, London.
5.Wickramasinghe LP, Harris S, Jones G and Vaughan N, 2003 Bat activity and species richness on organic andconventional farms: impact of agricultural intensification. Journal of Applied Ecology, 40, 984-993.
Supporting referencesThe Annex I habitat alluvial forests should be considered with the barbastelle.
< Section divider
This do
cumen
t was
with
drawn o
n 6 N
ovem
ber 2
017.

General informationThe Eurasian otter (Lutra lutra) is a brown furred semi-aquatic mammal with a long and sleek body withpartially webbed paws and a strong tapering rudder-liketail for swimming. An adult male may be up to 4 feetlong including the tail, with females typically beingsmaller.
The otter population of the British Isles declined rapidlyfrom the mid 1950s until at least the mid 1970s. A slowbut gradual recovery of the species is now beingobserved.
Habitat preferences• Otter populations occur in a wide range of ecological
conditions, including inland freshwater and coastalareas. In Scotland, otters are widespread in coastalhabitats as well as on inland lakes and rivers,whereas in England and Wales the tendency to utilisecoasts is less marked but may be increasing asrecovery continues;
• Inland otter populations utilise a range of runningand standing freshwaters. Vegetated river banks,islands, reedbeds and wetlands, adjacent ponds andwoodland provide suitable habitat for foraging,breeding and resting (Ref. 3); however, otters maymake use of almost all types of watercourse andwetland habitat for foraging or moving betweenforaging areas;
• Populations in coastal areas utilise shallow, inshoreareas for feeding but require freshwater for bathing.Terrestrial areas are also required for resting andbreeding holts. Coastal otter habitat ranges fromsheltered wooded inlets to more open, low-lyingcoasts; and
• Holts are commonly located in places where the riskof direct physical disturbance is low (e.g. reeds,dense scrub, culverts, piles of rocks). However, theavailability of these sites does not limit the otterpopulation, although few breeding holt sites areknown in the UK and it is possible that these may belimiting in certain areas.
Key influencesWater resources• No specific water requirements are noted for otter
populations, but indirect impacts on habitat andfood supply alteration (linked to water quantitychanges) should be considered; and
• The primary impact of flow changes to otters will bethe loss of freshwater sites and the reduction inavailable fish, crayfish and amphibian food sourcepopulations. These impacts may occur due to poorsurvival or reduced total biomass of prey as a resultof the impacts of reduced flows or levels on habitatavailability, or poor recruitment due to the flow andlevel impacts on egg/fry/larval stages. Impacts mayneed to be on a medium to large scale to significantlyaffect otters, although the loss of an important localfood source such as e.g. an amphibian populationthrough pond/wetland drying could be significant forindividual otter territories. It should be borne inmind that otters live at very low densities comparedto most UK carnivores.
Other influences• Obstructions and barriers and culverts which
concentrate flows and increase velocities inwatercourses may force otters to leave the waterside, particularly in flood events increasing the risk of road deaths;
• Otter use of freshwater habitats is associated withthe abundance of prey (Ref. 6). Fish dominate otterdiet in freshwater environments, but crayfish andamphibia (mostly frogs) may also contribute asubstantial proportion; therefore quality and extentof habitat will ultimately affect food supply andtherefore the carrying capacity for otters;
• Loss of trees and shrubs along river margins mayreduce invertebrate prey and shading, havingimplications for fish populations and subsequentlyotters utilising the area, and may also reduceavailable cover for otters, both of which may reducethe suitability of habitat at a local scale for otters;
• Organic pollution may indirectly affect and limitotter populations through reductions in food supply(Ref. 4);
• Direct spillage of oil and other contaminants incoastal areas may result in direct otter deaths.Bioaccumulation of heavy metals, pesticides andPCBs (Ref. 4) may also have detrimental effects to
Species and habitats Guidance notes – Species Mammals: Otter 2.3.3
Environment Agency in partnership with Natural England and Countryside Council for Wales Understanding water for wildlife
Otter (Lutra lutra)
2.3.3 Mammals
< Section divider
This do
cumen
t was
with
drawn o
n 6 N
ovem
ber 2
017.

otter populations over time, although otters are now recovering as a result of the removal fromgeneral use of certain organochlorine pesticideswhich were the main cause of their original rapiddecline in the UK; and
• Mason and Macdonald (1989) found that otters werenot resident in Welsh streams where the pH fellbelow 5.5 although this may have been due to thelack of suitable food sources rather than a sensitivityto acidified waters (Ref. 2 & 5).
Current and future workThe LIFE in UK Rivers Project developed conservationstrategies and monitoring protocols for use on riversdesignated as Special Areas of Conservation under theEuropean Union Habitats Directive. Refer to the LIFE inUK Rivers website for further information (Ref. 2).
Other research underway includes investigations intoDNA fingerprinting of otter spraints (faeces), nationaldistribution surveys and research into road-deathmitigation techniques.
Species and habitats Guidance notes – Species Mammals: Otter 2.3.3
Environment Agency in partnership with Natural England and Countryside Council for Wales Understanding water for wildlife
Key referencesGeneral description/biology & habitat details1. Amblonyx Otter Fact Sheets. Accessed October 2002. http://www.amblonyx.com/otter/lutra/otter_char.htm
2.Chanin P, 2003 Ecology of the European Otter. Conserving Natura 2000 Rivers, Ecology Series Number 10.English Nature: Peterborough. Available: http://www.english-nature.org.uk/lifeinukrivers/species/otter.html
3. Durbin, L. S. (1998). Habitat selection of five otters Lutra lutra in rivers of northern Scotland. Journal Zool.London, 245(1), 85-92.
4. Mason, C. F (1989). Water Pollution and otter distribution: a review. Lutra, 32 (2), 97-131.
5. Mason CF and Macdonald SM, 1989 Acidification and otter (Lutra lutra) distribution in Scotland. Water Air andSoil Pollution, 43, 3, 365-374.
6. McLeod, CR, Yeo, M, Brown, AE, Burn, AJ, Hopkins, JJ, & Way, SF (eds.) (2002). The Habitats Directive: selection ofSpecial Areas of Conservation in the UK. 2nd edn. Joint Nature Conservation Committee, Peterborough.www.jncc.gov.uk/SACselection
Supporting referencesThe Annex I habitat alluvial forests should be considered with otters.
< Section divider
This do
cumen
t was
with
drawn o
n 6 N
ovem
ber 2
017.

2.3.4 PlantsThe following accounts are intended to provide a summary of relevantinformation on the freshwater requirements of the plants. With many of thespecies there is little published material directly associated with waterresource requirements, and as such these notes should be treated with thenecessary precautions. For further information, refer to key references listedin each species account.
– Slender green-feather moss (Drepanocladus vernicosus)
– Petalwort (Petalophyllum ralfsii)
– Marsh saxifrage (Saxifraga hirculus)
– Creeping marshwort (Apium repens)
– Floating water plantain (Luronium natans)
– Fen orchid (Liparis loeselii)
– Shore dock (Rumex rupestris)
Species and habitats Guidance notes – Species Plants 2.3.4
Environment Agency in partnership with Natural England and Countryside Council for Wales Understanding water for wildlife
< Section divider
This do
cumen
t was
with
drawn o
n 6 N
ovem
ber 2
017.

General informationSlender green-feathe rmoss (Drepanocladusvernicosus) is a medium-sized moss of mildly base-richflushes and springs in the uplands and more rarely,lowland sedge fens. Slender green-feather moss andrelated genera are taxonomically difficult, with thegroup being recently revised. The slender green-feathermoss is referred to in most current literature asHamatocaulis vernicosus (Mitt.) Hedenäs. It has beenconfused with the related Scorpidium cossonii(Drepanocladus cossonii), but its distribution has beenclarified by examination of herbarium specimens andrecent survey work (Ref. 3).
Factors pertaining to the decline of this species includethe destruction of habitat, the lowering of the localwater table at lowland sites, and heavy grazing offlushes by sheep and deer in upland sites (Ref. 3).
Habitat preferences• The slender green-feather moss has been identified
in very wet, unshaded, mesotrophic mires, withmoderate (but not high) concentrations of calcium inboth water inputs and soil (Ref. 2);
• It occurs predominately in base-rich flushes andsprings (Ref. 3);
• The species may grow with small sedges (Carex spp.),black bog-rush (Schoenus nigricans) and othercharacteristic mosses of base-rich flushes and fens,such as Campylium stellatum and rarely if ever growswith Scorpidium scorpioides (a strong basophile) orLeiocolea bantriensis. It is often in neutralassociations with bryophytes that includeCalliergonella cuspidatum, Philonotis fontana,Campylium stellatum and Dicranella palustris ; and
• It is more frequently found in uplands but does notreach very high altitudes, with the highest record at450 m on Snowdon (Ref. 3).
Key influencesWater resources• Limited information is available on the specific water
quantity and flow regime requirements for theslender green-feather moss;
• The slender green-feather moss are generally onlyfound in localities which are wet all year and includespring heads and large flushes (Ref. 2);. However,several of the Pembrokeshire sites are only wet inwinter and could only really be described as damp inthe summer (Ref. 8);
• The species is commonly in rushy but open flusheswhere water movement is minimal. Water movementis required nearby to provide calcium input; and
• A strong relationship between water quantity/flowregimes and the distribution of the moss is likely(Ref. 2) but more research is required before anyconclusions can be drawn on the relationshipbetween flow regime, water quantity requirementsand the ecological status of this moss.
Other influences• The eutrophication of spring waters feeding the
slender green-feather moss habitat will have anadverse effect on the plant and may result in localextinction in some instances (Ref. 3);
• The moss is likely to have a low pH variationtolerance with the species favouring the morecalcareous environments (Ref. 2);
• Unshaded areas that are grazed to preventvegetation encroachment are preferred but over-grazing can destroy populations (Ref. 2); and
• Atmospheric pollution as well as forest creation is alsothought to have contributed to its decline (Ref. 4).
Current and future workAs part of Scottish Natural Heritage’s (SNH) lower plantconservation project, The Edinburgh Royal BotanicalGardens is assessing the taxonomic status of theslender green-feather moss using available herbariumsamples (Ref. 1).
Species and habitats Guidance notes – Species Plants: Slender green-feather moss 2.3.4
Environment Agency in partnership with Natural England and Countryside Council for Wales Understanding water for wildlife
Slender green-feather moss(Drepanocladus vernicosus)
2.3.4 Plants
< Section divider
This do
cumen
t was
with
drawn o
n 6 N
ovem
ber 2
017.

Species and habitats Guidance notes – Species Plants: Slender green-feather moss 2.3.4
Environment Agency in partnership with Natural England and Countryside Council for Wales Understanding water for wildlife
Key referencesGeneral description/biology & habitat details1.HMSO (1999). UK Biodiversity Group Tranche 2 Action Plans – Volume VI: Terrestrial and freshwater species andhabitats. HMSO, Tranche: 2 Volume: VI.
2. Holyoak, D. T. (1999). Status, ecology and conservation of the moss Hamatocaulis vernicosus in England andWales. Report to CCW and EN on work carried out under EN contract no. FIN/CON/VT9918. Confidential,unpublished, EN.
3. McLeod, CR, Yeo, M, Brown, AE, Burn, AJ, Hopkins, JJ, & Way, SF (eds.) (2002). The Habitats Directive: selectionof Special Areas of Conservation in the UK. 2nd edn. Joint Nature Conservation Committee, Peterborough.www.jncc.gov.uk/SACselection
References pertaining to the management of terrestrial habitat4. ARKive, Slender green feather moss (Hamtocaulis vernicosus), Retrieved March 2 2006 fromhttp://www.arkive.org/species/ARK/plants_and_algae/Hamatocaulis_vernicosus/more_info.html
5. Blockeel, T.L (1997). A Revision of British specimens of Drepanocladus vernicosus. Joint Nature ConservationCommittee, Peterborough.
6. Hedenas , L. (1989). ‘The genera Scorpidium and Hamatocaulis, gen. nov, in northern Europe’, Lindbergiia, 15,8-36.
7. Male, A. (2002). Drepanocladus vernicosus, Web Access: 2002http://home.clara.net/adhale/bryos/hvernic.htm
8. Motley, Graham & Bosanquet, Sam. County Country Side for Wales 2003.
Supporting referencesAnnex I habitats to be considered with the slender green-feather moss are: calcareous fens with Cladium mariscusand species of the Caricion davallianae, petrifying springs with tufa formation (Cratoneurion) and alkaline fens.
< Section divider
This do
cumen
t was
with
drawn o
n 6 N
ovem
ber 2
017.
General informationPetalwort (Petalophyllum ralfsii) is a pale green thalloidliverwort with erect lamellae on its upper surface. Thespecies is dioecious but commonly produces capsules,which mature from March to May (Ref. 5). It is commonlyassociated with the Annex I humid dune slacks habitat,but has occasionally been recorded in other coastalgrasslands with similar conditions (Ref. 4).
The petalwort appears to be increasing at a number ofsites as a result of trampling and soil compaction. AtEnglish and Welsh sites the thalli appear above groundfrom autumn to spring, and perennate through thesummer as underground tubers packed with lipid.Some thalli may be visible on the surface during wetweather in summer (Ref. 2). At the one Scottish site,where there is a continual flow of fresh water throughthe population, the petalwort remain throughout thesummer, as well as winter, months.
Habitat preferences• The liverwort grows in open, damp, calcareous dune
slacks, often on low hummocks rather than on thevery wet ground, and on compacted sandy/muddybryophyte-rich turf;
• The species typically occurs in very short (<0.5cm)vegetation, typically with 10-50% bare substrateexposed (Ref. 5);
• The petalwort requires low nutrient status waters;and
• An association with sand dunes, in particular duneslacks has been noted, but the species has also beenrecorded near pond edges, along damp pathwaysamong dunes, in small hollows among dunes, andon former industrial sites adjoining dunes (Ref. 5).
Key InfluencesWater resources• The petalwort is strongly characterised by
hydrological regimes, however little research dataexist on this relationship;
• A fluctuating water table, with periodic flooding isconsidered optimal for petalwort habitats.Fertilisation requires transport of spermatozoids inwater. Sites that are periodically flooded may assistin this transport (Ref. 5);
• A seasonally high water table is consideredimportant (Ref. 5), however the petalwort cantolerate seasonal drought;
• The nutrient concentration of the water supply couldbe affected by the amount of water entering the site(dilution effect); and
• Drainage of sites will remove this species from thehabitat composition.
Other influences• Eutrophication of water supplies may result in this
species being out-competed;• The petalwort will only tolerate minimal shading in
the UK;• Maintenance of low vegetation by low nutrient
loading, and intense grazing by rabbits is consideredimportant;
• Light trampling on pathways may play a part inmaintaining suitable conditions at some sites(Ref. 5); and
• The species is not found in permanently water-filledslacks or in slacks where willow (Salix spp.) scrubpredominates (Ref. 6).
Current and future workScottish Natural Heritage (SNH) as part of their lowerplant conservation project has recently surveyed theonly Scottish site where the petalwort is found. TheCountryside Council for Wales (CCW) have surveyed allthe Welsh populations in recent years, and monitoringis taking place at some sites (Ref. 8).
In the absence of relevant information on thehydrological regime requirements of the petalwort,there is a strong need to pursue research in this area.
Species and habitats Guidance notes – Species Plants: Petalwort 2.3.4
Environment Agency in partnership with Natural England and Countryside Council for Wales Understanding water for wildlife
Petalwort (Petalophyllum ralfsii)
2.3.4 Plants
< Section divider
This do
cumen
t was
with
drawn o
n 6 N
ovem
ber 2
017.

Species and habitats Guidance notes – Species Plants: Petalwort 2.3.4
Environment Agency in partnership with Natural England and Countryside Council for Wales Understanding water for wildlife
Key referencesGeneral description/biology & habitat details1. Davy A.J, Grootjans A.P, Hiscock K, Petersen J. 2006 English Nature. Development of eco-hydrological guidelinesfor dune habitats-phase 1. Report Number 696. Available: http://www.english-nature.org.uk/pubs/publication/PDF/696.pdf
2. HMSO (1999).UK Biodiversity Group Tranche 2 Action Plans – Volume VI: Terrestrial and freshwater species andhabitats,HMSO, Tranche: 2 Volume: VI, pg 205.
3. Joint Nature Conservation Committee. Lower Plant Species1395 Petalwort Petalophyllum ralfsii Available:http://www.jncc.gov.uk/protectedsites/sacselection/species.asp?FeatureIntCode=S1395 Accessed 28th Feb 2006.
4. McLeod, CR, Yeo, M, Brown, AE, Burn, AJ, Hopkins, JJ, & Way, SF (eds.) (2002). The Habitats Directive: selectionof Special Areas of Conservation in the UK. 2nd edn. Joint Nature Conservation Committee, Peterborough.www.jncc.gov.uk/SACselection
5. Plantlife (2001). Species Action Plans for Plants Petalwort, Plantlife, English Nature.
6. Smith, A.J.E (1990). The Liverworts of Britain and Ireland Cambridge, Cambridge University Press.
7. Stewart, N (ed) (1995). Red Data Book of European Bryophytes. Part 1: Introductory section and background.European Committee for the Conservation of Bryophytes.
8. UK Biodiversity Action Plan. Action plan for Petalwort (Petalophyllum ralfsii).
Available: http://www.ukbap.org.uk/UKPlans.aspx?ID=509 Accessed 28th Feb 2007.
Supporting referencesReferences pertaining to the management of terrestrial habitat9. Breeds, J. & Rogers, D. (1998). Dune management without grazing: a cautionary tale. Enact Managing Land forWildlife, 6: pp 18-22.
10. Sim-Sim, M., Jones, M. P. & Sérgio, C. (1998). ‘Petalaophyllum ralfsii (Wils) Nees & Gott., A threatened liverwortpresent in Portugal. Morphological and ecological data, directions for future conservation’. Abstracts for the 3rdEuropean Conference on the Conservation of Bryophytes, The Scientific Basis for Conservation.
The Annex I humid dune slack habitat should be considered with the petalwort.
< Section divider
This do
cumen
t was
with
drawn o
n 6 N
ovem
ber 2
017.
General informationThe rare marsh saxifrage (Saxifraga hirculus) is anattractive, yellow-flowered perennial requiring base-richsoils and wet conditions. It occurs in base-rich flushesand mires in the northern Pennines, the Grampians,Pentlands and the Antrim Mountains of NorthernIreland (Ref. 4).
The marsh saxifrage has suffered from overgrazing anddrainage, with distribution on the decline in both theUK and Europe (Ref. 3).
Habitat preferences• The marsh saxifrage occurs in base-rich flushes;• The species is now considered an upland species
with all favoured lowland habitats lost;• Large numbers of the species and a high proportion
of the larger plants can be associated with themesotrophic zones of sites which it inhabits (Ref. 3);and
• Wet conditions are required.
Key influencesWater resources• Little is known about the hydrology and chemistry of
flushes where the marsh saxifrage is found. Thehydrology of most flushes is complex and furtherresearch is required to assist in determining thehydrologic requirements of the marsh saxifrage(Ref. 4).
Other influences• Although moderate levels of grazing may be
considered beneficial to the marsh saxifrage, heavygrazing and climatic change are considered threatsto the distribution and abundance of the plant; and
• Water quality may impact on the health and status ofthe marsh saxifrage. Kelly & Hallman (2002)collected water samples (from flowing waters) fromflushes with the marsh saxifrage present and foundthem to be alkaline, have a pH of 7.0 to 8.6, andcontain no significant nitrate or phosphorousconcentrations. The calcium content of all watersamples was in excess of 20mg/l, but generallybetween 20 and 40mg/l. Values varied from flush toflush, with some samples recording concentrationsover 110mg/l. These high values may be associatedwith tufa formation. It is important to note thatintermediate springs and seepages some distancedown a flush can differ in chemical composition fromthe principle source (or sources) at the head of theflush (Ref. 3).
Current and future workA three year study was completed by Kelly and Hallam(2002) on behalf of Natural England looking at theimpacts of grazing on the marsh saxifrage.
As a precautionary measure seeds have been collectedand stored in the Millennium Seed Bank by the RoyalBotanical Gardens, Kew and may be propagated and re-introduced in the wild (Ref. 1).
Species and habitats Guidance notes – Species Plants: Marsh saxifrage 2.3.4
Environment Agency in partnership with Natural England and Countryside Council for Wales Understanding water for wildlife
Marsh saxifrage (Saxifraga hirculus)
2.3.4 Plants
< Section divider
This do
cumen
t was
with
drawn o
n 6 N
ovem
ber 2
017.

Species and habitats Guidance notes – Species Plants: Marsh saxifrage 2.3.4
Environment Agency in partnership with Natural England and Countryside Council for Wales Understanding water for wildlife
Key referencesGeneral description/biology & habitat details1. ARKive, Yellow Marsh Saxifrage (Saxifraga hirculus), Retrieved March 9, 2006, Available:http://www.arkive.org/species/ARK/plants_and_algae/Saxifraga_hirculus/more_info.html
2. HMSO (1995). Biodiversity: The UK Steering Group Report, Volume 2: Action Plans, pg. 194.
3. Kelly, P and Hallam, C (2002). Marsh Saxifrage monitoring project – Final Report, English Nature, unpublished report.
4. McLeod, CR, Yeo, M, Brown, AE, Burn, AJ, Hopkins, JJ, & Way, SF (eds.) (2002). The Habitats Directive: selectionof Special Areas of Conservation in the UK. 2nd edn. Joint Nature Conservation Committee, Peterborough.www.jncc.gov.uk/SACselection
Supporting referencesReferences pertaining to the management of terrestrial habitat5. Flemming, L..V. & Sydes, C. (1997). Genetics and rare plants: guidelines for recovery. Unpublished.
6. Olesen, J. M. & Warncke, E. (1990). ‘Morphological, phonological and biochemical differentiation in relation togene flow in a population of Saxifraga hirculus’. Sommerfeltia 11:159-173. Oslo. ISBN 82-7420-009-8.
Other Annex I habitats to be considered with the marsh saxifrage are alkaline fens, calcium-rich springwater-fedfens, calcareous fens with Cladium mariscus and species of the Caricion davallianae and also petrifying springswith tufa formation (Cratoneurion.)
< Section divider
This do
cumen
t was
with
drawn o
n 6 N
ovem
ber 2
017.

General informationThe creeping marshwort (Apium repens) is a creepingperennial, forming rosettes of once-pinnate leaves. Itclosely resembles certain varieties of the related fool’swater-cress (Apium nodiflorum), which has led to someconfusion over its true status (Ref. 1 & 6).
Distribution of the creeping marshwort in Great Britain islimited and until recently was believed to be restricted toone meadow in Oxfordshire (Port Meadow), where apopulation of 100 plants has been estimated. Thespecies has now reappeared at a nearby site, BinseyGreen, following the reintroduction of grazing (Ref. 9).The species also appeared on the WalthamstowMarshes SSSI in 2001 and is likely to have originatedfrom buried seed following ditch clearance.
Habitat preferences• The creeping marshwort grows in wet grassland
subject to winter flooding, typically by rivers;• The species grows in open, wet, usually base-rich
(lime-river alluvium) permanent pasture (Ref. 2); and• In the UK, the creeping marshwort is confined to the
MG13 NVC community type (Ref. 5).
Key influencesWater resources• The specific hydrological requirements of the creeping
marshwort is considered to be a principle parameterresponsible for the decline in the UK (Ref. 7);
• The creeping marshwort is dependent on a shallowflood during winter and spring (found on river floodplains), followed by retreat of the surface water (Ref. 7);
• The species is also found adjacent to still water (aswell as flowing waters) with a fluctuating watertable,which is believed to protect the covered plants fromsevere frost (Ref. 3);
• Groundwater levels must remain close to the surfaceduring summer months, but the soil conditions arestill described as dry (Ref. 5 & 7); and
• Summer flooding has a negative influence on thecreeping marshwort, reducing growth rates anddetaching the plant from the soil (Ref. 3). Summerfloodwaters if accompanied by pollution may alsoreduce dissolved oxygen levels leading to bacterialconversion of sulphate to poisonous hydrogensulphide (Ref. 2).
Other influences• The creeping marshwort can flourish on highly
organic, silty or sandy soils (Ref. 5);• The species is known to favour habitats with some
bare mud and where water has lain during winter,allowing colonisation by seedlings and runners.Poaching of the ground by cattle is thereforedesirable (Ref. 2);
• The creeping marshwort is usually found in short(0-10cm) cattle grazed swards (Ref. 2); and
• Agricultural intensification, herbicides, the control ofwinter flooding, and overgrazing, ploughing areconsidered the principle activities causing the declineand/or loss of the creeping marshwort (Ref. 9 &7).
Current and future workEnglish Nature, in conjunction with the Rare PlantsGroup of the Ashmolean Natural History Society ofOxfordshire commenced a recovery programme for thecreeping marshwort in 1995. This programme hasinvolved experimental introductions of the creepingmarshwort at various sites, monitoring, and researchinto gene flow, reproductive biology and seed viabilityand longevity (Ref. 8).
Species and habitats Guidance notes – Species Plants: Creeping marshwort 2.3.4
Environment Agency in partnership with Natural England and Countryside Council for Wales Understanding water for wildlife
Creeping marshwort (Apium repens)
2.3.4 Plants
< Section divider
This do
cumen
t was
with
drawn o
n 6 N
ovem
ber 2
017.

Species and habitats Guidance notes – Species Plants: Creeping marshwort 2.3.4
Environment Agency in partnership with Natural England and Countryside Council for Wales Understanding water for wildlife
Key referencesGeneral description/biology & habitat details1.Grassly, N.C, Harris, A. & Cronk, Q.C.B (1996). ‘British Apium repens (Jacq) Lag. (Apiaceae) status assessed usingrandom amplified polymorphic DNA (RAPD)’. Watsonia, 21:103-111.
2. Lambrick, C.R. (2001). Creeping marshwort, Apium repens, Habitat Requirements, Rare Plants Group,Ashmolean Natural History Society of Oxfordshire (unpublished).
3. Lambrick, C. (2000). Creeping marshwort, Apium repens, Species Recovery Action Summary of 1995-2000,Ashmolean Natural History Society of Oxfordshire Rare Plants Group (unpublished).
4.McDonald A.W. and Lambrick C.R. (2006) Apium Repens Creeping Marshwort. Species Recovery Programme1995-2005. Available: http://www.english-nature.org.uk/pubs/publication/PDF/706pt1.pdf
5. McDonald, A.W, Lambrick, C.R & Warden, K.J (1997). Creeping Marshwort, Apium repens in Holland andBelgium, English Nature.
6. McLeod, C.R., Yeo, M, Brown, A.E., Burn, A.J., Hopkins, J.J., & Way, S.F. (eds.) (2002). The Habitats Directive:selection of Special Areas of Conservation in the UK. 2nd edn. Joint Nature Conservation Committee, Peterborough.www.jncc.gov.uk/SACselection
7. Sykora, K. & Westhoff, V. (1985). ‘Synecology and syntaxonomy of Apium repens (Jacq) Lag, and Scirpuscariciformis Vest., in particular in the eastern part of Zeeuws-Vlaanderen (Province of Zeeland, the Netherlands)’,Sonderdruck aus Tuexenia, Neue Serie Band, Nr 5, Göttingen.
8. The Ashmolean Natural History Society of Oxfordshire. The Rare Plants Group Available:http://www.oxfordrareplants.org.uk/
9. UK Biodiversity Steering Group, Biodiversity: The UK Steering Group Report – Volume II: Action Plans, HMSOLondon.
< Section divider
This do
cumen
t was
with
drawn o
n 6 N
ovem
ber 2
017.

General informationFloating water-plantain (Luronium natans Rafinesque)is an aquatic monocotyledon of the familyAlismataceae. It is endemic to Europe and has a fairlycomplex life history and ecology, and is difficult toidentify. Native populations in the UK have beenrecorded in Glamorgan, Worcestershire andNorthamptonshire north to Anglesey, Argyll and CountyDurham. Introduced populations are also noted.
It has two characteristic forms of leaf – a submergedgrass-like form and a floating spoon-shape form –determined by light availability and water-depth.Detailed published information on the life history offloating water-plantain is limited.
Habitat preferences• Floating water-plantain occur in a range of different
environments including natural standing waters,natural flowing waters and artificial waterbodiessuch as canals, ditches, reservoirs and balancingponds;
• A wide range of chemical and substrate tolerancesare noted. Floating water-plantain has beenassociated with sand, sand with gravel, boulder clayand or silt. It is mainly restricted to substrates of ahigh mineral composition and disappears under anaccumulation of organic detritus i.e. underhydroseral transition to swamp;
• Floating water-plantain occurs in waters with a pHranging from 3.6-7.4. The solid geology may vary frommildly acid to base-rich (Ref. 3);
• Records have observed floating water-plantain toinhabit oligotrophic, mesotrophic and meso-oligotrophic waters; and
• Accounts of habitat requirements for this species areoccasionally conflicting but are well described in Ref. 8.
Key influencesWater resources• Ref. 4 recorded floating water-plantain within a
preferred water depth of 0.1 to 1.0 m, but it occurs atdepths of up to 4 m in clear water and can be found,ephemerally, as a terrestrial form on damp mud ;
• Populations in natural habitats appear to be greatestwhen water levels are low and much bare mud isexposed. When water levels are high, many plantsmay be present as rosettes (Ref. 6);
• Water quantity requirements should be assessed onhow they may suppress the colonisation of floatingwater-plantain habitat by more aggressive plantspecies;
• Floating water-plantain grows in depths of 2 m orgreater where there is no seasonal depth variation;
• Floating water-plantain populations can occupytemporary water bodies. The drying out of thesubstrate may suppress colonisation by otheraggressive species; and
• Flow changes, drainage of water bodies fordevelopment and conversion to agricultural land mayresult in direct habitat loss.
Other influences• pH tolerance ranges from 3.6 to 8.0, levels; outside
this range may impact on populations;• Floating water-plantain is believed to be largely
intolerant of competition, and fast-growingmacrophytes such as duckweed (Lemna spp.),common reed (Phragmites) and invasive aliens likeNew Zealand pygmy weed Crassula helmsii, are likelyto limit distribution and abundance;
• A lack of light at depth and poor nutrient status arelimiting factors for populations in deeper waters; and
• Eutrophication will reduce floating water-plantainpopulations through increased competition by moreaggressive species.
Current and future workThe LIFE in UK Rivers Project is developing conservationstrategies and monitoring protocols for use on riversdesignated as Special Areas of Conservation under theEuropean Union Habitats Directive. Refer to the LIFE inUK Rivers website for further information.
Natural England and The Countryside Council Wales arecurrently producing management guidelines for canalscontaining this plant (Ref. 7).
Species and habitats Guidance notes – Species Plants: Floating water-plantain 2.3.4
Environment Agency in partnership with Natural England and Countryside Council for Wales Understanding water for wildlife
Floating water-plantain (Luronium natans)
2.3.4 Plants
< Section divider
This do
cumen
t was
with
drawn o
n 6 N
ovem
ber 2
017.

Species and habitats Guidance notes – Species Plants: Floating water-plantain 2.3.4
Environment Agency in partnership with Natural England and Countryside Council for Wales Understanding water for wildlife
Key referencesGeneral description/biology & habitat details1. ARKive, Luronium natans, Floating Water-plantain. Retrieved March 6, 2006, fromhttp://www.arkive.org/species/ARK/plants_and_algae/Luronium_natans/more_info.html
2. Greulich S, Bornette G, Amoros C and Roelofs JGM, 2000 Investigation on the fundamental niche of a rarespecies:an experiment on establishment of Luronium natans. Aquatic Botany, 66, 3, 209-224.
3. Landsdown, R. V. & Wades, P. M. (2002). Ecological requirements of the floating water plantain (Luroniumnatans (L.) Rafinesque) (Draf). LIFE in UK Rivers Project. http://www.english-nature.org.uk/lifeinukrivers/ecological.html
4. Newbold, C. & Mountford, O. (1997). Water level requirements of wetland plants and animals. English NatureFreshwater Series No 5. English Nature, Peterborough.
5. Nielson RN, Riis T and Brix H, 2006 The importance of vegetative and sexual dispersal of Luronium natans.Aquatic Botany, 84, 2, 165-170.
6. Preston, C. D. & Croft, J. M. (1997). Aquatic Plants in Britain and Ireland. Harley Books. pg 168.
7. UK Biodiversity Action Plan, Action Plan for Luronium natans. Retrieved March 6, 2006, fromhttp://ukbap.org.uk/UKPlans.aspx?ID=427
8. Willby, N.J. & Eaton, J.W. (1993) The distribution, ecology and conservation of Luronium natans (L.) Raf. inBritain. Journal of aquatic plant management 31: 7078.
Supporting referencesAnnex I habitats associated with the floating water-plantain are oligotrophic waters containing very few minerals ofsandy plains (Littorelletalia uniflorae), oligotrophic to mesotrophic standing waters with vegetation of theLittorelletalia uniflorae and/or the Isoeto-Nanojuncetea, water courses of plain to montane levels withRanunculion fluitantis and Callitricho-Batrachion vegetation.
< Section divider
This do
cumen
t was
with
drawn o
n 6 N
ovem
ber 2
017.
General informationThe fen orchid (Liparis loeselii) is a small green-flowered orchid of fen and dune systems. Two distinctmorphological forms are noted Liparis loeselli (fenland)and Liparis loeselli var ovata. The new Flora of GB &Ireland by Sell & Murrell (2006) affords the fenland formvarietal rank as var. loeselii. It might clear up confusionif the authors of this account follow this.
Liparis loeselli (fenland) is found in the East Anglian fensand has acute oblong-elliptical leaves. It inhabits wetcalcareous or neutral fens, and is now only known fromthree sites in Norfolk. This form is confined to species-rich fens that have experienced historic disturbancethrough peat-cutting. Liparis loeselli var ovata occurs indune slacks with moist calcareous conditions and isgenerally shorter with fewer-flowers and blunt, broadlyelliptical leaves. This form is now only found in four sitesin south Wales (and one in north Devon) and is confinedto successionally young dune slack communities wheresome open soil remains (Ref. 4). In the UK these formsare mutually exclusive with respect to their distribution,but in mainland Europe the fenland form also occurs indune slacks (Ref. 7).
Habitat preferences• The fen orchid requires fairly open conditions to
flourish;• It is often found on the edges of pools, pingos and
floating fen (Ref. 6);• Liparis loeselii var.ovata favours newly created dune
slacks (Ref. 6);• This species is characteristic of basin mires, and is
never associated with soligenous species orpercolating fen (Ref. 6);
• It is characteristic of lower slump succession (Ref. 6);and
• The fen orchid is associated with certain bryophytessuch as the brown mosses: Calliergon cuspidatum,Drepanocladus revolvens, Calliergon cuspidatum andScorpidium scorpiodes in the lower layer (Ref. 6).
Key influencesWater resources• There seems to be some disagreement about the
relationship between the fen orchid and the nature ofwater inputs (Ref. 6). The current research into thewater supply mechanisms of wetlands beingundertaken by Sheffield University may help to clarifythis issue;
• The proximity of the fen orchid to open water asopposed to seasonal flooding may be an importantfactor in its distribution for the Broadlandpopulations;
• Both forms favour stagnant water conditions andmay require exposure to air at certain times of theyear (Ref. 6);
• The species can tolerate variable water levels andseasonal inundation may be an importantconsideration (Ref. 3);
• The fenland fen orchid form requires high watertables throughout the year and possibly winterflooding (Ref. 7);
• Liparis loeselii var.ovata tolerates winter flooding,with inundation often occurring for up to five monthsin a year. It requires relatively high and stable waterconditions, but is considered more tolerant of a widerrange of hydrological conditions than the fenlandvariety (Ref. 6);
• Drainage and other factors affecting groundwaterplay an important role in the status of the fen orchid(Ref. 6); and
• A high summer water table is essential for survival ofthe Liparis loeselii var.ovata form (Ref. 6).
Other influences• Open conditions are required by the fen orchid to
flourish (Ref. 5);• A base rich water supply is required with the fenland
form being associated with pH values of between6.5-8.2 (Ref. 3&6);
• The cessation of peat-cutting in the fens is probablythe most important contributory factor leading to thedecline of the fenland type (Ref. 7); and
• Liparis loeselii var.ovata requires regular disturbanceover medium time-scales to ensure a steady supplyof newly formed dune slack substrates forcolonisation (Ref. 5).
Species and habitats Guidance notes – Species Plants: Fen orchid 2.3.4
Environment Agency in partnership with Natural England and Countryside Council for Wales Understanding water for wildlife
Fen orchid (Liparis loeselii)
2.3.4 Plants
< Section divider
This do
cumen
t was
with
drawn o
n 6 N
ovem
ber 2
017.

Current and future workThe Countryside Council for Wales (CCW) and theNorfolk Wildlife Trust have recently produced amanagement plan for the conservation of the fen orchidand have plans to re-introduce the species to suitablesites within its known former range (Ref. 1). CCW havealso funded experimental management programmes atKenfig NNR, which supports the largest UK population.
Species and habitats Guidance notes – Species Plants: Fen orchid 2.3.4
Environment Agency in partnership with Natural England and Countryside Council for Wales Understanding water for wildlife
Key referencesGeneral description/biology & habitat details1. ARKive, Fen Orchid (Liparis loeselii), Retrieved March 7 2006, from http://www.arkive.org/species/ARK/plants_and_algae/Liparis_loeselii/more_info.html
2. Davy A.J, Grootjans A.P, Hiscock K, Petersen J. 2006 English Nature. Development of eco-hydrological guidelinesfor dune habitats-phase 1. Report Number 696. Available: http://www.english-nature.org.uk/pubs/publication/PDF/696.pdf
3. English Nature. (2002). Management guidelines for the Fen Orchid (Draft). Unpublished report.
4. Jones, P.S. 1998. Aspects of the population biology of Liparis loeselii (L.) Rich. Var. ovata Ridd. Ex Godfrey(Orchidaceae) in the dune slacks of South Wales, UK. Botanical Journal of the Linnean Society, 126, 123-139.
5. Jones, P.S. and Wheeler, B.D. Liparis loeselii (L.). L.C.M. Rich. (Orchidaceae). In Wiggonton, M.J. (ed) (1999).British Red Data Books: 1 Vascular Plants. 3rd. Edition. Joint Nature Conservation Committee, Peterborough. Pp. 225-226.
6. Masson, A (1995). Liparis Report 1994/95, Norfolk Wildlife Trust, Norfolk.
7. McLeod, CR, Yeo, M, Brown, AE, Burn, AJ, Hopkins, JJ, & Way, SF.(eds.). (2002). The Habitats Directive: selectionof Special Areas of Conservation in the UK. 2nd edn. Joint Nature Conservation Committee, Peterborough.www.jncc.gov.uk/SACselection
8. Sell P and Murrell G, 2006, Volume 4, Flora of Great Britain and Ireland Cambridge University Press
9. UK Biodiversity Action Group (1995). Biodiversity: The UK Steering Group Report – Volume II: Action PlansHMSO Tranche: 1 Volume 2.
10. Wheeler, B.D., Lambley, P.W. & Geeson, J. 1998. Liparis loeselii (L.) Rich. In eastern England: constraints ondistribution and population development. Botanical Journal of the Linnean Society, 126, 141-158.
Supporting referencesAnnex I habitats associated with the fen orchid are, humid dune slacks, Calcareous fens with Cladium mariscusand species of the Caricion davallianae, Alkaline fens Calcium-rich springwater-fed fens, transition mires andquaking bogs, hard oligo-mesotrophic waters with benthic vegetation of Chara spp and natural eutrophic lakeswith Magnopotamion or Hydrocharition-type vegetation.
< Section divider
This do
cumen
t was
with
drawn o
n 6 N
ovem
ber 2
017.
General informationThe shore dock, Rumex rupestris, is a long-lived woodyperennial maritime plant with greyish leaves and greenor reddish-brown flowers in whorls spread out up thestem (Ref. 7 & 6). It is a poor competitor and oftenbehaves like a pioneer species (Ref. 6). It occurs onupper shores or in wet hollows in sand dunes atapproximately 40 locations in Anglesey, South Devon,Cornwall and the Isles of Scilly although the number ofmainland UK sites has declined by over 80 per cent overthe past century (Ref. 8 & 6). Although the largestBritish population has no more than 50 individuals, theUK is the world stronghold for this species (Ref. 3).Recently, several new colonies have been found alongthe coastline in south-west England and Wales (Ref. 3).
Habitat preferences• R. rupestris grows on rocky, sandy and raised
beaches, shore platforms and the lower slopes ofcliffs, and rarely in dune slacks (Ref. 3);
• Most commonly, it may be found growing by the sideof streams entering beaches, on soft-rock cliffs andin rock clefts where flushing occurs and it only occurswhere there is a constant source of freshwater,running or static (Ref. 3); and
• R. rupestris often occurs in National VegetationClassifications MC8, MG12b, MG11, MG11b, MC8,SD2, S25 and SD14 (Ref. 6).
Key influencesWater resources• R. rupestris is dependent upon a constant source of
freshwater and is often found near seepage zones orgroundwater springs at the junction of superficialdepositions such as quaternary head and imperviousunderlying rock strata and even surrounding septictank leaks (Ref. 2 & 6).
Other influences• The loss or fragmentation of its habitat through the
culverting of streams, coastal defence, tourism alongbeaches, and sea level rise have contributed to thedecline of shore dock (Ref. 3);
• It has also declined as a result of competition fromthe Hottentot fig (Carpobrotus edulis), anestablished non-native species as well as frombramble and other invasive species;
• R. rupestris is sensitive to pollution, particularly oilspills and eutrophication (Ref. 6);
• Shore dock is sensitive to the weather and severewinter storms can cause fluctuations in populations,rising sea levels can also reduce the availability ofsuitable habitat (Ref. 3 & 6);
• Surveys have suggested that the shore dock issomewhat mobile and consideration should be givento suitable habitat even if it is not yet occupied; and
• Surveys have suggested that moderate grazing isbeneficial for colonization of R. rupestris as it helpsto create suitable bare ground for seedlingestablishment (Ref. 6).
Current and future workA species recovery programme, undertaken by Plantlife,began in 1994 and its results and the results of otherresearch are available at:www.plantlife.org.uk/uk/assets/saving-species/saving-species-dossier/Rumex_rupestris_dossier.pdf
Species and habitats Guidance notes – Species Plants: Shore dock 2.3.4
Environment Agency in partnership with Natural England and Countryside Council for Wales Understanding water for wildlife
Shore dock (Rumex rupestris)
2.3.4 Plants
< Section divider
This do
cumen
t was
with
drawn o
n 6 N
ovem
ber 2
017.

Species and habitats Guidance notes – Species Plants: Shore dock 2.3.4
Environment Agency in partnership with Natural England and Countryside Council for Wales Understanding water for wildlife
Key references1. ARKive, Shore dock (Rumex rupestris). Retrieved March 7, 2006, fromhttp://www.arkive.org/species/ARK/plants_and_algae/Rumex_rupestris/
2. Daniels RE, McConnell EJ and Raybould AF, 1998 The current state of Rumex rupestris Le Gall (polygonaceae) inEngland and Wales, and threats to its survival and genetic diversity. Watsonia 22, 33-39.
3. Joint Nature Conservation Committee, Higher Plant Species 1441 Shore dock, Rumex rupestris. Retrieved March7, 2006, from http://www.jncc.gov.uk/ProtectedSites/SACselection/species.asp?FeatureIntCode=S1441
4. King M, 2002 Shore Dock Rumex rupestris: report on work undertaken in 2001. Report Number 196, Plantlife.
5. McLeod CR, Yeo M, Brown AE, Burn AJ, Hopkins JJ and Way SF, 2002 The Habitats Directive: selection of SpecialAreas of Conservation in the UK, second edition. Joint Nature Conservation Committee: Peterborough.
6. Plantlife, Rumex rupestris Shore Dock. Retrieved March 9, 2006 fromhttp://www.plantlife.org.uk/uk/assets/saving-species/saving-species-dossier/Rumex_rupestris_dossier.pdf
7. Plantlife, Species and Habitat Conservation. Retrieved March 7, 2006, from www.plantlife.org.uk
8. UK Biodiversity Action Plan, Action Plan for Rumex rupestris. Retrieved March 7, 2006, fromhttp://www.ukbap.org.uk/UKPlans.aspx?ID=555
Supporting referencesHumid dune slack habitats should be considered with the shore dock.
< Section divider
This do
cumen
t was
with
drawn o
n 6 N
ovem
ber 2
017.

Species and habitats Guidance notes – Species SPA bird species: Introduction 2.3.5
Environment Agency in partnership with Natural England and Countryside Council for Wales Understanding water for wildlife
2.3.5 BirdsThe following summaries have been compiled using key reference papersprovided by Environment Agency and Natural England staff. They provide asummary of relevant information on the freshwater requirements of birds. Forfurther information, refer to references listed below each habitat account.
– SPA bird species
– Habitat descriptions
– Species descriptions
< Section divider
This do
cumen
t was
with
drawn o
n 6 N
ovem
ber 2
017.
Introduction The Birds Directive (Council Directive 79/409/EEC)compliments the Habitats Directive by requiringmember states to protect rare or vulnerable bird speciesthrough designating Special Protection Areas (SPAs).Bird species for which an SPA is designated can begrouped by the type of habitat that supports them.These groups are:
3.1 Birds of uplands;3.2 Birds of woodland and scrub;3.3 Birds of lowland heaths and brecks;3.4 Birds of lowland wet grassland;3.5 Birds of lowland dry grassland;3.6 Birds of lowland freshwaters and their margins;3.7 Birds of farmland;3.8 Birds of coastal habitats;3.9 Birds of estuarine habitats; and3.10 Birds of open sea and rocks.
Bird species can be associated with particular habitattypes, but links to more than one habitat type arecommon due to the mobility, spatial range, life cycleand migration patterns of populations. For SPAdesignation, only one habitat group is generallyidentified as the primary habitat, unless there is morethan one primary habitat type present. (e.g. groups 3.6and 3.9 as an estuarine SPA).
This section focuses on the habitat groupings 3.4, 3.6and 3.9, lowland wet grasslands, lowland freshwatersand their margins (for which water resource issues areconsidered to have significant implications) andestuarine habitats (for which water resources issuesmay prove to be important). Table 1 provides a listing ofbird species considered and which habitat type they aregenerally associated with. The selection is based on therarity or degree of vulnerability, and the legislativerequirements, for the species concerned as indicatedby its inclusion in Annex 1 of the EC Birds Directive(79/409/EEC), Schedule 1 of the1981 Wildlife &Countryside Act, or the Red Data Birds in Britain listing(NCC/RSPB 1990). Predominantly marine birds andcommon bird species were not included, althoughlisted in groupings 3.4, 3.6. & 3.9.
While a number of species have highly specific habitatrequirements of either habitat type, there are manyspecies dependent on more than one. Lowlandgrasslands and lowland freshwaters are commonly co-joined habitats, exhibiting a strong functionalinterdependence between them. There are manysituations where freshwater habitats are in closeproximity to estuarine habitats and can overlap. Anindication of UK wintering/passage habitats andbreeding habitats is also provided in the table.
Water resource management needs to take account ofthe vulnerable seasons (weather conditions andsupply) in relation to the seasonal requirements of theavian population. Water needs for the key habitat typesare relatively well understood; but the challengesremain to understand the freshwater needs of birdsusing estuarine habitats and to apportion a resourcewith multiple demands.
Species and habitats Guidance notes – Species Birds: SPA bird species 2.3.5
Environment Agency in partnership with Natural England and Countryside Council for Wales Understanding water for wildlife
2.3.5 Birds
SPA bird species
< Section divider
This do
cumen
t was
with
drawn o
n 6 N
ovem
ber 2
017.

Species and habitats Guidance notes – Species Birds: Table 1. Species of lowland wet grassland (3.4 ) and lowland freshwaters (3.6) 2.3.5
Environment Agency in partnership with Natural England and Countryside Council for Wales Understanding water for wildlife
3.4 Bewicks swan*** Shallow-water lakes, ponds, river flood plains
Barnacle goose Pastures Mainly coastal
Golden plover** Upland moors and pastures Unimproved wet grassland, arable Higher prey density in old grasslands
Black-tailed godwit* Wet grasslands, fens Flooded grassland, mainly coastal(peat substrates)
Curlew Wet heath, bogs, unimproved Coastal Mainly upland breedingwet grassland
Dunlin Upland bogs and peatlands Coastal Rarely in lowland, inland habitats
Redshank Wet grasslands, saltmarshes Mainly coastal Requires moderate grazing on breeding grasslands
3.6 Bittern*** Dense reedbeds Reedbeds, open waters, rivers Open waters/rivers in hard winters
Marsh harrier*** Reedbeds Reedbeds, saltmarshes Also nests in arable crops
Mediterranean gull*** Lakes, marshes, gravel pits Lakes, marshes, gravel pits, Rarearable land
Gadwall Marshes, shallow eutrophic, Shallow, eutrophic open watersopen waters
Pintail Shallow waters in Mainly coastal, certain washlands Rare breeder,grasslands, washes and nearby arable susceptible to water
level management
Ringed plover Gravels on river bars, Mainly coastal, some at breeding lake/reservoir shores sites inland
Shelduck Hole nester (burrows, tree hollows) Some on open waters, mainly coastal
Shoveler Shallow freshwaters with Similar to breeding sites, ditchesmarshland edges in washlands
Wigeon Mainly in upland neutral waters Flooded pastures, washlands, mainly coastal
3.4/3.6 Ruff*** Wet grassland, floodplains Lake/pool margins, Requires summer flooded grassland grazing, winter flooding
Whooper swan*** Reed fringes, forest ponds Shallow lakes, ponds, floodplains, arable
Hen harrier*** Upland moor Reedbeds, river valleys, marshes, heathland
Pink foot goose** Pastures, arable, lakes High proportion coastal
Teal Well vegetated wetlands, Well vegetated wetlands High proportion ofpeatland pools in lowlands breeding in uplands
3.9 Avocet*** Coastal lagoons Coastal lagoons, estuaries Most of the British birdsnest within reserves
Bar-tailed godwit** Sheltered shorelines, bays and Almost certainly restrictedestuaries with mud and sand to estuaries
Brent Goose Mudflats where they graze foreel grass Zostera.
*** Annex 1, Schedule 1, RDB ** Annex 1, RDB * Schedule 1, RDB
Key habitat Species Breeding Passage/wintering Additional informationtype requirements requirements
Table 1. Species of lowland wet grassland (3.4 ) and lowland freshwaters (3.6)
< Section divider
This do
cumen
t was
with
drawn o
n 6 N
ovem
ber 2
017.

Common tern Shingle beaches, rocky islands Prey abundance likely to be and saltmarshes along coasts, key controlling factoralso islands in gravel pits and rivers
Cormorant Cliffs or rocky islands & trees Anywhere there is sufficient Adaptable and by freshwater lakes, gravel pits fish prey opportunistic speciesand reservoirs
Great crested grebe Shallow, reed-fringed freshwater As per breeding but then extendslakes, gravel pits and slow rivers to estuaries and coasts
Grey Plover Very few are found away from estuaries where over 90% of UKwintering population are found
Knot Estuary sites are important fuelling stops as part of their migration
Lapwing Pasture, wet grassland and marshes, Flooded grassland, estuaries, Food supply at breedingespecially if it contains flood pools coastal wetlands, short grassy sites v. important
and damp patches fields and ploughed fields.
Little egret Reedbeds, wetland scrub and As per breeding but also along Former visitor nowin trees near water estuaries breeding
Purple sandpiper Restricted to one or very few Rocky shores and islands and Not uncommon onsites in Scotland around jetties, piers and breakwaters estuaries in winter
Sanderling Winter visitors and passage migrantsentirely restricted to sandy coastsand estuaries
Slavonian grebe*** Hill lochs, gravel pits and Sheltered estuaries andlowland lochs in Scotland coastal bays
Turnstone All types of coastline are used from rocky coasts to sandy shores and tidal mud
*** Annex 1, Schedule 1, RDB ** Annex 1, RDB * Schedule 1, RDB
Key habitat Species Breeding Passage/wintering Additional informationtype requirements requirements
Table 1. Species of lowland wet grassland (3.4 ) and lowland freshwaters (3.6) cont.
Species and habitats Guidance notes – Species Birds: Table 1. Species of lowland wet grassland (3.4 ) and lowland freshwaters (3.6) 2.3.5
Environment Agency in partnership with Natural England and Countryside Council for Wales Understanding water for wildlife
< Section divider
This do
cumen
t was
with
drawn o
n 6 N
ovem
ber 2
017.

Species and habitats Guidance notes – Species Birds: Habitat descriptions 2.3.5
Environment Agency in partnership with Natural England and Countryside Council for Wales Understanding water for wildlife
The water level regime in marshes or wet grasslands isparticularly important during the breeding phase ofmany bird species. Appropriate grazing regimes andvarying water table levels are required. Water levelmanagement has received considerable attention (Ref. 21) in relation to providing the correct mosaic ofopen water, soft ground for feeding and, more recently,in relation to the distribution of soil-invertebrate prey.
In flood-plains that regularly flood in winter, soilinvertebrates, which are dominated by earthworms, areflood adapted. Long periods of flooding can lead to areduction in invertebrate biodiversity, particularly of thearthropod fauna. New flooding, particularly ifprolonged, in grasslands formerly not subject to annualinundation can lead to a loss of invertebrate diversityand biomass. Ausden et al., working on those areas ofnew flooding in ESA schemes, concluded that theoptimum practice may be to ensure a mosaic of floodedconditions during the winter and spring months, ratherthan subject pastures in new flooding schemes, toprolonged and deep floodwater.
Lowland wet grasslandsWater resource related influences• Winter flooding of river flood-plains has been regarded
as beneficial in sustaining wet grassland habitat. Itassists in maintaining a shorter sward, keeps theground soft for probing birds such as redshank andsnipe ,and it provides winter feeding and roostingareas for a number of wetland bird species;
• Water levels in the flood-plain grasslands during thebreeding season generally need to be sufficiently highto maintain soft enough ground for feeding, keepingsoil invertebrates in the upper 20-30 cm of soil and inthe maintenance of high water levels in ditches andpools. A mosaic of drier grassland and damp hollows,together with the variation in sward structure thatarises from topographical variation and grazingmanagement, provides optimum conditions for mostspecies and in particular the more demandingspecies, ruff, black-tailed godwit and redshank. Inproviding such mosaics, other typical species of wetgrasslands are catered for, e.g. snipe and lapwingwhere the former requires soft ground with talltussocky vegetation for concealment, while lapwingprefers short vegetation with good all round visibility;
• In marshlands where there is traditionally someconstancy in water levels, e.g. spring-fed systems orother forms of ground water supply from theunderlying aquifer, abstraction leading to frequentfluctuations in water level can induce changes in thevegetation e.g. increasing dominance by certaingrasses, tall herbs or willow scrub with consequentimplications for the bird communities;
• Ground-water abstraction may lead to the lowering ofwater levels in marshes and reedbeds, while riverabstraction may lead to lowering water levels in theflood-plain; and
• Abstractions resulting in regularly varying waterlevels leading to vegetation changes.
Other influences• Use of washlands for flood storage during summer
rainfall and the loss of nesting populations;• Drainage of marshes and wet grasslands for
agricultural intensification or other developments;• Improvements in the drainage regime for agricultural
intensification;• Water pollution and excess eutrophication; and• Disturbance from recreational uses of water bodies.
Lowland freshwaters and theirmarginsWater resource related influences• In lowland freshwaters, (particularly shallow marshes
and reedbeds), small decreases in water level makehabitat unsuitable. In general, relatively constantlevels are required, particularly during summermonths when natural drawdown can occur. Constantlevels ensure the growth of submerged and emergentwater plants and maintain invertebrate and fishpopulations for duck species and for bittern inreedbeds; and
• Drawdown in the summer months and lower watervolumes is often coupled to increasingconcentrations of nutrients from agriculturalapplications or domestic water disposal.
Habitat descriptions
2.3.5 Birds
< Section divider
This do
cumen
t was
with
drawn o
n 6 N
ovem
ber 2
017.

Other influences• Water quality remains an important issue for while
most species of lowland freshwaters and lowland wetgrasslands benefit from eutrophic and species-richhabitats, excess nutrients (particularly nitrates andphosphates) can lead to a loss of diversity wherealgal blooms predominate, or single species,adapted to rapid nutrient uptake, are favoured;
• Nutrient enrichment in wet grassland can lead todominance by a few grass species and a loss ofdiversity in the flowering herb community. Reedsloose their structural qualities under conditions ofexcess nutrients leading to lowering reed density andweak stems;
• Construction of embankments or bunds for floodprotection;
• Deepening and canalisation of rivers for floodcontrol, ditch deepening in flood-plains; and
• Water pollution and excess eutrophication.
Estuarine habitatsWater resource related influences• Estuaries comprise a range of habitat types and
provide a gradient between the marine andfreshwater environment and are important wildliferesources, especially as they support large numbersof waterbirds;
• Freshwater flows into estuaries may influencesediment regime and hence estuarine morphology.The number and location of freshwater inputs shouldbe considered, along with an understanding ofestuarine morphology;
• Changes to freshwater input may alter currents withinthe estuary affecting sediment transport, settlementand the dispersion of organisms;
• Invertebrate diversity is greatest in either marine orfreshwater environments, reducing as the salinityrange increases. Changes in salinity resulting fromfreshwater inputs will generally reduce invertebratediversity. However, interstitial salinity tends to bemuch less variable than the overlying water, and assuch is not considered a major limiting factor ofinvertebrate abundance;
• Freshwater inputs may be considered important forbird utilisation of this habitat, although it is not yetclear. It is possible that birds do rely on freshwaterinputs for preening and drinking, and as such theseinputs are important for the development of localniches (Ref. 19);
• The zonation of non-breeding waterbirds has beenshown along the salinity gradient for the Scheldeestuary on the Dutch-Belgian border (Ref. 28);Oystercatcher and dunlin were dominant inpolyhaline areas (salinity 18 – 30ppt), wigeon andgreylag goose dominated the mesohaline areas (5 –18ppt) while teal and mallard were dominant in theoligohaline areas (0.5 – 5ppt); and
• Salinity gradient and freshwater inputs can influencehabitat diversity and suitability for use by waterbirds,mainly through food availability (Ref. 28).
Other influences• Tidal barrages and other development which affect
flows through the estuary can affect sedimenttransport processes and habitat diversity for birds;
• Recreational activities can create significantdisturbance to feeding or roosting estuarine birds; and
• Human activities which affect bird food distributionand/or abundance can have an effect on birdcondition and this may be detrimental to someimportant overwintering or migratory populations.
Species and habitats Guidance notes – Species Birds: Habitat descriptions 2.3.5
Environment Agency in partnership with Natural England and Countryside Council for Wales Understanding water for wildlife
< Section divider
This do
cumen
t was
with
drawn o
n 6 N
ovem
ber 2
017.

Species and habitats Guidance notes – Species Birds: Species descriptions 2.3.5
Environment Agency in partnership with Natural England and Countryside Council for Wales Understanding water for wildlife
Avocet Recurvirostra avosetta
Avocet use coastal lagoons on the east coast insummer, and south and east-coast estuaries in winter.They now also breed in north-east England, north-westEngland, South Wales and the Fens. Most of the Britishbirds nest within reserves, where the management ofbrackish lagoons is tailored to the birds’ requirements,and where they are safe from human disturbance.Protection of wintering birds on estuaries such as theExe requires the involvement of other organisations andprivate individuals, and forms a part of broader scaleestuary conservation and management plans.
It became extinct as a breeding bird in 1842 as a result ofextensive land claim and the building of sea walls, whichdried out its habitat. The breeding population stood at1,020 pairs in 2000. The primary food is invertebrates,especially crustaceans and worms. In fresh water theyalso take insects found on the surface or within the toplayers of the bottom sediments.
Key influences• Chick survival can be poor, and is determined largely
by weather and food supply;• They can breed at higher densities and more
successfully when the density of invertebrates(the biomass) is high;
• Correct management of breeding habitat is vital(Ref. 20);
• Relationship between salinity, invertebrate foodsupply and breeding success still imprecisely known(Ref. 20); and
• Availability of saline lagoon complexes and areasof brackish water likely to influence expansion ofthis species.
Bar-tailed godwit Limosa lapponica
On their northern breeding grounds in the Arctic ofScandinavia and Siberia they use peatbogs and swampwith areas of raised ground and occasional trees. Inwinter they are found almost exclusively along coasts,liking sheltered shorelines, bays and estuaries withmud and sand. The large numbers of birds which passthrough the UK on their way to and from southernwintering grounds will stop off to refuel at suitableestuaries and bays. They will take a range of largermolluscs and polycheate worms, but their main foodconsists of lugworm Arenicola marina.
Key influences• Almost certainly restricted to estuaries;• Major threat from estuary land claim for
development; and• Bait digging is a particularly important threat but
other factors which could reduce prey density needto be considered.
Bewick’s swan Cygnus columbianus bewickii
and Whooper swan Cygnus cygnus
The Bewick’s swan is an overwintering/passage speciesutilising shallow-water lakes, reservoirs, and ponds,rivers and their flood-plains to feed on low emergentand submerged aquatic plants. Increasing, use is beingmade of arable fields (Ref. 21), with up to 60% of thepopulation recorded to use this resource. The transferto this feeding pattern may have arisen as a result ofthe eutrophication of aquatic habitats (Ref. 3). Theswan is primarily a southerly species in the UK (Ref. 21),partly a function of the migration routes from theRussian breeding grounds to the wintering quarters inNW Europe. Major concentrations in the Ouse washes(Cambridgeshire/Norfolk), Slimbridge in Gloucesterand Martin Mere in Lancashire.
Whooper swans have a more northerly breedingdistribution than Bewick’s and small numbers breedannually in marshes and lochs in northern Scotland andwintering mainly in northern England and Scotland onand in the proximity of shallow permanent open waters,inland and coastal, where the birds feed on submergedplants and adjacent wet grassland. Foraging in arableland is also frequent.
Key influences• Wetlands are important refuge areas for this bird
species with standing water on grazing marshes,levels and flood-plains providing valuable winteringfeeding and roosting sites;
• Threats to this species pertain to water managementthat reduces or prevents winter flooding;
• Eutrophication and drainage of farmland areconsidered to be the principle threats to the healthand status of this species; and
• Other threats to both swan species also includes disturbance in the wintering groundsand breeding areas.
Species descriptions
2.3.5 Birds
< Section divider
This do
cumen
t was
with
drawn o
n 6 N
ovem
ber 2
017.

Species and habitats Guidance notes – Species Birds: Species descriptions 2.3.5
Environment Agency in partnership with Natural England and Countryside Council for Wales Understanding water for wildlife
Bittern Botaurus stellaris
Bittern is one of the key indicator species for high-quality extensive reed-swamp dominated byPhragmites australis. In the UK the species requiressuch areas of dense reedbed for breeding. Small areasof Salix scrub appear to improve the UK habitat for thisspecies (Ref. 9). During the winter it may emerge to feedalong well vegetated margins of river margins and otheropen waters. Food items include fish, amphibia,aquatic insects and occasionally birds and smallmammals.
Key influences• The breeding habitat of this species requires water
levels to be deep enough to support fish andamphibian prey, a mosaic of open water and reed-swamp giving a long length of reed-edge habitat,good water quality and a significant area of totalreed cover, the optimal size being around 20 ha (Ref. 9 & 26). Drier reedbeds are avoided;
• The lowering of water tables is considered a realthreat to the status of this species;
• The historical loss of reedbed habitat to landdrainage and intensive farming has reducedpopulations of this bird, making its status rare; and
• Threats other than direct habitat loss andfragmentation, include eutrophication under whichreed quality and prey items decline.
Brent Goose Branta bernicla
Brent geese overwinter in internationally importantnumbers on estuaries and shallow coasts with mudflatswhere they graze for eel grass Zostera. They also grazeon fields near the coast and as numbers have increasedcan prove problematic for arable farmers who havewinter sown crops near to overwintering sites. Mainconcentrations are found in the Wash, the North Norfolkcoastal marshes, Essex estuaries, the Thames Estuaryand Chichester and Langstone Harbours.
Key influences• Major threats include shooting in wintering areas,
habitat loss or change and other human disturbance.
Common tern Sterna hirundo
Common terns are summer visitors breeding on shinglebeaches, rocky islands and saltmarshes along coasts,and also on islands in gravel pits and rivers. They willalso use artificial rafts if provided on reservoirs/lakes.Breeding success is determined by the abundance offish, mainly small clupeids for coastal birds but inlandbirds will take small freshwater fish. Prey abundancealso affects pre-migration condition and subsequentlydetermines migration success.
Key influences• Habitat loss at breeding sites either through natural
causes (storm events, flooding, sea level rise) orhuman induced (engineering works, flooding ordraining at inland freshwater sites);
• Inland breeding sites tend to be close to a suitablesupply of prey items (small fish) normally caught ingravel pits, reservoirs, lakes and river backwaters;and
• Changes in hydrology which result in prey reductionat these sites could affect breeding success ifalternative feeding areas are not available.
Cormorant Phalacrocorax carbo
As coastal seabirds Cormorants are found whereverthere are cliffs or rocky islands. New colonies inland aremainly in trees by freshwater lakes, gravel pits andreservoirs. The species is adaptive, will hunt for fish inurban ponds or lakes. They are also opportunistic andwill target fish farms and lakes or ponds with sufficientfish stocks.
Key influences• Loss of suitable breeding sites on rock shores due to
coastal development;• Loss of woodland at suitable inland breeding sites;• Disturbance at breeding sites;• Reduction in fish stocks is likely to affect breeding
success; and• Conflicts with fishery managers who see cormorant
as a threat.
< Section divider
This do
cumen
t was
with
drawn o
n 6 N
ovem
ber 2
017.

Species and habitats Guidance notes – Species Birds: Species descriptions 2.3.5
Environment Agency in partnership with Natural England and Countryside Council for Wales Understanding water for wildlife
Great crested grebe Podiceps cristatus
Breeding sites can be found in shallow, reed-fringedfreshwater lakes, gravel pits and slow rivers. Emergentvegetation in standing water provides cover andprotection from nest predation. Overwintering habitatsare the same as breeding habitats but birds are alsofound along sheltered coastal areas, including estuaries.In severe winters, coastal numbers increase as inlandfreshwater habitats freeze up and prohibit access to preyitems, which is mainly fish but some amphibians andinvertebrates are taken.
Key influences• Loss of suitable breeding habitat through drainage,
flood defence works, dredging etc;• Reductions in fish stocks caused by changes in
hydrology, hydro-morphology and water quality canprove detrimental to breeding success; and
• Significant hydrological changes are likely to resultin complete habitat loss.
Grey Plover Pluvialis squatarola
This species is a localised winter visitor and passagemigrant to Britain in internationally important numbers.Very few are found away from estuaries where over 90%of UK wintering population are found (Ref. 20). Largemuddy and sandy estuaries and bays are preferred,sometimes they are found on saltmarsh. They may evenmove into coastal fields at high tide. Largest numbersare found on the Wash, Ribble, Thames, Blackwater,Medway, Dee and Humber estuaries, and Chichesterand Langstone Harbours. Shellfish but mainlypolycheate worms make up their diet.
Key influences• As with most waders, estuarine land claim for
development or the creation of tidal barrages posesthe biggest threat (Ref. 20); and
• Bait digging is a key threat, especially at the few siteswhere birds occur in large numbers.
Hen Harrier Circus cyaneus
and Marsh Harrier C. aeruginosus
Hen harrier is a breeding species mainly of uplandmoors but, as with marsh harrier, obtains winterhunting over extensive open lowland wet grasslands,reedbeds and marshes. Arable land may also be used.Marsh harrier requires extensive areas of reedbed inwhich to nest and food items comprise birds, smallmammals and frogs. Smaller reedbeds in arable landand even cereal crops have recently been used for
nesting. During spring and autumn passage, thespecies commonly uses river valleys as migrationroutes and for foraging.
Of the two species, marsh harrier is the rarer andsomewhat more dependent on water resourcemanagement in its breeding habitat. At one time thespecies was extinct in the UK but since 1900, arelatively small breeding population has establishedthroughout the country.
Key influences• While habitat loss in the past must have reduced the
population, and pesticide residues in eggs notablyreduced raptor populations from around 1950 to1970, persecution, disturbance where extensive areasof nesting habitat are unavailable, and predation ofnest sites (e.g. by foxes) are current threats; and
• The eutrophication of reedbeds will reduce thedensity vigour of the reed stand, thus reducing thecapacity of the reed to support the nest platform.
Knot Calidris canuta
Knot are localised winter visitors and passage migrantsto the UK and are almost entirely restricted to estuaries(Ref. 20). They can be seen around UK coasts betweenAugust and May but largest numbers can be seen athigh tide roosts between December and March.Greatest numbers are found on The Wash, MorecambeBay, Thames, Humber and Dee estuaries, the SolwayFirth and Strangford Lough. Knot are specialist feederson marine bivalve molluscs, particularly macomabalthica, Mytilus edulis and Cerastoderma spp.
Key influences• Of particular importance is the very large
concentration of this species in a very few estuariesat any one time. These sites are important fuellingstops as part of their migration;
• Any reduction in food availability in UK sites is likelyto prove a serious threat to the birds’ ability toaccumulate sufficient reserves; and
• Equally, disturbance at key feeding sites is likely toresult in reduced food intake.
< Section divider
This do
cumen
t was
with
drawn o
n 6 N
ovem
ber 2
017.

Species and habitats Guidance notes – Species Birds: Species descriptions 2.3.5
Environment Agency in partnership with Natural England and Countryside Council for Wales Understanding water for wildlife
Lapwing Vanellus vanellus
This species mainly breeds on farmland, especiallyamong crops sown in spring which are adjacent to grassand bare land. Also on pasture, wet grassland andmarshes, especially if it contains flood pools and damppatches. Wintering habitats include flooded grassland,estuaries, coastal wetlands, short grassy fields andploughed fields. The highest known winterconcentrations of lapwings are found at the SomersetLevels, Humber and Ribble estuaries, BreydonWater/Berney Marshes, the Wash, and Morecambe Bay.Coastal grazing marshes can provide importantbreeding sites, especially where wet areas occur as these are important foraging areas for chicks(Ref. 13). Adults and chicks feed on a wide range of soil, surface-active and aquatic invertebrates withTipulid and Chironomid larvae making the largestproportion of their diet (Ref. 2).
Key influences• Reductions in soil moisture in breeding areas can
affect the density of invertebrate prey (Ref. 2); • Flooding from high river levels and/or high
groundwater levels are important for creating the wetmosaic necessary for breeding;
• Management should focus on creating this mosaicwith the appropriate hydrological regime; and
• Human disturbance at breeding sites can lead to reduced breeding success.
Little egret Egretta garzetta
Little egrets are wetland birds with a preference forlowland shallow waters, especially along coasts andestuaries. They nest communally, often alongside thenests of other herons and associated wetland species.Colonies are located in reedbeds, wetland scrub and intrees near water, up to a height of 20m. They overwinteron coastal estuaries, saltmarshes and tidal inlets. Arecent colonist, it is most commonly found along thesouth coast, and on parts of the east coast. Theestuaries of south Devon and Cornwall; Poole Harbourand Chichester Harbour hold some of the largestconcentrations and birds can be seen right round toNorth Norfolk.
It is predominantly a fish eating species butinvertebrates, amphibians and small mammals will alsobe taken.
Key influences• Changes in hydrology (flow and level) which affect
fish stocks can have a knock-on effect, especiallywithin or close to breeding sites; and
• Wetland sites should be managed to ensureoptimum conditions are maintained for associatedinvertebrates, amphibians and fish to providesufficient food supply for egrets.
Mediterranean gull Larus melanocephalus
The global distribution of the Mediterranean gull ishighly restricted with a few pairs (77 at the most recentcount in 2001) now regularly breeding in the UK, usingcoastal marshes in south and eastern England (theSwale and Dungeness/Pett levels in Kent, PooleHarbour, Dorset, the Solent and the north Norfolkcoast). Nesting typically occurs with black-headed gullcolonies or with sandwich terns. The species winters inthe Mediterranean and in the UK.
Key influences• The main threats to this species are considered to be
disturbance and predation;• In its coastal breeding sites, the species is relatively
independent of issues relating to the management offreshwater resources; and
• Implications may arise from sea-level rise, a factor thatpertains to a number of coastal species (Ref. 18 & 22).
Ruff Philomachus pugnax
The Ruff is a rare breeding wader in the UK, consideredto have highly specific requirements of the lowland wet grassland and floodplain habitat in which it nests(Ref. 23). Coastal grazing marsh and the higher levelsof saltmarshes are also used.
The species is semi-colonial and males congregate inleks in suitable areas where raised areas of shorter turfprovide display sites. Females nest solitarily but nearbywhere taller vegetation can conceal the nest (Ref. 10).The species is migratory with the main population insub-Saharan Africa. However, some numbers winter innorth-west Europe and the UK, along estuaries and alsoinland wetlands. The wintering population is thought tobe distinct from the summer breeding population whicharrives relatively late on the breeding grounds. Nestingcommences in late May to early June.
The species is dependent on the water managementregime, the micro-topography and the appropriategrazing patterns, to maintain the complex structuralmosaic in the wet grasslands.
< Section divider
This do
cumen
t was
with
drawn o
n 6 N
ovem
ber 2
017.

Species and habitats Guidance notes – Species Birds: Species descriptions 2.3.5
Environment Agency in partnership with Natural England and Countryside Council for Wales Understanding water for wildlife
Key influences• Adult birds and particularly chicks require wetter
depressions and areas of open water for feeding.This combination of requirements calls for a complexmosaic of unimproved grassland with a goodpopulation of invertebrate prey, produced byappropriate levels of summer grazing and winterflooding;
• Summer water table levels need to remain high toretain invertebrate prey items in the top layers of thesoil and provide areas of open water in lower-lyingdepressions;
• The continued loss, and improved drainage, of wetgrasslands has maintained the rare status of thisspecies despite greater levels of species protection.The species is particularly sensitive to the drainageregime and its late nesting cycle means that evenslight improvements in drainage may render thepastures too dry during the summer months; and
• At sites managed as flood storage areas, e.g. theOuse Washes, recent high rainfall events during thesummer months have resulted in the loss of neststhrough flooding.
Purple sandpiper Calidris maritima
This is a rare breeding species that has successfullybred at one site in Scotland since 1978. Other than thatit is restricted to arctic tundra and moors outside theUK. It is an important wintering and passage migrantutilising rocky shores and islands and around jetties,piers and breakwaters particularly on the east coastnorth of the Humber. Winkles, insects, spiders,crustaceans, and some plants are key dietarycomponents.
Key influences• Human disturbance and habitat loss due to
development are key threats.
Sanderling Calidris alba
Breeding sites are found in High Arctic tundra nearfreshwater lakes. In the UK sanderlings are localisedwinter visitors and passage migrants entirely restrictedto sandy coasts and estuaries (Ref. 20) but mayoccasionally turn up on the edges of large inland lakesand reservoirs. Birds feed almost exclusively in areaswith sandy substrates where small marine worms,crustaceans and molluscs are taken.
Key influences• Estuarine barrage development and land claim for
development are the main threats; and
• The protection of critical migration stop-over sitesshould be emphasised.
Slavonian grebe Podiceps auritus
Slavonian grebes breed on hill lochs, gravel pits andlowland lochs in Scotland and on shallow lakes andpools with thick surrounding vegetation in Scandinavia.In the UK breeding birds are confined to Scotland (Ref. 20). In winter they favour sheltered estuariesand coastal bays with concentrations in some Scottish firths and along the south coast of England.Their diet consists of fish and insect larvae.
Key influences• Human disturbance, a decrease in invertebrate
populations due to overstocking of fish, and a change in nutrient status of lochs etc as a resultof human activities are the main threats to thisspecies (Ref. 20); and
• Fluctuating water levels can cause problems atnesting sites.
Turnstone Arenaria interpres
This species breeds on bare ground along coasts andon islands in Canada, Greenland, Scandinavia and N Siberia. Breeding has never been recorded in thiscountry, although it was suspected in 1976 (Ref. 20).The wintering population of turnstones in Britain is ofinternational importance. Turnstones particularly likefeeding on rocks covered with seaweed, and will feedalong seawalls and jetties. It forages for insects,crustaceans and molluscs amongst seaweed and smallrocks, literally turning stones, rocks and other materialto expose its prey hence the common name turnstone.
Key influences• Habitat loss and other factors leading to prey
reduction are threats to certain parts of the winteringpopulation utilising estuaries; and
• Such threats are less important to this speciescompared with other waders as this bird occursmainly on rocky shores and will adapt to someartificial structures (Ref. 20).
< Section divider
This do
cumen
t was
with
drawn o
n 6 N
ovem
ber 2
017.

Species and habitats Guidance notes – Species Birds: Species descriptions 2.3.5
Environment Agency in partnership with Natural England and Countryside Council for Wales Understanding water for wildlife
Barnacle goose Branta leucopsis
and Pink-footed gooseAnser brachyrhynchus
The Barnacle and Pink-footed goose winter in the UK,concentrating mainly on a few open coastal sites wherea gradation from saltmarsh to grazing pasture, witharable land, provides good feeding and roosting habitat.The species are highly gregarious and can congregate inlarge numbers, locally leading to conflicts with farminginterests. Pink-foot geese may forage in arable land upto 30 kms away from the coastal roosting sites and thisspecies is principally dependent on farmland for winterforaging. Geese may be attracted away from arable cropsby managing the pastures so as to provide good grazing,this mainly being a function of sward height (relativelyshort) and fertilisation. These geese, as do othermembers of this group, gain more benefit fromagriculturally improved grasslands (Ref. 19 & 27).
Conservation of this species at its coastal winteringgrounds has few implications for water resourcemanagement issues.
Golden plover Pluvialis apricaria
The Golden plover is a characteristic breeding speciesof the high, flat, open moors of the Pennines andScotland but on passage and during the winter thespecies may be found in the more southerly estuariesand lowlands inland, feeding on extensive unimprovedwet grasslands and permanent pastures rich ininvertebrate prey. Large arable fields also providemainly roosting areas.
Key influences• Threats to the species are mainly on alterations to
the breeding grounds through loss of habitat toupland afforestation or overgrazing. The loss oflowland unimproved wet grassland may affect wintersurvival in some areas.
Black-tailed godwit Limosa limosa
As with the ruff, the Black-tailed godwit is entirelydependent on extensive, open, wet grasslands forbreeding. It is a rare breeding species in the UK,currently only present at five locations. The species issemi-colonial, requiring extensive areas of open habitatwhere grazing maintains a relatively short turf.
Wintering takes place on a few key estuarine sites wherepopulations are vulnerable to disturbance, either on thefeeding grounds or on high-tide roosts. It is during thebreeding season, however, where water resource issuespertain directly to the survival of this species.
Key influences• Softer peat soils are preferred to allow probing.
Ideally the summer water table is no more than 20-30 cms below the surface (Ref. 7 & 23). Grasslandstructure needs to be varied with short turf forfeeding and for predator visibility, tussocks for nestconcealment and areas of taller grass favoured byfeeding chicks (Ref. 4). Additional feeding areas areavailable if shallow temporary or permanent poolsare present and the species generally breeds within300 metres of open water;
• Threats to the species are also similar as for the ruffand include land-use changes resulting in the loss ofwet grasslands by conversion to arable orimprovements in land drainage;
• High summer rainfall events can lead to flooding inthe favoured washland nesting areas resulting intheir loss. Summer flooding can also temporarilysuspend the correct grazing regime required tomaintain a shorter turf structure for the breedingseason; and
• This species is vulnerable to disturbance of itsfeeding grounds or roost sites.
Curlew Numenius arquata
In the UK Curlew typically breeds on the moors andrough grasslands of the uplands though there are a fewsites in the lowlands where the species breeds onextensive areas of bog and wet-heath, and extensivewet rushy pastures and rough grasslands.
Key influences• Curlew are particularly sensitive to disturbance
during the breeding season;• In the grassland sites, traditional management such
as grazing is required to maintain an open swardwith good invertebrate population in the upper soilhorizons and vegetative layers; and
• Threats to the species include grasslandimprovement, cessation of pasture farming,improvements to the drainage regime andreplacement of late cuts for hay by more intensivesilage production.
< Section divider
This do
cumen
t was
with
drawn o
n 6 N
ovem
ber 2
017.

Species and habitats Guidance notes – Species Birds: Species descriptions 2.3.5
Environment Agency in partnership with Natural England and Countryside Council for Wales Understanding water for wildlife
Dunlin Calidris alpina
Dunlin is primarily a coastal species during winteringand passage movements. It is a breeding species of thepeatlands of the northern uplands and the coastalmachair grasslands of the Scottish Western Isles.Lowland wet grasslands are of lesser importance to thisspecies though it does occupy this habitat type at a fewcoastal locations.
Key influences• The species is vulnerable to habitat change in its
breeding grounds via afforestation, drainage ofcoastal marshes and developments at its keyestuarine wintering grounds; and
• The spread of the cord grass (Spartina anglica) hasdeprived dunlin of its favoured foraging habitat(open mudflats and low saltmarsh of the middle andupper shore).
Gadwall Anas strepera
and Pintail A. acuta
These ducks winter in the UK in internationallyimportant numbers but as a breeding species they arerather local and scarce, pintail in particular.
Adult gadwall are herbivorous, taking Glyceria, Juncus,Scirpus, Carex and submerged and floating pondweeds,Potamogeton, Myriophyllum, Elodea, Callitriche andRanunculus. Chicks are carnivorous in the first few weekstaking mainly insects from the water surface. Shallowlakes, ponds with adjacent marsh or rough grassland andslow rivers may be used.
During the winter, gadwall occupy more extensive openwaters of lakes, reservoirs and gravel pits. Unlike someother ducks and geese, this species rarely emergesfrom the cover of its marshland habitat to feed in opengrasslands.
Pintail nests in a variety of locations close to water inmarshes, lake shores, islets and periodically inundatedgrassland adjacent to large lakes and moorland pools.It is omnivorous, feeding preferentially on freshwaterinvertebrates in shallow waters during the summer,shifting towards a herbivorous diet in winter. Estuariesprovide the main wintering habitat for pintail thoughthe species also occurs in extensive wet grasslands andwashlands.
Key influences• Breeding gadwall require marshes with clear
eutrophic standing waters which provide a variety ofplants for food as low emergent and submergedspecies with taller reeds for cover;
• Threats to gadwall populations include disturbanceand water pollution; and
• The potential for developments at key estuarine sitesand loss of extensive inland wetland habitats arethreats to the status of the pintail.
Redshank Tringa totanus
While the majority of nesting birds in the UK are foundin coastal grazing marshes and saltmarshes, there are a number of key sites where the species continues tobreed in suitable extensive wet grasslands of river flood plains.
Key influences• Habitat requirements for redshank in wet grasslands
require a high water table with open pools andditches with a high water level (Ref. 13), grasslandsgrazed to produce a shorter (15 cm and lower) swardwith tussocks for nest concealment (Ref. 23);
• Inland sites have been lost to flood defence works,land drainage and agricultural intensification. Theseactivities have reduced soil wetness, leading tolosses in open water habitat and incorrect swardcharacteristics;
• Threats in the coastal locations to the redshankinclude drainage of grazing marshes, grasslandimprovement and conversion to arable (Ref. 12),developments on estuaries (Ref. 22);
• The spread of the cord grass Spartina anglica, whichis reducing foraging areas on the saltmarshes andadjacent mudflats in many southern estuaries, isalso a threat to the status of the redshank;
• Grazing regimes on saltmarshes affect nestingdensity. Light to moderately grazed marshes produceoptimum conditions (Ref. 15 & 16); and
• Severe weather leads to heavy mortality in redshanks(Ref. 14), a factor that can be exacerbated bydisturbance at the feeding grounds.
< Section divider
This do
cumen
t was
with
drawn o
n 6 N
ovem
ber 2
017.
Species and habitats Guidance notes – Species Birds: Species descriptions 2.3.5
Environment Agency in partnership with Natural England and Countryside Council for Wales Understanding water for wildlife
Ringed Plover Charadrius hiaticula
Both the wintering and breeding distribution of theringed plover is coastal with shingle beaches providingthe ideal nesting grounds. The machair grasslands inthe Scottish Western Isles also attract high numbersand similar short-cropped coastal grasslands andarable land close to the sea may also attract nestingbirds in England.
There are a few inland breeding locations for thisspecies, on gravel bars along the larger unmanagedriver reaches or on shingle “beaches” at reservoirs andgravel pits though these habitats are mainly thepreserve of the related and less common little-ringedplover. Threats principally concern disturbance fromrecreation and development at shingle beaches wherethe birds nest.
Shelduck Tadorna tadorna
Shelduck is primarily a coastal species of muddy shoresand estuaries, breeding on adjacent marshes andfarmland. There are a few inland breeding sites,particularly in Norfolk, and this trend may becontinuing. Nest sites include holes in old rabbitburrows, crevices in rocks or between boulders anddense bramble or gorse scrub. Feeding sites providingsurface invertebrates on wet sands and muds, insects,seaweeds, and grassland herbage are utilised.Wintering takes place on estuaries and shallowfreshwaters near the shore. Estuarine developments areconsidered to constitute the main potential threats tothe UK population.
Shoveler A. clypeata
Shoveler is well distributed mainly in the central andeastern counties of England, inhabiting marshes andshallow open eutrophic waters. The species is notablefor its specialised feeding technique, skimming smallinvertebrates, including zooplankton, and plant seedsfrom the water surface or shallow sediments (Ref. 8).Deeper, nutrient-rich waters may be used where thesurface layers have a high plankton population. Plantmaterial forms a greater part of the diet in winter andflooded river valleys can prove attractive at this time.Nesting takes place, often in the open by the water’sedge, or in taller clumps of sedge or similar vegetation.
Land drainage is thought to have considerably reducedpopulations in the past and may continue to pose apotential threat.
Teal A. crecca
and Wigeon A. penelope
Teal and wigeon winter in the UK in internationallyimportant numbers. Wigeon tends to have a coastaldistribution whereas teal also occurs in well vegetatedinland marshes. Relatively few wigeon breed in the UK,the population being mainly restricted uplands of thenorthern Pennines and the north of Scotland, mainly inupland neutral waters. Teal breed in greater numbersthroughout the UK, usually in secluded well-vegetatedand enclosed marshes, often with a partial cover ofscrub and trees.
Wigeon is almost entirely herbivorous and utilisesextensive coastal grazing marshes and washlands duringthe winter. They will also feed on arable stubble. Inlandreservoirs and gravel pits may also be used. Teal alsofrequent shallow estuaries in winter but will alsocontinue to winter in inland marshes.
Threats to the teal population include land drainageand loss of the shallow marshland habitat anddevelopments and disturbance at its shallow-watercoastal locations. Wintering populations of wigeon,with its lesser reliance on inland marshes, areconsidered to be less vulnerable to water-resourcemanagement issues.
< Section divider
This do
cumen
t was
with
drawn o
n 6 N
ovem
ber 2
017.

Species and habitats Guidance notes – Species Birds: Species descriptions 2.3.5
Environment Agency in partnership with Natural England and Countryside Council for Wales Understanding water for wildlife
Key referencesReference material has been derived from a variety of key publications such as Red Data Birds in Britain(NCC/RSPB 1990), the UK atlases for breeding and wintering birds (BTO 1986, 1993) and The Wet Grassland Guide(RSPB, ITE, EN, 1997). A literature search for more recent work within the last 10 years used the British Libraryfacility to scan key data bases such as Biological Abstracts, Life Sciences Collection, Environment Abstracts, andZoological Record. Additional information is available on certain web sites, in particular that of the RSPB andBritish Trust for Ornithology (BTO).
1. Andrews, J. & Kinsman, D. (1990). Gravel Pit Restoration for Wildlife. RSPB. Sandy, Bedfordshire, UK. (RSPBmanual with much useful background material on birds of open lowland freshwaters).
2. Ausden, M., Rowlands, A., Sutherland, W.J. & James, R. (2003). Diet of breeding Lapwing Vanellus vanellusand Redshank Tringa totanus on coastal grazing marsh and implications for habitat management. Bird Study 50: 285-293.
3. Beekman, J. H., van Eerden, M. R. & Dirksen, S. (1991). Bewick’s Swans Cygnus columbianus bewickii utilisingthe changing resource of Potamogeton pectinatus during the autumn in the Netherlands. In – Third IWRBInternational Swan Symposium, Oxford 1989. Eds. Sears, J. & Bacon. Wildfowl (Suppl. 1).
4. Bientema, A.J., Thissen, J.B., Tensen, D. & Visser, G. H. (1991). Feeding ecology of charadriiform chicks inagricultural grassland. Ardea 79, 31-44.
5. BTO (1986). The Atlas of Wintering Birds in Britain and Ireland. Compiled by P. Lack. T & AD Poyser Ltd. Calton,Staffordshire, UK.
6. BTO (1993). The New Atlas of Breeding Birds in Britain and Ireland 1988-1991. Compiled by D WingfieldGibbons, JB Reid, RA Chapman. T & AD Poyser Ltd. London, UK.
7. Green, R.E. (1996). The management of lowland wet grassland for breeding waders. Chief Scientists DirectorateNo.626, Nature Conservancy Council (JNCC) Peterborough UK.
8. Guillemain, M., Fritz, H. & Guillon, N. (2000). Foraging behaviour and habitat choice of wintering northernshoveler in a major wintering quarter in France. Waterbirds 23 (3) 355-363.
9. Hawke, C.J. & Hose, P.V. (1996). Reedbed Management for Commercial and Wildlife Interests. RSPB. Sandy,Bedfordshire, UK.
10. Hoeglund, J., Widem, F. Sutherland, W.J. & Nordenfors, H. (1998). Ruffs Philomachus pugnax and distributionmodels, can leks be regarded as patches? Oikos 82 (2) 370-376.
11. Mayhew, P. (1988). The energy intake of the European wigeon in winter. Ornis. Scand. 19, 217-223.
12. Milsom, T.P., Landton, S.D., Parkin, W.K., Peel, S., Bishop, J.D., Hart, J.D. & Moore, N.P. (2000). Habitat modelsof bird species’ distribution: an aid to the management of coastal grazing marshes. J. App. Ecol, 37 (2), 706-727.
13. Milsom, T.P., Hart, J.D., Parking, W.K. & Peel, S. (2002). Management of coastal grazing marshes for breedingwaders; the importance of suface topography and wetness. Biol. Cons. 103 (2) 199-207.
14. Mitchel, P.I., Scott, I. & Evans, P.R. (2000). Vulnerability to severe weather and regulation of body mass ofIcelandic and British redshank Tringa totanus. J. Avian Biol. 31 (4), 511-521.
15. Norris, K., Cook, T. O’ Dowd, B. & Durdin, C. (1997). The density of redshank Tringa totanus breeding on thesalt-marshes of the Wash in relation to habitat and it grazing management. J. App. Ecol. 34 (4), 999-1013.
16. Norris, K., Brindley, E., Cook, T., Babbs, S., Brown, C.F. & Yaxley, R. (1998). Is the density of redshank Tringatotanus nesting on salt-marshes in Great Britain declining due to changes in grazing management? J. App. Ecol. 35 (5) 621-634.
17. Norris, K. & Atkinson, P.W. (2000). Declining populations of coastal birds in Great Britain: victims of sea levelrise and climate change? Env. Reviews 8 (4), 303-323.
< Section divider
This do
cumen
t was
with
drawn o
n 6 N
ovem
ber 2
017.

Key references (cont.)18. Percival, S.M. & Percival, T. (1997). Feeding ecology of Barnacle geese on their spring staging grounds.Ecography 20 (5) 461-465.
19.Ravenscroft, N.O.M. & Beardall, C.H. (2003). The importance of freshwater flows over estuarine mudflats forwintering waders and wildfowl. Biological Conservation 113: 89-97.
20. Red Data Birds in Britain, (1990). Ed. by LA Batten, CJ Bibby, P Clement, GD Elliot & RF Porter. NCC and RSPB. T& AD Poyser, London.
21. Rees, E.C, Kirby, J.S. & Gliburn, A. (1997). Site selection by swans wintering in Britain and Ireland; theimportance of habitat and geographical location. Ibis 139 (2), 337-352.
22. Rehfisch M.M., Austin G.E., Clark N.A., Clarke R.T., Holloway S.J., Yates, M.G., Durel S., Eastwood J., GossCustard, J.D., Swetnam R. D. & West J. R. (2000). Predicting densities of wintering redshank Tringa totanus fromestuary characteristics; a method for assessing the likely impact of habitat change. Acta Ornithologica Warsaw 35(1), 25-32.
23. RSPB, English Nature & ITE (1997). The Wet Grassland Guide; managing floodplain and coastal wet grasslandfor wildlife. RSPB. Sandy, Bedfordshire, UK.
24. RSPB, NRA & RSNC (1994). The New Rivers and Wildlife Handbook. RSPB. Sandy, Bedfordshire, UK.
25. Tucker, G. M. & Heath, MF. (1994). Birds in Europe; their conservation status. Birdlife International, Cambridge, UK.
26. Tyler, G. (1994). Management of Reedbeds for Bitterns and Opportunities for Reedbed Creation. RSPBConservation Review 8, 57-62.
27. Vickery, J. & Gill, J. A. (1999). Managing grassland for wild geese in Britain: A review. Biological Conservation 89(1) 93-106.
28. Ysebaert, T., Meininger, P.L., Meire, P., Devos, K., Berrevoets, C.M., Strucker, R.C.W. & Kuijken, E. (2000).Waterbird Communities along the Estuarine Salinity Gradient of the Schelde Estuary, NW-Europe. Biodiversity andConservation 9: 1275-1296.
Supporting referencesRefer to the EN research Report No 359 for further information on habitat requirements for particular bird species.
Consideration of the Annex I habitat estuaries is required. Refer to this guidance note for further information.
Species and habitats Guidance notes – Species Birds: Species descriptions 2.3.5
Environment Agency in partnership with Natural England and Countryside Council for Wales Understanding water for wildlife
< Section divider
This do
cumen
t was
with
drawn o
n 6 N
ovem
ber 2
017.

2.4 Eco-hydrological guidelines forlowland wetland plant communitiesThe Agency document Eco-hydrological Guidelines forLowland Wetland Plant Communities contains a seriesof community-based descriptions of the hydrologicalregimes required by selected communities.
The descriptions put each community in context byproviding data on floristic composition, distribution,landscape situation and substratum. The main watersupply mechanisms and preferred hydrological,nutrient and management regimes are then covered.The descriptions conclude by providing guidance,under the heading ‘Implications for Decision Making’,on the vulnerability to change and restorability of eachcommunity and on knowledge gaps.
2.5 Other sources of informationOther on-going R&D of potential relevance to theseGuidelines includes:
• A joint funded project by the Agency and CEH; Theimpact assessment of wetlands -Focus on hydrologicaland hydrogeological issues. – A Scoping Study. Thisproject is ongoing but output will not be available forsome time. The project aims to identify assessmenttechniques for inland, largely groundwater fed,wetland systems. When this output becomesavailable it is likely to provide additional tools forreference in the Assessment Methods described inSection 4.
Species and habitats 2.4 – 2.5
Environment Agency in partnership with Natural England and Countryside Council for Wales Understanding water for wildlife
Other useful information can also be downloaded fromthe internet, with the following web sites providinguseful sources of data:
• The Environment Agency's Science R&D reports can beobtained from http://intranet.ea.gov/organisation/df/environment_protection/science/contents.htm)
• English Nature's publications and Science Series canbe found at http://www.english-nature.org.uk/pubs/publication/pub_search.asp
• CCW’s Publications and Research section can befound at http://www.ccw.gov.uk/reports/index.cfm?Action=ViewRecent&lang=en
Useful information may also be obtained from relevantexperts and it is recommended that discussions areheld with local conservation officers from NaturalEngland or CCW and the Agency to ensure the correctapplication of relevant information.
< Section divider
This do
cumen
t was
with
drawn o
n 6 N
ovem
ber 2
017.
3.1 Introduction
3.2 Hydro-ecological domains
3.2.1 Fresh surface waters domains
3.2.2 Freshwater wetlands domain
3.2.3 Marine/coastal domain
3.3 Linking hydro-ecological domainswith hydrological regimes
3.4 Linking hydrological regimes to the potential source ofimpacts/effects
Hydro-ecologicaldomains andhydrologicalregimes
3
< Main contents
This do
cumen
t was
with
drawn o
n 6 N
ovem
ber 2
017.

Hydro-ecological domains and hydrological regimes 3.1 – 3.2
Environment Agency in partnership with Natural England and Countryside Council for Wales Understanding water for wildlife
3.1 IntroductionThis section sets out a framework to aid in thehydrological characterisation and conceptualisation forsites specifically supporting European interest features(species and/or habitats) by developing the concept ofthe source – pathway – receptor links to support theevaluation of impacts and their ecological effects.
The framework identifies a series of hydro-ecologicaldomains (and sub-domains) enabling sites to becategorised in accordance with their ascribed interestfeatures and with due regard to the hydrologicalsystems/processes (particularly those providingfreshwater supplies) believed to support them. Withinthis framework the main hydrological regimes (groundwater, riverine etc) can be readily identified whichprovide the pathway along which activities that give rise to potential impacts can be conveyed to the site of interest (receptor). Finally, a whole range ofpossible activities (sources of potential impact) arebriefly considered.
3.2 Hydro-ecological domainsFor the purpose of these guidelines sites should, wherepossible, be characterised (or grouped) into a series ofhydro-ecological domains and sub-domains. Thedomains suggested are not intended to form a new (orvaried) hydrologically based classification system forsites with existing classifications such as thoseproposed by D J Gilvear and R J McInnes (1994) and B DWheeler and S C Shaw (1995). The purpose of thedomains proposed in these guidelines is intended tohelp characterise sites in terms of the key freshwaterregimes, which may potentially be impacted byconsented activities which come under the control ofthe Agency’s Water Resource function, thus modifyingany or all of the:
• Supply of freshwater to the site (required at aparticular quantity and/or quality) or otherwiseneeded to abate the intrusion of alternative watersupplies with unsuitable quality characteristics;
• Water level (surface or ground water) regime at thesite. Here it should be noted that although at somesites the dominant freshwater supply may comedirectly from rainfall, the key pathway by which
3. Hydro-ecological domains andhydrological regimes
consented activities can affect the site is throughregional (or local) ground water (or surface water)regimes;
• Substrate characteristics (material, size, depth,sorting and interstitial water quality) for the site.
All wetland sites receive direct rainfall and this supplyof water is of importance to a greater or lesser extentdepending on the site. For some sites, direct rainfallmay provide the predominant supply and such sites arereferred to as having an ombotrophic regime. In thisguidance, sites which are essentially Ombrotrophic, butwhich do not rely upon a ground water (or surfacewater) regime which extends beyond the site, are notconsidered further. The reason for this is that waterabstraction licences cannot fundamentally impactrainfall regimes. Rain water quality can be influenced byconsented emissions to atmosphere which in turn canimpact the hydrochemistry and the condition of certainsites such as raised bogs, blanket bogs and sites withSphagnum recurvum (such as the Cheshire Meres andMosses). Additionally, and on a global scale, certainemissions to atmosphere may also be giving rise toeffects on climate too. However, for the purpose ofthese guidelines consideration will be limited toimpacts/effects on sites resulting from sources(consented activities) which depend upon ahydrological (ground water or surface water) pathwayrather than an atmospheric pathway.
When characterising and assessing impacts/effects onsites it is important to consider both the natural andanthropogenic (man-made) factors which govern them.In the broadest sense the fundamental naturalinfluences on a site stem from climate and geology(both past and present) which govern their form (size,shape and topography), hydrology, marine influence (if relevant) and ecology. Anthropogenic influences onsites can be wide ranging such as:
• Artificial creation of habitats such as reservoirs,canals, quarry lakes, controlled washlands, tidalbarrages and reclaimed salt marshes.
• Management of habitats through localised schemesto control (or optimise):– water quantity and/or quality; – influences on site flora/fauna from predation,
invasion, grazing and harvesting (or cutting);
< Section divider
This do
cumen
t was
with
drawn o
n 6 N
ovem
ber 2
017.
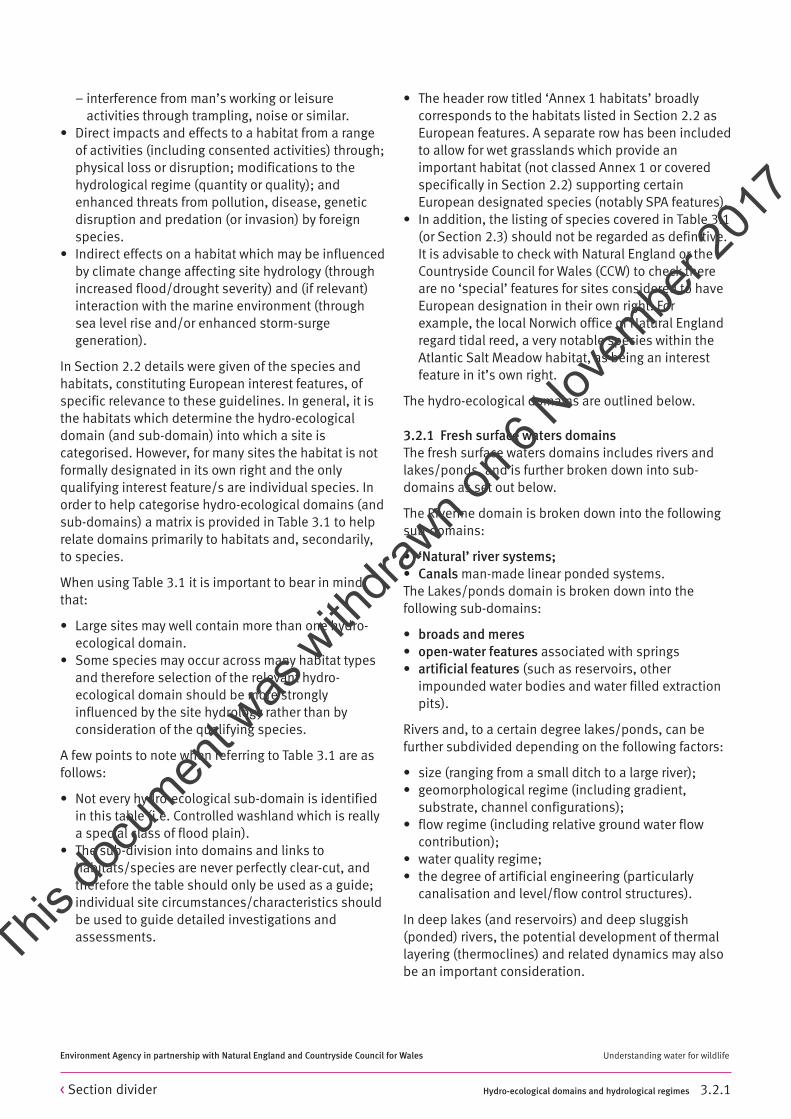
Hydro-ecological domains and hydrological regimes 3.2.1
Environment Agency in partnership with Natural England and Countryside Council for Wales Understanding water for wildlife
– interference from man’s working or leisureactivities through trampling, noise or similar.
• Direct impacts and effects to a habitat from a rangeof activities (including consented activities) through;physical loss or disruption; modifications to thehydrological regime (quantity or quality); andenhanced threats from pollution, disease, geneticdisruption and predation (or invasion) by foreignspecies.
• Indirect effects on a habitat which may be influencedby climate change affecting site hydrology (throughincreased flood/drought severity) and (if relevant)interaction with the marine environment (throughsea level rise and/or enhanced storm-surgegeneration).
In Section 2.2 details were given of the species andhabitats, constituting European interest features, ofspecific relevance to these guidelines. In general, it isthe habitats which determine the hydro-ecologicaldomain (and sub-domain) into which a site iscategorised. However, for many sites the habitat is notformally designated in its own right and the onlyqualifying interest feature/s are individual species. Inorder to help categorise hydro-ecological domains (andsub-domains) a matrix is provided in Table 3.1 to helprelate domains primarily to habitats and, secondarily,to species.
When using Table 3.1 it is important to bear in mindthat:
• Large sites may well contain more than one hydro-ecological domain.
• Some species may occur across many habitat typesand therefore selection of the relevant hydro-ecological domain should be more stronglyinfluenced by the site hydrology rather than byconsideration of the qualifying species.
A few points to note when referring to Table 3.1 are asfollows:
• Not every hydro-ecological sub-domain is identifiedin this table (i.e. Controlled washland which is reallya special class of flood plain).
• The sub-division into domains and links tohabitats/species are never perfectly clear-cut, andtherefore the table should only be used as a guide;individual site circumstances/characteristics shouldbe used to guide detailed investigations andassessments.
• The header row titled ‘Annex 1 habitats’ broadlycorresponds to the habitats listed in Section 2.2 asEuropean features. A separate row has been includedto allow for wet grasslands which provide animportant habitat (not classed Annex 1 or coveredspecifically in Section 2.2) supporting certainEuropean designated species (notably SPA features).
• In addition, the listing of species covered in Table 3.1(or Section 2.3) should not be regarded as definitive.It is advisable to check with Natural England or theCountryside Council for Wales (CCW) to check thereare no ‘special’ features for sites considered to haveEuropean designation in their own right. Forexample, the local Norwich office of Natural Englandregard tidal reed, a very notable species within theAtlantic Salt Meadow habitat, as being an interestfeature in it’s own right.
The hydro-ecological domains are outlined below.
3.2.1 Fresh surface waters domainsThe fresh surface waters domains includes rivers andlakes/ponds, and is further broken down into sub-domains as set out below.
The Riverine domain is broken down into the followingsub-domains:
• ‘Natural’ river systems;• Canals man-made linear ponded systems.The Lakes/ponds domain is broken down into thefollowing sub-domains:
• broads and meres• open-water features associated with springs• artificial features (such as reservoirs, other
impounded water bodies and water filled extractionpits).
Rivers and, to a certain degree lakes/ponds, can befurther subdivided depending on the following factors:
• size (ranging from a small ditch to a large river);• geomorphological regime (including gradient,
substrate, channel configurations);• flow regime (including relative ground water flow
contribution);• water quality regime; • the degree of artificial engineering (particularly
canalisation and level/flow control structures).
In deep lakes (and reservoirs) and deep sluggish(ponded) rivers, the potential development of thermallayering (thermoclines) and related dynamics may alsobe an important consideration.
< Section divider
This do
cumen
t was
with
drawn o
n 6 N
ovem
ber 2
017.

Hydro-ecological domains and hydrological regimes 3.2.2 – 3.3
Environment Agency in partnership with Natural England and Countryside Council for Wales Understanding water for wildlife
3.2.2 Freshwater wetlands domainThe freshwater wetlands domain includes bogs, mires,swamps, marshes, fens and wet meadows. Vegetationcan vary from reed and sedge to carr (woodland), and in‘land managed’ areas may also include wet grazingmeadows. This domain can be further broken down intosub-domains including:
• Upland valley mires/flushes typically upland valleysites are ground water influenced and fed by eitherground water or rainwater.
• Lowland valley fens typically lowland valley fens aredominantly ground water fed and influenced.
• Lowland fens and marshes many lowland fens andmarshes are ground water (but some are surfacewater) fed and/or influenced.
• Natural riparian floodplains natural riparianfloodplains are typically surface water fed (underflood conditions) and influenced but some are alsoground water influenced.
• Controlled washlands controlled washlands (notindividually identified in Table 3.1) are typicallysurface water fed (under flood conditions) andinfluenced but some are also ground waterinfluenced.
• Transitional wetlands transitional wetlands can existin a wide range of hydro-ecological sub-domains andhabitats. Note; this is not regarded as a separatehydro-ecological sub-domain.
For reasons given previously, sites which essentiallyrely upon direct rainfall input (i.e. which have anombotrophic regime) are not detailed in theseguidelines.
Within freshwater wetland domains and in particularthose sub-domains fed by ground water, thehydrochemistry of the ground water, can be animportant factor which further influences sub-domaincharacteristics and resulting habitats and species atsites. The mineral content is important in governingwhether ground waters are base rich, neutral or acidic.Further, the redox potential for ground waters flowingthrough the site may be influenced by the ‘flushing’regime at a particular site. Additionally, if groundwaters are enriched with nutrients this can impact thesite hydrochemistry and effect ecology.
3.2.3 Marine/coastal domainThe marine/coastal domain can include an array oftransition elements. Typically, from sea to shoreline,this domain can be broken down into the following sub-domains:
• Sub-tidal/marine sites that are permanentlyinundated.
• Inter-tidal including mud/sand banks, through tosalt marsh and possibly coastal lagoons.
• Extreme tidal including salt meadow and somecoastal lagoons.
• Humid dune slacks typically seasonal pondssupplied by rainfall and sometimes also influencedby a shallow ground water table regime.
• Marine/coastal transition this is not classed as ahydro-ecological sub-domain in it’s own right but theterm is often used to describe a range of habitatswhich can include an array of coastal/marine sub-domains referred to above. This may also incorporatehabitats associated with reclaimed coastal marshesin which an ‘artificial’ fresh or brackish water regimesare maintained.
• Estuarine/shallow embayment riverine/marineinterfaces give rise to estuarine, and occasionallylarge shallow embayment, regimes.
Along some inter-tidal zones the discharge (as springsor seeps) of fresh ground water may give rise to locallyspecial regimes. Within salt marsh zones these cansupport tidal reed beds, and in mud/sand bank maysupport specialist invertebrate communities.
At the coast there may be a sharp transition betweenthe saline and freshwater regimes introduced throughartificial drainage and coastal sea defenceschemes/management. This can allow artificialmaintenance of landward freshwater wetlands andlakes immediately adjacent to the coastal sea defence.Similarly distinct saline/freshwater regimes frequentlyoccur on the boundaries between rivers and estuarieswhere tidal control structures are incorporated.
3.3 Linking hydro-ecological domainswith hydrological regimesIn characterising the hydro-ecological domain or sub-domain at a site (or part of a site) Table 3.2 can be usedto help identify the likely broad hydrological regimeswhich could govern supply of and/or influence theregime of the fresh (or brackish) systems at the domain.This table is merely intended as a guide and should beused with some degree of caution, with certain pointsto note including:
• It is expected that riverine or lake/pond sub-domainswill probably be influenced by a surface water regimeand more often than not this will provide the keypathway. However, in certain instances these sub-domains can also be equally (or more) influenced bya ground water regime and hence this regime isidentified as a possible pathway for animpact/effect.
< Section divider
This do
cumen
t was
with
drawn o
n 6 N
ovem
ber 2
017.

Hydro-ecological domains and hydrological regimes 3.3
Environment Agency in partnership with Natural England and Countryside Council for Wales Understanding water for wildlife
• Where it is indicated that a link is ‘unlikely’ thisshould not be interpreted as impossible. For exampleit is occasionally possible for certain fresh surfacewater or freshwater wetland domains, located near tothe coast, to receive some tidal influences, althoughTable 3.2 indicates this as unlikely.
• The table is no substitute for site-specifichydrological conceptualisation (see Section 4Method Summaries). The hydrological regimes aretoo broad to identify key influences and the actualnature of the potential mechanisms operating at aparticular site. Therefore, as part of the overallhydrological conceptualisation for a site the range ofpossible hydrological regimes need to be examinedin more detail.
Figure 3.1 provides a diagram with a hierarchy ofhydrological regimes (from broad to detailed) whichcould be used to help determine the level of detail thatmay be required for adequate hydrologicalconceptualisation of a site. The general emphasis inFigure 3.1 is given to quantity related components ofthe main hydrological regimes (such as flow and level).In general, little detail is provided on the range of waterquality considerations that may be required for sitecharacterisation and assessment as this is generallyconsidered outside the scope of these guidelinesalthough further information can be obtained fromWork Instruction (95_01) – Habitats Directive TechnicalGuidance for Water Quality: Review of Permissions toDischarge and New Applications. In addition, furtherguidance will become available when output fromongoing R&D projects become available such as:
• Environment Agency R&D; Establishing PracticalMeasures for Assessment of eutrophication risks andImpacts in Estuaries. (At the time of going to pressfull details on this R&D project were not available).
• Environment Agency R&D (P4-083(10)); AtmosphericDeposition Threat to Freshwater Habitats Sites; RiskScreening and Assessment based on FreshwaterCritical Loads. Project being undertaken by ENSIS (atUniversity College of London) and CEH and is due forcompletion in 2004.
Identification of geomorphological components for themain hydrological regimes is limited – this may need tobe considered on a site-specific basis.
Table 3.3 sets out the likely links between moredetailed (or intermediate) hydrological regimes anddomains. For example, Table 3.2 shows a probable linkbetween the broad surface water hydrological regimeand the estuaries and embayments hydro-ecologicalsub-domain. However, when the more ‘detailed’subdivision of hydrological regimes is considered inTable 3.3, only flow and quality are shown as probablelinks whilst the level and geomorphology regimes areindicated as possible links.
< Section divider
This do
cumen
t was
with
drawn o
n 6 N
ovem
ber 2
017.

Hydro-ecological domains and hydrological regimes 3.3
Environment Agency in partnership with Natural England and Countryside Council for Wales Understanding water for wildlife
Figure 3.1 Hydrological regimes diagram
Broad regime
Ground water
Quantity
Quality
Surface water
Quantity
Quality
Geomorphology
Tidal regime
Quality
Geomorphology
Level
Flow
Level
Flow
Sediment load
Channel (form)
Substrate
Flood plain
Tidal water
Neap flow/level
Spring flow/level
Surge flow/level
Sediment load
Substrate
Fore/near shorecharacteristics
Intermediate regime Detailed regime
Note: Water quality considerations arepotentially numerous and commonly includeevaluation of the following:
• Salinity/mineralisation• Sanitary/pH• Nutrients• Specific pollutants/contaminants• REDOX• Biologically based classifications
< Section divider
This do
cumen
t was
with
drawn o
n 6 N
ovem
ber 2
017.

Hydro-ecological domains and hydrological regimes 3.4
Environment Agency in partnership with Natural England and Countryside Council for Wales Understanding water for wildlife
3.4 Linking hydrological regimes to thepotential source of impacts/effectsIn this sub-section further details are provided on thesource – pathway – receptor links. The source –pathway – receptor mechanism involves:
• Source; an activity (often consented such as anabstraction) which gives rise to a possible impact, inthis case hydrological, and related effect/s.
• Pathway; a hydrological regime in which an impactcan be transmitted (such as in an aquifer system asrelevant to a ground water regime).
• Receptor; the hydro-ecological domain (or sub-domain) where a hydrological impact, underconsideration, may be received. Translation of thisimpact into ecological effect, and significance, at thefeature will depend upon the magnitude of theimpact and the sensitivity of the key interest featuresto these impacts.
Table 3.4 highlights the general likelihood that variousconsented activities (sources) may act with differenthydrological regimes providing a pathway by whichimpacts/effects may occur. The consented activity ofprimary concern in these guidelines involves licensedwater abstractions. However, there is a requirement (setout within the habitats regulations) to assess theimpact of abstraction ‘in-combination’ with activitiesregulated by other Environment Agency functions andnon Agency activities. These activities may also giverise to potential hydrological impacts/effects, but mayalso have other effects not related to hydrology. Thesealso need to be borne in mind and considered when ‘in-combination’ assessments are undertaken.
Within the Agency’s water resources function otheractivities that will probably be managed by this functionbut may be consented, wholly or partly, by a separateAgency function, include:
• artificial recharge and Aquifer Storage & Recovery(ASR) schemes;
• raw water transfers; and • major impoundments (construction/installation
only).
Other Agency functions that have a consenting, or someother regulatory, role which may give rise to potentialhydrological impacts/effects, via the hydrologicalpathway, include:
• Water quality discharge consents usually prescribedfor treated effluent discharge activities. The mainimpact consideration from such activities is normallyon water quality in the receiving water.
• Integrated Pollution Control (IPC) and RadioActiveSubstances (RAS) consents involving discharge towater. The main impact consideration from suchactivities is normally on water quality in the receivingwater. Here it should be noted that those IPCconsents involving emissions to atmosphere and inparticular those which may pollute rainfall (i.e. causerain acidification) and impact European sites areconsidered to have an atmospheric rather thanhydrological pathway.
• Flood defence and land drainage activities. Majorinland schemes can typically give rise to significantimpacts on the flow, level and geomorphologicalregimes of affected rivers whilst sea defenceschemes can give comparable impacts to the tidalwater regime. It should be noted that otherAuthorities, in addition to the Environment Agency,also have responsibility for flood defence anddrainage matters and most notably these includeInternal Drainage Boards and Local Authorities.
• Major navigation schemes can give rise to significantimpacts on the flow, level and geomorphologicalregimes of affected rivers and tidal waters. Whilst theEnvironment Agency are the Navigation Authority forcertain inland waterways (mainly selected navigablerivers), the major Authority is British Waterways.Other small-scale regulators of inland water includelocalised bodies such as the Middle LevelCommissioners. British Waterways responsibilityalso extends to some navigable tidal waters, butmany of these are regulated by separate HarbourAuthorities while others are the responsibility of theLocal Authority.
• Waste management, and in particular landfilllicensing, is regulated by the Environment Agency.Poorly designed or operated landfill sites can impacton the ground water (or surface water) qualityregimes. Another form of waste management, whichmay be hydrologically significant, is the dumping ofdredged sediments to tidal waters. Such activitiesare predominantly undertaken to maintainnavigation channels (these are generally regulatedby DEFRA). Where dredging is undertaken in river (ordrainage) channels to maintain flood conveyancecapacities (the Environment Agency (or appropriateDrainage Authority) will have managementresponsibility for such works. Where these worksinvolve deposition adjacent to channel dredging noother authorities are normally involved but if suchsediment is disposed of in tidal waters regulation byDEFRA may apply.
< Section divider
This do
cumen
t was
with
drawn o
n 6 N
ovem
ber 2
017.

• Water Level Management Plans are regulated byDEFRA but many plans, particularly those involving astrategic approach to water resource management,have been formulated and may also be operated,monitored or co-ordinated by the EnvironmentAgency. Plans compiled by the Environment Agencyinclude those for the River Avon cSAC/SPA inHampshire.
The most notable non Agency consented activities (orallied management) which may give rise to potentialhydrological impacts/effects include:
• Site management activities regulated by NaturalEngland and the Countryside Council for Wales.
• Nearby inland mining and quarrying activities,regulated by County Councils or Metropolitan/UnitaryAuthorities concerning mineral extraction (or the CoalAuthority concerning coal mining), may involve de-watering activities which can potentially impact bothground water and surface water regimes. Marineaggregate extractions, (undertaken both forconventional aggregate use and beach nourishmentschemes), may potentially impact tidal water regimesand these activities are regulated by the CrownEstates.
• Major planning development including; residential;commercial; industrial; transport infrastructure; andmajor pipelines can all lead to potential hydrologicalimpacts. Such developments involve a range ofregulating authorities such as Local, Metropolitan,County, Highways and Rail Authorities.
• Good Agricultural Practice and comparablerequirements for aquaculture activities are theresponsibility (in terms of formulation andimplementation) of DEFRA. Inappropriate practicescan impact both ground water and/or surface waterquality regimes.
Hydro-ecological domains and hydrological regimes 3.4
Environment Agency in partnership with Natural England and Countryside Council for Wales Understanding water for wildlife
< Section divider
This do
cumen
t was
with
drawn o
n 6 N
ovem
ber 2
017.

Annex 1 habitat can straddle hydro-ecological sub-domains
Hydro-ecological domains and hydrological regimes Table 3.1 Species: Habitats; hydrological domains matrix 3.4
Environment Agency in partnership with Natural England and Countryside Council for Wales Understanding water for wildlife
Table 3.1 Species: habitats; hydrological domains matrixHydro-ecological domain ‘boundary’Hydro-ecological sub-domain ‘boundary’
Hyd
ro-e
colo
gica
ldom
ains
Mar
ine/
Coas
talS
ites
(MCS
)
Hyd
ro-e
colo
gica
lsub
dom
ains
Estu
arie
s&
em
baym
ents
Inte
rtid
alEx
trem
e ti
dal
Dun
es
Sub
hab
itat
sS
ubti
dal/
mar
ine
& in
tert
idal
tran
siti
onIn
tert
idal
Dun
es/i
nlan
d ha
loph
ytic
Bro
ad h
abit
ats
Coas
tal&
hal
ophy
tic
Dun
es
Ann
ex1
habi
tats
Estu
arie
sLa
rge
shal
low
M
ud/s
and-
Colo
nisi
ngSp
artin
aCo
asta
lA
tlant
icsa
ltIn
land
sal
tH
umid
dun
eem
baym
ants
flats
mud
/san
dsw
ard
lago
ons
mea
dow
mea
dow
slac
ks
Sub
cat
egor
y(n
on a
nnex
1 ha
bita
ts)
Inve
rteb
rate
Gey
er’s
who
rlsn
ail
Nar
row
mou
thed
who
rlsn
ail
✔✔
Roun
d m
outh
ed w
horl
snai
l
Des
mou
lin’s
who
rlsn
ail
Fres
hwat
er p
earl
mus
sel
Sou
ther
n da
mse
lfly
Mar
sh fr
itill
ary
butt
erfly
Whi
te-c
law
ed c
rayf
ish
Ram
shor
n sn
ail
Fish
er’s
estu
arin
e m
oth
✔
Fish
Sea
lam
prey
✔✔
Bro
okla
mpr
ey
Rive
r lam
prey
✔
Alli
ssh
ad✔
Twai
te s
had
✔
Atla
ntic
salm
on✔
Bul
lhea
d
Spin
ed lo
ach
Amph
ibia
n
Gre
atcr
este
d ne
wt
Mam
mal
Bar
bast
elle
bat
Ott
er✔
Plan
t
Sle
nder
gre
en-f
eath
er m
oss
Peta
lwor
t✔
Mar
sh s
axifr
age
Floa
ting
wat
er p
lant
ain
Sho
re d
ock
✔
Fen
orch
id✔
Cree
ping
mar
shw
ort
Bir
d✔
✔✔
✔✔
✔✔
✔✔
< Section divider
This do
cumen
t was
with
drawn o
n 6 N
ovem
ber 2
017.

Hydro-ecological domains and hydrological regimes Table 3.1 Species: Habitats; hydrological domains matrix 3.4
Environment Agency in partnership with Natural England and Countryside Council for Wales Understanding water for wildlife
Table 3.1 Species: habitats; hydrological domains matrix continuedAnnex 1 habitat can straddle hydro-ecological sub-domainsHydro-ecological domain ‘boundary’Hydro-ecological sub-domain ‘boundary’
Hyd
ro-e
colo
gica
ldom
ains
Fres
hwat
er S
urfa
ce W
ater
s(F
SW
)
Hyd
ro-e
colo
gica
lsub
dom
ains
Riv
erin
e (&
lake
s/po
nds)
Lake
s/po
nds
Sub
hab
itat
sR
iver
ine
Riv
erin
e an
d la
kes/
pond
sLa
kes/
pond
s
Bro
ad h
abit
ats
Fres
hwat
ers
Ann
ex1
habi
tats
Plai
n to
mon
tane
Har
d ol
igo-
Olig
otro
phic
wat
ers
Olig
o-m
esot
roph
icN
atur
aleu
trop
hic
Nat
ural
Med
iter
rane
an
wat
erco
urse
sm
esot
roph
ic(m
ainl
yac
idic
flow
ing
wat
ers)
stan
ding
wat
ers
lake
sdy
stro
phic
Tem
p. p
onds
(low
land
mes
otro
phic
)w
ater
s(s
tand
ing/
flow
ing)
lake
s
Sub
cat
egor
y(n
on a
nnex
1 ha
bita
ts)
Inve
rteb
rate
Gey
er’s
who
rlsn
ail
Nar
row
mou
thed
who
rlsn
ail
Roun
d m
outh
ed w
horl
snai
l
Des
mou
lin’s
who
rlsn
ail
✔✔
Fres
hwat
er p
earl
mus
sel
✔✔
Sou
ther
n da
mse
lfly
✔✔
Mar
sh fr
itill
ary
butt
erfly
Whi
te-c
law
ed c
rayf
ish
✔✔
Ram
shor
n sn
ail
✔✔
✔
Fish
er’s
estu
arin
e m
oth
Fish
Sea
lam
prey
✔
Bro
okla
mpr
ey✔
✔✔
Rive
r lam
prey
✔
Alli
ssh
ad✔
Twai
te s
had
✔✔
Atla
ntic
salm
on✔
Bul
lhea
d✔
✔✔
✔
Spin
ed lo
ach
✔
Amph
ibia
n
Gre
atcr
este
d ne
wt
✔✔
Mam
mal
Bar
bast
elle
bat
Ott
er✔
✔✔
✔✔
✔✔
Plan
t
Sle
nder
gre
en-f
eath
er m
oss
Peta
lwor
t
Mar
sh s
axifr
age
Floa
ting
wat
er p
lant
ain
✔✔
✔
Sho
re d
ock
Fen
orch
id
Cree
ping
mar
shw
ort
Bir
d✔
✔✔
✔✔
✔✔
< Section divider
This do
cumen
t was
with
drawn o
n 6 N
ovem
ber 2
017.
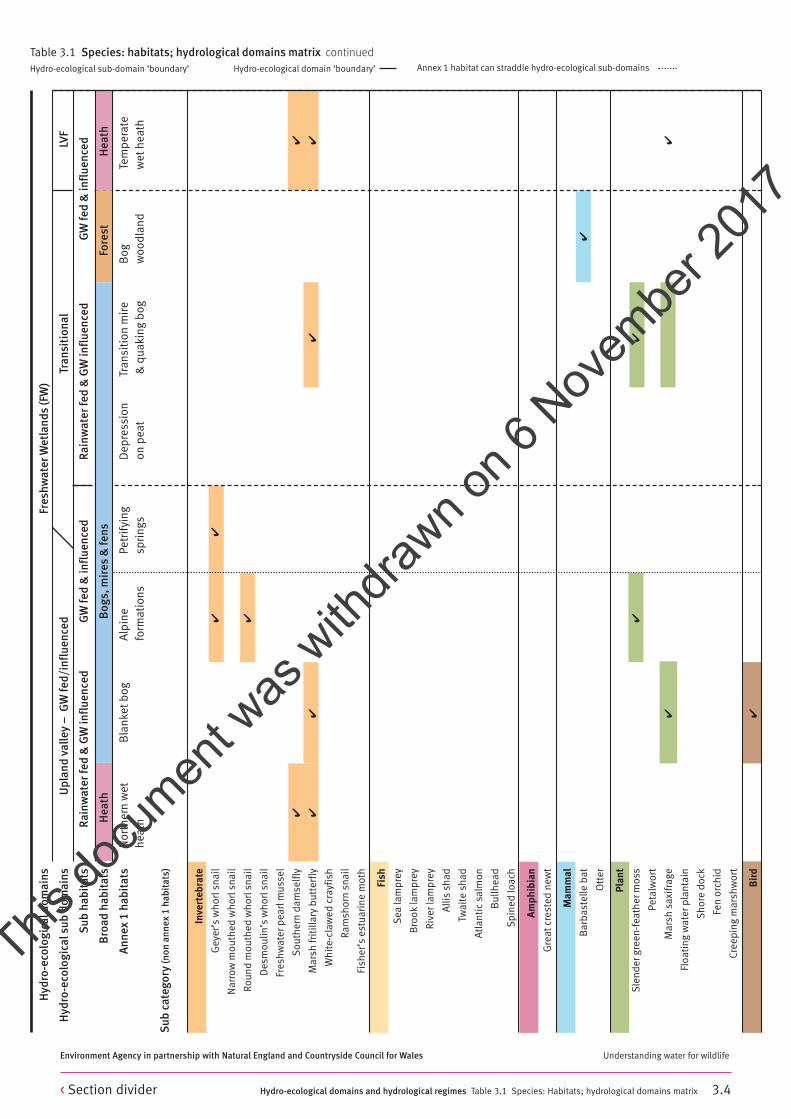
Hydro-ecological domains and hydrological regimes Table 3.1 Species: Habitats; hydrological domains matrix 3.4
Environment Agency in partnership with Natural England and Countryside Council for Wales Understanding water for wildlife
Table 3.1 Species: habitats; hydrological domains matrix continuedAnnex 1 habitat can straddle hydro-ecological sub-domainsHydro-ecological domain ‘boundary’Hydro-ecological sub-domain ‘boundary’
Inve
rteb
rate
Gey
er’s
who
rlsn
ail
✔✔
Nar
row
mou
thed
who
rlsn
ail
Roun
d m
outh
ed w
horl
snai
l✔
Des
mou
lin’s
who
rlsn
ail
Fres
hwat
er p
earl
mus
sel
Sou
ther
n da
mse
lfly
✔✔
Mar
sh fr
itill
ary
butt
erfly
✔✔
✔✔
Whi
te-c
law
ed c
rayf
ish
Ram
shor
n sn
ail
Fish
er’s
estu
arin
e m
oth
Fish
Sea
lam
prey
Bro
okla
mpr
ey
Rive
r lam
prey
Alli
ssh
ad
Twai
te s
had
Atla
ntic
salm
on
Bul
lhea
d
Spin
ed lo
ach
Amph
ibia
n
Gre
atcr
este
d ne
wt
Mam
mal
Bar
bast
elle
bat
✔
Ott
er
Plan
t
Sle
nder
gre
en-f
eath
er m
oss
✔✔
Peta
lwor
t
Mar
sh s
axifr
age
✔✔
Floa
ting
wat
er p
lant
ain
Sho
re d
ock
Fen
orch
id
Cree
ping
mar
shw
ort
Bir
d✔
Hyd
ro-e
colo
gica
ldom
ains
Fres
hwat
er W
etla
nds
(FW
)
Hyd
ro-e
colo
gica
lsub
dom
ains
Upl
and
valle
y–
GW
fed/
infl
uenc
edTr
ansi
tion
alLV
F
Sub
hab
itat
sR
ainw
ater
fed
& G
Win
flue
nced
GW
fed
& in
flue
nced
Rai
nwat
er fe
d &
GW
infl
uenc
edG
Wfe
d &
infl
uenc
ed
Bro
ad h
abit
ats
Hea
thB
ogs,
mir
es&
fens
Fore
stH
eath
Ann
ex1
habi
tats
Nor
ther
n w
etB
lank
etbo
gA
lpin
ePe
trif
ying
Dep
ress
ion
Tran
siti
on m
ire
Bog
Te
mpe
rate
heat
hfo
rmat
ions
spri
ngs
on p
eat
& q
uaki
ng b
ogw
oodl
and
wet
heat
h
Sub
cat
egor
y(n
on a
nnex
1 ha
bita
ts)
< Section divider
This do
cumen
t was
with
drawn o
n 6 N
ovem
ber 2
017.
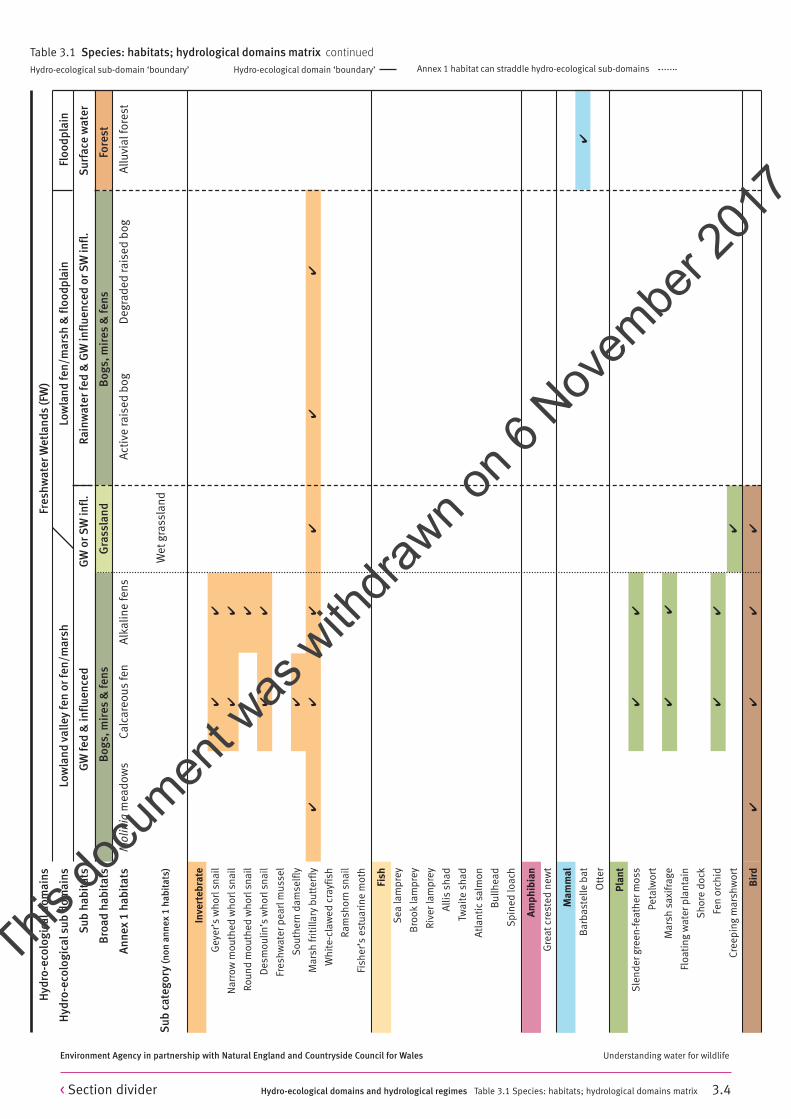
Hydro-ecological domains and hydrological regimes Table 3.1 Species: habitats; hydrological domains matrix 3.4
Environment Agency in partnership with Natural England and Countryside Council for Wales Understanding water for wildlife
Table 3.1 Species: habitats; hydrological domains matrix continuedAnnex 1 habitat can straddle hydro-ecological sub-domainsHydro-ecological domain ‘boundary’Hydro-ecological sub-domain ‘boundary’
Inve
rteb
rate
Gey
er’s
who
rlsn
ail
✔✔
Nar
row
mou
thed
who
rlsn
ail
✔✔
Roun
d m
outh
ed w
horl
snai
l✔
Des
mou
lin’s
who
rlsn
ail
✔✔
Fres
hwat
er p
earl
mus
sel
Sou
ther
n da
mse
lfly
✔
Mar
sh fr
itill
ary
butt
erfly
✔✔
✔✔
✔✔
Whi
te-c
law
ed c
rayf
ish
Ram
shor
n sn
ail
Fish
er’s
estu
arin
e m
oth
Fish
Sea
lam
prey
Bro
okla
mpr
ey
Rive
r lam
prey
Alli
ssh
ad
Twai
te s
had
Atla
ntic
salm
on
Bul
lhea
d
Spin
ed lo
ach
Amph
ibia
n
Gre
atcr
este
d ne
wt
Mam
mal
Bar
bast
elle
bat
✔
Ott
er
Plan
t
Sle
nder
gre
en-f
eath
er m
oss
✔✔
Peta
lwor
t
Mar
sh s
axifr
age
✔✔
Floa
ting
wat
er p
lant
ain
Sho
re d
ock
Fen
orch
id✔
✔
Cree
ping
mar
shw
ort
✔
Bir
d✔
✔✔
✔
Hyd
ro-e
colo
gica
ldom
ains
Fres
hwat
er W
etla
nds
(FW
)
Hyd
ro-e
colo
gica
lsub
dom
ains
Low
land
val
ley
fen
or fe
n/m
arsh
Low
land
fen/
mar
sh &
floo
dpla
inFl
oodp
lain
Sub
hab
itat
sG
Wfe
d &
infl
uenc
edG
Wor
SW
infl
.Ra
inw
ater
fed
& G
Win
flue
nced
or S
Win
fl.
Sur
face
wat
er
Bro
ad h
abit
ats
Bog
s, m
ires
& fe
nsG
rass
land
Bog
s, m
ires
& fe
nsFo
rest
Ann
ex1
habi
tats
Mol
inia
mea
dow
sCa
lcar
eous
fen
Alk
alin
e fe
nsA
ctiv
e ra
ised
bog
D
egra
ded
rais
ed b
og
Allu
vial
fore
st
Sub
cat
egor
y(n
on a
nnex
1 ha
bita
ts)
Wet
gras
slan
d
< Section divider
This do
cumen
t was
with
drawn o
n 6 N
ovem
ber 2
017.

Hydro-ecological domains and hydrological regimes Table 3.2 Linking hydro-ecological sub-domains and broad hydrological regimes 3.4
Environment Agency in partnership with Natural England and Countryside Council for Wales Understanding water for wildlife
Infl
uenc
e/im
pact
key
Prob
able
Poss
ible
Unl
ikel
y
Gro
und
wat
er
Surf
ace
wat
er
Tida
lwat
er
Fres
h S
urfa
ce W
ater
sFr
esh
Wat
er W
etla
nds
Mar
ine/
coas
tal
Rive
rine
Lake
s/U
plan
d Lo
wla
ndLo
wla
ndN
atur
alCo
ntro
lled
Sub
tida
l*In
ter t
idal
Extr
eme
Hum
id d
une
Estu
arie
s&
po
nds
valle
yva
lley
fens
&
flood
plai
nsw
ashl
ands
tida
lsl
acks
emba
ymen
tsm
ires
/fe
nsm
arsh
esflu
shes
Tabl
e 3.
2Li
nkin
g hy
dro-
ecol
ogic
alsu
b-do
mai
nsan
d br
oad
hydr
olog
ical
regi
mes
* Su
b ti
dald
omai
nsar
e lik
ely
to b
e pe
rman
entl
yin
unda
ted
wit
h se
a w
ater
and
rece
ive
a ne
glig
ible
fres
hwat
er c
ontr
ibut
ion.
Itis
acce
pted
that
loca
lised
spe
cific
fres
hwat
er in
puts
can
exis
tbut
thes
e ar
e di
ffic
ultt
o id
enti
fy, q
uant
ify
and
appl
yw
ithi
n w
ater
reso
urce
sre
gula
tion
.
< Section divider
This do
cumen
t was
with
drawn o
n 6 N
ovem
ber 2
017.

Hydro-ecological domains and hydrological regimes Table 3.3 Matrix linking hydro-ecological sub-domains 3.4
Environment Agency in partnership with Natural England and Countryside Council for Wales Understanding water for wildlife
Gro
und
wat
er
Leve
l
Flow
Qua
lity
Sur
face
wat
er
Leve
l
Flow
Qua
lity
Geo
mor
phol
ogy
Tida
lwat
er
Leve
l
Flow
Qua
lity
Geo
mor
phol
ogy
Like
lyas
sess
men
treq
uire
men
tkey
Prob
able
Poss
ible
Unl
ikel
y
Dom
ain
Fres
h S
urfa
ce W
ater
sFr
esh
Wat
er W
etla
nds
Mar
ine/
coas
tal
Rive
rine
Lake
s/U
plan
d Lo
wla
ndLo
wla
ndN
atur
alCo
ntro
lled
Sub
tida
l*In
ter t
idal
Extr
eme
Hum
id d
une
Estu
arie
s&
po
nds
valle
yva
lley
fens
&
flood
plai
nsw
ashl
ands
tida
lsl
acks
emba
ymen
tsm
ires
/fe
nsm
arsh
esflu
shes
Tabl
e 3.
3M
atri
xlin
king
hyd
ro-e
colo
gica
lsub
-dom
ains
and
broa
d hy
drol
ogic
alre
gim
es
Regi
me
* Su
b ti
dald
omai
nsar
e lik
ely
to b
e pe
rman
entl
yin
unda
ted
wit
h se
a w
ater
and
rece
ive
a ne
glig
ible
fres
hwat
er c
ontr
ibut
ion.
Itis
acce
pted
that
loca
lised
spe
cific
fres
hwat
er in
puts
can
exis
tbut
thes
e ar
e di
ffic
ultt
o id
enti
fy, q
uant
ify
and
appl
yw
ithi
n w
ater
reso
urce
sre
gula
tion
.
< Section divider
This do
cumen
t was
with
drawn o
n 6 N
ovem
ber 2
017.

Hydro-ecological domains and hydrological regimes Table 3.4 Matrix linking sources (of impact) with hydroloical regimes 3.4
Environment Agency in partnership with Natural England and Countryside Council for Wales Understanding water for wildlife
Gro
und
wat
er
Leve
l
Flow
Qua
lity
Sur
face
wat
er
Leve
l
Flow
Qua
lity
Subs
trat
e
Tida
lwat
er
Leve
l
Flow
Qua
lity
Subs
trat
e
Like
lihoo
d of
infl
uenc
e
Prob
able
(or d
efin
ite)
Poss
ible
Unl
ikel
y(o
r ver
yun
likel
y)
Hig
hlig
hts
ofre
spon
sibi
litie
sst
radd
ling
func
tion
sor
aut
hori
ties
**Co
nsen
ting
resp
onsi
bilit
ym
ayre
stw
ith
Envi
ronm
entA
genc
ybu
tlie
out
side
the
wat
er re
sour
ce fu
ncti
on.
*#Co
nsen
ting
resp
onsi
bilit
ym
ayre
stw
ith
an a
utho
rity
othe
r tha
n th
e En
viro
nmen
tAge
ncy
Not
e: W
ater
qua
lity
impa
cts
can
cove
r a v
ery
wid
e ra
nge
ofpo
ssib
iliti
esan
d w
ith
resp
ectt
o Ro
Cco
uld
pote
ntia
llyco
ver c
hem
ical
, san
itary
,
nutr
ient
, tox
icol
ogic
al, b
acte
riol
ogic
al, p
atho
geni
c, g
enet
icdi
srup
tors
, wat
er b
orne
dis
ease
san
d fo
reig
n sp
ecie
sre
late
d is
sues
.
Sou
rce
Envi
ronm
entA
genc
y–
wat
er re
sour
ces
Envi
ronm
entA
genc
y–
oth
er (n
one
wat
er re
sour
ce) f
unct
ions
Non
e ag
ency
acti
viti
es/r
egul
atio
nfu
ncti
on (o
r man
agem
ent)
GW
Art
ifici
alSW
Raw
Impo
und-
WQ
IP
C/Fl
ood
Nav
i-W
aste
Wat
erS
ite
Min
e &
Plan
ning
Agr
i/A
qua-
abst
ract
ion
Rech
arge
abst
ract
ion
wat
erm
ent*
*di
scha
rge
RAS
defe
nce
gati
on* #
man
age-
le
vels
man
age-
quar
rycu
ltura
lor
AS
R**
tran
sfer
**co
nsen
ts&
land
m
ent*
#m
anag
e-
men
tac
tivi
ties
guid
elin
esdr
aina
ge* #
men
tpl
ans*
#
Tabl
e 3.
4M
atri
xlin
king
sou
rces
(ofi
mpa
ct) w
ith
hydr
oloi
calr
egim
es(p
athw
ays
for
prop
ogat
ion/
conv
eyan
ce o
fim
pact
)
Regi
me
< Section divider
This do
cumen
t was
with
drawn o
n 6 N
ovem
ber 2
017.

– Rainfall – runoff modelling
– River Habitat Surveys (RHS)
– River flows
– Species abundance anddistribution data
– Trophic status assessments
– Water balance assessment
– Groundwater levels
– Numerical groundwatermodelling
– Groundwater abstractiondrawdown methods (based onradial flow assumptions)
– Conceptualisation for HabitatsDirective AppropriateAssessments
– Flood inundation modelling
– Lidar terrain mapping
– Topographic surveys
– Resource Assessment andManagement (RAM) framework
– Risk Assessment protocol
4.1 Introduction
4.2 Guidance on assessment methodselection
4.3 Translation of hydrological impactto hydro-ecological effect
4.4 Assessment methods
4.5 Additional sources of information
4.6 Assessment method summaries(or ‘technique sheets’)
– Fish population surveys
– Fisheries Classification System(FCS)
– Habscore
– FAME European Fish index (EFi)
– River Fish Habitat Inventory (RFHI)
– Impact of GroundwaterAbstraction on River Flows (IGARF)
– Licence Accumulation Diagram(LAD)
– Flow naturalisation
– Low flows 2000
– Macro-invertebrate biotic indices
– MORECS/MOSES
Assessmentmethods4
< Main contents
This do
cumen
t was
with
drawn o
n 6 N
ovem
ber 2
017.

Assessment methods 4.1 – 4.2
Environment Agency in partnership with Natural England and Countryside Council for Wales Understanding water for wildlife
4.1 IntroductionThis section provides a ‘route map’ to a range ofavailable assessment methods (or techniques), detailsof which can be found on summary sheets in thisdocument. These methods are available for use inassessments and the package of methods adoptedshould reflect specific site characteristics, theadequacy of available data for the site and the level(or sophistication) of assessment being undertaken.Selection of assessment methods should not be carriedout without recourse to the relevant technical expertise.
The assessment methods are broken down into groupswhich may be used to:
• help characterise the site; • interpret the processes which supply or influence
freshwater supplies to the site; • evaluate (quantify) impacts/effects.
Some guidance on assessment method selection isprovided below within a framework which alsoconsiders the:
• source – pathway – receptor concept; • ecological sensitivity of the receptor to hydrological
impacts; • adequacy of hydrological conceptualisation for the
site; • stage of assessment in the Habitats Regulations
Review of Consent (or comparable) process.
All the assessment methods referred to should beapplied following Environment Agency policies andprocedures and following the relevant Work Instructionsand guidance on the Environment Agency intranetsystem.
4.2 Guidance on assessment methodselectionThe selection of a method (or technique) for use in anassessment is dependent upon a number of importantconsiderations. In outline, these can include:
• Does the hydrological characterisation(conceptualisation) for the site identify a potentialsource – pathway – receptor link? If not, or if anylink is shown to be of very low consequence, theremay be no need to undertake any further assessmentwork.
4. Assessment methods
• If an assessment is considered necessary theapproach to, or sophistication of, the methodologyadopted should be commensurate with the:– Adequacy (confidence level) of understanding for
both the hydrological and ecologicalcharacterisation/conceptualisation of the site.
– The nature, proximity (with respect to thesite/receptor) and size of the source/s of potentialimpact.
– The conveyance of impacts along the relevantpathway/s (i.e. hydrological regimes) from thesource to the receptor.
– The ecological sensitivity of the key interestfeatures at the receptor.
• Adopting a progressive, stepped and precautionaryapproach:– Starting with the simplest methods and
progressing to more rigorous techniques asnecessary;
– Applying the precautionary principle in the light ofuncertainties (in knowledge regarding hydrologicalcharacterisation or sensitivity of the interestfeatures) and/or applied assumptions regardinghydrological characterisation of the site or theparticular assessment methods adopted;
– Undertaking assessments of impacts/effectsprogressively from single function through to multi-functional considerations, and also bearing inmind that in-combination effects may arise, suchas the possibility of enhanced toxicity from a‘cocktail’ of pollutants rather than consideration ofindividual toxicity from each individual constituent.
• If a refined approach is deemed appropriate alsoconsider if there is a need for:
– Further baseline investigations to improve site(hydrological or ecological) characterisation orspecific understanding/provenance of a linkbetween source and receptor.
– Further research into the ecological sensitivity forcertain interest features.
< Section divider
This do
cumen
t was
with
drawn o
n 6 N
ovem
ber 2
017.

Assessment methods 4.3 – 4.5
Environment Agency in partnership with Natural England and Countryside Council for Wales Understanding water for wildlife
4.3 Translation of hydrological impact tohydro-ecological effectIn all cases the significance of the predicted impact hasto be assessed. This can only be done by translatinghydrological impact (change in flow, water level etc)into hydro-ecological effect. The hydro-ecological effectdepends on a range of ecological factors including whatis known on the water requirements of the species orhabitat and other pressures acting at the site inquestion. In most cases this will require localknowledge and access to expert opinion.
Very often there is a lack of information on which tobase an assessment or decision on the significance of apredicted impact. Risk assessment frameworks canprovide a useful tool in these circumstances. Themethods should be precautionary (particularly wheremajor uncertainty is involved) and can be used to assistin the identification of sites where risk is minimal (andhence can be eliminated from the assessment process)and to identify need for further investigations/fieldwork.
4.4 Assessment methodsFollowing on from the introduction of hydrologicalregimes (the pathway for source to receptorimpacts/effects) in Section 3.3 and potential links withtypes of activities which may provide the source ofimpacts/effects (Section 3.4), Table 4.1 sets outpossible assessment methods applicable to theseregimes. The assessment methods are divided into twomain classes and include:
• Standard techniques to help characterise the site(typically covering field-based monitoring andbaseline processing/interpretation of resulting data);and
• Various approaches which may be undertaken toassess hydrological impacts.
Table 4.1 also provides, for the assessment methodsidentified, an indication as to the:
• Type of method (whether used to provide baselinedata, aid site characterisation or enable impactassessment);
• Hydrological regimes under which the method islikely to (or may) be applicable;
• Typical cost/complexity of applying the method; and• Further coverage of outline details for this method in
these Guidelines (see Section 4.5).
Table 4.2 reproduces the full list of assessmentmethods previously identified in Table 4.1. The majorityof these are provided with Assessment Summaries inSection 4.6 but in some cases where the selection ofmethods are not made primarily by the Water Resourcefunction, e.g. water quality, no summary has beenprovided. When no summary has been provided thensuggestions may be included (in Table 4.2) giving otherreferences or organisations which might help.
4.5 Additional sources of informationFurther information may be obtained from the followingsources:
• 133_05 Work Instruction: (Appendix 4) Assessmentof new Water Resources permissions under theHabitats Regulations.
• 134_05 (Appendix 4) Review of existing WaterResources permissions under the HabitatsRegulations.
• 135_05 (Appendix 4) Stages 1 & 2 of the review ofexisting Water Resources permissions under theHabitats Regulations.
• 136_05 (Appendix 4) Stage 3 of the review of existingWater Resources permissions under the HabitatsRegulations.
< Section divider
This do
cumen
t was
with
drawn o
n 6 N
ovem
ber 2
017.

Assessment method summaries: Fish population surveys 4.6
Environment Agency in partnership with Natural England and Countryside Council for Wales Understanding water for wildlife
SummaryType of regime where appliedRiverine and lacustrine.
Applicability to groundwater or surface watersSurface waters only.
Hydrological data requirementsGauged flow data may be useful to explain orinvestigate migratory behaviour, distribution andimpacts on fish populations
Ecological data requirementsRiver habitat survey may be used to link distribution tochannel features
Can method be used on its own?Yes, however, data are best interpreted against otherenvironmental data.
Applicability to European interest featuresHighly applicable, various survey techniques can beused to target particular species or groups according to habitat.
Resource requirementExperienced/qualified surveyors required – minimumnumber to meet health and safety requirements variesaccording to specific task.
1. Background and applicabilityto species protected under the Habitats DirectiveFish population survey data have been routinelycollected by the Environment Agency and itspredecessor organisations for most river catchments inorder to evaluate the distribution, abundance andstatus of fish species. Historically fish population datahave been collected to provide information on thehealth of the river, both in terms of habitat and waterquality, and in terms of the sport fishery. The collectionof survey data has, in the past, varied betweenEnvironment Agency Regions and Areas, both spatiallyand temporally. Since angling has been a key driver forgathering fish population data, surveys have typicallyconcentrated on the favoured coarse and salmonid fishspecies. Consequently, other species such as bullheadand lamprey have been under-recorded.
The provisions of the Conservation (Natural Habitats&c.) Regulations 1994 has highlighted the conservationstatus of species such as lampreys, bullhead andshads. As a result of this there has been increasedemphasis on local targeted surveys for these species.
1 European (fish) interest features include salmon,bullhead, allis shad, twaite shad, brook lamprey, river lamprey, sea lamprey, spined loach, powan and vendace
Salmon are the only European (fish) interest featurethat have historically been subject to extensive surveyeffort, with surveys targeting both the adult and thejuvenile fish. Surveys have also been repeated atregular intervals, providing good historical data sets formany river catchments.
Bullhead, spined loach and lamprey have typically beenrecorded as present at sites if detected. However, thehabitat preferences and behaviour of these speciesmean that specialist targeted surveys are required forquantitative studies, with routine surveys probablyunder-recording these species. Historical data forspined loach may be limited or unreliable due to lack ofrecording or mis-identification.
Shad species have rarely been monitored other thanthrough specialist surveys as the adults are onlypresent in rivers for short periods of time in Springwhen general fish populations surveys are not usuallyundertaken. Most historical records are anecdotalbased on observation of adult fish returning to spawn.Consequently no useful population estimates exist forthis species, with the exception of the River Severnwhere there are 25 years of useful CPUE (Catch Per UnitEffort) data. However, the use of fixed stationhydroacoustic counters is currently being evaluated onthe River Wye.
Coregonids (powan, gwyniad, vendace) are confined todeep glacial lakes in generally upland areas of NorthWest England and North Wales and have only beensubjected to targeted surveys, principally by theFreshwater Biological Association and Centre forEcology and Hydrology.
Fish population surveys4.6 Assessment method summaries
< Section divider
This do
cumen
t was
with
drawn o
n 6 N
ovem
ber 2
017.

Assessment method summaries: Fish population surveys 4.6
Environment Agency in partnership with Natural England and Countryside Council for Wales Understanding water for wildlife
2. Fish population survey methodsThe variable morphology of water bodies throughoutEngland and Wales means that a variety of differentsurvey techniques have to be employed according tothe width, depth, substratum, water conductivty andturbidity of the water being surveyed, also to purpose ofsurvey and target species
Each of these techniques has certain limitations andthey vary considerably in their selectivity and efficiencydepending upon the survey site and prevailingconditions. A combination of techniques may be used
at certain sites. The data from fish population surveyscan be evaluated in association with environmentaldata, such as gauged flow data, River Habitat Survey(channel morphology) data, water quality data asdescribed in summary to provide some explanation ofvariability in distribution or abundance, or to explainspecies behaviour.
The fishery survey methods most commonly used in England and Wales and their applicability toenvironments and species are summarised in the table below.
River Type Method European interest species Comments
Upland, narrow, shallow streams Backpack Electric Fishing Salmon (juvenile), lamprey - (juvenile), bullhead
Small to medium sized shallow rivers, Wading (generator-based) Salmon (juvenile and adult) Adult salmon seasonally only, upland and lowland electric fishing lamprey, bullhead, electric fishing not recommended
spined loach as a survey method
Deeper, medium to large rivers Boat-based hand-held Salmon (adult and juvenile), Adult salmon seasonally only, (upland and lowland), margins electric fishing lamprey, bullhead, electric fishing not recommended of lakes, canals spined loach as a survey method. Lampreys,
bullhead and spined loach in shallow margins only.
Large, navigable, slower-flowing Boom-boat electric fishing Not applicable to any of -rivers, lakes European interest species
Medium to large, slow-flowing lowland Trawling Shad, coregonids in lakes -rivers, large lakes, estuaries
Medium to large, slow-flowing lowland Seine netting Salmon (adult), spined loach, Unlikely to be used for rivers, lakes, estuaries shad (juvenile) sampling adult salmon
Large lowland rivers and lakes, estuaries Hydroacoustic survey Coregonus species in lakes -(boat-based or fixed) Shad and Salmon smolt
Small to large sized rivers and Angler rod-catch Salmon (adult) -lakes, estuaries Commercial net catch
Fish population survey methods
< Section divider
This do
cumen
t was
with
drawn o
n 6 N
ovem
ber 2
017.

3. Brief descriptions of methods3.1 Electric fishingElectric fishing involves the creation of an electric fieldin the water around a set of electrodes in order toattract and immobilise fish so that they can be capturedeasily, enumerated and processed before beingreturned to the water with minimal risk of harm. Electricfishing can be carried out either by wading or from aboat, the power being provided usually by a portablegenerator, or in small shallow streams in sites withdifficult access, a battery unit. The effective electricalfield in water is generally only quite small, in the orderof 2-3 metres around the electrodes, and so the methodis of limited effectiveness in larger or deeper waterbodies. There are considerable health and safetyimplications surrounding electric fishing and it mustonly be undertaken by trained and experienced staff,the number of whom are required varying according tothe type of operation being mounted.
3.2 NettingAlthough fish can be captured in a variety of broad typesof nets, the chief methods used in English and Welshwaters for fish sampling are seine netting and trawling.
A seine net is typically 50 – 150 metres in length withvarying depth (1.5 – 6 metres) and consists of arelatively small mesh size (15 – 50 mm). One end of thenet is held on the bank whilst the rest of the net is set ina circle from a boat and the ends drawn together toform an enclosure around the area being fished. Thewhole net is drawn slowly towards the shore where thecatch can be scooped out and placed in suitablecontainers for processing. Seine netting is impracticalin waters which are very deep, have steeply shelvingbeds or are debris strewn, are weedy or where the watervelocity is excessive. Seine netting is fairly manpowerintensive although in ideal sampling conditions it isrelatively efficient.
Trawling is undertaken from a suitably-powered vesseland involves the use of a bag-shaped net which can berigged and weighted so as to sample either the bed ofthe water body or the pelagic layers. Long stretches ofwater can be sampled relatively rapidly although itsrelative efficiency is usually low and may be highlyselective for species. The method is best suited to wide,deep waters with relatively smooth, clear bed.
3.3 HydroacousticsHydroacoustic surveying of fish works by thetransmission of a high-frequency sonic beam under thewater which, when it encounters a fish or otherunderwater object, creates an echo that is detected by areceiver. The energy from the echo is transformed into a
reading or visual image on a screen or paper chart. Themodern split beam and dual beam hydroacousticsystems used by the Environment Agency and otherscientific bodies incorporate very sophisticated softwarewhich enable high confidence in discerning fish fromother objects, assessment of numbers and size of fishpresent and tracking of movement patterns of individualfish within the beam. Hydroacoustic surveys aregenerally conducted by boat although fixed locationmonitoring from the bank or a pontoon can be used. Inthe generally shallow (< 6m) deep waters thehydroacoustic beam is fired horizontally whilst in deeplakes it is transmitted vertically. The method enableslong lengths of river or shoreline to be surveyed withmodest manpower in a relatively short time, and has theadvantage of being non-intrusive to the fish. Surveys areusually conducted between dawn and dusk when thefish tend to rise higher in the water column where theyare more visible to the beam. Whilst the size of fish canbe estimated, it is not generally possible to discernspecies.
3.4 Fish countersMigratory fish species have presented their ownchallenges when trying to evaluate the characteristicsof the adult spawning population. As a result of thisfixed position counters have been deployed at varioussites to count the number of fish migrating upstreamand in some cases, downstream. These methods allowcontinuous recording of fish movement, subject tocertain environmental conditions being met, and so canprovide information not only on numbers of fish butpatterns of behaviour.
Two techniques have routinely been employed:
• resistivity counters (where the fish interrupts anelectrical field, the magnitude of the interruptionbeing proportional to the size of the fish);
• hydroacoustic counters (where the fish swimsthrough a sonic beam, influencing the returningsignal, the magnitude of the returning signal beingproportional to the size of the fish).
Both techniques are effectively ‘blind’, i.e. there is noeasy way of establishing the identity of the fish otherthan to use a separate technique such as underwatervideo. Consequently there are certain inaccuraciesassociated with each method, which may also beinfluenced by other environmental factors such asmacrophytes, algae, suspended solids, air bubbles etc.It is possible to calibrate systems so that fish size canbe estimated, and fish numbers can readily becalculated unless the fish form dense shoals. This is aparticular problem with shad, which makesenumeration problematic.
Assessment method summaries: Fish population surveys 4.6
Environment Agency in partnership with Natural England and Countryside Council for Wales Understanding water for wildlife
< Section divider
This do
cumen
t was
with
drawn o
n 6 N
ovem
ber 2
017.

Fixed position fish counters have been deployed on anumber of the salmon rivers in England and Wales(11 of these provide reliable data). Consequently gooddata exist for some SAC rivers where salmon are aninterest feature. In most cases fish migration data can berelated to river flows to identify migration triggers. It isalso possible to use counter data to enumerate thereturning adult population. This can be related tospawning targets to establish the status of the fishery.Much research has been completed looking at the use ofcounters to evaluate stocks of salmon and sea trout.However, the value of these systems for evaluating shadmigration is now being trialled, and work is being carriedout to develop the systems further for this purpose.
3.5 Angler rod-catch and commercial net-catch.Migratory salmonid rod licence holders and holders oflicences for commercial salmon netting are required tosubmit to the Environment Agency details of theirsalmon catches including dates and methods used,hours fished etc. Rod-catch data are the most reliabledata on runs of adult salmon in many rivers where thereare no fish counters. The data are expressed as catch-per unit effort, i.e it can only provide a relative index ofabundance although relationships between rod-catchand total run size have been established for somesystems. Rod-catch data can also be used to drawinferences about the behaviour and distribution ofadult salmon.
Assessment method summaries: Fish population surveys 4.6
Environment Agency in partnership with Natural England and Countryside Council for Wales Understanding water for wildlife
Additional informationGeneral:Ladle, M. (2002) Review of Flow Needs for Fish and Fisheries. Environment Agency R&D Technical Report TR W159.Bristol: Environment Agency, 2002
Aprahamian, M. W. & Lester, S. M. (1998) Shad conservation in England and Wales. Environment Agency R&DTechnical Report P302(1998) ISBN 1857051335 Bristol : Environment Agency, 1998
Institute of Freshwater Ecology; Winfield, I.J., Fletcher, J.M. Cragg-Hine, D., Cubby, P. R. (1996) The population biologyand status of Coregonus albula and C. lavaretus in England and Wales. National Rivers Authority R&D Note 424Bristol: National Rivers Authority, 1996
Fish counters:Nicholson, S.A. & Aprahamian, M. W. (1995) Design and use of fish counters. National Rivers Authority R&D Note 382Bristol: National Rivers Authority, 1995
Nicholson, S.A., Best, P.M., Shaw, R.A. Kaar, E.T. (1997) Design and use of open channel resistivity fish counters.Environment Agency R&D report W23 Bristol: Environment Agency, 1997.
Gregory, J., Bray, J. & Gough, P (2002). The development of applications and validation methods for hydroacousticsalmonid counters. Environment Agency R&D Technical Report W233ISBN 1857057821 Bristol: Environment Agency, 2002
Gregory, J. Clabburn, P. Robinson, L. (1998) The use of a hydroacoustic counter for assessing salmon stocks.Environment Agency R&D Technical Report W92Bristol: Environment Agency, 1998
Gregory, J. (2000) An appraisal of hydroacoustic techniques for monitoring the spawning migration for shad in the R. Wye. Environment Agency R&D Technical Report W226ISBN 1857053362 Bristol: Environment Agency, 2000
Electric fishing:Centre for Ecology and Hydrology; Beaumont, W.R., Taylor, A.A.L., Lee, M.J. & Welton, J. S. (2002) Guidelines forElectric Fishing Best Practice’. Environment Agency R&D Technical Report W2-054/TR. ISBN 1857056361 Bristol : Environment Agency, 2002
Cowx, I.G. & Harvey, J. (1995) Electric fishing in deep rivers. National Rivers Authority R&D Note 303 Bristol: National Rivers Authority, 1995
< Section divider
This do
cumen
t was
with
drawn o
n 6 N
ovem
ber 2
017.

Assessment method summaries: Fish population surveys 4.6
Environment Agency in partnership with Natural England and Countryside Council for Wales Understanding water for wildlife
Additional information continuedNetting techniques:Freshwater Fisheries Management. Ed. Robin Templeton Fishing News Books, 1995, ISBN 0-85238-209-X
Hydroacoustic surveys:Royal Holloway; Duncan, A. & Kubecka, J.(1993) Hydroacoustic methods of fish surveys(National Rivers Authority R&D Note 196 Bristol: National Rivers Authority, 1993
Lucas, M.C. Walker, L., Mercer, T. & Kubecka, J. (2002) A review of fish behaviours likely to influence acoustic fish stock assessment in shallow temperate rivers and lakes.Environment Agency R&D Technical Report W2-063/TR/1 ISBN 1857056884 Bristol: Environment Agency, 2002
Hateley, J. (2002) Variability in mobile acoustic fish community assessment. Environment Agency R&D TechnicalReportW2-063/TR/2) ISBN 1857058488 Bristol: Environment Agency, 2002
Rod and net catch:Fisheries statistics 1999: salmonid and freshwater fisheries statistics for England and Wales: (declared catches ofsalmon and migratory trout by rods, nets and other instruments. Environment Agency National Salmon and TroutCentre (Author)EA Publication; 35pp.Bristol: Environment Agency, 2000
< Section divider
This do
cumen
t was
with
drawn o
n 6 N
ovem
ber 2
017.

Assessment method summaries: Fisheries Classification System (FCS) 4.6
Environment Agency in partnership with Natural England and Countryside Council for Wales Understanding water for wildlife
SummaryType of system where appliedRiverine.
Applicability to groundwater or surface waterSurface waters only.
Fish data requirementsQuantitative or semi-quantitative electric fishing surveydata or angling match catch data
Hydrological data requirementsHistoric naturalised and actual flow data may be usefulfor further investigations.
Ecological data requirementsComparison with river habitat survey data may provideuseful additional data on habitat preferences.
Can method be used on its own?Uses fish population survey data plus map-and site-based data.
Applicability to European interest featuresUses UK reference sites for databases. Incorporate dataon salmon, spined loach, bullhead and shads wherethese are present and can be sampled. Quantitativedata only for salmon.
Resource requirementPractitioners must be familiar with FCS softwarepackage and manipulation of fish population dataincluding National Fish Population Database (NFPD).
BackgroundThe Fisheries Classification System (FCS) wasdeveloped to enable objective assessment of fisheries,comparison of the status of fisheries from a local andnational perspective, and communication of results, ona national basis.
The system was developed by compiling a database of fishery survey and simple environmental data fromaround 1000 river sites from around England and Wales and examining patterns of abundance of thevarious species and groups in relation to river widthand river gradient.
Method descriptionFCS requires electric fishing survey outputs expressedas numbers of individuals per 100m2 for salmonidsand biomass density (g/100m2) for coarse fish over 10cm forklength (on the basis that fish less than 10cm inlength cannot be sampled quantitatively, FCS canproduce outputs for sites where fully quantitativeelectric fishing is not practicable and there is a modulewhich can utilise angling match catch data.
Fishery survey data and site gradient and width data areentered into the model; the outputs for any given siteare presented as grades according to a five-bandclassification system from the total range of values offish density and biomass found across England andWales. The system operates on four levels of detailthrough the use of a hierarchy of species aggregations,and, for each level of detail allows an absoluteclassification (how the fishery rates in relation to allothers in the database) as well as a relativeclassification, which places the site in the context ofother sites in the same broad habitat type (gradient andwidth category) in the database.
ApplicabilityAt all levels of detail, ‘minor’ species such as bullhead,minnow, lampreys, coarse fish fry and the loaches isrequired only as presence or absence, hence FCS haslimited applicability to most Habitats Directive species.
FCS uses only very basic habitat data as part of theevaluation process, which limits the sensitivity of thesystem for assessing species occurrence andabundance in relation to habitat. It is tailored towardsspecies of angling interest and is a tool for Nationalreporting and is easily translated to map-basedoutputs. Although FCS considers salmonids, theHABSCORE system provides a more robust tool forassessing salmonid populations in relation to habitat.
Fisheries classification system (FCS)4.6 Assessment method summaries
< Section divider
This do
cumen
t was
with
drawn o
n 6 N
ovem
ber 2
017.

Assessment method summaries: Fisheries Classification System (FCS) 4.6
Environment Agency in partnership with Natural England and Countryside Council for Wales Understanding water for wildlife
Additional informationWRc plc, Mainstone, C. P. ,Wyatt, R. J. & Barnard, S. (1994) The NRA national fisheries classification scheme: aguide for users. National Rivers Authority R&D Note 206Bristol: National Rivers Authority, 1994
WRc plc, Mainstone, C. P. Wyatt, R. J. & Barnard, S. (1994) Development of a fisheries classification scheme.National Rivers Authority R&D Project Record 244/7/YBristol: National Rivers Authority, 1994
WRc plc; Wyatt, R.J.& Lacey, R. F. (1999) Semi-quantitative methods for fisheries classification. Environment AgencyR&D Technical Report W167Bristol: Environment Agency, 1999
< Section divider
This do
cumen
t was
with
drawn o
n 6 N
ovem
ber 2
017.

Assessment method summaries: HABSCORE 4.6
Environment Agency in partnership with Natural England and Countryside Council for Wales Understanding water for wildlife
SummaryType of system where appliedRiverine.
Applicability to groundwater or surface waterSurface waters only.
Fish data requirementsQuantitative or semi-quantitative electric fishing surveydata or angling match catch data
Hydrological data requirementsHistoric naturalised and actual flow data may be usefulfor further investigations.
Ecological data requirementsComparison with River Habitat Survey data may provideuseful additional data on habitat preferences.
Can method be used on its own?Uses fish population survey data plus map-and site-based data.
Applicability to European interest featuresUses UK reference sites for databases. Focuses onsalmonids.
Resource requirementHabitat and fish data must be gathered by trainedpractitioners. Users must be familiar with HABSCOREsoftware package and manipulation of fish populationdata including National Fish Population Database(NFPD).
BackgroundHABSCORE is a system of salmonid stream habitatmeasurement and evaluation based on empiricalmodels of fish density against combinations of site andcatchment features. The system has been developed toaid the interpretation of fisheries data, with particularemphasis on the assessment of environmental impact.Indirect derivations of densities from the pristineHABSCORE sites feed into the production of spawningtargets. HABSCORE is based on a series of empiricalstatistical models which predict population size of fivesalmonid species/age categories to observed habitatvariables including site and catchment features.
The models were developed using fish populationestimates obtained from 602 ‘pristine’sites in Englandand Wales.
Method descriptionThe HABSCORE system uses a range of variables includingcatchment variables (e.g. altitude, slope), primary sitevariables (e.g. mean depth and width, shading) andderived site variables (e.g. surface area to volume ratio).The system produces two principal outputs:
• Habitat Quality Score (HQS): a prediction of theexpected population at a site derived from habitatdata.
• Habitat Utilisation Index (HUI): a measure of theextent to which the potential of the site is realised,i.e. the difference between the observed and theexpected population size. The HUI is derived fromhabitat and fish data.
The comparison of observed with expected data usingthe HABSCORE model provides a useful tool forassessing the performance of the salmonid populationat a particular site. A poor HUI indicates that the siteholds fewer fish than would be expected on the basis ofhabitat features and hence that it might be impacted.
Because the HABSCORE system is empirically derived,there is not necessarily a direct causal link between themodel variable and the predicted population. Thesystem therefore has to be used with caution whentrying to predict the consequences of habitat change.Therefore in those cases where the observed value fallsbelow the predicted value, further investigation may benecessary to identify the factor(s) responsible for thedeviation.
ApplicabilityHABSCORE has been designed to evaluate the habitatused by salmon and trout in upland rivers and streamsand serves this purpose well, however its applicabilityin larger rivers where measurements of many of thevariables used, is limited. The value of the method forother Habitats Directive fish species has not yet beenvalidated.
HABSCORE4.6 Assessment method summaries
< Section divider
This do
cumen
t was
with
drawn o
n 6 N
ovem
ber 2
017.

Assessment method summaries: HABSCORE 4.6
Environment Agency in partnership with Natural England and Countryside Council for Wales Understanding water for wildlife
Additional informationWRc plc, Wyatt, R.J. & Barnard, S. (1995) Guide to HABSCORE field survey methods and the completion of standardforms. National Rivers Authority R&D Note 401.Bristol: National Rivers Authority 1995
WRc plc, Wyatt, R.J. Barnard, S. & Lacey, R. F. (1995) Salmonid modelling literature review and subsequentdevelopment of HABSCORE models National River Authority R&D Project Record(338/20/W) Bristol: National Rivers Authority, 1995
< Section divider
This do
cumen
t was
with
drawn o
n 6 N
ovem
ber 2
017.

Assessment method summaries: FAME European Fish index (EFi) 4.6
Environment Agency in partnership with Natural England and Countryside Council for Wales Understanding water for wildlife
SummaryType of system where appliedRiverine.
Applicability to groundwater or surface waterSurface waters only.
Hydrological data requirementsHistoric Naturalised and Actual Flow data may be usefulfor further investigations.
Ecological data requirementsComparison with River Habitat Survey data may provideuseful additional data on habitat preferences.
Can method be used on its own?Uses fish population survey data plus map and site-based data.
Fish data Single-run electric fishing survey data.
Applicability to European interest featuresUses UK and European reference sites for databases.Incorporates data on salmon, spined loach, bullheadand shads where these are present and can be sampledbut makes no specific reference in final score.
Resource requirementPractitioners must be familiar with FAME softwarepackage and manipulation of fish population dataincluding National Fish Population Database (NFPD).
BackgroundThe FAME (Fish based Assessment Method for theEcological status of European Rivers) methodology wasdeveloped to provide a tool for assessing EcologicalStatus of rivers for the purposes of complying with theEuropean Water Framework Directive, using fish as oneof the four elements which have been chosen asindicators of ecological status.
The method looks at the fish community rather thansingle species in isolation, and follows the concept ofthe Index of Biotic Integrity. IBI’s work on theassumption that various aspects, or metrics of abiological system will change along a gradient ofhuman interference or degradation in a predictable andquantifiable manner. Waters at High Ecological Statusexhibit few or no signs of human degradation in thebiotic communities they support, whilst those in the
lowest of the five categories (Bad) have communitieswhich are very highly modified from those occurringunder pristine (reference) conditions. An EFi score ofclose to 1 indicates a high probability that the site is atreference condition.
The FAME database (FIDES) was developed on aEuropean-wide scale and included over 15 000samples from 8 000 sites from 12 countries. For eachriver type in each of 16 ‘eco-regions’, characteristic fishcommunities have been identified by their compositionin terms of reproductive and feeding ‘guilds’ that wouldbe expected under near-pristine conditions.
Method descriptionThe methodology involves five basic steps:
1. Classify river type – this is done on the basis of simplemap and field based variables describing the basicenvironmental characteristics and geographicallocation of the site which are fed into the FAME model
2. Define reference condition – this is derived from theFIDES database by the model
3. Undertake survey and enter data into the model
4. Assess deviation from reference condition – this isthe EFi score and is the output from the EFi software.
5. Assign quality status.
FAME uses data from single-run electric fishing survey,undertaken to strict criteria laid down in the FAMEmanual. Data from multiple catch surveys can be used,however only the first run catch is used in thecomputations. Fish caught are classified according totheir membership of various guilds, which make up theten fish metrics used to calculate the EFi. Some of themetrics are simply the presence or absence of certainspecies whilst others are densities of various fishgroups.
ApplicabilityWhilst data on European Interest fish species isgathered and fed into EFi model, the resulting EFiscores only give a general indication of the ecologicalstatus of the site and are not suitable for investigatingthe status of particular species or the reasons for theirstatus in any given site or reach.
FAME European Fish index (EFi)
4.6 Assessment method summaries
< Section divider
This do
cumen
t was
with
drawn o
n 6 N
ovem
ber 2
017.

Assessment method summaries: FAME European Fish index (EFi) 4.6
Environment Agency in partnership with Natural England and Countryside Council for Wales Understanding water for wildlife
Additional informationSchmutz, Stefan & Haidvogel, Gertrude (2004) Development, evaluation and implementation of a standardisedfish based assessment method for the ecological status of European rivers.
FAME Group: 2004. Accessible from FAME webpage http://fame.boku.ac.at
FAME consortium (2004) Manual for the application of the European fish index – EFI. A fish based method to assessthe ecological status of European rivers in support of the water framework directive. Version 1.1 January 2005.
< Section divider
This do
cumen
t was
with
drawn o
n 6 N
ovem
ber 2
017.
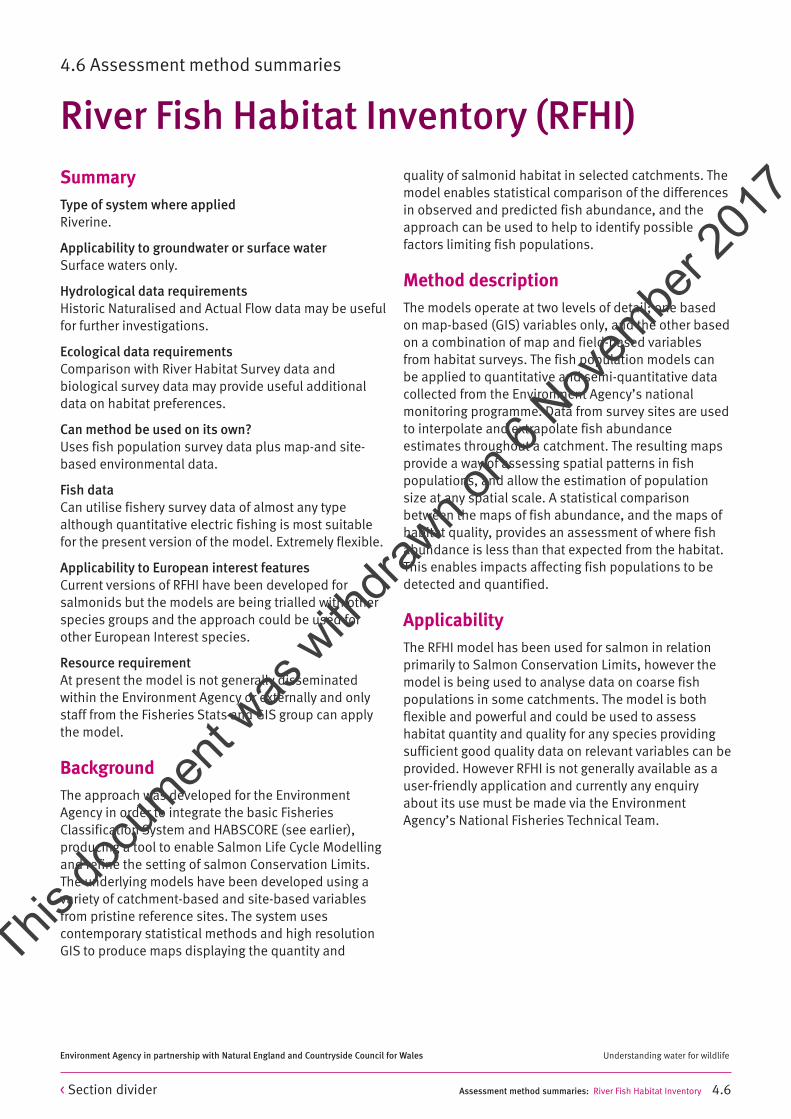
Assessment method summaries: River Fish Habitat Inventory 4.6
Environment Agency in partnership with Natural England and Countryside Council for Wales Understanding water for wildlife
SummaryType of system where appliedRiverine.
Applicability to groundwater or surface waterSurface waters only.
Hydrological data requirementsHistoric Naturalised and Actual Flow data may be usefulfor further investigations.
Ecological data requirementsComparison with River Habitat Survey data andbiological survey data may provide useful additionaldata on habitat preferences.
Can method be used on its own?Uses fish population survey data plus map-and site-based environmental data.
Fish data Can utilise fishery survey data of almost any typealthough quantitative electric fishing is most suitablefor the present version of the model. Extremely flexible.
Applicability to European interest featuresCurrent versions of RFHI have been developed forsalmonids but the models are being trialled with otherspecies groups and the approach could be used forother European Interest species.
Resource requirementAt present the model is not generally disseminatedwithin the Environment Agency or externally and onlystaff from the Fisheries Stats and GIS group can applythe model.
BackgroundThe approach was developed for the EnvironmentAgency in order to integrate the basic FisheriesClassification System and HABSCORE (see earlier),producing a tool to enable Salmon Life Cycle Modellingand refine the setting of salmon Conservation Limits.The underlying models have been developed using avariety of catchment-based and site-based variablesfrom pristine reference sites. The system usescontemporary statistical methods and high resolutionGIS to produce maps displaying the quantity and
quality of salmonid habitat in selected catchments. Themodel enables statistical comparison of the differencesin observed and predicted fish abundance, and theapproach can be used to help to identify possiblefactors limiting fish populations.
Method descriptionThe models operate at two levels of detail; one basedon map-based (GIS) variables only, and the other basedon a combination of map and field-based variablesfrom habitat surveys. The fish population models canbe applied to quantitative and semi-quantitative datacollected from the Environment Agency’s nationalmonitoring programme. Data from survey sites are usedto interpolate and extrapolate fish abundanceestimates throughout a catchment. The resulting mapsprovide a way of assessing spatial patterns in fishpopulations, and allow the estimation of populationsize at any spatial scale. A statistical comparisonbetween the maps of fish abundance, and the maps ofhabitat quality, provides an assessment of where fishabundance is less than that expected from the habitat.This enables impacts affecting fish populations to bedetected and quantified.
ApplicabilityThe RFHI model has been used for salmon in relationprimarily to Salmon Conservation Limits, however themodel is being used to analyse data on coarse fishpopulations in some catchments. The model is bothflexible and powerful and could be used to assesshabitat quantity and quality for any species providingsufficient good quality data on relevant variables can beprovided. However RFHI is not generally available as auser-friendly application and currently any enquiryabout its use must be made via the EnvironmentAgency’s National Fisheries Technical Team.
River Fish Habitat Inventory (RFHI)
4.6 Assessment method summaries
< Section divider
This do
cumen
t was
with
drawn o
n 6 N
ovem
ber 2
017.

Assessment method summaries: River Fish Habitat Inventory 4.6
Environment Agency in partnership with Natural England and Countryside Council for Wales Understanding water for wildlife
Additional information Wyatt, R.J. 2002. Estimating riverine fish population size from single- and multiple- pass removal sampling using ahierarchical model. Can. J. Fish Aquat. Sci. 59: 695–706.
Wyatt, R.J. 2003. Mapping the abundance of riverine fish populations: integrating hierarchical Bayesian modelswith a geographic information system (GIS). Can. J. Fish Aquat. Sci. 60: 997-1006
WRc plc,Wyatt, R.J. & Barnard, S. (1997) River fisheries habitat inventory (phase 1): scoping study. EnvironmentAgency R&D Technical Report W95. Publication Bristol: Environment Agency, 1997
Wyatt, R.J.(2005) River Fish Habitat Inventory Phase 2: Methodology Development for Juvenile Salmonids.Environment Agency Science Report SC980006/SR. Bristol: Environment Agency July 2005. ISBN Number1844324591
< Section divider
This do
cumen
t was
with
drawn o
n 6 N
ovem
ber 2
017.
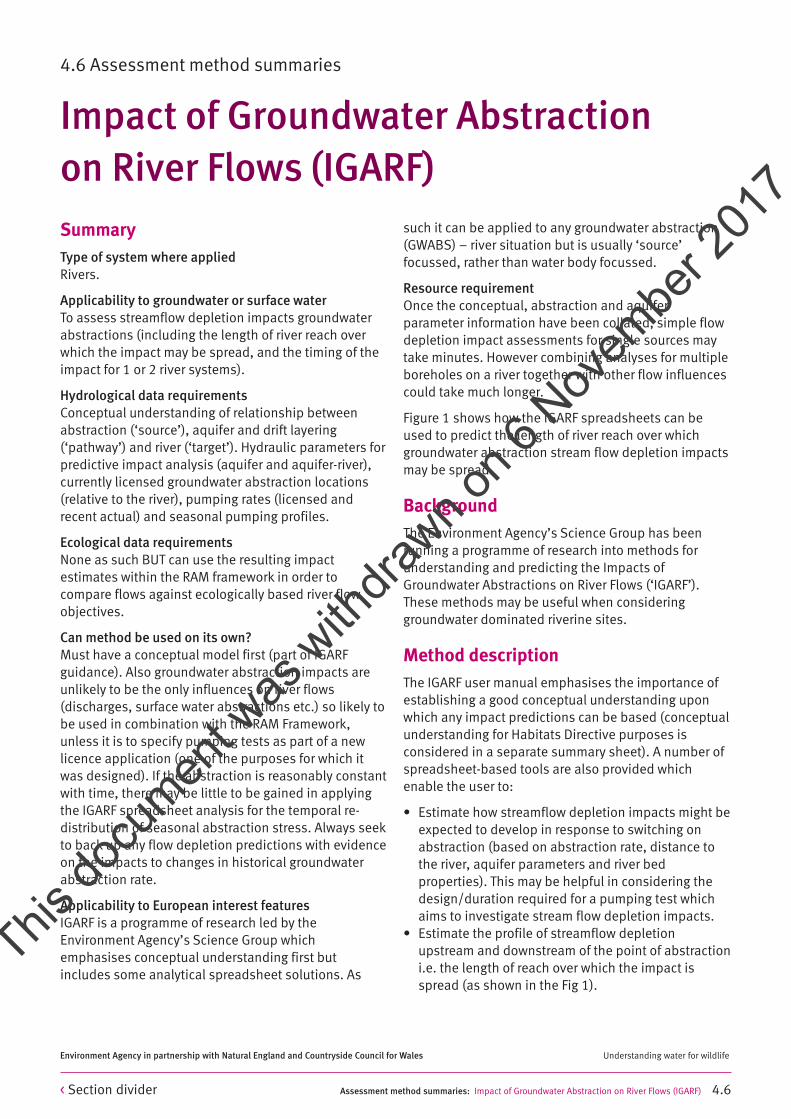
Assessment method summaries: Impact of Groundwater Abstraction on River Flows (IGARF) 4.6
Environment Agency in partnership with Natural England and Countryside Council for Wales Understanding water for wildlife
SummaryType of system where appliedRivers.
Applicability to groundwater or surface waterTo assess streamflow depletion impacts groundwaterabstractions (including the length of river reach overwhich the impact may be spread, and the timing of theimpact for 1 or 2 river systems).
Hydrological data requirementsConceptual understanding of relationship betweenabstraction (‘source’), aquifer and drift layering(‘pathway’) and river (‘target’). Hydraulic parameters forpredictive impact analysis (aquifer and aquifer-river),currently licensed groundwater abstraction locations(relative to the river), pumping rates (licensed andrecent actual) and seasonal pumping profiles.
Ecological data requirementsNone as such BUT can use the resulting impactestimates within the RAM framework in order tocompare flows against ecologically based river flowobjectives.
Can method be used on its own?Must have a conceptual model first (part of IGARFguidance). Also groundwater abstraction impacts areunlikely to be the only influences on river flows(discharges, surface water abstractions etc.) so likely tobe used in combination with the RAM Framework,unless it is to specify pumping tests as part of a newlicence application (one of the purposes for which itwas designed). If the abstraction is reasonably constantwith time, there may be little to be gained in applyingthe IGARF spreadsheet analysis for the temporal re-distribution of seasonal abstraction stress. Always seekto back up any flow depletion predictions with evidenceon the impacts to changes in historical groundwaterabstraction rate.
Applicability to European interest featuresIGARF is a programme of research led by theEnvironment Agency’s Science Group whichemphasises conceptual understanding first butincludes some analytical spreadsheet solutions. As
such it can be applied to any groundwater abstraction(GWABS) – river situation but is usually ‘source’focussed, rather than water body focussed.
Resource requirementOnce the conceptual, abstraction and aquiferparameter information have been collated, simple flowdepletion impact assessments for single sources maytake minutes. However combining analyses for multipleboreholes on a river together with other flow influencescould take much longer.
Figure 1 shows how the IGARF spreadsheets can beused to predict the length of river reach over whichgroundwater abstraction stream flow depletion impactsmay be spread.
BackgroundThe Environment Agency’s Science Group has beenrunning a programme of research into methods forunderstanding and predicting the Impacts ofGroundwater Abstractions on River Flows (‘IGARF’).These methods may be useful when consideringgroundwater dominated riverine sites.
Method descriptionThe IGARF user manual emphasises the importance ofestablishing a good conceptual understanding uponwhich any impact predictions can be based (conceptualunderstanding for Habitats Directive purposes isconsidered in a separate summary sheet). A number ofspreadsheet-based tools are also provided whichenable the user to:
• Estimate how streamflow depletion impacts might beexpected to develop in response to switching onabstraction (based on abstraction rate, distance tothe river, aquifer parameters and river bedproperties). This may be helpful in considering thedesign/duration required for a pumping test whichaims to investigate stream flow depletion impacts.
• Estimate the profile of streamflow depletionupstream and downstream of the point of abstractioni.e. the length of reach over which the impact isspread (as shown in the Fig 1).
Impact of Groundwater Abstraction on River Flows (IGARF)
4.6 Assessment method summaries
< Section divider
This do
cumen
t was
with
drawn o
n 6 N
ovem
ber 2
017.

Assessment method summaries: Impact of Groundwater Abstraction on River Flows (IGARF) 4.6
Environment Agency in partnership with Natural England and Countryside Council for Wales Understanding water for wildlife
• Estimate the average monthly profile of streamflowdepletion impacts, given an average monthly profileof abstraction. This may be helpful for consideringthe long term typical pattern of river flow depletion inresponse to a groundwater abstraction which ismarkedly seasonal in character (e.g. spray irrigation).However, the analysis is less worthwhile forabstractions which continue throughout the year atreasonably steady rates (e.g. many public watersupply boreholes).
• Estimate the spatial distribution of impacts from oneborehole on two or more river reaches, based ontheir distance, aquifer and river bed properties.
UseIGARF approaches may form part of a Review of Consentsassessment for a groundwater riverine habitat,particularly if it is influenced by strongly seasonal
groundwater abstractions. Other techniques will also berequired in order to account for other influences on riverflows – IGARF may, for example, be used to definegroundwater abstraction impacts as an input to a RAMFramework based assessment (described on a separatesummary sheet). The IGARF analytically basedspreadsheet tools should be applied with particularcaution in hydrogeological situations where thecharacteristics of groundwater flow or groundwater –surface water interaction vary through the year (e.g. chalkwinterbournes). If groundwater abstraction impacts areimportant in these or other hydrogeologically complexsituations, it may be more appropriate to considerdistributed groundwater modelling.
Further information IGARF User Manual (Environment Agency Science Group).
< Section divider
This do
cumen
t was
with
drawn o
n 6 N
ovem
ber 2
017.

Assessment method summaries: Impact of Groundwater Abstraction on River Flows (IGARF) 4.6
Environment Agency in partnership with Natural England and Countryside Council for Wales Understanding water for wildlife
Str
ea
m d
ep
leti
on
fa
cto
r (m
3/d
ay
/m)
Cu
mu
lati
ve
str
ea
m d
ep
leti
on
(m3
/da
y)
Distance (m)
Profile of stream depletion factorand cumulative stream depletion
7
6
5
4
3
2
1
0
-6000 -4000 -2000 0 2000 4000 6000
2500
2000
1500
1000
500
0
Figure 1 Example of output from IGARF spreadsheets: Analytical prediction of stream flow depletion profile associated with a
groundwater abstraction
Well 1 base 1Theis Model
Stream depletion factor
Cumulative sdf
< Section divider
This do
cumen
t was
with
drawn o
n 6 N
ovem
ber 2
017.

Assessment method summaries: Licence Accumulation Diagram (LAD) 4.6
Environment Agency in partnership with Natural England and Countryside Council for Wales Understanding water for wildlife
SummaryType of system where appliedRivers, Lakes and Wetland.
Applicability to groundwater or surface waterSurface water and groundwater.
Hydrological data requirementsEstimates of the currently licensed abstraction impacts(e.g. groundwater level drawdown or flow reduction) ona water body.
Ecological data requirementsNone as such BUT can usefully add an indicative hydro-ecological sensitivity or hydrologically significantthreshold (HST).
Can method be used on its own?Useful screening technique to identify total cumulative‘in combination’ abstraction impacts, and theindividual licences contributing to this total, rankedaccording to the size of the impact or the date of issueof the abstraction licence.
Applicability to European interest featuresA standard hydrological technique which can beapplied to any site.
Resource requirementOnce the impacts have been derived, a ‘LAD’ can bequickly put together in a spreadsheet, whether or not aHST has been determined.
BackgroundLicense Accumulation Diagrams (LADs) are graphicalpresentations of abstraction licence impacts – eithergroundwater level drawdown or flow reduction impacts.They can be prepared either for a wetland site (usuallybased on drawdown estimates from all surroundinggroundwater abstractions, as in Figure 1), or for a lakeor assessment point on a river (usually based onabstraction related flow depletion estimates from allupstream abstractions).
The LAD shows the impact of each licence individuallyand ‘in combination’ with those plotted previously onthe diagram. The order in which the licences arepresented therefore influences the shape of the LADalthough the total impact of all the licences in
combination will not change. Licences are commonlyordered either according to the size of impact (smallestones first, largest last), to focus attention on thosehaving the greatest impact, or according to the date offirst issue (first one first, last one last) in order to reflectlicensing precedence. Both these types of LAD may beuseful when considering appropriate licensing options.
A ‘Hydrological Significance Threshold’ (HST) can beincluded on the LAD in order to highlight those licenceswhich exceed this threshold, either individually or incombination, to provide a focus for further stages ofimpact assessment. Also, a ‘triviality threshold’ can beincluded to identify licences that can be excluded fromfurther assessment due to the trivial nature of theirindividual impact. It is important to obtain agreementwith our own technical staff and those from partnerorganisations on any thresholds that are used.
Method description1. Carry out individual impact assessments for ALLlicences relevant to the site (e.g. drawdown or flowreduction). When applying to flow impacts on a riverassessment point take care to adopt appropriateconsumptiveness assumptions and to make someallowance for the return of other discharges (e.g.sewage treatment works) which are also upstream.
2. Copy these results into a spreadsheet and sortaccording to size of impact on one sheet, and date offirst issue on a second sheet.
3. Calculate cumulative impacts for both sheets andplot these, together with individual impacts as stackedbar plots (see illustration).
4. Add an agreed HST if available e.g. 5 cm drawdownhas been used as a Stage 2 HST for groundwater fedwetlands in East Anglia.
5. If needed, add an agreed ‘triviality’ threshold e.g.1mm drawdown has been used as a triviality thresholdfor groundwater fed sites in East Anglia.
Figure 1 shows a LAD for licensed drawdown impactspredicted at a wetland due to the licensed abstractionsaround it sorted according to the size of the predictedimpact.
Licence Accumulation Diagram (LAD)
4.6 Assessment method summaries
< Section divider
This do
cumen
t was
with
drawn o
n 6 N
ovem
ber 2
017.

Assessment method summaries: Licence Accumulation Diagram (LAD) 4.6
Environment Agency in partnership with Natural England and Countryside Council for Wales Understanding water for wildlife
UsesFrom the description above, LADs can be seen toprovide a useful and comprehensive representation oflicensed abstraction impacts for the purposes ofscreening and prioritisation.
0
1
2
3
4
5
6
7
7/34
/06/
*G/0
161
7/34
/04/
*G/0
075
7/34
/04/
*G/0
066
7/34
/06/
*G/0
256
7/34
/05/
*G/0
047
7/34
/06/
*G/0
163
7/34
/04/
*g/0
078
7/34
/05/
*G/0
049
7/34
/05/
*g/0
053
7/34
/04/
*G/0
064
7/34
/06/
*g/2
49
7/34
/05/
*g/0
051
7/34
/05/
*G/0
048
7/34
/06/
*G/0
181
7/34
/05/
*G/0
017
7/34
/05/
*G/0
036
(MH
)
7/34
/05/
*G/0
036
(HR)
7/34
/05/
*G/0
036
(WTW
)
Dra
wdo
wn(
m)
Licence numbers
HST = 0.05m Drawdown
Key:
Totalcumulative
effect
Contributionfromindividual
Note:
Based on increased drawdown effect to chalk groundwater at the fen. The impact in chalk groundwater does not necessarily represent theimpact on water level in the fen. List of licences current at 1 February 2000.
Figure 1 Licence Accumulation Diagram of licenced abstraction drawdown impacts at a wetland based on a single layer
analytical model
< Section divider
This do
cumen
t was
with
drawn o
n 6 N
ovem
ber 2
017.

Assessment method summaries: Flow naturalisation 4.6
Environment Agency in partnership with Natural England and Countryside Council for Wales Understanding water for wildlife
SummaryType of regime where appliedMainly riverine or estuarine. Consider also forassessment of inflows to reservoirs/lakes, embaymentsand natural or artificial flood washlands.
Applicability to groundwater or surface watersThe technique is intended to evaluate naturalised riverflow but requires both surface and groundwaterinfluences to be taken into account.
Hydrological data RequirementsGauged river flows. Surface and groundwaterabstractions (both licensed and non-licensed). Surfaceand groundwater discharges (both consented and non-consented). Major impoundment operations.
Ecological data RequirementsNone.
Can method be used on its own?Yes this can be a stand alone process but is of littlevalue in Review of Consents (RoC) unless incorporatedwith another application such as the ResourceAssessment & Management (RAM) framework.
Applicability to European interest featuresInterest features associated with regimes identifiedabove.
Resource requirementDepends upon level of flow naturalisation undertaken.Naturalised flows provide a benchmark and estimate ofthe natural flow regime. The methodology involvesmodifying a measured flow sequence by removing theimpact of Artificial Influences (AI); these areimpoundments, abstractions and discharges.
OverviewThe effort applied to flow naturalisation can bedependent upon the specific application and thetime/budget available for undertaking suchassessments.
There are 5 stages for flow naturalisation:Firstly, the flow sequence that is being naturalisedshould be assessed to determine whether it is ofsufficient quality. If the data is of a poor quality then
the naturalised time series may not be reliable, or fit forpurpose. If observed data is not available and modelleddata is used then an assessment of quality should alsobe carried out.
The flow record is then assessed to determine whetherit is significantly influenced. If not significantlyinfluenced then it may not be necessary to undertakeany further work.
The next step is to develop an understanding of thenature and scale of the AI in the catchment. Anunderstanding of the balance of AI in the catchment willidentify those where further investigation is required. AIwhich have the dominant impact on the estimatednatural flow will add to uncertainty.
Actual AI data is required for the timestep (daily ormonthly) and time period that is being assessed. Wherethis is not available for specific abstractions,discharges and impoundments then estimates aremade. These can be derived by applying averagemonthly usage profiles or using data from similar AInearby.
The impact of the AIs on the final naturalised flowrecord is assessed at the next stage. The impact of eachAI on the nearest river reach is also assessed to ensurethat local impacts are sensible.
At this point the following data will now be available:
• An observed flow time series• A time series of abstraction• A time series of discharge
Naturalisation is now a simple arithmetical process.
UsesFlow naturalisation enables the naturalised and actual(influenced) river flow regime to be compared andtherefore the quantitative impact of different consentsto be assessed. This is fundamental to the Review ofConsents (RoC) assessments. During such assessmentsit may be necessary to examine the potential influenceof AIs on the river flow by considering full licensedquantities rather than actual abstraction regimes. Thisapproach is implicit in the RAM framework.
Flow naturalisation4.6 Assessment method summaries
< Section divider
This do
cumen
t was
with
drawn o
n 6 N
ovem
ber 2
017.

Assessment method summaries: Flow naturalisation 4.6
Environment Agency in partnership with Natural England and Countryside Council for Wales Understanding water for wildlife
Additional informationEnvironment Agency, National Hydrology Group; Good practice in flow naturalisation by decomposition (Version 2);April 2001 (Revised 15 June 2001).
Environment Agency, Toolkit for flow naturalisation V1.0; December 2005
Environment Agency, Anglian Region; Regional Good Practice Guideline; The use of artificial influence data in flownaturalisation; (undated).
Environment Agency, Midlands Region; A guide to flow naturalisation (Version 3); September 1997.
Environment Agency, R&D; A review of techniques of applied hydrology in low flow investigations; Technical reportW6-057/TR; Sheet 12 – flow naturalisation; W S Atkins; 2001.
< Section divider
This do
cumen
t was
with
drawn o
n 6 N
ovem
ber 2
017.

Assessment method summaries: Low Flows 2000 4.6
Environment Agency in partnership with Natural England and Countryside Council for Wales Understanding water for wildlife
SummaryType of regime where appliedRiverine or Estuarine. Consider also for assessment ofinflow regimes to Reservoirs/Lakes, Embayments andnatural or artificial Flood Washlands.
Applicability to groundwater or surface watersThe technique is intended to estimate natural (andinfluenced) river flow statistics for ungaugedcatchments (or catchments with relatively limitedgauging records).
Hydrological data requirementsLow Flows 2000 (LF2000) can be run by nominating apoint on a GIS map or specifying a grid reference. Thedata underlying the system enabling estimates ofnatural flow include a digital terrain model, griddedhydrometeorological data, HOST soil class data andriver network data. In order to generate influence dataabstraction, discharge and impoundment data need tobe added.
Ecological data requirementsNone.
Can method be used on its own?Yes this can be a stand alone process but is of littlevalue in RoC unless undertaken to aid hydrologicalcharacterisation or impact assessment potentiallyrequired in the RoC process.
Applicability to European interest featuresInterest Features associated with regimes identifiedabove.
Resource requirementLow Flows 2000 (LF2000) is the Environment Agency’sstandard methodology for estimating flow statistics atungauged (or partially gauged) catchments enabling:
• Estimation of natural flow statistics for ungaugedcatchments (or catchments with very limited flowdata availability);
• Estimation of the impact on flow estimates (fromabstraction, discharge and impoundment activities).The impact on flows arising from such activities arecommonly referred to as influences; and
• LF2000 has an extensive application throughout theEnvironment Agency as a means of estimatingnatural flow statistics for ungauged catchments. Thecomparable use for estimating influences on flow
statistics throughout the Environment Agency issignificantly less due to the need to first populate thesystem with artificial influence data.
BackgroundLF2000 was developed by the Centre for Ecology &Hydrology (CEH) for the estimation of flow statistics forungauged catchments (or catchments with limited flowrecords) throughout England and Wales. The presentsystem succeeds the Micro Low Flows V2.1 systemdeveloped by the Institute of Hydrology (componentpredecessor to CEH) and is the result of a joint R&Dproject between CEH and the Environment Agency. Thesystem relies upon the development of the Region ofInfluence approach. This approach involves thederivation of catchment characteristics for the studycatchment and relating these to 10 selectedcatchments for which natural (or near natural) statisticalflow data are held within the LF2000 system and whichpossess the most similar set of characteristics.Estimates of flow statistics for the study catchment arethen generated using a weighted assessment of flowstatistics for the 10 selected (similar) catchments withthe weighting allowing greater emphasis for thoseselected catchments which have the most similarcharacteristics to the study catchment.
In order to generate estimates of natural flow statisticsthe system is highly automated enabling natural flowstatistics to be formulated very readily for any locationin England and Wales on the 1:50 000 river network.The potential output is generated, with reference todiscretised or mapped physical andhydrometeorological data (used to derive thecatchment characteristics), on both an annual andindividual monthly basis including:
• Mean flow; and• Flow duration (percentile exceedence) values.
Standard output from LF 2000 includes;
• mapped generation of the catchment boundary andthe relevant river network (which can be exported toArcView);
• mapped generation of influence locations such asabstractions and impoundments (which can beexported to Arcview);
• tabular listings of standard physical and
Low Flows 2000
4.6 Assessment method summaries
< Section divider
This do
cumen
t was
with
drawn o
n 6 N
ovem
ber 2
017.

Assessment method summaries: Low Flows 2000 4.6
Environment Agency in partnership with Natural England and Countryside Council for Wales Understanding water for wildlife
hydrometeorological parameter values (catchmentcharacteristics) for the study catchment;
• plus generation of residual flow diagrams for anynominated stretch of river. Imminent enhancementsof the system will allow this facility to be exported toArcView.
If available flow data for study catchments includes aspot flow or a short gauged flow record these data canreadily be compared with LF2000 output.
Incorporation of influence data for abstractions anddischarges into LF 2000 can be quite time consuming ifundertaken rigorously. The main driver within theEnvironment Agency giving rise to the systematicincorporation of influence data for catchments is theCatchment Abstraction Management System (CAMS)programme LF2000 output incorporating effects frominfluences includes:
• Modified mean flow (both annual and individualmonthly).
• Flow duration values (both annual and monthly).• Naturalised and Influenced longitudinal flow
accretion diagrams representing a particularstatistical flow condition such as the Q95 (theestimated flow exceeded for 95% of the time).
StrengthsThe main strengths of LF2000 in the application ofestimating natural flow statistics for ungaugedcatchments include:
• The available system is based on ‘best practice’ andforms the Environment Agency’s standard method forstatistical flow estimation in ungauged catchmentswith development fully supported by CEH;
• LF2000 benefits from a progressive evolution andbenefits from considerable expertise held by CEH;
• A simple, extensive and efficient user interface, GISbased and compatible with other EnvironmentAgency standard packages such as Excel, Word andArcView;
• Extensive use across the Environment Agency and inparticular for routine applications concerningabstraction licencing and discharge consentingassessments;
• The system benefits from extensive documentationand knowledge regarding strengths and weaknesses;
• Following initial investment in acquiring the systemit’s efficient user friendly interface leads to extensiveuse which makes it relatively cheap in the long term;and
• Wide use of the system means that a consistentapproach is adopted throughout the EnvironmentAgency.
Potentially, the strengths of utilising the LF2000routines for estimating influenced flows are comparableto those for natural flow estimation but adoption of thiscomponent within the system has been much morepatchy although it has been tied in with the CAMSpriorities.
WeaknessesThe main weaknesses of using LF2000 for estimation ofnatural flow regimes are that:
• It is only possible to generate set statistical flowvalues and not a complete time series simulation offlow (as a hydrograph).
• There are serious some questionmarks regarding thereliability of low flow estimation (particularly in Chalkand Limestone dominated catchments otherwise theresulting flow statistics produced are generallyregarded as reliable.
• There is a need to be vigilant regarding the automaticgeneration of catchment areas, using the DTMoption, and in particular where:– drainage systems may be subject to artificial
influence (i.e. diversions).– the area of interest incorporates low lying/relief
zones where watersheds are difficult to depictwithout specific knowledge.
Where such complications are believed to occur use ofthe analogue option for catchment delineation may bemore appropriate.
Additional weakness considerations with generation/estimation of influences on flows includes:
• time consuming/onerous to populate the databasewith data on a rigorous basis.
• no allowance can be routinely made for possiblerouting processes involving attenuation applicable tonon steady state surface water abstractions/discharges.
• potential questionmarks over the incorporation ofgroundwater abstractions and their translation intoriver flow influences including:
– inadequacies of the Theis-Jenkins technique. Mostgroundwater abstraction licences will have beenloaded using this method, though since version4.2.1 users can override this with their owncalculations.
– a need to recognise that surface catchment andgroundwater capture areas may be quite differentand therefore the automatic assignment ofgroundwater influences generated by LF2000 mayrequire manual editing.
< Section divider
This do
cumen
t was
with
drawn o
n 6 N
ovem
ber 2
017.

Assessment method summaries: Low Flows 2000 4.6
Environment Agency in partnership with Natural England and Countryside Council for Wales Understanding water for wildlife
The rigour with which influences are assigned in aLF2000 application may vary in accordance with thepurpose, the nature of the catchment and availabletime/budget constraints for the study. For example, in alarge catchment with a low baseflow index and wherethe dominant influence on the flow regime is fromsurface water abstractions there is probably no need toworry about variations between the surface catchmentand groundwater capture zones or the translation ofgroundwater abstractions into impacts on river flow.
UsesLF2000 is a very efficient system for generatingestimates of natural flow statistics for an ungaugedcatchment (or catchment with very limited records). The method has widespread application across theEnvironment Agency. Output can be used to help informhydrological characterisation and impact assessment forthose sites involved in the RoC (or similar) processwhere inflows from a river system may be of significancesuch as in riverine, estuarine and controlled washlandsub-domains as well as river fed lake/reservoir systems.Care should be exercised in generation/use of resultingoutput from groundwater dominated catchments(particularly incorporating Chalk or Limestone aquifers).Vetting of output by Area based Hydrologists/Hydrogeologists is recommended and use of outputshould generally be limited to initial screening, andconservatively based, applications for the RoC.
LF2000 can also be used efficiently as a basis for scalingnaturalised flows (derived from gauged records andincorporating removal of influence effects) for a gaugedlocation to a non gauged location elsewhere within thesame catchment. The process suggested involves:
• generating estimates of flows, covering a range of standard percentile exceedence values, for boththe gauged and non gauged location of interestusing LF 2000;
• normalising these estimated flows from cumecs toequivalent yield (l/s/km2);
• developing a variable conversion factor based oncombining the ratios of both catchment area andnormalised flow (equivalent yield) estimates togenerate a factor which varies with flow percentileexceedence. A possible approach for this applicationis given in Ref 1;
• In general, LF2000 should be considered for RoC instudy catchments where;
• the relevant database has already been populatedwith influence data for a CAMS (or other) study;
• the inflowing river to a site is ungauged and ofrelatively small proportions; and
• the river system is not baseflow dominated andinfluences on the river are predominantly fromsurface water abstractions (and/or discharges).Alternatively, in groundwater dominated catchmentswhere influences are predominantly fromgroundwater abstractions an alternative, moreconceptually based, approach is suggested possiblyusing IGARF (see the alternative Method Summary).
If the study requirement necessitates an assessmentusing time-series rather than statistical flow summariesthen an alternative method is required enabling thenatural riverflow for the river system to be simulated(see alternative Method Summary on Rainfall-RunoffModelling).
Data requirementsStandard application of LF2000 for generation of naturalflow estimates requires no data as the requisite needsare all integrated into the system. For study catchmentsincluding spot flow or short gauged records LF2000 canbe populated with these data to enable comparisonsbetween selective output and available data.
Utilisation of the influence procedures within LF2000requires abstractions, discharges and impoundmentsdata to be populated and routines have beendeveloped enabling the automatic transfer ofabstraction licence data and discharge consent datafrom standard output of the Environment Agency’sNALD and WIMS respectively. However, this process isnot straightforward and is likely to be time consumingfor any significant catchment application although insome instances these data have already beenincorporated particularly under the CAMS programme.
ApplicabilityLF2000 may provide useful output to aid RoCassessments particularly involving riverine andestuarine regimes and possibly involving shallow tidalembayments, reservoirs/lakes and natural/controlledflood washlands.
< Section divider
This do
cumen
t was
with
drawn o
n 6 N
ovem
ber 2
017.

Assessment method summaries: Low Flows 2000 4.6
Environment Agency in partnership with Natural England and Countryside Council for Wales Understanding water for wildlife
Further information Ref 1; ‘Lookup details on LF2000 scaling’; Environment Agency – Anglian Region; Flow Institute of Hydrology;Low Flow Studies Report; 1980.
Institute of Hydrology; Low Flow Estimation in the United Kingdom; Report 108; 1992.
Environment Agency Internal Guideline; Implementation of Low Flows 2000 within the EA; (undated).
Centre for Ecology & Hydrology; Low Flows 2000; Quick Reference Notes 1 to 5; Various.Note; further information on LF2000 is available to Environment Agency staff through the Intranet service under Solutions.
< Section divider
This do
cumen
t was
with
drawn o
n 6 N
ovem
ber 2
017.

Assessment method summaries: Macro-invertebrate biotic indices 4.6
Environment Agency in partnership with Natural England and Countryside Council for Wales Understanding water for wildlife
SummaryType of system where appliedRiverine.
Applicability to groundwater or surface waterPrimarily surface water, but can be used to measuregroundwater impacts.
Hydrological data requirementsYes – Can be linked to gauged or modelled flow data.
Ecological data requirementsPossible to generate predictive data, but most usefulwhen comparing actual data gathered through fieldsurvey. Most valuable comparison is observed longterm data with historic flows.
Can method be used on its own?Yes – possible to use the method in a variety ofdifferent ways to evaluate impacts. May need to becorrelated to water quality, flow or RHS data to explainpatterns due to low flow, quality or habitat impacts.
Applicability to European interest featuresOnly those associated with riverine systems. Useful forsite characterisation and for defining the generalsensitivity/status of the site in question.
Resource requirementTime consuming, requiring data collection andprocessing. However, extensive data should alreadyhave been collected through water quality/waterresource monitoring on riverine sites, so resourcerequirements may be reduced.
The scoring or ranking of macro-invertebrateassemblages on the basis of their sensitivity to changesin the environment, provides a useful means ofidentifying or predicting the effects of environmentalstress. Biotic indices, such as River Habitat Survey(RHS), provide a useful means of identifying the effectof low flows on invertebrate communities. Other indicessuch as Biological Monitoring Working Party (BMWP)score or Average Score Per Taxa (ASPT) are primarilydesigned to assess organic pollution in a river,although these indices may also respond to flowvariation.
Abstraction may impact on the macro-invertebratecommunity by reducing the dilution of pollutants, or by
affecting the flow regime. Both changes can beassessed using macro-invertebrate indexing methods.Low flows, either as a result of abstraction or naturaldrought, cause habitat change through reductions inwater depth, exposure of margins or midchannelhabitats, and silt deposition. There may also be adecline in water quality though increased temperature,decreased dissolved oxygen and increasedconcentrations of pollutants. Changes in flow may alsoimpact directly on flow-sensitive species, leading tochanges in species diversity at a site. Engineeredmodification of riverine habitats may also adverselyaffect the colonising macroinvertebrate fauna and alterthe natural response of this community to changes inflow.
IntroductionBenthic macro-invertebrates are widely regarded as thepreferred group for assessing water quality. Samplingprocedures for this group are well developed and thereis a range of detailed identification keys available formost taxonomic groups. Most macro-invertebrates arerelatively sedentary and exhibit a variety of differenttolerances to environmental conditions, which meansthat they can be used to locally monitor environmentalchange over time.
Many macro-invertebrate species show a clumpeddistribution across a site in relation to the distributionof meso-habitats. Standard sampling techniques havebeen designed to compensate for this distribution, bycovering all meso-habitats present and sampling eachhabitat present with an effort that is proportional to itsoccurrence. Consequently a single sampling techniqueusually provides a representative sample for a site.
A variety of sampling techniques are employed forcollecting macro-invertebrates, the most widely usedbeing the ‘kick sample’ using a hand net. Othertechniques include benthic grabs, emergence traps anddrift samplers. The last three methods are highlyspecies/habitat specific and are not designed forgeneral macro-invertebrate sampling. Furtherinformation on standard Environment Agency samplingtechniques can be obtained from Procedure forcollecting and analysing river macro invertebratesamples, Report no. BT001, Issue 2.0, (EnvironmentAgency, 1999).
Macro-invertebrate biotic indices
4.6 Assessment method summaries
< Section divider
This do
cumen
t was
with
drawn o
n 6 N
ovem
ber 2
017.

Assessment method summaries: Macro-invertebrate biotic indices 4.6
Environment Agency in partnership with Natural England and Countryside Council for Wales Understanding water for wildlife
Method descriptionA number of biotic indices have been developed toassess water quality, which are based on the numberand sensitivity of different macro-invertebrate taxa. Inthe UK the most widely used of these indices is theBMWP score. This scores each macro-invertebratefamily present between 1 and 10, depending upon theirperceived susceptibility to organic pollution. The mostsensitive families, for example mayflies and stoneflies,are given the highest scores. The BMWP score is thetotal score for all families present in a sample.
If this score is divided by the total number of BMWPscoring taxa present in a sample, the Average Score PerTaxon (ASPT) is calculated. The ASPT has been found tobe less influenced by the season or sample size thanthe BMWP score, and consequently provides a betterindicator of water quality over a wide range ofconditions. BMWP, and to a lesser extent ASPT, areinfluenced by habitat quality, and therefore this mustbe considered within any interpretation.
River Invertebrate Prediction And Classification System(RIVPACS) has been developed to evaluateenvironmental stress (water quality) as reflected ininvertebrate communities. RIVPACS has two distinctcomponents:
1. It offers site-specific predictions of the macro-invertebrate fauna based on environmental features,and provides an indication of the fauna that might beexpected at a site in the absence of environmentalstress (comparison of the ‘expected’ fauna with thefauna observed at a site is the basis for a biologicalassessment);
2. It includes a system for locating sites of highbiological quality within a national classification ofsites, using macro-invertebrates.
The prediction system is built on a classification ofrunning water sites. There are 35 classification groupsbased on the macro-invertebrate fauna recorded at 614high quality reference sites distributed throughoutGreat Britain. A total of 637 macroinvertebrate taxahave been recorded at the reference sites. New sites ofhigh biological quality can be placed within the existingsite classification.
A recent development in the use of macro-invertebrateassemblages to monitor environmental change, is thedevelopment of the Lotic-invertebrate Index for FlowEvaluation (LIFE) methodology. Different taxa have beenshown to have different flow sensitivities, which arecategorised as follows:
I RapidII Moderate/fastIII Slow/sluggishIV Flowing/standingV StandingVI Drought resistant
(Note ; Flow is used in the hydrological sense, to refer toriver discharge, measured in volume/time. The LIFEscore flow group weightings relate to perceivedsensitivity to high/low velocity and silt/coarsesubstrata. In-river velocity is a product of both flow(discharge) and channel structure/habitat.)
The index additionally considers the relative abundanceof individual taxa, thus for a given site flow scores forthe represented taxa are combined to produce anoverall weighted average (the LIFE score). Higherantecedal flows produce higher LIFE scores.
RIVPACS predictions, alongside historic observed data,provide a means of both classifying the sensitivity of asite and standardising hydroecological information bymeans of observed to expected LIFE ratios. The analysisof LIFE against gauged flow data, provide a means ofassessing a site over time and inferring the impact oflow flows.
In addition, multivariate analysis tools may be used inecological studies to provide a highly valuable way oflinking observed changes in communities (eitherspatially or temporally) with environmental trends,where historic data exists or where large data sets havebeen collated.
SensitivityAquatic invertebrates provide an extremely usefulindicator of water quality and water quantity. Habitatquality can be inferred from biotic scores, but indicesare not typically used as a habitat indicator. However,care needs to taken when using biotic indices as theymay reflect the effect of a number of influences. Forexample an upland site may yield a low ASPT scorebecause of a recent reduction in water quality (whichmay be linked to low flow) or because substratecompaction has occurred or a combination of the two.LIFE scores are a little bit more robust, but care alsoneeds to be adopted when assessing data generated inthis way. Consequently biotic indices may need to beconsidered with water quality, water quantity and RHSdata when assessing cause and effect mechanisms.
In this context, recent work by CEH (Dunbar et al 2006)has shown strong links between habitat modificationand LIFE score, with more modified sites having lower
< Section divider
This do
cumen
t was
with
drawn o
n 6 N
ovem
ber 2
017.

LIFE scores and a steeper slope of response of LIFE toflow. These findings may have far reaching implicationsfor river management in the future.
LIFE scores are a key element of the EnvironmentalWeighting component of the Resource Assessment andManagement Framework. It may therefore follow thatRAM is a useful tool to use alongside macro-invertebrate data.
Care needs to be taken when interpreting macro-invertebrate data, as at some sites themacroinvertebrate community appears to respond to theprevious years summer flow and not the current year.
ApplicationAs previously discussed, the relatively sedentary natureof benthic macro-invertebrates and the fact that theyare sensitive to changes in environmental quality, meanthat they are useful ecological indicators. The frequencyat which the Environment Agency collects invertebrate
samples means that data can only be used to detecttrends over relatively long timescales, i.e. year on yearand seasonal trends. Extensive historic data generallyexists and can be used to assess the impact of lowflows/abstraction.
As noted, LIFE scores may be used, in combination withother indices, to examine the effects of flow changes onthe macro-invertebrate assemblage. RIVPACS allowspredicted LIFE scores to be generated for sites based oncertain morphological characteristics. Although thesepredictions should be treated with caution, they doprovide a useful mechanism for assessing the effects ofproposed abstractions, and the review of existingconsents and authorisations.
Assessment method summaries: Macro-invertebrate biotic indices 4.6
Environment Agency in partnership with Natural England and Countryside Council for Wales Understanding water for wildlife
Further informationWright J F, Furse M T and Symes K L (1997). ‘Practical sessions on RIVPACS III’, Institute of Freshwater Ecology,Wareham, Dorset.
Cox R et al (1997). ‘RIVPACS III – User Manual’, Institute of Freshwater Ecology, Wareham, Dorset.
Murray-Bligh J A D (1997). ‘Procedure for collecting and analysing macroinvertebrate samples’, Institute ofFreshwater Ecology, Wareham, Dorset.
Extence C A, Balbi D M and Chadd R P (1999). ‘River flow indexing using British benthic macro-invertebrates: Aframework for setting hydroecological objectives’, Regul. Rivers: Res. Mgmt. 15: 543-574.
Clarke R T (2003) Investigation of the relationship between the LIFE index and RIVPACS: Putting LIFE into RIVPACS.Environment Agency R&D Technical Report W6-044/TR1
Clarke R T, Dunbar M J (2005) Producing generalised LIFE response curves. Environment Agency Science reportSC990015/SR
Dunbar M J, Young A R, Keller V (2006) Distinguishing the relative importance of environmental data underpinningflow pressure assessement. Environment Agency R&D report. In press.
< Section divider
This do
cumen
t was
with
drawn o
n 6 N
ovem
ber 2
017.

Assessment method summaries: MORECS/MOSES 4.6
Environment Agency in partnership with Natural England and Countryside Council for Wales Understanding water for wildlife
SummaryType of system where appliedAll water body types (river catchments, lakesand wetlands).
Applicability to groundwater or surface waterSurface water and groundwater.
Standard applicationsSite or catchment water balance assessments. Inputtime series or starting conditions for hydrologicalmodelling (e.g. recharge or rainfall runoff models).
Ecological data requirementsNone as such BUT can use the resulting impactestimates within the RAM framework in order to compareflows against ecologically based river flow objectives.
Applicability to European interest featuresInterest features associated with regimesidentified above.
Resource requirementStandard outputs are available so resourcerequirements are minimal.
MORECSMORECS (the Meteorological Office Rainfall andEvaporation Calculation System) operates on a 40 kmgrid square basis across the UK. The model runs on adaily timestep to produce weekly and monthlyestimates of a number of water balance components(e.g. rainfall, actual evaporation, effective rainfall).
Climatic information from a network of stations is usedto calculate potential evaporation (PE) including;sunshine; temperature; wind speed; vapour pressure;and albedo (which varies for different vegetation/landtype). The Penman – Montieth Soil Extraction Model isthen used to calculate actual evaporation for threebroad classes of soil type (High, Medium and Low WaterAvailability) and a wide range of different crop types(including bare soil).
A wide variation of outputs are available from theMORECS model covering three soil types and a varietyof vegetation and land use types. Of particular use are outputs for Grass and Real Land Use. The mainoutputs are:
• Soil Moisture Deficit (SMD), an indicator of thedryness of the soil at 09:00 on each day
• Actual Evaporation (AE)• Hydrologically Effective Rainfall (HER) or Effective
Rainfall (ER)
Data is calculated from 1961 to present.
MOSESMOSES (Met. Office Surface Exchange Scheme) operateson a 5 km grid square basis across the UK and westernEurope at an hourly timestep. The inputs are direct fromthe Met Office’s Numerical Weather Prediction (NWP)model. Radar rainfall and other remotely sensed inputsare used instead of climate station data. The MOSESmodel is considered state of the art by the Met Officeand will eventually replace MORECS.
A vast range of products are available from the MOSESmodel at an hourly and daily resolution. These includesnow melt, actual evaporation and subsurface runofffor example. Soil Moisture Deficit is available but is notan explicit output from the MOSES model.
The Met Office has been running the MOSES model for acouple of years but it is not yet a commercially availableproduct as MORECS currently is.
Outputs for the MOSES and MORECS models are notdirectly comparable given the inherent differences inmodel formulation, input datasets and the spatial andtemporal resolutions.
Uses of MORECS/MOSES dataUses of the MORECS/MOSES data are outlined below;
• As a broad estimate of ER inputs to a wetland site. Thismay need to be revised to account for local variationsin rainfall as a result of topographical considerations.
• To assess evaporation demands (open water andspecific land use) on a site, which can be comparedwith estimates of inflow (from surface orgroundwater). The data can then be used to assesswhether the site has the potential to becomestressed in water balance terms.
• As an input into a rainfall runoff model. PE data andlocally derived rainfall estimates can be used in themodel to estimate river flow, rapid runoff, interflowand recharge to groundwater.
• As a direct input into a soil moisture / recharge modelto calculate ER for use with groundwater models.
MORECS/MOSES
4.6 Assessment method summaries
< Section divider
This do
cumen
t was
with
drawn o
n 6 N
ovem
ber 2
017.

Assessment method summaries: MORECS/MOSES 4.6
Environment Agency in partnership with Natural England and Countryside Council for Wales Understanding water for wildlife
Further information Entec, 2001; Strategy for Groundwater Investigations and Modelling; Potential Evaporation Analysis Methodology,for Anglian Region Environment Agency.
Entec, 2000; Strategy for Groundwater Investigations and Modelling; Rainfall Analysis Methodology for AnglianRegion ‘Strategy’ Project;
Essary, R., Best, R. & Cox, P., 2001; MOSES 2.2 Technical Documentation. Hadley Centre Technical Note 30, MetOffice, 30pp.
Monteith, J L, 1973; Principles of Environmental Physics; Edward Arnold; London.
MORECS, 1982; The Meteorological Office Rainfall and Evaporation Calculation System:MORECS (July 1981). Hydrological Memorandum 45.
MORECS, 1996; The Meteorological Office Rainfall and Evaporation Calculation System:MORECS version 2.0 (1995).
Penman H L, 1948; Natural evaporation from open water, bare soil and grass, Proc. Roy. Soc. London, A193, 120-146.
WS Atkins, 2001; Environment Agency – R&D; A Review of Techniques of Applied Hydrology in Low FlowInvestigations; Technical Report W6-057/TR; Sheet 3 – Rainfall & Evaporation Analysis.
< Section divider
This do
cumen
t was
with
drawn o
n 6 N
ovem
ber 2
017.
Assessment method summaries: Rainfall – runoff modelling 4.6
Environment Agency in partnership with Natural England and Countryside Council for Wales Understanding water for wildlife
SummaryType of system where appliedRiver catchments, inflows to lakes or online reservoirsand freshwater inputs to estuaries.
Applicability to groundwater or surface waterSurface water and groundwater where the requirementis to produce time series for a aquifer unit (effectiverainfall) or catchment (river flow). Some models canproduce recharge and baseflow time series. Whereinformation is required on flows and levels over awider area a distributed approach may be required.Please refer to the Method Summary for DistributedGroundwater Modelling.
Hydrological data requirementsThe inputs to rainfall runoff models are time series(areally averaged or spatially distributed) of:
• Precipitation• Potential Evaporation.
Other input time series can include:
• Abstractions (surface & groundwater)• Discharges (surface & groundwater)• Observed flow at calibration point(s).
Calibration parameters can be based upon physicalcharacteristics of the following:
• Catchment Area• Land Use types• Soils• Geology• Topography• Channel characteristics.
The type of model will determine the scale at whichthis information is used.
Ecological data requirementsNone.
Can method be used on its own?Yes, to assess/illustrate the inputs, outputs andstorage changes in the water body. This assessmentneeds to be combined with an ecological assessmentto determine whether changes in any of the waterbalance components impact on the ecological featureat the site.
Applicability to European interest featuresInterest Features associated with regimes identifiedabove.
Resource requirementDepends upon nature and complexity of modellingundertaken.
Uses of rainfall runoff modellingRainfall runoff models are used by hydrologists, waterresource planners, engineers and others (CATCHMOD,Conceptual Rainfall Runoff Model, Technical User Guide& Software Manual for Catchod v4.03, EnvironmentAgency, 2005) to:
• extend existing time-series flow records (backwardsor forwards in time) to include historic periods ofdrought or flooding, or bring a closed gauging stationrecord up to date;
• infill gaps where part of a gauging station record isunavailable, due to performance or data transferproblems or temporary closure eg duringrefurbishment;
• estimate time-series flow data at ungauged sites, ifflow estimates for calibration data can be made withconfidence;
• estimate natural flows at gauged artificially-influenced sites, by calibrating the model withobserved surface and groundwater abstractions anddischarges;
• provide recharge time series for groundwater models.
Natural or artificially-influenced river flows, whethersimulated or measured or a combination, are used for avariety of applications (CATCHMOD, Conceptual RainfallRunoff Model, Technical User Guide & Software Manualfor Catchod v4.03, Enviroment Agency, 2005) to:
• assess the impact of existing or proposed individualabstractions or discharges on river flow;
• assess the impact of different potential abstractionor discharge regimes;
• set abstraction licensing policies (through theEnvironment Agency’s Catchment AbstractionManagement Strategies – CAMS);
• estimate natural time-series of flow at a gaugedlocation and transpose to ungauged locations;
• assess how water resource systems (surface andgroundwater abstractions and reservoir controloperations) behave under historic drought or floodconditions – to plan to meet water resource demandsand set or amend the complex flow-dependentcontrol conditions;
• forecast future water resource availability underdifferent rainfall scenarios e.g. the impact of 60%rainfall over the next 6 months on river flow;
Rainfall – runoff modelling
4.6 Assessment method summaries
< Section divider
This do
cumen
t was
with
drawn o
n 6 N
ovem
ber 2
017.

Assessment method summaries: Rainfall – runoff modelling 4.6
Environment Agency in partnership with Natural England and Countryside Council for Wales Understanding water for wildlife
• assess the potential impact of climate change onrivers and reservoir inflow sequences e.g. usingfactors to produce scenario rainfall and PE series;
• calibrate real-time flood forecasting models off-line;• calibrate flood estimates (flow and volume) feeding
flood inundation and impact design studies (e.g.100-year flood mapping);
• feed water quality and ecological impactassessments and policy making.
The use of rainfall runoff models needs to beproportionate to the objectives of the project, in somecases a more complex approach may be needed whilein others a simpler approach could be used.
Types of rainfall runoff modelIn general rainfall runoff models used in waterresources fall into two broad conceptual categories:
• ‘Lumped’ Models;• ‘Distributed component’ Models.
Single event models and linear transfer models havenot been included in this document but are used inconjunction with the types of model above in flood riskmanagement.
‘Lumped’ Models‘Lumped’ Models generally incorporate a number ofstores and functions to represent movement of waterinto, through and out of a catchment. Typically, storagefluxes may be estimated for the soil zone(s) and anumber of groundwater zones. The total modelledhydrograph, depending on the model can be dividedinto different types of response, typically baseflow,inter-flow and rapid runoff.
Some of the main models commonly used in waterresources include:
CATCHMOD: This is the Environment Agency’s rainfallrunoff model and currently the most used within waterresources. Its main features are that the model:
• uses 3 conceptual stores representing soil moisture,upper and lower catchment storage;
• has a hydrological zone structure which allows themodel to be run in parallel on up to 10 hydrologicallysimilar zones (based on geology, topography or landuse). Individual zones are summed to give total flow.The individual calibration of the zones allows waterto pass through the stores at different rates;
• has a simple structure with only 5 physically-meaningful parameters per hydrological zone, withconsistent meanings between zones. This makes themodel easy to understand and restrict parameters torealistic values;
• is applicable to both baseflow dominated and flashyresponse catchments;
• can include abstractions from groundwater and riversources, and discharges to river;
• Rainfall, PE and artificial influence inputs may bezone-specific or common;
• Can be run at daily, hourly or 15 minute timeintervals;
• has an optional channel routing (translation andattenuation) module for sub-daily mode.
• Does not allow auto-calibration of parameters toensure user understanding and parameter realism,but manual changes are easily and rapidlyimplemented;
The model is available as an Excel spreadsheet to thirdparties to purchase from the Environment Agency.
HYSIM (Hydrological Simulation Model): This modelwas originally developed by Ron Manley and SevernTrent Water Authority. HYSIM incorporates a five storemodel which enables the combination of rapid runoff,interflow and baseflow components. The model uses22 parameters, which can be automatically optimised.It also facilitates routing and can be undertaken forconventional and ponded river channels as well asimpounded reservoirs. Large river basins can bedivided into sub-catchments. The model is no longerwidely used in the Environment Agency. If you wish touse this model, please contact the Water ResourcesHelpdesk so that the Hydrology and Hydrometry Policyteam can discuss your needs.
IHACRES (Identification of unit Hydrographs AndComponent flows from Rainfall, Evaporation andStreamflow data): This is an Australian model whichcan produce both rapid and slow responsecomponents. The model is not widely used in theEnvironment Agency. If you wish to use this model,please contact the Water Resources Helpdesk so thatthe Hydrology and Hydrometry Policy team can discussyour needs.
MIKE-11 Rainfall-Runoff module: This model utilises fourstores to represent responses from snow, the surface,the root zone and groundwater. It can model artificialinfluences and sub catchments. The model is relativelydata and parameter intensive and cannot be usedwithout other MIKE-11 modules. There is a perceptionthat the model does perform well in groundwaterdominated catchments with both high and variableaquifer transmissivities. Transmissibility is the rate offlow of water through the aquifer. MIKE 11 is not widelyused in water resources but it is used in a small numberof catchments in Anglian Region for flood forecasting.
< Section divider
This do
cumen
t was
with
drawn o
n 6 N
ovem
ber 2
017.

Additional models, such as the Stanford WatershedModel and the HEC HMS Model are available but arenot used within the Environment Agency.
‘Distributed Component’ ModelsThese models describe each component of thehydrological cycle through complex mathematicalequations. They are more resource intensive than‘lumped’ models in terms of data requirements and theability to successfully calibrate them. They require timeseries input data and calibration parameters for eachgrid point of the model, which can have a significantnumber of nodes on the finer gridded models. Thesemodels may be appropriate for certain designated siteswhere water movement is very complex but rely on thedevelopment of a conceptual understanding of the sitethrough water balance assessments. It may also beappropriate to consider hydraulic models (ISIS, MIKE11or more complex 2D and 3D models) in these terms.
MIKE-SHE: Developed by the Danish Hydraulic Institute,this model provides a very detailed ‘physically’ basedhydrological modelling procedure potentially suitablefor all types of catchments. The model enablesintegrated simulations of riverflow, subsurface(saturated and unsaturated) flow and over land flow.These models require a great amount of data input andcan be challenging to calibrate.
SHE-TRAN: This model is essentially based on the sameprototype as that used to develop
MIKE-SHE and has been further developed by theUniversity of Newcastle Upon Tyne as primarily aresearch tool.
4R coupled with MODFLOW: MODFLOW is a wellrecognised and distributed groundwater model codedeveloped by the USGS (US Geological Survey) andused for groundwater resource assessments. 4R is aninterface developed by Entec to work in conjunctionwith MODFLOW. It provides a ‘physically’ based modelfor apportioning effective rainfall to rapid runoff,interflow and groundwater recharge (this componentprovides the recharge input to MODFLOW,) a routingmechanism for integrating runoff, interflow andbaseflow (output from MODFLOW) and spatiallyaccreting riverflow.
Modelling Lowland/Ponded River SystemsSpecial consideration may be required for themodelling of flows in river systems which transectlowlands and are ponded, such as those in the EastAnglian fens and Somerset Levels.
These river systems, sometimes referred to as‘Highland Carriers’ are usually embanked and held atretention levels. These levels are; invariably higherthan surrounding lowland drainage system levelswhich tend to be pumped; and, much of thesurrounding land levels. Along such embankedstretches some degree of seepage is likely to occur andthis can be ‘lost’:
• if the lowland drainage system does not drain to (oris pumped back in) the source river; or,
• in summer, where such leakage may go to meet local‘riparian’ demands.
In these circumstances careful selection of a distributedcomponent model or hydraulic model will be required.
Further information Atkins W S, 2001; A Review of Techniques of Applied Hydrology in Low Flow Investigations; Sheet 12 – FlowNaturalisation Environment Agency – R&D Technical Report W6-057/TR;
Barker J A, Kinniburgh D G and MacDonald D M J, 1995;NRA R&D Project Record 295/20/A; GroundwaterModelling and Modelling Methodology;
Entec; 2002; A Review of Water Resource Assessment Methods and Licensing Practices in Fenland Areas.Environment Agency – NGLC Project Ref. NC/01/63.
Entec, 2000:The Strategy for Groundwater Investigation & Modelling; Description of 4R Code (ConfidentialBriefing Document), for Environment Agency – Anglian Region;
Environment Agency, 2005; CATCHMOD, Conceptual Rainfall Runoff Model, Technical User Guide & SoftwareManual for Catchmod v4.03.
Manley, R.E, 2003, HYSIM User Guide and Reference Manual.
Assessment method summaries: Rainfall – runoff modelling 4.6
Environment Agency in partnership with Natural England and Countryside Council for Wales Understanding water for wildlife
< Section divider
This do
cumen
t was
with
drawn o
n 6 N
ovem
ber 2
017.

Assessment method summaries: River Habitat Surveys 4.6
Environment Agency in partnership with Natural England and Countryside Council for Wales Understanding water for wildlife
SummaryType of system where appliedRiverine – headwaters to tidal limit
Applicability to groundwater or surface waterSurface waters only
Hydrological data requirementsNone
Ecological data requirementsRiver bank and channel morphological data collectedfor 500m reaches together with data on riparian andfloodplain land use and map data. Incidental speciesdata also recorded.
Can method be used on its own?Yes, but best used in association with data collectedusing other techniques. A national database allowscomplex assessments to be carried out by comparingdata with other sites.
Applicability to European interest featuresApplicable for riverine interest features, where it may bepossible to identify habitat interactions/relationships.
Resource requirementThe survey takes approximately 1 hour to complete.Rapid data input and standard reports have beendeveloped for easy data extraction. Habitat quality andhabitat modification scores are automaticallycalculated in the database.
River Corridors, which include the river, its banks andthe adjacent land, may be surveyed using a variety ofdifferent techniques to identify and quantify thehabitats that are present. River Habitat Survey is atechnique that has been adopted routinely in recentyears throughout England, Scotland and Wales. Thetechnique involves the collection of a range ofmorphological, land use and habitat data along 500 msections of river, the site data subsequently beingcompared with a national database comprising datafrom over 15 000 sites.
The large baseline data set used for carrying outanalyses makes RHS an extremely useful evaluationtool. RHS is currently undergoing further developmentto improve its applicability over a range of functions.
BackgroundRiver Habitat Survey (RHS) is a technique used toassess the physical structure of freshwater streams andrivers based on a standard 500 m length sample unit.Although the technique does not require specialistgeomorphological or botanical expertise, it doesrequire the consistent recognition of features used inthe assessment. For this reason all surveyors have to beaccredited if the surveys are carried out for EnvironmentAgency, Natural England, CCW or SEPA, or if the resultsare to be entered onto the national database.
Method descriptionRHS involves a walk-over survey of a 500 m section ofriver bank, recording various bank-side and in-channelhabitat features using a standard recording form. At 50m intervals throughout the survey section ‘spot checks’are carried out: each spot check comprises anassessment of flow types, physical features, vegetationstructure, land use and vegetation types. There is alsoan opportunity at the end of the survey to identify anyfeatures present that were not picked up during thespot checks. There is also a requirement to recordvarious channel dimensions together with backgroundmap-based information.
The National RHS database is a repository of RHS dataheld by the Environment Agency, comprising morethan15 000 sites across the UK. The data in thedatabase can be used to compare habitat parametersfrom similar rivers nationwide, allowing an assessmentto be made of the the habitat quality and habitatmodification of a particular river. RHS methods haverecently been reviewed and an updated methodology(RHS 2003) is now available.
A complementary module for RHS has been developedto collect detailed geomorphological and floodplaindata. The methods for this were finalised in Nov 2005,pilot testing is currently being investigated.
ApplicationThe national RHS database is continuously developing asmore and more sites are completed and added to thedatabase. This provides a significant quantity of baselinedata from which sitespecific analyses can be made.
River Habitat Surveys (RHS)
4.6 Assessment method summaries
< Section divider
This do
cumen
t was
with
drawn o
n 6 N
ovem
ber 2
017.

Assessment method summaries: River Habitat Surveys 4.6
Environment Agency in partnership with Natural England and Countryside Council for Wales Understanding water for wildlife
For each river system RHS can be used to carry out anevaluation of habitat suitability for fish communities,using key parameters such as substrate and flow type.Previous analyses have been carried out by theEnvironment Agency on other river systems, for examplethe River Lune for salmonid fish. Analyses have alsobeen carried out to identify other habitat associations,such as water vole on the River Arun in Sussex, and apilot study on coarse fish communities in Midlands.
RHS could be applied to the analysis of habitat qualityfor any of the species interest features or theirindividual life stages, in those reaches considered to beaffected by water resource operations. Survey datawould be gathered for a representative range of sitesand the various inchannel features, such as substratetype and flow type, could be compared to referencesites elsewhere within the catchment and nationally.Using these data in combination with ecological surveydata, it should be possible to identify:
• optimal habitats for certain species or life stages;• optimal habitats poorly utilised by certain species or
life stages;• sub-optimal habitat.
Where optimal habitat has been identified which ispoorly utilised by a certain species, furtherinvestigations may be required to identify the causalfactor, e.g. substrate quality or poor water quality.
Habitat Management Tools (HMTs) are in the process ofbeing developed for some riverine Habitats Directivespecies such as bullhead (Cottus gobio (L.)). HMTs willprovide statistical models of habitat suitability forspecies and communities. The aim will be tocharacterise habitat requirements of species andcommunities in terms of measurable parameters fromthe RHS database, and from expert knowledge derivedfrom literature. They will also help to identify potentialpressures acting on species and communities that maylead to a state of unfavourable condition allowing for
possible mitigation of these pressures if necessary.Other applications being developed as ‘bolt-ons’ toRHS include floodplain and geomorphologicalcomponents to the standard RHS methodology.
SensitivityThe RHS methodology includes the outline evaluationof various habitat characteristics with a focus onpatterns of erosion, deposition and geomorphology.Consequently the methodology can be used to identifythe presence of combinations of features that areconsidered to be desirable for a particular species.However, the methodology is not carried out withsufficient resolution to allow an analysis to be made ofthe extent of useable habitat within a section ofwatercourse.
A major weakness of the current RHS system is that itincludes very little data on the flow regime or speciesdistribution/information/coverage within the channel,i.e. depth, width, flow velocity. Flow types do, however,give an approximation to froude1 number which can beused to coarsely assess flow diversity. Additionally, thenew RHS Geomorphology and Floodplain Module willcollect more detailed data in relation to flow andchannel dimensions. It may be possible to overcomethe flow-related weakness by combining the techniquewith flow accretion profiles to relate habitat features tothe flow regime.
ApplicabilityIn order to determine the effects of abstraction it maybe possible to use RHS to identify habitats that arelikely to be at risk through changes in the flow regime,e.g. side bars, riffles, wetlands.
However, it is more likely that the technique will be ofmost value when used alongside other methodologies,such as Resource Assessment and Management (RAM).
Further information ‘River Habitat Survey – Field Survey Guidance Manual’ (2003) published by the Environment Agency.
‘River Habitat Quality’ (1998), Environment Agency, Bristol.
‘River Habitats in England and Wales – A National Overview’ (1996) published by the Environment Agency.RHS National Centre, Environment Agency, Warrington.
1 The Froude number (Fr) is used by hydraulic engineers to describe types of flow. Fr can be thought of as the ratio of kinetic energy to potential energy. Fr values >1
describe shooting flow; Fr values <1 describe tranquil flow.
< Section divider
This do
cumen
t was
with
drawn o
n 6 N
ovem
ber 2
017.

Assessment method summaries: River flows 4.6
Environment Agency in partnership with Natural England and Countryside Council for Wales Understanding water for wildlife
SummaryType of system where appliedRiver flow data is normally directly applicable to riverinesystems but may also be fundamental to all surfacewater fed systems including lakes; estuaries and tidalembayments. For groundwater fed systems, river flowdata may help characterise the inflow into (or residualflow from) a wetland system.
Applicability to groundwater or surface waterOf direct relevance to surface water fed systems butmay also be important in some groundwater fedsystems too.
Standard applicationsHydrological monitoring and conceptualisation.Conceptualisation requires various types of datamanipulation and interpretation to assist the process.
Applicability to European interest featuresInterest Features associated with regimes identifiedabove.
Resource requirementRiver Flows data monitoring and processing is a timeconsuming and costly undertaking.
River flows are collected for a variety ofreasons including:• for Environment Agency Water Resources and Flood
Defence (including flood warning) functionalactivities
• due to obligations on Consent holders to undertakeflow monitoring, typically:
– Water Companies (or other major users of water ordischargers to rivers)
– Non Environment Agency Drainage Authorities(such as IDBs)
– Mining/quarrying operators– Operators of water management schemes.
• as a requirement of large civil engineering schemessuch as, impoundments/reservoirs, channeldiversions and interbasin transfers.
Availability of river flow dataWithin the Environment Agency, river flow data isavailable from the National Archive – WISKI. This isaccessible from Area/Regional offices. EnvironmentEnvironment Agency Area Hydrometric Registers,Operational Drought Monitoring Reports (covering thedroughts of the early and mid 1990’s) and other reportsmay provide additional river flow data.
As well as the Environment Agency other potentialsources of River Flows data include:
• Centre for Ecology and Hydrology (CEH, see also theHydrometric Register and Statistics reports).
• British Waterways• Water Companies (as water and sewage effluent
undertakers)• Environmental Impact Assessments for site-specific
schemes (both for investigations and operations) • Universities specialising in hydrological or
associated research
Measurement of river flowsRiver flows are measured continuously (every 15minutes) at gauging stations. There are several types ofgauging station including:
• weirs or flumes• ultra-sonic• electromagnetic• adapted sluice (or other river) structures which are
primarily intended for river control purposes• natural bed control sites which have rated sections
(empirical stage – discharge calibration)
At ultra-sonic and electromagnetic gauging stationsriver flow is measured directly. At weirs, flumes andrated sections, flow is calculated from themeasurement of river depth or head/stage. Conversionfrom stage to flow is determined through a stage –discharge relationship.
River flows
4.6 Assessment method summaries
< Section divider
This do
cumen
t was
with
drawn o
n 6 N
ovem
ber 2
017.

Assessment method summaries: River flows 4.6
Environment Agency in partnership with Natural England and Countryside Council for Wales Understanding water for wildlife
Further informationEnvironment Agency, Anglian Region; Strategy for Groundwater Investigations and Modelling; Analysis andInterpretation of Riverflow Data; Entec; December 2000.
Environment Agency, Anglian Region; Strategy for Groundwater Investigations and Modelling; Linking BaseflowRecession Analysis with Initial Hydraulic and Geometric Parameterisation of Aquifers; Entec; January 2001.
Environment Agency – R&D; A Review of Techniques of Applied Hydrology in Low Flow Investigations; TechnicalReport W6-057/TR; Various Method Sheets; W S Atkins; 2001.
< Section divider
This do
cumen
t was
with
drawn o
n 6 N
ovem
ber 2
017.

Assessment method summaries: Species abundance and distribution data 4.6
Environment Agency in partnership with Natural England and Countryside Council for Wales Understanding water for wildlife
SummaryType of system where appliedAll aquatic and terrestrial systems.
Applicability to groundwater or surface waterSites influenced by groundwater and surface water.
Hydrological data requirementsFlow, level, rainfall, groundwater (borehole) data etcmay be linked to abundance and distribution to explainvariance.
Ecological data requirementsAppropriate methodologies need to be employed tocollect survey data. Survey programmes need toconsider the number of samples required to generateuseful data.
Can method be used on its own?No – needs to be interpreted against otherenvironmental data to explain variability in abundanceand distribution. Historical data required to identifytrends.
Applicability to European interest featuresHighly applicable if appropriate, targeted surveytechnique used.
Resource requirementExperienced/qualified surveyors required.
An important first step in understanding therelationship between species and the habitat(s) inwhich they are found is identifying the distribution andabundance of those species. Even in a pristine system,species will vary in abundance between sites, thisvariability being attributable to a range of factorsincluding water quality, habitat quality, competition,food availability, predation and disease. Understandingthe reasons why species vary in abundance anddistribution is critical if the effects of abstraction are tobe accurately predicted, and this can only be achievedthrough carefully designed survey work or analysis ofexisting data if available.
Although there is obvious value in collectingdistribution and abundance data for the Europeaninterest features present at a site, a lot of usefulinformation can be obtained by looking at otherspecies, particularly those with a known sensitivity tochanges in environmental conditions e.g. many
freshwater invertebrate species. The sensitivity ofcertain species to different environmental conditionsmeans that their presence is often indicative of acertain habitat type or quality. Consequently thepresence or absence of chosen indicator species can beused to assess the suitability of a habitat to supportparticular European interest features.
BackgroundHistorically, species-specific survey data have beencollected for SACs and SPAs by a range of organisations,including the Environment Agency, Natural England, theWildlife Trusts, and local naturalist groups. Sites ofEuropean importance are generally well studied, withcertain species, such as otter, crayfish and greatcrested newt, generally being well recorded. However,other species, such as invertebrates and bryophytes,have probably been under-recorded.
The value of survey data is dependent on a number offactors, including the accurate recording of data,location, surveyor, method, site conditions, togetherwith some form of quality control. In most cases thiswill entail the validation of the surveyors’ technicalcompetence.
The value of data is also linked to the purpose for whichthose data are to be used. For example, a singleappropriately timed site survey would be adequate toestablish presence or absence of certain species, suchas macrophytes and some invertebrates. However, thesuccess of such a survey may be dependent on theseasonal timing of the survey, weather conditions etc.For other species, such as great crested newt, a singlesurvey may be insufficient to establish presence, andmultiple visits may be required. It should be noted thatpresence/absence surveys would not be veryinformative in isolation for appropriate assessmentscarried out under the Conservation (Natural Habitats&c.) Regulations 1994, and may need to becomplemented with other survey work.
If the objective of a survey is to establish the status of apopulation (i.e. stable, improving or declining), multiplesurveys will be required over a specified time period.For short-lived species the survey period may only needto be relatively short, whereas for long-lived species amuch longer temporal data set may be required,possibly extending over many years. To link water
Species abundance and distribution data
4.6 Assessment method summaries
< Section divider
This do
cumen
t was
with
drawn o
n 6 N
ovem
ber 2
017.

Assessment method summaries: Species abundance and distribution data 4.6
Environment Agency in partnership with Natural England and Countryside Council for Wales Understanding water for wildlife
quantity / abstraction to species abundance anddiversity, the period of monitoring must include arepresentative range of water levels or flows. Thegreater the temporal extent of the data, the more robustthe analysis is likely to be when examining trendslinked to environmental change.
Method descriptionSurvey design may vary considerably depending uponthe species or habitat that is being targeted, and thesite where the surveys are to take place. Consequentlysurvey design should consider a number of factorsincluding:
• Geographical extent of the survey area (whole SAC orSPA or a component habitat)
• Weather conditions• Season and time of day• Sampling methodology, e.g. observation, trapping• Site selection• Survey objectives, e.g. presence/absence,
abundance, population trends• Sampling frequency• Recording of supporting environmental variables
There are a number of survey techniques that arecurrently accepted as the standard data collectionmethods for various taxonomic groups and habitattypes. These are summarised in Table 1.
ApplicationAs highlighted above surveys may be used to providedata for a range of purposes, including:
• To determine presence/absence• To establish status, i.e. stable, declining or improving
• To assess recruitment, age structure and growthrates in a population
• To assess population change due to emigration,immigration or mortality
• To provide a measure of habitat quality or suitability
In the context of determining the likely effect ofabstraction on species and habitats, it is important thatsurveys are designed to meet the requirements of thesite being assessed.
SensitivityIn order to generate useful, technically robust data,there is a need to select an appropriate surveymethodology and to design the survey programmeincorporating appropriate spatial and temporal surveycoverage.
Some species have very specific habitat or water qualityrequirements, and so survey data can readily be linkedto changes in habitat quality. Other species are muchmore tolerant of a range of environmental conditions,which potentially makes it more difficult to linkdistribution and abundance to habitat variability.
Ultimately the value of survey data lies in the ability torelate them to other data, e.g. macroinvertebrates andwater quality/quantity (RIVPACS/LIFE); salmon andflow/habitat (HABSCORE). River Habitat Survey may beused to link habitat quality with species presence orabundance data, as the database contains informationon a wide range of habitat variables across a largenumber of sites.
Additional informationGilbert G, Gibbons D and Evans J, (1998). Bird Monitoring Methods, RSPB, BTO, WWT,JNCC, ITE and the Seabird Group.
Sutherland W, (1999). Ecological Census Techniques, Cambridge University Press. (Refer to Table 2).
Guidance for Assessment: ‘Hydrological Requirements of Habitats & Species’ Assessment Method SummaryMacro-Invertebrate Biotic Indices
< Section divider
This do
cumen
t was
with
drawn o
n 6 N
ovem
ber 2
017.

Species Survey method Habitat Survey method
Allis shad Electrofishing;catch data; Alkaline fens National Vegetation Classificationhydroacoustics; LIFE in UK rivers methodology
Atlantic salmon Electrofishing; catch data; Alluvial forests National Vegetation ClassificationLIFE in UK rivers methodologyfish counter; redd counts; smolt traps
Barbastelle Barbastelle forest survey (BCT) Alpine pioneer formations of National Vegetation Classification- tailored bat detector survey the Carician bicolorisatrofuscae
Birds of lowland freshwaters WeBS low tide and high tide Atlantic salt meadow National Vegetation Classificationand their margins counts (marine); species /biotope mapping
specific observation surveys
Birds of lowland wet grassland Species-specific observation Blanket bog National Vegetation Classificationsurveys
Brook lamprey Electrofishing Bog woodland National Vegetation Classification
Bullhead Electrofishing; Kick sampling Calcareous fen National Vegetation Classificationbycatch;
Creeping marshwort Species-specific surveys Coastal lagoons National Vegetation Classification
Desmoulin’s whorl snail Species-specific surveys Depressions on peat substrates National Vegetation Classification
Fen orchid Species-specific surveys Estuaries National Vegetation Classification/biotope mapping
Floating water plantain Species-specific surveys; MTR Hard oligo-mesotrophic waters National Vegetation Classificationsurvey; WFD lake macrophyte survey
Geyer’s whorl snail Species-specific surveys Humid dune slacks National Vegetation Classification
Great crested newt Bottle trapping; torchlight Inland salt meadow National Vegetation Classificationsurveys; netting; egg search
Marsh fritillary Species-specific surveys Large shallow inlets and bays National Vegetation Classification/biotope mapping
Marsh saxifrage Species-specific surveys Mediterranean temporary ponds National Vegetation Classification
Narrow-mouthed whorl snail Species-specific surveys Molinia meadows National Vegetation Classification
Table 1 Selection of survey technique for SAC/SPA species and habitats species survey method habitat survey method
Assessment method summaries: Species abundance and distribution data 4.6
Environment Agency in partnership with Natural England and Countryside Council for Wales Understanding water for wildlife
< Section divider
This do
cumen
t was
with
drawn o
n 6 N
ovem
ber 2
017.

Assessment method summaries: Species abundance and distribution data 4.6
Environment Agency in partnership with Natural England and Countryside Council for Wales Understanding water for wildlife
Species Survey Method Habitat Survey Method
Otter Vincent Wildlife Trust methodology; Mudflats and sandflats National Vegetation ClassificationLIFE in UK rivers /biotope mapping
Pearl mussel Species-specific surveys; Natural dystrophic lakes National Vegetation ClassificationLIFE in UK rivers and ponds
Petalwort Species-specific surveys Natural eutrophic lakes National Vegetation Classification/Predictive System for Multimetrics
River lamprey Electrofishing; LIFE in UK rivers Northern wet heath National Vegetation Classification
Round-mouthed whorl snail Species-specific surveys Oligotrophic to mesotrophic National Vegetation Classificationstanding waters /Predictive System for Multimetrics
Sea Lamprey Electrofishing; LIFE in UK rivers Oligotrophic waters of National Vegetation Classificationsandy plains
Slender green feather moss Species-specific surveys Raised bogs National Vegetation Classification
Southern damselfly Species-specific surveys; kick Salicornia and other annuals National Vegetation Classificationsampling (larvae); LIFE in UK rivers colonising mud and sand /biotope mapping
Spined loach Electrofishing; Kick sampling Spartina swards National Vegetation Classificationbycatch; EA spined loach survey /biotope mapping
Twaite shad Electrofishing; LIFE in UK rivers Temperate wet heath National Vegetation Classification
White-clawed crayfish Kick sampling bycatch; substrate Transition mires National Vegetation Classificationsearch; torchlight surveys; trapping; LIFE in UK rivers
Watercourses of the plain to National Vegetation Classificationmontane levels with Ranunculion /Mean Trophic Rankfluitantis and Callitricho-batrachion vegetation
Table 1 Selection of survey technique for SAC/SPA species and habitats species survey method habitat survey method (cont.)
< Section divider
This do
cumen
t was
with
drawn o
n 6 N
ovem
ber 2
017.

Assessment method summaries: River flows 4.6
Environment Agency in partnership with Natural England and Countryside Council for Wales Understanding water for wildlife
At sites without a gauging station, one off, individualriver flows measurements (‘spot’ flow measurements)are taken by:
• Current metering (mechanical or other)• Rising air bubble technique• Floats• Dilution gauging
Processing river flow dataArchiving raw river flow measurement data follows well-established formal processes. Measurements of riverstage taken at 15 minute intervals are converted toflow, quality assured and archived. Flows are normallypresented as a daily mean.
To in-fill gaps in river flow data, record interpolation,possibly aided by correlation, can be used for very shortgaps (say < 7 days). Otherwise guidance given in theMethod Summary for Rainfall – Runoff Modellingshould be referred to for extending river flow datarecords or infilling more significant data gaps.
Presenting river flow dataDaily Mean Flows (DMFs) are normally displayed as atime series hydrograph. It can be useful to present morethan one hydrograph on one plot to demonstrateseasonal differences in response, identify trends or todemonstrate the effects of catchment geology i.e.baseflow or surface runoff dominated catchments. Dailymean flows can also be presented as flow percentileexceedence graphs or flow duration curves.
DMF’s are commonly summarised as monthly andannual values (mean, max & min). They are used tocalculate the catchment Base Flow Index (BFI) – therelative proportions of total flow that comes frombaseflow. Another common use is to calculate extrememinima or maxima (annual or above/below athreshold).
Verifying river flowsRiver flows can be checked through comparison withanother set of river flow data to ensure that therelationship between the two sites remain the same.This can be done with a Double Mass Plot. Double massanalysis, tests the consistency of the record at a stationby comparing its accumulated annual runoff with theconcurrent accumulated runoff for a group of similarnearby stations. Any significant variations in therelationship should reveal any periods of potentiallysuspect data or unexpected influences on one of thedata sets.
River flow data analysesSome of the most common type of analysis include:
• Flow normalisation (reducing flow records to l/s/km2
or similar) which is useful in making yieldcomparisons between catchments or to comparecatchments of different size or geology for example.
• Baseflow recession analysis, where the relativecontribution of groundwater and surface water inindividual river flow events is calculated to helpimprove our understanding of the processes involved.
• Flow Naturalisation (see Method Summary – FlowNaturalisation).
• Flow Accretion Diagrams. Where gain or loss in flowalong the course of a river can be shown as a longprofile. To aid interpretation, long profiles shouldshow positions of tributaries; abstractions;discharges; and, possible hydrogeological controls.
River Flows data is an important means of calibratinghydrological models (see separate Method Summariesfor both Rainfall – Runoff Modelling and DistributedGroundwater Modelling).
Application to wetland sitesThe river (or spring) flow regime into a wetland site maybe very important to the characterisation of the site andthe requirement of the Interest Features.
If low flows are considered critical to the favourablehydrological condition then attention should be givento an assessment of low flow regimes and factors whichmay impact that regime such as abstraction.
If high/flood flows are critical, such as in washlandsites, then focus should be given to factors which mayimpact the favourable inundation of the site. In thisinstance, it is very probable that issues such as changesin landuse will have more affects on river flows thanlicensed abstractions.
In order to undertake the required assessments for theReview of Consents the following will need to beincluded:
• Flow hydrograph (time series) plots.• Flow percentile exceedence tables or graphs.• Tabular seasonal and/or monthly flow statistics.
There are other analytical and interpretativehydrological techniques that can be applied to riverflow data that may be used to inform Review ofConsents studies. These techniques are addressedwithin the relevant Method Summaries.
< Section divider
This do
cumen
t was
with
drawn o
n 6 N
ovem
ber 2
017.

Taxonomic group Survey methodology Reference
General LIFE in UK rivers methodologies A full range of Life in UK Rivers publicationscan be ordered from:The Enquiry ServiceNatural England
Plants/habitats J NCC Phase 1 and 2 habitat surveys ‘Handbook for Phase 1 habitat survey’ JNCCNational Vegetation Classification (1993);’British Plant Communities – Mean Trophic Rank Volumes 1 -5’ Rodwell (2000); ‘Mean Trophic
Rank – A User’s Manual’ EA Technical Report E38
Invertebrates 3 minute kick sampling ‘RIVPACS III – User Manual’ IFE/EA (1997)Agency Guidelines
Mammals Survey of field signs (otter) ‘Otter and river habitat management’ EA (1999)Bat detector surveys Bat Conservation Trust
(http://www.bats.org.uk/)
Birds WeBS low tide and high tide counts for British Trust for Ornithologywintering birds; species-specific surveys (http://www.bto.org/survey/webs/)
Amphibians Bottle trapping/torching/netting ‘Great crested newt mitigation guidelines’ English Nature (2001)
Fish Electrofishing Environment Agency guidelines/workHydroacoustic/resistivity counter instructions Environment Agency R&DFish traps (http://publications.environment-agency.gov.ukCatch data (angler and net) /epages/eapublications.storefront)
Table 2 Information sources for standard survey techniques
Assessment method summaries: Species abundance and distribution data 4.6
Environment Agency in partnership with Natural England and Countryside Council for Wales Understanding water for wildlife
< Section divider
This do
cumen
t was
with
drawn o
n 6 N
ovem
ber 2
017.

Assessment method summaries: Trophic status assessments 4.6
Environment Agency in partnership with Natural England and Countryside Council for Wales Understanding water for wildlife
SummaryType of system where appliedRiverine.
Applicability to groundwater or surface waterFlowing surface waters only.
Hydrological data requirementsNone.
Ecological data requirementsMacrophyte or diatom data collected using standardsurvey methodologies.
Can method be used on its own?No – used to assess trophic status so needs to beevaluated in association with flow and water quality data.
Applicability to European interest featuresUseful for evaluating secondary effects of flow changeson water quality. Supplementary data only. Should onlybe used where linked concerns exist regarding waterquality and potential impact of abstraction.
Resource requirementTime consuming requiring data collection andprocessing. Data may already exist from Urban WasteWater Treatment Directive (UWWTD) studies.
The Mean Trophic Rank (MTR) and the Trophic DiatomIndex (TDI) have been developed to provide qualitativeassessments of whether a site is impacted byeutrophication or has undergone changes in trophicstatus. Such changes may occur indirectly as a result ofabstraction, which may lead to reduced dilution andincreased residence time of point or diffuse sourceinputs. MTR and TDI should only be used to comparethe trophic status of physically similar sites.
MEAN TROPHIC RANK
BackgroundMean Trophic Rank (MTR) is a technique used to assessthe trophic status of freshwater streams and riversbased on a standard 100 m length sample unit. Thetechnique requires specialist botanical expertise toidentify a range of macrophyte species, each of whichhas been ranked according to their nutrient sensitivity.
Method descriptionMTR involves a detailed botanical survey andassessment of the physical character of a 100 msection of river bank. All macrophytes present arerecorded, together with an estimate of percentagecover. Macrophyte species are assigned a numberbetween 1 and 10 on the basis of their tolerance tonutrient enrichment. These values are then multipliedby the cover value scores for each species, a meanvalue calculated and multiplied by ten to providethe MTR.
Scores for sites are then interpreted on the basis thatscores greater than 65 are unlikely to be eutrophic,scores less than 25 are badly damaged either bynutrient enrichment, toxicity or physical degradation,and scores in-between are eutrophic or at risk ofbecoming eutrophic. The MTR score is influenced byhabitat type, and therefore it is most useful to interpretthe score alongside physically similar sites of knownhigh water quality. Initially MTR was only used to studyspatial changes within a reach, with a change in MTRscore of 15% considered to be significant. Thereforeconsideration needs to be given to the use of MTR ontemporal scale.
ApplicationMTR has principally been developed to assist in thedesignation of ‘sensitive reaches’ under the UrbanWaste Water Treatment Directive. However, the ability tocharacterise watercourses in this way is considered tobe useful supplementary information when assessingthe direct and indirect effects of abstractions onEuropean interest features, but only where concernsexist regarding the interaction of WQ and abstractionimpacts.
SensitivityThe calculation of MTR scores involves the scoring ofover 130 different taxa, all of which have beenattributed a score between 1 and 10 to reflect theirsensitivity to nutrient enrichment.
Consequently the technique can be applied across a
Trophic status assessments
4.6 Assessment method summaries
< Section divider
This do
cumen
t was
with
drawn o
n 6 N
ovem
ber 2
017.

Assessment method summaries: Trophic status assessments 4.6
Environment Agency in partnership with Natural England and Countryside Council for Wales Understanding water for wildlife
range of stream and river types, but may be influencedby variability between surveyors and habitat variability.In addition there may be some natural backgroundvariation in MTR depending upon the survey seasonand the physical comparability of sites, however, themethodology is designed to minimise this variation.
ApplicabilityIn order to determine the effects of abstraction it maybe possible to use MTR to identify sites at risk fromeutrophication. Abstraction in or near such sites mayreduce dilution volumes, further compounding the
effects of nutrient enrichment. This technique may bedirectly applicable to some SAC interest features,however, it is more likely that it will be of general valuein characterising watercourses. The method should onlybe considered where abstraction and water quality areconsidered to be inter-linked. Ideally there should be aminimum of 1 survey over 3 years for usefulinterpretation to be carried out.
TROPHIC DIATOM INDEX
IntroductionAs with Mean Trophic Rank, the Trophic Diatom Indexwas developed to assist in the monitoring of rivers inresponse to the requirements of the Urban Waste WaterTreatment Directive. The method uses benthic diatomcommunities to assess water quality, with particularemphasis on nutrient enrichment. Trophic status isderived on the basis of the taxa present within asample, with certain taxa being more sensitive thanothers to nutrient enrichment. TDI does not really definetrophic status, but allows a comparison to be madespatially between sites and to make the conclusion thatone site is more enriched than another.
Method descriptionBenthic diatom films are collected from either natural orartificial substrates within the sample site, each sitecomprising a 10 m reach of river. The favoured method,in terms of ease, is to use natural substrates, asartificial substrates require multiple site visits. Slides ofthe diatom sample are analysed in the laboratory andthe taxa present identified, together with an estimate ofrelative abundance. The Index is then calculated fromthe data gathered.
ApplicationAs with MTR, TDI has principally been developed toassist in the designation of ‘sensitive reaches’ underthe Urban Waste Water Treatment Directive. However,the ability to characterise watercourses in this way isconsidered to be useful supplementary informationwhen assessing the direct and indirect effects ofabstractions on European interest features. As withMTR, TDI should only be considered where abstractionand water quality concerns are inter-linked.
SensitivityThe TDI has been developed using 86 taxa that aresensitive to nutrient status. Each individual taxon isassigned a value between 1 (favoured by low nutrientconcentrations) and 5 (favoured by very high nutrientconcentrations), with TDI values ranging from 0(indicating very low nutrient concentrations) to 100(indicating very high nutrient concentrations). Themethod is therefore applicable to the assessment oftrophic status, but has no proven application forassessing flow derogation per se.
Further informationEA R&D ‘Mean Trophic Rank – A User’s Manual’ Technical Report E38.
EA R&D ‘Assessment of the trophic status of rivers using macrophytes: Evaluation of MeanTrophic Rank’ TechnicalReport E39.
EA R&D ‘Assessment of the trophic status of rivers using macrophytes: Supporting documentation for theevaluation of Mean Trophic Rank’ Technical Report E1/i694/1.
< Section divider
This do
cumen
t was
with
drawn o
n 6 N
ovem
ber 2
017.

ApplicabilityTDI is considered to be an alternative to orcomplementary to MTR, when determining the effects ofnutrient enrichment as a result of abstraction.Abstraction in or near European sites may reducedilution volumes, further compounding the effects ofnutrient enrichment. This technique may be directlyapplicable to some SAC interest features, however, it ismore likely that it will be of general value incharacterising watercourses.
Further informationTrophic diatom index Project Number 0618.
The Trophic Diatom Index: A User’s Manual Reference Number TR E2.
Note:New ecological status classification tools, using macrophytes and diatoms, have been developed for the purposesof the Water Framework Directive, and these will be in use from 2007 onwards. These new tools are essentiallyimproved and refined versions of the existing MTR and TDI methods, based on more extensive data analyses, andas such will probably be widely adopted for assessment of nutrient impacts.
Assessment method summaries: Trophic status assessments 4.6
Environment Agency in partnership with Natural England and Countryside Council for Wales Understanding water for wildlife
< Section divider
This do
cumen
t was
with
drawn o
n 6 N
ovem
ber 2
017.
Assessment method summaries: Water balance assessment 4.6
Environment Agency in partnership with Natural England and Countryside Council for Wales Understanding water for wildlife
SummaryType of system where appliedRiver catchments, lakes & wetlands.
Applicability to groundwater or surface waterSurface water and groundwater.
Hydrological data requirementsTo reach a conceptual understanding of a water bodythere is a need to assess its water balance. This is avolumetric assessment of the inputs, outputs and thechanges in storage of the water body.
The main components of the natural water balancewhich can be measured or estimated are:
• Precipitation (rainfall/snowfall)• Evaporation (including transpiration)• Effective Rainfall• Soil Moisture• Water or groundwater level• Riverflow and other outflows.
Water balances also need to consider artificialinfluences (AI’s) including:
• Abstractions• Discharges• Mains/sewer leakage• Water transfers.
Other data which may support a water balanceassessment includes:
• Topographical catchment definition• Groundwater catchment definition from groundwater
level contours• Aquifer storage and transmissivity values• Level storage relationships.
Ecological data requirementsNone.
Can method be used on its own?Yes, to assess/illustrate the inputs, outputs and storagechanges in the water body. This assessment needs to becombined with an ecological assessment to determinewhether changes in any of the water balancecomponents impact on the ecological features at the site.
Applicability to European interest featuresInterest features associated with regimes identified in the previous questions identified above.
Resource requirementCan be scaled depending on the level of assessmentrequired.
Water balance assessmentsWater balance assessments can be used to:
• Quantify or estimate the main inflows, outflows andchanges in storage in a particular water body. Over aperiod of time the water balance assessment candetermine the sustainability of the water body interms of whether inflows are, in fact, balanced byoutflows and changes in storage.
• Estimate one of the components of the water balancewhich has not been measured or assessed. In thiscase, inflows into a water body (i.e lake) can beestimated over time from the measurement of thechange in storage in the water body (i.e lake level),and the outflows from the water body (i.eabstraction, or compensation flow or spill).
Similarly for Habitats Directive Review of Consents(RoC) purposes, the assessment should focus upon thedesignated site, or that part of it where the designatedecological features are located (e.g. if the wetlandfeature is fed by groundwater discharge, the waterbalance may exclude inputs from surface water runoffto adjacent ditches). To fulfil the RoC objectives thewater balance assessment should consider:
• ‘natural’ conditions (no artificial influences ofabstractions or discharge);
• ‘recent actual’ conditions (abstractions anddischarges as they are currently and have been in therecent past)
• ‘licensed’ conditions (abstractions assuming fulllicensed uptake and appropriate discharges).
The timestep at which water balance assessments areundertaken is often determined by the resolution of theestimated or measured data available and by itsintended use. This could range from a daily, monthly oryearly (usually a water year i.e. 1st October to 30th
September, to minimise changes in storage) timestepto long term average values. Typically water balanceassessments of designated sites may focus on arepresentative year and upon a dry year.
Consistent units should be used to quantify all inflows,outflows and changes in storage. These can beexpressed as Ml/d or mm.
Water balance assessment
4.6 Assessment method summaries
< Section divider
This do
cumen
t was
with
drawn o
n 6 N
ovem
ber 2
017.

Assessment method summaries: Water balance assessment 4.6
Environment Agency in partnership with Natural England and Countryside Council for Wales Understanding water for wildlife
MethodologyA water balance must be formulated on the foundationsof a sound conceptual model that describes theprocesses involved in the movement of water throughthe catchment. Like any good conceptual model, it maybe subject to refinement and improvement asunderstanding develops. It is sensible to look at thewater balance of each water body type separately if thedesignated site is dependent on more than one. Forexample, a water balance for a particular wetland,aquifer type (e.g. shallow drift gravel and deeper chalk)or river catchment. The conceptual model should assistin determining which discrete water bodies require awater balance assessment.
Components of a water balance may include:
Inflows• Precipitation (rainfall/snowfall)• Effective Rainfall (surface and subsurface/recharge)• Effluent discharges• Outflows from the water bodies (e.g. based on
estimates of recharge to groundwater catchmentareas, or based on simple calculations of hydraulicgradient and confining layer permeabilityassumptions)
• Mains/sewer leakage • Water transfers
Outflows• Evaporation (including transpiration)• Riverflow • Inflows to other water bodies• Abstractions• Water transfers
Changes in storage over the water balance period can beassessed for each water body by looking at changes in:
• Groundwater levels, • Soil moisture deficits,• Riverflows• Lake levels
When assessing licensed surface water and groundwaterabstraction impacts on a water balance it is important toconsider the licence constraint conditions written on thelicence, as these may include cessation clauses to limitlow flow impacts. It is also essential that theconsumptiveness of the abstraction is taken into accountin terms of the water locally returned to the catchment,and that the impacts of other discharges not locallyassociated with an abstraction (e.g. sewage treatmentworks) are also included. The Environment Agency’s‘Good practice in flow naturalisation’ and ‘RAMFramework’ provide more details.
Visualising the water balanceResults can be expressed graphically for each separatewater body in a number of ways:
• diagrammatically as a series of stores and flows/orfluxes
• as maps containing equivalent recharge circles aroundabstraction sources. The ‘RAM framework’ providesmore details (as illustrated in Figure 1)
• as a pie chart of typical inflows/outflows to the site (asillustrated in Figure 2). Determining percentagecontributions of artificial influences (in particularabstractions) will help determine the magnitude oftheir impacts upon the water balance.
These illustrations can be produced for a representativeyear, a dry year, or a long term average for natural, recentactual and fully licensed conditions.
UsesWater balance assessments focus on quantifying the mostimportant component(s) of the designated feature and theimpact on this of licensed abstractions and consenteddischarges. Once changes have been quantified furtheranalysis will be required to assess how these may translateinto habitat parameters (such as water depth, wettedperimeter and flow velocity) and whether these areresponsible for an adverse ecological impact.
Further informationStandard hydrological text booksEntec, 2002, ‘Resource Assessment and Management Framework – Report and User Manual – Version 3’ R&DManual W6-066M Version 3, for the Environment Agency.
Environment Agency (2001); Good Practice in Flow Naturalisation by Decomposition (Version 2); NationalHydrology Group April 2001 (Revised 15 June 2001).
Environment Agency (2005), Toolkit for flow naturalisation V1.0; December 2005
< Section divider
This do
cumen
t was
with
drawn o
n 6 N
ovem
ber 2
017.
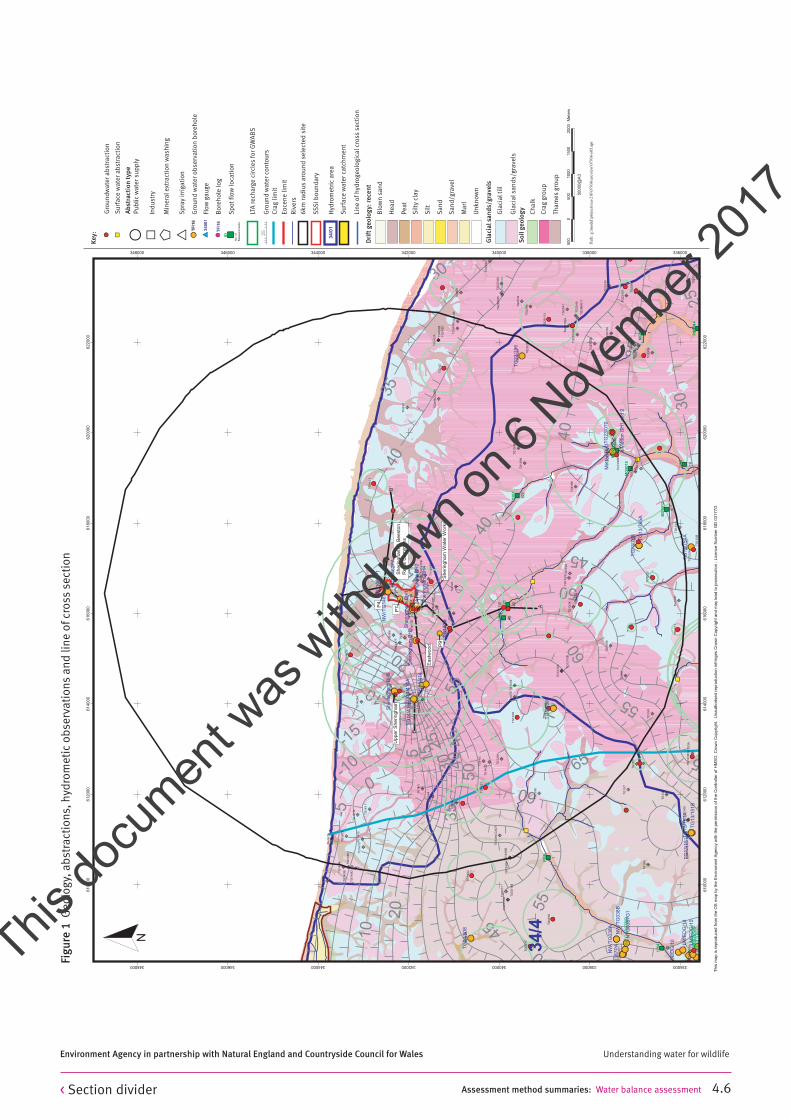
Figu
re 1
Geo
logy
, abs
trac
tion
s, h
ydro
met
icob
serv
atio
nsan
d lin
e of
cros
sse
ctio
n
Gro
undw
ater
abs
trac
tion
Surf
ace
wat
er a
bstr
acti
on
Publ
ic w
ater
sup
ply
Indu
stry
Min
eral
ext
ract
ion
was
hing
Spra
y ir
riga
tion
Bor
ehol
e lo
g
Spot
flow
loca
tion
LTA
rech
arge
cir
cles
for G
WA
BS
Gro
und
wat
er c
onto
urs
Crag
lim
it
Eoce
ne li
mit
Rive
rs6k
m ra
dius
aro
und
sele
cted
site
SSS
I bou
ndar
y
Hyd
rom
etri
c ar
ea
Surf
ace
wat
er c
atch
men
t
Line
of h
ydro
geol
ogic
al c
ross
sec
tion
Blo
wn
sand
Hea
d
Peat
Silt
y cl
ay
Silt
San
d/gr
avel
San
d
Unk
now
n
Gla
cial
till
Gla
cial
san
ds/g
rave
ls
Chal
k
Crag
gro
up
Tham
es g
roup
So
il g
eo
log
y
Gla
cia
l sa
nd
s/g
rav
els
Mar
l
Dri
ft g
eo
log
y:
rece
nt
Gro
und
wat
er o
bser
vati
on b
oreh
ole
Flow
gau
ge
Ab
str
act
ion
ty
pe
Ke
y:
Assessment method summaries: Water balance assessment 4.6
Environment Agency in partnership with Natural England and Countryside Council for Wales Understanding water for wildlife
< Section divider
This do
cumen
t was
with
drawn o
n 6 N
ovem
ber 2
017.

Assessment method summaries: Water balance assessment 4.6
Environment Agency in partnership with Natural England and Countryside Council for Wales Understanding water for wildlife
Figu
re 2
Inf
low
est
imat
esin
to S
heri
ngha
m a
nd B
eest
on R
egis
SSS
I
Long
term
ave
rage
nat
ural
inpu
tsTo
tali
nput
s0.
68 M
/d
Curr
enti
nput
sTo
tali
nput
s0.
64 M
/d
1975
/107
6 na
tura
linp
uts
Tota
linp
uts
0.28
M/d
SW
infl
ow16
.3%
SW
infl
ow17
.1%
SW
infl
ow10
.7%
RF-
AE
16.6
%R
F-A
E17
.4%
RF-
AE
25.1
%
Chal
kG
Win
flow
0.4%
Chal
kG
Win
flow
0.0%
Chal
kG
Win
flow
4.3%
Dri
ftG
Win
flow
66.7
%
Dri
ftG
Win
flow
65.6
%
Dri
ftG
Win
flow
59.9
%
LTA
Inpu
tsm
m/a
M
l/d
% in
flow
RF- A
E17
1 0.
112
17%
SWIn
flow
29
0.
110
16%
Dri
ftG
WIn
flow
68
8 0.
450
67%
Chal
kG
WIn
flow
5
0.00
3 0.
4%
TOTA
LIN
FLO
W89
3 0.
675
100%
Curr
entI
nput
sm
m/a
M
l/d
% in
flow
RF- A
E17
1 0.
112
17%
SWIn
flow
29
0.
110
17%
Dri
ftG
WIn
flow
64
6 0.
423
66%
Chal
kG
WIn
flow
0
0.00
0 0.
0%
TOTA
LIN
FLO
W84
6 0.
644
100%
Dro
ught
Inpu
tsm
m/a
M
l/d
% in
flow
RF- A
E10
7 0.
07
25%
SWIn
flow
8
0.03
11
%
Dri
ftG
WIn
flow
25
6 0.
17
60%
Chal
kG
WIn
flow
18
0.01
4%
67
%
TOTA
LIN
FLO
W89
3 0.
675
100%
H:\
Proj
ects
\Ea-
210\
0793
6 H
DS
trat
2\dr
awin
gs\S
heri
ngha
mPi
eCha
rt.x
lsM
ay20
03
0793
6-S
06.c
dr b
arkr
< Section divider
This do
cumen
t was
with
drawn o
n 6 N
ovem
ber 2
017.

Assessment method summaries: Groundwater levels 4.6
Environment Agency in partnership with Natural England and Countryside Council for Wales Understanding water for wildlife
SummaryType of system where appliedGroundwater Fed Wetlands. May also be relevant toheadwater locations on riverine systems.
Applicability to groundwater or surface waterOnly of direct relevance to groundwater fed systems. Inspecial circumstances Groundwater fed wetlands mayinclude coastal as well as inland sites.
Standard applicationsHydrogeological monitoring and conceptualisation withthe latter usually requiring various types of datamanipulation and interpretation to assist the process.
Applicability to European interest featuresInterest Features associated with regimes identifiedabove.
Resource requirementGroundwater level data monitoring is fundamental tothe water resource function of the Environment Agency.Site specific groundwater level data are also requiredfor the Environment Agency’s Waste Management(Landfill Licensing) function and occasionally for flooddefence schemes or conditionally for certainoperational schemes. Groundwater level datamonitoring and processing is a time consuming andcostly undertaking.
Groundwater level data are monitored for a variety ofreasons including:
• Environment Agency Water Resources and WasteManagement functions;
• In connection with Section 32/3 pumping tests whichare typically undertaken to support an application fora new/varied groundwater abstraction licence;
• Environment Agency Groundwater Investigationrequirements and operational monitoringobligations;
• Obligations on Consent holders to undertakemonitoring typically including Water Companies (orother major users of water); landfill operators;mining/quarrying operators; and operators of watermanagement schemes; and
• In connection with large civil engineering schemesinvolving earthworks groundwater level monitoringmay well be required such as for tunnelling, largecuttings, impoundments/reservoirs and dewateringoperations.
As well as the Environment Agency other potentialsources of groundwater level data include:
• British Geological Survey (through well records etc).• County Councils (through Mineral Planning and
Highways functions).• Site specific schemes (both for investigations and
operations). In this respect allied EnvironmentalImpact Assessments may provide a useful guide topotential data availability.
• Universities specialising in hydrogeological or alliedresearch fields.
Groundwater level monitoring may be undertaken usinga number of facilities such as:
• Purpose constructed observation boreholes and/orpiezometers.
• Utilising abandoned abstraction wells, boreholes,mine shafts and adits.
• Via excavations penetrating beyond the water table.• Where groundwater naturally emanates to the surface
as springs or seeps.
Groundwater levels are typically monitored:
• By means of an electrical contact dipper foroccasional spot readings down boreholes orpiezometers.
• Via gauge board installations in excavations or indiscrete springs for occasional spot readings.
• By means of ‘continuous’ monitoring made via asensor and recorder. Traditionally, these includedfloats suspended over a pully driving an autographicrecorder. Typically, they now incorporate either a shaftencoder (float/pully driven) or pressure transducersensor coupled to a data logging device.
• Where artesian groundwater levels are encounteredheads may be recorded using a pressure gauge ormanometer.
BackgroundThe processing of raw monitoring data to a formalarchive will normally include a number of quality checkssuch as:
• Levels within expected range;• Difference since last recording within anticipated
range or change in level (up or down) is asanticipated;
• Type of recording device as anticipated; and someform of verification.
Groundwater levels
4.6 Assessment method summaries
< Section divider
This do
cumen
t was
with
drawn o
n 6 N
ovem
ber 2
017.

The standard processing and presentation forgroundwater levels is to prepare them singly as a timeseries hydrograph. In some instances two or moregroundwater level hydrographs may be shown on oneplot to reveal trend comparisons or changes toresponse (such as in a pumping test).
Groundwater levels are also commonly plotted spatiallyand represented as a contoured plot for a specific time.Such plots are used to help interpret:
• Groundwater flow paths.• Groundwater flow gradients.• Groundwater capture zones to an abstraction or
discharge.
Groundwater level data are essential to help inform thehydrogeological characterisation of aquifer systems.Singly these data show level response to natural andartificial recharge and discharge (including abstractiondriven) processes/mechanisms. In conjunction withother data (particularly discharge and/or abstraction)level data can be used to interpret standard hydraulicproperties of aquifers including transmissivity andstorativity (or specific yield).
Application to wetlandsGroundwater level data may help in the characterisationand assessment of wetland sites in a number ofimportant, and sometimes fundamental, waysincluding:
• A sufficient network of groundwater level data mayenable the groundwater capture zone supplyinggroundwater flow to the site to be defined throughcompiling and interpreting a groundwater levelcontour plot.
• A nest of piezometers (or boreholes) intosuccessional geological horizons underlying awetland site should help reveal if the hydraulicpotential for groundwater flow is upward(discharging), downward (recharging) or neutral.
• A transect of piezometers (or boreholes) across awetland site may reveal local variations inpiezometric level and these can be compared to sitetopography to provide a spatial picture of depth towater table across the site. In addition, the variationin water levels across the transect may potentiallyallow hydraulic relationships to be drawn with on-site features (such as springs) or off-site stresses(such as from abstractions or tidal effects etc).
• In some instances discrete time series groundwaterlevel data recorded at or close to a wetland site mayreveal a specific response attributable to anindividual abstraction operation (or some otherstress). This may be especially noticeable where theabstraction is subject to distinct temporal variations(such as significant seasonal or diurnal variations inabstraction rate). Where relatively steady stateabstractions are suspected to cause an impact on asite, purpose designed tests (often referred to as‘Signal Tests’) may be undertaken to disrupt or alterthe steady state abstraction pattern so as to generatethe potential for a variation in groundwater levelmonitored at the site. In this way ‘Signal Tests’ mayprove valuable for identifying hydrologicalcharacteristics at a site as well as indicating thepossible scale of impacts.
• Where sufficient groundwater level data aremonitored at a designated wetland site theinformation should, when combined withtopographic and ecological data for the site, helpconfirm whether or not favourable hydrologicalconditions are achieved relative to the specific waterresource requirements of the Interest Features.
Assessment method summaries: Groundwater levels 4.6
Environment Agency in partnership with Natural England and Countryside Council for Wales Understanding water for wildlife
Further information Environment Agency, Anglian Region; Strategy for Groundwater Investigations and Modelling; Interpretation ofGroundwater Levels; Entec; August 2000.
< Section divider
This do
cumen
t was
with
drawn o
n 6 N
ovem
ber 2
017.
Assessment method summaries: Numerical groundwater modelling 4.6
Environment Agency in partnership with Natural England and Countryside Council for Wales Understanding water for wildlife
SummaryType of system where appliedRivers, lakes & wetlands.
Applicability to groundwater or surface waterWorth considering where seasonal or geographicallylocalised impacts of groundwater abstraction areimportant. For example, modelling changes ingroundwater levels, groundwater flows into wetlands orlakes or baseflow to rivers.
Hydrological data requirementsA conceptual understanding of natural groundwaterrecharge, flow and discharge and abstraction impactmechanisms which is appropriate to the level ofassessment and includes the water body supportingthe ecological feature plus all potentially impactingabstractions. This depends on collating, integrating andunderstanding a range of meteorological, geological,topographical, river flow, groundwater level andhydrochemical information. Aquifer boundaries andhydraulic parameters for groundwater flow, storage andinteraction with streams/rivers. Historic recharge andabstraction estimates plus observed groundwaterlevels and river/stream flow estimates (for historic orsteady state calibration). Fully licensed and recentactual groundwater abstraction rate assumptions forpredicting licensed impacts compared with ‘natural’(zero abstraction) scenario.
Ecological data requirementsNone, however, to draw a conclusion from themodelling results regarding ecological effects, targetedecological data are required to demonstrate ecologicalchange.
Can method be used on its own?Within hydro-ecological impact assessments,groundwater modelling will usually be used as part of awider study including ecological studies and optionsappraisal. The wider study will set environmentaloutcomes which will determine the scope of themodelling work.
A conceptual model taking account of the water supplymechanisms critical to the ecology is required beforemodelling (see conceptual model technique sheet). Forwetlands, model results should be prepared inconsultation with ecologists and impacts assessed withreference to hydro-ecological guidelines which definethe favourable water level or flow regime required bythe wetland features. For rivers, results should be
compared with the Resource Assessment &Management (RAM) Framework or Natural England –Favourable condition Table (FCT) -based RiverFlowObjectives.
Applicability to European interest featuresStandard hydrogeological assessment techniqueswhich can be applied for any location/wetland but canonly be interpreted in terms of potential ‘ecologicaleffects’ if combined with other techniques.
Resource requirementA ‘simple’ numerical model to consider groundwaterabstraction impacts on a wetland may be built andused to give indicative results within a few weeks. Amore complex model of a larger catchment can take afew years and cost several hundred thousand pounds.
Figures 1 and 2 include modelled groundwater leveloutput superimposed on a hydro-ecological water levelregime prescription for a wetland feature, and modelledwater balance output showing variations in flows intoand out of a wetland, respectively.
BackgroundA numerical groundwater model is used to understandand quantify the groundwater flow system to ensure thatan adequate balance between recharge (water enteringthe aquifer) and abstraction (water being pumped out ofthe aquifer) is maintained. A model usually simulatesthe spatial distribution of groundwater recharge, flowand discharge across a grid of ‘cells’ representing theaquifer and river network and can also show howgroundwater levels and flows change with time inresponse to recharge and abstraction stresses. Such amodel can provide the ‘best available’ tool to assess theimpacts of groundwater abstraction on river baseflow,spring flow, drain flow or groundwater levels.Predictions of both recent actual and fully licensedimpacts can be made using a model which has beencredibly calibrated against historic records of river flowand groundwater level variations. These predictions canfocus on critical drought, average or high groundwaterlevel periods as appropriate.
However, distributed groundwater models can also takemuch time and money to build and will only ever be asgood as the information and conceptual understandingupon which they are based. Before building such amodel it is always worth trying other, simplerapproaches, as described on separate summary sheets:
Numerical groundwater modelling
4.6 Assessment method summaries
< Section divider
This do
cumen
t was
with
drawn o
n 6 N
ovem
ber 2
017.

• Conceptual understanding;• Simple water balance approaches;• Radial flow based drawdown methods, together with
licence accumulation diagrams;• IGARF; and/or• The RAM Framework.
For the purposes of any hydroecological investigation it isessential to work with ecologists to ‘translate’ the outputfrom any groundwater model into a format which isrelevant to the ecological interest features on the site. Itis important to separately consider whether the predictedimpacts will result in an adverse ecological effect.
For example:
• modelled groundwater levels at a wetland cellrepresenting the piezometric head (in m AOD) withinthe main aquifer may have to be ‘translated’ toindicate the behaviour of the near surface water table(in m bgl) and to allow this to be compared with aprescribed water level regime for a ‘wet grassland’feature on the site itself. The duration and frequencyof changes in groundwater levels in relation to thegrowing season need to be considered.
• Seasonal changes in the direction and size ofgroundwater flows need to be considered.Maintenance of flushing flows into a wetland, or anupward hydraulic gradient may be critical to somevegetation interest features. The frequency, durationand timing of any gradient reversals is alsoimportant.
• The duration, frequency and timing of any reductionsin baseflows to rivers and lakes.
Method descriptionFollowing a ‘source – pathway – receptor’ model, thefirst step is to establish an appropriate level ofconceptual understanding. This will include somesimple water balances and an appreciation of thesources of impact (e.g. pumping by groundwater andsurface water licensed abstractions), flow mechanisms(pathways) and vulnerability mechanisms of thedesignated ecological features (receptors).
Once a conceptual understanding has been developed,numerical groundwater modelling may be used. It is aspecialist activity to be undertaken by groundwaterprofessionals. It is important to keep the numericalmodel as simple a representation of the conceptualmodel as is credibly possible in order to avoid havingtoo many, or inappropriate, model parameters. Thismay lead to unrealistic expectations/aspirations for themodel results.
Calibration and validation of the distributed modelagainst observation data acts to test and increaseconfidence in the conceptual model. During thedevelopment of the distributed model it may benecessary to revisit and modify the conceptual modelbefore continuing.
Model layersA single layer model provides the capability toincorporate recharge, control by rivers and drains,regional gradients, storage and abstractions. It alsopermits spatial variations in aquifer transmissivity orspecific yield to be incorporated. This will permit timevariant changes in groundwater discharge rates to bedetermined and may be adequate for some rivers andwetlands which are generally considered to be in goodhydraulic connection with the underlying aquifer.
However, in the presence of significant drift depositssuch a model may not provide an adequate simulationof changes in water level near the surface of a wetland.It may also be difficult to compare the predictions of themodel with the results of field observations if thesecomprise only levels. Furthermore, even where thegeology beneath a wetland is apparently simple, withno drift and good connection to the underlying aquifer,there is often some degree of layering, possibly relatedto fissure flow within the aquifer itself. In thesesituations pumping signals may travel greater distanceswhilst near surface drawdown is less marked. For thesereasons it is unlikely that a single layer model wouldprovide an adequate representation of many wetlands,where two layers or more may be required.
A model with two layers in the vicinity of a wetlandpermits vertical gradients in the wetland to be defined,and provides a basis for more realistic simulation ofheads in the wetland. The effect of horizontal/verticalanisotropy in the regional aquifer can be modelled bychanging vertical conductance terms. The results aremore readily comparable with those from fieldinvestigations, leading to more confidence in theappropriateness of the model calibration.
Assessment method summaries: Numerical groundwater modelling 4.6
Environment Agency in partnership with Natural England and Countryside Council for Wales Understanding water for wildlife
Accuracy
Cost
Regionalgroundwatermodelling studies
IGARF and otherinvestigative tools
< Section divider
This do
cumen
t was
with
drawn o
n 6 N
ovem
ber 2
017.

Assessment method summaries: Numerical groundwater modelling 4.6
Environment Agency in partnership with Natural England and Countryside Council for Wales Understanding water for wildlife
4
4.55
5.56
6.57
7.58
8.59
mAOD
Gro
undw
ater
hea
ds in
Top
act
ive
Laye
r, N
atur
alis
edG
roun
dwat
er h
eads
in T
op a
ctiv
e La
yer,
Ful
ly L
icen
ced
Gro
undw
ater
hea
ds in
Top
act
ive
Laye
r, A
bs @
50%
LTA
rech
arge
Gro
undw
ater
hea
ds in
Top
act
ive
Laye
r, H
isto
ric
Gro
undw
ater
hea
ds in
Lay
er 5
, Nat
ural
ised
Gro
undw
ater
hea
ds in
Lay
er 5
, Ful
ly L
icen
ced
Gro
undw
ater
hea
ds in
Lay
er 5
, Abs
@ 5
0% L
TA re
char
geG
roun
dwat
er h
eads
in L
ayer
5, H
isto
ric
Targ
et, O
ct 9
1 N
atur
alis
ed L
evel
= 6
.98
mAO
D
Jan
88
Ja
n 9
0
Ja
n 9
2
Jan
94
J
an
96
Ja
n 9
8
Ja
n 0
0
Ja
n 0
2
Ja
n 0
4
-10
0
-50050
10
0
15
0
20
0
25
0
30
0
35
0
m?/day
Upw
ards
Flo
w N
atur
alis
ed (7
5)U
pwar
ds F
low
Abs
at 5
0% re
char
ge (8
3)U
pwar
ds F
low
His
tori
c (8
5)U
pwar
ds F
low
Ful
ly 1
00%
Lic
ence
d (7
6)Ta
rget
= 0
m3/
d
Jan
88
Ja
n 9
0
Ja
n 9
2
Jan
94
J
an
96
Ja
n 9
8
Ja
n 0
0
Ja
n 0
2
Ja
n 0
4
-35
0
-30
0
-25
0
-20
0
-15
0
-10
0
-50 0 50
10
0Jan
88
Jan
90
Jan
92
Jan
94
Jan
96
Jan
98
Ja
n 00
Ja
n 02
Ja
n 04
m?/day
Str
eam
Dis
char
ge H
isto
ric
(85)
Str
eam
Dis
char
ge N
atur
alis
ed (7
5)S
trea
m D
isch
arge
100
% L
icen
ced
(76)
Str
eam
Dis
char
ge A
bs a
t 50%
rech
arge
(83)
Targ
et=
0 m
3/d
Not
e di
ffer
ing
char
t sca
les
Figu
re 1
App
rais
alof
abst
ract
ion
scen
ario
sfo
r a m
odel
cell
ata
grou
ndw
ater
fed
fen.
Dis
char
ge t
o st
ream
Gro
undw
ater
hea
dsin
top
act
ive
laye
r an
d la
yer
5
< Section divider
This do
cumen
t was
with
drawn o
n 6 N
ovem
ber 2
017.

-1.0
-0.8
-0.6
-0.4
-0.2
0.0
0.2
0.4
0.6
0.8
1.0
Aug-96 Aug-97 Aug-98
ya
d/lM
niw
olF
Direct Recharge to FenOutflow to DrainHorizontal inflow from Drift into FenHorizontal outflow from Drift into FenVertical inflowVertical outflow
24
25
26
27
28
29
30
31
Aug-96 Aug-97 Aug-98
)D
OA
m(d
ae
Hr
eta
wd
nu
orG
Drift Water Level
Chalk Water level
Total budget = 0.371 MI/day
Direct recharge to Fen =
0.0609 MI/day
17%
Outflow to drain =
0.3205 MI/day
87%
Horizontal outflow
from drift into Fen =
0.0451 MI/day
12%
Outflow from chalk
beneath the Fen =
0.101 MI/day
Horizontal inflow
from drift into Fen =
0.0947 MI/day
26%
Inflow from chalk
beneath the Fen =
0.311 MI/day
Vertical outflow =
0 MI/day
0%
Vertical inflow =
0.2093 MI/day
57%
Start date: 1st Aug 96
End date: 1st Aug 99
Layer 1
Layer 2
FEN
Figure 2 Components of modelling water budget and modelling groundwater levels
Components of the modelling water budget for a groundwater fed fen between Aug 1996 and Aug 1999
Components of flow budget in Fen
Modelling water levels at the Fen
Assessment method summaries: Numerical groundwater modelling 4.6
Environment Agency in partnership with Natural England and Countryside Council for Wales Understanding water for wildlife
< Section divider
This do
cumen
t was
with
drawn o
n 6 N
ovem
ber 2
017.
Numerical model design, constructionand refinementBoundaries of the modelled area should be definedfrom the conceptual model including its piezometricsurface map. In order to adequately consider theimpacts of abstractions on both the site of interest andother surface water features, and to allow comparisonof output against river flow gauges which may not belocal to the site, it is likely that the boundaries will haveto be set at some distance away from the site. Modelsare thus likely to be at the sub-catchment or smallregional scale, rather than finely focussed on thedesignated site itself.
Steady state simulations may be useful in the earlystages of model development and validation but, ifconsideration of critical low flow periods is required,the model should be refined through comparison withavailable data in transient mode. It should incorporatehistoric actual abstractions and meteorology for thispurpose – in most cases a monthly stress period shouldbe adequate.
The purpose of constructing the numerical model is todemonstrate the impact of groundwater abstractionsusing a simplified but credible representation of the‘source, pathway, receptor’ understanding presented inthe conceptual model (see separate summary).Although it is important to show that the modelrepresentation is reasonable, it is stronglyrecommended that the model is used to review theimpacts of abstraction from a very early stage in itsdevelopment – well before it might be considered to berobustly calibrated according to general practice in thedevelopment of a groundwater model. Running ‘noabstraction’ and ‘fully licensed abstraction’ scenariosand reviewing the results will help to highlight anyerrors in model construction and will provide an earlyestimate of the possible magnitude of impacts, therebyindicating the likely value and benefits of further timespent in refinement.
Demonstrating the impact of consentedgroundwater abstractionsIn general, predicted impact is defined as the differencebetween calculated model behaviour in the absence ofconsented activities, and in the presence of consentedactivities. More confidence exists in the calculateddifference, than in the absolute values. The intention isto review consented abstractions, therefore thescenarios should examine all licensed abstractions atmaximum consented rates regardless of whether or not
this can be taken using the installed pumps, pipes etc.
The sequence of steps will thus be to establish arelatively rapid dynamic calibration using actualabstraction data, to produce from this a ‘no abstractionbaseline’ by turning off all abstractions, and then tocalculate impact by turning on all abstractions at thelicensed rate. If an impact is demonstrated (see below– Presentation and Review of Model Output), thenadditional work is necessary to identify the abstractionscausing the impact, and the approximate proportion ofthe impact caused.
Presentation and review of model outputModel output should be presented to:
• Demonstrate that the simplified model representationof the designated site, sub-catchment andgroundwater abstraction impacts are credible; and
• Predict the impacts of fully licensed groundwaterabstraction. Calibration should be demonstrated byareal and time series plots of water level, by timeseries plots of flow data where available, and bystatistical summaries of both levels and flows.
Dynamic model flow budget output can also be helpfulfor the whole model area, subcatchments drawn to flowgauges, and the cells representing the designated siteitself.
Ways to present hydrological impacts and review theirhydro-ecological significance against the featureprescriptions should be discussed with ecologists fromthe Environment Agency and Natural England early onin the model development process. Options include:
• Annual cycle plots of depth to groundwater level(with a single year range on which values from allyears are plotted) including: the monthly toleranceranges suggested by the hydroecologicalprescriptions for the ‘most sensitive feature’; anyobserved depths to water from near surfacepiezometers on the site; simulated depths to waterfrom the no abstraction and full licensed runs, anexample is shown on Figure 1;
• Time series plots of both no abstraction and fullylicensed abstraction scenarios on groundwater levelsand drain or river discharge flows, and of thedifference between them. Time series plots ofwetland drain discharge flows simulated by the fulllicensed scenario as a percentage of those from theno abstraction scenario may also be helpful;
• Level-duration, river flow-duration, and drain or
Assessment method summaries: Numerical groundwater modelling 4.6
Environment Agency in partnership with Natural England and Countryside Council for Wales Understanding water for wildlife
< Section divider
This do
cumen
t was
with
drawn o
n 6 N
ovem
ber 2
017.

spring flow-duration curves for both scenarios, withtabulated differences at key percentiles – particularlythe 95 percentile which is commonly as a low flowparameter for rivers; and
• Indicative drawdown maps at key times (e.g.selected drought years) focusing on the uppermostlayer of the model.
In many cases, the ecological effect of the impactproduced will not be clear cut and assessment of thesignificance of the effect will require discussion withthe Environment Agency and Natural England.
In some cases it may be possible that the depth to waterranges predicted for the ‘no abstraction’ scenario lieoutside the tolerances suggested for ecological featurespresent on the site. If existing monitored depths to waterplot within the tolerance range, such ‘no abstraction’predictions may imply that the actual existence of theseecological features is in part related to the currentgroundwater abstraction stresses. However, both ‘noabstraction’ and ‘fully licensed’ scenario predictionsshould be viewed with some caution as they may takethe model beyond its historically calibrated range andgroundwater – surface water interaction mechanismsmay not be reliably simulated.
UsesGroundwater models have been used for many years aspart of investigations into low river flow alleviation orwetland restoration projects (e.g. the Wylye model onthe Hampshire Avon SAC and the model used forrelocation of the Redgrave abstraction as part of Fenrestoration in Suffolk). There has been a recent increasein their application to groundwater abstraction impactissues for Habitats Directive assessments (e.g. the RiverItchen SAC, the Bourne/Upper Avon SAC, manywetlands in East Anglia). But it is important toremember that all of these studies also involvedsignificant collection and analysis of hydrometric dataand field evidence.
Without such evidence, and the structured processrequired to produce a conceptual understanding of thesystem which is agreed by the main stakeholders(especially the Environment Agency, the watercompanies/abstractors, and Natural England), adistributed numerical model may be a misleading andcostly distraction.
Furthermore, although the existence of a credible andaccepted model should take much of the argument outof hydrological impact predictions (i.e. stream flowdepletion, water table drawdown etc), uncertaintiesregarding the effects of these impacts on the ecologywill still have to be grappled with.
Assessment method summaries: Numerical groundwater modelling 4.6
Environment Agency in partnership with Natural England and Countryside Council for Wales Understanding water for wildlife
Further informationGuidance for the Appropriate Assessment of Impacts from Licensed Abstractions on the Hydrological Regime ofGroundwater Fed Wetlands. Entec Technical Note for Environment Agency Anglian Region.
Manual of Notes on Groundwater Modelling, Environment Agency National Groundwater & Contaminated LandCentre.
< Section divider
This do
cumen
t was
with
drawn o
n 6 N
ovem
ber 2
017.
Assessment method summaries: Groundwater abstraction drawdown methods 4.6
Environment Agency in partnership with Natural England and Countryside Council for Wales Understanding water for wildlife
SummaryType of system where appliedGroundwater Fed Wetlands.
Applicability to groundwater or surface waterTo assess groundwater abstraction drawdown impactsrelated to Licensed or Recent Actual pumping rates.
Hydrological data requirementsConceptual understanding of relationship betweenabstraction (‘source’), aquifer and drift layering(‘pathway’) and near surface wetland water table(‘target’). Assessment of historic groundwater level andgroundwater abstraction time series relationships,including signal or pumping test results, plusappreciation of other factors influencing groundwaterlevels (e.g. site drainage, riparian evapotranspiration).Hydraulic parameters for predictive impact analysis,currently licensed groundwater abstraction locations(relative to the wetland), pumping rates (licensed andrecent actual) and seasonal limits, pumping durationand recharge assumptions.
Ecological data requirementsNone as such BUT can compare drawdown predictionswith observed water levels in the context of hydro-ecological water level regime prescriptions for wetlandfeatures. See Ecohydrological Guidelines for LowlandWetland Plant Communities on Environment Agencywebsite.
Can method be used on its own?Must have a conceptual model first, then can usefullybe applied to all groundwater abstractions (GWABS)within 5 km of a wetland at once and combined withLicence Accumulation Diagram (LAD) format output toprovide total ‘in-combination’ drawdown predictions,plus the contribution of each abstraction to the whole.But further ecological ‘effect’ interpretation will still berequired to determine adverse effect for HabitatsDirective sites.
Applicability to European interest featuresStandard hydrogeological techniques which can beapplied to any wetland or location – only relevant tothose wetland Habitat Directive (HD) features whichdepend on a groundwater level regime.
Resource requirementOnce conceptual understanding, aquifer parametersand abstraction data are collated, simple ‘first pass’application of analytical solutions like Theis, Hantushor Neuman can provide aquifer drawdown estimatesand associated LADs within a few hours. Application ofmore sophisticated techniques seeking to determinenear surface water table drawdown in response topumping signals deeper in the aquifer (e.g. layeredradial flow modelling) may take a few days.
Figure 1 shows alternative analyses and models for theprediction of drawdown due to groundwater abstractionincluding simple Hantush (leaky aquifer) and Neuman(unconfined aquifer) approaches. Figure 2 shows amore involved layered radial flow model (to predictdrawdown at shallower depths).
Background Wetland ecological features may be sensitive tochanges in the shallow water table regime resultingfrom groundwater abstraction drawdown impacts. A keypart of Review of consents (RoC) AppropriateAssessments for groundwater fed wetlands thereforeincludes estimation of drawdown impacts, relative to anatural baseline, associated both with current rates ofabstraction and with fully licensed abstraction. Theseestimates must be based on a sound conceptualunderstanding of the relationships between the open orscreened section of abstraction borehole where thestress is applied (the ‘source’), the aquifer and any driftlayers through which the signal must be transmitted(the ‘pathway’) and the ecological feature dependenton the shallow water table depth regime (the‘receptor’). This source – pathway – receptor type ofconceptual model for Habitats Directive assessments isdescribed in a separate sheet. They must also maximisethe use of any monitoring evidence of abstractionrelated drawdown (e.g. from comparison of historicabstraction rate changes and water level fluctuations,from pumping tests carried out during licencedetermination, or from more recent ‘signal tests’ onoperational sources.
Groundwater abstraction drawdownmethods (based on radial flowassumptions)
4.6 Assessment method summaries
< Section divider
This do
cumen
t was
with
drawn o
n 6 N
ovem
ber 2
017.

However, in order to assess the impacts of full licenceuptake, predictive techniques are likely to be required.A wide range of approaches can be attempted fromsimplistic confined aquifer analytical solutions (e.g.Theis), to more complex leaky or unconfined aquiferassumptions (e.g. Hantush or Neuman), layered radialflow numerical models or distributed numericalmodels. Distributed numerical models are described ina separate sheet. This sheet focuses on analytical andnumerical radial flow approaches which can be appliedto determine drawdown impacts from all of the licensedabstractions within a given radius of the wetland (e.g.within 5 km). The output from these analyses are mosteffectively represented in Licence AccumulationDiagrams (LADs) which are also described on aseparate sheet.
Time and parameter requirements for these radial flowbased techniques increase as they become moresophisticated and a progressive screening approach isrecommended. Simple analyses should be tried first(e.g. Theis) on the understanding that they shouldrepresent conservative, precautionary estimates ofdrawdown. More complexity can then be introduced tobetter represent the conceptual model until the site iseither clearly moved forward to the next RoC stage (onthe basis that a significant drawdown impact is likely),or dropped from the process (because the totaldrawdown is predicted to be less than agreedthresholds). In some cases significant uncertainty willremain which further, more sophisticated analysis willnot remove – these sites will also be moved forwardtogether with recommendations for furtherinvestigations or monitoring to improve confidence.
Method description Analytical Drawdown Estimates (e.g. Theis, Hantush or Neuman)An initial screening assessment of drawdown at thewetland associated with all the surroundinggroundwater abstractions can be made using the Theisequation. This is most readily achieved by collating allthe abstraction licence information in a spreadsheet(including locations, licence numbers, annual limits,assumed distributions of abstraction stress betweenmultiple location licences which are conservative withrespect to the wetland itself, etc.) together with theTheis function and aquifer parameter assumptions. Useof the ‘Aquifer Win32’ radial flow analysis package isalso an appropriate alternative. The drawdown fromeach abstraction can be calculated based on both thelicensed annual abstraction rate and the daily maximumlimit with aquifer parameters T and S specified as
uniform but subject to sensitivity across a very broadrange of values, e.g. after an assumed pumping periodof 200 days (a ‘long period’ without recharge).
Theis calculations of drawdown in the pumped andconfined aquifer, with no recharge, based on a dailymaximum abstraction rate and based on aquiferparameters on the outer bounds of credible ranges aredeemed worse case. They are then assumed to result inconservative over-estimates of the drawdown whichwould actually occur near the ground surface of thewetland. This is particularly the case when consideringwater level impacts in the upper, unconfined,discharging layer of a layered Drift-aquifer system whichis typical of many wetlands.
For wetlands where analytical models other than Theisare deemed to be more appropriate (but still relativelysimple) then alternative drawdown calculations can bemade. It must be stressed that an appropriate conceptualmodel of the site is established to inform aquiferparameters used in calculations. This might also involvethe use of spreadsheets or packages such as Aquifer Win32 to estimate unconfined aquifer (Neuman) or leakyaquifer (Hantush) drawdown and then simply assumingsuperposition of these impacts at the wetland.
This represents ‘one step beyond’ the Theiscalculations and it is recommended that the same timeperiod (e.g. 200 day) is assumed but that abstractionrate and main aquifer parameter assumptions are morecredible than the extremes previously adopted. In allcases it is expected that the predicted drawdown(which is still in the pumped aquifer rather than anyoverlying layer) will be less for the leaky aquifer thanthe Theis estimates and, in some cases, may fall belowthe total combined drawdown threshold chosen torepresent a ‘negligible impact’.
If drawdown at the site can be demonstrated to besufficiently small, the hypothesis of impact can berejected. If the site is unconfined, ‘sufficiently small’ islikely to be defined with respect to the natural variationof water level in the wetland considering the assumedtolerance of the features present, if data are available. Ifthe site is leaky, it is more likely that the hydrology ofthe wetland is defined by the hydraulic gradient causingleakage, than by the absolute level of the piezometricsurface. In this case, ‘sufficiently small’ will need to beevaluated with respect to the known range in gradient.It will be particularly significant if the drawdown issufficient to change the sign of the gradient whereasthe existence of a consistent upward gradient underhigh artesian pressure might suggest a stronglyrestricted pathway and negligible potential impacts.
Assessment method summaries: Groundwater abstraction drawdown methods 4.6
Environment Agency in partnership with Natural England and Countryside Council for Wales Understanding water for wildlife
< Section divider
This do
cumen
t was
with
drawn o
n 6 N
ovem
ber 2
017.

A 10cm drawdown threshold has been generallyadopted for Stage 2 Assessments (as this wasrecommended in TRAG as a default value). However, amore cautious 5 cm drawdown threshold isrecommended in TRAG for fen/mire communities. Thesethresholds may also provide an appropriate screen forStage 3, although this needs to be agreed with NaturalEngland/CCW (where appropriate) and the EnvironmentAgency –more specific thresholds for different featuresmay need to be considered, based on their tolerance indifferent seasons or months, as evident in the hydro-ecological prescriptions. As this level of simple analysisis precautionary relative to subsequent, moresophisticated, layered approaches, it is reasonable toreview results against the chosen threshold and, ifappropriate, use them to justify a statement of ‘noadverse effect’ without further work.
In addition to calculation of a total drawdown at the sitethrough superposition, the contributions from eachabstraction can be tabulated and plotted in revisedLADs. It may also be useful to map the results as aseries of overlapping 5 cm drawdown circles, drawnaround each source – the Aquifer Win32 analysis willgenerate a drawdown map as an alternative.
Application of these approaches should take a few hoursonly for each site, including the provision of some time toinvestigate the sensitivity of the final answer to a varietyof credible assumptions regarding aquifer parameters.
Layered, Radial Flow Model Drawdown EstimatesIf the simple approaches described above indicate thatpossible abstraction impacts may be above agreedthreshold levels, the application of more sophisticatedradial flow models should be considered. These modelswill provide an estimate of drawdown in an upper,unpumped aquifer, in response to abstraction stressesapplied to a lower layer – a conceptual arrangementwhich is of relevance to many of the wetlands underconsideration. However, it is important to note that theywill not take account of the near-surface influences ofditch or river drainage/recharge boundaries which willtend to reduce the amplitude of both seasonal andabstraction related water level fluctuations. In thisrespect it is reasonable to consider the resultingdrawdown estimates as conservative relative to aregional flow model which includes these boundaries.
A version of MODFLOW transformed to operate on radialflow assumptions can be applied (or any otherappropriate radial groundwater flow model). In manycases it is likely that a three layer model (possiblyrepresenting pumped aquifer – aquiclude – wetlandaquifer, depending on the conceptual model) should beadequate for the level of analysis. The thickness andparameterisation of the layers and the conductancebetween them should be derived from the dataintegration and conceptual understanding andinformed by previous analytical approaches. In line withthese approaches a prediction of the radial distance –drawdown curve can be made for all layers assuming200 days abstraction with no recharge.
The radial flow model may then only be run once foreach of the main aquifers from which abstractionoccurs, with the resulting distance – drawdown curvecopied into a spreadsheet where it is used to determinethe drawdown in the upper wetland layer due to eachabstraction in turn, based on distance from the wetlandand scaled according to abstraction rate.
Once again it is probable that the upper, wetland layerdrawdown estimates from such models will be smallerthan any simplified leaky single layer analysispreviously carried out. As before these drawdownpredictions for the wetland layer should be comparedagainst the same threshold values and hydro-ecologicalprescriptions to determine whether a statement of ‘noadverse’ effect can be justified or whether furtherappropriate analysis (possibly using time variantdistributed models) is required.
Application of the radial flow modelling approachshould be based on the aquifer parameters found tosuggest the largest credible drawdown estimates inprevious analytical sensitivity analysis. By choosingsuch conservative parameter combinations, the needfor extensive sensitivity analysis using the radial flowmodel can be minimised so that results should beobtainable within a day.
UsesApply these techniques where the ecological feature isdependent on a shallow water table ‘depth to water’regime which may be impacted by groundwaterabstraction i.e. groundwater fed wetlands.
Assessment method summaries: Groundwater abstraction drawdown methods 4.6
Environment Agency in partnership with Natural England and Countryside Council for Wales Understanding water for wildlife
< Section divider
This do
cumen
t was
with
drawn o
n 6 N
ovem
ber 2
017.

Assessment method summaries: Groundwater abstraction drawdown methods 4.6
Environment Agency in partnership with Natural England and Countryside Council for Wales Understanding water for wildlife
Further information and referencesLocal hydrogeologist with experience in developing ideas and conceptual models using disparate data. Entec havedeveloped spreadsheets to streamline all of these analyses for application to Anglian groundwater fed wetlands.Entec would be happy for these to be adapted for use more generally across the country although this wouldrequire further resources possibly with associated training. Calculations should be carried out by persons withhydrogeological knowledge to avoid misapplication of the spreadsheets, preferably with experience of theparticular aquifer in question.
Standard pumping test analysis texts (e.g. Krusemann & de Ridder).
User Manual for Aquifer win32.
Environment Agency Internal Document; Habitats Directive Stage 2 Review – Water Resource Authorisations;‘Practical Advice for Agency Water Resource Staff’ Version 2; March 2001.
< Section divider
This do
cumen
t was
with
drawn o
n 6 N
ovem
ber 2
017.

klahcdepmuP
levelretawdnuorg
klahcdepmuPlevelretawdnuorg
UNCONFINEDAQUIFER
PUMPED SEMICONFINEDAQUIFER
UNCONFINEDSAND AND
GRAVELAQUIFER
LEAKYCONFINING
LAYER
Chalk groundwaterabstraction
Chalk groundwaterabstraction
P7
P7
P4
P4
Sheringham and BeestonRegis Common
Sheringham and BeestonRegis Common
T = 100m²/dS = 5x10 -4
T = 220m²/dS = 0.0005Sy = 0.15
Water table in unconfined aquifer isassumed constant during pumping
Water table in unconfined aquifer isassumed constant during pumping
Chalk assumed to be isotropichomogeneous porous medium
K = 0.0001m/dV10m
Figure 1 Simple analytical models for Hantush and Neuman
Confined – leaky aquifer approach (Hantush)
Confined – leaky aquifer approach (Neuman)
Assessment method summaries: Groundwater abstraction drawdown methods 4.6
Environment Agency in partnership with Natural England and Countryside Council for Wales Understanding water for wildlife
< Section divider
This do
cumen
t was
with
drawn o
n 6 N
ovem
ber 2
017.

Assessment method summaries: Groundwater abstraction drawdown methods 4.6
Environment Agency in partnership with Natural England and Countryside Council for Wales Understanding water for wildlife
PUMPEDAQUIFER
Crag, chalk(modelled as
a homogenousporous media)
PUMPEDAQUIFER
Sand, gravelsilty sand
AQUITARDSSilt, clay
ebotnoitcartsbalanimoNdenoitroporp
4P7P
notseeBdnamahgnirehSnommoCsigeR
latotm51.0nwodward
latotm51.0nwodward
latotm21.0nwodward
latotm51nwodward
latotm21nwodward
levelretawdepmuPrefiuqadepmupni
levelretawdepmuP refiuqadepmupnuni
m51=ssenkcihT
d/²m522=T5000.0=S
51.0=yS
d/m1=KH
d/m1.0=KV
m01=ssenkcihT
d/²m10.0=T5000.0=S
01.0=yS
d/m100.0=KH
d/m1000.0=KV
m001=ssenkcihT
d/²m001=T5000.0=S
10.0=yS
d/m1=KH
d/m1.0=KV
leveldnuorg=levelretawtser
Figure 2 Three layer numerical redical flow model
< Section divider
This do
cumen
t was
with
drawn o
n 6 N
ovem
ber 2
017.

Assessment method summaries: Conceptualisation for Habitats Directive Appropriate Assessment 4.6
Environment Agency in partnership with Natural England and Countryside Council for Wales Understanding water for wildlife
SummaryType of system where appliedAll.
Applicability to groundwater or surface waterSurface water and groundwater.
Hydrological data requirementsIntegration of a wide variety of hydrological,hydrogeological, water quality, and meteorological datato develop an understanding of water supply and qualityinfluences on the water dependent site concerned.Information should also be gathered on the size andlocation of artificial influences (abstractions &discharges) thought to affect the water supply to the site.
Data needed may include rainfall & evaporation, orMORECS/MOSES hydrologically effective rainfall,recharge, abstractions and discharges, local geology,topographic or groundwater level contours, measuredriver flow hydrographs, groundwater level hydrographs,water quality distribution, river flow accretion data.
Ecological data requirementsHabitat type and species data. Habitat type NVC surveydata, or other vegetation mapping, should show theextent of particular communities of interest. Target notesmay provide some qualitative information on thecondition of the communities and the presence/absenceof positive and/or negative indicator species.
Survey data for particular species will provide anoverview of the distribution, abundance andconservation status.
The relevant species/habitats pages within section 2this document will help develop an understanding ofthe vulnerability and sensitivity of ecological features tochanges in water supply. Hydro-ecological prescriptionscan then start to be established.
Can method be used on its own?Establishing a sound conceptual characterisation is avital first step for any Appropriate Assessment or otherhydro-ecological assessment technique.Conceptualisation should be refined iterativelythroughout the process.
Applicability to European interest featuresApplies to them all.
Resource requirementCan be very quick and based on expertelicitation/brainstorming or can be based on analysisand integration of large volumes of data. Resourcerequirements will be determined partly by availableinformation, current understanding and the status ofthe site under investigation.
Figure 1 is a conceptual cross section drawn throughthe River Itchen cSAC to show mechanisms ofgroundwater abstraction impacts on river flows.
BackgroundAs a pre-requisite to applying any assessment it isessential to establish a sound conceptualunderstanding of:
• the natural water supply and water quality regime ofthe site;
• the way in which this has been modified by theactual influences of Environment Agency grantedconsents;
• the extent to which these impacts might beexacerbated if the consented activities were toincrease to their maximum allowable limits; and
• the other factors which may also influence thedesignated ecological features.
The aim of a Habitat’s Directive AppropriateAssessment is to ascertain there will be no adverseeffect on the integrity of the European site.
The ‘source-pathway-receptor’ paradigm isrecommended as the framework for developingconceptual models to support AppropriateAssessments, which in this context becomes ‘consent-mechanism-ecosystem’ approach. An adverse impactcan exist only if there is a consent (given), a vulnerableecosystem, and a mechanism by which the consent caneffect the ecosystem. The presence of a vulnerableecosystem is a given at most (but not all) sites, andtherefore the thrust of demonstrating no impact will liein demonstrating either that there is no mechanism, or
Conceptualisation for HabitatsDirective Appropriate Assessments
4.6 Assessment method summaries
Note: this approach can be tailored to suit any hydro-ecological investigationirrespective of the legislative driver
< Section divider
This do
cumen
t was
with
drawn o
n 6 N
ovem
ber 2
017.

that the hydrological or water quality impact via such amechanism is negligible (or not significant).
A robust determination is required based on a soundconceptualisation of the mechanisms involved, but adegree of pragmatism is also imposed by constraints ofavailable data, as well as by time and resources. Fullunderstanding of most of the sites concerned is unlikelyto be possible from the available dataset.Determinations may be conservative, but notunreasonably so. An impact that is too small to detectcan be discounted under triviality.
Within these constraints, methods of calculating impactshould take sufficient account of the site conceptualmodel to be defensible, and should assess the effect ofsimplifications made, demonstrating either explicitly orby reference that these simplifications are conservativewith respect to calculating impact.
It is unlikely that any determination of impact will be thefinal statement on the matter.
However, any determination of no significant impact oradverse effect will be a final statement.
A useful principle is that simple approaches should betried first, but that if the possibility of impact cannot beeliminated, then more complex approaches may betried. The work is complete once:
• it is clear either that there is negligible or nonesignificant impact; OR,
• that there is a possible impact, the size of which hasbeen determined and apportioned to the causingconsents; OR
• that it is impossible to prove given the present state ofknowledge that there is no impact (which is by defaulta determination that there is a possible impact).
Thus if, after ‘more complex’ assessments, risk ofimpact still cannot be excluded, the site will be carriedforward to where further detailed studies of remedialactions may be necessary.
Method descriptionConceptual models may be developed at a variety ofscales and degrees of sophistication, based onextensive data analysis or more rapid expert elicitation.The following summary description is an EXAMPLEwhich focuses on trying to understand the effects ofgroundwater abstraction (‘source’) drawdown and flowimpacts, as propagated through the intervening aquifer(‘pathway’), on the shallow water table and drainsystem of a wetland habitat (‘receptor’). It is hoped thatthe reader will be able to make analogies with othertypes of Review of Consent problems.
Data collation and integrationCollate information on the current ‘sources’ around thewetland which may be causing impacts:
e.g. licensed and unlicensed abstraction locationswithin 5 km of the site, historical, current and licensedrates of pumping including (for the largest) depths ofscreened or open sections.
Collate information to provide an understanding of the‘pathways’ from the sources to the near surfacewetland: e.g. geological layering, historic responses ofgroundwater levels to changes in abstraction andrecharge stresses (including the results of any ‘signal’or pumping tests), aquifer properties (horizontal andvertical layering)and hydrochemical data.
Collate information to provide an understanding of thedesignated ecological features – the ‘targets’ for theanalysis: e.g. distribution, abundance and vulnerabilitymechanisms.
Collate information on the other, ‘non-consented factors’which may also influence the ecological features: e.g.site drainage, physical habitat management etc.
Schematic maps and sectionsPrepare plans and hydrogeological cross-sectionsincluding source, pathway and target and illustratingthe main features including:
• the main watercourses;• the locations of consented abstractions and
discharges from groundwater and surface water andany protected rights (these will be shown in plan,with key abstractions in section as appropriate);
• sections through the main wetlands;• sections through other points of interest such as
springs, IDB drains, etc.
The area considered should be large enough to includeall consents expected to affect the site.
The plans should identify the rough line of cross-sections.
The preparation of the working plans and cross-sections should be viewed as a way of facilitating three-dimensional visualisation of the hydrological system.The schematic cross-sections should draw together onone diagram details of the following:
• the geological framework, including the shallowgeology and any Quaternary deposits;
• an indication of topography;• factors affecting groundwater recharge;• controls on surface water levels, e.g. ditches, rivers
and IDB drains and their sluices should be identifiedand tied in to sections;
Assessment method summaries: Conceptualisation for Habitats Directive Appropriate Assessment 4.6
Environment Agency in partnership with Natural England and Countryside Council for Wales Understanding water for wildlife
< Section divider
This do
cumen
t was
with
drawn o
n 6 N
ovem
ber 2
017.

• location of ecological features;• sections through public water supply or spray
irrigation boreholes as appropriate showing theposition of the open section so abstraction horizonsare established and an indication of transmissivityand storage characteristics of the deposits;
• an indication of the behaviour of groundwater levelswithin the area and for the different geological unitsrepresented by the schematic cross-section, or anindication of how we anticipate the piezometric levelsat different depths are behaving both naturally and inresponse to hydrochemistry – we need to gain anunderstanding of the horizontal and the vertical flows;
• an indication of the hydrochemistry; and• an indication of the flows and factors which control
surface water levels in watercourses.
The cross-sections should indicate the hypothesisedflow of water from the ground surface through theunsaturated and saturated aquifer system within andacross the boundaries of the hydrological domains. Theunsaturated and saturated zone flow processes shouldbe indicated, with emphasis on the dominantprocesses within any domain. The degree of surfacewater/groundwater interaction should be givenparticular consideration. From the available fieldevidence, and from our previous experience, what dowe think the processes are?
Basically, what are the inflows and the outflows, whatare the pathways along which water will flow, and whichpathways are abstraction horizons likely to be affecting?
Assessment of vulnerability mechanismsFor effective analysis of hydrological impact there mustbe an assessment of how impact may arise at theecological level. Key parameters are one or more of:
• Water level regime;• Water flow regime (velocity or volumetric rate); and• Water quality regime.
Conceptual understanding anduncertaintyA conceptual understanding of the groundwater andsurface water flow system should be drawn from the
schematic maps, sections, and water balances withparticular reference to the hydroecological vulnerabilitymechanisms and ‘source – pathway – target’ philosophy.
This understanding should extend beyond the wetlandto identify other surface water features which are alsothought to be dependant on groundwater discharge andmay therefore also be impacted by groundwaterabstraction.
The limits of the current conceptual understanding andmajor uncertainties should be indicated.
These uncertainties may include geologicaluncertainties. The extreme plausible conceptual modelleading to the greatest impact should be identified anddefended with robust argument. If such anidentification cannot be made or defended, sensitivitytesting will be needed at a later stage to demonstrate aconservative assessment. Iteration, refinement anddevelopment are essential components of theconceptual modelling process.
ApplicationA conceptual model of the type described above can beapplied to make quantitative assessments of impactaccording to a variety of techniques which areseparately described (including water balanceassessments, groundwater level drawdown estimates,Impacts from Groundwater abstraction on River Flows(IGARF) type assessments, distributed groundwatermodels etc).
SensitivityConceptual models need to be tested quantitatively tounderstand how sensitive they may be to assumptionswhich are inevitably required in the face of conceptualor parameter uncertainty.
ApplicabilitySome form of conceptual description should bepossible and essential for any Appropriate Assessment.
Assessment method summaries: Conceptualisation for Habitats Directive Appropriate Assessment 4.6
Environment Agency in partnership with Natural England and Countryside Council for Wales Understanding water for wildlife
Further informationEcohydrological Guidelines for Lowland Wetland Plant Communities‘Resource Assessment and Management Framework – Report and User Manual – Version 3’ (2002), R&D ManualW6-066M Version 3, published by Entec on behalf of the Environment Agency.
Various Environment Agency documents (particularly from the NGWCLC including the IGARF Manual).
< Section divider
This do
cumen
t was
with
drawn o
n 6 N
ovem
ber 2
017.

Assessment method summaries: Conceptualisation for Habitats Directive Appropriate Assessment 4.6
Environment Agency in partnership with Natural England and Countryside Council for Wales Understanding water for wildlife
Low
er p
erm
eabi
lity
chal
k
Hig
h pe
rmea
bilit
y ch
alk
Peat
and
allu
vium
Uni
form
, cle
an
grav
els
wel
l co
nnec
ted
to c
halk
Gro
un
dw
ate
r a
bs
tra
ctio
nC
arr
ier
Na
vig
ati
on
M
ain
ch
an
ne
l
Hig
h flo
w, w
ide,
low
, flu
shed
bed
, wel
l co
nnec
ted
to g
rave
ls
and
chal
k
Bu
rie
d c
ha
nn
el
wit
h lo
w
perm
eabi
lity
fill
(ver
y lo
calis
ed)
Gro
undw
ater
le
vels
Pum
ping
sw
itche
d of
fPu
mpi
ng s
witc
hed
on
Figu
re 1
Con
cept
ualu
nder
stan
ding
oft
he im
pact
ofgr
ound
wat
er a
bstr
acti
ons
on ri
ver f
low
s
< Section divider
This do
cumen
t was
with
drawn o
n 6 N
ovem
ber 2
017.
Assessment method summaries: Flood inundation modelling 4.6
Environment Agency in partnership with Natural England and Countryside Council for Wales Understanding water for wildlife
SummaryType of system where appliedRiverine or Estuarine. Consider also for assessment offlood flows and flood storage within Reservoirs/Lakes,Embayments and natural or artificial Flood Washlands.
Applicability to groundwater or surface waterThe technique can be used to estimate flow volumesand velocities, extent, depths and duration of floodingin flood washlands, depths of flow within rivers andassociated floodplains under flood conditions ofvarying probability. More complex 2D models can beused within extensive floodplains and estuaries while3D models are usually only used in large estuaries.
Hydrological data requirementsThese depend on the type and complexity of the model.All models will require data on channel topography (orestuary bathymetry), and channel roughness. Floodflows can be estimated using Flood EstimationHandbook (FEH) techniques while tidal levels can beestimated from extreme tidal datasets.
Ecological data requirementsNone, although more sophisticated techniques areevolving to model natural river regimes includingvegetated channels.
Can method be used on its own?It needs to be combined with Flood Estimation methodsand some form of Digital Elevation Model (DEM) wherelarge out-of-bank flows are forecast.
Applicability to European interest featuresThis method relates primarily to wet grassland sites(usually designated for their bird species) where depthsand duration of winter flooding are of concern, orwashlands where water level management under extremeflow conditions is required. Flood and tidal modelling isalso applicable to coastal sites where habitats may bevulnerable to increased levels or flow velocities.
Resource requirementDepends upon nature and complexity of modellingundertaken.
BackgroundFlood inundation modelling provides a methodology forestimating flood flows, velocities and depths of flow inrivers and associated floodplains under floodconditions as well as depths and durations of flooding
in washlands. Coastal and estuarial models can becombined with coastal process models to estimateimpacts on coastal and estuarial habitats, as well astransitional wetlands.
Increasingly such models are also being used toinvestigate hydrological impacts under climate changeusing sensitivity analysis (e.g. increasing flood flows by20%).
The level of sophistication applied to modelling canvary widely depending upon the specific applicationand the time/budget available for making theassessment. Flood models can be subdivided into thefollowing categories: -
• 1D models (e.g. HEC-RAS, MIKE 11, ISIS) – typicallyused for river modelling where floodplains arereasonably contained, although may be applied in aquasi-2D form to simulate complex floodplainhydraulics.
• 2D models (e.g. MIKE 21, DIVAST) – becoming morewidely used and applicable to situations wherefloodplains are very wide and in wide estuaries orembayments.
• 3D models (e.g. MIKE 3, TRIVAST) – require asignificant input of resources and are more normallyused for research purposes.
Models can be run in steady-state or time variant mode.Steady-state models are used where a single simulatedflow and corresponding water level are required. Theytake no account of storage effects or time-variantboundary conditions such as tidal cycles. As a resultflood extents may be conservative and are usually usedwhere a quick precautionary assessment is required forlittle financial or temporal outlay. Where storage effectsare significant or time-variant effects such as durationand variation in level are important then time variant orhydrodynamic models are used.
General data requirementsGeneral data requirements for flood modelling include:
• estimate of flood peak flows or flood hydrographs; intidal regimes this would also include extreme tidallevels and tidal cycles (see below);
• evaluation of river geometry or estuarial bathymetryand associated surface roughness for input intochannel hydraulics; and
Flood inundation modelling4.6 Assessment method summaries
< Section divider
This do
cumen
t was
with
drawn o
n 6 N
ovem
ber 2
017.

Assessment method summaries: Flood inundation modelling 4.6
Environment Agency in partnership with Natural England and Countryside Council for Wales Understanding water for wildlife
• some form of Digital Terrain Model (DTM) or DigitalElevation Model (DEM) covering the floodplain ontowhich predicted flood levels can be mapped topredict flood extents under floods of varyingmagnitude and/or temporal characteristics.
Flood estimationFlood estimation can be carried out on un-gauged andgauged catchments using flood estimation techniquesbased on the Flood Estimation Handbook (FEH). Wheregauged records exist statistical analysis can be carriedout using series of annual maxima or peaks overthreshold (POT) to estimate peak flows. An alternativeapproach uses rainfall-runoff methods to generate floodhydrographs. For ungauged sites or sites where thereare insufficient observed data, methods exist to pooldata from ‘pooling groups’ of gauged sites in nearby orhydrologically similar catchments.
In estuarial situations it may be necessary to assessextreme levels based on a combination of tidalconditions and extreme flood flows. This is normallycarried out using joint probability techniques.
1D hydrodynamic models• HEC-RAS
– Steady and unsteady 1D flood flow simulation inriver networks. Produced in the US by the ArmyCorps of Engineers, widely used particularly bysmaller consultancies.
– Website: http://www.hec.usace.army.mil/software/hec-ras/hecras-hecras.html
• MIKE 11– Steady and unsteady 1D flood flow simulation in
river networks. Also simulates sediment and waterquality. Produced in Denmark by DHI Software, andwidely used around the world. Has an integratedrainfall-runoff simulation, including FEH methods.
– Website: http://www.dhisoftware.com/mike11/• ISIS
– Steady and unsteady 1D flood flow simulation inriver networks. Also simulates sediment and waterquality. Produced in the UK by HR WallingfordGroup. Has an integrated rainfall-runoffsimulation, including FEH methods.
– Website: http://www.wallingfordsoftware.com/products/isis.asp
2D hydrodynamic models• MIKE 21
– Unsteady 2D simulation of rivers, estuaries andcoastal waters. Also simulates sediment, waterquality and waves. Produced in Denmark by DHISoftware.
– Website: http://www.dhisoftware.com/mike21/• DIVAST (Depth-Integrated Velocities and Solute
Transport)– Unsteady 2D flow and contaminant transport
estuarine/coastal model. Produced by theEnvironmental Water Management ResearchCentre (at Cardiff University).
– Website: http://www.cf.ac.uk/engin/research/water/2.1/2.1.1.6/erdf2.1.1.6.html
3D hydrodynamic models• MIKE 3
– Unsteady 3D simulation of rivers, lakes, estuaries,bays, coastal waters and seas. Takes into accountdensity variations, bathymetry, meteorology, tidalelevations and currents. Produced in Denmark byDHI Software.
– Website: http://www.dhisoftware.com/mike3/• TRIVAST
– Unsteady 3D simulation of hydrodynamics (3Dextension of DIVAST, see above). Makes ahydrostatic assumption in the vertical plane.
– Website: http://www.cf.ac.uk/engin/research/water/2.1/2.1.1.6/erdf2.1.1.6.html
Link to sediment transport/coastalprocess modelsFlood inundation models can be linked to sedimenttransport models and various packages are available,often as additional modules within an overall modellingpackage. Examples include MIKE 11, MIKE 21, MIKE 3,ISIS, DIVAST and TRIVAST.
< Section divider
This do
cumen
t was
with
drawn o
n 6 N
ovem
ber 2
017.

Assessment method summaries: Lidar terrain mapping 4.6
Environment Agency in partnership with Natural England and Countryside Council for Wales Understanding water for wildlife
SummaryType of system where appliedA method of obtaining topographic data which isapplicable to site characterisation and as an aid to theinterpretation of hydrological impacts into effects.
Applicability to siteRelevant to interest features associated with regimesidentified above.
Standard applicationsTopographic data are integral to the water resourcefunction of the Environment Agency, in particular floodplain and drainage mapping, coastal zone monitoring,flood risk analysis, hydraulic and groundwatermodelling and monitoring.
Resource requirementRelatively inexpensive process requiring airborne laserscanning and subsequent truthing and filtering. Inmany cases more costs effective than high-resolutionground based topographic survey.
IntroductionLIDAR (Light Detection and Ranging), also known asairborne laser scanning, is a relatively new remotesensing technique for cost-effective topographic terrainmapping. It is ideally suited for mapping extensiveareas where accurate elevation data are rapidlyrequired.
The Environment Agency, Infoterra, and OrdnanceSurvey are together promoting this technique. It wasfirst flown by the Environment Agency in 1998 and israpidly developing with constant improvement inmethods of data acquisition and processing. Forinstance, new equipment has meant that sites flownfrom 2000 no longer have the ‘white space’ problemdue to absorption of the laser pulses by water andtarmac.
Method DescriptionThe system operates on a principal similar to radar inthat a laser ranger (ALTM – airborne laser terrainmapper) transmits a series of pulses, these arereflected back from the ground and used to measurethe distance between the ground and the aircraft. Theaircraft fixes its position to coincide with each pulse by
an integrated on-board Global Positioning (GPS) and anInertial Navigation (INS) system. Areas are generallyflown in winter when there is less ground cover.
The output is in the form of contours and terrainmodels, which can be:
• Digital Elevation Model (DEM) representing thetopographic surface and includes features such asbuildings, trees etc (often referred to as clutter).
• Digital Terrain Model (DTM) representing the groundsurface. It is processed by filtering out the ‘clutter’from the DEM.
There are currently three methods of filtering the data toremove features and vegetation. In order of increasingsensitivity these are:
• Automatic (generally used);• Semi-automated/ supervised (on request);• Terrascan (as required).
The point elevations are acquired at 1 m or 2 m spatialresolution, to a vertical (z) accuracy of ±0.15 m or even±0.10 m depending on plane altitude, and a plan (x &y) accuracy of better than 1/2000 x altitude.Independent ground truthing commenced in 2000 andnow each polygon is automatically ground truthedwhen flown.
Data is available at a variety of postings between 0.5 –2m although data at 0.15m posting is occasionallycaptured in areas where higher detail is required toidentify smaller features
The Environment Agency can provide the data as aseries of tiles, either 5 x 5 km or 2 x 2 km, and these areavailable on CD as both DEM and DTM models. They canbe processed in ARCView using spatial analyst toproduce high-resolution topographic surfaces in plan,section, and 3D.
ApplicationApplications include:
• Flood plain and drainage mapping;• Coastal Zone monitoring;• Flood risk analysis;• Hydraulic modelling;• Landform monitoring;• Forestry management;
Lidar terrain mapping4.6 Assessment method summaries
< Section divider
This do
cumen
t was
with
drawn o
n 6 N
ovem
ber 2
017.

Assessment method summaries: Lidar terrain mapping 4.6
Environment Agency in partnership with Natural England and Countryside Council for Wales Understanding water for wildlife
• Landfill site assessment;• Pipeline routing;• Cartography.
The main advantage is that the method can be used tomap areas of difficult terrain where accurate elevationsare rapidly required by remote sensing and under mostweather conditions.
Research is on-going into methods of improving theproduct, its accuracy, and its use in conjunction withother techniques, such as digital photogrammetry,image analysis, synthetic aperture radar (SAR) andland-form profiles.
Further informationEnvironment Agency: Science Enterprise Centre, Twerton.
Ordnance Survey website (www.ordnancesurvey.co.uk).
Infoterra website (www.infoterra-global.com).
< Section divider
This do
cumen
t was
with
drawn o
n 6 N
ovem
ber 2
017.
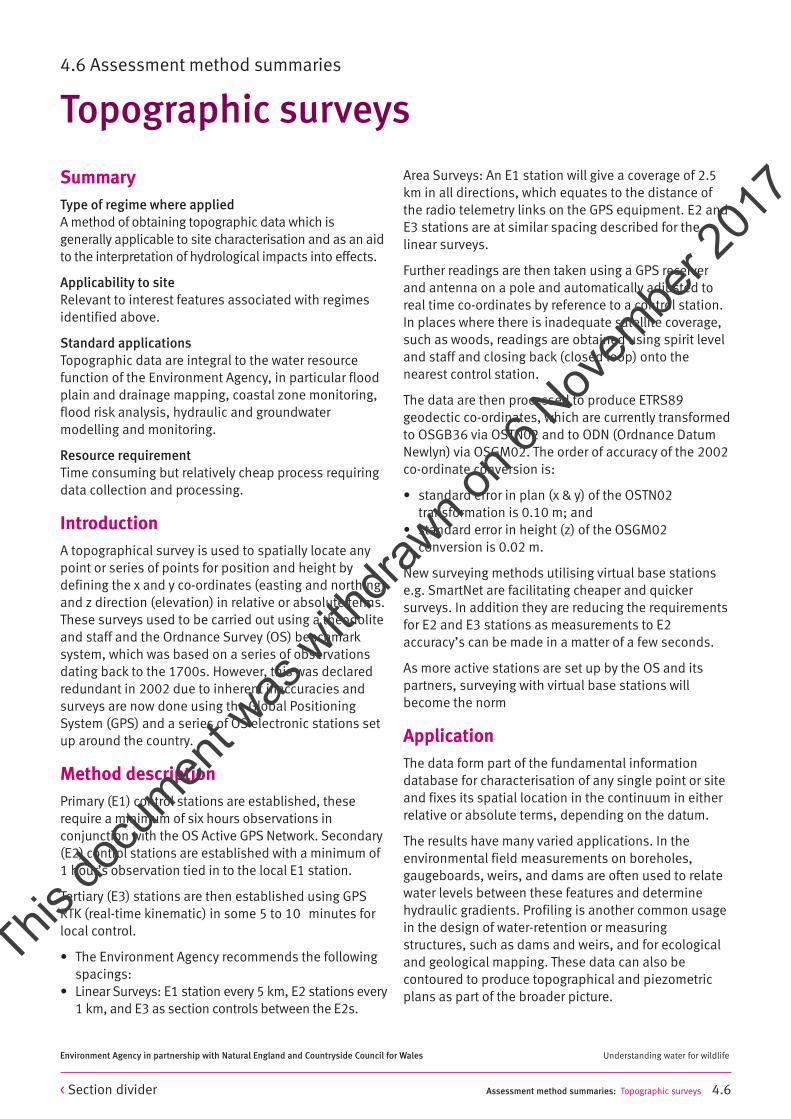
Assessment method summaries: Topographic surveys 4.6
Environment Agency in partnership with Natural England and Countryside Council for Wales Understanding water for wildlife
SummaryType of regime where appliedA method of obtaining topographic data which isgenerally applicable to site characterisation and as an aidto the interpretation of hydrological impacts into effects.
Applicability to siteRelevant to interest features associated with regimesidentified above.
Standard applicationsTopographic data are integral to the water resourcefunction of the Environment Agency, in particular floodplain and drainage mapping, coastal zone monitoring,flood risk analysis, hydraulic and groundwatermodelling and monitoring.
Resource requirementTime consuming but relatively cheap process requiringdata collection and processing.
IntroductionA topographical survey is used to spatially locate anypoint or series of points for position and height bydefining the x and y co-ordinates (easting and northing)and z direction (elevation) in relative or absolute terms.These surveys used to be carried out using a theodoliteand staff and the Ordnance Survey (OS) benchmarksystem, which was based on a series of observationsdating back to the 1700s. However, this was declaredredundant in 2002 due to inherent inaccuracies andsurveys are now done using the Global PositioningSystem (GPS) and a series of OS electronic stations setup around the country.
Method descriptionPrimary (E1) control stations are established, theserequire a minimum of six hours observations inconjunction with the OS Active GPS Network. Secondary(E2) control stations are established with a minimum of1 hour’s observation tied in to the local E1 station.
Tertiary (E3) stations are then established using GPSRTK (real-time kinematic) in some 5 to 10 minutes forlocal control.
• The Environment Agency recommends the followingspacings:
• Linear Surveys: E1 station every 5 km, E2 stations every1 km, and E3 as section controls between the E2s.
Area Surveys: An E1 station will give a coverage of 2.5km in all directions, which equates to the distance ofthe radio telemetry links on the GPS equipment. E2 andE3 stations are at similar spacing described for thelinear surveys.
Further readings are then taken using a GPS receiverand antenna on a pole and automatically adjusted toreal time co-ordinates by reference to a control station.In places where there is inadequate satellite coverage,such as woods, readings are obtained using spirit leveland staff and closing back (closed loop) onto thenearest control station.
The data are then processed to produce ETRS89geodectic co-ordinates, which are currently transformedto OSGB36 via OSTN02 and to ODN (Ordnance DatumNewlyn) via OSGM02. The order of accuracy of the 2002co-ordinate conversion is:
• standard error in plan (x & y) of the OSTN02transformation is 0.10 m; and
• standard error in height (z) of the OSGM02conversion is 0.02 m.
New surveying methods utilising virtual base stationse.g. SmartNet are facilitating cheaper and quickersurveys. In addition they are reducing the requirementsfor E2 and E3 stations as measurements to E2accuracy’s can be made in a matter of a few seconds.
As more active stations are set up by the OS and itspartners, surveying with virtual base stations willbecome the norm
ApplicationThe data form part of the fundamental informationdatabase for characterisation of any single point or siteand fixes its spatial location in the continuum in eitherrelative or absolute terms, depending on the datum.
The results have many varied applications. In theenvironmental field measurements on boreholes,gaugeboards, weirs, and dams are often used to relatewater levels between these features and determinehydraulic gradients. Profiling is another common usagein the design of water-retention or measuringstructures, such as dams and weirs, and for ecologicaland geological mapping. These data can also becontoured to produce topographical and piezometricplans as part of the broader picture.
Topographic surveys4.6 Assessment method summaries
< Section divider
This do
cumen
t was
with
drawn o
n 6 N
ovem
ber 2
017.

Assessment method summaries: Topographic surveys 4.6
Environment Agency in partnership with Natural England and Countryside Council for Wales Understanding water for wildlife
Further informationEnvironment Agency National Standard Contract and Specification for Surveying Services, Version 2.2 (andsubsequent amendments).
< Section divider
This do
cumen
t was
with
drawn o
n 6 N
ovem
ber 2
017.

Assessment method summaries: Resource Assessment and Management (RAM) framework 4.6
Environment Agency in partnership with Natural England and Countryside Council for Wales Understanding water for wildlife
SummaryType of system where applied Riverine (potentially as a stand alone screening tool).
Components from RAM can also be used to assistassessments for other (non riverine) hydrologicaldomains.
Applicability to groundwater or surface watersSurface water and groundwater abstraction impacts onriver flows – at a sub-catchment ‘screening scale’ (FlowDuration Curve (FDC) analysis in CAMSLedger.xls anddaily flow hydrographs in RivDay.xls), plus detailedaccretion profiling where required (in AccProf.xls). Alsowithin RAM the Aquifer Response Function can be usedto assist in initial characterisation of groundwater fedhabitats served by large recharge capture areas.
Hydrological data requirementsNatural flow duration curves for a number of sites,gauged flow data, licensed & recent actual abstractionand discharge datasets (CAMSLedger), daily river flowhydrographs (RivDay), spot flow survey data andnatural flow output from Lowflows 2000 (AccProf).
Ecological data requirementsBenchmark macro-invertebrate and macrophyte data,plus assessments of physical habitat and fisheries.Used within the Environmental Weighting (EW) Systemto derive River Flow Objectives (RFO) and assess actualecological departure from the benchmark.
Can method be used on its own?Yes (for riverine domains) – may require comparisonwith other river flow targets (e.g. those determined byNatural England/CCW), in addition to theEnvironmentally Weighted - River Flow Objectives (EWRFOs) derived within RAM Framework.
Applicability to european interest featuresMainly those associated with riverine systems; carerequired when interpreting data due to methodsensitivity. See separate report on applicability(Environment Agency; 2003).
Resource requirementTime consuming, requiring collation and processing of(generally) voluminous datasets. However, under theCAMS programme, necessary data sets will becomeincreasingly established.
Figures 1 and 2 show the flow duration curve analysis,which lies at the heart of long term River AP resourceassessment, and an example of an accretion profilewhich can be used to improve understanding of thedistribution of abstraction and discharge impacts inbetween River Assessment Points (Aps).
The Resource Assessment and Management Frameworkcurrently provides the most appropriate tool forestimating the amount of surface water available withina river for abstraction relative to the ecologicalrequirements of the watercourse, and for quantifying theLicensed and Recent Actual abstraction and dischargeimpacts on river flows (including groundwater andsurface water consents). It can also provide anassessment of predicted recharge and discharge ratesfrom any aquifers at a sub-catchment scale (e.g. aquifersdraining to large coastal wetlands) and therefore beused to help characterise certain groundwater fed sitesand assess impacts related to groundwater abstraction.However, the RAM Framework is not considered asuitable tool for evaluating local groundwater balances(e.g. in the vicinity of smaller inland wetlands) as thecapture zones to such sites are often subject tosignificant temporal/seasonal variations and/or mainaquifer interaction with the near surface is complicatedby the near surface (drift) geology to the extent that themethods utilised in the RAM Framework are sometimesnot considered appropriate.
The method, which applies to riverine systems with orwithout a groundwater influence, uses naturalised flowdata as a benchmark to define ecologically desirableflow regimes on a reach-by-reach basis in thecatchment, depending on the sensitivity of the ecologywithin the reach to abstraction related flow reductions.The ecologically desirable flows are compared withestimates of actual flows and flows predicted for fully
Resource Assessment andManagement (RAM) framework
4.6 Assessment method summaries
Note: This method summary relates to RAM V.3 and will be superseded by RAM V.4 in March 2008.
< Section divider
This do
cumen
t was
with
drawn o
n 6 N
ovem
ber 2
017.

Assessment method summaries: Resource Assessment and Management (RAM) framework 4.6
Environment Agency in partnership with Natural England and Countryside Council for Wales Understanding water for wildlife
licensed uptake to indicate the abstraction status ofeach reach. Care should be taken when applying theEnvironmental Weighting system (which is a componentof the RAM Framework) to particularly sensitive speciesand habitats, as the sub-catchment resolution of thesystem may not be sufficient to achieve the desiredlevel of confidence for Habitats Directive purposes.
BackgroundThe river flow Resource Assessment and ManagementFramework compares the ecologically desirable flow ina river system with the denaturalised flows predictedfor recent actual or fully licensed abstraction scenarios.This is achieved in five main stages:
• The natural flow regime at a number of locations(‘assessment points’) is established by, for example,use of Low Flows 2000, naturalising gauged flowbased on abstraction and discharge data, ormodelling;
• The sensitivity to abstraction related flow reductions(the ‘environmental weighting band’) for eachassessment point is determined based on fourecological indicators: physical habitat, macrophytes,macro-invertebrates and fisheries;
• A minimum ecologically desirable flow regime (the‘river flow objective’ – RFO) is hung from the naturalflow duration curve based on the environmentalweighting band. The more sensitive the ecosystemthe closer the ecological RFO is to the natural flow.The appropriateness of the RAM Framework EW RFOfor Habitat’s Directive purposes (in comparison withNatural England’s ‘within 10% of natural flow’ defaultFavourable Conditions Table Target) has been subjectto separate review (Environment Agency; 2003);
• The natural flow is denaturalised by application ofthe abstraction and discharge dataset to produce anestimate of what the flow regime currently is basedon recent actual abstraction and discharge impacts,and what it would be if all abstractions wereincreased to fully licensed rates. Where the recentactual flow is lower than RFO over much of the lowerflow range, the reach may be given an ‘over-abstracted’ status. If this is the case only for thelicensed scenario flow, the reach may be deemed‘over-licensed’. Where not over-licensed RAMprovides an indication of surplus water above theRFO, which may be available for further abstractionlicensing abstraction; and
• The denaturalised recent actual flow should becompared to gauged flow data to check that theassumptions underlying the natural flow regime andassigned influences for abstraction and dischargeappear credible.
The RAM Framework EW system includes a further‘ground truth’ check to investigate whether thosereaches deemed to by ‘over-abstracted’ are showingsigns of actual ecological stress.
How far away from the ‘benchmark’ or natural status arethey, and, if ecological integrity appears to be impairedon the basis of monitoring data, is this due to theeffects of flow reduction, or other factors (e.g. poorwater quality or physical channel modifications).
The groundwater component of the RAM Frameworkuses estimates of recharge and discharge combinedwith aquifer properties data to evaluate the abstractionstatus of groundwater bodies, which may also be invarious degrees of surplus, over-licensed or over-abstracted. Empirical evidence of groundwaterproblems or local techniques may also be applied aspart of the groundwater tests. These groundwaterresource analysis may have some value for theassessment of GW fed wetland habitats dependent ongroundwater discharge served by large recharge capturezones. In fact, components from RAM are being used inongoing Habitats Directive Review of Consentsassessments for the North Norfolk Coast.
UsesThe RAM Framework was designed for applicationwithin the Agency’s Catchment AbstractionManagement Strategy process and is supported bysome spreadsheet tools:
• CAMSLedger: flow duration curve analysis at RiverAssessment Points (APs), plus groundwater resourceassessment for groundwater management units(GWMUs);
• RivDay: Daily river flow hydrograph analysis at‘critical’ River APs;
• AccProf: River flow accretion profile analysis toidentify abstraction impacts between River APs;
• GWMon: Monthly groundwater outflow analysis forcritical GWMUs.
It is useful as a screening tool for identifyingabstraction impacts and where water may or may not beavailable for further licensing at a sub-catchment scale.It can be used as an initial screening tool for newlicences, but does not negate the need for a detailedlocal appraisal of any licence application and its effecton local water features and other water users to beundertaken.
< Section divider
This do
cumen
t was
with
drawn o
n 6 N
ovem
ber 2
017.

Although the accretion profile options will also behelpful in identifying smaller scale river reaches whichare critically flow depleted the RAM Framework shouldbe applied with caution when assessing effects onEuropean habitats and species at this scale, as it isdesigned to be used as a screening tool. It provides auseful method of assessing impacts on these featuresbut other techniques are also likely to be required forfurther analysis.
Data requirementsThe RAM Framework is generally data intensive - it requires collection of considerable hydrological,ecological and abstraction and discharge data. Datarequirements may be reduced by focusing effortson major artificial influences or particularly sensitiveriver reaches.
Typical data required for riverine analysis includenatural flow duration curves (Low Flows 2000,modelling etc), licensed quantities and actualabstraction data, discharge data (typically in the form ofactual or consented dry weather flows). Many of thesedata are fairly readily available from existingEnvironment Agency databases although abstractionand discharge information often requires significantmanipulation before input into the RAM Frameworkspreadsheets. For the groundwater assessment
estimates of recharge, aquifer properties, and othergroundwater parameters may be used, depending onthe resolution of the resource assessment required. Insome cases potentially useful datasets, for exampleabstraction returns, may be flawed or unavailable andsimple but justifiable estimates must be made using,for example, uptake factors.
The RAM spreadsheets limit the number of Riverassessment points in any given river system to 20, andguidance suggests that the minimum catchment to anassessment point should be of the order of 50 km2(although accretion profiles may be extended furtherupstream if required).
ApplicabilityThe RAM Framework’s intended use is as a high levelscreening methodology with the option of moredetailed river flow accretion profiling where required. Itcan indicate where there is the potential for ecologicalimpact or where abstraction may be increased withoutadversely affecting the ecosystem. Further investigationwould be required on a site specific, more detailed,level to determine whether an interest feature (of aHabitats Directive site for example) is impacted by overabstraction and what changes are required toadequately mitigate effects.
Assessment method summaries: Resource Assessment and Management (RAM) framework 4.6
Environment Agency in partnership with Natural England and Countryside Council for Wales Understanding water for wildlife
Further Information‘Resource Assessment and Management Framework – Report and User Manual - Version 3’ (2002), R&D ManualW6-066M Version 3, published by Entec on behalf of the Environment Agency.
(Environment Agency; 2003) RAM Framework; An Appraisal of the EW System for Assessing Impacts on HabitatsDirective Interest Features (currently in Draft); Entec; December 2002.
< Section divider
This do
cumen
t was
with
drawn o
n 6 N
ovem
ber 2
017.

Figure 1.7
b)
0
20
40
60
80
100
120
140
160
180
200
0 10 20 30 40 50 60 70 80 90 100
Percentage of time flow exceeded
Da
ilyF
low
(Ml/d
ay
)
Benchmark River Flow at AP
Ecological RFO, (EW Band = M)
Scenario River Flow (withLicensed Abs .& Dis . Impacts)
‘Natural’ or ‘Benchmark’Long Term FlowDuration Curve
‘Natural’ FDC
Iterate, Refine & Select Historic Years to Illustrate Resource Availability Variation
EnvironmentalWeighting Band INT between
thresholds forvariability
EWBand
UNC(% ofQ95)
1 2 3
TAKE(% ofINT)
VH 1-5 0.2 0.3 0.5 15%H 5-10 0.2 0.3 0.6 25%M 10-15 0.2 0.4 0.7 50%L 15-25 0.2 0.5 0.8 75%VL 25-30 0.3 0.6 0.9 75%
Other ? ? ? ? ?
Table for Ecological RFOs
Based On EW Band
Licensable ‘unconstrained’abstraction impacts as % of‘benchmark’ low flows (Q95)
(to protect low flows)
Licensable %proportion of each
INTerval
Intervals (INT) betweensuccessive flow thresholds
(HOFs) above Q95(to protect flow variability)
Ecological RFO Long TermFlow Duration Curve
(override if justified byspecial UNC or HOF needs)
Abs & Dis ScenarioLong Term FlowDuration Curves
MIN % TIME,SCENARIO
>ECO. RFO
ABS & DISSCENARIO
AP RESOURCESTATUS
> 95% LICENSED WATERAVAILABLE
70 ñ 95 % LICENSED NO WATERAVAILABLE
< 70% LICENSED OVERLICENSED
<70% RECENTACTUAL
OVERABSTRACTED
Compare Scenario and Eco RFO FDCs
De- naturalisationProcess
Upstream Licensed (orRecent Actual)
Abstraction & DischargeImpacts plus
Unlicensed Flow Needs
NO WATERAVAILABLE
WATERAVAILABLE
OVERLICENSED
OVERABSTRACTED
a)
AT LOW FLOWS
0
20
40
60
80
100
120
140
160
180
200
TAKE 3(LicensableProportion of INT 3)TAKE 2(LicensableProportion of INT 2)TAKE 1(LicensableProportion of INT 1)UNC (LicensableWithout FlowConstraints)
85
05
101520253035404550556065
50 55 60 65 70 75 80 85 90 95 100
Low Flow Detail
No Water Available
Flow
Sensitivity
Very HighHigh
ModerateLow
Very Low
NWA WAOLOA
No Water AvailableOver Licensed
Over Abstracted
Water AvailableLicensed
Recent Actual
95
Low Flow Resource Availability Statusbased on the lowest %ile where theScenario FDC (blue) crosses under theRiver Flow Objective FDC (green)
Figure 1 River AP resource assessment process (a), and example of long term flow duration curve analysis
Assessment method summaries: Resource Assessment and Management (RAM) framework 4.6
Environment Agency in partnership with Natural England and Countryside Council for Wales Understanding water for wildlife
< Section divider
This do
cumen
t was
with
drawn o
n 6 N
ovem
ber 2
017.

Assessment method summaries: Resource Assessment and Management (RAM) framework 4.6
Environment Agency in partnership with Natural England and Countryside Council for Wales Understanding water for wildlife
80
70
60
50
40
30
20
10
5.0
0.0
0.0 0
200
400
600
800
1000
0.7
1.4
2.1
2.8
3.5
4.2
4.9
5.6
6.3
7.0
7.7
8.4
9.1
9.8
10.5
11.2
11.9
12.0
13.3
-5.0
-10
.0
-15
.0
0.0
-1.0
-2.0
-3.0
-4.0
-5.0 0 -2 -4 -6 -8
6 4
1.0
0.8
0.6
0.4
0.2
0.0
40
.00
30
.00
20
.00
10
.00
0.0
02 00
Tota
l u
nco
ns
tain
ed
GW
AB
S (
bo
th d
isti
bu
ted
an
d n
on
-dis
trib
ute
d)
imp
act
CO
NS
UM
ED
Un
con
SW
ab
s+
As
so
cDis
AB
ST
RA
CT
ED
Un
con
SW
ab
s+
As
so
cDis
CO
NS
UM
PT
IVE
Un
As
so
cDis
cha
rge
s M
I/d
ay
for
lice
ns
ed
sce
na
rio
Tota
l p
ote
nti
al
con
sta
ine
d i
mp
act
s f
or
ea
ch n
od
e A
BS
TR
AC
TE
D
Tota
l p
ote
nti
al
con
sta
ine
d i
mp
act
s f
or
ea
ch n
od
e C
ON
SU
ME
D
Co
ns
tain
ed
lic
en
ces
–
con
su
me
d i
mp
act
HO
F li
mit
ed
Un
con
str
ain
ed
lic
en
ce –
con
su
me
d i
mp
act
flo
w l
imit
ed
CON5
CON2
River label 1
River label 2
River label 3
AP3
DIS 1
Small tributary net
Acc Lab 8
Acc Lab 8
Acc Lab 1
DIS 2
DIS 1
Spread impact (GW1)
CON3
SW2
SW3
SW1
CON1
Cu
mu
lati
ve
ne
t im
pa
cts
Sce
na
rio
flo
w (
blu
e l
ine
)N
at
riv
er
flo
w
LF
20
00
QN
90
AP
Eco
RFO
flo
ws
QE
90
An
y k
no
wn
lo
cal
HO
FS
Un
con
str
ain
ed
– c
on
su
me
d i
mp
act
is
gre
ate
r
tha
n r
ive
r fl
ow
(im
pa
ct l
imit
ed
)
Co
ns
tra
ine
d –
co
ns
um
ed
sce
na
rio
le
ss
th
an
HO
F
(im
pa
ct l
imit
ed
), o
r fl
ow
alr
ea
dy
be
low
HO
F
AP
na
tura
l fl
ow
s Q
N9
0
AP
sce
na
rio
flo
ws
QN
90
Un
con
sta
ine
d –
ab
str
act
ed
im
pa
ct g
rea
ter
tha
n r
ive
r fl
ow
Co
ns
tain
ed
– a
bs
tra
cte
d s
cen
ari
o l
es
s
tha
n H
OF
(co
ns
um
ed
no
t)
Na
t fl
ow
acc
reti
on
fo
r Q
N9
0
Co
mp
lex
imp
act
s a
t Q
N9
0 i
ncl
ud
ing
an
y
trib
uta
ry i
mp
act
s f
or
lice
ns
ed
sce
na
rio
Figu
re 2
Acc
reti
on p
rofil
e fo
r the
lice
nsin
g w
orki
ng e
xam
ple
ofth
e CA
MS
LEdg
er –
plo
ttin
g flo
ws
and
impa
ctat
Q90
< Section divider
This do
cumen
t was
with
drawn o
n 6 N
ovem
ber 2
017.

Assessment method summaries: Risk Assessment protocol 4.6
Environment Agency in partnership with Natural England and Countryside Council for Wales Understanding water for wildlife
SummaryType of regime where appliedThe Risk Assessment protocol is intended to provide arisk assessment framework for any form ofEnvironmental Impact. As such it is applicable to allregimes relevant to RoC.
Applicability to sitesThe protocol provides a framework allowinghydrological impact (at the receptor) to be translatedinto hydro-ecological effect to the Interest Features.
Standard ApplicationsAll forms of Environmental Impact Assessment.
Resource requirementThe Risk Assessment protocol can not be undertaken inisolation.
Sites require; characterisation (hydrologically andecologically); evaluation of hydrological impact;determination (or knowledge) of the water resourcerequirements (and sensitivity) of the Interest Features;before the Risk Assessment can be undertaken.
IntroductionThe risk assessment procedure suggested for theReview of Consents (RoC)1, and in routine LicenceDetermination, is one which broadly follows theprotocol given in the ‘Guidelines for Environmental RiskAssessment and Management’ produced by the DETR(2000). It is considered difficult to formulate aprocedure that is highly definitive, particularly in theearly stages of the RoC process. The method should beprecautionary (particularly where major uncertainty isinvolved) and should initially aim to:
• Assist in the identification of sites at which there isclearly minimal risk and which can therefore beeliminated from the RoC process.
• And depending upon the stage in the RoC processeither:– as in the early stages of RoC identify the need for
further investigations/assessments at those sitesconsidered to be at significant risk; or,
– at latter stages of the RoC process identify theactivities which are considered to give rise tosignificant risk on the site necessitating someaction to be undertaken to mitigate (or furtherclarify) the situation.
As noted in the DETR guidelines, ‘risk’ is a combinationof the probability, or frequency, of occurrence of adefined hazard (through the source-pathway-receptormechanism) and the magnitude of the consequences ofthe occurrence. Following this principle, a ‘risk matrix’ isrequired which can be used to ascribe values ofpotential risk based upon the perceived
1 Required under Regulation 50 of the Conservation(Natural Habitats &c.) Regulations 1994
This (or a similar) approach is required for eachcategory of consents to be reviewed. However, inaddition the review procedure should also:
• Be iterative and take on increased refinementthrough the staged RoC process.
• Consider impacts from consents both singly and in-combination (remembering that the combined effectfrom a ‘cocktail’ of impacts maybe significantwhereas the individual impact/effect evaluated forspecific activities/functions may not be consideredsignificant) with the in-combination assessmentcovering both:– a group of single type consents (i.e. abstraction
licences);– a mixture of consent types (i.e. a multi-functional
assessment).• Consider related management strategies such as:
– CAMS for abstraction licences;– Catchment Flood Management Plans for flood
defence;– Target River Quality Objectives which govern/
influence discharge (water quality related)consents;
– Shoreline Management Plans which influencecoastal sea defence and environmental regimes;
– Future assessments which will be required (andare being planned) for the Water FrameworkDirective.
The Risk Assessment methodology is highlighted asfollows in a Stage 2 Case Example undertaken for theNene Washes below.
The possible effects on the water supply to the sitewere initially ranked according to the nature andmagnitude of the hydrological impact as summarisedopposite.
Risk Assessment protocol4.6 Assessment method summaries
< Section divider
This do
cumen
t was
with
drawn o
n 6 N
ovem
ber 2
017.

Assessment method summaries: Risk Assessment protocol 4.6
Environment Agency in partnership with Natural England and Countryside Council for Wales Understanding water for wildlife
These rankings were converted into assessments ofpotential ‘hydro-ecological’ effect, based onconsiderations of the freshwater dependence of the keyEuropean interests and their vulnerability to thehydrological impacts. It is these potential effects whichare combined with likelihood of occurrence within therisk matrix to define overall risk.
The Magnitude of the Potential Effect is ranked asfollows (see Table 1):
High, Medium, Low, Very Low, Negligible.
The likelihood of occurrence of risk is ranked as follows:
Certain, High, Medium, Low, Very Low, Negligible, NotKnown.
The ratings of Risk that are used in the resultingassessment were as follows:
• High, Medium, Low (classed as significant)• Very Low, Negligible (classed as not significant)• If the risk is not known (then the likely default is that
it should be classed as significant).
Ranking Description of potential hydrological impacts
HIGH L1 Major reduction (i.e. well above HST) in wetland groundwater levels due toone or more individual licensed abstractions.
C1 Major reduction in wetland groundwater levels as a result of combinedabstraction from multiple licensed abstractions
F1 Major interception of surface water and/or groundwater flow to the wetland
Q1 Major reduction in the quality of water supply to the wetland
MEDIUM L2 Moderate reduction (i.e. around HST) in wetland groundwater levels due toone or more individual licensed abstractions
C2 Reduction in groundwater levels due to combined effects of multiplelicensed abstractions
F2 Reduction in surface water and/or groundwater flow to the wetland
Q2 Licensed abstraction will lead to a reduction in the quality of the watersupply to the wetland
LOW L3 Very Low reduction (i.e. well below HST) in wetland groundwater levels. Theresponse to pumping by individual abstractions is unlikely to be observed,but a general reduction in groundwater levels may occur due to cumulativeeffects of pumping from multiple licences.
C3 Very low reduction in groundwater levels due to combined effects of multiplelicensed abstractions
F3 Minor interception of surface water and/or groundwater flow to the wetland
Q3 Minor change in the quality of the water supply to the wetland.
Ranking description of potential hydrological impacts
< Section divider
This do
cumen
t was
with
drawn o
n 6 N
ovem
ber 2
017.

The Level of Confidence in the assessment also need tobe ranked as follows:
High The assessment has been based on alarge quantity of good qualitydata.
Medium The assessment is based on a limitedamount of data, but these are of goodquality and are directly relevant to thesite.
Low Only a limited amount of poor qualitydata are available. Conditions on sitehave been inferred using data fromother sites in the locality.
Very Low No relevant data are available.
Potential risk resulting from licensed abstractionsThe potential risk to the Nene Washes as a result ofEnvironment Agency Water Resources licensedabstractions is shown in Table 2.
The Potential Hydro-ecological Effect on the Europeanfeatures is based upon the potential hydrologicalimpacts described in the previous section. In addition itincorporates expert judgement of:
• the freshwater dependence of the site’s keyecological interests (European features);
• the significance of specific hydrological components(surface and/or groundwater) to the site;
• the vulnerability of the ecological interests tohydrological change/impact.
When undertaking this assessment, particular attentionis given to situations where the original hydrologicalimpact ranking is ‘Low’, to see if this should betranslated to a ‘Very Low’ or Guidance for Assessment:‘Hydrological Requirements of Habitats & Species’ Page5 of 6 ‘Negligible’ hydroecological effect on the Riskmatrix, as this can be a key factor in deciding whetheror not a site progresses to the next stage of the RoCprocess.
Assessment method summaries: Risk Assessment protocol 4.6
Environment Agency in partnership with Natural England and Countryside Council for Wales Understanding water for wildlife
Magnitude ofpotential effect
HIGH Low Medium High High High
MEDIUM Low Low Medium High High
LOW Very low Low Low Medium High
VERY LOW Negligible Very low Low Low Low
NEGLIGIBLE Negligible Negligible Negligible Negligible Negligible
Likelihood of VERY LOW LOW MEDIUM HIGH CERTAINoccurence
Table 1 Risk matrix
< Section divider
This do
cumen
t was
with
drawn o
n 6 N
ovem
ber 2
017.

Assessment method summaries: Risk Assessment protocol 4.6
Environment Agency in partnership with Natural England and Countryside Council for Wales Understanding water for wildlife
It must be noted that the risk assessment presented inTable 2 relates only to the conditions prevailing whenthe relevant assessment was prepared. The potentialrisk that may result from any future abstractions (orvariations) must be assessed independently as andwhen such changes arise.
The likelihood of occurrence takes into account anymitigating factors that may operate to reduce thepotential impact on the site. The Level of Confidencethat has been attributed defines the degree to whichthese factors are known.
The broad methodology suggested for assessment ofa riverine domain is set out schematically in Figure 1.This identifies the undertaking of assessments for both:
• groups of abstraction licences; and,• multi-functional consents.
The process also highlights the possibility ofincorporating an auditing process, regarding theadequacy of assessment both for ongoing and futureneeds, within the RoC process.
Table 2 Potential risk due to Environment Agency licensed abstractions and strategic water resources management (extract from
Stage 2 assessment for the Nene Washes)
Hazard Nature and Potential impact Likelihood of Consequent risk to Level of confidencemagnitude of on the overall occurrence European featurespotential effects water supply (preliminary assessment only)
on the water supply to siteto the site
Mortons Leam and the Washes
Licensed surface F2 (S) Medium (S) Low1(S) Low1(S) High(S)water abstractions F2(W) Medium(W) Medium(W) (S) Medium(W)
Non Licensed F1(S) High(S) Low1(S) Medium1(S) High(S)surface water abstractions
Strategic catchment F2(S) (S 6.1) Medium (S) Low2(S) Low2(S) High(S)management
Licensed surface L2, F3 (S6.3.1) Medium Low Low Mediumwater abstractions
1 Controlled by the Lower Nene Summer Operating Policy2 The strategic Wansford mcf limits effects and overall abstraction/discharge effects contribute positively to the low-flow regime of the Nene at Orton.
(S) Summer Effect controlled by Operating Policy(W) Winter Effect possibly attributed to AWS Wansford abstraction.
< Section divider
This do
cumen
t was
with
drawn o
n 6 N
ovem
ber 2
017.
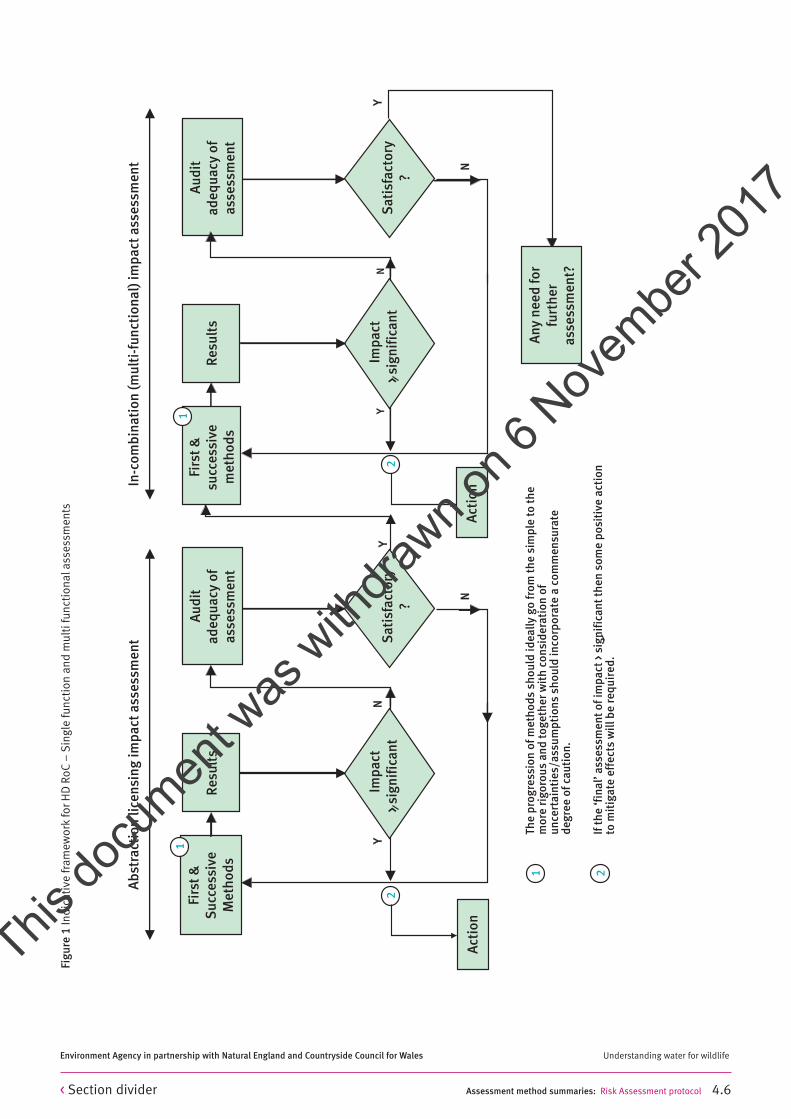
1
YIm
pa
ctY
N
Re
su
lts
Sa
tis
fact
ory
?
Sa
tis
fact
ory
?
Au
dit
ad
eq
ua
cy o
f
as
se
ss
me
nt
Firs
t &
Su
cce
ss
ive
Me
tho
ds
NY
N
Re
su
lts
Firs
t &
su
cce
ss
ive
me
tho
ds
N
An
y n
ee
d f
or
furt
he
r
as
se
ss
me
nt?
Th
e p
rog
res
sio
n o
f m
eth
od
s s
ho
uld
id
ea
lly
go
fro
m t
he
sim
ple
to
th
e
mo
re r
igo
rou
s a
nd
to
ge
the
r w
ith
co
ns
ide
rati
on
of
un
cert
ain
tie
s/a
ss
um
pti
on
s s
ho
uld
in
corp
ora
te a
co
mm
en
su
rate
d
eg
ree
of
cau
tio
n.
11
2
Ab
str
act
ion
lic
en
sin
g i
mp
act
as
se
ss
me
nt
In-c
om
bin
ati
on
(m
ult
i-fu
nct
ion
al)
im
pa
ct a
ss
es
sm
en
t
> s
ign
ific
an
t
Imp
act
> s
ign
ific
an
tN
Y2
Act
ion
Act
ion
2If
th
e ‘
fin
al’
as
se
ss
me
nt
of
imp
act
> s
ign
ific
an
t th
en
so
me
po
sit
ive
act
ion
to
mit
iga
te e
ffe
cts
wil
l b
e r
eq
uir
ed
.
Au
dit
ad
eq
ua
cy o
f
as
se
ss
me
nt
Sa
tis
fact
ory
?
Figu
re 1
Indi
cati
ve fr
amew
ork
for H
D R
oC–
Sin
gle
func
tion
and
mul
ti fu
ncti
onal
asse
ssm
ents
Assessment method summaries: Risk Assessment protocol 4.6
Environment Agency in partnership with Natural England and Countryside Council for Wales Understanding water for wildlife
< Section divider
This do
cumen
t was
with
drawn o
n 6 N
ovem
ber 2
017.

5.1 Introduction
5.2 Case studies
– The River Itchen
– Rutland Water
– East Walton Common
– Great Cressingham Fen
– Portholme Meadow
– The Nene Washes
– The Stour Estuary
– Gibraltar Point
– The North Norfolk Coast
– The Wash
Case studies5
< Main contents
This do
cumen
t was
with
drawn o
n 6 N
ovem
ber 2
017.

5.1 IntroductionThe list of case example assessments and thehydrological domains to which they belong is outlined in Table 5.1. (It is intended that these will be added toand revised on a regular basis as more informationbecomes available).
The range of assessment methods undertaken instudies to date to inform impact assessments(including; interpretation and site characterisationaids; water quality assessments; and, hydrologicalimpact assessments;) for these selected case examplesis summarised in Table 5.2.
Case studies 5.1
Environment Agency in partnership with Natural England and Countryside Council for Wales Understanding water for wildlife
Hydrological sub-domain case example
Riverine River Itchen
Lake/Reservoir Rutland Water
Lowland Valley Fen East Walton Common
Lowland Valley Fen Great Cressingham Fen
Natural Flood Plain Portholme Meadow
Controlled Washland The Nene Washes
Estuarine The Stour Estuary
Extreme Tidal - Humid Dune Slacks Gibraltar Point
Marine Transition & Inter-tidal The North Norfolk Coast
Tidal Embayment The Wash
Table 5.1 Selected case examples
5. Case studies
< Section divider
This do
cumen
t was
with
drawn o
n 6 N
ovem
ber 2
017.
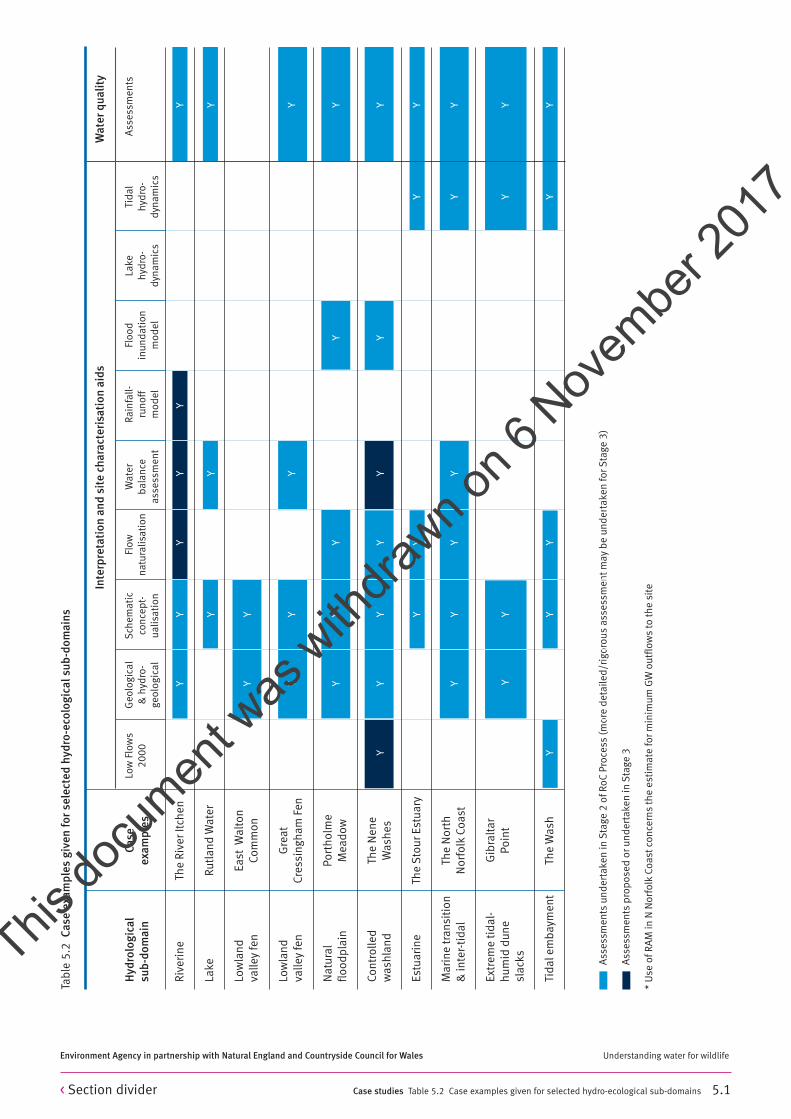
Case studies Table 5.2 Case examples given for selected hydro-ecological sub-domains 5.1
Environment Agency in partnership with Natural England and Countryside Council for Wales Understanding water for wildlife
Ass
essm
ents
unde
rtak
en in
Sta
ge 2
ofR
oCPr
oces
s(m
ore
deta
iled/
rigo
rous
asse
ssm
entm
aybe
und
erta
ken
for S
tage
3)
Ass
essm
ents
prop
osed
or u
nder
take
n in
Sta
ge 3
* U
se o
fRA
M in
N N
orfo
lkCo
astc
once
rns
the
esti
mat
e fo
r min
imum
GW
outf
low
sto
the
siteIn
terp
reta
tion
and
sit
e ch
arac
teri
sati
on a
ids
Wat
er q
ualit
y
Low
Flo
ws
Geo
logi
cal
Sch
emat
icFl
owW
ater
Rain
fall-
Floo
dLa
keTi
dal
Ass
essm
ents
2000
& h
ydro
-
conc
ept-
natu
ralis
atio
nba
lanc
eru
noff
inun
dati
onhy
dro-
hydr
o-ge
olog
ical
ualis
atio
nas
sess
men
tm
odel
mod
eldy
nam
ics
dyna
mic
s
Tabl
e 5.
2Ca
se e
xam
ples
give
n fo
r se
lect
ed h
ydro
-eco
logi
cals
ub-d
omai
ns
Hyd
rolo
gica
lCa
sesu
b-do
mai
nex
ampl
es
Rive
rine
The
Rive
r Itc
hen
YY
YY
YY
Lake
Rutla
nd W
ater
YY
Y
Low
land
Ea
stW
alto
nY
Yva
lley
fen
Com
mon
Low
land
G
reat
YY
YY
valle
yfe
nCr
essi
ngha
m F
en
Nat
ural
Port
holm
eY
YY
YY
flood
plai
nM
eado
w
Cont
rolle
dTh
e N
ene
YY
YY
YY
Yw
ashl
and
Was
hes
Estu
arin
eTh
e S
tour
Est
uary
YY
YY
Mar
ine
tran
siti
on
The
Nor
th
YY
YY
YY
& in
ter-
tida
lN
orfo
lkCo
ast
Extr
eme
tida
l-G
ibra
ltar
YY
YY
hum
id d
une
Poin
tsl
acks
Tida
lem
baym
ent
The
Was
hY
YY
YY
< Section divider
This do
cumen
t was
with
drawn o
n 6 N
ovem
ber 2
017.

Case studies Table 5.2 Case examples given for selected hydro-ecological sub-domains 5.1
Environment Agency in partnership with Natural England and Countryside Council for Wales Understanding water for wildlife
Impa
ctas
sess
men
tmet
hods
Tabl
e 5.
2Ca
se e
xam
ples
give
n fo
r se
lect
ed h
ydro
-eco
logi
cals
ub-d
omai
nsco
ntin
ued
Hyd
rolo
gica
lCa
sesu
b-do
mai
nex
ampl
es
Ass
essm
ents
unde
rtak
en in
Sta
ge 2
ofR
oCPr
oces
s(m
ore
deta
iled/
rigo
rous
asse
ssm
entm
aybe
und
erta
ken
for S
tage
3)
Ass
essm
ents
prop
osed
or u
nder
take
n in
Sta
ge 3
* U
se o
fRA
M in
N N
orfo
lkCo
astc
once
rns
the
esti
mat
e fo
r min
imum
GW
outf
low
sto
the
site
GW
abst
ract
ion
LAD
(Li
cenc
eIG
ARF
(Im
pact
RAM
(Re
sour
ceD
istr
ibut
edPH
abS
imH
ydro
- Ri
skA
sses
smen
tdr
awdo
wn
Acc
umul
atio
nof
GW
Abs
onA
sses
smen
tG
WM
odel
dyna
mic
prot
ocol
met
hods
Dia
gram
)Ri
ver F
low
)M
anag
emen
t)Es
tuar
ine
mod
el
Rive
rine
The
Rive
r Itc
hen
YY
YY
YY
Lake
Rutla
nd W
ater
Y
Low
land
Ea
stW
alto
nY
Yva
lley
fen
Com
mon
Low
land
G
reat
YY
YY
Yva
lley
fen
Cres
sing
ham
Fen
Nat
ural
Port
holm
eY
YY
YY
Yflo
odpl
ain
Mea
dow
Cont
rolle
dTh
e N
ene
YY
YY
YY
Yw
ashl
and
Was
hes
Estu
arin
eTh
e S
tour
Est
uary
YY
Y
Mar
ine
tran
siti
on
The
Nor
th
YY
Y*Y
Y&
inte
r-ti
dal
Nor
folk
Coas
t
Extr
eme
tida
l-G
ibra
lter
YY
Yhu
mid
dun
e Po
int
slac
ks
Tida
lem
baym
ent
The
Was
hY
YY
Y
< Section divider
This do
cumen
t was
with
drawn o
n 6 N
ovem
ber 2
017.

Case studies Case study examples: The River Itchen 5.2
Environment Agency in partnership with Natural England and Countryside Council for Wales Understanding water for wildlife
EcologySite typeRiverine SAC (and fringing Wetland)
Area of SSSI309.26 ha
SAC featuresRiver Itchen cSAC
• Otter• Salmon• Bullhead• Brook Lamprey• Crayfish• Rananculus (Water Crowfoot)• Southern Damselfly
Fringing Wetlands
• Desmoulin’s Whorlsnail• Fen Habitats• Wet Grasslands• Bog Woodlands
SPA features• None
Water resourcesSee Schematic Figure overleaf.
Geology/hydrogeologyThe essential geology of the Itchen catchment is Chalkwith Tertiary deposits in the lower (southern) section ofthe catchment. Flow in the Itchen is ground waterdominated with runoff only having any significance inareas covered by Tertiary deposits and also throughdrainage modifications in urban areas such asWinchester and Alresford.
Source(s) of water supplyThe river is essentially spring fed from the Chalk aquiferand the wetland areas depend upon aquifer-river-floodplain interaction and artificial water management too.
Level of confidence in the conceptualunderstanding siteThe general conceptualisation for the site is consideredto be very good.
The River ItchenUndertaken/planned investigations
5.2 Case study
Relationship between ecology and waterresourcesRelationship between european features and watersupplyRiverine SAC: There are reasonably clear hydrologicalrequirements set out for many of the Interest Features.It should be noted that these requirements equallycomprise quality and geomorphological regimes as wellas those related to quantity (discharge, velocity andlevel). Additionally, the multifunctional (sustainable)dimension is very important to the Itchen with effluentdischarges, land use, land drainage and rivermanagement having comparable significance to thefavourable condition of the riverine domain asabstractions. The habitat is dependant upon the riverflow regime which is ground water dominated.
Fringing Wetland: The hydrological regime of thefringing wetland is more directly dependant upon theground water table regime and local watermanagement, rather than the direct quantity regime ofthe River Itchen and tributaries.
What are the potential effects on the siteand how are they evaluated A standard RAM assessment for the River Itchen showsthat actual gauged flows, measured at Highbridge andAllbrook, fall significantly below the 'target' river flowobjectives evaluated using the EnvironmentalWeighting method. If abstractions and discharges wereto develop to full consented limits this 'deficiency'would be even more marked as revealed on the RAMoutput extract. The predominant abstractiondevelopment in the catchment is made from the Chalkaquifer particularly for PWS and the RAM results revealsignificant flow depletions, compared to thenaturalised regime, for the river. Comparable resultsderived from Distributed Ground water Modelling forthe Itchen (developed using MODFLOW) reveal, whencompared to the modelled naturalised flow regime,33% and 43% reductions in flow at the Q95 forscenarios which represent the present actual andpotential (fully licensed) abstraction regimesrespectively. All the RAM and Ground water Modelresults described above make due allowance forresidual effluent returns to the river.
< Section divider
This do
cumen
t was
with
drawn o
n 6 N
ovem
ber 2
017.

Case studies Case study examples: The River Itchen 5.2
Environment Agency in partnership with Natural England and Countryside Council for Wales Understanding water for wildlife
Hydrological impacts to the flow regime of the Itchenhave not been translated into an assessment ofecological effects within this case study but a series ofinvestigations and assessments were commissioned forthe appropriate assessment. These assessments arenot merely restricted to requirements under the HD RoCbut are also driven by the AMP-NEP (and are thereforeconsidering non European designated Interest Featurestoo) as well as aiming to satisfy the holistic/sustainableapproach underpinning the Water Framework Directiverequiring a multi-functional approach for impactassessment and future improved management of thissite.
Hazard Nature and Potential impact Likelihood of Consequent risk to Level of confidence(River Itchen magnitude of on the overall occurrence European featuresand fringing potential effects water supply (preliminary assessment only)
wetlands) on the water supply
River Itchen cSAC Flow Low1 Medium Low MediumSW Abstractions
River Itchen cSAC Flow High Medium High HighGW Abstractions
Fringing Wetland Flow Very low1 Low Very low LowSW Abstractions
Fringing Wetland Flow Medium Low Low MediumGW Abstractions
1 The most significant surface water abstractions are non consumptive made for fish farms.
Potential risk (Indicative only) due to Environment Agency licensed abstractions
< Section divider
This do
cumen
t was
with
drawn o
n 6 N
ovem
ber 2
017.
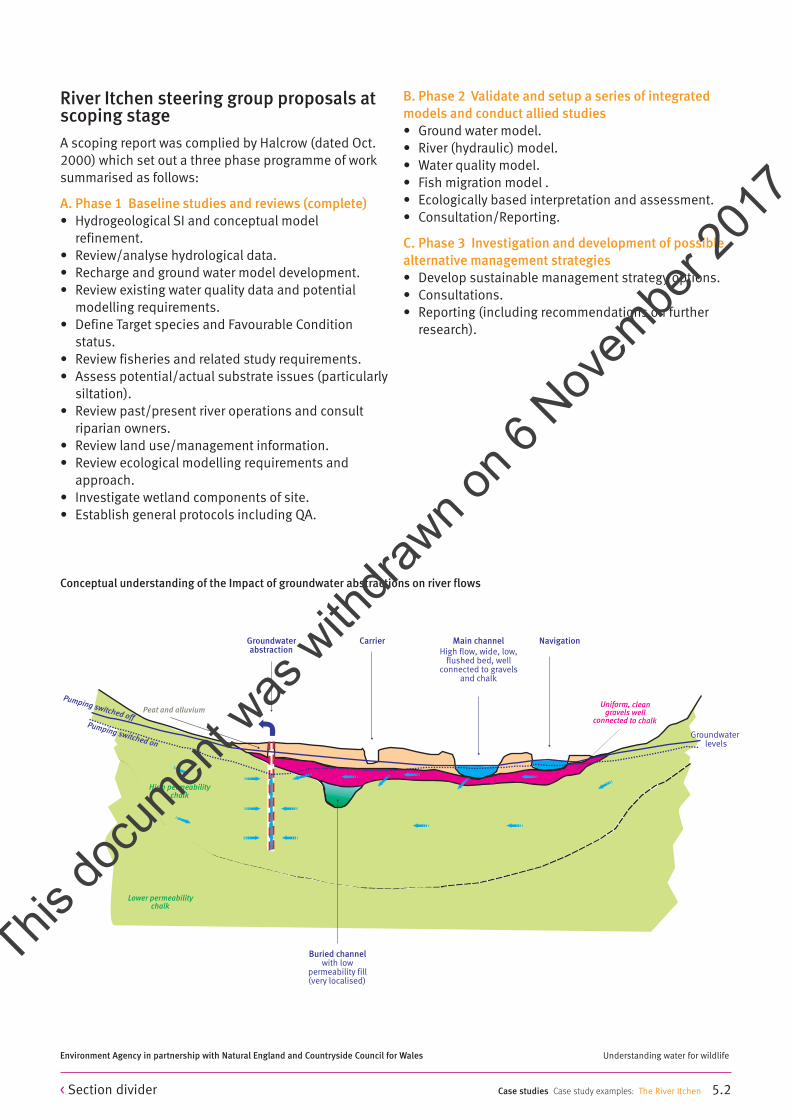
Case studies Case study examples: The River Itchen 5.2
Environment Agency in partnership with Natural England and Countryside Council for Wales Understanding water for wildlife
River Itchen steering group proposals atscoping stageA scoping report was complied by Halcrow (dated Oct.2000) which set out a three phase programme of worksummarised as follows:
A. Phase 1 Baseline studies and reviews (complete)• Hydrogeological SI and conceptual model
refinement.• Review/analyse hydrological data.• Recharge and ground water model development.• Review existing water quality data and potential
modelling requirements.• Define Target species and Favourable Condition
status.• Review fisheries and related study requirements.• Assess potential/actual substrate issues (particularly
siltation).• Review past/present river operations and consult
riparian owners.• Review land use/management information.• Review ecological modelling requirements and
approach.• Investigate wetland components of site.• Establish general protocols including QA.
Conceptual understanding of the Impact of groundwater abstractions on river flows
B. Phase 2 Validate and setup a series of integratedmodels and conduct allied studies• Ground water model.• River (hydraulic) model. • Water quality model.• Fish migration model .• Ecologically based interpretation and assessment.• Consultation/Reporting.
C. Phase 3 Investigation and development of possiblealternative management strategies• Develop sustainable management strategy options.• Consultations. • Reporting (including recommendations on further
research).
Lower permeability chalk
High permeability chalk
Peat and alluviumUniform, clean
gravels well connected to chalk
Groundwater abstraction
Carrier Navigation Main channel
High flow, wide, low, flushed bed, well
connected to gravels and chalk
Buried channel with low
permeability fill (very localised)
Groundwater levels
Pumping switched offPumping switched on
< Section divider
This do
cumen
t was
with
drawn o
n 6 N
ovem
ber 2
017.

Case studies Case study examples: The River Itchen 5.2
Environment Agency in partnership with Natural England and Countryside Council for Wales Understanding water for wildlife
Figure 2. APS Itchen – Highbridge & Allbrook
-78.4
35%
+/- 0
Min. % of timeScenario flow > RFO
1200
1000
800
600
400
200
0
0 10
Percentage of time flow exceeded
Dai
ly fl
ow v
alue
s (M
I/da
y)
20 30 40 50 60 70 80 90 100
Natural flow
Benchmark flow, AP5Itchen – Highbridge &AllbrookEcologucal RFO,EW Band M
Denat for complex &unconstained impactsonly
Abs & dis. scenario flow,licensed scenario
Gauge data
35
Q9 surplus or deficit, Ml/d
Or def. uncertainty, MI/d
Figure 1. Assessment points, catchments and surface and groundwater abstractions
< Section divider
This do
cumen
t was
with
drawn o
n 6 N
ovem
ber 2
017.

Case studies Case study examples: Rutland Water 5.2
Environment Agency in partnership with Natural England and Countryside Council for Wales Understanding water for wildlife
Site descriptionRutland Water is a man-made pump storage reservoirthat was created in 1975 when the Gwash Valley wasdammed. Rutland water was designated as a SSSI in1981, principally as a result of supporting exceptionalnumbers and diversity of passage and winteringwaterfowl. Habitats within the SSSI include open water,islands, mudflats, lagoons, reedswamp, pastures,meadows, scrub and mature woodland.
EcologyArea of SSSI1,540 ha
SPA featuresRegularly occurring migratory bird species ofinternational importance:
• wintering gadwall• wintering shoveler
Assemblage qualification: A wetland of Internationalimportance:
• by regularly supporting greater than 20,000waterfowl during winter
Existing ecological monitoringNo formal regular monitoring of habitats, but occasionalmonitoring of macrophytes. Regular monitoring ofmacro-invertebrates.
Bird counts are carried out annually as part of theWetland Bird Survey (WeBS) Core Counts.
Water resourcesGeologyMost of Rutland Water is underlain by the WhitbyMudstone. The Lincolnshire Limestone and and theNorthampton Sand also occur.
Existing surface water and ground water monitoringWater levels (absolute and percentage fill) andabstraction volumes are recorded by AWS
Source(s) of water supplyThe inputs to Rutland Water are: flow from the upstreamcatchment; abstraction from the River Welland at Tinwell;abstraction from the River Nene at Wansford, and directrainfall. By far the largest input comes from abstraction.
Rutland WaterStage 2 Assessments (and Stage 3 Proposals)
5.2 Case study
Level of confidence in the conceptual understanding ofthe siteHigh. Hydrologically the inputs, outputs and processesat Rutland water are relatively simple.
Relationship between ecology and waterresourcesRelationship between european features and watersupplyRelationship Between European Features and WaterSupply SPA: The SPA qualifying bird species require thefollowing habitats: open water with shallow margins;stable littoral invertebrate and macrophyte communities;and open grassland and wetland habitats around theshoreline. The location and extent of these habitats isdictated mainly by the current water management regimewithin the reservoir, which comprises pump storage andabstraction (supply) operations.
Historical bird count data for the reservoir shows thatthe population grew rapidly following commissioning ofthe reservoir, and has remained relatively stable eversince (within year-to-year fluctuations). There is noevidence that the current management regime is havinga detrimental effect on the bird assemblage or any ofthe individual species present.
The current management regime results in the seasonaldraw-down of reservoir water levels. The effect of this isto create an impoverished flora and fauna within thelittoral zone (based on the high water mark). Highnutrient levels in the reservoir are thought to compoundthese effects by affecting macrophyte and algal diversityand abundance. However, the significance of theseeffects on the bird assemblage is not fully understood.
Do any european features have a specific requirementfor ground waterNo.
Are any of the features supported by ground waterinputsNo. Rutland Water is a pump storage reservoir.
< Section divider
This do
cumen
t was
with
drawn o
n 6 N
ovem
ber 2
017.

What are the potential effects on the site The potential risk to Rutland Water as a result of theAWS abstractions at Wansford, Tinwell and RutlandWater is shown in Table 1. The potential impact ofsurface water abstraction on Rutland Water and thelikelihood of this impact occurring, have been rankedas High on the basis that the existing abstractionregime allows regular and sustained draw-down tooccur within the reservoir. Both draw-down and refillingmay lead to relatively rapid changes in water level thatexceed the rate of invertebrate movement and/ormacrophyte growth. Linked to this some deteriorationin water quality is likely, particularly as the reservoir iseutrophic and regularly suffers algal blooms.
The level of risk is considered to be Medium as,although there is no evidence to suggest that thecurrent operating regime is impacting upon the birdspresent, this is probably the consequence ofinadequate monitoring. Bird count data suggest thatpopulations of individual species are generally stable,
following an initial rapid increase after the completionof the reservoir. Although the bird population appearsto be relatively stable, it is unclear how this reflects thegeneral health of the habitat supporting those birds.The ecological interactions occurring at Rutland Waterare complicated by the fact that water levels, and hencethe littoral zone, fluctuate throughout the year. This,together with a high nutrient burden which affectsmacrophyte and algal abundance and distribution,results in a system that is constantly changing.
The level of Confidence is considered to beLow/Medium as very little data are available on theeffect of draw-down on the prey species being exploitedby the birds. Consequently it is possible that the currentregime may be impacting on the food resource used bythe birds, resulting in a gradual decline in preyavailability. This may manifest itself as a gradualdecline in the bird population that is currently maskedby the natural variability of the populations present.
Case studies Case study examples: Rutland Water 5.2
Environment Agency in partnership with Natural England and Countryside Council for Wales Understanding water for wildlife
Hazard Nature and Potential impact Likelihood of Consequent risk Level of confidencemagnitude of on the overall occurrence to european featurespotential water supply (preliminary assessment only)
AWS F1. The abstractions High. The way the Medium Medium/High. Habitat/prey Low/Medium abstractions provide the majority of abstractions are supporting interest features
water to the site and managed largely are impacted by operationalcontrol how it is released dictates how water regime, however, significance
levels and chemistry of this is not fully understood.in the reservoir change.
Table 1 Potential risk to Rutland Water due to AWS abstractions
Stage 3 Proposed/ongoing workAt the present time Anglian Water Services are unableto abstract their full licensed amount as there isinsufficient capacity at Wing Water Treatment Works.AWS are proposing to increase the capacity of this WTW,and this has led to the commissioning of a series ofEnvironmental Impact Assessment for the proposedscheme. Although some results have been published,further work is in progress and areas of additionalresearch have been identified.
Although there is no evidence that the current operatingregime is having a negative effect on the birdassemblage, limited data are available on the conditionof the habitat supporting those birds. Further researchis recommended as follows:
• An investigation of how macro-invertebrates andmacrophytes respond to changes in the water level,with consideration given to the duration and speedof draw-down events and the speed of refilling.
• An investigation of bird behaviour focussing on theidentification of feeding areas and food sources. Thisshould include an assessment of new feeding sitesas water levels within the reservoir changethroughout the year.
This research will allow the impact of draw-down oninvertebrate and plant populations to be assessed,together with the recovery of these populationsfollowing refilling of the reservoir.
< Section divider
This do
cumen
t was
with
drawn o
n 6 N
ovem
ber 2
017.

Case studies Case study examples: Rutland Water 5.2
Environment Agency in partnership with Natural England and Countryside Council for Wales Understanding water for wildlife
Figure 1 Rutland Water SPA
< Section divider
This do
cumen
t was
with
drawn o
n 6 N
ovem
ber 2
017.

Figure 2 Simplifed conceptual schematic of Rutland water system
Case studies Case study examples: Rutland Water 5.2
Environment Agency in partnership with Natural England and Countryside Council for Wales Understanding water for wildlife
< Section divider
This do
cumen
t was
with
drawn o
n 6 N
ovem
ber 2
017.

Case studies Case study examples: East Walton Common 5.2
Environment Agency in partnership with Natural England and Countryside Council for Wales Understanding water for wildlife
Site descriptionCombination of 2 distinct but nearby sites (East Waltonand Adcock's Common) with similar physical andecological characteristics.
EcologyArea of SSSI62.9 ha (49.7 ha for East Walton and 13.2 ha forAdcock's Comon)
SAC featuresAlkaline fens (M9, M13);
Habitats for the population of Desmoulin's whorl snail(Vertigo moulinsiana);
Alluvial forests with Alnus glutinosa and Fraxinusexcelsior (W6);
Calcareous fens with Cladium mariscus and species ofthe Caricion davallianae (S2 and S25);
Molinia meadows on calcareous, peaty or clayey-silt-laden-soils (M24); and
Semi-natural dry-grasslands and scrubland facies: oncalcareous substrates (CG2).
SPA features• N/A
Existing ecological monitoringWetland plant communities surveyed as part of ValleyFen Survey (1993). Locations of ground depressionswere mapped using GPS in 2000. Plant species listshave been produced in 2000 during compilation of aMillennium Report for the site, but communities werenot identified or mapped.
Invertebrate species lists have been compiled fromsurveys in 2000, undertaken for the Millennium Report,and previous data. The birds on site were surveyedinformally throughout 2000.
Water resourcesSee schematic figure overleaf.
GeologySuperficial sands/clays: variable(3 m thick)Lower Chalk absent to 30 m thickGault Clay ~10 m thickUpper Chalk
East Walton CommonStage 2 Ongoing (& Stage 3 Assessments)
5.2 Case study
Existing surface water and ground water monitoring2 Gaugeboards installed in depression ponds. Nomonitoring at Adcock's Common.
2 piezometers installed by HSI in 1996 near the easternperimeter of the East Walton site and completed intothe Chalk and superficial deposits.
Source(s) of water supplyThe site is supported by springs and emergences fromthe Chalk strata.
Regionally the superficial deposits and Chalk arehydraulically continuous. Locally the situation iscomplex and dictated by minor variations in lithologywhich causes variability of water levels across the site.
Level of confidence in the conceptual understanding of the siteModerate. A reasonable record is available for groundwater monitoring piezometers in the eastern part of theEast Walton site. No data are available for the Adcocks'Common site although the hydrogeology is comparable.
There is a case for more detailed measurements tounderstand local variations.
Relationship between ecology and water resourcesRelationship between european features and water supplyThe alkaline fen, calcareous fen and habitats thatsupport Desmoulins whorl snail all require high watertables maintained throughout the summer and arevulnerable if subjected to relatively small reductions.Alder woodland requires at least winter-wet conditionsbut can tolerate more variation. M24 requires amoderate water level and is less critically affected byvariations but is still vulnerable to drying in the longerterm. Semi-natural dry grasslands require rainfall anddo not need high water levels.
Do any european features have a specific requirementfor ground waterSAC: Yes. M13 is critically dependent upon the supplyof base-rich ground water.
< Section divider
This do
cumen
t was
with
drawn o
n 6 N
ovem
ber 2
017.

Are any of the features supported byground water inputs
Yes; The dominant supply to the alkaline fen,calcareous fen, alder woodland and habitats thatsupport Desmoulin's whorl snail is ground water.
What are the potential effects on the site Conceptual model of water supplyThe hydrological regime at East Walton is shownschematically in the Figure overleaf. Both the EastWalton and Adcocks components of the site can beconsidered as ground water fed by springs andseepages resulting from the lateral flow of Chalk groundwater from the east of the sites. Both sites are locatedon the edge of the Chalk which is underlain by the GaultClay aquiclude. Overlying sandy drift deposits,
generally, are in hydraulic continuity with the Chalkalthough the location of springs at East Walton appearsto correlate with the Chalk/drift boundary.
Impacts from surface water abstractionsThere are no surface abstractions that are considered topresent a risk to the site.
Impact from ground water abstractionsEstimated drawdowns have been made using AQUIFER-WIN32 and the Neuman method assuming 200 dayswithout recharge. The resulting values are within therange 0.5 and 1.0 m, with the greater drawdownsoccurring at Adcock's Common rather than at EastWalton Common. This level of potential impact isconsidered significant although uncertainties with theassumptions which underpin the assessment incomparison to the true hydrogeological regime for thesite must be borne in mind.
Case studies Case study examples: East Walton Common 5.2
Environment Agency in partnership with Natural England and Countryside Council for Wales Understanding water for wildlife
Hazard Nature and Potential hydro- Likelihood of Consequent risk Level of confidencemagnitude of ecological effect occurrence to interest featurespotential (preliminary assessment only)
hydrologicalimpacts
Surface water River flows N/A N/A N/A High abstractions
Ground water GW levels & flows) High Medium High Lowabstractions
Potential risk due to Environment Agency licensed abstractions and strategic water resources management
Stage 3 ProposalsAppropriate assessment is considered essential for thesite and Baseline investigations/assessmentsrecommended are outlined below:
Part 1. Review of permissionsImproved understanding of the ground water systemand impact assessment of ground water licences.
Part 2. Ecological, water quality and level surveys• Ecological survey to confirm the nature, extent and
composition of alder woodland, calcareous grasslandand habitats that support Desmoulin's whorl snail.(Should be undertaken by Natural England).
• Monitor near-surface water-levels, via dipwells, in themost sensitive communities (M9?, M13, S2 and S25).
• Vegetation monitoring of plots located adjacent tothe dipwells.
• Topographic survey.• Investigations to understand the localised lithologies
and structure of the geomorphological features thatcharacterise the site.
• Water quality sampling of the depression ponds toestablish the source of the water. This informationwould also feed into the condition monitoring for thesensitive fen features on site.
• Determine the datum of the existing gaugeboard(TF91/119).
< Section divider
This do
cumen
t was
with
drawn o
n 6 N
ovem
ber 2
017.
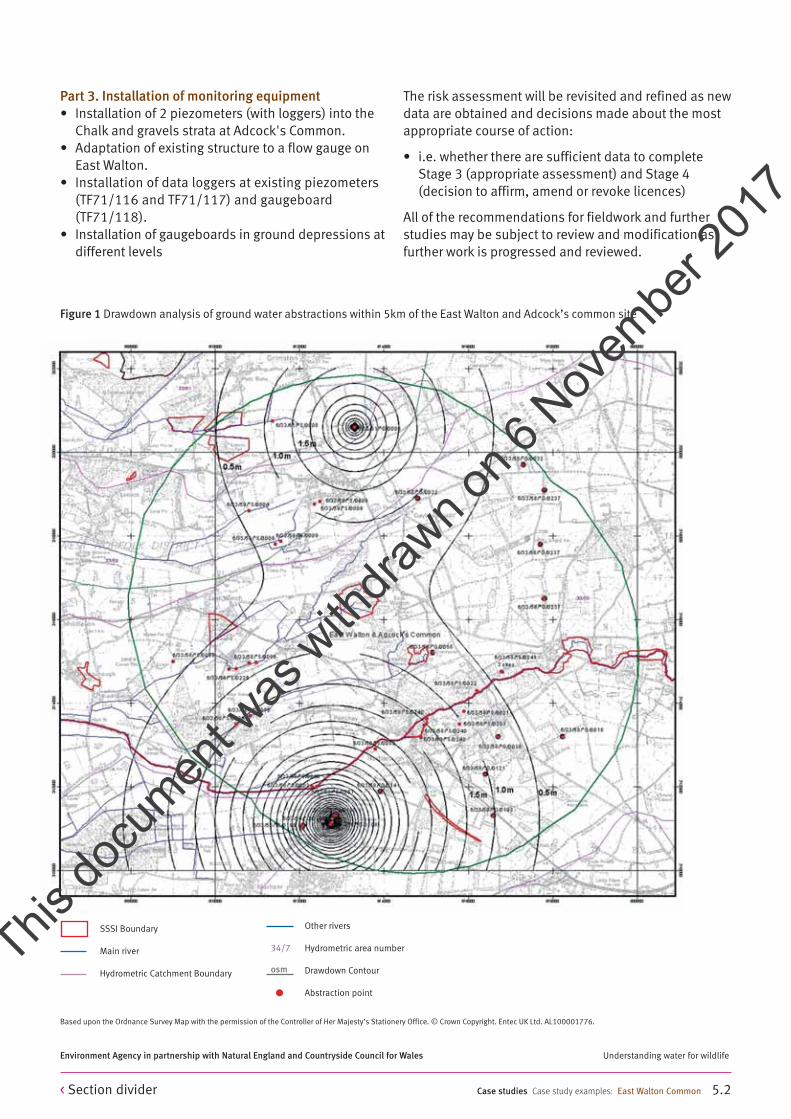
Part 3. Installation of monitoring equipment• Installation of 2 piezometers (with loggers) into the
Chalk and gravels strata at Adcock's Common. • Adaptation of existing structure to a flow gauge on
East Walton.• Installation of data loggers at existing piezometers
(TF71/116 and TF71/117) and gaugeboard(TF71/118).
• Installation of gaugeboards in ground depressions atdifferent levels
Case studies Case study examples: East Walton Common 5.2
Environment Agency in partnership with Natural England and Countryside Council for Wales Understanding water for wildlife
Figure 1 Drawdown analysis of ground water abstractions within 5km of the East Walton and Adcock’s common site
Based upon the Ordnance Survey Map with the permission of the Controller of Her Majesty’s Stationery Office. © Crown Copyright. Entec UK Ltd. AL100001776.
SSSI Boundary
Main river
Hydrometric Catchment Boundary
34/7
osm
Other rivers
Hydrometric area number
Drawdown Contour
Abstraction point
The risk assessment will be revisited and refined as newdata are obtained and decisions made about the mostappropriate course of action:
• i.e. whether there are sufficient data to completeStage 3 (appropriate assessment) and Stage 4(decision to affirm, amend or revoke licences)
All of the recommendations for fieldwork and furtherstudies may be subject to review and modification asfurther work is progressed and reviewed.
< Section divider
This do
cumen
t was
with
drawn o
n 6 N
ovem
ber 2
017.

Case studies Case study examples: East Walton Common 5.2
Environment Agency in partnership with Natural England and Countryside Council for Wales Understanding water for wildlife
Figure 2 Schematic of the key hydrological systems at East Walton
Chalk
Gault Clay
Lower Cretaceous Sand
Superficial Cover of Alluvium
Key:
Emergent Groundwater
Groundwater Table
Evapotranspiration
Ground Depressions
Overflow from Depressions
Zone of Recharge
Lateral groundwater
movement
Evapotranspira
tion
Drains
< Section divider
This do
cumen
t was
with
drawn o
n 6 N
ovem
ber 2
017.

Case studies Case study examples: Great Cressingham Fen 5.2
Environment Agency in partnership with Natural England and Countryside Council for Wales Understanding water for wildlife
EcologySite typeValley Fen
Area of SSSI13.7 ha
SAC featuresNorfolk Valley Fens cSAC:
• Alkaline Fens (M13);• Calcareous fens with Cladium mariscus and species
of the Caricion davallianae (S25c); and• Molinia meadows on calcareous, peaty or clayey-silt
laden soils (M24).
SPA featuresN/A
Water resourcesSee schematic figures overleaf
Geology/hydrogeologyPeat and Clay (central and eastern part of site)
Source(s) of water supplyThe site is ground water fed by springs/seepage fromthe Chalk aquifer via granular alluvial deposits. Surfaceinputs are from rainfall and limited rainfall generatedrunoff.
The eastern part of the site floods at times of high waterlevel although it is not known whether this is due toinundation from the River Wissey or backing up of waterdraining from the fen.
Level of confidence in the conceptualunderstanding siteMedium
Relationship between ecology and waterresourcesRelationship between european features and watersupplyM13 requires permanently high water levels. Other SACfeatures (represented by S25c and M24) prefer generallylower levels and are able to tolerate greater fluctuation.
Great Cressingham FenStage 2 Ongoing (planned Stage 3 Assessments)
5.2 Case study
Do any european features have a specific requirementfor ground waterYes – M13 critically dependent upon water from theChalk aquifer
Are any of the features supported by ground waterinputsYes – S25c and M24 both supported by ground waterlevels although not specifically dependent on it.
What are the potential effects on the site Ground waterGreat Cressingham Fen is fed by Chalk ground waterthat emerges into the north part of the fen as springsand seepages at the site margins or where ponds anddrains intersect the Chalk/Drift water table. There is apotential hydrological effect at the site due to theeffects on spring discharge of surrounding licensedground water abstractions associated with both publicwater supply and spray irrigation. In this instance,predicted drawdown has been assessed in Stage 3using the AQUIFER WIN32 program, the Hantushapplication, a Radial-MODFLOW 2D model as well fullydistributed 2 and 4 layer ground water MODFLOWmodels to represent the 'leaky/semi-confined'conditions. These assessments supersede Stage 2evaluations based on a Theis methodology assuminguniform flow through a homogeneous porous medium,and which does not allow for recharge, layering or otherlocal geological or hydrological variants.
Surface waterThere are no inflows to the fen directly via surfacewatercourses and rainfall generated runoff to the site islikely to be limited. However at times of high water levels,the southeastern corner of the fen may be susceptible todifficulties regarding drainage out from the fen andpossible flooding. The fen drains the to River Wissey, butthe effect of near-by river stage elevation on the degree offen flooding has not been ascertained.
The fen is susceptible to changes in rainfall andevaporation as these become manifest as changes indirect precipitation on the wetland and as changes toground water levels in the underlying Chalk aquifer.Consideration of available meteorological and ground
< Section divider
This do
cumen
t was
with
drawn o
n 6 N
ovem
ber 2
017.

water level data has shown that ground water levels inthe fen fall significantly during time of low rainfallresulting in springs and seepages drying up severaltimes since 1989. However, these problems may havebeen exacerbated by increased local ground waterabstractions. The observed magnitude of change inground water levels suggests that the fen may also be
vulnerable to increased density of drains – i.e. whichmay lead to further draining of the shallow fen depositsand consequently to lower water levels within thecentral part of the fen.
Case studies Case study examples: Great Cressingham Fen 5.2
Environment Agency in partnership with Natural England and Countryside Council for Wales Understanding water for wildlife
Hazard Nature and Potential impact Likelihood of Consequent risk Level of confidencemagnitude of on the overall occurrence to european featurespotential water supply (preliminary assessment only)
Licensed surface Reduction in flow Low Low Low Very Low water abstractions to the wetland (F2)
Minor change water quality (Q3)
Licensed ground Major reduction High Medium High Low -water abstractions (i.e. well above HST)
in wetland ground waterlevels (L1, C1)
Major interception offlow to the wetland (F1)
Potential risk due to Environment Agency licensed abstractions as assessed at the end of stage 2
Stage 3 Proposed/ongoing work(recommendations made at the end of stage 2)Appropriate assessment is considered essential for thesite but this should be undertaken in an integrated wayas outlined below:
A. Baseline investigations1) Further site characterisation by undertaking detailedon-site hydrological investigations under the AMP3National Environmental Programme and by otherinterested parties (e.g. Natural England and localabstractors). These to include:
• Ecological Investigation and Monitoring –clarification on the possible loss of species, furthervegetation monitoring including determining themobility of the peat raft beneath the Sphagnum
areas, defining existing water levels and fluctuationsto determine sensitivity to additional change,undertaking a topographic 'spot height' survey toascertain the relationship between ground surface,seepage/spring discharges and water levels anddetermining the role of the River Wissey in thesupport of fen water levels
• Hydrological Monitoring – increasing the number anddistribution of existing monitoring locations(boreholes and gaugeboards), in particular to assessthe hydrological impact of abstraction at the fen fromthe AWS North Pickenham and South PickenhamEstates sources.
< Section divider
This do
cumen
t was
with
drawn o
n 6 N
ovem
ber 2
017.

2) Further conceptual inderstanding by:
• Integrating hydrological data (including new datagathered since Stage 2) to support a hypothesisedview of flow from the underlying Chalk aquifer to theground surface through the unsaturated andsaturated aquifer system within and across theboundaries of the hydrological domains. Thedominant processes should be emphasised withineach domain.
• Undertaking a 'natural' water budget, i.e. as the sitewould naturally be in the absence of any abstractionsor discharges. The budget to be estimated based onboth long term average and dry year conditions (e.g.1976). Results to be used as part of the initialassessment of possible flow impacts.
3) Assessment of possible flow reduction impacts by:
• Retaining simple conservative drawdown estimatesat the fen, but by employing a more appropriateanalytical approach than Theis, such assuperposition of the Hantush analytical solution (i.e.for leaky aquifers).
• The further application of layered, radial flow modeldrawdown estimates to take account of the near-surface influences of ditch and/or river drainageboundaries which will tend to reduce the amplitudeof both seasonal and abstraction related water levelfluctuations.
• The application of simple transient two layerdistributed ground water flow models to providebetter details of changes in water level near the fen.
• Considering the use of a multi-layer or otherconceptual model, given that the degree of aquiferproperty layering at Great Cressingham Fen isconsidered sufficiently complex.
To use this information to assess impact/mitigation ofground water abstractions on the site. These to includescenarios without abstraction, under recent and fullylicensed abstraction conditions as well as individualassessments for those abstractions that have beenidentified as having a potentially significanthydrological impact (i.e. those that exceed theHydrologically Effective Threshold (HST), either as asingle abstraction or in combination with others).
4) Further clarification required of appropriate targetsfor the site, but primarily based on hydrologicalprescriptions for M13 and M24 ecological features.
Ongoing review of the Appropriate Assessment (andRisk Assessments) should be undertaken withprogression of Baseline Investigations.
Case studies Case study examples: Great Cressingham Fen 5.2
Environment Agency in partnership with Natural England and Countryside Council for Wales Understanding water for wildlife
< Section divider
This do
cumen
t was
with
drawn o
n 6 N
ovem
ber 2
017.

Case studies Case study examples: Great Cressingham Fen 5.2
Environment Agency in partnership with Natural England and Countryside Council for Wales Understanding water for wildlife
Figu
re 2
.3 H
ydro
geol
ogic
alse
ttin
g of
Gre
atCr
essi
ngha
m fe
n in
the
rive
r wis
sey
catc
hmen
t
5700
0057
2000
5740
0057
6000
5780
0058
0000
5820
0058
4000
5860
0058
8000
5900
0059
2000
5940
0059
6000
5980
00
2900
00
2920
00
2940
00
2960
00
2980
00
3000
00
3020
00
3040
00
3060
00
3080
00
3100
00
3120
00
3140
00
TF70
/127
TF80
/006
TF80
/217
TL79
/031
TL89
/002
TL89
/014
TL89
/017
TL89
/019
TF70
/038
TF70
/070
TF80
/014
TF80
/021
TF80
/022
TF80
/216
TF90
/001
TL89
/005
TL89
/006
TL99
/005
TF90
/167
TL99
/008
TF80
/005
TL99
/017
A
TL99
/007
A
Rive
r Wis
sey
Gre
at C
ress
ingh
am F
enW
atto
n B
rook
AWS
Nor
th P
icke
nham
Lic
6/33
/48/
G/1
22S
outh
Pic
kenh
am E
stat
esLi
c 6/
33/4
8/G
/024
8
Hy
dro
ge
olo
gic
al
Do
ma
in
Gre
at C
ress
ingh
am F
enSu
rfac
e W
ater
Cat
chm
ent
Ave
rage
Apr
il Ch
alk
Gro
undw
ater
Lev
els
(mAO
D)
Envi
ronm
ent A
genc
yH
ydro
met
ric
Are
a
Out
crop
Cha
lk (D
rift
<5m
)
5m <D
rift
<10
m o
n Ch
alk
Till
on C
halk
San
d &
Gra
vel o
n Ch
alk
San
d &
Gra
vel o
n Ti
ll on
Cha
lk
Gro
un
dw
ate
r A
bs
tra
ctio
n(H
isto
ric
an
d C
urr
en
t)
500
TCM
A
2000
TCM
A
Exte
nt o
f 2 la
yer m
odel
(lay
er 2
)
Loca
tion
of A
genc
y O
bser
vati
on
Bor
ehol
e us
ed fo
r Mod
el
Refin
emen
t
Line
s of
Cro
ss S
ecti
on
Ke
y
< Section divider
This do
cumen
t was
with
drawn o
n 6 N
ovem
ber 2
017.

Case studies Case study examples: Great Cressingham Fen 5.2
Environment Agency in partnership with Natural England and Countryside Council for Wales Understanding water for wildlife
Figure 2 Cross section indicating locations of significant abstractions and proposed monitoring installations
< Section divider
This do
cumen
t was
with
drawn o
n 6 N
ovem
ber 2
017.
Case studies Case study examples: Portholme Meadow 5.2
Environment Agency in partnership with Natural England and Countryside Council for Wales Understanding water for wildlife
Ecology (section 3)Site typeLowland hay meadow
Area of SSSI104 ha
SAC featuresPortholme cSAC
Lowland hay meadow
SPA featuresN/A
Existing ecological monitoringFlora surveyed in 1997 and 1999. No other monitoringundertaken.
Water resourcesSee Schematic Figure overleaf.
Geology/hydrogeologyThe hydrogeology of the site comprises a shallow graveldrift aquifer. This is believed to be recharged by surfacewater from the River Great Ouse upstream ofGodmanchester Sluice, where levels are retained by thesluice as well as indigenous recharge from rainfall.
Source(s) of water supplySurface water has a direct input to the system in timesof flood. Water from the Alconbury Brook and RiverGreat Ouse spills onto the site adjacent to thewatercourses. Other inputs include ground waterpossibly enhanced by infiltration from the river.
Level of confidence in the conceptualunderstanding of the siteThe general conceptualisation of the site is consideredadequate to understand and rank the hydrologicallyrelated issues which detrimentally affect the site.
Portholme MeadowStage 2 Ongoing (& Stage 3 Assessments)
5.2 Case study
Relationship between ecology and waterresourcesRelationship between european features and watersupplySAC: An appropriate water level regime, developedthrough a DEFRA funded project and limited data fromPortholme is presented below:
Winter – December to February; water tables oscillatebetween the soil surface and a depth of 40 cm withoccasional inundations by floodwater (2 to 4 days induration).
Spring – March to May; water levels fall gradually toabout 60cm below mean field level by the end of May.
Summer – June to August; water tables often continueto fall to below 100 cm from the surface, where soilconductivity begins to limit evaporative losses.Although the water table is deep, the vegetationremains well supplied with water by virtue of the highavailable water content of the deep alluvial soils towhich the community is restricted.
Autumn – September to November; water levels shouldrise back to within 40 cm of the surface.
SPA: N/A
What are the potential effects on the site The hydrological system controlling the wetland regimeat Portholme is shown schematically in the Figureoverleaf. Spillage to the site can occur under floodconditions. Under normal or low flow conditions,surface water in the Bedford Ouse is held at a retainedlevel upstream of Godmanchester Sluice. The surfacewater is then infiltrating the shallow gravel aquifer, andrecharging ground water within site.
< Section divider
This do
cumen
t was
with
drawn o
n 6 N
ovem
ber 2
017.

Impacts from surface water abstractionsThere is one major abstraction licence within 5 km andupstream of the Portholme site made by AWS at Offordused as the substantial source of input to GrafhamReservoir. Cessation clauses on licensed operationsprevent any effect under low flow conditions but underhigh and average conditions there is the potential forappreciable flow reduction. However, the directhydrological impact on the site is buffered, in river levelterms, by the operation of various control structuresaround the site.
The Offord abstraction and those made from theBedford Ouse further upstream may contribute to poorwater quality but this is primarily influenced by pointeffluent and diffuse discharges to the river elevatingsanitary and nutrient levels.
Impact from ground water abstractionsThe impact from licensed ground water abstractionshave been considered within a 5 km of the site using themodel software AQUIFER WIN32. These analyses wereconducted using both Neuman and Hantush methodsand assuming no recharge over 200 days. The resultssuggest no discernable drawdown at the site.
Case studies Case study examples: Portholme Meadow 5.2
Environment Agency in partnership with Natural England and Countryside Council for Wales Understanding water for wildlife
Hazard Nature and magnitude Potential hydro Likelihood of Consequent risk Level of confidenceof potential -ecological Effect occurrence to european featureshydrological (preliminary assessment only)
impacts
Surface water River flows Low Low Low High abstractions
Surface water River quality Low-Medium Unknown Probably low Lowabstractions possibly in range
Low – Medium
Ground water Ground water Levels Negligible Low Negligible Highabstractions
Potential risk due to Environment Agency licensed abstractions and strategic water resources management
Stage 3 ProposalsAppropriate assessment is considered essential for thesite and Baseline investigations/assessmentsrecommended are outlined below:
Hydrological monitoring• Review of water quality in watercourses surrounding
Portholme with respect to deposition of particulatenutrients during flood events. The impact of UWWTDimplementation on eutrophication effects on theRiver Great Ouse should also be considered.
• Actual causes of RE3 failure to Alconbury Brook. Andaction taken to solve the issues.
• Further monitoring of dipwells for both level andwater quality and extension of the dipwell network tocharacterise the whole site.
Ecological monitoring• Update of the 1997 NVC survey.• Annual monitoring of the fritillary and other criteria
identified for definition of favourable condition. • Collection of baseline data to allow a nutrient budget
for the site to be undertaken.
The Risk assessment should be revisited and refined asnew data are obtained and decisions made about themost appropriate course of action:
(i.e. proceed to Stage 3 (appropriate assessment) andStage 4 where the decision is made to affirm, amend orrevoke licences).
Nutrient analysis of soil and hay is required todetermine the susceptibility of the site to nutrientdeposition.
< Section divider
This do
cumen
t was
with
drawn o
n 6 N
ovem
ber 2
017.
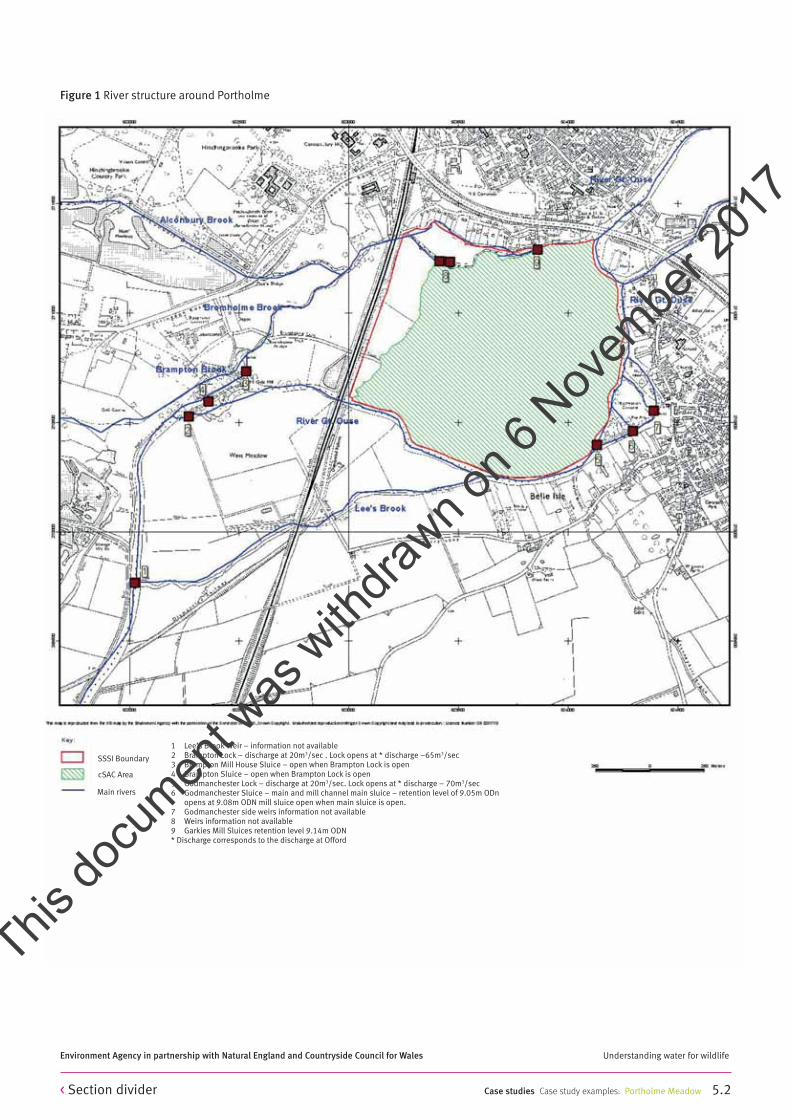
Case studies Case study examples: Portholme Meadow 5.2
Environment Agency in partnership with Natural England and Countryside Council for Wales Understanding water for wildlife
Figure 1 River structure around Portholme
1 Lee’s Brook Weir – information not available2 Brampton Lock – discharge at 20m3/sec . Lock opens at * discharge –65m3/sec3 Brampton Mill House Sluice – open when Brampton Lock is open4 Brampton Sluice – open when Brampton Lock is open5 Godmanchester Lock – discharge at 20m3/sec. Lock opens at * discharge – 70m3/sec6 Godmanchester Sluice – main and mill channel main sluice – retention level of 9.05m ODn opens at 9.08m ODN mill sluice open when main sluice is open.7 Godmanchester side weirs information not available8 Weirs information not available9 Garkies Mill Sluices retention level 9.14m ODN* Discharge corresponds to the discharge at Offord
SSSI Boundary
cSAC Area
Main rivers
< Section divider
This do
cumen
t was
with
drawn o
n 6 N
ovem
ber 2
017.

Case studies Case study examples: The Nene Washes 5.2
Environment Agency in partnership with Natural England and Countryside Council for Wales Understanding water for wildlife
EcologySite typeWashland & Moreton’s Leam
Area of SSSI1310 ha
SAC featuresNene Washes cSAC
• Spined loach.
SPA featuresNene Washes SPA
• Wigeon• Teal• Garganey• Gadwall• Black-tailed godwit• Shoveler• Pintail• Species contributing to the wintering
assemblage.Internationally important waterfowlassemblage: greater than 20 000 waterfowl.
Water resourcesSee schematic figure overleaf.
Geology/hydrogeologyThe geology of the site comprises variable driftoverlying Jurassic clays. Ground water is thought to be of moderate significance to the western part of thesites generally associated with sand and gravel (RiverTerrace Gravel).
Source(s) of water supplyThe site is supplied primarily from the River Nene viaMoreton’s Leam. Flood inflows are achieved whenStanground Sluice is opened and water spills into theWashes. Summer inflows are achieved via slackerinflows.
Moreton’s Leam is also supplied by indigenousdrainage from a small catchment, although supplies insummer are believed to be minimal.
Level of confidence in the conceptualunderstanding siteThe general conceptualisation for the site is considered
The Nene WashesStage 2 Ongoing (planned Stage 3 Assessments)
5.2 Case study
adequate to understand and rank the hydrologicallyrelated issues which detrimentally affect the site.
Relationship between ecology and waterresourcesRelationship between european features and watersupplySAC: Spined loach can tolerate poor water quality andmay thrive in the absence of other species that cannottolerate it. However the species requires macrophytes forcover and an abundant food supply which is more likelyto be present in good quality water i.e. low phosphorusand sanitary determinands, high oxygen content. Thespecies is poorly adapted to high flow rates.
SPA: The SPA species have varying water levelrequirements. The requirements of the food sourceshowever also need to be met. Whilst the Washgrassland can tolerate winter flooding, spring floodingis not desirable and can lead to the loss of the fine-leaved grasses such as creeping bent Agrostisstolonifera. The ditch flora requires high levels of lownutrient status water, ideally with a P level <0.1mg/l.Spring flooding adversely affects the breeding successof the waders in particular, as the nests get flooded.
Do any european features have a specific requirementfor ground waterSAC: No
SPA: No
Are any of the features supported by ground waterinputsNo
What are the potential effects on the site The western half of the Nene Washes are underlain by aDrift Gravels aquifer and there is potentially drawndowndue to surrounding licensed ground water abstractionsand dewatering operations associated with mineralextraction works. In this instance, predicted drawdownwas assessed using the AQUIFER WIN32 program andthe Neuman application to represent unconfinedconditions.
< Section divider
This do
cumen
t was
with
drawn o
n 6 N
ovem
ber 2
017.

Surface water flows to the Nene Washes derived fromthe River Nene can be potentially compromised in:• Winter; particularly by large scale abstractions for
PWS, which can reduce the incidence (reliability andmagnitude) of seasonal flooding to the site. This wasconsidered by looking at potential effects to amarginal and specific flood event that may havegiven rise to limited flooding in the Washes withoutthe effect of PWS abstractions.
• Summer; particularly by large scale non-licensedabstractions from the lower Nene. This threat isgenerally controlled by the Environment Agencythrough implementation of a Summer OperatingPolicy for the lower River Nene which aims toguarantee security of supply to the site and suppressusage by competing interests during periods of lowflow when total demands exceed water availability.However, implementation of the Policy relies uponco-operation. This was considered by closely lookingat the Summer Operating Policy and considering it'stheoretical performance against various flow regimesfor the Summer.
Another key issue for the site is the high nutrient statusof the River Nene. The situation has recently improvedthrough implementation of the UWWTD but improvedlevels are still likely to compromise the condition of thesite. The present situation is influenced both by pointdischarges (mainly from STWs) and diffuse sources.
Case studies Case study examples: The Nene Washes 5.2
Environment Agency in partnership with Natural England and Countryside Council for Wales Understanding water for wildlife
Hazard Nature and Potential impact Likelihood of Consequent risk Level of confidence(Moreton’s Leam magnitude of on the overall occurrence to european featuresand the Washes) potential effects water supply (preliminary assessment only)
on the water supply
Licensed surface Flow (S) Medium (S) Low1 (S) Low1 (S) Highwater abstractions
Non licensed surface Flow (S) High (S) Low1 (S) Medium1 (S) High (S)water abstractions
Strategic catchment Flow (S) Medium (S) Low2 (S) Low2 (S) High (S)management
Licensed ground Level & Flow Medium (Level) Low Low Medium-water abstractions Low (Flow)
1 Controlled by the Lower Nene summer operating policy2 The strategic Wansford MCF limits effects and overall abstraction/discharge effects contribute positively to the low-flow regime of the Nene at Orton.(S) Summer effect controlled by operating policy(W) Winter effect possibly attributed to AWS Wansford abstraction.
Potential risk due to Environment Agency licensed abstractions and strategic water resources management
< Section divider
This do
cumen
t was
with
drawn o
n 6 N
ovem
ber 2
017.

Stage 3 Proposed/ongoing work.Appropriate assessment is considered essential for thesite but this should be undertaken in an integrated wayas outlined below:
A. Baseline investigations• Further clarification required of appropriate targets
for the site. • Assess impact/mitigation of ground water
abstractions (licensed and none licensed) on thesite.
• Assess impact of AWS Wansford abstraction onWinter flooding regime/reliability of Washes.
• Investigate various flood defence issues (Rings EndSluice & siltation control on tidal Nene) and impactto site.
• Review significance of UWWTD implementation tophosphorus concentrations in the Nene.
• Investigate local catchment issues giving rise to RE3failure in Moreton’s Leam.
• Acquire available assessments and on-goingmonitoring from Bradley Fen extraction operation byHanson to help inform future RoC assessments.
• Undertake detailed on-site hydrologicalinvestigations under the AMP3 NationalEnvironmental Programme.
• Undertake flow naturalisation studies for the LowerNene.
• Investigate water balance for site.• Investigate nutrient budget for site.
B. Assessment and development of revised Integratedmanagement• Periodic Review of summer operating policy for the
Lower River (and consideration toward positive useof discharge from Flag Fen (Peterborough) STW).
• Possible implementation of controlled winterflooding to the Washes.
• Implementation of channel maintenance practicessympathetic to spined loach.
• Possible schemes to further reduce phosphorusconcentrations in the Nene (or on the site).
Ongoing review of the appropriate assessment (and riskassessments) should be undertaken with progressionof baseline investigations and development of revisedintegrated management. It is anticipated that revisionsof ongoing monitoring will be an integral requirement ofrevised management. Any introduction of controlledflooding must be considered in an integrated manor.The flood defence function and operation of theWashes must not be compromised.
Case studies Case study examples: The Nene Washes 5.2
Environment Agency in partnership with Natural England and Countryside Council for Wales Understanding water for wildlife
< Section divider
This do
cumen
t was
with
drawn o
n 6 N
ovem
ber 2
017.

Case studies Case study examples: The Nene Washes 5.2
Environment Agency in partnership with Natural England and Countryside Council for Wales Understanding water for wildlife
Figu
re 1
Low
er N
ene
– M
ajor
sum
mer
wat
er re
sour
ce a
lloca
tion
Key
Slu
ice/
Lock
Slu
ice
Lock
Maj
or R
iver
Inta
ke
Bun
ded
Are
a (r
etai
n flo
odw
ater
s an
d so
me
pum
ped
re-c
ircu
lati
on o
pera
tion
s)
Zone
of I
dent
ified
Riv
er L
eaka
ge/L
osse
s
Nen
e W
ashe
s SS
SI,
SAC
&SP
A
supp
lem
ente
d in
sum
mer
by
grav
ity
fed
inflo
ws
from
Mor
tons
Lea
m
Map
Ref
Rive
r Str
uctu
reCo
mm
ent
1W
ater
New
ton
Slu
ice/
Lock
Rete
ntio
n Le
vel ~
8.0
m A
OD
2A
lwal
ton
Slu
ice/
Lock
Rete
ntio
n Le
vel ~
6.4
m A
OD
3O
rton
Slu
ice/
Lock
Rete
ntio
n Le
vel ~
4.5
m A
OD
4D
og-in
-a-D
oubl
et S
luic
e/Lo
ck
Rete
ntio
n Le
vel ~
2.9
m A
OD
(Nen
e Ti
dal L
imit
)
5S
tang
roun
d S
luic
eFl
ood
Inle
t to
Nen
e W
ashe
s (a
ctiv
ated
whe
n N
ene
leve
l > 3
.7 m
AO
D)
6S
tang
roun
d Lo
ckN
avig
atio
n Li
nk b
etw
een
Nen
e an
d M
iddl
e Le
vel
8El
dern
ell S
luic
eRe
tent
ion
Leve
l ~1.
45 m
AO
D (s
umm
er),
~1.
0 m
AO
D (w
inte
r)
7Li
ttle
Bri
dge
Slu
ice
Rete
ntio
n Le
vel ~
1.60
m A
OD
(sum
mer
), ~
1.0
m A
OD
(win
ter)
9Ri
ngs
End
Slu
ice
Rete
ntio
n Le
vel ~
1.10
m A
OD
(sum
mer
), ~
1.0
m A
OD
(win
ter)
Rive
r Nen
e
Mor
tons
Lea
m
King
’s D
yke
Tida
l Riv
er N
ene
B10
401
34
2
5
7
8
New
Com
s O
ver D
rain
9
6
AWS
Wan
sfor
d In
take
Mid
dle
Leve
l
Min
. tar
get f
low
to
Nen
e W
ashe
s =
15
Ml/
d
Esti
mat
ed P
eak
Rive
r Lo
ss (O
rton
to
Dog
-in-a
-Dou
blet
Re
ach)
= 2
5 M
l/d
Min
. Con
trol
Flo
w =
15
0 M
l/d
(1.7
36 m
?/s)
- su
mm
er12
5 M
l/d
(1.4
47 m
?/s)
- w
inte
rN
ene
to M
iddl
e Le
vel
Tran
sfer
Pea
k D
eman
d ~
135
Ml/
d
Abs
trac
tion
Lic
ence
Ann
ual Q
ty 2
7849
5 M
l (~
763
Ml/
d)
Dai
ly Q
ty 7
63.9
Ml/
d
Min
. tar
get f
low
to ti
de=
25
Ml/
d (1
5 M
l/d
thro
ugh
the
slui
ce a
nd 1
0 M
l/d
thro
ugh
the
fish
pass
)
T
T
Nen
e to
Nor
th L
evel
Tr
ansf
er P
eak
Dem
and
~
10 M
l/d
< Section divider
This do
cumen
t was
with
drawn o
n 6 N
ovem
ber 2
017.

Case studies Case study examples: The Stour Estuary 5.2
Environment Agency in partnership with Natural England and Countryside Council for Wales Understanding water for wildlife
Site descriptionA coastal plain estuary, i.e. a flooded pre-existing valleyformed during the Holocene transgression.
EcologyArea of SSSI2150 ha
SAC featuresNot applicable
SPA featuresAnnex 1 bird species of international importance:
• hen harrier; and• golden plover (No longer qualifies).
Migratory bird species of international importance:• dark-bellied brent geese (No longer qualifies)• dunlin• redshank• ringed plover• shelduck• turnstone• grey plover• pintail• black tailed godwit
Internationally important waterfowl assemblage
Existing ecological monitoringNo regular monitoring of habitats takes place. TheEnvironment Agency carries out limited benthicinvertebrate sampling within the estuary. Bird countsare carried out annually as part of the Wetland BirdSurvey (WeBS) Core Counts.
Water resourcesGeologyGlacial Sand and Gravel Drift underlain by Red Crag,with London Clay underlying the estuary.
Existing surface water and ground water monitoringSome spot flow gauging on lower estuary inputs andthe main channel
Source(s) of water supplyFreshwater inputs from small channel inputs and mainriver channel
The Stour EstuaryStage 2 Assessments
5.2 Case study
Level of confidence in the conceptual understanding of the siteMedium
Relationship between ecology and waterresourcesRelationship between european features and water supplySPA: The SPA qualifying bird species require thefollowing habitats: saltmarsh communities; intertidalmudflats and sandflats; and shell, sand and gravelshores. The location and extent of these habitats isdictated mainly by coastal processes, i.e. sea level rise,land tilt, wave action, sediment deposition.
At the present time it is unclear whether or not birds usefreshwater inflows within the estuary in preference toother habitats. It is possible that birds do prefer areasadjacent to freshwater inputs for a number of activitiessuch as feeding, drinking, preening and loafing.
The distribution of saltmarsh plant species within theestuary appears to be primarily influenced by the heightof sediments in relation to sea levels rather thanchanges in salinity.
Invertebrate abundance similarly appears to beindependent of salinity, with the most productive areasof mudflat being located in those areas where theinfluence of freshwater is likely to be minimal.
Do any European features have a specific requirementfor ground water.
SAC: Not applicable
SPA: No
Are any of the features supported byground water inputsNo. Ground water seepages do occur along theshoreline of the estuary but these are small and do notappear to be supporting any of the European sub-features present. Ground water does provide base flowto the streams within the catchment which ultimatelydischarge into the estuary.
< Section divider
This do
cumen
t was
with
drawn o
n 6 N
ovem
ber 2
017.

UncertaintiesTwo studies by Ravenscroft et al (1997) and Ravenscroft(1998) suggest that there is an association betweensome species of waterfowl and freshwater flows.Ravenscroft observed that some species tended tocongregate around discrete channelled freshwater flowsin larger numbers than expected when the small areainvolved was considered. One of the estuaries includedwithin the 1998 study was the Stour, and shelduck,wigeon, pintail, grey plover, redshank, curlew and dark-bellied brent geese all showed statistically greaterdensities close to flows when compared with remainingareas of mudflat. However, this was not the case forblack-tailed godwit, ringed plover and dunlin and nopreference for freshwater seepage areas wasdemonstrated for any species. Ravenscroft proposed a number of hypotheses to explain why birds maybe demonstrating a preference for areas with freshwater flows:
• Increased nutrient input to mudflats leading toincreased biomass of prey species;
• Increased inputs of detritus providing a food sourcefor invertebrates, thereby increasing their biomass;
• Improved feeding conditions (wetness of mudflats,prevention of mud freezing);
• Changes in salinity favouring euryhalineinvertebrates;
• Shelter provided by channels.
Stage 3 Proposed/on-going workProposed ecological monitoringThe research of Ravenscroft et al (1997) andRavenscroft (1998) have highlighted the need forfurther research into the importance of freshwaterinputs to estuarine systems for waders and wildfowl. It is suggested that further research is carried out andbird surveys should:
• be carried out on a number of different estuaries andat a number of areas within each to increase thesample size from that in the research carried out byRavenscroft;
• be carried out at different times of day, states of thetide and weather conditions to determine whetherthere is any relationship between these and usage ofareas adjacent to freshwater flows;
• Record at the same time within freshwater flow areasand comparable areas of mudflat the number of eachspecies and the activity of birds.
Assuming that birds do congregate around freshwaterinflows in significant numbers, further research into whythis happens is required. Investigations may include:
• invertebrate sampling to identify any differences inspecies assemblage and abundance betweenfreshwater flow areas and surrounding mudflats;
• assessment of flora in the vicinity of freshwaterinflows, in particular algae; and
• salinity measurements to identify extent offreshwater influence, possibly including interstitialsalinity.
Case studies Case study examples: The Stour Estuary 5.2
Environment Agency in partnership with Natural England and Countryside Council for Wales Understanding water for wildlife
Hazard Nature and Potential impact Likelihood of Consequent risk Level of confidencemagnitude of on the overall occurrence to interest featurespotential effects on water supply (preliminary assessment only)
the water supply
Surface water Major interception High High Medium Medium abstractions of surface water
and/or ground waterflow to the wetland
Ground water Major interception High Medium Medium Medium abstractions of surface water
and/or ground waterflow to the wetland
Potential risk due to Environment Agency licensed abstractions
< Section divider
This do
cumen
t was
with
drawn o
n 6 N
ovem
ber 2
017.

Proposed hydrological monitoringAlthough the main River Stour is relatively well gauged,there is little data available to indicate what volume offreshwater enters the estuary directly. Limited flowgauging at all discrete discharge points to the estuarywould provide a useful estimate of freshwater dischargevolumes. Installation of piezometers in the Crag andSands and Gravels and/or ground water modellingwould improve understanding of ground watercontribution to river flows and diffuse ground watercontribution direct to the estuary. However, thecollection of this data is only considered necessary if aclear link is established between bird assemblages andfreshwater flows.
Case studies Case study examples: The Stour Estuary 5.2
Environment Agency in partnership with Natural England and Countryside Council for Wales Understanding water for wildlife
Figure 1 Schematic representation of the hydrological system of Stour estuary
< Section divider
This do
cumen
t was
with
drawn o
n 6 N
ovem
ber 2
017.

Case studies Case study examples: The Stour Estuary 5.2
Environment Agency in partnership with Natural England and Countryside Council for Wales Understanding water for wildlife
Figure 2 Stour estuary SSSI
< Section divider
This do
cumen
t was
with
drawn o
n 6 N
ovem
ber 2
017.

Case studies Case study examples: Gibraltar Point 5.2
Environment Agency in partnership with Natural England and Countryside Council for Wales Understanding water for wildlife
Site descriptionGibraltar Point SSSI supports a full transition of coastalhabitats ranging from mudflats to mature sand dunes.Other habitats included within the site includesaltmarsh, freshwater marsh and open pools,containing either fresh or brackish water. The site isprincipally valued for the range of coastal habitatssupported, and the fauna associated with them,particularly wintering and passage waterfowl andbreeding little tern.
EcologySite typeCoastal
Area of SSSI581ha
cSAC interest featuresThe Wash and North Norfolk Coast cSAC:
• Atlantic salt meadows;• Large shallow inlets and bays;• Mediterranean and thermo-Atlantic halophilous
scrubs (Sarcocornetea fruticosi);• Mudflats and sandflats not covered by seawater at
low tide; and• Salicornia and other annuals colonising mud and
sand.
Saltfleetby-Theddlethorpe Dunes and Gibraltar PointcSAC:
• Embryonic shifting dunes;Shifting dunes along the shoreline with Ammophila
arenaria (white dunes);• Fixed Dunes with herbaceous vegetation (grey
dunes);• Humid dune slacks; and• Dunes with Hippophae rhamnoides.
SPA interest featuresAnnex 1 species of international importance:
• wintering bar-tailed godwit;• breeding little tern.
Gibraltar Point
5.2 Case study
Migratory bird species of international importance:
• grey plover;• knot.
Internationally important waterfowl assemblage:greater than 20 000 waterfowl.
Existing ecological monitoringA number of ecological monitoring surveys are carriedout and these include birds surveys as part of theWetland Bird Survey (WeBS) and Common Bird Census(CBC), fixed quadrat vegetation surveys in FreshwaterMarsh and natterjack toad surveys.
Water resourcesGeology• Thin blown sands deposits possibly overlying
Terrington Beds;• The above overlaying extensive fluvio-glacial sands
and gravels;• The above rest uncomfortably over Lower Cretaceous
rocks.
Existing surface water and ground water monitoringOperational monitoring of selected surface waters on-site by Lincolnshire Wildlife Trust (LWT).
The Golf Club to the north of the site undertake somewater level and salinity monitoring associated with theirground water abstraction.
LWT also undertake further hydrometric monitoringassociated with their plans to extend the reservewestward towards Jacksons/Croft Marsh.
• The Freshwater Marsh is served by indigenous,highly localised, surface drainage and ground waterderived from rainfall runoff and recharge to (or veryclose to) the site.;
• Intertidal areas receive residual drainage from theFreshwater Marsh to the north and indigenous runoffbut are primarily influenced by diurnal tidal inflowand occasionally, for very large tides, these inflowsinundate the marshes
Stage 2 Assessments (and Stage 3 Proposals)
< Section divider
This do
cumen
t was
with
drawn o
n 6 N
ovem
ber 2
017.

Case studies Case study examples: Gibraltar Point 5.2
Environment Agency in partnership with Natural England and Countryside Council for Wales Understanding water for wildlife
Level of confidence in the conceptual understanding ofthe site• The broad understanding of site hydrology is
moderately understood but details are scarce,particularly for the Freshwater Marsh area, andtherefore, the baseline ground water regime andinteraction with pumped, IDB controlled, drainage tothe west for this area are poorly understood
Relationship between ecology and waterresourcesRelationship between european features and watersupplyThe Wash and North Norfolk Coast cSAC:The interest features are primarily influenced by coastalprocesses and largely independent of freshwaterinfluences within the intertidal areas of Gibraltar PointSSSI.
Saltfleetby-Theddlethorpe Dunes and Gibraltar Point cSAC:The interest features consist of a series of sand dunetypes and vegetation generally adapted to droughtconditions and not dependent on freshwater flows. Theexception to this are the humid dune slack areas of thesite. Freshwater inputs to the sand dune system ofGibraltar Point are local and indigenous. Therefore, LWTcarry out management aimed at retaining water throughthe summer months in an area known as the FreshwaterMarsh. However, ground water abstraction carried outby Seacroft golf course to maintain their greens maygive rise to sufficient drawdown in these areas to causesaline intrusion into some of the dune slack areas ofFreshwater Marsh, with the possibility of affectingspecies composition and abundance within theseareas.
Gibraltar Point SPA: The interest features require a range of intertidal (andextreme tidal) habitats but these do not havesignificant freshwater dependence. Tenuous links forInterest Features have been postulated in estuarineoutfalls and tidal creeks supplied by freshwater butthese regimes in relation to the site are not consideredto be significantly impacted.
What are the potential effects on the site The principal area of the European designated siteconsidered sensitive to the freshwater hydrologicalregime is the Freshwater Marsh zone. This zone isserved by indigenous drainage which is managed byLWT to achieve a desired quantity and quality regime forthe site. This zone is potentially vulnerable to salineintrusion by both surface and ground waterconveyance. The former is controlled through a series ofponds and a lagoon by means of sluicing. The freshground water zone is believed to have very limitedthickness and could be vulnerable to impacts underextreme drought or inappropriate operational regimes.Additional water level management by LWT, of waterbodies immediately west of the site (including theFreshwater Marsh), is believed to buffer the site frompotential hydrological impacts. Such impacts couldpotentially arise as a result of pump drainedoperations/management by the IDB for the Cow BankDrain which may otherwise lower ground water levels atthe site.
The intertidal areas of the site are primarily fed by tidalwater, with limited freshwater input from WainfleetHaven (the estuarine portion of the River Steeping) andone or two minor flows which drain from the sand dunesystem. Intertidal areas of the site are not consideredvulnerable to any potential impacts to the freshwatercomponent from the River Steeping. The only issuesconsidered to be of potential concern to the site iswhether water quality in Wainfleet Haven isdetrimentally impacted by discharge, abstraction or anyother operation affecting the River Steeping. This is notthought to be the case with the tidal river achieving awater quality compliant with a RE2 target.
The preliminary impact assessment indicates that thereis a possible risk to ground water salinity regimes at theFreshwater Marsh from a local abstraction made by theGolf Club to the north of the site. The other possibleeffect considered worthy of further investigation is tocheck that IDB management/operations do not causeground water level drawdown to the site. The preciseeffect on the Freshwater Marsh is difficult to quantifybecause the baseline hydrological regime for the site isnot well known. Therefore further investigations of thesite and adjacent operations are proposed to reduceuncertainty and enable a more robust assessment.
< Section divider
This do
cumen
t was
with
drawn o
n 6 N
ovem
ber 2
017.

Case studies Case study examples: Gibraltar Point 5.2
Environment Agency in partnership with Natural England and Countryside Council for Wales Understanding water for wildlife
Hazard Nature and Potential Hydro- Likelihood of Consequent risk Level of confidencemagnitude of ecological effect occurrence to European featurespotential (preliminary assessment only)
Surface Water R. Steeping quality Low Very low Very low HighAbstractions (negligible)
Ground water Level regime Very Low/ (negligible) Low Very low MediumAbstractions (negligible)
Quality regime Medium Low (? But very Low (? Possibly Low (? Possiblyuncertain) medium) very low)
Potential risk due to Environment Agency licensed abstractions and strategic water resources management
Stage 3 ProposalsAppropriate Assessment is considered essential for thesite and Baseline investigations/assessmentsrecommended are outlined below:
• Further Baseline Hydrological Investigations ofFreshwater Marsh component of site.
• Assess impact of Golf Club ground water abstractionson the site.
• Assess impact (if any) of IDB drainage on site.• Site Specific Surveys
– Detailed hydrological and water qualityinvestigation of ground water and surface waterregime across the Freshwater Marsh and extendingbeyond. This review would define more preciselythe scope of specific SI including piezometer anddata logger installations plus allied topographiclevelling of key datums.
– Signal testing of ground water abstraction effectson the Freshwater Marsh area of the site
– Botanical monitoring to confirm the status of theflora of the humid dune slack areas may benecessary.
The Risk Assessment will be revisited and refined asnew data are obtained and further assessmentsundertaken.
< Section divider
This do
cumen
t was
with
drawn o
n 6 N
ovem
ber 2
017.

Case studies Case study examples: Gibraltar Point 5.2
Environment Agency in partnership with Natural England and Countryside Council for Wales Understanding water for wildlife
Schemative of key hydological systems at Gibraltar Point
??
A ’A
’BB
sdeB notgnirreT
WainfleetHaven
Cow BankDrain
Croft MarshTennyson’s
Pond
WesternDunes
FreshWaterMarsh
EasternDunes
Sea
Key
Blown Sand Depo Saline Ground water Piezometric
Head (Salt Marsh)
SitsWater Table Blown
Sands
AquiferSaline Interface
The Mere
Old SaltMarsh
Fluvio-Glacial sand and gravel
Terrington Beds
BulldogBank
Golf CourseAbstraction
FreshwaterMarshBrackish
PondFenlandLagoon
New SaltMarsh
CarstoneRoach/Sutterby Marl
Tidal river sleeping
Jackson’s marsh pondsBurgh sluice P.S.
Croft marsh
Old salt marsh
New salt marsh
Wa
infle
et h
av
en
The Mere
Bulldog bank
Fenland ‘saline’ lagoon
Seacroft golf course
Fresh water marsh
Cow b
ank dra
in
Tenn
yson
’s p
onds
Wes
tern
dun
es
East
ern
dun
es
A’
A
’B
B
noitceS fo eniL htroN - htuoS = ’AA)B.1.5 erugiF eeS(
noitceSfoeniLtsaE-tseW=’BB
A
Fresh water pond or drain
Tidal river or creek
Saline lagoon
Seasonally brackish ponds
Foreshore to North sea/Wash
Sluice weir controls
Piped connections betweenbrackish ponds and saline lagoon
Key
Schematic of assumed hydrogeological controls at Gibraltar Point
< Section divider
This do
cumen
t was
with
drawn o
n 6 N
ovem
ber 2
017.

Case studies Case study examples: The North Norfolk Coast 5.2
Environment Agency in partnership with Natural England and Countryside Council for Wales Understanding water for wildlife
EcologySite typeCoastal
Area of SSSI7700 ha
SAC featuresThe Wash and North Norfolk Coast cSAC:
• Atlantic salt meadows (which includes tidalreedbeds);
• Large shallow inlets and bays;• Mediterranean and thermo-Atlantic halophilous
scrubs (Sarcocornetea fruticosi);• Mudflats and sandflats not covered by seawater at
low tide;• Common seal;• Salicornia and other annuals colonising mud
and sand; and• Sandbanks which are slightly covered by seawater
all of the time.
Additional proposed interest:
• Coastal Lagoons
The North Norfolk Coast cSAC:
• Coastal lagoons;• Fixed Dunes with herbaceous vegetation (grey dunes);• Embryonic shifting dunes;• Humid dune slacks;• Mediterranean and thermo-Atlantic halophilous
scrubs (Sarcocornetea fruticosi);• Perennial vegetation of stony banks; and• Shifting dunes along the shoreline with Ammophila
arenaria (white dunes).
Additional proposed interest:
• Otter• Petalwort
SPA featuresAnnex 1 species of international importance:
• wintering and breeding avocet;• wintering and breeding bittern;• breeding common tern;• breeding little tern;• breeding roseate tern;
The North Norfolk CoastStage 2 Ongoing (planned Stage 3 Assessments)
5.2 Case study
• breeding sandwich tern;• breeding Mediterranean gull;• breeding marsh harrier;• wintering bar-tailed godwit;• wintering golden plover;• wintering ruff;• wintering hen harrier; and• breeding little tern.
Migratory bird species of international importance:
• wintering pink-footed goose;• wintering pintail; and• wintering wigeon
Internationally important waterfowl assemblage:
• greater than 20 000 waterfowl.
Water resourcesGeology/hydrogeologyThe geology of the site comprises variable marsh driftoverlying sands & gravels on a Chalk platform with thelandward margin of the marshes generally demarked bya palaeo cliff-line cut into the Chalk. The Marsh depositsgenerally comprise variable accretional Holocenedeposits typically made up of salt marsh silts and claysbut also including variable quantities of peat and sandsand gravels. Seaward of the marshes sand dunedeposits and sand/shingle beach and ridge deposits aresignificant. Beyond areas of inter-tidal salt marsh mudand sand banks are widespread. Ground water entersmuch of the coastal marshes, particularly to the west ofthe site, directly from the Chalk aquifer. Further west,Chalk confinement by boulder clay together withincreased drift sands and gravels means that driftaquifers have more significance.
Source(s) of water supplyIn addition to direct ground water supply of the coastalmarshes estuarine components of the site are suppliedby rivers draining to the North Norfolk Coastal site andfrom west to east include;.R. Hun; R. Burn; Wells HarbourStream (a very minor system); R. Stiffkey; and, R. Glaven.Essentially these rivers have Chalk baseflow dominatedregimes but in the case of the Stiffkey and Glaven driftsands and gravels have hydrological significance too.
< Section divider
This do
cumen
t was
with
drawn o
n 6 N
ovem
ber 2
017.

Hydrological division of siteThe site has been divided into 10 discrete zones to helpwith the characterisation and assessment (see Figure 1enclosed).
Level of confidence in the conceptualunderstanding siteThe general conceptualisation for the site is consideredadequate to understand and rank the hydrologicallyrelated issues which detrimentally affect the site butlocal detail along the coast is quite variable.
Relationship between ecology and waterresourcesRelationship between european features and watersupplySee Table 1 for the distribution of interest featuresacross the zone receptors.
The hydrology of the North Norfolk Coast needs to beconsidered in a Regional context. In summary, thefollowing can be concluded:
• The principal rivers include the Hun, Burn, Stiffkeyand Glaven (Zones 1, 3, 7 and 9 respectively) all ofwhich are baseflow dominated rivers principallyinfluenced by the Chalk aquifer. The Hun and Burnhave minor surface water abstraction/dischargeinfluences in terms of quantity but the equivalentinfluences for the Stiffkey and Glaven are relativelygreater. Investigations have revealed that for theStiffkey and Glaven groundwater abstractions have amore significant impact on flow regimes. This is duein part to large abstractions for public water supply.Water quality is good in the Burn and Stiffkey (andthought also to be so in the Hun but no data arereadily available here) but poor in the Glaven, and allrivers are enriched with high nutrient levels.
• The small river system of Wells Harbour Stream (Zone5) is also believed to exhibit a Chalk ground waterdominated flow regime albeit of relatively minorproportions. There are virtually no data on quantity ofquality for this minor river system. The small size ofthe inflow suggests that this inflow is of nohydrodynamic significance to the tidal Wells HarbourChannel. It should also be noted that the quantityeffluent input to Wells Harbour Channel from thelocal sewage treatment works is likely to be fargreater than the minor stream inflow.
• Extensive ground water capture zones, essentiallydefined for the Chalk aquifer, are thought to existsupplying freshwater to coastal areas. Inflows toZone 2 (Thornham to Deepdale Marshes) may also beenhanced by deeper ground water outflow from theBurn catchment (Zone 3). The principal areas ofground water outflow believed to supply freshwaterto habitats in reclaimed marshes and freshwaterinfluenced salt marshes include:– Part of Zone 1 to Holme NNR.– Zone 2 (Thornham to Deepdale) supplying
freshened salt marsh (supporting tidal reed) andfreshwater grazing marshes.
– Zone 4 (Wells West Bank) freshwater grazingmarshes.
• With current knowledge it is not possible todistinguish those parts of Zone 3 (Burn) whichsupply freshwater to the reclaimed grazing marshareas of both Burnham Norton and Burnham Overybut some relatively small portion of discharge isbelieved to flow to these areas.
• Relatively minor ground water discharges arebelieved to flow and supply freshwater to both Zone8 (Morston Salt Marsh and Blakeney Freshes) andZone 10 Cley/Salthouse Marshes. The relativelyminor ground water outflows to these Zones aremade up by discharges from both Chalk and gravelaquifers. The significance of the inferred outflows toMorston Salt Marsh is not currently known (or indeedcorroborated by any field evidence). The groundwater inputs to Blakeney Freshes (reclaimed grazingmarsh) are thought to be of some significancealthough the major inflow, in quantity terms, comesin as a diversion from the River Glaven at Cley.
• There is believed to be no freshwater discharge toZone 7 (Warham to Stiffkey Salt Marshes) and this isinferred from both hydrogeological conceptualisationand field evidence which indicates no freshening ofmarine waters in this Zone.
Case studies Case study examples: The North Norfolk Coast 5.2
Environment Agency in partnership with Natural England and Countryside Council for Wales Understanding water for wildlife
< Section divider
This do
cumen
t was
with
drawn o
n 6 N
ovem
ber 2
017.

Impact assessmentbased on hydrological impact assessment using RAMaquifer response function and consideration oftheoretical drought yields (see Table 2). Figure 1 showsextent of capture zones and licensed abstractions.
Surface water abstraction licencesIs the site hydraulically connected to:
River EstuariesYes (Hun, Burn, Wells Harbour Stream, Stiffkey andGlaven)
Local marsh drainage systemsYes (the Freshwater (reclaimed) Grazing Marshes areintersected by IDB controlled drains some of which arespring fed by the Chalk)
Are there existing licensed abstractions within thecontributory surface water catchments to the site?Yes
River EstuariesYes (but none on the R. Burn)
Local marsh drainage systemsYes
If Yes, to what extent does this affect water supply tothe site (at the current licensed quantity)Risk is considered to range from negligible to medium.
Ground water abstraction licencesIs the site hydraulically connected to underlyingaquifers? Yes
Do ground waters significantly contribute to river flowinput to estuaries?Yes
How important is the ground water component in theoverall supply of water to European features?Coastal Marsh ZonesVaries from very low (Zone 6) to medium (Zone 2).
Estuarine ZonesIn the range low to medium although the dependenceon freshwater for the interest features is not presentlywell understood
Is the ground water water supply to the site likely to beaffected by existing ground water abstractions (at thecurrent licensed quantity) Yes
If yes, what is the likely impact on the overall watersupply to the siteCoastal Marsh ZonesVaries from negligible (Zone 6) to Medium (Zone 2).
Estuarine ZonesVaries from Negligible (Hun and Burn to Medium(Stiffkey and Glaven)
To what extent could this affect european featuresCoastal Marsh ZonesVaries from negligible (Zone 6) to Medium (Zone 2).
Estuarine ZonesVaries from Low (Hun and Burn) to Medium (Stiffkeyand Glaven)
Case studies Case study examples: The North Norfolk Coast 5.2
Environment Agency in partnership with Natural England and Countryside Council for Wales Understanding water for wildlife
< Section divider
This do
cumen
t was
with
drawn o
n 6 N
ovem
ber 2
017.

Case studies Case study examples: The North Norfolk Coast 5.2
Environment Agency in partnership with Natural England and Countryside Council for Wales Understanding water for wildlife
Zone Source of risk Potential risk to european features Level of confidence
Zone 1 Hun (including Holme NNR)
GW abstractions Low Low
SW abstractions Negligible Medium
All abstractions Low Low
Zone 2 Thornham to Deepdale Marshes
GW abstractions Medium Low
SW abstractions Very Low Medium
All abstractions Medium Low
Zone 3 Burn (including Burnham Norton & Overy)
GW abstractions Low Medium
SW abstractions Negligible High
All abstractions Low Medium
Zone 4 Wells West Bank
GW abstractions Negligible Low
SW abstractions Negligible Low
All abstractions Very low Low
Zone 5 Wells Harbour & Salt Marsh
GW abstractions Low Low
SW abstractions Medium Low
All abstractions Medium Low
Zone 6 Warham to Stiffkey Salt Marshes
GW abstractions Negligible Medium
SW abstractions Negligible High
All abstractions Negligible Medium
Zone 7 Stiffkey Estuary
GW abstractions Low – Medium Low
SW abstractions Low Low
All abstractions High Low
Zone 8 Morston Salt Marsh & Blakeney Freshes
GW abstractions Low Medium
SW abstractions Low Low – Medium
All abstractions Low – Medium Medium
Zone 9 Glaven Estuary
GW abstractions Medium Low
SW abstractions Low Low
All abstractions High Low
Zone 10 Cley/Salthouse Marshes
GW abstractions Low – Medium Low – Medium
SW abstractions Very Low High
All abstractions Low – Medium Low – Medium
Potential risks and level of confidence in the assessment
Environment Agency water resources consents
< Section divider
This do
cumen
t was
with
drawn o
n 6 N
ovem
ber 2
017.

Further investigations required under review ofconsents
Are further hydrological and/or ecologicalinvestigations required to define the impact ofEnvironment Agency consents?Yes
Water resources abstraction licences?Yes
Water quality discharge consents?Yes
Waste management licences?Possibly
Flood defence management?Yes
IDB drainageProbably not! Natural England aim to seek new landuse/ management agreements in areas of arable landwhich conflict with favourable regimes in freshwatergrazing marshes
Natural EnglandYes – Investigation/guidance on management of MarshDrains and on the unlicensed transfer onto the SSSIfrom the Glaven into Blakeney Freshes.
If yes, what?Part 1. Appropriate assessment• Appropriate assessment of selected abstractions is
recommended. The 1st step suggested in the nextstage of appropriate assessment involves refining;the spatial distribution of interest features anddefining their freshwater requirements (wherepossible) and getting a more definitive assessmentof actual freshwater feeds to certain salt marshesand better quantifying freshwater inflows to the sitemore generally. If these assessments continue toindicate a significant risk to the site more targetedinvestigation may be required to better define thehydrogeological regime of coastal marsh systemsand their precise interaction with chalk ground water.Assessments should be co-ordinated withrequirements under flood defence and water qualitypossibly co-ordinated through the SMP.
Part 2. Further investigations
Ecological Investigation:• The significance of an increase in salinity of the water
entering those saline lagoons which have asignificant freshwater input;
• Water balance relationships within humid duneslacks to define the water level requirements of thefeature;
• The relationship between salinity and vegetationcommunity of grazing marshes, as well as therelationship between grazing marsh invertebratecommunity composition and salinity;
• The relationship between freshwater flows acrossintertidal areas (mudflats and also in tidal creeks)and the distribution of benthic invertebrates andwintering birds.
Hydrological and Hydrochemical Investigation:• Water quality monitoring for the River Hun.• Hydrological Desk Studies bringing together findings
from; abstraction licence application impactassessments and monitoring; ongoing Regionalstudies (Entec); ongoing UEA research (Green); SMPrelated studies; and, monitoring /assessmentsassociated with the ongoing Cley-Salthouse seadefence scheme. These studies will define if furthermonitoring and/or modelling are required.
• Estuarine desk studies reviewing availability ofhydrodynamic and ecological data.
Part 3. Installations and specialist surveys
Initial recommendations include;• Quantity and quality monitoring of the Hun and Wells
Harbour Stream;• Flow accretion surveys of the Burn (below Burnham
gauge) and the Catchwater Drain (Zone 10);• Reconnaissance and gauging of significant springs in
Zones 1,2, 3 and 8;• Salinity monitoring and gauging of freshened tidal
creeks in Zone 2;• Salinity monitoring to identify if any freshening
occurs to tidal creeks in Zones 3, 5, and 8;• Gauging of the Glaven diversion into Blakeney
Freshes;• Down hole logging of selected boreholes in and
around Zone 2 to ascertain if deep ground water flowoccurs in the chalk and may be associated withpossible direct flow to sea;
• Reconnaissance and surveying of boreholes installedon Cley/Salthouse Marshes for investigationsassociated with the tidal flood defence scheme toinclude:– Ground water level monitoring– Depth/salinity profiling to characterise the ground
water salinity regime for the site.
Case studies Case study examples: The North Norfolk Coast 5.2
Environment Agency in partnership with Natural England and Countryside Council for Wales Understanding water for wildlife
< Section divider
This do
cumen
t was
with
drawn o
n 6 N
ovem
ber 2
017.

Case studies Case study examples: The North Norfolk Coast 5.2
Environment Agency in partnership with Natural England and Countryside Council for Wales Understanding water for wildlife
ZoneNorth Norfolk Coast cSAC 1 2 3 4 5 6 7 8 9 10
Coastal lagoons ✓ ✓ ✓
Humid dune slacks ✓ ✓
Otter (probably associated ✓? ? ✓? ✓? ? ? ✓? ✓? ✓? ✓?predominantly with river channels and drains)
Petalwort ? ✓?
ZoneWash and North Norfolk 1 2 3 4 5 6 7 8 9 10Coast cSAC
Atlantic salt meadows ✓ ✓ ✓
(refers in this tableto tidal reedbed)
Mudflats and sandflats not ? ? ? ? ? ? ? ✓ ✓
covered by seawater at low tide (of relevance because of the possible interaction between freshwater and the benthic invertebrate fauna consumed by birds)
ZoneOther habitats 1 2 3 4 5 6 7 8 9 10
Creeks carrying freshwater ✓ ✓ ✓? ✓
through saltmarsh
Freshwater reedbed ✓ ✓ ✓
Freshwater/brackish ✓ ✓ ✓ ✓ ✓ ✓
grazing marshes and associated ditches
Table 1 Distribution of european features in relation to ground water capture/outflow zones
< Section divider
This do
cumen
t was
with
drawn o
n 6 N
ovem
ber 2
017.

Case studies Case study examples: The North Norfolk Coast 5.2
Environment Agency in partnership with Natural England and Countryside Council for Wales Understanding water for wildlife
Zone
/cat
chm
ent
Talli
ed li
cens
e qu
anti
ties
Esti
mat
ed re
chan
ge &
dro
ught
outf
low
qua
ntit
ies
Exce
ed c
rite
ria?
Exce
ed C
rite
ria
& re
cept
or(>
100%
)
GW
Out
flow
rece
ptor
(FAQ
) Ful
l(F
DQ
) Ful
lS
elec
ted
Sel
ecte
dA
vera
geA
quife
r(D
MB
AR )
(DM
5 ) 5
yr(D
M5 )
10y
r(D
M5 )
20y
rFu
llan
nual
Full
daily
100*
100*
cap
annu
alqt
yda
ilyqt
yan
nual
qty
daily
qty
rech
arge
resp
onse
Mea
ndr
ough
tdr
ough
tdr
ough
tqt
y> 2
0yr
qty
> 5yr
(FAQ
/DM
20)
(FAQ
/DM
5 )zo
ne(M
I/d)
(MI/
d)(M
I/d)
(MI/
d)(M
I/d)
func
tion
annu
alm
inim
umm
inim
umm
inim
umdr
ough
tdr
ough
t(%
)(%
)(M
I/d)
(MI/
d)(M
I/d)
(MI/
d)(M
I/d)
min
imum
min
imum
1R.
Hun
(& H
olm
e N
NR)
4.87
11.0
14.
8711
.01
36.5
421
.68
17.0
611
.86
8.29
5.14
NN
94.6
92.8
2Th
ornh
am to
2.
8715
.99
2.69
14.3
927
.88
15.7
011
.21
7.28
4.90
2.54
YY
112.
821
9.7
Dee
pdal
e M
arsh
3R.
Bur
n (&
Bur
nham
2.
6413
.32
1.16
7.55
53.6
532
.81
24.4
916
.40
11.0
96.
21N
N42
.581
.2N
orto
n/O
very
)
4W
ells
Wes
tBan
k0.
111.
790.
000.
0012
.31
8.30
6.56
4.59
3.22
2.02
NN
5.6
38.9
5W
ells
(Har
bour
&0.
010.
020.
000.
004.
281.
050.
540.
360.
240.
14N
N6.
16.
4 S
altM
arsh
)
6W
arha
m to
Sti
ffke
y0.
000.
000.
000.
001.
240.
010.
000.
000.
000.
00N
N0.
00.
0 (S
altM
arsh
)
7R.
Sti
ffke
y10
.30
29.4
410
.05
27.9
145
.41
10.0
88.
856.
283.
902.
16Y
Y47
7.5
468.
9
8M
orst
on M
arsh
es&
0.65
4.86
0.44
1.68
6.27
2.85
1.85
1.27
0.81
0.43
YY
150.
338
1.7
Bla
kene
yFr
eshe
s
9R.
Gla
ven
6.67
19.7
94.
987.
9131
.06
16.7
212
.65
9.23
6.50
4.31
YY
154.
721
4.4
10Cl
ey/S
alth
ouse
0.
151.
320.
141.
317.
363.
151.
360.
970.
690.
46N
Y32
.913
5.8
Mar
shes
Tabl
e 2
Zon
allic
ense
d to
tals
and
com
paris
ons
wit
h ‘n
atur
al’ d
roug
htm
inim
um o
utflo
ws
Lice
nsed
gro
und
wat
er a
bstr
acti
ons
only
< Section divider
This do
cumen
t was
with
drawn o
n 6 N
ovem
ber 2
017.

Case studies Case study examples: The North Norfolk Coast 5.2
Environment Agency in partnership with Natural England and Countryside Council for Wales Understanding water for wildlife
Zone
/cat
chm
ent
Talli
ed L
icen
se Q
uant
itie
sEs
tim
ated
rech
ange
& d
roug
htou
tflo
w q
uant
itie
sEx
ceed
cri
teri
a?Ex
ceed
cri
teri
a &
rece
ptor
(>10
0%)
GW
Out
flow
rece
ptor
(FAQ
) Ful
l(F
DQ
) Ful
lS
elec
ted
Sel
ecte
dA
vera
geA
quife
r(D
MB
AR )
(DM
5 ) 5
yr(D
M5 )
10y
r(D
M5 )
20y
rFu
llan
nual
Full
daily
100*
100*
cap
annu
alqt
yda
ilyqt
yan
nual
qty
daily
qty
Rech
arge
resp
onse
Mea
ndr
ough
tdr
ough
tdr
ough
tqt
y> 2
0yr
qty
> 5yr
(FAQ
/DM
20)
(FAQ
/DM
5 )zo
ne(M
I/d)
(MI/
d)(M
I/d)
(MI/
d)(M
I/d)
func
tion
annu
alm
inim
umm
inim
umm
inim
umdr
ough
tdr
ough
t(%
)(%
)(M
I/d)
(MI/
d)(M
I/d)
(MI/
d)(M
I/d)
min
imum
min
imum
1R.
Hun
(& H
olm
e N
NR)
0.16
1.76
0.14
1.59
36.5
421
.68
17.0
811
.86
8.29
5.14
NN
3.1
14.8
2Th
ornh
am to
0.
314.
830.
201.
1427
.88
15.7
011
.21
7.28
4.90
2.54
NN
12.2
66.4
Dee
pdal
e M
arsh
3R.
Bur
n (&
Bur
nham
0.
000.
000.
000.
0053
.65
32.8
124
.49
16.4
011
.09
6.21
NN
0.0
0.0
Nor
ton/
Ove
ry)
4W
ells
Wes
tBan
k0.
111.
300.
000.
0012
.31
8.30
6.58
4.59
3.22
2.02
NN
5.3
28.3
5W
ells
(Har
bour
&0.
333.
480.
161.
234.
281.
050.
540.
360.
240.
14Y
Y23
3.7
962.
1S
altM
arsh
)
6W
arha
m to
Sti
ffke
y0.
000.
000.
000.
001.
240.
010.
000.
000.
000.
00N
N0.
00.
0 (S
altM
arsh
)
7R.
Sti
ffke
y1.
025.
130.
381.
3345
.41
15.0
88.
856.
283.
902.
16N
N47
.181
.7
8M
orst
on M
arsh
es&
0.00
0.00
0.00
0.00
6.27
2.85
1.85
1.27
0.81
0.43
NN
0.0
0.0
Bla
kene
yFr
eshe
s
9R.
Gla
ven
1.84
14.1
11.
014.
8431
.06
16.7
212
.65
9.23
6.50
4.31
NY
42.7
152.
8
10Cl
ey/S
alth
ouse
0.
030.
870.
000.
007.
363.
151.
360.
970.
690.
46N
N6.
089
.6M
arsh
es
Tabl
e 2
Zon
allic
ense
d to
tals
and
com
paris
ons
wit
h ‘n
atur
al’ d
roug
htm
inim
um o
utflo
ws
Lice
nsed
sur
face
wat
er a
bstr
acti
ons
only
< Section divider
This do
cumen
t was
with
drawn o
n 6 N
ovem
ber 2
017.

Case studies Case study examples: The North Norfolk Coast 5.2
Environment Agency in partnership with Natural England and Countryside Council for Wales Understanding water for wildlife
Zone
/cat
chm
ent
Talli
ed li
cens
e qu
anti
ties
Esti
mat
ed re
chan
ge &
dro
ught
outf
low
qua
ntit
ies
Exce
ed c
rite
ria?
Exce
ed c
rite
ria
& re
cept
or(>
100%
)
GW
Out
flow
rece
ptor
(FAQ
) Ful
l(F
DQ
) Ful
lS
elec
ted
Sel
ecte
dA
vera
geA
quife
r(D
MB
AR )
(DM
5 ) 5
yr(D
M5 )
10y
r(D
M5 )
20y
rFu
llan
nual
Full
daily
100*
100*
cap
annu
alqt
yda
ilyqt
yan
nual
qty
daily
qty
rech
arge
resp
onse
Mea
ndr
ough
tdr
ough
tdr
ough
tqt
y> 2
0yr
qty
> 5yr
(FAQ
/DM
20)
(FAQ
/DM
5 )zo
ne(M
I/d)
(MI/
d)(M
I/d)
(MI/
d)(M
I/d)
func
tion
annu
alm
inim
umm
inim
umm
inim
umdr
ough
tdr
ough
t(%
)(%
)(M
I/d)
(MI/
d)(M
I/d)
(MI/
d)(M
I/d)
min
imum
min
imum
1R.
Hun
(& H
olm
e N
NR)
5.02
12.7
75.
0012
.60
36.5
421
.68
17.0
811
.86
8.29
5.14
NY
97.7
107.
7
2Th
ornh
am to
3.
1820
.82
2.89
15.5
227
.88
15.7
011
.21
7.28
4.90
2.54
YY
125.
028
6.0
Dee
pdal
e M
arsh
3R.
Bur
n (&
Bur
nham
2.
6413
.32
1.16
7.55
53.6
532
.81
24.4
916
.40
11.0
96.
21N
N42
.581
.2N
orto
n/O
very
)
4W
ells
Wes
tBan
k0.
223.
090.
000.
0012
.31
8.30
6.58
4.59
3.22
2.02
NN
10.9
67.2
5W
ells
(Har
bour
&0.
333.
500.
161.
234.
281.
050.
540.
360.
240.
14Y
Y23
9.8
968.
5S
altM
arsh
)
6W
arha
m to
Sti
ffke
y0.
000.
000.
000.
001.
240.
010.
000.
000.
000.
00N
N0.
00.
0 (S
altM
arsh
)
7R.
Sti
ffke
y11
.32
34.5
710
.44
29.2
445
.41
15.0
88.
856.
283.
902.
16Y
Y52
4.6
550.
6
8M
orst
on M
arsh
es&
0.65
4.86
0.44
1.68
6.27
2.85
1.85
1.27
0.81
0.43
YY
150.
338
1.7
Bla
kene
yFr
eshe
s
9R.
Gla
ven
8.51
33.9
05.
9912
.75
31.0
616
.72
12.6
59.
236.
504.
31Y
Y19
7.4
367.
2
10Cl
ey/S
alth
ouse
0.
182.
200.
141.
317.
363.
151.
360.
970.
690.
46N
Y38
.9
225.
4M
arsh
es
Tabl
e 2
Zon
allic
ense
d to
tals
and
com
paris
ons
wit
h ‘n
atur
al’ d
roug
htm
inim
um o
utflo
ws
Lice
nsed
sur
face
& g
roun
d w
ater
abs
trac
tion
sco
mbi
ned
< Section divider
This do
cumen
t was
with
drawn o
n 6 N
ovem
ber 2
017.

Case studies Case study examples: The North Norfolk Coast 5.2
Environment Agency in partnership with Natural England and Countryside Council for Wales Understanding water for wildlife
Figu
re 1
Lic
ense
d su
rfac
e &
gro
undw
ater
abs
trac
tion
sw
ithi
n su
rfac
e ca
tchm
ents
or g
roun
dwat
er c
aptu
re z
ones
< Section divider
This do
cumen
t was
with
drawn o
n 6 N
ovem
ber 2
017.

Case studies Case study examples: The Wash 5.2
Environment Agency in partnership with Natural England and Countryside Council for Wales Understanding water for wildlife
EcologySite typeCoastal
Area of SSSI63,135 ha
SAC featuresThe Wash and North Norfolk Coast cSAC:
• Atlantic salt meadows;• Large shallow inlets and bays;• Mediterranean and thermo-Atlantic halophilous
scrubs (Sarcocornetea fruticosi);• Mudflats and sandflats not covered by seawater at
low tide;• Common seal (Phoca vitulina);• Salicornia and other annuals colonising mud and
sand; and• Sandbanks which are slightly covered by seawater all
the time.
Additional proposed interest includes; Coastal lagoons;Lutra Lutra (otter); and, Biogenic reefs
SPA featuresThis site qualifies under Article 4.1 of the Directive forthe following species listed on Annex I:
• During the breeding season; Common Tern Sternahirundo; Little Tern Sterna albifrons; and MarshHarrier Circus aeruginosus.
• Over winter; Avocet Recurvirostra avosetta; Bar-tailedGodwit Limosa lapponica; Golden Plover Pluvialisapricaria and Whooper Swan Cygnus cygnus.
This site also qualifies under Article 4.2 of the Directivefor migratory species: On passage – Ringed PloverCharadrius hiaticula; Sanderling Calidris alba.
The WashUndertaken/planned investigations
5.2 Case study
Water resourcesSee Figure overleaf.
Geology/geopmorpholgyThe solid geology of the Wash comprises Jurassic Claysto the south and Cretaceous deposits to the north. Ingeneral, the solid geology is hidden beneath theseabed sediments and does not outcrop in the Wash.The drift sediments distribution is complex, being madeup of tidally redistributed Holocene depositscomprising intertidal and sub-tidal muds, sands andgravels. The seafloor is relatively flat throughout muchof the area, generally less than 20m below ChartDatum. However, there is an elongated, steep sideddepression that extends from the Lynn Deeps of theWash to Skate Hole to the north east of the Wash.
Existing surface water and ground water monitoringThere is no ground water monitoring that is directlyrelevant to the Wash.Tidal levels across the Wash are monitored at severallocations by the Environment Agency, ports and otherorganisations. Special investigations have also beenundertaken of tidal currents and offshore wavecharacteristics.In general, river flows to the Wash are not gauged at thetidal limits and flow estimates need to be scaled usingappropriate available data and adjusted to allow for keyinfluences and contributions downstream of gauges.
Source(s) of water supplyIntertidal areas are primarily influenced by diurnal tidalinflow and occasionally, for very large tides, theseinflows inundate the marshes.
Principal riverine inputs- Witham, Welland, Nene andOuse. The latter being the largest. Other relatively minorinputs include those from smaller rivers (Steeping,Wolferton/Ingol and Heacham) and several minorinputs from IDB controlled drainage areas.
< Section divider
This do
cumen
t was
with
drawn o
n 6 N
ovem
ber 2
017.

Level of confidence in the conceptualunderstanding of the siteThe broad hydro-dynamics of the Wash and the relativesignificance of marine/tidal v fluvial processes areadequately understood. Fluvial effects on salinitydistributions are reasonably understood but the linksbetween fluvially influenced sediment distribution andriver flows are poorly understood.
Relationship between ecology and waterresourcesRelationship between european features and watersupplyThe Wash and North Norfolk Coast cSAC: The interestfeatures are primarily influenced by coastal processeswhich affect a variety of environmental conditions suchas the height of sediments in relation to sea levels andsalinity. However, all of the vegetation communities aredominated by halophytic species and thoughfreshwater influences salinity, any effects are likely tobe very localised due to the small size of the inputs andthe incised nature of the channels. Common seals haul-out on sandy beaches to rest, pup and suckle and haveno specific requirement for freshwater flows inintertidal areas. It is considered that freshwater inputshave very little effect on the cSAC interest features thatoccur within intertidal areas of The Wash, and limitedeffect on subtidal features. Recent research hassuggested that a number of species of waterfowl maypreferentially use areas around freshwater flows. Withinthe Wash freshwater inputs arise from the Nene, theOuse, the Welland and the Witham. Bird distribution inthe Wash does not appear to be correlated to theseareas; the detailed studies to demonstrate this arelacking.
The value of freshwater flows on this site to birds islikely to be negligible and is not considered to be amajor factor in determining the abundance ofdistribution of SPA qualifying species. Breeding ternsnest on shingle ridges and feed on small fish in shallowcoastal waters and therefore have no specificrequirement for freshwater. The main influence on theuse of the intertidal areas by most SPA qualifying birdsis likely to be the availability of invertebrate food.Invertebrate abundance appears to be largelyindependent of freshwater input, with the mostproductive areas of mudflat being located in areaswhere the influence of freshwater is likely to beminimal.
What are the potential effects on the site There is considered to be no direct connection ofsignificance between ground water and the Wash.Ground water and related abstractions are indirectly ofimportance because of baseflow contributions toriverflows and related impacts from ground waterdevelopment.
Riverflows are the primary freshwater input to the Wash(particularly from the Ouse, Nene, Welland and Witham).The significance of these inflows to the ecology (InterestFeatures) of the site is not precisely known with tenuouslinks suggested between these inputs and the SPAInterest Features both in terms of providingdrinking/preening habitats and through influences onthe invertebrate food source. Freshwater relatedinfluences on the habitat are also likely to be moresignificantly controlled by impacts on salinity regimeand riverine influences on sedimentation in the Wash.Identification and adequate understanding of theSource-Pathway-Receptor mechanism is furthercomplicated because the freshwater regime may be ofsecondary (or tertiary) importance as controlling factorson the associations to these Interest Features. Tidalregimes, climatic variability, flood defence (tidal andriverine) and water pollution loading potentially havingmore significance than direct quantity related impactsfrom abstractions on riverflow. On this basis, totalriverflows to the Wash have been estimated for bothactual and 'naturalised' flow conditions and the mainabstraction operations (both licensed and non-licensed)identified which contribute to flow impacts which couldpotentially affect the site (see figure showing flowsexpressed as a percentile exceedence graph).
Case studies Case study examples: The Wash 5.2
Environment Agency in partnership with Natural England and Countryside Council for Wales Understanding water for wildlife
< Section divider
This do
cumen
t was
with
drawn o
n 6 N
ovem
ber 2
017.

Case studies Case study examples: The Wash 5.2
Environment Agency in partnership with Natural England and Countryside Council for Wales Understanding water for wildlife
Hazard Nature and Potential impact Likelihood of Consequent risk to Level of confidence(Moreton’s Leam magnitude of on the overall occurrence European featuresand the Washes) potential effects water supply (preliminary assessment only)
on the water supply
Licensed Water Flow & Sediment (med.) Medium Low-medium Low-medium LowAbstractions & Quality (low)
Non Licensed Surface Flow & Sediment (low) Low Low Low LowWater Abstractions
Potential risk due to Environment Agency licensed abstractions and strategic water resources management
RecommendationsFurther investigations required under review ofconsentsAre further hydrological and/or ecologicalinvestigations required to define the impact ofEnvironment Agency consents?
Water resources abstraction licences?• Preening/drinking link for birdlife• Desk study to re-examine possible link between
invertebrates and flow using impacts on salinity andsediment as a surrogate indicator.
Water quality discharge consents? • Nutrient Budget assessments• Eco-toxicological (including in combination)
assessments
< Section divider
This do
cumen
t was
with
drawn o
n 6 N
ovem
ber 2
017.

Case studies Case study examples: The Wash 5.2
Environment Agency in partnership with Natural England and Countryside Council for Wales Understanding water for wildlife
Figure 1. Rivers draining to the Wash
< Section divider
This do
cumen
t was
with
drawn o
n 6 N
ovem
ber 2
017.

Case studies Case study examples: The Wash 5.2
Environment Agency in partnership with Natural England and Countryside Council for Wales Understanding water for wildlife
-20
10 20 30 40 50 60 70 80 90 100
0
20
40
60
80
100
120
140
0
Percetile Exceedence (%ile)
Flo
w (
cum
ecs
)
Gt Ouse (Nat)
Gt Ouse (Actual)
Bed & Ely Ouse (Nat)
Bed & Ely Ouse (Act)
Witham (Nat)
Witham (Actual)
Welland (Scaled Actual)
Nene (Actual)
Nene (Nat)
Steeping (Scaled Actual)
Wolferton (Scaled Actual)
Heacham (Scaled Actual)
Figure 2. Percentile exceedence for freshwater river flows (standard) into the Wash (1991 – 1997)
< Section divider
This do
cumen
t was
with
drawn o
n 6 N
ovem
ber 2
017.

References6
< Main contents
This do
cumen
t was
with
drawn o
n 6 N
ovem
ber 2
017.

References 6
Environment Agency in partnership with Natural England and Countryside Council for Wales Understanding water for wildlife
The references listed below are referred to within this guideline document but do not repeat those referencesseparately listed within the summaries given in Sections 2.2, 2.3 and 4.5 of this document.
English Nature, Scottish Natural Heritage, Countryside Council for Wales & Environment and Heritage ServiceNorthern Ireland; Guidelines for Managing Water Quality Impacts within UK European Marine Sites; supported byEC's LIFE programme; Oct. 1999.
Environment Agency; A Wetland Framework for Impact Assessment at Statutory sites in Eastern England; R&DTechnical Reports W6-068/TR1 (& TR2); University of Sheffield (Wetlands Research Group); 2001
Journal of Environmental Management; Wetland Hydrological Vulnerability and the Use of ClassificationProcedures: a Scottish Case Study; D.J. Gilvear and R.J. McInnes; 1994; Vol. 42 (p 403-414).
National Rivers Authority; Wetland Resource Evaluation and the NRA's Role in it's Conservation: 2 Classification ofBritish Wetlands; B.D. Wheeler and S.C. Shaw; R&D Note 378; 1995.
Water Quality Assessments (1992); A Guide to the use of Biota, Sediments and Water in EnvironmentalMonitoring; published for UNESCO/WHO/UNEP by Chapman & Hall Ltd.ISBN 0 412 44840 8.
6. References
< Section divider
This do
cumen
t was
with
drawn o
n 6 N
ovem
ber 2
017.

Glossary ofabbreviations7
< Main contents
This do
cumen
t was
with
drawn o
n 6 N
ovem
ber 2
017.

Glossary of abbreviations 7
Environment Agency in partnership with Natural England and Countryside Council for Wales Understanding water for wildlife
CCW Countryside Council for Wales
CEH Centre for Ecology and Hydrology
cSAC Candidate for Special Area of Conservation under the Habitats Directive
SAC Special Area of Conservation under the Habitats Directive
Interest features (also referred to as European interest features or European features); is the
common term for the range of qualifying habitats and species under the Habitats
Directive (or Habitats Regulations in England and Wales)
JNCC Joint Nature Conservation Committee (serving the individual nature conservation
Regulatory Authorities for England, Wales, Scotland and Northern Ireland)
LIFE projects Constitute a series of EU funded projects aimed at establishing the conservation
requirements for interest features at UK cSACs
R&D Research and development
source – pathway – receptor
mechanism/concept (See Section 3.4 for description)
SPA Special Protection Area under the Wild Birds Directive
SSSI Site of Special Scientific Interest
RSA Restoring Sustainable Abstraction
BAP Biodiversity Action Plan
PSA Public Service Agreement
7. Glossary of abbreviations
< Section divider
This do
cumen
t was
with
drawn o
n 6 N
ovem
ber 2
017.

GEHO0407BMNB-E-E
Environment first: If you need to print this pdf publication,please only print the sections you need and where possible
select the double sided printing option.
Would you like to find out more about us,or about your environment?
Then call us on 08708 506 506 (Mon-Fri 8-6)
or visit our website www.environment-agency.gov.uk
incident hotline 0800 80 70 60 (24hrs)
floodline 0845 988 1188
Partner contact detailsNatural England Northminster House, Peterborough PE1 1UA
Countryside Council for Wales Maes-y-Ffynnon,Penrhosgarnedd, Bangor, Gwynedd LL57 2DW
< Main contents
This do
cumen
t was
with
drawn o
n 6 N
ovem
ber 2
017.