Wireless Sensor Networks and their Impact on Municipal ...
50
Wireless Sensor Networks and their Impact on Municipal Parking Strategy 1 Glenn Caldwell 2018 Wireless Sensor Networks and their Impact on Municipal Parking Strategy Glenn Caldwell Wollongong, New South Wales, Australia [email protected] 25 th March 2018 The information contained in this document is not to be implied as being made to any third party. All surveys, forecasts and recommendations are made in good faith and on the basis of the information available. It is expected that the assumptions used in connection with the report will be reasonable and no representations or warranties, express or implied, will be given that these future matters will occur. This study is not meant to advocate a particular brand of sensor over any other, whether the reader interprets this to be the case within the context of this report, or otherwise. © Glenn Caldwell; 2018 Version No. Author Reviewed by: Date of issue: 1 Glenn Caldwell A. Mohammad 28 th January 2018 2 Glenn Caldwell 6 th February 2018 3 Glenn Caldwell 19 th February 2018 4 Glenn Caldwell 1 st March 2018 5 Glenn Caldwell
-
Upload
khangminh22 -
Category
Documents
-
view
1 -
download
0
Transcript of Wireless Sensor Networks and their Impact on Municipal ...

Wireless Sensor Networks and their Impact on Municipal Parking Strategy
1
Glenn Caldwell 2018
Wireless Sensor Networks and their Impact on Municipal Parking
Strategy
Glenn Caldwell
Wollongong, New South Wales, Australia
25th March 2018
The information contained in this document is not to be implied as being made to any third party. All surveys,
forecasts and recommendations are made in good faith and on the basis of the information available. It is
expected that the assumptions used in connection with the report will be reasonable and no representations
or warranties, express or implied, will be given that these future matters will occur. This study is not meant to
advocate a particular brand of sensor over any other, whether the reader interprets this to be the case within
the context of this report, or otherwise.
© Glenn Caldwell; 2018
Version No. Author Reviewed by: Date of issue:
1 Glenn Caldwell A. Mohammad 28th January 2018
2 Glenn Caldwell 6th February 2018
3 Glenn Caldwell 19th February 2018
4 Glenn Caldwell 1st March 2018
5 Glenn Caldwell

Wireless Sensor Networks and their Impact on Municipal Parking Strategy
2
Glenn Caldwell 2018
CONTENTS
ABSTRACT ............................................................................................................................................... 3
ABBREVIATIONS & DEFINITIONS ........................................................................................................... 4
INTRODUCTION TO PARKING SENSOR TECHNOLOGY ........................................................................... 5
THE IMPORTANCE OF ACCURACY ........................................................................................................ 10
BACKGROUND TO SENSOR ERRORS .................................................................................................... 12
PARKING SENSOR TECHNOLOGY ......................................................................................................... 17
SENSOR PERFORMANCE IN AUSTRALIA .............................................................................................. 34
ECONOMIC ASSESSMENT OF SENSORS ............................................................................................... 40
HOW TO EVALUATE SENSORS – THE BENEFITS OF FIELD TRIALS ........................................................ 45
CONCLUSIONS AND NEXT STEPS .......................................................................................................... 47
LIMITATIONS......................................................................................................................................... 49
REFERENCES .......................................................................................................................................... 49
FURTHER READING ............................................................................................................................... 49
ABOUT THE AUTHOR ............................................................................................................................ 50

Wireless Sensor Networks and their Impact on Municipal Parking Strategy
3
Glenn Caldwell 2018
ABSTRACT
The purpose of this paper is to understand the performance of various in-ground sensor
technologies and how this can impact the effectiveness of on-street parking management. This will
extend to a discussion of the social and economic benefits of introducing sensors into a congested
Town Centre.
Smart Cities (Sometimes referred to as Digital Cities), is the contemporary thinking with regards to
Municipal Management of assets. However most local government executives are rarely furnished
with the correct information as to how this can be implemented in a robust and integrated fashion.
Integration is the basic premise to this concept; however further scrutiny of various vendor’s
solutions shows they often have a very disaggregated architecture with a common marketing angle –
not a common IT platform.
In-ground Parking sensors are being heavily marketed as a key part of the Smart City solution,
however each vendor provides widely varying levels of performance which is not measured against
recognised standards.
Parking sensors provide two principle functions: (1) Real Time information of parking occupancy –
useful for parking guidance applications; (2) Improved enforcement efficiencies.
Each type of sensor tends to perform better on one of these aspects over the other. However with
the proliferation of nano-watt powered circuit boards and improved technology, sensors are starting
to excel at both Occupancy and Enforcement.
This paper explores the three most common technologies used in this field:
1. Infrared
2. Magnetometers
3. Nano-radar
The preliminary findings of this study indicate that the most accurate solution in the market will be
the emerging Nano-radar technology. However some magnetometers are performing extremely well
and will likely be equally suitable as a long-term solution.
Nano-Radar is much more expensive to procure than magnetometers. This is likely a result of the
significant research required to overcome its complexities – thereby reducing the number of suitable
chip manufacturers. However in the long term, as this solution is based on commonly available
electronics, is expected to become more cost effective.
Infrared technologies appear non-viable despite their long history in commercial applications.
Therefore its vendors have resorted to including a backup magnetometer as part of their sensor
solution. Considering that there are magnetometer providers that rely solely on one technology type
(and are performing well), it should be considered unnecessary to operate a sensor with both an
Infrared sensor and a Magnetometer.

Wireless Sensor Networks and their Impact on Municipal Parking Strategy
4
Glenn Caldwell 2018
Parking sensor performance in Australia varies widely. Some Municipalities experience an overall
accuracy of 75% in sensor performance. Some experience 97% – 98%. Others have mixed levels of
accuracy depending on the average turnover of vehicle movements occurring across the sensor.
Many Municipalities have installed large networks of sensors only to find their performance slipping
dramatically after 2 years (or less) once the batteries start to drain or the electronics deteriorate.
This adds a high level of risk to the average Council that is trying to demonstrate initiative in regard
to Smart City Solutions.
Sensors are expected to provide great benefit to Municipalities that suffer excessive parking
demand. The obvious benefit includes an improvement to enforcement efficiency. However it is
evident from existing case studies around the world, that technology can be used to improve parking
turnover - which has shown to reduce ‘parking search times’, kilometres travelled looking for a
space’ and ‘vehicle emissions’. These alone may support the introduction of in-ground parking
sensors.
Therefore it is recommended to undertake detailed trials of sensor technology - keeping in mind the
principles of the technology and how best to evaluate it.
ABBREVIATIONS & DEFINITIONS
VMS: Variable Message Sign
ANPR: Automatic Licence Plate Recognition
BCA: Benefit Cost Analysis
PGS: Parking Guidance System
UWB: Ultra-Wide band
Resolution: Ability to detect a signal through noise
Nano Watt: (10-9) of a watt
Hertz: Unit of Frequency in cycles per second (Hz)
GHz: (1,000,000,000) Hertz
ITS: Intelligent Transport Systems
IoT: The Internet of Things
ALoS: Average Length of Stay
AMR: Anisotropic Magneto-resistor
LTE: Long Term Evolution. high-speed wireless communication for mobile devices e.g. 4G
LTE

Wireless Sensor Networks and their Impact on Municipal Parking Strategy
5
Glenn Caldwell 2018
INTRODUCTION TO PARKING SENSOR TECHNOLOGY
Municipalities across the world have been progressively (sometimes cautiously) implementing
solutions to manage and improve the utilisation of their limited parking spaces. This is now being
intensified with the proliferation of ‘Smart City’ Strategies and the ‘Internet of Things (IOT)’. This has
led to smarter ways to improve lighting efficiency, waste removal efficiencies, and many other
council services. Sensors are now becoming increasingly popular as a means of providing real time
data across a wide variety of applications.
Metered pay parking has often been used as a means of ensuring better parking turnover, while
providing a means to recoup the social cost of parking. The issue with pay parking is that it can be
viewed as a heavy-handed approach and therefore as a first-line measure, Councils sometimes
consider in-ground parking sensors.
Parking sensors are relatively inexpensive and in recent years have improved markedly in regard to
their performance. It is understood that Councils have been trialling parking sensors within their
respective Municipalities with varying levels of success. Many more Jurisdictions are now intending
to expand their sensors as part of a broader parking strategy that often includes parking guidance.
To manage high occupancy streets around the fringe of the CBD, parking sensors may be a viable
option to encourage improved parking turnover and therefore maximize utilization. Parking sensors
cost an estimated $100+ to $500 per bay installed and would need to provide a return on
investment – at least in respect to reducing the ‘social cost of congestion and parking’. It is often
reasonable to install sensors where there are no pay parking controls.
__________________
Evaluating any proposed sensor solution based on case studies is a very delicate exercise. The case
study data will often claim a significant improvement in enforcement compliance and revenue. This
is often misleading as there is no certain way of knowing what sort of enforcement was previously
employed. Quite often, smaller under-resourced parking authorities exercise minimal enforcement
of parking restrictions; therefore, the introduction of any kind of solution will create a quantum
change in driver behaviour based on the ‘perceived’ increase in enforcement measures.
In assessing a particular bay sensing technology, it is important to note the accuracy of the sensor
technology in managing occupancy and session accuracy (these will be discussed later). The best
reference would be to see if the technology has been audited independently for technical accuracy.
Parking Guidance Systems are often linked to parking sensors. Parking Guidance Systems collate the
real-time occupancy data from sensors - which is displayed on Variable Message Signs. Parking
Guidance is a fast-growing trend globally and is now recognised as an effective local area traffic
management measure.
Wireless Sensor Networks and their Impact on Municipal Parking Strategy
6
Glenn Caldwell 2018
STANDARDS
As this is an emerging technology, there is no formal set of standards relating to the manufacture,
deployment and maintenance of parking sensors specifically. However there are many institutions
that provide regulation on electronic devices with respect to environmental resilience and
communication protocols, some include the following:
Institute of Electrical and Electronics Engineers (IEEE) Standards Association
IEEE 802.19 Wireless Coexistence Technical Advisory Group
Federal Communications Commission FCC 02-48
Australian Communications and Media Authority (ACMA)
IEC Standard 60529 – Ingress Protection Standards (IP rating)
These standards are applicable to specific components of a given sensor solution – not the sensor
overall.
Hence clear definitions relating to common sensor-related concepts of “accuracy” and “latency” are
never defined. This lack of a centralised standard for parking sensor performance gives vendors an
unbridled marketing channel to claim almost anything to the potential customer.
This results in sensor networks with little enforcement value - yet some parking guidance value
where accuracy does not count as much.
THE INTERNET OF THINGS
Many industry experts have predicted that within 5 years there will be hundreds of millions of IoT
sensors and devices communicating in the radio spectrum. These devices will be used for both
commercial and residential purposes and will require reliable networked radio communication.
Some Municipalities are now adopting better platforms to accommodate the rise of the IoT.
Denmark for example have rolled out a Sigfox communication platform that can support multiple
low powered devices with an open-source platform for developers to integrate.
Some parking sensor vendors may claim to have their technical direction well-aligned with the IoT
trend. This may include claims their sensors will be expanded to other applications such as lighting
and waste collection. Sensor Manufacturing companies may have a good level of integration with
various third-party systems (such as parking applications, pay by phone and third-party management
systems); however if their sensor does not work that well, then their baseline solution is weak.
Alternatively a sensor manufacturer that has a high performing sensor, can simply outsource their
integration needs to third-party providers that specialise in networked solutions. The sensor
manufacturer is then free to focus on what they do well - electrical engineering, firmware, etc…
Specialised sensor manufacturers can even outsource the management system functions and
reporting tools to third party parking providers that have more advanced online databases.
Finally, low power communication is vital to the success of any IoT strategy. This is one of the key
items of discussion within this paper.

Wireless Sensor Networks and their Impact on Municipal Parking Strategy
7
Glenn Caldwell 2018
THE IMPORTANCE OF DISCRETE DESIGN
In-ground sensors are often installed within Road Dense Grade Asphalt – which is 175mm thick.
Ideally the cost to remove old sensors (and make good) is a major aspect to the overall risk of the
sensor solution.
Sensors should be relatively small and be easy to install in the road base.
If the sensor solution is to be installed within a multi-deck car park, it is preferable that the sensor
can be drilled into the slab with a standard drill bit – rather than core drilled. Core drilling is typically
not recommended for suspended concrete slabs.
INTRODUCTION TO THE TYPES OF WIRELESS SENSOR TECHNOLOGIES
The ever-increasing level of car ownership, combined with limited road capacity, has spurred
engineers to devise innovative technical solutions to better manage transport systems. Intelligent
Transport Systems (ITS) has evolved over the past two decades to become a highly specialized area
of expertise that involves the application of modern technology within urban transportation
networks. In relation to sensors, the growth rate of occupancy (bay) sensors is estimated to be in the
vicinity of 14% per annum worldwide [Market&Markets, 2013].
Sensor technology comes in a variety of forms and has been used for a wide range of solutions
within the manufacturing sector’s production line applications. In conjunction with greatly improved
semiconductor technology, the following sensor technology categories are considered the most
commonly used for in-ground applications:
1. Infrared (Active)
2. Magnetometer
3. Micro/Nano radar
Infrared Sensors
Infrared Sensors can either be passive infrared (like a home security sensor), or be active whereby a
beam is transmitted by an LED.
Parking Sensors require an Active Infrared Sensor comprising an LED (Emitter) and Photo-Electric
Diode (Receiver). This is often seen as a pair of LEDs – one white/translucent and one black. The bulk
of the sensor is under the road surface - yet the top surface is exposed to allow light to travel.
These sensors have evolved over time to include Time-of-Flight solutions to remedy the common
issues associated with ranging, debris and leaves that occlude the LEDs.
Magnetometers
Magnetometers have been developed over several decades and are now regarded as one of the
most sensitive measuring devices in relation to the earth’s magnetic field. The technology used for
sensors is designed to measure subtle changes to the earth’s magnetic field as result of a large piece
of metal moving over the parking space. Magnetic sensors have three dimensional reads (x, y and z
axis). Although they were somewhat inaccurate years ago, the read accuracy has been enhanced
through the application of improved algorithms and componentry.
Wireless Sensor Networks and their Impact on Municipal Parking Strategy
8
Glenn Caldwell 2018
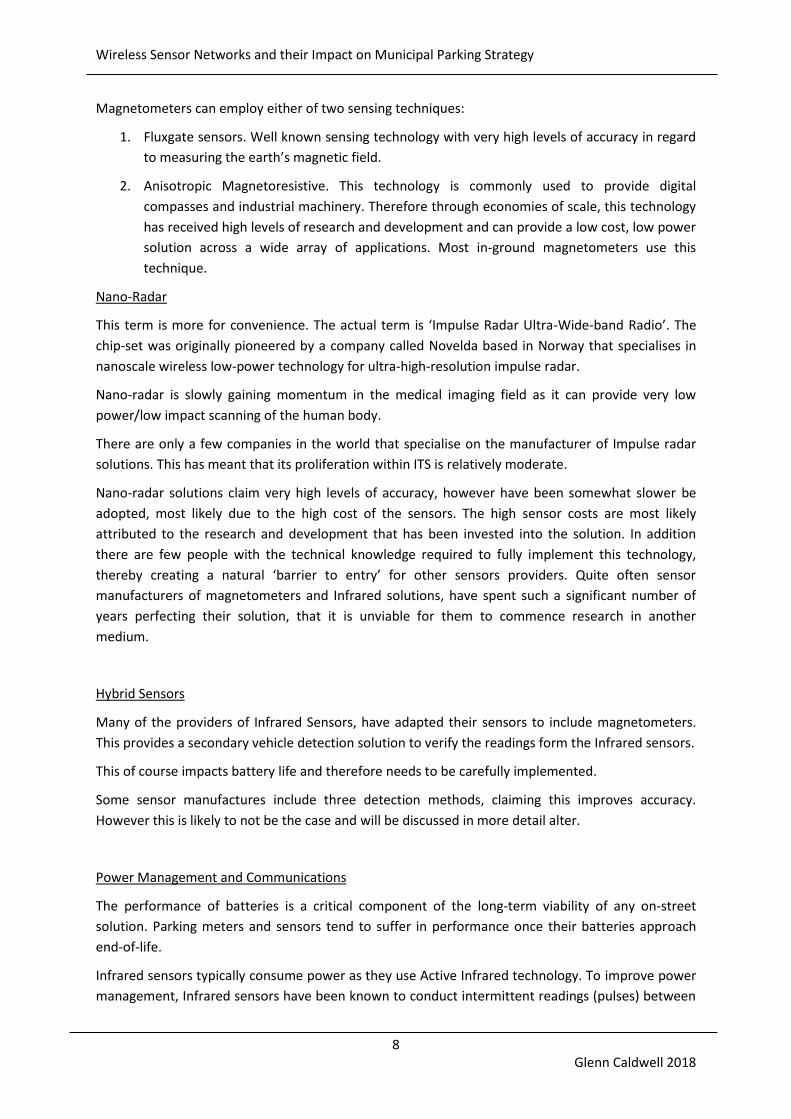
Magnetometers can employ either of two sensing techniques:
1. Fluxgate sensors. Well known sensing technology with very high levels of accuracy in regard
to measuring the earth’s magnetic field.
2. Anisotropic Magnetoresistive. This technology is commonly used to provide digital
compasses and industrial machinery. Therefore through economies of scale, this technology
has received high levels of research and development and can provide a low cost, low power
solution across a wide array of applications. Most in-ground magnetometers use this
technique.
Nano-Radar
This term is more for convenience. The actual term is ‘Impulse Radar Ultra-Wide-band Radio’. The
chip-set was originally pioneered by a company called Novelda based in Norway that specialises in
nanoscale wireless low-power technology for ultra-high-resolution impulse radar.
Nano-radar is slowly gaining momentum in the medical imaging field as it can provide very low
power/low impact scanning of the human body.
There are only a few companies in the world that specialise on the manufacturer of Impulse radar
solutions. This has meant that its proliferation within ITS is relatively moderate.
Nano-radar solutions claim very high levels of accuracy, however have been somewhat slower be
adopted, most likely due to the high cost of the sensors. The high sensor costs are most likely
attributed to the research and development that has been invested into the solution. In addition
there are few people with the technical knowledge required to fully implement this technology,
thereby creating a natural ‘barrier to entry’ for other sensors providers. Quite often sensor
manufacturers of magnetometers and Infrared solutions, have spent such a significant number of
years perfecting their solution, that it is unviable for them to commence research in another
medium.
Hybrid Sensors
Many of the providers of Infrared Sensors, have adapted their sensors to include magnetometers.
This provides a secondary vehicle detection solution to verify the readings form the Infrared sensors.
This of course impacts battery life and therefore needs to be carefully implemented.
Some sensor manufactures include three detection methods, claiming this improves accuracy.
However this is likely to not be the case and will be discussed in more detail alter.
Power Management and Communications
The performance of batteries is a critical component of the long-term viability of any on-street
solution. Parking meters and sensors tend to suffer in performance once their batteries approach
end-of-life.
Infrared sensors typically consume power as they use Active Infrared technology. To improve power
management, Infrared sensors have been known to conduct intermittent readings (pulses) between

Wireless Sensor Networks and their Impact on Municipal Parking Strategy
9
Glenn Caldwell 2018
15 second and 30 second intervals. This can lead to missing some vehicle movements as busy car
parks tend to attract rapid turnover of spaces – thereby the sensor will think a car has continued to
park despite there being a change in vehicle.
Sensor networks have fast adopted low power communication protocols such as LoRaWAN to
provide a viable network architecture for their sensors – while maintaining battery life.

Wireless Sensor Networks and their Impact on Municipal Parking Strategy
10
Glenn Caldwell 2018
THE IMPORTANCE OF ACCURACY
The Sensor’s ability to maintain accurate reads over its product lifecycle, is of prime importance. The
level of accuracy is always being increased due to ongoing technical improvements, however this
places greater pressure on power management. The following are some of the key drivers of high
accuracy:
1. Occupancy accuracy. This is a simple accuracy measure that is defined as “The sensor’s
ability to accurately detect if a vehicle is present above it”. A sensor will take readings at
predefined intervals. And for each of the sensor’s readings, it is important to know the % of
times that it correctly reads the presence of a vehicle (or vacancy) – compared to the total
number of readings.
2. Session Accuracy. This is defined as the sensor’s capability in regards to ‘proving’ that the car
has been present and stationary for a set period of time. For example, if a car has parked for
2-hours and the sensor correctly reports it as having stayed for 2-hours – then the parking
session has been read accurately. If the sensor reports that the same car has parked for 2-
hours, but in fact the parking space has turned over twice – then the parking session has not
been read accurately. This can occur in busy shopping centres, where as soon as a car exits a
space – there is another car ready to pull in. Sensors that do not detect this kind of vehicle
turnover may have reasonably good occupancy accuracy, but poor session accuracy. Session
accuracy is critical for enforcement, while occupancy accuracy is satisfactory for parking
guidance.
3. Zeroing out parking time on Parking Meters. Multi-space parking meters are often
frustrating to motorists as they sometimes park at a meter only to find they cannot pay the
parking fee until the previous driver’s sessions has expired. Highly calibrated sensors can
notify the meter the car has left and thereby cancel out the parking session. However
another issue exists whereby a vehicle may in fact be parked - yet the sensor detects a
movement thereby falsely cancelling out the parking session at the meter. If the
Municipality intends to integrate their sensor system with parking meters, then sensor
accuracy must exceed 99%.
4. Parking enforcement. If a sensor is 80% accurate, then it must be certain which 80% of the
sensors are reading with 100% certainty. An enforcement officer may choose to not infringe
on an overstaying vehicle, however must know when the sensor data is reliable at least.
5. Parking guidance issues in busy areas. Sensors generally have a latency of say 30 seconds
between the detection of a vehicle movement and it being noted on the management
system. If parking sensors were to be integrate to a parking guidance system, then the
latency will need to be factored in. Sometimes a motorist will have a parking app showing
the available bays, however when they arrive at a selected parking bay, it may have become
occupied in the intervening time.
6. Prevent meter feeding. People are known to return to the meter to top up their session,
thereby overstaying the allowable restrictions. This relates to Point 1 above, in that sensors
can be designed to integrate with meters - restricting a person from topping up the meter if

Wireless Sensor Networks and their Impact on Municipal Parking Strategy
11
Glenn Caldwell 2018
they have stayed up to their allocated time limit. However once again, sensor accuracy must
exceed 99%.
7. Eventually the wrong sensor that is highly inaccurate, cannot be replaced easily if it is
embedded well into the road – requiring major make-good works to replace them.

Wireless Sensor Networks and their Impact on Municipal Parking Strategy
12
Glenn Caldwell 2018
BACKGROUND TO SENSOR ERRORS
This section provides a background into the common types of errors with sensors and how these are
categorised.
1. False positives. The sensor detects a vehicle, however in reality no vehicle is present.
2. False negatives. The sensor assumes no vehicle present (vacancy), however a vehicle is
present.
3. Failed to detect vehicle movement. The sensor accurately detected the presence of a vehicle
at time (t1) and at time (t3), however did not detect a shuffling of cars in and out of the
space at the intervening time (t2).
4. Non-communication from the sensor to the network (No data sent)
The cause of sensor error rates depend largely on the technology being used as well as the amount
of research and development the vendor has invested in their solution.
Based on experience, the most common type of error is the ‘False Negative’, due to its dependence
on an output signal and a receiving signal. Over time sensors start losing power which impacts their
ability to detect – thus they become ‘locked’ into reporting a vacancy.
False Positives can mean that the sensor is over tuned to be too sensitive and will flag any sudden
aberration in the signal.
The third form of error (Failure to detect vehicle movement), is a common problem with sensors
that do not conduct measurements frequently enough.
The fourth error can relate to the network architecture and not always the sensor technology;
however the correct choice of communication protocols can resolve most of this.
Some sensor vendors have chosen to use two (or three) sensor mediums. These are usually a
combination of Infrared and Magnetometer sensors. In this scenario they claim to have improved
overall accuracy of the device as there is now the ability to cross check reads. However this is likely
to consume battery power as well as require complicated software to reconcile the reads. The
following table (overleaf) provides a ‘set of probabilities’ for all scenarios. The data set is based on
the assumption that each individual sensor (Infrared or Magnetometer) is proven to be
independently accurate to 90%. Therefore assuming that a parking space has a 50% chance of being
either occupied or vacant (i.e. 50% parking occupancy), then the probability of both sensors reading
the presence of a vehicle correctly is: 0.9 x 0.9 x 0.5 = 0.405 (40.5%).

Wireless Sensor Networks and their Impact on Municipal Parking Strategy
13
Glenn Caldwell 2018
Table 1 - Table of Probabilities for dual sensor system
Infrared Reading Magnetometer Reading Probability (p)
Infrared Correct Negative Magnetic Correct Negative 40.5%
Infrared Correct Positive Magnetic Correct Positive 40.5%
Infrared False Negative Magnetic False Negative 0.5%
Infrared False Positive Magnetic False Positive 0.5%
Infrared Correct Negative Magnetic False Positive 4.5%
Infrared False Negative Magnetic Correct Positive 4.5%
Infrared Correct Positive Magnetic False Negative 4.5%
Infrared False Positive Magnetic Correct Negative 4.5%
Infrared False Positive Magnetic False Negative N/A
Infrared False Negative Magnetic False Positive N/A
Infrared Correct Positive Magnetic Correct Negative N/A
Infrared Correct Negative Magnetic Correct Positive N/A
100.0%
Let’s assume that out of the two sensors, the Infrared sensor was the master sensor, and the
magnetometer was the crosscheck sensor. Then totalling the green shaded areas of (p), we arrive at
90%, i.e. the second sensor has not increased overall accuracy. However in an enforcement
situation, the officer can rely on the sensor 81% of the time (0.9 x 0.9), as the system can provide a
level of confidence that there was a vehicle present, provided both sensors report a consistent
positive reading. Conversely there is a 1% chance that BOTH sensors incurred the same error of a
false positive or a false negative (i.e. 0.1 x 0.1 = 0.01 = 1%) resulting in an invalid infringement notice
being issued.
The above scenario can only be improved upon with algorithms that include ‘fuzzy logic’ which could
be defined in a number of ways. Generally speaking fuzzy logic employs multivalued logic to provide
a ‘likely’ outcome – rather than an absolute outcome. This is quite useful for reporting on vehicle
occupancy. Additionally the sensor may be configured so that the magnetometer could be taking a
few measurements per second at low power; and once it detects a perturbation, will initialise the
infrared sensor to verify the change in state (i.e. a vehicle movement).
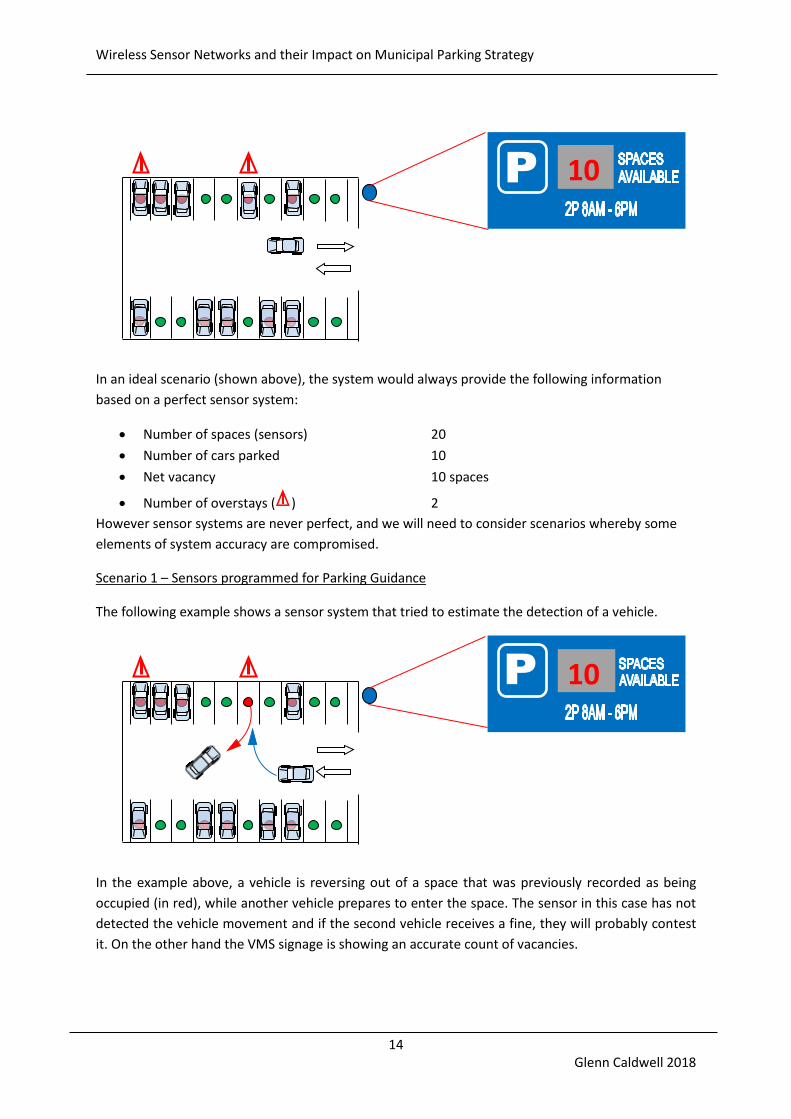
If we consider an example of using an inaccurate sensor technology on a small 20-space car park
(pictured below), we can better understand the useability of the data.
Wireless Sensor Networks and their Impact on Municipal Parking Strategy
14
Glenn Caldwell 2018
In an ideal scenario (shown above), the system would always provide the following information
based on a perfect sensor system:
• Number of spaces (sensors) 20
• Number of cars parked 10
• Net vacancy 10 spaces
• Number of overstays ( ) 2
However sensor systems are never perfect, and we will need to consider scenarios whereby some
elements of system accuracy are compromised.
Scenario 1 – Sensors programmed for Parking Guidance
The following example shows a sensor system that tried to estimate the detection of a vehicle.
In the example above, a vehicle is reversing out of a space that was previously recorded as being
occupied (in red), while another vehicle prepares to enter the space. The sensor in this case has not
detected the vehicle movement and if the second vehicle receives a fine, they will probably contest
it. On the other hand the VMS signage is showing an accurate count of vacancies.
10
10

Wireless Sensor Networks and their Impact on Municipal Parking Strategy
15
Glenn Caldwell 2018
Scenario 2 – Sensors programmed for enforcement
The following shows the impact of a sensor solution tuned for accuracy
The above scenario has correctly identified the vehicle movement and there is no alarm for an
overstay. However as the sensitivity rules applied to the sensor’s microprocessor will reject the
presence of some vehicles - there is sometimes doubt that the space is occupied (as indicated by the
green arrow above). This assists the rangers with respect to ensuring that any vehicle that is deemed
to have overstayed – is true at a high level of certainty.
Referring back to Table 1, we can now speculate how a sensor manufacturer can develop a hybrid
sensor that has a high degree of certainty with respect to overstays (rather than estimating
occupancy). If the parking ranger needed certainty that a car had parked for a 2 Hour period, then
the sensor may be configured to only assume that a space is occupied under the following scenario:
• The magnetic sensor (which can take 2 – 3 measurements per second) states that there has
been a car there for 2 hours or more. The magnetic sensor will most likely detect if there has
been a sudden vehicle movement.
• The Infrared sensor also states there is a car present consistently over this 2-hour period
(The Infrared sensor takes a measurement every 15 – 30 seconds).
• The probability of the above is no longer 90% - it is 90% x 90% or 81% of the sensors will
detect a correct 2-hour duration of stay – with a higher level of confidence
Sensor manufacturers that only use one sensing method (e.g. Magnetometer), may have issues with
detecting a vehicle movement. This is due to the sensor not having a high level of resolution. This
issue is covered in more detail later. However it is worth noting that a poorer quality magnetic
sensor may be tuned to only alert of an overstay IF there is clear resolution above a certain
threshold. That is, if it is very certain there is a car there, despite ambient noise confusing the signal.
This means a poorer quality sensor may not detect a smaller vehicle made of low ferrous material
(aluminium), and therefore will not report this to the system.
12

Wireless Sensor Networks and their Impact on Municipal Parking Strategy
16
Glenn Caldwell 2018
GROUND TRUTHING DATA
Some vendors attempt to constantly improve the accuracy of their sensors - often this is by making
minor adjustments to the hardware (antennas, battery etc…), Communication protocols (LoRa), or
most importantly the software.
By applying different algorithms into the sensor software, it is possible for the sensor make better
decisions in regard to flagging the presence of a vehicle. The sensor manufacturer must constantly
find ways to improve the resolution of the signal.
The best method is to review video footage of parking areas that include the vendor’s sensors. The
technical team can then compare actual vehicle movements against the readings from each sensor.
They can then note the presence of external noise factors that may have interfered with the reading
(e.g. presence of a large truck nearby). In addition they can investigate the impacts that different
model of vehicles will have on the sensor’s ability to reflect a signal.
Ground truthing must address the accuracy of: the read rate; the stability of the read rates for a
vehicle that remains parked for an extended time; vehicle movements.

Wireless Sensor Networks and their Impact on Municipal Parking Strategy
17
Glenn Caldwell 2018
PARKING SENSOR TECHNOLOGY
This section deals with the technical aspects of each commonly used parking technology. This
section will address the basics of the technology and the underlying issues and limitations of each
technology and how this can be addressed in a low power application.
There are a few key attributes that contributes to a successful sensor technology. These include:
1. Power Management
a. Base line consumption (including sleep modes and boot phase)
b. Detection power consumption
c. Communication power consumption
2. Communication protocol being used - including its Link Budget
3. Management of noise – resolution in regard to detecting a vehicle against background
interference.
Across the various technical solutions, the main challenge seems to fall on Power Management. This
impacts every aspect of the solution and how it will perform over the long term.
1. ACTIVE INFRARED SENSORS
Infrared sensors are one of the simplest technologies to develop, however is quite complex to
advance into a high-performance solution.
The basic operation of an Infrared Sensor is referred to as Opto-Coupling which is a circuit that
includes a Light Emitting Diode (LED) and a Photelectric Diode (light sensitive semiconductor).
The circuit sends a very short pulse of light from the LED which is reflected off a surface and received
by the Photelectric diode. The level of reflectance above a certain threshold will trigger a sensor
event. The Photoelectric diode is black so negates the effects of natural light and absorb Infrared
light only.
As the level of reflectance increases, the amount of energy hitting the photoelectric semiconductor
increases thereby creating a greater flow of current within the circuit. The level of reflectance is
affected by a number of things, mainly proximity. That is, the closer the object is from the emitting
LED, the more concentrated will be the level of reflectance.
Early Infrared sensors were housed in a simple sensor node covered with a lens. See diagram below:

Wireless Sensor Networks and their Impact on Municipal Parking Strategy
18
Glenn Caldwell 2018
Figure 1 Basic Opto Coupler
This type of sensor encountered several technical issues including the following:
• Damage to the lens cover through scratching.
• Leaves and debris covering the LED
• Additional occlusion from the ageing of the lens.
These sensors were improved upon to include exposed (but recessed) LEDs as per the diagram
below. Some of these had a dome shape to assist the deflection of debris. However some are almost
flush mounted.
Figure 2 Recessed Opto coupler
Base of Vehicle
Bitumen Bitumen
Base of Vehicle
Bitumen Bitumen

Wireless Sensor Networks and their Impact on Municipal Parking Strategy
19
Glenn Caldwell 2018
Infrared Sensors would typically experience the following issues:
• Varying reflectance of surfaces. Although the colour of a surface has little to do with this
(colour is in the natural light spectrum), some surfaces tend to be better reflectors than
others.
• In addition the undercarriage of cars includes chrome pipes, multiple cavities for the engine,
matt surfaces, shiny surfaces all at varying angles - creating a dispersion of light.
• The level of reflectance in regard to the wave. Poorly designed Opto-couplers will include
Infrared emitters operating at wavelengths that are offset from what Photoelectric sensors
can detect. The optimum wave length for an Infrared emitter is closer to 850 Nano-meters
• Some interference form rainfall and ambient light
Infrared Sensors require a low duty cycle with a simple “On-Off” Pulse (or set of pulses) at about 2
milliseconds and a subsequent low standby charge of a few microamps. To conserve power Infrared
sensors must only send out a detection pulse every 5 seconds - or as infrequent as 30 second
intervals.
These extended intervals between measurements causes concern as it is likely to miss detection of
vehicles that shuffle (one unparks and another immediately parks in the space). This is one of the
key issues with this technology.
In addition there was always the problem to the obstruction of the signals. If you were to cover an
Infrared Sensor, then how can it know of a car is present or not?
This has been now solved through improved microprocessors that can manage ‘Time-of-Flight’
processes for LED and Laser applications. This dramatically improves the performance of LED sensor
and provides a robust method of measuring distances.
Usually these solutions include an angle of incidence between the SENDER and RECEIVER to
accurately determine distance. However in cruder environments like a car park, this does not need
to be so precise. One of the benefits of Time-of-Flight is that it can reject measurements that are too
close (resulting from loose debris or a scooter etc…).
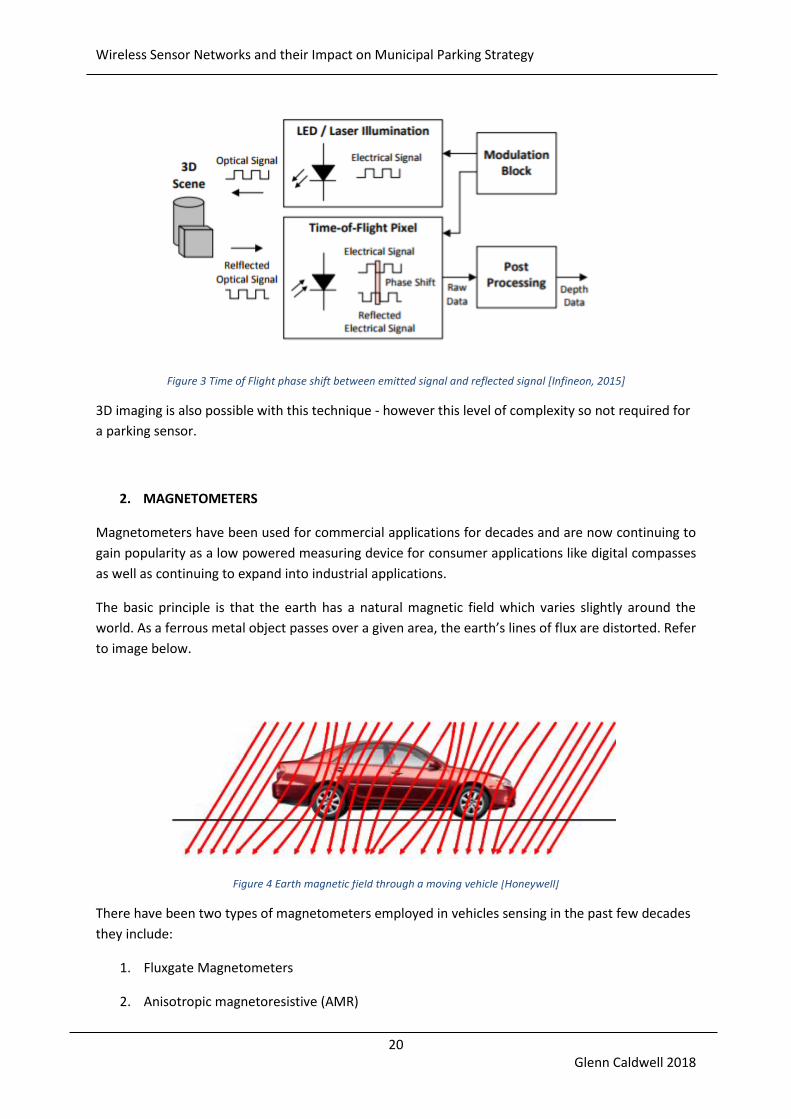
With the assistance for faster microprocessors, Time-of-Flight sensing can be easily done with
minimal complexity. The following diagram shows the basic principle of how this works. An
amplitude modulated signage is emitted and then received at the speed of light. Instead of
calculating the time taken for the signal to travel, a phase-shift circuit is included that measures the
offset between each signal. Therefore an accurate clock is not required at all – thereby simplifying
the process.
Wireless Sensor Networks and their Impact on Municipal Parking Strategy
20
Glenn Caldwell 2018
Figure 3 Time of Flight phase shift between emitted signal and reflected signal [Infineon, 2015]
3D imaging is also possible with this technique - however this level of complexity so not required for
a parking sensor.
2. MAGNETOMETERS
Magnetometers have been used for commercial applications for decades and are now continuing to
gain popularity as a low powered measuring device for consumer applications like digital compasses
as well as continuing to expand into industrial applications.
The basic principle is that the earth has a natural magnetic field which varies slightly around the
world. As a ferrous metal object passes over a given area, the earth’s lines of flux are distorted. Refer
to image below.
Figure 4 Earth magnetic field through a moving vehicle [Honeywell]
There have been two types of magnetometers employed in vehicles sensing in the past few decades
they include:
1. Fluxgate Magnetometers
2. Anisotropic magnetoresistive (AMR)

Wireless Sensor Networks and their Impact on Municipal Parking Strategy
21
Glenn Caldwell 2018
Fluxgates
Fluxgates are better suited to traffic monitoring applications rather than in-ground sensing; however
they have been included in the paper as they assist with the basic understanding magnetism.
Fluxgates excel in detecting very low field measurements - such as the earth’s magnetic field.
The principles of fluxgates include the following elements:
• Soft iron core that is ferromagnetic.
• A coil is wound around the core which is given an electric pulse to generate a magnetic field
around the core (this is the drive coil).
• The soft iron core takes in the magnetic field until it becomes ‘saturated’.
• The drive coil then drives the magnetic field (in the core) in the opposite direction (negative
direction) changing the polarity forming what is call a ‘Hysteresis cycle’. This continues
many times per second. The midpoint of this hysteresis cycle (where is starts to move from
positive to negative) is where the iron core is most sensitive to external magnetic fields -
such as from the earth.
• An additional sense coil is wrapped around the sensor to detect shifts in the core’s
magnetism which is likely to be attributed to an external magnetic field.
The images below show a typical fluxgate. On the left is a single axis gate. On the right shows a 2-axis
system (x, y). An additional fluxgate can be added to form the three-axis magnetometer that is
typically used to measure an accurate ‘magnetic signature’ based on the earth’s magnetic field.
Figure 5 Fluxgate sensor – split level [Metrolab]

Wireless Sensor Networks and their Impact on Municipal Parking Strategy
22
Glenn Caldwell 2018
Magnetometer precision is determined by the following
• Soft iron core: The quality of any magnetometer depends on the iron core material. This is
what creates its ‘Linearity’. Linearity refers to materials ability to change its level of
magnetisation based on an external field. Some harder materials cannot change their
magnetic fields easily.
• Core Geometry: e.g. Square split level (as above), oval, round.
• Resolution versus sensitivity. This is a basic trade off with magnetometers. A low hysteresis
cycle frequency favours the devices ability to detect an external magnetic field with better
resolution. ‘Resolution’ refers to the device’s ability to detect an external signal (or effect)
through extraneous noise. One the other hand the sensor may need to be more sensitive to
changes in external fields – in which case the frequency of the device must be set higher.
• Electronics. Poorer electronics creates noise and heat that impacts the sensor’s performance
• The temperature Coefficient. This is the core’s susceptibility to change its permeability
(ability to be affected by an external magnetic field) as a result of changes in its
temperature. Generally the hotter the rod becomes, the poorer is its performance. This is an
important consideration for road surface conditions.
• Calibration. The sensor must be programmed to know what its base level is (i.e. no external
field present).
The Anisotropic Magneto-resistive (AMR) Sensor
This is the most widely used magnetometer for ITS applications including in-ground sensors. It is now
the most common technology employed by magnetometer vendors.
This sensor is being widely used in many applications including compasses, and angle measuring
devices. It is also being heavily adopted in the ITS arena, traffic control and even medical
applications.
The basis of the technology is Anisotropy: in physics, the quality of exhibiting properties with
different values when measured along axes in different directions. [Britannica]
The basic operation of an AMR sensor involves a ferromagnetic rod wired up to a circuit. The rod is
already magnetised and is metal – therefore it can accommodate an electric current. Refer to the
diagram below:

Wireless Sensor Networks and their Impact on Municipal Parking Strategy
23
Glenn Caldwell 2018
Figure 6 Operation of a basic AMR sensor
The left image shows a simple battery connected to a light bulb circuit. The magnetisation of the rod
is vertically aligned allowing the free flow of electrons.
However if we were to apply an external magnetic field, like a large horseshoe magnet, to the left of
the rod, the alignment of the magnetisation changes (shown as the blue arrow in the right- image
above). This results in the rod creating an increase in resistance that slows the flow of current (think
of resistance as a partly closed faucet that reduces the flow of water). The reduced current then
reduces the brightness of the bulb.
If we take this concept further, a highly sensitive AMR sensor could detect shifts on the earth’s
magnetic field. A simple AMR sensor place on a road bed could be calibrated to offset the lines of
flux from the earth’s magnetic field – i.e. in a zero state. Once a car passes over the sensor, this
changes the earth’s field across the sensor creating a change in the current passing through the rod
core.
You could therefore say that the rod core acts as a variable resister – whose ability to conduct
current is impacted from external magnetic fields.
To develop a working in-ground AMR sensor, we need to use a set of four (4) resistors. The formal
name of this configuration of sensors is a Wheatstone Bridge.
Each of the 4 rods are made up of a nickel-iron (Permalloy) film in a patterned resistive strip
element. An example is shown in the image below in a rectangular configuration:

Wireless Sensor Networks and their Impact on Municipal Parking Strategy
24
Glenn Caldwell 2018
Referring to the image on the left, current flows from
(Vb) down – distributed equally to (Out+) and (Out-). if
for example a magnetic field was applied across the
sensitive axis, then the balance among the 4 resistors
will shift slightly (in regard to resistance) resulting in a
slight imbalance between the voltages across (Out+) and
(Out-). This would be measured by the sensor to
calculate the strength of the external field (i.e. earth’s
field).
One Wheatstone bridge can calculate changes to the
earth’s magnetic field across one axis. For a two-axis
sensor, we will need to combine two Wheatstone
bridges (one of them on the orthogonal axis) as shown
below
Figure 7 AMR Wheatstone bridge [Honeywell]
Figure 8 - 2-axis Wheatstone Bridge [Honeywell]
By including another Wheatstone bridge, we can create a three-axis sensor (x, y,
z) to provide an accurate reading of a vehicle’s magnetic signature.
The presence of a motor vehicle will impact the earth’s magnetic field. The
ability of the sensor to detect the change in field is impacted by the following:
1. The material in the vehicle. Ferrous material contains iron. Non-ferrous material like
aluminium will not affect the earths’ magnetic field.
2. The size of the vehicle
3. The distance between the vehicle and the ground sensor. The intensity of the magnetic field
is reduced in a cubed relationship. So if a vehicle’s distance to the sensor is reduced by say
distance(x), then the magnetic intensity is increased by (x)3.
4. External noise. This may be caused by large trucks passing nearby or power lines.

Wireless Sensor Networks and their Impact on Municipal Parking Strategy
25
Glenn Caldwell 2018
Magnetometers continuously sense at 2 or more measurements per second. This is a significant
improvement over infrared.
In addition a magnetic sensor can determine the ‘magnetic signature’ of a particular model of car
and can estimate the approximate type of vehicle based on templates. This is something that
Infrared cannot do at all. The signature is based on a three-axis reading.
One of the main drawbacks of Magnetic flux is the spatial resolution. It can easily provide a magnetic
signature of a metal object; however this signature does not show the shape of the mass.
There are issues with AC power lines that generate electromagnetic signals at 50Hz (20 ms per
cycle), therefore the sensor must sample data in such a way as to cancel out this type of
interference.
Managing these aberrations requires extensive algorithms being applied to the sensor readings.
Most of the logic involves determining what data to throw out and which to keep. This takes the
vendor significant investment of time in their software development. Vendors that do not invest in
their software solution, will inevitably provide a low-quality result.
Another issue is the extraneous impact from nearby vehicles (alongside the sensor but not over the
sensor). With well programmed communication protocols, it may be possible for adjacent sensors to
cross check each other’s status, thereby cancelling out these impacts.
Power consumption can be make-or-break with this technology. The vendor can develop the
microcontroller circuit to only conduct a few samples per second. Sample duration can be as little as
a few Nano-seconds. When the microcontroller is not taking sample measurements from the AMR
sensor, it can power down (even for periods of a few milliseconds), thereby reducing the overall duty
cycle of the device and conserving power significantly.
Power management is one of the key points when differentiating between magnetometer solutions.
If a vendor has not invested sufficient time on developing their technology, then it is likely they have
not managed to reduce the duty cycle of their circuitry – thereby requiring larger batteries to
manage inherent inefficiencies.
For example, some AMR magnetometers are an “all in one” unit that includes all 3-axes,
microcontrollers, multiplexers and amplifiers etc... These devices cannot be easily customised for
specific applications. The chip sets may require more processes and may generate more internal
noise. The communication signal to the repeater cannot be easily synchronised – ensuring it only
sends data at times when the sensor is not taking samples – thereby preventing interference. These
chip sets generally are programmed using higher level programming instructions which ultimately
require more processing power. These issues result in far greater power consumption and will
require a larger battery to support it, or will fail prematurely during its operating life cycle.

Wireless Sensor Networks and their Impact on Municipal Parking Strategy
26
Glenn Caldwell 2018
3. IMPULSE RADAR ULTRA WIDE BAND RADIO (Nano-Radar)
Radar has been used for well over a century and was developed extensively by the military in WWII.
However radar as a measuring device has taken a while to develop into a low powered environment.
Impulse radar employs the Ultra-wide band (UWB) Spectrum, which was approved by the Federal
Communications Commission (FCC) in 2002. it is the largest unlicensed bandwidth at 3.1GHz to
10.6GHz), therefore anyone can use this band without significant approvals.
Figure 9 Commonly used bandwidths (University of Turin, 2015)
WIFI or Bluetooth devices are popular and have the capacity to send large amounts of data, but the
battery life is very limited. With UWB it is possible to create very small nodes - generating Pulse
repetition modulation (radar emission), yet with extremely very low power consumption depending
on the channel conditions. Modern Nano power circuits consume very low power from 0.1 -
10milliwatts.
Novelda is a small pioneering company based in Norway that is leading the field in this technology.
Note: They do not provide parking sensors, they only provide an Impulse Radar chip set that can be
used across many applications. They can provide very small circuit boards with a complete radar
solution embedded on a low power circuit board as per the image below.
Wireless Sensor Networks and their Impact on Municipal Parking Strategy
27
Glenn Caldwell 2018
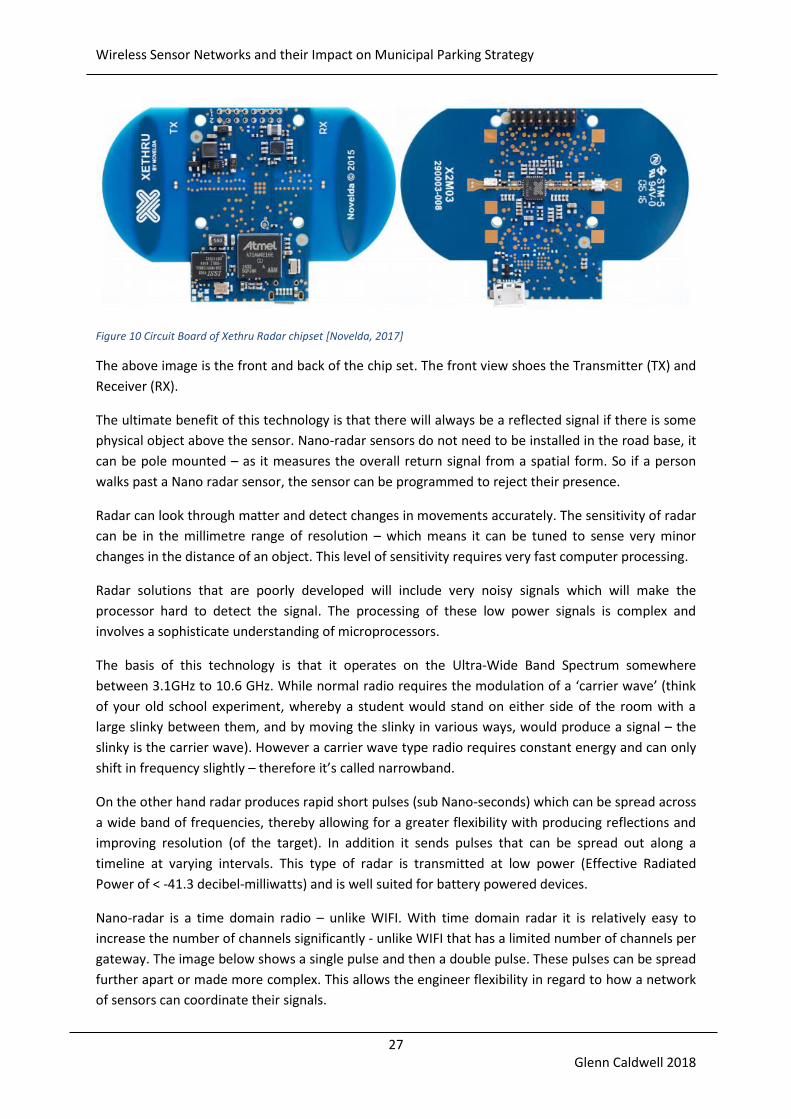
Figure 10 Circuit Board of Xethru Radar chipset [Novelda, 2017]
The above image is the front and back of the chip set. The front view shoes the Transmitter (TX) and
Receiver (RX).
The ultimate benefit of this technology is that there will always be a reflected signal if there is some
physical object above the sensor. Nano-radar sensors do not need to be installed in the road base, it
can be pole mounted – as it measures the overall return signal from a spatial form. So if a person
walks past a Nano radar sensor, the sensor can be programmed to reject their presence.
Radar can look through matter and detect changes in movements accurately. The sensitivity of radar
can be in the millimetre range of resolution – which means it can be tuned to sense very minor
changes in the distance of an object. This level of sensitivity requires very fast computer processing.
Radar solutions that are poorly developed will include very noisy signals which will make the
processor hard to detect the signal. The processing of these low power signals is complex and
involves a sophisticate understanding of microprocessors.
The basis of this technology is that it operates on the Ultra-Wide Band Spectrum somewhere
between 3.1GHz to 10.6 GHz. While normal radio requires the modulation of a ‘carrier wave’ (think
of your old school experiment, whereby a student would stand on either side of the room with a
large slinky between them, and by moving the slinky in various ways, would produce a signal – the
slinky is the carrier wave). However a carrier wave type radio requires constant energy and can only
shift in frequency slightly – therefore it’s called narrowband.
On the other hand radar produces rapid short pulses (sub Nano-seconds) which can be spread across
a wide band of frequencies, thereby allowing for a greater flexibility with producing reflections and
improving resolution (of the target). In addition it sends pulses that can be spread out along a
timeline at varying intervals. This type of radar is transmitted at low power (Effective Radiated
Power of < -41.3 decibel-milliwatts) and is well suited for battery powered devices.
Nano-radar is a time domain radio – unlike WIFI. With time domain radar it is relatively easy to
increase the number of channels significantly - unlike WIFI that has a limited number of channels per
gateway. The image below shows a single pulse and then a double pulse. These pulses can be spread
further apart or made more complex. This allows the engineer flexibility in regard to how a network
of sensors can coordinate their signals.

Wireless Sensor Networks and their Impact on Municipal Parking Strategy
28
Glenn Caldwell 2018
Figure 11 Typical pulse in time domain. Each pulse is in the order of Nano-seconds
One issue with Nano radar development is the recovery of the signal – which is very weak compared
to the transmission signal. At a first scan, the return signal is just noise and cannot be detected.
However there are methods to improve the resolution using the integration of many-many pulses.
One method is referred to as “Continuous Time Binary Value” [Sverre Lande, 2008], which refers to a
process to manage reflected signals without the need of a complex internal clock (a common
problem for sensing technology). This method can be designed to have very low power compared to
other techniques.
The way this works involves sending out several ‘sequences of pulses’ in a pattern that represents a
‘symbol’ like a ZERO or ONE. or a simple pulse (1 pulse is a ZERO, and 2 pulses is a ONE in Binary).
The emitted pulse will encounter significant interference from mains power, phones, etc….
The reflected energy back to the radar will be spread out as it bounces off various depths and
interference. This will create noisy sets of received signals as shown below (referred to as delay
spread)
Figure 12 Delay Spread of received signal
The data is then sampled multiple times to detect ‘patterns’ in the data. These are then integrated
into a coherent signal.

Wireless Sensor Networks and their Impact on Municipal Parking Strategy
29
Glenn Caldwell 2018
The management of the inbound signals may not need any complex sampling as mentioned above,
however depending on the noise level and the degree of accuracy required, it could be done more
efficiently with a simple set of logic gates at the receiver - to sift through the received signal looking
for expected patterns. This second method requires applying inferential statistical data to spikes in
the analog signal – allowing for the conversion of the received signal into digital data.
The depth of the reading (How far away is the car) can be done by determining the latency between
the transmitter and receiver. This is achievable over short distances with this technology and is one
of its primary benefits.
ADDITIONAL CONSIDERATIONS WITH SENSOR TECHNOLOGY
Casing
The outer casing of the sensor must have proven ingress protection and rigidity. Poor quality casing
will still be impacted by moisture. Also some sensors will not withstand significant pressure from
heavy vehicles. For example, sensors may be installed in a parallel parking arrangement along a
major road. Parking may be available during the middle of the day – only to become a clearway after
3PM. Weak sensors will crack and fail from heavy traffic.
Off-street parking
If the sensor solution is to be installed within a multi-deck car park, it is preferable that the sensor
can be drilled into the slab with a standard drill bit – rather than core drilled. Core drilling is typically
not recommended for suspended concrete slabs.
Hybrid Sensors
Hybrid Sensors ae a concern as the way they are configured is usually not known – even by the
vendor themselves. Often software programmers are busy writing algorithms to reconcile and
prioritise detected signals. This ultimately requires processing power and battery consumption.
Sampling
Sensors must detect rapid changes in parking space occupancy. In busy car parks, a car can quickly
exit a space, allowing a waiting vehicle to immediately park within seconds. Some sensors will miss
this event if they have a low sample rate.
Enforcement
Parking officers must be able to view parking sensor data remotely with minimal latency (less than
30 seconds) – so they do not waste time going to the wrong location and infringing incorrectly.

Wireless Sensor Networks and their Impact on Municipal Parking Strategy
30
Glenn Caldwell 2018
COMMUNICATION PROTOCOLS
Gateways
Sensor networks require gateways to route data from the sensor to the network. This is then passed
onto various applications, including: Parking officer handhelds, parking applications, management
systems.
Due to improvements in power management and circuit board efficiencies, sensor gateways can be
battery powered (or battery + Solar) and pole mounted with a SIM card to communicate to the
wireless network.
To conserve power within the sensor, most of the communication from the sensor to the gateway is
event driven - with the occasional status pulse. Events would typically include a vehicle movement.
Communication Protocols
IoT type devices require low power communication to ensure there is regular uploads of data to
inform the central system that a vehicle has moved. To ensure long term battery performance and
to avoid excessive interference, IoT device vendors have adopted a one of the following
technologies:
• Spread Spectrum
o LoRaWAN
• Narrow Band
o Sigfox
o Cat M1
o NB IoT
In previous years, sensor solutions had used the ZigBee protocol, which operates typically in the 902
- 928MHz band in Australia. ZigBee is ideal for managing a network of small devices while allowing
for a fair amount of data to be exchanged between nodes. This issue with ZigBee is power
consumption.
Various communication protocols perform at varying levels of bandwidth (the amount of data that
can be sent/received), and various distances. The greater that either (or both of these) are required,
then the greater the power. Refer to the graph below:

Wireless Sensor Networks and their Impact on Municipal Parking Strategy
31
Glenn Caldwell 2018
Figure 13 Common communication protocols
Any communication protocol is limited by three main elements:
1. Bandwidth (Speed)
2. Power
3. Range
You cannot have all three of the above as it will defy the laws of physics. WIFI, for example, requires
high bandwidth and generates some power, however it starts to lose signal within a short distance.
Mobile phones that are being used for the internet lose power within hours.
Sensors on the other hand, do not need to send much data (just bay status, signatures etc.). In
addition, they need to be very low power and cover a moderate range.
The communication protocol for sensors must have a reasonable ‘Link Budget’. This refers to the
amount of power that a signal can use between the Transmitter (Tx) to the receiver (Rx), allowing for
losses in signal strength throughout the journey. Signal strength can diminish as a result of
obstructions, buildings, metals, refractions, reflections and poor antenna quality.
Wireless Sensor Networks and their Impact on Municipal Parking Strategy
32
Glenn Caldwell 2018
LoRa
This is the most popular solution for low powered devices and resolves all the above issues. ‘LoRa’,
which has been developed by SemTech, operates around the 915MHz range in Australia with a
typical bandwidth (upper and lower ranges of frequency) of 125KHz.
Traditional signals send out data by manipulating the frequency. As sensors must operate at very
low levels of power, they must emit signals below the prevailing level of noise in the spectrum
(referred to as the noise floor). LoRa works below the noise level by the way it encodes its data on
the signal. The technique involves sending out sets of rising frequencies (similar in shape to a
‘chirp’). The Receiver is always tuned to these kind of signals and therefore can filter through a great
deal of noise within the incoming signal. Through robust demodulation techniques, the receiver
cancels out inconsistent signals, including competing narrowband signals (e.g. WIFI).
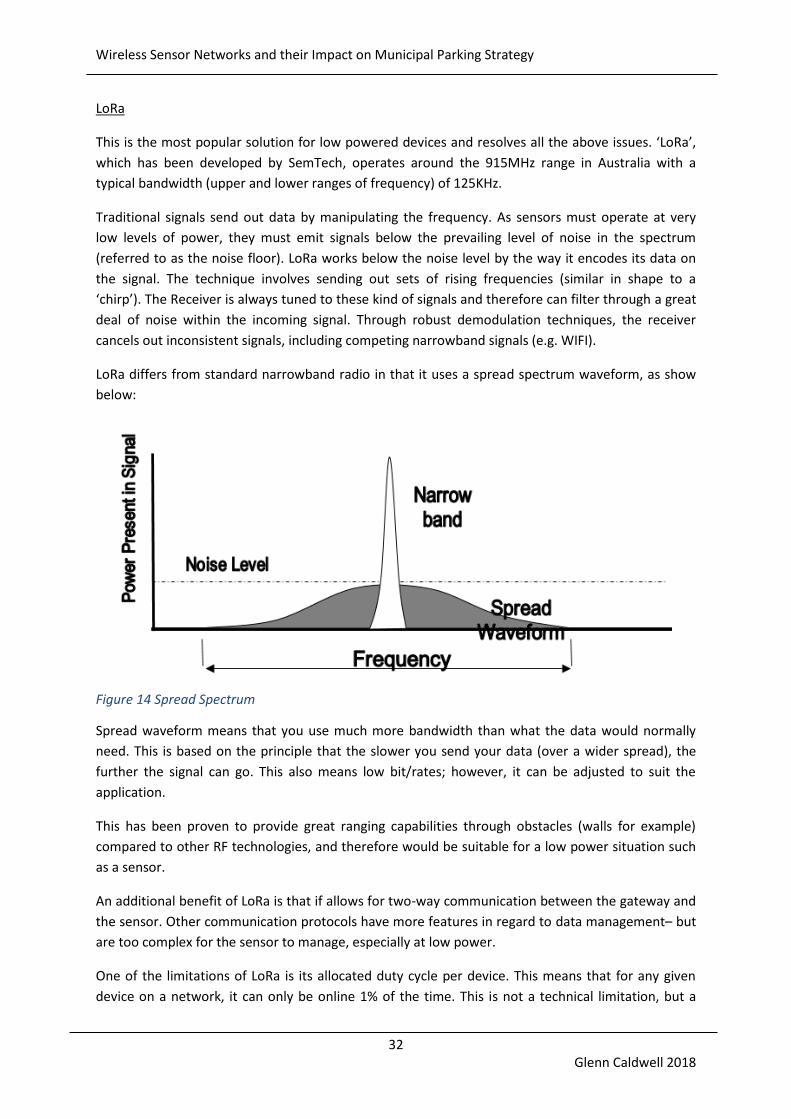
LoRa differs from standard narrowband radio in that it uses a spread spectrum waveform, as show
below:
Figure 14 Spread Spectrum
Spread waveform means that you use much more bandwidth than what the data would normally
need. This is based on the principle that the slower you send your data (over a wider spread), the
further the signal can go. This also means low bit/rates; however, it can be adjusted to suit the
application.
This has been proven to provide great ranging capabilities through obstacles (walls for example)
compared to other RF technologies, and therefore would be suitable for a low power situation such
as a sensor.
An additional benefit of LoRa is that if allows for two-way communication between the gateway and
the sensor. Other communication protocols have more features in regard to data management– but
are too complex for the sensor to manage, especially at low power.
One of the limitations of LoRa is its allocated duty cycle per device. This means that for any given
device on a network, it can only be online 1% of the time. This is not a technical limitation, but a

Wireless Sensor Networks and their Impact on Municipal Parking Strategy
33
Glenn Caldwell 2018
regulated limitation. Considering the small amount of data being sent at infrequent intervals, a 1%
duty cycle is viable.
Narrow Band – Internet of things
Sigfox is being considered a viable alternative to LoRa and it uses a very narrowband approach and
an encoding methodology that is designed to minimise noise. Usually the method of data
transmission is phase shift keying - sending just 12 bytes at a time. Sigfox has a significant size of the
existing IoT market and apparently has coverage in parts of Australia.
In addition to LoRa and Sigfox shown above, cat-M1 and NB-IoT operate on either a used GSM
carrier band or in an unused guard band between LTE bands. The solution was standardised by 3GPP
in 2016; however, it is yet to be broadly adopted by IoT device developers.
In Australia, Telstra is planning an expansion into the IoT arena by partnering with several software
providers to deliver a full Smart City Solution and are promoting their cat-M1 solution into the
market.
Cat M1 provided by Telstra will use guard bands for existing 4G services, most likely at a 200 KH
Bandwidth. This technology boasts an additional 20 dBm above other low power options. There are
claims that IoT devices will have a 10-year battery life, yet there are no proven power consumption
tests for sensors using this technology. The primary benefit of NB IOT is that it can easily integrate
with the existing mobile networks without added infrastructure. To do this, the provider of the NB-
IoT service will assign the frequency on the guard bands of the existing LTE bands (i.e. slightly higher
or lower than existing bands used by Telstra being 700MHz, 900MHz, 1800MHz, 2100MHz,
2600MHz).
Additional Considerations
It will be possible for sensors to communicate to each other wirelessly. This acts as a redundancy as
well as a cross check to determine the status of the neighbouring sensor – to cancel out extraneous
reads.
Councils considering joining the Internet of Things solution should factor in what communication
protocol they will use for their smart city initiatives. At this stage, they will need to consider a
precinct wide roll out of either LoRaWAN, NB-IoT or Sigfox.

Wireless Sensor Networks and their Impact on Municipal Parking Strategy
34
Glenn Caldwell 2018
SENSOR PERFORMANCE IN AUSTRALIA
To date there has been minimal detailed performance assessments conducted on parking sensors.
No known independent study exists that establishes the relative performance levels of every model
of sensor sold in Australia.
To provide a preliminary review of sensor performance in Australia, a sample of sensors were
inspected across various sites. For the purposes of this report, the names of each Council involved
will not be disclosed – nor the Sensor vendor. The following are a description of each site
Council #1 – Beachside Council with Infrared Sensors. The sensors include magnetometers as a
backup sensor.
Council #2 – Coastal/Regional Council. Large network of Magnetometer sensors
Council #3 – Coastal/Regional Council. Large Network of Magnetometer sensors
Council #4 – Regional Council with Infrared Sensors. The sensors include magnetometers as a
backup sensor.
Council #5 – Suburban Council. Small number of Nano-Radar Sensors
Council #1 – Beachside; Infrared with Magnetometer; installed late 2013 to early 2014
A sample of 600 parking sensors were observed on the 9th November 2017. The idea was to cross
reference occupancy accuracy on the sensor management system with field observations. In
addition the field conditions where these sensors were installed was noted including congestion
levels and typical vehicle movements. Sensors were located in sandy conditions.
Some sensors are within high traffic areas with high turnover. Other sensors are within lower
turnover areas. The areas was divided into 4 areas (or datasets).
Table 2 – Summary data of 4 datasets within Council 1
Council #1 SUMMARY of SYSTEM DATA Stat.
Data set 1 Total spaces reported in system 88
Total Occupied as per system 36
Total Vacant as per System 52
Error Observed on site including False (+) and False (-) 10
Data set 2 Total spaces reported in system 197
Total Occupied as per system 44
Total Vacant as per System 153
Error Observed on site including False (+) and False (-) 6
Wireless Sensor Networks and their Impact on Municipal Parking Strategy
35
Glenn Caldwell 2018
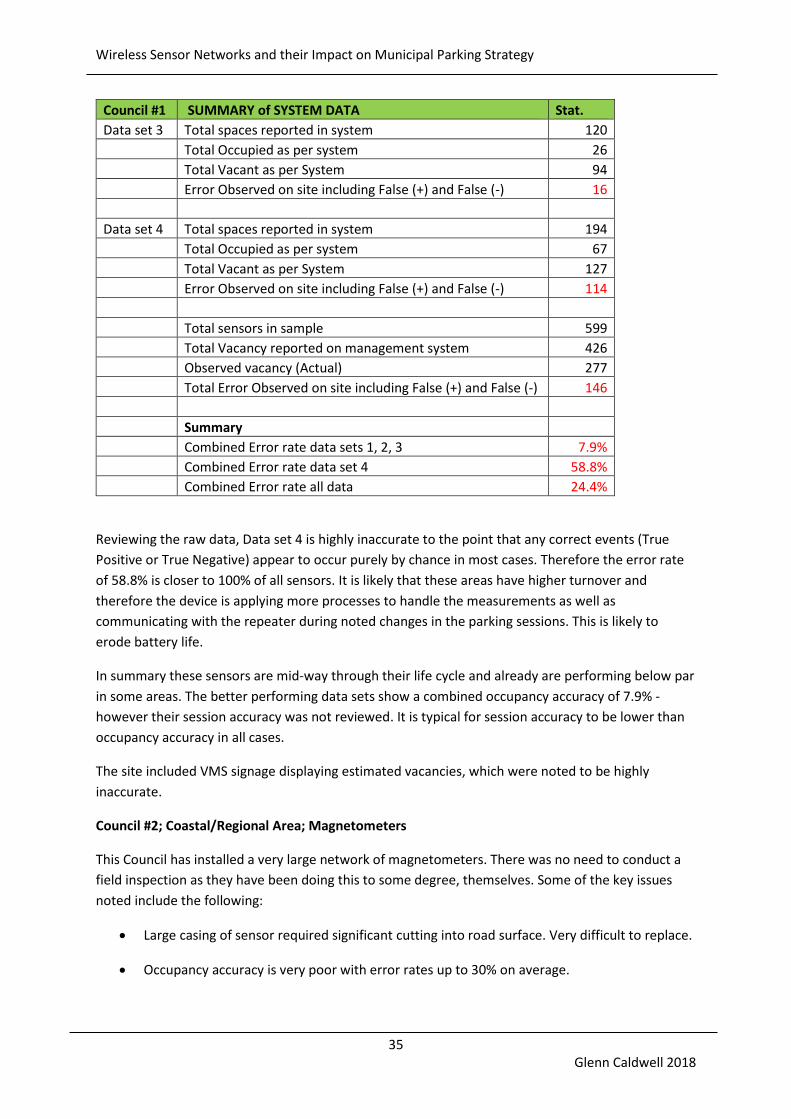
Council #1 SUMMARY of SYSTEM DATA Stat.
Data set 3 Total spaces reported in system 120
Total Occupied as per system 26
Total Vacant as per System 94
Error Observed on site including False (+) and False (-) 16
Data set 4 Total spaces reported in system 194
Total Occupied as per system 67
Total Vacant as per System 127
Error Observed on site including False (+) and False (-) 114
Total sensors in sample 599
Total Vacancy reported on management system 426
Observed vacancy (Actual) 277
Total Error Observed on site including False (+) and False (-) 146
Summary
Combined Error rate data sets 1, 2, 3 7.9%
Combined Error rate data set 4 58.8%
Combined Error rate all data 24.4%
Reviewing the raw data, Data set 4 is highly inaccurate to the point that any correct events (True
Positive or True Negative) appear to occur purely by chance in most cases. Therefore the error rate
of 58.8% is closer to 100% of all sensors. It is likely that these areas have higher turnover and
therefore the device is applying more processes to handle the measurements as well as
communicating with the repeater during noted changes in the parking sessions. This is likely to
erode battery life.
In summary these sensors are mid-way through their life cycle and already are performing below par
in some areas. The better performing data sets show a combined occupancy accuracy of 7.9% -
however their session accuracy was not reviewed. It is typical for session accuracy to be lower than
occupancy accuracy in all cases.
The site included VMS signage displaying estimated vacancies, which were noted to be highly
inaccurate.
Council #2; Coastal/Regional Area; Magnetometers
This Council has installed a very large network of magnetometers. There was no need to conduct a
field inspection as they have been doing this to some degree, themselves. Some of the key issues
noted include the following:
• Large casing of sensor required significant cutting into road surface. Very difficult to replace.
• Occupancy accuracy is very poor with error rates up to 30% on average.

Wireless Sensor Networks and their Impact on Municipal Parking Strategy
36
Glenn Caldwell 2018
• Incorrectly issued Infringements. This is when a penalty is issued erroneously based on
incorrect sensor data. This is performing relatively well (only 1% are rejected). However
there are many parking sessions that are incorrectly recorded and therefore are not even
considered viable to enforce. So essentially out of the 70% - 75% of sensors that are
operating well – 99% of these can be enforced reliably.
Council #3; Suburban Council; large network of Magnetometers
Installed October 2015, across many Town Centres.
The review included a small sample of 244 sensors during peak parking period.
Approximately 3.3% occupancy error rate (96.7%). Session error unknown. Most of the errors were
‘false negatives’. This is a substantial improvement over the magnetometers for Council #2.
Council #4; Regional Council; Infrared Sensors with Supporting Magnetometer (Hybrid)
This Council trialled an earlier model of these sensors within an at grade car park 2 years ago
(approximately 100 sensors). Many of these sensors failed and have been recently replaced.
In 2017 an additional 250 sensors were installed within the high street. Theses sensors were from
the same vendor – but a newer model with a smaller form factor and different gateway architecture
from what was used in the original trial.
A Review of the site was conducted 6th December 2017 to compare system data against field
observations.
Table 3 – Summary of error rate Council #4
Summary of High Street
Occupancy Accuracy
Total spaces in sample area 217
Adjusted error (allow for latency) 17
adj error 7.8%
Session Accuracy
Estimated issues (based on vehicle movements) 14
Error 6.5%
Net overlap between issues (occ. + Sess.) 0
TOTAL ERROR Session + Occupancy combined 14.3%
Occupancy error of older model sensors
total spaces 75
error 4
% error 5.3%
Occupancy accuracy was adjusted to allow for some latency between the movement of a vehicle and
the event being transmitted to the management system.
Wireless Sensor Networks and their Impact on Municipal Parking Strategy
37
Glenn Caldwell 2018
Session accuracy was an estimate only, based on a review of the sensor data (exported to excel
format).
Latency is likely to be closer to 30 seconds between a movement of vehicle and changes in
occupancy being displayed at the VMS.
Considering these sensors are new, the performance is moderate. It will be interesting to see if this
sensor continues to perform past 2-years when their device has had exposure to the environment
and been tested for battery consumption.
Council #5; Outer suburban Area; prone to high temperatures; Nano-radar sensors
Trial of approximately 95 Radar sensors in High street conditions. These sensor have been operating
for around 3 years on average and experience an average vehicle turnover every 2 hours over an
average 8-hour period.
The original version of these sensors were installed in 2013 yet experienced water ingress issues
resulting in a majority of them being replaced. However since 2014, the structural integrity of the
casing has improved markedly, resulting in only 6.5% of sensors needing to be replaced in the past
three years.
Over the past three years Parking Occupancy accuracy and Parking Session accuracy is reported by
Council to be between 98.5% and 99%. Out of all Council case studies, this particular sensor has
performed the best over an extended time frame.

Wireless Sensor Networks and their Impact on Municipal Parking Strategy
38
Glenn Caldwell 2018
TECHNOLOGY ALTERNATIVES TO PARKING SENSORS
There has been many ‘trials’ of progressive parking solutions. These include a long list of the
following: Pay-by-phone, pay-by-plate, RFID, fixed camera ANPR, Mobile ANPR, Ultrasonic solutions,
GPS based location and many more.
Physical parking devices like Pay-by-plate parking meters, allows drivers the ability to park their car
by validating their vehicle’s registration at a payment station. Parking rangers can then roam around
with a mobile camera capturing licence plate details.
This does not always work well as many areas are highly congested and does not allow parking
officers to navigate through the congestion efficiently. In addition some Pay-by-plate systems are in
their infancy and prone to error. Sensors are often an afterthought as pay parking controls is
sufficient to reduce parking demand. However whenever sensors are considered, the following
technologies are considered as an alternative.
1. Camera based sensors. These sensors detect occupancy and vehicle movements by
capturing changes in the images within the ‘field of view’. These are position pole mounted
over a set of vehicles. They are considered too expensive and unreliable for the purposes of
enforcement. In addition, modern in-ground sensors are fast becoming more reliable.
Camera sensors are not suitable when there are many trees.
2. Mobile enforcement. This can involve a parking officer on a motor scooter with a mounted
ANPR camera to roam the streets detecting vehicles. This cannot provide real time
occupancy data for the purposes of parking guidance.
3. Pay by Phone synchronise with a sensor below the car. Not viable due to power
consumption
4. Pay Parking System Algorithms to predict occupancy and compliance. This may be a viable
solution long term, and can work well in conjunction with parking sensors. This involves real-
time analysis of pay parking data for either a parking meter solution OR a Pay-by-phone
solution. It has been noted earlier in this report that parking sensors can be flawed in
providing vacancy information for motorists because they can arrive at the space only to find
it occupied due to errors in the system. Additionally, parking sensors may be difficult to
implement across an entire city. Therefore, a high-level solution is required to provide
motorists with real-time ‘probabilities’ of a space being available within a zone.
How this works. The Pay Parking vendor has real time information on the number of parking
sessions that have been paid for at any one time. Based on ground truthing analysis, the
vendor knows the % of people that probably have not paid for parking, and the % of people
that under stay or overstay the time they have paid for. From these 2 variables, the vendor
can predict the number of vacant spaces for each section of street, within a predetermined
margin of error.
This data is then pushed to a customer parking app that can provide real-time information on the
availability of spaces within an area.

Wireless Sensor Networks and their Impact on Municipal Parking Strategy
39
Glenn Caldwell 2018
In summary the future of parking will likely be more mobile based (pay by phone) and therefore the
algorithmic method discussed above, will become more relevant.

Wireless Sensor Networks and their Impact on Municipal Parking Strategy
40
Glenn Caldwell 2018
ECONOMIC ASSESSMENT OF SENSORS
When assessing the viability of sensors, it is relatively easy to calculate the net increase in
enforcement efficiency and fine revenue – assessed against the capex and annual Opex of sensors
over a term of a few years. However this is often hard to provide justification to the broader benefits
that sensors address.
DETERMINING THE SOCIAL COSTS/BENEFITS OF SENSORS
There have been many arguments in favour of pay parking as it provides a direct measure of the
social cost of parking. Donald Shoup, based in UCLA, has become famous in parking for providing a
robust book on this subject.
The social costs with free parking (or unregulated parking) including the following:
• Increased congestion
• Increased travel time
• Driver frustration
• Poor parking availability
• Greater walking time
• Diverted trips (people do not visit the area)
• Greater emissions
Pay Parking is not the only method to encourage parking turnover. There are another two common
methods of increasing vehicle turnover and utilisation. Enforcement and Parking Guidance (both
improved with sensors).
There are almost no studies that directly assess the economic benefit of parking sensors specifically.
In addition there needs to be some ability to translate these benefits over to other projects. To
investigate this, let’s consider a couple of case studies.
The most famous case study relates to SF Park – in San Francisco. Since 2012 SF Park has assessed
the change in parking behaviours resulting from the introduction of various pay parking measures,
particularly variable pricing and associated demand changes. The “SF Park Pilot Project Evaluation
Report” covers the main findings from the study. In addition this report is based on pay parking and
sensors together. The following table summarises the net change between the trial area and the
controlled area (where initiatives were not implemented).
Table 4 – SF Park Summary Results
% Change
SF Park Summary (All areas) Trial Area Control area
Net change
Parking Availability - Increase in times when area reaches target occupancy of 60%-80% 31% 6% 25%
Parking Search Time reduction 43% 13% 30%
Reduction in greenhouse gas emissions 30% 6% 24%
Vehicle miles travelling looking for parking (decreased) 30% 6% 24%
Average 26%

Wireless Sensor Networks and their Impact on Municipal Parking Strategy
41
Glenn Caldwell 2018
The above measures could be easily referenced by any Council intending to conduct a business case
to support the introduction of pay parking controls or sensors. However transposing the SF Park
results from one City to another (or another country and culture), may not be a seamless exercise.
Therefore Councils wanting to investigate the economic and social benefits of sensors and pay
parking, should conduct more rigorous investigation of the parking behaviours occurring within their
local government area.
For the purposes of this paper, it is worth deriving a simple ‘discount factor’ that estimates the net
social and economic benefit of introducing new parking technology (parking meters or sensors
etc…). One of the principle benefits of parking demand management is either - to increase in
turnover; or to decrease the Average Length of Stay (ALoS). ALoS is directly related to Turnover and
Occupancy. If the number of cars attempting to park in a car park remains constant, then if the ALoS
reduces, then average occupancy of the car park reduces. If the average occupancy reduces, then
this may attract more cars that would otherwise not drive. This can then lead to better parking
utilisation and turnover. In addition if parking occupancy decreases (i.e. parking availability
increases), then it follows that average parking search time decreases – resulting in reduced kms
travelled and reduced emissions.
One of the main benefits of the SF program is that prior to the program, the overall ALoS (all areas)
statistics showed that 50% of drivers parked for less than 3 hours and 50% more than 3 hours. Post
SF program the average duration was 76% less than 3 hours and 24% more than 3 hours. If we
assume that the distribution of ‘duration of stay’ is roughly spread across a ‘normal distribution’;
then we can estimate the shift in average length of stay - thereby estimating the % change in parking
demand. Refer to image below.
Figure 15 Reduction in Parking duration – SF Park. Normal Distribution
Based on the normal distribution rules tabulated in standard statistical ‘Z-Value Tables’; with what
minimal information we have, we can estimate the standard deviation (in respect to length of stay)
as being about 42 minutes. Also based on a shift in ALoS distribution below (3 hours) from 50% to
76%, we can use the normal distribution to calculate the revised average length of stay as close to 2
hours 20 minutes – or approximately 22% reduction in parking length of stay.

Wireless Sensor Networks and their Impact on Municipal Parking Strategy
42
Glenn Caldwell 2018
This statistic approximates the net improvements as shown in Table 4. However as explained
previously, this relates to a pay parking scenario – rather than isolating the benefit of sensors.
To better understand the net impact of sensors, we can assess a related technology, Parking
Guidance. Parking guidance is loosely related to sensors in that they provide a means to assist
drivers in finding a parking space. In addition many parking guidance systems include some form of
bay sensor.
Quantifying the potential savings in travel time resulting from parking guidance systems – a
simulation case study by B.J. Waterson, N.B. Hounsell and K. Chatterjee Transportation Research
Group, University of Southampton 2001 – identified that travel times were improved by only 1%.
The main Intelligent Transport Systems ITS website: includes a case study from O R Tambo
International airport; which claims that parking guidance resulted in a 70% reduction in greenhouse
emissions and increases in parking turnover of 5 + percent.
It is evident that a unified method of studying the benefits of new parking technology is limited.
Additionally transposing one case study to another parking environment is challenging.
However for the sake of this exercise, we will refer to the SF Park estimated reduction in ALoS of
22% as a key metric in our economic evaluation. Furthermore to account for the fact that we are not
including any pay parking measures, and relying solely on ground-sensors (as a means to encourage
turnover and utilisation), we will nominally discount the 22% value by more than 50% - down to a
simple 10% net benefit (to remain conservative). This will be applied to each element of the
economic assessment.
In summary, for the purposes of this economic assessment, a net benefit of 10% will be applied to a
generalised cost model as shown below.
ECONOMIC ASSESSMENT USING A GENERALISED COST MODEL
The assumptions used in the assessment are as follows
• Parking precinct comprising 1000 sensors within a cordoned area
• Discount value is 6%. Standard rate for Australian BCA and is sometimes set as high as 7.5%
• CPI is zero
• Time frame is 5 years. Sensors are replaced every 5 years. This is sometimes rather hopeful
depending on battery life
• Value of reduced car travel (congestion) is 15c per km. This estimate can vary widely
depending on source. However the value of congestion could also be measured in terms of
fuel savings. Based on cross referencing from several sources [Shoup, 2004] We can average
the cost of congestion to be about 15c which seems rather consistent across these sources.
• Environmental is 0.11c per km [average based on Climate Change Authority, 2014]
• Economic tax benefit of 10% has not been applied in this version
• Value of time is $12. [TfNSW, 2015]
• New user benefits have not been included
• Cruise speed is 16km/h (i.e. convert from 10mph) [Shoup, 2004]
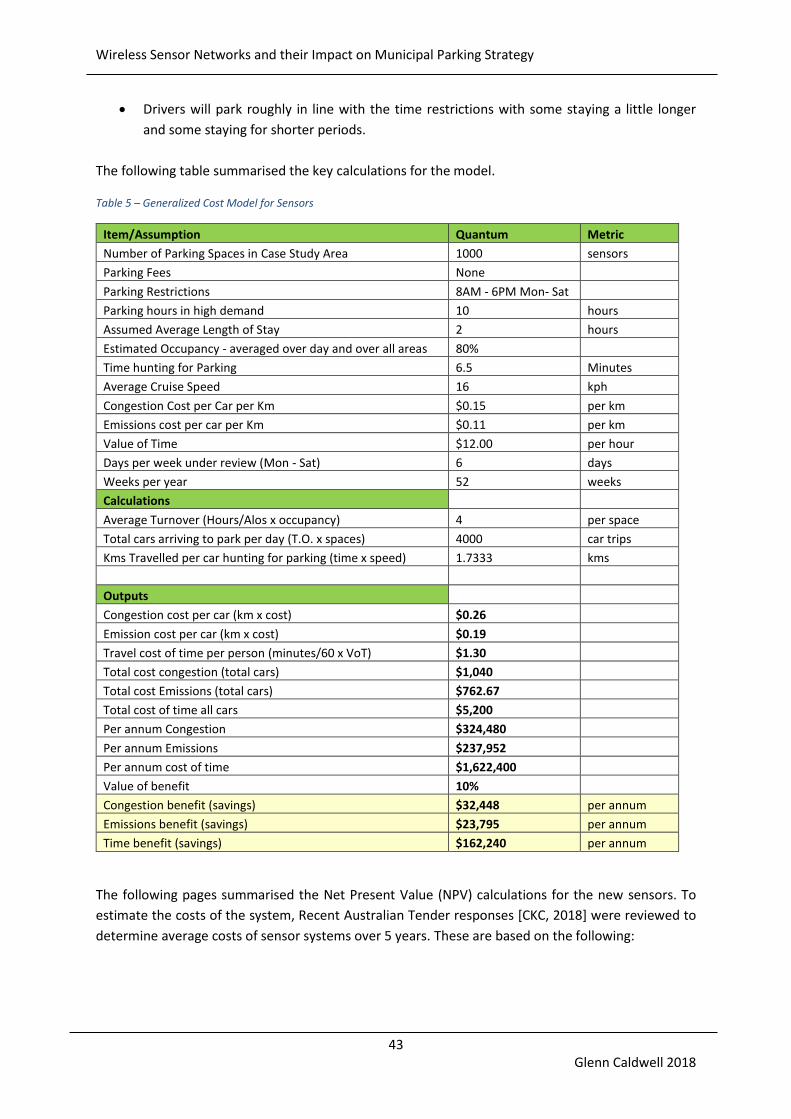
Wireless Sensor Networks and their Impact on Municipal Parking Strategy
43
Glenn Caldwell 2018
• Drivers will park roughly in line with the time restrictions with some staying a little longer
and some staying for shorter periods.
The following table summarised the key calculations for the model.
Table 5 – Generalized Cost Model for Sensors
Item/Assumption Quantum Metric
Number of Parking Spaces in Case Study Area 1000 sensors
Parking Fees None
Parking Restrictions 8AM - 6PM Mon- Sat
Parking hours in high demand 10 hours
Assumed Average Length of Stay 2 hours
Estimated Occupancy - averaged over day and over all areas 80%
Time hunting for Parking 6.5 Minutes
Average Cruise Speed 16 kph
Congestion Cost per Car per Km $0.15 per km
Emissions cost per car per Km $0.11 per km
Value of Time $12.00 per hour
Days per week under review (Mon - Sat) 6 days
Weeks per year 52 weeks
Calculations
Average Turnover (Hours/Alos x occupancy) 4 per space
Total cars arriving to park per day (T.O. x spaces) 4000 car trips
Kms Travelled per car hunting for parking (time x speed) 1.7333 kms
Outputs
Congestion cost per car (km x cost) $0.26
Emission cost per car (km x cost) $0.19
Travel cost of time per person (minutes/60 x VoT) $1.30
Total cost congestion (total cars) $1,040
Total cost Emissions (total cars) $762.67
Total cost of time all cars $5,200
Per annum Congestion $324,480
Per annum Emissions $237,952
Per annum cost of time $1,622,400
Value of benefit 10%
Congestion benefit (savings) $32,448 per annum
Emissions benefit (savings) $23,795 per annum
Time benefit (savings) $162,240 per annum
The following pages summarised the Net Present Value (NPV) calculations for the new sensors. To
estimate the costs of the system, Recent Australian Tender responses [CKC, 2018] were reviewed to
determine average costs of sensor systems over 5 years. These are based on the following:

Wireless Sensor Networks and their Impact on Municipal Parking Strategy
44
Glenn Caldwell 2018
• Cost per sensor installed - $420 ex GST
• Cost for additional infrastructure including repeaters, gateways and management system
(10% of capex)
• Annual cost to maintain system is $70 per sensor per annum
Table 6 – Net Present Value – 5 years
Discount Rate 6% COSTS ECONOMIC BENEFITS
New
Users Existing
Users Road Users Environmental TOTAL
Capital Operating Consumer Travel Travel time Pollution NET Financial
Year Year Cost Cost Surplus Time Congestion Impacts BENEFITS
Commencing No. Sensors Savings
Year 1 0 $462,000 $82,000 $162,240 $32,448 $23,795 -$325,517
Year 2 1 $0 $82,000 $162,240 $32,448 $23,795 $136,483
Year 3 2 $0 $82,000 $162,240 $32,448 $23,795 $136,483
Year 4 3 $0 $82,000 $162,240 $32,448 $23,795 $136,483
Year 5 4 $0 $82,000 $162,240 $32,448 $23,795 $136,483
Present Value $462,000 $366,139 $0 $724,419 $144,884 $106,248 $147,412
NPV 6% DR
Project Costs 828,139
Project Benefits 975,551
Net Present Value 147,412
Benefit Cost Ratio 1.18
The above analysis provides a positive return – albeit a conservative estimate as it has not included
the following:
1. Improved Enforcement Revenue: This is not a direct social benefit. It would form part of a
financial assessment (different to an economic assessment)
2. Consumer Surplus: (Economic Benefit) Will sensors attract new visitors to a Town centre?
These would be included as consumer surplus. This would also become a net benefit for
local businesses in the form of increased patronage.
3. An additional 10% should be deducted from all the expenses to allow for the ‘Economic tax
benefit’ – which is a common rule applied to government related BCA.
In summary, based on the conservative assumption listed above, a well performing sensor solution
should easily pay for itself within 5 years (closer to breakeven in under 4 years).

Wireless Sensor Networks and their Impact on Municipal Parking Strategy
45
Glenn Caldwell 2018
HOW TO EVALUATE SENSORS – THE BENEFITS OF FIELD TRIALS
Also sensors need to be tested rigorously across multiple councils that are employing various sensor
technology. The sensor technology must be less than 2 years since installation. The evaluation of
sensors should be conducted as per the following methodology:
• Select the array of sensors that will be tested. These will need to include a mix of low
turnover and high turnover bays (i.e. where spaces turnover 1 – 2 times per day - and spaces
that turnover every hour)
• Sample of bays to be over 50 sensors
• Sample over at least 2 days with differing conditions. This may be 1 hot day and 1 wet day
for example. This is not a critical requirement.
• Have survey staff monitor the movement of a sample of parking bays each (perhaps 20 – 50
bays per person). They are to have a calibrated clock in sync to the sensor management
system within 1 second accuracy. They are to have a map of their assigned parking areas
with a space to note the time of each vehicle movement relating to each space.
• As each car un-parks or parks in each bay, the surveyor must check the exact time that the
car moves out of the parking space.
• This is done over a minimum of 8 hours
• If the parking area has Variable message signs, these are being monitored also. At random
intervals the VMS sign is to be observed, noting the stated vacancies on the LED display and
the exact times the counter changes.
• The data is then compiled, and the following analysis is conducted:
1. Calculate parking occupancy accuracy. This is done by comparing the surveyor’s
occupancy observations against what is stated on the system. There may be latency
between the data (30seconds to 2 minutes difference). This is not an error in
occupancy – but a separate issue of latency
2. Calculate session accuracy. This is done by comparing the length of stay for each
parking car (observed) against the length of stay noted on the system. This is how
long a car has remained in a space.
3. Compare overstay alerts to the ranger’s portal – with what has been observed on-
site
4. Determine latency between what is observed and when it is updated on the
management system
5. Calculate False negatives
6. Calculate False Positives

Wireless Sensor Networks and their Impact on Municipal Parking Strategy
46
Glenn Caldwell 2018
7. Determine which spaces are ‘stuck’. i.e. always showing a car is present – or always
showing a space is vacant.
Note: ‘Session accuracy’ is the most relevant statistic with regards to summarising the integrity of a
particular sensor.

Wireless Sensor Networks and their Impact on Municipal Parking Strategy
47
Glenn Caldwell 2018
CONCLUSIONS AND NEXT STEPS
TECHNOLOGY
• Infrared is not a viable solution for in-ground sensors. At present Infrared solutions use a
secondary technology to crosscheck reading accuracy. There is some evidence that shows an
improvement in performance in the short term for some of the newer models of hybrid
sensors. However they do not reach the standard or performance against the better Nano-
radar and Magnetometer sensors. They are also expected to start failing sooner due to poor
power management.
• Sensors using dual technologies (e.g. magnetic and Infrared), indicates they are using one
inferior solution to offset the weaknesses of another inferior solution - whereby any success
(resulting from the software and algorithms), is likely to consume battery power.
• AMR magnetometers are a viable solution and have benefits over Infrared technology
provided it has been well developed.
• Impulse radar may be the prevailing technology in the long term and is ultimately the most
robust against noise and obstructions.
• The way to predict the pedigree of a particular vendor is keep in mind some basic concepts:
o Small form factor. This will reduce the devices footprint on the road. It can be easily
replaced. Most likely the battery is small indicating the developer has considered
power consumption to an advanced level.
o Communication Protocols. LoRa and LoRaWAN at a minimum
o Session accuracy is more important than occupancy accuracy. If a sensor provider
can only reliably provide occupancy accuracy - then there is no long-term viability of
their technology as they will inevitably be building on an inferior sensor architecture.
Alternatively, a provider that can provide high session accuracy would have the
technical capacity to detune their sensor to accommodate better occupancy
accuracy. Even better still is a sensor technology that can provide statistical data for
both vehicle movements and enforcement accuracy as required.
• Impulse Radar UWB (Nano Radar), is probably the most important long-term solution - not
just in the field of vehicle detection, but for a wide array of applications including medical
imaging. Therefore it may be the best contender over the long term. However the vendors
will need to accept a reduction in unit costs considering the fact their technology can be
developed relatively cheaply and uses very little power.
• Second to Nano-Radar is AMR magnetometers – a highly viable option and currently cheaper
than Nano-radar (up to 4 times less expensive). These are gaining wide success and will be
able to incorporate the latest technical advances in communication, they are very low
power. The only set back with these technologies is that the external noise must be
managed repeatedly by recalibrating the device with complex algorithms.

Wireless Sensor Networks and their Impact on Municipal Parking Strategy
48
Glenn Caldwell 2018
NEXT STEPS
Councils around Australia and New Zealand (Including Universities) should be proactive and consider
a combined benchmarking study across some of the existing sensor installations. The study should
include an assessment of the industry leading technology providers for each technology type (Dual
Infrared+Magnetic; Magnetic; Nano-radar).
Some vendors may be reluctant to participate willingly with a study of this kind. However they can
be studied in-situ at any of the Vendor’s recent installations (with cooperation from the parking
authority).
Assuming a consortium of councils can cooperate under a single working group, a common
methodology can be employed to assess each sensor type.
Councils, vendors and parking authorities should adopt a set of performance measures that include
clear definitions of the following terms:
• Occupancy Accuracy
• Session Accuracy
• Latency – from device to enforcement handheld.
• Battery Consumption - standby, measurement, average
• Field tested
• Evidentiary material derived from sensors
FINAL NOTE
It is hard to predict what technologies will dominate IoT in the long term. One important factor will
be the long-term battery consumption of both the sensing medium, and the communication
protocol. Telcos will have a strong influence in this arena and will continually push for more
coverage and monopoly over the IoT space. Nano-Radar is a very challenging technology to master
but has the added advantage of being able to double as both a sensing medium and a simple node-
to-node communication medium - without the need for LoRa or Sigfox. Nano-radar developers
therefore can continue in a futureproof technology. AMR magnetic technology does however ride on
the back of the widespread use of magnetometers, therefore is still a long-term solution for vehicle
sensing. However sensors that are based on infrared technology (as a single solution or in
conjunction with another sensor technology), cannot be considered sustainable.

Wireless Sensor Networks and their Impact on Municipal Parking Strategy
49
Glenn Caldwell 2018
LIMITATIONS
This study referred to field data that included a limited sample size.
Additional studies will be required to include detailed analysis of session-level accuracy across a
variety of sensors
Standards relating to Bandwidths vary depending on the Country
This study is not meant to advocate a particular brand of sensor or a particular type of technology
over any other, whether the reader interprets this to be the case within the context of this report, or
otherwise.
REFERENCES
Parking Management Market Worldwide Market Forecasts & Analysis (2013 – 2018)
Caldwell & Kent Consulting Sensor Data based on various projects 2014 – 2017.
https://www.racv.com.au/membership/member-benefits/royalauto/motoring/information-and-
advice/car-running-costs.html
https://www.britannica.com/science/anisotropy
Novelda; https://www.xethru.com/
SF Park Pilot Project Evaluation, 2014
The High Cost of Free Parking, D. Shoup; 2004
LIGHT VEHICLE EMISSIONS STANDARDS FOR AUSTRALIA RESEARCH REPORT, Climate Change
Authority; June 2014
Australasian Transport Research Forum 2015 Proceedings 30 September - 2 October 2015, Sydney,
Australia; Value of Travel Time Revisited – NSW Experiment. Transport for NSW
Metrolab Technology SA 2017
Application Note – AN218 Vehicle Detection Using AMR Sensors, Honeywell International Inc.; 2005
Time-of-Flight 3D Imaging for Mixed-Critical Systems; N Druml, G Fleischmann, C Heidenreich, A
Leitner, H Martin, T Herndl, and G Holweg; Infineon Technologies Austria AG, Graz, Austria, July 2015
Polytechnic University of Turin; M Crepaldi, 2015
University of Oslo; T Sverre Lande; 2008
http://www.itsinternational.com/sections/cost-benefit-analysis/features/intelligent-parking-
guidance-relieves-congestion-reduces-costs/
FURTHER READING
SF Park; http://sfpark.org/wp-content/uploads/2014/06/SFpark_Pilot_Project_Evaluation.pdf

Wireless Sensor Networks and their Impact on Municipal Parking Strategy
50
Glenn Caldwell 2018
ABOUT THE AUTHOR
Glenn Caldwell is a parking and transport professional experienced in developing local government
parking strategies. Based in Wollongong Australia, he routinely consults to government agencies and
universities across Australia with regards to on-street parking technology. With the rapid increase in
popularity of the internet of things (IoT), he has started to take greater interest in the field of
Wireless Sensor Networks, which he considers will form an integral part of a long-term change in
Intelligent Transport Systems globally. He holds a Bachelor of Commerce, University of Western
Sydney; Grad. Dip. Transport, Monash University.