Who Moderates the Moderators? The Effect of Non-neutral Moderators in Deliberative Decision Making
Upload
independentCategory
view
4download
0
Who Uses Tips as a Reward for Service and When?
An Examination of Potential Moderators of the Service-Tipping Relationship
Michael Lynn*
School of Hotel Administration, Cornell University
552 Statler Hall, Ithaca, NY 14853-6902, USA
Tel: +1 607 255 8271
Email: [email protected]
Patrick Jabbour and Woo Gon Kim
Dedman School of Hospitality, College of Business, Florida State University
288 Champions Way, UCB 4116, Tallahassee, FL 32306-2541, USA
Tel: +1 850 644 82442
Email: pgj07 @fsu.edu and [email protected]
Key Words: tipping, service, relative thinking
Journal of Economic Psychology (forthcoming)
*Please address all correspondence regarding this paper to Michael Lynn.

1
ABSTRACT
Consumers in many countries often give voluntary payments of money (tips) to the
workers who have served them. These tips are supposed to be a reward for service and
research indicates that they do increase with customers’ perceptions of service quality.
This paper contributes to the service-tipping literature by examining numerous potential
moderators of this relationship in two studies. Results indicate that the service-tipping
relationship is robust across meal type, day of week, sex and race of server as well as
customers’ alcohol consumption, education, income, race, worship frequency, and
hospitality work experience, but that it is stronger for older consumers than for younger
ones and for parties with large bills than for parties with smaller bills. The practical and
theoretical implications of these and other findings are discussed.
Keywords: Tipping, service, relative thinking PsychINFO classification: 3000, 3920 JEL classification: M10, M50, D03, D10, L80, Z13

2
Who Uses Tips as a Reward for Service and When?
An Examination of Potential Moderators of the Service-Tipping Relationship
1. Introduction
Consumers in many countries often leave voluntary sums of money (tips) for
workers in the service industry who have served them. Among the many service workers
commonly tipped are bartenders, barbers, concierges, cruise cabin stewards, delivery
drivers, doormen, exotic dancers, golf caddies, hotel maids, musicians, parking valets,
porters, restaurant waiters, taxicab drivers, and tour guides (Star, 1988). Although the
amounts given by a single customer to any one worker are typically modest, they are not
negligible. For example, tipping typically increases the cost of dining out by 10 to 16
percent and often increases the costs of taxicab rides by 7 to 12 percent depending on the
country in which the service occurs (Lynn and Lynn, 2004). Moreover, the total amount
tipped to all workers is substantial with one estimate placing the annual tips in the United
States alone at over $45 billion (Azar, 2011a). Understanding the motivations, causes,
and processes underlying this behavior is important from both a practical and theoretical
perspective.
From a practical perspective, tipping affects the perceptions and experiences of
consumers (Lynn and Withiam, 2008), the incomes, attitudes, and behaviors of service
workers (Kwortnik, Lynn and Ross, 2009; Lynn, 2002; Lynn, Kwortnik and Sturman,
forthcoming), and ultimately the performance and profitability of service firms (Azar,
2011a; Lynn and Withiam, 2008; Schwartz, 1997). A better understanding of the
determinants of tipping would inform consumers’ efforts to reform the practice (May,
1980), servers’ efforts to increase their incomes (Lynn, 2011a), service managers’ efforts

3
to train and motivate their employees (Azar, 2004a; Lynn, 2005), and executives’ efforts
to expand into new geographic markets and to set optimal pricing and tipping policies
(Azar, 2003; Lynn, 2004; Lynn and Withiam, 2008).
From the perspective of neoclassical economic theory, tipping appears to be
irrational (Lynn, 2006; Saunders & Lynn, 2010). Tips are not legally required and are not
given until after service is delivered, so they are not necessary to ensure good current
service. If tip sizes are made contingent on service quality they could be used to buy
future service, but repeated failures to find a service quality by patronage frequency
interaction effect on tip size undermines this potential rational explanation for tipping
(Azar, 2009; Conlin, Lynn and O’Donoghue, 2003; Lynn and McCall, 2000) as does the
fact that people tip in establishments they will never revisit (Kahneman, Knetsch and
Thaler, 1986). An adequate explanation of tipping must go beyond a rational economic
motivation and embrace psychological motivations such as desires to reward good
service, help servers, and gain social approval or status (Lynn, 2006; Saunders and Lynn,
2010). A better understanding of the motivations and causes underlying tipping would
inform economists’ and other scholars’ attempts to build more realistic and
comprehensive theories and models of consumer behavior.
2. Research on the Service-Tipping Relationship
Research on tipping has appeared in the journals of such diverse disciplines as
anthropology, economics, hospitality management, services marketing, psychology,
sociology, and tourism (see Azar, 2007a, and Lynn, 2006, for reviews). A recurring
theme in this research is the relationship between tipping and service. Tips are supposed
to be an incentive/reward for service, so researchers have repeatedly examined the

4
relationship between ratings of service and tip size, especially in restaurant settings. This
research repeatedly supports three conclusions about the service-tipping relationship – (i)
restaurant tips do increase with service ratings, though the relationship is weak (Azar,
2009; Lynn and McCall, 2000), (ii) the service-tipping relationship is not moderated by
patronage frequency (Azar, 2007a; Conlin, Lynn and O’Donoghue, 2003; Lynn and
McCall, 2000), and (iii) some individuals base their restaurant tips on service more than
do other individuals, though what specific traits or characteristics underlie these
individual differences is unclear (Lynn and Sturman, 2010; Rogelberg, Ployhart, Blazer
and Yonker, 1999).
In addition to the above consistent findings, limited evidence suggests that the
tendency to increase tips with service quality is stronger among Asian and Hispanic
consumers than White consumers (Lynn and Thomas-Haysbert, 2003), among older
consumers than young ones (Lynn and Katz, forthcoming), and among those who attend
religious worship services less frequently (Lynn and Katz, forthcoming). Furthermore,
isolated findings in the published literature suggest that the service-tipping relationship
may be stronger on weekdays than weekends (Conlin, Lynn and O’Donoghue, 2003), for
waiters than waitresses (Lynn and Simons, 2000), for dinner than lunch (Lynn and
Simons, 2000), and for white servers than black servers (Lynn, Sturman, Ganley, Adams,
Douglas and McNeil, 2008). These isolated findings are interesting, but need to be
replicated.
This paper contributes to the literature on the service-tipping relationship by
attempting to replicate many of the isolated findings of moderation effects described
above and by testing several potential new moderators, namely customer political
5
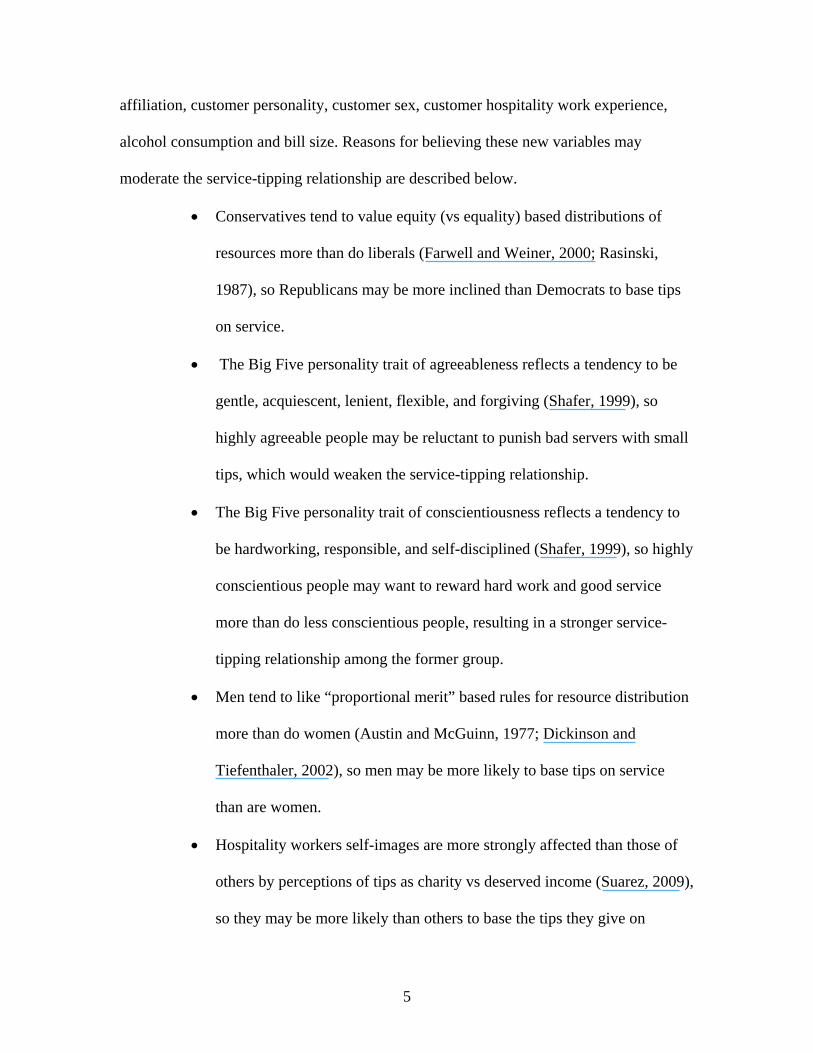
affiliation, customer personality, customer sex, customer hospitality work experience,
alcohol consumption and bill size. Reasons for believing these new variables may
moderate the service-tipping relationship are described below.
Conservatives tend to value equity (vs equality) based distributions of
resources more than do liberals (Farwell and Weiner, 2000; Rasinski,
1987), so Republicans may be more inclined than Democrats to base tips
on service.
The Big Five personality trait of agreeableness reflects a tendency to be
gentle, acquiescent, lenient, flexible, and forgiving (Shafer, 1999), so
highly agreeable people may be reluctant to punish bad servers with small
tips, which would weaken the service-tipping relationship.
The Big Five personality trait of conscientiousness reflects a tendency to
be hardworking, responsible, and self-disciplined (Shafer, 1999), so highly
conscientious people may want to reward hard work and good service
more than do less conscientious people, resulting in a stronger service-
tipping relationship among the former group.
Men tend to like “proportional merit” based rules for resource distribution
more than do women (Austin and McGuinn, 1977; Dickinson and
Tiefenthaler, 2002), so men may be more likely to base tips on service
than are women.
Hospitality workers self-images are more strongly affected than those of
others by perceptions of tips as charity vs deserved income (Suarez, 2009),
so they may be more likely than others to base the tips they give on

6
service as both a reflection and reinforcement of their motivated
conviction that tips are and should be earned.
Alcohol reduces people’s cognitive abilities and makes them more
myopic, which means that intoxicated people’s behavior is more strongly
influenced by the highly salient cues in a situation and less influenced by
those cues that are less salient (Steele and Josephs, 1990). Thus, alcohol
consumption could increase or decrease the service-tipping relationship
depending on how salient service is to tippers at the time they make their
tipping decisions.
Bill size combines with tips to make up the monetary costs of dining out at
a restaurant. Research suggests that consumers often assess changes to
costs in relative terms such that a $5 increase affects consumers less when
the base price is $200 than when it is $20 (Azar, 2007c, 2011b). If this
relative thinking occurs in restaurants, then differences in absolute tip
amounts would seem smaller the larger the bill size and dollar tips should
increase with service more the larger the bill size.
These and the previously identified moderators of the service-tipping relationship are
examined in the two studies reported below. Study 1 uses data from consumer diaries
kept by a student sample. To address issues of generalizability across methods and
samples, Study 2 uses data from an online survey taken by a more diverse and wealthier
sample from a commercial consumer panel.

7
Study 1
Study 1 used a consumer diary methodology to assess the effects on tip amounts
of service interactions with experience working for tips, customer sex, customer race,
server sex, server race, weekend (vs weekday), meal type, alcohol consumption, and bill
size.
3.1 Method
Students in a hospitality course at a university in the southern United States were
promised extra class credit in exchange for participation in a multi-week study of
restaurant tipping. Participants first completed a questionnaire (called “personal
information”) containing questions about their sex (male= 1, female =2), age (in years),
race (coded as white =1 and non-white = 0 due to small numbers of specific types of non-
white participants), and hospitality/restaurant work experience (yes = 1, no = 0).
Gosling, Rentfrow and Swann’s (2003) ten item measure of the Big Five personality
traits was also included in this questionnaire, but its items did not load on the five
expected factors and the subscale reliabilities were very poor, so it was not used in these
analyses.
Then, over the next four weeks, participants completed brief questionnaires
(called “journal entries”) about specific commercial eating and drinking experiences
where they were responsible for paying at least part of the bill. Participants were given
six dining experience surveys and asked to complete one each time they went out to eat
or drink during the study period. Information from each dining experience survey was
coded into the following variables:
(1) weekend (F, Sa, Su: yes = 1, no = 0),
8
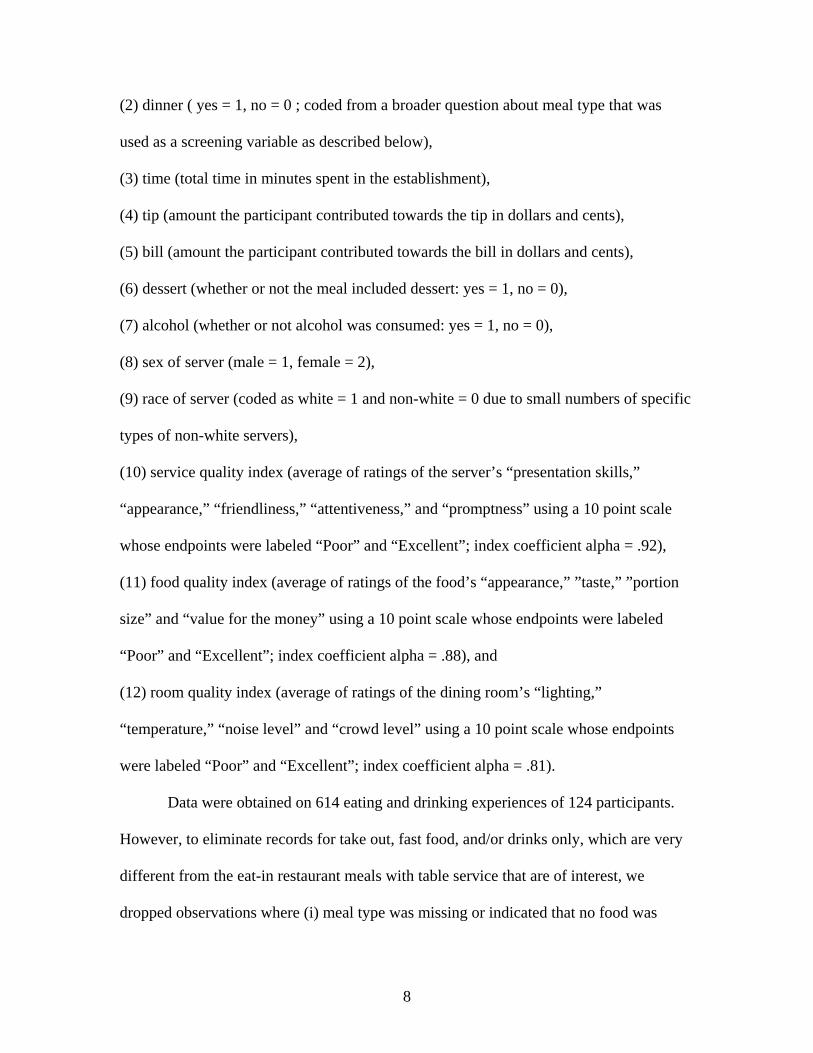
(2) dinner ( yes = 1, no = 0 ; coded from a broader question about meal type that was
used as a screening variable as described below),
(3) time (total time in minutes spent in the establishment),
(4) tip (amount the participant contributed towards the tip in dollars and cents),
(5) bill (amount the participant contributed towards the bill in dollars and cents),
(6) dessert (whether or not the meal included dessert: yes = 1, no = 0),
(7) alcohol (whether or not alcohol was consumed: yes = 1, no = 0),
(8) sex of server (male = 1, female = 2),
(9) race of server (coded as white = 1 and non-white = 0 due to small numbers of specific
types of non-white servers),
(10) service quality index (average of ratings of the server’s “presentation skills,”
“appearance,” “friendliness,” “attentiveness,” and “promptness” using a 10 point scale
whose endpoints were labeled “Poor” and “Excellent”; index coefficient alpha = .92),
(11) food quality index (average of ratings of the food’s “appearance,” ”taste,” ”portion
size” and “value for the money” using a 10 point scale whose endpoints were labeled
“Poor” and “Excellent”; index coefficient alpha = .88), and
(12) room quality index (average of ratings of the dining room’s “lighting,”
“temperature,” “noise level” and “crowd level” using a 10 point scale whose endpoints
were labeled “Poor” and “Excellent”; index coefficient alpha = .81).
Data were obtained on 614 eating and drinking experiences of 124 participants.
However, to eliminate records for take out, fast food, and/or drinks only, which are very
different from the eat-in restaurant meals with table service that are of interest, we
dropped observations where (i) meal type was missing or indicated that no food was
9
served, (ii) no tip was given or recorded, (iii) meal duration was unrecorded or less than
15 minutes, and (iv) bill size was unrecorded or less than $3. In addition, cases where
entries duplicated a previous entry from that subject were also deleted. This resulted in
466 eat-in restaurant dining experiences from 122 participants being available for
analysis. The number of dining experiences per participant ranged from 1 to 6 with a
mean of 4.5 and a standard deviation of 1.3. In order to avoid further loss of observations
from occasional missing values for some predictor variables, missing values were
replaced with the means of continuous predictors and the modes of categorical predictors.
See Table 1 for descriptive statistics on the final sample.
3.2 Results
The data were analyzed using fixed-effects regression that provided within-
subjects estimation of the regression coefficients and robust standard errors adjusted for
clusters in subject. Model 1 predicted tip amount (in dollars and cents) from bill, bill
squared, time, dinner, alcohol, dessert, weekend, server sex, server race, food index,
room index, and service index as main-effect predictors (R2 within = .895, F model (13, 120)
= 66.70, p < .0001). The results of this analysis indicated that tip amounts significantly
increased with bill size, time duration of the meal, and service quality (see Table 2).
These effects all make sense - the positive effect of bill size is consistent with the 15 to
20 percent tipping norm, the positive effect of time spent on the meal compensates the
server for the lost opportunity of seating and serving other customers at the table, and the
positive effect of service quality compensates the server for doing a good job.
Model 2 included all the main effects from Model 1 plus the interactions of
service with hospitality work experience, customer sex, customer race, customer age,

10
weekend, server sex, server race, dinner, alcohol consumption, and bill size (R2 within =
.91, F model (22, 121) = 285.80, p < .0001). The only variables to significantly moderate
the effects of service in this analysis were customer sex and bill size (see Table 2).
Surprisingly, women increased their tips with service quality to a greater degree than did
men. This finding is contrary to previous research indicating that men more than women
prefer merit-based over equality-based distributions of rewards (Austin and McGuinn,
1977; Dickinson and Tiefenthaler, 2002). The current result suggests that this sex-based
preference is context specific, though specifically what about the restaurant tipping
context causes it to be reversed is not clear. The other moderation effect was more in line
with expectations. Consistent with relative thinking theory (Azar, 2007c), tips increased
with service more the larger the bill was.
Some might argue that relative thinking in tipping contexts is caused by a
situation specific social norm that calls for tipping 15 to 20 percent of the bill rather than
a generalized way of thinking. People could comply with the tipping norm by taking all
factors into consideration, deciding on a tip percentage, calculating that amount, and
leaving it as a tip. If that is what people did, it could explain our results without a
generalized tendency for relative thinking. However, the tipping norm does not require
this percentage thinking; all it requires that final tip amounts fall within 15 to 20 percent
of the bill size. Moreover, given weak math skills (Lipkus, Samsa and Rimer, 2001) and a
general distaste for effortful thinking (Gararino and Edell, 1997), it seems unlikely that
most consumers would follow the norm in that way. It is more likely that consumers use
some easy to calculate standard tip percentage (whether 10%, 20%, or double the sales
tax) to get within the normative ballpark, but otherwise think about how much to tip in

11
dollars and cents. For example, someone with a $30.00 bill might calculate 15 percent of
the bill to be $4.50, decide the service warrants a larger than standard tip, and round the
calculated amount up to $6.00. Alternatively, that person might decide to tip $5.00 and
then do some simple calculations make sure that amount is more than 15 percent.
Some support for the idea that people think about precisely how much to tip in
dollar rather than percentage terms can be found in scatter plots of percentage tip against
bill size (Figures 1) and dollar tip against bill size (Figure 2).1 Clearly tip amounts are
clustering around dollar amounts rather than percentages. Importantly, specific dollar tip
amounts are associated with a wide range of bill sizes, so people are not simply rounding
selected normative tip percentages to the nearest dollar. If people are selecting precise
percentages to tip, then two unlikely things are happening. First, many people are
deliberately selecting tip percentages that fall well outside the normative range – e.g., 30
to 60 percent of the bill size. Second, people are undermining their selection of tip
percentages by rounding the calculated amount to a whole dollar. More likely is that the
vast majority of consumers think about and leave tips in whole dollar amounts that range
from one to six dollars with the choice of a larger whole dollar amount occurring more
frequently the larger the bill so that the tip amount exceeds the 15 percent minimum
mandated by the tipping norm. This is a plausible mental process that is simple and
consistent with what we know about people being cognitive misers and social
conformists. Furthermore, it plausibly explains very large percentage tips as the result of
1 The graphs’ ranges are restricted to show the bulk of the data in greater detail. This restriction encompassed the vast
majority of the observations and did not distort the overall pictures of the relationships. A regression of percent tip on bill size and bill size squared produced both a significant negative linear effect (B = -.27, t (463) = -5.22, p < .001) and a significant positive quadratic trend (B = .001, t(463) = 3.79, p < .001). A regression of tip amount on bill size, bill size squared and bill size cubed produced a significant linear relationship (B = .16, t (462) = 10.61, p < .001) with no quadratic (B = .000, t(462) = 1.05, n.s.) or cubic (B = -.000, t (462) = -1.13, n.s.) trends.

12
decisions to leave modest dollar tips (in the one to six dollar range) when the bill size is
small.
If, as the data suggest, consumers think about precisely how much to tip in dollar
terms rather than in percentage terms, then our finding that delivering good service brings
larger returns (in terms of tip amounts) the larger the bill size is unlikely to be a context
specific, norm driven tendency to choose and leave percentage tips. Instead it reflects a
more general tendency to think in relative terms. Most of the previous evidence
supporting relative thinking comes from hypothetical scenarios and a previous “real
world” test failed to find evidence for it, leading the investigators to suggest that
“financial incentives might alleviate relative thinking” (Azar, 2010). Our findings
suggest that conclusion was premature - relative thinking does occur in the face of
financial incentives in the real world.
To see if the relative thinking effect generalizes, we ran an additional analysis to
test the interaction of bill size with the other variable producing meaningful main effects
– i.e., time duration of the meal. This analysis also involved fixed-effects regression that
provided within-subjects estimation of the regression coefficients and robust standard
errors adjusted for clusters in subject. In this model, tip amount (in dollar and cents) was
predicted from bill, bill squared, time, dinner, alcohol, dessert, weekend, server sex,
server race, service index, food index, room index, the interactions of service with
customer sex and bill size, and the interactions of bill size with time (R2 within = .91, F
model (15, 121) = 259.82, p < .0001). This analysis produced a significant negative bill x
time interaction (see Table 2). Spending more time at the table increased tips less the
larger the bill. This effect is opposite of what we initially expected based on relative

13
thinking. Upon reflection, however, the interaction of bill and time spent at the table is a
poor test of relative thinking theory (Azar, 2007c). Presumably, time spent at the table
increases tip size relative to bill size as a way of compensating the server for the lost
opportunity to seat and serve other paying/tipping customers. In other words, it is
compensation for slow or lingering customers’ inefficient use of the table from the
restaurant and servers’ perspective, or put another way, for slow or lingering customers’
low ratio of bill amount to table-time. However, the larger the bill size the larger the ratio
of bill amount to table-time (the more efficient the customers’ use of the table), so there
is less need for a compensatory increase in tip size relative to bill size. Looked at this
way, the negative interaction of bill size and table-time says nothing about relative
thinking theory, but does provide some evidence supporting the “compensation for lost
opportunity” explanation of the positive table-time main effect.
Although not a major focus of this paper, we also performed a between subjects
regression of tip amount on the situational, main-effect predictors in Model 1 (in other
words, we used the same model but without controlling for subject identity) and then
averaged the residuals within subjects to get a measure of individual differences in
tipping that controlled for those situational, main-effect predictors. We then used these
mean residuals as a dependent measure in a regression model that included the subject’s
age, sex, race, and hospitality work experience as predictors. This analysis, which used
heteroskedasticity robust standard errors, produced no significant effects for either the
model as a whole (F model (4, 117) = 1.19, n.s.) or any of the individual predictors (all t-
values < 1.50, n.s.).

14
4. Study 2
Study 2 used an internet survey to assess the effects on tip amounts of service
interactions with experience working for tips, conscientiousness, agreeableness, age, sex,
race, education, income, religious worship frequency, political affiliation and bill size. In
addition, it asked subjects to choose which of several processes best describes how they
determine tip amounts and allowed us to test the interaction between service and bill size
among consumers who say they do not deliberately choose a specific tip percentage.
4.1. Method
In Study 2, members of the Survey Sampling International consumer panel who
were at least 18 years old and resided in the United States were invited to participate in a
survey concerning tipping. An attempt was made to get 200 Whites, 200 Hispanics, and
200 Blacks in the sample, so stratified sampling was used in sending out the invitations.
The obtained sample consisted of 384 Whites, 229 Blacks, 215 Hispanics and 36 people
of other or unknown race for a total of 864 participants. However, outliers (identified
below) and missing values for some variables meant that data from only 687 participants
were included in the analysis. See Table 3 for descriptive statistics on the final sample.
Survey participants were asked to indicate how much in dollars and cents they
would tip on one of two randomly assigned bill sizes ($21.32 or $46.23) if the service
was “unusually good,” “average” and “unusually bad.” Thus tipping was measured across
three within-subject levels of service quality and two between-subjects levels of bill size.
Data from 16 participants who listed one or more tip amounts that exceeded the bill size
were dropped from analysis as outliers.

15
Among other questions, participants were also asked to provide information
about:
(i) whether or not they had “ever worked for tips before” (yes=1, no = 0),
(ii) their personality using Langford’s (2003) single item measures of the Big Five
personality traits (only Conscientiousness and Agreeableness were theoretically
relevant and, therefore, used in the analyses),
(iii) their birth year (recoded as age; four impossible answers to this question were
recoded as missing values),
(iv) their race (coded into two dummy variables: Black (yes=1, no =0) and
Hispanic (yes=1, no =0), Other Ethnicity (including missing values; yes=1, no=0)
so that each of these ethnicities were contrasted with Whites in the analyses),
(v) their education (on an 8 point ordinal scale from 1= “less than high school” to
8 = “professional degree (JD,MD)”),
(vi) their income (on a 9 point ordinal scale from 1= “below $20,000” to
9=”$90,000 or more”),
(vii) their political affiliation (coded into two dummy variables: Democrat (yes=1,
no=0), Independent (yes=1, no=0), Other Political Affiliation (including missing
values; yes=1, no=0) so that each of these groups were contrasted with
Republicans in the analyses),
(viii) how often they “attend religious worship services” (on a 7 point ordinal
scale from 1= “once a year or less” to 7=”once a day or more”), and
(ix) the way they “decide how much to leave as a tip” (on a nominal scale with
the following options: A = ”I decide on some dollar amount without calculating a

16
percentage of the bill,” B = “I always calculate the same standard percentage of
the bill and leave that amount,” C = “I calculate some standard percentage of the
bill and then adjust that dollar and cents amount up or down depending on the
circumstances,” D = “I decide what percent of the bill to tip under the
circumstances, calculate what that percentage amounts to in dollars and cents, and
leave that amount (or very close to it),” and E = “Other”).
4.2 Results
The data were analyzed with a repeated measures general linear model in which
tip amount was the dependent variable, service quality was a within-subjects factor, and
worked for tips, conscientiousness, agreeableness, age, sex, Black, Hispanic, education,
income, Democrat, Independent/Tea-Party/other, and bill size were between subjects
covariates and moderators of service effects (see Tables 4 and 5). This analysis produced
significant main effects for service (F (2,1342) = 3.93, p < .03), worked for tips (F(1,
671) = 7.49, p < .007), Black (F(1, 671) = 13.19, p < .001), Hispanic (F(1, 671) = 13.17,
P < .001), age (F(1, 671) = 10.36, p < .002) and bill size (F(1, 671) = 282.77, p < .001).
Tips increased with service, experience working for tips, and bill size and decreased with
age (see Tables 6 - 8). In addition, Blacks and Hispanics tipped less than Whites (see
Tables 6 – 8). All these effects are consistent with previous research (see Lynn, 2006).
More importantly for our purposes, service interacted significantly with age (F(2,
1342) = 5.84, p < .004), Independent (F(2, 1342) = 3.88, p < .03), customer sex (F(2,
1342) = 2.62, p < .07) and bill size (F(2, 1342) = 58.51, p < .001). Figure 3 displays the
service by age interaction. Although the graph shows a median split on age, the actual
analysis treated it as a continuous measure. What is clear from the graph, as well as

17
from separate regression analyses for each level of service (see Tables 6 – 8), is that tips
decline with age more when service is unusually good and bad than when service is
average (B’s = -.03 and -.02 vs -.01). This means that older consumers are more likely
than younger consumers to punish bad service with small tips (compared to those they
give for average service) but less likely to reward unusually good service with large tips
(compared to those they give for average service).
This finding is superficially different from that reported by Lynn and Katz
(forthcoming), who found a negative effect of age on tips when service is bad, but not
when service is good. However, it is possible that respondents in Lynn and Katz’s survey
interpreted good service the same way our respondents interpreted average service since
the average consumer rating of service is very positive (see Lynn, 2000). If respondents
in Lynn and Katz’s did interpret “good service” as normal or average, then the results of
the two studies are consistent in finding negative effect of age under bad service but not
under average/normal service. Given research showing that older consumers are also less
likely than younger consumers to be concerned with impressing servers or tipping for
self-presentational reasons (Lynn, 2009), this finding makes sense because punishing bad
service with lower tips risks the server’s disapproval and older consumers should be less
concerned about this risk than young ones.
Our study goes beyond Lynn and Katz’s (forthcoming) study in asking about tips
when service is “unusually good.” Thus, our finding that tips decline with age under this
condition is new. Note that the young and old both reward good service with larger tips,
but that the increase is larger for younger tippers (see Figure 3). Since younger tippers are
more concerned than older consumers about self-presentational motives for tipping

18
(Lynn, 2009), it is possible that they simply exaggerated their claims about the extent to
which they would reward good service in order to look good. To rule out this possibility,
future research needs to test the age by service interaction using actual rather than just
self-reported tip amounts.
Figure 4 displays the service by Independent interaction, which indicates that those
who describe themselves as political independents vary their tips with service quality more
than do Republicans. Since Independents tend to be less consistently conservative than
Republicans, this finding goes against our theoretical expectation that conservatives (who
favor equity over equality based distributions of resources) would tip based on service more
than liberals (who favor equality over equity based distributions of resources). We could
come up with no convincing theoretical explanation for the stronger service-tipping
relationship among political independents than among Republicans, so this interaction may
be a Type-II error. It needs to be replicated before much is made of it.
Figure 5 displays the service by customer sex interaction. Although only
marginally significant using a two-tailed test, we had a theoretically based expectation
about the direction of the effect, so a one-tailed test is appropriate. Using a one-tailed test,
the sex by service interaction was significant (p < .05). As expected, the tips of men
varied with service more than did the tips of women (see Figure 3). This finding is
opposite of that in Study 1, but is consistent with previous research finding that men more
than women prefer equity or merit based distributions of resources (Austin and McGuinn,
1977; Dickinson and Tiefenthaler, 2002).
Figure 6 displays the service by bill size interaction, which indicates that tips
increase with service more strongly the larger the bill size. This effect is consistent with

19
relative thinking theory (Azar, 2007c). According to this theory, people consider relative
differences between prices rather than absolute differences when making economic
decisions. As discussed previously, some might argue that relative thinking in tipping
contexts is caused by a situation specific social norm that calls for tipping a percentage of
the bill rather than by a generalized way of thinking. However, the restaurant tipping
norm only requires that the tip fall within a range of 15 to 20 percent of the bill; it does
not require people to think about service-based adjustments to their tips in percentage
terms. In fact, only 13 percent of our respondents said they select and leave specific tip
percentages based on the circumstances. Thirty four percent of the respondents in this
study indicated that they calculate a standard percentage of the bill and then adjust that
dollar and cent amount up or down depending on the circumstances and another 35
percent indicated that they decide on dollar and cent tip amounts without ever calculating
a percentage of the bill. Furthermore, when we confined our analyses to these latter two
groups of respondents, we replicated the service by bill size interaction (B’s for bill size
under good, average and bad service = .14, .11, and .07 respectively; F-test of interaction
(2, 912) = 29.08, p < .001). People who think about tipping in terms of dollars and cents
reward service more when their bills are larger. Thus, the service by bill size interaction
is attributable to a generalized tendency toward relative thinking rather than a context
specific, norm driven tendency to choose and leave a specific tip percentage based on
service.

20
5. Discussion
Tipping is supposed to be a reward for service, so tip amounts should and do
increase with customers’ perceptions of service quality (Azar, 2009; Lynn and McCall,
2000). Although isolated findings from previous research suggested that this relationship
may be stronger on weekdays than weekends (Conlin, Lynn and O’Donoghue, 2003), for
dinner meals than lunch meals (Lynn and Simons, 2000), for waiters than waitresses
(Lynn and Simons, 2000), for white servers than black servers (Lynn, Sturman, Ganley,
Adams, Douglas and McNeil, 2008), among those who attend religious services less
frequently (Lynn and Katz, forthcoming), and among Asian and Hispanic consumers than
White consumers (Lynn and Thomas-Haysbert, 2003), the current studies failed to
replicate these interaction effects. In addition, several potential moderators of the service-
tipping relationship tested here for the first time – customers’ hospitality work
experience, alcohol consumption, conscientiousness, agreeableness, education and
income – also failed to interact significantly with service ratings. Of course, null results
could be due to lack of statistical power, so firm conclusions about these potential
moderators are not yet possible. Nevertheless, the overall picture to emerge from these
studies is that the service-tipping relationship is fairly robust and may not vary in strength
as much as the previous literature suggests. Three variables that did moderate the service-
tipping relationship in these studies were customer sex, customer age, and bill size. Each
is discussed in greater detail below.
Customer sex moderated the effects of service on tipping in both of the current
studies, but the direction of the moderation effect was inconsistent. In Study 1, the effects
of service were stronger when the customer was female, but in Study 2, the effects of

21
service were stronger when the customer was male. The latter effect is consistent with
and may be attributed to a tendency for men to prefer performance based distributions of
rewards more than do women (Austin and McGuinn, 1977; Dickinson and Tiefenthaler,
2002), but the former effect suggests that customer sex may influence tipping in other
ways as well. Clearly, the interaction of customer sex and service deserves further
investigation in future research.
Another variable that moderated the service-tipping relationship in Study 2 was
customer age. Of particular interest was the finding that older consumers were more
likely than younger consumers to punish bad service with small tips (compared to those
they give for average service). This finding is consistent with that of Lynn and Katz
(forthcoming) if respondents in their study interpreted what was described as “good
service” as normal or average, as seems likely given the fact that the average consumer
rating of restaurant service is very positive (see Lynn, 2000). Given research showing
that older consumers are also less likely than younger consumers to be concerned with
impressing servers or tipping for self-presentational reasons (Lynn, 2009), it makes sense
that older consumers would be more likely to risk server disapproval by punishing bad
service with lower tips. This effect was not found in Study 1, but the variance in age was
much smaller in that study than in Study 2 (standard deviations = 3.37 vs 16.09
respectively), so this failure to replicate is neither surprising nor informative.
Arguably the most important variable to moderate the service-tipping relationship
was bill size. Tip amounts increased with service more strongly the larger the customers’
bill sizes in both Studies 1 and 2. This effect is consistent with relative thinking theory
(Azar, 2007c), which posits that people consider relative differences between prices

22
rather than absolute differences when making economic decisions. Most of the previous
evidence supporting relative thinking comes from hypothetical scenarios and a previous
“real world” test failed to find evidence for it, leading the authors to suggest that
“financial incentives might alleviate relative thinking” (Azar, 2010). Our finding in
Study 1 suggests that conclusion was premature - relative thinking does occur in the face
of financial incentives in the real world. From a practical perspective, relative thinking in
general and our findings in particular mean that servers interested in earning more tips
should devote a disproportionate share of their selling and service efforts to those dining
parties they know or expect to have larger bills, because the marginal return on those
efforts will be greater the larger the bill size.
Although not the primary focus of this paper, we also found that tip amounts after
controlling for bill size increased with the amount of time customers spent on the meal
occasion and that this increase was itself larger the smaller the dining parties’ bill sizes.
This is the first study that we know of to test and observe these effects. They are
important because they suggest that consumers think about and voluntarily compensate
servers for the opportunity costs that their lingering imposes on servers. Of course, it is
not clear that this compensation matches the true value of the lost opportunity to seat and
server other customers, but it should help to make servers more tolerant of customers
who take their time eating and leaving.
In conclusion, tips are supposed to be a reward for service. Consistent with this
function, we found that restaurant tip amounts increased with perceived service quality
and that this relationship was robust across meal type, day of week, sex and race of server
as well as customers’ alcohol consumption, education, income, race, worship frequency,

23
and hospitality work experience. However, service quality did have a bigger effect for
parties with large bills than for those with smaller bills. In addition to providing evidence
for relative thinking in the face of real world financial incentives, this finding suggests
that servers interested in earning larger tips should devote a disproportionate share of
their selling and service efforts to those dining parties they know or expect to have larger
bills. Overall, these and other findings of the study suggest that although tipping is not
“rational” in the economic sense, it is orderly and understandable from a psychological
perspective. Hopefully, this paper will encourage more economists to adopt that
perspective when they study this and other topics.

24
REFERENCES
Austin, W. & McGinn, N.C. (1977). Sex differences in choice of distribution rules.
Journal of Personality, 45, 379-394.
Azar, O. (2003). The implications of tipping for economics and management.
International Journal of Social Economics, 30 (10), 1084-1094.
Azar, O. (2004a). Optimal monitoring with external incentives: The case of tipping.
Southern Economic Journal, 71 (1), 170-181,
Azar, O. (2007a). Do people tip strategically, to improve future service? Theory and
evidence. Canadian Journal of Economics, 40, 515-527.
Azar, O. (2007b). The social norm of tipping: A review. Journal of Applied Social
Psychology, 37, 380-402.
Azar, O. (2007c). Relative thinking theory. Journal of Socio-Economics, 36, 1-14.
Azar, O. (2009a). Incentives and service quality in the restaurant industry: The tipping-
service puzzle. Applied Economics, 41, 1917-1927.
Azar, O. (2010). Does relative thinking exist in real-world situations? A field experiment
with bagels and cream cheese. Economic Inquiry, no. doi. 10.1111/j.1465-
7295.2009.00285.x.
Azar, O. (2011a). Business strategy and the social norm of tipping. Journal of Economic
Psychology, 32, 515-525.
Azar, O. (2011b). Do people think about absolute or relative price differences when
choosing between substitute goods? Journal of Economic Psychology, 32, 450-457.
Conlin, M., Lynn, M. & O’Donoghue, T. (2003). The norm of restaurant tipping. Journal
of Economic Behavior and Organization, 52, 297-321.

25
Dickinson, D.L. & Tiefenthaler, J. (2002). What is fair? Experimental evidence. Southern
Economic Journal, 69, 414-428.
Farwell, L. & Weiner, B. (2000). Bleeding hearts and heartless: Popular perceptions of
liberal and conservative ideologies.” Personality and Social Psychology Bulletin, 26,
845-852.
Garbarino, E.C. & Edell, J.A. (1997). Cognitive effort, affect and choice. Journal of
Consumer Research, 24, 147- 158.
Gosling, S.D., Rentfrow, P.J. & Swann, W.B. (2003). A very brief measure of the big-
five personality domains. Journal of Research in Personality, 37, 504-528.
Kahneman, D., Knetsch, J.L. & Thaler, R. (1986). Fairness as a constraint on profit
seeking: Entitlements in the market. American Economic Review, 76, 728-741.
Kwortnik, R.J., Lynn, M. & Ross, W.T. (2009). Buyer montitoring: A means to insure
personalized service. Journal of Marketing Research, XLVI, 573-583.
Langford, P.H. (2003). A one-minute measure of the Big Five? Evaluating and abridging
Shafer’s (199a) Big Five markers. Personality and Individual Differences, 35, 1127-1140.
Lipkus, I.M., Samsa, G. & Rimer, B.K. (2001). Genral performance ona numeracy scale
among highly educated samples. Medical Decision Making, 21, 37-44.
Lynn, M. (2002). Turnover’s relationships with sales, tips and service across restaurants
in a chain. International Journal of Hospitality Management, 21, 443-447.
Lynn, M. (2004). Ethnic differences in tipping: A matter of familiarity with tipping
norms. Cornell Hotel and Restaurant Administration Quarterly, 45, 12-22.
Lynn, M. (2005). Increasing servers’ tips: What managers can do and why they should do
it. Journal of Foodservice Business Research, 8, 89-98.

26
Lynn, M. (2006). Tipping in restaurants and around the globe: An interdisciplinary
review. Chapter 31, pp. 626-643. In M. Altman (Ed.). Handbook of contemporary
behavioral economics: Foundations and developments. M.E. Sharpe.
Lynn, M. (2011a). Mega tips 2: More scientifically tested ways to increase your tips.
Unpublished manuscript, Center for Hospitality Research, Cornell University, Ithaca, NY.
Lynn, M. (2011b). A comparison of Asians’, Hispanics’ and Whites’ restaurant tipping.
Unpublished manuscript, Cornell University, Ithaca, NY
Lynn, M., Kwortnik, R. & Sturman, M. (forthcoming). Voluntary tipping and the selective
attraction and retention of service workers in the United States: An application of the
ASA Model. International Journal of Human Resources Management.
Lynn, M. & Lynn, A. (2004). National values and tipping customs: A replication and
extension. Journal of Hospitality and Tourism Research, 28, 356-364.
Lynn, M. & McCall, M. (2000). Gratitude and gratuity: A meta-analysis of research on the
service-tipping relationship. Journal of Socio-Economics, 29, 203-214.
Lynn, M. & Simons, T. (2000). Predictors of male and female servers’ average tip
earnings. Journal of Applied Social Psychology, 30, 241-252.
Lynn, M. & Sturman, M.C. (2010). Tipping and service quality: A within-subjects analysis.
Journal of Hospitality and Tourism Research, 34 (2), 269-275.
Lynn, M., Sturman, M.C., Ganley, C., Adams, E., Douglas, M. & McNeil, J. (2008).
Consumer racial discrimination in tipping: A replication and extension. Journal of
Applied Social Psychology, 38, 1045-1060.
Lynn, M. & Thomas-Haysbert, C. (2003). Ethnic differences in tipping: Evidence,
explanations and implications. Journal of Applied Social Psychology, 33, 1747-1772.

27
Lynn, M. & Withiam, G. (2008). Tipping and its alternatives: Business considerations
and directions for research. Journal of Services Marketing, 22, 328-336.
May, J.M. (1980). Looking for tips: An empirical perspective on restaurant tipping.
Cornell Hotel and Restaurant Administration Quarterly, 422-428.
Rasinski, K.A. (1987). What’s fair is fair: Or is it? Journal of Personality and Social
Psychology, 53, 201-211.
Rogelberg, S.G., Ployhart, R., Balzer, W. & Yonker, R. (1999). Using policy capturing to
examine tipping decisions. Journal of Applied Social Psychology, 29, 2567-2590.
Saunders, S.G. & Lynn, M. (2010). Why tip? An empirical test of motivations for tipping
car guards. Journal of Economic Psychology, 31 (1), 106-113.
Schwartz, Z. (1997). The economics of tipping: Tips, profits and the market’s demand-
supply equilibrium. Tourism Economics, 3, 265-279.
Shafer, A.B. (1999). Brief bipolar markers for the Five Factor Model of Personality.
Psychological Reports, 84, 1173-1179.
Star, N. (1988). The international guide to tipping. New York: Berkeley.
Steele, C.M. & Josephs, R.A. (1990). Alcohol myopia: It’s prized and dangerous effects.
American Psychologist, 45, 921-933.
Suarez, D. (2009). Restaurant tipping: Short-circuiting the morality of the market.
Research in Economic Anthropology, 29, 307-339.

28
Figure 1. Scatter plot of the relationship between percent tip and bill size (with reference
lines showing 5 and 20 percent tips).

29
Figure 2. Scatter plot of the relationship between tip amount and bill size (with reference
lines showing 5 and 20 percent tips).

30
Figure 3. Depiction of the service by age interaction effect on tip amounts.

31
Figure 4. Depiction of the service by political affiliation interaction effect on tip amounts.

32
Figure 5. Depiction of the service by customer sex interaction effect on tip amounts.

33
Figure 6. Depiction of the service by bill size interaction effect on tip amounts.

34
Table 1. Descriptive statistics for Study 1.
N Minimum Maximum Mean Std. Deviation
Customer Level Variables
Sex (M =1, F =2) 122 1 2 1.68 .468
Age 122 18 46 21.57 3.367
Race
(W = 1, Other =0)
122 0 1 .76 .42743
Hospitality
Experience
122 0 1 .75 .432
Number Dining
Experiences
122 1 6 4.53 1.34
Dining Experience Level Variables
Tip 466 .07 36.00 3.7856 3.67293
Bill 466 3.19 196.27 19.0056 20.31928
Table-Time 466 15.00 310.00 75.2597 35.46380
Dinner (Y/N) 466 .00 1.00 .6052 .48934
Alcohol (Y/N) 466 .00 1.00 .2296 .42104
Dessert (Y/N) 466 .00 1.00 .0622 .24184
Weekend (Y/N) 466 .00 1.00 .5343 .49936
Server Sex
(M=1, F=2)
466 1.00 2.00 1.6609 .47390
Server Race
(W =1, Other = 0)
466 .00 1.00 .7361 .44125
Service Index 466 1.60 10.00 7.3372 1.69961
Food Index 466 2.25 10.00 8.1970 1.35327
Room Index 466 2.00 10.00 7.5002 1.44803

35
Table 2. Tests of effects on tip amount in Study 1 (with 466 observations from 122 subjects).
Parameter Model 1 Model 2 Model 3
B
Robust
Std.
Error B
Robust
Std.
Error B
Robust
Std.
Error
Intercept -1.03 .70 -.73 1.05 -.78 .72
Bill .15*** .01 .11*** .01 .15*** .02
Bill Squared .00006 .00007 .0001** .00004 .0002*** .00006
Table-Time .01*** .002 .01 .001 .01*** .002
Dinner .03 .12 -.08 .51 .01 .11
Alcohol .40 .22 -.82 .58 .31 .22
Dessert .26 .28 .17 .27 .26 .26
Weekend -.09 .12 .10 .55 -.15 .11
Server Sex -.01 .10 .26 .51 .07 .09
Server Race .09 .14 .29 .50 .10 .13
Service .21*** .04 -.58 1.10 -.13 .14
Food .03 .06 .03 .06 .03 .06
Room -.07 .05 -.07 .05 -.08 .05
Hospitality Experience X Service -.03 .12
Customer Sex X Service .18* .09 .14 .08
Customer Race X Service .13 .08
Customer Age X Service .02 .05
Weekend X Service -.03 .08
Server Sex X Service -.02 .07
Server Race X Service -.03 .07
Dinner X Service .02 .07
Alcohol X Service .15 .09
Bill X Service .01** .001 .004*** .001
Bill X Table-Time -.0004** .0001
R2 within .90 .91 .91
R2 between .87 .82 .85
R2 overall .87 .85 .86
* p < .05, ** p < .01, *** p < .001

36
Table 3. Descriptive Statistics for Study 2.
N Minimum Maximum Mean
Std.
Deviation
Worked for tips 687 no = 0 yes = 1 .34 .473
Conscientiousness 687 1 7 5.78 1.435
Agreeableness 687 1 7 5.20 1.546
Age 687 10.00 90.00 42.9767 16.09065
Sex 687 male = 1 female = 2 1.48 .500
Black 687 no = .00 yes = 1.00 .2475 .43185
Hispanic 687 no = .00 yes = 1.00 .2518 .43437
Other race 687 no = .00 yes = 1.00 .0393 .19445
Education 687 1 8 3.47 1.392
Income 687 1 9 3.58 2.388
Democrat 687 no = .00 yes = 1.00 .4556 .49839
Independent 687 no = .00 yes = 1.00 .2489 .43270
Other Political 687 no = .00 yes = 1.00 .0990 .29885
Worship frequency 687 1 7 2.67 1.876
Tips for good service 687 .00 25.00 7.1052 3.61557
Tips for average service 687 .00 23.00 4.8949 2.45256
Tips for bad service 687 .00 40.00 2.2703 2.55563
I decide on some dollar amount w/out calculating
a percentage of the bill.
685 no = .00 yes = 1.00 .3460 .47604
I always calculate the same standard percentage
of the bill and leave that amount.
685 no = .00 yes = 1.00 .1007 .30119
I calculate some standard percentage oft he bill
and then adjust that dollar and cents amount up or
down depending on the circumstances.
685 no = .00 yes = 1.00 .3431 .47508
I decide what percent of the bill to tip under the
circumstances, calculate what that percentage
amounts to in dollars and cents, and leave that
amount (or very close to it).
685 no = .00 yes = 1.00 .1343 .34123
Valid N (listwise) 685

37
Table 4. Tests of Within-Subjects Effects on Tip Amount in Study 2.
Source
Type III Sum of
Squares df Mean Square F Sig.
Service 27.612 2 13.806 3.926 .020
Service X Worked for tips 11.208 2 5.604 1.594 .204
Service X Conscientiousness 6.147 2 3.074 .874 .417
Service X Agreeableness 3.844 2 1.922 .547 .579
Service X Age 41.082 2 20.541 5.841 .003
Service X Sex 18.414 2 9.207 2.618 .073
Service X Black 9.690 2 4.845 1.378 .252
Service X Hispanic 13.411 2 6.705 1.907 .149
Service X Other race 13.229 2 6.615 1.881 .153
Service X Education 3.334 2 1.667 .474 .623
Service X Income 1.909 2 .955 .271 .762
Service X Worship frequency 3.541 2 1.771 .504 .605
Service X Democrat 13.036 2 6.518 1.853 .157
Service X Independent 27.275 2 13.638 3.878 .021
Service X Other Political 14.422 2 7.211 2.051 .129
Service X Bill 411.508 2 205.754 58.510 .000
Error(service) 4719.244 1342 3.517

38
Table 5. Tests of Between-Subjects Effects on Tip Amount in Study 2.
Source
Type III Sum
of Squares df Mean Square F Sig.
Intercept 124.804 1 124.804 10.359 .001
Worked for tips 90.251 1 90.251 7.491 .006
Conscientiousness .042 1 .042 .003 .953
Agreeableness 2.650 1 2.650 .220 .639
Age 124.770 1 124.770 10.356 .001
Sex 7.781 1 7.781 .646 .422
Black 158.919 1 158.919 13.191 .000
Hispanic 158.723 1 158.723 13.174 .000
Other race 12.543 1 12.543 1.041 .308
Education .802 1 .802 .067 .796
Income 40.669 1 40.669 3.376 .067
Worship Frequency 32.473 1 32.473 2.695 .101
Democrat 40.194 1 40.194 3.336 .068
Independent 20.975 1 20.975 1.741 .187
Other Political 1.977 1 1.977 .164 .686
Bill 3406.763 1 3406.763 282.769 .000
Error 8084.107 671 12.048

39
Table 6. Tests of effects on tip amount when service is good in Study 2.
Parameter B Std. Error t Sig.
Intercept 3.163 .903 3.504 .000
Worked for tips .657 .252 2.609 .009
Conscientiousness .054 .089 .608 .544
Agreeableness -.013 .082 -.161 .872
Age -.029 .008 -3.624 .000
Sex -.319 .242 -1.318 .188
Black -.580 .328 -1.771 .077
Hispanic -.991 .309 -3.206 .001
Other race .101 .619 .163 .871
Education -.002 .092 -.024 .981
Income .082 .055 1.489 .137
Worship Frequency -.052 .065 -.798 .425
Democrat .697 .349 2.000 .046
Independent .760 .367 2.072 .039
Other Political .423 .464 .910 .363
Bill .144 .009 15.360 .000
R2 .30

40
Table 7. Tests of effects on tip amount when service is average in Study 2.
Parameter B Std. Error t Sig.
Intercept 1.427 .582 2.451 .014
Worked for tips .432 .163 2.656 .008
Conscientiousness -.021 .057 -.362 .717
Agreeableness .028 .053 .526 .599
Age -.005 .005 -1.019 .309
Sex -.206 .156 -1.321 .187
Black -.721 .211 -3.411 .001
Hispanic -.750 .199 -3.761 .000
Other race -.403 .400 -1.008 .314
Education .060 .059 1.014 .311
Income .070 .035 1.968 .050
Worship Frequency -.102 .042 -2.448 .015
Democrat .441 .225 1.960 .050
Independent .320 .237 1.351 .177
Other Political .290 .300 .967 .334
Bill .110 .006 18.143 .000
R2 .37

41
Table 8. Tests of effects on tip amount when service is bad in Study 2.
Parameter B Std. Error t Sig.
Intercept 1.129 .716 1.576 .115
Worked for tips .268 .200 1.342 .180
Conscientiousness -.044 .071 -.617 .537
Agreeableness .061 .065 .939 .348
Age -.016 .006 -2.588 .010
Sex .142 .192 .741 .459
Black -1.041 .260 -4.004 .000
Hispanic -.468 .245 -1.906 .057
Other race -.942 .492 -1.917 .056
Education -.011 .073 -.154 .877
Income .047 .044 1.082 .280
Worship Frequency -.055 .051 -1.077 .282
Democrat .116 .277 .418 .676
Independent -.127 .291 -.437 .663
Other Political -.342 .369 -.928 .354
Bill .057 .007 7.609 .000
R2 .12
Copyright © 2022 FDOKUMEN