A Social Support Intervention to Ease the College Transition: Exploring Main Effects and Moderators
17
A Social Support Intervention to Ease the College Transition: Exploring Main Effects and Moderators Jonathan F. Mattanah Jean F. Ayers Bethany L. Brand Leonie J. Brooks Journal of College Student Development, Volume 51, Number 1, January/February 2010, pp. 93-108 (Article) Published by The Johns Hopkins University Press DOI: 10.1353/csd.0.0116 For additional information about this article Access Provided by University of Wisconsin @ Madison at 11/08/10 5:30PM GMT More http://muse.jhu.edu/journals/csd/summary/v051/51.1.mattanah.html
Transcript of A Social Support Intervention to Ease the College Transition: Exploring Main Effects and Moderators

A Social Support Intervention to Ease the College Transition: Exploring Main Effects and Moderators
Jonathan F. MattanahJean F. AyersBethany L. BrandLeonie J. Brooks
Journal of College Student Development, Volume 51, Number1, January/February 2010, pp. 93-108 (Article)
Published by The Johns Hopkins University PressDOI: 10.1353/csd.0.0116
For additional information about this article
Access Provided by University of Wisconsin @ Madison at 11/08/10 5:30PM GMT
More
http://muse.jhu.edu/journals/csd/summary/v051/51.1.mattanah.html

JANUARY/FEBRUARY 2010 VOL 51 NO 1 93
Research in Brief
A Social Support Intervention to Ease the College Transition: Exploring Main Effects and ModeratorsJonathan F. Mattanah Jean F. Ayers Bethany L. Brand Leonie J. Brooks Julie L. Quimby Scot W. McNary
This study examined effects of a peer-led social support group intervention on college adjustment. Ninety first-year students, randomly assigned to participate in the intervention, reported higher levels of perceived social support and reduced loneliness when compared to controls (n = 94), after accounting for preintervention levels on these variables. Effects were not moderated by precollege adjustment concerns or gender. Results of this study suggest that a cost-effective peer-led intervention program can positively affect students’ social adjustment to university at a large, 4-year institution.
High school graduates in the United States are attending college in high numbers. According to the U.S. Department of Labor, Bureau of Labor Statistics (2006), more than 68% of 2005 high school graduates entered some form of post-secondary education within 4 months of graduation. Many late adolescents successfully navigate the transition to college. Some, however, do not. Indeed, more than 40% of students fail to complete college (Murtaugh, Burns, & Schuster, 1999), and much of this attrition occurs in the first year (Hamilton & Hamilton, 2006). In fact, more than half of all students who leave college do so in the first 6 weeks (Levitz & Noel, 1989). During the first weeks and months of college, students face a
number of challenges, including developing a new social network, keeping up with school work in an environment of much greater autonomy than high school, and negotiating the “temptations” of a college environment (e.g., alcohol, drugs, and sex). Given these challenges, the entrance into college has been viewed as a major transition of emerging adulthood, one in which late adolescents develop new levels of separation–individuation from parents while also maintaining a healthy connection to others (Mattanah, Hancock, & Brand, 2004; Rice, FitzGerald, Whaley, & Gibbs, 1995). To help facilitate the college transition, universities have instituted college transition programs, ranging from informational orien-ta tion sessions over the first few days of college to structured, clinically oriented interventions for at-risk students (Barefoot, 2005). Much attention has focused on first-year experience (FYE) programs, which include faculty- and staff-led advising sessions, service-learning opportunities for first-year students, and even faculty-led first-year seminars (Barefoot et al., 2005; Upcraft, Gardner, & Barefoot, 2005). These FYE programs provide students a chance to interact with faculty in a more informal way and receive much needed social support, factors known to enhance student success
Jonathan F. Mattanah is Associate Professor of Psychology at Towson University. Jean F. Ayers is a graduate student in the Physician’s Assistant program at George Washington University. Bethany L. Brand is Professor of Psychology at Towson University. Leonie J. Brooks is Associate Professor of Psychology at Towson University. Julie L. Quimby is Visiting Assistant Professor of Psychology at Bowdoin College. Scot McNary is Assistant Professor of Educational Technology and Literacy at Towson University. Portions of this study were presented at the 2006 biannual meeting of the Society for Research on Adolescence, San Francisco, CA. Work on this project was supported by a grant from the Faculty Development and Research Committee at Towson University.

94 Journal of College Student Development
Research in Brief
during the first year (Pascarella & Terenzini, 2005). Although very promising, these FYE programs emphasize heavily faculty- or staff-led programming while not examining as closely the important role that first-year and upper-class peers may play in facilitating students’ transition to college. Research has already demonstrated that peer interactions improve students’ academic performance and enhance leadership skills during the first-year (Pascarella & Terenzini, 2005). Furthermore, upperclass students serving as peer advisors help freshmen adjust by providing crisis intervention with issues such as drug and alcohol abuse, leading to less use of professional counseling services (Rabiecki & Brabeck, 1985; Russel & Skinkle, 1990). In the current study, we examined whether a peer-led social support program could improve psychosocial adjustment during the first year of college.
Prior Research on Peer-Led Social Support ProgramsSeveral studies, conducted in the 1980s and 1990s, demonstrated that peer-led social support programs administered during the first weeks of college enhance students’ perceptions of social support and overall adjustment and decrease loneliness (Lamothe et al., 1995; Oppenheimer, 1984; Pancer, Pratt, Hunsberger, Alisat, & Berkeley, 2007; Pratt et al., 2000). These researchers share a theoretical perspective that social support buffers stressful life experiences (Alloway & Bebbington, 1987) and that the transition to college disrupts established social networks (Shaver, Furman, & Buhrmester, 1985). Peer-led support groups allow students to establish new social ties with fellow students who are facing the same novel social environment, increased academic demands, and greater separation and independence from parents and high school support systems. In an early
study, Oppenheimer tested the effectiveness of small group discussions in facilitating adjustment to a small, selective U.S. college. The intervention involved weekly, hour-long discussion groups from mid-October through November during the first semester of college. Oppenheimer found that vulnerable students who scored high on a self-report measure of concern about social life at college showed increased social life satisfaction, increased self-esteem, and decreased social anxiety after the intervention, whereas nonvulnerable students showed no significant difference on these variables. These findings did not emerge as statistically significant until 5 months after the conclusion of the intervention, suggesting a “sleeper effect” (Oppenheimer). Lamothe et al. (1995) implemented a similar program at a small Canadian university with a sample of 27 freshmen. Because the first few weeks are particularly crucial for students’ adjustment, Lamothe et al. began their intervention in the first week of college. Three intervention groups of nine students met for six weekly semi-structured discussions of 90 minutes; these groups were facilitated by senior undergraduate and graduate students. Results indicated that the intervention participants showed significantly better college adjustment and reported higher levels of perceived social support than did control participants. Pratt et al. (2000) replicated the interven-tion with a larger sample (N = 50) at the same Canadian university and added measures of loneliness and depression to broaden the examination of intervention effects. Loneliness is particularly important to assess with first-year students because greater loneliness is associated with early dropout from college (Anderson, 1987). Results from Pratt et al.’s study found that, compared to the control group, the male and female students in the intervention group showed better overall adjustment to college, and female participants in the intervention

JANUARY/FEBRUARY 2010 VOL 51 NO 1 95
Research in Brief
group showed increased perceptions of social support and less depression than did control participants. As with Oppenheimer’s (1984) research, Pratt et al. (2000) found that differences in these adjustment measures did not emerge until data were collected in March of the spring semester. Recent analysis from a 4-year follow-up of their sample found that the intervention participants continued to show significantly better adjustment to college, including higher self-esteem, greater social support, and less stress than did control participants. Further, students in the intervention were significantly less likely than control participants to have left the university in the 4 years following the intervention (Pancer et al., 2007). Although each of these studies concluded that college adjustment can be enhanced by a cost-effective peer-led social support program, a few cautions are in order. First, methodological issues leave some concern in interpreting outcomes. Lamothe et al. (1995), for example, chose to delete the outcome data obtained from one of the three intervention groups because of low attendance. In addition, randomization efforts failed to create equivalent groups on several pretest measures in the Pratt et al. (2000) study, resulting in the need for statistical corrections in the data analyses. Second, the participants in both studies were sampled exclusively from small liberal arts colleges with limited diversity in socioeconomic status, race, and ethnicity. Previous research has shown that students at large 4-year universities, such as the one used in the current study, tend to limit their social involvement in college, which has a modest negative impact on their self-concept and educational attainment (Pascarella & Terenzini, 2005). Hence, it is important to determine whether a social support based intervention program may boost social support and social adjustment at a large, more diverse,
metropolitan university. Third, there is a need to examine more systematically whether the main effects of the intervention are moderated by individual difference variables, such as the participant’s gender or precollege adjustment concerns. Previous research has provided some inconsistent evidence that gender may moder-ate the effects of a social support based intervention. In their initial transition study, Pratt et al. (2000) found that women, but not men, in the intervention program reported greater perceived social support and fewer depressive symptoms; interestingly, however, these findings did not hold up 4 years later when both men and women in the intervention group were doing better on these measures than were men and women in the control group. Other studies of social support with young adults have shown that women generally report receiving greater social support than do men during stressful times although both genders benefit from the support they receive (Luo, 2006; Schneider, Randoll, & Buchner, 2006). In the current study, we examined whether gender moderated the main effects of the intervention on multiple measures of college adjustment. It is further important to determine whether this intervention is equally effective for students with differing precollege concerns and expectations regarding the transition to college. Jackson, Pancer, Pratt, and Hunsberger (2000) found that students with fearful expectations, as opposed to optimistic, complacent, or prepared expectations, had poorer adjustment and reported more stress and more depression in their first, second, and fourth years of college. Moreover, Oppenheimer (1984) provided some preliminary evidence that a social support intervention was effective only for students he categorized as “vulnerable” based on a precollege measure of concerns about social adjustment. Based on previous

96 Journal of College Student Development
Research in Brief
research, we tentatively hypothesized that precollege adjustment concerns would moder-ate the effects of the intervention on adjustment outcomes.
The Present StudyWe modified Pratt et al.’s (2000) intervention to fit the parameters of a large, metropolitan university. We hypothesized that the modified social support intervention would lead to enhanced college adjustment, greater perceived social support, and less loneliness in a socioeconomically and ethnically diverse, metropolitan sample. We examined further whether gender and preadjustment concerns moderated the effects of the intervention.
METHODParticipants
Participants in this study were all traditional-aged, first-time (no transfers) freshmen at a suburban university categorized by the Carnegie Foundation for the Advancement of Teaching (in its Size and Setting category; n.d.) as a “large, four-year, primarily non-residential” insitution (L4/NR). Such universities typically enroll over 10,000 students, and fewer than 25% of them live on campus. Over a 2-year period, letters were sent to the home addresses of approximately 3,000 students selected at random from the database of admitted and matriculating students. The letters introduced the study as a study of the transition to university life with the opportunity to participate in “discussion groups.” A total of 184 students returned completed consent forms (an initial response rate of 6.1%). Of these 184 students, 13 students failed to complete any of our online assessment instruments and were not included in further analyses; thus, our final response rate of usable data was 5.7%. Of these 171 participants, 88 (51.5%) were randomly assigned to an intervention social
support group at the beginning of their fall semester and 83 (48.5%) were assigned to the control group. Not all of the 88 intervention participants completed the intervention. Eight participants attended fewer than three intervention sessions (three or more sessions is how we defined having received a minimum dose of the intervention based on previous research; Pratt et al., 2000), 11 participants completed the preintervention survey but never attended any sessions, and attendance data was missing for 4 other participants. See below for our treatment of these 23 participants. The average age of our sample during the summer prior to starting college was 17.7 years (SD = 0.52). Our sample included 120 females (70.2%) and 51 males (29.8%). Ethnically, 67.9% were Caucasian, 16.4% African-American, 5.7% Asian-American, 1.3% Latino/a, and 8.7% reported themselves as biracial or “other.” The gender composition of our sample was similar to the population of entering students at this university over the previous 5 years, when women constituted 62.8–67.9% of entering classes. The ethnic composition our sample was roughly similar to that of the larger population except that we appear to have slightly over-sampled African-American students. In the past 5 years, Caucasians were 71.3–80.3% of the entering classes, African-Americans 7–11.6%, Asians 2.7–4.8%, and Latinos 1.3–2.0%. Information on socioeconomic status was gleaned by asking for mothers’ and fathers’ highest education level and current profession. The highest level reported for either parent (or for just one parent in the case of a single-parent household or household with one working parent) was used to determine social class. Following Hollingshead’s (1965) two-factor index, 56.6% of the students were from families in social classes I and II (i.e., executives, major professionals, and large business owners), 42%

JANUARY/FEBRUARY 2010 VOL 51 NO 1 97
Research in Brief
were from families in social classes III and IV (lesser professionals, middle management, small business owners, and skilled workers), and 1.4% were from social class V (semi-skilled and unskilled employees). The students reported their average high school grade point average (GPA) to be a 3.55 (SD = 0.42) and average combined (math and verbal sections) scholastic aptitude test (SAT) scores to be 1,130 (SD = 128). Mean GPA and SAT scores in our sample were comparable to mean GPA and SAT scores for entering classes over the previous 5 years, which were 3.6 and 1,120, respectively.
InstrumentsAdjustment to College. College student adjust-ment was measured with the Student Adaptation to College Questionnaire (SACQ; Baker & Syrik, 1984). The SACQ includes 67 items across four subscales that assess academic, social, and emotional adjustment and school attachment. In the current study, the total adjustment score was used, averaging participants’ responses on all 67 items. Sample items from the SACQ include “I am very involved with social activities in college” and “I haven’t been able to control my emotions very well lately.” Respondents indicated the extent to which each statement applied to them on a scale ranging from 1 (doesn’t apply to me at all) to 9 (applies very closely to me). Higher scores indicate better adjustment. Previous research found that Cronbach alphas for the three subscales ranged from .73 to .90 (Rice et al., 1995). The alpha coefficients for the total score in the current study were .76 and .83 for fall and spring adjustment, respectively. The SACQ is a widely used, well-validated measure of college adjustment; higher scores on the SACQ correlate with lower attrition rates and higher college GPA scores (Rice et al.). Our students’ scores on the SACQ were comparable to other studies with college
students; the overall mean for SACQ total score in our study was 6.69 (SD = 1.02) and the overall mean in the Pratt et al. (2000) study was 6.34 (SD = 0.88). Perceived Social Support. The Social Provisions Scale (SPS, Cutrona & Russell, 1987) was used to measure perceived social support. This scale includes 24 items, such as, “There is no one I can turn to for guidance in times of stress” and “I feel a strong emotional bond with at least one other person,” that assess six interrelated dimensions of social relationships. The items were measured on a four-point Likert-type scale ranging from 1 (strongly disagree) to 4 (strongly agree). For ease of presentation, we focused on a mean score across all 24 items rather than focus on the separate dimensions; subscales in our study were highly intercorrelated (average r = .66) and previous research has focused on a single mean score (see for example Cutrona, 1984, and Pratt et al., 2000). In the current study, the 24-item scale alpha was .91. Higher perceived social support scores on the SPS are related to lower depression scores among teenagers and adults during the transition to parenthood (Cutrona, 1984, 1989; Cutrona & Russell). Loneliness. The UCLA Loneliness Scale (Russell, Peplau, & Cutrona, 1980) was used to assess feelings of loneliness. The scale included 20 items such as, “My social relationships as superficial” and “I feel isolated from others.” Using a four-point Likert-type scale, responses ranged from 1 (never) to 4 (often), with higher scores representing greater feelings of loneliness. Previous research has demonstrated strong internal consistency reliability ranging from .92 to .93 (Pratt et al., 2000). The current study yielded an alpha coefficient of .93. Higher scores on loneliness are associated with depression and neuroticism and negatively associated with social support and self-esteem (Wei, Shaffer, Young, & Zakalik, 2005). Participants’ loneliness scores
98 Journal of College Student Development
Research in Brief
in our study (M = 1.64; SD = 0.51) were quite comparable to other studies with college students (M = 1.88; SD = 0.60 in Larose & Boivin, 1998). Precollege Adjustment Concerns. The New College Students Concerns Scale (NCSCS; Brooks, 2005) was used to assess common worries and concerns related to starting college, such as, “I will have difficulty balancing work and studying.” The NCSCS includes 25 items measured on a five-point Likert-type scale ranging from 1 (not concerned at all) to 5 (extremely concerned). The NCSCS has three subscales that measure academic, social and psychological concerns with each subscale demonstrating a strong positive correlation with the total scale (r ranging from .83 to .94). The total scale score was used in this study, with high scores indicating greater worries related to transitioning to college. In a previous study, the NCSCS showed good internal consistency ( = .93) and greater preadjustment concerns correlated with goal instability and poorer overall college adjustment on the SACQ during the first semester of college (Brooks). Alpha reliability in the current sample was .94. Demographic Variables. Demographics were gathered on the students’ age, gender, ethnicity, relationship status, college residence, number of siblings, birth order, mother and father’s highest level of education and occupation, high school GPA, and SAT scores.
ProceduresEighty-eight first-year college students parti ci-pated in 9-week social support groups during their first year in college. Each participant was randomly assigned to 1 of 11 groups, 5 conducted during the first year of data collec-tion and 6 during the second year. Each group included between 6 and 10 students and met for eight sessions during the fall semester and one session during the spring semester.
Group sessions were semi-structured and based on a training guide developed by the research team that included comprehensive, step-by-step instructions utilized by the group facilitators on a weekly basis. This training guide was adapted from the intervention guidebook developed by researchers in Canada (Pratt et al., 2000). We shifted the order of some of the group discussion topics to make them more consistent with an American university schedule (i.e., a discussion of maintaining old friendships was shifted to later in the semester to coincide with the American Thanksgiving holiday). Commuter student issues were also added as a discussion topic to reflect the more diverse nature of the student population (although we did not collect data systematically on the number of commuters in our sample, a survey sent to students after the study was completed suggested that 11% of our students commuted during their first year). Each session lasted for approximately 90 minutes and was facilitated by two undergraduate clinical psychology honors students who had completed advanced clinical coursework in basic counseling skills, relationship building, and group facilitation and had previous experience in leading groups. There were 10 student facilitators during year 1 and 12 students in year 2 (i.e., two unique student facilitators per group). Facilitators were chosen based on their clinical experience and training and their relative closeness in age/developmental stage with the members, which was intended to facilitate the connection between members and the leaders. The facilitators were supervised by five licensed psychology faculty members who met with them on a weekly basis to review the group session from that week and prepare for the next meeting. Each faculty member supervised one group during each year of data collection, and one faculty member supervised an additional group during the second year.

JANUARY/FEBRUARY 2010 VOL 51 NO 1 99
Research in Brief
During each meeting, students discussed a topic related to their college transition, with the exception of the two meetings in which students completed questionnaires and the initial group meeting when students were introduced to the intervention. Topics included (a) creating new social ties; (b) balancing work, academics, and a social life; (c) peer pressure, values, and college life; (d) residential issues; (e) expectations vs. realities of college life; and (f ) examining old social ties. The format of each meeting consisted of a check-in period to review reactions to the group from the previous week, a discussion of the topic selected for that week, and a wrap-up period during which students provided written feedback about their experience in group for that day. Students were offered pizza or other snacks as an incentive to participate. The average attendance rate among group participants was 6.12 sessions (SD = 2.27). There was no difference in participation rates between male and female group members. Control group members met in small groups on one occasion in the fall semester, when they were provided with information about campus resources and then completed questionnaires. Control and intervention participants completed a comprehensive battery of surveys online at the same three time points of the study: (a) the summer prior to matriculation into university, (b) week 10-11 of the fall semester (November), and (c) week 5 or 6 of the spring semester (March). The online surveys were administered to students via a password protected webpage link. Each student was assigned a unique identification number to ensure that the correct individual was completing his or her own survey. All participants completed their surveys independently at their home or school computer, either after their regularly scheduled meeting, in the case of the intervention participants, or on their own.
Plan of Analysis
Analysis of main outcomes was conducted using analysis of covariance (ANCOVA) with summer measures of each outcome serving as a baseline covariate. For loneliness and social support two analyses were done: fall outcomes controlling for summer measures and spring outcomes controlling for summer measures. For SACQ adjustment only one ANCOVA model was run using fall adjustment as a covariate for the spring adjustment outcome. This resulted in five models testing for the main effects of intervention. For each of these analyses, two estimates of intervention effects were calculated. Intention-to-treat (ITT) estimates included all intervention participants (regardless of attendance) and control participants. As-treated estimates included only those intervention participants who we knew had attended three or more sessions. ITT estimates are unbiased estimates of intervention effect (Pocock & Abdalla, 1998) but do not account for compliance. As-treated analyses account for non-compliance but produce estimates of intervention effect with unknown bias because random assignment no longer applies. All ANCOVA analyses were conducted using maximum likelihood estimation with SAS/STAT® PROC MIXED (SAS Institute, 2002), and t tests for the difference in adjusted means between groups are reported. A sample size of 141 was estimated necessary for detecting a small to moderate size effect (f 2 = 0.07) with power = 0.80 using the ANCOVA design employed: one baseline covariate, one grouping variable with two levels (G*Power 3.0.1; Faul, Erdfelder, Lang, & Buchner, 2007). Consequently, sufficient power was obtained for both ITT and as-treated analyses. In addition to the main effects analyses, moderation analyses were conducted using

100 Journal of College Student Development
Research in Brief
TABLE 1.Means and Standard Deviations of Preintervention Variables for Control and
Intervention Participants
VariableIntervention
M (SD)Control M (SD) Mean Diff.
p Value of Diff. Testa
Age 17.72 (0.50) 17.62 (0.54) 0.103 .222GPAb 3.62 (0.44) 3.50 (0.40) 0.120 .112SAT comb.c 1143 (129) 1115 (125) 28.500 .210Preadjustment concernsd
2.37 (0.72) 2.05 (0.70) 0.320 .009
Lonelinesse 1.64 (0.44) 1.64 (0.53) 0.000 .948Social Support f 3.35 (0.36) 3.31 (0.48) 0.040 .597
n (%) n (%)Gender .209
Male 30 (34.1) 21 (25.3)Female 58 (65.9) 62 (74.7)
Ethnicity .211Caucasian 65 (73.9) 54 (65.1)Non–Caucasian 23 (26.1) 29 (34.9)
Note. Analyses were based on all available data from the summer assessment.a Differences between the groups were tested via two–tailed, non–directional, independent sample t tests or
chi–square analyses.b Grade point average (range 2.00–5.00).c SAT combined score (range 800–1600).d Mean score from the Brooks New College Student Concerns Scale (range 1–5).e Mean score from the UCLA Loneliness Scale (range 1–4).f Mean score from the Social Provisions Scale (range 1–4).
ANCOVA with gender and precollege adjustment concerns used as interaction terms with the treatment indicator. As with the main effects analyses above, there were five outcomes (fall and spring loneliness, fall and spring social support, and spring adjustment), and summer measures of these outcomes served as covariates, except for spring adjustment for which fall adjustment was the covariate. All continuous variables were mean-centered before creating interaction terms. Only intervention participants who had attended three or more sessions were included in the moderation analyses.
Missing Data. The sample sizes fluctuated some what during different assessment points due to participants failing to complete online sur veys. Specifically, 155 (82 intervention, 73 control) participants completed the summer surveys, 138 (77 intervention, 61 control) completed the fall surveys, and 112 (65 intervention, 47 control) completed the spring surveys. Multiple imputation was used to address missing data for the ITT and as-treated analyses. Multiple imputation is an appropriate technique to use when it is reasonable to assume that the data were missing completely at random (MCAR) or missing at random
JANUARY/FEBRUARY 2010 VOL 51 NO 1 101
Research in Brief
TAB
LE 2
.C
orre
latio
ns A
mon
g M
oder
ator
and
Out
com
e Va
riabl
es
Lone
lines
sSo
cial
Sup
port
SAC
Q A
djus
tmen
t
Gen
der
Sum
mer
Fall
Sprin
gSu
mm
erFa
llSp
ring
Fall
Sprin
g
Lone
lines
s—
Fall
0.53**
—
Spr
ing
0.59**
0.69**
—
Soc
ial S
uppo
rt
Sum
mer
–0.7
0**
–0.5
0**
–0.3
6**
—
Fall
–0.4
0**
–0.7
5**
–0.4
5**
0.57**
—
Spr
ing
–0.4
9**
–0.5
2**
–0.7
3**
0.50**
0.56**
—
SA
CQ
Adj
ustm
ent
Fall
0.07
0.03
0.20
0.11
0.03
–0.1
2—
Spr
ing
0.01
0.12
0.04
0.04
–0.0
2–0
.02
0.52**
—
Gen
dera
–0.0
3–0
.03
0.05
0.16
0.17*
–0.0
70.
21*
–0.1
2—
Pre
adju
stm
ent
Con
cern
s0.
37**
0.24**
0.33**
–0.2
4**
–0.1
4–0
.22*
0.25**
0.14
0.22**
a 1
= fe
mal
e.
*p <
0.0
5. **
p <
0.01
.
(MAR). In preliminary analyses we found that missing status was unrelated to outcomes in the fall or spring. We felt this suggested our dataset met criteria for MAR and justified use of multiple imputation. Five imputed datasets were generated using SAS/STAT®
PROC MI (SAS Institute, 2002). Analyses were conducted on each imputed dataset using SAS/STAT® PROC MIXED (SAS Institute) and results from each dataset aggregated using SAS/STAT® MIANALYZE (SAS Institute).

102 Journal of College Student Development
Research in Brief
TABLE 3.Means, Standard Deviations, and Intervention Effects for Outcomes
Intervention M (SD)
Control M (SD) Difference (SE) t (df )a
Effect Size (d)
LonelinessITT
Fall 1.68 (0.56) 1.65 (0.50) –0.04 (0.08) –0.48 (117.4) 0.08Spring 1.60 (0.46) 1.76 (0.50) –0.17 (0.08) –2.24 (40.1)* –0.35
As-TreatedFall 1.59 (0.45) 1.68 (0.56) –0.10 (0.08) –1.18 (78.9) –0.20Spring 1.52 (0.43) 1.76 (0.50) –0.24 (0.08) –3.13 (58.6)** –0.53
Social SupportITT
Fall 3.32 (0.42) 3.33 (0.36) –0.001 (0.057) –0.02 (73.8) 0.00Spring 3.38 (0.36) 3.29 (0.41) 0.08 (0.06) 1.28 (73.5) 0.20
As-TreatedFall 3.37 (0.35) 3.32 (0.42) 0.02 (0.06) 0.38 (116.0) 0.06Spring 3.45 (0.30) 3.29 (0.41) 0.14 (0.06) 2.18 (69.6)* 0.37
SACQ Total AdjustmentITT
Spring 5.13 (0.60) 5.03 (0.65) 0.10 (0.11) 0.90 (24.4) 0.14As-Treated
Spring 5.09 (0.64) 5.03 (0.65) 0.09 (0.11) 0.83 (56.9) 0.14
Note. Sample sizes for control and intervention groups for the fall and spring outcomes for the ITT (intention-to-treat) estimates were n = 78 and n = 88, respectively. For the as–treated estimates sample sizes were n = 78 and n = 64, respectively. Cohen's d is calculated as d = t(n1n2 df n1n2). Degrees of freedom for ITT and as–treated effect size calculations were 162 and 139, respectively. Means are observed means. Differences, tests, and ES refer to differences between adjusted means.
a ttest the null hypothesis that the difference in adjusted means between groups is zero. Fractional degrees of freedom occur with imputed data and are a function of the proportion of missing data.
*p < 0.05. **p < .0.01.
RESULTSComparison of Groups at BaselineWe compared the intervention and control participants on their preintervention adjust-ment levels the summer prior to their matricu-lation into university. These analyses were conducted on all available data from the summer assessment time point without imputing data for missing cases. Intervention
and control participants did not differ signifi-cantly on any demographic variable (age, sex, high school GPA, SAT scores, or ethnic status) nor did they differ in their report of loneliness or social support (see Table 1). However, intervention participants did report significantly higher levels of adjustment concerns compared with control participants, which was accounted for primarily by the

JANUARY/FEBRUARY 2010 VOL 51 NO 1 103
Research in Brief
particularly high score (M = 2.64, SD = 0.79) among the 13 participants who eventually dropped out of the intervention.
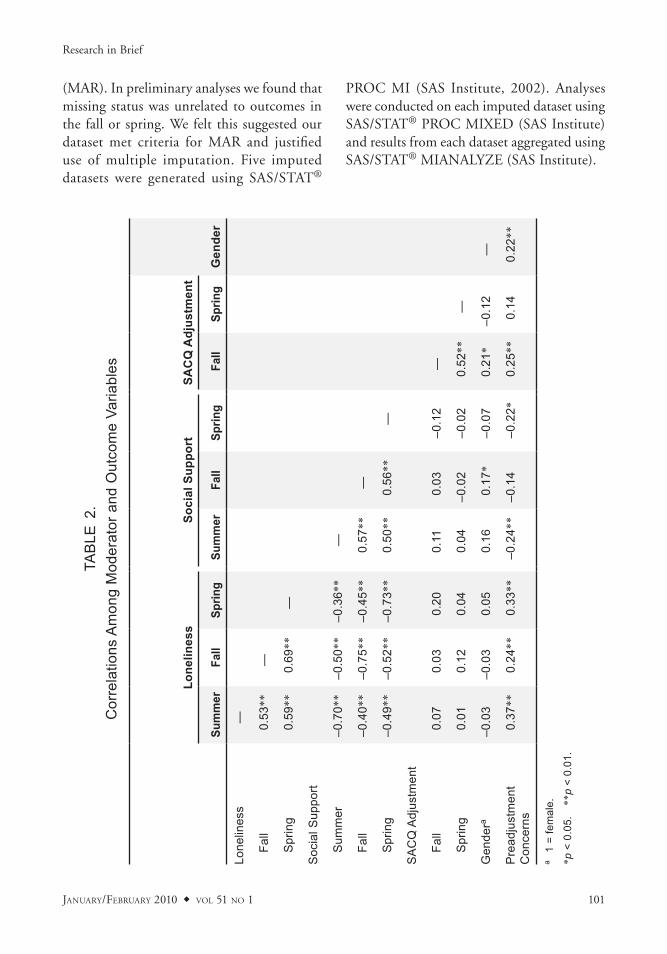
Outcome VariablesTable 2 presents bivariate correlations between the moderator and outcome variables across the time points at which they were assessed. These correlations were computed using pairwise complete data rather than imputed data. Cross time correlations within specific outcome variables were robust supporting the reliability of these measures. Noteworthy were the consistent correlations between preadjustment concerns and the outcome variables assessed at summer, fall, and spring, suggesting that students with greater concerns were at risk for adjustment difficulties during their college transition.
Main EffectsTo analyze the main effects of the intervention, we examined fall and spring adjustment score differences between the intervention and control group, after controlling for summer levels on the same variables. We conducted these analyses twice on two different groups of participants. The first analyses included all intervention participants, including those who dropped out of the intervention (but remained in the study) or never attended; this is labeled as the ITT analyses in Table 3. The second analyses included only those intervention participants who had attended at least three sessions of the intervention; this is labeled as the as-treated analyses in Table 3. We found that intervention and control participants did not differ in adjustment scores at the fall assessment point, consistent with past research (Pratt et al., 2000). At the spring assessment point, however, intervention participants were significantly less lonely than were control participants, after controlling for
summer levels of loneliness. This was apparent for both the ITT and as-treated analyses (Table 3). Effect sizes for these analyses were .35 and .53, respectively. Additionally, intervention group participants who attended at least three sessions felt significantly more social support in the spring than did control participants, controlling for summer levels of social support. The as-treated effect size (d) for spring social support was .37. No differences in spring SACQ total adjustment were found, after controlling fall SACQ scores.
Moderation EffectsModeration effects of gender and precollege adjust ment concerns were explored using the sample of intervention participants who attended three or more sessions. Of the two potential moderating relationships among the three outcomes, none was significant. Precollege adjustment concerns was positively associated with spring loneliness, controlling for summer loneliness, B = 0.16, SE = 0.07, t(81.3) = 2.15, p < .05; and negatively associated with spring social support, controlling for summer social support, B = –0.12 SE = 0.06, t(79) = 1.94, p = .06; but these slopes did not differ between intervention and control groups.
DISCUSSION
The purpose of this study was to determine if peer-led social support groups facilitated the adjustment of students making the transition to a large, metropolitan univer sity and to determine if intervention effects were moderated by preadjustment concerns or gender. Our randomization procedures succeeded in creating groups initially equivalent in loneliness, perceived social support, and demographic variables, although our intervention group was higher in preadjustment concerns. Overall, we found that participation in the intervention group enhanced the students’ social adjustment.

104 Journal of College Student Development
Research in Brief
Compared to the control group, students in the intervention groups experienced less loneliness and greater perceived social support. Our results are consistent with previous research (Lamothe et al., 1995; Pratt et al., 2000), although Pratt et al.’s intervention group did not show evidence of decreased loneliness. We found that the intervention did not lead to greater overall adjustment on the SACQ in the spring, after controlling for fall SACQ adjustment levels. Pratt et al. found that the intervention improved adjustment scores in the spring semester but they did not control for fall adjustment levels. It is possible that the overall SACQ score, which incorporates a host of academic and personal issues (e.g., having trouble sleeping, falling behind on schoolwork, etc.), was not a sensitive measure of the specific effects of this intervention, especially when examining changes in adjustment from fall to spring. The participants in this study attended a large, metropolitan university with a significant number of commuter, ethnic minority, and socioenonomically diverse students, as opposed to previous studies that investigated social support group interventions with students from small, elite liberal arts colleges (Lamothe et al. 1995; Oppenheimer, 1984; Pratt et al., 2000). Despite the greater social estrangement associated with a large university (Pascarella & Terenzini, 2005), the intervention was effective at enhancing students’ perceptions of social support and decreasing a sense of loneliness. A social support group setting provides students with an opportunity to have their experiences validated. They are interacting with peers who experience the same challenges associated with making the transition to college and they are presented with models (the facilitators) who have successfully negotiated this transition and provide invaluable information about resources on campus (e.g., counseling center, academic advising, etc.). Peer-led social
support programs can enhance current models of the freshmen year transition, which tend to focus on faculty- and staff-facilitated support programs to enhance students’ connection to the university and access to campus resources (Barefoot et al., 2005; Upcraft et al., 2005). We expected that these socially oriented groups would have the strongest impact on the outcome variables related to social functioning. Consistent with Pratt et al. (2000) and Oppenheimer (1984), we found that the effects of the intervention were not significant until the spring semester of the first year of college. Thus, it appears to take several months for students to experience the social benefits of the support groups, suggesting that developing new social networks takes time. In both our as-treated analyses and more conservative ITT analyses, loneliness was reduced by the intervention and the effect sizes were moderate, indicating that this is a consistent effect that holds up even under the most stringent criteria. Loneliness has been found to be positively related to depression and neuroticism and negatively related to social self-efficacy, social support, and self-esteem (Russell, 1996; Wei et al., 2005). Loneliness may also lead to retention problems in college (Anderson, 1987), so it is particularly important to the academic success of students.
Moderator EffectsWe investigated the interactions of the intervention with gender and precollege adjustment concerns. In previous research, this intervention was found to be particularly effective in increasing social support and reducing depression for women during their first year in college; however, 4 years after the intervention was completed, no gender differences were found regarding the effects of the intervention (Pancer et al., 2007; Pratt et al., 2000). We found no interactive effects

JANUARY/FEBRUARY 2010 VOL 51 NO 1 105
Research in Brief
of gender during the first year of the college transition, supporting the idea that a peer-led social-support based intervention is equally beneficial for young women and men making the transition to college. The students in our study who expressed greater concerns about transitioning to college reported less perceived social support and greater loneliness in the spring, after controlling for summer loneliness and social support. This is consistent with research indicating that students with anxious and fearful expectations have more difficulty transitioning to college (Brooks, 2005; Jackson et al., 2000). Although some research has found that group interventions benefited only students who were vulnerable prior to the intervention (e.g., Oppenheimer, 1984), our intervention worked equally for students with greater and fewer preadjustment concerns. Thus, we see our intervention as a primary prevention intervention, rather than a tertiary intervention (Pratt et al., 2000). This speaks to the wide reaching benefits of this intervention for first-year students, regardless of gender or level of adjustment concerns. As an intervention that benefited vulnerable as well as less vulnerable students, it is consistent with the goals of counseling psychologists, who focus on enhancing individuals’ strengths to increase their adaptation rather than focusing exclusively on students who are impaired (Gelso & Fretz, 2001).
Implications for Counseling Psychologists and Higher Education Professionals
Several positive benefits emerged from parti ci-pation in this 9-week social support intervention. We believe that the peer-led social support groups studied in this research may provide a model for effective ways of enhancing adjustment for first-year college students and thus may provide useful guidance for college counselors and educators working with this population. First, these groups
were ongoing throughout the fall semester rather than focused exclusively on orientation week, as is often done in traditional transition-to-college programs. Students benefited from developing deeper, more meaningful connections with a small group of students, and this allowed them to comfortably open up with each other to share experiences of transitioning to college. Second, the use of peer facilitators (fellow undergraduate students) made the experience that much more meaningful to the students, providing them models of successful college “transitioners” who were able to share their experiences and approach the new students as fellow journeyers rather than “experts” or “professionals.” Finally, the ongoing, loosely structured nature of the groups allowed the students to delve into some serious and complex issues facing first-year students, including tolerance of diversity and development of a personal value system, topics which tend to be overlooked in orientation week programs.
Future ResearchIt will be important for future researchers to replicate these findings with samples consisting of primarily or exclusively ethnically diverse students. Students from different cultural backgrounds may respond differently to group-based interventions, which require personal disclosure. For example, students from collectivist cultures (e.g., Asian) may have different expectations regarding being in a support group (e.g., reduced emotional expression and support seeking). Additionally, as some previous research has found that residential students report greater loneliness and social anxiety during the first semester of college compared with commuter students, residential status may moderate the effects of this intervention (Larose & Boivin, 1998). It would also be important to determine whether this intervention works the same way with students involved with Greek life versus those

106 Journal of College Student Development
Research in Brief
not involved. Finally, future research should continue to examine the long-term benefits of this intervention, as Pancer et al. (2007) found that their intervention program increased retention and adjustment to college 4 years after the intervention had been completed.
LimitationsAlthough the results of our study are encourag-ing, a few limitations should be noted. First, it took considerable effort to recruit sufficient incoming first-year students for this study. Only about 6% of the potential students sent recruitment letters ultimately agreed to participate in the study. Although low, our response rate is similar to that of other researchers doing longitudinal adjustment research with college students. For example, 7% of the sample invited to participate in Oppenheimer’s (1984) study completed the intervention. Although our participation rate may not be unusually low, the generalizability of our findings is limited to students willing to participate in social support groups. Such students may be more anxious or differ in some other way from students who choose not to be in a study designed to improve their transition to college. Another limitation of the study is that we did not systematically assess fidelity to treatment so we do not know that the groups were implemented consistently. However, the supervision groups provided weekly checks with the supervisors regarding the topics that had been discussed in the previous group and what topics would be discussed in the next group. Future social support interventions would be strengthened by including fidelity checks. Similarly, our analyses did not allow
us to determine what aspect of the group experience was most beneficial to student adjustment. We don’t know if the peer facili-tation was particularly helpful to students or whether simply being asked to reflect on their college experience on a regular basis helped students adjust better (we thank an anonymous reviewer for suggesting this important caveat to the interpretation of our results). Future studies might consider some additional analyses to determine the “active ingredients” of this social support intervention. Finally, our study relied exclusively on the use of self-report measures that can inflate the associations among variables due to common method variance. Inclusion of more objective assessments, such as peer evaluations, would extend the current findings.
ConclusionIn conclusion, our findings suggest that a cost-effective social support intervention benefits a broad range of college students, including males and those with greater preadjustment concerns. In particular, this study found that the intervention reduced loneliness and raised perceptions of social support by the end of the first year of college. Given the enduring benefit of feeling more socially connected in college, this intervention may have important implications for long-term college adjustment and, perhaps, for college retention and gradu-ation rates (Pancer et al., 2007).
Correspondence concerning this article should be sent to Jonathan F. Mattanah, Psychology Department, Towson University, 8000 York Rd., Towson, MD 21252; [email protected]

JANUARY/FEBRUARY 2010 VOL 51 NO 1 107
Research in Brief
REFERENCESAlloway, R., & Bebbington, P. (1987). The buffer theory
of social support: A review of the literature. Psychological Medicine, 17, 91-108.
Anderson, E. (1987). Forces influencing student persistence and achievement. In L. Noel, R. Levitz, & D. Saluri (Eds.), Increasing student retention (pp. 44-61). San Francisco: Jossey-Bass.
Baker, R., & Siryk, B. (1984). Measuring adjustment to college. Journal of Counseling Psychology, 31, 179-189.
Barefoot, B. (2005). Current institutional practices in the first college year. In M. Upcraft, J. Gardner, & B. Barefoot (Eds.), Challenging and supporting the first year student: A handbook for improving the first year of college (pp. 47-63). San Francisco: Jossey-Bass.
Barefoot, B., Gardner, J., Cutright, M., Morris, L., Schroeder, C., Schwartz, S., et al. (2005). Achieving and sustaining institutional excellence for the first year of college. San Francisco: Jossey-Bass.
Brooks, L. (2005). What are first-year college students worried about? The development of the New College Student Concerns Scale. Unpublished manuscript.
The Carnegie Foundation for the Advancement of Teaching. (n.d.). Institutional look-up of classifications of universities. Retrieved September 15, 2008, from http://www.carnegie foundation.org/classifications/sub.asp?key=748&subkey=1
4603&start=782Cutrona, C. (1984). Social support and stress in the transition to
parenthood. Journal of Abnormal Psychology, 93, 378-390.Cutrona, C. (1989). Ratings of social support by adolescents and
adult informants: Degree of correspondence and prediction of depressive symptoms. Journal of Personality and Social Psychology, 57, 723-730.
Cutrona, C., & Russell, D. (1987). The provisions of social relationships and adaptation to stress. In W. Jones & D. Perlman (Eds.), Advances in personal relationships: Vol 1 (pp. 37-67). Greenwich, CT: JAI Press.
Faul, F., Erdfelder, E., Lang, A.-G., & Buchner, A. (2007). G*Power 3: A flexible statistical power analysis program for the social, behavioral, and biomedical sciences. Behavior Research Methods, 39, 175-191.
Gelso, C., & Fretz, B. (2001). Counseling psychology (2nd ed.). Orlando, FL: Harcourt Brace.
Hamilton, S., & Hamilton, M. (2006). School, work, and emerging adulthood. In J. Arnett & J. Tanner (Eds.), Emerging adults in America: Coming of age in the 21st century (pp. 440-473). Washington, DC: American Psychological Association.
Hollingshead, A. (1965). Two factor index of social status. Unpublished manuscript, Yale University.
Jackson, L., Pancer, S., Pratt, M., & Hunsberger, B. (2000). Great expectations: The relation between expectancies and adjustment during the transition to university. Journal of Applied Social Psychology, 30, 2100-2125.
Lamothe, D, Currie, F., Alisat, S., Sullivan, T., Pratt, M., & Pancer, S. (1995). Impact of a social support intervention on the transition to university. Canadian Journal of Community Mental Health, 14, 167-180.
Larose, S., & Boivin, M. (1998). Attachment to parents, social support expectations, and socioemotional adjustment during the high school-college transition. Journal of Research on Adolescence, 8, 1-27.
Levitz, R., & Noel, L. (1989). Connecting students to institutions: Keys to retention and success. In M. Upcraft, J. Gardner & Associates (Eds.), The freshmen year experience: Helping students survive and succeed in college (pp. 65-81). San Francisco: Jossey-Bass.
Luo, L. (2006). The transition to parenthood: Stress, resources, and gender differences in a Chinese society. Journal of Community Psychology, 34, 471-488.
Mattanah, J., Hancock, G., & Brand, B. (2004). Parental attachment, separation–individuation, and college student adjustment: A structural equation analysis of mediational effects. Journal of Counseling Psychology, 51, 213-225.
Murtaugh, P., Burns, L., & Schuster, J. (1999). Predicting retention of university students. Research in Higher Educations, 40, 355-371.
Oppenheimer, B. (1984). Short-term small group intervention for college freshmen. Journal of Counseling Psychology, 31, 45-53.
Pancer, M., Pratt, M., Hunsberger, B., Alisat, S., & Berkeley, N. (2007). Long-term impacts of a support group intervention for the transition to university. Unpublished manuscript.
Pascarella, E., & Terenzini, P. (2005). How college affects students: A third decade of research. San Francisco: John Wiley & Sons.
Pocock, S., & Abdalla, M. (1998). The hope and hazards of using compliance data in randomized controlled trials. Statistics in Medicine, 17, 303-317.
Pratt, M., Hunsberger, B., Pancer, S., Alisat, S., Bowers, C., Mackey, K., et al. (2000). Facilitating the transition to university: Evaluation of a social support discussion intervention program. Journal of College Student Development, 41, 427-441.
Rabiecki, D., & Brabeck, M. (1985). A peer-designed peer advisement program. Journal of College Student Personnel, 26, 73-74.
Rice, K., FitzGerald, D., Whaley, T., & Gibbs, C. (1995). Cross-sectional and longitudinal examination of attachment, separation–individuation, and college student adjustment. Journal of Counseling and Development, 73, 463-474.
Russel, J., & Skinkle, R. (1990). Evaluation of peer-adviser effectiveness. Journal of College Student Development, 31, 388-394.
Russell, D. (1996). UCLA Loneliness Scale (Version 3): Reliability, validity, and factor structure. Journal of Personality Assessment, 66, 20-40.
Russell, D., Peplau, L., & Cutrona, C. (1980). The revised UCLA Loneliness Scale: Concurrent and discriminant validity evidence. Journal of Personality & Social Psychology, 39, 472-80.
SAS Institute. (2002). SAS/STAT® software. Version 9.0. Cary, NC: Author.
Schneider, S., Randoll, D., & Buchner, M. (2006). Why do women have back pain more than men: A representative prevalence study in the federal republic of Germany. Clinical Journal of Pain, 22, 738-747.

108 Journal of College Student Development
Research in Brief
Shaver, P., Furman, W., & Buhrmester, D. (1985). Transition to college: Network changes, social skills, and loneliness. In S. Duck & D. Perlman (Eds.), Understanding personal relationships: An interdisciplinary approach (pp. 193-219). Thousand Oaks, CA: Sage.
Upcraft, M., Gardner, J., & Barefoot, B. (2005). Challenging and supporting the first-year student: A handbook for improving the first college year. San Francisco: Jossey-Bass.
U.S. Department of Labor, Bureau of Labor Statistics. (2006). College enrollment and work activity of 2005 high school graduates (USDL #06-514). Washington, DC: Author.
Wei, M., Shaffer, P., Young, S., & Zakalik, R. (2005). Adult attachment, shame, depression, and loneliness: The media-tion role of basic psychological needs satisfaction. Journal of Counseling Psychology, 52, 591-601.