Main body final
54
1 1. INTRODUCTION 1.1. Background and Justification Developing countries have many economical and social problems caused by population increase and lower income per capita. Rapidly increasing populations require more food, but since most land is already under cultivation, the only way to increase production is to increase yield and grow more than one crop in a year. Despite the great progress of mechanization in agriculture, manual workers will still continue to provide the main source of power for the farmers on small farms of many developing countries (Hopfen, 1969; Allen, 1979; Dibbits, 1991; Awadhwal et al., 1992). In circumstances where human labour is supplemented by other energy sources to lighten the task or to increase work capacity, the human energy expenditure might still be considerable. Firstly, an important source of power to be considered is human power as many areas have no access to sources of energy except human power; small tractors on small individual farms are not feasible. Man powered and other power sourced seeders boost the yield of small holders by placing seeds in an environment for reliable germination. The main objective of sowing is to put seeds at a desired depth and spacing within the row. Uniform seed distribution within the soil results in better germination and emergence and increases yield by minimizing competition between plants for available light, water, and nutrients. A number of factors affect seed distribution in soil. Seed metering system, seed delivery tube, furrow opener design, physical attributes of seed and soil conditions all play a part in determining seed distribution ( Karayel and Ormerzi 2007). Manual broadcast sowing often results in uneven seed placement in the soil, which results in uneven emergence and stands. Seeds may be placed as deep as 2 to 5 cm, where many seeds will germinate but will not emerge through the soil surface. Other seeds may be placed very shallow or on the soil surface. These seeds often do not survive due to dry soil or winter damage. The uneven stands from broadcasting often result in lower yields comparing with drilling (Herbek and Murdock, 2003).
-
Upload
independent -
Category
Documents
-
view
0 -
download
0
Transcript of Main body final

1
1. INTRODUCTION
1.1. Background and Justification
Developing countries have many economical and social problems caused by population
increase and lower income per capita. Rapidly increasing populations require more food,
but since most land is already under cultivation, the only way to increase production is to
increase yield and grow more than one crop in a year. Despite the great progress of
mechanization in agriculture, manual workers will still continue to provide the main
source of power for the farmers on small farms of many developing countries (Hopfen,
1969; Allen, 1979; Dibbits, 1991; Awadhwal et al., 1992). In circumstances where
human labour is supplemented by other energy sources to lighten the task or to increase
work capacity, the human energy expenditure might still be considerable. Firstly, an
important source of power to be considered is human power as many areas have no
access to sources of energy except human power; small tractors on small individual farms
are not feasible.
Man powered and other power sourced seeders boost the yield of small holders by placing
seeds in an environment for reliable germination. The main objective of sowing is to put
seeds at a desired depth and spacing within the row. Uniform seed distribution within the
soil results in better germination and emergence and increases yield by minimizing
competition between plants for available light, water, and nutrients. A number of factors
affect seed distribution in soil. Seed metering system, seed delivery tube, furrow opener
design, physical attributes of seed and soil conditions all play a part in determining seed
distribution ( Karayel and Ormerzi 2007).
Manual broadcast sowing often results in uneven seed placement in the soil, which results
in uneven emergence and stands. Seeds may be placed as deep as 2 to 5 cm, where many
seeds will germinate but will not emerge through the soil surface. Other seeds may be
placed very shallow or on the soil surface. These seeds often do not survive due to dry soil
or winter damage. The uneven stands from broadcasting often result in lower yields
comparing with drilling (Herbek and Murdock, 2003).
2
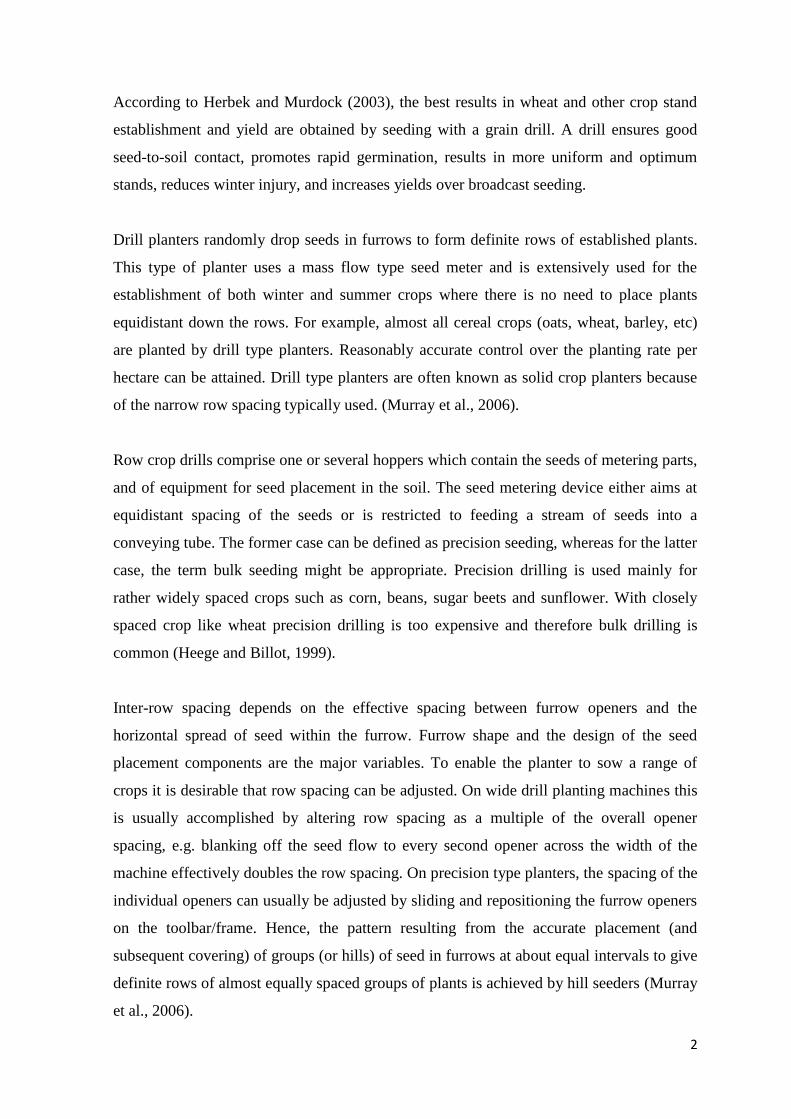
According to Herbek and Murdock (2003), the best results in wheat and other crop stand
establishment and yield are obtained by seeding with a grain drill. A drill ensures good
seed-to-soil contact, promotes rapid germination, results in more uniform and optimum
stands, reduces winter injury, and increases yields over broadcast seeding.
Drill planters randomly drop seeds in furrows to form definite rows of established plants.
This type of planter uses a mass flow type seed meter and is extensively used for the
establishment of both winter and summer crops where there is no need to place plants
equidistant down the rows. For example, almost all cereal crops (oats, wheat, barley, etc)
are planted by drill type planters. Reasonably accurate control over the planting rate per
hectare can be attained. Drill type planters are often known as solid crop planters because
of the narrow row spacing typically used. (Murray et al., 2006).
Row crop drills comprise one or several hoppers which contain the seeds of metering parts,
and of equipment for seed placement in the soil. The seed metering device either aims at
equidistant spacing of the seeds or is restricted to feeding a stream of seeds into a
conveying tube. The former case can be defined as precision seeding, whereas for the latter
case, the term bulk seeding might be appropriate. Precision drilling is used mainly for
rather widely spaced crops such as corn, beans, sugar beets and sunflower. With closely
spaced crop like wheat precision drilling is too expensive and therefore bulk drilling is
common (Heege and Billot, 1999).
Inter-row spacing depends on the effective spacing between furrow openers and the
horizontal spread of seed within the furrow. Furrow shape and the design of the seed
placement components are the major variables. To enable the planter to sow a range of
crops it is desirable that row spacing can be adjusted. On wide drill planting machines this
is usually accomplished by altering row spacing as a multiple of the overall opener
spacing, e.g. blanking off the seed flow to every second opener across the width of the
machine effectively doubles the row spacing. On precision type planters, the spacing of the
individual openers can usually be adjusted by sliding and repositioning the furrow openers
on the toolbar/frame. Hence, the pattern resulting from the accurate placement (and
subsequent covering) of groups (or hills) of seed in furrows at about equal intervals to give
definite rows of almost equally spaced groups of plants is achieved by hill seeders (Murray
et al., 2006).
3
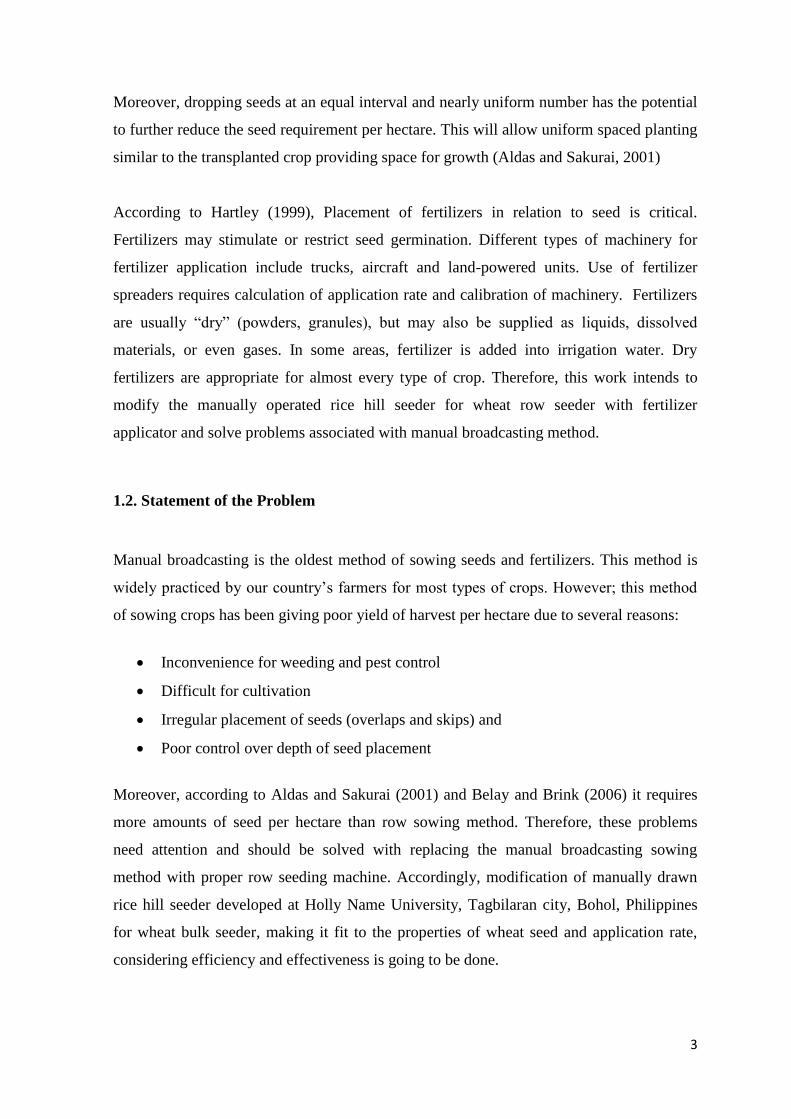
Moreover, dropping seeds at an equal interval and nearly uniform number has the potential
to further reduce the seed requirement per hectare. This will allow uniform spaced planting
similar to the transplanted crop providing space for growth (Aldas and Sakurai, 2001)
According to Hartley (1999), Placement of fertilizers in relation to seed is critical.
Fertilizers may stimulate or restrict seed germination. Different types of machinery for
fertilizer application include trucks, aircraft and land-powered units. Use of fertilizer
spreaders requires calculation of application rate and calibration of machinery. Fertilizers
are usually ―dry‖ (powders, granules), but may also be supplied as liquids, dissolved
materials, or even gases. In some areas, fertilizer is added into irrigation water. Dry
fertilizers are appropriate for almost every type of crop. Therefore, this work intends to
modify the manually operated rice hill seeder for wheat row seeder with fertilizer
applicator and solve problems associated with manual broadcasting method.
1.2. Statement of the Problem
Manual broadcasting is the oldest method of sowing seeds and fertilizers. This method is
widely practiced by our country‘s farmers for most types of crops. However; this method
of sowing crops has been giving poor yield of harvest per hectare due to several reasons:
Inconvenience for weeding and pest control
Difficult for cultivation
Irregular placement of seeds (overlaps and skips) and
Poor control over depth of seed placement
Moreover, according to Aldas and Sakurai (2001) and Belay and Brink (2006) it requires
more amounts of seed per hectare than row sowing method. Therefore, these problems
need attention and should be solved with replacing the manual broadcasting sowing
method with proper row seeding machine. Accordingly, modification of manually drawn
rice hill seeder developed at Holly Name University, Tagbilaran city, Bohol, Philippines
for wheat bulk seeder, making it fit to the properties of wheat seed and application rate,
considering efficiency and effectiveness is going to be done.

4
1.3. Objective of the Study
1.3.1. General Objective
The main objective of this research work is to modify the manually drawn rice hill seeder
(row seeder) developed at Holly Name University, Philippines for wheat with additional
fertilizer application capability.
1.3.2. Specific Objectives
To modify the seed metering device, seed hopper and furrow opener of the machine
for wheat.
To add a fertilizer application metering unit
To determine the draft force required by the machine at actual field condition
To evaluate the performance of the modified seeder in laboratory and actual field.
1.4.Significance of the Study
The main significance of the study is the development of a three row wheat hill seeder with
fertilizer applicator. The surrounding small holder farmers will be the main beneficiary and
the technology can also be disseminated to all over the country and other farmers can
utilize it. Moreover the seeder will be used as teaching aid for practical demonstration in
the department of Agricultural Engineering.

5
2. LITERATURE REVIEW
2.1. Overview of Wheat Production in Ethiopia
Ethiopia is the second largest producer of wheat in sub-Saharan Africa, following South
Africa. About 900,000 ha of bread (Triticum aestivum) and durum (T. turgidum var.
durum) wheats are grown in Ethiopia, primarily as highland rainfed crops. Mean wheat
yields are around 1.4 t/ha, well below experimental yields of over 5 t/ha Ethiopia‘s current
annual wheat production of approximately 1.3 million tons is insufficient to meet domestic
needs, forcing the country to import 30 to 50% of the annual wheat grain required. The
yield gap of over 3 t/ha suggests the potential for increasing production through improved
crop management, particularly increased use of fertilizers. However, there is also
justification for examining whether wheat production can be introduced to non-traditional
areas, (Hailu 1991).
Bread wheat accounts for roughly 60% of total wheat production and nearly all cultivars
are derived from modern, semi-dwarf wheats. Durum wheat accounts for most of the
remaining 40%, although emmer wheat (T. dicoccum L.) is also grown. Bread wheat is
produced at slightly higher elevations and on better drained soils than durum wheat, which
is primarily found on poorly drained Vertisols (Hailu 1991). Wheat production constraints
include low soil fertility, grass weed infestations, water logging in Vertisol areas, and
water deficits in short season areas (Tanner et al. 1991). Stripe rust (Puccinia striiformis) is
common at higher elevations (> 2,400 m); stem rust (P. graminis f. sp. tritici) is more
problematic at midelevations (2,000-2,400 m) (Bekele and Tanner 1995).
Double-cropping has recently been demonstrated as a promising option for south eastern
Ethiopia. In the Bale zone of Oromiya Region, the belg rains are sufficiently long and
reliable for wheat or other crops. Double cropping could reduce the negative effects of the
current practice of alternate season fallows: a continuous crop cover would reduce erosion;
alternating crops would help control weeds; and human and animal power could be used
more efficiently, (Tanner et al. 1994)
6
2.2.Potential Wheat Production Areas of Ethiopia
Because water deficits and warm night temperatures seemed to be key factors delimiting
bread wheat production areas in Ethiopia, potential new areas for bread wheat production
were identified by assuming that technologies could be developed to allow wheat to be
grown in drier or warmer environments. For drier conditions, such technologies might
include more drought tolerant cultivars, supplemental irrigation from small catchments, or
agronomic practices—such as reduced tillage and residue retention—that reduce runoff.
Growing wheat under warmer conditions might require cultivars with greater heat
tolerance as well as resistance to pathogens that prevail under warmer conditions
(e.g., Helminthosporium sativum) Belay et al., (1999).
Applying the assumption that wheat will grow in areas receiving as little as 300 mm during
the wettest quarter resulted in a surprisingly small addition (4%) to the potential wheat
production area. In contrast, a shift in adaptation to include areas with 2°C warmer
minimum temperatures (e.g., up to 13°C) substantially increase potential wheat area. The
actual impact on total wheat area is impossible to estimate: zones that meet climate criteria
may have unsuitable soils or topography or already be used for other, more profitable
agricultural pursuits. However, as a rough indicator, increasing the minimum temperature
limit by 2°C expanded the potential area suitable for wheat production by 108% (Belay et
al., 1999).
7
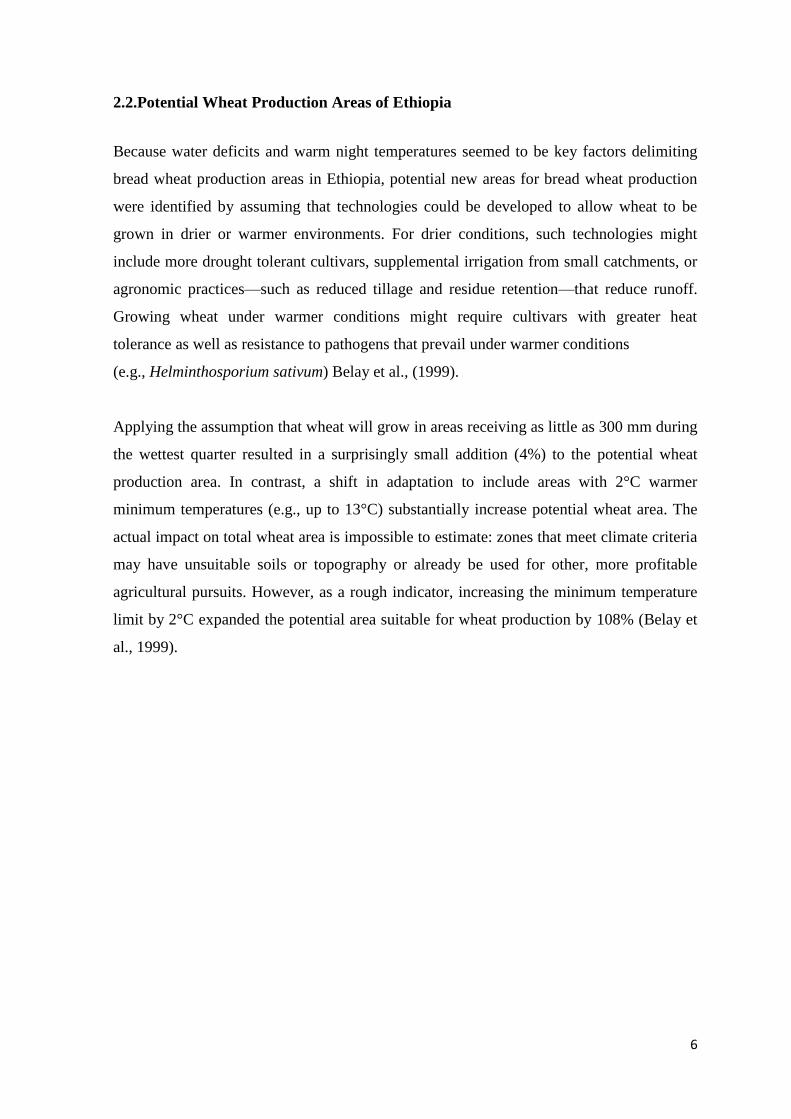
Figure 2.1: Approximate distribution of traditional wheat production areas of Ethiopia
(from Belay et al., 1999).
2.3.Physical Properties of Seeds and their Use in Designing Bulk Seeders
The knowledge of some important physical properties such as shape, size, volume, surface
area, thousand grain mass, density, porosity, angle of repose, of different grains is
necessary for the design of various separating, handling, storing, drying and planting
systems (Sahay and Singh, 1994). Bulk density, true density, and porosity (the ratio of
intergranular space to the total space occupied by the grain) can be useful in sizing grain
hoppers and storage facilities; they can affect the rate of heat and mass transfer of moisture
during aeration and drying processes ( Kheiralipour et al., 2008).
Seed flow through a planter is dependent on size, shape, sphericity, true density and angle
of repose of seeds. In addition, the impact of seeds on the internal components of the
planter is influenced by the coefficient of restitution of seeds on various impinging
surfaces (Jayan and Kumar, 2004). The static coefficient of friction and angle of repose is

8
necessary to design conveying machine and hopers used in planter machines (Karimi et.al,
2009).
The moisture content of seeds according to (RNAM, 1995) is calculated using the
following equation:
𝑀𝑐 =𝑀𝑤−𝑊𝑑
𝑊𝑑 ----------------------------------------------------------------------------------------1
Where, 𝑀𝑐 is moisture content (%) dry basis, 𝑀𝑤 mass of selected seed as bought from
market and 𝑊𝑑 is mass of dried seeds.
According to Mohsenin (1986), the three linear dimensions (namely, length L, width W,
and thickness T) can be measured using digital micrometer and the average diameter of
the seeds can presented as the arithmetic mean and geometric mean of the three axial
dimensions. Mohsenin, (1986) calculated the geometric mean diameter (Dg) and the
arithmetic mean diameter (Da) as follows:
Dg = (LWT)1/3 -----------------------------------------------------------------------------------------2
𝐷𝑎 = 𝐿+𝑊+𝑇
3 ----------------------------------------------------------------------------------------3
Mohsenin, (1986) also determined the shericity seeds by using the following equations:
ᶲ =(𝐿𝑊𝑇)
𝐿
1/3 -------------------------------------------------------------------------------------4
Whereᶲ is the sphericity; L is the length in mm; W is the width in mm; and T is the
thickness in mm. More over According to Razavi and Milani,(2006) the porosity which is
the ratio of free space between grains to total of bulk grains and coefficient of static
friction are determined as follows respectively:
휀 =𝜌𝑘−𝜌𝑏
𝜌𝑘 -----------------------------------------------------------------------------------------5
Where, ԑ is porosity
𝜌𝑘 is true density and
𝜌𝑏 is bulk density
𝜇 = 𝑡𝑎𝑛𝜑 --------------------------------------------------------------------------------------------6
Where, 𝜇 is coefficient of static friction
𝜑 is inclination angle
9
2.4.Function of Seeders
According to Karayel and Ormerzi (2007) the success of cultivating a crop is strongly
related to the seeding process. In this process the machine factor has special importance,
since it is responsible for the spatial distribution of plants which in turn greatly affects the
productivity of crops. The overall functions of a planter are according to Kepner et al.,
(1982) to open the seed furrow to the proper depth, meter the seeds in a furrow in an
acceptable pattern, cover the seeds and compact the soil around them. In the precision
seeding the metering device allows the placement of seeds at pre set distance among them
in the furrow.
Seeders and planters are essential for the sowing of seeds. Their function is metering and
placing in the soil of seeds or plants or of parts thereof. Thus, seeders are used for
generative reproduction, whereas planters aid in vegetative propagation. In some parts of
the world, the term planter is used for a seeder. Both seeders and planters are either used as
solo machines or in combinations with preceding soil cultivating machines. In some cases,
combinations with fertilizing equipment are also common (Heege and Billot, 1999).
2.5.Seed Metering Devices
When a crop is planted, the aim is to establish plant population whose spacing contributes
to the maximum return per surface area Kepner et al., (1982). Optimizing the density of
plant is a prime importance, and this requires precision in terms of seed metering and
distribution by the seeding machine. The objective of seed metering is accurate and
uniform seeding without causing damage to the seeds.
Moreover, Herbek and Murdock (2003) reported that planting method should be based on
planting equipment, time and labour availability, seeding costs, planting date opportunity,
weather, crop usage, yield goals, and stand establishment risks associated with each
method. In addition, calibration of planting equipment is critical to getting the correct
number of seeds in the soil.
Seed distribution refers to the planting of seeds according to pre determined pattern
(Karayel and Ormerzi, 2007). This should take in to account the requirement for
10
equidistance spacing between seeds. The depth at which they are planted should be
adjusted to provide them the best moisture condition (Kumar, 1989), it is therefore
important to take in to account the components of the drill and the possibilities of their
adjustment.
Karayel and Ormerzi, (2007), also reported that one factor affecting the quality of the crop
in mechanized crop production systems is the planting operation. The more precise the
planting operation, the better the quality of crop harvested. Precision planting reduces seed
scattering and excessive use of seeds due to uniform distribution of seeds and by
preventing seed from bouncing in the furrow, which facilitates drill calibration on the basis
of the number of seeds to be placed along a unit length of the row. Uniform germination
and growth of plants makes the subsequent operations, such as weeding and harvesting,
easy with less costs.
According to Karayel and Ormerzi (2007) the seed metering device is not only responsible
for the planters‘ performance concerning precision. The metered seeds still have to be
carried to the bottom of the furrow (opener at a certain depth) and properly conditioned.
The quality of these operations decisively affects the seedling emergence index (number of
viable seeds delivered to the emerged seedling ratio), which is one of the parameters used
to evaluate the final performance of a precision planter (Yadav et al., 2002)
Metering mechanism is the heart of sowing machine and its function is to distribute seeds
uniformly at the desired application rates. In planters it also controls seed spacing in a row.
A seed drill or planter may be required to drop the seeds at rates varying across wide range
(Zarate, 2004).
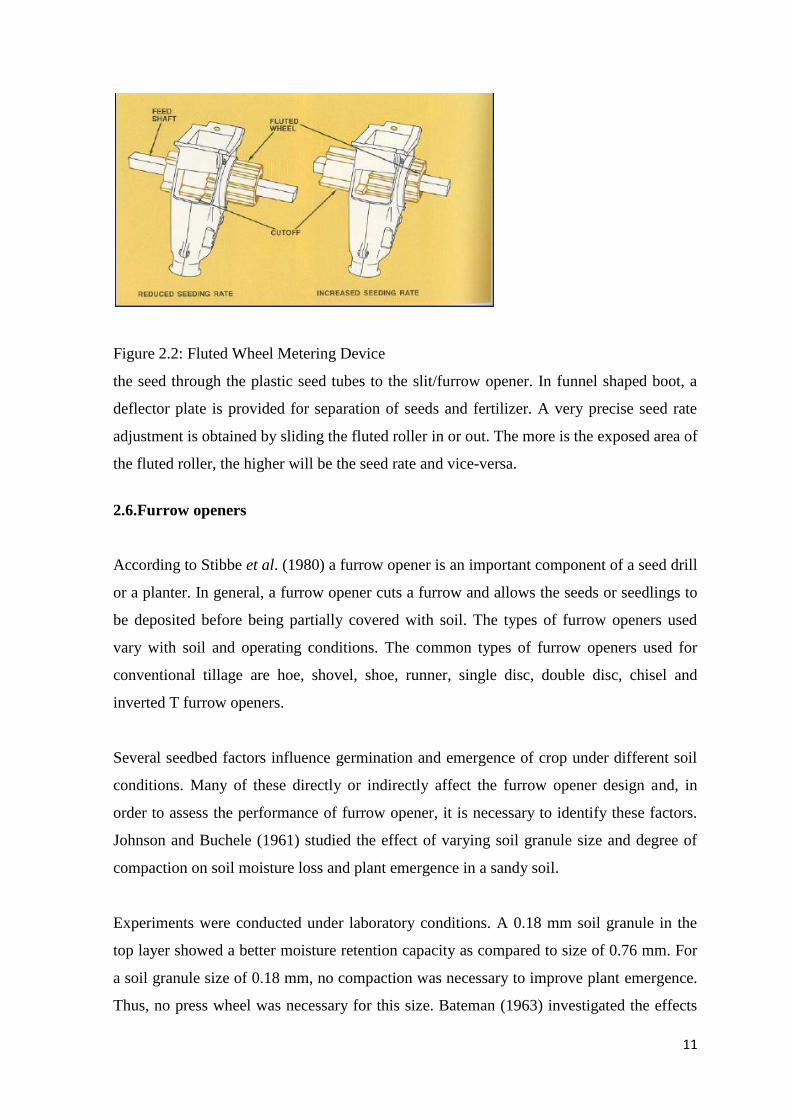
Yadav et al., (2002) described fluted rollers made of aluminium facilitate continuous
seeding of crops where control of plant to plant distance is not needed (wheat, rice, etc.).
Tooth size, depth of groove and the number of flutes depend on the seed size. For example,
there are 10 flutes in each roller for wheat seed. The rollers are fitted in a series on a shaft.
Aluminium cups are fitted on these rollers. Below the fluted rollers are aluminium or
plastic tongues to hold the seed. The tongues can be raised or lowered depending on the
size and texture (in case of rice) of the seed. As the fluted rollers turn, they push the seed
over the edge of the seed cups attached at the bottom of seed metering box which funnels
11
Figure 2.2: Fluted Wheel Metering Device
the seed through the plastic seed tubes to the slit/furrow opener. In funnel shaped boot, a
deflector plate is provided for separation of seeds and fertilizer. A very precise seed rate
adjustment is obtained by sliding the fluted roller in or out. The more is the exposed area of
the fluted roller, the higher will be the seed rate and vice-versa.
2.6.Furrow openers
According to Stibbe et al. (1980) a furrow opener is an important component of a seed drill
or a planter. In general, a furrow opener cuts a furrow and allows the seeds or seedlings to
be deposited before being partially covered with soil. The types of furrow openers used
vary with soil and operating conditions. The common types of furrow openers used for
conventional tillage are hoe, shovel, shoe, runner, single disc, double disc, chisel and
inverted T furrow openers.
Several seedbed factors influence germination and emergence of crop under different soil
conditions. Many of these directly or indirectly affect the furrow opener design and, in
order to assess the performance of furrow opener, it is necessary to identify these factors.
Johnson and Buchele (1961) studied the effect of varying soil granule size and degree of
compaction on soil moisture loss and plant emergence in a sandy soil.
Experiments were conducted under laboratory conditions. A 0.18 mm soil granule in the
top layer showed a better moisture retention capacity as compared to size of 0.76 mm. For
a soil granule size of 0.18 mm, no compaction was necessary to improve plant emergence.
Thus, no press wheel was necessary for this size. Bateman (1963) investigated the effects

12
of soil compaction on soil properties and found that a clay soil was susceptible to
compaction which caused high mechanical impedance to crop establishment. Thus, furrow
openers for clay soils should be designed for having loose soil above the seed. Stibbe et al.
(1980) investigated the effects of tillage on seedbed characteristics, plant establishment and
yield of maize on light sandy soil. Effects of furrow packing gave better emergence under
some conditions. However, additional compaction in the plant rows brought about a
significant decrease in crop yield. Panwar and Sirohi (1980) studied critical parameters of
plant emergence and root growth in sandy soil. They concluded that:
(a) a minimum soil moisture content of 10% is recommended for wheat and maize;
(b) for both wheat and maize, soil cover density of 1.3 and 1.9 g cm-3
proved to be too high
in soil impedance for plants to emerge;
(c) a seedbed density of higher than 1.5 g cm-3
restricted both root and plant growth; and
(d) the wheat crop was more sensitive to compaction as compared to maize
The most common design studies have been related to the optimum rake angle of furrow
openers. Furrow openers are generally of two types, one type with rake angles of less than
90° and the other with rake angles of greater than 90°. The effect of force on furrow
openers having different rake angles was studied by Dransfeld et al. (1964), Siemens et al.
(1965), Abernathy and Porterfield (1969), Gebresenbet and Johnson (1992), Mathur and
Pandey (1992) and Damora and Pandey (1995). Siemens et al. (1965) concluded
analytically as well as from experimental results that a rake angle of 25° gave the lowest
draught. The rake angle of the furrow opener which gave minimum specific draught was
reported by Mathur and Pandey (1992) as 28° for a lateritic sandy clay loam soil.
In addition to the effect of rake angle of the furrow openers on the forces acting upon them,
the rake angle also affects the depth of operation and the depth stability of the opener. The
depth stability is indicated by the variation in equilibrium depth of a seed drill furrow
opener due to changes in operating speed. Abernathy and Porterfield (1969) evaluated
runner-type furrow openers having rake angles ranging from 90 to 150° and horizontal
included angles (also known as the wedge angle) from 15 to 60° in a laboratory soil bin
containing light sandy soil. They reported that furrow depth was greater for openers with
large rake angles and large horizontal included angles. Gebrebenset and Johnson (1992)
reported that depth stability was best for a rake angle of 130° in a light sandy soil. No
conclusions, however, could be drawn for clay soils. Width of furrow openers is another
13
design factor affecting draught of the opener as well as soil cover in the furrows of the
opener.
As reported by Siemens et al., (1965) and Gebrebenset and Johnson (1992), the force
acting on the furrow opener increases with increasing width of opener. The recovery of soil
in the furrows of the furrow openers of seeders for pre-germinated rice, operating in
puddled soil, was complete for furrow opener widths of 40 mm but not so for 50 mm
(Srivastava & Panwar, 1986). In order to account for variations in the horizontal and
vertical forces caused by changes in rake angle, width and depth of operation of furrow
openers, polynomial models were developed by Gebrebenset and Johnson (1992) for
furrow openers having rake angles ranging from 70 to 130°, depths ranging from 10 to 70
mm and width of opener ranging from 15 to 40 mm. These models were used to predict
rake angles for zero vertical force. The predicted rake angles ranged from 67° to 81°,
depending upon speed, depth and width of operation. However, the model could not be
extended to clay soils, as found from subsequent field studies.
2.7.Seed Covering Devices
Seed covering devices are specifically designed to promote soil flow back into the furrow
to cover the seed after placement and/or firming. They play an important role in promoting
and stabilising conditions conducive to rapid seed germination and influencing seed
emergence and establishment through the manipulation of the depth of soil cover over the
seed. The functional requirements of seed covering devices are to assist in the transfer of
displaced surface soil back into the furrow for the purpose of covering the seed with soil;
assist in regulating the depth of soil cover over the seed (i.e. assist in regulating planting
depth relative to the final seedbed surface); and in some cases, assist in re-levelling the
seedbed surface. (Zarate, 2004).
According to Murray et.al (2006), covering the seed with soil helps provide and stabilise
an appropriate seed environment (e.g. reduce the rate of moisture loss and provide
seed/soil contact to optimise both the rate of moisture transfer and the duration of moisture
availability to the seed, reduce temperature fluctuations, etc); and protect seed from
predators such as birds, mice and insects. The need for, and the design of, the covering
device on a planter depends on many factors, including the soil type and condition; the
14
design of the furrow opener; the type and amount of surface residue; and the speed of
operation, etc. Not all planters have or need dedicated seed covering devices. Some drill
seeders, for example, rely solely on soil flow around the opener to cover the seed
2.8. Wheat Propagation and Planting
Belay and Brink (2006), reported that wheat reached North highlands of Ethiopia around
3000 BC. In tropical Africa durum wheat is predominantly grown in Ethiopia and to some
extent in Eritrea and Angola Wheat is propagated by seed. The 1000 seed mass of wheat is
30-50 g. It is advisable to use certified seed that has been treated with fungicides against
soil and seed-born diseases, but this is rarely practiced in tropical Africa. Wheat is sown by
hand or machine. When broadcasting, the seed is incorporated in the soil using an animal
drawn plough or machine drawn disc. The seed may also be dibbled directly into a furrow
behind the plough and covered, or machine planted in rows. Nelson, (1986) said that the
optimum seed rates for wheat vary with variety, location and method of planting. For seed
production fields, a lower seed rate may be recommended because lower seed rates lead to
higher multiplication factors but to lower yield per unit area. Higher multiplication factors
lead to rapid seed increase (more seed harvested per kilogram of seed planted), and farmers
will benefit from the improved variety earlier.
Low seed rates do not only increase the multiplication factor, but also often improve seed
quality because a lower number of plants per unit of land receive better nutrition, thus
producing better quality seed. Belay and Brink (2006) found that Common seed rates for
wheat are 150-200 kg/ha for broadcasting and 75-120 kg/ha for drilling in row. The
optimum spacing is 10-25 cm between rows, but it may extend up to 35 cm. The sowing
depth is 2-5 cm with deeper planting required in dry conditions
According to Herbek and Murdock (2003), best results in wheat stand establishment and
yield are obtained by seeding with a grain drill. A drill ensures good seed-to-soil contact,
promotes rapid germination, results in more uniform and optimum stands, reduces winter
injury, and increases yields over broadcast seeding and aerial seeding. Drills can be used
for conventional tillage, reduced tillage, and no-tillage field conditions. Conventional/full
tillage provides a level, smooth seedbed for drilling and results in a more uniform planting
15
depth. Drills with additional coulters and more down pressure on the planter units can
establish a good stand of wheat in reduced tillage and no-tillage fields. Moreover, row-
planting with drills has an advantage over broadcasting, as it requires less seed and
facilitates mechanized weed control, roguing and field inspection. Roguing lanes (empty
rows at intervals) should be left, which could be used by the seed grower to walk through
the field when roguing and inspecting the crop, as well as for spraying the crop.
2.9. Use of Fertilizers
Fertilizer is defined as "any substance containing one or more recognized plant nutrient(s)
which is used for its plant nutrient content and which is designed for use or claimed to
have value in promoting plant growth" (AAPFCO, 1997).
Application of chemical fertilizers has played a pivotal role in increasing crop production
all over the world. The alkaline and calcareous soils of Pakistan are low both in nitrogen
(N) and in phosphorus (P), requiring the addition of nutrients in appropriate amounts for
improving crop yields. Consequently, the use of N and P fertilizers increased many fold
since their introduction in the late fifties (Ahmad, 2000). Nitrogen demand increased
consistently and outstripped that of phosphate, thus leading to a serious imbalance in the
use of these two nutrients. It is very well known that balanced fertilization helps efficient
utilization of other agricultural inputs and increases crop yields (Rashid, 1994; Alam et al.,
2000). Among other agronomic practices that influence the efficiency of applied fertilizer,
time and method of application are also critically important. As fertilizer is a costly input
and the fertilizer use efficiency under local soil and climatic conditions are low, maximum
use efficiency should be the target for high economic returns.
Ascher et al. (1994) concluded that fertilizer application to seed crops should be based on
local recommendations. A well balanced supply of nitrogen, phosphorus and potassium
(NPK) is essential for seed production as it has an influence on seed development and
thereby on seed quality. Phosphorus is essential for enhancing seed maturity and K for
seed development.

16
2.10. Fertilizer Application Techniques
Several studies have been conducted to determine whether surface application or
incorporating controlled-release fertilizer (CRF) produces larger plants. Plant growth
varies depending on the method of application, nutrient release characteristics of the CRF,
rate of fertilization, container medium and plant species (Eakes et. al., 1990, Yeager et. al.,
1989).
According to Hairston, (2001), to minimize nutrient losses to the environment from
fertilizers, farm managers must ensure that plants use fertilizer efficiently. Best
Management Practices regarding fertilizer application techniques to increase fertilizer
uptake efficiency include proper timing, rate, and placement. Timing of fertilizer
application may be the most critical factor in determining fertilizer uptake efficiency and
crop yield. This is especially true for nitrogen fertilizer. When fertilizer is applied near the
time of maximum growth, crops are able to use more efficiently the nutrients. The more
nutrients that are used, the less opportunity there will be for loss. Extra amounts of
fertilizer will not ensure better crop yields or more efficient fertilizer uptake. Excessive
application will increase both the cost to the grower and the potential contamination of
surface waters and groundwater
Des Moines, (1989) discussed four different types of fertilizer placement (application) methods:
2.10.1. Broadcast and Surface Incorporation
The simplest method of fertilizer application is to broadcast the material on the soil
surface. The objective is uniform distribution of the nutrients and proper distribution of the
herbicide if a weed-and-feed combination of herbicide and fertilizer is used. Depending on
the tillage system, crop, expected weather conditions, herbicide program, and soil type, the
fertilizer material may be left on the surface or incorporated after application. So,
according to his finding, Des Moines (1989) reported that all nutrients will be more
efficiently utilized if they are incorporated after application. Incorporation makes the
nutrients less susceptible to erosion and runoff loss just after application.
17
2.10.2. Banding
Applying fertilizer in a narrow zone or band to provide a concentrated source of nutrients
is an advantage under some situation. Humenik et.al., (1982) pointed out the banding
application may result in more efficient use of the nutrients (1) if soil test levels are low,
(2) when early season stress from cool or wet conditions is likely to limit root growth, (3)
where large amounts of surface residue limit soil-fertilizer contact, or (4) in soils that have
a high tendency to fix nutrients in unavailable forms throughout the soil
2.10.3. Starter
Starter fertilizer application, a form of band application close to the seed, is an important
means of getting crops off to an early start. It is particularly helpful for crops planted in
cool soils. Crops planted under conservation or reduced tillage conditions frequently face
those conditions. Cool soil temperatures slow root development, lower plant metabolism,
and diminish the amount of energy released by sugar metabolism, which is needed for
nutrient uptake. (Des Moines, 1989)
2.11. Machinery for Fertilizer Application
Hartley (1999) discussed machinery for fertilizer application varies, depending on
conditions under which fertilizer is applied and type of fertilizer. Machinery for fertilizer
application can be grouped into three categories, depending on mode of application:
• ‗Straight‘ spreaders ranging from large machines to tractor mounted units
• ‗Placement‘ machines which distribute the fertilizer onto the ground surface in
bands near the plant or just below the ground surface
• Liquid or gas application machines
When designing fertilizer application systems, various factors require consideration like
uniformity of distribution at both low and high speeds, accurate control of delivery rates
mechanical durability, easy operation, and rapid clean up.

18
3. MATERIALS AND METHODS
This study was carried out with an aim to modify and test an appropriate wheat drilling
machine. The drill was modified in order to evaluate its performance. Thus the study was
divided into two phases; machine modification and performance evaluation in the
laboratory and in the actual field. This chapter solely deals with modification and
fabrication of the wheat drill machine with fertilizer application capability and the
laboratory and field test procedures.
3.1. Location of The Study
All the mechanical works like machining, welding, etc, during the fabrication of the
machine were done at Adama Science and Technology University, Mechanical
Engineering Department Work shop. After development of the machine, laboratory tests
were also done at the same department. Finally the machine field performance tests were
also performed with in the campus experiment field. The soil of the area is categorised as
sand soil, the altitude is about 1500 m above sea level with annual rain fall ranging from
700-1200 mm as sourced from local meteorological station.
3.2. Material
The wheat drill machine consists of: the hoppers, seed metering devices, ground wheels,
seed and fertilizer tubes, furrow opening and covering devices, drive shaft, main frame and
the handle.
(a) The hoppers: - There are three feed hoppers for both wheat and fertilizer made of 2
mm thick mild steel with partition wall, each having a tapered cross section. The design
capacity of each hopper is 3 kg. The dimension of the hoppers is 280 mm x 270 mm x 170
mm.
(b) Seed Metering device: - The seed metering devices or flutes were made of aluminium
bar, turned by lathe machine to the required diameter and half cylindrical flutes were made
by milling machine. On each roller there are ten half cylindrical cells made, equidistant
19
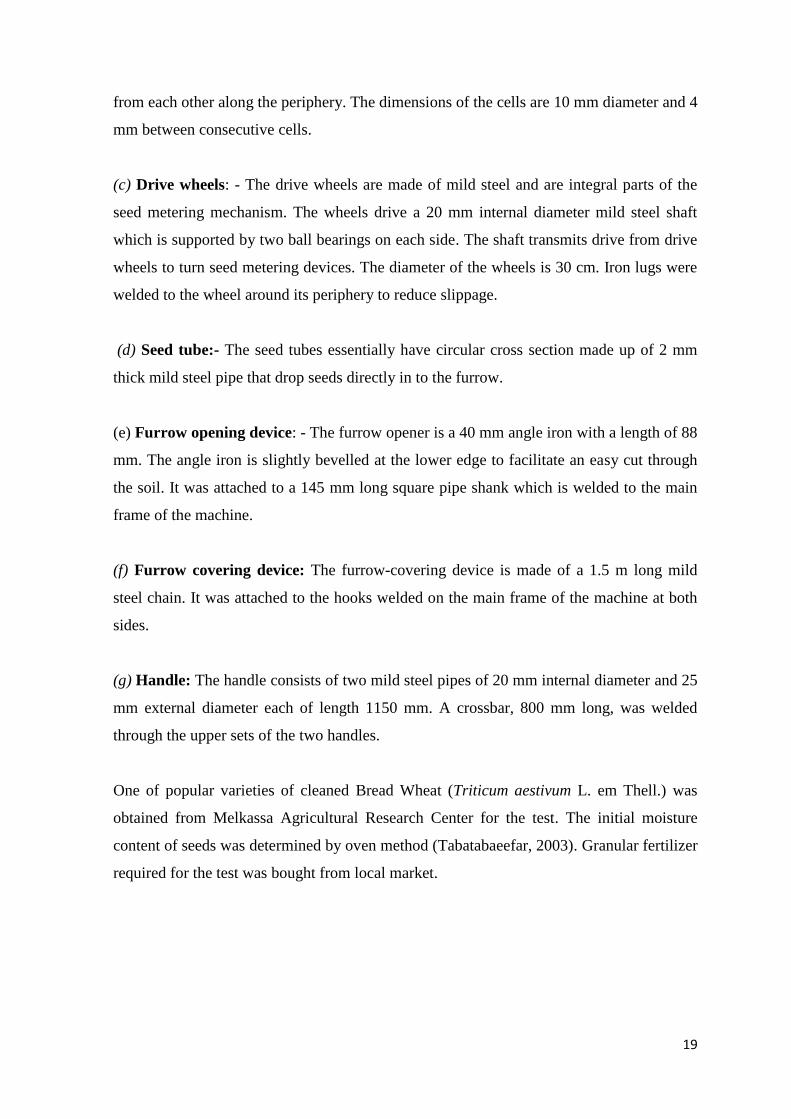
from each other along the periphery. The dimensions of the cells are 10 mm diameter and 4
mm between consecutive cells.
(c) Drive wheels: - The drive wheels are made of mild steel and are integral parts of the
seed metering mechanism. The wheels drive a 20 mm internal diameter mild steel shaft
which is supported by two ball bearings on each side. The shaft transmits drive from drive
wheels to turn seed metering devices. The diameter of the wheels is 30 cm. Iron lugs were
welded to the wheel around its periphery to reduce slippage.
(d) Seed tube:- The seed tubes essentially have circular cross section made up of 2 mm
thick mild steel pipe that drop seeds directly in to the furrow.
(e) Furrow opening device: - The furrow opener is a 40 mm angle iron with a length of 88
mm. The angle iron is slightly bevelled at the lower edge to facilitate an easy cut through
the soil. It was attached to a 145 mm long square pipe shank which is welded to the main
frame of the machine.
(f) Furrow covering device: The furrow-covering device is made of a 1.5 m long mild
steel chain. It was attached to the hooks welded on the main frame of the machine at both
sides.
(g) Handle: The handle consists of two mild steel pipes of 20 mm internal diameter and 25
mm external diameter each of length 1150 mm. A crossbar, 800 mm long, was welded
through the upper sets of the two handles.
One of popular varieties of cleaned Bread Wheat (Triticum aestivum L. em Thell.) was
obtained from Melkassa Agricultural Research Center for the test. The initial moisture
content of seeds was determined by oven method (Tabatabaeefar, 2003). Granular fertilizer
required for the test was bought from local market.

20
3.3. Determination of Physical Properties of wheat.
3.3.1. Moisture Content
Wheat seed was bought from the local market and cleaned to remove foreign materials
and impurities. The moisture content of the seed as brought from the market was
determined by drying samples in an air circulating oven set at 105°C (± 2) for 24 hrs.
Then the moisture content was calculated using equation 1.
3.3.2. Average Size
The average size was determined based on 100 randomly selected seeds. Three linear
dimensions (namely, length L, width W and thickness T) of the seeds were measured using
digital vernier caliper with an accuracy of 0.01 mm. The average diameter of the seeds was
presented as the arithmetic mean and geometric mean of the three axial dimensions. The
geometric mean diameter (Dg) and the arithmetic mean diameter (Da) were calculated for
the three principal dimensions equations 2 and 3 respectively and sphericity of the seeds
was determined using equation 4.
3.3.3. Emptying Repose Angle.
A box made of sheet metal with the top and bottom having equal dimension of 300 mm by
300 mm, and a height of 400mm was used to measure the angle of repose. At 200 mm
from the top, a circular disc of 100 mm diameter was fixed so that enough gap was left
between the hopper wall and disc which allows the seeds to flow through during the test. A
horizontal sliding gate was provided right below the disc for sudden release of the seed
during the test. Similar device was used for green gram by Nimkar and Chattopadhyay,
(2001) and for teff by Zewdu and Solomon (2007).
21
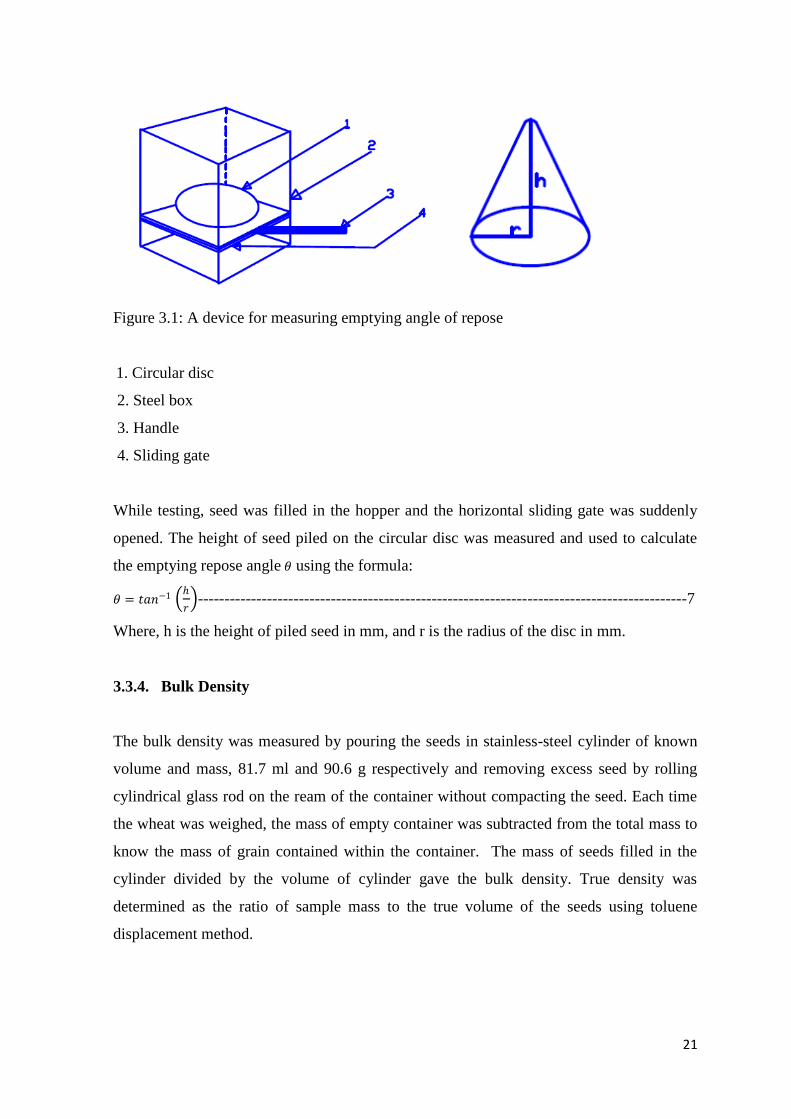
Figure 3.1: A device for measuring emptying angle of repose
1. Circular disc
2. Steel box
3. Handle
4. Sliding gate
While testing, seed was filled in the hopper and the horizontal sliding gate was suddenly
opened. The height of seed piled on the circular disc was measured and used to calculate
the emptying repose angle 𝜃 using the formula:
𝜃 = 𝑡𝑎𝑛−1
𝑟 --------------------------------------------------------------------------------------------7
Where, h is the height of piled seed in mm, and r is the radius of the disc in mm.
3.3.4. Bulk Density
The bulk density was measured by pouring the seeds in stainless-steel cylinder of known
volume and mass, 81.7 ml and 90.6 g respectively and removing excess seed by rolling
cylindrical glass rod on the ream of the container without compacting the seed. Each time
the wheat was weighed, the mass of empty container was subtracted from the total mass to
know the mass of grain contained within the container. The mass of seeds filled in the
cylinder divided by the volume of cylinder gave the bulk density. True density was
determined as the ratio of sample mass to the true volume of the seeds using toluene
displacement method.

22
3.3.5. Coefficient of Static Friction
The coefficient of static friction 𝜇 was determined for wheat seed against mild steel
surface. A plastic cylinder of 75 mm diameter and 50 mm height was filled with sample
and placed on tilting table having a scale to read the tilting angle directly. The seed-filled
cylinder was raised slightly, so that it will not have contact with the surface. The table was
raised gradually using a screw device till the cylinder just started to slide down and the
corresponding tilting angle 𝜑 was recorded. The value of 𝜇 was calculated using equation
6. Porosity is the ratio of free space between grains to total of bulk grains. That was
computed using equation 5.
3.4.Modification of the Seeder
The rice hill seeder to be modified is shown below:
Figure 3.2: The seeder to be modified with its metering disc.
The seed hopper, seed metering device, furrow openers, ground wheel and fertilizer
metering device were modified as stated below.
3.4.1. Seed Hopper
The seed and fertilizer hoppers were fabricated to cover almost full width of the machine.
These boxes were located above the main frame and fabricated with two millimetre thick
structural steel sheet. Partition was provided along the whole length of the box to avoid
direct contact of seed and fertilizer. Cross sectional area of the hopper was determined by
considering its trapezoidal section with ‗B‘ as base width, ‗h‘ as height of section and ‗α‘
as emptying angle of repose of wheat (RNAM, 1995).
23
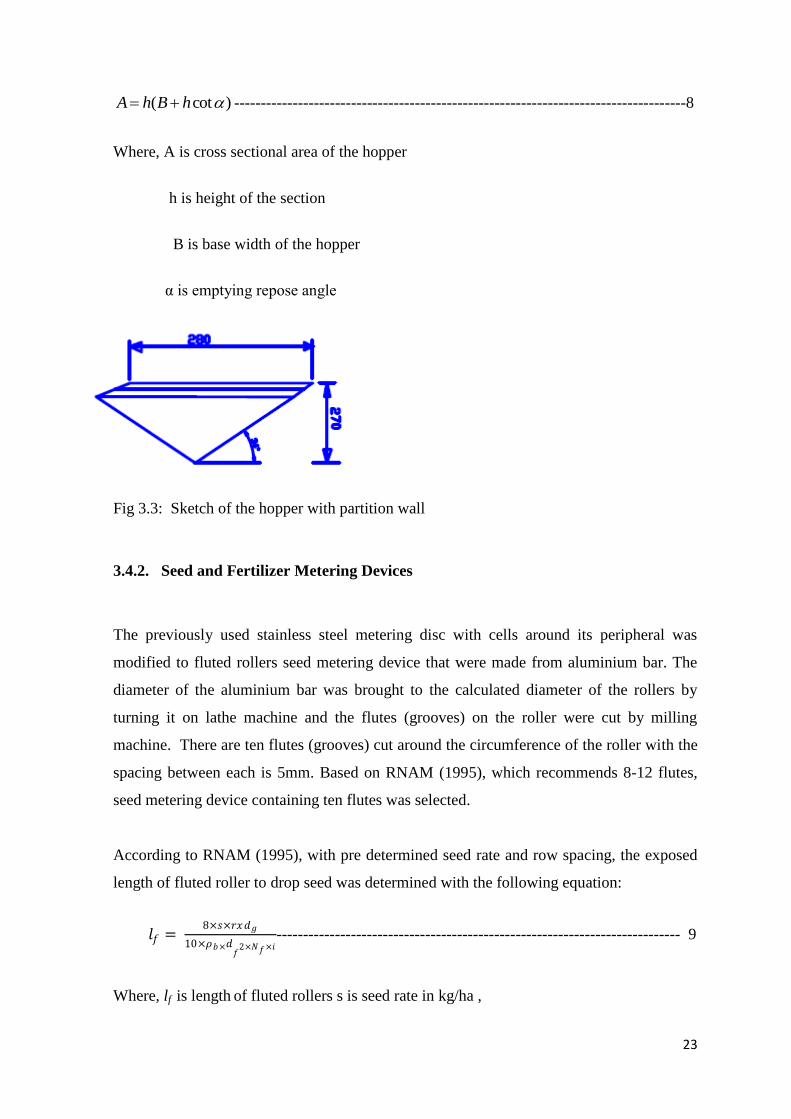
)cot( hBhA -------------------------------------------------------------------------------------8
Where, A is cross sectional area of the hopper
h is height of the section
B is base width of the hopper
α is emptying repose angle
Fig 3.3: Sketch of the hopper with partition wall
3.4.2. Seed and Fertilizer Metering Devices
The previously used stainless steel metering disc with cells around its peripheral was
modified to fluted rollers seed metering device that were made from aluminium bar. The
diameter of the aluminium bar was brought to the calculated diameter of the rollers by
turning it on lathe machine and the flutes (grooves) on the roller were cut by milling
machine. There are ten flutes (grooves) cut around the circumference of the roller with the
spacing between each is 5mm. Based on RNAM (1995), which recommends 8-12 flutes,
seed metering device containing ten flutes was selected.
According to RNAM (1995), with pre determined seed rate and row spacing, the exposed
length of fluted roller to drop seed was determined with the following equation:
𝑙𝑓 = 8×𝑠×𝑟𝑥𝑑𝑔
10×𝜌𝑏×𝑑𝑓
2×𝑁𝑓×𝑖---------------------------------------------------------------------------- 9
Where, lf is length of fluted rollers s is seed rate in kg/ha ,

24
ρb is bulk density in kgm-3
,
r is row spacing in m,
df is diameter of flute in m,
Nf is number of flutes,
i is transmission ratio and
dg is diameter of ground wheel in m,
The diameter of fluted roller plays an important role in dropping measured quantity of seed
per unit area. The diameter of fluted roller (dr) according to Muhammad (2004) was
determined with the help of the following relationship:
)( fff
r
sdNd
---------------------------------------------------------------------------------10
Where, Nf is number of flutes,
df is diameter of flutes in m and
sf is spacing between flutes in m.
The grooves cut through the length of the seed metering aluminium rollers were half
cylinders and their volume was determined as follows:
𝑉 =1
2𝜋𝑟2 ----------------------------------------------------------------------------------------11
Where, 𝑉 is volume the flute
r is radius of the cylinder and
h is the length of the groove
Both seed and fertilizer metering units were installed on the same shaft side by side. Two
flat mild steel wheels having 40 cm diameter each, were provided on either side of the

25
machine. The drive is transmitted directly from wheels to the shaft on which the seed
metering units are mounted. Lugs were welded around the circumference of the wheel to
reduce slippage of the drive wheels.
Fertilizer metering device was required to meter and drop fertilizer from fertilizer box into
the furrow. The placement of fertilizer in furrows was adopted in order to reduce
volatilization loss of nitrogen. The fluted wheel metering devices made from aluminium
were incorporated because of their capability for easily handling granular fertilizer
(RNAM, 1995). The procedures used to modify the seed metering device were used to
modify fertilizer metering device.
3.4.3. Seed and Fertilizer Placement Mechanism
3.4.3.1.Furrow Opener
A furrow opener should make a narrow slit with least soil disturbance and promote plant
emergence by maintaining edaphic factors such as moisture content, bulk density, aeration
and temperature so that the root bed is conducive to seed germination. The share of the
furrow should be sharp and wear resistant.
Keeping in view the above requirement the hoe type furrow openers made of steel angle
iron were employed. The furrow openers of these types has lower draft requirement when
compared with shoe type and shovel type openers according to Benjaphragairat et al.,
(2010). The furrow penetration depth of 2-5 cm which is recommended for wheat was
considered during the modification of the furrow opener and was made 3.5 cm
The furrow openers were welded on straight shanks made of mild steel. The rake angle of
the openers was made 20 degrees in order to facilitate the working of furrow openers with
minimum of soil disturbance. The relief or clearance angle was also made 20° in order to
minimize draft (Kepener et al.,1982).
26
3.4.3.2.Furrow Covering Device
Even though the wide range of seed covering devices exist, a Chain type covering device
was used to trail behind the furrow opener and drag loose soil into the furrow to cover the
seed. Chain type covering devices are most easily adapted for use in well-prepared (friable)
seedbeds without significant quantities of surface residue and where no significant degree
of soil movement is required to fill the furrow (Murray et al. 2006). Therefore 1.5 m long
chain was attached to hooks welded at either ends of the machine to be used as furrow
covering device
3.4.3.3.Seed and Fertilizer Tubes
Releasing of both seed and fertilizer through the same tube is not good practice (Smith,
1965). A better method is to release the fertilizer through separate tubes. In order to drop
the seeds and fertilizer through separate tubes a pipe was provided behind each furrow
opener.
Direct contact of seed with fertilizer affects seed germination, therefore a partition wall
provided in each furrow opener helped to exclude that possibility. Separate furrow openers
for seed and fertilizer were not provided because they would have increased cost of
machine and draft requirement.
3.5. Design of Power Transmission Shaft
In order to design the power transmitting shaft, the parameters taken into account were the
speed of the shaft, power to be transmitted, torque applied on the shaft and bending and
twisting moments on the shaft. The speed of the shaft and power transmitted by the shaft
were 20 rpm and 156 W respectively. To measure the rpm of the shaft the ground wheel
was painted and the machine was operated at normal walking speed. Then the stop watch
was used and the number of the ground wheel turns in one minute was recorded. Finally
the rpm of the shaft was determined by multiplying the rpm of the ground wheel with the
transmission ratio (diameter ratio) of the two components. The maximum bending moment
was worked out to be 8.1 N-m. As the shaft was to be subjected to fluctuating loads, the
27
equivalent twisting moment (Te) and equivalent bending moment Me were determined to
find the internal and external diameters of the hollow shaft.
The required outer and inner diameters of the hollow shaft were found to be 25 mm and 20
mm respectively. The detailed procedure for the design of the shaft is shown in Appendix
A.
3.6. Laboratory Tests of the Seeder
3.6.1. Seeding Rate Test
This test was done to check whether the machine is accurately dropping seeds in
accordance with the pre determined rate or not. After this test is done if the seeding rate is
above the pre determined rate, it will be corrected by reducing the length of the seed
metering unit exposed to the seeds dropping from seed hopper until the correct rate is
recorded and if the rate is below the pre determined rate it will be corrected by exposing
more length of the seed metering roller until the recommended rate is obtained.
To do this the diameter of the wheel, D, was measured and multiplied by π to determine its
circumference C, i.e.
𝐶 = 𝜋𝐷 ------------------------------------------------------------------------------------------------12
Then the distance L to cover one hectare was determined by dividing the area of one
hectare, 10,000 m2 for the effective width W of the machine in meter i.e.
𝐿 =10,000 𝑚2
𝑊 ------------------------------------------------------------------------------------------13
For this test one hundredth of the hectare length l was taken as sample and the result
obtained was multiplied by hundred for the whole hectare. Therefore to cover distance l the
wheels of the machine should turn n times,
𝑛 =l
πD . ----------------------------------------------------------------------------------------------14
Allowing 10% slippage the distance l can be covered in N turns i.e.

28
N = n − 0.1n . -------------------------------------------------------------------------------------15
After N is known, the wheels that drive the machine metering unit was elevated so it
didn‘t contact the surface and was turned N revolutions. Finally, the total seed dropped
under the seed drill was collected and weighed. And thus the seed rate per hectare was
calculated and compared with the pre determined rate (Yadav et al., 2002).
Figure 3.4: Seeding rate test in the lab.
3.6.2. Seed Damage Test
When the metering device is operating and discharging seeds, there might be some seed
damages. The damage is either visible physical damage or internal damage. The physical
damage can easily be observed, but to know the extent of internal damage germination test
should be conducted. Therefore; germination test was done by using seeds discharged from
each tube of the machine in the laboratory.
To obtain sample for testing, a total of 300 sample grains, and 100 from each seed tube
were taken randomly. The sample seeds were then put in row for ease of counting in the
moist soil contained by three water proof trays. The Seeds were sown at normal seeding
depth of 2-5 cm placing them on top of the soil and pushing in with a piece of dowel and
covered with a little more soil. The tray was watered gently to keep it moist (not wet)
29
since Over-watering results in fungal growth on the seeds, causing possible seed rot,
affecting normal germination. Seedlings were counted after 5 to 10 days when the majority
of seedlings are up. Here it is not necessary to wait until the late ones emerge–these are the
damaged weak ones, and finally the germination rate was determined calculated by using
the following equation(Chang, 1988).
𝐺𝑒𝑟𝑚𝑖𝑛𝑎𝑡𝑖𝑜𝑛 (%) = 𝑵𝒖𝒎𝒃𝒆𝒓 𝒐𝒇 𝒔𝒆𝒆𝒅𝒔 𝒈𝒆𝒓𝒎𝒊𝒏𝒂𝒕𝒆𝒅
𝑵𝒖𝒎𝒃𝒆𝒓 𝒐𝒇 𝒔𝒆𝒆𝒅𝒔 𝒐𝒏 𝒕𝒓𝒂𝒚× 100 -------------------------------------------16
3.7. Field Tests
Field performance tests were carried out to obtain actual data on the overall machine
performance. The machine field performance was evaluated by determining its draft force
requirement, field capacity and field efficiency. The field test was prepared to create an
optimum condition for proper test of the machine. A 2000 m2 (200m*10m) plot of land
was prepared in the compound of Adama Science and Technology University main
campus. The machine was tested on a well prepared seed bed.
3.7.1. Determination of Soil Moisture Content
Soil moisture content, which affects the draft force requirement to operate the machine,
was determined by dry weight basis. The soil samples were taken from the test plot, at a
depth of (2, 3.5, 5cm), the electrical balance was used for measuring the soil samples. The
samples were placed in oven at 1050
C for 24 hours. The dried soil samples were re-weighed
in an electrical balance and the weight was recorded. The soil moisture percent (% dry
weight basis) was calculated using the following formula, RNAM, (1995).
100
d
dw
W
WWMC ------------------------------------------------------------------------------17
where, MC is Moisture content (%), Ww is Weight of wet soil (g), Wd is Weight of dry soil
(g).
3.7.2. Determination of Draft Force
Even though a number of different methods exist to measure the draft force requirement of
the machine, a spring balance method was selected suitable for this work. The machine
was taken to the test field, while operating, the machine was stopped and its handles were
30
cut while the furrow opener was still in the soil at some depth. A spring with known initial
length (free length) was inserted between the cut handles and stacked together with the
handle by sticking material called epoxy resign.
The greater change in length of the spring was recorded when the machine was just starts
to roll when operated. Hence, the maximum change in length of the spring was taken to
determine the draft force requirement of the machine.
The spring was then taken to the valve spring compressor and compressed to the length the
seeder compressed it while it was between the cut handles of the machine and the force
(kgf) that is used to compress the spring was recorded as the draft force requirement of the
machine.
3.7.3. Machine Field Capacity and Field Efficiency tests
Machine field capacity can be evaluated from two different angles, the first one is the
theoretical field capacity of the machine in ha/h. It depends only on the full operating
width of the machine and the average travel speed in the field. It represents the maximum
possible field capacity that can be obtained at the given field speed when the full operating
width of the machine is being used.
Here the important parameter that evaluates the field capacity of the machine is its
effective field capacity not the theoretical one. But the effective field capacity was
determined from the theoretical field capacity of the machine. The effective field capacity
(EFC) is expressed as the rate at which it can do work, taking into account such non
productive operations as turning at the ends of the field, stopping to add seed or fertilizer,
stopping to check performance and the amount of overlap into previously travelled area.
Before determining the effective field capacity of the machine the field efficiency of the
machine was required to be known.
According to Lacayanga et al., (2009), theoretical Field capacity of the seeder, C can be
determined as follows.
WSC ---------------------------------------------------------------------------------------------18
31
Where, C is theoretical field capacity (ha/h), S is forward speed (m/s) and W is width of
the machine (m).
To determine the forward speed S, the length of the field which was already determined 20
m was taken as a distance for a pass, a stop watch was used to know time required to
complete the 20 m. Then the speed of each pass was determined by simple mathematical
relations,
𝑠 =𝑙
𝑡 ---------------------------------------------------------------------------------------------------19
Where, 𝑠 is velocity, 𝑙 is the distance travelled and 𝑡 is the time taken
Five treatments were done and the speed obtained by each treatment was multiplied by the
width of the machine which was measured 60 cm to get its theoretical field capacity.
Finally, the mean value was taken as the theoretical field capacity of the machine.
Von Bargen and Cunner, (1974) defined field efficiency, e as the primary activity time (the
time the machine is operating in the field at an optimum forward speed and performing
over its full width of action) divided by the sum of all field activities, shown as
𝑒 =𝑡𝑝
𝑡𝑝+ 𝑡𝑖𝑛𝑖=1
------------------------------------------------------------------------------------------ 20
Where, e = field efficiency, 𝑡𝑝 theoretical field time and 𝑡𝑖 other activity time
The field efficiency of the machine was determined from the data obtained while planting
the given plot of land. The total time required to complete 200 m2 was taken as both tp and
ti. That means ti was recorded as the time including turning at head lands, to refill the seed
and fertilizer hoppers and other machine check up and preparation time. After the
determination of field efficiency, the effective field capacity was determined as follows:
𝐸𝐹𝐶 = 𝑇𝐹𝐶 × 𝑒 -------------------------------------------------------------------------------------21
Where, 𝐸𝐹𝐶 − Effective field capacity (ha/h)
3.8.Data Collection
Most of the data collected were related with machine performance tests both in the
laboratory and actual field conditions. For seeding rate test in the laboratory, the diameter
and rpm of the ground wheel and the machine width were taken as the data and for the seed

32
damage tests sample seeds from each seed tube were taken randomly. Machine forward
speed, machine width and the time taken in test field were the data collected for
determination of the field capacity and field efficiency of the drill machine. Compression
spring deflection and load on the spring were the data collected for determination of the
draft force requirement of the machine. Statistical method of data analysis was used for all
cases to measure data.
33
4. RESULT AND DISCUSSION
4.1 Physical Properties Wheat Grain
The mean dimensions of about 50 samples at moisture content of 9.71% d.b were: length
6.25 mm, width 3.35 mm and thickness 2.75 mm. All dimensions were increased with an
increase in moisture content from 9.71% to 17% w.b. The increasing trend in axial
dimensions, with gain in moisture content, was due to filling of capillaries and voids upon
absorption of moisture and subsequent swelling.
One thousand kernels weight was 21.35 g. The sphericity of grains was found 0.59 and the
mean volume of a grain was found 31.74 mm3. The geometric mean diameter was 3.91 mm
and the arithmetic diameter found 4.2 mm at 9.71% d.b.
The value of bulk density and true density were 987 kgm-3
and 1240.5 kgm-3
respectively.
Moreover, the porosity of the wheat grains was calculated to be 20.4%. The static
coefficient of friction on sheet metal surface was 0.47 and the emptying repose angle found
to be 34°. at 9.71% d.b.
A linear increase in the one thousand kernel mass as seed moisture content increased has
been noted. TGW increased linearly from 21.35 g to 34 g when the moisture content
increased from 9.71to 17 % d.b.
The sphericity of wheat grains increased from 0.63 to 0.66 with an increase in moisture
content. The geometric mean diameter of wheat grains increased from 3.96 to 4.25 mm and
arithmetic diameter from 4.1 to 4.4 mm. The values of the bulk density for different
moisture levels varied from 987 to 789 kg m-3
. The true density varied from 1240.5 to
1185.5 kgm-3
when the moisture level increased from 9.71% - 17% d.b. The porosity of
wheat grains increased significantly from 0.24 to 0. 33 with the increase in moisture
content from 9.71% to 17%. It was observed that the static coefficient of friction on iron
sheet metal increased with increase in moisture content. This is due to the increased
adhesion between the grains and the material surfaces at higher moisture values.

34
Table 4.1: Summary of the physical properties of wheat as it varies with moisture content
MC(%) L
mm
W
mm
T
mm
ρk
kgm-3
µ R*a
Deg.
9.71 6.25±0.38 3.35±0.35 2.75±0.23 1240.5±0.25 0.47±0.022 34±0.62
12 6.29±0.39 3.45±0.45 2.85±0.25 1202±0.26 0.55±0.023 36±0.65
17 6.45±0.42 3.70±0.33 3.05±0.22 1185.5±0.29 0.58±0.027 41±0.67
R*a – angle of repose
4.2. The Modified Seeder
The seeder is basically manually operated by only one person. The wheel is the driving
mechanism that allows the metering device to turn as the shaft turns. As the seeder is
pushed forward, the seed in the hopper drops on to the flap below the seed metering device
and fills the gap between the seed metering device and the flap. The seed metering device
then guides the seed from the underneath flap into the seed tube fixed below it. This allows
the seeds to be delivered to destination furrow. Turning on headland is simply
accomplished supporting the weight of the machine on the stand provided. This action does
not discharge seeds because the wheel is suspended and there will be no drive transmitted
to the seed metering device.

35
(a) (b)
Fig 4.1: Sketch of the modified machine: (a) front view, (b) side view
1. Ground wheel 6. Handle
2. Seed hopper 7. Furrow opener
3. Fertilizer hopper 8. Seed tube
4. Drive shaft 9. Furrow covering device
5. Main frame 10. Fertilizer tube
Fig 4.2: Isometric view of the seeder

36
4.3. Evaluation of Seeding Rate
The machine was required to seed wheat at a rate of 120 kg/ha. This pre determined rate is
achieved by the proper design of seed delivering components of the drill machine specially
seed metering units. Therefore, to check whether the intended outcome was achieved or
not seeding rate test was performed in the laboratory (p value < 0.0001). Hence, after
turning the suspended wheels 120 times seeds dropped under each seed tube were collected
and weighed.
Table 4.2: Mass of grain discharged from each seed tube
Seed tube Weight (kg)
Seed tube 1 0.41±0.0065
Seed tube 2 0.42±0.006
Seed tube 3 0.41±0.0055
Since the seeding rate test was done for 1/100th
a hectare, multiplying the total mass of
seeds collected by 100 gives the amount of wheat seed required in kg for 1 hectare of land.
Therefore, 124 kg/ha was the result obtained from the data which is within the
recommended range of seeding rate for wheat. The variation seen among the output from
the three seed tubes tabulated above was negligible to consider.
Table 4.3: Varying seeding rate
Length (mm) Rate (kg/ha)
10 82.5±0.27
11 90.95±0.28
12 99.2±0.26
13 107.5±0.26
14 115.75±0.25
14.5 120±0.27
37
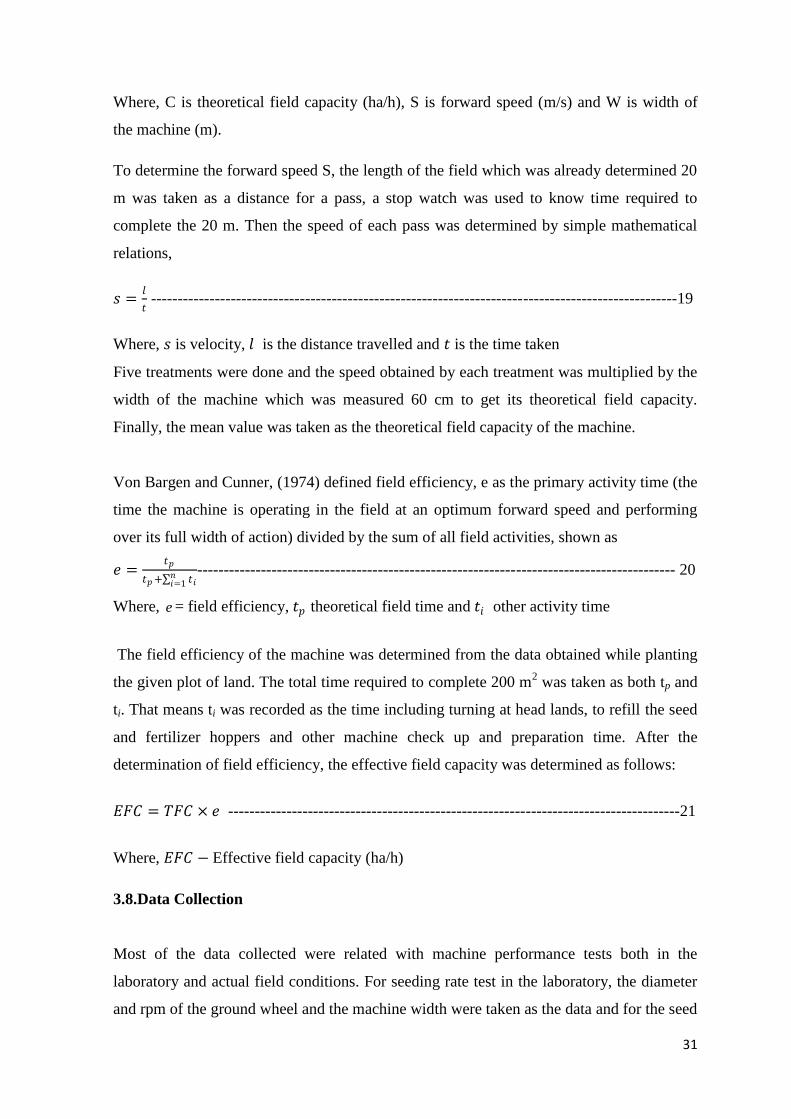
Figure 4.3: Rate vs length of seed metering device
4.4. Evaluation of Fertilizer Application Rate
The machine was designed to apply fertilizer at a rate of 100 kg/ha. This pre determined
rate is achieved by the proper design of seed delivering components of the drill machine
specially fertilizer metering units. Therefore, to check whether the intended outcome was
achieved or not test of fertilizer application rate was performed and the result of the test
was compared with the pre targeted one. The procedure used to test the application rate of
fertilizer was the same with that of used for testing the wheat seeding rate.
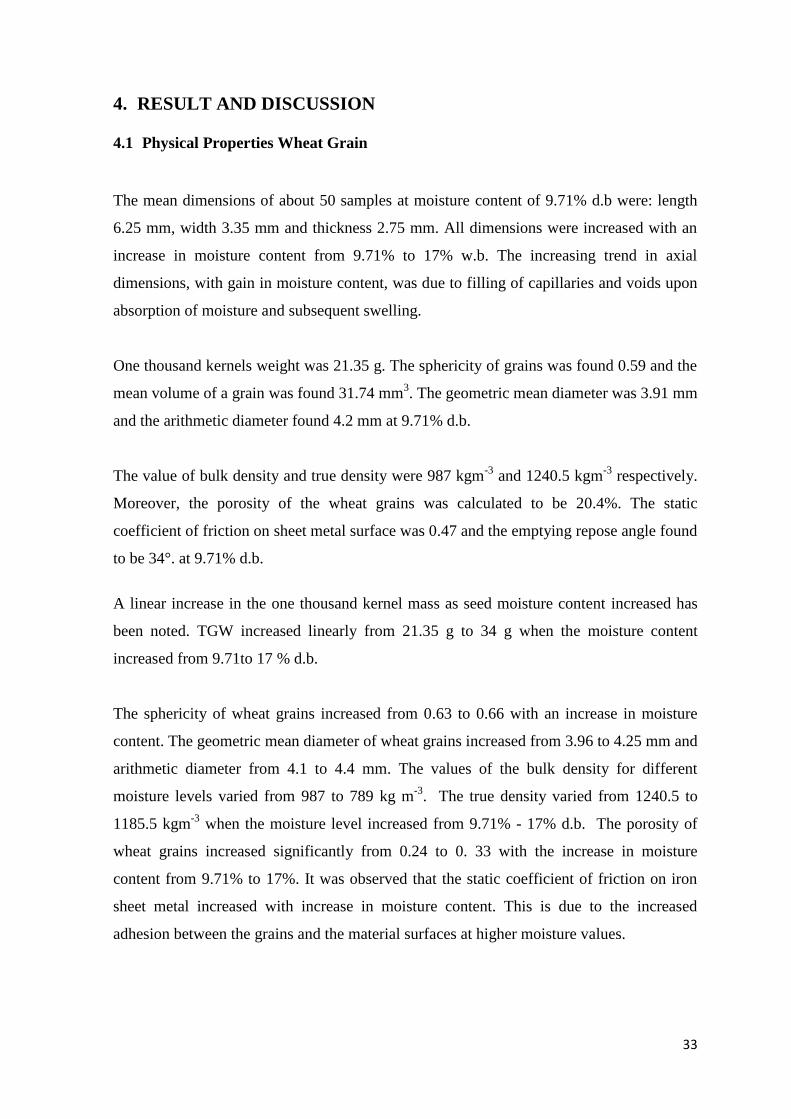
Therefore, after turning the suspended wheels 120 times, as determined before and
fertilizer grains dropped under each fertilizer tube were collected and weighed.
Table 4.4: Mass of fertilizer discharged from each tube
Fertilizer tube Weight (kg)
Tube 1 0.35±0.024
Tube 2 0.37±0.023
Tube 3 0.31±0.025
0
20
40
60
80
100
120
140
0 2 4 6 8 10 12 14 16
Rat
e (
kg?
ha)
Seed metering device length (mm)

38
Multiplying the total weight of fertilizer collected by 100 gives the amount of fertilizer
required in kg for 1 hectare of land. Therefore, 103 kg/ha was the result obtained from the
data. Like for wheat, fertilizer application rate can be adjusted to any desired rate by
adjusting the length of the fertilizer metering device exposed to the opening of the fertilizer
hopper.
Table 4.5: Varying fertilizer application.
Length (mm) Rate (kg/ha)
8 66±0.66
9 74.5±0.63
10 82.5±0.65
11 91±0.64
12 99±0.62
12.5 103±0.67
13 107.5±0.65
Figure 4.4: Rate vs length of fertilizer metering device
0
20
40
60
80
100
120
140
0 2 4 6 8 10 12 14 16
Rat
e (
kg?
ha)
Length of fertilizer metering device (mm)
39
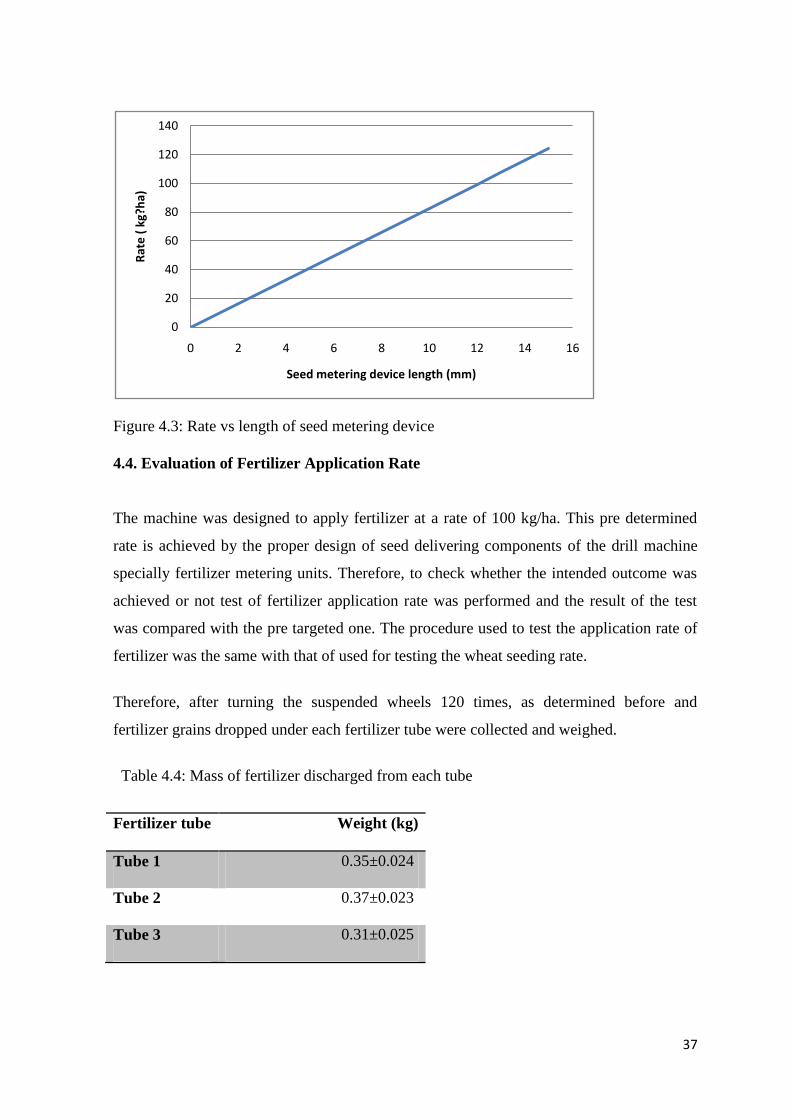
4.5.Germination test assessments
Seed germination test result, which is an indication tool for the extent of the seed internal
damage caused by seed metering units, is one of the factors which determine the efficiency
of the machine .Germination rate was taken as the average number of seeds that germinate
over 10 days.
Figure 4.5: Germinated seeds on trays in the lab.
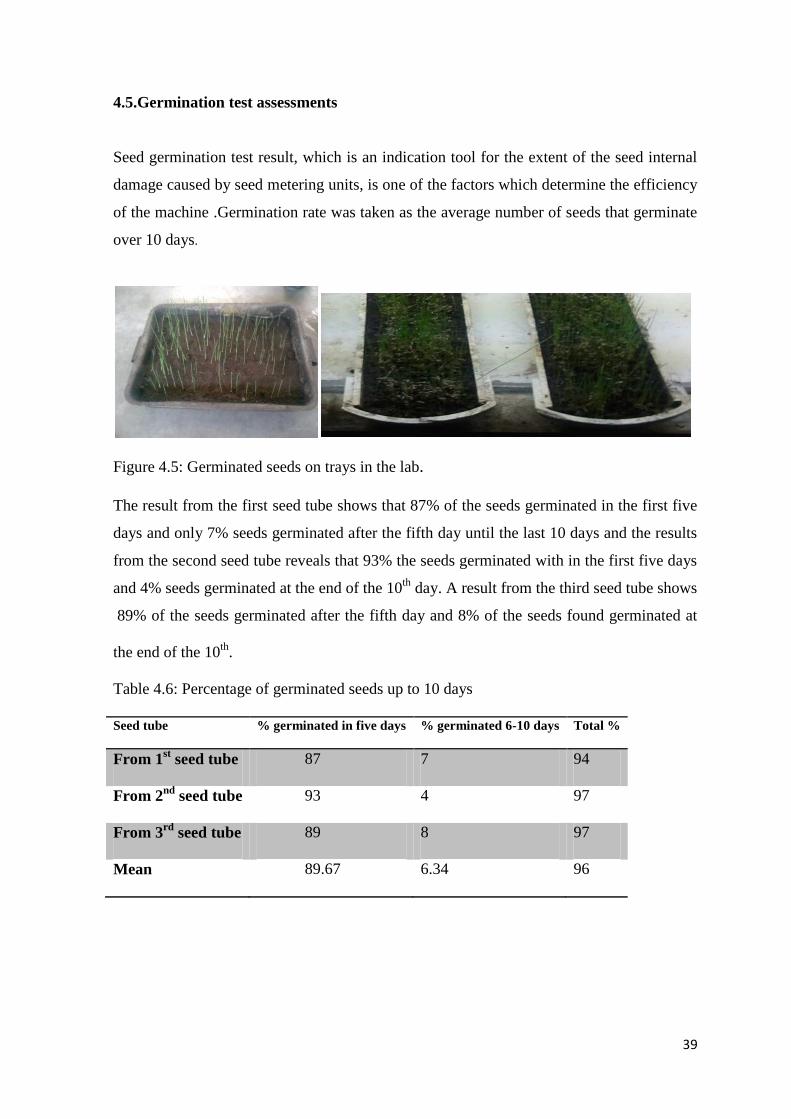
The result from the first seed tube shows that 87% of the seeds germinated in the first five
days and only 7% seeds germinated after the fifth day until the last 10 days and the results
from the second seed tube reveals that 93% the seeds germinated with in the first five days
and 4% seeds germinated at the end of the 10th
day. A result from the third seed tube shows
89% of the seeds germinated after the fifth day and 8% of the seeds found germinated at
the end of the 10th
.
Table 4.6: Percentage of germinated seeds up to 10 days
Seed tube % germinated in five days % germinated 6-10 days Total %
From 1st seed tube 87 7 94
From 2nd
seed tube 93 4 97
From 3rd
seed tube 89 8 97
Mean 89.67 6.34 96

40
Figure 4.4: Percentage of seed germinated depending on the number of days after seeding
Hence, as it can be observed from the result 96% of the seeds were emerged (average) and
be fairly enough as Peter and Holding (2005) found more than 80% should emerge.
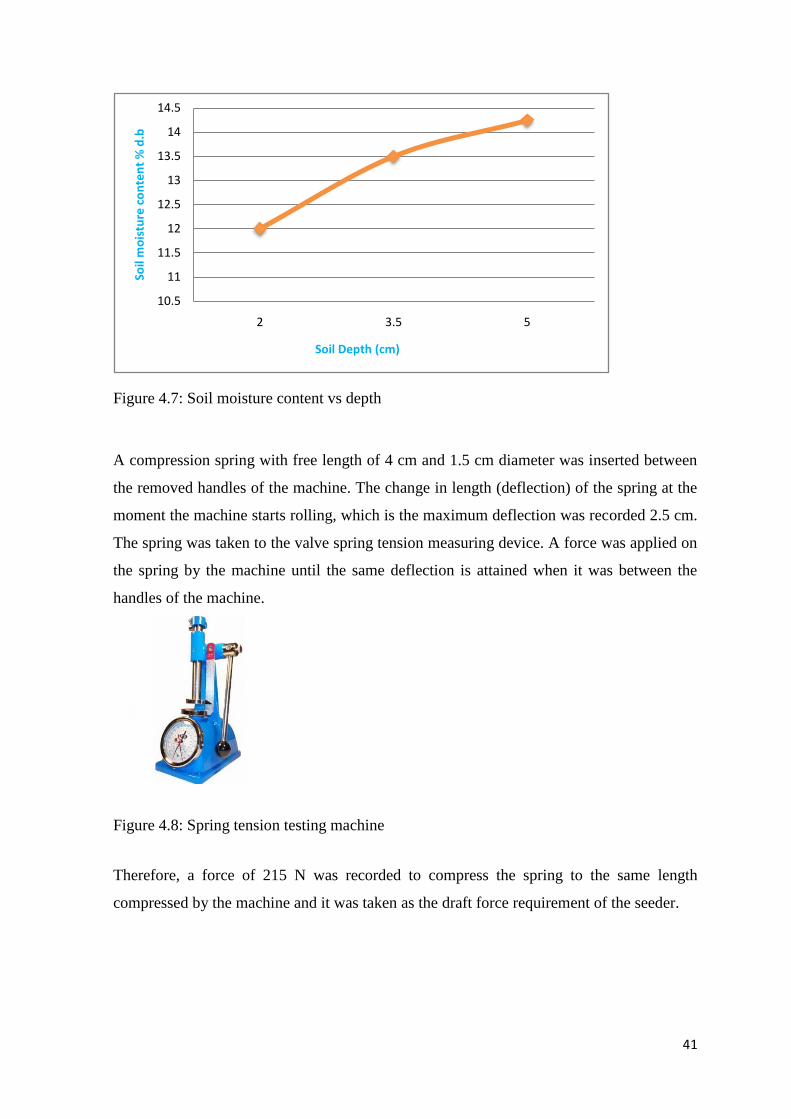
4.6. Soil Moisture Content and Draft Force Requirement.
The result from the measurement of soil moisture content at (2, 3.5, 5cm) is shown below.
The values show that as the depth of the soil increases its moisture content increases
because of less exposure to sun light and air movement when compared with the upper
depths. The increase in moisture content further results in increase of bulk density of soil
which also results in high penetration resistance (great draft force requirement).
Table 4.7: Values of soil moisture content at different depths
Depth % of moisture
Moisture content at 2 cm depth 12±0.22
Moisture content at 3.5 cm depth 13.5±0.23
Moisture content at 5 cm depth 14.25±0.25
-20
0
20
40
60
80
100
0 1 2 3 4 5 6 7
%ge
rmin
ate
d
number of days
41
Figure 4.7: Soil moisture content vs depth
A compression spring with free length of 4 cm and 1.5 cm diameter was inserted between
the removed handles of the machine. The change in length (deflection) of the spring at the
moment the machine starts rolling, which is the maximum deflection was recorded 2.5 cm.
The spring was taken to the valve spring tension measuring device. A force was applied on
the spring by the machine until the same deflection is attained when it was between the
handles of the machine.
Figure 4.8: Spring tension testing machine
Therefore, a force of 215 N was recorded to compress the spring to the same length
compressed by the machine and it was taken as the draft force requirement of the seeder.
10.5
11
11.5
12
12.5
13
13.5
14
14.5
2 3.5 5
Soil
mo
istu
re c
on
ten
t %
d.b
Soil Depth (cm)
42
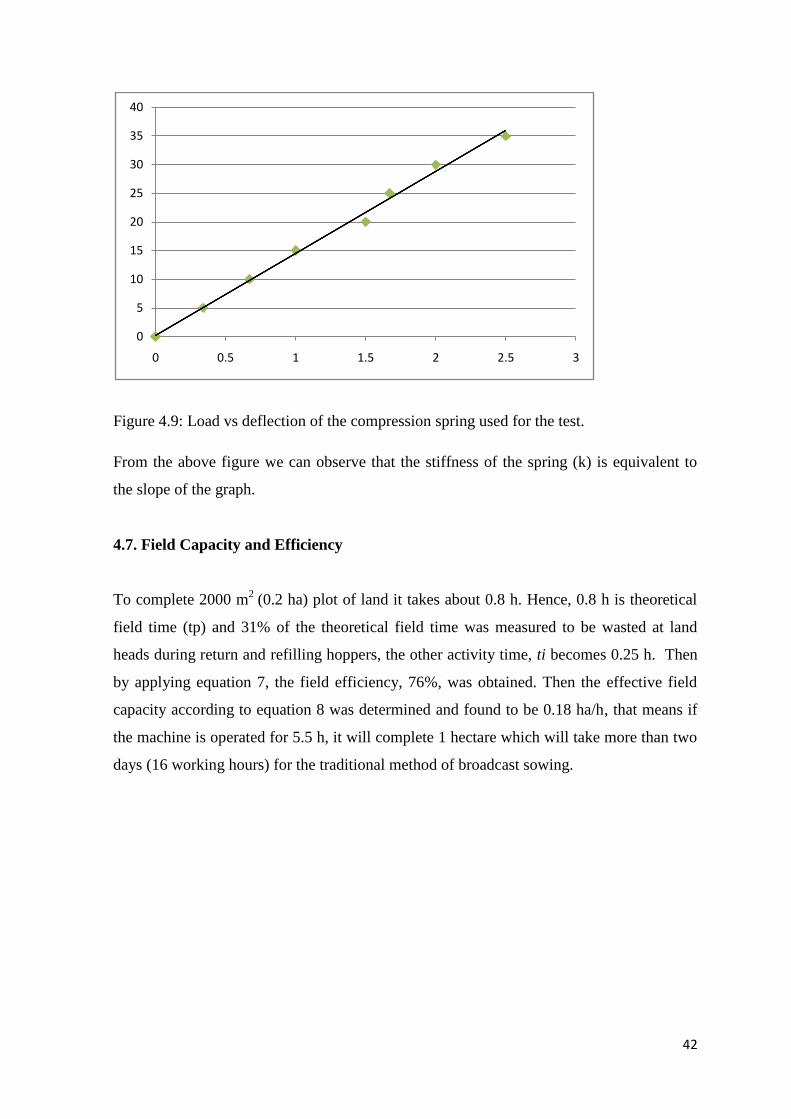
Figure 4.9: Load vs deflection of the compression spring used for the test.
From the above figure we can observe that the stiffness of the spring (k) is equivalent to
the slope of the graph.
4.7. Field Capacity and Efficiency
To complete 2000 m2
(0.2 ha) plot of land it takes about 0.8 h. Hence, 0.8 h is theoretical
field time (tp) and 31% of the theoretical field time was measured to be wasted at land
heads during return and refilling hoppers, the other activity time, ti becomes 0.25 h. Then
by applying equation 7, the field efficiency, 76%, was obtained. Then the effective field
capacity according to equation 8 was determined and found to be 0.18 ha/h, that means if
the machine is operated for 5.5 h, it will complete 1 hectare which will take more than two
days (16 working hours) for the traditional method of broadcast sowing.
0
5
10
15
20
25
30
35
40
0 0.5 1 1.5 2 2.5 3

43
5. Conclusion and Recommendation
5.1. Conclusion
This study was under taken to modify and develop a machine which would drill wheat
seeds in row and fits the local farming needs. As a result of this study a manually operated
wheat row seeder machine with fertilizer applicator was developed with three row planting
unit. The spacing between rows was 20 cm. The power to seed metering devices was
provided from ground wheels through hollow shaft.
After completing the assembly of the machine, its laboratory and field tests were carried
out. The laboratory test includes seeding rate and seed damage tests. The seeding rate test
was performed in an intention to check whether the machine is seeding to the pre
determined rate (120 kg/ha) or not and the test result showed that the seeding rate was 124
kg/ha, which is within the recommended range of seeding rate for wheat (100-125 kg/ha).
The result obtained from the test of fertilizer application rate was 103 kg/ha, which can of
course be adjusted to any desired rate by changing the length of fertilizer metering device
exposed to the base of the fertilizer hopper.
The seed damage test was carried out to know the amount of internal and external damages
caused by seed metering units while discharging (metering) seeds to the underneath furrow
via seed tubes. The external damage was simple to observe it on the seeds discharged out
of the seed tubes, but germination test was carried out to evaluate the extent of internal
damages of the seeds. Accordingly, 100 seed samples were taken from the discharges of
each seed tubes randomly and put on wet soil tray for ten days. The result showed that
above 95% of the seeds germinated from each seed tube.
The machine was also tested in the actual field prepared in the University‘s test field for its
capacities and efficiency. The theoretical and effective field capacities were determined
and found to be 0.244 ha/hr and 0.18 ha/hr respectively. The field efficiency of the
machine was 76%.

44
The draft force requirement of the machine was determined by the spring balance method
and found to be 215 N, a push, which an average person can satisfactorily operate the
machine with less drudgery to push.

45
5.2. Recommendation
The developed wheat row seeder machine with fertilizer applicator is believed to improve
the yield of small holder farmers with better efficiency and additional seed saving
capability. Therefore, after appropriate trial, its dissemination to the smallholder farmers is
recommendable.
46
REFERENCES
Abernathy, G.H and J.G Porterfield, 1969. Effect of planter openers shape on furrow
characteristics. Transaction of ASAE, 12(1), 16-19.
Ahmad, N. 2000. Integrated plant nutrition management in Pakistan: status and
opportunities. In: Proc. Symp. Integrated plant nutrition management, NFDC,
Islamabad. PP.18-39.
Alam, S.M, Z. Iqbal and A. Latif, 2000. Effect of P and Zn application by fertigation on P
use efficiency and yield of wheat. Tropical Agric. Res. Ext. 3(2): PP 115-119.
Aldas, R.E and H. Sakurai, 2001. Study on two row rice seeder with plunger type
mechanism for hill seeding rice. The Philippine Society of Agricultural Engineers, pp
13-18.
Allen, D. 1979. Agricultural Mechanization in Yemen. Informal situation report: 5,7
Ascher, J.S., R.D. Graham, D.E. Elliott, J.M. Scott, & R.S. Jessop ,1994. Agronomic value
of seed with high nutrient content.. Mexico, DF, CIMMYT.
Association of American Plant Food Control Officials (AAPFCO) and the Fertilizer
Institute (TFI), 1997: Commercial Fertilizers 1996.
Awadhwal, N. K., Sheety, S. V. R.,Oumar Niangado, and M. B., Traore, 1992.
Development and testing a donkey drawn cultivator cum seeder. Agricultural
Mechanization in Asia, Africa and Latin America. Vol. 23 No 2: 25-27
Bateman H P., 1963. Effect of field compaction on soil physical properties and crop
response. Agricultural development paper No. 91.
Bekele Geleta and D.G. Tanner. 1995. Status of cereal production and pathology research
in Ethiopia. In: D.L. Danial (ed.). Breeding for Disease Resistance with Emphasis on
Durability, pp. 42-50. Wageningen, The Netherlands: Wageningen Agricultural
University.
Belay,G. and M. Brink, 2006.Plant resource of Tropical Africa1. Cereals and pulses.
PROTA Foundation, Wageningen, The Netherlands/ Backhuys publishers, Leiden,
Netherlands/ CTA, PP: 180-185.
Belay Simane, D.G. Tanner, Amsal Tarekegene and Asefa Taa. 1999. Agro-ecological
decision support systems for wheat improvement in Ethiopia: Climatic characteristics
and clustering of wheat growing regions. African Crop Science Journal 7:9-19.
Chang, C.S., 1988. Porosity and density of grain kernels. Cereal chemistry, 65:13

47
Damora D. and K P. Pandey, 1995. Evaluation of performance of furrow openers of
combined seed and fertilizer drills. Soil and Tillage Research. 34(1), 127-139.
Des Moines, 1989. Best Management Practices for Profitable Nitrogen Programs. Journal
of Tropical Agriculture, 67-69
Dibbits H. J. 1991. Use of human and animal power on small farms in Africa. Department
of Agricultural Engineering University of Nairoby, Kenya.
Dransfield P., S .T. Willatt, and A.H. Willis, 1964. Soil to implement reaction experienced
with simple tines at various angles of attack. Journal of Agricultural Engineering
Research. (38), 85-86
Eakes, D.J., W.J. Foster, C.H. Gilliam and J.W. Olive, 1990. Effects of method of
application and rate of three slow release fertilizers. Proc. Southern Nurserymen.s
Assoc. Annu. Res. Conf., 35th Annu. Rpt., P. 47-48.
Galanopoulou, S., M. Facinelli,. & F. Lorenzetti, 1996. General agronomic aspects of seed
production. 24 Apr.-9 May 1993, Amman. Aleppo, Syria, ICARDA.
Gebresenbet, Gezehagn. and H. Johnson, 1992. Performance of seed drill coulters in
relation to speed, depth and rake angles. Journal of Agricultural Engineering
Research.( 47), 36-37.
Hailu Gebre-Mariam. 1991. Wheat production and research in Ethiopia. In: Hailu Gebre-
Mariam, D.G. Tanner, and M. Hulluka (eds.). Wheat Research in Ethiopia: A
Historical Perspective. Addis Ababa: IAR/CIMMYT.
Hairston E., 2001. Fertilizer Application Techniques to Reduce Nutrient Pollution
Potential. Journal of Tropical Agriculture, 68-69
Heege,H. and J.F. Billot, 1999. Seeders and planters In: Stout B.(ed.) Plant Production
Engineering, CIGR, Handbook of Agricultural Engineering Volume III, ASAE, pp
145-148
Herbek, J. and L. Murdock, 2003. A Comprehensive Guide to Wheat Management.
International maize and wheat improvement centre, vol. 3, 2006.
Hopfen, H. J., 1969. Farm implements for arid and tropical regions. Agricultural
development paper No. 91, FAO, Rome: 2-10.
Humenik, F. J., DeAnne D. Johnson, M. Greglow, A. Dressing, P. Maas, A. Koehler, W.
Meek, and N. Swader 1982. Best Management Practices For Agricultural Nonpoint
Source Control: II Commercial Fertilizer. North Carolina Cooperative Extension
Service. Biological and Agricultural Engineering Department. North Carolina State
University. Raleigh, NC
Jayan, P.R. and J.F. Kumar, 2004. Planter design in relation to the physical properties of
seeds. Journal of Tropical Agriculture 42:69-71

48
Johnson, WH. and WF. Buchele ,1961. Influence of soil granule size and compaction on
rate of soil drying and emergence of corn. Agricultura Tropica et sub tropical vol. 40
(3) 2007
Karayel, D. & A. Ozmerzi,. 2007. Comparison of vertical and lateral seed distribution of
furrow openers using a new criterion. Soil and Tillage Research, 95, 69–75.
Karimi, M., Kheiralipour, K., Tabatabaeefar, A., Khoubakht, G.M., Naderi, M. and
Heidarbeigi, K., 2009. The Effect of Moisture Content on Physical Properties of
Wheat. Pakistan Journal of Nutrition 8 (1): 90-95.
Kepner, R.A., R. Bainer, E.L. Barger , 1982: Principles of Farm Machinery. III ed., AVI
publishing, INC. West port, Connecticut, USA.
Kheiralipour, K., M. Karimi, A. Tabatabaeefar, M. Naderi, G. Khoubakht and K.
Heidarbeigi, 2008. Moisture-Dependent Physical Properties of Wheat (Triticum
aestivum L.). Journal of Agricultural Technology 4(1): 53-64.
Lacayanga, JE., WG. Valdez,., Ines, and RP. Calderon, 2009. Improved manual rice hill
seeder for wet land paddy, Lumina an interdisciplinary and scholarly journal, 20 (1)
3-4.
Mathur, S M. and K P. Pandey, 1992. Influence of system parameters on performance of
reversible hoe type furrow opener for animal drawn seed and fertilizer drills. In:
Proceedings of International Agricultural Engineering Conference, Vol. I
Mohsenin, N. N. 1986. Physical properties of plant and animal materials. Gordon and
Breach Science Publications, 2nd
edition, New York.
Muhammad Y., 2004. Development and performance evaluation of wheat planting system
for conservation agriculture rice-wheat tract of the Punjab University of agriculture
Faisalabad, Pakistan, pp 65-76.
Murray, JR., J N. Tullberg and B B. Basnet, 2006. Planters and their Components. School
of Agronomy and Horticulture, University of Queensland, Australia
Nelson, W.L., 1986. Cultural practices for cereal seed production. In J.P. Srivastava
Nimkar P.M. and P.K. Chattopadhyay, 2001. Some physical properties of green gram.
Journal of Agricultural Engineering Research, 80(2), 183–189.
Panwar J.S. and N.P. Sirohi, 1980. Critical parameters of plant emergence and root
growth. Journal of Agricultural Engineering.10 (7) 13-14
Paul V. Hartley, (1999). Fertilizer distribution machinery design and operation. IITA
Research Guide 25
Peter, M. and D. Holding, 2005. Germination testing and seed rate calculation. NSW
Department of primary industries, Wagga Wagga
RNAM, 1995. Test codes and procedure for farm machinery. Technical series, No:12.

49
Rashid, A., 1994. Phosphorus use efficiency in soils of Pakistan. In: Proc. 4th Natl. Cong.
Soil Sci., Islamabad, Pakistan. PP.115-127.
Razavi, S. and E. Milani. 2006. Some physical properties of the watermelon seeds.
Africian Journal of Agricultural Research, 13, 65-69.
Sahay, K.M. and K.K. Singh, 1994. Unit Operations of Agricultural Processing. 1st ed.
Vikas Publishing House Pvt. Ltd., New Delhi, India
Siemens J C., J A. Weber and T H. Thornburn ,1965. Mechanics of soil as influenced by
tillage tools. Transaction of ASAE, 8(1), 1-7
Smith, H.P. 1965. Ground driven power tillage. ASAE paper No: 79-1024
Srivastava A P. and J S. Panwar ,1986. Studies on design parameters of furrow openers for
puddled soil. Journal of Agricultural Engineering. 7 (4), 4-5
Stibbe E., R . Terpstran and, M. Kowehoven ,1980. Characteristics of spring tillage on
seedbed characteristics, plant establishment and yield of silage corn on a light sandy
soil. Soil and Tillage Research. 12 (3), 7-8.
Tabatabaeefar, A., 2003. Moisture-dependent physical properties of wheat. International
Agrophysics, 17, PP 207-211
Tanner, D.G., Zewdu Yilma, Lemma Zewdie, and Girmay Gebru. 1994. Potential for
cerealbased double cropping in Bale Region of southeastern Ethiopia. African Crop
Science Journal 2:135-143.
Kheiralipour K., M.G Varnamkhasti,., H. Mobli, A. Jafari, A. R. Keyhani, M. H.
Soltanabadi, S. Rafiee, and,2008. Some physical properties of rough rice (Oryza
Sativa L.) grain. Journal of Cereal Science, 47, PP 496-501.
Von Bargen, K. and M. B. Cunney ,1974. Activity ratio for farm machinery operations
analysis. Transactions of the ASAE 17(2),PP 225-227
Yadav, A., R.K. Malik, N.K. Bansal,. R.K. Gupta, S. Singh, and P.R. Hobbs, (2002).
Manual for using zero-till seed-cum-fertilizer drill, and zero-till drill-cum-bed
planter, Rice-Wheat Consortium Technical Bulletin Series 4, New Delhi-110 012,
India: Rice-Wheat Consortium for the Indo-Gangetic Plains. pp 24
Yeager, T.H., D.L. Ingram, and C.A. Larsen, (1989). Nitrate nitrogen and potassium
release from surface-applied and growth medium incorporated Osmocote and Escote.
PP. 47-48.
Zarate, P., 2004.Tools and equipments for land development, and tillage and seed bed
preparation. Government of India, Department of Agriculture and cooperative
Ministry of Agriculture. PP 69-71.

50
Zewdu A.D.and W.K. Solomon, 2007. Moisture-Dependent Physical Properties of Tef
Seed. Biosystems Engineering, 96 (1), 57–63

51
APPENDIX A
Calculations for the design of power transmitting shaft
The shaft carrying three hoppers with wheat and fertilizer inside is like a simply supported
beam as shown below. The shaft is supported at A and B in roller bearings. It is a hollow
shaft made of mild steel required to transmit 156 W of power at 20 rpm. It carries three
hoppers each weighing 45 N with full of wheat and fertilizer. According to ASME code the
allowable shear stress and bending stress for none keyed commercial shaft are 45 Mpa and
100 Mpa. The diameter (internal and external) of the shaft can be determined as follows:
𝑃 = 156 𝑊
𝑁 = 20 𝑟𝑝𝑚
𝑇 =𝑃×60
2𝜋𝑁=
156×60
2×3.14×20= 74.5𝑁𝑚 = 74500𝑁𝑚𝑚
Where, P is the power transmitted
N is revolutions per minute of the ground wheel
T is the torque transmitted
The reaction at each support will be 67.5 N i.e.
𝑅𝐴 = 𝐴𝐵 = 67.5 𝑁

52
It can be observed that the maximum bending moment lies at point E and it is zero
at the reaction points.
𝐵𝑀𝐸 = 67.5 𝑁 × 0.27𝑚 = 18.22𝑁𝑚 = 18220𝑁𝑚𝑚
𝐵𝑀𝐶 = 0.07 × 45 = 4.725𝑁𝑚
𝐵𝑀𝐷 = 0.07 × 45 𝑁 = 4.725𝑁𝑚
𝐵𝑀𝐴 = 𝐵𝑀𝐵 = 0
Where, BM is bending moment.
Now let‘s determine the equivalent twisting moment and equivalent bending
moments to determine the internal and external diameters of the shaft:
𝑇𝑒 = 𝑀2 + 𝑇2 =𝜋
16× 𝜏(𝑑𝑜)3(1 − 𝐾4)
Where, Te is equivalent twisting moment
M is bending moment
T is torque transmitted
𝜏 is allowable shear stress =42 𝑁
𝑚𝑚 2 for the material selected
do is outer diameter
K is 𝑑𝑖
𝑑𝑜= 0.75
Therefore, 𝑇𝑒 = 18.222 + 74.52 = 76.7𝑁𝑚
Hence, 76700𝑁𝑚𝑚 =3.14
16×
42 𝑁
𝑚𝑚 2(𝑑𝑜)3(1 − 0.754)
𝑑𝑜 = 23.88𝑚𝑚 ≅ 24𝑚𝑚 and 𝑑𝑖 = 0.75 × 24𝑚𝑚 = 18𝑚𝑚
The equivalent bending moment (Me) is determined as:
𝑀𝑒 =1
2(𝑀 + 𝑀2 + 𝑇2 =
𝜋
32𝛿𝑏(𝑑𝑜)3(1 − 𝐾4)

53
Where, 𝑀𝑒 is equivalent bending moment.
𝛿𝑏 is allowable bending stress =100 𝑁
𝑚𝑚 2 for the selected material.
Hence, 𝑀𝑒 =1
2(18.2𝑁𝑚 + 18.222 + 74.52 = 47.44𝑁𝑚
Again, 47440𝑁𝑚𝑚 =𝜋
32𝛿𝑏(𝑑𝑜)3(1 − 𝐾4)
=3.14
32×
100 𝑁
𝑚𝑚2 (𝑑𝑜)3(1 − 0.754)
𝑑𝑜 = 20 𝑚𝑚 𝑎𝑛𝑑 𝑑𝑖 = 0.75 × 20 = 15 𝑚𝑚
Now we have two values for both 𝑑𝑜 and 𝑑𝑖 and the larger values for 𝑑𝑜 = 24 mm
and 𝑑𝑖 =18mm, but available stock size in the market, 25 mm for 𝑑𝑜 and 20 mm
for 𝑑𝑖 were taken for the machine.

54