Stage II of Chronic Kidney Disease—A Tipping Point in ... - MDPI
16
Citation: Grgurevic, L.; Novak, R.; Salai, G.; Hrkac, S.; Mocibob, M.; Vojtusek, I.K.; Laganovic, M. Stage II of Chronic Kidney Disease—A Tipping Point in Disease Progression? Biomedicines 2022, 10, 1522. https://doi.org/10.3390/ biomedicines10071522 Academic Editor: Yuji Oe Received: 1 June 2022 Accepted: 25 June 2022 Published: 27 June 2022 Publisher’s Note: MDPI stays neutral with regard to jurisdictional claims in published maps and institutional affil- iations. Copyright: © 2022 by the authors. Licensee MDPI, Basel, Switzerland. This article is an open access article distributed under the terms and conditions of the Creative Commons Attribution (CC BY) license (https:// creativecommons.org/licenses/by/ 4.0/). biomedicines Article Stage II of Chronic Kidney Disease—A Tipping Point in Disease Progression? Lovorka Grgurevic 1,2, * , Rudjer Novak 2 , Grgur Salai 2,3 , Stela Hrkac 2,4 , Marko Mocibob 5 , Ivana Kovacevic Vojtusek 6 and Mario Laganovic 7 1 Department of Anatomy, School of Medicine, University of Zagreb, 10000 Zagreb, Croatia 2 Center for Translational and Clinical Research, Department of Proteomics, School of Medicine, University of Zagreb, 10000 Zagreb, Croatia; [email protected] (R.N.); [email protected] (G.S.); [email protected] (S.H.) 3 Department of Pulmonology, University Hospital Dubrava, 10000 Zagreb, Croatia 4 Department of Emergency Medicine, University Hospital Centre Zagreb, 10000 Zagreb, Croatia 5 Department of Chemistry, Faculty of Science, University of Zagreb, 10000 Zagreb, Croatia; [email protected] 6 Department of Nephrology, Arterial Hypertension, Dialysis and Transplantation, University Hospital Center Zagreb, 10000 Zagreb, Croatia; [email protected] 7 Department of Nephrology, University Hospital Merkur, 10000 Zagreb, Croatia; [email protected] * Correspondence: [email protected]; Tel.: +385-915-895-240 Abstract: Chronic kidney disease (CKD) is the progressive loss of renal function. Although advances have been made in understanding the progression of CKD, key molecular events in complex patho- physiological mechanisms that mark each stage of renal failure remain largely unknown. Changes in plasma protein profiles in different disease stages are important for identification of early diagnostic markers and potential therapeutic targets. The goal of this study was to determine the molecular profile of each CKD stage (from 1 to 5), aiming to specifically point out markedly expressed or downregulated proteins. We performed a cross-sectional shotgun-proteomic study of pooled plasma across CKD stages and compared them to healthy controls. After sample pooling and heparin-column purification we analysed proteomes from healthy to CKD stage 1 through 5 participants’ plasma by liquid-chromatography/mass-spectrometry. We identified 453 proteins across all study groups. Our results indicate that key events, which may later affect the course of disease progression and the overall pathophysiological background, are most pronounced in CKD stage 2, with an emphasis on inflammation, lipoprotein metabolism, angiogenesis and tissue regeneration. We hypothesize that CKD stage 2 is the tipping point in disease progression and a suitable point in disease course for the development of therapeutic solutions. Keywords: angiogenesis; chronic kidney disease; inflammation; proteomics; tissue regeneration 1. Introduction Chronic kidney disease (CKD) is the progressive loss of renal function that can develop rapidly over a period of months or advance more slowly over many years. It is recognized as a worldwide public health problem, with a global estimated prevalence of 13.4% and high associated healthcare costs [1,2]. The disease is caused by a diverse range of conditions (immunological, toxic, metabolic, etc.) that affect the functional kidney compartments, including vasculature, glomeruli and tubulointerstitium [3]. CKD is divided into five stages that are characterized by progressive deterioration of glomerular filtration rate. In the early stages, the symptoms are not specific, which can prevent correct diagnosis, and the disease is therefore often confirmed only in its more advanced stages, usually based on the glomerular filtration rate estimation (eGFR), determination of albuminuria and, at times, kidney biopsy [4]. The observed loss of function is progressive and irreversible due Biomedicines 2022, 10, 1522. https://doi.org/10.3390/biomedicines10071522 https://www.mdpi.com/journal/biomedicines
-
Upload
khangminh22 -
Category
Documents
-
view
0 -
download
0
Transcript of Stage II of Chronic Kidney Disease—A Tipping Point in ... - MDPI

Citation: Grgurevic, L.; Novak, R.;
Salai, G.; Hrkac, S.; Mocibob, M.;
Vojtusek, I.K.; Laganovic, M. Stage II
of Chronic Kidney Disease—A
Tipping Point in Disease
Progression? Biomedicines 2022, 10,
1522. https://doi.org/10.3390/
biomedicines10071522
Academic Editor: Yuji Oe
Received: 1 June 2022
Accepted: 25 June 2022
Published: 27 June 2022
Publisher’s Note: MDPI stays neutral
with regard to jurisdictional claims in
published maps and institutional affil-
iations.
Copyright: © 2022 by the authors.
Licensee MDPI, Basel, Switzerland.
This article is an open access article
distributed under the terms and
conditions of the Creative Commons
Attribution (CC BY) license (https://
creativecommons.org/licenses/by/
4.0/).
biomedicines
Article
Stage II of Chronic Kidney Disease—A Tipping Point inDisease Progression?Lovorka Grgurevic 1,2,* , Rudjer Novak 2 , Grgur Salai 2,3 , Stela Hrkac 2,4, Marko Mocibob 5 ,Ivana Kovacevic Vojtusek 6 and Mario Laganovic 7
1 Department of Anatomy, School of Medicine, University of Zagreb, 10000 Zagreb, Croatia2 Center for Translational and Clinical Research, Department of Proteomics, School of Medicine,
University of Zagreb, 10000 Zagreb, Croatia; [email protected] (R.N.); [email protected] (G.S.);[email protected] (S.H.)
3 Department of Pulmonology, University Hospital Dubrava, 10000 Zagreb, Croatia4 Department of Emergency Medicine, University Hospital Centre Zagreb, 10000 Zagreb, Croatia5 Department of Chemistry, Faculty of Science, University of Zagreb, 10000 Zagreb, Croatia;
[email protected] Department of Nephrology, Arterial Hypertension, Dialysis and Transplantation,
University Hospital Center Zagreb, 10000 Zagreb, Croatia; [email protected] Department of Nephrology, University Hospital Merkur, 10000 Zagreb, Croatia; [email protected]* Correspondence: [email protected]; Tel.: +385-915-895-240
Abstract: Chronic kidney disease (CKD) is the progressive loss of renal function. Although advanceshave been made in understanding the progression of CKD, key molecular events in complex patho-physiological mechanisms that mark each stage of renal failure remain largely unknown. Changes inplasma protein profiles in different disease stages are important for identification of early diagnosticmarkers and potential therapeutic targets. The goal of this study was to determine the molecularprofile of each CKD stage (from 1 to 5), aiming to specifically point out markedly expressed ordownregulated proteins. We performed a cross-sectional shotgun-proteomic study of pooled plasmaacross CKD stages and compared them to healthy controls. After sample pooling and heparin-columnpurification we analysed proteomes from healthy to CKD stage 1 through 5 participants’ plasmaby liquid-chromatography/mass-spectrometry. We identified 453 proteins across all study groups.Our results indicate that key events, which may later affect the course of disease progression and theoverall pathophysiological background, are most pronounced in CKD stage 2, with an emphasis oninflammation, lipoprotein metabolism, angiogenesis and tissue regeneration. We hypothesize thatCKD stage 2 is the tipping point in disease progression and a suitable point in disease course for thedevelopment of therapeutic solutions.
Keywords: angiogenesis; chronic kidney disease; inflammation; proteomics; tissue regeneration
1. Introduction
Chronic kidney disease (CKD) is the progressive loss of renal function that can developrapidly over a period of months or advance more slowly over many years. It is recognizedas a worldwide public health problem, with a global estimated prevalence of 13.4% andhigh associated healthcare costs [1,2]. The disease is caused by a diverse range of conditions(immunological, toxic, metabolic, etc.) that affect the functional kidney compartments,including vasculature, glomeruli and tubulointerstitium [3]. CKD is divided into fivestages that are characterized by progressive deterioration of glomerular filtration rate. Inthe early stages, the symptoms are not specific, which can prevent correct diagnosis, andthe disease is therefore often confirmed only in its more advanced stages, usually basedon the glomerular filtration rate estimation (eGFR), determination of albuminuria and, attimes, kidney biopsy [4]. The observed loss of function is progressive and irreversible due
Biomedicines 2022, 10, 1522. https://doi.org/10.3390/biomedicines10071522 https://www.mdpi.com/journal/biomedicines

Biomedicines 2022, 10, 1522 2 of 16
to renal circulatory impairment, which is common in patients with underlying diabetes,obesity, atherosclerosis or hypertension [5]. According to epidemiological and clinicaldata, as the kidneys deteriorate over time, the mutual endpoint is tissue fibrosis anddysfunction. The existing treatment options are non-specific and are aimed at improvingthe underlying condition. For patients in end-stage renal disease (ESRD), this includesrenal replacement therapies, dialysis and kidney transplants, all procedures that requirefrequent follow-ups and are prone to complications [6]. In a study by Glorieux et al.,the plasma proteome of patients with stage 2–3 and stage 5 CKD with haemodialysisconfirmed changes in molecular pathways related to decreased haemostasis and increasedinflammation, complement activation and vascular damage. An increase in plasma levelsof two proteins was identified during CKD progression: lysozyme C and leucine-richalpha-2 glycoprotein [7]. Romanova et al. proposed that serum alpha-1-antitrypsin andHSP90B2 are associated with ESRD and might be potential disease biomarkers [8]. Toadd, some authors focused their research on advanced CKD kidney derived proteinsand proposed several proteins to be used as early plasma biomarkers of CKD, whileothers aimed to detect pro angiogenic and inflammatory biomarkers [9–11]. However,these results require verification, since the protein expression changes dramatically overthe course of the disease stages, and it could therefore be misleading to estimate earlybiomarkers according to proteins expressed in ESRD. Gansevoort and de Jong argue thatdetermination of proteinuria in stage 1 and 2 of CKD might be a relevant indicator of futureprogression to ESRD. Furthermore, as they argue that albuminuria might be an early markerof renal impairment—patients with detected albuminuria without eGFR impairment mightbenefit from cardioprotective and renoprotective therapies [12]. Although advances havebeen made in understanding renal disease, it is still difficult to pinpoint key events thatunderlay the advancement of kidney failure and identify therapeutic targets that couldslow it down. Previous research in this field does not provide a clear understanding of thepathophysiology of CKD stages and fails to point out potential “turning points” that couldsignal irreversible organ damage. Up to now, early diagnostic protein biomarkers of CKDhave not been extensively studied.
We performed a cross-sectional shotgun-proteomic study in order to screen the plasmaof advancing kidney disease and compare them to healthy control participants. Molec-ular profiles of identified proteins were created for each CKD stage (from 1 to 5), withthe aim to specifically point out markedly upregulated or downregulated proteins. Ourresults implies that the aggravation towards renal failure does not follow a “linear mode”of disease progression. We propose evidence of a potential tipping-point occurring atstage 2 of CKD, which possibly makes it a crucial pathophysiological moment that maysignificantly affect disease progression. Several signalling pathways were activated, someof which had previously been connected to renal pathology. Additionally, new possibleplasma biomarkers of early CKD development are proposed for future validation. Thepresented data interconnects a plethora of the published research on CKD proteomics andhypothesizes stage 2 as a crucial event in disease progression.
2. Materials and Methods2.1. Study Participants and Study Outline
This cross-sectional observational study included N = 90 participants divided bydeclining eGFR into the following experimental groups (N = 15): (a) CKD-1; (b) CKD-2;(c) CKD-3; (d) CKD-4; (e) CKD-5; (f) healthy controls (Table 1, Figure 1). Exclusion studycriteria were: persons under the age of 18, patients with proven malignant, systemic autoim-mune, rheumatic or central nervous system diseases, persons with mental and behaviouraldisorders, and patients with acute cardiovascular or infectious disease. The majority ofparticipants with CKD suffered from underlying primary glomerular disease objectifiedby biopsy, including patients with stage 1 of CKD. Detailed distribution of underlyingkidney diseases for each CKD stage is presented in Table 1. CKD was classified into stagesusing Kidney Disease: Improving Global Outcomes (KDIGO) 2012 nomenclature [4]. This

Biomedicines 2022, 10, 1522 3 of 16
study was approved by the Ethics Committee of the University Hospital Center Zagreb(EP-16/106-2, 24 June 2016). All participants signed an informed consent form. Bloodsamples from all participants were collected from 1 January 2017 to 31 December 2018at the Department of Nephrology, Arterial Hypertension, Dialysis and Transplantation,University Hospital Center Zagreb.
Biomedicines 2022, 10, 1522 3 of 17
jectified by biopsy, including patients with stage 1 of CKD. Detailed distribution of un-derlying kidney diseases for each CKD stage is presented in Table 1. CKD was classified into stages using Kidney Disease: Improving Global Outcomes (KDIGO) 2012 nomencla-ture [4]. This study was approved by the Ethics Committee of the University Hospital Center Zagreb (EP-16/106-2, 24 June 2016). All participants signed an informed consent form. Blood samples from all participants were collected from 1 January 2017 to 31 De-cember 2018 at the Department of Nephrology, Arterial Hypertension, Dialysis and Trans-plantation, University Hospital Center Zagreb.
Figure 1. Study outline. Proteomic data was obtained from the pooled and purified plasma samples of patients with chronic kidney disease (CKD) including all stages from CKD 1 to CKD 5. The most relevant proteins related to kidney disease initiation and progressions were selected by manual cu-ration, as well as kidney specific protein analysis was performed. Next, dynamic profiles of proteins identified in all samples, as well as outliers, were performed with an emphasis on the degree of renal failure at which the greatest changes were observed. Functional pathway analysis of proteins included in the ascending and descending protein abundance profiles was assessed.
Figure 1. Study outline. Proteomic data was obtained from the pooled and purified plasma samplesof patients with chronic kidney disease (CKD) including all stages from CKD 1 to CKD 5. Themost relevant proteins related to kidney disease initiation and progressions were selected by manualcuration, as well as kidney specific protein analysis was performed. Next, dynamic profiles of proteinsidentified in all samples, as well as outliers, were performed with an emphasis on the degree ofrenal failure at which the greatest changes were observed. Functional pathway analysis of proteinsincluded in the ascending and descending protein abundance profiles was assessed.

Biomedicines 2022, 10, 1522 4 of 16
Table 1. Participants’ characteristics at the time of plasma sampling, categorized according to the stage of chronic kidney disease. Gender, comorbidities andunderlying diseases are reported as number of participants (percentage). Age, body mass index and serum creatinine are reported as mean ± standard deviation.Proteinuria is reported as median (first and third quartile). Patients with hyperlipidemia were on statin therapy at the time of plasma sampling.
Group Healthy CKD Stage 1 CKD Stage 2 CKD Stage 3 CKD Stage 4 CKD Stage 5
N 15 15 15 15 15 15Age (years) 42.9 ± 9.4 36.7 ± 15.2 54.5 ± 18.2 56.5 ± 14.5 60.5 ± 16.1 60.7 ± 15.4
Gender: N (%) female 7 (46%) 8 (53%) 7 (46%) 4 (26%) 9 (60%) 6 (40%)BMI (kg/m2) 24.3 ± 2.7 25.1 ± 4.7 28.7 ± 6.43 25.7 ± 5.22 26.3 ± 4.06 28.3 ± 5.23
Serum creatinine (µmol/L) 72.7 ± 10.9 74.1 ± 14.3 88.7 ± 15.2 158 ± 23.7 237 ± 52.2 476 ± 136eGFR (mL/min/1.73 m2) 104 ± 10.1 102 ± 10.2 74.7 ± 8.8 39.3 ± 7.2 21.7 ± 4.7 10.3 ± 2.3
Proteinuria (g/24 h) 0.2 (0–0.5) 0.36 (0.2–1.5) 0.7 (0.3–1.3) 0.49 (0.4–1.2) 0.43 (0.4–3.1) 1.88 (0.7–3.2)BUN (mmol/L) 5 ± 1 5 ± 1.3 6.2 ± 1.6 10.5 ± 3.3 16.6 ± 4.9 24.3 ± 4.9
Serum cholesterol (mmol/L) 4.4 ± 0.6 5.4 ± 2.5 4.2 ± 0.8 4.5 ± 0.8 5 ± 1.4 5 ± 1.7Serum triglycerides (mmol/L) 1.1 (0.7–1.4) 1 (0.8–1.2) 1.4 (1–1.8) 1.7 (1.2–2) 2 (1.6–3.4) 1.6 (1.4–2.8)
Serum HDL (mmol/L) 1.6 ± 0.3 1.6 ± 0.4 1.3 ± 0.4 1.3 ± 0.4 1.1 ± 06 1.1 ± 0.3Serum LDL (mmol/L) 2.4 ± 0.5 3.3 ± 2.4 2.2 ± 0.7 2.1 ± 0.8 2.8 ± 1.4 2.7 ± 1.3Serum albumin (g/L) 44 ± 3 39 ± 6 38 ± 3 40 ± 3 37 ± 6.6 40 ± 4
Comorbidities
Hypertension 0 7 (47%) 14 (93%) 13.(86%) 15 (100%) 15 (100%)Diabetes 0 0 3 (20%) 4 (26%) 5 (33%) 2 (13%)Smoker 2 (13%) 2 (13%) 1 (7%) 6 (40%) 3 (20%) 8 (53%)
Hyperlipidemia 0 5 (33%) 12 (80%) 10 (67%) 12 (80%) 9 (60%)Atherosclerosis 0 0 3 (20%) 4 (26%) 5 (33%) 8 (53%)
Underlying Disease
Primary glomerular KD 0 13 (86%) 15 (100%) 9 (60%) 5 (33%) 6 (40%)Hypertensive/atherosclerotic KD 0 0 0 2 (13%) 5 (33%) 2 (13%)
Autosomal dominant polycystic KD 0 1 (7%) 0 0 0 1 (7%)Diabetic KD 0 0 0 0 1 (7%) 1 (7%)
Other specific cause 0 1 (7%) 0 2 (13%) 2 (13%) 2 (13%)Unknown 0 0 0 1 (7%) 2 (13%) 3 (20%)
BMI—body mass index; BUN—blood urea nitrogen; CKD—chronic kidney disease; eGFR—estimated glomerular filtration rate; HDL—high density lipoprotein; KD—kidney disease;LDL—low density lipoprotein; N—number of participants.

Biomedicines 2022, 10, 1522 5 of 16
2.2. Plasma Sample Collection and Heparin Column Chromatography
Blood samples were drawn into tubes containing 3.8% sodium citrate to form ananticoagulant-to blood ratio (v/v) 1:9. Plasma was obtained by centrifugation (15 minat 4 ◦C and 3000× g), and aliquots of each sample were stored at −80 ◦C until analysis.Samples were then pooled into six groups (CKD stages 1–5 and healthy controls). All poolswere then applied twice through the 5 mL heparin sepharose column (HiTrap HeparinHP, Thermo Fisher Scientific, Waltham, MA, USA) and consecutively eluted with 5 mLof 0.5, 1 and 2 M NaCl solution. Eluates were then precipitated with acetone (previouslycooled at −20 ◦C); (eluate:acetone ratio of 1:4) and were then left overnight to furtherprecipitate at −80 ◦C. The following day, samples were centrifuged at 16,000× g for 10 min.Supernatant was disposed and formed pellets were resuspended with phosphate-bufferedsaline. Prepared pooled samples were then stored at −80 ◦C until further analysis.
2.3. Liquid Chromatography-Mass Spectrometry (LC-MS) Analysis
Total protein concentration was determined using the RC DC Lowry protein assay(BioRad, Hercules, CA, USA) according to manufacturer’s instructions. Pooled proteinsamples (40 µg) were denatured (8 M urea), alkylated (55 mM iodoacetamide in 8 M urea)and digested with 0.8 µg of TPCK treated trypsin (Worthington Industries, Columbus, OH,SAD) in 10-kDa centrifugal filter units. Digested peptides were purified and concentratedusing Stage Tips [13]. Tryptic peptides were then separated in a gradient of acetonitrilein formic acid on a PepMap C18 25-centimetre-long nano-column by high-performanceliquid-chromatography on an Easy-nLC 1200 System (Thermo Fisher Scientific, Waltham,MA, USA). Mass spectrometry (MS) was performed on a T Q Exactive Plus instrument(Thermo Fisher Scientific, Waltham, MA, USA). Automated measurement cycles consistedof full MS scanning and MS/MS scanning of up to ten most intense ions. Full MS scansranging from m/z 300 to 1800, were obtained in the Orbitrap analyser at a resolution of70,000, with internal calibration of the instrument using the lock mass setting.
2.4. Data Analysis
Raw data was processed using the Proteome Discoverer (Thermo Fisher Scientific,Waltham, MA, USA ) software version 2.4. Spectral data was searched using SequestHTand Mascot search engines in iterative manner against human proteome database retrievedfrom UniProt (Release 2020_05, Proteome ID: UP000005640). The search parameters were:full trypsin digest, missed cleavages max. 2, dynamic modifications: Met oxidation, Asnand Gln deamination, dynamic protein N-terminal modifications: Met-loss, acetylation,Met-loss and acetylation. Label-free quantification was performed to determine the relativeprotein abundances, which were calculated from MS1 peptide intensities and normalizedbetween samples. Samples were analysed in technical duplicates, and proteins identifiedwith at least one peptide were considered relevant for analysis. Obtained data weredeposited at the ProteomeXchange Consortium via the Proteomics Identification Database(PRIDE) partner repository with the dataset identifier PXD033427.
Gene enrichment analysis, including analysis of relevant biological pathways, wasperformed using Funrich 3.1.3. software which yielded several significant biological path-ways [14]. Statistical significance among the biological pathways was determined desig-nated as statistically significant for p < 0.05 by performing hypergeometric test, correctedby Bonferroni for multiple comparisons. A literature search for the statistically significantpathways was performed and we report the pathways we deem to be potentially the mostbiologically relevant by manual curation.
Individual identified proteins were initially analysed for outliers in a binary (yes/no)fashion for each group. Outliers (proteins found in a single experimental group) werethen plotted as Venn diagram and for each outlier a literature search (described below)was performed.
Identified proteins were plotted in a heatmap according to their protein abundanceper experimental group and analysed in a semiquantitative fashion.
Biomedicines 2022, 10, 1522 6 of 16
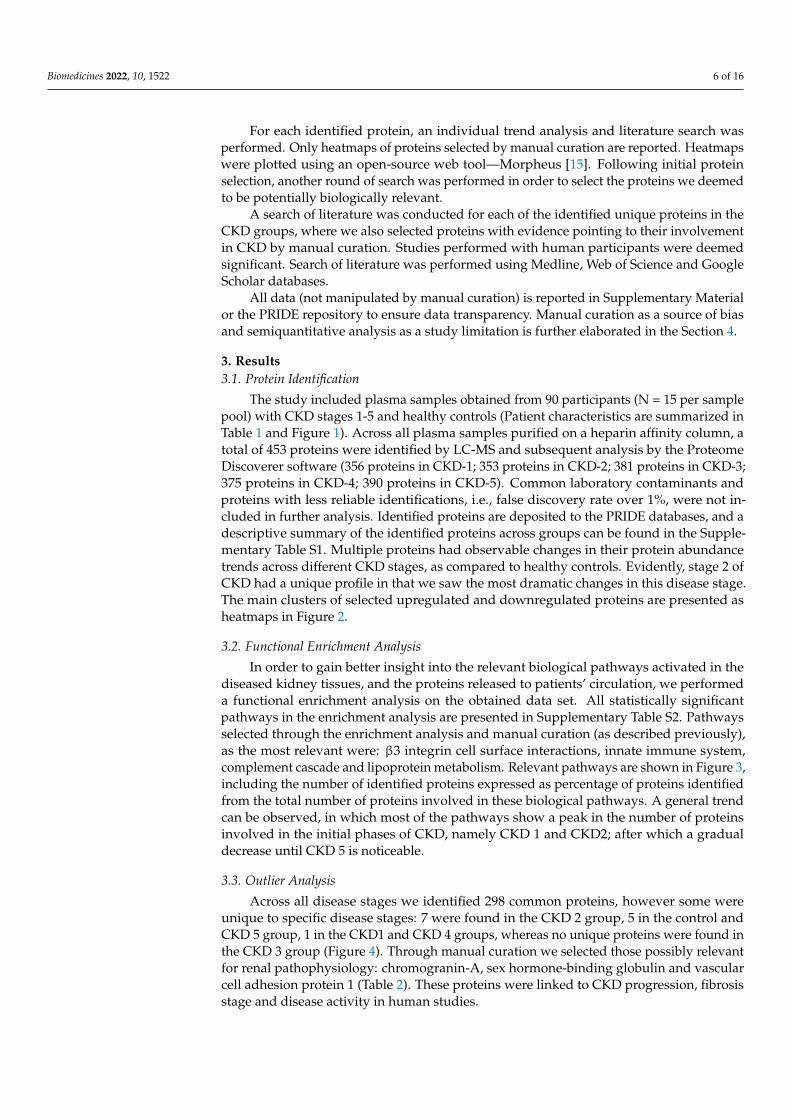
For each identified protein, an individual trend analysis and literature search wasperformed. Only heatmaps of proteins selected by manual curation are reported. Heatmapswere plotted using an open-source web tool—Morpheus [15]. Following initial proteinselection, another round of search was performed in order to select the proteins we deemedto be potentially biologically relevant.
A search of literature was conducted for each of the identified unique proteins in theCKD groups, where we also selected proteins with evidence pointing to their involvementin CKD by manual curation. Studies performed with human participants were deemedsignificant. Search of literature was performed using Medline, Web of Science and GoogleScholar databases.
All data (not manipulated by manual curation) is reported in Supplementary Materialor the PRIDE repository to ensure data transparency. Manual curation as a source of biasand semiquantitative analysis as a study limitation is further elaborated in the Section 4.
3. Results3.1. Protein Identification
The study included plasma samples obtained from 90 participants (N = 15 per samplepool) with CKD stages 1-5 and healthy controls (Patient characteristics are summarized inTable 1 and Figure 1). Across all plasma samples purified on a heparin affinity column, atotal of 453 proteins were identified by LC-MS and subsequent analysis by the ProteomeDiscoverer software (356 proteins in CKD-1; 353 proteins in CKD-2; 381 proteins in CKD-3;375 proteins in CKD-4; 390 proteins in CKD-5). Common laboratory contaminants andproteins with less reliable identifications, i.e., false discovery rate over 1%, were not in-cluded in further analysis. Identified proteins are deposited to the PRIDE databases, and adescriptive summary of the identified proteins across groups can be found in the Supple-mentary Table S1. Multiple proteins had observable changes in their protein abundancetrends across different CKD stages, as compared to healthy controls. Evidently, stage 2 ofCKD had a unique profile in that we saw the most dramatic changes in this disease stage.The main clusters of selected upregulated and downregulated proteins are presented asheatmaps in Figure 2.
3.2. Functional Enrichment Analysis
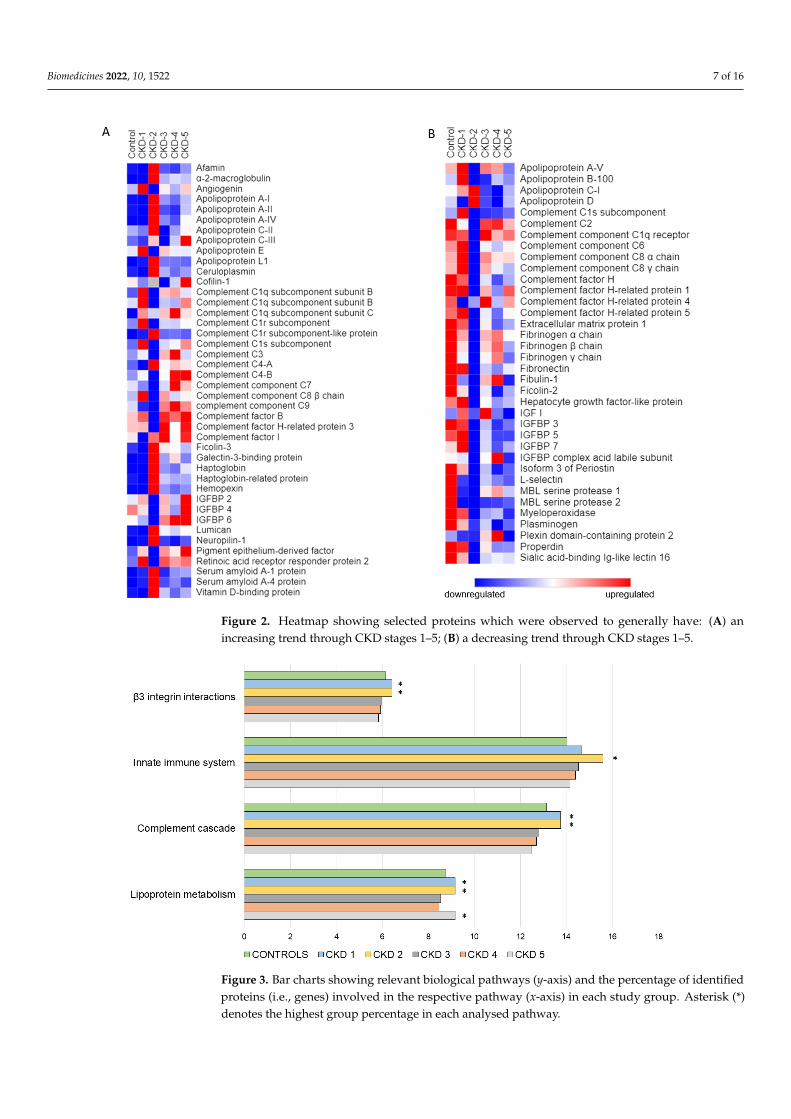
In order to gain better insight into the relevant biological pathways activated in thediseased kidney tissues, and the proteins released to patients’ circulation, we performeda functional enrichment analysis on the obtained data set. All statistically significantpathways in the enrichment analysis are presented in Supplementary Table S2. Pathwaysselected through the enrichment analysis and manual curation (as described previously),as the most relevant were: β3 integrin cell surface interactions, innate immune system,complement cascade and lipoprotein metabolism. Relevant pathways are shown in Figure 3,including the number of identified proteins expressed as percentage of proteins identifiedfrom the total number of proteins involved in these biological pathways. A general trendcan be observed, in which most of the pathways show a peak in the number of proteinsinvolved in the initial phases of CKD, namely CKD 1 and CKD2; after which a gradualdecrease until CKD 5 is noticeable.
3.3. Outlier Analysis
Across all disease stages we identified 298 common proteins, however some wereunique to specific disease stages: 7 were found in the CKD 2 group, 5 in the control andCKD 5 group, 1 in the CKD1 and CKD 4 groups, whereas no unique proteins were found inthe CKD 3 group (Figure 4). Through manual curation we selected those possibly relevantfor renal pathophysiology: chromogranin-A, sex hormone-binding globulin and vascularcell adhesion protein 1 (Table 2). These proteins were linked to CKD progression, fibrosisstage and disease activity in human studies.
Biomedicines 2022, 10, 1522 7 of 16Biomedicines 2022, 10, 1522 7 of 17
Figure 2. Heatmap showing selected proteins which were observed to generally have: (A) an in-creasing trend through CKD stages 1–5; (B) a decreasing trend through CKD stages 1–5.
3.2. Functional Enrichment Analysis In order to gain better insight into the relevant biological pathways activated in the
diseased kidney tissues, and the proteins released to patients’ circulation, we performed a functional enrichment analysis on the obtained data set. All statistically significant path-ways in the enrichment analysis are presented in Supplementary Table S2. Pathways se-lected through the enrichment analysis and manual curation (as described previously), as the most relevant were: β3 integrin cell surface interactions, innate immune system, com-plement cascade and lipoprotein metabolism. Relevant pathways are shown in Figure 3, including the number of identified proteins expressed as percentage of proteins identified from the total number of proteins involved in these biological pathways. A general trend can be observed, in which most of the pathways show a peak in the number of proteins involved in the initial phases of CKD, namely CKD 1 and CKD2; after which a gradual decrease until CKD 5 is noticeable.
Figure 2. Heatmap showing selected proteins which were observed to generally have: (A) anincreasing trend through CKD stages 1–5; (B) a decreasing trend through CKD stages 1–5.
Biomedicines 2022, 10, 1522 8 of 17
Figure 3. Bar charts showing relevant biological pathways (Y-axis) and the percentage of identified proteins (i.e., genes) involved in the respective pathway (X-axis) in each study group. Asterisk (*) denotes the highest group percentage in each analysed pathway.
3.3. Outlier Analysis Across all disease stages we identified 298 common proteins, however some were
unique to specific disease stages: 7 were found in the CKD 2 group, 5 in the control and CKD 5 group, 1 in the CKD1 and CKD 4 groups, whereas no unique proteins were found in the CKD 3 group (Figure 4). Through manual curation we selected those possibly rele-vant for renal pathophysiology: chromogranin-A, sex hormone-binding globulin and vas-cular cell adhesion protein 1 (Table 2). These proteins were linked to CKD progression, fibrosis stage and disease activity in human studies.
Figure 4. Venn diagram showing the number of proteins found in all study groups and proteins found only in one group. Specific proteins for each group are listed in boxes adjacent to the respec-tive group. Proteins found to be potentially biologically relevant in CKD (according to the previ-ously published literature) are shown in bold.
Figure 3. Bar charts showing relevant biological pathways (y-axis) and the percentage of identifiedproteins (i.e., genes) involved in the respective pathway (x-axis) in each study group. Asterisk (*)denotes the highest group percentage in each analysed pathway.

Biomedicines 2022, 10, 1522 8 of 16
Biomedicines 2022, 10, 1522 8 of 17
Figure 3. Bar charts showing relevant biological pathways (Y-axis) and the percentage of identified proteins (i.e., genes) involved in the respective pathway (X-axis) in each study group. Asterisk (*) denotes the highest group percentage in each analysed pathway.
3.3. Outlier Analysis Across all disease stages we identified 298 common proteins, however some were
unique to specific disease stages: 7 were found in the CKD 2 group, 5 in the control and CKD 5 group, 1 in the CKD1 and CKD 4 groups, whereas no unique proteins were found in the CKD 3 group (Figure 4). Through manual curation we selected those possibly rele-vant for renal pathophysiology: chromogranin-A, sex hormone-binding globulin and vas-cular cell adhesion protein 1 (Table 2). These proteins were linked to CKD progression, fibrosis stage and disease activity in human studies.
Figure 4. Venn diagram showing the number of proteins found in all study groups and proteins found only in one group. Specific proteins for each group are listed in boxes adjacent to the respec-tive group. Proteins found to be potentially biologically relevant in CKD (according to the previ-ously published literature) are shown in bold.
Figure 4. Venn diagram showing the number of proteins found in all study groups and proteinsfound only in one group. Specific proteins for each group are listed in boxes adjacent to the respectivegroup. Proteins found to be potentially biologically relevant in CKD (according to the previouslypublished literature) are shown in bold.
Table 2. Relevant articles pertaining to notable group-specific proteins and its link with the degree ofkidney disease.
ReferenceOutlierProteinName
NHospital
AdmissionDisease
Study Groups Tested Sample Main Points andConclusions
Po-Tseng Leeet al., 2021 [16] VCAM-1 51
Peripheralarterial disease
(PAD)
3 groups:A/normalkidney function;B/CKD; C/HD
serum/arterialtissue
- Link with underlyingkidney disease
- The HD group hada higher
Concentration ofVCAM-1 than the other
two groups- Serum level and thetissue expression of
VCAM-1 weresignificantly higher in
PAD patientswith advancedkidney disease
Gasparin et al.,2020 [17] VCAM-1 62
Systemic lupuserythematosus
(SLE)
2 groups:A/withoutactive lupus nephritis
(LN); B/with active LNurine
VCAM-1 level waselevated in patients
with active comparedto inactive LN
Y Jia et al., 2021[18] VCAM-1 22 Diabetes
mellitus
2 groups:A/Control;B/Diabetic kidney
disease (DKD)
renal tubularcells, infiltratedimmune cells
VCAM1 expressionwas upregulated inrenal tubular cells,
which might interactwith infiltrated
immune cells, thuspromoting fibrosis.

Biomedicines 2022, 10, 1522 9 of 16
Table 2. Cont.
ReferenceOutlierProteinName
NHospital
AdmissionDisease
Study Groups Tested Sample Main Points andConclusions
Tramonti Get al., 2009 [19] CGA 102 Kidney related
diseasePatients with different
values of GFR serumCGA accumulates in
the blood inrenal failure
Bech PR et al.,2012 [20] CGA 147 Kidney related
disease
2 groups: A/normalkidney function;
B/CKDplasma
CGA accumulates inthe blood inrenal failure
Yu et al., 2022[21] CGA 219
Type 2 diabetesmellitus(T2DM)
3 groups of patientswith DN based on their
urine albumin tocreatinine ratios
serumSerum CgA increased
gradually with thedegree of DN
Zhang H 2022[22] SHBP 5027
Screening formethabolicdisease andother risk
factors
Measurement of SHBPand testing correlation
with eGFRSerum, plasma
Lower serum SHBGlevels were
significantly associatedwith lower eGFR
N—number of participants; HD—hemodialysis; VCAM-1—Vascular Cell Adhesion Molecule; CGA—chromogranin A; SHBP—sex hormone-binding globulin; DN—diabetic nephropathy.
4. Discussion
Renal tissue can be damaged by a variety of noxious stimuli, such as long-term highblood pressure or elevated cholesterol, infections, medications and underlying conditionslike diabetes or kidney stones, as well as by other immunologically-mediated mechanisms.If untreated, the injury can progress from a largely undiagnosed stage 1, to the morepronounced disease stages (Figure 5). The progressing pathology of renal disease andits turbulent pathophysiological changes are also visible on a systemic level, through theplasma (proteome) of CKD patients. Early disease stages that are characterized by a rathermild loss of function (reduction in GFR) are mostly associated to initial scarring of theglomeruli, however, we have observed substantial changes in molecular patterns that occuras the disease begins to develop.
To summarize our findings, we organized them into several biological processesaccording to the proteins involved in renal pathophysiology, that modulate inflammation,angiogenesis, tissue repair and lipid metabolism. Stage 2 of CKD seems to be a “tippingpoint” in renal response to injury—there were clearly observable changes in the plasmaabundance of several proteins previously associated to the failing kidney. An overviewof potential target molecules identified by our study and the corresponding significantbiological processes is shown in Figure 5. These new insights support and summarize thecurrent knowledge, and focus the discourse towards, what seems to be, the critical point inthe natural advancement of renal failure.
The long-term smouldering inflammation in a CKD-ridden kidney supports the se-cretion of inflammatory mediators and progressive activation of other parts of the innateimmune system. Complement proteins can trigger the cascade activation of innate mecha-nisms that damage renal tissue and lead to autoimmune-initiated glomerulopathies [23,24].We present evidence of several complement (C) activation mechanisms that were clearlydisrupted, mostly in stage 2 CKD patients. This can be observed in our analysis of biologicalpathways, as it shows a peak in proteins related to the complement cascade in CKD 1 andCKD 2. Furthermore, as the levels of complement inhibitors like C factor H decrease, thestage is set for activation of the alternative complement pathway, through C factor B. At thesame time, the levels of complement activator properdin drop, which complicates kidneyrepair and inflammation resolution, as shown in renal disease C3 glomerulopathy andlupus nephritis [25–28]. The pronounced complement activation flares can thus consumethe available properdin leading to a drop in its plasma levels [29]. The complement cascade

Biomedicines 2022, 10, 1522 10 of 16
can also be activated via the lectin pathway, mediated by pattern recognition moleculesmannan-binding lectin (MBL) and MBL-associated serine protease-2 (MASP-2), whichcontribute to the pathogenesis of renal isograft ischemic reperfusion injury [30]. Our studyshows that plasma abundance of MASP-2 drops sharply at CKD stage 2 and remainsconsistently lower than in healthy control samples. This favours the deposition of C3 onthe tubular surface leading to renal injury, a phenomenon that is implied by our find ofelevated plasma C3 levels in the later CKD stages. Activation of the lectin pathway canalso be aggravated by ficolins, which we have also seen in stage 2 patients [31,32]. Adding“fuel to the fire” around stage 2 CKD, the secretion of acute phase plasma proteins likehemopexin, haptoglobin and serum amyloid A worsen the inflammation [33–35]. Anotherpuzzle piece in stage 2 is the exclusive detection of vascular cell adhesion protein 1 (VCAM-1), a biomarker of kidney diseases. VCAM-1 enables the adhesion of leukocytes to vascularendothelium, aggravating atherosclerosis and further facilitating inflammation [17,18]. Wealso observed that proteins related to innate immunity pathways are raised above healthycontrol group levels in all CKD stages, with a clearly visible peak in CKD2 (Figure 3).In conclusion, the synchronous activation of multiple inflammatory pathways, clearlycoincide in the early disease stages. Interestingly, the rapid build-up of these mediatorsdoes not suffice for neutrophil-induced myeloperoxidase (MPO) secretion. MPO is theneutrophils’ “weapon of choice” against pathogens that can also damage host tissues. We,as well as other researchers have shown, that its plasma levels are significantly lower inCKD patients, possibly due to the inhibitory effect of uremic toxins on this enzyme [36].
Biomedicines 2022, 10, 1522 10 of 17
the glomeruli, however, we have observed substantial changes in molecular patterns that occur as the disease begins to develop.
Figure 5. (A) Hypothetical presentation of Stage 2 CKD as a “tipping point” in further disease pro-gression. (B) Proposed target proteins accompanied by a specific biological process significantly different in plasma of CKD patients stage 2 of disease as compared to the other CKD stages and healthy control group.
To summarize our findings, we organized them into several biological processes ac-cording to the proteins involved in renal pathophysiology, that modulate inflammation, angiogenesis, tissue repair and lipid metabolism. Stage 2 of CKD seems to be a “tipping point” in renal response to injury—there were clearly observable changes in the plasma abundance of several proteins previously associated to the failing kidney. An overview of potential target molecules identified by our study and the corresponding significant bio-logical processes is shown in Figure 5. These new insights support and summarize the current knowledge, and focus the discourse towards, what seems to be, the critical point in the natural advancement of renal failure.
The long-term smouldering inflammation in a CKD-ridden kidney supports the se-cretion of inflammatory mediators and progressive activation of other parts of the innate
Figure 5. (A) Hypothetical presentation of Stage 2 CKD as a “tipping point” in further diseaseprogression. (B) Proposed target proteins accompanied by a specific biological process significantlydifferent in plasma of CKD patients stage 2 of disease as compared to the other CKD stages andhealthy control group.
Biomedicines 2022, 10, 1522 11 of 16
Imbalance of angiogenesis regulators is a known aggravating factor of CKD [31]. Wehave confirmed previous findings of excessive plasma angiogenin (ANG) in the early stagesof CKD, however they drop and normalize in the later disease stages [37]. ANG contributesto blood vessel normalization, i.e., proper covering of pericytes over leaky vessels, promot-ing cellular adaptation to kidney injury [38,39]. Another role of ANG is to mitigate bloodclotting by stimulating the activation of plasminogen [40]. Lack of ANG corresponds tolower plasminogen levels—a finding we have also observed in all CKD patients, whichis in compliance with previous research. The consistently decreased fibrinogen levelscontribute to blood coagulation abnormalities, which are common in CKD [41]. Anotherangiogenesis modulator we detected is neuropilin-1 (NRP-1), a co-receptor expressed inkidney pericytes that regulates the integrity of glomerular basement membrane, directlyinfluencing glomerular filtration [42]. It was reported that overexpression of NRP-1 coulddamage kidneys in lupus nephritis [43,44]. Knowing that, the sharp increase of its proteinabdundance in stage 2 of CKD that we have seen, might contribute to the disease pathology.Moreover, we found that integrin signalling, namely β3 integrin, which has been shown toplay an important role in angiogenesis, peaks in early stages of CKD [45]. Finally, we havefound that plasma levels of ceruloplasmin, an angiogenesis inducer, also peak at stage 2 ofthe disease. Taken together, it is evident that the angiogenesis pathway is a major disruptednetwork that should be further investigated in the early CKD stages [46,47].
In parallel with inflammation and angiogenesis, the stressed renal tissue likely triggersdefence mechanisms and production of mediators related to tissue repair. As podocytesrecover from injury, they undergo actin cytoskeletal remodelling, a process tightly regulatedby cofilin-1, which was previously proposed as a kidney injury biomarker [48,49]. As CKDprogresses, we have seen a steady raise not only in plasma cofilin-1, but also in its relatedmediator, vitamin D binding protein (DBP) [50,51]. In inflamed and injured tissues affectedby CKD, DBP induces inflammation through cellular immunity and is known to be elevatedin the serum of kidney transplant recipients with acute rejection We have observed anincrease of DBP abundance in all CKD stages, peaking in stage 2 patients, which waspreviously found by Doorenbos et al. However, Kalousova et al. observed significantlydecreased levels of DBP in CKD patients compared to healthy controls [51,52]. Anothertissue repair modulator, elevated in CKD, is pigment epithelium derived factor (PEDF), aserin protease inhibitor with anti-inflammatory, anti-thrombogenic and vasculo-protectiveproperties [53–55]. Our data indicated its elevated plasma abundance levels during diseaseprogression, which could be interpreted by plasma soluble PEDF providing an extra supplyfor the dwindling tissue levels of the modulator from systemic circulation, possibly playinga protective role against organ damage. Kidney inflammation might also be internallyameliorated the through the control of inflammatory cytokines. Alfa-2-macroglobulin(A2M) is known to be elevated in patients with nephrotic syndrome—we have also foundits excessive abundance in the plasma of CKD patients, again peaking at stage 2 [56–58].A2M plays an active role in quenching the inflammatory reaction and fostering tissuerepair, since it binds and neutralizes multiple cytokines. However, as inflammation instage 2 is evident, besides tissue repair modulators, we have seen evidence of excessivematrix deposition, possibly leading to tissue fibrosis, which as it progresses, leads to clinicaldeterioration of CKD (Figure 5). Amongst dysregulated extracellular matrix proteins,lumican acts as a pro-inflammatory signal that peaks in stage 2 CKD and remains highin the following disease stages [59,60]. Elevated lumican levels may be related to theprogression of renal fibrosis, which is in correlation with previous research [61]. To add, theprotein abundance patterns of fibulin-1 and extracellular protein 1 from our data are not inline with previously published data: we consistently documented their decrease in CKD.However, previous studies were exploratory kidney disorder screens that did not stratifyCKD patients according to stages; furthermore, the proteins in question lack specificitypertaining to kidney pathology [62].
Caught between pro-inflammatory signals, disrupted angiogenesis and tissue repairpathways, the kidney suffers from loss of function, which is apparent in lipid metabolism.

Biomedicines 2022, 10, 1522 12 of 16
CKD is a known risk factor for cardiovascular disease, since elevated plasma levels of apoA-I containing lipoproteins may lead to the accumulation of atherogenic particles [63,64]. Inour study, multiple apolipoproteins were dysregulated with respect to control samples.apoA-I, apoA-II and apoA-IV peaked at stage 2 CKD: the most striking build-up was seenin apoA-IV, which was previously established as an independent predictor of CKD pro-gression [65]. Therefore, the peak in proteins related to lipoprotein metabolism pathwayswhich we observed in stages 1 and 2, might reflect this peak in plasma apolipoproteins.
Our study has several limitations which must be taken into account while interpretingour results: (A) One of the main limitations of our pilot proteomics study is the relativelysmall sample pool we draw our conclusions from: the presented ideas should be morebroadly validated. (B) This study is cross-sectional in design, a prospective longitudinalstudy in the future might offer further validation. (C) Additionally, the staging of CKDrelies on an attempt at quantification of kidney function through eGFR and it is blindto the underlying cause of kidney failure. Stratification of patients according to primarykidney disease in future studies should distinguish whether these concepts are universalor disease-specific. (D) Another important limitation is sample pooling, which was adeliberate choice that enabled us to focus on the most prominent pathways disrupted inCKD, however it inherently diluted out individual patient specificities [66]. Therefore,only the most prominent regulators of CKD progression might have been identified, whileweaker, but possibly important modulators might have been disregarded. Sample poolingmight have also clouded the distinction among underlying kidney disorders, however,the action of sample pooling allowed for a clearer data analysis. It is also theoreticallypossible that specific overabundant proteome pattern of a single patient acted as a potentialconfounder that “outweighed” group from the “biological average”. (E) To add, the factthat we purified our samples using a heparin-enriched column “blinded” us to one part ofplasma proteome, however multiple growth factors and cytokines that have a relativelyhigh heparin binding affinity, were thus concentrated [67–73]. (F) Finally, it is importantto note that these results are primarily interpreted by manual curation done accordingto literature search results. Therefore, data interpretation is prone to human error andpublication bias. Furthermore, the comprehensive nature of mass spectrometry-basedproteomics, uncovered abundant differences in plasma proteome profiles of CKD patientsas compared to healthy people; therefore, for the sake of clarity and readability, we haveomitted to comment on pathways clearly known to be disrupted in CKD, such as theinsulin like growth factor binding proteins [74,75]. All raw data is, however, available atthe ProteomeXchange Consortium via the PRIDE partner repository to achieve maximumtransparency, as mentioned in the Section 2.4.
In spite of the mentioned limitations, our study boasts a few strengths: we havesystematically analysed gross plasma proteome profile changes, as well as each identifiedprotein individually. Our study group design enables tracking of molecular progressionfrom healthy controls to ESRD, across all stages of CKD. Furthermore, it allows for aneasier bench to bedside translation, as CKD stage is most commonly determined by eGFRin the clinical setting. Another major strength lies in the fact that of our data is in line witha plethora of studies done by other researchers in the field, which were often focused on asingle protein, it thus serves as a form of “inherent quality control” of participant samplingand methodology. Therefore, our data is consistent with multiple studies focusing onkidney pathology, but also uncovers previously unknown CKD mediators and brings forthseveral novel findings.
The key message of our study is the observation of synchronous activation of cellularpathways related to inflammation and angiogenesis as well as tissue homeostasis andrepair. In that regard, stage 2 seems to be a potential “tipping point” in CKD progression,a possible molecular milestone in natural disease progression, beyond which, hallmarksof disease, such as hemodynamic changes, proteinuria and inflammatory processes be-come increasingly evident both clinically and by proteomic analysis (Figure 5). Differentbiological processes known to be important for CKD progression are reflected in several

Biomedicines 2022, 10, 1522 13 of 16
proteins identified as potential target molecules (Figure 5). We thus hypothesize that stage2 might be the potential “site” for biomarker discovery and for development of therapeuticstrategies for halting CKD. However, further prospective studies with longitudinal design,including more participants and with adequate patient stratification are needed to confirmour hypothesis. These studies should, therefore, be the basis of further biomarker screeningand future validation, which might ultimately have an impact on therapeutic strategiesand potentially improve patient outcomes.
Supplementary Materials: The following supporting information can be downloaded at: https://www.mdpi.com/article/10.3390/biomedicines10071522/s1, Table S1: Summary information re-garding identified proteins per group, as well as the total number of identified proteins; Table S2:The table shows all biological pathways to which the identified proteins in each group showeda statistically significant relation by the FunRich 3.1.3. software. The table values represent thepercentage of identified proteins that take part in the identified pathway in the respective studygroup. Statistically significant pathways were manually curated and presented in the Section 3 ofthe paper.
Author Contributions: Conceptualization: L.G.; Investigation, Methodology: G.S., S.H., R.N., M.M.,I.K.V., M.L.; Formal analysis, Visualization: L.G., R.N., G.S., S.H.; Supervision, Validation: L.G., R.N.;Writing—original draft: L.G., R.N., G.S., S.H.; Writing—review & editing: All authors. All authorshave read and agreed to the published version of the manuscript.
Funding: The study was supported by the School of Medicine, University of Zagreb, 10000 Zagreb, Croatia.
Institutional Review Board Statement: All subjects gave their informed consent for inclusion beforethey participated in the study. The study was conducted in accordance with the Declaration ofHelsinki, and the protocol was approved by the Ethics Committee of the University Hospital CenterZagreb (EP-16/106-2, 24 June 2016).
Informed Consent Statement: Informed consent was obtained from all subjects involved in the study.
Data Availability Statement: The data presented in this study are openly available at ProteomeX-change Consortium via the PRIDE partner repository with the dataset identifier PXD033427.
Acknowledgments: The authors would like to thank the study participants. We thank Josko Bilandzicand Luka Mitar for technical support. The study was supported by the infrastructural project CIuK(European Regional Development Fund, grant number KK.01.1.1.02.0016).
Conflicts of Interest: The authors declare no conflict of interest.
References1. Hill, N.R.; Fatoba, S.T.; Oke, J.L.; Hirst, J.A.; O’Callaghan, C.A.; Lasserson, D.S.; Hobbs, F.D. Global Prevalence of Chronic Kidney
Disease—A Systematic Review and Meta-Analysis. PLoS ONE 2016, 11, e0158765. [CrossRef] [PubMed]2. Manns, B.; Hemmelgarn, B.; Tonelli, M.; Au, F.; So, H.; Weaver, R.; Quinn, A.E.; Klarenbach, S. The Cost of Care for People with
Chronic Kidney Disease. Can. J. kidney Health Dis. 2019, 6, 2054358119835521. [CrossRef]3. Vojtusek, I.K.; Laganovic, M.; Burek Kamenaric, M.; Bulimbasic, S.; Hrkac, S.; Salai, G.; Ivkovic, V.; Coric, M.; Novak, R.; Grgurevic,
L. First Characterization of ADAMTS-4 in Kidney Tissue and Plasma of Patients with Chronic Kidney Disease—A PotentialNovel Diagnostic Indicator. Diagnostics 2022, 12, 648. [CrossRef] [PubMed]
4. KDIGO. 2012 Clinical Practice Guideline for the Evaluation and Management of Chronic Kidney Disease. Off. J. Int. Soc. Nephrol.2013, 3, 5–14.
5. Cao, Q.; Chen, X.-M.; Huang, C.; Pollock, C.A. MicroRNA as novel biomarkers and therapeutic targets in diabetic kidney disease:An update. FASEB Bioadvances 2019, 1, 375–388. [CrossRef]
6. Neovius, M.; Jacobson, S.H.; Eriksson, J.K.; Elinder, C.-G.; Hylander, B. Mortality in chronic kidney disease and renal replacementtherapy: A population-based cohort study. BMJ Open 2014, 4, e004251. [CrossRef]
7. Glorieux, G.; Mullen, W.; Duranton, F.; Filip, S.; Gayrard, N.; Husi, H.; Schepers, E.; Neirynck, N.; Schanstra, J.P.; Jankowski, J.;et al. New insights in molecular mechanisms involved in chronic kidney disease using high-resolution plasma proteome analysis.Nephrol. Dial. Transpl. 2015, 30, 1842–1852. [CrossRef]
8. Romanova, Y.; Laikov, A.; Markelova, M.; Khadiullina, R.; Makseev, A.; Hasanova, M.; Rizvanov, A.; Khaiboullina, S.; Salafutdinov,I. Proteomic Analysis of Human Serum from Patients with Chronic Kidney Disease. Biomolecules 2020, 10, 257. [CrossRef]
9. Higashisaka, K.; Takeya, S.; Kamada, H.; Obana, M.; Maeda, M.; Kabayama, M.; Yamamoto, K.; Ishida, N.; Isaka, R.; Tsujino, H.;et al. Identification of biomarkers of chronic kidney disease among kidney-derived proteins. Clin. Proteom. 2022, 19, 3. [CrossRef]
Biomedicines 2022, 10, 1522 14 of 16
10. Jalal, D.; Sanford, B.; Renner, B.; Ten Eyck, P.; Laskowski, J.; Cooper, J.; Sun, M.; Zakharia, Y.; Spitz, D.; Dokun, A.; et al. Detectionof pro angiogenic and inflammatory biomarkers in patients with CKD. Sci. Rep. 2021, 11, 8786. [CrossRef]
11. Luczak, M.; Formanowicz, D.; Marczak, Ł.; Pawliczak, E.; Wanic-Kossowska, M.; Figlerowicz, M.; Stobiecki, M. Deeper insightinto chronic kidney disease-related atherosclerosis: Comparative proteomic studies of blood plasma using 2DE and massspectrometry. J. Transl. Med. 2015, 13, 20. [CrossRef] [PubMed]
12. Gansevoort, R.T.; de Jong, P.E. The Case for Using Albuminuria in Staging Chronic Kidney Disease. J. Am. Soc. Nephrol. 2009, 20,465–468. [CrossRef] [PubMed]
13. Rappsilber, J.; Mann, M.; Ishihama, Y. Protocol for micro-purification, enrichment, pre-fractionation and storage of peptides forproteomics using Stage Tips. Nat. Protoc. 2007, 2, 1896–1906. [CrossRef]
14. Fonseka, P.; Pathan, M.; Chitti, S.V.; Kang, T.; Mathivanan, S. FunRich enables enrichment analysis of OMICs datasets. J. Mol. Biol.2021, 433, 166747. [CrossRef] [PubMed]
15. Morpheus. Available online: https://software.broadinstitute.org/morpheus/ (accessed on 7 February 2022).16. Lee, P.-T.; Liao, I.-C.; Lee, C.-H.; Hsu, L.-W.; Liu, P.-Y. Expression of Vascular Cell Adhesion Molecule-1 in Peripheral Artery
Disease is Enriched in Patients with Advanced Kidney Disease. Acta Cardiol. Sin. 2021, 37, 591–599.17. Gasparin, A.A.; de Andrade, N.P.B.; Hax, V.; Palominos, P.E.; Siebert, M.; Marx, R.; Schaefer, P.G.; Veronese, F.V.; Monticielo, O.A.
Urinary soluble VCAM-1 is a useful biomarker of disease activity and treatment response in lupus nephritis. BMC Rheumatol.2020, 4, 67. [CrossRef]
18. Jia, Y.; Xu, H.; Yu, Q.; Tan, L.; Xiong, Z. Identification and verification of vascular cell adhesion protein 1 as an immune-relatedhub gene associated with the tubulointerstitial injury in diabetic kidney disease. Bioengineered 2021, 12, 6655–6673. [CrossRef]
19. Tramonti, G.; Ferdeghini, M.; Annichiarico, C.; Norpoth, M.; Donadio, C.; Bianchi, R.; Bianchi, C. Relationship between renalfunction and blood level of chromogranin A. Ren. Fail. 2001, 23, 449–457. [CrossRef]
20. Bech, P.R.; Ramachandran, R.; Dhillo, W.S.; Martin, N.M.; Bloom, S.R. Quantifying the Effects of Renal Impairment on PlasmaConcentrations of the Neuroendocrine Neoplasia Biomarkers Chromogranin A, Chromogranin B, and Cocaine- and Amphetamine-Regulated Transcript. Clin. Chem. 2012, 58, 941–943. [CrossRef]
21. Yu, H.; Wang, H.; Su, X.; Cao, A.; Yao, X.; Wang, Y.; Zhu, B.; Wang, H.; Fang, J. Serum chromogranin A correlated with albuminuriain diabetic patients and is associated with early diabetic nephropathy. BMC Nephrol. 2022, 23, 41. [CrossRef]
22. Zhang, H.; Chen, C.; Zhang, X.; Wang, Y.; Wan, H.; Chen, Y.; Zhang, W.; Xia, F.; Lu, Y.; Wang, N. Association between sexhormone-binding globulin and kidney function in men: Results from the SPECT-China study. Chin. Med. J. 2022. Available online:https://pubmed.ncbi.nlm.nih.gov/35170516/ (accessed on 3 March 2022).
23. Farrar, C.A.; Zhou, W.; Sacks, S.H. Role of the lectin complement pathway in kidney transplantation. Immunobiology 2016, 221,1068–1072. [CrossRef] [PubMed]
24. Sacks, S.H.; Zhou, W.; Pani, A.; Campbell, R.D.; Martin, J. Complement C3 gene expression and regulation in human glomerularepithelial cells. Immunology 1993, 79, 348–354. [PubMed]
25. Michels, M.A.H.M.; Volokhina, E.B.; van de Kar, N.C.A.J.; van den Heuvel, L.P.W.J. The role of properdin in complement-mediatedrenal diseases: A new player in complement-inhibiting therapy? Pediatr. Nephrol. 2019, 34, 1349–1367. [CrossRef] [PubMed]
26. Gaarkeuken, H.; Siezenga, M.A.; Zuidwijk, K.; van Kooten, C.; Rabelink, T.J.; Daha, M.R.; Berger, S.P. Complement activation bytubular cells is mediated by properdin binding. Am. J. Physiol. Physiol. 2008, 295, F1397–F1403. [CrossRef]
27. Wu, Y.; Yang, B. Erythropoietin Receptor/β Common Receptor: A Shining Light on Acute Kidney Injury Induced by Ischemia-Reperfusion. Front. Immunol. 2021, 12, 697796. [CrossRef]
28. Zhang, Y.; Meyer, N.C.; Fervenza, F.C.; Lau, W.; Keenan, A.; Cara-Fuentes, G.; Shao, D.; Akber, A.; Fremeaux-Bacchi, V.; Sethi, S.;et al. C4 Nephritic Factors in C3 Glomerulopathy: A Case Series. Am. J. Kidney Dis. 2017, 70, 834–843. [CrossRef]
29. Corvillo, F.; Bravo García-Morato, M.; Nozal, P.; Garrido, S.; Tortajada, A.; Rodríguez de Córdoba, S.; López-Trascasa, M. Serumproperdin consumption as a biomarker of C5 convertase dysregulation in C3 glomerulopathy. Clin. Exp. Immunol. 2016, 184,118–125. [CrossRef]
30. Thiel, S.; Jensen, L.; Degn, S.E.; Nielsen, H.J.; Gál, P.; Dobó, J.; Jensenius, J.C. Mannan-binding lectin (MBL)-associated serineprotease-1 (MASP-1), a serine protease associated with humoral pattern-recognition molecules: Normal and acute-phase levels inserum and stoichiometry of lectin pathway components. Clin. Exp. Immunol. 2012, 169, 38–48. [CrossRef]
31. Man-Kupisinska, A.; Michalski, M.; Maciejewska, A.; Swierzko, A.S.; Cedzynski, M.; Lugowski, C.; Lukasiewicz, J. A NewLigand-Based Method for Purifying Active Human Plasma-Derived Ficolin-3 Complexes Supports the Phenomenon of Crosstalkbetween Pattern-Recognition Molecules and Immunoglobulins. PLoS ONE 2016, 11, e0156691. [CrossRef]
32. Smedbråten, Y.V.; Sagedal, S.; Mjøen, G.; Hartmann, A.; Fagerland, M.W.; Rollag, H.; Mollnes, T.E.; Thiel, S. High Ficolin-3 Levelat the Time of Transplantation Is an Independent Risk Factor for Graft Loss in Kidney Transplant Recipients. Transplantation 2015,99, 791–796. [CrossRef]
33. Graw, J.A.; Hildebrandt, P.; Krannich, A.; Balzer, F.; Spies, C.; Francis, R.C.; Kuebler, W.M.; Weber-Carstens, S.; Menk, M.;Hunsicker, O. The role of cell-free hemoglobin and haptoglobin in acute kidney injury in critically ill adults with ARDS andtherapy with VV ECMO. Crit. Care 2022, 26, 50. [CrossRef] [PubMed]
34. Anderberg, R.J.; Dieter, B.P.; Meek, R.L.; Tuttle, K.R. An Inflammatory Nexus: Serum Amyloid A and inflammation in DiabeticKidney Disease. Inflamm. Cell Signal. 2015, 2, 1–5.
Biomedicines 2022, 10, 1522 15 of 16
35. Anderberg, R.J.; Meek, R.L.; Hudkins, K.L.; Cooney, S.K.; Alpers, C.E.; Leboeuf, R.C.; Tuttle, K.R. Erratum: Serum amyloid A andinflammation in diabetic kidney disease and podocytes. Lab Investig. 2015, 95, 697. [CrossRef] [PubMed]
36. Madhusudhana Rao, A.; Anand, U.; Anand, C.V. Myeloperoxidase in Chronic Kidney Disease. Indian J. Clin. Biochem. 2011, 26,28–31. [CrossRef]
37. Choi, H.-M.; Kwon, Y.-E.; Kim, S.; Oh, D.-J. Changes in FGF-23, Neutrophil/Platelet Activation Markers, and Angiogenin inAdvanced Chronic Kidney Disease and Their Effect on Arterial Stiffness. Kidney Blood Press Res. 2019, 44, 1166–1178. [CrossRef]
38. Mami, I.; Bouvier, N.; El Karoui, K.; Gallazzini, M.; Rabant, M.; Laurent-Puig, P.; Li, S.; Tharaux, P.L.; Beaune, P.; Thervet, E.;et al. Angiogenin Mediates Cell-Autonomous Translational Control under Endoplasmic Reticulum Stress and Attenuates KidneyInjury. J. Am. Soc. Nephrol. 2016, 27, 863–876. [CrossRef]
39. Gacche, R.N. Compensatory angiogenesis and tumor refractoriness. Oncogenesis 2015, 4, e153. [CrossRef]40. Dutta, S.; Bandyopadhyay, C.; Bottero, V.; Veettil, M.V.; Wilson, L.; Pins, M.R.; Johnson, K.E.; Warshall, C.; Chandran, B.
Angiogenin interacts with the plasminogen activation system at the cell surface of breast cancer cells to regulate plasminformation and cell migration. Mol. Oncol. 2014, 8, 483–507. [CrossRef]
41. Mulay, S.R.; Eberhard, J.N.; Pfann, V.; Marschner, J.A.; Darisipudi, M.N.; Daniel, C.; Romoli, S.; Desai, J.; Grigorescu, M.; Kumar,S.V.; et al. Oxalate-induced chronic kidney disease with its uremic and cardiovascular complications in C57BL/6 mice. Am. J.Physiol. Physiol. 2016, 310, F785–F795. [CrossRef]
42. Kennedy-Lydon, T.M.; Crawford, C.; Wildman, S.S.P.; Peppiatt-Wildman, C.M. Renal pericytes: Regulators of medullary bloodflow. Acta Physiol. 2013, 207, 212–225. [CrossRef]
43. Gagnon, M.L.; Bielenberg, D.R.; Gechtman, Z.; Miao, H.-Q.; Takashima, S.; Soker, S.; Klagsbrun, M. Identification of a naturalsoluble neuropilin-1 that binds vascular endothelial growth factor: In vivo expression and antitumor activity. Proc. Natl. Acad Sci.USA 2000, 97, 2573–2578. [CrossRef] [PubMed]
44. Vadasz, Z.; Ben-Izhak, O.; Bejar, J.; Sabo, E.; Kessel, A.; Storch, S.; Toubi, E. The involvement of immune semaphorins andneuropilin-1 in lupus nephritis. Lupus 2011, 20, 1466–1473. [CrossRef] [PubMed]
45. Mezu-Ndubuisi, O.J.; Maheshwari, A. The role of integrins in inflammation and angiogenesis. Pediatr. Res. 2021, 89, 1619–1626.[CrossRef] [PubMed]
46. Kennedy, D.J.; Fan, Y.; Wu, Y.; Pepoy, M.; Hazen, S.L.; Tang, W.H.W. Plasma Ceruloplasmin, a Regulator of Nitric Oxide Activity,and Incident Cardiovascular Risk in Patients with CKD. Clin. J. Am. Soc. Nephrol. 2014, 9, 462–467. [CrossRef]
47. Lazzaro, M.; Bettegazzi, B.; Barbariga, M.; Codazzi, F.; Zacchetti, D.; Alessio, M. Ceruloplasmin potentiates nitric oxide synthaseactivity and cytokine secretion in activated microglia. J. Neuroinflammation 2014, 11, 164. [CrossRef]
48. Wang, Q.; Gao, H.; Liang, Y.; Zhang, J.; Wang, J.; Qiu, J. Cofilin1 is involved in hypertension-induced renal damage via theregulation of NF-κB in renal tubular epithelial cells. J. Transl. Med. 2015, 13, 323. [CrossRef]
49. Coskun, A.; Ucal, Y.; Berber, I.; Çakır, Ü.; Serteser, M.; Moldur, D.E.; Derelioglu, E.I.; Yozgatlı, T.K.; Özpınar, A.; Ünsal, I. Cofilin-1as a potential biomarker to evaluate acute kidney injury. Turk. J. Biochem. 2019, 44, 9–15. [CrossRef]
50. Gao, Y.; Wu, K.; Xu, Y.; Zhou, H.; He, W.; Zhang, W.; Cai, L.; Lin, X.; Fang, Z.; Luo, Z.; et al. Characterization of acute renalallograft rejection by human serum proteomic analysis. J. Huazhong Univ. Sci. Technol. (Med. Sci.) 2009, 29, 585–591. [CrossRef]
51. Speeckaert, M.; Huang, G.; Delanghe, J.R.; Taes, Y.E.C. Biological and clinical aspects of the vitamin D binding protein (Gc-globulin) and its polymorphism. Clin. Chim. Acta. 2006, 372, 33–42. [CrossRef]
52. Kalousova, M.; Dusilova-Sulkova, S.; Zakiyanov, O.; Kostirova, M.; Safranek, R.; Tesar, V.; Zima, T. Vitamin D Binding Protein IsNot Involved in Vitamin D Deficiency in Patients with Chronic Kidney Disease. Biomed Res. Int. 2015, 2015, 492365. [CrossRef]
53. Wang, J.J.; Zhang, S.X.; Mott, R.; Chen, Y.; Knapp, R.R.; Cao, W.; Ma, J.X. Anti-inflammatory effects of pigment epithelium-derivedfactor in diabetic nephropathy. Am. J. Physiol. Physiol. 2008, 294, F1166–F1173. [CrossRef] [PubMed]
54. Motomiya, Y.; Yamagishi, S.; Adachi, H.; Abe, A. Increased Serum Concentrations of Pigment Epithelium-Derived Factor inPatients with End-Stage Renal Disease. Clin. Chem. 2006, 52, 1970–1971. [CrossRef] [PubMed]
55. Yamagishi, S.; Matsui, T. Pigment Epithelium-derived Factor (PEDF) and Cardiometabolic Disorders. Curr. Pharm. Des. 2014, 20,2377–2386. [CrossRef]
56. Feige, J.-J.; Negoescu, A.; Keramidas, M.; Souchelnitskiy, S.; Chambaz, E.M. Alpha-2-Macroglobulin: A Binding Protein forTransforming Growth Factor-β and Various Cytokines. Horm. Res. Paediatr. 1996, 45, 227–232. [CrossRef] [PubMed]
57. Lagrange, J.; Lecompte, T.; Knopp, T.; Lacolley, P.; Regnault, V. Alpha-2-macroglobulin in hemostasis and thrombosis: Anunderestimated old double-edged sword. J. Thromb. Haemost. 2022, 20, 806–815. [CrossRef] [PubMed]
58. Yang, A.H.; Chen, J.Y. Glomerular deposition of alpha 2-macroglobulin in glomerular diseases. Nephrol. Dial. Transplant. 1997, 12,465–469. [CrossRef] [PubMed]
59. lu, X.-M.; Ma, L.; Jin, Y.-N.; Yu, Y.-Q. Lumican overexpression exacerbates lipopolysaccharide-induced renal injury in mice. Mol.Med. Rep. 2015, 12, 4089–4094. [CrossRef]
60. Vij, N.; Roberts, L.; Joyce, S.; Chakravarti, S. Lumican Regulates Corneal Inflammatory Responses by Modulating Fas-Fas LigandSignaling. Investig. Opthalmology Vis. Sci. 2005, 46, 88. [CrossRef]
61. Krishnan, A.; Li, X.; Kao, W.-Y.; Viker, K.; Butters, K.; Masuoka, H.; Knudsen, B.; Gores, G.; Charlton, M. Lumican, an extracellularmatrix proteoglycan, is a novel requisite for hepatic fibrosis. Lab Investig. 2012, 92, 1712–1725. [CrossRef]

Biomedicines 2022, 10, 1522 16 of 16
62. Neiman, M.; Hedberg, J.J.; Dönnes, P.R.; Schuppe-Koistinen, I.; Hanschke, S.; Schindler, R.; Uhlén, M.; Schwenk, J.M.; Nilsson, P.Plasma Profiling Reveals Human Fibulin-1 as Candidate Marker for Renal Impairment. J. Proteome. Res. 2011, 10, 4925–4934.[CrossRef]
63. Barbagallo, C.M.; Cefalù, A.B.; Giammanco, A.; Noto, D.; Caldarella, R.; Ciaccio, M.; Averna, M.R.; Nardi, E. LipoproteinAbnormalities in Chronic Kidney Disease and Renal Transplantation. Life 2021, 11, 315. [CrossRef] [PubMed]
64. Kwon, S.; Kim, D.K.; Oh, K.-H.; Joo, K.W.; Lim, C.S.; Kim, Y.S.; Han, S.S. Apolipoprotein B is a risk factor for end-stage renaldisease. Clin. Kidney J. 2021, 14, 617–623. [CrossRef] [PubMed]
65. Boes, E.; Fliser, D.; Ritz, E.; König, P.; Lhotta, K.; Mann, J.F.E.; Müller, G.A.; Neyer, U.; Riegel, W.; Riegler, P.; et al. ApolipoproteinA-IV Predicts Progression of Chronic Kidney Disease: The Mild to Moderate Kidney Disease Study. J. Am. Soc. Nephrol. 2006, 17,528–536. [CrossRef]
66. Diz, A.P.; Truebano, M.; Skibinski, D.O.F. The consequences of sample pooling in proteomics: An empirical study. Electrophoresis2009, 30, 2967–2975. [CrossRef] [PubMed]
67. Muñoz, E.M.; Linhardt, R.J. Heparin-Binding Domains in Vascular Biology. Arterioscler. Thromb. Vasc. Biol. 2004, 24, 1549–1557.[CrossRef] [PubMed]
68. Gandhi, N.S.; Mancera, R.L. Prediction of heparin binding sites in bone morphogenetic proteins (BMPs). Biochim. Biophys. ActaProteins Proteom. 2012, 1824, 1374–1381. [CrossRef]
69. Ori, A.; Free, P.; Courty, J.; Wilkinson, M.C.; Fernig, D.G. Identification of Heparin-binding Sites in Proteins by Selective Labeling.Mol. Cell Proteom. 2009, 8, 2256–2265. [CrossRef]
70. Casu, B.; Naggi, A.; Torri, G. Heparin-derived heparan sulfate mimics to modulate heparan sulfate-protein interaction ininflammation and cancer. Matrix Biol. 2010, 29, 442–452. [CrossRef]
71. Aviezer, D.; Levy, E.; Safran, M.; Svahn, C.; Buddecke, E.; Schmidt, A.; David, G.; Vlodavsky, I.; Yayon, A. Differential structuralrequirements of heparin and heparan sulfate proteoglycans that promote binding of basic fibroblast growth factor to its receptor.J. Biol. Chem. 1994, 269, 114–121. [CrossRef]
72. Alberdi, E.; Hyde, C.C.; Becerra, S.P. Pigment Epithelium-Derived Factor (PEDF) Binds to Glycosaminoglycans: Analysis of theBinding Site. Biochemistry 1998, 37, 10643–10652. [CrossRef]
73. Palhares, L.C.G.F.; London, J.A.; Kozlowski, A.M.; Esposito, E.; Chavante, S.F.; Ni, M.; Yates, E.A. Chemical Modification ofGlycosaminoglycan Polysaccharides. Molecules 2021, 26, 5211. [CrossRef] [PubMed]
74. Wang, S.; Chi, K.; Wu, D.; Hong, Q. Insulin-Like Growth Factor Binding Proteins in Kidney Disease. Front. Pharmacol. 2021, 12,807119. [CrossRef] [PubMed]
75. Oh, Y. The insulin-like growth factor system in chronic kidney disease: Pathophysiology and therapeutic opportunities. KidneyRes. Clin. Pract. 2012, 31, 26–37. [CrossRef] [PubMed]