Who Supports the ECB? Evidence from Eurobarometer Survey Data
36
Department of Economics © Henley Business School, University of Reading 2012 Who Supports the ECB? Evidence from Eurobarometer Survey Data Who Supports the ECB? Evidence from Eurobarometer Survey Data by by Etienne Farvaque, Etienne Farvaque, Muhammad Azmat Hayat Muhammad Azmat Hayat and Alexander Mihailov and Alexander Mihailov 2011 092 Revised: October 2012 Department of Economics University of Reading Whiteknights Reading RG6 6AA United Kingdom www.reading.ac.uk
-
Upload
univ-lehavre -
Category
Documents
-
view
4 -
download
0
Transcript of Who Supports the ECB? Evidence from Eurobarometer Survey Data

gareth.jones Section name
Department of Economics
© Henley Business School, University of Reading 2012
Who Supports the ECB? Evidence from Eurobarometer Survey Data
Who Supports the ECB? Evidence from Eurobarometer Survey Data
by by Etienne Farvaque, Etienne Farvaque, Muhammad Azmat Hayat Muhammad Azmat Hayat and Alexander Mihailov and Alexander Mihailov
2011 092 Revised: October 2012 Department of Economics University of Reading Whiteknights Reading RG6 6AA United Kingdom www.reading.ac.uk


Who Supports the ECB?Evidence from Eurobarometer Survey Data
Etienne Farvaque∗, Muhammad Azmat Hayat† and Alexander Mihailov‡
October 2012§
Abstract
This paper contributes empirically to the long-debated issue of the legitimacy ofthe European Central Bank (ECB) with regard to European polities. Using micro-level data from the Eurobarometer survey, we shed light on the socio-demographicdeterminants of public-opinion support for the ECB. We find that people with higherlevel of education and income and centre to right-wing political orientation tend tosupport the ECB, as well as people with optimistic expectations on the economicsituation. By contrast, the unemployed tend to distrust the ECB. The policy relev-ance of such results is important for ECB’s communication strategy with the generalpublic.
JEL Classification: C23, E58, F33, H11, Z13Keywords: institutional trust, Eurobarometer survey, European Central Bank,
European (Monetary) Union, quasi-panel logistic regression
∗Corresponding author: EDEHN – Université du Havre, Faculté des Affaires Internationales, 25 rue Phil-ippe Lebon BP 1123, 76063 Le Havre Cedex, and Skema Business School, France; [email protected]†Department of Economics, University of the Punjab, Quaid-i-Azam Campus, Lahore, Pakistan;
[email protected]‡Department of Economics, University of Reading, Whiteknights, Reading RG6 6AA, United Kingdom;
[email protected]§First draft: June 2010. This is a revised version of Economics & Management Discussion Paper 2011-
092, Henley Business School, University of Reading (July 2011). We acknowledge particularly stimulatingcomments from Riccardo Rovelli. We also thank Gunther Capelle-Blancard, Jézabel Couppey-Soubeyran,Hakim Hammadou, Jérôme Héricourt, Julien Idier, Clemens Kool, Bertrand Maillet, Mathias Morys, Man-fred Neumann, Kerry Patterson, Agnès Bénassy-Quéré, Koen Schoors, Pierre Siklos, Karsten Staehr, Sté-phane Vigeant and the audiences at the joint University of Paris 1 (Panthéon – Sorbonne) & Banque deFrance workshop in monetary theory (March 2011), at the annual conferences of the Irish Economic As-sociation in Limerick (April 2011), the Eurasia Business and Economics Society in Istanbul (June 2011),and the GdRE/CNRS in Money, Banking and Finance in Reading (June 2011), as well as at the RussianSummer School on Institutional Economics in Moscow (July 2011) and the Europsymposium conferencein Bayreuth (January 2012). Farvaque has benefited from the financial support of the ANR–JSPS Chorusprogram. Hayat thanks the Higher Education Commission (HEC) of Pakistan for their financial support.Mihailov is grateful to the University of Lille 1 for granting him an invited professorship that facilitated thework along the project. The usual disclaimer for any remaining errors and omissions applies.
Contents
1 Introduction 1
2 Evolution of Trust in the ECB: Data and Statistical Summary 42.1 Measuring Trust in the ECB from the Eurobarometer Survey . . . . . . . 42.2 Evolution of Trust in the ECB across Time and Country Subsamples . . . 6
3 Determinants of Trust in the ECB: Econometric Estimation 73.1 Variables Entering the Logistic Regressions . . . . . . . . . . . . . . . . . 73.2 Baseline Empirical Results . . . . . . . . . . . . . . . . . . . . . . . . . . 103.3 Robustness Checks . . . . . . . . . . . . . . . . . . . . . . . . . . . . . . 14
4 Concluding Comments 16
List of Figures
1 Average Support for the ECB by Country – All EU27, 1999-2004-2011 . . 202 Trust in the ECB by Country – Old EU15, 1999-2011 . . . . . . . . . . . 213 Trust in the ECB by Country – New EU12, 2004-2011 . . . . . . . . . . . 214 Distribution of Trust in the ECB – Old EU15, 1999-2004 . . . . . . . . . 225 Distribution of Trust in the ECB – All EU27, 2004-2011 . . . . . . . . . . 226 Distribution of Trust in the ECB – Old EU15 and All EU27, 1999-2004-2011 23
List of Tables
1 Eurobarometer Data Coverage by Survey Wave . . . . . . . . . . . . . . 242 Eurobarometer Data Coverage by Country . . . . . . . . . . . . . . . . . 243 Trust in the ECB by Socio-Demographic Category – Summary Statistics . 254 Trust in the ECB by Country Subgroup – Descriptive Statistics . . . . . . 265 Baseline Logistic Regressions – Old EU15 . . . . . . . . . . . . . . . . . 276 Baseline Logistic Regressions – New EU12 and All EU27 . . . . . . . . . 287 Robustness Checks – Non-EMU EU Subsample with Inflation Differentials 298 Robustness Checks – EMU Subsample with Expected Inflation . . . . . . 309 Robustness Checks – All EU27 with National vs Euro-Area Inflation . . . 3110 Evolution of Trust in the ECB after the Financial Crisis – All EU27 . . . . 32

Who Supports the ECB? 1
1 Introduction
Price stability has been the main goal of central banks since the high-inflation experi-ence known even in developed economies in the 1970s and up until the recent globalfinancial crisis. Accordingly, monetary authorities across the world have been granted aconsiderable degree of – mostly, operational – independence (Crowe and Meade, 2007;Arnone et al., 2009; Carlstrom and Fuerst, 2009). More precisely, many governmentshave chosen to delegate monetary policy and/or commit to inflation targets in order toincrease policy credibility and arrive at a lower rate of average inflation.
However, there is an inherent risk in delegating monetary policy and, for the del-egation to be sustainable, one needs to ensure at least the medium-and-long run com-patibility of monetary policy with the society’s preferences. This is all the more obviousand important right now, when the global financial crisis and the Euro-area debt sus-tainability problems have undermined the policies and reputation of perhaps the mostindependent central bank in the world, the European Central Bank (ECB). Under cir-cumstances like those the independence of monetary authorities is being confrontedwith doubts and criticism from politicians.1 Such attacks on the technocratic autonomyof central banks could be seriously threatening or impairing the effectiveness of theirpresent and future policies, as well as their anchoring role regarding market inflationexpectations. In particular for a supranational institution as the ECB, whose powers areonly limited by the Treaty of Maastricht and not by any given national government orparliament, its legitimacy is at stake.
Of course, these considerations rely on the incentives of politicians to bash the cent-ral bank and to exercise pressures on it. Hence, the larger the support from the pop-ulation, the lower the risk for the central bank to be threatened. Public support isparticularly relevant and pressing for a young institution such as the European CentralBank, the more so in the wake of the deepest depression for nearly a century. It stillstands accused of a lack of accountability – and, consequently, of misaligned interestsand policies with respect to national governments and electorates, especially during thefinancial and Euro-debt crisis. In a nutshell, if people trust the ECB, although such sup-port would be most likely sensitive to the business cycle (Stevenson and Wolfers, 2011),then its legitimacy as an institution and the credibility of its monetary policy will behigher; in addition, the attraction of the Euro as a world currency, and/or of the Euro-area for candidate countries will be stronger too. It can furthermore be argued thattrust in the ECB and support for its policy could be enhanced by active communicationwith the European polities explaining its objectives, constraints, instruments and effects.Communication by central banks is gaining increasing importance in policymaking. Aclear and transparent communication strategy is essential if the population’s support fora central bank’s policy declines, as it seems to be the case in the recent years, and notjust in Europe. But, as Blinder et al. (2008) show, there still exists large variation incommunication strategies across central banks, and no consensus has shaped out eitheron an optimal communication strategy or on an optimal degree of transparency.
In the case of the European Central Bank which we explore here, though some pa-pers have attempted to check how its communication is received by the markets, veryfew have been able to ascertain the width of the support for the ECB in the European
1On the anecdotal side, this is illustrated by the ‘End the Fed’ campaign of US Congressman and formerpresidential candidate Ron Paul or by former French President Nicolas Sarkozy who criticized repeatedlythe ECB during his election campaigns in 2007 and 2012. On the empirical side, among others, Havrilesky(1991) and Mixon and Gibson (2002), but also Coleman (2001) and Siklos (2010) document the fact of‘signaling’ from political leaders to central bankers. On the theoretical side, Lohmann (1992) has demon-strated that, in some situations such as the occurrence of a negative supply shock, the probability of aconflict between the government and the central bank increases.

2 Farvaque, Hayat and Mihailov (Revised: October 2012)
population at large. For example, studying the pattern of communication strategiesof several central banks, Ehrmann and Fratzscher (2007) find that the ECB GoverningCouncil members step up the frequency of communication if there is a need to explainthe monetary policy decision taken in the preceding Governing Council meeting. Whilethey show that financial markets tend to respond significantly stronger to communica-tion prior to interest rate changes, their evidence is limited to financial markets’ reac-tions. Extending the scope, Maier and Bezoen (2004) argue that external pressure onthe ECB stems mainly from politicians or from international organizations such as theInternational Monetary Fund (IMF). Moreover, in contrast with their own evidence forthe Bundesbank, they also establish that interest groups (such as commercial banks)hardly attempt to influence European monetary policy.2
Notwithstanding their intrinsic interests, these papers have focused on given seg-ments of the population, while it can certainly be affirmed that monetary policy impactseveryone’s everyday life. Starting from such a premise, the study of attitudes and val-ues is now recognized as an important source of information for economists, and theavailability of the Eurobarometer survey data has put the European integration processunder the magnifying glass more than once (see, e.g., Gabel, 1998, or Nelsen and Guth,2000). Concerning monetary issues in particular, the emergence of the Euro as a cur-rency and its popular support has been examined, among others, by Gärtner (1997),Hayo (1999) and Jonung (2004). But the trust of the Europeans in the ECB based onthe socio-demographic determinants of their support for it has not yet been exhaustivelyexplored. In fact, such literature is only emerging, and consists of the few papers werefer to as being the closest to our work here below.
Kaltenthaler and Anderson (2001) analyze the support for a European monetarypolicy, but in a sample over 1994–1997 when the single currency was not yet born.Using the data from Eurobarometer waves 41-47, they conclude that national attitudesdominate, and that the more people are attached to their national identity, the lowertheir support for a common currency. An exploration along similar lines but larger inscope is attempted by Hudson (2006), who presents some evidence with respect to trust,showing that changes in an individual’s personal circumstances can also have an impacton trust. Importantly, trust appears to build over time, experience being a key driver ofone’s trust. For example, unemployed people tend to have lower levels of trust not onlyin the main economic institutions, but in other state institutions too, such as the policeand the law. Trust also differs in a systematic manner with respect to education andhousehold income. Age too has an impact on trust: it tends to increase as people growolder. Hudson (2006) also provides some evidence on trust in the ECB, showing that thestandard socio-demographic variables are significant for trust. However, the data usedis for year 2001 only.
Banducci et al. (2009) examine the evolution of trust in the Euro, analyzing howthe inflationary effects of the transition to the new currency have been perceived bythe Europeans. They show that rising prices have reduced the support for the Euro,although most of the surveyed people (two-thirds) still have a positive opinion of thenew currency. While this study is somewhat related to ours, its coverage (2000–2007)and focus (on the Euro, and not on the European Central Bank) are more limited. Yetvery recently Kaltenthaler et al. (2010) have evaluated the distrust of the public opinionin the ECB. They find that the distrust towards the ECB is stronger when people considerthat the bank is too autonomous to reflect their own preferences. Their results show in
2See also Maier et al. (2002) and Maier and Knapp (2002) for analyses of, respectively, the politicalpressure on, and the support for, the Deutsche Bundesbank. There is, to our knowledge, no equivalent studyfor the US, although Carvalho and Nechio (2012) look at the way lay people and professional forecastersunderstand monetary policy, would the Fed follow a Taylor rule.

Who Supports the ECB? 3
particular that women are less likely to trust the ECB, whereas being older, and having ahigher education level improved the score. More surprisingly, at the background of theextant literature on public support, they find no significant statistical evidence of a rolefor unemployment, religious belief, and political orientation. However, differently fromour work here, they rely on a single survey wave (Eurobarometer 65.2 of 2006) and donot consider inflation as an explanatory variable. Moreover, distrust is considered withregard to the degree of independence the ECB enjoys, and not with regard to the policyit implements.
Fischer and Hahn (2008) also measure trust in the ECB from answers to the Euroba-rometer opinion polls conducted on representative samples of the whole European pop-ulation. Using the proportion of trust in the ECB as their dependent variable, they showthat higher inflation reduces the trust in this institution. They also find that (lagged)national income, proxied by GDP per capita, and GDP growth both influence trust inthe ECB positively, while unemployment-related variables do not seem to have an ef-fect. Their study, however, considers only macro-determinants of the support for theECB. Roth (2009), Gros and Roth (2010), Ehrmann et al. (2010) and Wälti (2012) haverevisited such findings, yet focusing on the impact of the recent financial crisis on thesupport for the ECB, and argue that the banking distress and the fiscal turmoils haveaffected negatively the degree of trust in the ECB. Their results are in line with theprocyclical nature of trust in institutions highlighted by Stevenson and Wolfers (2011).
In a related empirical study Berggren et al. (2012) explore social trust as a keydeterminant of central bank independence. They summarize the large and growing lit-erature on trust, pointing out to the distinction between social trust and particularizedtrust (Bjørnskov, 2007). Their focus is on social trust, understood as capturing the basicoutlook on people in general, unrelated to information about specific persons or organiz-ations. Berggren et al. (2012) find a U-shaped link between central bank independenceand social trust: at low trust levels, the need for central bank independence in a societyis strong enough and dominates its low ability to implement reforms; at high trust levelsthe ability for reforms is high and dominates the low need; at intermediate trust levelsthere is neither need nor ability strong enough to generate independent central banks.By contrast, our interest here is in studying the socio-demographic determinants of par-ticularized trust, more precisely as reflected in the survey-documented public opinionon a specific supranational and very influential institution, the ECB. To narrow downfurther our domain of investigation, we focus on institutional trust that is delimited bythe question of how an institution, the ECB in particular, would benefit individuals, theEuropean citizens in particular. This may be denoted as a utilitarian dimension of insti-tutional trust that is important in economic and monetary decisions, but it is certainlynot the only aspect of trust worth examining.
While the above-cited papers appear to be the closest to ours, our approach is em-pirically more encompassing. We rely on micro-level data with the aim to elicit from theEurobarometer survey responses the most relevant socio-demographic determinants ofsupport for the ECB (i) over its entire history back to 1999 and (ii) covering all currentEU members (27 countries). One has to bear in mind that all EU members are supposedto adopt the single currency (except Denmark and the United Kingdom, which bene-fit from a special status). This perspective justifies the use of data not only from thepresent Euro-area members but also from the whole EU. Consequently, we hypothesizethat such individual characteristics would matter beyond the national business cycle inenhancing or not the trust of the European public in the ECB. We, therefore, apply apseudo-panel logistic regression model with both country fixed effects and time fixedeffects that isolates the variation in the data due to unobserved time-invariant cross-country heterogeneity or common shocks and enables us to focus on which among the

4 Farvaque, Hayat and Mihailov (Revised: October 2012)
socio-demographic individual characteristics we are interested in matter most in influ-encing the trust of the Europeans in the ECB.
Analyzing statistically the trust different segments of the population accord to theECB and its evolution over time and across groups of countries, we present evidencethat people with higher level of income and education and centre to right-wing politicalorientation tend to support a conservative institution such as the ECB, mostly becauseof a tighter alignment of views and interests. It may not come as a surprise that theunemployed are among the socio-demographic groups that distrust the ECB the most,together with the bottom quartiles of the income distribution and the people with theminimum level of education. However, the main import of the present paper is to es-tablish that socio-demographic determinants of the trust of the European population inthe ECB matter in a strong way, in addition and beyond the influence of inflation orother macrovariables revealed in other studies. Consequently, our findings can help theECB to better formulate and implement its communication strategy with the EU publicin order to ensure its longer-run legitimacy, recently endangered by the EMU debt crisisand the global depression, as our results also show.
The paper is structured as follows. The next section presents our data by a generalstatistical analysis of the evolution of trust in the ECB extracted from the Eurobarometerwaves. Against this background, section 3 first motivates the socio-demographic determ-inants of trust in the ECB, the macroeconomic control variables, and the econometricmethodology we employ, namely, survey-based pseudo-panel logistic regressions; it thendiscusses our baseline estimation results and reports appropriate robustness checks. Weconclude by summarizing our key empirical findings and their policy implications.3
2 Evolution of Trust in the ECB: Data and Statistical Summary
Our data comes from the Eurobarometer survey. This survey, dealing with issues of gen-eral interest, is conducted on behalf of the European Commission since 1973. The resultsare published in Eurobarometer and are now made available on the Gesis website.4
2.1 Measuring Trust in the ECB from the Eurobarometer Survey
We have used Eurobarometer surveys 52.0 (November 1999) through 75.3 (May 2011),selecting those waves of the survey that include the question on trust in the ECB we areinterested in. Table 1 provides the exact details.
[Table 1 about here]
The waves of the survey we employ cover all current EU member countries. Table 2lists them by subgroup, as well as the relevant period coverage.
[Table 2 about here]
Among other questions, the respondents are asked about the importance of the majorEuropean institutions, including the ECB, and their trust in them, in particular in theECB (Question n◦ 28_6 in Eurobarometer 52.0), which is of our direct interest here, asfollows:
3For replication purposes, our Stata dataset, codes and estimation output are available upon request.4http://zacat.gesis.org/webview/index.jsp

Who Supports the ECB? 5
“Q.28 And, for each of them, please tell me if you tend to trust it or tend not totrust it?
Q.28_6 The European Central Bank”
The responses are recorded in the following way: 1 for ‘Tend to trust’, 2 for ‘Tend notto trust’, and 3 for ‘Don’t know’. We measure the trust in the European Central Bank bytransforming this categorical variable into a binary one, excluding the responses coded3 that do not express an opinion. The binary discrete choice variable thus obtained be-comes our dependent variable in the logistic regressions we report later on. However,just excluding the ‘Don’t know’ category raises a problem, as people could be more in-terested in economic matters when things turn bad. Looking at the data, we confirmthis cyclical nature of trust in the ECB: fewer people declare themselves in this thirdcategory near the end of our sample period. Moreover, it may also be that people decidefirst to express an opinion or not, and then on what their opinion would be, creatinga potential sample selection bias (no matter that the survey sample would be designedas random). For these reasons our main estimation was complemented by two altern-ative ones, relying on standard techniques in similar studies: (i) imputation to handlemissing data in a way resulting in valid statistical inference (Rubin, 1987); (ii) two-stepcorrection for sample selection bias (Heckman, 1976, 1979). Both alternative estima-tion methods delivered qualitatively similar results, and we return to them with moredetail in the robustness analysis further below.
We have divided our country sample into two groups: ‘old EU15’ are the older 15EU member states for which data is available in the Eurobarometer survey from 1999through 2011; while 10 of the ‘new EU12’ joined EU in 2004 and two5 in 2007, anddata for the new EU12 countries is available in the Eurobarometer survey as from 2004.
Attitudes by country towards trust in the ECB are illustrated in Figure 1, in termsof the proportion of those respondents who trust the central bank, taken as a long-runaverage across the (relevant, for each EU member state) Eurobarometer survey waves.
[Figure 1 about here]
This average level of trust in the ECB is higher in the Netherlands (1999-2011) andMalta and Estonia (2004-2011), where close to 80% of the respondents tend to trustthe ECB, while in the United Kingdom (1999-2011), by contrast, only a bit more than40% of the people admit they trust the ECB. Note, however, that except in the UnitedKingdom, in all remaining countries in our sample the (average, across the relevantwaves) support for the ECB according to the Eurobarometer survey exceeds half of therespondents. In the top half of our sample in Figure 1, the average support for theECB is stronger than two-thirds of the respondents by nation. From this, it appearsthat the ECB enjoys high credibility among the European population. As clear from thefigure too, the level of trust of people living in countries which joined the EU in 2004or 2007 is generally higher than that in its founding members. Another important factapparent from Figure 1 is that Denmark and Bulgaria are two non-Euro-area countrieswhich are among the top ten countries with high average trust in the ECB.6 This justifiesfurther our decision to consider the non-Euro-area countries in our analysis, as well asto examine possible differences of exchange rate peggers versus floaters among them.
5Bulgaria and Romania.6Note, however, that both these countries maintain a fixed exchange rate regime of their national cur-
rencies to the Euro, so they are de facto in the Euro-area and ECB’s monetary policy affects them directly.

6 Farvaque, Hayat and Mihailov (Revised: October 2012)
2.2 Evolution of Trust in the ECB across Time and Country Subsamples
We first look at the annual evolution of the level of trust in the ECB by individual countryin our two subsamples of EU member countries, the old EU15 and the new EU12, asdocumented by the Eurobarometer survey data plotted in figures 2 and 3, respectively.
[Figures 2 and 3 about here]
A considerable amount of variation is exhibited in the old EU15 subsample, whilethe level of trust in the new EU12 subsample is less dispersed, and remaining above 60percent until 2008. A drop in the trust in the ECB that can be attributed to the financialcrisis is observed after 2008 in all EU27 member states. On an individual country level,figures 2 and 3 reveal that the lowest trust in the ECB, though fluctuating, has beensystematically recorded in the UK, followed by France, and recently Greece, among theold EU15, whereas the highest level of support for the central bank has been attained inthe Netherlands, Ireland before the 2008 banking crisis there, and Denmark after 2005;among the new EU12, the trust in the ECB has persistently been weak and declining inLatvia and Hungary, while remaining high, yet also declining, in Estonia and Malta.
[Tables 3 and 4 about here]
We now briefly discuss the key features of our data in terms of summary statist-ics characterizing the evolution of the distribution of the support for the ECB. Table 3provides a first glance on the trust summary statistics in the Eurobarometer survey acrossits main socio-demographic categories and groupings within. The respective means sug-gest, in a preview before any econometric estimation to check for statistical significance,a broad picture of who supports the ECB more, and who less, consistent with most ofour results highlighted in the introduction. Table 4 then reports the descriptive statist-ics characterizing the support for the ECB by key subgroups and corresponding surveywaves, also thus outlining the evolving trends in its distribution. These trends and theshape of the distribution over time are illustrated in the several figures we commentnext.
[Figures 4 and 5 about here]
Figure 4 illustrates, in terms of boxplot diagrams, the change in the distribution oftrust in the ECB by the old EU15 countries between the earliest Eurobarometer wave inour dataset, of Oct-Nov 1999 (Eurobarometer 52.0), and Feb-Mar 2004 (Eurobarometer61.0), the last wave before the new EU member states were included too. It is clearthat trust in the ECB by the EU15 has become stronger during 1999-2004 (the meangoes up from 66.14% to 68.44% and the median from 64.00% to 67.13%) and lessdispersed (the standard deviation falls from 12.20% to 9.78%, and the maximum fallswhereas the minimum rises, thus decreasing the spread between them from 49 down to35 percentage points). This reveals a build-up of credibility by the newly-created ECB.
Figure 5 illustrates, in turn, the corresponding change in the distribution of trust inthe ECB by all EU27 countries between the earliest Eurobarometer wave in our datasetwhere data on trust for the new EU member states are available (Oct-Nov 2004, Euroba-rometer 62.0), and the latest wave in our dataset for all these countries (May 2011,Eurobarometer 75.3). Now a reversal in the trend in the distribution of trust in the ECBby the EU27 is apparent during 2004-2011: trust has become weaker (the mean dropsfrom 73.89% to 57.81% and the median from 73.23% to 59.61%) and more dispersed(the standard deviation rises from 8.34% to 12.97%, with both the maximum and theminimum falling but increasing the spread between them, from 33 up to 53 percentage

Who Supports the ECB? 7
points). Yet a comparison between the old EU15 and the new EU12 reveals that the newmembers have a higher level of trust in the ECB. In both survey waves (Eurobarometer62.0 and Eurobarometer 75.3), the new EU12 are characterized by summary trust stat-istics that are superior to the respective ones for the old EU15, notwithstanding the dropin the support for the ECB the financial crisis caused in both groups of countries.
[Figure 6 about here]
Another illustration regarding the evolution of the shape of the distribution of trustin the ECB among the EU member states is suggested in Figure 6. It provides the kerneldensity function (kdf)7 for the same four waves of the Eurobarometer survey. What iseasy to notice in the left-panel graph in Figure 6, concerning the old EU15 subgroupbetween 1999 and 2004, is the clear tendency of an increasing trust in the ECB revealedin Figure 4. Namely, the support of the kdf narrows down while the mode moves bothright and up. The opposite tendency is displayed by the right-panel graph in Figure 6,concerning all EU27 member countries between 2004 and 2011, of a decreasing andmore dispersed trust in the ECB, consistent with Figure 5. The support of the kdf thistime shifts leftward, especially the lower tail, and its spread is consequently increased,while the shape of the kdf flattens, with the mode moving down and left, and skews intoa less symmetric distribution, with mass shifting leftward.
The likely explanations for the observed trends in the distribution of trust in the ECBwe summarized include, as few recent studies we already quoted have emphasized, thetensions that arise fundamentally from potential asymmetry of shocks across the E(M)Umember states and, hence, from the ensuing diverging national policy requirements. Inessence, while the new EU member states brought in, on average, increased trust in theECB, they also brought in many additional problems and debates about the social cohes-iveness of the political, economic and monetary union. Moreover, the global financialcrisis since August 2007 and the subsequent aggravation of the sovereign debt problemsof several European nations have further threatened even to disintegrate the Euro-area.
3 Determinants of Trust in the ECB: Econometric Estimation
Having summarized the evolving distribution of trust in the ECB, we next estimate thedeterminants of these changes. Along the lines of the existing literature dealing withpublic preferences for economic issues, socio-demographic variables are particularlyconsidered, in addition to business cycle and institutional controls.
3.1 Variables Entering the Logistic Regressions
The role of individual characteristics is measured through categorical variables suchas education, income, employment status, economic expectations, political placement,gender, age. Hyperinflation and fiscal/SGP dummies and certain interaction terms arealso employed, as we discuss next.
Walstad (1997) and Walstad and Rebeck (2002) observe that education is an im-portant determinant of an individual’s preference concerning an economic issue, as wellas measuring labor market skills and cognitive abilities (Scheve, 2004). But there is noconsensus about the effect of education on an economic issue: Hainmüller and Hiscox(2006) find that people with college education are more pro-trade while other forms ofeducation are not significant in evaluating trade policy. In our case, education is hypo-thesized to be linked to an understanding of the costs of inflation, of the operation of the
7Using Epanechnikov (optimal) weighting and Silverman (data-determined) bandwidth.

8 Farvaque, Hayat and Mihailov (Revised: October 2012)
monetary policy transmission mechanism, and of the macroeconomic role and institu-tional mandate of the central bank. Assuming that a higher level of education is related,among other things, to a better understanding of economics, education would thus beone main determinant of support for the ECB. In the Eurobarometer survey, ‘education’is measured by the age of the respondent when s/he stopped full-time education and isan ordered categorical variable on a scale of 1 to 4; 1 for ‘up to 15 years’, 2 for ‘16 to 19years’, 3 for ‘20+ years’ and 4 for ‘still studying’.
The income variable in the Eurobarometer survey ranges from 1 to 4 indicatingwhether the respondent is in the first, second, third, or fourth quartile of the incomedistribution for the respondent’s country. This variable proved influential in Jayadev(2006) for people’s attitude towards inflation. In our case, income is hypothesized topertain to an individual’s self-interest: for example, if they own nominal assets and aimto preserve their purchasing power. Such a motivation suggests that individual incomeshould be among the main socio-demographic determinants of ECB support.8
The literature has suggested that employment status could also be important, withthe unemployed people less supportive of an inflation-bashing central bank, as low in-flation levels could lead to a distortion of the Phillips curve trade-off (see Akerlof et al.,1996). Such a distortion may push up the sacrifice ratio, and be perceived as costlyby (part of) the electorate, notably the unemployed and retired people. To capturedifferences across employment status, we therefore include ‘occupation’ dummies forthe unemployed and the retired. As the probability of being unemployed, or to haveone’s income reduced, is linked to business cycle fluctuations, we also take into accountthe economic expectations the surveyed declare. This variable is coded as to whethereconomic conditions are anticipated to ‘get worse’, ‘improve’ or ‘stay the same’.
Political ideology is proxied by a political placement indicator, i.e. the way peopleposition themselves on the political axis from ‘left’ to ‘right’ through ‘centre’. Politicalplacement can obviously change individual attitudes towards important economic issuesand institutions, notably inflation and the central bank. As trust in the ECB could berelated to a pro-European or pro-integration bias, we also include a dummy variableto capture trust in the European Commission, constructed out from the same responsecategories in the Eurobarometer survey as the ones for trust in the ECB.
Previous studies (Nelsen and Guth, 2000; Scheve, 2004) have revealed that womenare less concerned about economic issues, so we add gender in our regressions. Agecan also be important with respect to inflation aversion and, hence, central bank inde-pendence issues related to the role of the ECB. Farvaque et al. (2010) and Farvaque andMihailov (2009) show that an older population acts as a strong weight against inflation,while Malmendier and Nagel (2009) present evidence that individuals of different agesreact differently to past inflation experiences.
Related to the two preceding considerations could be the experience of hyperinfla-tion some people might have lived through. We thus include in our estimates a dummyvariable with value 1 if the country has known a hyperinflation episode in the 20th cen-tury. This is the case for Germany, Greece and Hungary for the immediate aftermathof World War I and/or II and for Bulgaria, Poland, Romania and Slovenia in specificperiods during their transition from a centrally-planned to market economy over thelast decade of the past century. As many hyperinflation episodes are related to fiscalpolicy outcomes, we also include dummy variables to account for the fulfillment of theStability and Growth Pact (SGP) fiscal criteria: SGPDEBT has a value equal to one ifthe country shows a public debt to GDP ratio superior to the 60% limit, while SGPDEFis equal to one if the country shows a public deficit to GDP ratio superior to the 3%threshold.
8Ideally, data on wealth and on asset detention would be preferable, but are not available.
Who Supports the ECB? 9
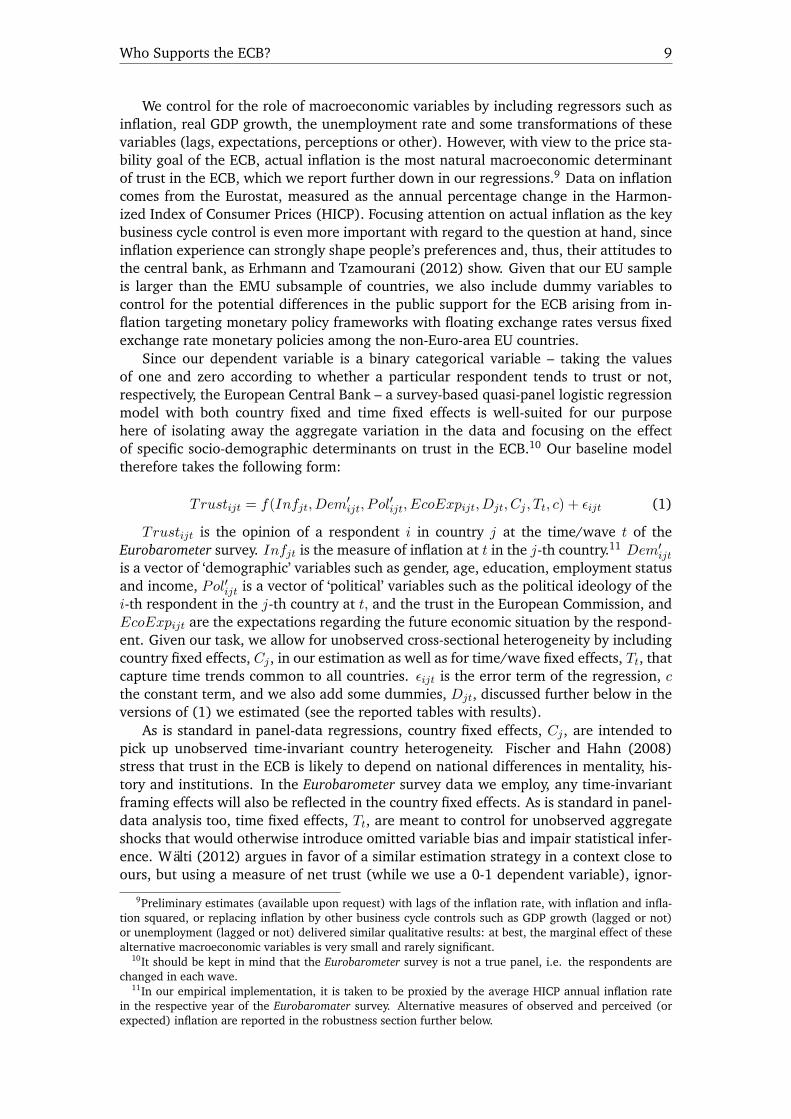
We control for the role of macroeconomic variables by including regressors such asinflation, real GDP growth, the unemployment rate and some transformations of thesevariables (lags, expectations, perceptions or other). However, with view to the price sta-bility goal of the ECB, actual inflation is the most natural macroeconomic determinantof trust in the ECB, which we report further down in our regressions.9 Data on inflationcomes from the Eurostat, measured as the annual percentage change in the Harmon-ized Index of Consumer Prices (HICP). Focusing attention on actual inflation as the keybusiness cycle control is even more important with regard to the question at hand, sinceinflation experience can strongly shape people’s preferences and, thus, their attitudes tothe central bank, as Erhmann and Tzamourani (2012) show. Given that our EU sampleis larger than the EMU subsample of countries, we also include dummy variables tocontrol for the potential differences in the public support for the ECB arising from in-flation targeting monetary policy frameworks with floating exchange rates versus fixedexchange rate monetary policies among the non-Euro-area EU countries.
Since our dependent variable is a binary categorical variable – taking the valuesof one and zero according to whether a particular respondent tends to trust or not,respectively, the European Central Bank – a survey-based quasi-panel logistic regressionmodel with both country fixed and time fixed effects is well-suited for our purposehere of isolating away the aggregate variation in the data and focusing on the effectof specific socio-demographic determinants on trust in the ECB.10 Our baseline modeltherefore takes the following form:
Trustijt = f(Infjt, Dem′ijt, Pol
′ijt, EcoExpijt, Djt, Cj , Tt, c) + εijt (1)
Trustijt is the opinion of a respondent i in country j at the time/wave t of theEurobarometer survey. Infjt is the measure of inflation at t in the j-th country.11 Dem′ijtis a vector of ‘demographic’ variables such as gender, age, education, employment statusand income, Pol′ijt is a vector of ‘political’ variables such as the political ideology of thei-th respondent in the j-th country at t, and the trust in the European Commission, andEcoExpijt are the expectations regarding the future economic situation by the respond-ent. Given our task, we allow for unobserved cross-sectional heterogeneity by includingcountry fixed effects, Cj , in our estimation as well as for time/wave fixed effects, Tt, thatcapture time trends common to all countries. εijt is the error term of the regression, cthe constant term, and we also add some dummies, Djt, discussed further below in theversions of (1) we estimated (see the reported tables with results).
As is standard in panel-data regressions, country fixed effects, Cj , are intended topick up unobserved time-invariant country heterogeneity. Fischer and Hahn (2008)stress that trust in the ECB is likely to depend on national differences in mentality, his-tory and institutions. In the Eurobarometer survey data we employ, any time-invariantframing effects will also be reflected in the country fixed effects. As is standard in panel-data analysis too, time fixed effects, Tt, are meant to control for unobserved aggregateshocks that would otherwise introduce omitted variable bias and impair statistical infer-ence. Wälti (2012) argues in favor of a similar estimation strategy in a context close toours, but using a measure of net trust (while we use a 0-1 dependent variable), ignor-
9Preliminary estimates (available upon request) with lags of the inflation rate, with inflation and infla-tion squared, or replacing inflation by other business cycle controls such as GDP growth (lagged or not)or unemployment (lagged or not) delivered similar qualitative results: at best, the marginal effect of thesealternative macroeconomic variables is very small and rarely significant.
10It should be kept in mind that the Eurobarometer survey is not a true panel, i.e. the respondents arechanged in each wave.
11In our empirical implementation, it is taken to be proxied by the average HICP annual inflation ratein the respective year of the Eurobaromater survey. Alternative measures of observed and perceived (orexpected) inflation are reported in the robustness section further below.

10 Farvaque, Hayat and Mihailov (Revised: October 2012)
ing to correct for selection bias (while we do that) and focusing only on 12 Euro-areacountries (while we look at all 27 EU members).
We estimate the parameters of our empirical model in (1) using logit regressions.Since we are merging country-level inflation with micro-data, it is important to considerthe possibility that disturbances will be correlated across countries. Hence, standarderrors are clustered by country and require the much weaker assumption that errors areindependent across countries but not necessarily across every survey respondent withina country (Moulton, 1990).
Another issue in the analysis is the weighting of the survey data. We follow theproposal of DuMouchel and Duncan (1983) to include sampling weights and interactionterms between the weights and the independent variables in the regressions to detectpossible misspecification. In almost all cases, we cannot reject the hypothesis that thecoefficients of the sampling weights and the interaction terms are equal to zero. Thisindicates that our results are not sensitive to the weighting and thus we report them onunweighted data.
3.2 Baseline Empirical Results
As described above, for the older 15 EU member states data is available for the whole1999-2011 period. However, as the new 12 EU member states are covered only from2004 on, we provide, as a point of departure, estimates for the earlier subperiod 1999-2004 and, for comparison purposes, also estimates for the whole period. More precisely,we estimated the following version of our baseline logistic regression (1):
Trustijt = f(Infjt, Dem′ijt, Pol
′ijt, [EcoExp3ijt], Cj , Tt, Djt, c) + εijt, (2)
where Dem′ijt = (Age4ijt, Edu4ijt, [Inc4ijt] , Genijt, Unemijt, Rtdijt)
′
and Pol′ijt = (Pol3ijt, EUComijt)′.
The ‘demographic’ vector contains ordered categorical variables and dummies: Age4ijtis the age group of the respondent in 4 categories: 15-24 years, 25-44 years, 45-64years, 65+ years; Edu4ijt is the education level of the respondent in 4 categories: upto 15 years of age at the time of obtaining the highest degree, 16-19 years, 20+ years,still studying; Inc4ijt is the income quartile of the respondent (in 4 categories). The‘political’ vector contains the trust in the EU Commission and one ordered categoricalvariable: Pol3ijt is the political placement of the respondent in 3 categories: left, centreand right. EcoExp3ijt indicates the expectation of the respondents about the economicsituation in the next twelve months with response options given by ‘better’, ‘worse’ or‘same’. The key dummies we use refer to the gender of the respondent, Genijt, andwhether s/he is unemployed, Unemijt, or retired, Rtdijt; EUComijt is the dummy fortrust in the EU Commission. The variables in square brackets are available only forcertain subsamples, as we explain next.
Table 5 presents the regression results from estimating (2) in four specifications, thesecond one including income quartiles and the fourth one including economic expecta-tions.12
[Table 5 about here]
As the Eurobarometer surveys discontinue publishing these income quartile charac-teristics of the respondents after 2004, our income quartile regressors appear only in
12The data on economic expectations is not available in most of the survey waves before 2004. Itssignificance has been checked by excluding/including it in specifications (3) and (4) in Table 5.

Who Supports the ECB? 11
specification (2) in Table 5 and not when estimates are reported up through 2011. Sucha discontinuity causes concern, though, as our results confirm that income is a signific-ant determinant of trust in the ECB. More precisely, as can be read off in specification(2) in Table 5, trust in the ECB is an increasing function of income (quartile): the richerthe respondents are, the more they trust the ECB. Due to the mentioned limitation inthe Eurobarometer survey waves after 2004, not containing income quartile data, wecannot further exploit and cross-check this particular finding in our ‘updated’ samplesthrough 2011, also including the 12 new EU member states. Comparing specifications(1) and (2) in Table 5, one can say that although accounting for income quartiles isclearly justified, it does not modify substantively the other regression results. That is,apart from the loss of statistical significance of inflation in specification (2) relative to(1), the rest of the regression results look pretty much the same except for some minornuances.
We find that: women trust less the ECB than men; age appears as a significant vari-able when the sample period is the largest, with the older people showing strongersupport for the ECB; education clearly matters too, as people with a higher level of edu-cation (and those still studying) trust the ECB more than those with lower educationlevels. Furthermore, trust in the ECB monotonically increases as one goes from ‘left’through ‘centre’ and to ‘right’ in the political spectrum. This result might have beenexpected given that the European Central Bank is generally considered as a rather con-servative institution. Consistent with related earlier findings, our occupation dummyconvincingly shows that unemployed people distrust the ECB. Economic expectationsare also strongly significant, with the expected sign: the better the expected future, thehigher the degree of trust in the ECB.
Most importantly, actual inflation is not significant at the 1% level in our estimatedspecifications (2), (3) and (4) of Table 5 once the socio-demographic characteristicsof the respondents are taken into account. These added socio-demographic regressorsthus complement, and look beyond the influence of, the few macrovariables employedin, for example, Fischer and Hahn (2008) and Wälti (2012) as potential determinantsof the trust in the ECB. And, among the socio-demographic variables with the strongesteffect on the support for the ECB by the European population at large are, notably, thehigher-level education, the unemployment status, the two top income quartiles and thecenter-to-right political orientation.13
All in all, a major outcome of these first estimates is that the impact of most ifnot all of our various socio-demographic variables remains statistically significant andeconomically interpretable, in addition and beyond the simultaneous impact of inflationor lack of it.14 These two types of determinants of the support the European populationaccords to the ECB, macroeconomic versus socio-demographic ones, have so far beenstudied in the literature mostly in separation. A comparison of regression (1) to itswider sample versions in (3) and (4), in Table 5, confirms that actual inflation is notfound empirically to be among the key determinants of trust in the ECB based on theEurobarometer survey waves. Another change is that older people (45-64 and 65+) arenow supportive of the central bank too (at the 1% level of significance). This is the only
13It could be argued that, given the relatively low level of inflation in the Euro-area, its low varianceduring our sample period, and the fact that the Euro-area is also characterized by persistent intra-zonedispersion in inflation rates (see, e.g., Altissimo et al., 2011; Gregoriou et al., 2011), inflation does notappear significant because its impact is already captured by the fixed effects. Nevertheless, our estimatesshow that including other socio-demographic variables is essential to have a better understanding of theissue at stake.
14Removal of inflation terms that come out statistically insignificant from the reported regressions doesnot change the essence of the results for the significant variables kept in. Additional tables confirming theserobustness findings are available from the authors.

12 Farvaque, Hayat and Mihailov (Revised: October 2012)
qualitative modification of the results we reported when comparing earlier specifications(1) and (2) in Table 5, as well as some changes in the degree of significance of thedummies related to the SGP criteria. We return to these particular findings with a likelyinterpretation later on, after considering analogous estimates for the 12 new EU memberstates, separately as the ‘new EU12’ subgroup and together with the ‘old EU15’ countries,as ‘all EU27’.
We next estimated an analogous version of model (2) for the new EU12 countriesseparately and together with the old EU15 countries, but excluding the income categor-ical variable (discontinued in 2004 and, thus, not available for the new EU12 memberstates) from the ‘demographic’ vector, which now contains the remaining categoricalvariables, as below:
Trustijt = f(Infjt, Dem′ijt, Pol
′ijt, EcoExp3ijt, Cj , Tt, Djt, c) + εijt, (3)
where Dem′ijt = (Age4ijt, Edu4ijt, Genijt, Unemijt, Rtdijt)
′
and Pol′ijt = (Pol3ijt, EUComijt)′.
Table 6 presents the results for the new EU12 countries in 2004-2011, specification(1), as well as for the whole sample, i.e. all EU27, over two periods of time, 2004-2011(specification (2)) and 1999-2011 (specifications (3) and (4)).
[Table 6 about here]
The age categories do not influence trust in the ECB in the new EU12 countries. Therest of the results are qualitatively similar, for the political, education and occupationvariables. Also, while gender still significantly and negatively affects the support for theECB, the coefficient’s magnitude for the average marginal effect is almost three timesweaker in the case of the new EU12 estimates. These differences in the results can partlybe due to the much shorter sample, 14 waves of the Eurobarometer only in 2004-2011,versus 24 waves for the old EU15 group in 1999-2011, and partly to the fact that exceptMalta and Cyprus (as from 2004), Slovenia (as from 2007) and Slovakia (as from 2010)the remaining eight countries in the new EU12 group do not (yet) share the commoncurrency, the Euro, issued by the ECB and directly influenced by its monetary policy (towhich we come back further in the robustness section below).
More importantly, our main conclusions from Table 5 carry over to Table 6. Namely,the estimated trust in the ECB does not appear affected by the inflation rate, but ratherby the same set of key socio-demographic characteristics of the Eurobarometer respond-ents we employ. We again find, now in the new EU12 subgroup of countries (as it was inthe old EU15 subgroup), that the ECB is mostly supported by people with right politicalorientation and the highest level of education (and still studying). At the same time,and by analogy with the results reported in all specifications in Table 5, women andunemployed distrust the ECB the most.
Having presented our results so far by distinct country subsamples, that is, for theold EU15 region versus the new EU12 region, it is finally not surprising what ‘blending’these EU subgroups altogether produces, as reflected in the last three columns of Table6. We first estimate the same baseline logistic regression for all our 27 countries, allEU27, over the subperiod 2004-2011 when data for the new EU12 becomes availablein the Eurobarometer survey waves, and our results are reported in the column underspecification (2) in Table 6. We then pool the subperiods and subgroups together, and re-estimate for the whole ‘all EU27’ country sample over the entire 1999-2011 time period(with 24 waves for the old EU15 and only the latest 14 waves for the new EU12 in the

Who Supports the ECB? 13
whole group of all EU27). Specification (2) in Table 6 looks very similar to specification(1) in Table 5, with only retirees now – i.e. when the new EU12 and the later subperiod2004-2011 are allowed to shape out our findings – becoming statistically significant.Specifications (3) and (4), in turn, are very close to specification (2) in Table 6. Mostimportantly, considering together all data does not restore the statistical significanceand the sign and magnitude relevance of the key macroeconomic variable affecting thetrust in the ECB, namely, observed inflation: compare specification (3) in Table 6 withspecification (1) in Table 5, as was noted earlier.
Let us sum up next what we learn from employing the various dummy variables andcertain interaction terms. Beginning with the dummy for countries having experiencedhyperinflation, it appears as statistically significant only in the old EU15 subsample inTable 5, in all four columns. Its average marginal effect coefficient has a negative sign,which implies that trust in the ECB is lower in countries such as Germany where after thehyperinflation history in the 1920s and 1940s a credible central bank had emerged andconsolidated, the Deutsche Bundesbank. The hyperinflation dummy is not statisticallysignificant, however, for the new EU12 subsample and for all EU27 countries in Table 6.
Our ‘fiscal profligacy’ dummies, capturing higher deficit or debt ratios to GDP thanthose imposed by the SGP, seem more informative. In particular, the average marginaleffect coefficient of the dummy for higher level of debt to GDP than the SGP limit isstatistically significant and negative in the old EU15 subgroup over the whole period,1999-2011 (the last two columns in Table 5). This means that the old EU15 populationin countries with highly indebted governments does not support the ECB as much as thepopulation in the remaining, less indebted old EU15 member states. The same is truefor all EU27 countries over the entire sample, 1999-2011 (the last two columns in Table6). Yet, it seems that the ECB may be considered as a check on profligate governments inthe new EU12 subsample (the first column in Table 6), as the dummy related to the SGPdebt criterion is now coming out with a significant positive coefficient. The changingsign on this coefficient as one moves from specification (1) to the other in Table 6 alsoreveals perhaps the rationality of respondents, who appear even more worried by thelack of discipline in public finances many EU27 countries now face. Important deficitsand/or debt levels, especially as the financial and Euro-debt crisis has hit the old EU15members more severely than the new EU12 ones, have impacted their public financesmore strongly, and then the trust in the ECB as revealed by our estimates (see alsobelow our robustness check on the financial and Euro-debt crisis period). As for thegroup of 10 new EU members that joined in 2004, our dummy EU2004 comes out witha significant and negative coefficient over 2004-2011 in most variants of the estimation(including the robustness checks to be discussed later), which indicates a lower degreeof trust in the ECB in these 10 countries.
The interaction terms we employed checking for various possible combined effectson the trust in the ECB proved not statistically significant most of the time, unless on afew occasions that are reported in our tables. Just two such interaction terms, namely,hyperinflation × SGP debt and hyperinflation × old EU15 were found statistically sig-nificant in some of our econometric specifications, including the robustness checks dis-cussed in the subsection to follow. As far as the baseline estimation in tables 5 and 6 isconcerned the interaction of hyperinflation with SGP debt is hard to interpret, while theinteraction of hyperinflation with the old EU15 subgroup results in a significant negativeaverage marginal effect when the whole sample of 27 EU members is estimated over theentire period of 1999-2011 as well as over the more recent subperiod of 2004-2011 (seethe last three columns in Table 6).
Interestingly, our dummy for the original EU6 founding countries comes out system-atically across the variants of our estimation with a negative and significant average

14 Farvaque, Hayat and Mihailov (Revised: October 2012)
marginal effect coefficient, while our dummy for the EMU member states displays theopposite significant sign, and roughly three times lower magnitude of the respectivecoefficients. These econometric findings seem to reflect some opposite trends in thepublic opinion concerning the ECB in the founding EU6 versus the much larger sub-group of the current EMU members.
Finally, our dummies for inflation targeting countries with floating exchange rateregimes and for fixed exchange rate regimes within the EU27 are generally insignificantin the largest sample.
All in all, the results we discussed show that higher education and/or income levelsseem the dominant determinant of support for the ECB, coming out with statisticallysignificant coefficients for the average marginal effects and the expected positive sign inour regressions. Our empirical work thus corroborates the two key socio-demographicsources of trust in the ECB we hypothesized. The findings we reported also reveal thatthe usual macrovariable to help evaluate central bank performance and build up supportfor its monetary policy, actual inflation, matters less (or even often does not matterstatistically) for maintaining trust in the ECB once socio-demographic characteristics ofthe Eurobarometer survey respondents are also included in the regressions.
3.3 Robustness Checks
The definition of the dummies we used for hyperinflation as well as for SGP debt andSGP deficit may appear as taking out a lot of variability in the data from the outsetand/or could raise doubts for under-identification problems, when they are coupledwith the fixed effects, even though the non-linear estimation method would allow theconvergence of the algorithm. We have, thus, re-estimated the same regressions as theones we reported in the preceding subsection without these dummies and their interac-tion terms, and can confirm the robustness of the results to their inclusion/absence.15
As was noted when defining our binary measure of trust in the ECB, the estimates wepresented above do not take into account the ‘Don’t know’ category in the Eurobarometersurvey response coding. While Wälti (2012) in his related panel-data work with a focuson the impact of the global financial crisis on a different measure of net trust neglectedthe implications of the mentioned category altogether, we did check for the robustnessof our empirical findings along this dimension. More precisely, the respondents in the‘Don’t know’ category were imputed using standard techniques (Rubin, 1987) and allequations were re-estimated. This did not lead to any qualitative modifications of theresults we reported in the preceding subsection.16
Yet, one cannot completely ignore the possibility that respondents, even in a randomsurvey sample, first decide to have an opinion or not, and only then which opinion tohave. Therefore, as an alternative of the imputation analysis, we also ran a Heckman(1976, 1979) selection model, as is common in the literature.17 We concluded in favorof the absence of a selection bias in our analysis.18
Furthermore, the estimates we presented make use of the survey respondents’ na-tional inflation rate. Yet, as our goal is to analyze the trust in the ECB by European
15Full results are available upon request.16Full results are available upon request.17When the correlation between the error terms in the regression and estimation equations in a Heckman
(1976) selection model is nonzero, standard regression techniques applied to the regression equation yieldbiased results. To obtain consistent, asymptotically efficient estimates for the parameters of interest, weapplied the Heckman (1979) two-step efficient estimator. This approach is an appropriate alternative withlarge datasets as ours, in which maximum likelihood estimation of the parameters may be time consuming.We, therefore, performed the estimation with Heckman (1979) correction for selection bias.
18Full results are available upon request.

Who Supports the ECB? 15
polities, a natural question arises about the relevant inflation rate that should be con-sidered. For a resident of a country belonging to the Euro-area (or linked to it by a fixedexchange rate), the relevant inflation rate is the one targeted by the ECB. However, for arespondent from a country outside the Euro-area (and not linked to it by a peg regime),the support delivered to the ECB could depend on the difference between the Euro-areainflation rate and the domestic one. This is so especially given the fact that the ECB hasbeen quite successful in achieving its 2% inflation target, except for the last few years,due to the crisis.
To deal with these other aspects of robustness, we next present estimates based onthree alternatives. The first series of estimates, regressions (1) to (4) in Table 7, usethe subsample of countries that are not members of the European Monetary Union, andconsider the difference between their national inflation rate and the Euro-area inflationrate. As can be seen, the results are fundamentally similar to the preceding ones. Thesecond series of robustness checks, regressions (1) to (4) in Table 8, consider expectedinflation in the EMU subsample, and not realized inflation.19 Here again, as can beseen, the qualitative essence of our empirical results remains robust. Moreover, compar-ing this particular estimated specification on a restricted sample of just the Euro-areacountries with the baseline empirical findings concerning all EU members reveals nosubstantive difference between these two groups along the issue we investigate. To ex-pand on this dimension of potential divide of EMU vs non-EMU states, the third seriesof robustness checks, regressions (1) to (4) in Table 9, finally look for a possible roleof inflation perceptions by using the national inflation rate for the countries that do notbelong to the Euro area, but the Euro-area inflation rate for the EMU members. As canbe seen, again, no significant difference emerges from those estimates and the precedingones. Hence, inflation (whatever the measure we consider) remains mostly insignific-ant in our regressions. Concerning the socio-demographic variables, the results showthat the effect of education is the same (the higher the education level, the higher thesupport), people from the right are still more supportive of the ECB, while unemployed,retirees and women tend to be less supportive of the ECB.20
[Tables 7, 8 and 9 about here]
To judge about the impact of the global financial crisis on the support for the ECBaccorded by the population in the EU, we ran estimates on the last subperiod of oursample, i.e. 2007 to 2011. Roth (2009) and Wälti (2012), for example, show thatthe support for the ECB has strongly decreased over the last years of our sample, sowe checked if our own reported results are robust to the crisis period. As can be seenfrom Table 10, our findings are mostly unchanged, except for the dummies related tothe hyperinflation episodes and the fiscal stance. The hyperinflation dummy is nowsignificant and negative in both types of countries, as well as its interaction with thedummies related to the SGP criteria. This seems to indicate certain disapproval by therespondents with regard to the policies the ECB has implemented during the crisis toback up the sovereign issuers in the Euro area, and also a good understanding of thefact that such policies may fuel inflation if they are not reversed.
19The definition and source of inflation expectations in the Euro area are taken from the ECBSurvey of Professional Forecasters (SPF). This is a quarterly survey of expectations for the ratesof inflation, real GDP growth and unemployment in the euro area for several horizons, togetherwith a quantitative assessment of the uncertainty surrounding them. The data are available athttp://www.ecb.int/stats/prices/indic/forecast/html/index.en.html
20A minor difference with respect to our baseline results is that the interaction of hyperinflation withSGP debt now appears with a statistically significant positive, not negative, coefficient once economicexpectations are included as an additional regressor over the whole period as well as over 2004-2007,and given that actual inflation in Table 7 is measured in a perhaps more directly relevant way to nationalperceptions of what the ECB can do about it or not.

16 Farvaque, Hayat and Mihailov (Revised: October 2012)
[Table 10 about here]
Finally, as far as potential combined effects are concerned, we ran the regressionswe have reported also including additional interaction terms, namely gender × income,gender × education and income × education.21 The terms interacting with incomecame out insignificant, while gender × education was found statistically significant onlyfor high levels and negative.22
All in all, then, these robustness checks confirm quite convincingly the spirit of thepreceding results and interpretations. They show, more precisely, that one principalsource of trust in the ECB we hypothesized, the understanding of the costs of inflation,of monetary policy transmission and of the institutional role of the central bank, witheducation being its key determinant, is the most supported by the sample we used.Although we cannot neglect the relevance of another major source of trust in the ECB,income, our exploration along these lines was less conclusive due to the lack of data.
4 Concluding Comments
Our empirical answers to the question we posed in the title to this paper can be summar-ized as follows. Who supports the ECB? People with higher – rather than lower – levelof education, perhaps because these can better appreciate the role of the ECB within theE(M)U; people with higher – rather than lower – level of income, possibly because thesetend to be more concerned that price stability is protected, which is the mandate of theECB; people with centre to right-wing – rather than left-wing – political orientation, asthese are likely to be more conservative and, thus, more ‘aligned’ with the usual centralbanking functions and policies; people with optimistic expectations on the economicsituation, perhaps because these see the ECB as partly contributing to shaping out eco-nomic trends in the E(M)U; men – rather than women – as they might overall be morepolitics- or business-inclined. Not surprisingly, perhaps, the unemployed are among thesocio-demographic groups that distrust the ECB the most, as they would care primarilyto find a job, and so a source of income. By analogy, the bottom quartiles of the incomedistribution and people with the minimum level of education also belong to the sociallayers that display the weakest support, if at all, for the ECB and its priority policies.
Our findings also make another important point: most of the micro-characteristics ofthe European population we employed in our empirical work matter for its trust in theECB, while the control for actual (as well as expected, perceived, lagged or transformed)inflation in the Euro area or relative to the non-Euro part of the EU was surprisinglynot found statistically significant most of the time. Simply studying macroeconomicdeterminants of trust in the ECB, as common in this emerging literature so far, wouldtherefore miss a whole set of micro-based socio-demographic determinants. As ourresults show, these latter determinants led to statistically significant and economicallyinterpretable results in a broader context of investigating the support for the ECB by thepopulation of the EU member states that looks beyond the business cycle and nationalinstitutional context using the data from the Eurobarometer survey waves.
The implications of such results are clearly essential when it comes to formulatingand implementing a central bank’s communication policy, and in particular the commu-nication strategy of the ECB. Over the recent years, the intense debates on the EMU debtcrisis together with the weak global economy have led to a decline of the trust in the
21These additional results are available from the authors.22Such a result may imply that women with higher degrees of education tend to be less supportive of the
ECB when compared to less educated women, a curious minor reversal of what we reported for men andfor both sexes in general.

Who Supports the ECB? 17
ECB. Our results, in effect, identify the groups that should be targeted in such commu-nication with the public if the ECB has to improve its policy credibility and longer-runlegitimacy. Their relevance for ECB’s communication strategy is especially high in theyears ahead of further challenges and likely reforms of the EMU.
References
[1] Akerlof G., Dickens W., Perry G. (1996), “The Macroeconomics of Low Inflation,”Brookings Papers on Economic Activity 1, 1–76.
[2] Altissimo F., Benigno P., Palenzuela D.R. (2011), “Inflation Differentials in a Cur-rency Area: Facts, Explanation and Policy,” Open Economies Review 22, 189–233.
[3] Arnone M., Laurens B.J., Segalotto J.-F., Sommer M. (2009), “Central BankAutonomy: Lessons from Global Trends,” IMF Staff Papers 56, 263–296.
[4] Banducci S.A., Karp J.A., Loedel, P.H. (2009), “Economic Interests and Public Sup-port for the Euro”, Journal of European Public Policy, 16, 564–581.
[5] Berggren, N., Daunfeldt, S.-O., Hellström, J. (2012), “Social Trust and Central-Bank Independence,” Research Institute of Industrial Economics (IFN) – Stock-holm, IFN Working Paper No. 920.
[6] Blinder A.S., Ehrmann M., Fratzscher M., De Haan J., Jansen D.-J. (2008), “CentralBank Communication and Monetary Policy: A Survey of Theory and Evidence,”Journal of Economic Literature 46, 910–945.
[7] Bjørnskov, C. (2007), “Determinants of Generalized Trust: a Cross-country Com-parison,” Public Choice 130, 1–21.
[8] Carlstrom C.T., Fuerst T.S. (2009), “Central Bank Independence and Inflation: ANote,” Economic Inquiry 47, 182–186.
[9] Carvalho C., Nechio F. (2012), “Do People Understand Monetary Policy?”, WorkingPaper 2012-01, Federal Reserve Bank of San Francisco.
[10] Coleman W. (2001), “Is It Possible That an Independent Central Bank Is Im-possible? The Case of the Australian Notes Issue Board, 1920-1924,” Journalof Money, Credit and Banking 33, 729–748.
[11] Crowe C., Meade E. (2007), “The Evolution of Central Bank Governance Aroundthe World,” Journal of Economic Perspectives 21, 69–90.
[12] DuMouchel W.H., Duncan G.J. (1983), “Using Sample Survey Weights in MultipleRegression Analyses of Stratified Samples,” Journal of the American Statistical As-sociation 78, 535–543.
[13] Ehrmann M., Fratzscher M. (2007), “The Timing of Central Bank Communication,”European Journal of Political Economy 23, 124–145.
[14] Ehrmann, M., Soudan, M., Stracca, L. (2010), “Explaining the Fall in Citizens’Trust in ECB During the Financial Crisis,” manuscript.
[15] Ehrmann M., Tzamourani P. (2012), “Memories of High Inflation,” EuropeanJournal of Political Economy 28, 174–191.

18 Farvaque, Hayat and Mihailov (Revised: October 2012)
[16] Farvaque E., Héricourt J., Lagadec G. (2010), “Central Bank Independence andAgeing,” Applied Economics Letters 17, 1167–1171.
[17] Farvaque E., Mihailov A. (2009), “Intergenerational Transmission of Inflation Aver-sion: Theory and Evidence,” IRISS Working Paper 2009-11, CEPS/INSTEAD, Lux-embourg.
[18] Fischer J.V., Hahn V. (2008), “Determinants of Trust in the European Central Bank,”Working Paper Series in Economics and Finance 695, Stockholm School of Eco-nomics.
[19] Gabel M. (1998), “Public Support for European Integration: An Empirical Test ofFive Theories,” Journal of Politics 60, 333–354.
[20] Gärtner M. (1997), “Who Wants the Euro – and Why? Economic Explanations ofPublic Attitudes towards a Single European Currency,” Public Choice 93, 487–510.
[21] Gregoriou A., Kontonikas A., Montagnolli A. (2011), “Euro Area Inflation Differen-tials: Unit Roots and Nonlinear Adjustment,” Journal of Common Market Studies49, 525–540.
[22] Gros D., Roth F. (2010), “The Financial Crisis and Citizen Trust in the EuropeanCentral Bank,” CEPS Working Document 334.
[23] Hainmüller J., Hiscox M.J. (2006), “Learning to Love Globalization? Educationand Individual Attitudes toward International Trade,” International Organization60, 469–498.
[24] Havrilesky T. (1991), “The Frequency of Monetary Policy Signaling from the Ad-ministration to the Federal Reserve,” Journal of Money, Credit and Banking 23(Part 1), 423–428.
[25] Hayo B. (1999), “Knowledge and Attitude towards European Monetary Union,”Journal of Policy Modeling 21, 641–651.
[26] Heckman, J. (1976), “The Common Structure of Statistical Models of Truncation,Sample Selection and Limited Dependent Variables and a Simple Estimator forSuch Models,” Annals of Economic and Social Measurement 5, 475–492.
[27] Heckman, J. (1979), “Sample Selection Bias as a Specification Error,” Econometrica47, 153–161.
[28] Hudson J. (2006), “Institutional Trust and Subjective Well-Being across the EU,”Kyklos 59, 43–62.
[29] Jayadev A. (2006), “Differing Preferences between Anti-Inflation and Anti-Unemployment Policy among the Rich and the Poor,” Economics Letters 91, 67–71.
[30] Jonung L. (2004), “The Political Economy of Monetary Unification: The SwedishEuro Referendum of 2003,” Cato Journal 24, 123–249.
[31] Kaltenthaler K.C., Anderson C. J. (2001), “Europeans and Their Money: Explain-ing Public Support for the Common European Currency,” European Journal ofPolitical Research 40, 139–170.
[32] Kaltenthaler K.C., Anderson C.J., Miller W.J. (2010), “Accountability and Inde-pendent Central Banks: Europeans and Distrust of the European Central Bank,”Journal of Common Market Studies, 48, 1261–1281.

Who Supports the ECB? 19
[33] Lohmann S. (1992), “Optimal Commitment in Monetary Policy: Credibility versusFlexibility,” American Economic Review 82, 273–286.
[34] Maier P., Bezoen S. (2004), “Bashing and Supporting Central Banks: The Bundes-bank and the European Central Bank,” European Journal of Political Economy 20,923–939.
[35] Maier P., Knapp T. (2002), “Who Supported the Deutsche Bundesbank? An Empir-ical Investigation,” Journal of Policy Modeling 24, 831–851.
[36] Maier P., Sturm J.-E., de Haan J. (2002), “Political Pressure on the Bundesbank:An Empirical Investigation Using the Havrilesky Approach,” Journal of Macroeco-nomics 24, 103–123.
[37] Malmendier U., Nagel S. (2009), “Learning from Inflation Experiences,”StanfordGraduate School of Business, manuscript.
[38] Mixon F.G. Jr., Gibson M.T. (2002), “The Timing of Partisan and Nonpartisan Ap-pointments to the Central Bank: Some New Evidence,” Journal of Money, Creditand Banking 34, 361–375.
[39] Moulton B.R. (1990), “An Illustration of a Pitfall in Estimating the Effects of Ag-gregate Variables on Micro Units,” Review of Economics and Statistics 72, 334–338.
[40] Nelsen B.F., Guth J.L. (2000), “Exploring the Gender Gap: Women, Men and PublicAttitudes toward European Integration,” European Union Politics 1, 267–229.
[41] Roth F. (2009), “The Effect of the Financial Crisis on Systemic Trust,” Intereco-nomics: Review of European Economic Policy 44, 203–208.
[42] Rubin, D.B. (1987), Multiple Imputation for Nonresponse in Surveys. New York:Wiley.
[43] Scheve K. (2004), “Public Inflation Aversion and the Political Economy of Macroe-conomic Policymaking,” International Organization 58, 1–34.
[44] Siklos P.L. (2010), “Revisiting the Coyne Affair: A Singular Event that Changedthe Course of Canadian Monetary History,” Canadian Journal of Economics 43,994–1015.
[45] Stevenson B., Wolfers J. (2011), “Trust in Public Institutions,” American EconomicReview 101, 281–287.
[46] Walstad W.B. (1997), “The Effect of Economic Knowledge on Public Opinion ofEconomic Issues,” Journal of Economic Education 28, 195–205.
[47] Walstad W.B., Rebeck K. (2002), “Assessing the Economic Knowledge and Eco-nomic Opinions of Adults,” Quarterly Review of Economics and Finance 42, 921–935.
[48] Wälti, S. (2012), “Trust No More? The Impact of the Crisis on Citizens’ Trust inCentral Banks,” Journal of International Money and Finance 31, 593–605.

20 Farvaque, Hayat and Mihailov (Revised: October 2012)
GBRFRAGRCLVAESPAUTHUNDEUSVNPOLCZEITASWEBELCYPSVKPRTFINBGRIRLLTUDNKLUXROMMLTESTNLD
0 10 20 30 40 50 60 70 80 90 100
Maximum Average Minimum
Figure 1: Average Support for the ECB by Country, % – All EU27. Note: Statisticsfor the old EU15 countries are based on 1999-2011 (24 Eurobarometer survey wavesbetween EB52.0, Oct-Nov, 1999 and EB75.3, May 2011), while statistics for the newEU12 member states are based on 2004-2011 (14 Eurobarometer survey waves betweenEB62.0, Oct-Nov, 2004 and EB75.3, May 2011). Source: Authors’ calculations based onEurobarometer survey data.

Who Supports the ECB? 21
30
40
50
60
70
80
90
1999 2000 2001 2002 2003 2004 2005 2006 2007 2008 2009 2010 2011
AUT BEL DEU DNK ESP FIN FRA GBR
GRC IRL ITA LUX NLD PRT SWE
Figure 2: Trust in the ECB by Country, % – Old EU15, 1999-2011. Source: Authors’calculations based on Eurobarometer survey data.
40
50
60
70
80
90
2004 2005 2006 2007 2008 2009 2010 2011
BGR CYP CZE EST HUN LTU
LVA MLT POL ROM SVK SVN
Figure 3: Trust in the ECB by Country, % – New EU12, 2004-2011. Source: Authors’calculations based on Eurobarometer survey data.

22 Farvaque, Hayat and Mihailov (Revised: October 2012)
0
20
40
60
80
100
EB52.0 OctNov,1999 EB61.0 FebMar,2004
Figure 4: Distribution of Trust in the ECB, %, Old EU15, 1999-2004 – Boxplots. Source:Authors’ calculations based on Eurobarometer survey data.
0
20
40
60
80
100
EB62.0, OctNov, 2004 EB75.3, May,2011
Figure 5: Distribution of Trust in the ECB, %, All EU27, 2004-2011 – Boxplots. Source:Authors’ calculations based on Eurobarometer survey data.

Who Supports the ECB? 23
0
.01
.02
.03
.04
.05
0 10 20 30 40 50 60 70 80 90 100
EB52.0 OctNov,1999, EU15EB61.0 FebMar,2004, EU15
0
.01
.02
.03
.04
.05
0 10 20 30 40 50 60 70 80 90 100
EB62.0 OctNov, 2004, EU27EB75.3 May, 2011, EU27
Figure 6: Distribution of Trust in the ECB, %, Old EU15 and All EU27, 1999-2004-2011– Kernel Densities. Source: Authors’ calculations based on Eurobarometer survey data.

24 Farvaque, Hayat and Mihailov (Revised: October 2012)
Table 1: Eurobarometer Data Coverage by Survey Wave
No in Our Sample Original No Original 4-Digit Code Period Year Year Wave
1 52.0 3204 Oct-Nov 1999 2nd2 53.0 3296 Apr-May 2000 1st3 54.1 3387 Nov-Dec 2000 2nd4 55.2 3507 Apr-May 2001 1st5 56.2 3627 Oct-Nov 2001 2nd6 57.1 3639 Mar-Apr 2002 1st7 58.1 3693 Oct-Nov 2002 2nd8 59.1 3904 Mar-Apr 2003 1st9 60.1 3938 Oct-Nov 2003 2nd10 61.0 4056 Feb-Mar 2004 1st11 62.0 4229 Oct-Nov 2004 2nd12 63.4 4411 May-Jun 2005 1st13 64.2 4414 Oct-Nov 2005 2nd14 65.2 4506 Mar-Apr 2006 1st15 66.1 4526 Sep-Oct 2006 2nd16 67.2 4530 Apr-May 2007 1st17 68.1 4565 Sep-Nov 2007 2nd18 69.2 4744 Mar-May 2008 1st19 70.1 4819 Oct-Nov 2008 2nd20 71.3 4973 Jun-Jul 2009 1st21 72.4 4994 Oct-Nov 2009 2nd22 73.4 5234 May 2010 1st23 74.2 5449 Nov-Dec 2010 2nd24 75.3 5481 May 2011 1st
Table 2: Eurobarometer Data Coverage by Country
Old EU15: 1999-2011 (24 waves) New EU12: 2004-2011 (14 waves)Code Name Code NameAUT Austria BGR BulgariaBEL Belgium CYP Cyprus (Republic)DNK Denmark CZE Czech RepublicFIN Finland EST EstoniaFRA France HUN HungaryDEU Germany (East+West) LVA LatviaGBR Great Britain LTU LithuaniaGRC Greece MLT MaltaIRL Ireland POL PolandITA Italy ROM RomaniaLUX Luxembourg SVK SlovakiaNLD Netherlands SVN SloveniaPRT PortugalESP SpainSWE Sweden

Who Supports the ECB? 25
Table 3: Trust in the ECB by Socio-Demographic Category – Summary Statistics
Mean Std.Dev. Obs.Full Sample 0.67 0.47 398,379
GenderMale 0.69 0.46 194,238Female 0.65 0.47 204,141
Age15-24 0.70 0.46 51,19925-44 0.67 0.47 137,34545-64 0.66 0.47 133,50465+ 0.65 0.48 76,288
EducationUp to 15 0.58 0.49 80,40416-19 0.65 0.48 162,51020+ 0.74 0.44 115,883Still studying 0.74 0.44 35,219
Political PlacementLeft 0.65 0.48 103,050Center 0.68 0.46 136,544Right 0.73 0.44 93,205
Economic ExpectationsBetter 0.78 0.42 78,731Same 0.70 0.46 134,307Worse 0.57 0.49 127,108
IncomeQ1 0.62 0.48 17,878Q2 0.66 0.47 20,755Q3 0.70 0.46 20,415Q4 0.74 0.44 21,961
OccupationUnemployed 0.56 0.50 25,297Retired 0.65 0.48 101,065
Source: Authors’ calculations based on Eurobarometer survey data.

26 Farvaque, Hayat and Mihailov (Revised: October 2012)
Table 4: Trust in the ECB, %, by Country Subgroup – Descriptive Statistics
EB52.0 Oct-Nov, 1999 EB61.0 Feb-Mar, 2004Old EU15 Old EU15
Mean 66.14 68.44Median 64.00 67.13Maximum 88.93 81.69Minimum 39.50 47.09Std. Dev. 12.20 9.78Skewness -0.14 -0.62Kurtosis 3.05 2.63Jarque-Bera 0.05 1.04Probability 0.97 0.59Observations 15 15
EB62.0 Oct-Nov 2004All EU27 Old EU15 New EU12
Mean 73.89 71.93 76.33Median 73.23 71.91 76.08Maximum 92.82 84.14 92.82Minimum 56.23 56.23 64.59Std. Dev. 8.34 7.99 8.43Skewness 0.02 -0.36 0.33Kurtosis 2.74 2.28 2.35Jarque-Bera 0.08 0.64 0.44Probability 0.96 0.73 0.81Observations 27 15 12
EB75.3 May 2011All EU27 Old EU15 New EU12
Mean 57.81 55.14 61.14Median 59.61 55.31 63.20Maximum 77.54 77.54 72.06Minimum 25.36 25.36 44.29Std. Dev. 12.97 15.53 8.27Skewness -0.72 -0.32 -0.67Kurtosis 2.98 2.19 2.54Jarque-Bera 2.33 0.68 1.02Probability 0.31 0.71 0.60Observations 27 15 12
Source: Authors’ calculations based on Eurobarometer survey data.

Who Supports the ECB? 27
Table 5: Baseline Logistic Regressions – Old EU15Regressors 1999-2004 1999-2011
(1) (2) (3) (4)Inflation(t) -0.009** -0.006 0.004** 0.004*
(0.004) (0.005) (0.002) (0.002)Gender Dummy -0.030*** -0.030*** -0.038*** -0.040***
(0.006) (0.006) (0.006) (0.006)Age (BL: 15-24)
25-44 0.003 0.003 0.008 0.010*(0.007) (0.007) (0.006) (0.006)
45-64 0.014* 0.011 0.022*** 0.026***(0.008) (0.007) (0.005) (0.005)
65+ 0.011 0.014 0.033*** 0.040***(0.009) (0.009) (0.007) (0.007)
Education (BL: Up to 15)16-19 0.016*** 0.005 0.026*** 0.029***
(0.005) (0.005) (0.004) (0.004)20+ 0.049*** 0.033*** 0.068*** 0.071***
(0.007) (0.006) (0.008) (0.008)Still studying 0.029*** 0.028*** 0.041*** 0.040***
(0.007) (0.008) (0.005) (0.005)Political Placement (BL: Left)
Centre 0.023*** 0.023*** 0.022*** 0.022***(0.006) (0.006) (0.005) (0.005)
Right 0.036*** 0.034*** 0.037*** 0.037***(0.011) (0.013) (0.008) (0.008)
Occupation DummiesUnemployed -0.039*** -0.023*** -0.037*** -0.037***
(0.008) (0.007) (0.007) (0.007)Retired -0.006 0.007 -0.010* -0.011*
(0.007) (0.005) (0.006) (0.006)Income (BL: Q1)
Q2 0.022***(0.006)
Q3 0.041***(0.006)
Q4 0.067***(0.008)
Economic Expectations (BL: Same)Better 0.021***
(0.004)Worse -0.038***
(0.005)Other Dummies and InteractionsTrust in EU Commission 0.401*** 0.402*** 0.401*** 0.392***
(0.004) (0.004) (0.004) (0.005)Hyperinflation -0.038*** -0.053*** -0.106*** -0.095***
(0.011) (0.009) (0.005) (0.006)EMU 0.037*** 0.035*** 0.000 0.024***
(0.009) (0.007) (0.008) (0.007)EU6 -0.094*** -0.089*** -0.115*** -0.119***
(0.005) (0.006) (0.003) (0.004)SGPDEF -0.020*** -0.012 -0.010 -0.006
(0.007) (0.014) (0.007) (0.008)SGPDEBT -0.009 -0.017 -0.035*** -0.036***
(0.011) (0.017) (0.011) (0.013)IT/Float Countries 0.028*** 0.034*** -0.018** -0.016*
(0.010) (0.010) (0.009) (0.009)Peg Countries 0.065*** 0.065*** -0.028*** -0.010
(0.011) (0.010) (0.009) (0.009)Hyperinflation x SGPDEBT 0.021* 0.023* -0.003 -0.011
(0.013) (0.014) (0.010) (0.010)Observations 99,578 66,701 229,197 188,644Adjusted Pseudo R-Sq 0.33 0.33 0.35 0.35Notes: Average marginal effects are reported. Standard errors clustered by country are inparentheses. All specifications are estimated using country and time fixed effects.BL: Baseline; * p < .1, ** p < .05, *** p < .01.

28 Farvaque, Hayat and Mihailov (Revised: October 2012)
Table 6: Baseline Logistic Regressions – New EU12 and All EU272004-2011 1999-2011
Regressors New EU12 All EU27 All EU27(1) (2) (3) (4)
Inflation(t) -0.000 -0.000 0.001 0.001(0.001) (0.001) (0.001) (0.001)
Gender Dummy -0.012*** -0.033*** -0.032*** -0.032***(0.003) (0.006) (0.005) (0.005)
Age (BL: 15-24)25-44 0.002 0.011*** 0.007 0.008**
(0.005) (0.004) (0.004) (0.004)45-64 0.001 0.022*** 0.016*** 0.020***
(0.006) (0.005) (0.005) (0.005)65+ 0.000 0.033*** 0.024*** 0.029***
(0.008) (0.007) (0.006) (0.006)Education (BL: Up to 15)
16-19 0.015*** 0.027*** 0.023*** 0.025***(0.004) (0.004) (0.003) (0.003)
20+ 0.035*** 0.063*** 0.060*** 0.061***(0.007) (0.008) (0.007) (0.007)
Still studying 0.023*** 0.037*** 0.037*** 0.035***(0.007) (0.005) (0.004) (0.004)
Political Placement (BL: Left)Centre 0.015** 0.019*** 0.021*** 0.021***
(0.007) (0.005) (0.004) (0.004)Right 0.023** 0.035*** 0.037*** 0.036***
(0.010) (0.006) (0.007) (0.006)Occupation Dummies
Unemployed -0.013** -0.025*** -0.030*** -0.029***(0.006) (0.005) (0.006) (0.005)
Retired -0.006 -0.009** -0.010** -0.010**(0.005) (0.004) (0.004) (0.004)
Economic Expectations (BL: Same)Better 0.031*** 0.026*** 0.025***
(0.003) (0.003) (0.003)Worse -0.035*** -0.035*** -0.037***
(0.005) (0.003) (0.004)Other Dummies and InteractionsTrust in EU Commission 0.363*** 0.387*** 0.398*** 0.389***
(0.004) (0.002) (0.002) (0.002)Hyperinflation 0.005 0.020* 0.014 0.018
(0.010) (0.012) (0.011) (0.012)EMU 0.029*** 0.038*** 0.031*** 0.035***
(0.008) (0.012) (0.011) (0.012)EU6 -0.120*** -0.112*** -0.115***
(0.004) (0.003) (0.003)EU2004 -0.048** -0.045*** -0.044***
(0.021) (0.014) (0.015)SGPDEF -0.006 -0.005 -0.014*** -0.009*
(0.007) (0.006) (0.005) (0.006)SGPDEBT 0.014*** -0.035* -0.032*** -0.033***
(0.001) (0.019) (0.011) (0.012)IT/Float Countries -0.002 -0.015 -0.016* -0.018*
(0.010) (0.010) (0.010) (0.010)Peg Countries 0.020** 0.008 -0.009 0.001
(0.010) (0.010) (0.011) (0.010)Hyperinflation x SGPDEBT -0.014* 0.037** 0.001 0.002
(0.008) (0.017) (0.011) (0.014)Hyperinflation x EU15 -0.164*** -0.114*** -0.117***
(0.019) (0.014) (0.015)Observations 77,748 223,100 309,461 266,392Adjusted Pseudo R-Sq 0.45 0.39 0.37 0.38Notes: Average marginal effects are reported. Standard errors clustered by country are inparentheses. All specifications are estimated using country and time fixed effects.BL: Baseline; * p < .1, ** p < .05, *** p < .01.

Who Supports the ECB? 29
Table 7: Robustness Checks – Non-EMU Subsample, Difference with Euro-Area Inflationin Place of Actual Inflation
Regressors 1999-2004 2004-2011 1999-2011(1) (2) (3) (4)
Difference with EMU inflation (t) -0.006 -0.001 -0.000 -0.001(0.009) (0.002) (0.002) (0.002)
Gender Dummy -0.050*** -0.028*** -0.034*** -0.031***(0.008) (0.008) (0.009) (0.008)
Age (BL: 15-24)25-44 -0.010 0.012 0.003 0.008
(0.014) (0.008) (0.008) (0.007)45-64 0.001 0.015 0.006 0.012
(0.013) (0.010) (0.008) (0.008)65+ -0.005 0.022* 0.011 0.017*
(0.018) (0.012) (0.010) (0.010)Education (BL: Up to 15)
16-19 0.022*** 0.022*** 0.023*** 0.022***(0.007) (0.007) (0.005) (0.006)
20+ 0.057*** 0.047*** 0.051*** 0.050***(0.005) (0.014) (0.010) (0.012)
Still studying 0.027*** 0.038*** 0.036*** 0.038***(0.009) (0.013) (0.008) (0.009)
Political Placement (BL: Left)Centre 0.033** 0.023*** 0.026*** 0.025**
(0.015) (0.009) (0.010) (0.010)Right 0.066** 0.036*** 0.045*** 0.042***
(0.026) (0.013) (0.015) (0.014)Occupation Dummies
Unemployed -0.040*** -0.021*** -0.026*** -0.023***(0.010) (0.006) (0.006) (0.005)
Retired -0.016 -0.015*** -0.015** -0.015**(0.016) (0.004) (0.006) (0.006)
Economic Expectations (BL: Same)Better 0.025*** 0.029***
(0.005) (0.005)Worse -0.031*** -0.031***
(0.004) (0.004)Other Dummies and InteractionsTrust in EU Commission 0.413*** 0.375*** 0.393*** 0.381***
(0.004) (0.001) (0.001) (0.001)Hyperinflation -0.226** 0.002 -0.006 0.001
(0.112) (0.011) (0.008) (0.009)EU2004 0.214 -0.110*** -0.098*** -0.098***
(0.163) (0.013) (0.014) (0.013)SGPDEF -0.235*** -0.003 -0.014* -0.008
(0.077) (0.007) (0.007) (0.007)SGPDEBT 0.018 -0.019** -0.019* -0.027***
(0.045) (0.008) (0.011) (0.009)IT/Float Countries 0.154** 0.009 0.019* 0.013
(0.076) (0.011) (0.010) (0.010)Peg Countries 0.050** 0.027** 0.023** 0.028**
(0.023) (0.011) (0.011) (0.012)Hyperinflation x SGPDEBT 0.023*** 0.014 0.026***
(0.006) (0.009) (0.007)Observations 27,431 85,812 115,841 104,690Adjusted Pseudo R-Sq 0.36 0.42 0.41 0.41Notes: Average marginal effects are reported. Standard errors clustered by country are inparentheses. All specifications are estimated using country and time fixed effects.BL: Baseline; * p < .1, ** p < .05, *** p < .01.

30 Farvaque, Hayat and Mihailov (Revised: October 2012)
Table 8: Robustness Checks – EMU Subsample, Expected Inflation in Place of ActualInflation
Regressors 1999-2004 2004-2011 1999-2011(1) (2) (3) (4)
Expected inflation (at t) -0.039 0.010 0.008 0.012*(0.038) (0.007) (0.007) (0.007)
Gender Dummy -0.021*** -0.035*** -0.030*** -0.031***(0.005) (0.008) (0.006) (0.006)
Age (BL: 15-24)25-44 0.008 0.010** 0.008 0.008
(0.007) (0.004) (0.005) (0.005)45-64 0.019** 0.028*** 0.022*** 0.025***
(0.008) (0.005) (0.005) (0.005)65+ 0.015 0.046*** 0.031*** 0.036***
(0.010) (0.008) (0.007) (0.007)Education (BL: Up to 15)
16-19 0.014*** 0.031*** 0.025*** 0.027***(0.005) (0.005) (0.004) (0.004)
20+ 0.046*** 0.078*** 0.067*** 0.069***(0.008) (0.010) (0.008) (0.009)
Still studying 0.031*** 0.039*** 0.038*** 0.034***(0.008) (0.004) (0.005) (0.004)
Political Placement (BL: Left)Centre 0.020*** 0.015*** 0.018*** 0.017***
(0.004) (0.004) (0.003) (0.004)Right 0.025*** 0.030*** 0.030*** 0.030***
(0.006) (0.005) (0.004) (0.005)Occupation Dummies
Unemployed -0.033*** -0.031*** -0.033*** -0.033***(0.009) (0.009) (0.008) (0.008)
Retired 0.002 -0.008 -0.004 -0.005(0.005) (0.006) (0.004) (0.005)
Economic Expectations (BL: Same)Better 0.024*** 0.022***
(0.005) (0.004)Worse -0.037*** -0.041***
(0.006) (0.005)Other Dummies and InteractionsTrust in EU Commission 0.393*** 0.396*** 0.400*** 0.393***
(0.005) (0.005) (0.004) (0.005)Hyperinflation -0.051*** -0.029*** -0.028*** -0.031***
(0.009) (0.008) (0.007) (0.008)EU6 -0.094*** -0.124*** -0.115*** -0.119***
(0.005) (0.008) (0.004) (0.005)EU2004 -0.039 -0.017 -0.019
(0.030) (0.016) (0.019)SGPDEF -0.016** -0.006 -0.013* -0.009
(0.008) (0.013) (0.008) (0.009)SGPDEBT -0.005 -0.041 -0.027** -0.030**
(0.012) (0.029) (0.012) (0.015)Hyperinflation x SGPDEBT 0.020 0.003 -0.005
(0.013) (0.011) (0.011)Observations 77,662 113,571 193,620 161,702Adjusted Pseudo R-Sq 0.32 0.37 0.35 0.36Notes: Average marginal effects are reported. Standard errors clustered by country are inparentheses. All specifications are estimated using country and time fixed effects.BL: Baseline; * p < .1, ** p < .05, *** p < .01.
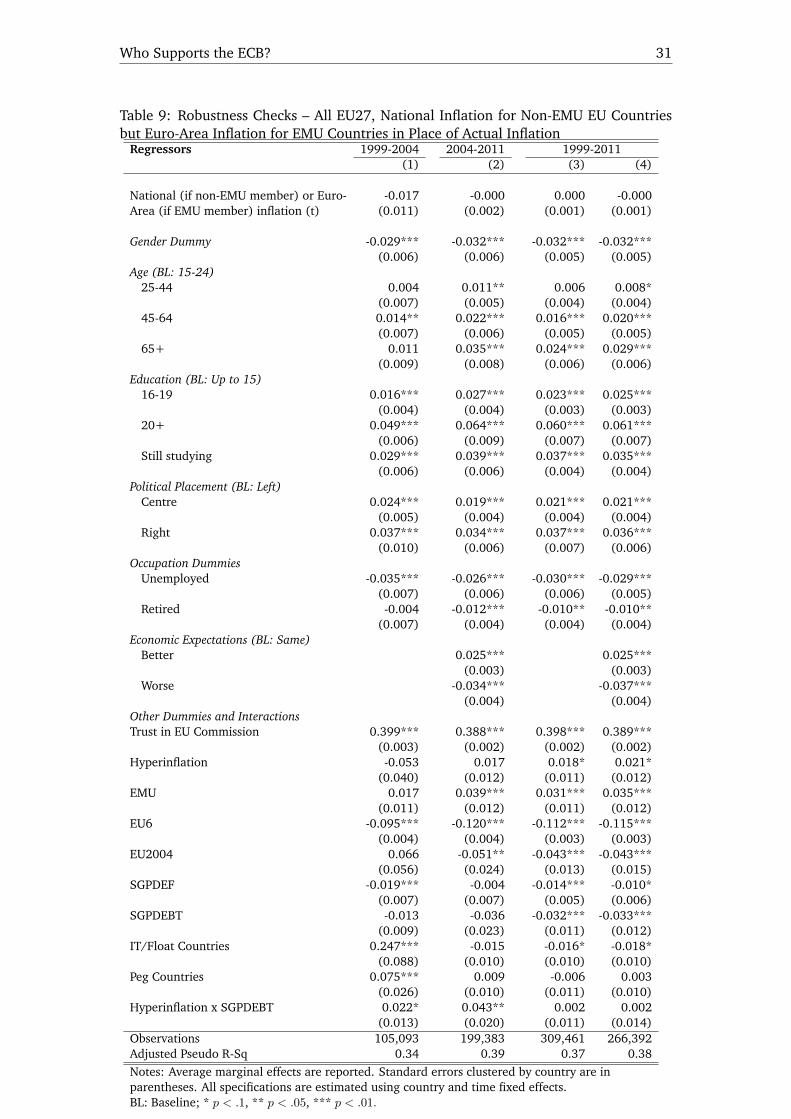
Who Supports the ECB? 31
Table 9: Robustness Checks – All EU27, National Inflation for Non-EMU EU Countriesbut Euro-Area Inflation for EMU Countries in Place of Actual Inflation
Regressors 1999-2004 2004-2011 1999-2011(1) (2) (3) (4)
National (if non-EMU member) or Euro- -0.017 -0.000 0.000 -0.000Area (if EMU member) inflation (t) (0.011) (0.002) (0.001) (0.001)
Gender Dummy -0.029*** -0.032*** -0.032*** -0.032***(0.006) (0.006) (0.005) (0.005)
Age (BL: 15-24)25-44 0.004 0.011** 0.006 0.008*
(0.007) (0.005) (0.004) (0.004)45-64 0.014** 0.022*** 0.016*** 0.020***
(0.007) (0.006) (0.005) (0.005)65+ 0.011 0.035*** 0.024*** 0.029***
(0.009) (0.008) (0.006) (0.006)Education (BL: Up to 15)
16-19 0.016*** 0.027*** 0.023*** 0.025***(0.004) (0.004) (0.003) (0.003)
20+ 0.049*** 0.064*** 0.060*** 0.061***(0.006) (0.009) (0.007) (0.007)
Still studying 0.029*** 0.039*** 0.037*** 0.035***(0.006) (0.006) (0.004) (0.004)
Political Placement (BL: Left)Centre 0.024*** 0.019*** 0.021*** 0.021***
(0.005) (0.004) (0.004) (0.004)Right 0.037*** 0.034*** 0.037*** 0.036***
(0.010) (0.006) (0.007) (0.006)Occupation Dummies
Unemployed -0.035*** -0.026*** -0.030*** -0.029***(0.007) (0.006) (0.006) (0.005)
Retired -0.004 -0.012*** -0.010** -0.010**(0.007) (0.004) (0.004) (0.004)
Economic Expectations (BL: Same)Better 0.025*** 0.025***
(0.003) (0.003)Worse -0.034*** -0.037***
(0.004) (0.004)Other Dummies and InteractionsTrust in EU Commission 0.399*** 0.388*** 0.398*** 0.389***
(0.003) (0.002) (0.002) (0.002)Hyperinflation -0.053 0.017 0.018* 0.021*
(0.040) (0.012) (0.011) (0.012)EMU 0.017 0.039*** 0.031*** 0.035***
(0.011) (0.012) (0.011) (0.012)EU6 -0.095*** -0.120*** -0.112*** -0.115***
(0.004) (0.004) (0.003) (0.003)EU2004 0.066 -0.051** -0.043*** -0.043***
(0.056) (0.024) (0.013) (0.015)SGPDEF -0.019*** -0.004 -0.014*** -0.010*
(0.007) (0.007) (0.005) (0.006)SGPDEBT -0.013 -0.036 -0.032*** -0.033***
(0.009) (0.023) (0.011) (0.012)IT/Float Countries 0.247*** -0.015 -0.016* -0.018*
(0.088) (0.010) (0.010) (0.010)Peg Countries 0.075*** 0.009 -0.006 0.003
(0.026) (0.010) (0.011) (0.010)Hyperinflation x SGPDEBT 0.022* 0.043** 0.002 0.002
(0.013) (0.020) (0.011) (0.014)Observations 105,093 199,383 309,461 266,392Adjusted Pseudo R-Sq 0.34 0.39 0.37 0.38Notes: Average marginal effects are reported. Standard errors clustered by country are inparentheses. All specifications are estimated using country and time fixed effects.BL: Baseline; * p < .1, ** p < .05, *** p < .01.

32 Farvaque, Hayat and Mihailov (Revised: October 2012)
Table 10: Evolution of Trust in the ECB after the Financial Crisis – All EU272007ξ-2011
Regressors Old EU15 New EU12 All EU27(1) (2) (3)
Inflation(t) 0.003 0.002 0.000(0.005) (0.001) (0.002)
Gender Dummy -0.044*** -0.012*** -0.033***(0.008) (0.003) (0.006)
Age (BL: 15-24)25-44 0.018** 0.005 0.013**
(0.008) (0.006) (0.005)45-64 0.035*** -0.001 0.021***
(0.007) (0.007) (0.006)65+ 0.060*** 0.003 0.038***
(0.010) (0.012) (0.009)Education (BL: Up to 15)
16-19 0.034*** 0.010*** 0.025***(0.007) (0.004) (0.005)
20+ 0.085*** 0.030*** 0.065***(0.012) (0.006) (0.010)
Still studying 0.047*** 0.028*** 0.040***(0.010) (0.009) (0.007)
Political Placement (BL: Left)Centre 0.019*** 0.012* 0.018***
(0.006) (0.006) (0.005)Right 0.038*** 0.027*** 0.037***
(0.007) (0.008) (0.006)Occupation Dummies
Unemployed -0.037*** -0.011* -0.026***(0.010) (0.006) (0.007)
Retired -0.018*** -0.008 -0.014***(0.007) (0.007) (0.005)
Economic Expectations (BL: Same)Better 0.022*** 0.023*** 0.023***
(0.005) (0.005) (0.004)Worse -0.029*** -0.029*** -0.029***
(0.007) (0.007) (0.005)Other Dummies and InteractionsTrust in EU Commission 0.393*** 0.373*** 0.393***
(0.006) (0.004) (0.002)Hyperinflation -0.140*** -0.034*** -0.009
(0.011) (0.011) (0.017)EMU 0.068** 0.007 0.026
(0.033) (0.011) (0.016)EU6 -0.117*** -0.119***
(0.007) (0.005)EU2004 -0.065**
(0.026)SGPDEF -0.018 0.014 -0.007
(0.018) (0.009) (0.013)SGPDEBT -0.047* -0.004 -0.049*
(0.026) (0.003) (0.027)IT/Float Countries -0.012 -0.011 -0.015
(0.014) (0.008) (0.010)Peg Countries 0.024 0.003 0.008
(0.016) (0.008) (0.011)Hyperinflation x SGPDEBT -0.033*** 0.009
(0.004) (0.027)Hyperinflation x EU15 -0.141***
(0.031)Observations 79,346 45,962 125,308Adjusted Pseudo R-Sq 0.37 0.46 0.40Notes: Average marginal effects are reported. Standard errors clustered by country are inparentheses. All specifications are estimated using country and time fixed effects.ξ Second wave of 2007.BL: Baseline; * p < .1, ** p < .05, *** p < .01.