
Fatherhood Research Bulletin special issue Fathers and Family Violence
Upload
khangminh22Category
view
2download
0
Economic Bulletin
Issue 8 / 2021
ECB Economic Bulletin, Issue 8 / 2021 – Contents 1
Contents
Economic, financial and monetary developments 2
Overview 2
1 External environment 7
2 Financial developments 16
3 Economic activity 22
4 Prices and costs 30
5 Money and credit 38
6 Fiscal developments 47
Boxes 51
1 Supply chain disruptions and the effects on the global economy 51
2 The US and UK labour markets in the post-pandemic recovery 58
3 Financing conditions through the lens of euro area companies 63
4 Decomposing market-based measures of inflation compensation into
inflation expectations and risk premia 71
5 Liquidity conditions and monetary policy operations from 28 July to 2
November 2021 76
6 The ECB’s communication on the economic outlook: a comparative
analysis 82
7 Sources of supply chain disruptions and their impact on euro area
manufacturing 87
8 Fiscal policies in 2022 – implications of the 2022 draft budgetary plans 92
Articles 97
1 The ECB Survey of Monetary Analysts: an introduction 97
2 ECB communication with the wider public 122
Statistics S1

ECB Economic Bulletin, Issue 8 / 2021 – Economic, financial and monetary developments
Overview 2
Economic, financial and monetary
developments
Overview
Economic activity
The global economy remains on a recovery path, although persisting supply
bottlenecks, rising commodity prices and the emergence of the Omicron
variant of the coronavirus (COVID-19) continue to weigh on the near-term
growth prospects. Recent surveys of economic activity suggest that growth
momentum remained weak at the start of the fourth quarter, particularly in the
manufacturing sector owing to the above-mentioned supply bottlenecks, whereas the
services sector benefited from the reopening of large economies. Compared with the
previous projections, the growth outlook for the global economy in the December
2021 Eurosystem staff macroeconomic projections has been revised downwards for
2021, remained unchanged for 2022 and been revised upwards for 2023. Global real
GDP growth (excluding the euro area) is estimated to increase to 6.0% in 2021,
before slowing to 4.5% in 2022, 3.9% in 2023 and 3.7% in 2024. Euro area foreign
demand is projected to expand by 8.9% in 2021, 4.0% in 2022, 4.3% in 2023 and
3.9% in 2024. However, foreign demand has been revised downwards for 2021 and
2022 compared with the previous projections. This reflects the adverse impact of the
ongoing supply bottlenecks on global imports. Supply bottlenecks are expected to
start easing from the second quarter of 2022 and to fully unwind by 2023. The export
prices of euro area competitors have been revised upwards for 2021 and 2022 amid
the confluence of higher commodity prices, supply bottlenecks and recovering
demand. The future course of the pandemic remains the key risk affecting the
baseline projections for the global economy. Other risks to the growth outlook are
judged to be tilted to the downside, whereas the balance of risks to global inflation is
more uncertain.
The euro area economy continues to recover. Growth is moderating, but
activity is expected to pick up again strongly in the course of this year. The
continued economic recovery is foreseen to be driven by robust domestic demand.
The labour market is improving, with more people having jobs and fewer in job
retention schemes. This supports the prospect of rising household income and
consumption. The savings built up during the pandemic will also support
consumption. Economic activity moderated over the final quarter of last year and this
slower growth is likely to extend into the early part of this year. We now expect
output to exceed its pre-pandemic level in the first quarter of 2022. To cope with the
current pandemic wave, some euro area countries have reintroduced tighter
containment measures. This could delay the recovery, especially in travel, tourism,
hospitality and entertainment. The pandemic is weighing on consumer and business
confidence and the spread of new virus variants is creating extra uncertainty. In
ECB Economic Bulletin, Issue 8 / 2021 – Economic, financial and monetary developments
Overview 3
addition, rising energy costs are a headwind for consumption. Shortages of
equipment, materials and labour in some sectors are hampering production of
manufactured goods, causing delays in construction and slowing down the recovery
in some parts of the services sector. These bottlenecks will persist for some time, but
they should ease during 2022.
Although the COVID-19 crisis continued to weigh heavily on public finances in
2021, the December Eurosystem staff macroeconomic projections show that
the fiscal balance is already on a path to improvement. Having peaked at 7.2%
of GDP in 2020, the deficit ratio is estimated to have fallen to 5.9% in 2021 and is
projected to fall further to 3.2% in 2022 and to stabilise just below 2% by the end of
the forecast horizon in 2024. These improvements are due to a combination of
higher cyclically adjusted primary balances and, particularly from 2022, a
significantly larger contribution from the economic cycle. In terms of the euro area
fiscal stance, a strong expansion in 2020 was followed by only a marginal tightening
in 2021 once adjusted for Next Generation EU (NGEU) grants. In 2022, the stance is
projected to tighten considerably, albeit much less than forecast previously, mainly
owing to a reversal of a significant part of crisis emergency support. The tightening is
projected to continue over the remainder of the forecast horizon, but to a much
smaller extent, as significant support to the economy will remain in place over the
coming years. Targeted and growth-friendly fiscal measures should continue to
complement monetary policy. This support will also help the economy adjust to the
structural changes that are under way. An effective implementation of the NGEU
programme and the “Fit for 55” package will contribute to a stronger, greener and
more even recovery across euro area countries.
Growth is expected to rebound strongly over the course of 2022. The December
Eurosystem staff macroeconomic projections foresee annual real GDP growth at
5.1% in 2021, 4.2% in 2022, 2.9% in 2023 and 1.6% in 2024. Compared with the
September staff projections, the outlook has been revised down for 2022 and up for
2023.
Inflation
Inflation increased further to 4.9% in November. It will remain above 2% for most
of 2022. Inflation is expected to remain elevated in the near term, but to decline in
the course of this year. The upswing in inflation primarily reflects a sharp rise in
prices for fuel, gas and electricity. In November, energy inflation accounted for more
than half of headline inflation. Demand also continues to outpace constrained supply
in certain sectors. The consequences are especially visible in the prices of durable
goods and those consumer services that have recently reopened. Base effects
related to the reversal of the VAT cut in Germany are still contributing to higher
inflation, but only until the end of 2021. There is uncertainty as to how long it will take
for these issues to resolve. But, in the course of 2022, energy prices are expected to
stabilise, consumption patterns to normalise, and price pressures stemming from
global supply bottlenecks to subside. Over time, the gradual return of the economy to
full capacity and further improvements in the labour market should support faster

ECB Economic Bulletin, Issue 8 / 2021 – Economic, financial and monetary developments
Overview 4
growth in wages. Market and survey-based measures of longer-term inflation
expectations have remained broadly stable since the October monetary policy
meeting. But overall, these have moved closer to 2% in recent months. These
factors will help underlying inflation to move up and bring headline inflation up to the
ECB’s 2% target over the medium term.
The December 2021 Eurosystem staff macroeconomic projections foresee
annual inflation at 2.6% in 2021, 3.2% in 2022, 1.8% in 2023 and 1.8% in 2024 –
significantly higher than in the previous projections in September. Inflation
excluding food and energy is projected to average 1.4% in 2021, 1.9% in 2022, 1.7%
in 2023 and 1.8% in 2024, also higher than in the September projections.
Risk assessment
The Governing Council sees the risks to the economic outlook as broadly
balanced. Economic activity could outperform the ECB’s expectations if consumers
become more confident and save less than expected. By contrast, the recent
worsening of the pandemic, including the spread of new variants, could be a more
persistent drag on growth. The future path of energy prices and the pace at which
supply bottlenecks are resolved are risks to the recovery and to the outlook for
inflation. If price pressures feed through into higher than anticipated wage rises or
the economy returns more quickly to full capacity, inflation could turn out to be
higher.
Financial and monetary conditions
Market interest rates have remained broadly stable since the October
Governing Council meeting. Over the review period (9 September to 15 December
2021), euro area financial markets were predominantly influenced by shifts in the
inflation outlook and renewed uncertainty about further COVID-19-related economic
repercussions. The news of the new Omicron variant created volatility, but the strong
initial negative impact, especially on risk assets, partly reversed towards the end of
the review period.
Money creation in the euro area edged up in October 2021, reflecting greater
uncertainty related to the COVID-19 pandemic and policy support measures.
Eurosystem asset purchases remained the dominant source of money creation.
Bank lending rates for firms and households remained at historically low levels.
Overall, financing conditions for the economy remain favourable. Lending to firms is
partly driven by short-term funding needs stemming from supply bottlenecks that
increase their expenses for inventory and working capital. At the same time,
corporate demand for loans remains moderate because of retained earnings and
generous cash holdings, as well as high debt. Lending to households remains robust
– driven by demand for mortgages. Euro area banks have further strengthened their
balance sheets thanks to higher capital ratios and fewer non-performing loans.

ECB Economic Bulletin, Issue 8 / 2021 – Economic, financial and monetary developments
Overview 5
Banks are now as profitable as they were before the pandemic. Bank funding
conditions remain favourable overall.
In line with the new monetary policy strategy, twice a year the Governing
Council assesses in-depth the interrelation between monetary policy and
financial stability. An accommodative monetary policy underpins growth, which
supports the balance sheets of companies and financial institutions, as well as
preventing risks of market fragmentation. At the same time, the impact of
accommodative monetary policy on property markets and financial markets warrants
close monitoring as a number of medium-term vulnerabilities have intensified. Still,
macroprudential policy remains the first line of defence in preserving financial
stability and addressing medium-term vulnerabilities.
Monetary policy decisions
At its monetary policy meeting in December, the Governing Council judged that the
progress on economic recovery and towards the ECB’s medium-term inflation target
permits a step-by-step reduction in the pace of its asset purchases over the coming
quarters. But monetary accommodation is still needed for inflation to stabilise at the
ECB’s 2% inflation target over the medium term. In view of the current uncertainty,
the Governing Council needs to maintain flexibility and optionality in the conduct of
monetary policy. With this is mind, the Governing Council took the following
decisions.
First, in the first quarter of 2022, the Governing Council expects to conduct net asset
purchases under the pandemic emergency purchase programme (PEPP) at a lower
pace than in the previous quarter. Net asset purchases under the PEPP will be
discontinued at the end of March 2022.
Second, the Governing Council decided to extend the reinvestment horizon for the
PEPP. It now intends to reinvest the principal payments from maturing securities
purchased under the PEPP until at least the end of 2024. In any case, the future roll-
off of the PEPP portfolio will be managed to avoid interference with the appropriate
monetary policy stance.
Third, the pandemic has shown that, under stressed conditions, flexibility in the
design and conduct of asset purchases has helped to counter the impaired
transmission of the ECB’s monetary policy and made the efforts to achieve the
Governing Council’s goal more effective. Within the ECB’s mandate, under stressed
conditions, flexibility will remain an element of monetary policy whenever threats to
monetary policy transmission jeopardise the attainment of price stability. In particular,
in the event of renewed market fragmentation related to the pandemic, PEPP
reinvestments can be adjusted flexibly across time, asset classes and jurisdictions at
any time. This could include purchasing bonds issued by the Hellenic Republic over
and above rollovers of redemptions in order to avoid an interruption of purchases in
that jurisdiction, which could impair the transmission of monetary policy to the Greek
economy while it is still recovering from the fallout of the pandemic. Net purchases

ECB Economic Bulletin, Issue 8 / 2021 – Economic, financial and monetary developments
Overview 6
under the PEPP could also be resumed, if necessary, to counter negative shocks
related to the pandemic.
Fourth, in line with a step-by-step reduction in asset purchases and to ensure that
the monetary policy stance remains consistent with inflation stabilising at the ECB’s
2% target over the medium term, the Governing Council decided on a monthly net
purchase pace of €40 billion in the second quarter and €30 billion in the third quarter
under the asset purchase programme (APP). From October 2022 onwards, net asset
purchases under the APP will be maintained at a monthly pace of €20 billion for as
long as necessary to reinforce the accommodative impact of the policy rates. The
Governing Council expects net purchases to end shortly before it starts raising the
key ECB interest rates.
The Governing Council also confirmed its other measures to support the ECB’s price
stability mandate, namely the level of the key ECB interest rates and the forward
guidance on the future path of policy rates. This is crucial for maintaining the
appropriate degree of accommodation to stabilise inflation at the ECB’s 2% inflation
target over the medium term.
The Governing Council will continue to monitor bank funding conditions and ensure
that the maturing of operations under the third series of targeted longer-term
refinancing operations (TLTRO III) does not hamper the smooth transmission of its
monetary policy. It will also regularly assess how targeted lending operations are
contributing to its monetary policy stance. As announced, the Governing Council
expects the special conditions applicable under TLTRO III to end in June this year. It
will also assess the appropriate calibration of its two-tier system for reserve
remuneration so that the negative interest rate policy does not limit banks’
intermediation capacity in an environment of ample excess liquidity.
The Governing Council stands ready to adjust all of its instruments, as appropriate
and in either direction, to ensure that inflation stabilises at the ECB’s 2% target over
the medium term.

ECB Economic Bulletin, Issue 8 / 2021 – Economic, financial and monetary developments
External environment 7
1 External environment
The December 2021 Eurosystem staff macroeconomic projections suggest that the
global economy remains on a recovery path, although headwinds relating to supply
bottlenecks and high commodity prices and the emergence of the Omicron variant of
the coronavirus (COVID-19) continue to weigh on near-term growth prospects.
Recent surveys of economic activity suggest that growth momentum remained weak
at the start of the fourth quarter, particularly in the manufacturing sector owing to
supply bottlenecks, whereas the services sector has benefited from the reopening of
large economies. Compared with the previous projections, the growth outlook for the
global economy has been revised downwards for 2021, remained unchanged for
2022 and been revised upwards for 2023. Global (excluding the euro area) real GDP
growth is estimated to increase to 6.0% in 2021, before slowing to 4.5% in 2022,
3.9% in 2023 and 3.7% in 2024. Euro area foreign demand is projected to expand by
8.9% in 2021, 4.0% in 2022, 4.3% in 2023 and 3.9% in 2024. However, foreign
demand has been revised downwards in 2021 and 2022 compared with the previous
projections. This reflects the adverse impact of ongoing supply bottlenecks on global
imports. Supply bottlenecks are expected to start easing from the second quarter of
2022 and to fully unwind by 2023. The export prices of the euro area’s competitors
have been revised upwards for 2021 and 2022 amid the confluence of higher
commodity prices, supply bottlenecks and recovering demand. The future course of
the pandemic remains the key risk affecting the baseline projections for the global
economy. Other risks to the growth outlook are judged to be tilted to the downside,
whereas the balance of risks to global inflation is more uncertain.
Global economic activity and trade
In 2021 the recovery in global economic activity and trade was less smooth
than previously expected. Pandemic developments dented consumer confidence,
even in the absence of strong containment measures. More recently, the emergence
of the Omicron variant, has threatened an intensification of the pandemic on a global
scale and further raised uncertainty about its future evolution. Meanwhile other
headwinds weighed on activity and trade and put upward pressure on prices. Strains
on global production networks have intensified in the course of 2021 and particularly
affected large advanced economies and the manufacturing sector (especially the
automotive industry). The turmoil in China’s residential property market and a
tightening of monetary policy in some emerging market economies (EMEs) have
further capped the speed of recovery. Finally, rising commodity prices have led to the
build-up of inflationary pressures across the globe. Compared with the September
2021 ECB staff macroeconomic projections, real GDP growth in the third quarter
disappointed in a number of countries, including the United States, China and the
United Kingdom. The global picture is, however, influenced by India, where a strong
resurgence of COVID-19 infections in the second quarter of last year caused a sharp
contraction in economic activity, followed by a V-shaped recovery in the third quarter
– in contrast to several other economies that were facing new spikes in the number
of infections at that time. The sheer size of the decline and subsequent recovery of

ECB Economic Bulletin, Issue 8 / 2021 – Economic, financial and monetary developments
External environment 8
activity in India entails an increase in global real GDP growth (excluding the euro
area) in the third and fourth quarters; however, this is not supported by
developments in other large economies.
Survey indicators confirm weak momentum in activity going into the fourth
quarter of 2021 amid persisting supply-side disruptions. Global industrial
production stalled in August amid continued chip shortages, with the automotive
sector exerting a significant drag. The global composite output Purchasing
Managers’ Index (PMI) for November confirms weak dynamics in the manufacturing
sector, while the services sector remained comparatively stronger amid the gradual
reopening of large economies. Overall, recent PMI data suggest a two-speed
recovery across sectors at the start of the fourth quarter (Chart 1).
Chart 1
Global (excluding the euro area) output PMI by sectors
(diffusion indices)
Sources: Markit and ECB calculations.
Note: The latest observations are for November 2021.
Global financial conditions were stable until news about the Omicron variant
sparked a sell-off in risky assets and increased volatility. Financial conditions
feeding into the December 2021 Eurosystem staff macroeconomic projections
remained accommodative and broadly stable compared with the previous projection
round. This stability reflected a steady increase in equity prices supported by
buoyant earnings outcomes, which were broadly offset by increasing expectations of
a tighter monetary policy stance against the backdrop of rising inflation, as well as a
renewed surge in COVID-19 infections in Europe. Following the Federal Open
Market Committee (FOMC) communication in November, financial markets started to
price in expectations of an accelerated tapering of asset purchases and the earlier
and steeper tightening path implied by the federal funds futures curve rate. Concerns
about property developer Evergrande in China were largely confined to local
financial markets. Sovereign and corporate bond spreads in other EMEs remained
broadly stable. After the cut-off date for the December projections, news about the
Omicron variant sparked a sell-off in risky assets, resulting in tighter financial
conditions across advanced economies and EMEs. Since then global equity markets
25
30
35
40
45
50
55
60
65
01/20 03/20 05/20 07/20 09/20 11/20 01/21 03/21 05/21 07/21 09/21 11/21
Manufacturing
Services

ECB Economic Bulletin, Issue 8 / 2021 – Economic, financial and monetary developments
External environment 9
have recouped part of their losses and the upward trend in the federal funds futures
curve has continued.
The near-term outlook for global economic activity and trade will be shaped by
the evolution of the pandemic and the pace at which supply bottlenecks
unwind. Pandemic developments intensified in some regions, particularly Europe,
while improving across others. A resurgence of containment measures could
materially cloud the near-term global outlook and increase the dispersion of growth
outcomes across countries. Global trade in goods continues to be constrained by
supply bottlenecks, while global demand for goods remains strong.1 This is reflected,
for instance, in semiconductor production and shipping volumes, which are well
above their respective pre-pandemic trends. Strains in global production networks
might indeed be further amplified by a precautionary hoarding of intermediary goods
in some industries as firms seek to build buffers against possible shortages.
Global (excluding the euro area) real GDP growth is estimated at 6.0% for 2021
and is projected to gradually moderate over the projection horizon. This is
slightly weaker (by 0.3 percentage points) than forecast in the September 2021 ECB
staff macroeconomic projections. The weaker activity is due to the resurgence of
COVID-19 infections, the detrimental impact of supply bottlenecks and weaker
growth in China. Supply bottlenecks are projected to continue weighing on activity
across advanced economies in 2022, although to a lesser extent than on trade, as
consumers may substitute unavailable foreign products with domestic ones.
Moreover, the progressive rotation of consumption demand from goods back to
services is also expected to mitigate the impact of bottlenecks on goods
consumption. Looking ahead, global (excluding the euro area) real GDP growth is
projected to reach 4.5% in 2022, before moderating to 3.9% in 2023 and 3.7% in
2024. Compared with the September 2021 ECB staff macroeconomic projections,
growth remains unchanged for 2022 and has been revised slightly upwards for 2023
(by 0.2 percentage points). While global (excluding the euro area) real GDP had
surpassed its pre-pandemic level in late 2020, it is projected to remain somewhat
below its pre-pandemic path over the projection horizon. In fact, while advanced
economies and China have returned to their pre-crisis trajectories, the recovery
continues to lag behind in other EMEs and will weigh on the level of global activity
going forward.
In the United States, economic activity is recovering following subdued growth
in the third quarter caused by a resurgence of COVID-19 infections. Activity data
for October has generally rebounded, suggesting solid short-term growth
expectations. Since April, consumer demand has rotated towards services, away
from durable goods, which were also subject to supply bottlenecks amid strong
demand. In recent weeks, the waiting times and costs of shipping between China
and the United States have declined. However, volumes of durable goods
inventories remain below pre-pandemic levels, which should support growth once
current bottlenecks fully unwind. Annual headline consumer price index (CPI)
inflation increased to 6.8% in November. Energy prices accelerated, to 33% in
1 See Box 1 entitled “Supply chain disruptions and the effects on the global economy” in this issue of the
Economic Bulletin.

ECB Economic Bulletin, Issue 8 / 2021 – Economic, financial and monetary developments
External environment 10
annual terms, while annual food price inflation further increased to 6.1%. Excluding
food and energy, annual core inflation increased to 4.9% in November from 4.6% in
the previous month. Price pressures were more visible in goods, amid persistent
supply chain bottlenecks, while remaining generally more contained in services.
Overall, inflationary pressures are expected to remain high in the coming months,
with annual headline CPI inflation forecast to only start gradually decreasing from its
currently elevated levels from early 2022. Meanwhile wage pressures are rising, as
suggested by the employment cost index, which increased by close to 4% in annual
terms in the third quarter. This increase was substantially stronger and also broader
across industries compared with outturns from earlier in the year.
In China, activity decelerated sharply owing to energy shortages, the turmoil in
the residential property sector and renewed COVID-19 outbreaks. Consumer
confidence surveys provided mixed signals regarding private consumption, while
production and investment are possibly being constrained by supply bottlenecks.
Energy demand remains elevated, but there have been recent signs of easing
pressure, partly owing to the policies to boost coal supply and the use of national
stockpiles in an effort to bring domestic oil prices down and ensure energy security.
The turmoil in the residential property sector continued, as the real estate developer
Evergrande was declared to be in “restricted default” by a rating agency. The default
was largely expected and follows those of smaller firms. Evergrande had already
entered a managed restructuring process, with government representatives joining a
risk management committee to oversee Evergrande, maintain its operations and
restructure its debts. Authorities have provided policy support, with the People’s
Bank of China cutting the banks’ reserve requirement ratio in December and the
central government signalling a more supportive stance towards the property sector.
These policy actions are aimed at managing the slowdown and avoiding a sharper
contraction in both the residential sector and the broader economy. Headline year-
on-year CPI inflation increased to 2.3% in November from 1.5% in October, largely
owing to base effects, fuel price rises and food price increases amid disruptions to
harvests caused by adverse weather conditions.
In Japan, the economy slowed in the third quarter in the face of supply
bottlenecks and the resurgence in COVID-19 infections. Economic activity is
expected to rebound in the fourth quarter, reflecting a gradual easing of containment
measures, progress in vaccinations and continued policy support. These factors
should also support a more solid recovery in early 2022. Annual CPI inflation is
projected to return to positive territory and further rise over the projection horizon,
while remaining below the central bank’s target.
In the United Kingdom, incoming data suggest that activity remains subdued
following a weak outturn in the third quarter of 2021. A combination of supply
chain disruptions and labour shortages, driven by global conditions and Brexit, led to
a moderation in growth to 1.3% in the third quarter (down from 5.5% in the previous
quarter).2 Private consumption remained a driver of real activity as COVID-19
restrictions eased further, while investment, by contrast, continued to be very weak.
2 See Box 2 entitled “The US and UK labour markets in the post-pandemic recovery” in this issue of the
Economic Bulletin.
ECB Economic Bulletin, Issue 8 / 2021 – Economic, financial and monetary developments
External environment 11
The factors that weighed on activity over the summer months are expected to
continue into the coming months. As a result, economic activity in the United
Kingdom is expected to reach its pre-pandemic levels in the first quarter of 2022,
somewhat later than previously expected. Employment and participation in the
workforce have been slowly rising over recent months, whereas vacancies have
increased strongly, contributing to a sharp tightening in the labour market. This
tightness is a result of both a lower supply of EU workers and still below pre-
pandemic participation of national workers in the workforce. Shortages are
particularly pronounced in industries such as hospitality, construction and food.
Headline CPI inflation picked up to 4.2% in October from 3.1% in September. The
rise in annual headline inflation was mostly driven by energy prices, reflecting the
increase in the household energy price cap, a regulatory measure reset every April
and October. While underlying inflation remains more contained, inflationary
pressures started to broaden and are expected to remain sustained in the short run,
mainly on account of ongoing supply chain disruptions and rising energy prices.
Inflation is expected to peak in April 2022 owing to the scheduled adjustment of the
energy price cap, which will most likely be sizeable, as it will absorb energy price
increases from the second part of 2021.
In central and eastern EU Member States, activity remained solid in the third
quarter, but is expected to moderate. This moderation reflects a significant
deterioration of the epidemiological situation and persistent supply bottlenecks.
Rising energy prices are expected to put additional pressure on CPI inflation, which
is projected to peak in 2022 before gradually declining over the rest of the projection
horizon.
In large commodity-exporting countries, economic activity hinges on the
ability to tackle the COVID-19 outbreaks and the amount of policy space
available. In Russia, sharply increasing numbers of COVID-19 infections have led to
tighter containment measures, while rising global demand for oil and gas and the
associated positive terms of trade effect should support economic activity. Food
prices and demand pressures are projected to keep inflation high in the near term;
however, it is projected to return to the central bank’s target in the medium term. In
Brazil, economic activity is constrained by a tighter monetary policy stance and
limited fiscal space. CPI inflation, which continues to increase and recently reached
double digits, is expected to decline over the projection horizon.
In Turkey, economic activity has decelerated amid weakening domestic
demand. A supportive external environment was the main driver of growth in 2021.
Inflation has increased and is expected to remain at double digits over the forecast
horizon as a result of an overly expansive monetary policy stance which pushed the
lira to record lows against the US dollar, notwithstanding the central bank’s
interventions.
Global (excluding the euro area) trade growth moderated in 2021, reflecting
intensifying supply bottlenecks. The strong rebound in global trade that
materialised after the reopening of the global economy in mid-2020 started to
moderate in 2021. Global trade in goods peaked in March and has since
progressively decelerated, while remaining well above its pre-pandemic levels (Chart

ECB Economic Bulletin, Issue 8 / 2021 – Economic, financial and monetary developments
External environment 12
2). Incoming data on global (excluding the euro area) merchandise trade in the third
quarter point to downside risks to global trade estimates, mainly on account of
persisting supply bottlenecks, which are evident in lengthening supplier delivery
times. Furthermore, the weakness in the logistics sector affects trade more than
industrial production, as a shift towards domestic goods and suppliers helps cushion
the impact on industrial production. The impact of contracting merchandise trade on
global trade is somewhat mitigated by the growth in services trade, which has been
gathering momentum following the relaxation of international travel restrictions.
Chart 2
Global (excluding the euro area) imports of goods and new export orders
(left-hand scale: index, December 2019 = 100; right-hand scale: diffusion index)
Sources: Markit, CPB Netherlands Bureau for Economic Policy Analysis and ECB calculations.
Note: The latest observations are for November 2021 for the PMI data and September 2021 for global imports of goods.
Strains in global production networks, also referred to as supply bottlenecks,
are a multifaceted phenomenon. They reflect a combination of demand and supply
imbalances, resulting in shortages of intermediate inputs that are particularly felt in
large advanced economies and in the manufacturing sector (especially the
automotive industry).3 In the December 2021 Eurosystem staff macroeconomic
projections, supply bottlenecks are expected to affect a larger number of countries
and sectors than was forecast in the previous projection round. According to survey
data, these bottlenecks have intensified further in recent months and are assumed to
gradually start easing as of the second quarter of 2022, before fully unwinding by
2023.
These factors are weighing on euro area foreign demand, which was revised
downwards for 2021 and 2022 compared with the previous projections. The
unwinding of supply bottlenecks is then expected to lead to somewhat stronger euro
area foreign demand in the outer years of the projection horizon. Euro area foreign
demand growth is estimated to reach 8.9% in 2021 before decreasing to 4.0% in
2022, 4.3% in 2023 and 3.9% in 2024, respectively. The level of euro area foreign
3 See Box 1 entitled “Supply chain disruptions and the effects on the global economy” in this issue of the
Economic Bulletin.
25
30
35
40
45
50
55
60
75
80
85
90
95
100
105
110
01/20 03/20 05/20 07/20 09/20 11/20 01/21 03/21 05/21 07/21 09/21 11/21
Global (excluding the euro area) imports of goods
Advanced economies (excluding the euro area)
China
Emerging market economies (excluding China)
Global (excluding the euro area) manufacturing new export orders PMI (right-hand scale)

ECB Economic Bulletin, Issue 8 / 2021 – Economic, financial and monetary developments
External environment 13
demand is expected to initially remain below the level projected in the September
2021 ECB staff macroeconomic projections, before gradually converging back to the
previously forecast level by the end of the projection horizon. The projected path for
global (excluding the euro area) imports resembles that of euro area foreign
demand: it is estimated to increase by 11.1% in 2021, 3.9% in 2022, 4.4% in 2023
and 4.0% in 2024.
Risks around the baseline projections relate primarily to the evolution of the
pandemic. The baseline projections for the global economy are complemented by
two alternative pandemic scenarios – one mild and one severe. Key parameters in
these scenarios are the evolution of the pandemic, the associated path of
containment measures and the vaccine rollout. The severe scenario assumes that, in
EMEs, the first two parameters are more adverse and the vaccine rollout slower than
in advanced economies.4 The outcomes for global activity and euro area foreign
demand as a result of the two alternative pandemic scenarios are broadly
comparable to those presented in the September 2021 ECB staff projections. The
emergence of the Omicron variant is likely to induce higher volatility in global growth,
but at this stage its exact impact is highly uncertain.
The balance of other risks around the global (excluding the euro area) growth
outlook is tilted to the downside. An earlier and faster tightening of monetary
policy in large advanced economies may have spillover effects on financial
conditions in EMEs and would represent a downside risk to growth. In China, a
stronger slowdown in the real estate sector than currently expected would pose
downside risks to the outlook for global activity. Upside risks to growth include the
possibility that the US fiscal package has a larger fiscal multiplier than currently
assumed and that the stock of excess savings unwinds faster than expected in
advanced economies.
Global price developments
High energy prices remain a headwind for the global economy. Energy prices
have increased since the September 2021 ECB staff macroeconomic projections,
with the rise in oil prices reflecting both recovering demand and supply-side
developments. Oil demand rebounded as more countries reopened their economies,
including their borders to international travel, which led mobility levels to increase. Oil
demand has also been supported by the surge in gas prices, which has led to
substitution to other energy sources, including oil. Supply factors have also
contributed to the higher oil prices, as OPEC+ failed to reach its production targets
and Hurricane Ida caused extended supply disruptions in the United States. At the
end of November energy prices moderated somewhat amid a sharp drop in oil prices
caused by the emergence of the Omicron variant, reflecting concerns that a
resurgence in COVID-19 cases may weigh on global oil demand. Non-energy
commodity prices decreased over the review period. This was due to a decline in
metal commodity prices, driven by a marked drop in iron ore prices, partly reflecting
4 For further details, see Box 5 of “Eurosystem staff macroeconomic projections for the euro area,
December 2021”, published on the ECB’s website on 16 December 2021.

ECB Economic Bulletin, Issue 8 / 2021 – Economic, financial and monetary developments
External environment 14
falling steel demand from China. In contrast, food commodity prices increased owing
to tightness in the coffee and wheat markets.
Incoming data point to ongoing inflationary pressures. Strains on global logistics
and production networks – as well as labour market frictions in key advanced
economies – point to continued pipeline price pressures, as signalled by rising global
producer prices.5 CPI inflation across advanced economies remained elevated and
well above its historical average over the last two decades. In EMEs, CPI inflation
has also increased, but developments have been more diverse and, on average,
less pronounced. The impact of positive base effects from suppressed price levels
during the peak of pandemic lockdowns in 2020 has been significant for advanced
economies, as shown by the difference in inflation rates calculated over 12 and 24
months. For EMEs, this effect seems less pronounced. Looking ahead, the rise in
global CPI inflation is expected to be more persistent than previously anticipated and
to gradually moderate only in the course of 2022. Across member countries of the
Organisation for Economic Co-operation and Development (OECD), annual headline
CPI inflation increased to 5.2% in October from 4.6% in September (Chart 3). This
steep increase was driven by the surge of energy price inflation to the highest level
observed over the last four decades (24.2%), with base year effects still playing a
role. OECD core CPI inflation also increased in October to 3.5%, up from 3.2% in the
previous month.
Chart 3
OECD consumer price inflation
(year-on-year percentage changes; percentage point contributions)
Sources: OECD and ECB calculations.
Note: The latest observations are for October 2021.
Inflationary pressures are expected to remain elevated until mid-2022 and ease
thereafter as the underlying drivers fade. While the factors supporting inflationary
pressures, such as supply bottlenecks and labour shortages, are proving less
transitory than predicted in the September 2021 ECB staff macroeconomic
projections, these are assumed to start dissipating as of mid-2022. Over the
5 See Box 2 entitled “The US and UK labour markets in the post-pandemic recovery” in this issue of the
Economic Bulletin.
-1.5
-1.0
-0.5
0.0
0.5
1.0
1.5
2.0
2.5
3.0
3.5
4.0
4.5
5.0
5.5
01/19 03/19 05/19 07/19 09/19 11/19 01/20 03/20 05/20 07/20 09/20 11/20 01/21 03/21 05/21 07/21 09/21
Inflation including all components
Contribution of all components except food and energy
Food contribution
Energy contribution

ECB Economic Bulletin, Issue 8 / 2021 – Economic, financial and monetary developments
External environment 15
projection horizon, the expected rise in headline inflation globally will be reflected in
higher euro area competitor export prices. This increase is to a large extent
explained by rising global commodity prices, which in part reflect the base effects
from the pandemic shock in spring 2020.
ECB Economic Bulletin, Issue 8 / 2021 – Economic, financial and monetary developments
Financial developments 16
2 Financial developments
Over the review period (9 September to 15 December 2021), euro area financial
markets have been predominantly influenced by shifts in the inflation outlook and
renewed uncertainty about further economic repercussions relating to the
coronavirus (COVID-19). Specifically, the information about the new Omicron variant
induced significant intra-period volatility, but the strong initial impact, especially on
risk assets, partly reversed towards the end of the review period. The short end of
the benchmark euro short-term rate (€STR) forward curve increased markedly until
the end of October before falling back somewhat, signalling overall a significant
repricing by market participants towards an earlier rate hike compared to the start of
the review period. In line with short-term rates, risk-free long-term overnight index
swap (OIS) rates also followed a sawtooth pattern, increasing slightly overall.
Sovereign spreads over the OIS rate widened marginally in some jurisdictions and
tightened slightly in others, in the context of intra-period volatility. Equity markets
advanced globally until end-November, supported by a strong earnings season, but
thereafter suffered the worst setback in more than a year amid a sharp deterioration
in risk sentiment. Euro area corporate bond spreads widened slightly over the period,
but remained broadly unchanged overall. The euro depreciated against most major
currencies.
The benchmark €STR averaged -57 basis points over the review period. Excess
liquidity increased by approximately €26 billion to around €4,430 billion, mainly
reflecting asset purchases under the pandemic emergency purchase programme
(PEPP) and the asset purchase programme (APP), as well as the €97.57 billion
take-up of the ninth operation under the third series of targeted longer-term
refinancing operations (TLTRO III). At the same time, the growth in excess liquidity
was curtailed substantially by early repayments amounting to €79.24 billion of funds
borrowed under previous TLTRO III operations and by a net decline in other assets
of around €246 billion over the review period. This net decline in other assets was
predominantly driven by an increase of around €201 billion in Eurosystem liabilities
to non-euro area residents denominated in euro over the review period.
The short end of the €STR forward curve has shifted up markedly compared to
the September Governing Council meeting, suggesting a significant repricing
of rate hike expectations by market participants (Chart 4).6 The short end of the
€STR forward curve moved up during the first half of the review period in an
environment of increasing market-based inflation-compensation measures and
stronger expectations of a tightening of monetary policy at the global level. In the
second half of the review period, the curve moved down following the monetary
policy communication after the October Governing Council meeting and amid
intensifying coronavirus-related concerns. Overall, the market-implied rate lift-off
date – defined as the time when the €STR forward curve surpasses the current level
6 From now on, the €STR OIS forward curve will be reported rather than the EONIA OIS forward curve.
The change is being made because the EONIA was discontinued on 3 January 2022 as it no longer
complied with benchmark rate regulations. The two OIS forward curves are mechanically linked as,
since 2 October 2019, the EONIA has been computed as the €STR plus a fixed spread of 8.5 basis
points. See the box entitled “Goodbye EONIA, welcome €STR!”, Economic Bulletin, Issue 7, ECB,
2019.

ECB Economic Bulletin, Issue 8 / 2021 – Economic, financial and monetary developments
Financial developments 17
of the €STR plus 10 basis points – has shifted forward by about a year, to late
December 2022. However, the expected rate path and lift-off timing has been
surrounded by a high level of uncertainty, as reflected in money markets’ elevated
volatility.
Chart 4
€STR forward rates
(percentages per annum)
Sources: Bloomberg and ECB calculations.
Long-term average euro area sovereign bond yields continued to follow risk-
free rates closely and stood slightly higher at the end of the review period
amid some intra-period volatility (Chart 5). In the context of improving medium-
term economic prospects at the global level, long-term euro area sovereign yields
increased between early September and the end of October. However, these
subsequently declined, following central bank communication and reflecting
perceived downside risks for the economic outlook amid fears about the impact of
new coronavirus-related restrictions, fuelled in particular by news about the Omicron
variant. Overall, both the GDP-weighted euro area ten-year sovereign bond yield and
the ten-year risk-free OIS rate based on the €STR increased by almost 10 basis
points, to 0.06% and -0.07% respectively. Developments were fairly similar in the
United States, where the ten-year sovereign bond yield initially increased before
partially reversing that trend to stand 16 basis points higher at 1.46% at the end of
the review period.
-0.75
-0.50
-0.25
0.00
0.25
2019 2020 2021 2022 2023 2024 2025 2026 2027 2028
Realised €STR
€STR forward curve 15 December 2021
€STR forward curve 9 September 2021

ECB Economic Bulletin, Issue 8 / 2021 – Economic, financial and monetary developments
Financial developments 18
Chart 5
Ten-year sovereign bond yields and OIS rate based on the €STR
(percentages per annum)
Sources: Refinitiv and ECB calculations.
Notes: The vertical grey line denotes the start of the review period on 9 September 2021. The latest observation is for 15 December
2021.
Long-term euro area sovereign spreads relative to OIS rates widened in some
jurisdictions and tightened slightly in others amid the increased uncertainty
(Chart 6). Sovereign bond markets displayed significant but temporary spread
increases in the last week of October (e.g. 32 basis points in Italy, 18 basis points in
Portugal and 14 basis points in Spain). As of November, long-term sovereign
spreads decreased somewhat in Germany and France, overall standing lower by
around 10 basis points, driven by high demand for safe bonds amid thin sovereign
market liquidity, and to some extent exhibiting a typical year-end pattern. Overall,
spreads remained relatively stable in Portugal and Spain but increased in Italy by
around 15 basis points over the review period.
-1.0
-0.5
0.0
0.5
1.0
1.5
2.0
2.5
3.0
3.5
01/18 07/18 01/19 07/19 01/20 07/20 01/21 07/21
GDP-weighted euro area average
United Kingdom
United States
Germany
Ten-year euro area overnight index swap rate (OIS)

ECB Economic Bulletin, Issue 8 / 2021 – Economic, financial and monetary developments
Financial developments 19
Chart 6
Ten-year euro area sovereign bond spreads vis-à-vis the €STR OIS rate
(percentage points)
Sources: Refinitiv and ECB calculations.
Notes: The spread is calculated by subtracting the ten-year €STR OIS rate from the ten-year sovereign bond yield. The vertical grey
line denotes the start of the review period on 9 September 2021. The latest observation is for 15 December 2021.
Supported by a strong corporate earnings season, global equity markets
continued their rise in the first part of the review period, before dropping
sharply in response to news about the recently discovered Omicron variant
(Chart 7). For most of the review period, solid earnings growth expectations
supported the overall positive evolution of euro area equity prices, which by 25
November had risen by 2% overall. From the end of November, however, uncertainty
about the rapid spread of the Omicron variant and its impact on the global economy
put a stop to the continued strong rise in equity prices on both sides of the Atlantic
and prices decreased sharply, largely reflecting a rise in the equity risk premium. The
market impact of this new, potentially faster-spreading coronavirus variant was larger
in the euro area than in the United States. Equity prices of euro area non-financial
corporations (NFCs) edged down by 1.1% while they increased by 3.0% in the
United States. US bank equity prices recorded an increase of 3%, while in the euro
area they edged up by just 0.2%.
-1.0
-0.5
0.0
0.5
1.0
1.5
2.0
2.5
3.0
3.5
01/18 07/18 01/19 07/19 01/20 07/20 01/21 07/21
GDP-weighted euro area average
Germany
France
Italy
Spain
Portugal

ECB Economic Bulletin, Issue 8 / 2021 – Economic, financial and monetary developments
Financial developments 20
Chart 7
Euro area and US equity price indices
(index: 1 January 2018 = 100)
Sources: Refinitiv and ECB calculations.
Notes: The vertical grey line denotes the start of the review period on 9 September 2021. The latest observation is for 15 December
2021.
Mirroring the developments in equity prices, euro area corporate bond spreads
widened slightly on the news of the Omicron variant and displayed some
volatility thereafter (Chart 8). Over the review period as a whole, the investment-
grade NFC bond spread and the financial sector bond spread (relative to the risk-
free rate) remained broadly unchanged. Taking a longer-term view, the continued
declining trend in recent months can largely be attributed to excess bond premia, i.e.
the component of euro area corporate bond spreads that is unexplained by
economic, credit and uncertainty-related factors.
Chart 8
Euro area corporate bond spreads
(basis points)
Sources: Markit iBoxx indices and ECB calculations.
Notes: The spreads are the difference between asset swap rates and the risk-free rate. The indices comprise bonds of different
maturities (with at least one year remaining) with an investment-grade rating. The vertical grey line denotes the start of the review
period on 9 September 2021. The latest observation is for 15 December 2021.
25
50
75
100
125
150
175
200
01/18 07/18 01/19 07/19 01/20 07/20 01/21 07/21
Euro area banks
Euro area NFCs
US banks
US NFCs
0
50
100
150
200
250
01/18 07/18 01/19 07/19 01/20 07/20 01/21 07/21
Financial corporate bond spreads
NFC bond spreads

ECB Economic Bulletin, Issue 8 / 2021 – Economic, financial and monetary developments
Financial developments 21
In foreign exchange markets, the euro depreciated in trade-weighted terms
(Chart 9), reflecting a broad-based weakening against the US dollar in
particular as well as against most other major currencies. Over the review
period, the nominal effective exchange rate of the euro, as measured against the
currencies of 42 of the euro area’s most important trading partners, weakened by
1.2%. The euro depreciated markedly against the US dollar (by 4.9%), reflecting the
widening of the short-term interest rate expectations differential between the euro
area and the United States, driven by the faster rebound in economic activity and
higher inflation in the United States and the path of US monetary policy. The euro
also weakened against other major currencies, including the Chinese renminbi (by
6.2%), the Swiss franc (by 4.1%), the Japanese yen (by 1.4%) and the pound
sterling (by 0.7%). Over the same period, the euro strengthened against the
currencies of several non-euro area EU Member States, including the Hungarian
forint (by 5.2%) and the Polish zloty (by 2.1%).
Chart 9
Changes in the exchange rate of the euro vis-à-vis selected currencies
(percentage changes)
Source: ECB.
Notes: EER-42 is the nominal effective exchange rate of the euro against the currencies of 42 of the euro area’s most important
trading partners. A positive (negative) change corresponds to an appreciation (depreciation) of the euro. All changes have been
calculated using the foreign exchange rates prevailing on 15 December 2021.
-10.0 -7.5 -5.0 -2.5 0.0 2.5 5.0 7.5
Croatian kuna
Indian rupee
Brazilian real
Taiwan dollar
Romanian leu
Danish krone
Hungarian forint
Indonesian rupiah
South Korean won
Russian rouble
Swedish krona
Czech koruna
Polish zloty
Japanese yen
Swiss franc
Pound sterling
US dollar
Chinese renminbi
EER-42
Since 9 September 2021
Since 15 December 2020

ECB Economic Bulletin, Issue 8 / 2021 – Economic, financial and monetary developments
Economic activity 22
3 Economic activity
The euro area recovery continued in the third quarter of 2021, with activity
strengthening further to stand close to the pre-pandemic level of output. Private
consumption was the main driver of third-quarter growth, with a further modest
contribution from net trade. A further substantial increase in services activity was a
major contributor, particularly in the hospitality and leisure segments, which benefited
from the progressive loosening of restrictions over the course of the summer.
Meanwhile, industry and construction detracted from headline growth amid
deepening supply shortages over the summer months.
Supply disruptions, energy price increases and further restrictions on activity related
to a resurgence of the pandemic in some euro area countries are estimated to have
weighed on activity in the final quarter of the year. The surge in coronavirus
(COVID-19) infection rates since late November, a reintroduction of containment
measures in several euro area countries and growing concerns about the Omicron
variant are likely to weigh further on near-term confidence and activity.
Near-term disruptions and uncertainties notwithstanding, the basis for the ongoing
euro area recovery remains intact. The medium-term outlook continues to envisage
a further strengthening of domestic demand, alongside an improving labour market,
strengthening global growth and ongoing policy support from both monetary and
fiscal policy in the transition to self-supporting growth. This assessment is broadly
reflected in the baseline scenario of the December 2021 Eurosystem staff
macroeconomic projections for the euro area, which envisages annual real GDP
growth of 5.1% in 2021, 4.2% in 2022, 2.9% in 2023 and 1.6% in 2024, with a return
to pre-pandemic quarterly levels of activity expected by the first quarter of 2022.
Compared with the September 2021 ECB staff macroeconomic projections, the
outlook for economic activity has been revised downward for 2022, largely on
account of the recent intensification of global supply bottlenecks and tighter
pandemic-related restrictions in some euro area countries. In the medium term,
however, the unwinding of these headwinds is expected to lead to a strong upward
revision to growth in 2023 and increasingly self-sustaining growth thereafter.
Overall, the risks surrounding the outlook for euro area GDP growth are assessed as
being broadly balanced. On the one hand, growth could underperform if the recent
worsening of the pandemic, and the spread of new variants, results in a more
persistent drag on growth. On the other hand, a faster recovery could be expected if
the pandemic-driven increase in the stock of household savings unwinds more
quickly, or current supply-side bottlenecks ease faster, than is currently envisaged.
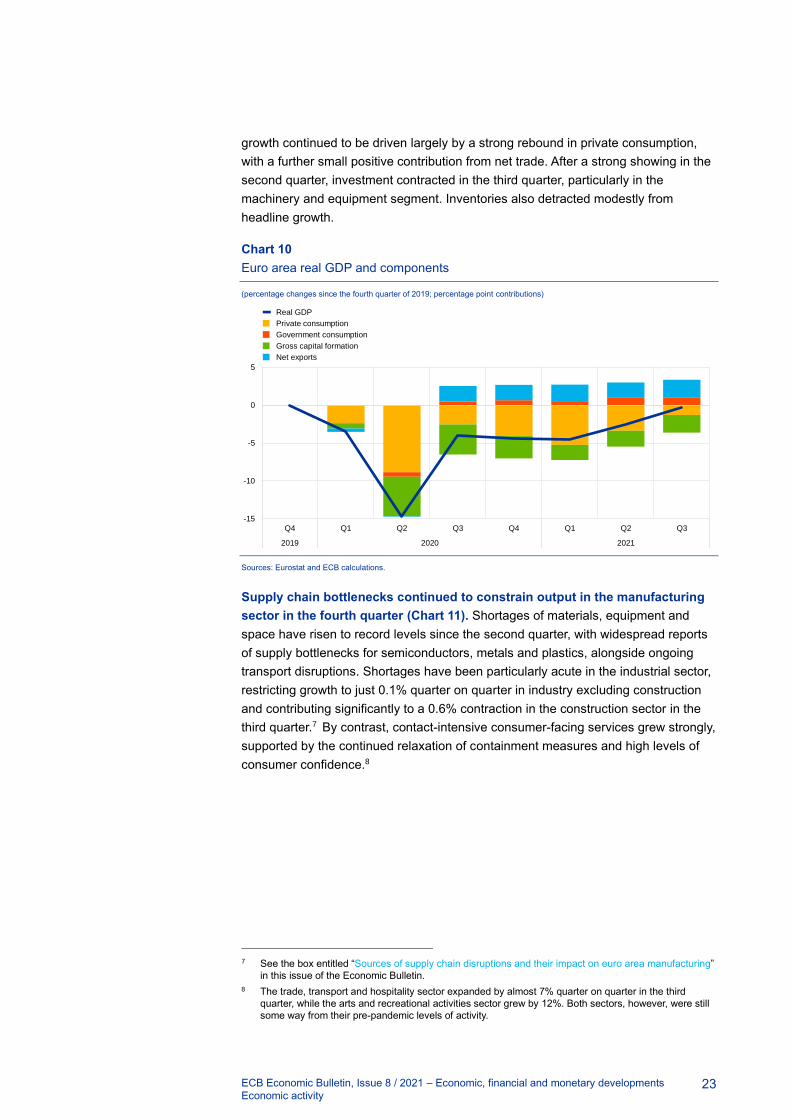
Euro area economic activity grew by a further 2.2% in the third quarter of 2021,
confirming that a strong mid-year recovery was under way despite intensifying
supply chain disruptions. After the technical recession at the start of 2021, real
GDP growth was robust in the second and third quarters – growing at a quarter-on-
quarter rate of 2.2% in both quarters – as pandemic containment measures were
progressively relaxed. The outcome is broadly in line with the profile envisaged in the
September 2021 ECB staff macroeconomic projections, with quarterly activity just
0.3% below the pre-pandemic level seen at the end of 2019 (Chart 10). Third-quarter
ECB Economic Bulletin, Issue 8 / 2021 – Economic, financial and monetary developments
Economic activity 23
growth continued to be driven largely by a strong rebound in private consumption,
with a further small positive contribution from net trade. After a strong showing in the
second quarter, investment contracted in the third quarter, particularly in the
machinery and equipment segment. Inventories also detracted modestly from
headline growth.
Chart 10
Euro area real GDP and components
(percentage changes since the fourth quarter of 2019; percentage point contributions)
Sources: Eurostat and ECB calculations.
Supply chain bottlenecks continued to constrain output in the manufacturing
sector in the fourth quarter (Chart 11). Shortages of materials, equipment and
space have risen to record levels since the second quarter, with widespread reports
of supply bottlenecks for semiconductors, metals and plastics, alongside ongoing
transport disruptions. Shortages have been particularly acute in the industrial sector,
restricting growth to just 0.1% quarter on quarter in industry excluding construction
and contributing significantly to a 0.6% contraction in the construction sector in the
third quarter.7 By contrast, contact-intensive consumer-facing services grew strongly,
supported by the continued relaxation of containment measures and high levels of
consumer confidence.8
7 See the box entitled “Sources of supply chain disruptions and their impact on euro area manufacturing”
in this issue of the Economic Bulletin.
8 The trade, transport and hospitality sector expanded by almost 7% quarter on quarter in the third
quarter, while the arts and recreational activities sector grew by 12%. Both sectors, however, were still
some way from their pre-pandemic levels of activity.
-15
-10
-5
0
5
Q4 Q1 Q2 Q3 Q4 Q1 Q2 Q3
2019 2020 2021
Real GDP
Private consumption
Government consumption
Gross capital formation
Net exports

ECB Economic Bulletin, Issue 8 / 2021 – Economic, financial and monetary developments
Economic activity 24
Chart 11
Factors limiting activity in the euro area
(percentages of respondents; difference relative to long-term average)
Source: European Commission.
Notes: The long-term average is computed for the period between 2003 and 2019. Quarterly surveys are carried out in the first month
of each quarter. The latest observations are for the fourth quarter of 2021 (October).
Euro area GDP growth is estimated to have slowed significantly in the fourth
quarter, amid high levels of short-term uncertainty. While a normalisation of
growth rates was expected following the strong rebound seen during the summer,
the current slowdown is likely to be amplified by the combined effects of the
intensification of supply chain disruptions, sharp increases in energy prices, a
renewed surge in COVID-19 infection rates and further concerns related to the
Omicron variant. The average of the composite output Purchasing Managers’ Index
(PMI) for October and November was lower than the third-quarter average (at 54.8,
down from 58.4), although the index still pointed to growth. The decline was
broad-based, but slightly stronger in manufacturing than in services. The European
Commission’s Economic Sentiment Indicator (ESI) worsened slightly in November,
but the average for the first two months of the fourth quarter remained in line with its
third-quarter average. Importantly, however, the latest surveys for the PMI and ESI
were largely concluded before the recent strong rises in COVID-19 cases and the
subsequent reintroduction of restrictions on activity in some euro area countries, as
well as being conducted before the first cases of the Omicron variant were identified
in Europe. Consumer confidence had already declined – from high levels – over the
first two months of the fourth quarter, following a resurgence of the pandemic and
strong increases in energy prices, which have constrained households’ purchasing
power. The European Commission’s quarterly business survey for the fourth quarter
pointed to intensifying shortages of materials and – increasingly – labour compared
with the third quarter (Chart 11). These shortages are likely to constrain near-term
activity through trade and investment to a stronger degree than was previously
envisaged. While near-term uncertainty about the degree and duration of these
challenges remains high, renewed progress with vaccination campaigns, learning
effects from earlier waves of the pandemic, the continuing favourable demand and
-20
-10
0
10
20
30
40
50
60
70
Q1 Q2 Q3 Q4 Q1 Q2 Q3 Q4
2020 2021
a) Manufacturing
Shortage of material, space or equipment
Shortage of labour
Insufficient demand
Financial constraints
Other
Q1 Q2 Q3 Q4 Q1 Q2 Q3 Q4
2020 2021
b) Services

ECB Economic Bulletin, Issue 8 / 2021 – Economic, financial and monetary developments
Economic activity 25
lending conditions for firms9, and direct support for households to offset much of the
recent surge in energy prices are expected to contain the impact of recent adverse
developments on activity.
The euro area labour market continued to improve in the third quarter of 2021.
Labour demand increased further in the third quarter, as evidenced by higher job
vacancy rates. Employment grew by 0.9% quarter on quarter in the third quarter of
2021 (Chart 12). While this was the second highest quarterly increase since 1999,
employment remained 0.2% below its pre-pandemic level. The unemployment rate
declined further to stand at 7.3% in November, albeit it was still supported in part by
workers in job retention schemes. These workers were estimated to account for
2.0% of the labour force at the end of the third quarter of 2021, a share that declined
to 1.8% in October. This is a substantial decrease relative to the average of 6.3% in
the first five months of the year, reflecting the easing of pandemic-related
restrictions. Moreover, the labour force has continued to increase, steadily
recovering to stand just 0.5% below its pre-pandemic level in the third quarter of
2021.
Chart 12
Euro area employment, the PMI assessment of employment and the unemployment
rate
(left-hand scale: quarter-on-quarter percentage changes, diffusion index; right-hand scale: percentages of the labour force)
Sources: Eurostat, Markit and ECB calculations.
Notes: The PMI employment indicator and the unemployment rate are shown at a monthly frequency, while employment is shown at a
quarterly frequency. The PMI is expressed as a deviation from 50 divided by 10. The latest observations are for the third quarter of
2021 for employment, November 2021 for the PMI and October 2021 for the unemployment rate.
Short-term indicators point to a further strengthening of the labour market. The
monthly composite PMI employment indicator, which encompasses both industry
and services, decreased slightly to stand at 55.3 in November, down from 55.5 in
October, but remains well above the threshold of 50 that indicates growth in
employment. The PMI employment indicator has fully recovered from its all-time low
in April 2020 and is still close to its July 2021 level – the highest level since March
2000.
9 See also the box entitled “Financing conditions through the lens of euro area companies” in this issue
of the Economic Bulletin.
6.8
7.0
7.2
7.4
7.6
7.8
8.0
8.2
8.4
8.6
8.8
9.0
-3.2
-2.8
-2.4
-2.0
-1.6
-1.2
-0.8
-0.4
0.0
0.4
0.8
1.2
Q1 Q2 Q3 Q4 Q1 Q2 Q3 Q4
2020 2021
Employment
PMI assessment of employment
Unemployment rate (right-hand scale)

ECB Economic Bulletin, Issue 8 / 2021 – Economic, financial and monetary developments
Economic activity 26
Private consumption continued its rebound in the third quarter, driven by the
consumption of services. Private consumption increased by 4.1% quarter on
quarter in the third quarter of 2021. However, retail trade increased by just 0.8% over
the same period. Strong aggregate consumption and subdued goods consumption
suggest that the rebound was mainly on account of contact-intensive services, in line
with the strong recovery in tourism activities during the summer months. By contrast,
the more subdued dynamics of goods consumption continued at the start of the
fourth quarter, as revealed by October data for retail trade (0.2% month on month)
and car registrations (-3.1% month on month).
New pandemic-related risks are again causing concern for households.
Consumer confidence fell to -6.8 in November, its lowest level since April 2021,
seemingly reflecting growing concerns about the recent evolution of the pandemic.
Since the summer, respondents to the European Commission’s monthly consumer
survey have become increasingly uncertain about their future financial situation
(Chart 13). As news concerning the pandemic worsened further in November and
December, monthly consumer confidence figures may still understate the current
situation. Adverse pandemic-related developments during the winter months are
expected to weigh on the consumption of contact-intensive services over the next
few quarters.
Chart 13
Uncertainty among euro area households about their future financial situation
(percentage balances)
Source: European Commission.
Notes: Since the spring of 2019, the European Commission’s monthly consumer survey has included an additional question that
explicitly asks about the ease with which households are able to predict their future financial situation. The latest observation is for
November 2021.
Corporate (non-construction) investment fell back in the third quarter of 2021,
despite strong demand for capital goods. Euro area non-construction investment
(excluding Ireland10) declined by 0.6% quarter on quarter in the third quarter of 2021,
offsetting an expansion in the previous quarter and remaining slightly below the
pre-pandemic level seen in the last quarter of 2019. Among the largest euro area
countries, non-construction investment increased in Italy and Spain, while it declined
in Germany and the Netherlands and remained roughly unchanged in France. As for
10 Ireland is excluded owing to the high volatility of Irish investment data, which would otherwise mask
underlying euro area developments.
-20
-16
-12
-8
Q1 Q2 Q3 Q4 Q1 Q2 Q3 Q4
2020 2021
ECB Economic Bulletin, Issue 8 / 2021 – Economic, financial and monetary developments
Economic activity 27
the components of non-construction investment, investment in transport equipment
contracted strongly in the euro area for a third consecutive quarter, mostly related to
input shortages as a result of the ongoing supply chain bottlenecks.11 By contrast,
investment in non-transport equipment and intellectual property products continued
to expand. Alongside the reported shortages of equipment and labour, which are
seen as key factors limiting production in the euro area, short-term indicators for the
fourth quarter of 2021 suggest continued strong demand for capital goods. New
orders of capital goods continue to rise, with the October PMI clearly pointing to
growth. Information from the euro area bank lending survey12 is also in line with
upbeat expectations regarding firms’ investment activities, as banks expect demand
for long-term loans (typically used in the financing of investment) to increase in the
fourth quarter of 2021.13
Housing investment declined in the third quarter of the year and is likely to
remain subdued on account of continuing supply bottlenecks and
pandemic-related uncertainties. Housing investment in the third quarter fell by
1.2% relative to its second-quarter level. The European Commission’s indicator of
recent trends in construction activity declined significantly, on average, in the first two
months of the fourth quarter, although it remained well above its long-term average.
The PMI for housing activity increased somewhat, rising further into expansionary
territory. On the household side, European Commission survey data show buoyant
demand, with consumers’ short-term intentions to buy or build a home reaching their
highest level since early 2002, while intentions to renovate were at their highest level
ever in the fourth quarter of 2021. Favourable demand is also reflected in data for
firms, where confidence has improved again, driven by a further increase in firms’
assessments of order book levels. However, supply concerns have also increased
again, with companies reporting a further increase in material and labour shortages,
which were already at an all-time high in the third quarter. These supply bottlenecks
are also reflected in the latest PMI surveys, which show very long delivery times for
suppliers, and are likely to have contributed to construction companies’ somewhat
less optimistic assessment of business activity over the next 12 months.
Although net trade contributed positively to GDP growth in the third quarter,
goods exports were held back by the ongoing supply disruptions. In the third
quarter of 2021, euro area exports increased by 1.2% quarter on quarter while
imports expanded by 0.7%, resulting in a 0.3 percentage point contribution to GDP
growth. Trade in goods and services had divergent outcomes. Exports and imports of
goods declined (by 1.0% and 0.9% respectively quarter on quarter) as global
demand softened and supply disruptions persisted. By contrast, exports and imports
of services expanded strongly (by 7.3% and 5.9% respectively quarter on quarter),
with exports driven by double-digit growth rates in countries that are summer tourist
destinations. Looking ahead, order-based indicators for goods exports signal a
11 For an assessment of the key factors causing supply chain disruptions and their impact on euro area
industrial production, see the box entitled “Sources of supply chain disruptions and their impact on euro
area manufacturing” in this issue of the Economic Bulletin.
12 See “The euro area bank lending survey – Third quarter of 2021”.
13 For analysis of perceived financing conditions in the euro area based on the survey on the access to
finance of enterprises (SAFE), see the box entitled “Financing conditions through the lens of euro area
companies” in this issue of the Economic Bulletin.

ECB Economic Bulletin, Issue 8 / 2021 – Economic, financial and monetary developments
Economic activity 28
moderation in demand. Moreover, the renewed intensification of the pandemic
threatens the recovery in services exports, particularly travel-related services.
Passenger and flight data show a deceleration in the recovery as of September
2021, while forward-looking indicators based on orders and expectations point to
momentum slowing in the coming months.
Near-term uncertainties notwithstanding, euro area activity is expected to
exceed pre-crisis levels in the course of 2022. The medium-term outlook
envisages a further strengthening of domestic demand alongside an improving
labour market and strengthening global growth as near-term disruptions subside, as
well as ongoing policy support from both monetary and fiscal policy in the transition
to self-supporting growth. Furthermore, progress with the implementation of the Next
Generation EU programme is an additional factor helping to support the recovery.
This is reflected in the December 2021 Eurosystem staff macroeconomic projections
for the euro area, which foresee annual real GDP growth of 5.1% in 2021, 4.2% in
2022, 2.9% in 2023 and 1.6% in 2024 (Chart 14). Compared with the September
2021 ECB staff macroeconomic projections, the growth profile has been revised
downward in 2022, but upward in 2023. The downward revisions in the near term
reflect the recent intensification of global supply bottlenecks and tighter
pandemic-related restrictions in the face of a resurgence in COVID-19 case numbers
in some euro area countries, which are now expected to continue into 2022. As a
consequence, quarterly euro area activity is now expected to return to pre-pandemic
levels by the first quarter of 2022, one quarter later than was envisaged in the
September 2021 projections. However, growth is expected to rebound strongly
towards the end of 2022 as these headwinds gradually dissipate. Consequently, euro
area GDP is now expected to rise above the level foreseen in the September 2021
projections by the end of 2022, resulting in substantial carry-over effects into 2023
and an upward revision to annual growth in that year.14
14 See the article entitled “Eurosystem staff macroeconomic projections for the euro area, December
2021”, published on the ECB’s website on 16 December 2021.

ECB Economic Bulletin, Issue 8 / 2021 – Economic, financial and monetary developments
Economic activity 29
Chart 14
Euro area real GDP (including projections)
(index; fourth quarter of 2019 = 100; seasonally and working day-adjusted quarterly data)
Sources: Eurostat and the article entitled “Eurosystem staff macroeconomic projections for the euro area, December 2021”, published
on the ECB’s website on 16 December 2021.
Note: The vertical line indicates the start of the December 2021 projections and follows the last observation for euro area real GDP,
which relates to the third quarter of 2021.
80
85
90
95
100
105
110
2019 2020 2021 2022 2023 2024
December 2021 Eurosystem staff projections
September 2021 ECB staff projections
December 2019 Eurosystem staff projections
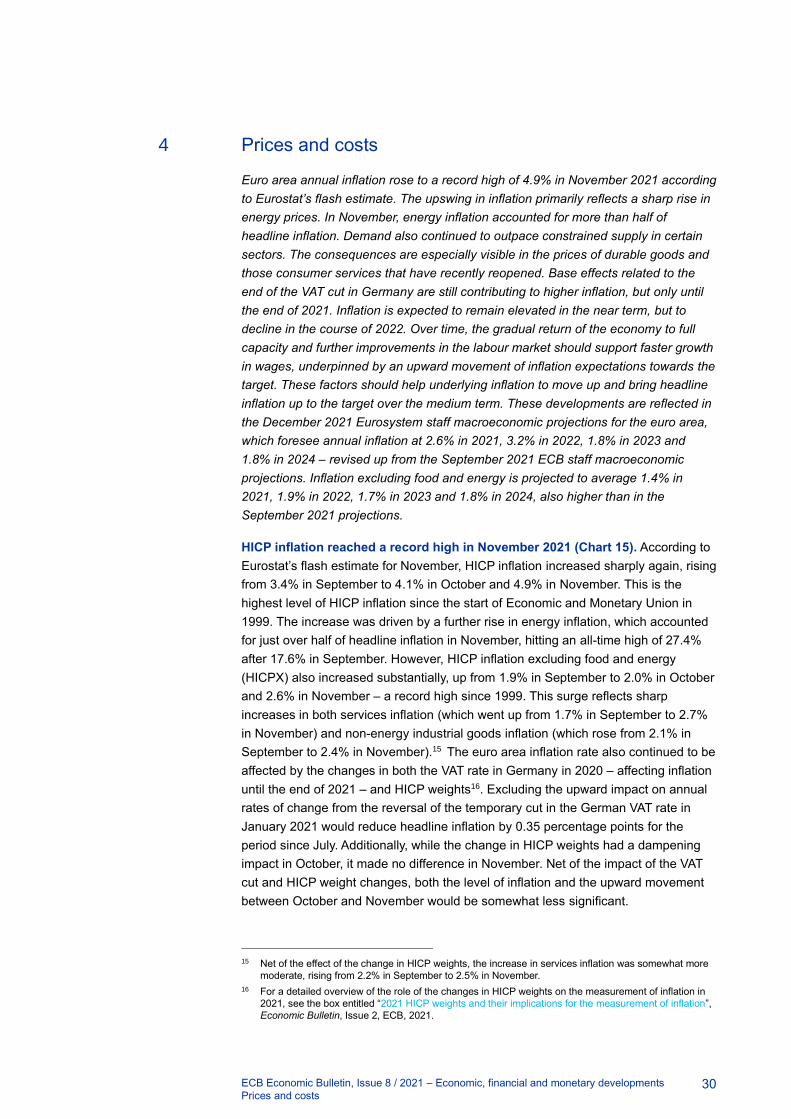
ECB Economic Bulletin, Issue 8 / 2021 – Economic, financial and monetary developments
Prices and costs 30
4 Prices and costs
Euro area annual inflation rose to a record high of 4.9% in November 2021 according
to Eurostat’s flash estimate. The upswing in inflation primarily reflects a sharp rise in
energy prices. In November, energy inflation accounted for more than half of
headline inflation. Demand also continued to outpace constrained supply in certain
sectors. The consequences are especially visible in the prices of durable goods and
those consumer services that have recently reopened. Base effects related to the
end of the VAT cut in Germany are still contributing to higher inflation, but only until
the end of 2021. Inflation is expected to remain elevated in the near term, but to
decline in the course of 2022. Over time, the gradual return of the economy to full
capacity and further improvements in the labour market should support faster growth
in wages, underpinned by an upward movement of inflation expectations towards the
target. These factors should help underlying inflation to move up and bring headline
inflation up to the target over the medium term. These developments are reflected in
the December 2021 Eurosystem staff macroeconomic projections for the euro area,
which foresee annual inflation at 2.6% in 2021, 3.2% in 2022, 1.8% in 2023 and
1.8% in 2024 – revised up from the September 2021 ECB staff macroeconomic
projections. Inflation excluding food and energy is projected to average 1.4% in
2021, 1.9% in 2022, 1.7% in 2023 and 1.8% in 2024, also higher than in the
September 2021 projections.
HICP inflation reached a record high in November 2021 (Chart 15). According to
Eurostat’s flash estimate for November, HICP inflation increased sharply again, rising
from 3.4% in September to 4.1% in October and 4.9% in November. This is the
highest level of HICP inflation since the start of Economic and Monetary Union in
1999. The increase was driven by a further rise in energy inflation, which accounted
for just over half of headline inflation in November, hitting an all-time high of 27.4%
after 17.6% in September. However, HICP inflation excluding food and energy
(HICPX) also increased substantially, up from 1.9% in September to 2.0% in October
and 2.6% in November – a record high since 1999. This surge reflects sharp
increases in both services inflation (which went up from 1.7% in September to 2.7%
in November) and non-energy industrial goods inflation (which rose from 2.1% in
September to 2.4% in November).15 The euro area inflation rate also continued to be
affected by the changes in both the VAT rate in Germany in 2020 – affecting inflation
until the end of 2021 – and HICP weights16. Excluding the upward impact on annual
rates of change from the reversal of the temporary cut in the German VAT rate in
January 2021 would reduce headline inflation by 0.35 percentage points for the
period since July. Additionally, while the change in HICP weights had a dampening
impact in October, it made no difference in November. Net of the impact of the VAT
cut and HICP weight changes, both the level of inflation and the upward movement
between October and November would be somewhat less significant.
15 Net of the effect of the change in HICP weights, the increase in services inflation was somewhat more
moderate, rising from 2.2% in September to 2.5% in November.
16 For a detailed overview of the role of the changes in HICP weights on the measurement of inflation in
2021, see the box entitled “2021 HICP weights and their implications for the measurement of inflation”,
Economic Bulletin, Issue 2, ECB, 2021.
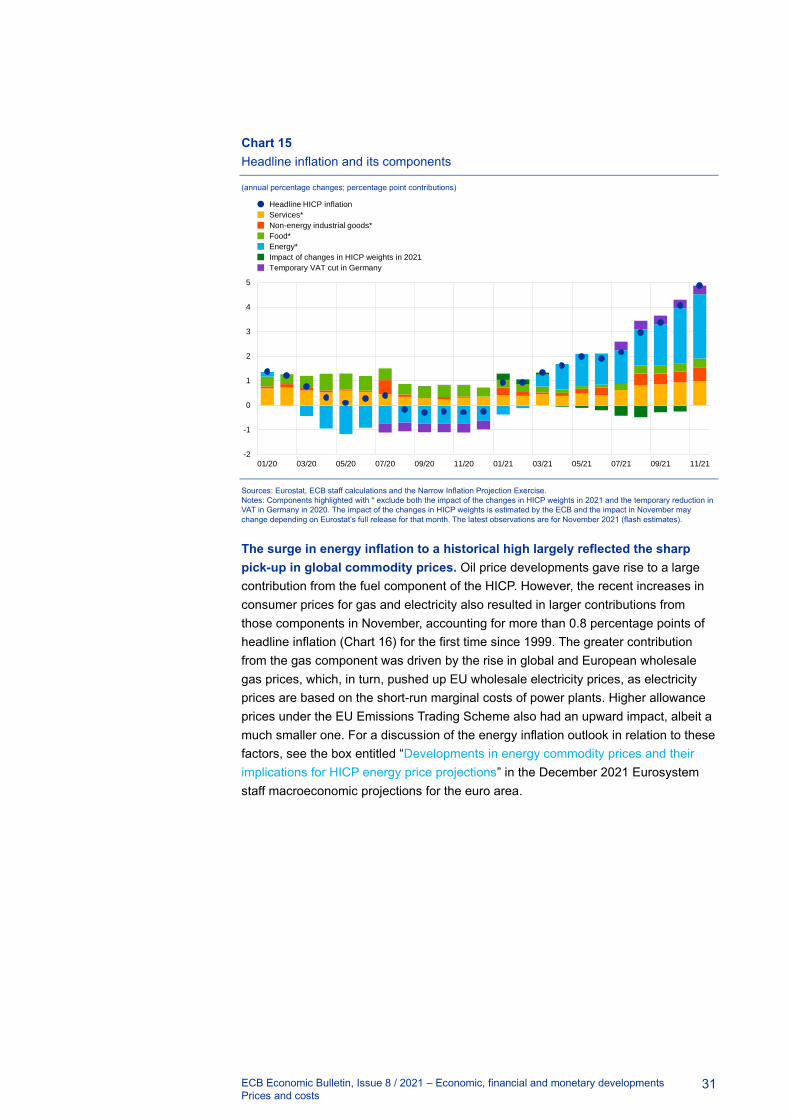
ECB Economic Bulletin, Issue 8 / 2021 – Economic, financial and monetary developments
Prices and costs 31
Chart 15
Headline inflation and its components
(annual percentage changes; percentage point contributions)
Sources: Eurostat, ECB staff calculations and the Narrow Inflation Projection Exercise.
Notes: Components highlighted with * exclude both the impact of the changes in HICP weights in 2021 and the temporary reduction in
VAT in Germany in 2020. The impact of the changes in HICP weights is estimated by the ECB and the impact in November may
change depending on Eurostat’s full release for that month. The latest observations are for November 2021 (flash estimates).
The surge in energy inflation to a historical high largely reflected the sharp
pick-up in global commodity prices. Oil price developments gave rise to a large
contribution from the fuel component of the HICP. However, the recent increases in
consumer prices for gas and electricity also resulted in larger contributions from
those components in November, accounting for more than 0.8 percentage points of
headline inflation (Chart 16) for the first time since 1999. The greater contribution
from the gas component was driven by the rise in global and European wholesale
gas prices, which, in turn, pushed up EU wholesale electricity prices, as electricity
prices are based on the short-run marginal costs of power plants. Higher allowance
prices under the EU Emissions Trading Scheme also had an upward impact, albeit a
much smaller one. For a discussion of the energy inflation outlook in relation to these
factors, see the box entitled “Developments in energy commodity prices and their
implications for HICP energy price projections” in the December 2021 Eurosystem
staff macroeconomic projections for the euro area.
-2
-1
0
1
2
3
4
5
01/20 03/20 05/20 07/20 09/20 11/20 01/21 03/21 05/21 07/21 09/21 11/21
Headline HICP inflation
Services*
Non-energy industrial goods*
Food*
Energy*
Impact of changes in HICP weights in 2021
Temporary VAT cut in Germany

ECB Economic Bulletin, Issue 8 / 2021 – Economic, financial and monetary developments
Prices and costs 32
Chart 16
Energy inflation decomposition
(annual percentage changes; percentage point contributions)
Sources: Eurostat and ECB calculations.
Notes: “Fuel” refers to the HICP component “liquid fuels and fuels and lubricants for personal transport equipment”. “Other” includes
the items “solid fuels” and “heat energy” at the COICOP 5-digit level of aggregation. COICOP stands for classification of individual
consumption according to purpose. The latest observations are for October 2021 for COICOP subcomponents and for November 2021
for energy inflation.
Indicators of underlying inflation continued to increase (Chart 17). HICPX
increased to 2.6% in November (estimated at 2.5% when excluding the effects of
changes in HICP weights, and at 2.2% when also taking into account the VAT cut in
Germany in 2020). Data for other indicators of underlying inflation are only available
up to October. HICP inflation excluding energy, food, travel-related items, clothing
and footwear (HICPXX) rose from 1.9% in September to 2.1% in October, while the
model-based Persistent and Common Component of Inflation (PCCI) went up from
1.8% to 1.9% over the same period. The Supercore indicator, which comprises
cyclically sensitive items, increased for the fourth consecutive month, edging up to
2.0% in October from 1.6% in September. The distribution of inflation rates across
HICP items is currently very broad, and 46% of the items included in HICPX
recorded inflation rates above 2%. This implies that exclusion-based indicators of
underlying inflation, especially the so-called trimmed means, derived from the items
in the HICP basket, still include a number of items with relatively high and volatile
growth rates, which in recent months have pushed up the corresponding measures
into the upper end of the range of indicators of underlying inflation.17
17 Trimmed means (which remove around 5% or 15% from each tail of the distribution of annual price
changes) stand well above the target of 2% because they include some energy items with currently
very high inflation rates. For further information on these and other measures of underlying inflation,
see Box 2 and Box 3 in the article entitled “Measures of underlying inflation for the euro area”,
Economic Bulletin, Issue 4, ECB, 2018.
-15
-10
-5
0
5
10
15
20
25
30
01/20 03/20 05/20 07/20 09/20 11/20 01/21 03/21 05/21 07/21 09/21 11/21
Energy
Fuel
Electricity
Gas
Other
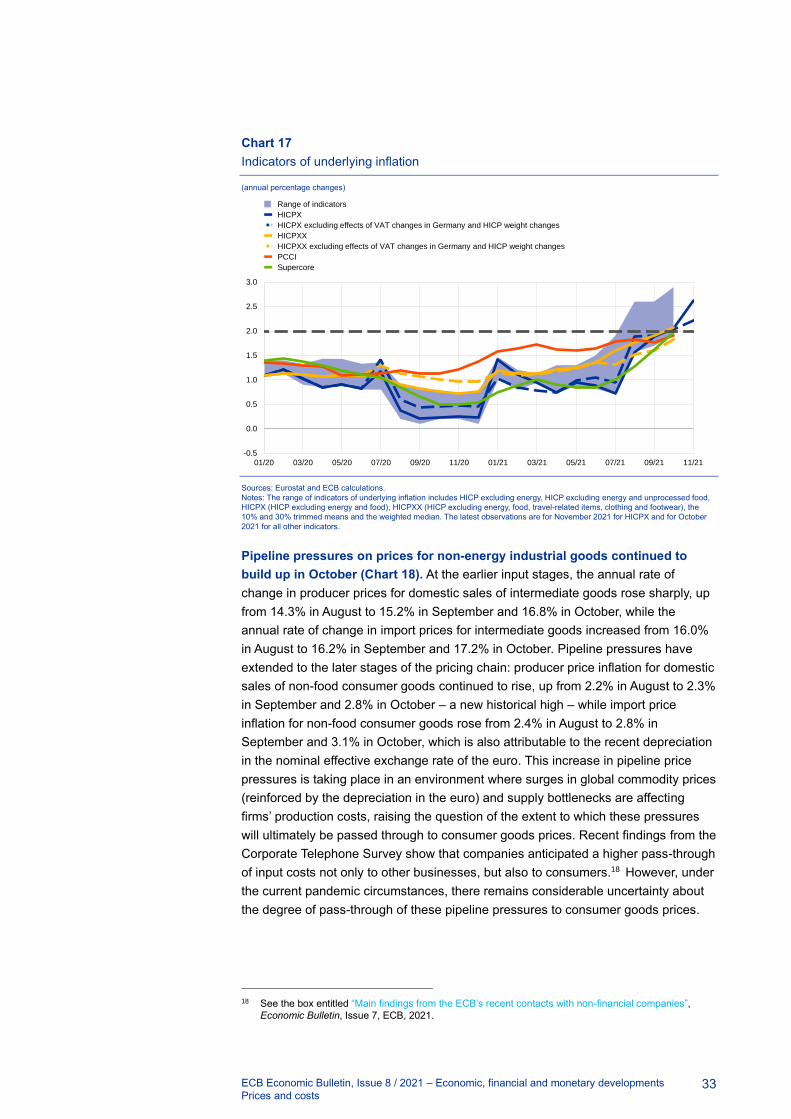
ECB Economic Bulletin, Issue 8 / 2021 – Economic, financial and monetary developments
Prices and costs 33
Chart 17
Indicators of underlying inflation
(annual percentage changes)
Sources: Eurostat and ECB calculations.
Notes: The range of indicators of underlying inflation includes HICP excluding energy, HICP excluding energy and unprocessed food,
HICPX (HICP excluding energy and food), HICPXX (HICP excluding energy, food, travel-related items, clothing and footwear), the
10% and 30% trimmed means and the weighted median. The latest observations are for November 2021 for HICPX and for October
2021 for all other indicators.
Pipeline pressures on prices for non-energy industrial goods continued to
build up in October (Chart 18). At the earlier input stages, the annual rate of
change in producer prices for domestic sales of intermediate goods rose sharply, up
from 14.3% in August to 15.2% in September and 16.8% in October, while the
annual rate of change in import prices for intermediate goods increased from 16.0%
in August to 16.2% in September and 17.2% in October. Pipeline pressures have
extended to the later stages of the pricing chain: producer price inflation for domestic
sales of non-food consumer goods continued to rise, up from 2.2% in August to 2.3%
in September and 2.8% in October – a new historical high – while import price
inflation for non-food consumer goods rose from 2.4% in August to 2.8% in
September and 3.1% in October, which is also attributable to the recent depreciation
in the nominal effective exchange rate of the euro. This increase in pipeline price
pressures is taking place in an environment where surges in global commodity prices
(reinforced by the depreciation in the euro) and supply bottlenecks are affecting
firms’ production costs, raising the question of the extent to which these pressures
will ultimately be passed through to consumer goods prices. Recent findings from the
Corporate Telephone Survey show that companies anticipated a higher pass-through
of input costs not only to other businesses, but also to consumers.18 However, under
the current pandemic circumstances, there remains considerable uncertainty about
the degree of pass-through of these pipeline pressures to consumer goods prices.
18 See the box entitled “Main findings from the ECB’s recent contacts with non-financial companies”,
Economic Bulletin, Issue 7, ECB, 2021.
-0.5
0.0
0.5
1.0
1.5
2.0
2.5
3.0
01/20 03/20 05/20 07/20 09/20 11/20 01/21 03/21 05/21 07/21 09/21 11/21
Range of indicators
HICPX
HICPX excluding effects of VAT changes in Germany and HICP weight changes
HICPXX
HICPXX excluding effects of VAT changes in Germany and HICP weight changes
PCCI
Supercore

ECB Economic Bulletin, Issue 8 / 2021 – Economic, financial and monetary developments
Prices and costs 34
Chart 18
Indicators of pipeline pressures
(annual percentage changes)
Sources: Eurostat and ECB calculations.
Note: The latest observations are for October 2021.
Wage pressures have remained moderate so far, but measures of wage growth
continue to be blurred by pandemic-related developments. Growth in
compensation per employee and compensation per hour converged in the third
quarter of 2021, after a large gap between the two measures in the second quarter,
with annual growth in compensation per employee moderating to 3.0% in the third
quarter, down from 7.2% in the second quarter, and compensation per hour rising to
2.0% in the third quarter, up from -4.5% in the second quarter (Chart 19). These
large movements in the year-on-year growth rates mainly reflect base effects
associated with developments in 2020, when short-time work and temporary lay-off
schemes meant that people retained their employment status but worked fewer
hours. However, policy measures remain in place and are still distorting measures of
wage growth to some degree. Negotiated wages, which are not directly affected by
developments in hours worked or the recording of benefits from job retention
schemes, declined to 1.3% in the third quarter of 2021, down from 1.8% in the
second quarter.19 Although this measure is more stable than actual wage growth, it
does also entail some volatility, as it includes some special pandemic-related one-off
payments. While negotiated wages suggest that wage growth is only moderate, the
data probably cover negotiations that were concluded before the recent surge in
inflation.
19 For more information, see the box entitled “Assessing wage dynamics during the COVID-19 pandemic:
can data on negotiated wages help?”, Economic Bulletin, Issue 8, ECB, 2020.
-6
0
6
12
18
-3
0
3
6
9
2017 2018 2019 2020 2021
Import prices – intermediate goods (right-hand scale)
Import prices – non-food consumer goods
Domestic producer prices – intermediate goods (right-hand scale)
Domestic producer prices – non-food consumer goods
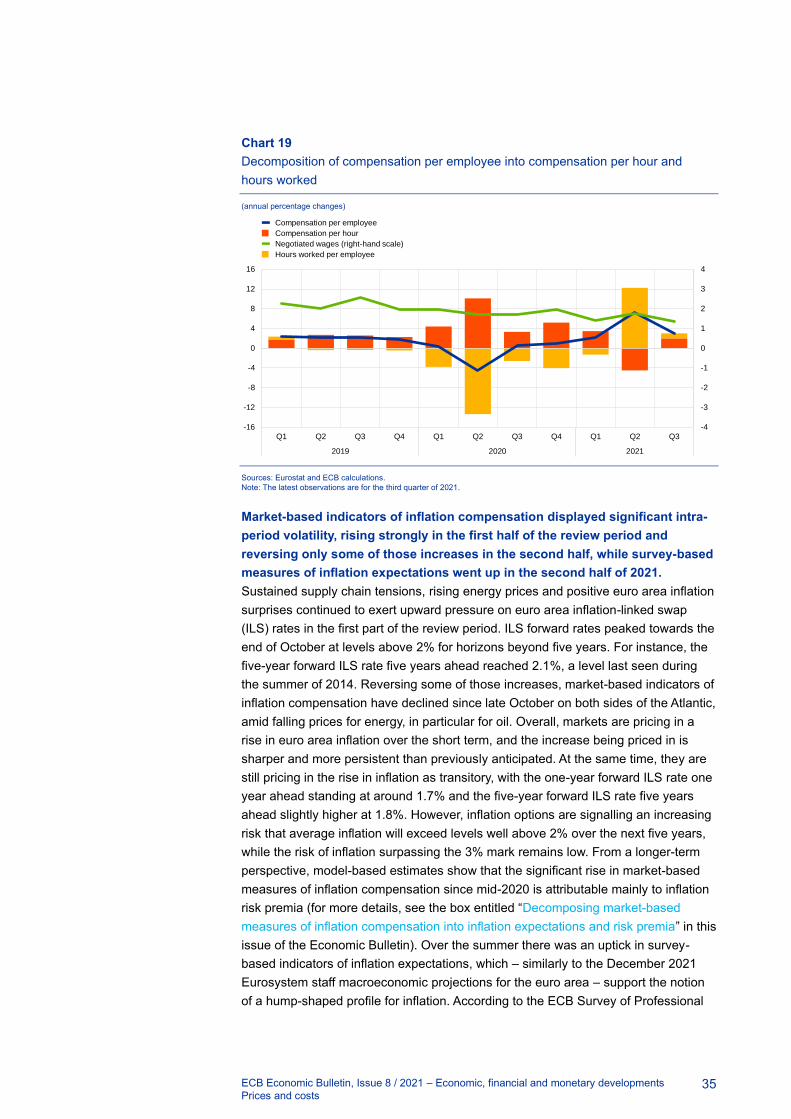
ECB Economic Bulletin, Issue 8 / 2021 – Economic, financial and monetary developments
Prices and costs 35
Chart 19
Decomposition of compensation per employee into compensation per hour and
hours worked
(annual percentage changes)
Sources: Eurostat and ECB calculations.
Note: The latest observations are for the third quarter of 2021.
Market-based indicators of inflation compensation displayed significant intra-
period volatility, rising strongly in the first half of the review period and
reversing only some of those increases in the second half, while survey-based
measures of inflation expectations went up in the second half of 2021.
Sustained supply chain tensions, rising energy prices and positive euro area inflation
surprises continued to exert upward pressure on euro area inflation-linked swap
(ILS) rates in the first part of the review period. ILS forward rates peaked towards the
end of October at levels above 2% for horizons beyond five years. For instance, the
five-year forward ILS rate five years ahead reached 2.1%, a level last seen during
the summer of 2014. Reversing some of those increases, market-based indicators of
inflation compensation have declined since late October on both sides of the Atlantic,
amid falling prices for energy, in particular for oil. Overall, markets are pricing in a
rise in euro area inflation over the short term, and the increase being priced in is
sharper and more persistent than previously anticipated. At the same time, they are
still pricing in the rise in inflation as transitory, with the one-year forward ILS rate one
year ahead standing at around 1.7% and the five-year forward ILS rate five years
ahead slightly higher at 1.8%. However, inflation options are signalling an increasing
risk that average inflation will exceed levels well above 2% over the next five years,
while the risk of inflation surpassing the 3% mark remains low. From a longer-term
perspective, model-based estimates show that the significant rise in market-based
measures of inflation compensation since mid-2020 is attributable mainly to inflation
risk premia (for more details, see the box entitled “Decomposing market-based
measures of inflation compensation into inflation expectations and risk premia” in this
issue of the Economic Bulletin). Over the summer there was an uptick in survey-
based indicators of inflation expectations, which – similarly to the December 2021
Eurosystem staff macroeconomic projections for the euro area – support the notion
of a hump-shaped profile for inflation. According to the ECB Survey of Professional
-4
-3
-2
-1
0
1
2
3
4
-16
-12
-8
-4
0
4
8
12
16
Q1 Q2 Q3 Q4 Q1 Q2 Q3 Q4 Q1 Q2 Q3
2019 2020 2021
Compensation per employee
Compensation per hour
Negotiated wages (right-hand scale)
Hours worked per employee

ECB Economic Bulletin, Issue 8 / 2021 – Economic, financial and monetary developments
Prices and costs 36
Forecasters for the fourth quarter of 2021, which was conducted in the first week of
October, as well as the October Consensus Economics forecasts, longer-term
inflation expectations increased to 1.9% (Chart 20).
Chart 20
Survey-based indicators of inflation expectations and market-based indicators of
inflation compensation
(annual percentage changes)
Sources: Eurostat, Refinitiv, Consensus Economics, ECB Survey of Professional Forecasters, Eurosystem staff macroeconomic
projections for the euro area, December 2021 and ECB calculations.
Notes: The market-based indicators of the inflation compensation series are based on the one-year spot inflation rate and the one-year
forward rate one year ahead, the one-year forward rate two years ahead, the one-year forward rate three years ahead and the one-
year forward rate four years ahead. The latest observations for market-based indicators of inflation compensation are for 15 December
2021. The ECB Survey of Professional Forecasters for the fourth quarter of 2021 was conducted between 1 and 11 October 2021. The
Consensus Economics cut-off date is 8 December for 2021 and 2022, and 14 October 2021 for 2023, 2024, 2025 and 2026. The cut-
off date for data included in the projections was 1 December 2021.
The December 2021 Eurosystem staff macroeconomic projections for the euro
area foresee inflation to be higher for longer, but falling to rates below the 2%
target in 2023 and 2024. Having reached 4.9% in November 2021, HICP inflation is
expected to decrease sharply over the course of 2022, before stabilising in 2023 to
rates below the inflation target. The baseline projections point to headline HICP
inflation averaging 2.6% in 2021, 3.2% in 2022, 1.8% in 2023 and 1.8% in 2024
(Chart 21). Compared with the September 2021 ECB staff macroeconomic
projections for the euro area, the projection for HICP inflation has been revised
upwards for the entire projection horizon, specifically by 0.4 percentage points for
2021, 1.5 percentage points for 2022 and 0.3 percentage points for 2023. High
prices for energy (transport fuels, electricity and gas), stronger demand in the
context of the reopening of the economy and increasing producer prices as a result
of global supply bottlenecks and higher transport costs have led to a strong surge in
inflationary pressures, which are also expected to sustain inflation into 2022.
However, HICP inflation is expected to decline in 2022 mainly owing to base effects
in both the energy and non-energy components, partly related to the reversal of the
temporary cut in the German VAT rate in January 2021. HICPX is projected to
broadly mimic the near-term developments in headline inflation before strengthening
towards the end of the projection horizon, to stand at 1.4% in 2021, 1.9% in 2022,
-1.0
-0.5
0.0
0.5
1.0
1.5
2.0
2.5
3.0
3.5
4.0
4.5
5.0
5.5
2019 2020 2021 2022 2023 2024 2025 2026
HICP
Consensus Economics – HICP (8 December 2021)
Eurosystem staff macroeconomic projections (December 2021)
Market-based indicators of inflation compensation (15 December 2021)
SPF Q4 2021
SPF Q3 2021
SPF Q2 2021

ECB Economic Bulletin, Issue 8 / 2021 – Economic, financial and monetary developments
Prices and costs 37
1.7% in 2023 and 1.8% in 2024. The upward revisions to HICPX similarly reflect the
impact of supply bottlenecks. The strengthening of underlying inflation towards the
end of the projection horizon is supported by the economic recovery, stronger wage
growth and higher inflation expectations.
Chart 21
Euro area HICP inflation (including projections)
(annual percentage changes)
Sources: Eurostat and Eurosystem staff macroeconomic projections for the euro area, December 2021.
Notes: The vertical line indicates the start of the projection horizon. The latest observations are for the third quarter of 2021 (data) and
the fourth quarter of 2024 (projections). The cut-off date for data included in the projections was 1 December 2021.
-0.5
0.0
0.5
1.0
1.5
2.0
2.5
3.0
3.5
4.0
4.5
5.0
2014 2015 2016 2017 2018 2019 2020 2021 2022 2023 2024

ECB Economic Bulletin, Issue 8 / 2021 – Economic, financial and monetary developments
Money and credit 38
5 Money and credit
Money creation in the euro area edged upward in October 2021, reflecting greater
uncertainty related to the coronavirus (COVID-19) pandemic and policy support
measures. Eurosystem asset purchases remained the dominant source of money
creation. Growth in loans to the private sector increased slightly, continuing to benefit
from favourable financing conditions, while firms’ working capital needs supported
demand for short-term loans. In the third quarter, the total volume of external
financing for firms picked up, supported by debt securities issuance and bank loans
to firms. The overall cost of firms’ external financing increased slightly over the
period from July to October 2021 – driven by the cost of raising equity – but
remained well below the peak observed at the onset of the pandemic.
In October 2021 broad money growth edged upward. The annual growth rate of
M3 increased to 7.7% in October, up from 7.5% in September (Chart 22), driven by a
large inflow that coincided with greater uncertainty related to the impact that the
fourth COVID-19 wave would have on the European economy. The quarterly pace of
money growth continued to move closer to its longer-term average. On the
components side, the main driver of M3 growth was the narrow aggregate M1, which
includes the most liquid components of M3. During the pandemic, money holders
have generally displayed a strong preference for liquid assets, which reflects
precautionary motives. With containment measures being relaxed in spring and
summer 2021 and economic activity recovering, growth in M1 moderated in the
second and third quarters of 2021 following the high growth rates observed during
the first year of the pandemic. In October the annual growth rate of M1 decreased
further, falling from 11.1% to 10.7%, mainly reflecting developments in overnight
deposits. Meanwhile, the annual growth rate of currency in circulation, which had
been declining since the first quarter of 2021, stabilised at 8.5% in October. The
contribution of other short-term deposits remained negative in that month, reflecting
a decrease in demand for time deposits. Moreover, the contribution of marketable
instruments increased from a very low level owing to search-for-yield behaviour in a
low interest rate environment.

ECB Economic Bulletin, Issue 8 / 2021 – Economic, financial and monetary developments
Money and credit 39
Chart 22
M3, M1 and loans to the private sector
(annual percentage changes; adjusted for seasonal and calendar effects)
Source: ECB.
Notes: Loans are adjusted for loan sales, securitisation and notional cash pooling. The latest observations are for October 2021.
Growth in overnight deposits moderated further. The annual growth rate of
overnight deposits fell to 11.1% in October, down from 11.5% in September. This
decline was driven mainly by households, which make the largest contribution from a
sectoral perspective. At the start of the pandemic, deposit inflows were substantial,
since household savings increased as a consequence of containment measures and
firms created additional liquidity buffers. In an environment of increased uncertainty,
these inflows then continued beyond the early phase of the pandemic.20 More
recently, households have started to reduce their saving rate as consumer
confidence has increased and improved spending opportunities have emerged. As
vaccination campaigns have progressed and economic activity has rebounded, the
quarterly pace at which households and firms accumulate bank deposits has slowed,
returning to its pre-pandemic average. Growth in the deposit holdings of firms and
households has varied across countries, reflecting differences in liquidity needs and
national (fiscal) support measures.
Money creation continued to be driven by Eurosystem asset purchases in
October 2021. As in previous quarters, the largest contribution to M3 growth came
from the Eurosystem’s net purchases of government securities under the asset
purchase programme (APP) and the pandemic emergency purchase programme
(PEPP) (red portion of the bars in Chart 23). As in previous quarters, credit to the
private sector provided significant support to money creation (blue portion of the
bars). Other counterparts also supported broad money growth (dark green portion of
the bars), as favourable conditions for targeted longer-term refinancing operations
(TLTROs) provided incentives to shift bank funding away from longer-term liabilities.
However, two main factors dampened money creation: first, sales of government
bonds or reduced issuance of government securities (light green portion of the bars),
which resulted in the reduction of bank credit to general government; and second,
20 See the box entitled “COVID-19 and the increase in household savings: an update”, Economic Bulletin,
Issue 5, ECB, 2021.
-4
-2
0
2
4
6
8
10
12
14
16
18
2014 2015 2016 2017 2018 2019 2020 2021
M3
M1
Loans to the private sector

ECB Economic Bulletin, Issue 8 / 2021 – Economic, financial and monetary developments
Money and credit 40
net external monetary outflows (yellow portion of the bars), driven by a strengthening
of portfolio substitution and coinciding with a weakening of the euro’s effective
exchange rate.
Chart 23
M3 and its counterparts
(annual percentage changes; contributions in percentage points; adjusted for seasonal and calendar effects)
Source: ECB.
Notes: Credit to the private sector includes monetary financial institution (MFI) loans to the private sector and MFI holdings of debt
securities issued by the euro area private non-MFI sector. As such, it also covers the Eurosystem’s purchases of non-MFI debt
securities under the corporate sector purchase programme and the PEPP. The latest observations are for October 2021.
Growth in loans to the private sector increased slightly in October 2021
(Chart 22). Lending to firms and households continued to benefit from favourable
financing conditions and improved economic prospects. Following a moderation in
the first half of the year, growth in loans to the private sector rose to 3.4% in October,
up from 3.2% in September, driven by lending to firms. The annual growth rate of
loans to firms rose to 2.5% in October, up from 2.1% in September, driven by an
increase in short-term loans that was probably related to firms’ working capital
needs. At the same time, loan growth remained moderate on account of large cash
balances, the strengthening of internally generated funds and the availability of other
non-bank funding sources, which continued to weigh on firms’ demand for bank
loans. The growth rate of loans to households remained unchanged at 4.1% in
October (Chart 24). Mortgage lending continued to be the main driver of household
borrowing, with growth in consumer credit remaining subdued. Loan developments
also mask considerable differences across euro area countries, which reflect, among
other things, unevenness in the impact of the pandemic and the progress of the
economic recovery.
-4
-2
0
2
4
6
8
10
12
14
2019 2020 2021
M3
Net external monetary flows
General government debt securities held by the Eurosystem
Credit to general government from MFIs excluding the Eurosystem
Credit to the private sector
Inflows from longer-term financial liabilities and other counterparts

ECB Economic Bulletin, Issue 8 / 2021 – Economic, financial and monetary developments
Money and credit 41
Chart 24
MFI loans in selected euro area countries
(annual percentage changes; standard deviation)
Source: ECB.
Notes: Loans are adjusted for loan sales and securitisation; in the case of non-financial corporations (NFCs), loans are also adjusted
for notional cash pooling. The cross-country standard deviation is calculated using a fixed sample of 12 euro area countries. The latest
observations are for October 2021.
Small and medium-sized enterprises (SMEs) recently reported improved
access to external finance over the past six months relative to early 2021, and
they expect a further improvement going forward. According to the November
2021 survey on the access to finance of enterprises (SAFE), euro area SMEs felt
that the improvement in their access to external funds had outweighed the
corresponding increases in their financing needs, resulting in a slightly negative
external financing gap of -2% (down from 4%) (Chart 25). Moreover, those SAFE
responses showed that SMEs – and even more so large firms – expected to see an
improvement in the availability of most external financing sources. In particular, firms’
improved overall perceptions of financing conditions played an increasingly important
role in explaining their expectations regarding the future availability of bank loans
(see Box 3 in this issue). Reflecting the ongoing economic recovery, euro area SMEs
signalled an increase in their turnover, while profits fell by much less than in the
previous survey round. The lacklustre performance in terms of profits generally
reflected higher commodity prices and labour costs.
2
3
4
5
6
7
8
9
10
-9
-6
-3
0
3
6
9
12
15
2019 2020 2021
a) MFI loans to NFCs
Euro area
Germany
France
Italy
Spain
Cross-country standard deviation (right-hand scale)
1
2
3
4
5
6
7
8
-6
-4
-2
0
2
4
6
8
2019 2020 2021
b) MFI loans to households

ECB Economic Bulletin, Issue 8 / 2021 – Economic, financial and monetary developments
Money and credit 42
Chart 25
Changes in the external financing gap reported by SMEs across euro area countries
(weighted net balances)
Source: ECB survey on the access to finance of enterprises (SAFE).
Notes: The financing gap indicator combines both financing needs and the availability of bank loans, credit lines, trade credit, and
equity and debt securities issuance at the firm level. For each of the five financing instruments, the indicator of the perceived change in
the financing gap takes a value of 1 (-1) if the need increases (decreases) and availability decreases (increases). If enterprises
perceive only a one-sided increase (decrease) in the financing gap, the variable is assigned a value of 0.5 (-0.5). The composite
indicator is a weighted average of the financing gap for the five instruments. A positive value for the indicator points to an increase in
the financing gap. Values are multiplied by 100 to obtain weighted net balances in percentages. The figures refer to rounds 3-25 of the
survey (March 2010-September 2010 to April 2021-September 2021).
Debt funding costs for euro area banks remain close to their historical lows,
supported by the ECB’s monetary policy measures. The composite cost of debt
financing remains below pre-pandemic levels, notwithstanding an increase in
risk-free rates and bank bond yields since September 2021 (Chart 26). Bank funding
costs have so far remained insulated from upward pressure for three reasons. First,
repricing of deposits has continued, with euro area banks charging negative interest
rates on an increasing share of corporate deposits, while the percentage of
household deposits that have negative rates has also increased (albeit from
relatively low levels) and now stands at 6.5%.21 Second, banks’ share of debt
funding has declined significantly, as banks have made use of the third series of
targeted longer-term refinancing operations (TLTRO III) and the pandemic
emergency longer-term refinancing operations (PELTROs) at very favourable
conditions. Third, the ECB’s APP and PEPP policy measures have helped to contain
upward pressure on bank bond yields and reduce divergence in funding conditions
across countries, risk classes and maturities relative to the levels observed before
the pandemic. In addition, prices for covered bank bonds have been supported by
the ECB’s third covered bond purchase programme (CBPP3). In addition to the
ECB’s policy measures, the Next Generation EU programme is also supportive of
lower yields, as it contributes to a stronger and more uniform recovery across the
euro area.
21 See the November 2021 Financial Stability Review.
-20
-10
0
10
20
30
'11 '16 '21 '11 '16 '21 '11 '16 '21 '11 '16 '21 '11 '16 '21
DE ES FR IT Euro area

ECB Economic Bulletin, Issue 8 / 2021 – Economic, financial and monetary developments
Money and credit 43
Chart 26
Composite bank funding rates in selected euro area countries
(annual percentages)
Sources: ECB, ECB calculations and Markit iBoxx indices.
Notes: Composite bank funding rates are the weighted cost of deposits and unsecured market-based debt financing. The composite
cost of deposits is calculated as an average of new business rates on overnight deposits, deposits with an agreed maturity and
deposits redeemable at notice, weighted by their corresponding outstanding amounts. Bank bond yields refer to monthly averages of
senior-tranche bonds. The latest observations are for October 2021.
Bank lending rates remained close to their historical lows in October 2021. The
composite bank lending rate for loans to non-financial corporations fell to 1.43%,
while the equivalent rate for loans to households for house purchase remained
broadly unchanged at 1.31% (Chart 27). The decline in lending rates for firms was
mostly driven by developments in the largest euro area countries. Moreover, the
spread between bank lending rates on very small loans and those on large loans
increased but remained below pre-pandemic levels, mainly reflecting increases in
rates on very small loans. Uncertainty regarding the economic consequences of the
pandemic has increased with the global spread of new variants and the fourth
COVID-19 wave. However, the ECB’s policy measures have so far prevented a
broad-based tightening of financing conditions, which would have amplified the
adverse impact of the new variants on the euro area economy.
0.0
0.5
1.0
1.5
2.0
2.5
2014 2015 2016 2017 2018 2019 2020 2021
a) Banks’ composite cost of debt financing
Euro area
Germany
France
Italy
Spain
0.0
0.1
0.2
0.3
0.4
0.5
01/21 04/21 07/21 10/21
0
1
2
3
4
5
2014 2015 2016 2017 2018 2019 2020 2021
b) Bank bond yields
0.00
0.25
0.50
0.75
1.00
1.25
1.50
01/21 04/21 07/21 10/21

ECB Economic Bulletin, Issue 8 / 2021 – Economic, financial and monetary developments
Money and credit 44
Chart 27
Composite bank lending rates in selected euro area countries
(annual percentages, three-month moving averages; standard deviation)
Source: ECB.
Notes: The indicator for the total cost of bank borrowing is calculated by aggregating short and long-term rates using a 24-month
moving average of new business volumes. The cross-country standard deviation is calculated using a fixed sample of 12 euro area
countries. The latest observations are for October 2021.
The total volume of external financing for firms picked up in the third quarter
of 2021. The annual growth rate of external financing edged upward from 2.1% in
June to 2.2% in September, supported by the low cost of debt financing. In the third
quarter of 2021, larger external financing flows mostly stemmed from an increase in
bank loans to firms and greater issuance of debt securities, while loans from
non-banks made a smaller positive contribution (Chart 28). Firms’ demand for credit
was supported by stronger business investment, while improved profits and retained
earnings, sizeable liquidity buffers and firms’ high gross debt levels continued to
dampen demand. In countries and sectors that have been particularly affected by
supply bottlenecks, increased working capital needs on account of production delays
and the rebuilding of inventories have led to an increase in short-term borrowing. On
balance, however, firms have continued to display a stronger preference for
financing instruments with longer maturities, which suggests that external finance
0.0
0.4
0.8
1.2
1.6
2.0
0
1
2
3
4
5
2014 2015 2016 2017 2018 2019 2020 2021
a) Rates on loans to NFCs
Euro area
Germany
France
Italy
Spain
Cross-country standard deviation (right-hand scale)
0.0
0.2
0.4
0.6
0.8
1.0
1.0
1.2
1.4
1.6
1.8
2.0
01/21 04/21 07/21 10/21
0.0
0.4
0.8
1.2
1.6
2.0
0
1
2
3
4
5
2014 2015 2016 2017 2018 2019 2020 2021
b) Rates on loans to households for house purchase
0.0
0.2
0.4
0.6
0.8
1.0
1.0
1.2
1.4
1.6
1.8
2.0
01/21 04/21 07/21 10/21

ECB Economic Bulletin, Issue 8 / 2021 – Economic, financial and monetary developments
Money and credit 45
tends to be used for business investment, as opposed to the establishment of
liquidity buffers.
Chart 28
Net external financing flows for euro area NFCs
(annual flows in EUR billions)
Sources: ECB and ECB estimates, Eurostat and Dealogic.
Notes: Net external financing is the sum of MFI loans, net issuance of debt securities, net issuance of listed shares and non-MFI loans.
MFI loans are adjusted for sales, securitisation and cash-pooling activities. Loans from non-MFIs include loans from other financial
institutions and insurance corporations and pension funds net of securitised loans. The striped vertical bar and the light blue diamond
indicate the nowcast for the third quarter of 2021. The latest observations are for the second quarter of 2021 for euro area accounts
data; estimates for the third quarter of 2021 are based on ECB balance sheet items (BSI) and securities (SEC) data, as well as
Dealogic.
The total nominal cost of external financing for NFCs (comprising bank
lending, debt issuance in the market and equity finance) increased between
July and October 2021, driven by the cost of equity. The cost of external
financing rose to 4.7% in October 2021 (Chart 29), around 40 basis points below the
peak seen in March 2020 but 60 basis points higher than the historical low of March
2021. The increase observed in October was mainly accounted for by the higher cost
of equity, which reflected a pick-up in both risk-free rates and, to a much lesser
extent, the equity risk premium. The increase in risk-free rates was also responsible
for the higher cost of market-based debt, which reached levels last seen in October
2020, despite corporate bond spreads remaining virtually unchanged. The overall
cost of financing is estimated to have declined marginally between the end of
October and 15 December, with a fall in the cost of equity more than compensating
for a slight further increase in the cost of market-based debt. The fall in the cost of
equity over that period was brought about by a decline in risk-free rates that more
than compensated for the slight increase in the equity risk premium. However, that
decline in risk-free rates was not sufficient to lower the cost of market-based debt
because of the widening of corporate bond spreads, most notably in the high-yield
segment.
-200
-100
0
100
200
300
400
500
2014 2015 2016 2017 2018 2019 2020 2021
MFI loans to NFCs (adjusted)
Net issuance of debt securities by NFCs
Net issuance of listed shares by NFCs
Loans from non-MFIs to NFCs (excluding securitisation)
Total
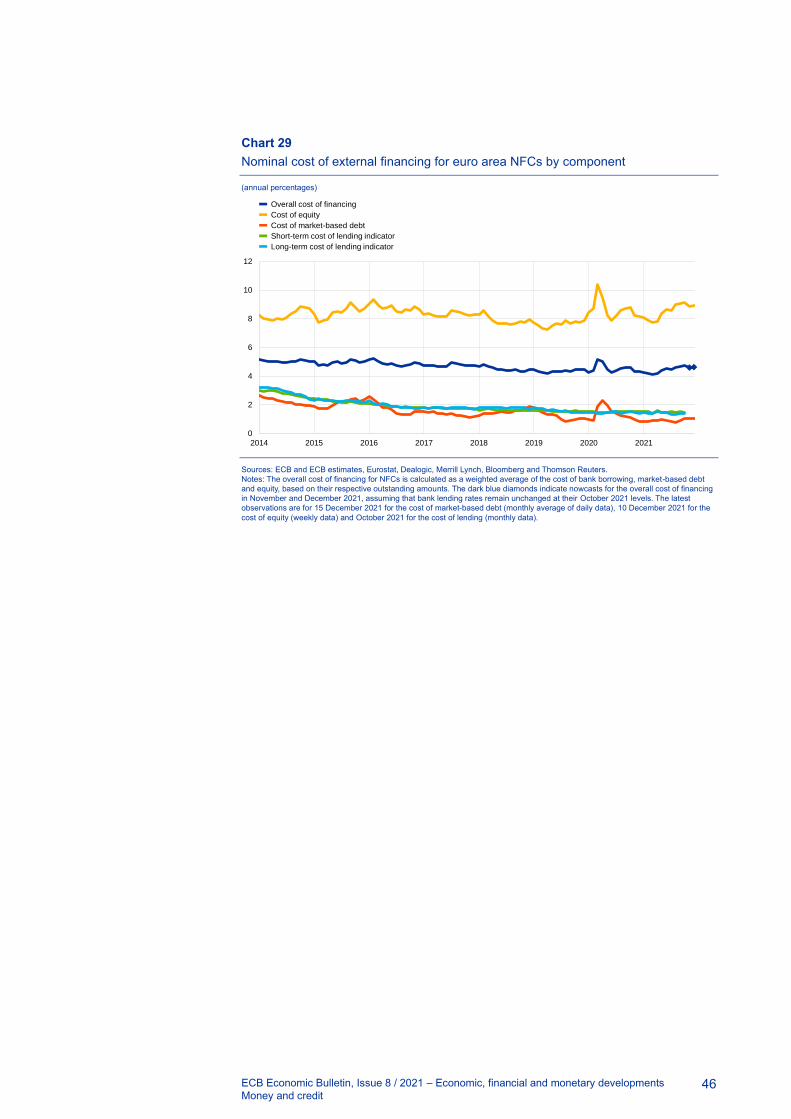
ECB Economic Bulletin, Issue 8 / 2021 – Economic, financial and monetary developments
Money and credit 46
Chart 29
Nominal cost of external financing for euro area NFCs by component
(annual percentages)
Sources: ECB and ECB estimates, Eurostat, Dealogic, Merrill Lynch, Bloomberg and Thomson Reuters.
Notes: The overall cost of financing for NFCs is calculated as a weighted average of the cost of bank borrowing, market-based debt
and equity, based on their respective outstanding amounts. The dark blue diamonds indicate nowcasts for the overall cost of financing
in November and December 2021, assuming that bank lending rates remain unchanged at their October 2021 levels. The latest
observations are for 15 December 2021 for the cost of market-based debt (monthly average of daily data), 10 December 2021 for the
cost of equity (weekly data) and October 2021 for the cost of lending (monthly data).
0
2
4
6
8
10
12
2014 2015 2016 2017 2018 2019 2020 2021
Overall cost of financing
Cost of equity
Cost of market-based debt
Short-term cost of lending indicator
Long-term cost of lending indicator

ECB Economic Bulletin, Issue 8 / 2021 – Economic, financial and monetary developments
Fiscal developments 47
6 Fiscal developments
Although the coronavirus (COVID-19) crisis continued to weigh heavily on public
finances in 2021, the December 2021 Eurosystem staff macroeconomic projections
show that the fiscal balance is already on a path to improvement. Having peaked at
7.2% of GDP in 2020, the deficit ratio is estimated to have fallen to 5.9% in 2021 and
is projected to fall further to 3.2% in 2022 and to stabilise thereafter just below 2% by
the end of the forecast horizon in 2024. These improvements are due to a
combination of higher cyclically adjusted primary balances and, particularly from
2022, a significantly larger contribution from the economic cycle. In terms of the euro
area fiscal stance, a strong expansion in 2020 was followed by only a marginal
tightening in 2021 once adjusted for Next Generation EU (NGEU) grants. In 2022,
the stance is projected to tighten considerably, albeit much less than previously
projected, mainly owing to a reversal of a significant part of crisis emergency
support. The tightening is projected to continue over the remainder of the forecast
horizon but to a much smaller extent since significant support to the economy
remains in place over the coming years. In general, supportive fiscal policies that
rest on a gradual withdrawal of fiscal measures would help to sustain the recovery of
the euro area economy and mitigate the longer-term scarring effects. This support
would also help the economy adjust to the structural changes that are under way.
Fiscal measures should be growth-friendly and targeted in nature to address
vulnerabilities effectively. As a complement to national fiscal measures, the NGEU
and the “Fit for 55” package are expected to contribute to a stronger, greener and
more even recovery.
According to the December 2021 Eurosystem staff macroeconomic
projections, the euro area general government budget balance will show a
steady improvement starting in 2021.22 The general government deficit ratio for
the euro area is estimated to have declined to 5.9% of GDP in 2021, after reaching
an unprecedented 7.2% in 2020. It is forecast to then fall even more strongly to 3.2%
in 2022 and further to 2.1% and 1.8% of GDP in the subsequent two years (Chart
30). Following economic support measures in response to the pandemic of around
4.1% of GDP in 2020, the crisis and recovery support is projected to have increased
to about 4.4% of GDP in 2021. This reflects the fact that governments have
prolonged emergency measures, gradually expanded their size and/or adopted new
ones to support the recovery, including measures funded through grants that they
receive from the NGEU.23 The large negative cyclical component, which contributed
to the large increase in the government deficit in 2020, is expected to start
contributing less, albeit only moderately so, in 2021. The more significant
improvement in the budget balance from 2022 onwards is projected to be driven by a
higher cyclically adjusted primary balance, as a large share of the emergency
measures not funded by NGEU grants will expire. Moreover, the negative
contribution from the economic cycle is expected to fade swiftly as of 2022, turning
22 See the “Eurosystem staff macroeconomic projections for the euro area, December 2021”, published
on the ECB’s website on 16 December 2021.
23 NGEU grants amount to around 0.5% of GDP, on average, over the projection horizon, declining
gradually after 2022. Together with a limited amount of loans, they are assumed to finance about 2.5%
of GDP of budget spending. The fiscal developments described in this section do not include the
European supranational deficit and debt related to NGEU transfers.

ECB Economic Bulletin, Issue 8 / 2021 – Economic, financial and monetary developments
Fiscal developments 48
slightly positive as of 2023. To a lesser extent, but over the whole projection horizon,
the improvement in the budget balance will also be helped by gradually falling
contributions from interest payments.
Chart 30
Budget balance and its components
(percentages of GDP)
Sources: ECB and December 2021 Eurosystem staff macroeconomic projections.
Note: The data refer to the aggregate general government sector of euro area countries.
The euro area aggregate fiscal stance is estimated to have tightened
marginally in 2021, following a very large expansion in 2020.24 From still high
levels of support, a more significant tightening of the fiscal stance is expected to take
place in 2022, as the fiscal support fades along with the expiry of pandemic and
temporary support measures. In 2023 and 2024 the fiscal stance is projected to
continue tightening moderately.25 This notwithstanding, the level of fiscal support to
the economic recovery remains large over the whole projection horizon, which is
reflected in the overall primary fiscal balance remaining firmly negative.
In addition to the fiscal support for their economies, euro area countries have
provided sizeable loan guarantee envelopes to bolster the liquidity positions
of firms. In total, these guarantee envelopes amount to around 19% of GDP for the
euro area in 2021. The cumulative take-up of these guarantees over the period
2020-21 is estimated at 9% of GDP. It should be noted that these figures mask
significant differences in both the envelope and the take-up rate across countries.
The loan guarantees are contingent liabilities for governments and any calls on the
24 The fiscal stance reflects the direction and size of the stimulus from fiscal policies to the economy
beyond the automatic reaction of public finances to the business cycle. It is measured here as the
change in the cyclically adjusted primary balance ratio net of government support to the financial
sector. Given that the higher budget revenues related to NGEU grants from the EU budget do not have
a contractionary impact on demand, the cyclically adjusted primary balance is in this context adjusted
to exclude those revenues. For more details on the concept of the euro area fiscal stance, see the
article entitled “The euro area fiscal stance”, Economic Bulletin, Issue 4, ECB, 2016.
25 The euro area aggregate fiscal stance was -4.2 percentage points of GDP in 2020, is estimated to have
been +0.2 percentage points of GDP in 2021, and is projected to be +1.1, +0.3 and +0.3 percentage
points of GDP in 2022, 2023 and 2024, respectively, after adjustment for revenues related to NGEU
grants.
-8
-7
-6
-5
-4
-3
-2
-1
0
1
2020 2021 2022 2023 2024
Cyclically adjusted primary balance (adjusted for NGEU grants on revenue side)
Cyclical component
Interest payments
NGEU grants (on revenue side)
Budget balance

ECB Economic Bulletin, Issue 8 / 2021 – Economic, financial and monetary developments
Fiscal developments 49
guarantees will therefore constitute additional public spending that increases
government debt.
Compared with the September 2021 ECB staff macroeconomic projections, the
budget balance in 2021 is projected to have improved significantly while a
small deterioration is foreseen for 2022. Specifically, the euro area general
government budget balance as a share of GDP has been revised up by 1.1
percentage points for 2021 to -5.9% and down by 0.2 percentage points in 2022 to
- 3.2% while the balance in 2023 is unrevised at -2.1%. This profile is mostly
determined by revisions in the fiscal stance, which is estimated to have tightened in
2021, mostly on account of higher revenue collections than previously estimated and
somewhat lower discretionary stimulus measures. For 2022, the revisions in the
fiscal stance reflect mainly the additional stimulus measures incorporated in the
context of the 2022 budgets and, to a lesser extent, non-discretionary revenue
factors with a loosening effect.
Following a large increase in 2020, the euro area government debt-to-GDP
ratio is projected to decline slightly to just below 97% in 2021 and further to
about 90% in 2024. After a 14 percentage point increase in the debt ratio in 2020, a
falling but still high primary deficit in 2021 will be more than compensated by a
significant debt-reducing contribution from the interest-growth differential. In 2022
and 2023, the debt ratio is projected to decline more quickly as debt-increasing
primary deficits, though falling, are outweighed by favourable contributions from
interest-growth differentials and, to a lesser extent, by negative deficit-debt
adjustments (Chart 31). At the end of the projection horizon in 2024, the debt-to-GDP
ratio is expected to stabilise at around 90%, 6 percentage points above its pre-crisis
level. Overall, the COVID-19 crisis has had a significantly smaller adverse impact on
the euro area aggregate debt path than was generally expected in the initial phase of
the crisis.26
26 For instance, in the June 2020 Eurosystem staff macroeconomic projections, the debt-to-GDP level at
the end of 2022 was projected to stand 6.7 percentage points higher than in the current projections.

ECB Economic Bulletin, Issue 8 / 2021 – Economic, financial and monetary developments
Fiscal developments 50
Chart 31
Drivers of change in euro area government debt
(percentages of GDP, unless otherwise indicated)
Sources: ECB and December 2021 Eurosystem staff macroeconomic projections.
Note: The data refer to the aggregate general government sector of euro area countries.
National fiscal policies should provide targeted and growth-friendly support to
the firms and households most exposed to the ongoing pandemic. This, based
on a gradual withdrawal of fiscal support, would help to sustain the recovery and
mitigate the longer-term scarring effects. The gradual reduction of budgetary
imbalances should rest on a decisive shift towards a more growth-friendly
composition of public finances and structural reforms that raise the growth potential
of euro area economies. The NGEU’s Recovery and Resilience Facility and the “Fit
for 55” package can provide important support in this respect, not least by
accelerating the green and digital transitions.
-18
-16
-14
-12
-10
-8
-6
-4
-2
0
2
4
6
8
10
12
14
16
2020 2021 2022 2023 2024 2021-24
Cumulative
Primary balance (-)
Deficit-debt adjustment
Interest-growth differential
Change in consolidated gross debt (percentage points of GDP)

ECB Economic Bulletin, Issue 8 / 2021 – Boxes
Supply chain disruptions and the effects on the global economy 51
Boxes
1 Supply chain disruptions and the effects on the global
economy
Prepared by Maria Grazia Attinasi, Mirco Balatti, Michele Mancini and
Luca Metelli
Strains in global production networks, which started to emerge in late 2020,
are a reflection of imbalances between the supply and demand of certain
goods and are creating headwinds for the ongoing global economic recovery.
Strains in global production networks, also commonly referred to as supply
bottlenecks, are a multifaceted phenomenon. The decline and subsequent recovery
in economic activity during the COVID-19 pandemic have been unprecedented,
reflecting the massive shifts in demand and supply triggered by the closing and
reopening of economies, and amid considerable monetary and fiscal stimulus and
high levels of accumulated savings, especially in advanced economies. Moreover, as
pandemic-related containment measures severely restricted consumption
opportunities in the services sector (in particular travel, tourism and recreational
activities), there was a rotation in demand towards merchandise goods, which
compounded the already strong cyclical recovery in the goods sector. Faced with
that strong surge in demand, suppliers of goods worldwide have been struggling to
meet the increase in orders. In addition, idiosyncratic supply chain disruptions (owing
to the waves of the pandemic and adverse weather events, for instance) have also
played a role, capping activity and trade growth and ultimately pushing up prices.
This box reviews the main features of the ongoing supply bottlenecks. First, it aims
to disentangle supply chain disruptions from demand-side factors, claiming that while
the latter are a manifestation of the current phase of the business cycle, the former
may indeed curb the pace of the recovery and therefore warrant close monitoring.
Second, it provides an empirical assessment of the impact of supply chain
disruptions on global economic activity and prices, and the assumptions about how
they will evolve going forward.1
Supply chain disruptions are putting a drag on activity and trade at the global
level. The most relevant elements are i) difficulties in the logistics and transportation
sector, ii) semiconductor shortages, iii) pandemic-related restrictions on economic
activity, and iv) labour shortages. Global shipping of merchandise goods has been
severely disrupted owing to container misplacement and congestion on the back of
not only the rapid recovery in the global economy, the rotation of consumption
demand from services to goods, and the associated high import volumes, but also
port closures because of localised and asynchronous outbreaks of COVID-19.2 As a
1 For an analysis of the impact of supply chain disruptions on euro area industrial production, see the
box entitled “Sources of supply chain disruptions and their impact on euro area manufacturing” in this
issue of the Economic Bulletin.
2 See also the box entitled “What is driving the recent surge in shipping costs”, Economic Bulletin, Issue
3, ECB, 2021.

ECB Economic Bulletin, Issue 8 / 2021 – Boxes
Supply chain disruptions and the effects on the global economy 52
result, shipping costs, especially from the main Asian ports to the United States and
Europe, have skyrocketed since the end of 2020. Semiconductor shortages started
to materialise in the second half of 2020 and are especially pronounced in the
automotive sector. During the great lockdown, car producers reduced their chip
orders, while demand for chips used in other electronic equipment rose significantly
(mostly on account of the work from home instruction). Producers were surprised by
the sharp increase in new car orders in the second half of 2020, and with little spare
capacity left in the semiconductor industry, chip production was unable to keep up
with the high demand – possibly also as a result of underinvestment in the years
prior to the pandemic.3 Labour shortages appear to be less widespread and more
concentrated in certain economies, such as the United States and the United
Kingdom. In both countries, indicators of labour market tightness are already above
their pre-crisis levels, in contrast to the slow recovery after the global financial crisis.
Declines in both matching efficiency and labour force participation partly reflect
increases in unemployment benefits, early retirements and the need to care for
children and other family members during the pandemic, as well as a reluctance to
work in contact-intensive sectors.4 Finally, the impact of the aforementioned factors
in terms of clogging up supply chains might be exacerbated by the “bullwhip-effect”,
a standard amplification channel phenomenon whereby firms build up their
inventories because they are expecting robust demand amid a shortage of key
inputs in the production process, such as raw materials and intermediates.
The lengthening of suppliers’ delivery times across advanced economies since
the end of 2020 is the most evident manifestation of widespread strains in
global production networks. One of the indicators most commonly used as a proxy
for such strains is the global Purchasing Managers Index suppliers’ delivery times
(hereinafter referred to as the “PMI SDT”), which quantifies developments in the time
required for the delivery of inputs to firms. One key advantage of the PMI SDT is that
it is able to capture capacity constraints of a different nature (e.g. intermediate goods
shortages, transportation delays or labour supply shortages), making it an all-
encompassing indicator of strains in global production networks.5 This indicator
suggests that suppliers’ delivery times have lengthened massively in recent months
(Chart A, panel a) and that the lengthening is proving to be more protracted than
during the initial COVID-19 shock. The chart also suggests that there is a significant
amount of heterogeneity between advanced economies and emerging economies,
with economies like the United States, the euro area and the United Kingdom being
much more affected than key emerging economies. Finally, while the increase in the
PMI SDT is common to most sectors, it is particularly pronounced for certain types of
product, such as technology equipment and machinery (Chart A, panel b),
suggesting that the shortage of intermediate products is more severe in those
sectors.
3 See also the box entitled “The semiconductor shortage and its implication for euro area trade,
production and prices”, Economic Bulletin, Issue 4, ECB, 2021.
4 See also the box entitled “The US and UK labour markets in the post-pandemic recovery” in this issue
of the Economic Bulletin.
5 An alternative indicator of supply bottlenecks is shipping prices, but these provide only a partial picture
of the phenomenon, as they only cover the logistics sector, whereas the PMI SDT is broader and co-
moves more with economic activity.
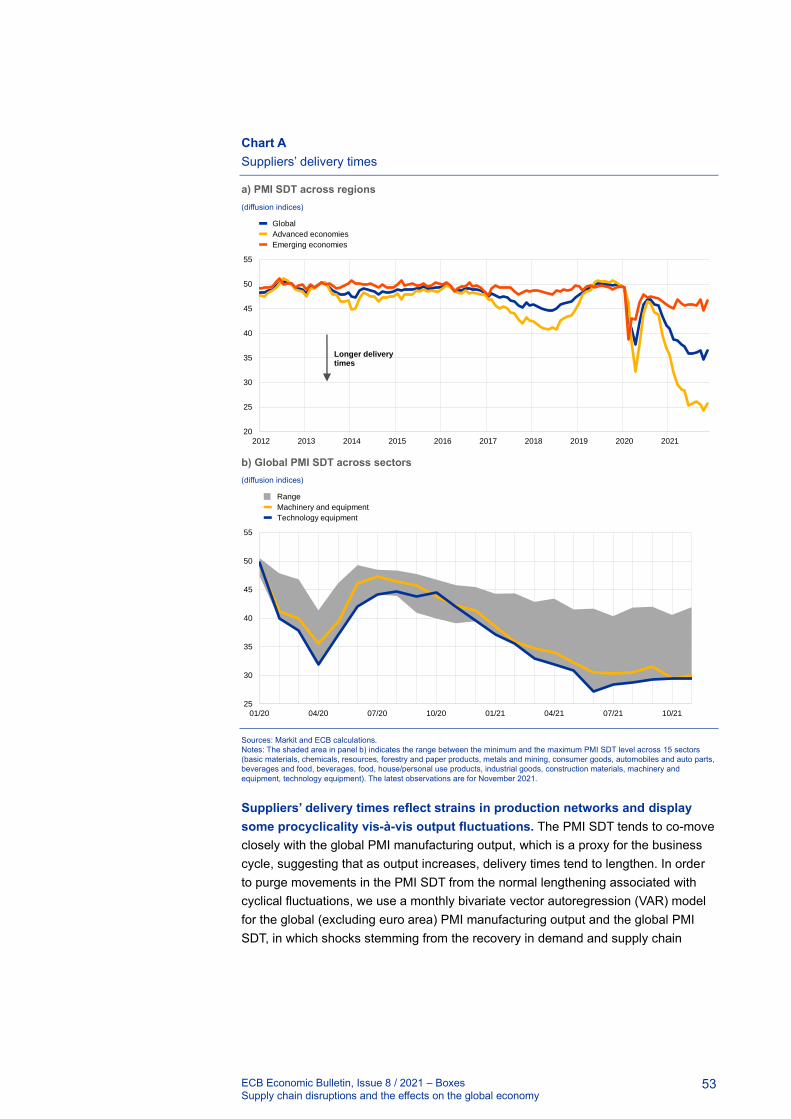
ECB Economic Bulletin, Issue 8 / 2021 – Boxes
Supply chain disruptions and the effects on the global economy 53
Chart A
Suppliers’ delivery times
a) PMI SDT across regions
(diffusion indices)
b) Global PMI SDT across sectors
(diffusion indices)
Sources: Markit and ECB calculations.
Notes: The shaded area in panel b) indicates the range between the minimum and the maximum PMI SDT level across 15 sectors
(basic materials, chemicals, resources, forestry and paper products, metals and mining, consumer goods, automobiles and auto parts,
beverages and food, beverages, food, house/personal use products, industrial goods, construction materials, machinery and
equipment, technology equipment). The latest observations are for November 2021.
Suppliers’ delivery times reflect strains in production networks and display
some procyclicality vis-à-vis output fluctuations. The PMI SDT tends to co-move
closely with the global PMI manufacturing output, which is a proxy for the business
cycle, suggesting that as output increases, delivery times tend to lengthen. In order
to purge movements in the PMI SDT from the normal lengthening associated with
cyclical fluctuations, we use a monthly bivariate vector autoregression (VAR) model
for the global (excluding euro area) PMI manufacturing output and the global PMI
SDT, in which shocks stemming from the recovery in demand and supply chain
20
25
30
35
40
45
50
55
2012 2013 2014 2015 2016 2017 2018 2019 2020 2021
Longer delivery times
Global
Advanced economies
Emerging economies
25
30
35
40
45
50
55
01/20 04/20 07/20 10/20 01/21 04/21 07/21 10/21
Range
Machinery and equipment
Technology equipment

ECB Economic Bulletin, Issue 8 / 2021 – Boxes
Supply chain disruptions and the effects on the global economy 54
disruptions are identified using sign restrictions.6 More specifically, we assume that
disruptions to supply chains lengthen delivery times and reduce output, while the rise
in demand induced by the economic recovery increases both delivery times and
output. This approach enables us to recover the structural shocks underlying
movements in the PMI SDT, and in particular the supply-side shock, which we take
as our measure of supply chain shocks.
Our empirical analysis suggests that supply chain shocks account for around
one-third of the strains in global production networks. The historical
decomposition shows that, even though demand factors played a primary role in
driving the overall level of the PMI SDT, supply chain disruptions accounted for one-
third of the lengthening in delivery times over the last six months, and their
contribution has been growing (Chart B). By contrast, the greater contribution of
demand factors is not surprising given the procyclicality of delivery times in periods
of economic recovery and the unprecedented economic recovery that has followed
the initial COVID-19 shock.7
Chart B
A model decomposition of PMI suppliers’ delivery times
(deviations from the mean; percentage point contributions)
Source: ECB calculations based on Markit data.
Notes: Historical decomposition of global (excluding euro area) PMI suppliers’ delivery times, which was obtained via a two variable
Bayesian VAR with PMI output and PMI suppliers’ delivery times, identified through sign restrictions and estimated over the period
from May 2007 to November 2021. The latest observations are for November 2021.
Supply chain disruptions have a negative impact on global industrial
production and trade, and a positive impact on inflation. Our analysis aims to
quantify the impact of the aforementioned supply chain shock on activity, trade and
prices, and, in turn, the headwinds it creates for the economic recovery. To achieve
this, we estimate a companion VAR, with five endogenous variables (exports,
imports and industrial production, together with the inflation rates for the consumer
6 This identification strategy was inspired by Bhushan, S. and Struyven, D., “Supply Chains, Global
Growth, and Inflation”, Global Economics Analyst, Goldman Sachs Research, 20 September 2021. The
use of global PMI manufacturing output measure in this VAR model enables a timely estimation of the
supply chain shock. This would not be possible using hard data on economic activity, which are
published with a longer lag.
7 At the peak of the COVID-19 shock in April 2020, supply chain disruptions were the main reason for the
longer delivery times.
-12
-10
-8
-6
-4
-2
0
2
01/19 04/19 07/19 10/19 01/20 04/20 07/20 10/20 01/21 04/21 07/21 10/21
PMI suppliers’ delivery times
Economic recovery
Supply chain

ECB Economic Bulletin, Issue 8 / 2021 – Boxes
Supply chain disruptions and the effects on the global economy 55
price index and the producer price index). The estimated supply chain shock is
plugged into the model as an exogenous variable. In order to quantify the headwinds
for activity, trade and prices, we then generate a counterfactual scenario by running
a conditional forecasting exercise for the period from November 2020 to September
2021, which assumes that there are no supply chain disruptions (i.e. the supply
chain shock is set at zero throughout). For that period, we find that world trade would
have been around 2.7% higher cumulatively in the absence of supply chain shocks,
while global industrial production would have been around 1.4% higher (Chart C,
panel a). The effects are greater on trade than on industrial production because the
weakness in the logistics sector disproportionately affected trade. Moreover, the shift
towards domestic suppliers and domestic goods might have mitigated the
repercussions on industrial production. Our findings also suggest that supply chain
disruptions have a significant – and increasing over time – effect on prices, which is
much more prominent in the producer price index than in the consumer price index
(Chart C, panel b).8 This could be attributed to the fact that producers are more
directly exposed to supply chain disruptions than consumers. Moreover, rising
producer prices are passed on to consumers only partially and/or with a lag. Finally,
it is worth noting that the aforementioned aggregate results mask significant
heterogeneity across countries given that not all countries are affected by supply
bottlenecks to the same degree. For instance, we find that the effects are greater in
the United States, where trade and industrial production stand at 4.3% and 2.0%
below the disruption-free counterfactual scenario respectively.
8 The impulse response functions of the VAR suggest that, after a one period shock, the effects on
inflation dissipate in six to nine months, while those on real variables take around four months.

ECB Economic Bulletin, Issue 8 / 2021 – Boxes
Supply chain disruptions and the effects on the global economy 56
Chart C
Impact estimates
a) World (excluding euro area) trade and industrial production
(October 2020 = 100)
b) World (excluding euro area) consumer price index and producer price index
(percentage point deviations from year-on-year monthly inflation)
Source: ECB calculations based on Markit, CPB and OECD data.
Notes: The effects of supply chain disruptions on quantities and prices are obtained by means of a VAR in which a structural supply
shock (recovered from a sign restricted structural VAR with PMI output and PMI delivery times) is plugged in as an exogenous
variable. The effects are computed as the difference between the path of the variables obtained under the realisation of the shock and
under a counterfactual scenario in which the shock between November 2020 and September 2021 is set at zero (i.e. no supply chain
disruptions). In panel a) the dashed lines show the estimated evolution of exports and industrial production in the absence of supply
bottlenecks. In panel b) the bars show the estimated effects of supply bottlenecks on the consumer price index and the producer price
index. All global aggregates exclude the euro area. The latest observations are for September 2021.
Supply chain disruptions are expected to improve gradually in the second half
of 2022, although there is still a high level of uncertainty about their evolution.
Given their multifaceted nature, some disruptions might need more time to be
resolved than others. For example, a significant boost to semiconductor production
requires a large amount of investment to increase foundry capacity, and given the
lead time that this requires, fundamental improvements can only be expected later in
2022 or in 2023. Any easing in labour shortages in the coming months will depend
on the evolution of government support, as well as pandemic containment measures
and the number of new COVID-19 cases. Shipping costs have fallen recently, mainly
on account of temporary factors (e.g. the reopening of ports in South Asia as the
number of COVID-19 infections had declined), but they are still close to their
90
95
100
105
110
95
100
105
110
115
10/20 11/20 12/20 01/21 02/21 03/21 04/21 05/21 06/21 07/21 08/21 09/21
Industrial production
Exports (right-hand scale)
0.0
0.1
0.2
0.3
0.4
0.5
0.6
0.7
0.8
0.9
1.0
11/20 12/20 01/21 02/21 03/21 04/21 05/21 06/21 07/21 08/21 09/21
Consumer price index
Producer price index
ECB Economic Bulletin, Issue 8 / 2021 – Boxes
Supply chain disruptions and the effects on the global economy 57
historical highs. Available survey-based information summarising the views of the
corporate sector suggests that the situation is expected to remain difficult throughout
most, if not all, of 2022.9
Looking ahead, risks of further supply-side disruptions cannot be ruled out,
especially if the pandemic situation intensifies. The new Omicron variant has
reignited concerns about an intensification of the pandemic on a global scale.
Outbreaks may result in localised closures at ports or firms, which would induce
further disruptions in production and shipping, and hence act as a drag on activity
while putting upward pressures on prices. In addition, new containment measures to
limit its spread (e.g. restrictions on mobility and international flights), as well as
voluntary limitations, may again trigger a shift in consumer demand from services to
goods, thereby exacerbating supply bottlenecks. However, if overall consumer
demand declines, there could be some easing in the global supply constraints which,
as shown above, seem to be mostly the result of strong demand. Finally, a faster
than expected increase in semiconductor production and transportation capacity in
the shipping industry may lead to a quicker resolution of the supply-side disruptions.
9 See the box entitled “Main findings from the ECB’s recent contacts with non-financial companies”, ECB
Economic Bulletin, Issue 7, ECB, 2021; Oxford Economics, Research Briefing Global, “Supply chain
problems peaking, but risks remain” by Tim Hunter, 18 November 2021; The Beige Book, Federal
Reserve System, 20 October 2021; The CFO Survey, Duke University, Federal Reserve Bank of
Richmond and Federal Reserve Bank of Atlanta, 14 October 2021; Business Outlook Survey of
Industrial and Service Firms, Banca d’ Italia, 8 November 2021.
ECB Economic Bulletin, Issue 8 / 2021 – Boxes
The US and UK labour markets in the post-pandemic recovery 58
2 The US and UK labour markets in the post-pandemic
recovery
Prepared by Katrin Forster van Aerssen, Ramon Gomez-Salvador,
Michel Soudan and Tajda Spital
During the post-pandemic recovery, the US and UK labour markets show many
similarities, albeit with different implications for wages. This box reviews post-
pandemic labour market developments in the United States and United Kingdom. It
shows that, in both countries, imbalances between labour demand and labour supply
are causing a high and unusual tightness for such an early stage in a recovery. This
could translate into broad-based wage pressures, in turn posing a risk to inflation.
Such pressures are becoming increasingly visible in the United States, but are less
marked in the United Kingdom.
In the United States, labour demand outstrips supply. According to the latest
available data, in October 2021 the labour force participation rate still stood
significantly below its pre-crisis level (1.7 percentage points below the level
prevailing in February 2020). Such a level is commonly observed at an early stage of
a recovery in the labour market cycle. The maximum employment objective for the
Federal Reserve System, of which the participation rate is one element, appears to
be far from being reached (Chart A). At the same time, firms are opening positions at
a fast pace in response to the rapid recovery of the US economy. This has brought
vacancies to very high, even unprecedented, levels, which are usually associated
with a late stage in the labour market cycle. As a result, labour market tightness has
already jumped above pre-crisis levels, instead of making a slow recovery, as was
the case after the global financial crisis (Chart A).1 The lack of response on the part
of labour supply (low participation) to rising labour demand (high level of vacancies)
is indicative of a decline in matching efficiency in the current recovery. This appears
to be the case especially for businesses with frequent customer contact, such as
bars and restaurants, which have encountered difficulties in attracting workers.
Moreover, a temporary increase in unemployment benefits (particularly significant for
low-paid workers), early retirement, and an increased need to care for children and
other family members during the pandemic, particularly for women, has also reduced
the labour supply.2 This partly accounts for what has been called the “Great
Resignation”, as support programmes have allowed people more freedom to leave
their jobs or to be more selective when looking for new ones.
1 The Empire State Manufacturing Survey confirms that firms are struggling to expand the workforce.
2 The slow recovery of older groups’ participation in the United States could be partly due to fears related
to the pandemic. For a detailed analysis at the euro area level, see the box entitled “Labour supply
developments in the euro area during the COVID-19 pandemic”, Economic Bulletin, Issue 7, ECB,
2021.

ECB Economic Bulletin, Issue 8 / 2021 – Boxes
The US and UK labour markets in the post-pandemic recovery 59
Chart A
US employment rate, participation rate and labour market tightness
(percentages of civilian population; ratio of vacancies to unemployment; monthly)
Sources: BLS and author’s calculations.
Notes: Labour market tightness is measured by the ratio of vacancies to unemployment. Shaded areas indicate recessions. The latest
observations are for September 2021 for tightness and October 2021 for employment and participation rates.
The increase in labour market tightness has translated into broadening wage
pressures. While the high level of vacancies has been broad-based across
industries, up to the second quarter of this year wage growth – as measured by the
employment cost index – was limited to leisure and hospitality, as firms tried to make
these contact-intensive and mostly low-paid jobs more attractive (Chart B). In the
third quarter of this year, however, an acceleration in wages also became visible in
most other industries, such as trade and, to a lesser extent, manufacturing, financial
activities and professional services, although for the latter three industries still
remaining within ranges observed in the past. This development has sparked a
debate about the risk of a further broadening of wage pressures, and if it could
ultimately lead to a wage-price spiral. Whether these risks materialise depends on
various factors. First, most of the factors which have held back labour supply in the
United States are expected to be temporary and to revert in the coming months,
therefore reducing the level of tightness. The temporary increase in unemployment
benefits has already expired. Second, new coronavirus (COVID-19) infections have
been falling since summer, which should attenuate fears about returning to work in
high-contact industries, and the reopening of schools should favour a return to work
by parents. At the same time, above average productivity growth has kept unit labour
costs, a measure that is more relevant for firms in setting prices than nominal wages,
close to long-term averages. Third, the recent increase in inflation has to a large
extent been driven by goods and services, for which wage growth has remained
subdued (for example car manufacturing), or is related to other factors (such as
rents, which are linked to housing market developments). On the other hand,
although indexation clauses are not a common practice in the United States, the high
inflation environment (highest headline inflation rate recorded since 1990), coupled
with labour market tightness could translate into a heightened risk of higher wage
demands proliferating going forward.
0.0
0.2
0.4
0.6
0.8
1.0
1.2
1.4
1.6
1.8
50
52
54
56
58
60
62
64
66
68
2001 2003 2005 2007 2009 2011 2013 2015 2017 2019 2021
Civilian participation rate
Civilian employment/population ratio
Labour market tightness (right-hand scale)

ECB Economic Bulletin, Issue 8 / 2021 – Boxes
The US and UK labour markets in the post-pandemic recovery 60
Chart B
US employment cost index by industry
(year-on-year growth rates)
Sources: BLS and author’s calculations.
Notes: The box plots represent the minimum, the first quartile, the median, the third quartile and the maximum from the first quarter of
1997 to the fourth quarter of 2019. The latest observations are for the third quarter of 2021.
The UK labour market is also showing signs of increased tightness, coupled
with a slow recovery in employment and labour market participation. As in the
United States, both the employment rate and the labour force participation rate have
only slowly been approaching their pre-crisis levels. The respective gaps of 1.2
percentage points and 0.9 percentage points compared with February 2020 levels
remain considerable and indicate an early cycle stage of the labour market recovery
(Chart C). In contrast, vacancies have been increasing rather sharply, as UK firms
have faced both an increased demand for goods and services (driven by the re-
opening of the economy) and a decreased supply of low-skilled EU workers (owing
to Brexit). As a result, labour market tightness has already surpassed pre-crisis
levels, pointing towards a late stage in the cycle, as opposed to the slower recovery
experienced in the aftermath of the global financial crisis (Chart C). Similar to the
United States, the sluggish response of UK labour supply relative to strong labour
demand suggests lower matching efficiency. This is for similar reasons, but also
because of lower participation by many younger people who have chosen to stay in
education. The furlough scheme may be another explanation for the tightness in the
labour market, as employees on furlough had less incentive to join the pool of
available workers and apply for new jobs. However, the scheme ended in
September, meaning that labour market tightness might already be lower than the
official data show.
0
1
2
3
4
5
6
7
Total Construction Manufacturing Tradetransportations
and utilities
Financialactivity
Professionalservice
Educationand health
Leisure
2020 minimum
Q2 2021
Q3 2021

ECB Economic Bulletin, Issue 8 / 2021 – Boxes
The US and UK labour markets in the post-pandemic recovery 61
Chart C
UK employment rate, participation rate and labour market tightness
(percentages of working age population and ratio of vacancies to unemployment, 3-month moving average)
Sources: ONS and authors’ calculations.
Notes: Labour market tightness is measured by the ratio of vacancies to unemployment. Shaded areas indicate recessions. The latest
observations are for September 2021.
Reflecting the diverse developments in vacancies, wage pressures have so far
remained limited to specific sectors. While economy-wide growth in average
weekly earnings remains high (at 5.8% in September), most of the increase comes
from negative base effects reflecting the introduction of the furlough scheme last
year.3 This can also be observed on a sectoral level, as base effects drove wages in
the second quarter of this year to historically high rates across most industries. The
latest data for the third quarter indicate that wage growth has not increased further
and, in most cases, has even decelerated (Chart D).4 Wage increases were most
pronounced in professional and business services and in sectors previously relying
on low-skilled migrant labour (construction, and leisure and hospitality). It is worth
noting that even though specific professions (such as lorry drivers) experienced a
substantial increase in earnings, this increase did not extend to the industry as a
whole (trade, transportation and utilities). Therefore, the risk of broad-based wage
pressures and a wage-price spiral appears less likely at this stage of the recovery,
considering that the underlying wage growth remains much more contained.
3 The government-run furlough scheme in the United Kingdom provided staff on furlough with 80% of
their usual salary, up to a maximum of £2,500 per month. This resulted in a considerable decrease in
average weekly earnings.
4 When annualised growth rates are compared over two years, the influence of base effects disappears,
and the second and third quarters show only moderate wage pressures.
0.0
0.3
0.6
0.9
1.2
57
59
61
63
65
2001 2003 2005 2007 2009 2011 2013 2015 2017 2019 2021
Participation rate
Employment/working population ratio
Labour market tightness (right-hand scale)
Recessions

ECB Economic Bulletin, Issue 8 / 2021 – Boxes
The US and UK labour markets in the post-pandemic recovery 62
Chart D
Average weekly earnings by industry in the United Kingdom
(year-on-year growth rates, 3-month moving average)
Sources: ONS and authors’ calculations.
Notes: The box plots represent the minimum, the first quartile, the median, the third quartile and the maximum from the first quarter of
2002 to the fourth quarter of 2019. The latest observations are for the third quarter of 2021.
Overall, while both the United States and United Kingdom are experiencing
labour shortages, developments on the wage front differ to some extent.
Factors constraining labour supply are expected to fade somewhat in both countries.
In the United Kingdom, this is likely to reduce labour market tightness and to dampen
what have been – up until now – very localised wage pressures. In the United
States, expectations of further strong economic growth in the short term could
prolong labour market tightness, in turn leading to broader-based wage increases.
-15
-10
-5
0
5
10
15
20
Total Manufacturing Construction Trade Financialactivity
Professionalservice
Educationand health
Leisure andhospitality
2020 minimum
Q2 2021
Q3 2021

ECB Economic Bulletin, Issue 8 / 2021 – Boxes
Financing conditions through the lens of euro area companies 63
3 Financing conditions through the lens of euro area
companies
Prepared by Annalisa Ferrando and Sofia Gori
This box explores new indicators of the financing conditions faced by euro
area companies, based on firm-level survey data. Since the beginning of the
pandemic, and especially since December 2020, the Governing Council has
committed itself to preserving favourable financing conditions for the duration of the
pandemic, seeing them as the compass guiding monetary policy.1 The ECB uses a
holistic approach to measure financing conditions, covering a broad spectrum of
indicators over the entire transmission chain of monetary policy. These indicators
range from “upstream” stages, with interest rates that are at the beginning of the
transmission process (i.e. risk-free interest rates and sovereign yields), to
“downstream” stages, with indicators which measure the effects on the cost and
volume of external finance available to firms and households. This box focuses on
new indicators of the downstream financing conditions faced by non-financial
corporations in the euro area, derived from information taken from the survey on the
access to finance of enterprises (SAFE). Such information complements an analysis
of financial conditions based on quantitative bank-based and market-based
indicators.
Based on the rich SAFE dataset, three synthetic indicators encapsulate how
firms have perceived financing conditions in the euro area since 2009. The
SAFE survey includes questions divided into four groups. The first group covers
changes in price terms and conditions, and is related to bank interest rates and other
costs of bank financing (charges, fees and commissions), while the second focuses
on changes in non-price terms and conditions and covers collateral and other factors
such as required guarantees, information requirements, procedures, time required
for loan approval, and loan covenants. The third group of questions relates to the
financial position of firms and focuses on changes in profits, own capital and credit
history, insofar as these variables are perceived to affect a firm’s access to credit.
Changes in these variables reveal information on the financial solidity of borrowers’
balance sheets and are used by banks to decide whether or not to provide credit.
The fourth group of questions covers firms’ perceptions of changes in the
“willingness” of banks to provide credit and also provides significant information on
the supply of external financing. Such questions can indirectly signal the extent to
which monetary policy operations are helping to ease access to bank funding and
therefore to maintain lending to the real economy. Starting from the individual
responses of about 35,000 firms to the four groups of questions above,2 it is possible
to capture various aspects of overall financing conditions by applying factor
1 See Lane, P., “The compass of monetary policy: favourable financing conditions”, speech at Comissão
do Mercado de Valores Mobiliários, 25 February 2021.
2 This corresponds to a total of 58,000 observations in the period 2009-21 (until September).

ECB Economic Bulletin, Issue 8 / 2021 – Boxes
Financing conditions through the lens of euro area companies 64
analysis.3 The analysis detects three “principal components”, which can be
interpreted as relating to the financial position of firms, non-price terms and
conditions, and price terms and conditions. These are presented in Chart A, in the
order of their importance in explaining the total variance of overall financing
conditions. A positive value for a principal component signals a tightening in
financing conditions.
Overall, the three indicators suggest there have been several important phases
in firms’ perceptions of their financing conditions, which closely align with the
monetary policy measures taken by the ECB over time (Chart A, all panels).
The indicators suggest that there has been a general easing of financing conditions
over the last decade, which is consistent with the accommodative monetary policy
stance in place during the period and with the measures taken to restore the
transmission mechanism since the global financial crisis.4 While financing conditions
were generally tighter for small and medium-sized enterprises than for large
companies throughout most of the period, conditions eased for companies of all
sizes, and this easing continued with only temporary periods of reversal.
3 Technically, the factor analysis provides a greater number of principal components. Using Horn’s
parallel analysis, three principal components were retained. These components explain more than 65%
of the total variance in the dataset of eight individual variables. After the validity of the data reduction
had been assessed using Kaiser-Meyer-Olkin and Cronbach’s alpha statistics, the factor loadings were
rotated obliquely in order to produce correlated factors. On the basis of the rotated factor loadings
matrix, we assigned each principal component a specific meaning by looking at the highest loadings for
each variable.
4 For a detailed description of the different phases and the related ECB measures adopted up until the
onset of the COVID-19 pandemic, see the article entitled “Access to finance for small and medium-
sized enterprises after the financial crisis: evidence from survey data”, Economic Bulletin, Issue 4,
ECB, 2020.

ECB Economic Bulletin, Issue 8 / 2021 – Boxes
Financing conditions through the lens of euro area companies 65
Chart A
Indicators of financing conditions based on factor analysis
(weighted scores in percentages)
Source: ECB and European Commission survey on the access to finance of enterprises (SAFE).
Notes: Positive values indicate a tightening in financing conditions, as measured by the principal components. Small and medium-
sized enterprises have fewer than 250 employees. The individual scores for each principal component are weighted by size class,
economic activity and country to reflect the economic structure of the underlying population of firms. The individual scores are
standardised so they have a range of between -1 and 1 and are multiplied by 100 to obtain weighted balances in percentages. The
first vertical grey line denotes the announcement of Outright Monetary Transactions; the second vertical grey line denotes the start of
the first series of targeted longer-term refinancing operations (TLTRO I) and the negative interest rate policy; the third vertical grey line
denotes the start of TLTRO II and the corporate sector purchase programme; and the last vertical grey line denotes the start of the
pandemic emergency purchase programme and TLTRO III. The dotted lines show the 95% confidence bands. The latest observations
are for April 2021 to September 2021.
-50
-40
-30
-20
-10
0
10
20
30
40
50
H1 H2 H1 H2 H1 H2 H1 H2 H1 H2 H1 H2 H1 H2 H1 H2 H1 H2 H1 H2 H1 H2 H1 H2 H1
'9 '10 '11 '12 '13 '14 '15 '16 '17 '18 '19 '20 '21
a) First principal component (financial position)
Small and medium-sized enterprises
Large enterprises
95% confidence interval
-50
-40
-30
-20
-10
0
10
20
30
40
50
H1 H2 H1 H2 H1 H2 H1 H2 H1 H2 H1 H2 H1 H2 H1 H2 H1 H2 H1 H2 H1 H2 H1 H2 H1
'9 '10 '11 '12 '13 '14 '15 '16 '17 '18 '19 '20 '21
b) Second principal component (non-price terms and conditions)
-50
-40
-30
-20
-10
0
10
20
30
40
50
H1 H2 H1 H2 H1 H2 H1 H2 H1 H2 H1 H2 H1 H2 H1 H2 H1 H2 H1 H2 H1 H2 H1 H2 H1
'9 '10 '11 '12 '13 '14 '15 '16 '17 '18 '19 '20 '21
c) Third principal component (price terms and conditions)

ECB Economic Bulletin, Issue 8 / 2021 – Boxes
Financing conditions through the lens of euro area companies 66
The most recent phase in firms’ perceptions of changes in financing
conditions coincided with the launch of the pandemic emergency purchase
programme (PEPP) and the easing of conditions for the third series of targeted
longer-term refinancing operations (TLTRO III). The latest survey results, which
cover the period April 2021 to September 2021, show that, following the rapid
economic downturn, access to finance improved to the extent that the availability of
external finance was considered to exceed demand. However, during this latest
phase the three principal components offered diverging assessments of financing
conditions, given the specific nature of the pandemic-induced economic crisis.
The first indicator of financing conditions emphasises the role played by
changes in firms’ balance sheet quality (profits, own capital and
creditworthiness) in determining their access to external finance (financial
position: Chart A, panel a). Focusing on the period just before and during the
pandemic (the last four survey rounds), after a significant deterioration at the
beginning of the pandemic the financial position of firms has improved in tandem
with the recent rebound in economic activity. From April 2020 to March 2021, small
and medium-sized enterprises reported a pronounced fall in profits as well as some
erosion of their capital positions. Since both indicators are important determinants of
banks’ lending decisions, this deterioration was perceived by firms as an impediment
to their access to external finance. In the latest survey round (April 2021 to
September 2021) small and medium-sized enterprises signalled a return to an
easing of conditions, which reflected their optimistic perceptions of long-term
turnover growth, despite their continuing lacklustre performance in terms of profits.
Large companies also saw a deterioration in their profit situation, but it was short-
lived.
The second component focuses mainly on factors related to changes in
collateral requirements and other guarantees (non-price terms and conditions:
Chart A, panel b). This indicator has been more stable over time, with a trend which
is declining overall. The indicator points to an easing in financing conditions during
the pandemic for large companies only, while small and medium-sized enterprises
signalled a deterioration due to increases in collateral requirements and other
requirements such as covenants.
The third component mostly reflects changes in interest rates and other costs
of financing (price terms and conditions: Chart A, panel c). This is the
component that might best reflect the transmission of monetary policy to firms’
financing conditions during the four phases described earlier. For small and medium-
sized enterprises it signals some tightening related to banking costs since October
2020, while for large firms it signals a tightening at the beginning of the pandemic
which has moderately considerably in the most recent period (April 2021 to
September 2021).
Firms’ perceptions of financing conditions related to price terms and
conditions closely follow the trend for terms and conditions reported by euro
area banks. Chart B compares the dynamics of the price terms and conditions
component with two important aspects of banks’ terms and conditions agreed in loan
contracts. These are the margins on average loans and the margins on riskier loans,

ECB Economic Bulletin, Issue 8 / 2021 – Boxes
Financing conditions through the lens of euro area companies 67
defined as the spread over relevant market reference rates. Changes in these
variables are regularly reported by euro area banks in the quarterly bank lending
survey (BLS).5 Since 2009 a widening (narrowing) of banks’ margins has been
reflected in a worsening (improvement) of financing conditions reported by firms.
Just before the onset of the pandemic, the signals from the BLS pointed to a broad-
based tightening of credit conditions, although bank lending rates remained at
historically favourable levels. Banks attributed this tightening to the intensification of
risks to the creditworthiness of firms (also captured here by the first indicator) and
the prospect of possible loan losses in the future. As the economic recovery
increasingly included more firms, the tightening diminished and loan margins were
reported as broadly unchanged in the BLS during the latest available SAFE round. At
the same time, however, small and medium-sized enterprises perceived a
deterioration in financing conditions related to price terms and conditions. This most
recent tightening, in the period April 2021 to September 2021, might be due to the
reduced use of pandemic-related government guaranteed loans, which have typically
been granted by banks under very favourable conditions including more relaxed loan
approval criteria.
5 For each (biannual) round of the SAFE survey the corresponding two quarters of BLS responses have
been averaged.

ECB Economic Bulletin, Issue 8 / 2021 – Boxes
Financing conditions through the lens of euro area companies 68
Chart B
Banks’ lending conditions and the third principal component (price terms and
conditions)
(net percentages for margins; weighted scores for price terms and conditions in percentages)
Sources: Euro area bank lending survey (BLS), ECB and European Commission survey on the access to finance of enterprises
(SAFE).
Notes: Positive values indicate a deterioration in the principal component and a net widening in loan margins. Small and medium-sized
enterprises have fewer than 250 employees. The individual scores for the principal component are weighted by size class, economic
activity and country to reflect the economic structure of the underlying population of firms. The individual scores are standardised so
they have a range of between -1 and 1 and are multiplied by 100 to obtain weighted balances in percentages. For each (biannual)
round of the SAFE survey the corresponding two quarters of BLS responses have been averaged. The first vertical grey line denotes
the announcement of Outright Monetary Transactions; the second vertical grey line denotes the start of the first series of targeted
longer-term refinancing operations (TLTRO I) and the negative interest rate policy; the third vertical grey line denotes the start of
TLTRO II and the corporate sector purchase programme; and the last vertical grey line denotes the start of the pandemic emergency
purchase programme and TLTRO III. The latest observations are for April 2021 to September 2021.
A tightening of financing conditions reflected in an increase in any of the
principal components raises the probability of a firm reporting expectations of
a deterioration in the future availability of bank loans (Chart C). In the SAFE
survey, firms are asked to give their expectations for the future availability of external
finance in the six months after the fieldwork is carried out.6 Following the approach
taken by Ferrando and Ganoulis7, a logit model is used to link the expected
deterioration in the future availability of bank loans to the three principal components,
6 For instance, in the last survey round firms were asked between mid-September and mid-October 2021
about changes in access to finance for the period April 2021 to September 2021, and also about
expected changes in access to finance for the period October 2021 to March 2022.
7 Ferrando, A. and Ganoulis, I., “Firms’ expectations on access to finance at the early stages of the
COVID-19 pandemic”, Working Paper Series, No 2446, ECB, 2020.
-40
-20
0
20
40
60
80
H1 H2 H1 H2 H1 H2 H1 H2 H1 H2 H1 H2 H1 H2 H1 H2 H1 H2 H1 H2 H1 H2 H1 H2 H1
'9 '10 '11 '12 '13 '14 '15 '16 '17 '18 '19 '20 '21
a) Small and medium-sized enterprises
Price terms and conditions
BLS margins on riskier loans
BLS margins on average loans
-40
-20
0
20
40
60
80
H1 H2 H1 H2 H1 H2 H1 H2 H1 H2 H1 H2 H1 H2 H1 H2 H1 H2 H1 H2 H1 H2 H1 H2 H1
'9 '10 '11 '12 '13 '14 '15 '16 '17 '18 '19 '20 '21
b) Large enterprises

ECB Economic Bulletin, Issue 8 / 2021 – Boxes
Financing conditions through the lens of euro area companies 69
a set of dummies controlling for macroeconomic developments separately for each
country and time, and a set of firm characteristics (sector and size).8 Chart C reports
the probability of a firm reporting a deterioration in the future availability of bank
loans as a result of changes in financing conditions (average marginal effects). The
first three columns are based on estimations for the period before the pandemic and
the second three on estimations for the period after the beginning of the pandemic.
All the reported marginal effects are positive and statistically significant.
Chart C
Contributions of the indicators of financing conditions to a deterioration in perceived
future availability of bank loans
(average marginal effects, percentages)
Source: ECB and European Commission survey on the access to finance of enterprises (SAFE).
Notes: Average marginal effects of the increase by one standard deviation in the principal components on a deterioration in the future
availability of bank loans based on logit regressions. PC stands for “principal component”. PC 1 refers to firms’ financial positions; PC
2 to non-price terms and conditions; PC 3 to price terms and conditions.
Since the onset of the COVID-19 pandemic, firms have become increasingly
concerned that the future availability of bank loans may be reduced if
financing costs rise. The importance of the component related to changes in bank
interest rates and other costs of financing in predicting the future availability of bank
loans has increased the most since the onset of the COVID-19 pandemic. A
worsening of this component, which is directly linked to the assessments made by
firms of banks’ behaviour, by one standard deviation now increases the probability of
a deterioration in the future availability of bank loans by 7.8%. This figure was 5.1%
until March 2020. Nevertheless, the expected availability of finance is still most
strongly influenced by the financial position of firms (the first principal component),
with average marginal effects of 9.6% before COVID-19 and 13% since the onset of
the pandemic. For the component related to non-price terms and conditions (the
second principal component), the corresponding rise since the onset of the
pandemic is 1.1 percentage points to a level of 7.2%.
To conclude, the empirical analysis shows that, since the beginning of the pandemic,
the overall financing conditions signalled by firms in the SAFE survey, and distilled
8 A second specification includes the change in the availability of bank loans. This variable plays a similar
role to a lagged dependent variable in a cross-sectional model, although it is reported by firms at the
same time as expectations. The econometric results are confirmed under this second specification,
although these results are not reported in the box.
0
2
4
6
8
10
12
14
PC 1 PC 2 PC 3 PC 1 PC 2 PC 3
Before COVID-19 Since COVID-19

ECB Economic Bulletin, Issue 8 / 2021 – Boxes
Financing conditions through the lens of euro area companies 70
via the three principal components, have become more important in gauging the
beliefs of firms about the future availability of bank loans.
ECB Economic Bulletin, Issue 8 / 2021 – Boxes
Decomposing market-based measures of inflation compensation into inflation expectations
and risk premia 71
4 Decomposing market-based measures of inflation
compensation into inflation expectations and risk premia
Prepared by Valentin Burban, Bruno De Backer, Fabian Schupp and
Andreea Liliana Vladu
This box presents a model-based approach for distinguishing between two
unobserved components embedded in market-based measures of inflation
compensation, namely inflation expectations and inflation risk premia. The
approach relies on econometric models used to analyse the term structure of
inflation-linked swap (ILS) rates. Estimates indicate that the rise in forward ILS rates
observed since mid-2020 is attributable more to inflation risk premia than to inflation
expectations. This suggests that the rise is mainly related to a shift in the inflation
risks priced in, from lower than expected to higher than expected.
ILS rates are often used as a benchmark for market-based measures of
inflation compensation in the euro area. ILS contracts exchange at maturity the
fixed swap rate agreed in advance against the average inflation rate realised over
the life of the swap, with both rates applied to a notional amount. Unlike break-even
inflation rates derived from inflation-linked and nominal sovereign bonds issued by
specific euro area member states, ILS rates are less affected by market liquidity
issues.1
Because ILS rates reflect financial market participants’ views about future
inflation, they are closely monitored by central banks (Chart A). ILS rates were
relatively stable at slightly above 2% over the period 2005-07 but plummeted in the
second half of 2008 as the global financial crisis unfolded. While they had returned to
close to 2% by the end of 2010, they gradually declined again to levels incompatible
with the ECB’s inflation target at the time of “below, but close to” 2%. For example,
the one-year forward ILS rate four years ahead stood slightly below 1% in mid-2016.
Although ILS rates recovered somewhat by mid-2018, they subsequently slid again
to low levels until the coronavirus (COVID-19) crisis induced another dramatic
decline, with a trough reached at the end of March 2020. They then increased
significantly over the next year and a half. Most recently, the one-year ILS rate has
reached as high as 3%, but the one-year forward rate one year ahead has remained
below 2%. This suggests that the financial markets are pricing the recent rise in
inflation as transitory. Importantly for the medium-term objective of price stability, the
five-year forward rate in five years ahead has returned to levels close to 2%.
1 For an overview of the ILS market, see “Derivatives transactions data and their use in central bank
analysis”, Economic Bulletin, Issue 6, ECB, 2019; “Interpreting recent developments in market-based
indicators of longer-term inflation expectations”, Economic Bulletin, Issue 6, ECB, 2018; Work stream
on inflation expectations, “Inflation expectations and their role in Eurosystem forecasting”, Occasional
Paper Series, No 264, ECB, 2021. By market convention, the reference price index for euro area ILS
rates is the HICP excluding tobacco (HICPxT). ILS rates refer to the HICPxT with a three-month
indexation lag.

ECB Economic Bulletin, Issue 8 / 2021 – Boxes
Decomposing market-based measures of inflation compensation into inflation expectations
and risk premia 72
Chart A
Euro area inflation-linked swap rates
(percentages per annum)
Sources: Refinitiv and ECB calculations.
Notes: The “1y4y ILS rate” is the one-year forward ILS rate in four years’ ahead, and similarly for the “1y1y ILS rate” and “5y5y ILS
rate”. The latest observation is for 26 November 2021.
ILS rates and other market-based measures of inflation compensation reflect
not only financial market participants’ actual inflation expectations, but also
inflation risk premia. The presence of inflation risk premia is due to financial market
participants being risk-averse and having to deal with uncertainty. In general, theory
suggests that inflation risk premia tend to be positive in times dominated by supply
shocks and negative in times dominated by demand shocks.2 Adverse supply
shocks, for instance, support positive inflation risk premia, as they imply that inflation
tends to increase when financial asset payoffs (in real terms) are highly valued, i.e.
when real activity declines and the marginal utility of consumption rises.
Econometric models of the term structure of ILS rates can be used to
decompose ILS rates into inflation expectations and inflation risk premia.
2 See, for instance, Rostagno, M., Altavilla, C., Carboni, G., Lemke, W., Motto, R., Saint Guilhem, A. and
Yiangou, J., “Monetary Policy in Times of Crisis: A Tale of Two Decades of the European Central Bank”,
Oxford University Press, 2021.
-1
0
1
2
3
4
2005 2008 2011 2014 2017 2020
1y ILS rate
5y ILS rate
10y ILS rate
a) ILS spot rates
0.0
0.5
1.0
1.5
2.0
2.5
3.0
3.5
2005 2008 2011 2014 2017 2020
b) ILS forward rates
1y1y ILS rate
1y4y ILS rate
5y5y ILS rate
ECB Economic Bulletin, Issue 8 / 2021 – Boxes
Decomposing market-based measures of inflation compensation into inflation expectations
and risk premia 73
Estimated models typically incorporate the key economic drivers of the short-term
inflation rate (“pricing factors”) and a mechanism for the dynamics of these pricing
factors (the “law of motion”). These constituents allow forecasts of the short-term
inflation rate and averages of these forecasts to be generated for any maturity.
Inflation expectations can then be estimated as the average short-term inflation rate
over a given horizon, and inflation risk premia can be proxied as the difference
between ILS rates and these inflation expectations.3
Two variants of an econometric term structure model are used in this box to
decompose ILS rates into inflation expectations and inflation risk premia. The
models incorporate three pricing factors that explain the bulk of the variation in end-
of-month ILS rates of different maturities over time.4 Both models imply that the
short-term ILS rate converges on a fixed number over the long run, as will any
stationary term structure model. As this endpoint is hard to pin down empirically,5 it is
calibrated to a level of 1.9%. This is in line with the all-time average of long-term
inflation forecasts from the Survey of Professional Forecasters and Consensus
Economics, and compatible with numerical implementations of the ECB’s objective
for most of the period analysed.6 The two variants differ in the way they estimate the
law of motion for the pricing factors. Specifically, the method used to estimate one of
the variants accounts for a well-known bias afflicting estimates of persistent
processes; the other method does not take this bias into account.7
Decomposition results are represented as averages of the two model
outcomes. Inflation expectations based on the first approach have the advantage of
being relatively close to the level of survey forecasts, which is a meaningful cross-
check since survey data are not taken into consideration at the estimation stage.
However, inflation expectations for longer horizons based on the first approach tend
to be fairly rigid and possibly underestimate the true and unobserved time variation.
The second approach, which corrects for the estimation bias, renders long-term
expectations more variable, but occasionally seems to establish too tight a
3 Inflation risk premia are usually estimated as the difference between “fitted” ILS rates (i.e. implied by
the estimated model) and estimated expectation components.
4 The reference model follows the methodology of the seminal paper by Joslin, S., Singleton, K.J. and
Zhu, H., “A new perspective on Gaussian dynamic term structure models”, The Review of Financial
Studies, Vol. 24, Issue 3, 2011, pp. 926-970, and is applied to end-of-month ILS rates adjusted for the
three-month indexation lag, as in Camba-Mendez, G. and Werner, T., ”The inflation risk premium in the
post-Lehman period”, Working Paper Series, No 2033, ECB, 2017.
5 See, for instance, Villani, M., “Steady-state priors for vector autoregressions”, Journal of Applied
Econometrics, Vol. 24, Issue 4, 2009, pp. 630-650.
6 Calibrating the long-run inflation mean at 1.9% is in line with the New Area-Wide Model in which, prior
to the adoption of the ECB’s new inflation target of 2%, the central bank’s long-run inflation objective
was set to 1.9% per annum (see Christoffel, K., Coenen, G. and Warne, A., “The New Area-Wide Model
of the euro area: a micro-founded open-economy model for forecasting and policy analysis”, Working
Paper Series, No 944, ECB, 2008; and Coenen, G., Karadi, P., Schmidt, S. and Warne, A., “The New
Area-Wide Model II: an extended version of the ECB’s micro-founded model for forecasting and policy
analysis with a financial sector”, Working Paper Series, No 2200, ECB, 2019). See also Mazelis, F.,
Motto, R., and Ristiniemi, A., “Monetary policy strategies in a low interest rate environment for the euro
area”, forthcoming, who also use 1.9%. The ECB’s 2020-21 strategy review adjustment to aim for 2%
inflation over the medium term means the long-run mean of inflation expectations may need to be
updated at some point, which would result in slightly lower inflation risk premia estimates overall.
7 Augmented Dickey-Fuller tests and Philips and Perron tests fail to reject the null hypothesis of a unit
root in ILS rates. The correction of the estimation bias (toward a lack of persistence) in the second
model follows the methodology of Kilian, L., “Finite sample properties of percentile and percentile-t
bootstrap confidence intervals for impulse responses”, Review of Economics and Statistics, Vol. 81, No
4, 1999, pp. 652-660.

ECB Economic Bulletin, Issue 8 / 2021 – Boxes
Decomposing market-based measures of inflation compensation into inflation expectations
and risk premia 74
connection between short-term ILS rates and long-horizon expectations. Model
averaging strikes a balance between the two approaches.8 At the same time, it
should be noted that model-based inflation expectations (and, conversely, premia)
extracted from ILS rates are subject to estimation uncertainty and their levels cannot
be validated directly by an observed counterpart.9
Chart B
Model-based decomposition of euro area inflation-linked swap rates
(percentages per annum)
Sources: Refinitiv and ECB calculations.
Notes: Average estimates based on two affine term structure models following Joslin, Singleton and Zhu (2011) applied to ILS rates
adjusted for the indexation lag, as in Camba-Mendez and Werner (2017). The latest observation is for November 2021 (monthly
models).
Estimated decompositions suggest that inflation expectations are in general
more stable than ILS rates, and that inflation risk premia across tenors have
changed sign in the past, including recently (Chart B). Decompositions indicate
that inflation expectations can vary significantly through time, although they are in
general smoother than ILS rates. This holds especially true for more distant forward
rates, which is in line with the intuition that inflation expectations are, in principle,
better anchored in the long run. Inflation risk premia are estimated to have gone from
positive to negative around 2013-14, suggesting that markets increasingly accounted
for the risk of inflation outcomes falling below their expectations. More recently, as
the effects of the coronavirus (COVID-19) pandemic have started to dissipate,
inflation risk premia estimates have increased significantly, and even changed sign
to possibly become slightly positive again. This change in sign might be related to
the pricing in of a greater likelihood, or at least risk, of the economy being dominated
8 As a broad check for “reasonableness”, the standard deviation of the expectation components obtained
from the average of the two model estimates is relatively close to that of inflation forecasts derived from
the Survey of Professional Forecasters and Consensus Economics (e.g. around 10 basis points at the
four to five-year horizon).
9 Specifically, survey estimates can differ from true (unobserved) expectations embedded in ILS rates by
the simple fact that different market players are expressing their views.
0.0
0.5
1.0
1.5
2.0
2.5
3.0
2005 2009 2013 2017 2021
Expectations component
Inflation risk premia
Fitted ILS rate
a) 1y1y ILS rate
0.0
0.5
1.0
1.5
2.0
2.5
3.0
2005 2009 2013 2017 2021
b) 1y4y ILS rate
0.0
0.5
1.0
1.5
2.0
2.5
3.0
2005 2009 2013 2017 2021
c) 5y5y ILS rate

ECB Economic Bulletin, Issue 8 / 2021 – Boxes
Decomposing market-based measures of inflation compensation into inflation expectations
and risk premia 75
by supply shocks in the foreseeable future in the context of ongoing supply
bottlenecks.10
10 See for instance Box 4, “The impact of supply bottlenecks on trade”, Economic Bulletin, Issue 6, ECB,
2021.

ECB Economic Bulletin, Issue 8 / 2021 – Boxes
Liquidity conditions and monetary policy operations from 28 July to 2 November 2021 76
5 Liquidity conditions and monetary policy operations from
28 July to 2 November 2021
Prepared by Elvira Fioretto and Juliane Kinsele
This box describes the ECB’s monetary policy operations and liquidity
developments during the fifth and sixth reserve maintenance periods of 2021.
Together, these two maintenance periods ran from 28 July to 2 November 2021 (the
“review period”).
Average excess liquidity in the euro area banking system rose by €175.5 billion
during the fifth and sixth maintenance periods of 2021, reaching a record level
of €4,367 billion. This was largely due to asset purchases conducted under the
pandemic emergency purchase programme (PEPP) and the asset purchase
programme (APP) as well as the settlement of the eighth and ninth operations of the
third series of targeted longer-term refinancing operations (TLTRO III.8 and III.9).
The effect of monetary policy operations on excess liquidity was partially offset by a
sizeable increase in net autonomous factors.
Liquidity needs
The average daily liquidity needs of the banking system, defined as the sum of
net autonomous factors and reserve requirements, increased by €170.8 billion
to €2,290.2 billion in the review period. The significant increase compared to the
previous two maintenance periods was almost totally due to an increase in net
autonomous factors by €167.8 billion to €2,138.4 billion (see the section of Table A
entitled “Other liquidity-based information”), while minimum reserve requirements
increased only marginally by €3 billion to €151.9 billion.
Liquidity-absorbing autonomous factors in the review period increased by
€120.3 billion to €3,116.6 billion, driven by other autonomous factors as well as
increases in banknotes in circulation and government deposits. Other
autonomous factors (see Table A below for further information) increased in the
review period by €55.1 billion to €959.4 billion. At the same time, banknotes in
circulation increased by €28.7 billion to €1,503.7 billion. Government deposits remain
at a very high level after increasing by €36.6 billion to €653.5 billion, although this is
below the record high of €729.8 billion reached in 2020.
Liquidity-providing autonomous factors decreased by €47.5 billion to €978.6
billion. This decrease was the net effect of a decline of €63.1 billion in net assets
denominated in euro and an increase of €15.6 billion in net foreign assets.

ECB Economic Bulletin, Issue 8 / 2021 – Boxes
Liquidity conditions and monetary policy operations from 28 July to 2 November 2021 77
Table A provides an overview of the autonomous factors1 discussed above and their
changes.
Table A
Eurosystem liquidity conditions
Liabilities
(averages; EUR billions)
Current review period:
28 July 2021 to 2 November 2021
Previous review
period:
28 April 2021 to
27 July 2021
Fifth and sixth
maintenance
periods
Fifth maintenance
period:
28 July to
14 September
Sixth maintenance
period:
15 September to
2 November
Third and fourth
maintenance
periods
Autonomous liquidity factors 3,116.6 (+120.3) 3,086.2 (+28.8) 3,147.0 (+60.8) 2,996.3 (+46.9)
Banknotes in circulation 1,503.7 (+28.7) 1,499.9 (+14.1) 1,507.4 (+7.5) 1,475.0 (+35.0)
Government deposits 653.5 (+36.6) 635.7 (-16.5) 671.3 (+35.6) 616.9 (-1.3)
Other autonomous factors (net)1) 959.4 (+55.1) 950.6 (+31.2) 968.3 (+17.7) 904.3 (+13.2)
Current accounts above
minimum reserve requirements
3,614.5 (+143.3) 3,575.3 (+72.3) 3,653.7 (+78.4) 3,471.2 (+338.8)
of which exempted excess reserves
under the two-tier system
904.2 (+17.1) 899.2 (+4.4) 909.2 (+10.0) 887.1 (+13.1)
of which non-exempted excess
reserves under the two-tier system
2,709.5 (+123.2) 2,675.3 (+67.2) 2,743.7 (+68.4) 2,586.3 (+317.9)
Minimum reserve requirements2) 151.9 (+3.0) 150.9 (+0.8) 152.8 (+1.9) 148.9 (+1.9)
Exemption allowance3) 911.3 (+18.1) 905.6 (+4.5) 916.9 (+11.3) 893.2 (+11.6)
Deposit facility 752.6 (+32.2) 766.6 (+30.1) 738.5 (-28.2) 720.4 (+86.2)
Liquidity-absorbing fine-tuning
operations
0.0 (+0.0) 0.0 (+0.0) 0.0 (+0.0) 0.0 (+0.0)
Source: ECB.
Notes: All figures in the table are rounded to the nearest €0.1 billion. Figures in brackets denote the change from the previous review
or maintenance period.
1) Computed as the sum of the revaluation accounts, other claims and liabilities of euro area residents, capital and reserves.
2) Memo item that does not appear on the Eurosystem balance sheet and therefore should not be included in the calculation of total
liabilities.
3) Exempted and non-exempted excess reserves are explained on the ECB’s website.
1 For further details on autonomous factors, see the article entitled “The liquidity management of the
ECB”, Monthly Bulletin, ECB, May 2002.

ECB Economic Bulletin, Issue 8 / 2021 – Boxes
Liquidity conditions and monetary policy operations from 28 July to 2 November 2021 78
Assets
(averages; EUR billions)
Current review period:
28 July 2021 to 2 November 2021
Previous review
period:
28 April 2021 to
27 July 2021
Fifth and sixth
maintenance
periods
Fifth maintenance
period:
28 July to
14 September
Sixth maintenance
period:
15 September to
2 November
Third and fourth
maintenance
periods
Autonomous liquidity factors 978.6 (-47.5) 987.2 (-19.9) 970.0 (-17.2) 1,026.1 (-39.9)
Net foreign assets 830.9 (+15.6) 826.7 (+5.0) 835.1 (+8.3) 815.3 (-11.2)
Net assets denominated in euro 147.7 (-63.1) 160.5 (-24.9) 134.9 (-25.5) 210.8 (-28.6)
Monetary policy instruments 6,657.3 (+346.3) 6,592.2 (+151.6) 6,722.3 (+130.1) 6,311.0 (+513.8)
Open market operations 6,657.3 (+346.3) 6,592.2 (+151.6) 6,722.3 (+130.1) 6,311.0 (+513.8)
Tender operations 2,211.7 (+63.5) 2,213.3 (+17.2) 2,210.0 (-3.3) 2,148.2 (+234.4)
MROs 0.2 (+0.0) 0.2 (+0.1) 0.2 (+0.0) 0.1 (-0.2)
Three-month LTROs 0.1 (-0.1) 0.1 (-0.0) 0.1 (+0.0) 0.1 (-0.4)
TLTRO II operations 0.0 (+0.0) 0.0 (+0.0) 0.0 (+0.0) 0.0 (-9.7)
TLTRO III operations 2,195.0 (+74.3) 2,188.9 (+20.4) 2,201.1 (+12.3) 2,120.7 (+244.3)
PELTROs 16.4 (-10.8) 24.2 (-3.2) 8.6 (-15.6) 27.2 (+0.5)
Outright portfolios 4,445.6 (+282.8) 4,378.9 (+134.4) 4,512.3 (+133.4) 4,162.8 (+279.4)
First covered bond purchase
programme
0.4 (-0.0) 0.4 (-0.0) 0.4 (-0.0) 0.4 (-0.0)
Second covered bond purchase
programme
2.4 (-0.0) 2.4 (+0.0) 2.4 (+0.0) 2.4 (-0.2)
Third covered bond purchase
programme
295.9 (+4.4) 294.7 (+2.1) 297.1 (+2.4) 291.6 (+2.1)
Securities Markets Programme 9.5 (-7.7) 12.6 (-4.5) 6.5 (-6.1) 17.2 (-8.4)
Asset-backed securities purchase
programme
27.0 (-1.4) 27.5 (-0.7) 26.6 (-1.0) 28.4 (-0.3)
Public sector purchase programme 2,448.0 (+36.0) 2,439.7 (+18.1) 2,456.3 (+16.6) 2,412.0 (+37.7)
Corporate sector purchase
programme
294.8 (+15.4) 290.6 (+7.0) 298.9 (+8.3) 279.3 (+15.9)
Pandemic emergency purchase
programme
1,367.5 (+236.1) 1,311.0 (+112.4) 1,424.1 (+113.2) 1,131.4 (+232.6)
Marginal lending facility 0.0 (+0.0) 0.0 (+0.0) 0.0 (-0.0) 0.0 (-0.0)
Source: ECB.
Notes: All figures in the table are rounded to the nearest €0.1 billion. Figures in brackets denote the change from the previous review
or maintenance period.

ECB Economic Bulletin, Issue 8 / 2021 – Boxes
Liquidity conditions and monetary policy operations from 28 July to 2 November 2021 79
Other liquidity-based information
(averages; EUR billions)
Current review period:
28 July 2021 to 2 November 2021
Previous review
period:
28 April 2021 to
27 July 2021
Fifth and sixth
maintenance
periods
Fifth maintenance
period:
28 July to
14 September
Sixth maintenance
period:
15 September to
2 November
Third and fourth
maintenance
periods
Aggregate liquidity needs1) 2,290.2 (+170.8) 2,250.3 (+49.3) 2,330.2 (+79.8) 2,119.4 (+88.8)
Net autonomous factors2) 2,138.4 (+167.8) 2,099.4 (+48.5) 2,177.3 (+78.0) 1,970.6 (+86.8)
Excess liquidity3) 4,367.0 (+175.5) 4,341.9 (+102.4) 4,392.2 (+50.3) 4,191.5 (+425.0)
Source: ECB.
Notes: All figures in the table are rounded to the nearest €0.1 billion. Figures in brackets denote the change from the previous review
or maintenance period.
1) Computed as the sum of net autonomous factors and minimum reserve requirements.
2) Computed as the difference between autonomous liquidity factors on the liability side and autonomous liquidity factors on the asset
side. For the purposes of this table, items in the course of settlement are also added to net autonomous factors.
3) Computed as the sum of current accounts above minimum reserve requirements and the recourse to the deposit facility minus the
recourse to the marginal lending facility.
Interest rate developments
(averages; percentages)
Current review period:
28 July 2021 to 2 November 2021
Previous review
period:
28 April 2021 to
27 July 2021
Fifth and sixth
maintenance
periods
Fifth maintenance
period:
28 July to
14 September
Sixth maintenance
period:
15 September to
2 November
Third and fourth
maintenance
periods
MROs 0.00 (+0.00) 0.00 (+0.00) 0.00 (+0.00) 0.00 (+0.00)
Marginal lending facility 0.25 (+0.00) 0.25 (+0.00) 0.25 (+0.00) 0.25 (+0.00)
Deposit facility -0.50 (+0.00) -0.50 (+0.00) -0.50 (+0.00) -0.50 (+0.00)
EONIA1) -0.485 (-0.005) -0.484 (-0.003) -0.486 (-0.002) -0.480 (-0.001)
€STR -0.569 (-0.004) -0.569 (-0.003) -0.570 (-0.002) -0.565 (-0.001)
Source: ECB.
Notes: Figures in brackets denote the change from the previous review or maintenance period.
1) Computed as the euro short-term rate (€STR) plus 8.5 basis points since 1 October 2019. Differences in the changes shown for the
euro overnight index average (EONIA) and the €STR are due to rounding.
Liquidity provided through monetary policy instruments
The average amount of liquidity provided through monetary policy instruments
increased by €346.3 billion to €6,657.3 billion during the review period (Chart
A). Around 82% of the increase was the result of ongoing net purchases under the
asset purchase programmes, primarily the PEPP, and the remaining 18% originated
from credit operations, particularly TLTRO III, while maturing operations and
repayments drained liquidity.

ECB Economic Bulletin, Issue 8 / 2021 – Boxes
Liquidity conditions and monetary policy operations from 28 July to 2 November 2021 80
Chart A
Evolution of liquidity provided through open market operations and excess liquidity
(EUR billions)
Source: ECB.
Note: The latest observation is for 2 November 2021.
The average amount of liquidity provided through credit operations increased
by €63.5 billion during the review period. This increase was driven both by the
effect of the €109.8 billion injected via the eighth TLTRO III operation settled in June
(the full effect of which on period averages only materialises in the maintenance
period after settlement) and by the €97.6 billion allotted in the ninth TLTRO III
operation at the end of September. The liquidity providing effect of the ninth
operation was partially offset by the first round of voluntary repayments under the
TLTRO III programme, which totalled €79.3 billion in September. In addition, at the
end of September three pandemic emergency longer-term refinancing operations
(PELTROs) matured for an amount of €22.1 billion, while only €1.3 billion was
allotted in the September PELTRO. Overall, the new PELTRO allotments and
maturing tenders together resulted in an average net liquidity absorption of €10.8
billion compared to the previous review period. The main refinancing operations
(MROs) and three-month longer-term refinancing operations (LTROs) continued to
play a marginal role, with the average recourse to both of these regular refinancing
operations staying at record low levels, as in the previous review period.
At the same time, outright portfolios increased by €282.8 billion to €4,445.6
billion, owing to net purchases under the PEPP and the APP. Average holdings
in the PEPP increased by €236.1 billion to €1,367.5 billion when compared to the
average of the previous review period. Purchases under the PEPP represented the
largest increase across the ECB’s asset purchase programmes, followed by the
public sector purchase programme (PSPP) and the corporate sector purchase
programme (CSPP), with average increases of €36 billion to €2,448 billion and €15.4
billion to €294.8 billion, respectively. The maturing of securities held in non-active
programmes reduced the size of outright portfolios by €7.7 billion.
0
1,000
2,000
3,000
4,000
5,000
6,000
7,000
2016 2017 2018 2019 2020 2021
Tender operations
Outright portfolios
Excess liquidity

ECB Economic Bulletin, Issue 8 / 2021 – Boxes
Liquidity conditions and monetary policy operations from 28 July to 2 November 2021 81
Excess liquidity
Average excess liquidity increased by €175.5 billion, reaching a new record
high of €4,367 billion (Chart A). Excess liquidity is the sum of banks’ reserves
above the reserve requirement and the recourse to the deposit facility net of any
recourse to the marginal lending facility. It reflects the difference between the total
liquidity provided to the banking system and banks’ liquidity needs. Banks’ current
account holdings in excess of minimum reserve requirements grew by €143.3 billion
to €3,614.5 billion, while the average recourse to the deposit facility increased by
€32.2 billion to €752.6 billion.
Excess reserves exempt from the negative deposit facility rate under the two-
tier system2 rose by €17.1 billion to €904.2 billion. Non-exempt excess
liquidity, which includes the deposit facility, increased by €155.4 billion,
reaching €3,462.1 billion. The aggregate utilisation rate of the maximum exemption
allowance, i.e. the ratio of exempted reserves to the maximum exempted amount3,
which has remained above 98% since the third maintenance period of 2020,
decreased marginally from 99.3% to 99.2%. The share of exempted excess reserves
in total excess liquidity stood at 20.7%, compared to 21.2% in the previous review
period.
Interest rate developments
The average €STR remained broadly unchanged at -56.9 basis points during
the review period. As a consequence of the high level of excess liquidity, the €STR
continues to be relatively inelastic, even to substantial fluctuations in liquidity. Since
October 2019, the EONIA has been calculated as the €STR plus a fixed spread of
8.5 basis points. Therefore, it moved in lockstep with the €STR, and continued to do
so until the discontinuation of the EONIA on 3 January 2022. Since 18 October 2021,
as part of the transition to the €STR as the new benchmark rate, the EONIA is no
longer used in new derivatives contracts cleared by central counterparties. The ECB
policy rates – the rates on the deposit facility, MROs and the marginal lending facility
– were left unchanged during the review period.
2 More information about the two-tier system for remunerating excess reserve holdings is available on
the ECB’s website.
3 The maximum exempted amount is measured as the sum of the minimum reserves and the exemption
allowance, which is equal to six times the minimum reserves amount.

ECB Economic Bulletin, Issue 8 / 2021 – Boxes
The ECB’s communication on the economic outlook: a comparative analysis 82
6 The ECB’s communication on the economic outlook: a
comparative analysis
Prepared by Julian Ashwin, Maarten Dossche, Katrin Forster van
Aerssen, Ramon Gomez-Salvador, Eleni Kalamara and Beatrice
Pierluigi
The ECB’s communication on the economic outlook has changed significantly
over the past 20 years. This box shows how the ECB’s communication on the
frameworks and concepts behind the economic outlook has evolved since the central
bank was established in 1998. It also compares the ECB’s communication on the
economic outlook with that of the Board of Governors of the Federal Reserve
System (Federal Reserve Board) and the Bank of England, covering the period
2015-19. The analysis ends in 2019 to avoid the results being affected by the
measures related to the coronavirus (COVID-19) pandemic or by the monetary policy
strategy reviews conducted by the Federal Reserve Board and the ECB respectively.
While this box focuses on a specific part of the ECB’s communication, the article
entitled “ECB communication with the wider public” in this issue of the Economic
Bulletin takes a wider perspective and includes the lessons learned from the ECB’s
recent strategy review.1
In 2015 the ECB’s regular communication on the economic outlook saw two
important changes. First, the ECB reduced the frequency of the Governing
Council’s monetary policy meetings from a four to a six-week cycle. Second, the
ECB started publishing accounts of the Governing Council’s monetary policy
meetings. These changes reduced the risk of introducing noise in the communication
of the economic outlook, which can arise when updates are published too frequently.
They also increased the transparency and accountability of the decision-making
process. Both changes brought the ECB’s approach closer to the monetary policy
deliberation practice of the Federal Reserve Board in the United States. While the
official communication on the economic outlook has been reduced from twelve times
(Monthly Bulletin) to eight times (Economic Bulletin) a year, communication by the
ECB’s Chief Economist via speeches and presentations on the economic outlook to
external audiences (Chart A, panel a) has risen over the past 20 years. The Chief
Economist also tended to give significantly more speeches on the economic outlook
than the Chief Economist of the Bank of England or the Vice-Chair of the Federal
Reserve Board (Chart A, panel b) during the period 2015-19.2
1 See the article entitled “ECB communication with the wider public” in this issue of the Economic
Bulletin; and Assenmacher, K., Glöckler, G., Holton, S. and Trautmann, P., “Clear, consistent and
engaging: ECB monetary policy communication in a changing world”, Workstream on monetary policy
communications, Occasional Paper Series, No 274, ECB, September 2021.
2 For the Bank of England speeches, the analysis focuses on the Chief Economist. Taking into
consideration speeches by the Deputy Governor for Monetary Policy, who is closer to the ECB Chief
Economist in terms of executive responsibility, in addition to those by the Chief Economist would not
materially affect the results.

ECB Economic Bulletin, Issue 8 / 2021 – Boxes
The ECB’s communication on the economic outlook: a comparative analysis 83
Chart A
Number of speeches on the economic outlook by the Chief Economist
(annual average)
Source: ECB staff calculations.
Notes: In panel (a) where the change in office took place during a year (i.e. 2006 Issing/Stark; 2019 Praet/Lane), the speeches have
been attributed to the yearly average of the incoming Executive Board member. In panel (b) the Vice-Chair of the Federal Reserve
Board (Fischer, Clarida) has been taken to correspond to the Chief Economist at the ECB (Praet, Lane) and at the Bank of England
(Haldane). “BoE” stands for Bank of England; “Fed” stands for the Federal Reserve Board.
The readability of the ECB’s communication on the economic outlook has
improved since 2008. This is illustrated in Chart B, panel a, which reports the
number of years of education required to understand the ECB’s speeches on the
economic outlook. It shows that the language used in speeches on the economic
outlook has become less complex over time. This improvement is similar to that of
the readability of all ECB speeches, including those on topics other than the
economic outlook.3 The readability of the ECB speeches on the economic outlook
compares well with the readability of Bank of England speeches; the Federal
Reserve Board speeches are somewhat more difficult to read than those of the ECB
according to this metric (Chart B, panel b). On the other hand, the readability of the
ECB’s monetary policy accounts, which have been published since 2015, is
significantly lower than that of the minutes of the Federal Open Market Committee or
the minutes of the Monetary Policy Committee of the Bank of England. While the
3 See the article entitled “ECB communication with the wider public” in this issue of the Economic
Bulletin.
0
5
10
15
20
25
Issing(1999-2005)
Stark(2006-11)
Praet(2012-14)
Praet(2015-18)
Lane(2019)
1999-2014 average
2015-19 average
a) ECB since 1999
0
5
10
15
20
25
ECB BoE Fed
b) ECB, BoE and the Fed between 2015-19
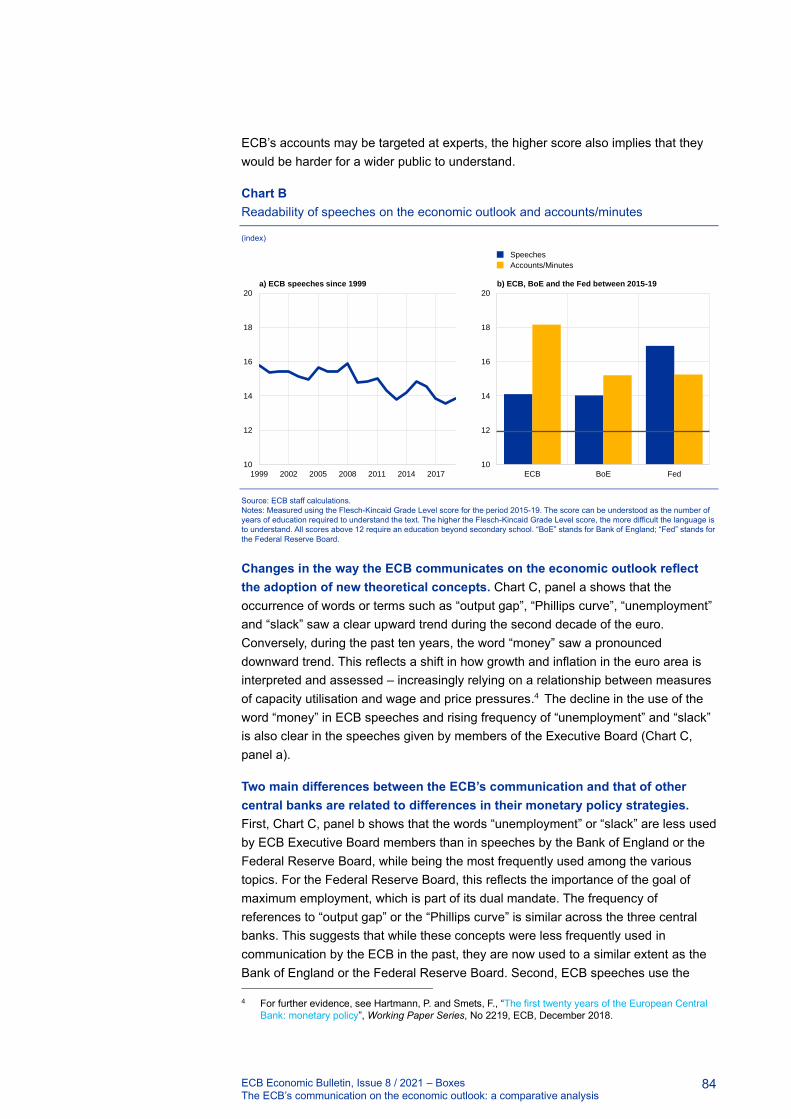
ECB Economic Bulletin, Issue 8 / 2021 – Boxes
The ECB’s communication on the economic outlook: a comparative analysis 84
ECB’s accounts may be targeted at experts, the higher score also implies that they
would be harder for a wider public to understand.
Chart B
Readability of speeches on the economic outlook and accounts/minutes
(index)
Source: ECB staff calculations.
Notes: Measured using the Flesch-Kincaid Grade Level score for the period 2015-19. The score can be understood as the number of
years of education required to understand the text. The higher the Flesch-Kincaid Grade Level score, the more difficult the language is
to understand. All scores above 12 require an education beyond secondary school. “BoE” stands for Bank of England; “Fed” stands for
the Federal Reserve Board.
Changes in the way the ECB communicates on the economic outlook reflect
the adoption of new theoretical concepts. Chart C, panel a shows that the
occurrence of words or terms such as “output gap”, “Phillips curve”, “unemployment”
and “slack” saw a clear upward trend during the second decade of the euro.
Conversely, during the past ten years, the word “money” saw a pronounced
downward trend. This reflects a shift in how growth and inflation in the euro area is
interpreted and assessed ‒ increasingly relying on a relationship between measures
of capacity utilisation and wage and price pressures.4 The decline in the use of the
word “money” in ECB speeches and rising frequency of “unemployment” and “slack”
is also clear in the speeches given by members of the Executive Board (Chart C,
panel a).
Two main differences between the ECB’s communication and that of other
central banks are related to differences in their monetary policy strategies.
First, Chart C, panel b shows that the words “unemployment” or “slack” are less used
by ECB Executive Board members than in speeches by the Bank of England or the
Federal Reserve Board, while being the most frequently used among the various
topics. For the Federal Reserve Board, this reflects the importance of the goal of
maximum employment, which is part of its dual mandate. The frequency of
references to “output gap” or the “Phillips curve” is similar across the three central
banks. This suggests that while these concepts were less frequently used in
communication by the ECB in the past, they are now used to a similar extent as the
Bank of England or the Federal Reserve Board. Second, ECB speeches use the
4 For further evidence, see Hartmann, P. and Smets, F., “The first twenty years of the European Central
Bank: monetary policy”, Working Paper Series, No 2219, ECB, December 2018.
10
12
14
16
18
20
1999 2002 2005 2008 2011 2014 2017
a) ECB speeches since 1999
10
12
14
16
18
20
ECB BoE Fed
b) ECB, BoE and the Fed between 2015-19
Speeches
Accounts/Minutes

ECB Economic Bulletin, Issue 8 / 2021 – Boxes
The ECB’s communication on the economic outlook: a comparative analysis 85
term “money” more frequently than the Federal Reserve Board or the Bank of
England, which might reflect the importance of the monetary analysis in its monetary
policy strategy.
Chart C
Frequency of words related to various topics across central banks
a) Frequency in ECB communication
(percentage of total number of words)
b) Frequency in speeches across central banks
(percentage of total number of words)
Source: ECB staff calculations.
Notes: The frequency of the specific term/word is computed as the number of times the specific term/word is used divided by the total
number of words published that year. “BoE” stands for Bank of England; “Fed” stands for the Federal Reserve Board.
References to inequality are comparable across the three major central banks;
climate change is also a prominent topic. While the focus on inequality has
increased over time in most central banks, it seems that the ECB pays comparable
attention to this topic as the two other major central banks. Discussions on climate
change appear to be more frequent in the speeches of the Bank of England than in
those of the ECB or the Federal Reserve Board.
0.0
0.1
0.1
0.2
0.2
0.3
1999 2004 2009 2014 2019
Economic Bulletin
Output gap and Phillips curve
Money
Unemployment and slack
0.00
0.05
0.10
0.15
0.20
0.25
1999 2004 2009 2014 2019
Speeches
0.00
0.05
0.10
0.15
ECB BoE Fed
Unemployment and slack
Money
Output gap and Phillips curve
Climate
Inequality

ECB Economic Bulletin, Issue 8 / 2021 – Boxes
The ECB’s communication on the economic outlook: a comparative analysis 86
Textual analysis underscores the importance of “narratives” in the
communication of economic forecasts. Sharpe et al. document how sentiment, or
“tonality”, extracted from the narratives accompanying Federal Reserve Board
economic forecasts is strongly correlated with future economic performance:
positively with GDP and negatively with unemployment and inflation. Moreover,
tonality conveys incremental information in that it predicts errors in both Federal
Reserve Board and private-sector forecasts of GDP, and unemployment up to four
quarters ahead.5 The authors find that the forecasting power of tonality arises from
its signalling of downside risks to economic performance. They also find that tonality
has significant predictive power for monetary policy. A more optimistic tone in the
Tealbook text precedes a higher than anticipated federal funds rate up to four
quarters ahead.6 Likewise, Jones et al. find that there is information in the qualitative
discussion on output growth forecasts in the Bank of England’s quarterly Inflation
Report which improves its quantitative nowcasts and one-quarter-ahead forecasts.7
The above evidence illustrates how qualitative discussions (or “narratives”)
surrounding forecasts contain incremental information about the economy
which supplements the quantitative analysis. This underscores the importance of
clear and informative communication about the economic outlook ‒ a priority which
has also been reaffirmed during the ECB’s recent strategy review.8 The constant
flow of new information means that the ECB’s economic outlook narrative is updated
constantly too, which requires a broad set of economic models, tools and surveys.
5 See Sharpe, S., Sinha, N. and Hollrah, C., “The Power of Narratives in Economic Forecasts”, Finance
and Economics Discussion Series, No 2020-001, Board of Governors of the Federal Reserve System,
2020.
6 The official title of the Tealbook is “Report to the FOMC on Economic Conditions and Monetary Policy”,
which is produced by the staff at the Federal Reserve Board. The “Tealbook” name was given when the
Bluebook and Greenbook were merged in June 2010.
7 See Jones, J., Sinclair, T. and Stekler, H., “A textual analysis of Bank of England growth forecasts”,
International Journal of Forecasting, Vol. 36(4), 2020, pp. 1478-1487. For similar evidence from the
Banco de España, see Sobrino, N., Ghirelli, C., Hurtado, S., Pérez, J. and Urtasun, A., “The narrative
about the economy as a shadow forecast: an analysis using Bank of Spain quarterly reports”, Applied
Economics, November 2021.
8 See the article entitled “An overview of the ECB’s monetary policy strategy”, Economic Bulletin, Issue
5, ECB, 2021.
ECB Economic Bulletin, Issue 8 / 2021 – Boxes
Sources of supply chain disruptions and their impact on euro area manufacturing 87
7 Sources of supply chain disruptions and their impact on
euro area manufacturing
Prepared by Roberto A. De Santis
The euro area recovery over the course of 2021 has been affected by
increasing global supply chain disruptions. Real GDP growth in 2021 was
predominantly supported by a recovery in business services, while industry and
construction have contributed to a lesser degree due to shortages of imported
intermediated inputs and equipment. Global supply chain disruptions have been the
result of the interplay of several factors, which can be grouped into five main
categories: (i) early strong rebound in global demand for manufacturing goods; (ii)
supply shortages of specific semiconductors; (iii) logistical disruptions in the
transport sector, primarily linked to container vessel activity; (iv) strict lockdown
measures in some key Asian countries that produce intermediated inputs; (v) time
needed to increase supply capacity of semiconductor production and of vessels.
The imbalance between the sharp recovery in global demand and the supply
shortages has been more severe and protracted than initially expected. The
global surge in high-tech demand from households needing to work from home and
from firms needing to upgrade their internet capacity and network access, together
with supply disruptions resulting from the coronavirus (COVID-19) pandemic, has
generated a crisis in the supply of semiconductors, which has, in particular,
adversely affected the automobile industry.1 Equally relevant is that container vessel
activity also sustained a major shock as a result of the pandemic. With the collapse
of world trade in April 2020, cargo ships were not able to run at full capacity and
many containers were left to pile up in western countries’ ports due to the lockdowns.
After the summer of 2020, once global demand had picked up again, the lack of
containers to transport these goods from Asia to the United States and Europe, as
well as numerous vessels arriving at their destinations well outside of schedule
(exacerbated by the massive container ship that blocked the Suez Canal), led to
considerable supply bottlenecks. According to UNCTAD, the average time spent by
container vessels in ports in the first half of 2021 was 11% higher compared with the
pre-pandemic average in 2018-19. In Europe, due to congestion, scheduling delays
and infrastructure constraints, German and French ports saw a very large increase in
average port stays (e.g. 42% and 25% higher than their average in 2018 and 2019),
thus standing even higher than those seen in the United States. Belgium, Italy and
the Netherlands, on the other hand, all saw changes more in line with the global
average (Chart A). Another issue that exacerbated these supply bottlenecks was the
renewed lockdown measures resulting from the spread of the Delta variant in some
countries of the Asia-Pacific region (including Malaysia, Singapore, Thailand and
1 For further information on developments in semiconductor industries, see European Central Bank,
“What is driving the recent surge in shipping costs”, Economic Bulletin, Issue 3, ECB, 2021; European
Central Bank, “The semiconductor shortage and its implication for euro area trade, production and
prices”, Economic Bulletin, Issue 4, ECB, 2021; the Special Issue in the Autumn 2021 European
Economic Forecast by the European Commission, and the discussion paper entitled “Bottlenecks:
causes and macroeconomic implications” by the Bank for International Settlements, BIS Bulletin, No
48, BIS, 2021.

ECB Economic Bulletin, Issue 8 / 2021 – Boxes
Sources of supply chain disruptions and their impact on euro area manufacturing 88
Vietnam), which are key to the semiconductor chip production. According to the
ECB’s contacts in the corporate sector, both semiconductor foundry capacity and
cargo vessel capacity are expected to remain tight into 2023.2
Chart A
Median time in ports for container ships in the first half of 2021 against the 2018-19
average
(ratio)
Sources: UNCTAD (United Nations Conference on Trade and Development) and ECB staff calculations.
Note: The latest observation is for June 2021.
During normal times, increases in production are generally associated with
longer suppliers’ delivery times and declining inventories. Before the pandemic,
the key mechanism at play was that an increase in demand would lead to an
increase in production, delaying the delivery of goods to firms and lowering inventory
levels; however, an efficient allocation of resources thanks to globalisation would
help to improve supply processes and speed up delivery times. Since the second
half of 2020, it is not only a strong demand that has triggered longer delivery times
but also the supply bottlenecks that are causing severe delays, to the point of
implying a decline in production (Chart B). These bottlenecks caused material and/or
equipment shortages that prevented euro area firms from being able to adequately
respond to the rapid recovery in demand for manufacturing goods, which
subsequently led to a fall in inventories across all sectors (Chart C). This new
development can be exploited to assess the degree to which supply bottlenecks are
behind the weakness in euro area industrial production.
2 With regard to firms’ views on the persistence of supply constraints, see European Central Bank, “Main
findings from the ECB’s recent contacts with non-financial companies”, Economic Bulletin, Issue 7,
ECB, 2021.
0.8
0.9
1.0
1.1
1.2
1.3
1.4
1.5
DE FR US BE CN NL UK IT ES
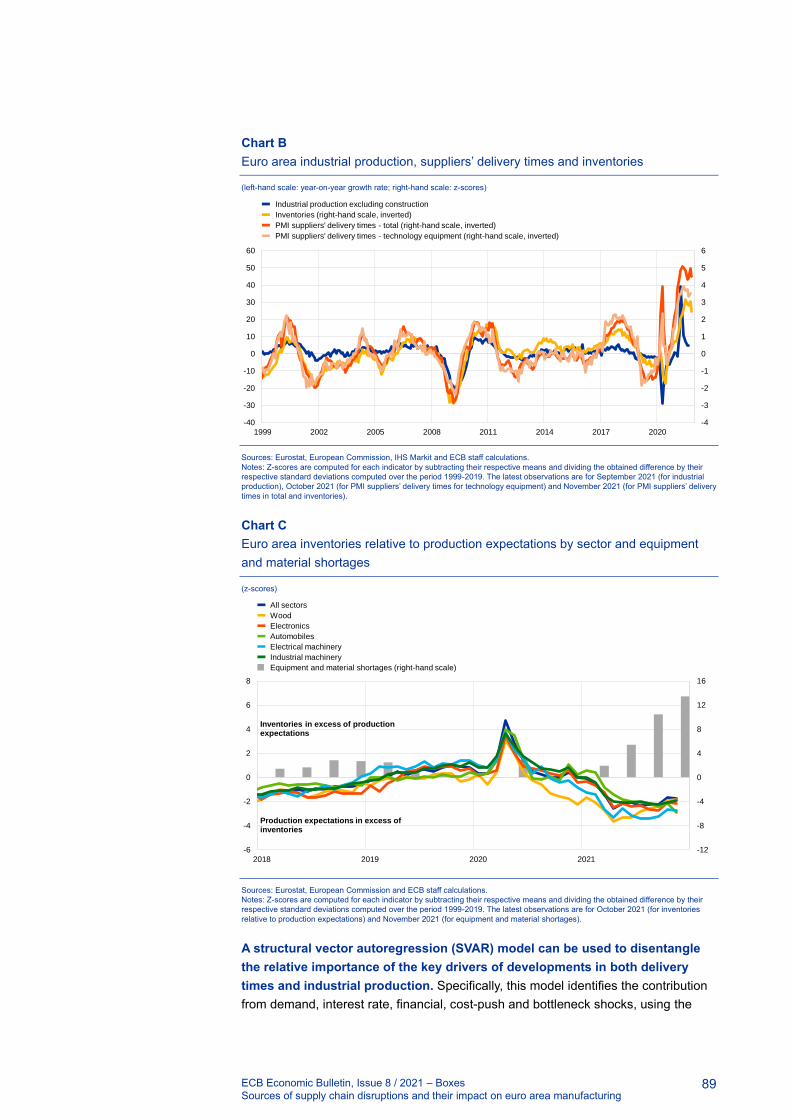
ECB Economic Bulletin, Issue 8 / 2021 – Boxes
Sources of supply chain disruptions and their impact on euro area manufacturing 89
Chart B
Euro area industrial production, suppliers’ delivery times and inventories
(left-hand scale: year-on-year growth rate; right-hand scale: z-scores)
Sources: Eurostat, European Commission, IHS Markit and ECB staff calculations.
Notes: Z-scores are computed for each indicator by subtracting their respective means and dividing the obtained difference by their
respective standard deviations computed over the period 1999-2019. The latest observations are for September 2021 (for industrial
production), October 2021 (for PMI suppliers’ delivery times for technology equipment) and November 2021 (for PMI suppliers’ delivery
times in total and inventories).
Chart C
Euro area inventories relative to production expectations by sector and equipment
and material shortages
(z-scores)
Sources: Eurostat, European Commission and ECB staff calculations.
Notes: Z-scores are computed for each indicator by subtracting their respective means and dividing the obtained difference by their
respective standard deviations computed over the period 1999-2019. The latest observations are for October 2021 (for inventories
relative to production expectations) and November 2021 (for equipment and material shortages).
A structural vector autoregression (SVAR) model can be used to disentangle
the relative importance of the key drivers of developments in both delivery
times and industrial production. Specifically, this model identifies the contribution
from demand, interest rate, financial, cost-push and bottleneck shocks, using the
-4
-3
-2
-1
0
1
2
3
4
5
6
-40
-30
-20
-10
0
10
20
30
40
50
60
1999 2002 2005 2008 2011 2014 2017 2020
Industrial production excluding construction
Inventories (right-hand scale, inverted)
PMI suppliers' delivery times - total (right-hand scale, inverted)
PMI suppliers' delivery times - technology equipment (right-hand scale, inverted)
-12
-8
-4
0
4
8
12
16
-6
-4
-2
0
2
4
6
8
2018 2019 2020 2021
All sectors
Wood
Electronics
Automobiles
Electrical machinery
Industrial machinery
Equipment and material shortages (right-hand scale)
Production expectations in excess of inventories
Inventories in excess of production expectations

ECB Economic Bulletin, Issue 8 / 2021 – Boxes
Sources of supply chain disruptions and their impact on euro area manufacturing 90
HICP, industrial production (excluding construction), the ten-year OIS rate, corporate
spreads and PMI suppliers’ delivery times.
The model suggests that supply bottlenecks have hampered industrial
production considerably over the course of 2021. According to the model,
between October 2020 and September 2021, around 45% of the change in euro
area PMI suppliers’ delivery times was driven by aggregate demand forces (i.e. the
sum of demand, interest rate and financial shocks), around 45% by supply
bottlenecks and roughly 10% by other types of cost-push shocks (Chart D, left-hand
scale). The contribution from demand, supply bottlenecks and cost-push shocks to
industrial production is shown in Chart D, right-hand scale. Everything else being
equal, supply bottlenecks are estimated to have reduced the level of euro area
industrial production by around 2.6% cumulatively between October 2020 and
September 2021 compared with a scenario without bottlenecks.3
Chart D
Contribution from supply bottleneck shocks on euro area industrial production and
PMI suppliers’ delivery times
(left-hand side: diffusion index in deviation from baseline; right-hand side: percentage in deviation from baseline, cumulated from
October 2020 to September 2021)
Sources: Eurostat, European Commission and ECB staff calculations.
Notes: The model shows the contribution from aggregate demand (demand, interest rate, financial shocks), cost-push and bottleneck
shocks, using the HICP, industrial production (excluding construction), the ten-year OIS rate, corporate spreads and PMI suppliers’
delivery times. The model is based on euro area aggregate data from January 1999 to September 2021 and the shocks are identified
using the method employed by J. Antolín-Díaz and J.F. Rubio-Ramírez in the “Narrative Sign Restrictions for SVARs”, American
Economic Review, No 108, 2018, pp. 2802-2829. The assumed sign restrictions at impact are as follows: demand shocks imply HICP
(+); industrial production (+); ten-year OIS rate (+); corporate spreads (-); and PMI suppliers’ delivery times (-). Interest rate shocks
imply HICP (-); ten-year OIS rate (+); corporate spreads (+). Financial shocks imply industrial production (-) and corporate spreads (+).
Cost-push shocks imply HICP (+) and industrial production (-). Bottleneck shocks imply HICP (+); industrial production (-) and PMI
suppliers’ delivery times (-). The assumed narrative restrictions are as follows: the largest contribution to the forecast errors for the ten-
year OIS rate in January 2015 is attributed to monetary policy shocks; for corporate spreads in July 2007 it is attributed to financial
shocks; for PMI suppliers’ delivery times in April 2020 and March 2021 it is attributed to bottlenecks shocks. It is also assumed that all
financial shocks have a positive sign in September and October 2008 and that all demand shocks have a negative sign in March and
April 2020.
By February 2021, the effect of supply bottlenecks on industrial production began to
become increasingly noticeable. Survey indicators available for the fourth quarter of
3 Exports have also been strongly affected by supply bottlenecks, as described in European Central
Bank, “The impact of supply bottlenecks on trade”, Economic Bulletin, Issue 6, ECB, 2021. For further
details of the contribution from supply shocks to global industrial production and trade, see Box 1
entitled “Supply chain disruptions and the effects on the global economy” in this issue of the Economic
Bulletin.
-4
-3
-2
-1
0
1
2
3
4
5
6
7
8
10/20 01/21 04/21 07/21
Industrial production
Supply bottlenecks
Supply cost-push
Demand
-25
-20
-15
-10
-5
0
5
10/20 01/21 04/21 07/21
PMI suppliers' delivery times
Supply bottlenecks
Supply cost-push
Demand

ECB Economic Bulletin, Issue 8 / 2021 – Boxes
Sources of supply chain disruptions and their impact on euro area manufacturing 91
2021 suggest that this impact will most likely not have been reabsorbed by the last
quarter of this year. Given that industry excluding construction accounts for roughly
20% of total euro area value added, the above estimates imply that in 2021 real GDP
growth would have been around 0.5% higher in the absence of supply bottlenecks.
This estimate can be considered a lower bound, as supply bottlenecks continued to
affect production in the last quarter of 2021, as well as construction and business
services.
The effects of supply bottleneck shocks could persist through much of 2022.
The semiconductor shortages, negative pandemic developments in Asia and current
congestion at container ports are unlikely to ease very much, suggesting that the
euro area economy is expected to continue to be affected by these shocks over the
coming months and that the impact of supply bottleneck shocks could persist
through much of 2022, as also highlighted by the ECB’s contacts in the corporate
sector. According to the European Commission business and consumer surveys in
October 2021, businesses expected a further deterioration in material shortages over
the next three months in all euro area countries, except for very few smaller
countries (Chart E). The larger the share of respondents confirming that their
businesses were affected by shortages compared with the respective long-term
average, the larger the share of respondents that expected a further deterioration in
their situation, which corroborates with the overall assessment of a prolonged and
persistent impact from supply bottlenecks.
Chart E
Euro area countries’ shortages of equipment and material expected in the fourth
quarter of 2021
(x-axis: percentage of respondents, levels de-meaned by historical average; y-axis: percentage of respondents, difference compared
with the third quarter of 2021)
Sources: Eurostat, European Commission and ECB staff calculations.
Notes: The values for each indicator are computed by subtracting their respective mean for each economy over the period 1999-2019.
The latest observation is for October 2021.
AT
BE
CY
EE
FI
FR
DEGR
IT
LVLT
LU
MT
NL
PT
SK
SI
ES
Euro area
-10
-8
-6
-4
-2
0
2
4
6
8
10
12
14
16
-5 0 5 10 15 20 25 30 35 40 45 50 55 60 65 70 75 80 85 90

ECB Economic Bulletin, Issue 8 / 2021 – Boxes
Fiscal policies in 2022 – implications of the 2022 draft budgetary plans 92
8 Fiscal policies in 2022 – implications of the 2022 draft
budgetary plans
Prepared by Giovanni Bardone, Stephan Haroutunian, Sebastian
Hauptmeier and Philip Muggenthaler
On 24 November 2021 the European Commission released its opinions on the
euro area governments’ draft budgetary plans for 2022.1 These opinions focus
on the consistency of the plans with the Council recommendations of 18 June 2021,
which advise Member States to adopt more differentiated fiscal policies in 2022. The
Council recommended Member States with low or medium levels of debt to pursue
or maintain a supportive fiscal stance in 2022 and Member States with high debt to
use the Recovery and Resilience Facility (RRF) to finance additional investment in
support of the recovery, while pursuing a prudent fiscal policy. It advised all Member
States to preserve nationally financed investment. The Commission’s assessment of
the draft budgetary plans takes into account the continued application of the general
escape clause of the Stability and Growth Pact in 2022. The clause is expected to be
deactivated as of 2023.2
On the basis of an adjusted indicator that aims to capture the fiscal policy
orientation in the current economic context, the euro area fiscal stance is
projected to remain supportive in 2021 and 2022. For its assessment, the
Commission uses a revised measure of the fiscal stance that was developed in light
of the current crisis and the national and EU fiscal measures taken to address it. 3
First, the fiscal stance measure takes into account expenditures funded by the RRF
and other EU funds, which provide a fiscal impulse to the economy but are not
reflected in Member States’ recorded budget balance. Second, it nets out temporary
emergency measures taken in response to the crisis. According to the Commission’s
2021 autumn forecast, which incorporates the 2022 draft budgetary plans, the fiscal
expansion based on this definition of the fiscal stance will amount to around 1.75%
of GDP in 2021, while a further expansion of nearly 1% of GDP is expected for
2022.4
1 European Commission (2021), “Communication from the Commission to the European Parliament, the
Council, and the European Central Bank on the 2022 Draft Budgetary Plans: Overall Assessment”.
2 The clause was introduced as part of the “six-pack” reform of the Stability and Growth Pact in 2011.
The clause can be activated in the case of an unusual event − outside the control of the Member State
concerned − which has a major impact on the financial position of the general government, or in
periods of severe economic downturn for the euro area or the EU as a whole. When the clause is
activated, Member States may temporarily depart from the fiscal adjustment requirements under both
the preventive and corrective arms of the Pact, provided this does not endanger fiscal sustainability in
the medium term.
3 The Commission computes the fiscal stance by looking at the annual increase in net expenditure
relative to ten-year potential growth. Following the Council’s recommendations on the 2021 Stability
Programmes, the net expenditure aggregate used to compute the overall fiscal stance was adjusted to
include expenditure financed by RRF grants and other EU funds and to exclude the temporary
emergency measures related to the coronavirus (COVID-19) crisis. In addition to the contribution from
EU-financed expenditure, the Commission’s assessment also looks at the contributions to the overall
fiscal stance from different nationally financed expenditure aggregates namely (i) investment, (ii) other
capital expenditure, and (iii) current primary expenditure (net of discretionary revenue measures).
4 European Commission (2021), op. cit.

ECB Economic Bulletin, Issue 8 / 2021 – Boxes
Fiscal policies in 2022 – implications of the 2022 draft budgetary plans 93
According to the Commission’s assessment, the individual draft budgetary
plans are broadly in line with the fiscal policy recommendations adopted by
the Council on 18 June 2021. When measured on the basis of the adjusted
indicator capturing the orientation of fiscal policies in the current crisis, the majority of
low and medium-debt euro area countries pursue a supportive fiscal stance. Of the
Member States in this grouping (Germany, Estonia, Ireland, Cyprus, Latvia,
Lithuania, Luxembourg, Malta, Netherlands, Austria, Slovenia, Slovakia and Finland),
only Malta and Slovakia are not projected to do so in 2022. The Commission
assesses that all Member States in this grouping − with the exception of the
Netherlands, which has not yet submitted its recovery and resilience plan − intend to
use the RRF to support their recovery. All preserve or broadly preserve nationally
financed investment.
The Commission further indicates the importance for high-debt Member States
“to preserve prudent fiscal policies”. To this end, the Commission assesses that
Belgium, Greece, Spain, France and Italy, in line with the Council recommendations
of June 2021, use the RRF to finance additional investment in support of the
recovery and preserve nationally financed investment.5 The Commission also
stresses that these countries should “preserve prudent fiscal policy in order to
ensure sustainable public finances in the medium term” when taking supporting
budgetary measures.
The Commission’s assessment reflects the euro area-wide rise in government
investment seen throughout the pandemic, which contrasts with the pattern
observed in the aftermath of the global financial crisis, with a significant part
of the increase being attributed to EU funding, including through the RRF. The
Commission projects euro area government investment to increase from 2.8% of
GDP in 2019 to 3.2% of GDP in 2022, thus partially reversing the pre-pandemic and
post-global financial crisis trend of reduced public investment (Chart A). Both the
Commission’s 2021 autumn forecast and the draft budgetary plans point to the
aggregate spending profile of RRF grants being frontloaded, with around two-thirds
of the RRF grants allocated to euro area countries being spent by the end of 2023. In
terms of GDP, RRF-funded expenditure is projected at around 0.5% of GDP in both
2022 and 2023. Overall, the high quality of government budgets and sustained public
investment should support the twin transition towards green and digital economies.
5 The European Commission did not adopt an opinion on the draft budgetary plan submitted by Portugal,
as the Portuguese Parliament had in the meantime rejected the draft budget on which the plan was
based.

ECB Economic Bulletin, Issue 8 / 2021 – Boxes
Fiscal policies in 2022 – implications of the 2022 draft budgetary plans 94
Chart A
Public investment, 2009-22
(percentages of GDP)
Sources: European Commission (AMECO database) and ECB calculations.
At the same time, there is scope to reduce the contribution of current
spending to the fiscal support, which would curtail the increase in government
debt. The Commission indicates that, among the countries with low or medium
levels of government debt, Latvia and Lithuania are not projected to sufficiently
ensure the control of the growth of nationally financed current expenditure. Among
the countries with high government debt-to-GDP ratios, Italy is not considered to
sufficiently ensure the limitation in the growth of nationally financed current
expenditure. The Commission and the Eurogroup6 thus invite Italy to take the
necessary measures to curtail such expenditures.
The correction of fiscal imbalances continues to evolve heterogeneously
across the euro area countries.7 According to the Commission’s 2021 autumn
forecast, deficits are projected to decrease in all euro area countries in both 2022
and 2023 (Chart B). Seven euro area countries are projected to record deficits above
the 3% of GDP threshold in 2023. The largest deficits in the years 2022-23 are
projected for some countries that entered the pandemic period with high government
debt-to-GDP ratios. Debt-to-GDP ratios in most euro area countries are foreseen to
drop in 2022, while in some they will remain on an increasing path until the end of
the forecast horizon in a no-policy change scenario (Chart C). Generally, they are
forecast to remain above the pre-crisis levels at the end of the projection horizon in
2023 − including in some Member States which entered the crisis with comparatively
high debt-to-GDP ratios.
6 The Eurogroup Statement on the Draft Budgetary Plans of 2022, issued on 6 December 2021, “invites
those high-debt Member States, where the growth of the nationally financed current expenditure is not
planned to be sufficiently limited according to the Commission’s assessment, to take the necessary
measures within the national budgetary process.”
7 For details on budgetary developments for the euro area aggregate based on the December 2021
Eurosystem staff macroeconomic projections for the euro area, see Section 6 of this issue of the
Economic Bulletin.
-4
-2
0
2
4
6
8
LV SI EE MT FI LU GR SK FR NL LT AT IT EA BE PT CY ES DE IE
Public investment ratio 2019
Change in public investment ratio 2019-22
Change in public investment ratio 2009-19

ECB Economic Bulletin, Issue 8 / 2021 – Boxes
Fiscal policies in 2022 – implications of the 2022 draft budgetary plans 95
Targeted and growth-friendly fiscal measures need to remain in place. Fiscal
policies still need to balance achieving a safe and sustained exit from this crisis with
remaining attentive to fiscal sustainability. Given the large uncertainty, fiscal support
that is responsive to macroeconomic developments can facilitate this balancing act.
Should the pandemic situation deteriorate, additional fiscal support would curtail the
detrimental impact on output growth. At the same time, if economies learn to adapt
more effectively to the pandemic and grow faster than currently foreseen, countries
with high government debt could improve fiscal sustainability by utilising better than
projected developments in nominal GDP for enhancing budgetary positions. If, in line
with the June 2021 Council recommendations, the fiscal support in 2022 were to
focus on productive spending – including investment financed through the RRF, the
impact on economic growth would be particularly beneficial. Given the expected
deactivation of the Stability and Growth Pact’s general escape clause as of 2023 and
the possible implications of the ongoing review of the EU’s economic governance
framework8, a timely agreement on the orientation of fiscal policies appears
warranted.
Chart B
General government budget balances, 2020-23
(percentages of GDP)
Sources: European Commission (AMECO database) and ECB calculations.
8 Eurosystem reply to the Communication from the European Commission “The EU economy after
COVID-19: implications for economic governance” of 19 October 2021.
-12
-11
-10
-9
-8
-7
-6
-5
-4
-3
-2
-1
0
1
LU NL DE LV IE FI SK EE CY PT EA LT SI AT BE FR IT MT GR ES
2020
2021
2022
2023
3% deficit threshold

ECB Economic Bulletin, Issue 8 / 2021 – Boxes
Fiscal policies in 2022 – implications of the 2022 draft budgetary plans 96
Chart C
General government gross debt, 2019-23
(percentages of GDP)
Sources: European Commission (AMECO database) and ECB calculations.
-100
-50
0
50
100
150
200
250
-10
-5
0
5
10
15
20
25
GR IT PT BE FR ES CY EA AT SI FI DE IE NL SK MT LV LT LU EE
Change in debt ratio 2019-22
Change in debt ratio 2022-23
Debt ratio 2019 (right-hand scale)

ECB Economic Bulletin, Issue 8 / 2021 – Articles
The ECB Survey of Monetary Analysts: an introduction 97
Articles
1 The ECB Survey of Monetary Analysts: an introduction
Prepared by Claus Brand and John Hutchinson
1 Introduction
Understanding the expectations of households, firms and financial markets
regarding monetary policy and macroeconomic developments is important for
the conduct of monetary policy. Expectations regarding macroeconomic
developments and monetary policy matter for the transmission of monetary policy
and can be used as a yardstick to assess the credibility of monetary policy. Their
development over time also helps central banks understand the effectiveness of
monetary policy.
Surveys can play an important role in understanding expectations and
complement expectations inferred from market pricing. While it is not possible to
measure expectations of households, firms and financial markets directly, surveys
provide information on the expectations of these specific groups.
The ECB Survey of Monetary Analysts (SMA) brings together information on
financial sector expectations of monetary policy and macroeconomic
developments in a coherently structured and regularly updated survey.1
Integrating survey information on both macroeconomic developments and monetary
policy closes a knowledge gap that is left by surveys focusing either just on
expectations of economic developments alone (e.g. the ECB Survey of Professional
Forecasters – SPF) or only on monetary policy (e.g. private sector surveys available
from Thomson Reuters and Bloomberg). The SMA is not the first survey of this type
to be conducted by a central bank as part of its market intelligence gathering (see
Box 1 for a description of how the SMA adds to information obtained from other
surveys for the euro area, how it compares to the Federal Reserve Bank of New
York’s Survey of Primary Dealers (SPD) and how it contributes to the ECB’s market
intelligence gathering).
The key objective of the SMA is to “gather regular, comprehensive, structured
and systematic information on market participants’ expectations”. This
information is intended to serve three purposes (see examples in Section 5): (i)
assessing financial market participants’ expectations of the ECB’s monetary policy
measures, including their possible impact on financial markets; (ii) examining
respondents’ outlook for the economy; and (iii) understanding whether the ECB’s
communication and forward guidance is well understood.
1 For information on the SMA, see the ECB’s website.

ECB Economic Bulletin, Issue 8 / 2021 – Articles
The ECB Survey of Monetary Analysts: an introduction 98
The ECB launched the SMA initially as a pilot project in April 2019, which
ended in June 2021 with the publication of aggregate results. The survey runs
eight times a year, ahead of the Governing Council’s monetary policy meetings. The
ECB decided to end the pilot phase and publish aggregate results on its website
following a staff assessment that the SMA had significantly advanced the quality and
comprehensiveness of systematic market intelligence gathering.2
Box 1
The role of surveys in gathering market intelligence related to monetary policy
expectations and the economy
Prepared by John Hutchinson, Falk Mazelis, Martin Strukat and Olivier Vergote
This box examines the role of private sector and central bank surveys in gathering systematic
market intelligence and how they contribute to the understanding of monetary policy expectations
and expectations regarding the development of the economy.
Gathering market intelligence is important for central banks to be able to better understand financial
market participants’ monetary policy expectations, their participation in open market operations and
their overall view of market developments and market functioning. For the most part, market
intelligence gathering is qualitative in nature and takes the form of direct interactions with traders
and market participants, complemented by information inferred from high-frequency market data
and analysts’ research reports.3 Regular market contact group meetings are an important
component of the ECB’s market intelligence gathering.4
Surveys undertaken by private sector companies are a valuable market intelligence source for
summarising market expectations in a more systematic way than bilateral exchanges or market
contact group discussions. An advantage of surveys over discussing topics of interest with market
participants is that surveys can provide a more systematic view of financial market participants’
expectations by asking a broad set of respondents the same questions over a fixed time horizon.
Such surveys also cover a wide range of respondent types (in a relatively stable but still changing
composition). Bloomberg and Thomson Reuters run two of the most established surveys of market
participants’ expectations of ECB policy with, on average, 35 and 70 respondents, respectively, per
survey round in 2021. The private sector surveys do not have fixed survey periods or fixed dates for
the publication of their results, but typically occur in the week prior to the Governing Council’s
monetary policy meetings.5
Central banks also undertake their own surveys to address their specific informational needs and to
better understand monetary policy expectations and the economy.6 The key advantage of a central
bank undertaking its own survey is that it can control the precise timing around monetary policy
meetings, the scope and detail of the questions, the forecast horizons and the panel of
2 See the press release of 8 February 2021.
3 See “Market Intelligence Gathering at Central Banks”, Markets Committee Papers, No 8, Bank for
International Settlements, December 2016.
4 More information on the ECB’s market contact groups is available on the ECB’s website.
5 Such surveys typically ask questions concerning the path of key interest rates and other policy
parameters, like the pace of asset purchases and communication aspects. Bloomberg also publishes
the results of a separate monthly survey that focuses solely on the path of the deposit facility rate
(DFR) and the main refinancing operations (MRO) rate.
6 The Federal Reserve System also gathers market intelligence on other topics, e.g. on banks’ strategies
and practices for managing reserve balances (via the Senior Financial Officer Survey).

ECB Economic Bulletin, Issue 8 / 2021 – Articles
The ECB Survey of Monetary Analysts: an introduction 99
respondents. Moreover, by having recurring questions and a broadly stable group of respondents,
regular surveys provide comprehensive information about the evolution of expectations, while the
inclusion of questions on key macroeconomic variables captures how policy expectations correlate
with economic developments.
The SMA shares many similarities with the Federal Reserve Bank of New York’s Survey of Primary
Dealers (SPD), which is the most established survey undertaken by a major central bank.7 Like the
SMA, the SPD is staff-led, but the SPD is conducted by the Trading Desk of the Federal Reserve
Bank of New York.8 The SPD questionnaire is distributed to the 24 primary dealers of the Federal
Reserve Bank of New York and published on its website approximately two weeks ahead of each
scheduled meeting of the Federal Open Market Committee (FOMC). Both the SPD and the SMA
focus on expectations regarding monetary policy measures, financial conditions and the
macroeconomic outlook. However, while SMA policy questions only relate to communication from
the Governing Council’s monetary policy statement (formerly the introductory statement), the SPD
also covers “topics that are widely discussed in the public domain”. Both questionnaires typically
ask respondents to provide modal expectations, which may be supplemented by probability
distribution questions. The period of time between the end of the SPD’s response period and the
first day of the FOMC meeting is about one week, which is slightly shorter than the corresponding
period for the SMA. Summaries of the SPD results are published about three weeks after each
FOMC meeting. Since the end of the pilot phase in June 2021, the SMA results have been
published in aggregate form on the Friday of the week after the Governing Council’s monetary
policy meeting.
This article looks at the structure of the survey and the rationale behind it and
explains what role it plays in understanding changes in market participants’
expectations of euro area monetary policy and the macroeconomy. Section 2
outlines the scope and main features of the SMA; Section 3 describes how the panel
of respondents was initially selected and the survey’s likely future evolution; Section
4 examines the SMA’s governance along several dimensions; and Section 5
illustrates how the SMA’s results can be used to inform views on market
expectations.
2 Scope and main features of the SMA
The objective of the SMA is to gather “regular, comprehensive, structured and
systematic information on market participants’ expectations”.9 First, the SMA
provides “regular” information by collecting market participants’ expectations ahead
of each Governing Council monetary policy meeting and making the results available
7 For more information on the SPD, see the Federal Reserve Bank of New York’s website, and for an in-
depth study, see “Understanding the New York Fed’s Survey of Primary Dealers”, Current Issues in
Economics and Finance, Vol. 19, No 6, Federal Reserve Bank of New York, 2013. The Federal
Reserve Bank of New York also conducts the Survey of Market Participants, which covers a subset of
firms associated with its advisory groups and committees.
8 See, for example, “Responses to Survey of Primary Dealers”, Federal Reserve Bank of New York, July
2021. The SMA is jointly formulated by ECB staff from the Directorate General Market Operations and
the Directorate General Monetary Policy.
9 See press release of 30 January 2019.

ECB Economic Bulletin, Issue 8 / 2021 – Articles
The ECB Survey of Monetary Analysts: an introduction 100
to the Eurosystem committees, to the Governing Council and, since June 2021, also
to the general public after the Governing Council meeting. For this purpose, it
gathers “comprehensive” data on ECB policy expectations, such as: (i) the key ECB
interest rates and other market interest rates – the euro interbank offered rate
(EURIBOR) and the euro short-term rate (€STR) – over an extended horizon and in
the long run, as well as expectations on interest rate forward guidance; (ii) the ECB’s
asset purchase programmes and expectations on changes in forward guidance; (iii)
targeted longer-term refinancing operations (TLTROs) (repayments and take-ups);
and (iv) the macroeconomic outlook (baseline and risks) over an extended horizon
and in the long run. In addition, the SMA provides “structured” information by
ensuring that the survey covers horizons that give visibility to the main policy
parameters (e.g. interest rate lift-off, end of net asset purchases and end of
reinvestments) and by collecting information on how changes in the macroeconomic
outlook and policy expectations jointly evolve. Finally, the SMA provides “systematic”
information by asking a set of questions that are intended to remain fairly stable over
time, thereby fostering respondents’ understanding of the questions and gradually
building up the longitudinal dimension of the survey.
The questionnaire is structured around four sections pertaining to interest rate
expectations, asset purchases, refinancing operations and the
macroeconomic outlook. The questions in these sections are largely kept stable in
order to facilitate comparability of replies over time. However, when new policy
measures are announced by the Governing Council, these are systematically
incorporated into the questionnaire. For example, in the September 2021 SMA, a
dedicated section was included relating to the ECB’s new monetary policy strategy.
Over time the questionnaire has been adjusted, but its structure has been
maintained, ensuring that all key policy parameters are always captured.
The questionnaire collects modal and probabilistic views of respondents.
While it asks for the modal view (in the form of a point estimate), in many instances it
also makes use of probabilistic questions to elicit the likelihood that respondents
assign to different future events. This type of question is particularly suitable where
there is a bimodality of expectations. Probabilistic questions also eliminate
uncertainty about whether the respondent is referring to the mean, median or mode
when asked to provide a point estimate.10
As intended, the information gathered by the SMA can be used to undertake
the following analyses:
• Assessing financial market participants’ expectations regarding monetary
policy: To the extent that survey results can be understood as reflecting
financial market expectations, these results can complement information in
asset prices and inform analysis to extract such financial market expectations.
Specifically, econometric models can be deployed that combine both surveys
and prices to extract useful “underlying” or average expectations (for a more
technical discussion, see Box 2). At the same time, survey data are not
10 For an instructive overview of the rationale behind the Federal Reserve System’s introduction of
probability distribution questions in the SPD, see Fischer, S., “Monetary Policy Expectations and
Surprises”, speech at the School of International and Public Affairs, Columbia University, April 2017.

ECB Economic Bulletin, Issue 8 / 2021 – Articles
The ECB Survey of Monetary Analysts: an introduction 101
necessarily representative of financial market expectations: their cross-section
dimension can be small (given the small size of the SMA panel), and the
heterogeneity of panellists may affect aggregate results.
• Examining respondents’ outlook for the economy: The SMA provides
respondents’ forecasts on key macroeconomic variables and risks that
correspond to their policy expectations (see Section 5).
• Examining how the ECB’s communication and forward guidance are
understood:11 As the SMA provides joint information on expected interest
rates, asset purchases and macroeconomic developments, it allows a
quantitative assessment of how forward guidance translates into expectations
regarding the timing and pace of interest rate changes and net asset purchases
and of the duration of reinvestments under the ECB’s purchase programmes.
Specifically, the SMA reveals information on respondents’ expectations
regarding the timing of “shortly before” the ECB rates start increasing, while
expectations regarding the ending of full reinvestments provide insight on
interpretations of the “extended period of time” after which the ECB rates will
start increasing. It can also be used to analyse the extent to which the ECB’s
current interest rate forward guidance conditions regarding inflation are met
(see Box 3).
Box 2
Inferring financial market participants’ expectations from asset prices and surveys
Prepared by Bruno De Backer, Fabian Schupp and Andreea Liliana Vladu
The SMA captures survey panellists’ expectations regarding monetary policy and macroeconomic
developments. An alternative way to capture economic agents’ expectations is to look at financial
asset prices, which incorporate expectations of future payoffs, which in turn link to interest rates,
inflation, economic growth, corporate profits and other key variables. As asset prices are available
at daily or even higher frequency, these can be used to extract financial market participants’
expectations in a timely manner. These prices can therefore complement survey information, which
is available at lower frequency and only for a selection of forecast horizons.
Forward interest rates are indicators of market participants’ interest rate expectations. These rates
(e.g. the one-year interest rate four years ahead) are locked in today and apply to lending or
borrowing contracts that start in the future.12 Considering the simplest form of the expectations
hypothesis, forward rates can be interpreted as expected short-term rates. By this logic, the current
flatness of the short end of the €STR forward curve suggests that market participants expect the
€STR (and hence also the ECB’s DFR) to remain at its current level for an extended period of time.
11 For a description of the ECB’s revised interest rate forward guidance, see Lane, P.R., “The new
monetary policy strategy: implications for rate forward guidance”, The ECB Blog, ECB, August 2021.
The chained forward guidance structure of the asset purchase programme (APP) links the horizons of
net asset purchases and reinvestments to the interest rate lift-off date.
12 Forward rates are often reported as “implied forward rates”, i.e. they are computed from observed spot
interest rates using the fact that one can replicate the pay-off stream of a forward contract by creating
certain portfolios of long and short positions in bonds. The “implied forward rate” would then depend on
the current yields of the bonds constituting the replicating portfolio. The one-year forward rate four
years ahead, for instance, would be implied by the four-year and five-year bond yields.
ECB Economic Bulletin, Issue 8 / 2021 – Articles
The ECB Survey of Monetary Analysts: an introduction 102
Similarly, forward rates derived from inflation-linked swaps reflect expectations regarding future
inflation rates.
However, forward rates do not exclusively reflect market participants’ actual rate expectations; they
also reflect a risk premium component compensating investors for the risk of rate changes or
reinvestment risk.13 This risk premium is measured by the difference between forward rates and a
measure of the expected short-term interest rate at corresponding horizons. It can be positive or
negative, it can change over time, and its absolute size varies with the uncertainty and risk aversion
of market participants. While forward rates as such are readily available, their sub-components (rate
expectations and risk premia) are not individually observable. This poses a challenge to the use of
asset prices for monitoring market participants’ expectations over time.
Chart A compares the three-month EURIBOR forward rate 12 months ahead (blue line) with survey
forecasts of the three-month EURIBOR rate in 12 months. Survey figures represent the average of
Consensus Economics’ panellists’ expected rate (yellow dots) and the median of SMA panellists’
most likely rate (red dots). Assuming that aggregated survey responses are broadly in line with
interest rate expectations embedded in three-month EURIBOR forward rates, Chart A illustrates the
presence and time variation of forward risk premia measured by the difference between survey
expectations and forward rates. An analysis of forward rates and Consensus Economics survey
forecasts suggests that the 12 months ahead three-month EURIBOR forward risk premium has, on
average, been slightly negative since 2014.14 For the most recent period, aggregated SMA
forecasts differ slightly from aggregated Consensus Economics forecasts, which might be due to
panel compositional effects, different reporting periods, and discrepancies in underlying questions.
13 The size and sign of the forward risk premium will depend on the uncertainty about the future level of
the short-term interest rate, but also on the economic environment in which those higher or lower-than-
expected rate realisations are expected to happen. See, for example, Chapter 19.2 on “Yield curve and
expectations hypothesis” in Cochrane, J.H., Asset pricing, Princeton University Press, 2001.
14 Paying a negative risk premium might be reasonable from an investor’s perspective if an asset serves
as insurance against adverse shocks – i.e. it tends to have a high pay-off in bad states of the world. For
nominal risk-free assets this may, for example, be the case if investors are worried about low
growth/low inflation scenarios (see Piazzesi, M. and Schneider, M., “Equilibrium Yield Curves”, NBER
Macroeconomics Annual, Vol. 21, 2006; and Campbell J.Y., Sunderam, A. and Viceira, L.M., “Inflation
Bets or Deflation Hedges? The Changing Risks of Nominal Bonds”, Critical Finance Review, Vol. 6,
2017, pp. 263-301).

ECB Economic Bulletin, Issue 8 / 2021 – Articles
The ECB Survey of Monetary Analysts: an introduction 103
Chart A
Three-month EURIBOR rate: 12-months-ahead forward rate and survey expectations
(percentages per annum)
Sources: Consensus Economics, SMA and ECB staff calculations.
Notes: The latest survey forecasts are for September 2021. Consensus Economics reports averages across survey panellists of mean point forecasts. The
SMA reports medians across survey panellists of modal point forecasts.
As survey expectations are only available at certain points in time, these may not be available when
they are most useful to gauge market participants’ expectations, e.g. in times of crisis.15 Asset
prices, by contrast, are available daily, but, as argued above, their information content regarding
interest rate expectations is blurred by the presence of risk premia. In order to reap the benefits of
both data sources, econometric models have been developed to combine the timeliness of asset
price data with the premia-free but more sporadic information from surveys. Econometric models of
the term structure of interest rates, for instance, can be designed to include survey information.16
Accounting for survey information in the estimation of term structure models helps econometricians
to better estimate the degree of persistence of interest rates expectations. This could otherwise be
underestimated, implying too strong a reversion of rate forecasts to their long-run model-implied
mean.17 In addition, including survey information in term structure models can also help to better
pin down the long-run mean of interest rates.18 Overall, these models provide a high-frequency
15 For instance, at the end of February and beginning of March 2020, when the financial market turmoil
related to the coronavirus (COVID-19) outbreak in Europe intensified, surveys were only available on 9
March (Consensus Economics), 6 and 17 March (Bloomberg surveys on the DFR), and 1 March (SMA
pilot phase), with survey results quickly becoming obsolete following their release.
16 A central assumption frequently imposed on econometric term structure models is the exclusion of
arbitrage opportunities across maturities. This assumption implies that it is not possible to build bond
portfolios across maturities such that the investor receives positive profits with certainty in the future
without investing any capital today. Technically, the no-arbitrage constraint is imposed via restrictions
across model parameters. See, for example, Joslin, S., Singleton, K.J. and Zhu, H., “A New
Perspective on Gaussian Dynamic Term Structure Models”, The Review of Financial Studies, Vol. 24,
No 3, 2011, pp. 926-970.
17 See, for example, Kim, D.H. and Orphanides, A., “Term Structure Estimation with Survey Data on
Interest Rate Forecasts”, Journal of Financial and Quantitative analysis, Vol. 47, No 1, 2012, pp. 241-
272; and Geiger, F. and Schupp, F., “With a little help from my friends: Survey-based derivation of euro
area short rate expectations at the effective lower bound”, Discussion Paper, No 27, Deutsche
Bundesbank, 2018.
18 Models that use survey information to help pin down the (potentially time-varying) long-term mean of
interest rates include Kozicki, S. and Tinsley, P.A., “Effective Use of Survey Information in Estimating
the Evolution of Expected Inflation”, Journal of Money, Credit and Banking, Vol. 44, No 1, 2012, pp.
145-169; Del Negro M., Giannone, D., Giannoni, M.P. and Tambalotti, A., “Safety, Liquidity, and the
Natural Rate of Interest”, Brookings Papers on Economic Activity, Spring, 2017, pp. 235-316; and
Bauer, M.D. and Rudebusch, G.D., “Interest Rates under Falling Stars”, American Economic Review,
Vol. 110, No 5, 2020, pp. 1316-1354.
-0.8
-0.6
-0.4
-0.2
0.0
0.2
0.4
0.6
2014 2015 2016 2017 2018 2019 2020 2021
Forward rate
Consensus Economics
SMA
-0.8
-0.6
-0.4
-0.2
0.0
0.2
0.4
0.6
01/20 01/21 21/09/202

ECB Economic Bulletin, Issue 8 / 2021 – Articles
The ECB Survey of Monetary Analysts: an introduction 104
measure of interest rate expectations that reflects both sources of information: asset prices (the
yield curve observed every day) and surveys (rate expectations at various horizons, sampled at
certain points in time).
Importantly, model-based estimates of interest rate expectations typically do not (and need not)
precisely match survey-based expectations. The difference between the two partly reflects the fact
that models are subject to estimation and model uncertainty, as the true “data generating process”
cannot be observed. Moreover, the reported average or median expectations across survey
panellists may differ from expectations of the marginal investors who determine asset prices.19
Besides, as models typically include average or median survey expectations, they neglect the
heterogeneity across survey panellists.20 In addition, survey expectations might suffer from
misunderstandings or a misrepresentation of expectations induced by wrong incentives (like a
reluctance to deviate too much from the consensus view).
Chart B compares snapshots of the EONIA and €STR forward curves with model-based forecasts
and survey-based expectations of the money market rates at three different points in time over the
last decade. The model-based results are obtained from an econometric term structure model with
a lower bound on interest rates that takes Consensus Economics forecasts and recent SMA
forecasts into account.21 The upper and middle panels of Chart B show that survey expectations
and model-implied expected rate paths can be below or above the forward curve, indicating that
forward term premia can be positive or negative. Moreover, the panels illustrate that model-based
expectations can be displayed for an arbitrary and dense set of horizons. By contrast, surveys can
only cover the horizons specified in the respective questionnaires. The lower panel of Chart B
compares the €STR forward curve prevailing in August 2021 with the median of the SMA
participants’ most likely path for the €STR.22 The survey and model results suggest close to nil
forward term premia up to about three years out, and negative forward term premia thereafter.
19 See, for example, Reis, R., “The People versus the Markets: A Parsimonious Model of Inflation
Expectations”, CEPR Discussion Paper, No 15624, 2021.
20 The availability of individual data across participants to measure the heterogeneity of views is an
advantage of survey data. However, most econometric models deploying surveys focus on a measure
of central tendency, ignoring such dispersion.
21 As Consensus Economics asks survey participants for their expectations for the three-month
EURIBOR rate, these forecasts are adjusted for the observed spread between the three-month
EURIBOR rate and the €STR before being input into the model.
22 For consistency, the model-based most likely rate path, i.e. the modal path, is shown instead of the
mean path.

ECB Economic Bulletin, Issue 8 / 2021 – Articles
The ECB Survey of Monetary Analysts: an introduction 105
Chart B
Forward curves, model-based expectations and survey-based forecasts
(x-axis: months ahead; y-axis: percentages per annum)
Sources: Bloomberg, Consensus Economics, Refinitiv and ECB (SMA and staff calculations).
Note: Model-implied estimates follow Geiger, F. and Schupp, F., “With a little help from my friends: Survey-based derivation of euro area short rate
expectations at the effective lower bound”, Discussion Paper, No 27, Deutsche Bundesbank, 2018.
The SMA can be particularly helpful for models that decompose asset prices into expectations and
risk premia, owing to its unique features: first, compared to other surveys, it provides forecasts for a
broader range of variables (the three key ECB policy interest rates, the €STR, the three-month
EURIBOR rate and inflation); second, unlike most other surveys, SMA vintages also provide a
0.0
0.7
1.4
2.1
2.8
3.5
0 6 12 18 24 30 36 42 48
EONIA forward curve (14 March 2011)
EONIA model-implied mean path
Consensus Economics (March 2011)
-0.8
-0.4
0.0
0.4
0.8
1.2
0 6 12 18 24 30 36 42 48
EONIA forward curve (14 August 2017)
EONIA model-implied mean path
Bloomberg survey (August 2017)
-1.2
-0.6
0.0
0.6
1.2
1.8
0 12 24 36 48 60 72 84 96 108 120
Months ahead
€STR forward curve (27 August 2021)
€STR model-implied modal path
SMA survey (September 2021)

ECB Economic Bulletin, Issue 8 / 2021 – Articles
The ECB Survey of Monetary Analysts: an introduction 106
consistent and dense grid of forecast horizons, reaching up to ten years ahead (“long term”) for
some variables; third, the survey is carried out shortly before Governing Council monetary policy
meetings (every six weeks on average).
Owing to the still short history of the SMA, SMA survey results need to be complemented with other
survey data to inform models used to extract interest rate or inflation expectations at high
frequency. As more SMA vintages become available, such models will increasingly be informed by
the survey.
3 Panel selection
The press release announcing the launch of the SMA gave four criteria for the
selection of respondents. The criteria are: (i) market relevance, (ii) geographical
representativeness, (iii) commitment to participating regularly in the survey, and (iv)
having an active involvement in the areas of activity covered by the survey.23
The survey respondents have been selected from among members of the
ECB’s market contact groups, as these largely satisfy the four criteria.24 The
track record of the ECB’s market contact groups provides an effective way to identify
potential SMA participants, as their willingness to actively engage is critically
important in ensuring the quality of the survey.25 The degree of engagement is
especially relevant as the SMA sample size consists of 29 institutions, so a high
response rate is required if the survey is to be indicative of the market’s view. The list
of institutions is published on the ECB’s website and the participation rate has been
high, including during the pilot phase.26 The panel composition, which has remained
largely unchanged since the start of the survey, is currently being reviewed. Figure 1
illustrates the geographical distribution of the current panellists.
23 See the press release of 30 January 2019.
24 All respondents are given equal weight when constructing the summary statistics.
25 Details on the ECB’s market contact groups are available on the ECB’s website. It should be noted that
these groups contain the largest institutions, as reflected in their market relevance and analytical
capacity.
26 A list of SMA participants in the pilot phase can be found on the ECB’s website.

ECB Economic Bulletin, Issue 8 / 2021 – Articles
The ECB Survey of Monetary Analysts: an introduction 107
Figure 1
Panel composition
Source: ECB.
The selection of respondents has focused on the banking community. One
reason for this approach is the important role banks play in euro area monetary
policy transmission, be it as counterparties to the ECB, traders in financial markets
or as credit intermediators in the euro area bank-based system. In addition, banks’
economic forecasting and market research can inform the views of their clients. As
such, their expectations regarding monetary policy and the economy can also be
considered as being informative of investor expectations. To obtain the “house view”,
SMA respondents were asked to coordinate the answers based on the views of their
own economists, strategists and traders so as to ensure consistency.
The panel composition will henceforth be reviewed annually. The ECB
periodically updates the panel of banks in its contact groups. Accordingly, the SMA
panel composition is reviewed too, with a focus on assessing the quality of
responses and the degree of engagement of respondents over the preceding 12
months. At the same time, new potential respondents may be invited to take part in
the survey. Looking ahead, and in view of the increasing importance of the asset
management industry in financial markets, buy-side institutions may eventually be
invited to take part in the SMA too.
4 SMA governance
With the SMA being an ECB survey on monetary policy, specific safeguards
are required to ensure that survey questions cannot be misinterpreted as
revealing signals of future monetary policy decisions and, at the same time, to
ensure that these capture decisions taken by the Governing Council in a timely
• Nordea
• Bayerische
Landesbank
• Commerzbank
• Deutsche Bank
• DZ Bank
• LBBW
• BNP Paribas
• BPCE/Natixis
• Crédit Agricole
• Société Générale
• Bank of Ireland
• BBVA
• CaixaBank
• Santander
• Caixa Geral de
Depósitos
• ING
• Belfius
• Intesa Sanpaolo
• Mediobanca
• UniCredit
• Erste Bank
Global
• Barclays
• Citigroup
• Credit
Suisse
• Goldman
Sachs
• HSBC
• Morgan
Stanley
• Nomura
• State
Street

ECB Economic Bulletin, Issue 8 / 2021 – Articles
The ECB Survey of Monetary Analysts: an introduction 108
and comprehensive manner. Accordingly, the SMA’s governance has been shaped
along several dimensions:
Staff ownership: From the outset the SMA has been staff-led with the questionnaire
disclaimer stating “This survey has been formulated by ECB staff; members of the
ECB’s decision-making bodies are not involved in the formulation of the survey” and
“The questions never presume or signal an intention to undertake any particular
policy action in the future”.27
Scope of the questionnaire: The SMA questionnaire appears to be well-understood
by respondents and has evolved considerably over the pilot phase to incorporate
new policy measures introduced by the Governing Council through questions that
are generally based on the monetary policy statement.
Formulation of the questions: Questions are formulated in a neutral manner.
Survey frequency: Since its launch, the frequency of the SMA has been aligned
with the six-weekly schedule of the Governing Council’s monetary policy meetings
(see Figure 2 for a typical SMA timeline). 13 business days before the Governing
Council meeting, typically on a Monday morning at 10:00 CET, the questionnaire is
sent to the respondents and published simultaneously on the ECB’s website.
Respondents provide their responses by Thursday evening of the same week, then
the SMA team validates and analyses the questionnaires before disseminating the
aggregated results to the Governing Council four business days before the
Governing Council meeting. Since June 2021, the results have been published on
the ECB’s website at 18:00 CET on the Friday of the week after the Governing
Council meeting.
Quality control of results: Cross-checks of responses against other publicly
available information and periodical statistical exercises are consistently applied.
27 For the full disclaimer, see, for example, “ECB Survey of Monetary Analysts (SMA), September 2021”,
ECB, August 2021.
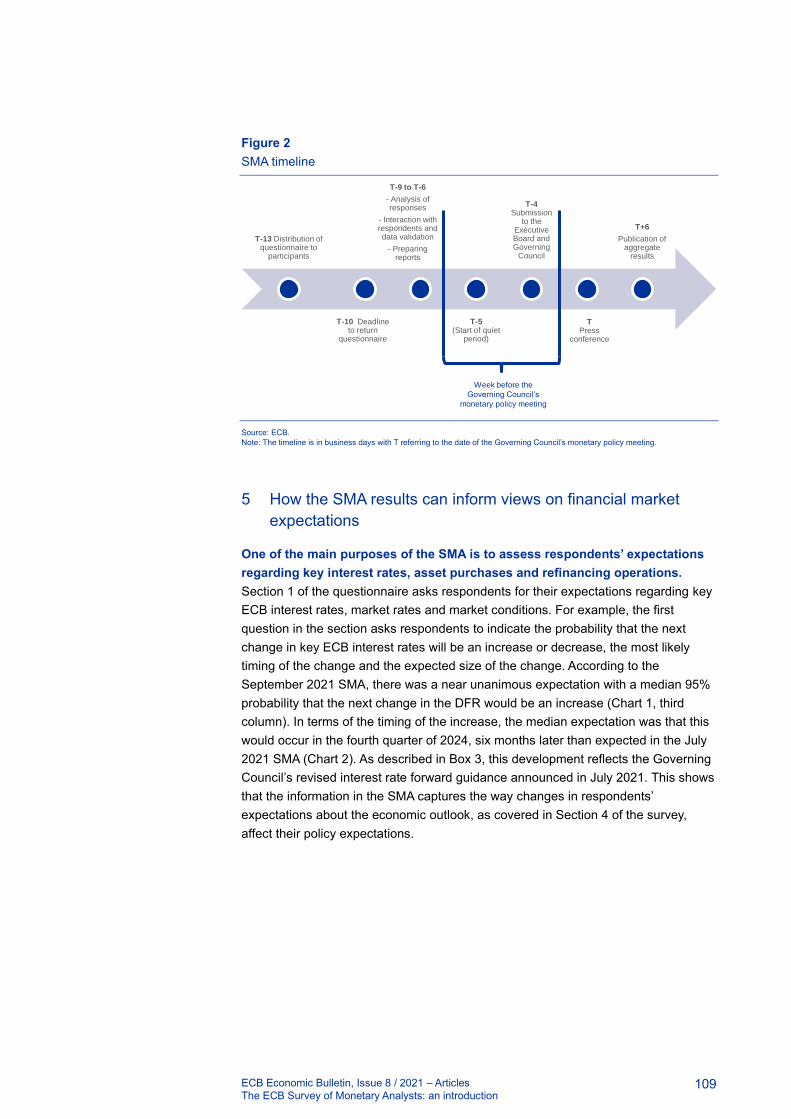
ECB Economic Bulletin, Issue 8 / 2021 – Articles
The ECB Survey of Monetary Analysts: an introduction 109
Figure 2
SMA timeline
Source: ECB.
Note: The timeline is in business days with T referring to the date of the Governing Council’s monetary policy meeting.
5 How the SMA results can inform views on financial market
expectations
One of the main purposes of the SMA is to assess respondents’ expectations
regarding key interest rates, asset purchases and refinancing operations.
Section 1 of the questionnaire asks respondents for their expectations regarding key
ECB interest rates, market rates and market conditions. For example, the first
question in the section asks respondents to indicate the probability that the next
change in key ECB interest rates will be an increase or decrease, the most likely
timing of the change and the expected size of the change. According to the
September 2021 SMA, there was a near unanimous expectation with a median 95%
probability that the next change in the DFR would be an increase (Chart 1, third
column). In terms of the timing of the increase, the median expectation was that this
would occur in the fourth quarter of 2024, six months later than expected in the July
2021 SMA (Chart 2). As described in Box 3, this development reflects the Governing
Council’s revised interest rate forward guidance announced in July 2021. This shows
that the information in the SMA captures the way changes in respondents’
expectations about the economic outlook, as covered in Section 4 of the survey,
affect their policy expectations.
T-13 Distribution of questionnaire to
participants
T-10 Deadline to return
questionnaire
T-9 to T-6
- Analysis of responses
- Interaction with respondents and data validation
- Preparing reports
T-5(Start of quiet
period)
T-4 Submission
to the Executive Board and Governing
Council
T Press
conference
T+6
Publication of aggregate
results
Week before the
Governing Council’s
monetary policy meeting

ECB Economic Bulletin, Issue 8 / 2021 – Articles
The ECB Survey of Monetary Analysts: an introduction 110
Chart 1
Probability attached to next change in the DFR being an increase
(left-hand scale: percentages; right-hand scale: months)
Source: ECB.
Note: Number of respondents is 21 for the September 2021 SMA, 21 for the July 2021 SMA and 22 for the June 2021 SMA.
Chart 2
Expectations for policy parameters
(x-axis: date)
Source: ECB.
Note: Number of respondents is 24 for the September 2021 SMA and 24 for the July 2021 SMA.
The respondents’ expectations regarding the ECB’s asset purchase
programmes – the APP and the pandemic emergency purchase programme
(PEPP) – and reinvestments are covered in Section 2 of the questionnaire. The
section starts with the APP and asks multipart questions pertaining to when net asset
purchases will end, the length of time the reinvestment of maturing securities
purchased under the APP will continue, the evolution of the stock of the APP and
whether respondents expect changes to the programme. In the September 2021
round, the median expectation was that the APP would end in mid-2024 with full
reinvestments continuing until the end of 2026 (Chart 2).
SMA survey results on interest rates and asset purchases can be used to
understand the effectiveness of the interaction between forward guidance on
20
25
30
35
40
45
0
20
40
60
80
100
June 2021 SMA July 2021 SMA September 2021 SMA
Probability of an increase in the DFR (left-hand scale)
Months to next increase (right-hand scale)
Q4 2023 Q1 2024 Q2 2024 Q3 2024 Q4 2024 Q1 2025 Q2 2025 Q3 2025 Q4 2025 Q1 2026 Q2 2026 Q3 2026 Q4 2026
2 quarters 2 quarters 2 quarters
"shortly before" "extended period"
September 2021 SMA APP end of net purchases
July 2021 SMA APP end of net purchases
September 2021 SMA lift-off date
July 2021 SMA lift-off date
September 2021 SMA APP end of reinvestments
July 2021 SMA APP end of reinvestments

ECB Economic Bulletin, Issue 8 / 2021 – Articles
The ECB Survey of Monetary Analysts: an introduction 111
interest rates and on asset purchases. Forward guidance on APP parameters are
linked to forward guidance on interest rates via the conditions that are required to be
met before policy interest rates start increasing (see Box 3): net purchases will be
conducted until “shortly before” the date on which the Governing Council starts
raising interest rates, and reinvestments will run for “an extended period of time” past
that date (see Chart 2). SMA survey results indicate that respondents have revised
the expected timing of the end of net purchases, the interest rate lift-off, and the end
of reinvestment in a consistent manner in line with the chained forward guidance on
interest rates and asset purchases: the postponement of the DFR lift-off date is
associated with the prolonged horizon of APP net purchases and reinvestments, and
vice versa.
The second part of Section 2 of the questionnaire relates to respondents’
expectations regarding the PEPP, which was introduced in response to the
COVID-19 pandemic. Respondents were asked multipart questions covering the
amount of the PEPP envelope they expect to be used by March 2022, when they
expect the programme to end and what they expect the profile of quarterly
purchases to be. In the September round, the median expectation was for the
programme to end in the first quarter of 2022 (Chart 3, panel a), reinvestments to
continue until the end of 2024 (Chart 3, panel a) and the €1,850 billion envelope to
not be fully taken up by March 2022 (Chart 3, panel b). The median expectation that
the entire PEPP envelope would not be fully exhausted by the second quarter of
2022 was also corroborated by Bloomberg and Thomson Reuters surveys. The
respondents’ median expectation was that the size of average monthly purchases
per quarter would progressively decline over the final three quarters of the
programme (Chart 4).

ECB Economic Bulletin, Issue 8 / 2021 – Articles
The ECB Survey of Monetary Analysts: an introduction 112
Chart 3
Expectations for the PEPP and TLTRO III
(panel a: date; panel b: EUR billions)
Source: ECB.
Note: Number of respondents is 24 for the September 2021 SMA, 24 for the July 2021 SMA and 24 for the June 2021 SMA.
12/20
12/21
12/22
12/23
12/24
12/25
12/26
PEPP PEPP
End of fullreinvestments
End of netasset purchases
2024 Q4
2022 Q1
a) End of full reinvestments and end of net asset purchases for the PEPP
September 2021 SMA
July 2021 SMA
June 2021 SMA
0
500
1,000
1,500
2,000
2,500
PEPP TLTRO III
Total envelope(net purchases)
Total take-up
b) Total envelope for the PEPP and total take-up of TLTRO III
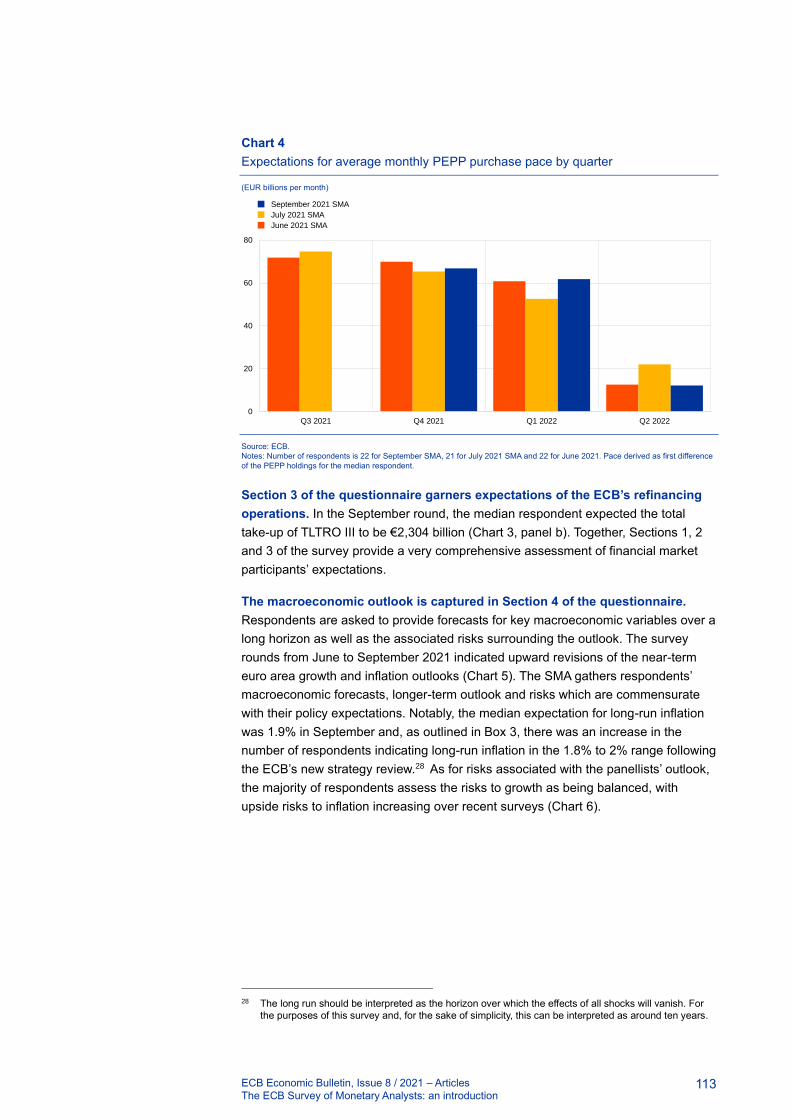
ECB Economic Bulletin, Issue 8 / 2021 – Articles
The ECB Survey of Monetary Analysts: an introduction 113
Chart 4
Expectations for average monthly PEPP purchase pace by quarter
(EUR billions per month)
Source: ECB.
Notes: Number of respondents is 22 for September SMA, 21 for July 2021 SMA and 22 for June 2021. Pace derived as first difference
of the PEPP holdings for the median respondent.
Section 3 of the questionnaire garners expectations of the ECB’s refinancing
operations. In the September round, the median respondent expected the total
take-up of TLTRO III to be €2,304 billion (Chart 3, panel b). Together, Sections 1, 2
and 3 of the survey provide a very comprehensive assessment of financial market
participants’ expectations.
The macroeconomic outlook is captured in Section 4 of the questionnaire.
Respondents are asked to provide forecasts for key macroeconomic variables over a
long horizon as well as the associated risks surrounding the outlook. The survey
rounds from June to September 2021 indicated upward revisions of the near-term
euro area growth and inflation outlooks (Chart 5). The SMA gathers respondents’
macroeconomic forecasts, longer-term outlook and risks which are commensurate
with their policy expectations. Notably, the median expectation for long-run inflation
was 1.9% in September and, as outlined in Box 3, there was an increase in the
number of respondents indicating long-run inflation in the 1.8% to 2% range following
the ECB’s new strategy review.28 As for risks associated with the panellists’ outlook,
the majority of respondents assess the risks to growth as being balanced, with
upside risks to inflation increasing over recent surveys (Chart 6).
28 The long run should be interpreted as the horizon over which the effects of all shocks will vanish. For
the purposes of this survey and, for the sake of simplicity, this can be interpreted as around ten years.
0
20
40
60
80
Q3 2021 Q4 2021 Q1 2022 Q2 2022
June 2021 SMA
July 2021 SMA
September 2021 SMA

ECB Economic Bulletin, Issue 8 / 2021 – Articles
The ECB Survey of Monetary Analysts: an introduction 114
Chart 5
Median forecasts of real GDP and HICP inflation
(year-on-year percentage changes)
Source: ECB.
Note: Number of respondents is 23 for the September 2021 SMA, 24 for the July 2021 SMA and 25 for the June 2021 SMA.
1
2
3
4
5
6
2021 2022 2023 2024
September 2021 SMA
July 2021 SMA
June 2021 SMA
a) Real GDP
0.0
0.5
1.0
1.5
2.0
Long run
September 2021 SMA
July 2021 SMA
June 2021 SMA
0.0
0.5
1.0
1.5
2.0
2.5
2021 2022 2023 2024
b) HICP inflation
0.0
0.5
1.0
1.5
2.0
Long run

ECB Economic Bulletin, Issue 8 / 2021 – Articles
The ECB Survey of Monetary Analysts: an introduction 115
Chart 6
Balance of risks
(percentages of respondents)
Source: ECB.
Note: Number of respondents is 21 for the September 2021 SMA, 23 for the July 2021 SMA and 27 for the June 2021 SMA.
The level of disagreement between respondents was limited in relation to the
growth outlook and slightly more elevated for the inflation outlook. The survey
allows the heterogeneity of replies across respondents to be examined, which can
be illustrated by plotting the disagreement among respondents (calculated as the
difference between the 75th percentile and 25th percentile) on growth and inflation
forecasts (Chart 7). There was a similar degree of disagreement among respondents
regarding the growth outlook, with a growing share of respondents assessing the
outlook to be balanced (Chart 6, panel a). By contrast disagreement over the
inflation outlook increased in the September 2021 SMA, with a growing share of
respondents perceiving upside risks to inflation (Chart 6, panel b).
0
10
20
30
40
50
60
70
80
90
100
Downside Balanced Upside Downside Balanced Upside Downside Balanced Upside
2021 2022 2023
July 2021 SMA
June 2021 SMA
September 2021 SMA
a) Balance of risk for GDP growth
0
10
20
30
40
50
60
70
80
90
100
Downside Balanced Upside Downside Balanced Upside Downside Balanced Upside
2021 2022 2023
b) Balance of risks for HICP inflation

ECB Economic Bulletin, Issue 8 / 2021 – Articles
The ECB Survey of Monetary Analysts: an introduction 116
Chart 7
Disagreement on real GDP and HICP inflation among SMA respondents
(interquartile ranges)
Source: ECB.
Note: Number of respondents is 23 for the September 2021 SMA, 24 for the July 2021 SMA and 25 for the June 2021 SMA.
As mentioned above, SMA survey results have been used to examine how
SMA respondents interpret the ECB’s new strategy statement and revised
interest rate forward guidance in order to analyse the effectiveness of ECB
communication (see Box 3 for a more detailed discussion). The September
2021 SMA included a specific section dedicated to the new strategy statement with
SMA respondents indicating that they now had greater clarity regarding the ECB’s
price stability target following the statement. Also, respondents appeared to have
taken on board the conditions that need to be met, as outlined in the revised forward
guidance on interest rates, before policy interest rates can begin increasing.
0.0
0.2
0.4
0.6
0.8
2021 2022 2023 2024 Long run
September 2021SMA
July 2021 SMA
June 2021 SMA
a) Change in real GDP
0.0
0.2
0.4
0.6
2021 2022 2023 2024 Long run
b) Change in HICP inflation

ECB Economic Bulletin, Issue 8 / 2021 – Articles
The ECB Survey of Monetary Analysts: an introduction 117
Box 3
Examining the impact of the ECB’s revised strategy statement on market expectations
through the lens of the SMA29
Prepared by Falk Mazelis and Arthur Saint-Guilhem
On 8 July 2021 the ECB communicated its new monetary policy strategy, which incorporates two
key innovations: first, the redefinition of the price stability objective as a symmetric two per cent
inflation target over the medium term; second, a conditional commitment to take into account the
implications of the effective lower bound when conducting policy in an environment of structurally
low nominal interest rates.30
On 22 July 2021 the Governing Council revised its interest rate forward guidance to align it with the
achievement of the symmetric two per cent inflation target. The revised forward guidance stipulates
three conditions that need to be met before policy interest rates start increasing: first, looking
forward, inflation should be expected to reach the new two per cent target “well ahead” of the end of
the projection horizon; second, this convergence should be reached “durably for the rest of the
projection horizon”; third, progress in current-looking underlying inflation should be judged to be
“sufficiently advanced” at the time of lift-off, so as to act as a safeguard against a premature policy
tightening in the face of adverse cost-push shocks that might elevate headline inflation temporarily
but fade quickly with no implication for inflation trends. Also, according to the revised forward
guidance, and in line with the strategy review statement, the verification of these three conditions
might imply a transitory period in which inflation is moderately above target.
The ECB’s monetary policy strategy statement
SMA respondents reported that the revised strategy statement has improved their understanding of
the ECB’s communication. The September SMA round featured questions specifically tailored to
gauge the effects of the ECB’s revised strategy statement on market participants’ perception of the
ECB’s reaction function. Respondents overwhelmingly considered the statement to have enhanced
the clarity of the ECB’s price stability definition, as well as to have clarified the ECB’s reaction
function (Chart A, panel a). Respondents’ comments revealed that they welcomed the new strategy
and signalled that it was broadly anticipated.31 They also indicated that it remained to be seen how
the revised strategy would translate into the practical implementation of monetary policy over time.32
29 All aggregate results referred to in this box are available on the ECB’s website.
30 For more detail, see the ECB’s monetary policy strategy statement and the accompanying overview of
the ECB’s monetary policy strategy.
31 The broad anticipation of the strategy review outcome implies that the comparison of the June, July
and September SMA rounds may only partially capture the impact of the revised strategy on
respondents’ expectations. That the outcome of the strategy review was broadly anticipated is further
evidenced by the limited reaction of financial markets on the day of the announcements. Indeed,
reports by market analysts published ahead of the announcements support the view that market
participants were correctly anticipating important elements of the new strategy and the revised forward
guidance.
32 A favourable disposition towards the ECB’s new monetary policy strategy was also evident from the
results of a special survey of professional forecasters on the ECB’s new monetary policy strategy.

ECB Economic Bulletin, Issue 8 / 2021 – Articles
The ECB Survey of Monetary Analysts: an introduction 118
Chart A
Strategy review announcement (list of survey respondents)
a) Improved understanding through strategy statement
(percentages of respondents)
b) Long-term inflation expectations (pooled probability distribution)
(x-axis: percentages per annum; y-axis: percentages)
Source: ECB.
Notes: Panel a depicts the share of respondents to the September 2021 SMA that answered “yes” (blue) or “no” (yellow) to Question 0.1 “Has [the ECB’s
monetary policy strategy statement] enhanced the clarity of your understanding of the ECB’s price stability target?” (left column) and Question 0.2 “Has [the
ECB’s monetary policy strategy statement] enhanced the clarity of the ECB’s policy reaction function” (right column). The number of respondents to each
question was 24. In panel b, the grey areas highlight the medians for June (1.5% to 1.7%) and September (1.8% to 2.0%). The number of respondents was 19
for the September 2021 SMA and 20 for the June 2021 SMA.
The September 2021 SMA also indicated a noticeable upshift in respondents’ long-term inflation
expectations.33 Compared to the June round, the median long-term inflation expectation across
respondents has increased, from 1.5-1.7% in June to 1.8-2.0% in September (Chart A, panel b). In
addition, respondents’ expectations exhibited a slightly more symmetric distribution, as indicated by
the reduced skewness compared to the June distribution. This change is also visible in the
33 The assessment focuses on the September SMA, as the July round’s deadline was only one day after
the strategy announcement, allowing little time for respondents to digest the announcement. In
addition, the September SMA is the first round available following the revised forward guidance
announcement and therefore allows for a broader assessment of the joint impact of the strategy and
forward guidance revisions on respondents’ expectations. While respondents are asked to provide
long-run inflation expectations referring to a horizon when the effects of all transitory disturbances have
vanished, short-run inflation dynamics, which increased during the summer period, cannot be ruled out
as a factor behind the increase in long-run dynamics.
0
25
50
75
100
Price stability target Policy reaction function
Yes
No
0
5
10
15
20
25
30
< 0.0 0.0 0.3 0.6 0.9 1.2 1.5 1.8 2.1 2.4 2.7 3.0 3.3 3.6 >3.9
to to to to to to to to to to to to to
0.2 0.5 0.8 1.1 1.4 1.7 2.0 2.3 2.6 2.9 3.2 3.5 3.8
MedianSeptember
MedianJune
September 2021 SMA
June 2021 SMA

ECB Economic Bulletin, Issue 8 / 2021 – Articles
The ECB Survey of Monetary Analysts: an introduction 119
increased probability – from 30% in June to 40% in September – attached to euro area long-term
inflation ranging between 1.8% and 2.3% (Chart A, panel b).
Revised interest rate forward guidance
In addition to the strategy statement, the evolution of respondents’ expectations over the reviewed
period also reflected the update to the Governing Council’s interest rate forward guidance. First, in
the September SMA, the median expected timing of the first increase in key interest rates was
postponed by two quarters to the end of 2024, compared to mid-2024 in the July round, which was
conducted before the revised forward guidance was announced. Second, respondents indicated
that, at the time of lift-off, they expected the prevailing headline inflation rate to be higher, at 1.85%,
compared to 1.7% in the two preceding rounds, albeit with significant dispersion across responses
(Chart B, panel a). Third, responses to a direct question included in the September SMA imply the
“well ahead” condition to be interpreted as around six quarters before the end of the projection
horizon. Fourth, with regard to the “sufficiently advanced” progress in underlying inflation, the
September SMA signalled expected HICP inflation excluding food and energy to be at 1.8% at the
time of lift-off, which was an increase compared to 1.6% in July and 1.5% in June. A cross-check
with a direct question on the third conditionality of rate forward guidance featured in the September
SMA confirms this assessment, with respondents indicating their understanding that the “sufficiently
advanced” condition would be fulfilled when euro area underlying inflation stands at 1.8%.
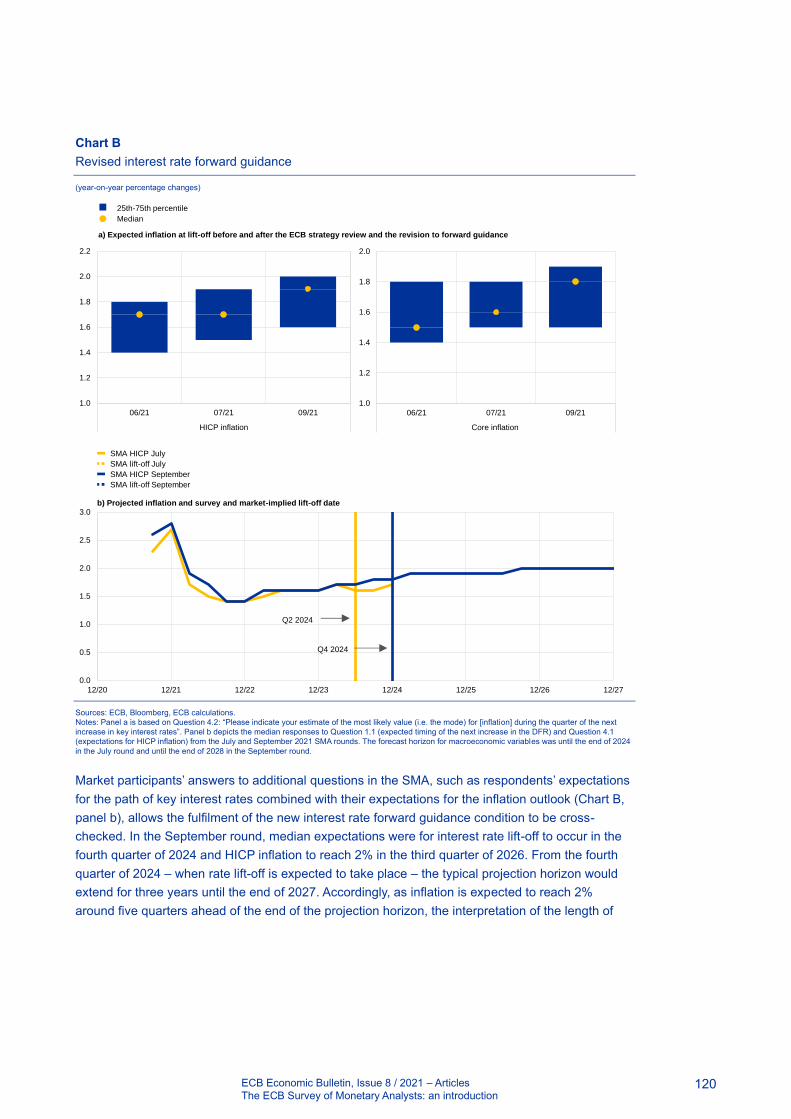
ECB Economic Bulletin, Issue 8 / 2021 – Articles
The ECB Survey of Monetary Analysts: an introduction 120
Chart B
Revised interest rate forward guidance
(year-on-year percentage changes)
Sources: ECB, Bloomberg, ECB calculations.
Notes: Panel a is based on Question 4.2: “Please indicate your estimate of the most likely value (i.e. the mode) for [inflation] during the quarter of the next
increase in key interest rates”. Panel b depicts the median responses to Question 1.1 (expected timing of the next increase in the DFR) and Question 4.1
(expectations for HICP inflation) from the July and September 2021 SMA rounds. The forecast horizon for macroeconomic variables was until the end of 2024
in the July round and until the end of 2028 in the September round.
Market participants’ answers to additional questions in the SMA, such as respondents’ expectations
for the path of key interest rates combined with their expectations for the inflation outlook (Chart B,
panel b), allows the fulfilment of the new interest rate forward guidance condition to be cross-
checked. In the September round, median expectations were for interest rate lift-off to occur in the
fourth quarter of 2024 and HICP inflation to reach 2% in the third quarter of 2026. From the fourth
quarter of 2024 – when rate lift-off is expected to take place – the typical projection horizon would
extend for three years until the end of 2027. Accordingly, as inflation is expected to reach 2%
around five quarters ahead of the end of the projection horizon, the interpretation of the length of
1.0
1.2
1.4
1.6
1.8
2.0
2.2
06/21 07/21 09/21
HICP inflation
25th-75th percentile
Median
a) Expected inflation at lift-off before and after the ECB strategy review and the revision to forward guidance
1.0
1.2
1.4
1.6
1.8
2.0
06/21 07/21 09/21
Core inflation
0.0
0.5
1.0
1.5
2.0
2.5
3.0
12/20 12/21 12/22 12/23 12/24 12/25 12/26 12/27
b) Projected inflation and survey and market-implied lift-off date
SMA HICP July
SMA lift-off July
SMA HICP September
SMA lift-off September
Q4 2024
Q2 2024

ECB Economic Bulletin, Issue 8 / 2021 – Articles
The ECB Survey of Monetary Analysts: an introduction 121
the “well-ahead” period would be around five quarters, which is broadly consistent with the estimate
from the above-mentioned direct question.34
Overall, the evolution of respondents’ answers over the June, July and September survey rounds
provides valuable insights into market participants’ perception of the changes in the ECB’s reaction
function following the strategy revision. Nonetheless, the understanding of the entire scope can be
expected to take time and be fully internalised only over a longer horizon. Such a pattern would be
consistent with the recent experience in the United States, where it took some time for the new
strategy of the Federal Reserve System and the subsequent reformulation of forward guidance to
be reflected in market-based inflation expectations.
6 Conclusions
Understanding the evolution of expectations of households, firms and financial
markets pertaining to macroeconomic developments and monetary policy is crucial
for the success of central banks in pursuing price stability. It is not possible to
measure these expectations directly and in an all-encompassing, representative
manner. However, surveys collecting forecasts on the expected use of monetary
policy instruments and the macroeconomic outlook (alongside information contained
in asset prices) can inform this understanding in important ways. The ECB’s SMA
complements these sources of information. In particular, the SMA fills a knowledge
gap concerning the joint evolution of both macroeconomic developments and
monetary policy. It is also informative on financial market participant's understanding
of the ECB’s reaction function. Specifically, the survey covers all ECB monetary
policy measures and thereby provides important information to monitor the
effectiveness of the ECB’s monetary policy decisions and forward guidance and the
credibility of its inflation targets, as measured by long-run inflation expectations.
34 In the SMA, minor differences in the assessment of the “well ahead” condition are to be expected and
may arise for various reasons, e.g. different subsets of respondents that provided answers to the direct
question and to the additional questions on lift-off and macroeconomic forecasts. Moreover, the implied
“well ahead” conditionality derived from the macroeconomic forecasts is based on respondents’ own
expectations of inflation developments, whereas the duration enquired about in the direct question is
more likely to relate to the respondents’ interpretation of the Governing Council’s projections, in line
with the revised forward guidance.

ECB communication with the wider public 122
2 ECB communication with the wider public
Prepared by Marius Gardt, Siria Angino, Simon Mee, Gabriel Glöckler
1 Introduction
Central banks across the world have stepped up their efforts to communicate
more effectively and reach wider audiences. With the rise of central bank
independence in recent decades, central banks have become more transparent and
are working harder to make themselves understood.1 Furthermore, the wider set of
tools that central banks have used and additional tasks entrusted to them since the
global financial crisis have called for better explanations of what central banks do
and why. Central banks have also made communication a core part of their monetary
policy toolkit with the introduction of forward guidance. While central banks used to
primarily address their communication to expert audiences, such as financial market
participants, recently they have been making more of an effort to reach out to the
non-expert wider public.
Central bank communication is important for the effectiveness of monetary
policy because it can influence the expectations of market participants, firms,
and consumers. For central banks to influence inflation expectations effectively, the
wider public – defined here as the general, non-expert public and representative
professional bodies such as employers’ groups, trade unions, political groups, etc. –
needs to be aware of central banks’ messages and understand them. At the same
time, attracting people’s attention and reducing the complexity of central bank
communication in an effective manner is challenging.
With the recent evolution in central banking, the ECB has revisited its
communication practices. To account for significant shifts in the communication
landscape and the clear demand from the wider public to make ECB communication
more accessible, the ECB decided – as a result of its recent strategy review – to
modernise its monetary policy communication and make “listening” a regular feature
of its communication.2
This article examines the ECB’s communication with the wider public. It starts
from the premise that communication is a process that involves a “sending end” –
the central bank – and a “receiving end”, i.e. different audiences, ranging from
experts to the wider public. For communication to work effectively, both ends, as well
as the link between the two, need to be well understood. By shedding light on this
process, this article builds upon the analysis conducted as part of the ECB’s strategy
1 See Dincer, N. and Eichengreen, B., “Central Bank Transparency and Independence: Updates and
New Measures”, International Journal of Central Banking, Vol 10, No 1, 2014; Crowe, M. and Meade,
E. E., “Central Bank Independence and Transparency: Evolution and Effectiveness”, IMF Working
Paper, 2008.
2 Data gathered from the “ECB Listens Portal” show that respondents find that the ECB uses too much
economic jargon and that its communication is not accessible enough. Respondents called for clearer
and more direct and modern communication from the ECB.

ECB communication with the wider public 123
review, notably by the Work stream on monetary policy communications.3 It also
provides a first assessment of efforts to modernise ECB communication following the
strategy review’s conclusion.
2 The “receiving end” of central bank communication
The ECB faces various challenges in its efforts to “get through” to the wider
public. First, as a supranational central bank, the ECB finds itself in a challenging
position in that it speaks to diverse audiences across 19 Member States. Financial
literacy levels, inflation expectations and trust in the ECB vary across and within euro
area countries. ECB communication needs to take this plurality into account.
Second, the ECB – like other central banks – has to overcome the challenge of
people’s inattention to its messages.4 The complexity of central bank communication
and low levels of financial literacy, among other factors, can make it too “costly” for
people to pay attention to what central banks say.5 Another challenge is that trust in
the ECB, which declined significantly during the global financial crisis, is only slowly
recovering to previous levels. Analysing the determinants of public trust in the ECB
can help us understand if and how the ECB can build trust.
One central bank, many diverse audiences
When reaching out to the wider public, the ECB needs to consider the diversity
of those who are at the receiving end of central bank communication.
Compared with other major central banks, the ECB stands out in terms of the
linguistic diversity of its audience. It communicates in 24 languages to an audience
made up of 340 million citizens, spread across 19 Member States. Besides language
diversity, ECB communication also needs to account for different financial literacy
levels across countries (Chart 1)6 and the heterogeneity of inflation expectations
among the wider public (Chart 2). Results from the ECB Consumer Expectations
Survey (CES) indicate that inflation expectations are higher for female consumers
than male consumers, increase with age and decrease with a high level of financial
literacy and income.7
3 See Assenmacher, K., Holton, S., Glöckler, G., Trautmann, P., Ioannou. D., Mee, S. et al., “Clear,
consistent and engaging: ECB monetary policy in a changing world”, Occasional Paper Series, No 274,
ECB, Frankfurt am Main, September 2021.
4 See Coibion, O., Gorodnichenko, Y., Knotek II, E. S. and Schoenle, R., “Average Inflation Targeting and
Household Expectations”, Federal Reserve Bank of Cleveland Working Paper, No 20-26, 2020.
5 See, for instance, Sims, C. A., “Rational inattention and monetary economics”, Handbook of monetary
economics, 2010, pp. 155-181; Binder, C., “Fed speak on main street: Central bank communication
and household expectations”, Journal of Macroeconomics, Vol 52, 2017, pp. 238-251.
6 See Klapper, L. and Lusardi, A., “Financial literacy and financial resilience: Evidence from around the
world”, Financial Management, Vol 49, No 3, 2020, pp. 589-614.
7 See Baumann, U., Darracq Paries, M., Westermann, T., Riggi, M. et al., “Inflation expectations and their
role in forecasting”, Occasional Paper Series, No 264, ECB, Frankfurt am Main, September 2021.

ECB communication with the wider public 124
Chart 1
Financial literacy of the general public by euro area Member State
(percentage share of respondents)
Source: Klapper, L. and Lusardi, A. (2020).
Notes: Share of respondents who answered at least three out of the five questions on financial literacy correctly in the S&P Global
FinLit Survey. Questions concerned risk diversification, inflation, numeracy, and compound interest. The authors derived the data from
a set of five questions from the Gallup World Poll survey. More than 150,000 nationally representative and randomly selected adults
(age 15+) in more than 140 countries were interviewed during 2014. The surveys were conducted face-to-face in most emerging
countries and by phone in high-income countries.
Chart 2
Consumer expectations for inflation across demographic groups
Expected inflation rates over next 12 months in selected euro area Member States
(percentages)
Source: ECB Consumer Expectations Survey
Notes: Averages using weighted data. Latest observation December 2020. Pooled data across waves. The CES collects information
on perceptions and expectations of households in the euro area, as well as on their economic and financial behaviour. The survey is
conducted online each month. Survey participants were located in six euro area countries: Germany, France, Italy, Spain, the
Netherlands and Belgium. The sample size – during the pilot phase – targeted 10,000 respondents.
The wider public’s interest in ECB-related themes also varies widely, though
its main interest lies in monetary policy. Taking media coverage as a proxy for
public preferences and interests,8 Chart 3 shows commonalities across countries,
8 See Soroka, S. N., Stecula, D. and Wlezien, C., “It’s (Change in) the (Future) Economy, Stupid:
Economic Indicators, the Media and Public Opinion”, American Journal of Political Science, Vol 59,
No 2, 2015, pp. 457-474.
0
10
20
30
40
50
60
70
DE NL FI BE IE EE AT LU FR ES LV SK EL MT SI LT IT CY PT
0.0
0.5
1.0
1.5
2.0
2.5
3.0
3.5
4.0
4.5
5.0
Male Female 18-34 35-49 50-64 65+ 1 2 3 4 Belowmedian
Median or abovemedian
Gender Age Income quartile Financial literacy

ECB communication with the wider public 125
but also indicates important differences across the euro area.9 ECB-related
coverage focuses mostly on monetary policy, but there are significant cross-country
differences, depending on the topic. For example, in Italy and Spain, interest in
banking supervision topics is much higher than in countries such as Germany or the
Netherlands, while discussion about the ECB’s mandate and accountability – under
the category Governance – is more common in Germany and France than in the
other countries in the sample.
Chart 3
Media attention to ECB-related topics in selected euro area Member States
(percentage share of ECB-related coverage in each country)
Source: ECB data.
Notes: The sample includes ECB-related articles featured in the main media outlets of the selected countries for the period January
2019 to September 2021. The classification was performed manually by an external provider. The category “Governance” mostly
captures media coverage of the ECB’s mandate and accountability, while the category “Organisation” includes coverage of the
governing bodies of the ECB and staffing issues.
There are also significant variations in the relative importance of the channels
through which the public receives news about the ECB. Data from the
Knowledge & Attitudes (K&A) survey10 from May 2021 show that television (81%) is
the most popular source of information about the ECB (Chart 4).11 Printed press is
the second most popular source, followed by online press, radio and information
received through people’s social circles. Relatively few people receive their news
about the ECB on social media. The most popular of the social media channels is
Facebook (14%), followed by Twitter and LinkedIn. At the same time, these figures
mask country-level differences, which are shown in Chart 5.
9 While Chart 3 focuses on a selection of Member States, the underlying analysis covers all 19 Member
States.
10 The ECB Knowledge and Attitudes (K&A) survey is an annual, cross-sectional survey conducted
among the general public in the 19 euro area Member States. The May 2021 edition was carried out
between 5 and 19 May 2021 with a sample of 15,500 respondents (approximately 1,000 in each
Member State, except for Cyprus, Estonia, Latvia, Lithuania, Luxembourg, Malta and Slovenia, where
the sample size was around 500). Unlike the European Commission’s Eurobarometer, which elicits
opinions about a variety of themes, the K&A survey focuses exclusively on knowledge and perception
of the ECB.
11 Television is the most popular source of information in all Member States, with the sole exception of
Luxembourg, where the printed press was selected by a higher share of respondents.
0
10
20
30
40
50
60
Banking supervision Governance Internationaleconomy
Monetary policy Organisation Other
France
Germany
Greece
Italy
Netherlands
Spain

ECB communication with the wider public 126
Chart 4
Sources of information about the ECB in the euro area
(percentage share of respondents)
Source: ECB K&A Survey May 2021.
Notes: Respondents were asked the following question: “Where have you heard of the ECB?”. Respondents were able to pick more
than one answer.
Chart 5
Sources of information about the ECB in selected euro area Member States
(percentage share of respondents)
Source: ECB K&A Survey May 2021.
Notes: Respondents were asked the following question: “Where have you heard of the ECB?”. The chart shows the share of
respondents who selected a given source at the national level for selected countries. Respondents were able to pick more than one
answer.
Against this background, efforts to tailor communication to specific needs,
interests, local debates and media consumption habits can help the ECB get
its messages through to different audiences more effectively. For example, the
results of the analyses highlight that the ECB needs to take different inflation
expectations and financial literacy levels into account when designing its
0 10 20 30 40 50 60 70 80 90
Television
Printed press
Online press
Radio
Discussion with family, friends, colleagues
Other sources on the internet (e.g. blogs, forums)
ECB website
Offline media
Online and social media
0
10
20
30
40
50
60
70
80
90
100
Television Printed press Online press Facebook Discussion withrelatives, friends,
colleagues
France
Germany
Greece
Italy
Netherlands
Spain

ECB communication with the wider public 127
communication. At the same time, the nature of central bank communication calls for
consistent messaging.12
Mind the gap: awareness, interest and knowledge
Communication should be designed around solid evidence about how people
view the ECB. Are they aware of the ECB? Do people know about the ECB’s tasks
and objectives? Do they care? Are they interested in learning more about the ECB?
Data reveal a gap between euro area citizens’ awareness of the ECB on the one
hand, and their interest in and knowledge of the ECB on the other. As Chart 6
shows, while awareness is high, interest and knowledge are relatively low. According
to May 2021 K&A data, 87% of respondents have heard of the ECB. However, the
majority of citizens (55%) are not interested in the ECB and its policies, with 27% of
people not interested at all. Only 11% of respondents say they are very interested.
Similarly, respondents’ self-assessment of their knowledge about the ECB’s tasks
and objectives is low: on a scale of 1-10, respondents on average rate their own
knowledge at 4.1. Only 3% rate their knowledge as very good (9-10), while 31% say
it is very bad (1-2).
Chart 6
Awareness of, interest in, and knowledge about the ECB
(percentage share of respondents)
Source: ECB K&A Survey May 2021.
Notes: Respondents were asked the following questions: “Have you heard of the European Central Bank?” (Possible answers: Yes,
No, Don’t know), “How interested are you in information about the European Central Bank and its policies?” (Possible answers: Very
interested; Fairly interested; Not very interested; Not interested at all; Don’t know) and “On a scale from 1 to 10, where 1 means that
you know nothing at all and 10 means that you know a great deal, how would you assess your knowledge of the policies of the
European Central Bank?” (Possible answers include Don’t know). For the awareness question, the chart displays the share of “Yes”
responses. For the interest question, the chart displays the share of “Very interested” and “Fairly interested” responses. For the self-
assessed knowledge question, the chart displays the share of responses in the range 6-10.
Confusion about the ECB’s tasks seems to be widespread. K&A data indicate
that when respondents pick from a list of possible tasks and objectives of the ECB,
they often select topics that are beyond the ECB’s mandate (Chart 7). While 64%
state that the ECB should “keep inflation at bay”, 66% also believe it is the ECB’s
12 See also Coibion, O., Gorodnichenko, Y., Kumar, S. and Pedemonte, M., “Inflation expectations as a
policy tool?”, Journal of International Economics, Vol 124, 2020.
0
10
20
30
40
50
60
70
80
90
100
Have heard of the ECB Interested in the ECB's policies Rate own knowledge about the ECB > 5on a scale 1-10
Awareness Interest Self-assessed knowledge

ECB communication with the wider public 128
task to “stabilise the foreign exchange rate”, while 39% indicate that the ECB’s job is
to “finance governments”.
Chart 7
Perceived tasks and objectives of the ECB
(percentage share of respondents)
Source: K&A Survey May 2021.
Notes: Respondents were asked the following question: “To your knowledge, which of the following are tasks or objectives of the
ECB?”
These data underscore the need for the ECB to close the gap between high
levels of awareness and lower levels of interest and knowledge. As research
shows, possible ways to overcome inattention are to make ECB communication not
just simpler but also more engaging.13 Central bank communication that is both
understandable and effective in generating interest and increases knowledge among
the wider public matters when it comes to accountability and trust.14
Proximity to the different audiences across the euro area is instrumental in
adapting communication to local audiences and making it more effective. In
this context, national central banks play a key role in connecting and engaging with
diverse national audiences across the euro area and in helping to explain ECB
decisions and the rationale behind them. They can reach out to people in their local
language, and might have an informational advantage when it comes to the topics
that resonate with citizens in the different countries and the channels they can best
use to keep citizens informed. Effective and successful communication with the
wider public is therefore something the entire Eurosystem must work together to
achieve.
Public trust in the ECB
Public trust in the ECB is an essential prerequisite for it to deliver on its
mandate of maintaining price stability. Various studies have analysed how trust in
13 See Brouwer, N. and de Haan, J., “Central bank communication with the general public: effective or
not?”, SUERF Policy Brief, March 2021.
14 See Haldane, A., Macaulay, A. and McMahon, M., “The 3 E’s of central bank communication with the
public”, Bank of England Staff Working Paper, No 847, 2020.
0 10 20 30 40 50 60 70 80
To ensure financial stability
To help euro area countries in financial difficulties
To stabilise the foreign exchange rate of the euro
To keep inflation at bay
To supervise banks
To support growth and employment
To finance governments

ECB communication with the wider public 129
central banks can influence the formation of people’s inflation expectations.15 While
greater trust in the ECB can anchor better public inflation expectations around the
central bank’s target,16 low levels of trust in the ECB may play a part in leading
inflation expectations away from the central bank’s defined price stability target,
which could undermine the ECB’s ability to deliver on its mandate.17 Trust in an
institution like the ECB has many different facets and determinants, and the
processes for building trust are multi-dimensional. Some of those aspects can be
influenced by the ECB itself, while others lie beyond its reach.
What determines trust
A first and decisive factor that determines trust in the ECB – and one that is at
least partially under the central bank’s own control – relates to people’s
perception of its performance and of its leading personnel. Recent K&A data
show that the association between specific perceptions of the ECB and trust in it is
strong (see Chart 8). Two relevant dimensions of trust in the ECB emerge.18 One
dimension relates to the ECB’s competence – is the ECB able to successfully deliver
on its mandate, and is it credible? – which is most tightly linked to trust.19 There is,
however, also an ethical dimension: does the ECB care about its citizens and does it
act responsibly?
15 See, among others, Easaw, J., Golinelli, R. and Malgarini, M., “What determines households inflation
expectations? Theory and evidence from a household survey”, European Economic Review, Vol 61,
2013, pp. 1-13; Mellina, S. and Schmidt, T., “The role of central bank knowledge and trust for the
public's inflation expectations”, Deutsche Bundesbank Discussion Paper, 2018.
16 See Christelis, D., Georgarakos, D., Jappelli, T. and Van Roij, M., “Trust in the Central Bank and
Inflation Expectations”, International Journal of Central Banking, Vol 16, No 6, December 2020.
17 See Ehrmann, M., Soudan, M. and Stracca, L., “Explaining European Union citizens’ trust in the
European Central Bank in normal and crisis times”, The Scandinavian Journal of Economics, Vol 115,
No 3, 2013, pp. 781-807.
18 See Murtin, F., et al., “Trust and its determinants: Evidence from the Trustlab experiment”, OECD
Statistics Working Paper, 2018.
19 See Angino, S. and Secola, S., “Pillars of Trust: What determines trust in the ECB?”, mimeo, 2019.

ECB communication with the wider public 130
Chart 8
Strength of association between trust in the ECB and perceptions of the institution
(standardised beta coefficients)
Source: Angino and Secola (2019).
Notes: The chart displays the perception variables most strongly associated with trust in the ECB in an ordinary least square
regression estimation that controls for individual characteristics such as socio-demographics, factual and self-assessed knowledge
about the ECB, and country and time fixed effects. ECB K&A data were used. Perception variables are binary variables derived from
two question batteries: “Please tell me for each of the following adjectives if it corresponds very well, fairly well, fairly badly or very
badly to the idea you might have of the ECB” and “I am going to read you a list of statements. Please tell me if you totally agree, tend
to agree, tend to disagree or totally disagree with each of them”. Estimated effects marked by *** are statistically significant at the
0.01% significance level, those marked with ** at the 1%. Robust standard errors clustered at the country level are used.
To foster trust, the ECB not only needs to be successful in its policy
performance, but also needs to show how its measures ultimately serve the
people of Europe. Success at delivering price stability is an essential component of
building trust among the wider public. However, by narrowly focusing on its policy
performance in its communications, the ECB may miss out on important aspects of
how people perceive it. Framing communication also in terms of how responsible
ECB policy actually benefits people’s welfare – in other words, how it makes a
positive contribution to people’s individual lives – can capture these additional
dimensions and foster greater trust.
Beyond that, trust in the ECB is also determined – possibly more decisively,
even – by a wide range of economic and non-economic factors. There are
various studies linking trust in public institutions to economic conditions. With respect
to the ECB, research shows that the public often holds the ECB responsible for
macroeconomic conditions such as unemployment and stagnation, or crisis
management on the part of EU institutions.20 Besides the relevance of the perceived
state of the economy, trust in the ECB depends on citizens’ satisfaction with the
performance of the EU as a whole, which again differs across countries.21 In that
20 See Roth, F. and Jonung, L., “Public support for the euro and trust in the ECB. The Economics of
Monetary Unions: Past Experiences and the Eurozone”, VoxEU, December 2019.
21 See Bergbauer, S., Hernborg, N., Jamet, J. F. and Persson, E., “The reputation of the euro and the
European Central Bank: interlinked or disconnected?”, Journal of European Public Policy, Vol 27, No 8,
January 2020, pp. 1178-1194. The authors measure performance evaluations of the EU on the basis of
survey respondents’ assessment of whether things “are going in the right direction in the EU” as well as
their evaluations of the EU’s crisis performance.
***
****** ***
***
*****
****
0
5
10
15
20
25
30
35
Cre
dib
le
Resp
onsib
le
Att
en
tive t
ocitiz
en
s'w
elfa
re
Su
cce
ssfu
l in
infla
tio
n c
on
tro
l
Su
cce
ssfu
l in
ba
nkin
g s
up
erv
isio
n
Inde
pe
nde
nt
Po
werf
ul
Com
mu
nic
ative
Tra
nsp
are
nt

ECB communication with the wider public 131
sense, these factors are at best indirectly related to the ECB and its performance, if
not entirely exogenous.
Among non-economic determinants of trust, there is evidence that cultural and
sociological factors also matter. Chart 9 shows the link between cultural traits,
measured by social trust – that is, generally speaking, “faith in people”22 – at the
regional level in the euro area, and trust in the ECB. Individuals living in regions with
lower levels of social trust systematically exhibit less trust in the ECB, and the
underlying analysis supports a causal interpretation.23 Clearly, these cultural and
sociological factors are slow-moving components, and the scope for the ECB to
influence them is limited.24
Chart 9
The relationship between trust in the ECB and social trust
(x-axis: regional share of respondents stating that other people can generally be trusted; y-axis: regional share of respondents stating
that they trust the ECB)
Source: Angino et al. (2021).
Note: The chart displays the share of European Social Survey (ESS) respondents who state that most people can be trusted and the
share of K&A respondents who state they trust the ECB. To measure social trust, data from the ESS between 2002 and 2016 are
used. To measure trust in the ECB, data from the K&A survey collected in the 19 euro area countries in 2016, 2017 and 2018 are
used.
Ways of building trust
Given the importance of trust for central banks, it is essential to have a deeper
understanding of how public trust can be built and sustained. In this context,
important societal shifts with respect to how trust is generated and lost are of great
22 The following survey item from the European Social Survey (ESS) was used: “Generally speaking,
would you say that most people can be trusted, or that you can’t be too careful in dealing with people?”.
Respondents are provided with a scale from 0 to 10; See also Pew Research Center, “Americans and
Social Trust: Who, Where and Why”, Report, 22 February 2017.
23 See Angino, S., Ferrara, F. and Secola, S., “The cultural origins of institutional trust: the case of the
ECB”, European Union Politics, 2021.
24 The same applies to socio-demographic factors such as gender, age and education; see Bergbauer, S.,
Hernborg, N., Jamet, J-F., Persson, E. and Schölermann, H., “Citizens’ attitudes towards the ECB, the
euro and Economic and Monetary Union”, Economic Bulletin, Issue 4, ECB, Frankfurt am Main, 2020.
30
40
50
60
70
80
90
10 20 30 40 50 60 70 80
Central and Northern Europe
Southern Europe

ECB communication with the wider public 132
relevance for the ECB.25 However, there is ample literature that confirms that by
communicating in an accessible manner26 and by engaging with citizens27, central
banks can build knowledge, increase understanding and ultimately affect people’s
trust in them. Two key mechanisms can be distinguished: “reflective trust”, which
builds on greater understanding as a stepping stone towards increased trust; and
“instinctive trust”, which builds more on emotion and personal experience and
generates trust in the institution even in the absence of a clear understanding of its
role or policy.28
A survey experiment conducted with K&A survey data highlights differences
between reflective and instinctive trust levels in the ECB. In the survey
experiment (Chart 10), respondents were randomly asked to answer the question
“Do you tend to trust or tend not to trust the ECB?” either at the beginning of the
questionnaire, in the middle of it, or at the end. The randomisation made it possible
to check whether deeper consideration of the ECB – that is, “reflective trust” –
promotes more or less trust in the institution compared with an on-the-spot
judgement – “instinctive trust”.
For the ECB it is important not to rely on instinctive trust alone but also
strengthen reflective trust levels. The survey experiment shows that instinctive
trust is fragile, especially for certain socio-demographic groups. When respondents
had the opportunity to reflect about the ECB, the level of trust decreased for some of
them. Mainly women then tend to trust the ECB less, in particular those who claim to
know little about the institution. These findings suggest that for trust levels to remain
steady even in times of crisis, the ECB should try and increase reflective trust levels.
One way to do that could be to help improve people’s factual and self-assessed
knowledge of the ECB’s tasks and objectives.
25 See Haldane, A.,”A Little More Conversation. A Little Less Action”, Speech, Macroeconomics and
Monetary Policy Conference, Federal Reserve Bank of San Francisco, March 2017, and Botsman, R.,
“Who can you trust? How Technology brought us together and why it could drive us apart”, Penguin,
2017.
26 See Bholat, D., Broughton, N., Ter Meer, J. and Walczak, E., “Enhancing central bank communications
using simple and relatable information”, Journal of Monetary Economics, 2019, pp. 1-15.
27 See Haldane, A., Macaulay, A. and McMahon, M., “The 3 E’s of central bank communication with the
public”, Bank of England Staff Working Paper, 2020.
28 See Angino, S. and Secola, S., “Instinctive trust versus reflective trust in the
European Central Bank”, mimeo, 2021.

ECB communication with the wider public 133
Chart 10
Evolution of net trust in the ECB by gender and education level
(percentage share of respondents)
Source: Angino and Secola (2021).
Notes: The survey experiment makes use of two consecutive waves of the ECB K&A survey. In the survey experiment, respondents
were randomly asked to answer the question “Do you tend to trust or tend not to trust the ECB?” either at the beginning of the
questionnaire, in the middle of it, or at the end. Net trust is calculated as the share of respondents answering “Tend to trust” divided by
the sum of respondents answering either “Tend to trust” or “Tend not to trust” (i.e. “Don’t know” answers are excluded). Levels of trust
at the beginning of the questionnaire are what we refer to as “instinctive trust”. Levels of trust in the middle and at the end of the
questionnaire are what we refer to as “reflective trust”.
3 Analysing the “sending end” of central bank communication
Evolution of ECB communication
For central banks, communication via press conferences, speeches and
interviews is a well-established means of reaching expert audiences as well as
the interested, highly-educated public. As communication gains importance for
central bank policy and its effectiveness, recourse to this type of communication has
grown considerably. For example, Chart 11 shows the increase in the number
interviews given by ECB Executive Board members over time. The increase mainly
reflects the efforts made by the central bank to explain its increasingly complex
policies during times of crisis and to reduce uncertainty. During the pandemic, media
interviews given to both financial and general-interest media provided a suitable
platform for sharing the ECB’s messages.
45
50
55
60
65
70
Beginning Middle End
Instinctive trust Reflective trust
All
Men, no college
Men, college
Women, no college
Women, college

ECB communication with the wider public 134
Chart 11
Volume of ECB interviews over time
(number of interviews)
Source: ECB website.
Notes: Number of interviews by ECB Executive Board members published on the ECB’s website. Three-year moving average is
superimposed. No interviews dating before 2005 are published on the ECB’s website.
Quantity alone, however, is no guarantee of more media coverage and, by
extension, a greater chance of “getting through” to the wider public. To
increase its voice in traditional media and social media, the ECB needs to focus on
communicating simpler messages.29 While stepping up communication, especially in
times of crisis, is relevant in terms of ensuring accountability and legitimacy, the
clarity of the central bank’s messages matters for its reach. Chart 12 shows that
clear communication in ECB speeches is a significant and robust predictor of media
engagement. This also holds true for ECB communication on Twitter and via its
press conferences.30
29 It is important not to see online and offline media as mutually exclusive. ECB communication via TV or
the printed press can spark debates on social media.
30 See Ferrara, F. and Angino, S., “Does Clarity Make Central Banks More Engaging? Lessons from ECB
Communications”, European Journal of Political Economy, 2021.
0
10
20
30
40
50
60
70
80
2005 2006 2007 2008 2009 2010 2011 2012 2013 2014 2015 2016 2017 2018 2019 2020

ECB communication with the wider public 135
Chart 12
Clarity of ECB speeches and media engagement
(x-axis: Flesh-Kincaid Grade Level of ECB speeches; y-axis: number of ECB-related articles on the day of the speech and the day
after)
Source: Ferrara and Angino (2021).
Notes: Data refer to the period from 1999-2019. Clarity of communication (x-axis) is measured using the Flesh-Kincaid Grade Level,
which indicates how many years of formal training are required to understand the text based on the length of its sentences and words.
Media engagement (y-axis) is measured by the number of articles about the ECB, retrieved from the digital archive of Dow Jones
Factiva. Predictions are based on a regression that controls, inter alia, for the topic distribution of the speech, whether the ECB
President is speaking, whether the speaker belongs to the Executive Board or the Supervisory Board, and time fixed effects.
While the readability of ECB speeches has improved over time, the challenge
of conveying messages in a simple, but not simplistic, way remains difficult,
especially in times of crisis. Chart 13 shows that the readability of ECB speeches
has generally improved since the launch of the euro, especially in the aftermath of
the global financial crisis. At the same time, the pandemic and the policy response to
it has led to more complex and complicated packages of measures, which is also
reflected in the complexity of speeches, as is shown by the uptick in the readability
score over the year 2020. The challenge for the future will be to return to the pre-
pandemic downward trend when it comes to the complexity of communication
activities.
350
400
450
500
550
9 10 11 12 13 14 15 16 17 18 19

ECB communication with the wider public 136
Chart 13
Readability of ECB speeches over time
Monthly average of Flesch-Kincaid Grade Level from June 1998-December 2020
(Flesch-Kincaid Grade Level)
Source: ECB data, staff calculations.
Notes: The difficulty of the language employed is measured using the Flesch-Kincaid Grade Level score, which indicates how many
years of formal training are required to understand the text, based on the length of its sentences and words. A 12-month moving
average was superimposed.
The ECB has adapted its communication strategy to “new” communication
platforms and technologies. Citizens, especially younger people, increasingly
consume news on online platforms.31 As a consequence, the ECB has expanded its
activities on social media platforms. The ECB is now present on Twitter, LinkedIn,
Instagram and YouTube with a combined followership of over a million.32 While this
number can still be considered modest given the size of the ECB’s audience, the
ECB’s social media channels have already proved to be important platforms for
reaching the wider public, as outlined in Box 1 below.
Box 1
ECB-related discussions on social media – an analysis of Twitter traffic
Prepared by Michael Ehrmann
The ECB’s policies are actively discussed on social media. The ECB itself is an active player,
posting material on its social media channels, but ECB-related social media posts originate from
many different sources, with experts and non-experts both contributing. An analysis of Twitter traffic
that comments on the ECB and its policies can help shed light on who is contributing to these
discussions and how they respond to the ECB’s communication. This box provides such an
analysis, based on a dataset of tweets that mention the ECB and the Twitter accounts from which
they were posted. The dataset is studied in Ehrmann and Wabitsch (2021) and contains tweets
written in English and in German.33
31 See Newman, N., Fletcher, R., Schulz, A., Andi, S. and Nielsen, R. K., “Reuters Institute Digital News
Report”, 2020.
32 This figure does not refer to unique followers across social media platforms. In other words, one person
might follow the ECB on multiple social media channels.
33 See Ehrmann, M. and Wabitsch, A., “Central bank communication with non-experts: a road to
nowhere?”, Working Paper Series, No 2594, ECB, October 2021.
10
11
12
13
14
15
16
17
18
19
20
1998 2000 2002 2004 2006 2008 2010 2012 2014 2016 2018 2020

ECB communication with the wider public 137
A small number of Twitter accounts generates most of the ECB-related traffic, and an even smaller
number constitutes the most influential opinion-makers. This can be seen in Chart A. The yellow line
plots how the contribution to ECB-related Twitter traffic is distributed across the various Twitter
accounts. The chart, which shows what is known as a Lorenz curve, reveals that most of the Twitter
traffic stems from relatively few accounts. For instance, the top 5% of accounts generate 74% of
tweets in English and 61% of tweets in German. This is far from a situation where each account
contributes in equal proportion, a hypothetical case that is represented by the blue line in the chart.
What is more, the top 5% Twitter accounts are responsible for 93% of tweets in English that get
“liked” and for 97% of tweets that get retweeted. For tweets in German the top 5% Twitter accounts
are responsible for 89% of retweeted tweets and likes.
Chart A
Distribution of tweets across Twitter accounts
(x-axis: cumulative share of accounts; y-axis: cumulative share of tweets)
Source: Ehrmann and Wabitsch (2021).
Notes: The chart shows the Lorenz curve of ECB-related Twitter activity in English and German, respectively. The 45-degree line (in blue) represents a
hypothetical case where each account contributes to the Twitter traffic in equal proportion. The yellow line shows the distribution of tweets about the ECB, the
red line the distribution of tweets about the ECB that got “liked” by other Twitter accounts, and the green line the distribution of tweets about the ECB that got
retweeted by other users. Based on data covering the years 2012-2018.
A more granular picture can be obtained by splitting the contributions into those stemming from
experts in monetary policy matters and those written by non-experts. Differentiating these two
groups is possible with a few assumptions: experts issue tweets regularly on the days of the ECB
press conference, whereas non-experts do so more occasionally and post tweets about various
topics, leading to a low ECB-centricity in their overall tweets.
Chart B shows how ECB-related tweets differ across expert and non-expert groups. It shows that,
on average, tweets by non-experts are more subjective and express stronger views. This difference
is relatively small for tweets in English, but more pronounced for those in German. The chart also
plots the standard deviation of the average sentiment expressed by each Twitter account, i.e. it
measures how different the sentiment is across Twitter accounts in each group. The differences
between experts and non-experts are notable. Tweets issued by experts are much more aligned in
terms of their subjectivity and the strength of views expressed than tweets by non-experts. This
shows that tweets by non-experts reflect a much larger spectrum of views.
0
10
20
30
40
50
60
70
80
90
100
0 5
10
15
20
25
30
35
40
45
50
55
60
65
70
75
80
85
90
95
10
0
45-degree line
ECB-related tweets
Liked ECB-related tweets
Retweeted ECB-related tweets
a) English sample
0
10
20
30
40
50
60
70
80
90
100
0 5
10
15
20
25
30
35
40
45
50
55
60
65
70
75
80
85
90
95
10
0
b) German sample

ECB communication with the wider public 138
Chart B
Sentiment expressed in ECB-related tweets
(index ranging from 0-100)
Source: Ehrmann and Wabitsch (2021).
Notes: The chart shows summary statistics for tweets issued by experts and by non-experts, in English and German respectively. Subjectivity and strength of
views are measured based on a dictionary approach, and are restricted to lie between 0 and 100. The English lexicon is based on Princeton University’s
WordNet, the German lexicon on the German equivalent GermaNet. Being based on two different dictionaries, sentiment in English and German tweets is not
directly comparable. Words that indicate subjectivity are, for instance, “terrible” or “actual”, which yield subjectivity values of 100 and 0, respectively. Indicators
for the strength of views are, for instance, “awful”, “marvellous” or “consistent”, which yield values of 100, 100 and 0, respectively. For both sentiment
measures, the chart plots i) the average across all ECB-related tweets and ii) the standard deviation of the account-specific average sentiment measure as a
measure of variation. Based on data covering the years 2012-2018.
How does sentiment respond to the ECB’s communication? Chart C provides some estimates for
the case of the ECB’s press conference, around which Twitter traffic is elevated for several days,
before and after the event. As Chart C shows, the reaction of non-experts’ tweets in English and in
German is quite different. Tweets in English become considerably more factual, and the views more
moderate. In addition, there is less dispersion in subjectivity. This pattern suggests that tweets in
English mainly relay information about the press conference. In contrast, tweets in German do not
become significantly more factual, nor more moderate. At the same time, the increase in the
variation of subjectivity and in the variation of the strength of views reveals that the views expressed
become substantially more heterogeneous across Twitter accounts. Tweets in German around the
time of the ECB press conference, therefore, seem to reflect a more controversial discussion
among Twitter users.
0
5
10
15
20
25
30
Subjectivity: average Subjectivity: variation Strength of views: average Strength of views: variation
Experts
Non-experts
a) English sample
0
5
10
15
20
25
30
Subjectivity: average Subjectivity: variation Strength of views: average Strength of views: variation
b) German sample

ECB communication with the wider public 139
Chart C
Change in sentiment in non-experts’ tweets around the ECB press conference
(response coefficients)
Source: Ehrmann and Wabitsch (2021).
Notes: The chart shows the responsiveness of the sentiment expressed in non-experts’ tweets in English and German, respectively, to the ECB’s press
conference. Response coefficients that are statistically significant at least at the 10% level are plotted in dark shaded colours. Based on data covering the
years 2012-2018.
Even though the reception of the ECB’s press conference by non-experts is different in the two
languages, there is one common pattern that is important: Twitter traffic by non-experts intensifies
around the time of the ECB’s press conference, which suggests that the ECB’s communication gets
noticed and is discussed by non-experts. This implies that the first necessary step on the way to
successful communication, namely that the sender manages to reach the intended recipient, is
being taken.
Modernising ECB communication
Big economic, societal, and technological changes that are shaping a radically
altered communications landscape are inevitably driving a further evolution in
ECB communication. These trends include a loss of trust in expert authority34, a 24-
hour news cycle and greater controversy around and politicisation of central bank
actions.35 Moreover, as outlined in Chapter 2, more concerted engagement efforts
are necessary to build knowledge and ultimately trust. To that end, the ECB’s
Governing Council decided, in the context of its recent strategy review, to adapt the
substance, style and operational model of its monetary policy communication.
The Governing Council has made its monetary policy communication more
accessible by replacing its “introductory statement” with the new “monetary
policy statement”, which is more streamlined and has a stronger narrative.
Chart 14 shows how the length and complexity of monetary policy statements issued
34 See Jacobs, R., “The downfall (and possible salvation) of expertise”, Chicago Booth Review,
November 2020.
35 See Moschella, M., Pinto, L. and Martocchia Diodati, N., “Let's speak more? How the ECB responds to
public contestation”, Journal of European Public Policy, Vol 27, No 3, 2020, pp. 400-418.
-15
-10
-5
0
5
10
15
Subjectivity:average
Subjectivity:variation
Strength of views:average
Strength of views: variation
English
German

ECB communication with the wider public 140
before the strategy review had concluded compare with those issued after the
strategy review outcome measures had been implemented. Chart 15 shows the
length and complexity of monetary policy communication over time, indicating that
recent monetary policy statements are more accessible than previous ones.36
Chart 14
The ECB monetary policy statement: before and after
a) Word count
(number of words)
b) Language complexity
(Flesch-Kincaid Grade Level)
Source: ECB data.
Notes: The chart displays the length and the complexity of the last three monetary policy statements (until June 2021 “introductory
statement”) before the announcement of the outcome of the ECB strategy review (8 July 2021) and the first three following it. The
difficulty of the language employed is measured using the Flesch-Kincaid Grade Level score, which indicates how many years of
formal training are required to understand the text, based on the length of its sentences and words.
36 See Coenen, G., Ehrmann, M., Gaballo, G., Hoffmann, P., Nakov, A., Nardelli, S., Persson, E. and
Strasser, G., “Communication of monetary policy in unconventional times”, Working Paper Series,
No 2080, ECB, Frankfurt am Main, June 2017.
0
500
1,000
1,500
2,000
2,500
03/21 04/21 06/21 07/21 09/21 10/21
Before strategy review outcome
After strategy review outcome
0
2
4
6
8
10
12
14
16
03/21 04/21 06/21 07/21 09/21 10/21
Before strategy review outcome
After strategy review outcome
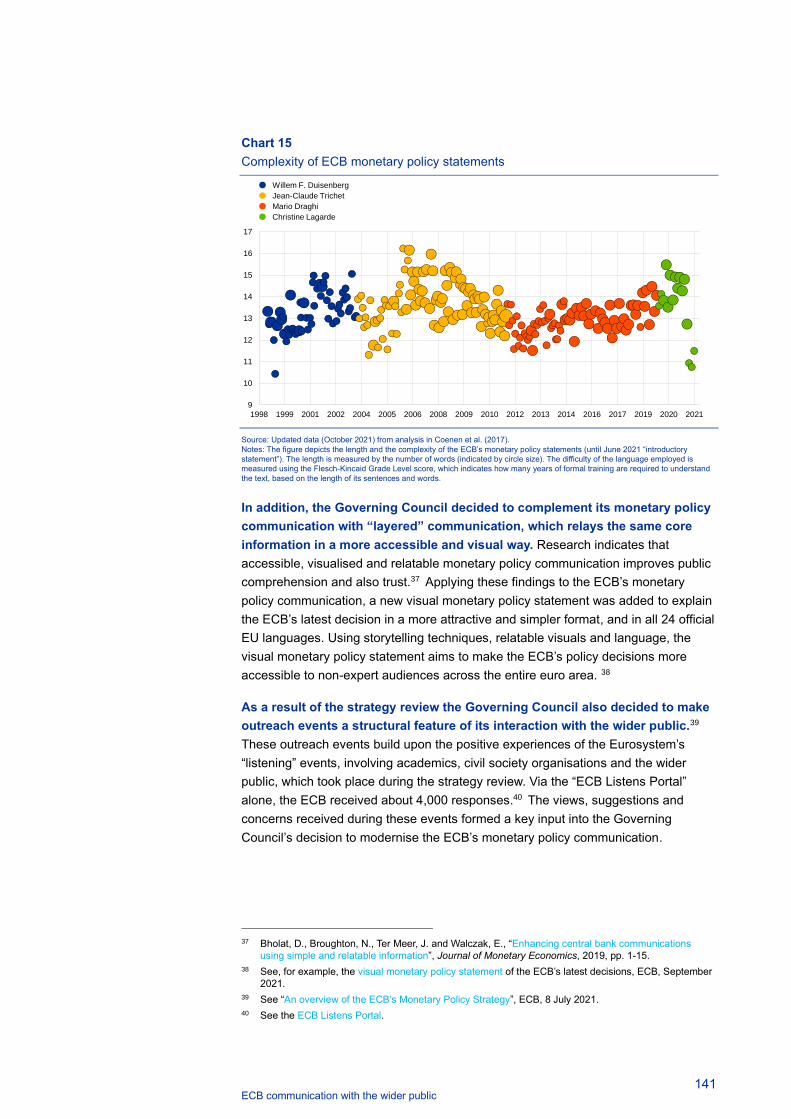
ECB communication with the wider public 141
Chart 15
Complexity of ECB monetary policy statements
Source: Updated data (October 2021) from analysis in Coenen et al. (2017).
Notes: The figure depicts the length and the complexity of the ECB’s monetary policy statements (until June 2021 “introductory
statement”). The length is measured by the number of words (indicated by circle size). The difficulty of the language employed is
measured using the Flesch-Kincaid Grade Level score, which indicates how many years of formal training are required to understand
the text, based on the length of its sentences and words.
In addition, the Governing Council decided to complement its monetary policy
communication with “layered” communication, which relays the same core
information in a more accessible and visual way. Research indicates that
accessible, visualised and relatable monetary policy communication improves public
comprehension and also trust.37 Applying these findings to the ECB’s monetary
policy communication, a new visual monetary policy statement was added to explain
the ECB’s latest decision in a more attractive and simpler format, and in all 24 official
EU languages. Using storytelling techniques, relatable visuals and language, the
visual monetary policy statement aims to make the ECB’s policy decisions more
accessible to non-expert audiences across the entire euro area. 38
As a result of the strategy review the Governing Council also decided to make
outreach events a structural feature of its interaction with the wider public.39
These outreach events build upon the positive experiences of the Eurosystem’s
“listening” events, involving academics, civil society organisations and the wider
public, which took place during the strategy review. Via the “ECB Listens Portal”
alone, the ECB received about 4,000 responses.40 The views, suggestions and
concerns received during these events formed a key input into the Governing
Council’s decision to modernise the ECB’s monetary policy communication.
37 Bholat, D., Broughton, N., Ter Meer, J. and Walczak, E., “Enhancing central bank communications
using simple and relatable information”, Journal of Monetary Economics, 2019, pp. 1-15.
38 See, for example, the visual monetary policy statement of the ECB’s latest decisions, ECB, September
2021.
39 See “An overview of the ECB’s Monetary Policy Strategy”, ECB, 8 July 2021.
40 See the ECB Listens Portal.
9
10
11
12
13
14
15
16
17
1998 1999 2001 2002 2004 2005 2006 2008 2009 2010 2012 2013 2014 2016 2017 2019 2020 2021
Willem F. Duisenberg
Jean-Claude Trichet
Mario Draghi
Christine Lagarde

ECB communication with the wider public 142
4 Conclusion
Central bank communication with expert audiences and the wider public plays
an important role in influencing expectations and sustaining trust, thereby
making monetary policy more effective and helping to ensure the legitimacy of
independent monetary institutions. To ensure the effectiveness of the ECB’s
monetary policy, clear and consistent communication targeted at expert audiences
will remain essential. At the same time, greater efforts to “get through” to the wider
public will help increase the impact of the ECB’s monetary policy communication.
This article has examined the receiving and sending ends of the ECB’s
communication with the wider public, and the elements that facilitate
communication between those two ends. The analysis highlighted the sheer
diversity of the ECB’s audience and made the case that ECB communication needs
to be adjusted accordingly. Research suggests that more accessible, relatable and
visual communication can increase the impact of the central bank’s messages.
The strategy review’s outcome has led to the introduction of more
understandable, relatable and visual monetary policy communication. This
article has shown that the readability of the ECB’s new “monetary policy statement”
is noticeably better than the “introductory statement” that preceded it. In turn, the
visual monetary policy statement introduces a layer of more accessible
communication that allows the ECB to better reach the wider public.

Statistics
S 1ECB Economic Bulletin, Issue 8 / 2021 - Statistics
Contents
1 External environment S 2 2 Financial developments S 3 3 Economic activity S 8 4 Prices and costs S 14 5 Money and credit S 18 6 Fiscal developments S 23
Further information
ECB statistics can be accessed from the Statistical Data Warehouse (SDW): http://sdw.ecb.europa.eu/ Data from the statistics section of the Economic Bulletin are available from the SDW: http://sdw.ecb.europa.eu/reports.do?node=1000004813 A comprehensive Statistics Bulletin can be found in the SDW: http://sdw.ecb.europa.eu/reports.do?node=1000004045 Methodological definitions can be found in the General Notes to the Statistics Bulletin: http://sdw.ecb.europa.eu/reports.do?node=10000023 Details on calculations can be found in the Technical Notes to the Statistics Bulletin: http://sdw.ecb.europa.eu/reports.do?node=10000022 Explanations of terms and abbreviations can be found in the ECB’s statistics glossary: http://www.ecb.europa.eu/home/glossary/html/glossa.en.html
Conventions used in the tables
- data do not exist/data are not applicable . data are not yet available ... nil or negligible (p) provisional s.a. seasonally adjusted n.s.a. non-seasonally adjusted
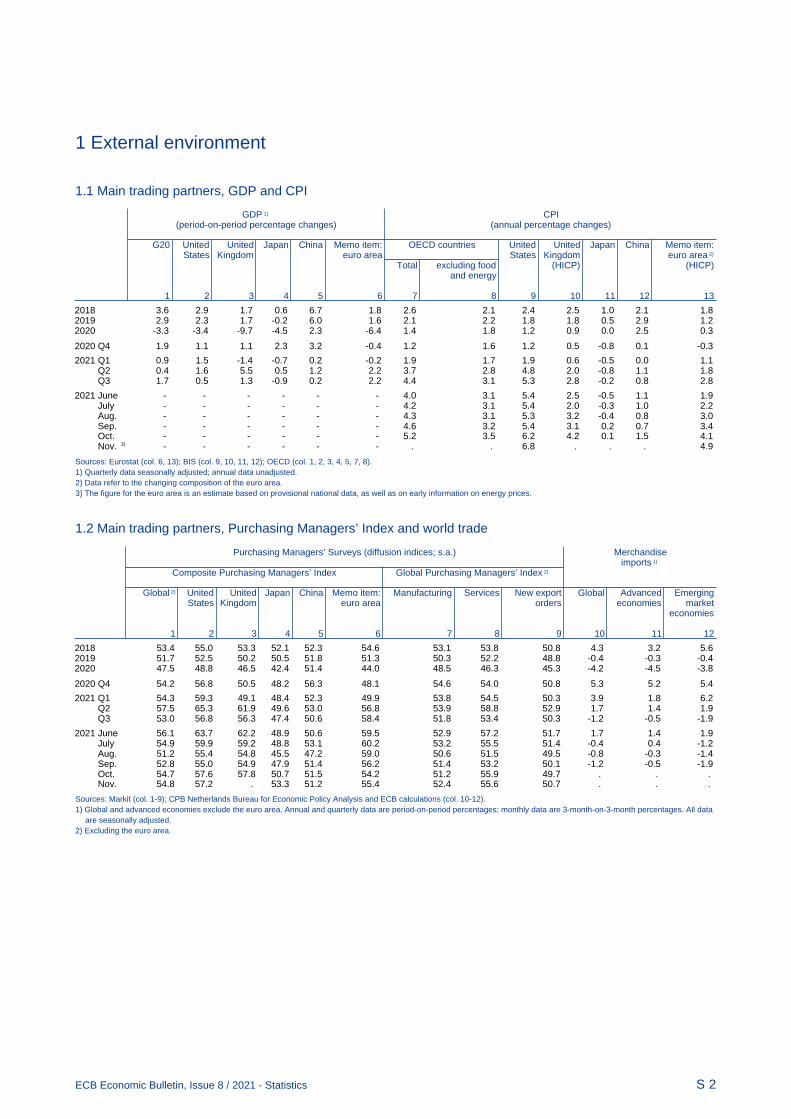
1 External environment
S 2ECB Economic Bulletin, Issue 8 / 2021 - Statistics
1.1 Main trading partners, GDP and CPI
GDP 1) CPI
(period-on-period percentage changes) (annual percentage changes)
G20 United United Japan China Memo item: OECD countries United United Japan China Memo item:States Kingdom euro area States Kingdom euro area 2)
Total excluding food (HICP) (HICP)and energy
1 2 3 4 5 6 7 8 9 10 11 12 13
2018 3.6 2.9 1.7 0.6 6.7 1.8 2.6 2.1 2.4 2.5 1.0 2.1 1.82019 2.9 2.3 1.7 -0.2 6.0 1.6 2.1 2.2 1.8 1.8 0.5 2.9 1.22020 -3.3 -3.4 -9.7 -4.5 2.3 -6.4 1.4 1.8 1.2 0.9 0.0 2.5 0.3
2020 Q4 1.9 1.1 1.1 2.3 3.2 -0.4 1.2 1.6 1.2 0.5 -0.8 0.1 -0.3
2021 Q1 0.9 1.5 -1.4 -0.7 0.2 -0.2 1.9 1.7 1.9 0.6 -0.5 0.0 1.1 Q2 0.4 1.6 5.5 0.5 1.2 2.2 3.7 2.8 4.8 2.0 -0.8 1.1 1.8 Q3 1.7 0.5 1.3 -0.9 0.2 2.2 4.4 3.1 5.3 2.8 -0.2 0.8 2.8
2021 June - - - - - - 4.0 3.1 5.4 2.5 -0.5 1.1 1.9 July - - - - - - 4.2 3.1 5.4 2.0 -0.3 1.0 2.2 Aug. - - - - - - 4.3 3.1 5.3 3.2 -0.4 0.8 3.0 Sep. - - - - - - 4.6 3.2 5.4 3.1 0.2 0.7 3.4 Oct. - - - - - - 5.2 3.5 6.2 4.2 0.1 1.5 4.1 Nov. 3) - - - - - - . . 6.8 . . . 4.9
Sources: Eurostat (col. 6, 13); BIS (col. 9, 10, 11, 12); OECD (col. 1, 2, 3, 4, 5, 7, 8).1) Quarterly data seasonally adjusted; annual data unadjusted.2) Data refer to the changing composition of the euro area.3) The figure for the euro area is an estimate based on provisional national data, as well as on early information on energy prices.
1.2 Main trading partners, Purchasing Managers’ Index and world trade
Purchasing Managers’ Surveys (diffusion indices; s.a.) Merchandise
imports 1) Composite Purchasing Managers’ Index Global Purchasing Managers’ Index 2)
Global 2) United United Japan China Memo item: Manufacturing Services New export Global Advanced EmergingStates Kingdom euro area orders economies market
economies
1 2 3 4 5 6 7 8 9 10 11 12
2018 53.4 55.0 53.3 52.1 52.3 54.6 53.1 53.8 50.8 4.3 3.2 5.62019 51.7 52.5 50.2 50.5 51.8 51.3 50.3 52.2 48.8 -0.4 -0.3 -0.42020 47.5 48.8 46.5 42.4 51.4 44.0 48.5 46.3 45.3 -4.2 -4.5 -3.8
2020 Q4 54.2 56.8 50.5 48.2 56.3 48.1 54.6 54.0 50.8 5.3 5.2 5.4
2021 Q1 54.3 59.3 49.1 48.4 52.3 49.9 53.8 54.5 50.3 3.9 1.8 6.2 Q2 57.5 65.3 61.9 49.6 53.0 56.8 53.9 58.8 52.9 1.7 1.4 1.9 Q3 53.0 56.8 56.3 47.4 50.6 58.4 51.8 53.4 50.3 -1.2 -0.5 -1.9
2021 June 56.1 63.7 62.2 48.9 50.6 59.5 52.9 57.2 51.7 1.7 1.4 1.9 July 54.9 59.9 59.2 48.8 53.1 60.2 53.2 55.5 51.4 -0.4 0.4 -1.2 Aug. 51.2 55.4 54.8 45.5 47.2 59.0 50.6 51.5 49.5 -0.8 -0.3 -1.4 Sep. 52.8 55.0 54.9 47.9 51.4 56.2 51.4 53.2 50.1 -1.2 -0.5 -1.9 Oct. 54.7 57.6 57.8 50.7 51.5 54.2 51.2 55.9 49.7 . . . Nov. 54.8 57.2 . 53.3 51.2 55.4 52.4 55.6 50.7 . . .
Sources: Markit (col. 1-9); CPB Netherlands Bureau for Economic Policy Analysis and ECB calculations (col. 10-12).1) Global and advanced economies exclude the euro area. Annual and quarterly data are period-on-period percentages; monthly data are 3-month-on-3-month percentages. All data
are seasonally adjusted.2) Excluding the euro area.

2 Financial developments
S 3ECB Economic Bulletin, Issue 8 / 2021 - Statistics
2.1 Money market interest rates(percentages per annum; period averages)
Euro area 1) United States Japan
Euro short-term Overnight 1-month 3-month 6-month 12-month 3-month 3-monthrate deposits deposits deposits deposits deposits deposits deposits
(€STR) 2) (EONIA) (EURIBOR) (EURIBOR) (EURIBOR) (EURIBOR) (LIBOR) (LIBOR)
1 2 3 4 5 6 7 8
2018 -0.45 -0.36 -0.37 -0.32 -0.27 -0.17 2.31 -0.052019 -0.48 -0.39 -0.40 -0.36 -0.30 -0.22 2.33 -0.082020 -0.55 -0.46 -0.50 -0.43 -0.37 -0.31 0.64 -0.07
2021 May -0.56 -0.48 -0.56 -0.54 -0.51 -0.48 0.15 -0.09 June -0.56 -0.48 -0.55 -0.54 -0.51 -0.48 0.13 -0.09 July -0.57 -0.48 -0.56 -0.54 -0.52 -0.49 0.13 -0.08 Aug. -0.57 -0.48 -0.56 -0.55 -0.53 -0.50 0.12 -0.10 Sep. -0.57 -0.49 -0.56 -0.55 -0.52 -0.49 0.12 -0.08 Oct. -0.57 -0.49 -0.56 -0.55 -0.53 -0.48 0.13 -0.08 Nov. -0.57 -0.49 -0.57 -0.57 -0.53 -0.49 0.16 -0.09
Source: Refinitiv and ECB calculations.1) Data refer to the changing composition of the euro area, see the General Notes.2) The ECB published the euro short-term rate (€STR) for the first time on 2 October 2019, reflecting trading activity on 1 October 2019. Data on previous periods refer to the
pre-€STR, which was published for information purposes only and not intended for use as a benchmark or reference rate in any market transactions.
2.2 Yield curves(End of period; rates in percentages per annum; spreads in percentage points)
Spot rates Spreads Instantaneous forward rates
Euro area 1), 2) Euro area 1), 2) United States United Kingdom Euro area 1), 2)
3 months 1 year 2 years 5 years 10 years 10 years 10 years 10 years 1 year 2 years 5 years 10 years- 1 year - 1 year - 1 year
1 2 3 4 5 6 7 8 9 10 11 12
2018 -0.80 -0.75 -0.66 -0.26 0.32 1.07 0.08 0.51 -0.67 -0.45 0.44 1.172019 -0.68 -0.66 -0.62 -0.45 -0.14 0.52 0.34 0.24 -0.62 -0.52 -0.13 0.412020 -0.75 -0.76 -0.77 -0.72 -0.57 0.19 0.80 0.32 -0.77 -0.77 -0.60 -0.24
2021 May -0.63 -0.68 -0.69 -0.54 -0.15 0.53 1.54 0.75 -0.72 -0.67 -0.16 0.57 June -0.65 -0.69 -0.70 -0.56 -0.20 0.49 1.40 0.68 -0.72 -0.68 -0.22 0.45 July -0.66 -0.75 -0.80 -0.75 -0.44 0.31 1.16 0.52 -0.83 -0.86 -0.50 0.16 Aug. -0.68 -0.73 -0.77 -0.68 -0.39 0.34 1.24 0.56 -0.79 -0.79 -0.43 0.16 Sep. -0.71 -0.73 -0.72 -0.54 -0.17 0.56 1.41 0.78 -0.74 -0.66 -0.16 0.46 Oct. -0.74 -0.69 -0.62 -0.37 -0.07 0.62 1.43 0.45 -0.63 -0.46 0.03 0.34 Nov. -0.90 -0.85 -0.82 -0.64 -0.35 0.50 1.23 0.49 -0.81 -0.73 -0.30 0.07
Source: ECB calculations.1) Data refer to the changing composition of the euro area, see the General Notes.2) ECB calculations based on underlying data provided by Euro MTS Ltd and ratings provided by Fitch Ratings.
2.3 Stock market indices(index levels in points; period averages)
Dow Jones EURO STOXX indices United Japan
States Benchmark Main industry indices
Broad 50 Basic Consumer Consumer Oil and Financials Industrials Technology Utilities Telecoms Health care Standard Nikkeiindex materials services goods gas & Poor’s 225
500
1 2 3 4 5 6 7 8 9 10 11 12 13 14
2018 375.5 3,386.6 766.3 264.9 172.6 115.8 173.1 629.5 502.5 278.8 292.9 800.5 2,746.2 22,310.72019 373.6 3,435.2 731.7 270.8 183.7 111.9 155.8 650.9 528.2 322.0 294.2 772.7 2,915.5 21,697.22020 360.0 3,274.3 758.9 226.8 163.2 83.1 128.6 631.4 630.2 347.1 257.6 831.9 3,217.3 22,703.5
2021 May 443.8 4,003.6 959.5 290.0 183.0 94.8 167.8 808.7 811.7 384.1 278.3 870.2 4,169.6 28,517.1 June 455.3 4,105.8 958.5 305.3 188.6 97.4 168.5 831.8 850.4 375.9 287.2 883.4 4,238.5 28,943.2 July 453.8 4,062.6 979.0 300.5 190.2 91.2 162.2 835.4 875.2 372.0 290.2 896.1 4,363.7 28,118.8 Aug. 468.5 4,177.0 1,014.5 303.3 191.9 91.6 169.0 865.0 938.2 380.0 303.6 922.1 4,454.2 27,692.7 Sep. 465.5 4,158.3 993.9 295.0 188.1 93.9 169.0 863.3 969.5 371.3 294.8 917.5 4,449.6 29,893.6 Oct. 461.4 4,132.2 976.8 294.4 185.0 101.7 175.8 836.1 925.6 367.5 285.7 897.1 4,460.7 28,586.2 Nov. 478.7 4,306.4 1,020.6 311.7 191.9 100.4 176.9 859.8 1,002.3 380.2 286.3 933.0 4,668.9 29,370.6
Source: Refinitiv.
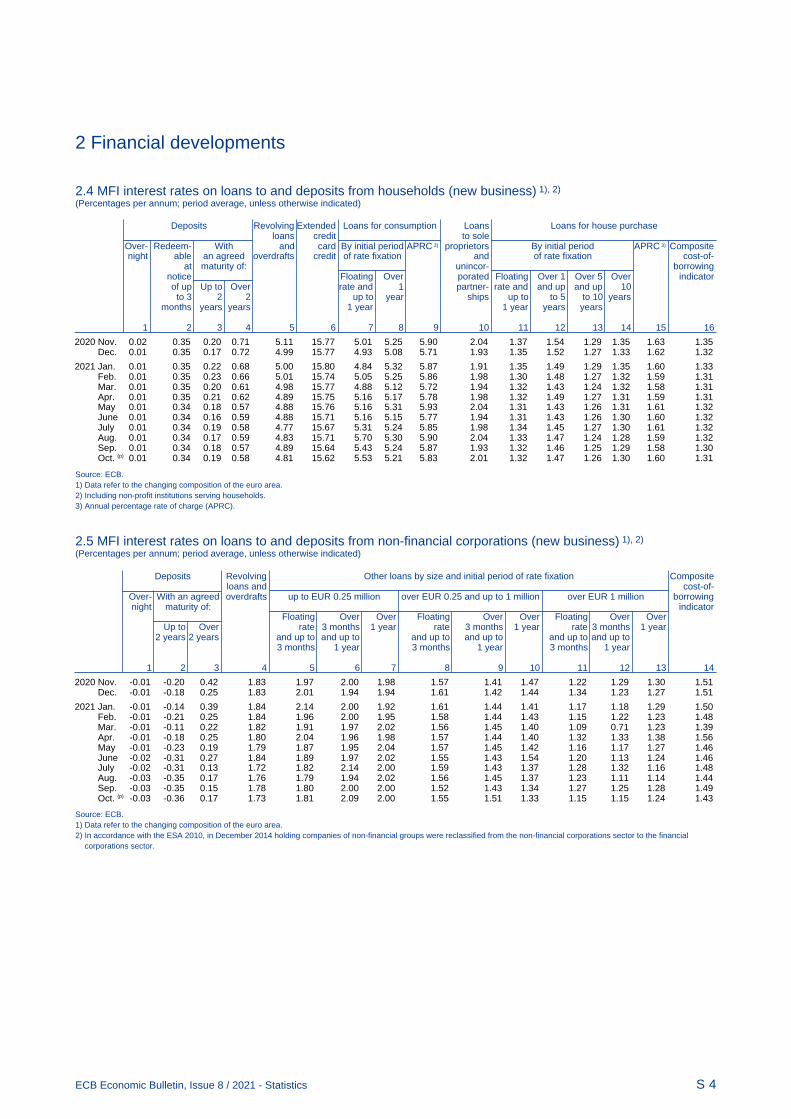
2 Financial developments
S 4ECB Economic Bulletin, Issue 8 / 2021 - Statistics
2.4 MFI interest rates on loans to and deposits from households (new business) 1), 2) (Percentages per annum; period average, unless otherwise indicated)
Deposits Revolving Extended Loans for consumption Loans Loans for house purchase
loans credit to sole Over- Redeem- With and card By initial period APRC 3) proprietors By initial period APRC 3) Compositenight able an agreed overdrafts credit of rate fixation and of rate fixation cost-of-
at maturity of: unincor- borrowingnotice Floating Over porated Floating Over 1 Over 5 Over indicatorof up Up to Over rate and 1 partner- rate and and up and up 10to 3 2 2 up to year ships up to to 5 to 10 years
months years years 1 year 1 year years years
1 2 3 4 5 6 7 8 9 10 11 12 13 14 15 16
2020 Nov. 0.02 0.35 0.20 0.71 5.11 15.77 5.01 5.25 5.90 2.04 1.37 1.54 1.29 1.35 1.63 1.35 Dec. 0.01 0.35 0.17 0.72 4.99 15.77 4.93 5.08 5.71 1.93 1.35 1.52 1.27 1.33 1.62 1.32
2021 Jan. 0.01 0.35 0.22 0.68 5.00 15.80 4.84 5.32 5.87 1.91 1.35 1.49 1.29 1.35 1.60 1.33 Feb. 0.01 0.35 0.23 0.66 5.01 15.74 5.05 5.25 5.86 1.98 1.30 1.48 1.27 1.32 1.59 1.31 Mar. 0.01 0.35 0.20 0.61 4.98 15.77 4.88 5.12 5.72 1.94 1.32 1.43 1.24 1.32 1.58 1.31 Apr. 0.01 0.35 0.21 0.62 4.89 15.75 5.16 5.17 5.78 1.98 1.32 1.49 1.27 1.31 1.59 1.31 May 0.01 0.34 0.18 0.57 4.88 15.76 5.16 5.31 5.93 2.04 1.31 1.43 1.26 1.31 1.61 1.32 June 0.01 0.34 0.16 0.59 4.88 15.71 5.16 5.15 5.77 1.94 1.31 1.43 1.26 1.30 1.60 1.32 July 0.01 0.34 0.19 0.58 4.77 15.67 5.31 5.24 5.85 1.98 1.34 1.45 1.27 1.30 1.61 1.32 Aug. 0.01 0.34 0.17 0.59 4.83 15.71 5.70 5.30 5.90 2.04 1.33 1.47 1.24 1.28 1.59 1.32 Sep. 0.01 0.34 0.18 0.57 4.89 15.64 5.43 5.24 5.87 1.93 1.32 1.46 1.25 1.29 1.58 1.30 Oct. (p) 0.01 0.34 0.19 0.58 4.81 15.62 5.53 5.21 5.83 2.01 1.32 1.47 1.26 1.30 1.60 1.31
Source: ECB.1) Data refer to the changing composition of the euro area.2) Including non-profit institutions serving households.3) Annual percentage rate of charge (APRC).
2.5 MFI interest rates on loans to and deposits from non-financial corporations (new business) 1), 2) (Percentages per annum; period average, unless otherwise indicated)
Deposits Revolving Other loans by size and initial period of rate fixation Composite
loans and cost-of-Over- With an agreed overdrafts up to EUR 0.25 million over EUR 0.25 and up to 1 million over EUR 1 million borrowingnight maturity of: indicator
Floating Over Over Floating Over Over Floating Over OverUp to Over rate 3 months 1 year rate 3 months 1 year rate 3 months 1 year
2 years 2 years and up to and up to and up to and up to and up to and up to3 months 1 year 3 months 1 year 3 months 1 year
1 2 3 4 5 6 7 8 9 10 11 12 13 14
2020 Nov. -0.01 -0.20 0.42 1.83 1.97 2.00 1.98 1.57 1.41 1.47 1.22 1.29 1.30 1.51 Dec. -0.01 -0.18 0.25 1.83 2.01 1.94 1.94 1.61 1.42 1.44 1.34 1.23 1.27 1.51
2021 Jan. -0.01 -0.14 0.39 1.84 2.14 2.00 1.92 1.61 1.44 1.41 1.17 1.18 1.29 1.50 Feb. -0.01 -0.21 0.25 1.84 1.96 2.00 1.95 1.58 1.44 1.43 1.15 1.22 1.23 1.48 Mar. -0.01 -0.11 0.22 1.82 1.91 1.97 2.02 1.56 1.45 1.40 1.09 0.71 1.23 1.39 Apr. -0.01 -0.18 0.25 1.80 2.04 1.96 1.98 1.57 1.44 1.40 1.32 1.33 1.38 1.56 May -0.01 -0.23 0.19 1.79 1.87 1.95 2.04 1.57 1.45 1.42 1.16 1.17 1.27 1.46 June -0.02 -0.31 0.27 1.84 1.89 1.97 2.02 1.55 1.43 1.54 1.20 1.13 1.24 1.46 July -0.02 -0.31 0.13 1.72 1.82 2.14 2.00 1.59 1.43 1.37 1.28 1.32 1.16 1.48 Aug. -0.03 -0.35 0.17 1.76 1.79 1.94 2.02 1.56 1.45 1.37 1.23 1.11 1.14 1.44 Sep. -0.03 -0.35 0.15 1.78 1.80 2.00 2.00 1.52 1.43 1.34 1.27 1.25 1.28 1.49 Oct. (p) -0.03 -0.36 0.17 1.73 1.81 2.09 2.00 1.55 1.51 1.33 1.15 1.15 1.24 1.43
Source: ECB.1) Data refer to the changing composition of the euro area.2) In accordance with the ESA 2010, in December 2014 holding companies of non-financial groups were reclassified from the non-financial corporations sector to the financial
corporations sector.

2 Financial developments
S 5ECB Economic Bulletin, Issue 8 / 2021 - Statistics
2.6 Debt securities issued by euro area residents, by sector of the issuer and initial maturity(EUR billions; transactions during the month and end-of-period outstanding amounts; nominal values)
Short-term
Outstanding amounts Gross issues 1)
Total MFIs Non-MFI corporations General government Total MFIs Non-MFI corporations General government
(including (including Euro- Financial Non- Central Other Euro- Financial Non- Central Other
system) corporations financial govern- general system) corporations financial govern- generalother than FVCs corporations ment govern- other than FVCs corporations ment govern-
MFIs ment MFIs ment
1 2 3 4 5 6 7 8 9 10 11 12 13 14
2018 1,215 503 170 . 72 424 47 389 171 66 . 41 76 352019 1,283 550 181 . 85 406 61 415 177 80 . 47 73 382020 1,530 455 145 . 98 714 118 455 177 70 . 45 114 49
2021 May 1,536 463 151 . 100 692 130 410 187 48 . 37 105 33 June 1,542 481 152 . 90 694 126 451 216 56 . 34 106 39 July 1,539 478 148 . 101 688 124 470 224 44 . 39 113 50 Aug. 1,538 493 146 . 99 678 121 415 232 40 . 25 93 25 Sep. 1,568 506 139 . 99 697 127 473 220 44 . 39 124 46 Oct. 1,517 478 133 . 103 686 117 418 202 39 . 41 105 32
Long-term
2018 15,748 3,688 3,162 . 1,249 7,022 627 228 64 68 . 15 75 62019 16,315 3,817 3,397 . 1,324 7,152 626 247 69 74 . 20 78 72020 17,290 3,892 3,203 . 1,464 8,006 725 296 68 71 . 27 114 16
2021 May 17,908 3,946 3,311 . 1,489 8,393 769 269 46 69 . 21 121 12 June 18,092 3,980 3,361 . 1,498 8,473 780 341 75 87 . 29 136 15 July 18,186 3,992 3,397 . 1,502 8,515 780 302 56 99 . 18 119 10 Aug. 18,222 3,990 3,398 . 1,500 8,554 779 134 27 34 . 4 66 3 Sep. 18,322 4,021 3,433 . 1,521 8,558 788 316 72 92 . 22 114 15 Oct. 18,407 4,038 3,499 . 1,530 8,553 787 293 64 102 . 22 92 13
Source: ECB.1) For the purpose of comparison, annual data refer to the average monthly figure over the year.
2.7 Growth rates and outstanding amounts of debt securities and listed shares(EUR billions; percentage changes)
Oustanding amount
Debt securities Listed shares
Total MFIs Non-MFI corporations General government Total MFIs Financial Non-
(including corporations financialEurosystem) Financial Non- Central Other other than corporations
corporations financial government general MFIsother than FVCs corporations government
MFIs
1 2 3 4 5 6 7 8 9 10 11
2018 16,962.7 4,190.4 3,332.4 . 1,320.6 7,445.8 673.5 7,023.4 465.0 1,099.2 5,459.22019 17,598.1 4,367.4 3,577.7 . 1,408.5 7,558.1 686.5 8,586.6 538.4 1,410.6 6,637.62020 18,819.0 4,346.8 3,347.6 . 1,561.1 8,720.3 843.3 8,448.2 469.3 1,321.5 6,657.4
2021 May 19,444.5 4,409.7 3,462.1 . 1,588.4 9,085.1 899.2 9,646.8 575.7 1,508.7 7,562.4 June 19,633.4 4,461.5 3,512.9 . 1,587.7 9,166.3 905.1 9,773.2 564.9 1,521.5 7,686.9 July 19,724.5 4,469.9 3,544.5 . 1,602.6 9,202.9 904.7 9,895.0 559.2 1,526.8 7,809.0 Aug. 19,759.4 4,483.2 3,544.4 . 1,599.5 9,232.7 899.6 10,166.4 587.9 1,612.9 7,965.7 Sep. 19,890.1 4,527.2 3,572.4 . 1,620.0 9,255.6 914.9 9,899.5 597.2 1,616.9 7,685.4 Oct. 19,924.3 4,516.5 3,631.8 . 1,632.7 9,239.3 904.0 10,296.1 613.8 1,701.4 7,980.9
Growth rate
2018 1.9 1.7 3.0 . 3.3 1.9 -4.3 0.7 0.3 2.4 0.42019 3.1 3.8 4.9 . 5.6 1.5 1.8 0.0 0.5 0.0 0.02020 7.5 1.2 2.7 . 12.4 10.9 24.3 1.1 0.1 3.1 0.8
2021 May 5.6 0.1 5.1 . 5.4 8.1 12.3 2.1 1.5 6.1 1.3 June 4.5 -0.3 4.4 . 4.1 6.6 9.7 2.3 1.9 6.4 1.5 July 4.6 0.3 5.2 . 3.7 6.1 10.1 2.3 1.9 6.5 1.5 Aug. 4.0 0.8 4.0 . 3.4 5.3 9.2 2.3 1.8 7.7 1.3 Sep. 4.1 1.1 4.6 . 3.7 5.0 8.6 2.4 1.8 8.0 1.4 Oct. 4.3 1.2 5.5 . 4.0 5.3 5.6 2.2 1.7 6.3 1.4
Source: ECB.
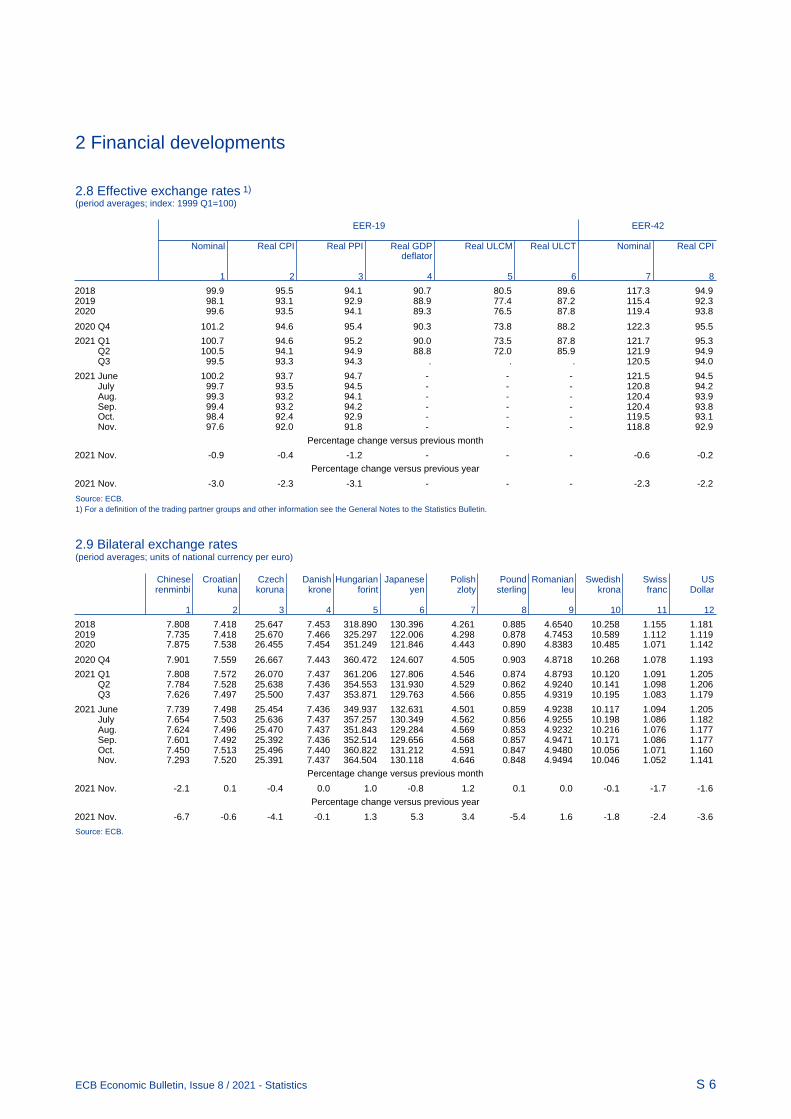
2 Financial developments
S 6ECB Economic Bulletin, Issue 8 / 2021 - Statistics
2.8 Effective exchange rates 1) (period averages; index: 1999 Q1=100)
EER-19 EER-42
Nominal Real CPI Real PPI Real GDP Real ULCM Real ULCT Nominal Real CPIdeflator
1 2 3 4 5 6 7 8
2018 99.9 95.5 94.1 90.7 80.5 89.6 117.3 94.92019 98.1 93.1 92.9 88.9 77.4 87.2 115.4 92.32020 99.6 93.5 94.1 89.3 76.5 87.8 119.4 93.8
2020 Q4 101.2 94.6 95.4 90.3 73.8 88.2 122.3 95.5
2021 Q1 100.7 94.6 95.2 90.0 73.5 87.8 121.7 95.3 Q2 100.5 94.1 94.9 88.8 72.0 85.9 121.9 94.9 Q3 99.5 93.3 94.3 . . . 120.5 94.0
2021 June 100.2 93.7 94.7 - - - 121.5 94.5 July 99.7 93.5 94.5 - - - 120.8 94.2 Aug. 99.3 93.2 94.1 - - - 120.4 93.9 Sep. 99.4 93.2 94.2 - - - 120.4 93.8 Oct. 98.4 92.4 92.9 - - - 119.5 93.1 Nov. 97.6 92.0 91.8 - - - 118.8 92.9
Percentage change versus previous month
2021 Nov. -0.9 -0.4 -1.2 - - - -0.6 -0.2
Percentage change versus previous year
2021 Nov. -3.0 -2.3 -3.1 - - - -2.3 -2.2
Source: ECB.1) For a definition of the trading partner groups and other information see the General Notes to the Statistics Bulletin.
2.9 Bilateral exchange rates(period averages; units of national currency per euro)
Chinese Croatian Czech Danish Hungarian Japanese Polish Pound Romanian Swedish Swiss USrenminbi kuna koruna krone forint yen zloty sterling leu krona franc Dollar
1 2 3 4 5 6 7 8 9 10 11 12
2018 7.808 7.418 25.647 7.453 318.890 130.396 4.261 0.885 4.6540 10.258 1.155 1.1812019 7.735 7.418 25.670 7.466 325.297 122.006 4.298 0.878 4.7453 10.589 1.112 1.1192020 7.875 7.538 26.455 7.454 351.249 121.846 4.443 0.890 4.8383 10.485 1.071 1.142
2020 Q4 7.901 7.559 26.667 7.443 360.472 124.607 4.505 0.903 4.8718 10.268 1.078 1.193
2021 Q1 7.808 7.572 26.070 7.437 361.206 127.806 4.546 0.874 4.8793 10.120 1.091 1.205 Q2 7.784 7.528 25.638 7.436 354.553 131.930 4.529 0.862 4.9240 10.141 1.098 1.206 Q3 7.626 7.497 25.500 7.437 353.871 129.763 4.566 0.855 4.9319 10.195 1.083 1.179
2021 June 7.739 7.498 25.454 7.436 349.937 132.631 4.501 0.859 4.9238 10.117 1.094 1.205 July 7.654 7.503 25.636 7.437 357.257 130.349 4.562 0.856 4.9255 10.198 1.086 1.182 Aug. 7.624 7.496 25.470 7.437 351.843 129.284 4.569 0.853 4.9232 10.216 1.076 1.177 Sep. 7.601 7.492 25.392 7.436 352.514 129.656 4.568 0.857 4.9471 10.171 1.086 1.177 Oct. 7.450 7.513 25.496 7.440 360.822 131.212 4.591 0.847 4.9480 10.056 1.071 1.160 Nov. 7.293 7.520 25.391 7.437 364.504 130.118 4.646 0.848 4.9494 10.046 1.052 1.141
Percentage change versus previous month
2021 Nov. -2.1 0.1 -0.4 0.0 1.0 -0.8 1.2 0.1 0.0 -0.1 -1.7 -1.6
Percentage change versus previous year
2021 Nov. -6.7 -0.6 -4.1 -0.1 1.3 5.3 3.4 -5.4 1.6 -1.8 -2.4 -3.6
Source: ECB.

2 Financial developments
S 7ECB Economic Bulletin, Issue 8 / 2021 - Statistics
2.10 Euro area balance of payments, financial account(EUR billions, unless otherwise indicated; outstanding amounts at end of period; transactions during period)
Outstanding amounts (international investment position)
Total 1) Direct Portfolio Net Other investment Reserve Memo:
investment investment financial assets Grossderivatives external
Assets Liabilities Net Assets Liabilities Assets Liabilities Assets Liabilities debt
1 2 3 4 5 6 7 8 9 10 11 12
2020 Q3 28,047.3 28,661.8 -614.5 11,135.6 9,375.6 9,995.2 12,597.2 -103.7 6,110.7 6,689.0 909.5 15,163.2 Q4 28,366.3 28,991.0 -624.7 11,051.2 9,359.9 10,692.6 12,893.1 -94.2 5,836.9 6,738.0 879.7 14,854.7
2021 Q1 29,644.2 30,313.3 -669.1 11,385.0 9,473.4 11,435.3 13,696.1 -134.1 6,108.5 7,143.7 849.4 15,485.7 Q2 30,098.3 30,694.6 -596.3 11,348.2 9,453.7 11,947.6 14,079.2 -126.2 6,059.7 7,161.7 869.0 15,399.0
Outstanding amounts as a percentage of GDP
2021 Q2 254.9 260.0 -5.1 96.1 80.1 101.2 119.2 -1.1 51.3 60.7 7.4 130.4
Transactions
2020 Q4 80.6 -48.2 128.8 -59.1 45.4 348.7 -225.1 -14.5 -196.6 131.5 2.1 -
2021 Q1 523.0 425.0 97.9 100.7 -7.1 266.3 178.8 6.4 152.6 253.4 -3.1 - Q2 184.3 83.6 100.7 -37.2 -38.0 227.6 67.0 8.5 -22.1 54.6 7.5 - Q3 335.8 290.2 45.6 30.2 -41.8 126.4 70.1 -7.3 63.4 261.8 123.2 -
2021 Apr. 200.6 193.9 6.7 30.1 12.1 56.4 33.1 4.5 109.0 148.8 0.7 - May 14.0 -26.3 40.3 -51.3 -58.4 75.2 -2.0 -2.1 -9.1 34.1 1.4 - June -30.4 -84.1 53.7 -16.0 8.3 96.0 35.9 6.2 -121.9 -128.2 5.3 - July 143.3 101.1 42.1 23.6 -10.4 22.6 41.1 8.9 88.5 70.4 -0.3 - Aug. 184.4 183.4 1.0 5.7 -8.8 44.8 22.6 -6.7 18.5 169.6 122.1 - Sep. 8.1 5.7 2.5 0.9 -22.6 58.9 6.4 -9.5 -43.6 21.9 1.5 -
12-month cumulated transactions
2021 Sep. 1,123.6 750.6 373.0 34.6 -41.6 969.0 90.8 -6.9 -2.7 701.4 129.6 -
12-month cumulated transactions as a percentage of GDP
2021 Sep. 9.4 6.3 3.1 0.3 -0.3 8.1 0.8 -0.1 0.0 5.8 1.1 -
Source: ECB.1) Net financial derivatives are included in total assets.
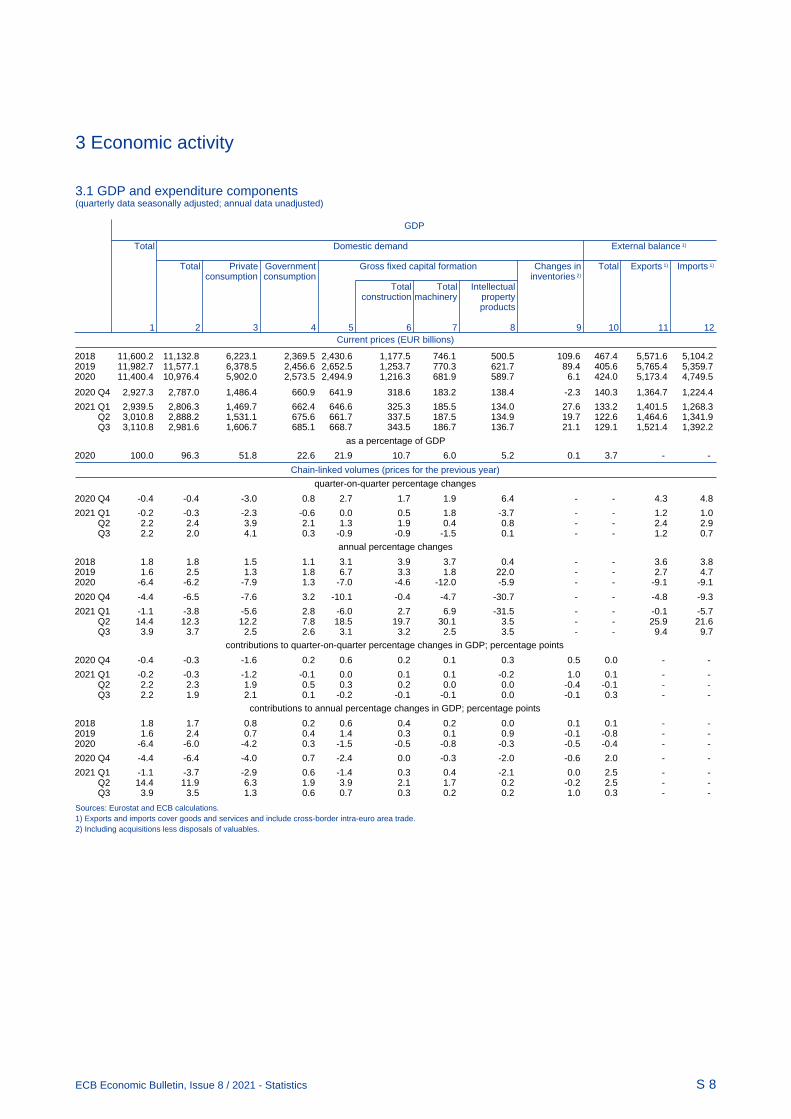
3 Economic activity
S 8ECB Economic Bulletin, Issue 8 / 2021 - Statistics
3.1 GDP and expenditure components(quarterly data seasonally adjusted; annual data unadjusted)
Current prices (EUR billions)
GDP
Total Domestic demand External balance 1)
Total Private Government Gross fixed capital formation Changes in Total Exports 1) Imports 1)
consumption consumption inventories 2)
Total Total Intellectualconstruction machinery property
products
1 2 3 4 5 6 7 8 9 10 11 12
2018 11,600.2 11,132.8 6,223.1 2,369.5 2,430.6 1,177.5 746.1 500.5 109.6 467.4 5,571.6 5,104.22019 11,982.7 11,577.1 6,378.5 2,456.6 2,652.5 1,253.7 770.3 621.7 89.4 405.6 5,765.4 5,359.72020 11,400.4 10,976.4 5,902.0 2,573.5 2,494.9 1,216.3 681.9 589.7 6.1 424.0 5,173.4 4,749.5
2020 Q4 2,927.3 2,787.0 1,486.4 660.9 641.9 318.6 183.2 138.4 -2.3 140.3 1,364.7 1,224.4
2021 Q1 2,939.5 2,806.3 1,469.7 662.4 646.6 325.3 185.5 134.0 27.6 133.2 1,401.5 1,268.3 Q2 3,010.8 2,888.2 1,531.1 675.6 661.7 337.5 187.5 134.9 19.7 122.6 1,464.6 1,341.9 Q3 3,110.8 2,981.6 1,606.7 685.1 668.7 343.5 186.7 136.7 21.1 129.1 1,521.4 1,392.2
as a percentage of GDP
2020 100.0 96.3 51.8 22.6 21.9 10.7 6.0 5.2 0.1 3.7 - -
Chain-linked volumes (prices for the previous year)
quarter-on-quarter percentage changes
2020 Q4 -0.4 -0.4 -3.0 0.8 2.7 1.7 1.9 6.4 - - 4.3 4.8
2021 Q1 -0.2 -0.3 -2.3 -0.6 0.0 0.5 1.8 -3.7 - - 1.2 1.0 Q2 2.2 2.4 3.9 2.1 1.3 1.9 0.4 0.8 - - 2.4 2.9 Q3 2.2 2.0 4.1 0.3 -0.9 -0.9 -1.5 0.1 - - 1.2 0.7
annual percentage changes
2018 1.8 1.8 1.5 1.1 3.1 3.9 3.7 0.4 - - 3.6 3.82019 1.6 2.5 1.3 1.8 6.7 3.3 1.8 22.0 - - 2.7 4.72020 -6.4 -6.2 -7.9 1.3 -7.0 -4.6 -12.0 -5.9 - - -9.1 -9.1
2020 Q4 -4.4 -6.5 -7.6 3.2 -10.1 -0.4 -4.7 -30.7 - - -4.8 -9.3
2021 Q1 -1.1 -3.8 -5.6 2.8 -6.0 2.7 6.9 -31.5 - - -0.1 -5.7 Q2 14.4 12.3 12.2 7.8 18.5 19.7 30.1 3.5 - - 25.9 21.6 Q3 3.9 3.7 2.5 2.6 3.1 3.2 2.5 3.5 - - 9.4 9.7
contributions to quarter-on-quarter percentage changes in GDP; percentage points
2020 Q4 -0.4 -0.3 -1.6 0.2 0.6 0.2 0.1 0.3 0.5 0.0 - -
2021 Q1 -0.2 -0.3 -1.2 -0.1 0.0 0.1 0.1 -0.2 1.0 0.1 - - Q2 2.2 2.3 1.9 0.5 0.3 0.2 0.0 0.0 -0.4 -0.1 - - Q3 2.2 1.9 2.1 0.1 -0.2 -0.1 -0.1 0.0 -0.1 0.3 - -
contributions to annual percentage changes in GDP; percentage points
2018 1.8 1.7 0.8 0.2 0.6 0.4 0.2 0.0 0.1 0.1 - - 2019 1.6 2.4 0.7 0.4 1.4 0.3 0.1 0.9 -0.1 -0.8 - - 2020 -6.4 -6.0 -4.2 0.3 -1.5 -0.5 -0.8 -0.3 -0.5 -0.4 - -
2020 Q4 -4.4 -6.4 -4.0 0.7 -2.4 0.0 -0.3 -2.0 -0.6 2.0 - -
2021 Q1 -1.1 -3.7 -2.9 0.6 -1.4 0.3 0.4 -2.1 0.0 2.5 - - Q2 14.4 11.9 6.3 1.9 3.9 2.1 1.7 0.2 -0.2 2.5 - - Q3 3.9 3.5 1.3 0.6 0.7 0.3 0.2 0.2 1.0 0.3 - -
Sources: Eurostat and ECB calculations.1) Exports and imports cover goods and services and include cross-border intra-euro area trade.2) Including acquisitions less disposals of valuables.

3 Economic activity
S 9ECB Economic Bulletin, Issue 8 / 2021 - Statistics
3.2 Value added by economic activity(quarterly data seasonally adjusted; annual data unadjusted)
Current prices (EUR billions)
Gross value added (basic prices) Taxes less
subsidiesTotal Agriculture, Manufacturing Const- Trade, Infor- Finance Real Professional, Public ad- Arts, enter- on
forestry and energy and ruction transport, mation and estate business and ministration, tainment productsfishing utilities accom- and com- insurance support education, and other
modation munica- services health and servicesand food tion social workservices
1 2 3 4 5 6 7 8 9 10 11 12
2018 10,395.4 175.4 2,055.6 525.8 1,963.1 499.9 477.2 1,170.0 1,210.2 1,960.3 358.0 1,204.82019 10,741.0 178.5 2,100.8 561.2 2,041.4 531.2 478.9 1,204.6 1,249.7 2,025.5 369.2 1,241.72020 10,268.7 176.6 1,971.0 552.4 1,799.8 544.9 469.0 1,210.9 1,168.0 2,054.1 321.8 1,131.7
2020 Q4 2,634.0 43.7 521.7 146.7 458.4 139.5 117.2 305.6 301.7 522.0 77.5 293.3
2021 Q1 2,646.9 44.0 532.9 145.9 455.7 141.4 118.5 305.9 302.1 523.2 77.2 292.6 Q2 2,700.4 45.2 535.9 150.3 480.5 144.8 118.2 308.4 305.8 530.6 80.6 310.4 Q3 2,781.8 45.1 545.5 150.5 519.4 146.2 118.9 310.8 315.8 541.3 88.4 329.0
as a percentage of value added
2020 100.0 1.7 19.2 5.4 17.5 5.3 4.6 11.8 11.4 20.0 3.1 -
Chain-linked volumes (prices for the previous year)
quarter-on-quarter percentage changes
2020 Q4 -0.4 0.6 3.5 2.0 -3.6 -1.0 -0.3 -0.4 1.7 -1.4 -11.5 0.0
2021 Q1 0.1 -2.8 1.0 -1.0 -1.0 2.0 1.3 -0.1 0.1 0.0 -0.4 -2.6 Q2 1.9 0.5 0.6 1.9 4.6 1.9 0.6 0.9 1.3 1.7 5.7 4.8 Q3 2.3 -1.0 0.1 -0.6 6.7 1.3 0.2 0.5 2.8 1.5 12.0 1.6
annual percentage changes
2018 1.8 -0.7 1.9 2.2 1.5 6.4 0.2 1.4 4.0 0.7 1.3 1.72019 1.6 1.7 0.2 2.1 2.5 5.7 0.4 1.5 1.7 1.1 1.7 1.62020 -6.3 -0.7 -6.8 -5.3 -13.7 1.2 -1.0 -0.8 -7.9 -2.9 -17.1 -6.5
2020 Q4 -4.5 -0.8 -1.2 -0.7 -12.8 1.2 -0.8 -0.7 -5.7 -1.5 -21.9 -3.6
2021 Q1 -1.3 -1.1 3.1 0.6 -8.1 3.6 1.4 0.1 -2.8 0.8 -16.5 0.4 Q2 14.3 -0.9 21.8 18.6 23.0 11.1 4.3 3.6 15.5 9.9 15.4 15.3 Q3 3.9 -2.7 5.2 2.2 6.5 4.1 1.8 0.9 6.1 1.9 4.2 3.8
contributions to quarter-on-quarter percentage changes in value added; percentage points
2020 Q4 -0.4 0.0 0.7 0.1 -0.6 -0.1 0.0 0.0 0.2 -0.3 -0.4 -
2021 Q1 0.1 0.0 0.2 -0.1 -0.2 0.1 0.1 0.0 0.0 0.0 0.0 - Q2 1.9 0.0 0.1 0.1 0.8 0.1 0.0 0.1 0.1 0.3 0.2 - Q3 2.3 0.0 0.0 0.0 1.2 0.1 0.0 0.1 0.3 0.3 0.4 -
contributions to annual percentage changes in value added; percentage points
2018 1.8 0.0 0.4 0.1 0.3 0.3 0.0 0.2 0.5 0.1 0.0 - 2019 1.6 0.0 0.0 0.1 0.5 0.3 0.0 0.2 0.2 0.2 0.1 - 2020 -6.3 0.0 -1.3 -0.3 -2.6 0.1 0.0 -0.1 -0.9 -0.5 -0.6 -
2020 Q4 -4.5 0.0 -0.2 0.0 -2.4 0.1 0.0 -0.1 -0.7 -0.3 -0.8 -
2021 Q1 -1.3 0.0 0.6 0.0 -1.5 0.2 0.1 0.0 -0.3 0.2 -0.6 - Q2 14.3 0.0 4.0 1.0 3.8 0.6 0.2 0.5 1.7 2.0 0.5 - Q3 3.9 0.0 1.0 0.1 1.2 0.2 0.1 0.1 0.7 0.4 0.1 -
Sources: Eurostat and ECB calculations.

3 Economic activity
S 10ECB Economic Bulletin, Issue 8 / 2021 - Statistics
3.3 Employment 1)
(quarterly data seasonally adjusted; annual data unadjusted)
Persons employed
Total By employment By economic activity
status
Employ- Self- Agricul- Manufac- Con- Trade, Infor- Finance Real Professional, Public adminis- Arts,ees employed ture, turing, struc- transport, mation and estate business and tration, edu- entertainment
forestry energy tion accom- and insur- support cation, health and otherand and modation com- ance services and services
fishing utilities and food munica- social workservices tion
1 2 3 4 5 6 7 8 9 10 11 12 13
as a percentage of total persons employed
2018 100.0 85.9 14.1 3.1 14.6 6.0 25.0 2.9 2.4 1.0 14.0 24.3 6.82019 100.0 86.0 14.0 3.0 14.6 6.1 25.0 2.9 2.4 1.0 14.0 24.3 6.72020 100.0 86.0 14.0 3.0 14.5 6.2 24.5 3.0 2.4 1.0 13.9 24.9 6.6
annual percentage changes
2018 1.6 1.9 0.0 -0.4 1.5 2.6 1.6 3.8 -1.0 2.4 2.8 1.4 0.32019 1.3 1.5 0.2 -2.4 1.1 2.5 1.5 3.3 0.0 1.7 1.4 1.4 0.52020 -1.5 -1.5 -1.7 -2.4 -1.8 0.7 -3.6 1.4 -0.5 -0.2 -2.4 0.9 -3.4
2020 Q4 -1.8 -1.8 -1.5 -1.5 -2.3 0.8 -4.7 1.6 -0.4 1.7 -2.2 1.2 -4.0
2021 Q1 -1.7 -1.8 -1.4 0.0 -2.2 1.4 -5.4 2.1 -0.5 1.3 -1.6 1.4 -4.8 Q2 2.0 2.4 -0.1 3.4 -0.4 4.8 0.5 4.6 0.7 2.2 4.5 2.7 1.6 Q3 2.0 2.3 0.5 0.9 0.3 3.0 1.5 5.5 0.7 1.4 4.4 2.1 1.0
Hours worked
as a percentage of total hours worked
2018 100.0 81.1 18.9 4.3 15.0 6.7 25.9 3.0 2.5 1.0 13.8 21.7 6.12019 100.0 81.3 18.7 4.1 14.9 6.8 25.9 3.1 2.4 1.0 13.9 21.7 6.12020 100.0 82.0 18.0 4.3 15.0 6.9 24.3 3.3 2.6 1.1 13.8 23.1 5.7
annual percentage changes
2018 1.8 2.2 0.0 -0.1 1.5 3.2 1.8 3.8 -0.9 3.1 3.1 1.2 0.72019 1.0 1.3 -0.2 -3.3 0.5 2.3 1.1 3.4 0.3 2.0 1.3 1.3 0.22020 -7.8 -7.0 -11.2 -2.6 -7.5 -6.3 -13.7 -1.7 -2.8 -6.6 -8.0 -2.0 -13.4
2020 Q4 -6.3 -5.8 -8.8 -1.2 -5.5 -2.9 -13.5 -0.5 -1.7 -2.6 -5.6 -0.7 -12.4
2021 Q1 -2.8 -3.1 -1.6 2.0 -1.4 4.9 -11.1 1.8 1.0 3.4 -1.8 2.1 -8.5 Q2 16.3 14.9 23.2 7.7 14.7 25.3 23.8 11.7 6.2 20.1 18.5 8.3 25.0 Q3 3.0 3.3 1.8 -0.2 2.2 2.7 3.9 7.5 1.3 4.7 6.3 1.3 1.1
Hours worked per person employed
annual percentage changes
2018 0.1 0.3 0.0 0.3 -0.1 0.5 0.2 0.1 0.1 0.7 0.3 -0.2 0.42019 -0.3 -0.2 -0.4 -1.0 -0.6 -0.2 -0.4 0.0 0.2 0.3 -0.1 -0.1 -0.22020 -6.3 -5.6 -9.7 -0.3 -5.8 -7.0 -10.5 -3.1 -2.3 -6.4 -5.8 -2.9 -10.4
2020 Q4 -4.7 -4.0 -7.4 0.3 -3.3 -3.6 -9.2 -2.1 -1.2 -4.2 -3.5 -1.9 -8.7
2021 Q1 -1.1 -1.3 -0.1 2.0 0.8 3.5 -6.0 -0.4 1.4 2.1 -0.2 0.6 -3.9 Q2 14.0 12.2 23.3 4.2 15.1 19.6 23.1 6.8 5.5 17.5 13.4 5.5 23.0 Q3 1.0 1.0 1.3 -1.1 1.9 -0.2 2.3 1.9 0.5 3.3 1.9 -0.8 0.1
Sources: Eurostat and ECB calculations.1) Data for employment are based on the ESA 2010.

3 Economic activity
S 11ECB Economic Bulletin, Issue 8 / 2021 - Statistics
3.4 Labour force, unemployment and job vacancies(seasonally adjusted, unless otherwise indicated)
Labour Under- Unemployment 1) Job
force, employ- vacancymillions ment, Total Long-term By age By gender rate 3)
% of unemploy- labour Millions % of ment, Adult Youth Male Female
force labour % offorce labour Millions % of Millions % of Millions % of Millions % of % of total
force 2) labour labour labour labour postsforce force force force
1 2 3 4 5 6 7 8 9 10 11 12 13 14
% of total 100.0 80.6 19.4 51.4 48.6 in 2020
2018 163.346 3.9 13.399 8.2 3.8 10.926 7.3 2.473 17.2 6.891 7.9 6.507 8.6 2.12019 164.125 3.6 12.419 7.6 3.3 10.114 6.8 2.306 16.0 6.363 7.3 6.056 7.9 2.22020 162.416 3.6 12.771 7.9 3.0 10.288 6.9 2.482 17.7 6.570 7.6 6.201 8.2 1.8
2020 Q4 163.149 3.6 13.107 8.0 3.2 10.630 7.1 2.478 17.8 6.751 7.8 6.356 8.3 1.9
2021 Q1 162.332 3.7 13.491 8.3 3.2 10.871 7.4 2.620 18.5 6.851 7.9 6.640 8.8 2.1 Q2 163.545 3.5 13.153 8.0 3.3 10.536 7.1 2.618 17.9 6.657 7.6 6.496 8.5 2.3 Q3 . . 12.306 7.5 . 9.917 6.6 2.389 16.3 6.232 7.1 6.074 7.9 2.6
2021 May - - 13.105 8.0 - 10.551 7.1 2.554 17.7 6.613 7.6 6.492 8.5 - June - - 12.787 7.8 - 10.265 6.9 2.522 17.3 6.431 7.4 6.356 8.3 - July - - 12.477 7.6 - 10.063 6.7 2.413 16.5 6.288 7.2 6.189 8.1 - Aug. - - 12.332 7.5 - 9.954 6.7 2.377 16.3 6.256 7.2 6.076 7.9 - Sep. - - 12.109 7.4 - 9.733 6.5 2.376 16.1 6.152 7.0 5.957 7.8 - Oct. - - 12.045 7.3 - 9.679 6.5 2.367 15.9 6.122 7.0 5.923 7.7 - Sources: Eurostat and ECB calculations.1) Where annual and quarterly Labour Force Survey data have not yet been published, they are estimated as simple averages of the monthly data. There is a break in series from
the first quarter of 2021 due to the implementation of the Integrated European Social Statistics Regulation. Owing to technical issues with the introduction of the new Germansystem of integrated household surveys, including the Labour Force Survey, the figures for the euro area include data from Germany, starting in the first quarter of 2020,which are not direct estimates from Labour Force Survey microdata, but based on a larger sample including data from other integrated household surveys.
2) Not seasonally adjusted.3) The job vacancy rate is equal to the number of job vacancies divided by the sum of the number of occupied posts and the number of job vacancies, expressed as a percentage.
Data are non-seasonally adjusted and cover industry, construction and services (excluding households as employers and extra-territorial organisations and bodies).
3.5 Short-term business statistics
Industrial production Con- Retail sales Services New
struction turnover 1) passenger Total Main Industrial Groupings produc- Total Food, Non-food Fuel car regis-
(excluding construction) tion beverages, trationstobacco
Manu- Inter- Capital Consumer Energyfacturing mediate goods goods
goods
1 2 3 4 5 6 7 8 9 10 11 12 13
% of total 100.0 88.7 32.1 34.5 21.8 11.6 100.0 100.0 40.4 52.5 7.1 100.0 100.0in 2015
annual percentage changes
2018 0.8 1.0 0.6 1.2 1.5 -1.4 1.7 1.6 1.4 2.0 0.7 4.9 0.92019 -1.3 -1.3 -2.4 -1.8 1.4 -2.1 2.1 2.4 1.0 3.7 0.8 3.0 1.82020 -8.6 -9.0 -7.4 -13.2 -4.7 -5.2 -5.7 -0.9 3.6 -2.4 -14.4 -8.7 -25.0
2020 Q4 -1.5 -1.6 1.5 -3.2 -2.6 -1.8 -1.2 1.6 4.5 1.3 -13.8 -5.9 -9.2
2021 Q1 3.5 3.6 4.8 5.2 0.5 0.6 2.9 2.4 2.6 3.2 -5.2 0.1 3.4 Q2 22.4 24.1 25.4 29.1 17.4 7.7 17.8 11.9 2.0 18.7 29.7 25.1 53.8 Q3 5.9 6.6 7.6 5.4 7.7 0.5 0.7 2.4 0.2 4.0 3.5 13.1 -23.5
2021 May 20.5 22.2 24.0 27.2 14.2 6.2 12.6 8.8 0.2 14.2 28.6 25.1 49.5 June 10.5 11.3 15.9 6.8 12.8 3.3 4.1 5.7 2.1 7.5 11.9 25.1 5.4 July 7.7 8.4 11.2 6.1 9.2 1.5 2.2 3.3 1.2 4.9 4.2 13.1 -22.0 Aug. 4.9 5.7 6.7 3.2 7.5 -0.5 -2.6 1.3 -1.4 3.3 1.4 13.1 -24.8 Sep. 5.1 5.6 4.9 6.2 6.6 0.5 1.5 2.6 0.8 3.7 4.8 13.1 -24.2 Oct. 3.3 3.9 2.1 5.2 6.3 -1.0 . 1.4 -1.2 2.5 8.5 . -28.6
month-on-month percentage changes (s.a.)
2021 May -1.1 -0.8 -0.1 -2.5 -1.7 -2.5 0.2 4.2 -0.5 8.8 8.0 - 1.8 June 0.3 0.2 0.1 -1.4 3.0 -0.4 -0.9 1.9 -1.2 3.6 2.5 - -0.4 July 1.2 1.3 0.3 2.7 1.2 -0.4 -0.9 -2.2 -0.5 -3.8 0.9 - -5.9 Aug. -1.7 -1.9 -1.4 -3.5 -1.9 0.6 -1.4 0.9 -0.8 2.4 -0.5 - -3.8 Sep. -0.2 -0.3 -0.2 -0.4 0.6 0.4 0.9 -0.4 0.8 -1.9 1.0 - 3.4 Oct. 1.1 1.2 -0.6 3.0 0.5 0.1 . 0.2 -0.1 0.4 1.3 - -3.1Sources: Eurostat, ECB calculations, ECB experimental statistics (col. 8) and European Automobile Manufacturers Association (col. 13).1) Including wholesale trade.

3 Economic activity
S 12ECB Economic Bulletin, Issue 8 / 2021 - Statistics
3.6 Opinion surveys(seasonally adjusted)
European Commission Business and Consumer Surveys Purchasing Managers’ Surveys
(percentage balances, unless otherwise indicated) (diffusion indices)
Economic Manufacturing industry Consumer Construction Retail Service industries Purchasing Manu- Business Compositesentiment confidence confidence trade Managers’ facturing activity outputindicator Industrial Capacity indicator indicator confid- Services Capacity Index (PMI) output for
(long-term confidence utilisation ence confidence utilisation for manu- servicesaverage indicator (%) indicator indicator (%) facturing
= 100)
1 2 3 4 5 6 7 8 9 10 11 12
1999-15 99.3 -5.2 80.6 -11.6 -15.4 -8.6 7.3 - 51.2 52.5 53.0 52.8
2018 111.8 6.7 83.7 -4.8 7.2 1.3 15.2 90.4 54.9 54.7 54.5 54.62019 103.7 -5.2 82.0 -6.9 6.7 -0.5 10.8 90.5 47.4 47.8 52.7 51.32020 88.2 -14.4 74.0 -14.3 -7.4 -12.9 -16.5 86.3 48.6 48.0 42.5 44.0
2020 Q4 91.4 -8.8 76.9 -15.6 -8.3 -10.9 -15.4 85.7 54.6 56.7 45.0 48.1
2021 Q1 95.3 -2.4 80.0 -13.7 -5.9 -16.6 -14.8 85.8 58.4 58.5 46.9 49.9 Q2 114.3 11.7 82.7 -5.5 4.4 0.7 10.5 87.2 63.1 62.7 54.7 56.8 Q3 118.1 14.2 82.5 -4.6 5.7 3.5 16.9 88.5 60.9 58.6 58.4 58.4
2021 June 117.9 12.8 - -3.3 5.2 4.7 17.9 - 63.4 62.6 58.3 59.5 July 119.0 14.5 83.0 -4.4 4.0 4.4 18.9 88.0 62.8 61.1 59.8 60.2 Aug. 117.6 13.8 - -5.3 5.5 4.6 16.8 - 61.4 59.0 59.0 59.0 Sep. 117.8 14.1 - -4.0 7.5 1.4 15.2 - 58.6 55.6 56.4 56.2 Oct. 118.6 14.2 82.1 -4.8 8.6 1.9 18.0 88.9 58.3 53.3 54.6 54.2 Nov. 117.5 14.1 - -6.8 9.0 3.7 18.4 - 58.4 53.8 55.9 55.4
Sources: European Commission (Directorate-General for Economic and Financial Affairs) (col. 1-8) and Markit (col. 9-12).
3.7 Summary accounts for households and non-financial corporations(current prices, unless otherwise indicated; not seasonally adjusted)
Households Non-financial corporations
Saving Debt Real gross Financial Non-financial Net Hous- Profit Saving Debt Financial Non-financial Finan-ratio ratio disposable investment investment worth ing share 3) ratio ratio 4) investment investment cing
(gross) income (gross) 2) wealth (net) (gross)
Percentage of gross Percentage of net Percent- disposable income Annual percentage changes value added age of Annual percentage changes
(adjusted) 1) GDP
1 2 3 4 5 6 7 8 9 10 11 12 13
2018 12.5 93.0 1.9 1.9 6.2 2.5 4.6 35.5 5.9 75.2 2.0 7.6 1.52019 13.1 93.3 1.9 2.7 3.8 6.0 3.9 35.3 6.3 74.9 1.9 7.9 1.82020 19.5 96.1 -0.5 4.1 -3.5 5.0 4.7 31.2 4.5 82.0 3.3 -14.7 2.0
2020 Q3 17.8 95.3 0.8 3.7 -1.3 3.7 4.2 31.5 4.4 81.8 2.7 -15.1 2.0 Q4 19.5 96.1 0.2 4.1 1.8 5.0 4.7 31.2 4.5 82.0 3.3 -20.9 2.0
2021 Q1 20.6 96.5 -0.2 4.6 10.6 7.3 4.6 32.3 5.8 83.1 4.0 -10.5 2.2 Q2 19.1 96.6 3.3 4.1 30.0 6.3 4.8 34.2 7.8 80.5 4.5 20.8 2.3
Sources: ECB and Eurostat.1) Based on four-quarter cumulated sums of saving, debt and gross disposable income (adjusted for the change in pension entitlements).2) Financial assets (net of financial liabilities) and non-financial assets. Non-financial assets consist mainly of housing wealth (residential structures and land). They also include
non-financial assets of unincorporated enterprises classified within the household sector.3) The profit share uses net entrepreneurial income, which is broadly equivalent to current profits in business accounting. 4) Defined as consolidated loans and debt securities liabilities.

3 Economic activity
S 13ECB Economic Bulletin, Issue 8 / 2021 - Statistics
3.8 Euro area balance of payments, current and capital accounts(EUR billions; seasonally adjusted unless otherwise indicated; transactions)
Current account Capital
account 1) Total Goods Services Primary income Secondary income
Credit Debit Balance Credit Debit Credit Debit Credit Debit Credit Debit Credit Debit
1 2 3 4 5 6 7 8 9 10 11 12 13
2020 Q4 1,021.2 930.4 90.8 581.6 479.6 225.5 197.6 183.3 173.9 30.7 79.3 23.8 24.6
2021 Q1 1,050.7 945.3 105.5 602.3 496.9 226.5 203.5 191.2 169.0 30.8 75.8 15.4 12.4 Q2 1,073.4 1,007.8 65.6 617.7 536.1 232.5 212.4 193.8 188.1 29.4 71.2 17.2 11.6 Q3 1,079.2 1,021.1 58.1 620.2 559.7 243.7 227.1 175.4 160.0 39.9 74.2 23.2 11.6
2021 Apr. 354.3 336.7 17.6 203.2 176.6 77.1 71.5 63.4 64.9 10.7 23.7 4.6 3.6 May 360.3 342.1 18.2 208.5 180.6 77.0 72.0 65.7 65.6 9.0 23.9 5.3 3.0 June 358.9 329.0 29.9 206.1 178.9 78.4 68.8 64.7 57.7 9.7 23.6 7.3 4.9 July 357.2 334.9 22.3 208.8 183.3 79.3 72.5 59.1 55.2 10.1 23.8 6.7 4.8 Aug. 362.1 345.0 17.1 204.5 186.0 80.5 81.1 57.8 53.1 19.3 24.9 7.1 2.8 Sep. 359.9 341.2 18.7 206.9 190.4 83.9 73.6 58.5 51.6 10.5 25.5 9.5 4.1
12-month cumulated transactions
2021 Sep. 4,224.6 3,904.6 320.0 2,421.8 2,072.3 928.3 840.6 743.7 691.1 130.8 300.6 79.7 60.2
12-month cumulated transactions as a percentage of GDP
2021 Sep. 35.2 32.6 2.7 20.2 17.3 7.7 7.0 6.2 5.8 1.1 2.5 0.7 0.5
1) The capital account is not seasonally adjusted.
3.9 Euro area external trade in goods 1) , values and volumes by product group 2) (seasonally adjusted, unless otherwise indicated)
Values (EUR billions; annual percentage changes for columns 1 and 2)
Total (n.s.a.) Exports (f.o.b.) Imports (c.i.f.)
Total Memo item: Total Memo items:
Exports Imports Intermediate Capital Consump- Manu- Intermediate Capital Consump- Manu- Oilgoods goods tion facturing goods goods tion facturing
goods goods
1 2 3 4 5 6 7 8 9 10 11 12 13
2020 Q4 -2.6 -5.5 569.3 265.7 114.6 178.5 480.2 494.0 262.2 87.0 135.7 381.4 35.3
2021 Q1 0.6 0.2 582.1 280.6 115.0 174.6 487.8 512.9 285.1 91.5 129.8 383.4 47.1 Q2 34.2 33.9 595.3 290.8 116.9 176.3 492.5 558.0 322.5 92.2 135.4 404.3 53.5 Q3 13.4 22.5 604.8 . . . 498.5 575.8 . . . 412.1 .
2021 Apr. 46.7 38.3 198.1 95.2 39.7 60.0 164.4 185.2 106.4 30.7 45.9 133.7 17.1 May 34.8 35.0 199.3 97.5 39.0 58.8 164.5 186.1 107.7 30.8 44.7 135.4 18.3 June 23.7 28.9 197.9 98.1 38.3 57.4 163.5 186.8 108.4 30.7 44.8 135.2 18.2 July 11.9 17.9 201.1 99.1 40.5 57.1 166.6 187.9 111.4 30.4 43.5 134.2 19.6 Aug. 19.2 28.5 202.2 102.7 39.1 56.2 166.2 192.5 113.5 31.4 44.8 139.9 19.3 Sep. 10.0 21.6 201.4 . . . 165.6 195.3 . . . 138.0 .
Volume indices (2000 = 100; annual percentage changes for columns 1 and 2)
2020 Q4 -1.4 -0.8 104.4 105.9 99.9 106.6 103.8 105.7 102.8 107.8 111.4 109.6 84.7
2021 Q1 0.8 0.1 104.5 108.5 100.8 101.8 104.0 105.0 103.5 112.6 105.5 108.3 85.8 Q2 29.1 20.3 104.5 108.9 101.7 101.1 103.2 109.6 109.9 113.8 108.0 111.9 84.9 Q3 . . . . . . . . . . . . .
2021 Mar. 11.4 15.0 105.7 110.5 100.3 102.5 103.1 108.5 107.8 118.6 108.9 111.5 84.5 Apr. 41.9 25.2 104.6 107.7 104.0 102.9 103.5 110.0 110.8 113.0 109.4 111.2 84.0 May 29.3 20.4 104.8 109.4 101.1 101.4 103.3 109.9 110.4 113.9 107.2 112.6 87.4 June 18.9 15.9 104.1 109.8 100.0 99.1 102.8 109.1 108.7 114.4 107.2 111.8 83.4 July 4.8 3.1 104.0 108.7 104.1 96.8 102.8 106.4 107.7 109.2 102.6 108.2 85.8 Aug. 9.0 10.9 103.0 110.4 99.8 94.5 101.0 108.0 108.3 114.0 104.3 112.2 84.4
Sources: ECB and Eurostat.1) Differences between ECB’s b.o.p. goods (Table 3.8) and Eurostat’s trade in goods (Table 3.9) are mainly due to different definitions.2) Product groups as classified in the Broad Economic Categories.
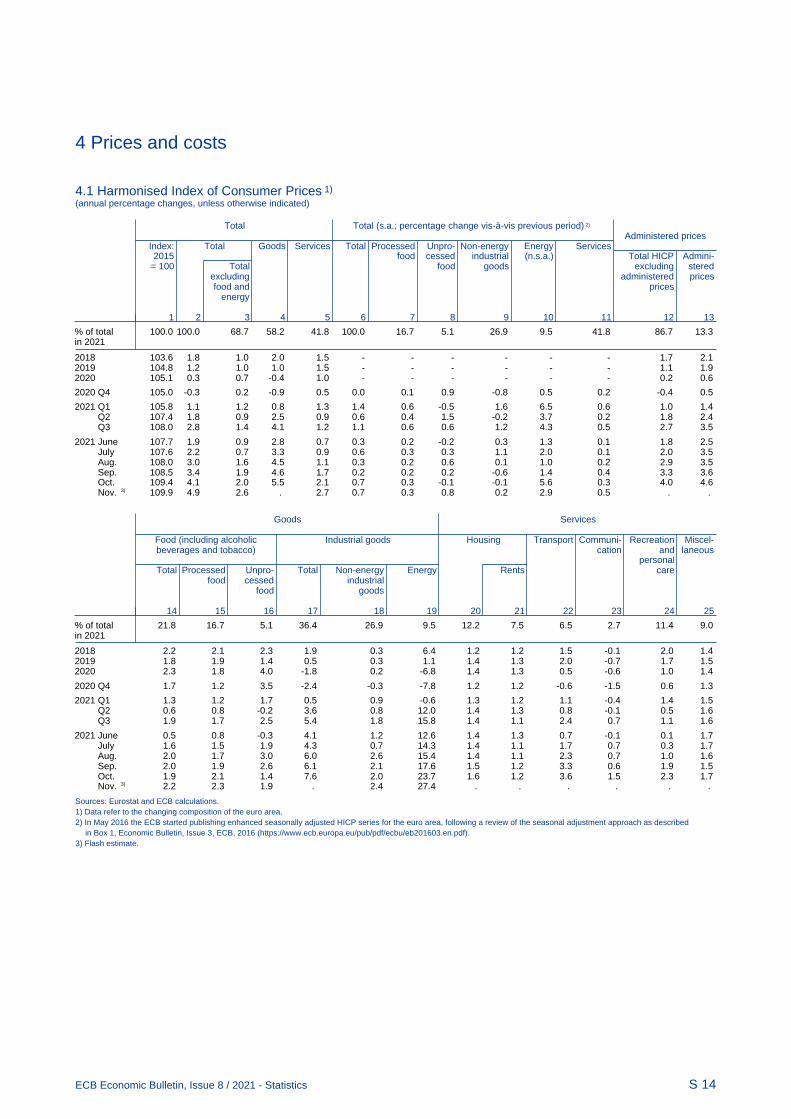
4 Prices and costs
S 14ECB Economic Bulletin, Issue 8 / 2021 - Statistics
4.1 Harmonised Index of Consumer Prices 1)
(annual percentage changes, unless otherwise indicated)
Total Total (s.a.; percentage change vis-à-vis previous period) 2)
Administered pricesIndex: Total Goods Services Total Processed Unpro- Non-energy Energy Services2015 food cessed industrial (n.s.a.) Total HICP Admini-
= 100 Total food goods excluding steredexcluding administered pricesfood and prices
energy
1 2 3 4 5 6 7 8 9 10 11 12 13
% of total 100.0 100.0 68.7 58.2 41.8 100.0 16.7 5.1 26.9 9.5 41.8 86.7 13.3in 2021
2018 103.6 1.8 1.0 2.0 1.5 - - - - - - 1.7 2.12019 104.8 1.2 1.0 1.0 1.5 - - - - - - 1.1 1.92020 105.1 0.3 0.7 -0.4 1.0 - - - - - - 0.2 0.6
2020 Q4 105.0 -0.3 0.2 -0.9 0.5 0.0 0.1 0.9 -0.8 0.5 0.2 -0.4 0.5
2021 Q1 105.8 1.1 1.2 0.8 1.3 1.4 0.6 -0.5 1.6 6.5 0.6 1.0 1.4 Q2 107.4 1.8 0.9 2.5 0.9 0.6 0.4 1.5 -0.2 3.7 0.2 1.8 2.4 Q3 108.0 2.8 1.4 4.1 1.2 1.1 0.6 0.6 1.2 4.3 0.5 2.7 3.5
2021 June 107.7 1.9 0.9 2.8 0.7 0.3 0.2 -0.2 0.3 1.3 0.1 1.8 2.5 July 107.6 2.2 0.7 3.3 0.9 0.6 0.3 0.3 1.1 2.0 0.1 2.0 3.5 Aug. 108.0 3.0 1.6 4.5 1.1 0.3 0.2 0.6 0.1 1.0 0.2 2.9 3.5 Sep. 108.5 3.4 1.9 4.6 1.7 0.2 0.2 0.2 -0.6 1.4 0.4 3.3 3.6 Oct. 109.4 4.1 2.0 5.5 2.1 0.7 0.3 -0.1 -0.1 5.6 0.3 4.0 4.6 Nov. 3) 109.9 4.9 2.6 . 2.7 0.7 0.3 0.8 0.2 2.9 0.5 . .
Goods Services
Food (including alcoholic Industrial goods Housing Transport Communi- Recreation Miscel- beverages and tobacco) cation and laneous
personalTotal Processed Unpro- Total Non-energy Energy Rents care
food cessed industrialfood goods
14 15 16 17 18 19 20 21 22 23 24 25
% of total 21.8 16.7 5.1 36.4 26.9 9.5 12.2 7.5 6.5 2.7 11.4 9.0in 2021
2018 2.2 2.1 2.3 1.9 0.3 6.4 1.2 1.2 1.5 -0.1 2.0 1.42019 1.8 1.9 1.4 0.5 0.3 1.1 1.4 1.3 2.0 -0.7 1.7 1.52020 2.3 1.8 4.0 -1.8 0.2 -6.8 1.4 1.3 0.5 -0.6 1.0 1.4
2020 Q4 1.7 1.2 3.5 -2.4 -0.3 -7.8 1.2 1.2 -0.6 -1.5 0.6 1.3
2021 Q1 1.3 1.2 1.7 0.5 0.9 -0.6 1.3 1.2 1.1 -0.4 1.4 1.5 Q2 0.6 0.8 -0.2 3.6 0.8 12.0 1.4 1.3 0.8 -0.1 0.5 1.6 Q3 1.9 1.7 2.5 5.4 1.8 15.8 1.4 1.1 2.4 0.7 1.1 1.6
2021 June 0.5 0.8 -0.3 4.1 1.2 12.6 1.4 1.3 0.7 -0.1 0.1 1.7 July 1.6 1.5 1.9 4.3 0.7 14.3 1.4 1.1 1.7 0.7 0.3 1.7 Aug. 2.0 1.7 3.0 6.0 2.6 15.4 1.4 1.1 2.3 0.7 1.0 1.6 Sep. 2.0 1.9 2.6 6.1 2.1 17.6 1.5 1.2 3.3 0.6 1.9 1.5 Oct. 1.9 2.1 1.4 7.6 2.0 23.7 1.6 1.2 3.6 1.5 2.3 1.7 Nov. 3) 2.2 2.3 1.9 . 2.4 27.4 . . . . . .
Sources: Eurostat and ECB calculations.1) Data refer to the changing composition of the euro area.2) In May 2016 the ECB started publishing enhanced seasonally adjusted HICP series for the euro area, following a review of the seasonal adjustment approach as described
in Box 1, Economic Bulletin, Issue 3, ECB, 2016 (https://www.ecb.europa.eu/pub/pdf/ecbu/eb201603.en.pdf).3) Flash estimate.

4 Prices and costs
S 15ECB Economic Bulletin, Issue 8 / 2021 - Statistics
4.2 Industry, construction and property prices(annual percentage changes, unless otherwise indicated)
Industrial producer prices excluding construction 1) Con- Residential Experimental
struction property indicator ofTotal Total Industry excluding construction and energy Energy 2) prices 3) commercial
(index: property2015 = 100) Manu- Total Intermediate Capital Consumer goods prices 3)
facturing goods goodsTotal Food, Non-
beverages foodand tobacco
1 2 3 4 5 6 7 8 9 10 11 12 13
% of total 100.0 100.0 77.3 72.1 28.9 20.7 22.5 16.5 5.9 27.9 in 2015
2018 104.1 3.3 2.4 1.5 2.7 1.0 0.4 0.1 0.6 8.4 2.5 4.9 4.12019 104.7 0.6 0.6 0.8 0.1 1.5 1.0 1.1 0.9 -0.1 1.9 4.2 4.52020 102.0 -2.6 -1.7 -0.1 -1.6 0.9 1.0 1.1 0.6 -9.7 1.3 5.4 1.7
2020 Q4 102.6 -1.7 -1.7 0.0 -0.6 0.8 0.0 -0.5 0.7 -6.7 1.6 6.0 -0.9
2021 Q1 105.9 2.1 1.3 1.4 2.7 1.0 0.0 -0.7 0.7 3.8 2.6 6.1 -1.3 Q2 109.4 9.2 6.8 4.7 9.0 1.7 1.8 1.8 1.2 23.7 4.5 7.2 -2.8 Q3 115.6 14.0 9.3 7.4 14.1 3.0 2.8 2.9 2.1 34.3 . . .
2021 May 109.3 9.6 7.2 4.9 9.3 1.8 2.0 1.9 1.3 25.1 - - - June 110.9 10.3 7.4 5.6 10.7 2.0 2.4 2.6 1.4 25.5 - - - July 113.7 12.4 8.4 6.8 12.8 2.5 2.7 2.8 1.9 30.1 - - - Aug. 114.9 13.4 9.2 7.4 14.3 3.1 2.8 2.8 2.2 31.9 - - - Sep. 118.1 16.1 10.3 8.1 15.2 3.6 3.0 3.1 2.3 40.8 - - - Oct. 124.5 21.9 11.8 8.9 16.8 3.9 3.4 3.2 2.8 62.5 - - -
Sources: Eurostat, ECB calculations, and ECB calculations based on MSCI data and national sources (col. 13).1) Domestic sales only.2) Input prices for residential buildings.3) Experimental data based on non-harmonised sources (see https://www.ecb.europa.eu/stats/ecb_statistics/governance_and_quality_framework/html/experimental-data.en.html
for further details).
4.3 Commodity prices and GDP deflators(annual percentage changes, unless otherwise indicated)
GDP deflators Oil prices Non-energy commodity prices (EUR)
(EUR per Total Total Domestic demand Exports 1) Imports 1) barrel) Import-weighted 2) Use-weighted 2) (s.a.;
index: Total Private Govern- Gross Total Food Non-food Total Food Non-food2015 consump- ment fixed
= 100) tion consump- capitaltion formation
1 2 3 4 5 6 7 8 9 10 11 12 13 14 15
% of total 100.0 45.4 54.6 100.0 50.4 49.6
2018 103.6 1.5 1.8 1.5 1.9 1.9 1.5 2.2 60.4 -0.9 -6.3 4.3 -0.6 -6.2 5.72019 105.3 1.7 1.5 1.1 1.8 2.3 0.8 0.3 57.2 2.0 4.4 -0.1 3.0 8.3 -2.32020 107.1 1.6 1.1 0.5 3.5 1.2 -1.3 -2.6 37.0 1.5 3.4 -0.3 -0.9 -0.1 -1.8
2020 Q4 107.4 1.2 0.9 0.0 2.8 0.5 -1.4 -2.6 37.4 4.1 0.1 7.9 -0.5 -6.1 6.2
2021 Q1 108.1 1.5 1.6 1.0 2.4 1.1 0.8 0.8 50.4 18.3 9.1 27.3 14.0 5.1 24.6 Q2 108.3 0.5 1.5 1.5 -1.3 2.4 4.3 7.0 57.0 38.3 20.1 56.4 35.6 20.2 54.4 Q3 109.5 2.7 3.5 2.6 2.9 4.3 7.0 9.5 61.9 31.1 26.2 35.4 32.3 28.2 36.7
2021 June - - - - - - - - 60.7 38.2 22.2 53.4 35.9 21.9 52.1 July - - - - - - - - 62.9 36.9 26.8 46.0 36.1 27.4 45.5 Aug. - - - - - - - - 59.5 29.8 28.7 30.7 31.6 31.4 31.8 Sep. - - - - - - - - 63.4 26.7 23.1 29.9 29.4 26.0 33.0 Oct. - - - - - - - - 72.1 33.7 27.3 39.7 35.2 28.5 42.7 Nov. - - - - - - - - 70.8 29.8 30.9 28.7 33.0 35.1 30.8
Sources: Eurostat, ECB calculations and Bloomberg (col. 9).1) Deflators for exports and imports refer to goods and services and include cross-border trade within the euro area.2) Import-weighted: weighted according to 2009-11 average import structure; use-weighted: weighted according to 2009-11 average domestic demand structure.

4 Prices and costs
S 16ECB Economic Bulletin, Issue 8 / 2021 - Statistics
4.4 Price-related opinion surveys(seasonally adjusted)
European Commission Business and Consumer Surveys Purchasing Managers’ Surveys
(percentage balances) (diffusion indices)
Selling price expectations Consumer Input prices Prices charged (for next three months) price trends
over pastManu- Retail trade Services Construction 12 months Manu- Services Manu- Services
facturing facturing facturing
1 2 3 4 5 6 7 8 9
1999-15 4.3 5.6 - -4.5 32.3 56.7 56.3 - 49.7
2018 11.5 7.5 9.6 12.6 20.6 65.4 57.9 56.1 52.72019 4.2 7.3 9.1 7.5 18.2 48.8 57.1 50.4 52.42020 -1.3 1.6 -0.8 -5.8 10.9 49.0 52.1 48.7 47.2
2020 Q4 1.6 2.6 -2.7 -7.8 7.0 56.7 52.6 51.6 48.3
2021 Q1 10.7 5.0 -1.8 -3.8 8.1 74.0 54.0 56.5 48.6 Q2 30.0 18.2 8.5 15.7 20.4 85.9 60.1 68.2 53.1 Q3 37.0 28.0 12.3 26.1 35.0 87.7 63.8 70.3 55.1
2021 June 36.0 23.1 10.9 21.9 24.7 88.5 63.2 71.1 55.6 July 35.5 26.1 12.2 25.7 31.2 89.2 63.1 71.9 55.4 Aug. 37.2 27.3 11.7 27.8 34.4 87.0 63.3 68.6 54.7 Sep. 38.3 30.6 13.1 24.8 39.3 86.9 65.2 70.4 55.1 Oct. 42.3 36.9 16.6 32.7 46.3 89.5 67.5 72.6 55.8 Nov. 49.0 44.5 19.8 37.8 52.5 88.9 71.4 73.7 57.8
Sources: European Commission (Directorate-General for Economic and Financial Affairs) and Markit.
4.5 Labour cost indices(annual percentage changes, unless otherwise indicated)
Total Total By component For selected economic activities Memo item:
(index: Indicator of2016 = 100) Wages and Employers’ social Business economy Mainly non-business negotiated
salaries contributions economy wages 1)
1 2 3 4 5 6 7
% of total 100.0 100.0 75.3 24.7 69.0 31.0 in 2018
2018 104.4 2.5 2.3 3.2 2.6 2.3 2.02019 106.9 2.4 2.6 2.1 2.4 2.5 2.22020 110.2 3.1 3.7 1.2 2.7 3.8 1.8
2020 Q4 116.6 2.9 3.4 0.7 2.2 4.2 2.0
2021 Q1 104.6 1.3 2.0 -1.0 1.2 1.9 1.4 Q2 115.8 -0.2 -0.4 0.8 -0.9 1.6 1.8 Q3 . . . . . . 1.3
Sources: Eurostat and ECB calculations.1) Experimental data based on non-harmonised sources (see https://www.ecb.europa.eu/stats/ecb_statistics/governance_and_quality_framework/html/experimental-data.en.html
for further details).
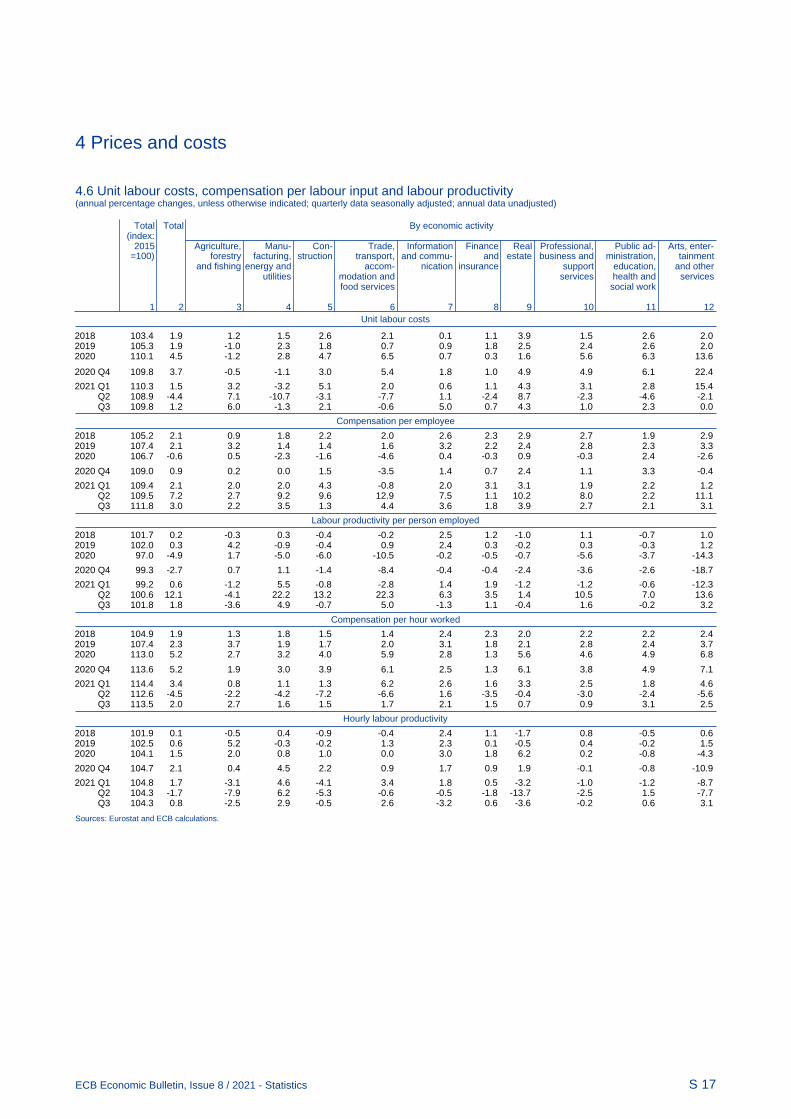
4 Prices and costs
S 17ECB Economic Bulletin, Issue 8 / 2021 - Statistics
4.6 Unit labour costs, compensation per labour input and labour productivity(annual percentage changes, unless otherwise indicated; quarterly data seasonally adjusted; annual data unadjusted)
Unit labour costs
Total Total By economic activity
(index:2015 Agriculture, Manu- Con- Trade, Information Finance Real Professional, Public ad- Arts, enter-
=100) forestry facturing, struction transport, and commu- and estate business and ministration, tainmentand fishing energy and accom- nication insurance support education, and other
utilities modation and services health and servicesfood services social work
1 2 3 4 5 6 7 8 9 10 11 12
2018 103.4 1.9 1.2 1.5 2.6 2.1 0.1 1.1 3.9 1.5 2.6 2.02019 105.3 1.9 -1.0 2.3 1.8 0.7 0.9 1.8 2.5 2.4 2.6 2.02020 110.1 4.5 -1.2 2.8 4.7 6.5 0.7 0.3 1.6 5.6 6.3 13.6
2020 Q4 109.8 3.7 -0.5 -1.1 3.0 5.4 1.8 1.0 4.9 4.9 6.1 22.4
2021 Q1 110.3 1.5 3.2 -3.2 5.1 2.0 0.6 1.1 4.3 3.1 2.8 15.4 Q2 108.9 -4.4 7.1 -10.7 -3.1 -7.7 1.1 -2.4 8.7 -2.3 -4.6 -2.1 Q3 109.8 1.2 6.0 -1.3 2.1 -0.6 5.0 0.7 4.3 1.0 2.3 0.0
Compensation per employee
2018 105.2 2.1 0.9 1.8 2.2 2.0 2.6 2.3 2.9 2.7 1.9 2.92019 107.4 2.1 3.2 1.4 1.4 1.6 3.2 2.2 2.4 2.8 2.3 3.32020 106.7 -0.6 0.5 -2.3 -1.6 -4.6 0.4 -0.3 0.9 -0.3 2.4 -2.6
2020 Q4 109.0 0.9 0.2 0.0 1.5 -3.5 1.4 0.7 2.4 1.1 3.3 -0.4
2021 Q1 109.4 2.1 2.0 2.0 4.3 -0.8 2.0 3.1 3.1 1.9 2.2 1.2 Q2 109.5 7.2 2.7 9.2 9.6 12.9 7.5 1.1 10.2 8.0 2.2 11.1 Q3 111.8 3.0 2.2 3.5 1.3 4.4 3.6 1.8 3.9 2.7 2.1 3.1
Labour productivity per person employed
2018 101.7 0.2 -0.3 0.3 -0.4 -0.2 2.5 1.2 -1.0 1.1 -0.7 1.02019 102.0 0.3 4.2 -0.9 -0.4 0.9 2.4 0.3 -0.2 0.3 -0.3 1.22020 97.0 -4.9 1.7 -5.0 -6.0 -10.5 -0.2 -0.5 -0.7 -5.6 -3.7 -14.3
2020 Q4 99.3 -2.7 0.7 1.1 -1.4 -8.4 -0.4 -0.4 -2.4 -3.6 -2.6 -18.7
2021 Q1 99.2 0.6 -1.2 5.5 -0.8 -2.8 1.4 1.9 -1.2 -1.2 -0.6 -12.3 Q2 100.6 12.1 -4.1 22.2 13.2 22.3 6.3 3.5 1.4 10.5 7.0 13.6 Q3 101.8 1.8 -3.6 4.9 -0.7 5.0 -1.3 1.1 -0.4 1.6 -0.2 3.2
Compensation per hour worked
2018 104.9 1.9 1.3 1.8 1.5 1.4 2.4 2.3 2.0 2.2 2.2 2.42019 107.4 2.3 3.7 1.9 1.7 2.0 3.1 1.8 2.1 2.8 2.4 3.72020 113.0 5.2 2.7 3.2 4.0 5.9 2.8 1.3 5.6 4.6 4.9 6.8
2020 Q4 113.6 5.2 1.9 3.0 3.9 6.1 2.5 1.3 6.1 3.8 4.9 7.1
2021 Q1 114.4 3.4 0.8 1.1 1.3 6.2 2.6 1.6 3.3 2.5 1.8 4.6 Q2 112.6 -4.5 -2.2 -4.2 -7.2 -6.6 1.6 -3.5 -0.4 -3.0 -2.4 -5.6 Q3 113.5 2.0 2.7 1.6 1.5 1.7 2.1 1.5 0.7 0.9 3.1 2.5
Hourly labour productivity
2018 101.9 0.1 -0.5 0.4 -0.9 -0.4 2.4 1.1 -1.7 0.8 -0.5 0.62019 102.5 0.6 5.2 -0.3 -0.2 1.3 2.3 0.1 -0.5 0.4 -0.2 1.52020 104.1 1.5 2.0 0.8 1.0 0.0 3.0 1.8 6.2 0.2 -0.8 -4.3
2020 Q4 104.7 2.1 0.4 4.5 2.2 0.9 1.7 0.9 1.9 -0.1 -0.8 -10.9
2021 Q1 104.8 1.7 -3.1 4.6 -4.1 3.4 1.8 0.5 -3.2 -1.0 -1.2 -8.7 Q2 104.3 -1.7 -7.9 6.2 -5.3 -0.6 -0.5 -1.8 -13.7 -2.5 1.5 -7.7 Q3 104.3 0.8 -2.5 2.9 -0.5 2.6 -3.2 0.6 -3.6 -0.2 0.6 3.1
Sources: Eurostat and ECB calculations.

5 Money and credit
S 18ECB Economic Bulletin, Issue 8 / 2021 - Statistics
5.1 Monetary aggregates 1) (EUR billions and annual growth rates; seasonally adjusted; outstanding amounts and growth rates at end of period; transactions during period)
Outstanding amounts
M3
M2 M3-M2
M1 M2-M1
Currency Overnight Deposits Deposits Repos Money Debtin deposits with an redeemable market securities
circulation agreed at notice fund withmaturity of up to shares a maturityof up to 3 months of up to2 years 2 years
1 2 3 4 5 6 7 8 9 10 11 12
2018 1,164.6 7,112.2 8,276.8 1,126.8 2,299.7 3,426.6 11,703.4 74.9 523.7 63.1 661.7 12,365.12019 1,222.4 7,721.9 8,944.3 1,069.7 2,364.2 3,433.9 12,378.2 79.3 528.8 -1.4 606.6 12,984.82020 1,360.8 8,886.2 10,247.0 1,034.9 2,450.1 3,485.0 13,731.9 101.5 636.5 -0.7 737.3 14,469.2
2020 Q4 1,360.8 8,886.2 10,247.0 1,034.9 2,450.1 3,485.0 13,731.9 101.5 636.5 -0.7 737.3 14,469.2
2021 Q1 1,392.9 9,137.6 10,530.4 991.5 2,477.0 3,468.5 13,998.9 109.3 617.9 15.7 743.0 14,741.9 Q2 1,419.7 9,350.5 10,770.2 936.3 2,489.6 3,425.9 14,196.1 111.9 613.7 27.5 753.1 14,949.2 Q3 1,444.4 9,617.8 11,062.2 903.2 2,493.4 3,396.6 14,458.7 120.4 597.7 37.3 755.4 15,214.2
2021 May 1,411.3 9,254.2 10,665.5 961.1 2,485.8 3,446.9 14,112.4 107.6 614.1 30.8 752.5 14,864.9 June 1,419.7 9,350.5 10,770.2 936.3 2,489.6 3,425.9 14,196.1 111.9 613.7 27.5 753.1 14,949.2 July 1,427.4 9,428.9 10,856.3 931.1 2,490.4 3,421.5 14,277.8 115.7 614.2 34.2 764.2 15,042.0 Aug. 1,435.8 9,519.2 10,955.1 914.2 2,487.1 3,401.3 14,356.4 112.7 615.0 35.8 763.5 15,119.9 Sep. 1,444.4 9,617.8 11,062.2 903.2 2,493.4 3,396.6 14,458.7 120.4 597.7 37.3 755.4 15,214.2 Oct. (p) 1,451.7 9,663.2 11,114.9 929.6 2,495.8 3,425.3 14,540.2 132.6 618.6 40.3 791.5 15,331.7
Transactions
2018 51.3 467.7 519.1 -74.5 45.4 -29.1 489.9 -0.8 12.6 -4.8 7.0 496.92019 57.7 604.8 662.5 -61.6 62.4 0.8 663.3 4.2 -4.1 -58.5 -58.3 605.02020 138.4 1,250.1 1,388.5 -28.9 86.7 57.8 1,446.3 19.5 113.8 0.1 133.4 1,579.8
2020 Q4 29.5 279.0 308.5 -29.9 24.6 -5.3 303.3 -2.2 41.3 -6.3 32.9 336.1
2021 Q1 32.1 238.9 271.0 -47.1 28.5 -18.6 252.4 6.9 -18.6 18.1 6.4 258.7 Q2 26.9 217.3 244.2 -54.0 12.6 -41.4 202.8 2.9 -3.6 11.7 11.0 213.8 Q3 25.0 254.4 279.3 -34.4 11.7 -22.6 256.7 5.5 -16.0 8.6 -1.9 254.8
2021 May 8.9 70.2 79.1 -7.9 2.2 -5.7 73.4 -1.1 0.4 7.5 6.8 80.1 June 8.4 89.2 97.6 -26.7 3.7 -23.0 74.6 3.7 -0.3 -3.8 -0.4 74.3 July 8.0 77.6 85.6 -5.0 0.9 -4.1 81.5 3.8 0.5 6.8 11.1 92.5 Aug. 8.4 81.0 89.4 -17.2 4.7 -12.5 76.8 -3.1 0.8 1.2 -1.1 75.8 Sep. 8.6 95.8 104.4 -12.1 6.2 -6.0 98.4 4.8 -17.3 0.6 -11.9 86.5 Oct. (p) 8.3 46.5 54.7 26.8 2.4 29.1 83.9 12.3 20.9 3.4 36.6 120.4
Growth rates
2018 4.6 7.0 6.7 -6.2 2.0 -0.8 4.4 -1.1 2.5 - 1.1 4.22019 5.0 8.5 8.0 -5.4 2.7 0.0 5.7 5.5 -0.8 - -8.8 4.92020 11.3 16.2 15.6 -2.7 3.7 1.7 11.7 24.4 21.6 - 22.0 12.2
2020 Q4 11.3 16.2 15.6 -2.7 3.7 1.7 11.7 24.4 21.6 - 22.0 12.2
2021 Q1 10.1 14.2 13.7 -7.8 4.9 0.9 10.2 -3.6 16.5 - 7.7 10.1 Q2 9.0 12.2 11.8 -12.9 3.8 -1.4 8.3 13.5 8.5 - 10.6 8.4 Q3 8.5 11.5 11.1 -15.5 3.2 -2.5 7.6 12.6 0.5 - 6.8 7.5
2021 May 9.2 12.1 11.7 -11.5 4.1 -0.8 8.4 9.0 13.2 - 13.3 8.6 June 9.0 12.2 11.8 -12.9 3.8 -1.4 8.3 13.5 8.5 - 10.6 8.4 July 8.9 11.3 11.0 -13.7 3.5 -1.8 7.6 5.0 6.2 - 9.8 7.7 Aug. 8.6 11.4 11.0 -12.7 3.3 -1.5 7.8 15.3 7.2 - 12.1 8.0 Sep. 8.5 11.5 11.1 -15.5 3.2 -2.5 7.6 12.6 0.5 - 6.8 7.5 Oct. (p) 8.5 11.1 10.7 -12.0 2.9 -1.6 7.5 27.9 3.9 202.5 11.1 7.7
Source: ECB.1) Data refer to the changing composition of the euro area.

5 Money and credit
S 19ECB Economic Bulletin, Issue 8 / 2021 - Statistics
5.2 Deposits in M3 1) (EUR billions and annual growth rates; seasonally adjusted; outstanding amounts and growth rates at end of period; transactions during period)
Outstanding amounts
Non-financial corporations 2) Households 3) Financial Insurance Other
corpor- corpor- generalTotal Overnight With an Redeem- Repos Total Overnight With an Redeem- Repos ations ations govern-
agreed able agreed able other than and ment 4)
maturity at notice maturity at notice MFIs and pensionof up to of up to of up to of up to ICPFs 2) funds2 years 3 months 2 years 3 months
1 2 3 4 5 6 7 8 9 10 11 12 13
2018 2,335.4 1,902.7 277.2 148.1 7.3 6,646.9 4,036.6 517.5 2,091.3 1.5 992.0 204.6 434.72019 2,483.9 2,070.3 256.7 150.5 6.4 7,044.4 4,399.1 492.0 2,152.4 1.0 1,026.5 215.7 464.72020 2,988.5 2,531.8 310.0 143.5 3.2 7,651.2 4,956.1 437.2 2,257.1 0.9 1,097.1 234.6 501.2
2020 Q4 2,988.5 2,531.8 310.0 143.5 3.2 7,651.2 4,956.1 437.2 2,257.1 0.9 1,097.1 234.6 501.2
2021 Q1 3,060.5 2,609.4 300.2 143.5 7.5 7,813.5 5,104.5 422.0 2,286.1 0.9 1,133.3 217.0 491.1 Q2 3,100.2 2,660.9 290.8 140.0 8.5 7,906.0 5,197.8 407.0 2,300.5 0.7 1,164.8 222.5 494.6 Q3 3,160.4 2,736.2 283.8 130.9 9.6 8,020.8 5,314.2 388.9 2,317.1 0.7 1,210.6 227.4 515.6
2021 May 3,066.3 2,623.0 294.7 141.6 6.9 7,870.1 5,161.5 411.6 2,296.2 0.8 1,152.1 228.1 492.1 June 3,100.2 2,660.9 290.8 140.0 8.5 7,906.0 5,197.8 407.0 2,300.5 0.7 1,164.8 222.5 494.6 July 3,108.6 2,679.9 284.9 135.9 7.8 7,944.3 5,236.6 399.2 2,307.7 0.8 1,186.6 227.3 499.3 Aug. 3,128.9 2,707.2 282.4 130.7 8.7 7,988.4 5,282.3 394.6 2,310.8 0.7 1,186.9 227.1 501.9 Sep. 3,160.4 2,736.2 283.8 130.9 9.6 8,020.8 5,314.2 388.9 2,317.1 0.7 1,210.6 227.4 515.6 Oct. (p) 3,188.0 2,758.2 292.8 128.9 8.2 8,040.2 5,332.4 383.5 2,323.3 1.0 1,244.8 239.8 508.4
Transactions
2018 96.7 108.7 -9.7 -1.0 -1.3 327.6 325.8 -45.0 46.1 0.6 -1.6 -3.1 18.22019 149.5 167.0 -18.9 1.8 -0.4 396.1 361.2 -26.3 61.7 -0.5 25.1 9.8 29.32020 515.7 469.6 55.8 -6.8 -2.9 612.0 560.6 -53.8 105.3 0.0 142.6 20.4 36.7
2020 Q4 40.1 59.0 -11.9 -3.3 -3.7 159.1 140.4 -9.5 28.1 -0.1 50.9 -6.0 27.5
2021 Q1 67.0 72.8 -9.9 0.0 4.2 160.8 146.1 -15.8 30.5 0.0 27.5 -18.2 -10.0 Q2 42.0 53.6 -9.2 -3.4 1.1 93.3 93.9 -14.9 14.4 -0.1 34.2 5.6 3.6 Q3 60.9 69.2 -8.0 -1.2 0.9 108.3 111.2 -18.3 15.4 -0.1 44.2 1.9 21.9
2021 May 14.0 15.3 0.3 -1.2 -0.4 32.3 35.0 -5.6 3.0 -0.1 14.9 3.6 -1.4 June 30.5 35.3 -4.8 -1.5 1.5 34.7 35.4 -4.8 4.2 -0.1 8.2 -6.0 2.5 July 16.0 23.3 -5.9 -0.8 -0.7 30.0 33.8 -7.8 4.1 0.0 21.9 4.7 4.7 Aug. 18.8 21.0 -2.6 -0.5 0.8 44.8 44.4 -4.6 5.0 0.0 -0.7 -0.2 2.6 Sep. 26.1 24.8 0.5 0.1 0.8 33.4 33.0 -5.9 6.4 -0.1 23.0 -2.6 14.7 Oct. (p) 28.1 22.4 9.0 -2.0 -1.4 19.5 18.3 -5.3 6.2 0.4 35.0 12.5 -7.2
Growth rates
2018 4.3 6.0 -3.4 -0.6 -15.9 5.2 8.8 -8.0 2.3 70.4 -0.2 -1.5 4.42019 6.4 8.8 -6.8 1.2 -6.5 6.0 8.9 -5.1 3.0 -35.6 2.5 4.8 6.72020 20.7 22.7 21.6 -4.5 -47.0 8.7 12.7 -10.9 4.9 -5.2 14.3 9.4 7.9
2020 Q4 20.7 22.7 21.6 -4.5 -47.0 8.7 12.7 -10.9 4.9 -5.2 14.3 9.4 7.9
2021 Q1 17.9 19.6 15.2 -2.7 9.2 9.1 12.6 -10.4 6.0 40.9 4.6 -5.7 4.1 Q2 8.4 11.4 -8.3 -5.7 47.4 7.6 11.0 -11.8 4.5 -20.2 15.9 -2.7 5.6 Q3 7.1 10.3 -12.1 -5.4 38.0 7.0 10.2 -13.1 4.0 -31.8 14.9 -6.8 9.1
2021 May 9.0 11.7 -5.8 -3.9 48.1 7.9 11.3 -11.3 4.9 -13.4 11.7 -0.1 6.5 June 8.4 11.4 -8.3 -5.7 47.4 7.6 11.0 -11.8 4.5 -20.2 15.9 -2.7 5.6 July 6.8 10.4 -14.2 -5.4 47.1 7.3 10.6 -12.6 4.3 -28.6 14.7 -4.1 4.4 Aug. 6.9 10.1 -13.0 -5.6 97.0 7.3 10.7 -12.6 4.1 -27.9 16.6 -1.8 6.1 Sep. 7.1 10.3 -12.1 -5.4 38.0 7.0 10.2 -13.1 4.0 -31.8 14.9 -6.8 9.1 Oct. (p) 7.4 10.5 -10.0 -6.8 44.7 6.5 9.6 -13.7 3.9 6.7 18.2 -0.1 6.0
Source: ECB.1) Data refer to the changing composition of the euro area.2) In accordance with the ESA 2010, in December 2014 holding companies of non-financial groups were reclassified from the non-financial corporations sector to the financial
corporations sector. These entities are included in MFI balance sheet statistics with financial corporations other than MFIs and insurance corporations and pension funds (ICPFs).3) Including non-profit institutions serving households.4) Refers to the general government sector excluding central government.

5 Money and credit
S 20ECB Economic Bulletin, Issue 8 / 2021 - Statistics
5.3 Credit to euro area residents 1) (EUR billions and annual growth rates; seasonally adjusted; outstanding amounts and growth rates at end of period; transactions during period)
Outstanding amounts
Credit to general government Credit to other euro area residents
Total Loans Debt Total Loans Debt Equity and
securities securities non-money Total To non- To house- To financial To insurance market fund
financial holds 4) corporations corporations investmentAdjusted corpor- other than and pension fund shares
loans 2) ations 3) MFIs and fundsICPFs 3)
1 2 3 4 5 6 7 8 9 10 11 12
2018 4,678.9 1,010.8 3,656.7 13,410.4 11,119.2 11,480.7 4,404.0 5,741.0 847.9 126.3 1,518.3 772.92019 4,654.5 989.2 3,653.5 13,856.8 11,446.4 11,835.1 4,474.3 5,930.1 891.0 151.0 1,560.6 849.92020 5,914.6 998.8 4,903.9 14,333.2 11,919.8 12,295.3 4,721.5 6,118.8 911.7 167.8 1,548.1 865.3
2020 Q4 5,914.6 998.8 4,903.9 14,333.2 11,919.8 12,295.3 4,721.5 6,118.8 911.7 167.8 1,548.1 865.3
2021 Q1 6,069.4 994.5 5,073.2 14,457.5 12,058.9 12,410.0 4,777.1 6,176.5 953.7 151.6 1,518.4 880.2 Q2 6,217.4 1,004.1 5,211.7 14,488.0 12,077.6 12,440.5 4,746.7 6,239.8 942.0 149.1 1,523.1 887.2 Q3 6,364.7 999.2 5,363.9 14,611.5 12,182.5 12,536.2 4,774.6 6,311.0 952.2 144.7 1,532.3 896.7
2021 May 6,148.8 1,002.3 5,144.7 14,463.2 12,067.9 12,417.4 4,747.0 6,215.4 949.0 156.4 1,510.7 884.7 June 6,217.4 1,004.1 5,211.7 14,488.0 12,077.6 12,440.5 4,746.7 6,239.8 942.0 149.1 1,523.1 887.2 July 6,305.8 1,006.9 5,297.2 14,530.9 12,114.7 12,474.0 4,747.8 6,273.3 945.7 147.9 1,527.9 888.3 Aug. 6,347.9 1,004.0 5,342.2 14,556.8 12,137.3 12,492.9 4,759.2 6,292.7 939.4 146.0 1,524.0 895.5 Sep. 6,364.7 999.2 5,363.9 14,611.5 12,182.5 12,536.2 4,774.6 6,311.0 952.2 144.7 1,532.3 896.7 Oct. (p) 6,393.6 987.4 5,404.6 14,677.4 12,228.9 12,590.0 4,794.2 6,334.3 945.9 154.5 1,553.0 895.5
Transactions
2018 91.7 -27.8 119.5 373.3 305.8 381.1 123.7 165.9 -1.4 17.5 88.4 -20.92019 -88.4 -23.2 -65.6 449.7 376.1 422.9 115.0 200.3 40.6 20.2 30.2 43.42020 1,042.0 13.5 1,028.4 737.1 538.1 559.4 288.3 209.1 23.8 16.9 170.7 28.2
2020 Q4 165.1 -0.3 165.3 145.2 75.0 112.3 -0.6 59.7 5.7 10.1 28.4 41.8
2021 Q1 150.1 -3.8 164.3 150.6 139.6 111.2 55.9 60.8 39.2 -16.4 2.7 8.3 Q2 164.2 9.5 154.1 53.3 43.6 51.8 -18.8 75.3 -10.6 -2.4 4.8 5.0 Q3 150.2 -5.1 155.2 131.9 117.5 120.4 39.5 65.8 19.1 -7.0 9.6 4.9
2021 May 57.2 1.8 55.2 40.3 34.4 26.0 4.2 24.3 1.5 4.4 -1.6 7.5 June 63.5 1.9 61.7 22.0 10.2 26.3 1.0 26.0 -9.5 -7.3 9.4 2.4 July 62.7 2.8 59.9 44.4 42.6 42.4 14.4 25.3 4.2 -1.2 4.1 -2.3 Aug. 51.1 -3.1 54.1 32.6 30.6 29.0 10.3 19.9 2.4 -1.9 -3.1 5.1 Sep. 36.4 -4.8 41.2 54.9 44.2 49.0 14.9 20.7 12.5 -3.9 8.5 2.1 Oct. (p) 33.9 -12.0 45.9 74.7 46.2 58.5 18.9 23.7 -6.1 9.8 32.0 -3.5
Growth rates
2018 2.0 -2.7 3.4 2.9 2.8 3.4 2.9 3.0 -0.2 16.2 6.1 -2.62019 -1.9 -2.3 -1.8 3.4 3.4 3.7 2.6 3.5 4.8 16.0 2.0 5.52020 22.2 1.4 27.8 5.4 4.7 4.7 6.4 3.5 2.7 10.3 11.4 3.4
2020 Q4 22.2 1.4 27.8 5.4 4.7 4.7 6.4 3.5 2.7 10.3 11.4 3.4
2021 Q1 21.7 -0.8 28.0 4.6 3.6 3.5 4.6 3.8 -1.2 -3.5 10.1 8.3 Q2 13.1 0.5 16.2 3.6 3.1 3.0 1.4 4.5 3.4 -3.5 5.3 7.6 Q3 11.0 0.0 13.5 3.4 3.2 3.2 1.6 4.3 5.9 -10.1 3.0 7.3
2021 May 15.4 -0.2 19.3 3.5 2.8 2.7 1.5 4.3 0.5 1.7 5.2 9.6 June 13.1 0.5 16.2 3.6 3.1 3.0 1.4 4.5 3.4 -3.5 5.3 7.6 July 12.4 1.0 15.1 3.4 3.1 3.0 1.3 4.5 4.2 -4.9 4.5 6.9 Aug. 12.1 1.0 14.8 3.2 3.0 3.0 1.0 4.5 5.2 -6.0 2.7 7.1 Sep. 11.0 0.0 13.5 3.4 3.2 3.2 1.6 4.3 5.9 -10.1 3.0 7.3 Oct. (p) 10.5 -1.2 13.2 3.7 3.3 3.4 1.9 4.3 5.7 -5.7 4.4 7.7
Source: ECB.1) Data refer to the changing composition of the euro area.2) Adjusted for loan sales and securitisation (resulting in derecognition from the MFI statistical balance sheet) as well as for positions arising from notional cash pooling services
provided by MFIs.3) In accordance with the ESA 2010, in December 2014 holding companies of non-financial groups were reclassified from the non-financial corporations sector to the financial
corporations sector. These entities are included in MFI balance sheet statistics with financial corporations other than MFIs and insurance corporations and pension funds (ICPFs).4) Including non-profit institutions serving households.

5 Money and credit
S 21ECB Economic Bulletin, Issue 8 / 2021 - Statistics
5.4 MFI loans to euro area non-financial corporations and households 1) (EUR billions and annual growth rates; seasonally adjusted; outstanding amounts and growth rates at end of period; transactions during period)
Outstanding amounts
Non-financial corporations 2) Households 3)
Total Up to 1 year Over 1 Over 5 years Total Loans for Loans for Other loans
and up to consumption houseAdjusted 5 years Adjusted purchase
loans 4) loans 4)
1 2 3 4 5 6 7 8 9 10
2018 4,404.0 4,488.4 990.5 842.3 2,571.1 5,741.0 6,023.6 682.6 4,355.4 703.02019 4,474.3 4,576.5 966.7 877.5 2,630.1 5,930.1 6,221.7 720.1 4,523.5 686.52020 4,721.5 4,839.5 898.1 1,011.3 2,812.1 6,118.8 6,386.6 700.2 4,723.8 694.8
2020 Q4 4,721.5 4,839.5 898.1 1,011.3 2,812.1 6,118.8 6,386.6 700.2 4,723.8 694.8
2021 Q1 4,777.1 4,897.7 894.4 1,017.8 2,864.9 6,176.5 6,439.5 696.3 4,786.6 693.7 Q2 4,746.7 4,866.6 833.0 971.6 2,942.2 6,239.8 6,498.5 693.7 4,851.8 694.3 Q3 4,774.6 4,889.7 835.1 972.1 2,967.5 6,311.0 6,569.3 696.6 4,914.4 699.9
2021 May 4,747.0 4,861.8 872.6 973.7 2,900.7 6,215.4 6,475.0 692.1 4,830.8 692.5 June 4,746.7 4,866.6 833.0 971.6 2,942.2 6,239.8 6,498.5 693.7 4,851.8 694.3 July 4,747.8 4,860.7 828.2 968.1 2,951.4 6,273.3 6,531.3 695.6 4,874.6 703.1 Aug. 4,759.2 4,873.8 828.1 969.4 2,961.7 6,292.7 6,552.2 695.4 4,894.9 702.4 Sep. 4,774.6 4,889.7 835.1 972.1 2,967.5 6,311.0 6,569.3 696.6 4,914.4 699.9 Oct. (p) 4,794.2 4,912.3 859.1 971.0 2,964.1 6,334.3 6,590.2 698.8 4,935.0 700.5
Transactions
2018 123.7 175.9 17.3 31.3 75.1 165.9 187.6 41.1 134.1 -9.42019 115.0 142.5 -13.1 44.8 83.2 200.3 216.2 41.0 168.5 -9.22020 288.3 324.8 -54.1 138.7 203.6 209.1 193.9 -11.8 210.6 10.4
2020 Q4 -0.6 20.3 -21.6 -1.8 22.8 59.7 64.9 -1.0 59.5 1.2
2021 Q1 55.9 58.1 -3.8 6.8 52.9 60.8 58.1 -2.2 63.3 -0.3 Q2 -18.8 -22.4 -57.6 -43.2 82.0 75.3 70.6 2.4 72.1 0.9 Q3 39.5 43.9 4.0 1.8 33.7 65.8 67.6 4.1 63.9 -2.2
2021 May 4.2 -5.2 -0.4 -22.5 27.0 24.3 23.4 1.1 22.9 0.3 June 1.0 9.6 -39.9 -1.5 42.3 26.0 24.5 2.1 23.6 0.3 July 14.4 10.3 -3.0 -1.2 18.6 25.3 25.0 1.7 23.8 -0.2 Aug. 10.3 14.1 0.0 0.8 9.5 19.9 21.3 0.3 20.3 -0.7 Sep. 14.9 19.4 7.0 2.3 5.6 20.7 21.4 2.1 19.9 -1.3 Oct. (p) 18.9 25.2 24.1 -1.6 -3.6 23.7 23.5 2.7 20.2 0.9
Growth rates
2018 2.9 4.1 1.8 3.8 3.0 3.0 3.2 6.3 3.2 -1.32019 2.6 3.2 -1.3 5.3 3.2 3.5 3.6 6.0 3.9 -1.32020 6.4 7.1 -5.7 15.9 7.8 3.5 3.1 -1.6 4.7 1.5
2020 Q4 6.4 7.1 -5.7 15.9 7.8 3.5 3.1 -1.6 4.7 1.5
2021 Q1 4.6 5.3 -9.2 11.1 7.5 3.8 3.3 -1.6 5.0 1.5 Q2 1.4 1.9 -11.8 -2.2 7.3 4.5 4.0 0.6 5.7 0.6 Q3 1.6 2.1 -8.6 -3.6 6.9 4.3 4.1 0.5 5.6 -0.1
2021 May 1.5 1.9 -7.8 -2.6 6.2 4.3 3.9 0.7 5.4 0.7 June 1.4 1.9 -11.8 -2.2 7.3 4.5 4.0 0.6 5.7 0.6 July 1.3 1.7 -11.4 -3.1 7.2 4.5 4.1 0.4 5.7 0.4 Aug. 1.0 1.5 -11.0 -3.8 6.8 4.5 4.2 0.1 5.8 0.2 Sep. 1.6 2.1 -8.6 -3.6 6.9 4.3 4.1 0.5 5.6 -0.1 Oct. (p) 1.9 2.5 -5.0 -3.6 6.1 4.3 4.1 0.6 5.5 -0.1
Source: ECB.1) Data refer to the changing composition of the euro area.2) In accordance with the ESA 2010, in December 2014 holding companies of non-financial groups were reclassified from the non-financial corporations sector to the financial
corporations sector. These entities are included in MFI balance sheet statistics with financial corporations other than MFIs and insurance corporations and pension funds (ICPFs).3) Including non-profit institutions serving households.4) Adjusted for loan sales and securitisation (resulting in derecognition from the MFI statistical balance sheet) as well as for positions arising from notional cash pooling services
provided by MFIs.
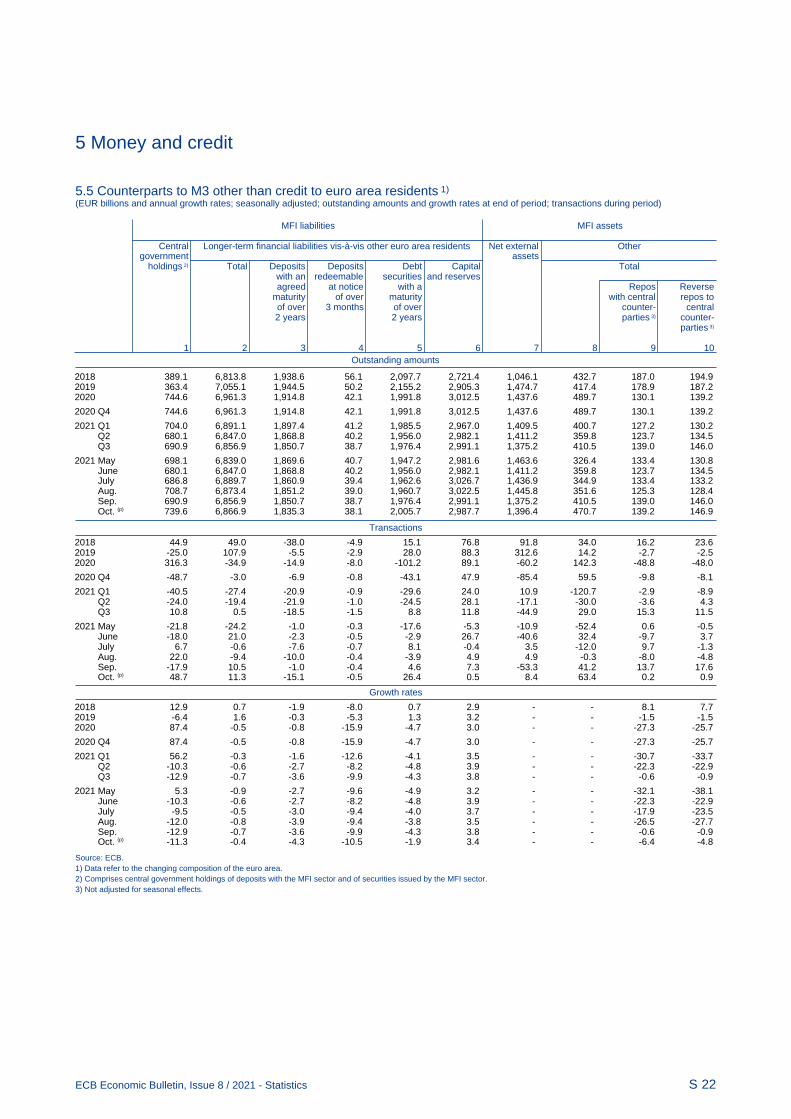
5 Money and credit
S 22ECB Economic Bulletin, Issue 8 / 2021 - Statistics
5.5 Counterparts to M3 other than credit to euro area residents 1) (EUR billions and annual growth rates; seasonally adjusted; outstanding amounts and growth rates at end of period; transactions during period)
Outstanding amounts
MFI liabilities MFI assets
Central Longer-term financial liabilities vis-à-vis other euro area residents Net external Other
government assets holdings 2) Total Deposits Deposits Debt Capital Total
with an redeemable securities and reservesagreed at notice with a Repos Reverse
maturity of over maturity with central repos toof over 3 months of over counter- central2 years 2 years parties 3) counter-
parties 3)
1 2 3 4 5 6 7 8 9 10
2018 389.1 6,813.8 1,938.6 56.1 2,097.7 2,721.4 1,046.1 432.7 187.0 194.92019 363.4 7,055.1 1,944.5 50.2 2,155.2 2,905.3 1,474.7 417.4 178.9 187.22020 744.6 6,961.3 1,914.8 42.1 1,991.8 3,012.5 1,437.6 489.7 130.1 139.2
2020 Q4 744.6 6,961.3 1,914.8 42.1 1,991.8 3,012.5 1,437.6 489.7 130.1 139.2
2021 Q1 704.0 6,891.1 1,897.4 41.2 1,985.5 2,967.0 1,409.5 400.7 127.2 130.2 Q2 680.1 6,847.0 1,868.8 40.2 1,956.0 2,982.1 1,411.2 359.8 123.7 134.5 Q3 690.9 6,856.9 1,850.7 38.7 1,976.4 2,991.1 1,375.2 410.5 139.0 146.0
2021 May 698.1 6,839.0 1,869.6 40.7 1,947.2 2,981.6 1,463.6 326.4 133.4 130.8 June 680.1 6,847.0 1,868.8 40.2 1,956.0 2,982.1 1,411.2 359.8 123.7 134.5 July 686.8 6,889.7 1,860.9 39.4 1,962.6 3,026.7 1,436.9 344.9 133.4 133.2 Aug. 708.7 6,873.4 1,851.2 39.0 1,960.7 3,022.5 1,445.8 351.6 125.3 128.4 Sep. 690.9 6,856.9 1,850.7 38.7 1,976.4 2,991.1 1,375.2 410.5 139.0 146.0 Oct. (p) 739.6 6,866.9 1,835.3 38.1 2,005.7 2,987.7 1,396.4 470.7 139.2 146.9
Transactions
2018 44.9 49.0 -38.0 -4.9 15.1 76.8 91.8 34.0 16.2 23.62019 -25.0 107.9 -5.5 -2.9 28.0 88.3 312.6 14.2 -2.7 -2.52020 316.3 -34.9 -14.9 -8.0 -101.2 89.1 -60.2 142.3 -48.8 -48.0
2020 Q4 -48.7 -3.0 -6.9 -0.8 -43.1 47.9 -85.4 59.5 -9.8 -8.1
2021 Q1 -40.5 -27.4 -20.9 -0.9 -29.6 24.0 10.9 -120.7 -2.9 -8.9 Q2 -24.0 -19.4 -21.9 -1.0 -24.5 28.1 -17.1 -30.0 -3.6 4.3 Q3 10.8 0.5 -18.5 -1.5 8.8 11.8 -44.9 29.0 15.3 11.5
2021 May -21.8 -24.2 -1.0 -0.3 -17.6 -5.3 -10.9 -52.4 0.6 -0.5 June -18.0 21.0 -2.3 -0.5 -2.9 26.7 -40.6 32.4 -9.7 3.7 July 6.7 -0.6 -7.6 -0.7 8.1 -0.4 3.5 -12.0 9.7 -1.3 Aug. 22.0 -9.4 -10.0 -0.4 -3.9 4.9 4.9 -0.3 -8.0 -4.8 Sep. -17.9 10.5 -1.0 -0.4 4.6 7.3 -53.3 41.2 13.7 17.6 Oct. (p) 48.7 11.3 -15.1 -0.5 26.4 0.5 8.4 63.4 0.2 0.9
Growth rates
2018 12.9 0.7 -1.9 -8.0 0.7 2.9 - - 8.1 7.72019 -6.4 1.6 -0.3 -5.3 1.3 3.2 - - -1.5 -1.52020 87.4 -0.5 -0.8 -15.9 -4.7 3.0 - - -27.3 -25.7
2020 Q4 87.4 -0.5 -0.8 -15.9 -4.7 3.0 - - -27.3 -25.7
2021 Q1 56.2 -0.3 -1.6 -12.6 -4.1 3.5 - - -30.7 -33.7 Q2 -10.3 -0.6 -2.7 -8.2 -4.8 3.9 - - -22.3 -22.9 Q3 -12.9 -0.7 -3.6 -9.9 -4.3 3.8 - - -0.6 -0.9
2021 May 5.3 -0.9 -2.7 -9.6 -4.9 3.2 - - -32.1 -38.1 June -10.3 -0.6 -2.7 -8.2 -4.8 3.9 - - -22.3 -22.9 July -9.5 -0.5 -3.0 -9.4 -4.0 3.7 - - -17.9 -23.5 Aug. -12.0 -0.8 -3.9 -9.4 -3.8 3.5 - - -26.5 -27.7 Sep. -12.9 -0.7 -3.6 -9.9 -4.3 3.8 - - -0.6 -0.9 Oct. (p) -11.3 -0.4 -4.3 -10.5 -1.9 3.4 - - -6.4 -4.8
Source: ECB.1) Data refer to the changing composition of the euro area.2) Comprises central government holdings of deposits with the MFI sector and of securities issued by the MFI sector.3) Not adjusted for seasonal effects.

6 Fiscal developments
S 23ECB Economic Bulletin, Issue 8 / 2021 - Statistics
6.1 Deficit/surplus(as a percentage of GDP; flows during one-year period)
Deficit (-)/surplus (+) Memo item:
PrimaryTotal Central State Local Social deficit (-)/
government government government security surplus (+)funds
1 2 3 4 5 6
2017 -0.9 -1.4 0.1 0.2 0.2 1.02018 -0.4 -1.0 0.1 0.2 0.3 1.42019 -0.6 -1.0 0.0 0.0 0.3 1.02020 -7.2 -5.9 -0.4 0.0 -0.9 -5.7
2020 Q3 -5.2 . . . . -3.7 Q4 -7.2 . . . . -5.7
2021 Q1 -8.4 . . . . -6.8 Q2 -7.0 . . . . -5.6
Sources: ECB for annual data; Eurostat for quarterly data.
6.2 Revenue and expenditure(as a percentage of GDP; flows during one-year period)
Revenue Expenditure
Total Current revenue Capital Total Current expenditure Capital
revenue expenditureDirect Indirect Net social Compen- Intermediate Interest Socialtaxes taxes contributions sation of consumption benefits
employees
1 2 3 4 5 6 7 8 9 10 11 12 13
2017 46.2 45.8 12.8 13.0 15.2 0.4 47.1 43.3 9.9 5.3 1.9 22.4 3.82018 46.4 45.9 12.9 13.0 15.2 0.5 46.9 43.2 9.9 5.3 1.8 22.3 3.72019 46.3 45.8 12.9 13.0 15.0 0.5 46.9 43.2 9.9 5.3 1.6 22.4 3.72020 46.6 46.1 13.0 12.8 15.6 0.5 53.8 49.2 10.7 6.0 1.5 25.5 4.6
2020 Q3 46.6 46.1 13.0 12.8 15.5 0.4 51.8 47.6 10.5 5.8 1.6 24.8 4.2 Q4 46.6 46.1 13.0 12.8 15.6 0.5 53.8 49.2 10.7 6.0 1.5 25.5 4.6
2021 Q1 46.5 46.1 13.0 12.7 15.7 0.5 54.9 50.2 10.8 6.1 1.5 25.8 4.6 Q2 46.3 45.8 12.8 12.8 15.5 0.5 53.3 48.7 10.5 5.9 1.5 25.0 4.6
Sources: ECB for annual data; Eurostat for quarterly data.
6.3 Government debt-to-GDP ratio(as a percentage of GDP; outstanding amounts at end of period)
Total Financial instrument Holder Original maturity Residual maturity Currency
Currency Loans Debt Resident creditors Non-resident Up to Over Up to Over 1 Over Euro or Other
and securities creditors 1 year 1 year 1 year and up to 5 years participating curren-deposits MFIs 5 years currencies cies
1 2 3 4 5 6 7 8 9 10 11 12 13 14
2017 87.5 3.2 14.5 69.9 48.0 32.0 39.5 8.6 78.9 16.4 28.9 42.3 85.7 1.82018 85.5 3.1 13.7 68.7 47.9 32.2 37.7 8.1 77.5 16.0 28.3 41.2 84.1 1.52019 83.6 3.0 12.9 67.6 45.2 30.4 38.4 7.6 75.9 15.6 27.7 40.3 82.2 1.42020 97.3 3.2 14.2 79.9 54.6 39.1 42.7 11.3 86.0 19.1 31.5 46.7 95.6 1.7
2020 Q3 96.6 3.1 13.9 79.6 . . . . . . . . . . Q4 97.3 3.2 14.2 79.9 . . . . . . . . . .
2021 Q1 100.0 3.2 14.1 82.7 . . . . . . . . . . Q2 98.3 3.1 13.9 81.4 . . . . . . . . . .
Sources: ECB for annual data; Eurostat for quarterly data.

6 Fiscal developments
S 24ECB Economic Bulletin, Issue 8 / 2021 - Statistics
6.4 Annual change in the government debt-to-GDP ratio and underlying factors 1) (as a percentage of GDP; flows during one-year period)
Change in Primary Deficit-debt adjustment Interest- Memo item:
debt-to- deficit (+)/ growth BorrowingGDP ratio 2) surplus (-) Total Transactions in main financial assets Revaluation Other differential requirement
effectsTotal Currency Loans Debt Equity and and other
and securities investment changes indeposits fund shares volume
1 2 3 4 5 6 7 8 9 10 11 12
2017 -2.5 -1.0 -0.1 0.4 0.5 0.0 -0.1 0.1 -0.2 -0.4 -1.3 1.02018 -2.0 -1.4 0.4 0.5 0.4 -0.1 0.0 0.2 0.1 -0.1 -1.0 0.82019 -2.0 -1.0 0.1 0.3 0.1 0.0 0.0 0.2 -0.2 0.0 -1.1 0.92020 13.8 5.7 2.3 2.5 2.0 0.4 -0.1 0.1 -0.1 -0.1 5.8 9.6
2020 Q3 11.3 3.7 3.0 3.2 2.9 0.3 -0.1 0.1 -0.3 0.0 4.6 8.5 Q4 13.8 5.7 2.3 2.5 2.0 0.4 -0.1 0.1 -0.1 -0.2 5.8 9.6
2021 Q1 14.3 6.8 1.9 2.2 1.6 0.5 0.0 0.2 -0.1 -0.3 5.5 10.3 Q2 3.9 5.6 -1.3 -0.4 -1.0 0.4 0.0 0.2 0.0 -0.9 -0.3 5.8
Sources: ECB for annual data; Eurostat for quarterly data.1) Intergovernmental lending in the context of the financial crisis is consolidated except in quarterly data on the deficit-debt adjustment.2) Calculated as the difference between the government debt-to-GDP ratios at the end of the reference period and a year earlier.
6.5 Government debt securities 1) (debt service as a percentage of GDP; flows during debt service period; average nominal yields in percentages per annum)
Debt service due within 1 year 2) Average Average nominal yields 4)
residual Total Principal Interest maturity Outstanding amounts Transactions
in years 3) Maturities Maturities Total Floating Zero Fixed rate Issuance Redemptionof up to 3 of up to 3 rate coupon
months months Maturitiesof up to 1
year
1 2 3 4 5 6 7 8 9 10 11 12 13
2018 12.5 11.0 3.7 1.5 0.4 7.3 2.3 1.1 -0.1 2.7 2.5 0.4 0.92019 12.2 10.8 3.6 1.4 0.4 7.5 2.2 1.3 -0.1 2.5 2.1 0.3 1.12020 14.9 13.6 4.2 1.4 0.3 7.6 1.9 1.1 -0.2 2.2 2.3 0.0 0.8
2020 Q3 15.8 14.4 4.7 1.4 0.3 7.5 1.9 1.1 -0.2 2.3 2.2 0.1 0.8 Q4 14.9 13.6 4.2 1.4 0.3 7.6 1.9 1.1 -0.2 2.2 2.3 0.0 0.8
2021 Q1 15.7 14.2 5.5 1.4 0.4 7.8 1.8 1.1 -0.2 2.1 2.1 0.0 0.5 Q2 15.5 14.1 5.2 1.4 0.3 7.9 1.7 0.5 -0.3 2.0 2.1 -0.1 0.5
2021 May 15.7 14.3 4.7 1.4 0.3 7.9 1.7 0.5 -0.3 2.1 2.1 -0.1 0.6 June 15.5 14.1 5.2 1.4 0.3 7.9 1.7 0.5 -0.3 2.0 2.1 -0.1 0.5 July 15.4 14.1 5.2 1.3 0.3 7.9 1.6 0.5 -0.3 2.0 1.9 -0.1 0.5 Aug. 15.4 14.0 5.4 1.4 0.3 7.9 1.7 1.1 -0.3 2.0 1.9 -0.1 0.5 Sep. 15.6 14.2 4.7 1.4 0.3 7.9 1.7 1.1 -0.3 2.0 1.8 -0.1 0.5 Oct. 14.6 13.3 4.0 1.4 0.3 8.0 1.7 1.1 -0.3 2.0 1.8 -0.1 0.5
Source: ECB.1) At face value and not consolidated within the general government sector.2) Excludes future payments on debt securities not yet outstanding and early redemptions.3) Residual maturity at the end of the period.4) Outstanding amounts at the end of the period; transactions as 12-month average.
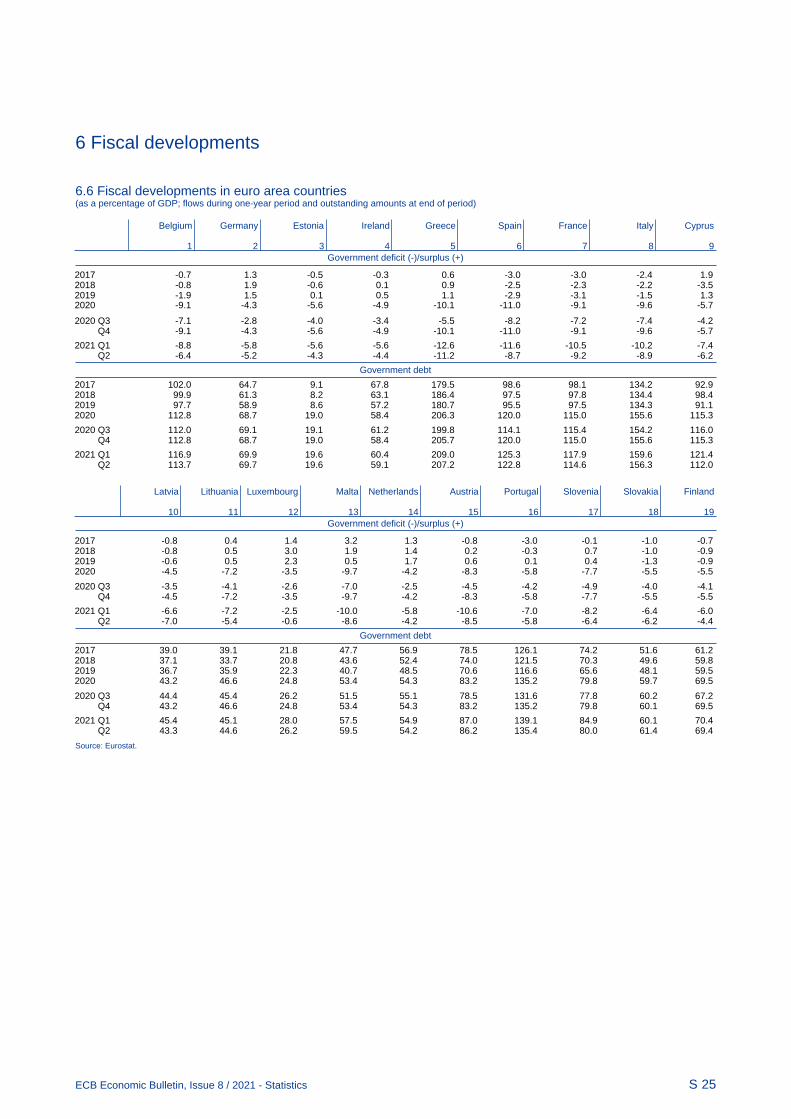
6 Fiscal developments
S 25ECB Economic Bulletin, Issue 8 / 2021 - Statistics
6.6 Fiscal developments in euro area countries(as a percentage of GDP; flows during one-year period and outstanding amounts at end of period)
Government deficit (-)/surplus (+)
Belgium Germany Estonia Ireland Greece Spain France Italy Cyprus
1 2 3 4 5 6 7 8 9
2017 -0.7 1.3 -0.5 -0.3 0.6 -3.0 -3.0 -2.4 1.92018 -0.8 1.9 -0.6 0.1 0.9 -2.5 -2.3 -2.2 -3.52019 -1.9 1.5 0.1 0.5 1.1 -2.9 -3.1 -1.5 1.32020 -9.1 -4.3 -5.6 -4.9 -10.1 -11.0 -9.1 -9.6 -5.7
2020 Q3 -7.1 -2.8 -4.0 -3.4 -5.5 -8.2 -7.2 -7.4 -4.2 Q4 -9.1 -4.3 -5.6 -4.9 -10.1 -11.0 -9.1 -9.6 -5.7
2021 Q1 -8.8 -5.8 -5.6 -5.6 -12.6 -11.6 -10.5 -10.2 -7.4 Q2 -6.4 -5.2 -4.3 -4.4 -11.2 -8.7 -9.2 -8.9 -6.2
Government debt
2017 102.0 64.7 9.1 67.8 179.5 98.6 98.1 134.2 92.92018 99.9 61.3 8.2 63.1 186.4 97.5 97.8 134.4 98.42019 97.7 58.9 8.6 57.2 180.7 95.5 97.5 134.3 91.12020 112.8 68.7 19.0 58.4 206.3 120.0 115.0 155.6 115.3
2020 Q3 112.0 69.1 19.1 61.2 199.8 114.1 115.4 154.2 116.0 Q4 112.8 68.7 19.0 58.4 205.7 120.0 115.0 155.6 115.3
2021 Q1 116.9 69.9 19.6 60.4 209.0 125.3 117.9 159.6 121.4 Q2 113.7 69.7 19.6 59.1 207.2 122.8 114.6 156.3 112.0
Government deficit (-)/surplus (+)
Latvia Lithuania Luxembourg Malta Netherlands Austria Portugal Slovenia Slovakia Finland
10 11 12 13 14 15 16 17 18 19
2017 -0.8 0.4 1.4 3.2 1.3 -0.8 -3.0 -0.1 -1.0 -0.72018 -0.8 0.5 3.0 1.9 1.4 0.2 -0.3 0.7 -1.0 -0.92019 -0.6 0.5 2.3 0.5 1.7 0.6 0.1 0.4 -1.3 -0.92020 -4.5 -7.2 -3.5 -9.7 -4.2 -8.3 -5.8 -7.7 -5.5 -5.5
2020 Q3 -3.5 -4.1 -2.6 -7.0 -2.5 -4.5 -4.2 -4.9 -4.0 -4.1 Q4 -4.5 -7.2 -3.5 -9.7 -4.2 -8.3 -5.8 -7.7 -5.5 -5.5
2021 Q1 -6.6 -7.2 -2.5 -10.0 -5.8 -10.6 -7.0 -8.2 -6.4 -6.0 Q2 -7.0 -5.4 -0.6 -8.6 -4.2 -8.5 -5.8 -6.4 -6.2 -4.4
Government debt
2017 39.0 39.1 21.8 47.7 56.9 78.5 126.1 74.2 51.6 61.22018 37.1 33.7 20.8 43.6 52.4 74.0 121.5 70.3 49.6 59.82019 36.7 35.9 22.3 40.7 48.5 70.6 116.6 65.6 48.1 59.52020 43.2 46.6 24.8 53.4 54.3 83.2 135.2 79.8 59.7 69.5
2020 Q3 44.4 45.4 26.2 51.5 55.1 78.5 131.6 77.8 60.2 67.2 Q4 43.2 46.6 24.8 53.4 54.3 83.2 135.2 79.8 60.1 69.5
2021 Q1 45.4 45.1 28.0 57.5 54.9 87.0 139.1 84.9 60.1 70.4 Q2 43.3 44.6 26.2 59.5 54.2 86.2 135.4 80.0 61.4 69.4
Source: Eurostat.

© European Central Bank, 2022
Postal address 60640 Frankfurt am Main, Germany
Telephone +49 69 1344 0
Website www.ecb.europa.eu
All rights reserved. Reproduction for educational and non-commercial purposes is permitted provided that the source is acknowledged.
This Bulletin was produced under the responsibility of the Executive Board of the ECB. Translations are prepared and published by the
national central banks.
The cut-off date for the statistics included in this issue was 15 December 2021.
For specific terminology please refer to the ECB glossary (available in English only).
PDF ISSN 2363-3417, QB-BP-21-008-EN-N
HTML ISSN 2363-3417, QB-BP-21-008-EN-Q
Copyright © 2022 FDOKUMEN