
Complexicity of ECB Communication and Financial Market ...
48
Marburg Centre for Institutional Economics • Coordination: Prof. Dr. Elisabeth Schulte c/o Research Group Institutional Economics • Barfuessertor 2 • D-35037 Marburg Phone: +49 (0) 6421-28-23196 • Fax: +49 (0) 6421-28-24858 • www.uni-marburg.de/fb02/MACIE • [email protected] Nr. 2020/07 Complexicity of ECB Communication and Financial Market Trading Bernd Hayo, Kai Henseler, Marc Steffen Rapp, Johannes Zahner MACIE, Philipps-Universität Marburg
-
Upload
khangminh22 -
Category
Documents
-
view
0 -
download
0
Transcript of Complexicity of ECB Communication and Financial Market ...

Marburg Centre for Institutional Economics • Coordination: Prof. Dr. Elisabeth Schulte
c/o Research Group Institutional Economics • Barfuessertor 2 • D-35037 Marburg
Phone: +49 (0) 6421-28-23196 • Fax: +49 (0) 6421-28-24858 •
www.uni-marburg.de/fb02/MACIE • [email protected]
Nr. 2020/07
Complexicity of ECB Communication
and Financial Market Trading
Bernd Hayo, Kai Henseler, Marc Steffen Rapp, Johannes Zahner
MACIE, Philipps-Universität Marburg

Joint Discussion Paper
Series in Economics by the Universities of
Aachen ∙ Gießen ∙ Göttingen Kassel ∙ Marburg ∙ Siegen
ISSN 1867-3678
No. 19-2019
Bernd Hayo, Kai Henseler, Marc Steffen Rapp and Johannes Zahner
Complexicity of ECB Communication and Financial Market
Trading
This paper can be downloaded from
http://www.uni-marburg.de/fb02/makro/forschung/magkspapers
Coordination: Bernd Hayo • Philipps-University Marburg School of Business and Economics • Universitätsstraße 24, D-35032 Marburg
Tel: +49-6421-2823091, Fax: +49-6421-2823088, e-mail: [email protected]

Complexity of ECB Communication and Financial Market Trading
Bernd Hayoa,b Kai Henselerc Marc Steffen Rappb,c,# Johannes Zahnerb,d
Completely revised version 4 December 2020
We empirically examine how complexity of ECB communications affects financial market trad-
ing based on high-frequency data from European stock index futures trading. Our sample
covers ECB press conferences between January 2009 and December 2017, during which un-
conventional monetary policy measures (UMPM) substantially increased communication com-
plexity. Analysing the linguistic complexity of the introductory statements and differentiating
between press conferences with and without UMPM-announcements, we find more complex
communication, i.e. high linguistic complexity and UMPM-announcement, is associated with a
lower level of contemporaneous trading activity. Moreover, complex communication leads to
a temporal shift in trading activity towards the subsequent Q&A session, which suggests that
Q&A sessions facilitate market participants’ information processing. Finally, we document a
relatively lower similarity of unconventional monetary policy statements and argue that this
might explain our findings.
JEL-Classification: D83, E52, E58, G12, G14
Keywords: ECB, central bank communication, textual analysis, linguistic complexity, readability, financial
markets, European stock markets
a School of Business and Economics, Macroeconomic Research Group, Philipps-Universität Marburg, Germany.
b Marburg Centre for Institutional Economics (MACIE), Philipps-Universität Marburg, Germany.
c School of Business and Economics, Accounting and Finance Area, Philipps-Universität Marburg, Germany.
d School of Business and Economics, Institutional Economics Research Group, Philipps-Universität Marburg, Ger-many.
# Corresponding author at: Philipps-Universität Marburg, School of Business & Economics, Am Plan 1, 35032 Marburg (Germany). E-mail: [email protected]
Declarations of interest: none (applies to all authors).
Thanks to participants at the German Economic Society Annual Conference in 2019 in Leipzig for helpful com-ments.

- 1 -
1 Introduction
Over the last decade, central bank communication has become a key component of
the central bankers’ toolkit (see, e.g., Dell’Ariccia, Rabanal and Sandri, 2018; Kuttner,
2018).1 To effectively steer the expectations of the private sector with the aim of
enhancing monetary policy transmission, central banks in several countries have in-
stitutionalised monetary policy communication (see, e.g., Blinder et al., 2008). An-
nouncements about current monetary policy decisions, assessments of the economic
outlook, and the expected consequences of monetary policy have become an im-
portant tool of central banks’ communication strategy (see, e.g., Hansen, McMahon
and Prat, 2018; Kohn and Sack, 2003).
However, the increase in complexity of monetary policy during and after the financial
crisis creates significant challenges for central bank communication (e.g., Bulíř, Čihák
and Jansen, 2013a; Bulíř, Čihák and Šmídková, 2013b; Hernández-Murillo and Shell,
2014). As Peter Praet, former chief economist of the ECB, put it ’[i]n normal times,
central banks adapted their monetary policy stance by influencing the level of one
short-term interest rate. In unconventional times, communication has had to cope
with the new challenge of explaining the complementarities between policy tools, as
non-standard monetary policy has become multidimensional. […] In this context, it is
1 Communication is “a process by which information is exchanged between individuals through
a common system of symbols, signs, or behaviour” (Merriam Webster Dictionary, available at:
https://www.merriam-webster.com/dictionary/communication (accessed: 05 Mar 2019)).
Central banks can utilise communication to reduce asymmetric information and share their
private information to guide expectations. Central banks’ private information may stem from
a myriad of sources, such as the outcome of previous policy votes (see, e.g., Meade, 2005),
the discussions at the meeting (see, e.g., Hansen, McMahon and Prat, 2018), or risk balance
evaluations (see, e.g., Hanson and Stein, 2015).

- 2 -
perhaps no coincidence that the complexity of the introductory statements delivered
at the ECB’s press conferences, as measured by common indices of text readability,
has also increased’.2
While there is a large number of studies exploring central bank communication (see
the surveys by Blinder et al., 2008 and de Haan and Sturm 2019), there is still little
understanding as to how financial markets are influenced by the complexity of central
bank communication. We address this gap in the literature by studying the European
Central Bank’s (ECB) press conferences following the Governing Council meeting and
the impact of linguistic and content-related complexity of the introductory statement
for contemporaneous trading behaviour in financial markets.
After interest rates reached the effective lower bound following the 2008 financial
crisis, many central banks around the world embraced unconventional monetary pol-
icy measures (UMPM), such as quantitative easing and forward guidance (e.g., Bowd-
ler and Radia, 2012). Arguably, the complexity – and potential ambiguity – associated
with these novel monetary policy tools demands a more disciplined and coherent
communication strategy, especially since the effectiveness of monetary policy poten-
tially seems to increase in the degree of comprehension of financial market partici-
pants (see, e.g., Cœuré, 2018, Lucca and Trebbi, 2009; Praet, 2017).3
To date, central banks in all major economies conduct regular press conferences fol-
lowing the meetings of their monetary policy committees. The ECB instituted its press
conferences after the Governing Council Meetings (GCM) right from its establishment.
2 See https://www.ecb.europa.eu/press/key/date/2017/html/ecb.sp171115.en.html (ac-
cessed Dec 2, 2020). 3 An extensive discussion on how financial market participants themselves evaluate the suc-
cess of these policies is provided in Hayo and Neuenkirch (2015a).
- 3 -
Each press conference begins with a prepared introductory statement and ends with
a Q&A session attended by journalists. In the light of the ECB's unique communication
design, we address the question of whether higher complexity of central bank com-
munication, causes financial markets to delay trading and whether the generally less
complex Q&A sessions may mitigate the effect.
We measure market trading using high-frequency data from European stock index
futures trading and study ECB press conferences in the aftermath of the 2008 financial
crises, during which unconventional monetary policies substantially increased com-
munication complexity. We proceed in four steps. First, we analyse the linguistic com-
plexity of the introductory statements. Differentiating between press conferences with
and without the announcement of UMPM, we find no difference between the linguistic
complexity of introductory statements. Second, examining the overall effect of lin-
guistic complexity on trading volume, we find – in contrast to Smales and Apergis
(2017a) who study the Federal Open Market Committee (FOMC) – no effect in our
sample period. Third, differentiating between press conferences with and without the
announcement of UMPM, we find higher linguistic complexity of introductory state-
ments is associated with a lower level of contemporaneous trading activity for UMPM-
announcements. Moreover, in for events we find increasing complexity to shift trading
activity towards the subsequent Q&A session, which suggests that Q&A sessions fa-
cilitate market participants’ information processing. Finally, drawing on Ehrmann and
Talmi (2020), we analyse the similarity of introductory statements and infer that the
observed effect of UMPM-announcements is due to their ‘unconventionality’, that is,
their degree of novelty. Specifically, we document that UMPM communication is, on

- 4 -
average, less similar and, therefore, more likely to transmit a higher degree of po-
tentially complex new information.
The remainder of this paper is structured as follows: The next section develops the
central research question and presents our hypotheses. Section 3 describes the da-
taset and provides the descriptive analysis. Section 4 illustrates our empirical design
and presents the regression results. Section 5 discusses the robustness of the results
and section 6 concludes.
2 Central Bank Communication and Financial Markets
Economic theory suggests that trading decisions depend on ’news’, i.e. novel infor-
mation (see, e.g., Stigler, 1961), which is swiftly incorporate by efficient financial
markets (Fama, 1970). Central bank communication often contains such relevant
news about future economic developments, with consequences for the macroecon-
omy, specific industries, and individual companies (see, e.g., Bernanke and Kuttner,
2005; Funke and Matsuda, 2006). Consistent with that view and Cukierman and Melt-
zer’s (1986) hypothesis, Andersson (2010) and Nakamura and Steinsson (2018) find
evidence that unexpected information (i.e. surprises) in central bank communication
has an immediate effect on financial markets.
Most studies analysing the informational content of central bank communication focus
on well-defined signals from the central bank, such as monetary policy announce-
ments (see, e.g., Blinder et al., 2008). In an attempt to minimise omitted variable
bias and endogeneity, these studies commonly take an event-study approach (see,
e.g., Rosa, 2011a). The dependent variables employed typically include some short-

- 5 -
term reactions by financial markets around monetary policy announcements (see,
e.g., Boguth, Grégoire and Martineau, 2019; Brand, Buncic and Turunen, 2010; Gur-
kaynak, Hussain, 2011; Rosa, 2008; Rosa, 2011b; Sack and Swanson, 2005; Schmel-
ing and Wagner, 2019). Other studies quantify the content of these announcements
through text-mining techniques and investigate communication of various central
banks, e.g., the ECB (Picault and Renault, 2017), the FOMC (Shapiro and Wilson,
2019), the Bundesbank (Tillmann and Walter, 2018), and the Riksbank (Apel and
Grimaldi, 2014).
In general, this stream of research considers information to be a rather simple con-
struct, easily understood and comprehended by market participants. However, sev-
eral studies question this assumption and emphasise the possibility of (1) variations
in the degree of understanding and interpretation of information (see, e.g., Grossman
and Stiglitz, 1976; Harris and Raviv, 1993) and (2) heterogeneity in the speed of
information processing. Kandel and Pearson (1995), for instance, suggest that differ-
ent ex ante opinions may rationalise dispersion in interpretation, that is, while all
market participants receive the same information, their assessment is heterogeneous.
Alternatively, the (lack of) general comprehensibility of the information could be the
cause for the differential interpretation of information (see, e.g., Loughran and
McDonald, 2016; Smith and Taffler, 1992; You and Zhang, 2009). That is, all market
participants receive the same information but decode it differently and/or at a differ-
ent speed due to the contents’ complexity. Hong and Stein (1999) argue that private
information may be required to transform public news into an opinion and heteroge-
neity in private information may result in gradually updated opinions and, thus, an
underreaction of the market to public news.

- 6 -
Regarding central bank communication, Ehrmann and Talmi (2020) report substantial
similarity in press releases announcing monetary policy decisions. They find that sim-
ilarity of press releases of the Bank of Canada is negatively associated with market
volatility. Examining FOMC statements, Hernández-Murillo and Shell (2014) docu-
ment that these statements have become more complex since the beginning of UMPM.
Smales and Apergis (2017a, 2017b) investigate in two studies the effect of linguistic
complexity of FOMC statements and find that complexity positively affects daily trad-
ing volume. The authors rationalise their finding with heterogeneity in beliefs and
opinions because of the complexity of information in light of Harris and Raviv (1993)
and Kandel and Pearson (1995).
In this paper, we extend the analysis of Smales and Apergis (2017a, 2017b) along
two dimensions. First, we are interested in the dynamics of information processing
and trading behaviour in financial markets. In light of Hong and Stein (1999), we
argue that at a given level of cognitive ability and private information, the time to
process news is positively correlated with the complexity of the text containing that
news. Hence, we expect that the market underreacts to more complex central bank
communication and that contemporaneous trading volume is negatively correlated
with complexity:
H1: Complexity of central bank communication has a negative impact on contempo-
raneous trading behaviour.
Second, we argue that it is not only the linguistic complexity of the transcripts that
matters, but also the complexity of the context and content that matters. Following
Peter Praet, former chief economist of the ECB, who argues ‘[a] multi-instrument
policy toolkit [UMPM] is more complex because it adds a further dimension to the

- 7 -
central bank reaction function’4, we posit that announcements of UMPM are more
complex in context and content. Hence, in the case of UMPM-events, we expect the
underreaction of the market to be even more pronounced.
H2: Complexity of central bank communication has a more negative impact on con-
temporaneous trading behaviour, when communication refers to unconventional
monetary policy measures.
Finally, we shed some light on the question of whether the unique communication
design of the ECB, where each press conference begins with a prepared introductory
statement and ends with a Q&A session attended by journalists, may mitigate the
underreaction of the market. Arguing that communication in Q&A sessions is less
formal and thus less complex, we hypothesise that Q&A sessions may be helpful for
reducing heterogeneity in information processing and opinions and thus attenuate the
underreaction of the market to complex news.
H3: There is a positive relationship between ECB communication complexity and a
temporal shift of trading activity to the Q&A session.
3 Sample and Descriptive Analysis
To test the three hypotheses, we analyse the effect of complexity in introductory
statements of the ECB press conferences using high-frequency trading volume data
4 See https://www.ecb.europa.eu/press/key/date/2017/html/ecb.sp171115.en.html (ac-
cessed Dec 2, 2020).

- 8 -
from European stock index futures. Our core sample contains all press conferences
from January 2009 to December 2017.5 It covers the aftermath of the 2008 financial
crises, when the ECB started conducting UMPM on a recurring basis. Specifically, it
covers the announcement of ECB’s first covered bond purchase programme on 07
May 2009 (see, e.g., Henseler and Rapp, 2018).
3.1 Introductory Statements to ECB Press Conferences
The main decision-making body of the ECB is the Governing Council, which assesses
economic and monetary developments and conducts monetary policy decisions on a
regular basis at the ECB’s premises in Frankfurt am Main, Germany.6 After GCMs, the
ECB issues a press statement at 13:45 CET on its interest rate decision, followed by
a press conference, where the monetary policy decisions are explained in detail by
the ECB’s president, sometimes supported by other members of the Executive Board.
A typical GCM press conference proceeds as follows. After the official start at 14:30
CET, the ECB’s president reads a prepared introductory statement, which covers the
GCM’s decisions, the underlying rationale, and a monetary policy outlook. This intro-
ductory statement takes between 10 and 20 minutes, with mean and median at 15
minutes (for our sample). Subsequently, a 40- to 60-minute Q&A session is held,
starting at around 14:50 CET. During this, local participants (usually press represent-
5 In the robustness checks, we extend the sample to cover the January 2003 to December
2017 period. Our results remain unaffected (see Section 5.1). 6 A detailed and comprehensive description of the Governing Council’s responsibilities can be
found at: https://www.ecb.europa.eu/ecb/orga/decisions/govc/html/index.en.html (ac-
cessed: 17 Feb 2019).
- 9 -
atives) ask questions, which are answered by the president. The Q&A session is ex-
plicitly intended to make the correspondence of the ECB as clear as possible (see,
e.g., Cœuré, 2018). The press conference concludes between 15:30 to 15:50 CET.
Searching the ECB webpage, we identify all GCM press conferences during our sample
period. For each press conference, we download transcripts of the introductory state-
ment and save it in a separate text file.7 We opt for analysing the GCM press confer-
ence introductory statements, since they represent an important and standardised
part of ECB communication (e.g., Hayo, Henseler, and Rapp, 2019): important, as it
embodies the communication as intended by the ECB, and standardised, as the state-
ments exhibit a common structure and duration. Still the statements differ in content
and, hence, provide an appropriate basis for comparative text analysis. Overall, our
sample covers 95 introductory statements.
3.2 Unconventional Monetary Policy Measures
In a detailed content analysis, we assess the introductory statements with regard to
the disclosure of Asset Purchase Programmes, Swap Agreements, Allotment Policy,
and/or Forward Guidance. If at least one of these topics is discussed substantively, a
dummy variable 𝑈𝑀𝑃𝑀 is coded 1 and 0 otherwise. A comprehensive list of the re-
sulting 34 press conference can be found in Table A1 in the Appendix.
7 ECB press conference transcripts with introductory statements and Q&A sessions are avail-
able at: https://www.ecb.europa.eu/press/pressconf.

- 10 -
3.3 Measuring Complexity of Introductory Statements
To quantify the latent dimension of comprehensibility, we follow the linguistic ap-
proach of Hernández-Murillo and Shell (2014) and Smales and Apergis (2017a,
2017b) and use the Flesch-Kincaid Grade Level (Kincaid, Fishburne, Rogers, and
Chissom, 1975) to measure complexity in the introductory statements.8
The Flesch-Kincaid Grade Level score (𝐹𝐾) is a linear function in the average sentence
length and the average word length measured in syllables. Technically, for a docu-
ment 𝑖 it is calculated as:
𝐹𝐾𝑖 = 0.39𝑡𝑜𝑡𝑎𝑙 𝑤𝑜𝑟𝑑𝑠𝑖
𝑡𝑜𝑡𝑎𝑙 𝑠𝑒𝑛𝑡𝑒𝑛𝑐𝑒𝑠𝑖+ 11.8
𝑡𝑜𝑡𝑎𝑙 𝑠𝑦𝑙𝑙𝑎𝑏𝑙𝑒𝑠𝑖𝑡𝑜𝑡𝑎𝑙 𝑤𝑜𝑟𝑑𝑠𝑖
− 15.59.
It is supposed to be equivalent to the US grade level of education and indicates the
required years of education to be able to understand the respective text. The Flesch-
Kincaid grade level approach can be applied to documents of arbitrary length. Con-
sider for instance, the following – rather complex – sentence from Mario Draghi’s
introductory statement to the ECB press conference on 4 September 2014: ‘The Eu-
rosystem will purchase a broad portfolio of simple and transparent asset-backed se-
curities (ABSs) with underlying assets consisting of claims against the euro area non-
financial private sector under an ABS purchase programme (ABSPP)’9. With 37 words
and 68 syllables, the Flesch-Kincaid grade level score of this sentence is 0.3937
1+
8 This approach is also applied in other fields of finance. For example, Smith and Taffler (1992),
You and Zhang (2009), and Miller (2010) investigate the effect of complexity in corporate
reports on subsequent trading volumes and stock-price movements. Loughran and McDonald
(2016) discuss the use of textual analysis and linguistic measures in accounting and finance. 9 https://www.ecb.europa.eu/press/pressconf/2014/html/is140904.en.html
(accessed: 29 Aug 2020).

- 11 -
11.8 68
37− 15.59 = 21, suggesting that a person needs to be a professional reader for full
comprehension.
We calculate the Flesch-Kincaid Grade Level score for all introductory statements us-
ing the quanteda package in R (Benoit et. al., 2018). To reduce the potential influence
of outliers, we define the variable 𝐶𝑜𝑚𝑝𝑙𝑒𝑥𝑖𝑡𝑦 as the log of this score.
3.4 Measuring Trading Volume
To proxy financial market trading activity, we use trading volume of the EURO-
STOXX-50 futures, since futures are highly liquid trading instruments that react
quickly to new information (see, e.g., Kuttner, 2001; Bomfim, 2003). The underlying
stock index, the EURO-STOXX 50 (ISIN: EU0009658145) with 50 large-cap constitu-
ents from the euro area, is one of the leading European stock indices. The corre-
sponding future (ISIN: DE0009652388) is traded on the EUREX and, with a tick-size
of 10, is widely considered the most liquid European stock index future.10
We retrieve trading volume at a 1-minute frequency from PortaraCQG and calculate
𝑉𝑜𝑙𝑢𝑚𝑒𝐼𝑛𝑡𝑟𝑜 as the natural logarithm of the mean trading volume (per minute) over
the 15-minute window from 14:30–14:45 CET. This period reflects the start of the
press conference and the average time span needed to read the introductory state-
ment. Correspondingly, we define 𝑉𝑜𝑙𝑢𝑚𝑒𝑄&𝐴 as the natural logarithm of the mean
10 According to Eurex Daily Statistics from 30 December 2016 and 29 December 2017, the
average annual trading volume of the EURO-STOXX-50 futures was roughly 328 million con-
tracts, corresponding to €10,474bn and an average daily trading volume of 1.35 million con-
tracts (Source: https://www.eurex.com/ex-en/data/statistics/trading-statistics, accessed 4
December 2020). In our sample, covering 2009-2017, the average trading during an intro-
ductory statement is some 4,600 contracts per minute, which is significantly more than the
(time-of-the day pattern adjusted) average trading volume per minute (see Figure 1).

- 12 -
trading volume (per minute) measured during the roughly 60 minutes long Q&A-ses-
sion (14:50–15:50 CET) and 𝑉𝑜𝑙𝑢𝑚𝑒𝐶𝑜𝑛𝑓 as the natural logarithm of the mean trading
volume (per minute) over the period of the whole press conference (14:30–15:50
CET).
3.5 Descriptive Analysis
In this subsection, we provide descriptive statistics about the linguistic complexity of
the introductory statements, as well as stylised facts and anecdotal evidence demon-
strating the relevance of our hypotheses. Specifically, with regard to the later, we
analyse (1) the trading activity around the press conferences, (2) the trading activ-
ity’s temporal distribution, and (3) its relationship with respect to complexity of the
introductory statements.
3.5.1 Linguistic Complexity of Introductory Statements
Calculating the Flesch-Kincaid Grade Level score for every introductory statement in
our sample, we find a mean score of 15.4 with a standard deviation of 0.6. This can
be roughly interpreted as 15 years of education are required to comprehend and fol-
low an average introductory statement of the ECB. For all statements, the observed
minimum and maximum values for the Flesch-Kincaid Grade Level are 14.2 and 16.5,
respectively. These statistics correspond with the findings of Coenen et al. (2017) and
demonstrate that the level of linguistic complexity of introductory statements is con-
sistently high. A descriptive summary of the Flesch-Kincaid Grade Level is provided
in Table A2 in the Appendix. Interestingly, we do not find a significant difference
between UMPM-events (15.5) and non-UMPM events (15.4).

- 13 -
To illustrate the disparity in complexity between introductory statement and Q&A ses-
sion, we also calculate the Flesch-Kincaid Grade Level score for the transcripts of the
Q&A sessions. With an average Flesch-Kincaid Grade Level of above 15 for the intro-
ductory statement (independent of the type of event) and below 11 for the Q&A ses-
sion (again, independent of the type of event), we discover a difference of more than
4 years of required education between the two forms of communication. Figure 1
shows these differences for all press conference, UMPM-events, and non-UMPM
events, respectively.
Figure 1: Complexity distribution of the ECB’s communication
Notes: Boxplot of Flesch-Kincaid Grade Level across introductory statements and Q&A ses-
sions, with observed values illustrated as jitter plot. Differentiation between UMPM-events
and non-UMPM events according to Table A1 in the Appendix.
Total sample UMPM events Non−UMPM events
Introductory Statement Q&A Introductory Statement Q&A Introductory Statement Q&A
9
11
13
15
Fle
sch
−K
inca
id I
nd
ex

- 14 -
We can see that in all three samples, statements are clearly more linguistically com-
plex than Q&A sessions. Moreover, the most complex Q&A session is less complex
than the least complex introductory statement. This supports our argument that com-
munication in Q&A sessions is less formal and thus less complex, and thus may help
to improve the flow of information and encourage trading.
3.5.2 Excess Trading Patterns
Next, we examine the EURO-STOXX-50 future trading activity during all GCM press
conferences in our sample to understand its extent and temporal distribution. To ex-
clude the effects stemming from common time-of-the-day patterns, we calculate ex-
cess trading volumes, defined as the difference between the mean trading volume
per minute from all event days (i.e., press conference days) minus the mean volume
per minute from non-event days (i.e., days without an ECB press conference). Figure
2 illustrates the mean excess trading volume for UMPM-events and non-UMPM events.
Three observations stand out. First, mean excess trading volume in stock index fu-
tures increases significantly a few minutes after the beginning of the GCM press con-
ferences (14:30 CET). The pattern is consistent with previous work on the effects of
ECB communication on financial markets (see, e.g., Andersson, 2010), and the view
that the introductory statement conveys relevant news for financial markets.11
Second, following a decline at the end of the introductory statement (at around 14:45
CET), the volume rises again with the beginning of the Q&A session (at around 14:50
CET). This suggests that the Q&A session provides additional information to financial
11 Note that these spikes in trading volumes are unlikely due to reactions to the Governing
Council’s interest rate decision, as the interest rate decision is communicated prior to the press
conference at 13:45 CET.

- 15 -
market participants. From 15:00 CET onwards, trading volumes slowly decrease until
the end of the Q&A session around 15:50 CET, when trading activity reverts to near
normal levels.
Figure 2: Excess trading pattern
Notes: Mean excess trading volume in stock index futures during the analysed GCM press
conferences. Calculation using mean excess trading volume for 1-minute intervals of the
EURO-STOXX-50 Future across all GCM days between January 2007 and December 2017.
Excess trading volume computed as mean EUREX trading volume across all GCM days minus
mean EUREX trading volume on non-meeting days over the same period. Differentiation
between UMPM-events and non-UMPM events according to Table A1 in the Appendix.
Third, Figure 2 highlights considerable differences between trading volume during
UMPM-events (grey) and non-UMPM events (black). In addition, the following conclu-
sions can be drawn: (i) trading volume tends to be higher during UMPM-events, (ii)
trading peaks later during UMPM events, and (iii) during the Q&A session, excess
trading volumes slow down faster for non-UMPM than for UMPM-events. This pattern
0
1000
2000
3000
4000
5000
14:30 14:45 14:50 15:50
CET
Exce
ss q
ua
ntity
of
tra
ded
fu
ture
con
tra
cts
Non−UMPM UMPM
- 16 -
is consistent with the view that financial market participants find UMPM-events rela-
tively more difficult to understand than non-UMPM events, which is why they tempo-
rarily underreact. The hike in trading activity especially during UMPM-events suggests
that the less complex Q&A session provides valuable information for market partici-
pants too.
3.5.3 Temporal Distribution of Trading Volumes
Next, we assess whether the temporal distribution of trading activity illustrated in
Figure 2 is representative for all events in our sample or whether it is simply a product
of aggregation over time. For each of our UMPM-events and non-UMPM events, Figure
3 plots the (logarithm of the) average trading volume during the Q&A session versus
the (logarithm of the) average trading volume during the introductory statement as
well as the corresponding event-specific regression lines.
Three main patterns are evident from Figure 2. First, there is a positive correlation
between the trading volumes in the two periods. This relationship is statistically sig-
nificant in both cases. Second, qualitatively, we find a steeper slope for the regression
line representing UMPM-events, suggesting that financial markets react with delayed
trading in case of UMPM events. Third, the quantitative relationship between trading
volume during the introductory statement and during the Q&A session can vary sub-
stantially. This indicates that the relationship is not perfectly linear and, therefore,
further variables appear to be relevant.

- 17 -
Figure 3: Temporal distribution of trading volumes
Notes: Cross-plot of trading volumes across introductory statements and Q&A sessions, with
observed values and a fitted regression line. Calculated using the natural logarithm of av-
erage (mean) minute trading volume of the EURO-STOXX-50 Future on EUREX all GCM days
between January 2009 and December 2017. Separation between 14:30–14:45 introductory
statement and 14:50–15:50 Q&A session. Differentiation between UMPM-events and non-
UMPM events according to Table A1 in the Appendix.
3.5.4 Trading Volumes and Complexity
Finally, we shift our focus to the ease of understanding of the transmitted information.
We analyse whether there is a relationship between the temporal distribution of trad-
ing volumes and the linguistic complexity of introductory statements.
In order to capture the temporal distribution of trading volumes in a single variable,
we calculate the difference of the logarithm of the average trading volume per minute
during the introductory statement, 𝑉𝑜𝑙𝑢𝑚𝑒𝐼𝑛𝑡𝑟𝑜, to the respective value for the Q&A
Non−UMPM
UMPM
7.0
7.5
8.0
8.5
9.0
7 8 9 10
Trading volume: Introductory statement
Tra
din
g v
olu
me
: Q
&A
se
ssio
n
Non−UMPM UMPM

- 18 -
session, 𝑉𝑜𝑙𝑢𝑚𝑒𝑄&𝐴. Figure 4 plots this log difference against the linguistic complexity
for each event.
Figure 4: Trading volumes and complexity
Notes: Temporal distribution of trading volumes and complexity. Calculation based on the
ratio of average (mean) minute trading volumes of the EURO-STOXX-50 Future on EUREX
over GCM days with during the 14:50–15:50 Q&A session divided by the 14:30–14:45 in-
troductory statement, with the natural logarithm applied to the fraction. Communication
complexity of GCM introductory statements is measured by the natural logarithm of the
Flesch-Kincaid Grade Level. Differentiation between UMPM-events and non-UMPM events
according to Table A1 in the Appendix.
For UMPM-events, the relationship between the complexity of the introductory state-
ments and the temporal distribution of trading volumes is positive, whereas it is
slightly negative for non-UMPM events. This pattern is consistent with the view of a
positive association between complexity and delayed trading. In other words, we find
evidence of an underreaction of the market in the case of UMPM-events.
Non−UMPM
UMPM
0.9
1.0
1.1
2.65 2.70 2.75 2.80
Complexity of the GCM introductory statement
Te
mpo
ral d
istr
ibutio
n o
f tr
ad
ing v
olu
mes
Non−UMPM UMPM

- 19 -
4 Regression Analysis
4.1 Empirical Design
To formally test our hypotheses, we estimate versions of the following regression:
(1) 𝑉𝑡 = 𝛼 + 𝛽1 ∙ 𝐶𝑜𝑚𝑝𝑙𝑒𝑥𝑖𝑡𝑦𝑡 + 𝛽2 ∙ 𝐶𝑜𝑚𝑝𝑙𝑒𝑥𝑖𝑡𝑦𝑡 ∙ 𝑈𝑀𝑃𝑀𝑡 + 𝛽3 ∙ 𝑈𝑀𝑃𝑀𝑡 + 𝛾 ∙ 𝐶𝑜𝑛𝑡𝑟𝑜𝑙𝑠𝑡 + 𝜀𝑡,
where 𝑉𝑡 measures trading behaviour at the event 𝑡 (i.e., the ECB press conference
following the Governing Council Meetings), 𝐶𝑜𝑚𝑝𝑙𝑒𝑥𝑖𝑡𝑦𝑡 the linguistic complexity of the
event's introductory statement, and 𝑈𝑀𝑃𝑀𝑡 the type of event. 𝛼 represents a constant,
𝐶𝑜𝑛𝑡𝑟𝑜𝑙𝑠𝑡 a vector of control variables, and 𝜀 the error term. Table 1 provides further
details of our variable definitions. The 𝛽𝑖’s are our coefficients of interest. Specifically,
arguing that UMPM-events are more complex in context and content, it is 𝛽2, the
coefficient of the interaction term, which is geared to reflect our argument that it is
not only the linguistic complexity of the transcripts that matters, but also the com-
plexity of the context and content.
We add three control variables to our regression. First, based on Kuttner (2001), we
capture the surprise effect in conventional monetary policy by long-term Bond Re-
turns. We use the log-return of the 10-year BUND future as traded on EUREX during
13:44–14:29 CET. Second, we use a Rate Change Dummy, which indicates whether
the ECB announced a change in its de-posit facility rate at 13:45 CET. Third, we
include ΔShadow Prime Rate, which captures monetary tightening as conveyed in the
ECB’s communications. In line with Hayo, Henseler, and Rapp (2019), we calculate
this measure using the Wordscores approach (Laver, Benoit and Garry, 2003), cali-
brated by using introductory statement transcripts of GCM press conferences from
1999–2006 and corresponding changes in the deposit facility rate.

- 20 -
Table 1: Overview of variable definitions
Dependent variables
Vt VolumeIntro ln(mean minute volume14:30-14:45 )
VolumeQ&A ln(mean minute volume14:50-15:50)
VolumeConf. ln(mean minute volume14:30-15:50)
Dt VolumeQ&A-to-Intro ln((mean minute volume14:50-15:50)/(mean minute vol-
ume14:30-14:45))
VolumeQ&A-to-Conf. ln((mean minute volume14:50-15:50)/(mean minute vol-
ume14:30-15:50))
Independent variables
Complexityt Flesch-Kincaid Grade Level for GCM introductory state-
ments,
calculated as: 0.39 • WS + 11.8 • SW – 15.59
WS = Total number of words divided by total number of
sentences
SW = Total number of syllables divided by total number
of words
Control variables
Controlst Bond Return ln(Price[14:29]/Price[13:44]), of EUREX traded EURO-
BUND Futures
Rate Change
Dummy
Deposit facility rate change announced at 13:45
(yes=1/no=0)
Δ Shadow Prime
Rate
Calculated using Wordscores, calibrated based on intro-
ductory statement transcripts of GCM press conferences
in 1999–2006 and corresponding changes in the deposit
facility rate
Notes: A descriptive summary of all variables can be found in Table A2 in the Appendix.
4.2 Regression Analysis
To assess the first two hypotheses, we regress statement complexity on trading vol-
ume. Table 2 reports the results for two measures of trading behaviour, 𝑉𝑜𝑙𝑢𝑚𝑒𝐼𝑛𝑡𝑟𝑜
and 𝑉𝑜𝑙𝑢𝑚𝑒𝐶𝑜𝑛𝑓, where 𝑉𝑜𝑙𝑢𝑚𝑒𝐼𝑛𝑡𝑟𝑜 measures trading volume during the introductory
statement and 𝑉𝑜𝑙𝑢𝑚𝑒𝐶𝑜𝑛𝑓 during the aggregate press conference.12 For each of the
volume measures, we estimate three specifications.
12 We confirm the results presented here in unreported tests, where we use (i) corresponding measures of excess trading volume and (ii) an alternative measure for 𝑉𝑜𝑙𝑢𝑚𝑒𝐼𝑛𝑡𝑟𝑜, which we
define as the logarithm of average trading volume defined over the period 14:35-14:45 CET
aiming to get rid of potential noise trading and make sure we capture the effect of the intro-
ductory statement only.

- 21 -
The results can be summarised as follows. First, Specification (1) and (4) reveal that
linguistic complexity of introductory statements is negatively (but insignificantly) cor-
related with contemporaneous trading activity. While this is consistent with our first
hypothesis (H1), the coefficients are far from significant. Essentially, the results from
these tow specifications suggest that overall for the period 2009-2017 linguistic com-
plexity of introductory statements uncorrelated with contemporaneous trading activ-
ity, which is in contrast to the findings of Smales and Apergis (2017a, 2017b) for
FOMC statements.
Table 2: Analysis of trading volume
Dependent variable:
VolumeIntro VolumeConf
(1) (2) (3) (4) (5) (6)
Complexity -0.89 3.23 2.73 -0.67 1.92 1.46
(1.74) (2.00) (1.98) (1.34) (1.56) (1.51)
Complexity*UMPM -12.42*** -9.87*** -7.90*** -5.57**
(3.44) (3.61) (2.69) (2.76)
UMPM 34.16*** 27.12*** 21.81*** 15.35**
(9.41) (9.89) (7.34) (7.56)
Bond_Return 0.57 0.47*
(0.35) (0.27)
Rate_Change_Dummy 0.32 0.35**
(0.20) (0.15)
∆Shadow Rate 0.26 0.25*
(0.19) (0.14)
Constant 10.63** -0.71 0.67 9.79*** 2.63 3.89
(4.76) (5.47) (5.41) (3.67) (4.27) (4.14)

- 22 -
Observations 95 95 95 95 95 95
R2 0.003 0.15 0.21 0.003 0.12 0.22
Notes: Coefficients are estimated using an OLS regression. Standard errors are displayed in
parentheses. ***, **, * indicate significance at the 1, 5, and 10 per cent level, respectively.
Second, Specification (2) and (5) document an event-differentiated correlation of lin-
guistic complexity with trading activity in financial markets. While the coefficient of
𝐶𝑜𝑚𝑝𝑙𝑒𝑥𝑖𝑡𝑦 is positive (but insignificant), the coefficient of the interaction term
𝐶𝑜𝑚𝑝𝑙𝑒𝑥𝑖𝑡𝑦𝑡 ∙ 𝑈𝑀𝑃𝑀𝑡 is negative and highly significant. The sum of the coefficients, i.e.
𝛽1 + 𝛽2, in Specification (2) is −9.13 (with a standard deviation of 2.47) and highly
significant (𝑝 < .01).13 This is not only consistent with You and Zhang (2009) and Miller
(2010) who propose a negative relationship between information complexity and trad-
ing behaviour and our second hypothesis (H2), but also economically meaningful:
Specifically, Specification (2) suggests that an increase in complexity by 1% is asso-
ciated with a decrease in trading volume by up to 9%, or some 420 contracts per
minute. Relatedly, a hike in the Flesch-Kincaid Grade Level index by one year beyond
the average (i.e., from 15.4 to 16.4) is on average accompanied by a reduction in
trading volumes by some 2,760 contracts per minute (about 75% of the standard
deviation).
Third, Specification (3) and (6) document that these results remain intact, when we
add our control variables. However, the coefficients of the interaction term decrease
and thus the estimated correlation of linguistic complexity with trading activity in case
of an UMPM event. Specifically, the sum of the coefficients 𝛽1 and 𝛽2 are −7.1 and −4.1
13 For Specification (5) the coefficients add up to −5.98 with a standard deviation of 2.37, which
is significant at the 5%-level.

- 23 -
in Specification (3) and Specification (6), respectively. Finally, looking at the coeffi-
cients 𝛽2 and 𝛽3 of Specification (2), we find, consistent with Figure 2, that for an
UMPM-event of average 𝐶𝑜𝑚𝑝𝑙𝑒𝑥𝑖𝑡𝑦, which is −2.7, contemporaneous trading volume
is about 23% (𝑝 < .10) higher than for a non-UMPM event with similar 𝐶𝑜𝑚𝑝𝑙𝑒𝑥𝑖𝑡𝑦.
In sum, the results from Table 2 are consistent with our argument that is not only the
linguistic complexity of the transcripts that matters, but also the complexity of the
context and content that matters and a market that underreacts to complex central
bank communication.
To assess our third hypothesis, we turn to the temporal distribution of trading activity.
Table 3 reports results for two measures of temporal distribution of trading activity,
𝑉𝑜𝑙𝑢𝑚𝑒𝑄&𝐴−𝑡𝑜−𝐼𝑛𝑡𝑟𝑜 and 𝑉𝑜𝑙𝑢𝑚𝑒𝑄&𝐴−𝑡𝑜−𝐶𝑜𝑛𝑓, which are defined as the difference between
𝑉𝑜𝑙𝑢𝑚𝑒𝑄&𝐴 and 𝑉𝑜𝑙𝑢𝑚𝑒𝐼𝑛𝑡𝑟𝑜 and 𝑉𝑜𝑙𝑢𝑚𝑒𝑄&𝐴 and 𝑉𝑜𝑙𝑢𝑚𝑒𝐶𝑜𝑛𝑓, respectively. Again, for each
of the measures, we estimate three specifications.
The results can be summarised as follows. First, Specification (1) and (4) reveal that
linguistic complexity of introductory statements is positively (but insignificantly) cor-
related with delayed trading activity. While this is consistent with our third hypothesis
(H3), the coefficients are far from significant.
Second, again we find an event-differentiated correlation of linguistic complexity with
trading activity in financial markets.14 While in Specification (2) and (5) the coefficient
14 We confirm the results presented here in unreported tests, where we also control for the
complexity of Q&A statements and allow the complexity of Q&A statements to interact with 𝑈𝑀𝑃𝑀.

- 24 -
of 𝐶𝑜𝑚𝑝𝑙𝑒𝑥𝑖𝑡𝑦 is negative (but insignificant), the coefficient of the interaction term
𝐶𝑜𝑚𝑝𝑙𝑒𝑥𝑖𝑡𝑦𝑡 ∙ 𝑈𝑀𝑃𝑀𝑡 is positive and significant. The sum of the coefficients, i.e. 𝛽1 + 𝛽2,
in Specification (2) is 4.6 (with a standard deviation of 1.8) and significant (𝑝 < .05).15
Third, Specification (3) and (6) document that these results remain intact, when we
add our control variables. However, the coefficients of the interaction term are slightly
lower. Finally, looking at the coefficients 𝛽2 and 𝛽3 of Specification (2), we find no
significant difference between UMPM-events and non-UMPM events for average
𝐶𝑜𝑚𝑝𝑙𝑒𝑥𝑖𝑡𝑦 (𝑝 > .30).
Table 3: Analysis of the temporal distribution of trading volume
Dependent variable:
VolumeQ&A-to-Intro VolumeQ&A-to-Conf.
(1) (2) (3) (4) (5) (6)
Complexity 0.56 -1.49 -1.44 0.35 -0.18 -0.18
(1.26) (1.53) (1.56) (0.34) (0.42) (0.43)
Complexity*UMPM 6.05** 5.80** 1.53** 1.49*
(2.63) (2.85) (0.71) (0.78)
UMPM -16.52** -15.82** -4.16** -4.05*
(7.17) (7.80) (1.95) (2.12)
Bond_Return -0.09 0.01
(0.28) (0.08)
Rate_Change_Dummy 0.02 -0.001
(0.16) (0.04)
∆Shadow Rate -0.01 -0.01
(0.15) (0.04)
Constant -1.88 3.72 3.59 -1.04 0.39 0.37
15 For Specification (5) the coefficients add up to 1.35 with a standard deviation of 0.52, which
again is significant at the 5%-level.

- 25 -
(3.45) (4.17) (4.27) (0.94) (1.13) (1.16)
Observations 95 95 95 95 95 95
R2 0.002 0.06 0.06 0.01 0.06 0.06
Notes: Coefficients are estimated using an OLS regression. Standard errors are displayed in
parentheses. ***, **, * indicate significance at the 1, 5, and 10 per cent level, respec-
tively.
In sum, the results from Table 3 again are consistent with our argument that markets
underreact to complex central bank communication and delay trading. Moreover, the
results suggest that trading is not uniformly delayed, but – for UMPM events – gains
momentum with the beginning of the Q&A session, which supports our third hypoth-
esis (H3).
4.3 Additional Analysis
In this section, we aim to shed some light on the difference between UMPM-events
and non-UMPM events. Therefore, we investigate whether UMPM-announcements
contain more novel information than standard announcements, i.e. whether they are
more ‘unconventional’. Specifically, we employ Amaya and Filbien’s (2015) similarity
index to assess the degree of homogeneity between different statements.
To calculate the index, we (i) remove all numbers, dates, and stop words, and (ii)
construct word bi-grams (two-word combinations) in order to capture combined ex-
pressions, for example, ‘quantitative easing’. We calculate the cosine similarity of two
subsequent introductory statements for all events in our sample, as follows:
𝑆𝑖𝑚𝑖𝑙𝑎𝑟𝑖𝑡𝑦𝑡 =∑ fr𝑏,𝑡∙fr𝑏,𝑡−1𝐵𝑏=1
√∑ frb,t2B
b=1 ∙√∑ frb,t−12B
b=1
,

- 26 -
where B represents the total number of unique bi-grams in all press releases and frb,t
and frb,t-1 are the frequencies of bi-gram b in press releases t and t-1, respectively.
To illustrate the idea of our similarity measure, consider the following two sentences:
‘The Governing Council expects the euro area economy to grow at a moderate pace
in 2010’ and ‘We expect price stability to be maintained over the medium term,
thereby supporting the purchasing power of euro area households’ from two intro-
ductory statements from 2010. They contain one shared bigram (euro_area) and 34
unique bigrams (the_governing, governing_council, council_expects, …). The similar-
ity index value of those two sentences is 1
35= 0.03. Comparing longer texts tends to
increase the value of the index, as the probability of recurring bigrams rises. In our
sample, the similarity index has an average score of 0.44, indicating that 44% of all
bigrams in an introductory statement occurred in the previous one too.
To assess whether UMPM announcements differ from non-UMPM announcements, we
run the following regression:
(2) 𝑆𝑖𝑚𝑖𝑙𝑎𝑟𝑖𝑡𝑦(𝑡 𝑎𝑛𝑑 𝑡 − 1)𝑡 = 𝛼 + 𝛽 ∙ 𝑈𝑀𝑃𝑀𝑡 + 𝛾 ∙ 𝑆𝑖𝑚𝑖𝑙𝑎𝑟𝑖𝑡𝑦(𝑡 𝑎𝑛𝑑 𝑡 − 2)𝑡 + 𝜀𝑡,
Note that Amaya and Filbien (2015) find that ECB introductory statements become
more similar over time. To capture this development, we include a delayed sentiment
index as a regressor. It is based on comparing the content of the current statement
with the text of the statement in t-2. The Durbin-Watson Test supports our choice of
the delayed sentiment term.
Table 4 reports the estimation results. The UMPM-Dummy is statistically significant
and economically relevant. Statements with UMPM announcements are 3% less sim-

- 27 -
ilar to the previous period statements than statements without UMPM announce-
ments. Given an average of 1420 bigrams, this increases the number of unique bi-
grams by 45. Since UMPM announcements do not significantly differ in length from
other announcements, they appear to contain more ‘novel’ information. Arguably, it
is this new information that drives the previous results. That is, through the deviation
from ‘standard’ announcements, complexity increases traders’ cognitive costs, which
causes them to postpone their trading decisions to the ‘easier’ Q&A session. These
findings do not change when controlling for the previous event type (i.e. using a
lagged UMPM-Dummy and interaction terms).16
Table 4: Similarity analysis
Dependent variable:
Similarity(t and t-1)
UMPM-Dummy -0.03**
(0.01)
Similarity(t and t-2) 0.87***
(0.07)
Constant 0.14***
(0.02)
Observations 96
R2 0.66
Notes: Coefficients are estimated using an OLS regression. Standard errors are displayed in
parentheses. ***, **, * indicate significance at the 1, 5, and 10 per cent level, respec-
tively.
16 All omitted results here and elsewhere in the paper are available on request.

- 28 -
In a next step, we analyse the similarity between introductory statement and Q&A
session. First, there is a remarkably strong similarity between the two institutionalised
forms of communication. Given that Figure 1 suggests considerable differences in
linguistic structure, an average similarity index of about 0.2 provides empirical evi-
dence that the substance of the Q&A session is close to the preceding introductory
statement. Second, the degree of similarity between introductory statement and Q&A
session does not differ during UMPM-events, which suggests that traders can gener-
ally rely on Q&A questions to clarify the more complex content of the introductory
statement.
These findings complement our previous results, namely (1) linguistic complexity of
Q&A sessions is lower than that of introductory statements, (2) for UMPM-events with
high linguistic complexity trading is delayed to Q&A sessions, and (3) the similarity
between subsequent press conferences is lower for UMPM-events. Thus, we discover
empirical evidence supporting the following transmission process from statement
complexity to financial market trading behaviour: Traders realise that introductory
statements referring to UMPM's are complex and contain relatively more novel infor-
mation. While this causes traders to underreact to the new information, the discussion
and clarification of the cognitively costly content during the subsequent Q&A session
mitigates this effect. An outcome of this process is that parts of the trading shifts
from the statement phase to the Q&A phase of the ECB’s press conference.

- 29 -
5 Robustness of Results
As robustness tests, we (1) increase the time horizon, (2) address the concept of
vagueness in our complexity metric, (3) consider alternative measures for the latent
variable of complexity, and (4) determine complexity via factor analyses based on
multiple complexity measures as well as further communication-related measures.
5.1 Time Horizon
To incorporate events prior to the period of the effective lower bound, we increase
the observation period to January 2003 until December 2017. This extension roughly
doubles the number of observations to around 163 press conferences. The estimation
results for extending the sample are presented in Table 5 and demonstrate that our
previous findings are robust. In addition to the earlier results and similar to the results
of Smales and Apergis (2017a, 2017b) for the FOMC, for non-UMPM-events the rela-
tionship between complexity and trading volume is now statistically significant.
Table 5: Robustness check - Time horizon
Dependent variables
VolumeIntro VolumeConf VolumeQ&A-to-Intro VolumeQ&A-to-Conf.
H2 H3
(1) (2) (3) (4)
Complexity 4.39*** 3.16*** -1.72** -0.49**
(1.11) (0.92) (0.76) (0.21)
Complexity*UMPM -13.35*** -9.17*** 5.99** 1.82***
(3.58) (2.96) (2.44) (0.68)
UMPM 37.14*** 25.67*** -16.44** -4.96***

- 30 -
(9.79) (8.09) (6.68) (1.86)
Bond_Return 0.53 0.35 -0.21 -0.03
(0.34) (0.28) (0.23) (0.06)
Rate_Change 0.21 0.26* 0.06 0.02
(0.17) (0.14) (0.11) (0.03)
∆Shadow Rate -0.14 -0.13 0.01 0.01
(0.19) (0.16) (0.13) (0.04)
Constant -4.32 -1.16 4.41** 1.25**
(3.02) (2.50) (2.06) (0.57)
Observations 163 163 163 163
R2 0.24 0.24 0.07 0.06
Notes: Coefficients are estimated using an OLS regression. Standard errors are dis-
played in parentheses. ***, **, * indicate significance at the 1, 5, and 10 per cent
level, respectively.
5.2 Complexity or Vague Talk
Next, we examine the possibility that the Flesch-Kincaid Grade Level metric may bet-
ter be interpreted as an indicator for vagueness rather than complexity. We argue
that complexity is a proxy for the cognitive cost of comprehending the content. How-
ever, vagueness also generates information that is difficult to follow, but originates
from a lack of clarity. The Flesch-Kincaid Grade Level index consists of two compo-
nents, the average length of a sentence (WS) and the average word length (SW):
𝐹𝐾𝑖 = 0.39 𝑡𝑜𝑡𝑎𝑙 𝑤𝑜𝑟𝑑𝑠𝑖𝑡𝑜𝑡𝑎𝑙 𝑠𝑒𝑛𝑡𝑒𝑛𝑐𝑒𝑖⏟
𝑊𝑆
+ 11.8 𝑡𝑜𝑡𝑎𝑙 𝑠𝑦𝑙𝑙𝑎𝑏𝑙𝑒𝑠𝑖𝑡𝑜𝑡𝑎𝑙 𝑤𝑜𝑟𝑑𝑠𝑖⏟
𝑆𝑊
− 15.59,
- 31 -
Longer sentences, i.e. higher WS, may be associated with both, more complexity and
more vagueness, whereas the use of longer words, i.e. higher SW, should only affect
comprehensibility. In other words, SW measures complexity but not vagueness,
whereas WS is a representation of complexity and vagueness.
Disaggregating the Flesch-Kincaid Grade Level into these two components, we dis-
cover that the correlation between SW and the complete index is almost 90%, com-
pared to around 10% for WS. Furthermore, if we include SW and WS in our regression
model (see Table 6), we find that SW (i.e. 'complexity') appears to drive our results
rather than WS ('vagueness'). Qualitatively, this conclusion holds for both hypotheses
but only the estimates for H2 are statistically significant.

- 32 -
Table 6: Robustness check – Vague talk
Dependent variable:
VolumeIntro VolumeConf VolumeQ&A-to-Intro VolumeQ&A-to-Conf.
H2 H3
(1) (2) (3) (4) (5) (6) (7) (8)
SW 1.76 1.49 -0.26 0.003
(1.39) (1.04) (1.09) (0.30)
WS -3.48 -6.07 -2.59 0.001
(6.81) (5.08) (5.31) (1.44)
SW*UMPM -5.71** -3.90** 2.44 0.62
(2.59) (1.95) (2.04) (0.56)
WS*UMPM -15.08 -7.51 11.30 3.74
(14.47) (10.80) (11.29) (3.06)
UMPM 18.47** 9.01 12.64** 4.51 -7.80 -6.68 -1.96 -2.18
(8.34) (8.61) (6.28) (6.42) (6.57) (6.72) (1.79) (1.82)
∆Shadow Rate 0.29 0.30 0.26* 0.23 -0.06 -0.08 -0.03 -0.02
(0.19) (0.20) (0.14) (0.15) (0.15) (0.16) (0.04) (0.04)
Bond_Return 0.71** 0.65* 0.55** 0.52* -0.18 -0.13 -0.02 0.004
(0.35) (0.37) (0.26) (0.28) (0.28) (0.29) (0.08) (0.08)
Rate_Change_Dummy 0.34* 0.31 0.36** 0.35** 0.01 0.06 -0.005 0.01
(0.20) (0.21) (0.15) (0.16) (0.16) (0.16) (0.04) (0.04)
Constant 2.52 10.22** 3.12 11.53*** 0.48 1.20 -0.12 -0.11
(4.42) (4.11) (3.33) (3.06) (3.49) (3.20) (0.95) (0.87)
Observations 95 95 95 95 95 95 95 95
R2 0.18 0.16 0.22 0.21 0.03 0.02 0.04 0.04
Notes: Coefficients are estimated using an OLS regression. Standard errors are displayed in
parentheses. ***, **, * indicate significance at the 1, 5, and 10 per cent level, respectively.

- 33 -
5.3 Alternative Measures of Complexity
Our operationalisation of the latent complexity variable in the form of the Flesch-
Kincaid Grade Level follows Smales and Apergis (2017a, 2017b). To demonstrate that
our results do not depend on this choice, we employ a variety of alternatives. The
most common measures for linguistic complexity are the Flesch Reading Ease (Flesch,
1948), the Gunning Fog Index (Gunning, 1952), the SMOG Index (McLaughlin, 1969),
the Coleman-Liau Index (Coleman and Liau, 1975), and the Automated Readability
Index (Senter and Smith, 1967). Table 7 sets out the respective definitions.
Table 7: Definitions of Alternative Complexity Measures
Complexity measures
Flesch Reading Ease 1/(206.835 − 1.015 ∙ WS − 84.6 ∙ SW)
(inverted) WS = #words divided by #sentences; SW = #syllables divided
by #words
Gunning Fog Index 0.4 ∙ WS + 40 ∙ CWW
WS = #words divided by #sentences; CWW = #complex words
divided by #words
SMOG Index 1.0430 ∙ √PS ∙ (30 𝑆⁄ ) + 3.1291
PS = #polysyllables (3 or more syllables); S = #sentences
Coleman-Liau Index 5.88 ∗ AL + (0.296 ∗ Nst / Nw) − 15.8
AL = Average #letters per 100 words; AS = Average #sentences
per 100 words
Automated Readability 4.71 ∙ (C W⁄ ) + 0.5 ∙ (W S⁄ ) − 21.43
Index C = #characters; W = #words; S = #sentences
Notes: We use the inverse of the Flesch Reading Ease, so as to ensure that for all indica-
tors larger values represent a higher degree of complexity.
Table 8 reports the estimated coefficients for Equation (1) for the various complexity
measures indicators. We include all control variables, but only report the coefficients
for the interaction term between UCPM and the respective complexity measurement.
Regardless of the underlying complexity definition, the coefficients have the expected
sign and most of them are significant at the 10% level or below. Thus, we conclude
that our results are generally robust with regard to the definition of complexity.
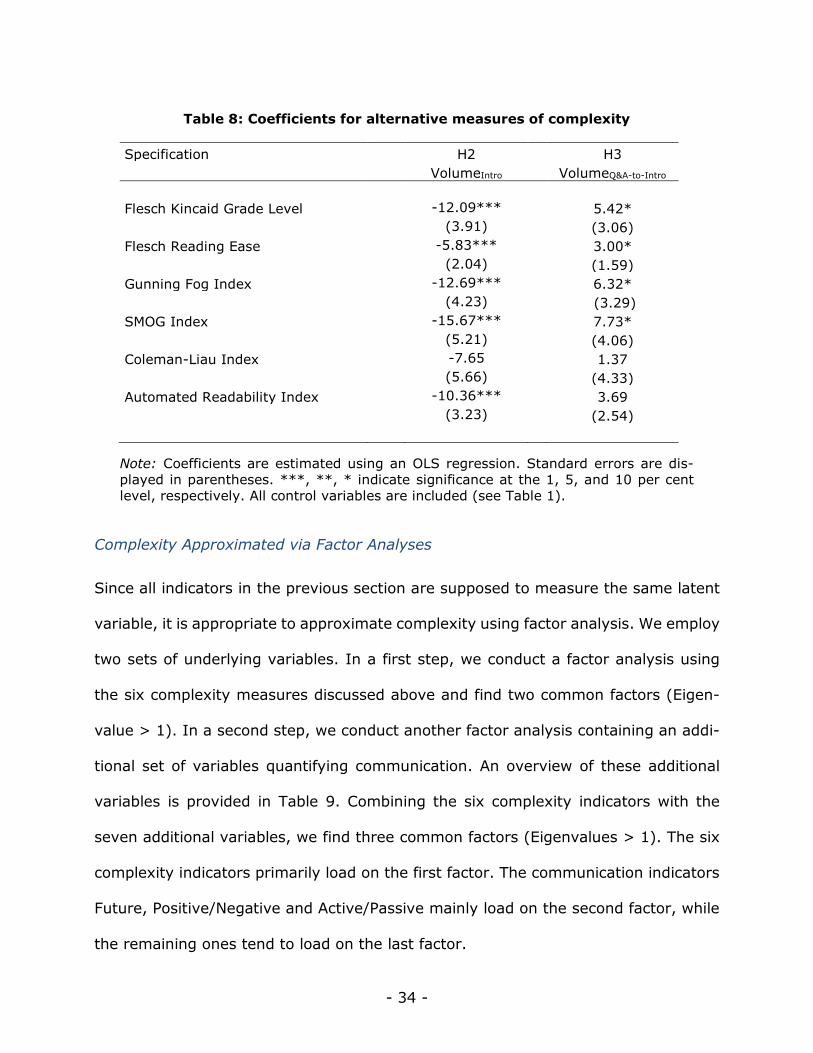
- 34 -
Table 8: Coefficients for alternative measures of complexity
Specification H2 H3
VolumeIntro VolumeQ&A-to-Intro
Flesch Kincaid Grade Level -12.09*** 5.42*
(3.91) (3.06)
Flesch Reading Ease -5.83*** 3.00*
(2.04) (1.59)
Gunning Fog Index -12.69*** 6.32*
(4.23) (3.29)
SMOG Index -15.67*** 7.73*
(5.21) (4.06)
Coleman-Liau Index -7.65 1.37
(5.66) (4.33)
Automated Readability Index -10.36*** 3.69
(3.23) (2.54)
Note: Coefficients are estimated using an OLS regression. Standard errors are dis-
played in parentheses. ***, **, * indicate significance at the 1, 5, and 10 per cent
level, respectively. All control variables are included (see Table 1).
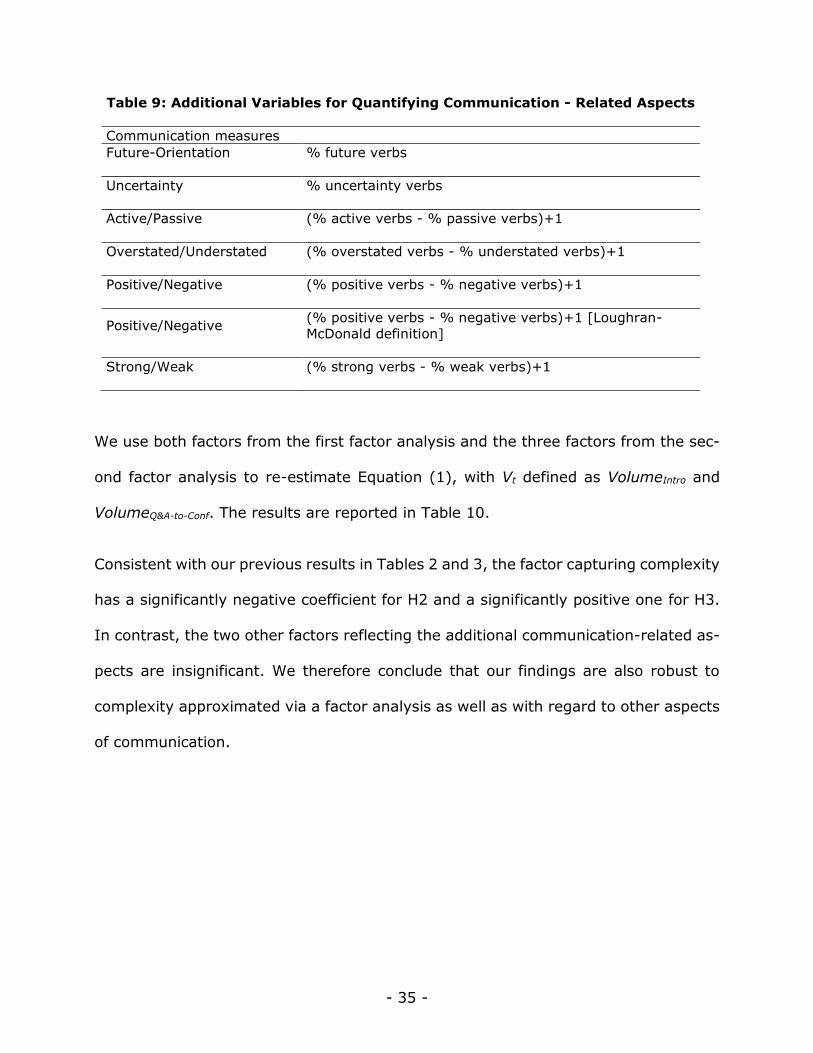
Complexity Approximated via Factor Analyses
Since all indicators in the previous section are supposed to measure the same latent
variable, it is appropriate to approximate complexity using factor analysis. We employ
two sets of underlying variables. In a first step, we conduct a factor analysis using
the six complexity measures discussed above and find two common factors (Eigen-
value > 1). In a second step, we conduct another factor analysis containing an addi-
tional set of variables quantifying communication. An overview of these additional
variables is provided in Table 9. Combining the six complexity indicators with the
seven additional variables, we find three common factors (Eigenvalues > 1). The six
complexity indicators primarily load on the first factor. The communication indicators
Future, Positive/Negative and Active/Passive mainly load on the second factor, while
the remaining ones tend to load on the last factor.
- 35 -
Table 9: Additional Variables for Quantifying Communication - Related Aspects
Communication measures
Future-Orientation % future verbs
Uncertainty % uncertainty verbs
Active/Passive (% active verbs - % passive verbs)+1
Overstated/Understated (% overstated verbs - % understated verbs)+1
Positive/Negative (% positive verbs - % negative verbs)+1
Positive/Negative (% positive verbs - % negative verbs)+1 [Loughran-
McDonald definition]
Strong/Weak (% strong verbs - % weak verbs)+1
We use both factors from the first factor analysis and the three factors from the sec-
ond factor analysis to re-estimate Equation (1), with Vt defined as VolumeIntro and
VolumeQ&A-to-Conf. The results are reported in Table 10.
Consistent with our previous results in Tables 2 and 3, the factor capturing complexity
has a significantly negative coefficient for H2 and a significantly positive one for H3.
In contrast, the two other factors reflecting the additional communication-related as-
pects are insignificant. We therefore conclude that our findings are also robust to
complexity approximated via a factor analysis as well as with regard to other aspects
of communication.

- 36 -
Table 10: Coefficients for complexity measures based on factor analysis
Panel A: Factor Analysis (Complexity
Measures)
Specification
H2
VolumeIntro
H3
VolumeQ&A-to-Conf
Factor 1*UMPM-Dummy -0.42*** 0.06*
(0.15) (0.03)
Factor 2*UMPM-Dummy -0.26 0.05
(0.19) (0.04)
Observations 91 91
R2 0.21 0.08
Panel B: Factor Analysis: Complexity
+ Add. Measures)
Specification H2 H3
Factor 1*UMPM-Dummy -0.48*** 0.06*
(0.16) (0.03)
Factor 2*UMPM-Dummy 0.24 -0.03
(0.15) (0.03)
Factor 3*UMPM-Dummy -0.05 0.03
(0.16) (0.04)
Observations 91 91
R2 0.29 0.11
Notes: Coefficients are estimated using an OLS regression. Standard errors are dis-
played in parentheses. ***, **, * indicate significance at the 1, 5, and 10 per cent
level, respectively. All control variables are included (see Table 1).
6 Conclusion
In this paper, we assess the effects of central bank communication complexity on
trading behaviour of financial market participants. Our analysis covers the official ECB
press conference following regular GCMs between January 2009 and December 2017,
during which unprecedented UMPM substantially increased communication complex-
ity. Examining the transcripts of the introductory statements and using high-fre-
quency data on European stock index futures, we investigate whether complexity of
ECB communication affects contemporaneous trading in financial markets.

- 37 -
Our findings can be summarised as follows. First, differentiating between UMPM-
events and non-UMPM-events, we do not find evidence for any difference in the lin-
guistic complexity of introductory statements. Second, we discover a negative rela-
tionship between ECB communication complexity and contemporaneous trading vol-
ume during events where unconventional monetary policy is discussed. This event-
differentiated underreaction of the market suggests, that when the ECB shares infor-
mation with financial markets, it is not only the linguistic complexity of the commu-
nication that matters, but also the complexity of the context and content. To support
this view, we demonstrate that more ‘novel’ information is transmitted during UMPM-
related press conferences than during other press conferences. These findings, which
are in line with results reported by You and Zhang (2009) and Miller (2010) and
consistent with the argument that investors underreact to cognitively costly/complex
information (Hirshleifer, 2001; Hong and Stein, 1999; McEwen and Hunton, 1999),
extent the findings of Smales and Apergis (2017a, 2017b) for the Federal Reserve.
Finally, we shed some light on the question of whether the ECB’s Q&A-sessions may
help to mitigate the underreaction of the market. Consistent with that view, we find
a positive relationship between the complexity of ECB communication in UMPM-events
and a shift of trading activity from introductory statement to Q&A session.
Going forward, promising future research could focus on the question of what drives
complexity of central bank communication and whether, in case of the ECB, a shift of
trading activity to Q&A sessions can be explained by Q&A sessions effectively miti-
gating complexity issues. In addition, it would be interesting examine whether our
findings apply to other central banks and other forms of central bank communication.

- 38 -
This could help to identify best practices for central banks’ communication strategies
vis-à-vis financial markets.

- 39 -
Acknowledgments
Funding: The academic work of Kai Henseler is financially supported by a scholar-
ship from the Konrad-Adenauer Foundation.

- 40 -
References
Amaya, D., & Filbien, J. Y. (2015). The Similarity of ECB’s Communication. Finance Research
Letters, 13, 234–242.
Andersson, M. (2010). Using Intraday Data to Gauge Financial Market Responses to Federal
Reserve and ECB Monetary Policy Decisions. International Journal of Central Banking,
6(2), 117–146.
Apel, M., & Grimaldi, M. (2014). How Informative are Central Bank Minutes?. Review of Eco-
nomics/Jahrbuch für Wirtschaftswissenschaften, 65(1).
Benoit, K., Watanabe, K., Wang, H., Nulty, P., Obeng, A., Müller, S., & Matsuo, A. (2018).
quanteda: An R Package for the Quantitative Analysis of Textual Data. Journal of Open
Source Software, 3(30), 774.
Bernanke, B. S., & Kuttner, K. N. (2005). What Explains the Stock Market’s Reaction to Federal
Reserve Policy? Journal of Finance, 60(3), 1221–1257.
Blinder, A. S., Ehrmann, M., Fratzscher, M., De Haan, J., & Jansen, D.-J. (2008). Central Bank
Communication and Monetary Policy: A Survey of Theory and Evidence. Journal of Eco-
nomic Literature, 46(4), 910–945.
Boguth, O., Grégoire, V., & Martineau, C. (2019). Shaping Expectations and Coordinating At-
tention: The Unintended Consequences of FOMC Press Conferences. Journal of Financial
and Quantitative Analysis, 54(6), 2327-2353.
Bomfim, A. N. (2003). Pre-Announcement Effects, News Effects, and Volatility: Monetary Pol-
icy and the Stock Market. Journal of Banking & Finance, 27(1), 133-151.
Bowdler, C. and Radia, A. (2012), Unconventional Monetary Policy: The Assessment. Oxford
Review of Economic Policy 28(4), 603–621.
Brand, C., Buncic, D., & Turunen, J. (2010). The Impact of ECB Monetary Policy Decisions and
Communication on the Yield Curve. Journal of the European Economic Association,
8(6), 1266–1298.
Bulíř, A., Čihák, M., & Jansen, D.-J. (2013a). What Drives Clarity of Central Bank Communi-
cation About Inflation? Open Economies Review 24, 125–145
Bulíř, A., Čihák, M., & Šmídková, K. (2013b). Writing Clearly: The ECB’s Monetary Policy Com-
munication. German Economic Review 14, 50–72.
Coenen, G., Ehrmann, M., Gaballo, G., Hoffmann, P., Nakov, A., Nardelli, S., Persson, E. &
Strasser, G. (2017) Communication of Monetary Policy in Unconventional Times. ECB
Working Paper No. 2080
Cœuré, B. (2018). Central Banking in Times of Complexity. Sveriges Riksbank’s 350th Anni-
versary. Stockholm, Sweden.
Coleman, M., & Liau, T. L. (1975). A Computer Readability Formula Designed for Machine
Scoring. Journal of Applied Psychology, 60(2), 283.
Cukierman, A., & Meltzer, A. H. (1986). A Theory of Ambiguity, Credibility, and Inflation Under
Discretion and Asymmetric Information. Econometrica, 54(5), 1099.

- 41 -
de Haan, J., & Sturm, J.-E. (2019), Central Bank Communication: How to Manage Expecta-
tions? In: The Oxford Handbook of the Economics of Central Banking (edited by David
G. Mayes, Pierre L. Siklos, and Jan-Egbert Sturm).
Dell’Ariccia, G., Rabanal, P., & Sandri, D. (2018). Unconventional Monetary Policy in the Euro
Area, Japan, and the United Kingdom. Journal of Economic Perspectives, 32, 147-172.
Ehrmann, M., & Talmi, J. (2020). Starting from a Blank Page? Semantic Similarity in Central
Bank Communication and Market Volatility, Journal of Monetary Economics 111(May),
48-62.
Fama, E. F (1979). Efficient Capital Markets, A Review of Theory and Empirical Work. Journal
of Finance 25(2), 383–417.
Flesch, R. (1948). A New Readibility Yardstick. Journal of Applied Psychology, 32(3), 221.
Funke, N., & Matsuda, A. (2006). Macroeconomic News and Stock Returns in the United States
and Germany. German Economic Review, 7(2), 189–210.
Grossman, S. J., & Stiglitz, J. E. (1976). Information and Competitive Price Systems. American
Economic Review, 66(2), 246–253.
Gunning, R. (1952). The Technique of Clear Writing. New York City, USA: McGraw-Hill.
Gurkaynak, R. S., Sack, B. P., & Swanson, E. T. (2005). Do Actions Speak Louder than Words?
The Response of Asset Prices to Monetary Policy Actions and Statements. International
Journal of Central Banking, 1(1), 55–93.
Hansen, S., McMahon, M., & Prat, A. (2018). Transparency and Deliberation Within the FOMC:
A Computational Linguistics Approach. Quarterly Journal of Economics, 133(2), 801–
870.
Hanson, S., & Stein, J. (2015). Monetary Policy and Long-term Real Rates. Journal of Financial
Economics, 115(3), 429-448.
Harris, M., & Raviv, A. (1993). Differences of Opinion Make a Horse Race. Review of Financial
Studies, 6(3), 473–506.
Hayo, B., Henseler, K., & Rapp, M. S. (2019). Estimating the Monetary Policy Interest-Rate-
to-Performance Sensitivity of the European Banking Sector at the Zero Lower Bound.
Finance Research Letters, 31, 471–475.
Hayo, B., & Neuenkirch, M. (2015a). Central Bank Communication in the Financial Crisis: Ev-
idence from a Survey of Financial Market Participants. Journal of International Money
and Finance, 59, 166–181.
Hayo, B., & Neuenkirch, M. (2015b). Self-Monitoring or Reliance on Newswire Services: How
Do Financial Market Participants Process Central Bank News? Journal of Banking & Fi-
nance, 59, 27–37.
Henseler, K., & Rapp, M. S. (2018). Stock Market Effects of ECB’s Asset Purchase Programmes:
Firm-level Evidence. Economics Letters, 169, 7-10.
Hernández-Murillo, R., & Shell, H. G. (2014). The Rising Complexity of the FOMC Statement
(Economic Synopses No. 23).

- 42 -
Hirshleifer, D. (2001). Investor Psychology and Asset Pricing. Journal of Finance, 56(4), 1533–
1597.
Hong, H., & Stein, J. C. (1999). A Unified Theory of Underreaction, Momentum Trading, and
Overreaction in Asset Markets. Journal of Finance, 54(6), 2143–2184.
Hussain, S. M. (2011). Simultaneous Monetary Policy Announcements and International Stock
Markets Response: An Intraday Analysis. Journal of Banking & Finance, 35(3), 752–
764.
Kandel, E., & Pearson, N. D. (1995). Differential Interpretations of Public Signal and Trade in
Speculative Markets. Journal of Political Economy, 103(4), 831–872.
Kohn, D. L., & Sack, B. P. (2003). Central Bank Talk: Does it Matter and Why? Divisions of
Research & Statistics and Monetary Affair. Federal Reserve Board.
Kincaid, J. P., Fishburne, R. P. Jr., Rogers, R. L., & Chissom, B. S. (1975). Derivation of New
Readability Formulas (Automated Readability Index, Fog Count and Flesch Reading
Ease Formula) for Navy Enlisted Personnel (Institute for Simulation and Training—Re-
search Report No. 56).
Kuttner, K. N. (2001). Monetary Policy Surprises and Interest Rates: Evidence from the Fed
Funds Futures Market. Journal of Monetary Economics, 47(3), 523–544.
Kuttner, K. N. (2018). Outside the Box: Unconventional Monetary Policy in the Great Recession
and Beyond. Journal of Economic Perspectives, 32, 121-146.
Laver, M., Benoit, K., & Garry, J. (2003). Extracting Policy Positions from Political Texts Using
Words as Data. American Political Science Review, 97(2), 311–331.
Loughran, T. & McDonald, B. (2016), Textual Analysis in Accounting and Finance: A Survey.
Journal of Accounting Research 54(4), 1187-1230
Lucca, D. O., & Trebbi, F. (2009). Measuring Central Bank Communication: An Automated
Approach with Application to FOMC Statements (No. w15367). National Bureau of Eco-
nomic Research.
McLaughlin, G. H. (1969). SMOG Grading—A New Readability Formula. Journal of Reading,
12(8), 639–646.
Meade, E. E. (2005). The FOMC: Preferences, Voting, and Consensus. Federal Reserve Bank
of St. Louis Review, 87 (March/April 2005).
Miller, B. P. (2010). The Effects of Reporting Complexity on Small and Large Investor Trading.
Accounting Review, 85(6), 2107–2143.
Nakamura, E., & Steinsson, J. (2018). High Frequency Identification of Monetary Non-Neu-
trality. Quarterly Journal of Economics, 133(3), 1283–1330.
Picault, M., & Renault, T. (2017). Words Are Not All Created Equal: A New Measure of ECB
Communication. Journal of International Money and Finance, 79, 136-156.
Praet, P. (2017). Communicating the Complexity of Unconventional Monetary Policy in EMU.
In 2017 ECB Central Bank Communications Conference. November 15, 2017. Frankfurt
am Main, Germany.

- 43 -
Rosa, C. (2008). Talking Less and Moving the Market More: Is this the Recipe for Monetary
Policy Effectiveness? Evidence from the ECB and the Fed (Centre for Economic Perfor-
mance, London School of Economics and Political Science No. 855). London, UK.
Rosa, C. (2011a). The Validity of the Event-Study Approach: Evidence from the Impact of the
Fed’s Monetary Policy on US and Foreign Asset Prices. Economica, 78(311), 429–439.
Rosa, C. (2011b). Words that Shake Traders. The Stock Market’s Reaction to Central Bank
Communication in Real Time. Journal of Empirical Finance, 18(5), 915–934.
Schmeling, M., & Wagner, C. (2019). Does Central Bank Tone Move Asset Prices? (No. 13490).
CEPR Discussion Papers.
Shapiro, A. H., & Wilson, D. (2019). Taking the Fed at its Word: A New Approach to Estimating
Central Bank Objectives Using Text Analysis. Federal Reserve Bank of San Francisco.
Senter, R. J., & Smith, E. A. (1967). Automated Readability Index. Cincinnati University, Ohio.
Smales, L. A., & Apergis, N. (2017a). Does More Complex Language in FOMC Decisions Impact
Financial Markets? Journal of International Financial Markets, Institutions and Money,
51, 171–189.
Smales, L. A., & Apergis, N. (2017b). Understanding the Impact of Monetary Policy Announce-
ments: The Importance of Language and Surprises. Journal of Banking & Finance, 80,
33–50.
Smith, M., & Taffler, R. (1992). Readability and Understandability: Different Measures of the
Textual Complexity of Accounting Narrative. Accounting, Auditing & Accountability
Journal, 5(4), 84–98.
Stigler, G. J. (1961). The Economics of Information. Journal of Political Economy, 69(3), 213–
225.
Tillmann, P., & Walter, A. (2018). ECB vs Bundesbank: Diverging tones and policy effective-
ness (No. 20-2018). Joint Discussion Paper Series in Economics.
You, H., & Zhang, X. J. (2009). Financial Reporting Complexity and Investor Underreaction to
10-k Information. Review of Accounting Studies, 14(4), 559–586.

- 44 -
Appendix
Table A1: ECB’s GCM press conferences included in the sample
No. Date UMPM disclosure (predominant)
1 07 May 2009 Asset Purchase Programme
2 04 Jun 2009 Asset Purchase Programme
3 06 Aug 2009 Swap Agreement
4 03 Dec 2009 Forward Guidance
5 04 Mar 2010 Allotment Policy
6 10 Jun 2010 Allotment Policy
7 02 Sep 2010 Allotment Policy
8 02 Dec 2010 Allotment Policy
9 03 Mar 2011 Allotment Policy
10 09 Jun 2011 Allotment Policy
11 04 Aug 2011 Allotment Policy
12 06 Oct 2011 Asset Purchase Programme
13 03 Nov 2011 Asset Purchase Programme
14 06 Jun 2012 Allotment Policy
15 02 Aug 2012 Asset Purchase Programme
16 06 Sep 2012 Asset Purchase Programme
17 06 Dec 2012 Allotment Policy
18 02 May 2013 Allotment Policy
19 05 Jun 2014 Allotment Policy
20 03 Jul 2014 Allotment Policy
21 04 Sep 2014 Asset Purchase Programme
22 02 Oct 2014 Asset Purchase Programme
23 22 Jan 2015 Asset Purchase Programme
24 10 Mar 2016 Asset Purchase Programme
25 21 Apr 2016 Asset Purchase Programme
26 02 Jun 2016 Asset Purchase Programme
27 21 Jul 2016 Forward Guidance
28 08 Sep 2016 Forward Guidance
29 20 Oct 2016 Forward Guidance
30 08 Dec 2016 Asset Purchase Programme
31 19 Jan 2017 Asset Purchase Programme
32 09 Mar 2017 Forward Guidance
33 27 Apr 2017 Forward Guidance
34 08 Jun 2017 Forward Guidance
Notes: ECB’s GCM press conferences sampled following the 2008 financial crisis, when the
ECB started conducting UMPM on a recurring basis, apparent by the announcement of ECB’s
first covered bond purchase programme on 07 May 2009, and covering the period until June
2017. Limitation to press conferences where details on UMPM are disclosed, i.e., details on
Asset Purchase Programmes, Swap Agreements, Allotment Policy, and/or Forward Guid-
ance.
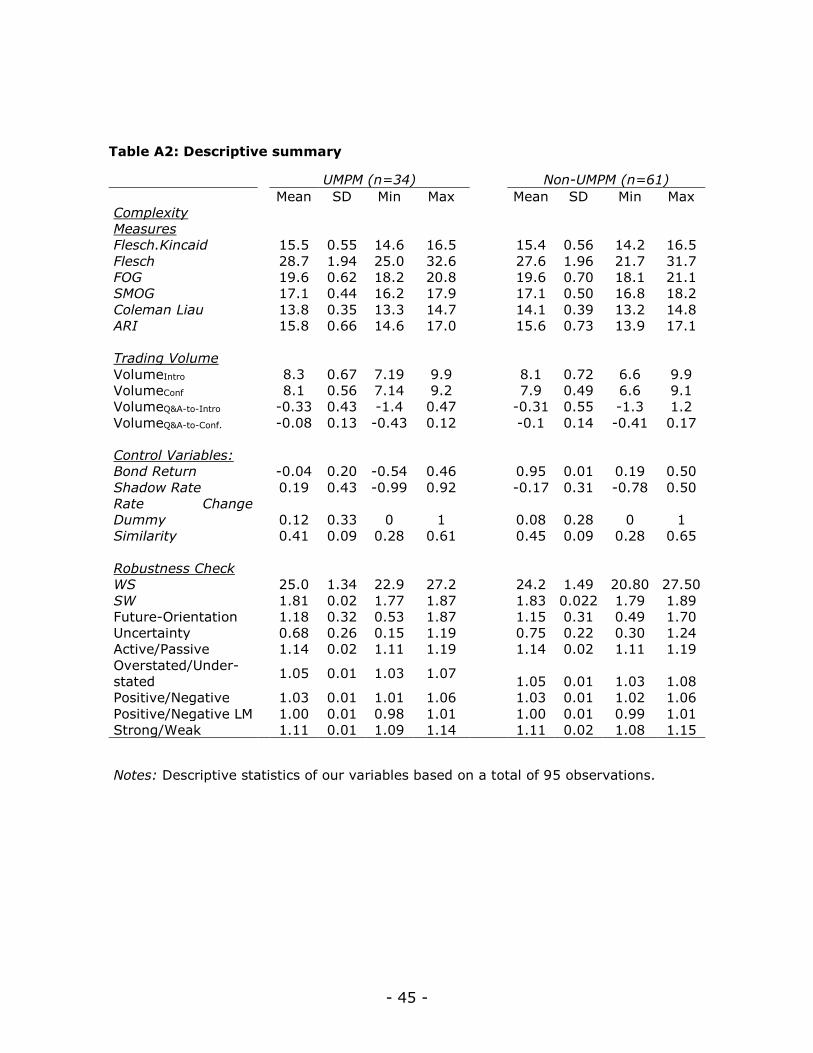
- 45 -
Table A2: Descriptive summary
UMPM (n=34) Non-UMPM (n=61)
Mean SD Min Max Mean SD Min Max
Complexity
Measures
Flesch.Kincaid 15.5 0.55 14.6 16.5 15.4 0.56 14.2 16.5
Flesch 28.7 1.94 25.0 32.6 27.6 1.96 21.7 31.7
FOG 19.6 0.62 18.2 20.8 19.6 0.70 18.1 21.1
SMOG 17.1 0.44 16.2 17.9 17.1 0.50 16.8 18.2
Coleman Liau 13.8 0.35 13.3 14.7 14.1 0.39 13.2 14.8
ARI 15.8 0.66 14.6 17.0 15.6 0.73 13.9 17.1
Trading Volume
VolumeIntro 8.3 0.67 7.19 9.9 8.1 0.72 6.6 9.9
VolumeConf 8.1 0.56 7.14 9.2 7.9 0.49 6.6 9.1
VolumeQ&A-to-Intro -0.33 0.43 -1.4 0.47 -0.31 0.55 -1.3 1.2
VolumeQ&A-to-Conf. -0.08 0.13 -0.43 0.12 -0.1 0.14 -0.41 0.17
Control Variables:
Bond Return -0.04 0.20 -0.54 0.46 0.95 0.01 0.19 0.50
Shadow Rate 0.19 0.43 -0.99 0.92 -0.17 0.31 -0.78 0.50
Rate Change
Dummy 0.12 0.33 0 1 0.08 0.28 0 1
Similarity 0.41 0.09 0.28 0.61 0.45 0.09 0.28 0.65
Robustness Check
WS 25.0 1.34 22.9 27.2 24.2 1.49 20.80 27.50
SW 1.81 0.02 1.77 1.87 1.83 0.022 1.79 1.89
Future-Orientation 1.18 0.32 0.53 1.87 1.15 0.31 0.49 1.70
Uncertainty 0.68 0.26 0.15 1.19 0.75 0.22 0.30 1.24
Active/Passive 1.14 0.02 1.11 1.19 1.14 0.02 1.11 1.19
Overstated/Under-
stated 1.05 0.01 1.03 1.07
1.05 0.01 1.03 1.08
Positive/Negative 1.03 0.01 1.01 1.06 1.03 0.01 1.02 1.06
Positive/Negative LM 1.00 0.01 0.98 1.01 1.00 0.01 0.99 1.01
Strong/Weak 1.11 0.01 1.09 1.14 1.11 0.02 1.08 1.15
Notes: Descriptive statistics of our variables based on a total of 95 observations.