
Whence Policy? Government Policies, Finance, and Economic Integration
39
EUROPEAN SUMMER SYMPOSIUM IN INTERNATIONAL MACROECONOMICS (ESSIM) 2010 Hosted by Banco de España Tarragona, Spain; 25-28 May 2010 Whence Policy? Government Policies, Finance, and Economic Integration Giuseppe Bertola and Anna Lo Prete The views expressed in this paper are those of the author(s) and not those of the funding organization(s) or of CEPR, which takes no institutional policy positions.
Transcript of Whence Policy? Government Policies, Finance, and Economic Integration

EUROPEAN SUMMER SYMPOSIUM IN INTERNATIONAL
MACROECONOMICS (ESSIM) 2010
Hosted by Banco de España
Tarragona, Spain; 25-28 May 2010
Whence Policy? Government Policies,
Finance, and Economic Integration
Giuseppe Bertola and Anna Lo Prete
The views expressed in this paper are those of the author(s) and not those of the funding organization(s) or of CEPR, which takes no institutional policy positions.

Whence Policy?
Government Policies, Finance, and Economic Integration
Giuseppe Bertola and Anna Lo Prete
Università di Torino and CEPR; Università di Torino
May 2010 *
ABSTRACT: Economic integration may directly increase the need for private funding of consumption and investment, and should make it difficult for national governments to repress financial markets and to enforce redistribution policies that substitute private contractual arrangements. We analyze the trajectories since the 1980s of financial market development and policy choices and interpret them structurally as reactions, shaped by country‐specific characteristics, to exogenous globalization pressures.
* Minor revision (not to be circulated or posted on open websites) of a paper presented at the 51st Panel Meeting of Economic Policy in Madrid.
2
1. Introduction
Between the 1980s and the 2000s, international trade and financial volumes grew considerably, while deregulation and budget contractions tended to reduce the economic role of governments. In this paper we analyze country‐specific trajectories along and around such broad worldwide trends, in search of additional information regarding the relevant interactions between different aspects of national policies and financial development.
The theoretical considerations we bring to bear on these phenomena are simply stated. International integration increases aggregate income and may make market incomes and investment opportunities more heterogeneous within each country and over each individual’s lifetime. More variable incomes and new investment opportunities increase the scope for transactions and transfers aimed to keep consumption stable in the face of labor market and lifecycle fluctuations and to allocate savings to investment projects. Smoothing consumption in the face of the ups and downs of individual incomes, and matching savings to investment opportunities, can be tasked to financial markets as well as to government policies (which are also motivated by solidarity and social cohesion concerns). Since national governments are less powerful when economic integration allows private agents to seek more lenient taxes and more generous subsidies across countries’ borders, deeper and wider economic integration asks financial markets to accommodate transactions that were previously repressed or substitute by government policies.
From this perspective, a positive association between economic integration and financial development is doubly unsurprising. The relative importance of its possible sources deserves to be examined carefully, however, in terms of the underlying policy choices. If globalization did not directly spur financial development but called financial markets to perform roles that would have been tasked to governments in closed economies, the mechanism at work in recent decades may grind to a halt and possibly reverse itself when financial markets malfunction, as they spectacularly did in 2008. Within the global trend growth of finance and international economic integration driving policy trajectories over the past few decade, our empirical work on standard country‐level panel data identifies patterns of imperfect substitution between financial markets and government policies, and assesses quantitatively their impact on an indicator of financial development. For this purpose, we focus on the variable intensity of international economic integration forces as an exogenous driver of policy choices, and we disentangle the role of different policies in shaping financial development exploiting sources of country‐level exogenous variation in the strength of globalization pressures, and in the shape of policy responses to them.
2. Data and theories
In this section we outline connections of private finance demand and supply to trade openness and government policies, in terms of simple links between pairs of these phenomena. In each of the following three subsections, we briefly review previous contributions’ efforts to highlight relevant theoretical linkages between openness and finance, openness and government policies, finance and government policies. And we confront them with the data, inspecting bi‐variate relationships between relevant empirical indicators in a standard country‐level data set encompassing those

3
analyzed by papers focused on the relationship between trade and government policies and by papers concerned with mechanisms linking trade and financial development. 1 We analyze finance, trade, and policy patterns across and within 22 OECD countries for which relevant data, introduced briefly in the context of this section’s discussion and in more detail in the Data Appendix, are available for all or most of the 1980‐2007 period. Business cycles naturally generate a negative correlation between government spending and financial depth, which may or may not be affected by the structural mechanisms we focus on (we do not consider government budget deficits, and ways in which openness may affect cyclical relationships). To smooth out high‐frequency cycles, we analyze average values of available observations within each of six non overlapping 5‐year periods, from 1980‐1984 to 2005‐07 (the last period includes only three years).
2.1 Finance and Openness
Financial markets are more useful when individual labor incomes and investment opportunities and returns are more diverse and volatile. International openness fosters economic efficiency by allowing trade between diverse economies, and also opens the way to shocks originating from a broader and more diverse set of foreign markets. This does not unambiguously imply more income instability. Barriers to trade clog channels of adjustment to internal shocks at the same time as they protect domestic producers from external shocks, which may be negatively correlated to those that originate in the domestic economy. A direct link between economic integration and financial development is plausible, however, and has been characterized and explored empirically in the literature.
International markets offer new investment opportunities and, to the extent that foreign competition reduces domestic firms’ rents, make it more necessary to draw on external finance (Rajan and Zingales, 2003). Beck (2002) notes that both trade and finance are strongly and positively associated with country‐level growth rates, and explores the relationship between financial development and the composition (rather than the total amount) of trade, arguing that external funding is differently relevant across sectors, and finding theoretically and empirically that manufacturing production and exports are larger in more financially developed countries. Do and Levchenko (2007) note that the volume of financial transactions should depend on trade patterns if it responds to demand, and show empirically that deeper trade integration has influenced production specialization so as to imply faster development in countries where production is more dependent on external financing. Svaleryd and Vlachos (2002) outline this channel and explore the empirical link between various openness measures and financial development indicators. Huang and Temple (2005), using panel data and methods similar to those of our next section – but without focusing on interactions with government policies – document the character and intensity of dynamic impacts of trade on financial development.
If more openness does imply a more urgent need to trade in financial markets, the direct association between economic integration and financial transactions should be positive (all else equal). To bring these considerations to bear on the data, we measure “Openness” using a standard measure of trade openness ‐ the ratio of imports and exports to GDP, drawn from the Penn World Tables (Version 6.3,
1 Country‐level information is necessary for the purpose of assessing and interpreting the causes and effects of policy changes, as we aim to do in this paper. Microeconomic datasets may of course help assess the effects of supposedly exogenous policy changes, but comparability problems make it difficult to do so on a cross‐country comparative basis.

4
compiled by Heston et al., 2009). And we follow Abiad et al. (2008) in measuring “Financial Development” using an indicator in volume (or de facto) terms: the “Private Domestic Credit by Deposit Money Banks and Other Financial Institutions to GDP” variable, drawn from the World Bank Financial Development and Structure Database (May 2009 revision, documented in Beck and Demirgüç‐Kunt, 2009). We prefer to focus on credit rather than stock markets, as the latter are more volatile; include international capital flows and foreign listings; are sensitive to detailed institutional features regarding stockholder protection; and, while presumably related to privatization and corporate governance reforms, are less directly related to our theoretical consumption‐smoothing perspective, and to available policy indicators.2
The top panels of Figure 1 illustrate the overall relationship between Financial Development and Openness indicators. There and in the following figures the left‐hand side panel plots observations in levels, while the right‐hand side panel displays deviations from country means, thus preventing empirical patterns from being influenced by country characteristics that shape both variables. This appears to be important in the case at hand: there is no significant relationship between Openness and Financial Development in the raw data, but a strong positive association is observed when we plot deviations from country means. Over time, within country‐specific trajectories, financial transactions are more intense in more integrated economies, while other forces appear to shape cross‐country observations differently.
All else of course need not be equal across the countries and periods we observe. Higher volumes of financial transactions reflect not only more intense demand for consumption smoothing and investment funding, but also structural features of financial markets that differ across countries and periods (quite possibly, as we shall discuss and document below, in ways that are in turn related to Openness). To capture differences in financial market accommodation of households and firms’ transaction needs we use the Financial Reform Indicator drawn from the IMF Financial Reform Database, documented in Abiad et al. (2008). This “Financial Structure” de jure policy indicator takes into account seven dimensions of policies in the financial sector (see the Data Appendix). It is shown in Tressel and Detragiache (2008) to be very significantly associated to de facto financial depth, controlling for various other country‐level characteristics (including other liberalization indicators). Indeed, as shown in the bottom panels of Figure 1, it is strongly and positively related to credit volumes across countries and periods in our sample, regardless of whether or not country means are removed from the data.3
2 A shortcoming of this choice is that, as regards firm financing, bank‐based systems appear but need not be more developed than stock‐based systems. We have experimented with replacing private credit with stock market capitalization, or using the sum of the two as an indicator of de facto financial development. The resulting pattern of coefficient estimates is very similar but not as precisely estimated, and mainly differs because the direct associations of stock market volumes to government policies indicators are much looser than those of private credit. We report some regression results in Appendix Table A.1, discussed in Section 5 below. 3 We found that the index is also highly correlated to Loan‐to‐value indicators of mortgage availability, which are more directly related to households’ access to financial markets as a substitute to public policy. We also experimented with the Credit Information Index available in the World Bank Doing Business database. It proved uninformative, also because only cross‐sections for very recent years are available.

5
2.2 Openness and Government Policies
The relationships discussed above between Financial Development and Openness, and Financial Development and Financial Structure, are theoretically sensible. In order to assess the strength of the relevant theoretical channels, however, one would have to believe that in those relationships one of the two variables drives the other, and that all other characteristics of countries and periods are constant across observations. All else is unlikely to be equal across more or less open economies, however. In particular, government policies are also shaped by the internationalization of markets.
For our empirical sample of OECD countries, in the top panels of Figure 2 we display 5‐year averages of the “Government Share of GDP” variable (also drawn from the Penn World Tables), a measure of government’s economic role dubbed “Government Size” in what follows. The left panel shows a positive (albeit not significant) relationship between Openness and Government Size: countries that trade more have larger governments, perhaps because internal policies substitute for protection from external shocks (Rodrik, 1998). In the right panel, where country‐specific features are erased by taking deviations from country means, the relationship is negative instead. This simple fact, that was also documented in earlier data by Rodrik (1997) and by Bertola and Lo Prete (2008), may suggest that while in cross‐section country‐specific characteristics jointly determine Openness and Government Size, over time the erosion of market boundaries makes it increasingly difficult for national governments to enforce policy choices.
The power of national governments to shape economic activity is weakened by international competition in all areas, and also in the specific area of redistribution policies meant to protect individual consumption and welfare from income fluctuations. Since Openness may influence the intensity of income fluctuations, it calls for more redistribution and labor market regulation (Agell, 2002) at the same time as it makes it more difficult to design and implement such policies. Even if the pattern of covariation resulting from the interaction of these demand and supply forces is not theoretically determined, it is interesting to inspect the information provided by a “Social Policy” indicator that is more closely related to the government’s income‐smoothing role: the OECD Public Social Expenditure’s total amount, as a fraction of GDP.4 In the bottom panels of Figure 2, the association between Openness and Social Policy is positive, both in levels and in deviations from country means. This finding, while still drawn from a simple bivariate perspective that fails to control for other relevant influences, suggests that Openness may indeed demand more intense redistribution.
2.3 Finance and Government Policies
So far, we have found that Openness is positively related to Financial Development (which is in turn positively related to Financial Structure); negatively related to Government Size when country‐specific effects are controlled for (but positively otherwise); and positively related to Social Policy. Together, these relationships imply a pattern of co‐variation between government policies and Financial Development that deserves to be interpreted theoretically and inspected in our data.
4 Availability of this variable restricts our sample to OECD countries. The World Bank WDI dataset includes a “public transfers” variable that might offer a suitable gauge of governments’ redistribution role, and is used as such by Epifani and Gancia (2009). Those data are sparse and of dubious quality, however, and indeed prove uninformative in Epifani and Gancia’s regressions.

6
Governments, like financial markets, redistribute resources over an individual’s lifetime as well as across random realizations of income. There would be no need for them to do so if financial markets worked perfectly. In reality, however, the scope of financial contracts is limited by asymmetric information problems and by enforcement costs, and also government policies face similar problems: for example, public unemployment insurance schemes can be designed so as to exploit the government’s superior monitoring and enforcement powers, but workers’ incentives to provide effort are to some extent decreased at the same time as their welfare is improved by smoother consumption patterns – which are all the more beneficial when more imperfect financial markets make it difficult to fund investments and smooth consumption through private contracts (Bertola and Koeniger, 2007).
Countries and periods do differ across these dimensions. Bivariate correlations are reported in Figure 3. Whether or not country‐specific unobservable features are controlled for, in the upper panels Government Size and Financial Development are negatively correlated. This suggests that different mixes of private market transactions and public spending reflect a degree of substitutability between the two. In the bottom panels of Figure 3, conversely, Social Policy covaries positively with Financial Development, both in raw data and within each country’s experience.
As in Figure 2, this suggests that these policy indicators capture different phenomena, and may well be driven differently by underlying forcing variables. While Openness reduces the effectiveness of many aspects of government policies, it arguably affects the usefulness of redistribution policies in the face of labor income risk more directly than that of other regulatory and spending policies. This observation calls for a more detailed analysis of how Government Size and Social Policy may be jointly driven by processes driving Financial Structure and Openness, and in turn drive Financial Development.
3. A theoretical framework for empirical analysis
Each of the relationships between pairs of variable discussed in the previous section is theoretically sensible, and appears empirically relevant. In reality, of course, all of them interact in ways that, while intricate, may be disentangled empirically by appropriate (albeit debatable) specifications of plausible channels of causation.
Closing the circle of the train of thought that in the previous section led us to examine links between Openness, Financial Development, Financial Structure, Government Size and Social Policy, we proceed to argue that the forces driving Openness may well stand out among the many sources of differences in the finance versus government policies mix observed across countries and periods.
Free trade across countries’ borders improves efficiency because it offers more choices to firms and consumers but, for the same reason, also makes it more difficult for policies to shape individual choices and market outcomes. International competition decreases the lobbying power and rent‐seeking activity of incumbents (Rajan and Zingales, 2003), and fosters financial deregulation; along standard race‐to‐the‐bottom lines, it also reduces governments’ ability to design and enforce beneficial social insurance schemes (Sinn, 2003). This may be bad or may be good, depending on which of these two perspectives appears more appropriate. From both, however, Openness reduces the ability of governments to suppress or substitute private finance, and leads to a larger volume of financial transactions regardless of whether it directly increases demand for external finance by firms or for insurance and consumption smoothing by households.

7
Much like financial contracts, taxes and subsidies influence the distribution of resources and the allocation of savings to investment opportunities. An economy’s investment and consumption smoothing needs can be addressed both by policies and by private financial contracts. When governments can do less, there is more left to do for markets. This line of argument predicts that financial transaction volumes should be increased, within a given financial market structure, by government retrenchment in the face of openness. It can also be extended to predict that governments should, to the extent possible, try and make it easier for financial markets to function in more open economies.
Existing work has confronted these predictions with the data. Rajan and Zingales (2003) suggest that freer international trade may trigger financial liberalization, overcoming the political power of incumbents. Their empirical work on 20th century data lets incumbents’ political power depend on the intensity of international capital flows, viewed as globally determined and exogenous to specific countries’ policies, and trade openness as determined by different countries’ geographical and cultural propensity to trade. Bertola and Lo Prete (2008) document that the relationship between Openness and Government Size within country‐specific trajectories is more strongly negative when and where financial markets are better developed. Recent data on de iure financial development are also correlated with trade. The supply‐side Financial Structure indicator is analyzed from this perspective by Hauner and Prati (2008), who find some evidence that international trade volumes increase in advance of deregulation of both internal and external financial relationships. Svaleryd and Vlachos (2002) regress trade indicators (both de facto and de iure) on financial development, with controls, and motivate that specification in terms of the impact of openness on income volatility. Like Huang and Temple (2005), who also employ dynamic panel data methods, they exploit natural openness as an exogenous (albeit only cross‐sectional) determinant of trade.
3.1 Policy determinants
The theories and data at hand suggest an interesting and novel perspective on the interaction between economic integration, government policies, and finance. Finance and economic integration certainly interact in shaping government policies: on the one hand, by making them more or less desirable, for example because openness increases income volatility, while well‐functioning private markets make it less necessary for governments to try and smooth its welfare implications; on the other hand, by constraining government action, in that deeper and wider free‐market interactions make it more difficult for governments to design and enforce effective policies.
Box 1 outlines a very simple formal framework where the efficacy of government policies in remedying financial market imperfections leaves more or less to be done by financial market transactions. This type of model delivers intuitive predictions: financial market volumes should be larger if incomes and investment opportunities are more heterogeneous across market participants, if financial markets are more efficient, and if the efficacy of government policies is lower. If increasing the efficiency of financial markets is possible but costly, governments should be more inclined to do so in more open economies, and to an extent that depends on possibly country‐specific features of the relevant costs. Similarly, it may be possible for governments to increase the efficacy of redistribution policies, for example by reducing their citizens’ freedom to relocate production abroad and circumvent taxation. But this also entails costs, in terms of lower production efficiency, that generally vary across countries and periods: where and when trade is more beneficial

8
and more difficult to restrain, policymakers will be less inclined to erect barriers to international markets, and more inclined to accept a reduction in their power to redistribute income.
Empirical patterns of observations generated by this mechanism depend on what drives the variation in the relevant parameters across countries and over time. Since a variety of structural characteristics influence the relative cost of public and private consumption smoothing instruments (see Bertola and Koeniger, 2010, for a discussion of information structure and administration costs’ aspects), the data are generated in reality by the interaction of more than a single unambiguous channel of causation. From this perspective, observed policies are shaped by the benefits of economic integration, by the difficulties it implies for government policies, and by the welfare consequences of governments’ retreat when it is difficult for financial markets to substitute policies.
For this paper’s purposes, however, it suffices to focus on the relationship between international globalization forces and the phenomena of interest. The association of observed openness and financial transactions reflects (among other things) substitution of imperfect financial relationships with (also imperfect) redistribution schemes in reality, as in the simple model outlined in Box 1.
We expect actual openness to be shaped both by technological developments beyond policymakers’ control, and by policy choices: governments should more willingly accept openness when it is easier for them and/or for their citizens to forego government policies. Through similar mechanisms, trade opportunities should foster financial reforms, because an efficient financial system is more useful in more open and competitive economies than in closed economies with powerful governments. Economic integration may make economic policy more useful (e.g., by increasing the instability of incomes and the dispersion of investment opportunities), but certainly makes it less effective (through more intense tax competition). Since the restraints on policy implied by trade openness are less important if it is easy for private markets to substitute governments, in countries and periods where and when trade opportunities are more abundant and financial markets function better we expect to see more actual openness to international competition, possibly slimmer governments, and more intense financial transactions resulting both from new financing needs, and from financial reforms.
Box 1. A simple model of government policies and finance
This Box illustrates the theoretical interactions of interest embedding them in a simple version of models of individual saving and investment decisions (reviewed in e.g. Bertola et al., 2007, Chapter 7) in an imperfect financial markets context, and outlines the role of public redistribution in that context (originally highlighted by Varian, 1980). Consistently with our empirical work on time‐aggregated data, where cyclical developments are smoothed out, we discuss the role of financial markets and policies in mediating consumption smoothing across individuals in different contingencies or at different points in the lifecycle, rather than aggregate interactions between liquidity constraints and tax schedules in a dynamic economy (see e.g. Hubbard and Judd, 1986). Let income and consumption occur in two different situations (periods and/or realizations of uncertainty). In each period or contingency, income is high at yH for half of the individuals, low at yL yH for the others. This perfect negative correlation would in principle make it possible to smooth consumption completely, and this would be optimal if utility is concave and, for simplicity, discount and return rates are normalized to zero. In the absence of financial frictions, rational agents would share risk fully across states or periods so that
9
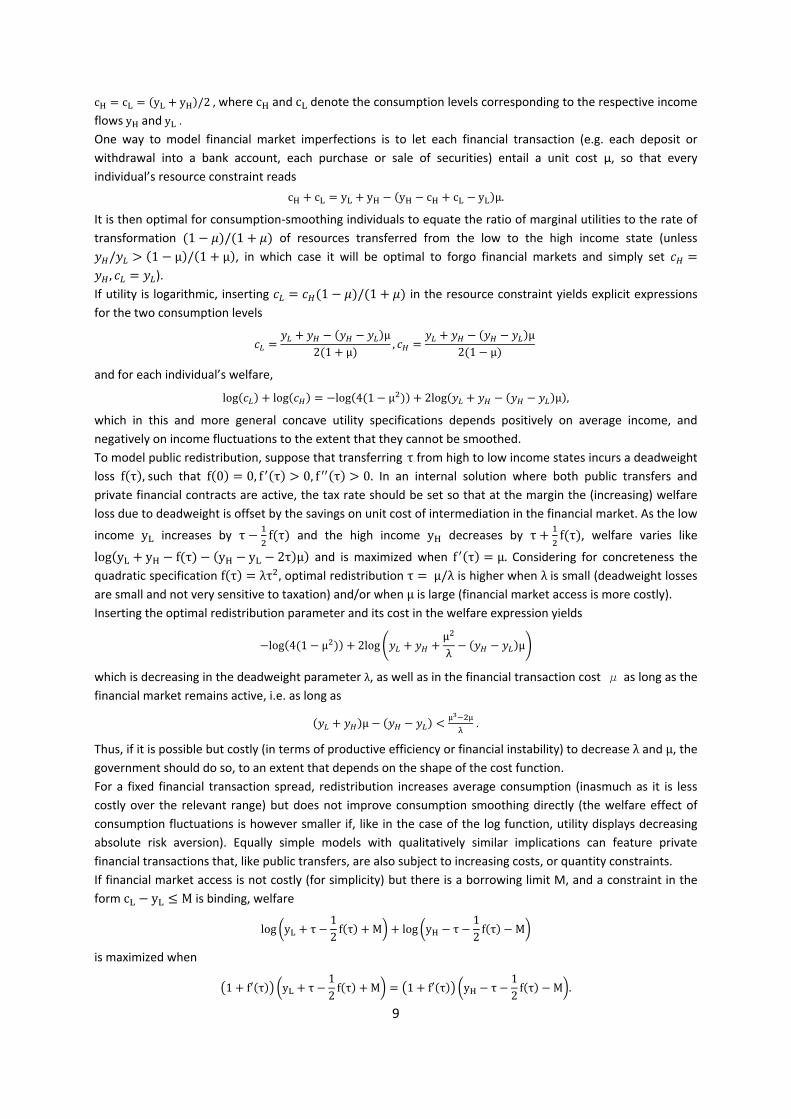
cH cL yL yH /2 , where cH and cL denote the consumption levels corresponding to the respective income flows yH and yL . One way to model financial market imperfections is to let each financial transaction (e.g. each deposit or withdrawal into a bank account, each purchase or sale of securities) entail a unit cost μ, so that every individual’s resource constraint reads cH cL yL yH yH cH cL yL µ. It is then optimal for consumption‐smoothing individuals to equate the ratio of marginal utilities to the rate of transformation 1 / 1 of resources transferred from the low to the high income state (unless / 1 µ / 1 µ , in which case it will be optimal to forgo financial markets and simply set , ). If utility is logarithmic, inserting 1 / 1 in the resource constraint yields explicit expressions for the two consumption levels µ2 1 µ , µ2 1 µ and for each individual’s welfare, log log log 4 1 µ 2log µ , which in this and more general concave utility specifications depends positively on average income, and negatively on income fluctuations to the extent that they cannot be smoothed. To model public redistribution, suppose that transferring τ from high to low income states incurs a deadweight loss f τ , such that f 0 0, f τ 0, f τ 0. In an internal solution where both public transfers and private financial contracts are active, the tax rate should be set so that at the margin the (increasing) welfare loss due to deadweight is offset by the savings on unit cost of intermediation in the financial market. As the low
income yL increases by τ f τ and the high income yH decreases by τ f τ , welfare varies like log yL yH f τ yH yL 2τ µ and is maximized when f τ µ. Considering for concreteness the quadratic specification f τ λτ , optimal redistribution τ µ/λ is higher when λ is small (deadweight losses are small and not very sensitive to taxation) and/or when µ is large (financial market access is more costly). Inserting the optimal redistribution parameter and its cost in the welfare expression yields log 4 1 µ 2log µλ µ
which is decreasing in the deadweight parameter λ, as well as in the financial transaction cost μ as long as the financial market remains active, i.e. as long as µ µ µ
.
Thus, if it is possible but costly (in terms of productive efficiency or financial instability) to decrease λ and µ, the government should do so, to an extent that depends on the shape of the cost function. For a fixed financial transaction spread, redistribution increases average consumption (inasmuch as it is less costly over the relevant range) but does not improve consumption smoothing directly (the welfare effect of consumption fluctuations is however smaller if, like in the case of the log function, utility displays decreasing absolute risk aversion). Equally simple models with qualitatively similar implications can feature private financial transactions that, like public transfers, are also subject to increasing costs, or quantity constraints. If financial market access is not costly (for simplicity) but there is a borrowing limit M, and a constraint in the form cL yL Μ is binding, welfare log yL τ 12 f τ Μ log yH τ 12 f τ Μ
is maximized when 1 f τ yL τ 12 f τ Μ 1 f τ yH τ 12 f τ Μ .
10
Total differentiation of this condition yields dτdΜ f τ yL yH2 f τ 1 f τ 0. As in the more general framework of Bertola and Koeniger (2007), looser quantity constraints call for less intense redistribution, because smaller income dispersion makes quantity constraints less binding. These derivations have intuitive implications for the policies and phenomena discussed in our paper. More openness to international competition makes it possible to exploit comparative advantage but also reduces the effectiveness of national government policies. In terms of this Box’s simple model, openness increases at the same time as it increases the mean of market incomes (with positive welfare effects) and possibly their dispersion (with positive effects on the volume of financial transactions at given access cost), while the structure of financial markets influences the imperfections indexed by µ and Μ. It would be conceptually straightforward to extend the model so as to represent the implications of financial imperfections for investment, supposing that each individual chooses not only how much to consume but also the amount to invest in a self‐financed investment opportunity that yields decreasing returns. Financial imperfections would then influence inequality of income as well as of consumption. And government redistribution, shifting resources towards higher marginal return opportunities, would influence production efficiency as well as consumption smoothing.
4. Whence policies?
Since the recent crisis has shown that financial development is a two‐edged sword, it is interesting to assess how supply of and demand for finance have been affected by policies. But it would not be appropriate to relate financial development directly to policies meant to achieve objectives that, among other things, depend on the intensity of financial transactions. As determinants of country‐level policies are likely to be correlated with those of financial development for given policies, regressing financial development on policies would neither measure the all‐else‐equal effects of policies, nor tell us anything about the deeper determinants of policies and, though policies, of finance.
Bringing the theoretical considerations outlined in Section 3 to bear on the data examined in Section 2, we focus on international trade opportunities as the forcing process of past cross‐country and time variation for interrelated policy choices. We suppose that, in the face of technological and global forces that make international market integration more beneficial and more difficult to restrain, countries have distributed policy reactions across modulation of country‐specific trade barriers, supply‐side reforms of financial markets, and internal policies.
To assess the explanatory power of this causal interpretation for country‐specific policy trajectories, we need to identify in the data relevant differences in the intensity of the forcing process and in the shape of policy reactions.
4.1 Country characteristics…
Not all countries are equally subject to globalization pressures: economic integration is certainly more difficult and less beneficial for a large and remote island, than for a small country surrounded by neighbors. To capture these features, which are empirically relevant to observed trade patterns, we employ the traditional Frankel and Romer (1999) indicator of such “natural” economic integration factors as countries’ size and location.

11
And not all countries find it equally easy (or difficult) to substitute government policies with private market transactions. To capture an element of the relevant cross‐country heterogeneity, we adopt another popular empirical indicator, the “Legal Origin” classification by La Porta et al. (1998), and group countries according to whether they belonged originally to one of the following legal systems: French Commercial Code; English Common Law; German Commercial Code; Scandinavian Commercial Code.5 Much recent research has explored the relevance to financial market development of this indicator, which is rooted in remote history and has been criticized for failing to recognize that distinctive characteristics of legal systems (such as important details of Common Law implementation) have been evolving along with financial market institutions. In our application, the relevance of legal origins is an essentially empirical question. More or less remote historical events (such as whether Napoleon succeeded in conquering a specific country, and La Porta et al.’s attribution of a “Legal Origin” code) may or may not directly influence financial development many years later. They may well shape each country’s policy response to globalization, however, and do turn out to play a significant and sensible role in the data.
Table 1 reports “Natural Openness” and “Legal Origin” indicators for the 22 countries in our sample. Table 2 shows the mean values, over the whole period, of the four policy indicators we introduced in Section 2, for the four Legal Origin groups and for individual countries within four segments of the overall Natural Openness distribution. There are significant and sensible differences across Legal Origin groups: Financial Structure is more liberalized in the English legal origin group, less in the French. Countries of Scandinavian legal origin are more open and feature more policy activity in terms Government Size and Social Policy, while German legal origin is associated with less Openness and smaller Government Size. The mix of national policies also varies across segments of the Natural Openness distribution. All the English Common Law countries belong in the “1st quartile” of least naturally open countries, with the exceptions of the European nations, Ireland and United Kingdom. Countries of German and Scandinavian legal origin are among the most naturally open European countries, and also tend to be more open in actual terms. Those of French legal origin are distributed across all segments of the Natural Openness distribution, and are the most heterogeneous group as regards actual openness levels. Our sample includes not only advanced economies but also two “upper middle‐income” (according to the World Bank definition) countries: Turkey, which has the most repressed financial market, and Mexico. They both feature very small Social Policy values, indicating that less attention is paid to social insurance issues in less developed countries.
Since both “Natural Openness” and “Legal Origin” are fixed for each country over time, they cannot respond to policy choices. For this reason, causality must run from them to observed policy differences rather than in the opposite direction. For the same reason, however, historical and geographical characteristics cannot explain country‐specific trajectories over time of the policies and outcomes of interest.
4.2 … and global trends
We address this issue considering the empirical relevance of interactions between theoretically relevant country characteristics and global time‐varying indicators of the intensity of world trade. We
5 Other countries have Social/Communist Laws legal origin. Since only Poland belongs to that group among OECD countries for which Financial Structure and Social Policy information is available, we exclude it from our sample (see the Data Appendix).

12
have experimented in this role with a “Global Trade” indicator constructed aggregating the Penn World Tables’ openness indicator for all countries, and with the time‐varying indicators of “Shipment Costs” collected and analyzed by Hummels (2007; see the Data Appendix for details).
Both variables measure forces that influence individual countries’ policies, but are beyond their policymakers’ control. As shown in Figure 4, the intensity of Global Trade has trended up strongly over the sample period; symmetrically, Shipment Costs have decreased at least until the 2000s (for some purposes, these variables could in fact be replaced by a set of time dummies without changing the data’s message). We report and discuss in the main text results based on Global Trade, which turns out to perform better than Shipment Costs in our regressions (results based on the latter are reported in Appendix Table A.1 and discussed in Section 5). This is not surprising since the actual intensity of Global Trade captures forms of technological or organizational progress (such as information technology) that ease international trade in more subtle ways than those captured by transportation costs, as well as multilateral policy forces beyond individual countries’ control.6
4.3 Globalization and policies
To disentangle the role of various policies in shaping financial development, we focus on the powerful globalization trend that has swept all countries at the turn of this century. We build a country‐and‐time specific indicator of “globalization pressures” based on the interaction of Frankel and Romer’s (1999) measure of policy‐independent determinants of trade openness (like country size and location) with the intensity of global trade, which also does not respond to country‐specific policies since individual countries are either too small or too closed to account for more than a small portion of global imports and exports. And we account for the fact that different countries may find it more or less easy to substitute private markets with public sector intervention allowing observed policy reactions to depend on the La Porta et al. (1998) indicator of how each country’s legal origin might shape its market friendliness.
These country‐specific indicators fit our purposes in two key respects: they have been abundantly argued to be theoretically and empirically relevant to trade and finance, and cannot be influenced by subsequent policy choices. To be useful, they do not need to measure very precisely the intensity of globalization pressures, under the hypothesis (that the data do not reject) that the level and interactions of natural openness, legal origin, and world trade influence finance only through policies. And they do not need to be more important, as drivers of national policies, than technological progress, demographic trends, or political fashions. Just like historically remote sources of policy variation have proved useful for the purpose of assessing the structural role of subsequent policies (Rodrik, Subramanian, and Trebbi, 2004), isolating exogenously different responses across countries to common exogenous developments makes it possible to identify the financial development effects of policies.
To be empirically useful, these exogenous sources of country‐and‐time specific variation should push and pull different policies differently enough to disentangle their separate effects on financial development. Before turning to formal estimation in the next section, we illustrate the empirical role of a summary “Globalization” measure of period‐and‐country specific ease of trade, defined as the
6 It would in principle be possible, but complex and subject to the heavy qualifications in Ben‐David (2001), to exploit variation across countries and over time generated by participation in multilateral trade liberalization rounds, along the lines of Slaughter (2001).

13
product of (time‐invariant) Natural Openness and (time‐varying) Global Trade. Focusing on a single‐dimensional indicator makes it possible to inspect visually its relationship to the variation, across countries and 5‐year periods, of the policy variables that in the next section we will relate to the resulting de facto Financial Development indicator.
The figures that appear below report data and regression lines for the four groups of country (and period) observations that share the same Legal Origin indicator. The horizontal axis always refers to the (country‐and‐period specific) indicator we call Globalization. On the vertical axis, we consider in turn the four policy‐relevant indicators of interest.7
To begin with, we plot patterns of co‐variation between Globalization and Openness in Figure 5. Actual openness is predicted well by the “Globalization” proxy of external trade pressures, and the positive association between these two variables differs significantly across Legal Origin sub‐samples. As economic integration limits a country's ability to implement public redistribution, we expect Openness to be lower (at the expense of production efficiency) when it is difficult to substitute government policies with private financial instruments. Our Globalization variable indeed appears to foster Openness more strongly where the legal system is more trade‐friendly, such as in English legal tradition countries. In contrast, countries belonging originally to the Scandinavian legal system seem to open their markets more slowly in response to global economic integration.
These differences across groups of countries are not only statistically but also economically significant. A change in Globalization of 400 is equivalent to the difference in Natural Openness between the median and the first quartile of the Natural Openness distribution times the Global Trade intensity in the 1995‐99 period, or to the change in Global Trade between 1985‐89 and 2005‐07 times the median value of Natural Openness. It implies a change in actual Openness of 25 percentage points (p.p.) of GDP in the English Legal Origin group, of only 11 p.p. of GDP for countries with Scandinavian legal traditions.
Figure 6 shows that while our Globalization indicator is also strongly and positively associated with Financial Structure, the financial reform pressure exerted by Globalization does not appear to be significantly different across countries. Reforms in the financial sector are everywhere positively related to economic integration, but the trajectories of these two variables do not depend on legal traditions once Legal Origin dummies have absorbed cross‐country variation in Financial Structure and Globalization.
Figure 7 documents the association between Globalization and Government Size. As markets became more integrated for reasons which were beyond policymakers’ control, governments retrenched in different ways in the data: the relationship is actually positive in the French Legal Origin group, while negative in the other ones. This suggests that legal systems which provide more support to private financial contracts might also find it easier to accommodate the retreat of the State. The evidence in Figure 7 is consistent with the race‐to‐the‐bottom tensions we focus on, rather than with other approaches predicting that Openness should be positively related to Government Size because it generates more income volatility (Rodrik, 1998) or because it makes it possible for countries to raise taxes in order to bias terms of trade in their favor (Epifani and Gancia, 2009). Again the differences are economically significant. The same 400 change in Globalization considered above implies a 7 The figures’ legends report the regression specification and statistics regarding its ability to fit the data, and the significance of intercept and slope differences across the four sub‐samples. The French Legal Origin sub‐sample is the reference group in the estimated equations, here and in all further regressions.

14
decline in Government Size of only about half a percent of GDP for the English Legal Origin group, a much larger decline of 2.4 percent of GDP for the Scandinavian Legal Origin group.
To further explore the relationships between government policies and globalization trends, we plot in Figure 8 the associations between Globalization and Social Policy. This picture’s story is interestingly different from that of Figure 7, because the relationship is positive in all Legal Origin groups, except the Scandinavian one. As Globalization makes social protection more desirable (Rodrik, 1998) at the same time as it makes it more difficult for national governments to design and enforce it (Sinn, 2003), governments find it more difficult to shape individual incomes, but the need to do so is more pressing. Hence, they may (or may not) do more in that area, and even as the total Government Size is reduced by Globalization, Social Policy may (or may not) increase. 8
In summary, the evidence displayed and discussed in this section indicate that policy variables are related in sensible ways to Globalization, and that those relationships are shaped by Legal Origin in ways that broadly conform to traditional views of the relative importance of government policies and private markets across country groups.
5. Deep determinants of financial development
The previous section’s analysis documents that globalization forces and legal traditions shape each of the four policy variables of interest: Financial Structure, actual (rather than “natural”) Openness, and government policies, represented by Government Size and Social Policy indicators. In technical terms, the empirical relationships shown and discussed in Figures 5‐8 can support specification of “first stage” regressions for determination of policies that, in turn, are theoretically expected to influence Financial Development.
Proceeding to discuss how financial transactions intensity actually evolved, we inspect in Figure 9 the “reduced‐form” relationship between our Financial Development and Globalization indicators: the regression turns out to explain a small proportion of the observed variation in Financial Development across countries and periods (the slope is positive in the French reference group, and significantly different only in the German group, where it is negative). Such a mixed relationship between Globalization and Financial Development indicates that different country‐specific reactions on different policy margins have contrasting implications for actual financial development.
5.1 From policies to finance
In order to trace the Financial Development effects of Globalization through such policy choices, we proceed to formulate (and, to the extent possible, test) assumptions that establish a cause‐and‐effect chain through the cross‐sectional, time‐series, and policy aspects of our data.
Technically, we run Instrumental Variables (IV) regressions (see Box 2 for a formal description of the specification). We suppose that Financial Development is influenced by Financial Structure, Openness, Government Size and Social Policy. And we suppose that these four policy indicators are in turn driven by suitable “instrumental variables” that determine “endogenous” policy choices (rather than being determined by them), and do not directly affect Financial Development (so that they may be “excluded instruments” in empirical models).
8 Besides Legal Origin, other country‐level characteristics, such as e.g. ethnic fractionalization (Alesina et al., 2003), might be relevant explanatory variables in this area.
15
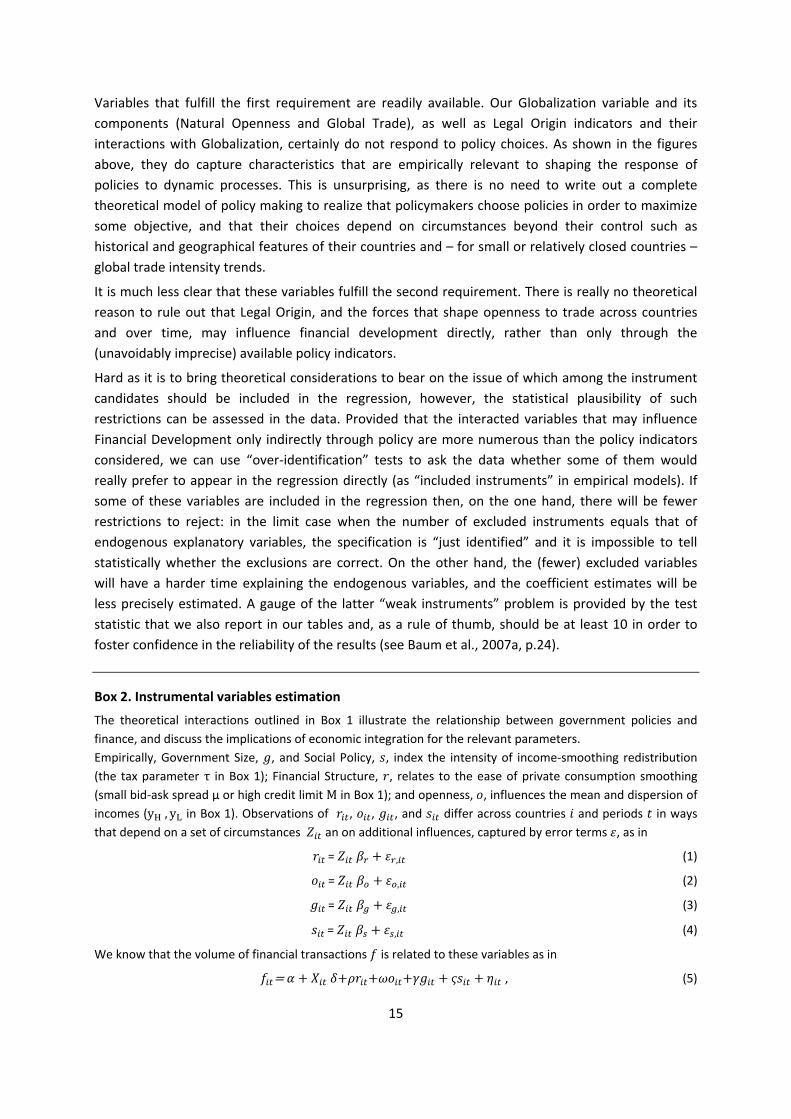
Variables that fulfill the first requirement are readily available. Our Globalization variable and its components (Natural Openness and Global Trade), as well as Legal Origin indicators and their interactions with Globalization, certainly do not respond to policy choices. As shown in the figures above, they do capture characteristics that are empirically relevant to shaping the response of policies to dynamic processes. This is unsurprising, as there is no need to write out a complete theoretical model of policy making to realize that policymakers choose policies in order to maximize some objective, and that their choices depend on circumstances beyond their control such as historical and geographical features of their countries and – for small or relatively closed countries – global trade intensity trends.
It is much less clear that these variables fulfill the second requirement. There is really no theoretical reason to rule out that Legal Origin, and the forces that shape openness to trade across countries and over time, may influence financial development directly, rather than only through the (unavoidably imprecise) available policy indicators.
Hard as it is to bring theoretical considerations to bear on the issue of which among the instrument candidates should be included in the regression, however, the statistical plausibility of such restrictions can be assessed in the data. Provided that the interacted variables that may influence Financial Development only indirectly through policy are more numerous than the policy indicators considered, we can use “over‐identification” tests to ask the data whether some of them would really prefer to appear in the regression directly (as “included instruments” in empirical models). If some of these variables are included in the regression then, on the one hand, there will be fewer restrictions to reject: in the limit case when the number of excluded instruments equals that of endogenous explanatory variables, the specification is “just identified” and it is impossible to tell statistically whether the exclusions are correct. On the other hand, the (fewer) excluded variables will have a harder time explaining the endogenous variables, and the coefficient estimates will be less precisely estimated. A gauge of the latter “weak instruments” problem is provided by the test statistic that we also report in our tables and, as a rule of thumb, should be at least 10 in order to foster confidence in the reliability of the results (see Baum et al., 2007a, p.24).
Box 2. Instrumental variables estimation
The theoretical interactions outlined in Box 1 illustrate the relationship between government policies and finance, and discuss the implications of economic integration for the relevant parameters. Empirically, Government Size, , and Social Policy, , index the intensity of income‐smoothing redistribution (the tax parameter τ in Box 1); Financial Structure, , relates to the ease of private consumption smoothing (small bid‐ask spread μ or high credit limit Μ in Box 1); and openness, , influences the mean and dispersion of incomes (yH , yL in Box 1). Observations of , , , and differ across countries and periods in ways that depend on a set of circumstances an on additional influences, captured by error terms , as in
= , (1)
= , (2)
= , (3)
= , (4)
We know that the volume of financial transactions is related to these variables as in , (5)
16
where the vector includes variables that matter for financial transactions alongside the policy indicators of interest of which we would like to estimate the “structural” coefficients , , , and . It would not be appropriate to estimate those parameters by ordinary least squares, because there is no reason to suppose that the random component of policies is uncorrelated with the term that policies do not explain in (5). In fact, there is every reason to expect the unobservable determinants of policy to be related to those of financial transactions, because the policy variables (1‐4) on the right‐hand side of (5) are chosen so as to maximize an objective that, among other things, depends on financial transactions. The vectors and may include a very large number of variables that are potentially relevant to policy choices, financial development, or both (in which case and have elements in common). If sufficiently many of the policy‐relevant circumstances are observable, not directly relevant to financial development, exogenous to policy, and sufficiently informative about the four distinct endogenous policy variables, then it is possible to estimate the structural impact of policy on Financial Development, and assess the relevance of those circumstances to policy choices. Plausible suitable elements of the policy determinants vector are Natural Openness ( , Global Trade ( , their Globalization interaction , Legal Origin indicators (for which we estimate intercept coefficients , where identifies the legal origin group to which country belongs), and interactions of Globalization with Legal Origin (with slope effect ). The resulting specification for equation (1) may be written
= ̃ , (6)
where the error term includes time‐varying determinants of openness that are orthogonal to the variables included (all uncorrelated with country‐specific policymaking interactions). The distribution of this error, and the coefficients, are specific to determination of Financial Structure in (6); similar regressions, with different parameters, can be specified for the other policy indicators in equations (2‐4). These differ from those reported in Figures 5‐9 only in that they feature, along with the slope effect of the “Globalization” variable, also the main slope effects of its and components: including these effects would make it impossible to plot the regression lines in bivariate pictures, but they naturally belong in formal regression specifications for the “first stage” of instrumental variables estimation of equation (5). Estimating by ordinary least squares the main and interaction coefficient of equations in the form (6), we extract the component of country‐specific policy developments that reflects reactions to global trends shaped by observable time‐invariant country characteristics. Under the assumption that neither global trends nor time‐invariant characteristics are determined by individual country policies, and that sufficiently many main and interaction terms can be excluded from the vector that is directly relevant to financial development, it is possible to estimate “second stage” structural coefficients for the endogenous policy variables in equation (5).
5.2 Identification
To assess the statistical plausibility of various specifications, we will compare results from a variety of instrumental variables approaches to the simple linear least square (OLS) regression results reported in Table 3. In the first column of Table 3 Financial Structure is strongly and positively associated to Financial Development indicating that, when countries liberalize their financial systems, it becomes easier to supply financial services and transactions volumes increase. In the second column we also control for Openness, which does not appear to be directly associated with Financial Development. Its significance remains very modest in column 3, where we include Government Size and find that its partial association with Financial Development is negative, consistently with the idea that a larger public sector reduces the demand for private finance. Including all our four policy variables in column

17
4, we find that Financial Development decreases with Government Size and increases with Financial Structure and Social Policy.
The latter positive relationship may indicate that, while private markets and public policies substitute each other in addressing households and firms’ investment and savings’ needs, something (that could be Openness) drives Social Policy along with Financial Development. It is pointless, however, to try and interpret theoretically the estimates of least‐square regressions where the association between policy variables and the outcomes of interest, as pointed out by e.g. Rodrik (2005), reflects “endogenous” policy choices rather than random policy experiments. The positive association between Financial Development and Financial Structure, for example, cannot be taken to imply that any country in the sample would experience higher Financial Development along the estimated relationship: countries with larger observed values of Financial Structure may and should be those where Financial Development is larger, or financial reforms appropriate, for a variety of other reasons, including policy reactions along other dimensions.
Instrumental variables estimation makes it possible to distill a clearer message from the intricate web of empirical relationships between policies and Financial Development. The regressions reported in Table 4 relate each country and period’s ratio of private credit to GDP to the portion of policy that is explained by exogenous forces, rather than to observed policy variables.
The specifications we use to characterize the determination of policy variables are inspired by the simple relationships illustrated in Figures 5‐8. They always include (and exclude from direct determinants of Financial Development) the interacted Globalization index measured on the horizontal axis of those figures, as well as its Global Trade and Natural Openness components. If only these variables served as excluded instruments, the model could feature at most three policy indicators. The results of such “just‐identified” specifications are not worth reporting, as the instruments prove to be weak and yield very imprecise coefficient estimates.
In columns 1‐4 of Table 4, not only Globalization and its components, but also its interactions with Legal Origin are excluded from the regression (and serve as instruments), while we allow Legal Origin to affect Financial Development directly. In these and all other regressions of Table 4 the specification test reported at the bottom of the table indicates that instrumental variables estimates are appropriate (and that the least square estimates of Table 3 are biased). The over‐identification test is not rejected by the data, which however do not offer evidence of instrument relevance in columns 3 and 4: the excluded instruments do not provide enough information to disentangle the effects of three or four policy variables.
In columns 5‐8 of Table 4 we suppose that Legal Origin can influence Financial Development only through its relationship with Financial Reforms, Openness, and government policies. The coefficients are significant in most cases, and this specification is able to capture much of the variation in country‐specific trajectories in theoretically sensible ways: Financial Development increases in Financial Structure, decreases in Government Size, and is insignificantly related to Openness until we include Social Policy in column 8. In columns 5‐7, rejection of over‐identifying restrictions indicates that some of the underlying explanatory variables affect Financial Development directly, as well as (or instead of) through the endogenous variables. This is not surprising: even though geography and remote historical events plausibly shape Financial Development only through their influence on subsequent policies, available policy indicators can provide only a very rough description of this channel. The explanatory power of our specifications increases as we move from the one‐policy‐
18
indicator model in column 5 to the more comprehensive model of column 7, but elusive important details would only be revealed by inclusion of information on aspects that, while also influenced by the country’s circumstances, are not captured by the information we make available to the regressions.
As was also the case in Table 3, an important component of the relevant heterogeneity appears to be captured by information on Social Policy. In column 8, where Social Policy is included in the regression and instrumented by our exogenous Globalization (and its components) and Legal Origin indicators’ main and interacted effects, the regression passes all the specification tests. The test of over‐identifying restrictions is not rejected, and the relevance of the instruments is high enough to indicate that our set of excluded instruments captures well the variation of policy variables.
5.3 Robustness and quantitative implications
The model in column 8 of Table 4 is therefore our preferred specification for the purpose of assessing deep determinants and financial consequences of policy choices. To assess its robustness, we included in the set of instruments per capita GDP or a dummy that controls for the different stage of development of less advanced countries, Mexico and Turkey. Appendix Table A.1 reports the resulting estimates, which are very similar, and remain similar also when country dummies rather than Legal Origin are included in the set of instruments (over‐identifying restrictions are rejected, however, and the specification test indicates that within‐country data do not contain enough information to discriminate between IV and OLS estimates). Table A.1 also reports estimates of our preferred specification when Shipment Costs or a precompiled “World Trade Volume in goods and services” measure from the OECD’s Main Economic Indicators database replaces our Global Trade indicator, and when the dependent variable is the ratio of Stock Market Capitalization to GDP rather than the ratio of Private Credit to GDP.
In our preferred specification Openness as such, after controlling for the implications of other relevant aspects of policy, plays a negative, statistically significant, small role in explaining Financial Development. Changing Openness by 32 p.p. of GDP, its standard deviation over all countries and periods, implies a decline of Financial Development (i.e., of private credit to GDP) by 10.7 p.p. This is small relative to the standard deviation of Financial Development over the entire sample, which is 44.76.
Financial Structure and Government Size play a more important role in explaining financial volumes. Multiplying the standard deviations in the sample of Financial Structure (4.67) by its coefficient in column 8 of Table 4 (which is substantially larger than its counterparts in Table 3, as may be expected when instrumental variables estimation is appropriate) would imply an increase of 27.73 p.p. in Financial Development. Symmetrically, a change in Government Size of one standard deviation (3.53) would lead to a decline of Financial Development by 20.44 p.p. This sensibly indicates that government involvement in economic matters relieves financial markets of some of their duties. An increase of Social Policy by its sample standard deviation (6.50) would instead imply an increase of Financial Development by 19.37 p.p. This positive effect is admittedly harder to interpret. Taken at face value, it might indicate that a more generous safety net encourages financial market participation; the result, which is robust to exclusion of Scandinavian countries from the regression, might however be driven by features of the data generating process that are not captured by our specification.

19
6. Discussion and conclusion
Our theoretical perspective and empirical results suggest that forces removing obstacles to international trade have in recent decades fostered financial development by prompting governments’ retreat from interference with markets within countries’ borders, in ways that depend on countries’ characteristics. In this final section we discuss how our estimates on 5‐year averaged data can gauge the strength and assess the implications of these mechanisms, in particular as regards possible permanent elements of the substitution across the public and private dimensions of economic interactions witnessed in the course of the 2008‐09 global crisis.
6.1 Crisis implications
Our regression results trace how policymakers reacted to easier trade opportunities, which had different implications for different policies across countries with different legal origin and geographical characteristics, and for the resulting financial development. This perspective on past developments is interesting because the technological, cultural, and political forces that drove the expansion of world trade since the end of the cold war may sooner or later wane.
During the 2008‐09 financial crisis, government deficits and debt grew as financial markets shrank. When financial markets malfunction, as they spectacularly did recently, a “great reversal” may occur not only through politico‐economic channels whereby the lack of competition strengthens incumbents by triggering protectionism and financial re‐regulation (Rajan and Zingales, 2003) but also because lack of financial market access may prompt well‐intentioned policymakers to strengthen the protection afforded by collective redistribution policies. It is interesting, therefore, to characterize whether and how the mechanisms we analyze in our 1980‐2007 data may work in reverse in the aftermath of the 2008‐09 crisis.
The specifications in Table 4 of “deep” structural policy effects yield suggestive estimates of how policies and outcomes may evolve if the exit route from the crisis features larger governments (heavier taxes and stricter regulation), as well as some degree of financial repression, and implicit or explicit trade protectionism of the type discussed and deplored by the World Trade Organization (2010).
Over the 5‐year medium run horizon of our data and from our theoretical perspective, it is interesting to examine the implications of our estimates for the policy consequences of the dramatic and potentially persistent Openness developments during the crisis. The International Monetary Fund (2010) reports that world output declined by 0.8% in 2009, while world trade volume (in goods and services) fell by 12.8%. Its predictions for 2010 (3.9% growth in output, 5.8% growth in trade), while heavily qualified by uncertainty regarding crisis resolution, are roughly consistent with a persistent decline of some 10 p.p. in our Global Trade indicator.
Should that indicator remain lower, Globalization would exert less pressure on country‐specific policies, and our estimates would imply changes of relevant policies that would in turn imply persistent structural changes in Financial Development. The change in our Globalization indicator implied by a decline of 10 p.p. in Global Trade intensity depends on each country’s Natural Openness, and in our specifications the resulting policy changes depend on its Legal Origin. In Table 5 we report our empirical model’s predictions for some representative countries: Portugal (Natural Openness equal to 18.8, near the 21.3 mean of its French Legal Origin group); United Kingdom (Natural Openness 13.5, near the 11.2 mean of its English group); Germany (Natural Openness 18.5, near its

20
German group’s 23.3 mean); and Finland (Natural Openness 21.6, near the 23.6 mean of its Scandinavian group).
As shown in the Table, a 10 p.p. decline in Global Trade implies changes of Financial Structure that are similar in all countries, and substantial at about two thirds of that indicator’s standard deviation over the whole sample. Changes of actual Openness are in the order of 10 p.p. of GDP, but in French and English legal tradition countries the regressions predict that trade‐relevant policies amplify the external Globalization shock, while German and Scandinavian countries undershoot the Global Trade shrinkages. The reactions of Government Size and Social Policy are also different across Legal Origin groups: Government Size is expected to increase more in Scandinavian Legal Origin countries, and less in the French Legal Origin group, while the opposite is true for predicted decreases in Social Policy. The last column of Table 5 indicates that, in all cases, the Financial Development indicator is predicted to fall by about a quarter of GDP.
Should the crisis‐related trade collapse persist over the 5‐year horizon considered by our empirical specifications, these estimates paint a picture of the policy and finance consequences of retracing previous globalization paths. It is of course too early to compare this prediction to actual outcomes. In terms of our estimates, which refer to the ratio of private credit outstanding to crisis‐struck GDP, 2009 would not appear to be a particularly bad year for credit growth. During 2009, overall private credit is estimated by the International Monetary Fund (2009, p.29, Table 1.5) to have experienced an unprecedented but relatively modest decline of less than one percent in the United States and 3.2% in the United Kingdom, while growing modestly in the Euro area. It is hard to gauge the extent to which the observed mildness of the credit “crunch” in these statistics resulted from emergency public support of private banks and credit markets, and even harder to assess the extent to which these developments might have reflected more or less temporary deterioration of the financial market infrastructure represented in our empirical work by Legal Origin and Financial Reform indicators.
6.2 Causes and effects of policies
While the estimated effects in Table 5 are strikingly large and intriguingly different across Legal Origin groups, they need not be as large and as different as they might turn out to be in a reality where policies were and will be driven by many other, less visible factors than Globalization.
If policy changes play the same role in all countries and periods (the debatable premise of any comparative empirical work), the estimated coefficients can also be used to trace actual financial developments to actual policy choices. Policy variation explains about 40% of the sample’s financial development variation, and the model offers a decomposition of this sizeable systematic component in terms of different policies’ contributions. For example, across the OECD countries in our sample, between 1985‐89 and 2000‐04, average policy changes predict a 19.8 percentage point (p.p.) increase in the Private Credit to GDP ratio (very close to the actual 18.3 p.p. change; the model, of course, does not do as well for individual countries and shorter periods, where such direct shocks to financial development as the Swedish and Finnish financial crises are important and visible). The estimated model attributes some 16 points of the increase to financial deregulation, while the contributions of the 17 p.p. increase in openness (‐5.76 p.p.) and of the 1 p.p. change in the government share of GDP (+6.97 p.p. of Private Credit/GDP) nearly offset each other. On the basis of these estimates, those who would like to reduce reliance on financial transactions after the crisis
21
should not try and do so by reducing openness: the structural association between openness and finance at given levels of other policies is mildly negative, rather than positive as in the overall plot above.
To the extent that our instrumental variables procedure delivers reliable estimates of the financial development implications of policies, they can be used to assess the consequences of such policy reforms as may be driven by e.g. political election results, by information technology’s impact on the relative efficiency of government policies and private markets, or by the reader’s whim and imagination. If our identification of relevant differences across countries and periods is valid, in fact, changes of policy indicators are predicted to have the effects we estimate regardless of whether they are shaped by the “instrumental variables” we considered. As discussed in Rodrik et al. (2004), the statistical relevance of persistent influences of ancient conquests and colonial experiences on countries’ legal frameworks and institutional developments is empirically useful for the purpose of identifying and assessing the role of exogenous factors, but countries are not condemned by history, and their policymakers can (within the constraints imposed by historical legacies) choose suitable policy mixes.
Our estimation strategy traces the roots of financial development to policy changes, whether resulting from responses to globalization, or from other country‐specific motives. It cannot tell us whether those changes were chosen by occasionally ill‐advised politicians, or were suitable responses to new conditions. Finance was a good thing while it lasted, and it is good to have it back after the crisis. Like all things, however, finance has costs as well as benefits, which may or may not have been taken into account correctly at the time policy choices were made. In order to inform and assess such choices, our approach would need to be extended beyond the interplay of policies and financial development. The data’s structure suggests that openness steers countries towards private financial market development and smaller governments, and that different combinations of policy reactions are chosen by countries with different legal traditions. Our estimates describe and measure these sensible features of reality, but do not offer normative prescriptions. The retreat of the state and the resulting expansion of private finance may be a good or a bad thing, depending on whether policy is the result of rent‐seeking tensions (as in e.g. Rajan and Zingales, 2003) or of well‐intentioned attempts to remedy markets’ shortcomings in addressing inequality and risk issues (as in e.g. Rodrik, 1998). As we do not have information about the costs of financial reforms and the benefits of international economic integration, views on this crucial issue unavoidably depend strongly on one's prior.
In principle, it would be interesting to try and characterize policy reactions to globalization forces in terms of their impact not just on financial development, but on such welfare‐relevant indicators as the level and growth rate of income, and the inequality and volatility of income and consumption. While country‐level growth experiences are certainly influenced by many difficult‐to‐capture country characteristics and policies, future work may make and discuss further identifying assumption in order to relate policy reactions to the growth, inequality, and instability of income and consumption. Relevant data are only beginning to become available on a cross‐country comparable basis (Krueger et al., 2010), but may make it possible to assess the extent to which policies have responded correctly to globalization pressures, and to gauge the welfare implications of globalization for different types of countries.

22
References
Abiad, A., E. Detragiache, and T. Tressel (2008). “A New Database of Financial Reforms,” IMF Working Paper Series, n. 266.
Adema, W., and M. Ladaique (2009). “How Expensive is the Welfare State? Gross and Net Indicators in the OECD Social Expenditure Database (SOCX),” OECD Social, Employment and Migration Working Papers, n. 92.
Agell, J. (2002). “On the Determinants of Labor Market Institutions: Rent Seeking vs Social Insurance,” German Economic Review, 3:2, 107‐135.
Alesina, A., A. Devleeschauwer, W. Easterly, S. Kurlat, and R. Wacziarg (2003). "Fractionalization," Journal of Economic Growth, 8:2, 155‐194.
Baum, C.F., M.E. Schaffer, and S. Stillman (2007a). “Enhanced routines for instrumental variables/GMM estimation and testing,” Boston College Economics Working Papers, n. 667, September.
Baum, C.F., M.E. Schaffer, and S. Stillman (2007b). “ivreg2: Stata module for extended instrumental variables/2SLS, GMM and AC/HAC, LIML and k‐class regression,” http://ideas.repec.org/c/boc/bocode/s425401.html.
Beck, T. (2002). “Financial development and international trade: Is there a link,” Journal of International Economics, 57:1, 107‐131.
Beck, T., and A. Demirgüç‐Kunt (2009). "Financial Institutions and Markets Across Countries and over Time: Data and Analysis," World Bank Policy Research Working Paper, n. 4943, June.
Ben‐David, D. (2001). “Trade liberalization and income convergence: a comment,” Journal of International Economics, 55:1, October, 229‐234.
Bertola, G., R. Foellmi, and J. Zweimüller (2007). “Income Distribution in Macroeconomic Models?” Princeton University Press, Woodstock.
Bertola, G., and W. Koeniger (2007). “Consumption Smoothing and Income Redistribution,” European Economic Review, 51:8, 1941‐1958.
Bertola, G., and W. Koeniger (2010). “Public and Private Insurance with Costly Transactions,” working paper.
Bertola, G., and A. Lo Prete (2008). “Openness, Financial Markets, and Policies: Cross‐Country and Dynamic Patterns,” CEPR Discussion Papers, n. 7048; Annales d’Economie et de Statistique, forthcoming.
Do, Q. and A.A. Levchenko (2007). “Comparative advantage, demand for external finance, and financial development,” Journal of Financial Economics, 86:3, 796‐834.
Epifani, P., and G. Gancia (2009). “Openness, Government Size and the Terms of Trade,” Review of Economic Studies, 76:2, 629‐668.
Frankel, J.A., and D. Romer (1999). “Does Trade Cause Growth?,” American Economic Review, 89:3, 379‐399.
Hauner, D., and A. Prati (2008). “Openness and Domestic Financial Liberalization: Which Comes First?,” preliminary draft, presented at the IMF conference “On The Causes And Consequences Of Structural Reforms” Washington DC, February 28–29.
Heston, A., R. Summers, and B. Aten (2009), “Penn World Table Version 6.3,” compiled by the Center for International Comparisons of Production, Income and Prices at the University of Pennsylvania, August 2009.

23
Huang, Y., and J.R.W. Temple (2005). “Does External Trade Promote Financial Development?,” CEPR Discussion Papers, n. 5150.
Hubbard, R.G., and K.L. Judd (1986). “Liquidity Constraints, Fiscal Policy, and Consumption,” Brookings Papers on Economic Activity, 1:1986, Spring, 1‐51.
Hummels, D. (2007). “Transportation Costs and International Trade in the Second Era of Globalization,” Journal of Economic Perspectives, 21:3, 131‐154.
International Monetary Fund (2009). Global Financial Stability Report: Navigating the Financial Challenges Ahead, IMF Publications: Washington DC.
International Monetary Fund (2010). World Economic Outlook Update, January 2010, available online: http://www.imf.org/external/pubs/ft/weo/2010/update/01/.
Krueger, D., F. Perri, L. Pistaferri, and G.L. Violante (2010). “Introduction to Cross Sectional Facts for Macroeconomists,” Review of Economic Dynamics, 13:1, 1‐14.
La Porta, R., F. Lopez‐de‐Silanes, A. Shleifer, and R.W. Vishny (1998). “Law and Finance,” Journal of Political Economy, 106:6, 1113‐1155.
Rajan, R.G., and L. Zingales (2003). “The great reversals: the politics of financial development in the twentieth century,” Journal of Financial Economics, 69, 5‐50.
Rodrik, D. (1997). Has Globalization Gone Too Far?, Institute for International Economics: Washington.
Rodrik, D. (1998). “Why Do More Open Economies Have Bigger Governments?,” Journal of Political Economy, 106:5, 997‐1032.
Rodrik, D. (2005). “Why We Learn Nothing from Regressing Economic Growth on Policies,” working paper, Harvard University.
Rodrik, D., A. Subramanian, and F. Trebbi (2004). “Institutions Rule: The Primacy of Institutions Over Geography and Integration in Economic Development,” Journal of Economic Growth. 9:2, 131‐165.
Sinn, H.W. (2003). The New Systems Competition, Basil Blackwell: Oxford. Slaughter, M.J. (2001). “Trade Liberalization and Per Capita Income Convergence: A Difference‐in‐
Differences Analysis," Journal of International Economics, 55:1, October, 203‐228. Svaleryd, H., and J. Vlachos (2002). “Markets for risk and openness to trade: how are they related?,”
Journal of International Economics, 57, 369‐395. Tressel, T., and E. Detragiache (2008). “Do Financial Sector Reforms Lead to Financial Development?
Evidence from a New Dataset,” IMF Working Papers, n. 08/265. Varian, H.R. (1980). “Redistributive Taxation as Social Insurance,” Journal of Public Economics, 14, 49‐
68. World Trade Organization (2010). World Trade Report 2009 ‐ Trade Policy Commitments and
Contingency Measures, WTO Publications: Geneva.

24
Data Appendix
Our dataset includes 1980‐2007 data from various sources for 22 countries: Australia, Austria, Belgium, Canada, Denmark, Finland, France, Germany, Greece, Ireland, Italy, Japan, Mexico, the Netherlands, New Zealand, Portugal, Spain, Sweden, Switzerland, Turkey, United Kingdom, United States. Country coverage is limited by availability of data on Public Social Expenditure (available only for OECD countries) and Financial Reform (not available for Iceland, Luxembourg, and Slovak Republic). We exclude Poland, which would be the only formerly Social/Communist Legal Origin country in the sample, and we pay particular attention to the impact on our empirical results of including the less advanced OECD members, Mexico and Turkey.
Annual data are interpolated when missing, and filled backwards and forward using, respectively, the first and last value available in the time series. Data of the resulting balanced sample are averaged over six non‐overlapping sub‐periods of five years each (three years in the last one, 2005‐2007). Regression results are virtually identical if averages are computed using only available observations.
Financial Market Development For financial market development information we draw on the World Bank “Financial Development and Structure Database,” as documented in Beck and Demirgüç‐Kunt (2009); the May 2009 version extends to 2007 data.
Financial Development. The variable “Private Credit by Deposit Money Banks and Other Financial Institutions to GDP” measures private credit as a share of GDP. We rescale this variable and express private credit to GDP in percentage points.
Stock Market Capitalization. The variable “Stock Market Capitalization to GDP” considers the value of listed shares to GDP. We rescale this variable and express it in percentage points.
Financial Market Structure The “Financial Reform Database” by the IMF (2008), as documented in Abiad et al. (2008), provides information on the structure of national financial systems and their development.
Financial Structure. The IMF “Financial Reform Index” is available between 1973 and 2005 for 91 countries. It considers seven dimensions of financial sector policy (credit controls and reserve requirements, interest rate controls, entry barriers, state ownership, policies on securities markets, banking regulations, and restrictions on the capital account). Along each dimension, a country is given a score on a graded scale from zero to three, with zero corresponding to the highest degree of repression and three indicating full liberalization. Liberalization scores for each category are then combined in a graded index that takes values between zero and 21.
Actual and Natural Openness Data on economic and natural integration are drawn from various sources.
Openness. To describe “actual” openness we use the variable “Openness in Current Prices”, drawn from the Penn World Tables, Version 6.3, compiled by Alan Heston et al. (2009). This variable measures total trade, computed as exports plus imports, as a percentage of GDP, and is expressed in percentage points.
Shipment Costs. Hummels (2007) collects data on shipment costs for ocean transport of dry (i.e. non oil) cargo from 1948 to 2003‐04. Freight Rate Indices are available for both liner trade (a market

25
organized into cartels) and trip charters shipping (whose price is decided in spot markets) and differ with respect to the price deflator used: “Liner ‐ German GDP deflator (c1)”; “Liner ‐ German import price deflator (c2)”; “Trip Charter ‐ US GDP deflator (c3)”; “Trip Charter ‐ Commodity Price Deflator (c4).” In Figure 4 we plot the “c3” index of trip charters’ shipment costs, deflated by the US GDP deflator, and then use it as a measure of exogenous time‐varying trends in the regression reported in Table A.1. The value in the last sup‐period is equal to the last value available in the time series (i.e. the value in 2003). Regression results in the fourth column of Table A.1 are similar (with less evidence of instrument relevance) if we exclude observations for the 2005‐2007 sub‐period.
Natural Openness. We use the trade‐relevant component of countries’ geographical characteristics as measured by Frankel and Romer (1999). This variable is based on bilateral trade equation estimates, then aggregated to obtain country‐specific “natural” shares in world trade, and provides cross‐sectional information for 94 countries.
Global Trade. To compute the share of global trade (exports plus imports) as a percentage of global GDP, we use data on “Openness in Current Prices,” “Real GDP per capita in Current Prices”, and “Population” drawn from the Penn World Tables, Version 6.3 (Heston et al., 2009). We consider not only the 22 OECD countries included in our sample, but all the 182 countries for which these data are available. We multiply Openness (a variable expressed as a percentage of GDP) by Real GDP per capita and Population, then sum the resulting level of total trade over all countries, and divide it by the sum of the Real GDP level over all countries.
Globalization. This variable is the product of “Global Trade” and “Natural Openness” (defined above).
World Trade Volume. The variable “World trade in goods and services (volume) seasonally adjusted, in billions of 2000 US dollars,” drawn from the OECD International Trade dataset (a subset of the Main Economic Indicators database, updated in 2009). It is constructed as the arithmetic average of the volume of world imports and world exports, where these variables are in turn computed as the weighted average of the growth rate of the volume of individual countries’ exports (imports), using as weights the value in 2000 of each country’s share of global goods and services exports (imports) expressed in US dollars.
Government Policies Government Size. The variable “Government share of Real GDP per capita,” drawn from the Penn World Tables, Version 6.3 (Heston et al., 2009).
Social Policy. Ratio of “Social Expenditure” to “Gross Domestic Product,” both in current prices, from the OECD Social Expenditure database as documented by Adema and Ladaique (2009). The Social Expenditure series is available for OECD countries from 1980 but only until 2005, and includes data on the following main policy areas: old age, survivors, incapacity‐related benefits, health, family, active labor market programs, unemployment, housing, other social policy areas.
Legal Origin Legal Origin. The “Legal Origin” indicator is a dummy variable reported by La Porta et al. (1998) to define five possible legal‐origin samples: English Common Law; French Commercial Code; German Commercial Code; Scandinavian Commercial Code; Social/Communist Laws.

26
Figure 1. Finance and Openness
Figure 2. Government Policies and Openness
050
100
150
200
Fina
ncia
l Dev
elop
men
t
0 50 100 150 200Openness
Levels
-100
-50
050
100
Fina
ncia
l Dev
elop
men
t
-40 -20 0 20 40Openness
Deviations from country means
050
100
150
200
Fina
ncia
l Dev
elop
men
t
0 5 10 15 20Financial Structure
Levels
-100
-50
050
100
Fina
ncia
l Dev
elop
men
t
-10 -5 0 5 10Financial Structure
Deviations from country means
510
1520
25G
over
nmen
t Siz
e
0 50 100 150 200Openness
Levels
-4-2
02
4G
over
nmen
t Siz
e
-40 -20 0 20 40Openness
Deviations from country means
010
2030
40S
ocia
l Pol
icy
0 50 100 150 200Openness
Levels
-50
510
Soc
ial P
olic
y
-40 -20 0 20 40Openness
Deviations from country means

27
Figure 3. Finance and Government Policies
Figure 4. Global Trade and Shipment Costs
050
100
150
200
Fina
ncia
l Dev
elop
men
t
5 10 15 20 25Government Size
Levels
-100
-50
050
100
Fina
ncia
l Dev
elop
men
t
-4 -2 0 2 4Government Size
Deviations from country means0
5010
015
020
0Fi
nanc
ial D
evel
opm
ent
0 10 20 30 40Social Policy
Levels
-100
-50
050
100
Fina
ncia
l Dev
elop
men
t
-5 0 5 10Social Policy
Deviations from country means
4045
5055
6065
Glo
bal T
rade
1980-1984 1985-1989 1990-1994 1995-1999 2000-2004 2005-2007
3035
4045
Shi
pmen
t Cos
ts
1980-1984 1985-1989 1990-1994 1995-1999 2000-2004 2005-2007

28
Figure 5. Globalization and Openness, by Legal Origin
Notes: The lines plot regressions within each of the four Legal Origin groups of Openness, , on Globalization, , where = Natural Openness in country and = Global Trade in sub‐period . The overall specification, in the form = where indexes the Legal Origin groups (with French as the reference), explains 0.840 of the dependent variable variance in levels. Test of the joint significance for the intercept coefficients: F(3,124)=6.71, Prob>F=0.000. Test of the joint significance for the slope coefficients: F(3,124)=10.79, Prob>F=0.000. All tests are computed using heteroskedasticity‐robust standard errors.
25.9
5957
175.
2211
17.6
7634
107.
0593
219.2012 2323.224 730.1363 1958.635
French English
German Scandinavian
Ope
nnes
s
Globalization

29
Figure 6. Globalization and Financial Structure, by Legal Origin
Notes: The lines plot regressions within each of the four Legal Origin groups of Financial Structure, , on Globalization, , where = Natural Openness in country and = Global Trade in sub‐period . The overall specification, in the form = where indexes the Legal Origin groups (with French as the reference), explains 0.175 of the dependent variable variance in levels. Test of the joint significance for the intercept coefficients: F(3,124)=5.11, Prob>F=0.002. Test of the joint significance for the slope coefficients: F(3,124)=1.38, Prob>F=0.253. All tests are computed using heteroskedasticity‐robust standard errors.
2.8
21.1
5115
7.5
20
219.2012 2323.224 730.1363 1958.635
French English
German Scandinavian
Fina
ncia
l Stru
ctur
e
Globalization

30
Figure 7. Globalization and Government Size, by Legal Origin
Notes: The lines plot regressions within each of the four Legal Origin groups of Government Size, , on Globalization, , where = Natural Openness in country and = Global Trade in sub‐period . The overall specification, in the form = where indexes the Legal Origin groups (with French as the reference), explains 0.551 of the dependent variable variance in levels. Test of the joint significance for the intercept coefficients: F(3,124)=12.98, Prob>F=0.000. Test of the joint significance for the slope coefficients: F(3,124)=8.20, Prob>F=0.000. All tests are computed using heteroskedasticity‐robust standard errors.
11.3
3991
18.6
7999
6.36
3288
15.2
0475
219.2012 2323.224 730.1363 1958.635
French English
German Scandinavian
Gov
ernm
ent S
ize
Globalization

31
Figure 8. Globalization and Social Policy, by Legal Origin
Notes: The lines plot regressions within each of the four Legal Origin groups of Social Policy, , on Globalization, , where = Natural Openness in country and = Global Trade in sub‐period . The overall specification, in the form = where indexes the Legal Origin groups (with French as the reference), explains 0.468 of the dependent variable variance in levels. Test of the joint significance for the intercept coefficients: F(3,124)=9.50, Prob>F=0.000. Test of the joint significance for the slope coefficients: F(3,124)=8.49, Prob>F=0.000. All tests are computed using heteroskedasticity‐robust standard errors.
1.90
1056
32.3
3488
11.2
2097
27.1
9834
219.2012 2323.224 730.1363 1958.635
French English
German Scandinavian
Soc
ial P
olic
y
Globalization

32
Figure 9. Globalization and Financial Development, by Legal Origin
Notes: The lines plot regressions within each of the four Legal Origin groups of Financial Development, , on Globalization, , where = Natural Openness in country and = Global Trade in sub‐period . The overall specification, in the form = where indexes the Legal Origin groups (with French as the reference), explains 0.276 of the dependent variable variance in levels. Test of the joint significance for the intercept coefficients: F(3,124)=11.44, Prob>F=0.000. Test of the joint significance for the slope coefficients: F(3,124)=1.85, Prob>F=0.142. All tests are computed using heteroskedasticity‐robust standard errors.
10.2
6198
169.
2434
71.9
1608
188.
7346
219.2012 2323.224 730.1363 1958.635
French English
German Scandinavian
Fina
ncia
l Dev
elop
men
t
Globalization

33
Table 1. Natural Openness and Legal Origin indicators
Country Natural Openness Legal Origin
Australia 4.07 English Austria 36.64 German Belgium 52.46 French Canada 4.97 English Denmark 30.89 Scandinavian Finland 21.64 Scandinavian France 15.26 French Germany 18.47 German Greece 27.10 French Ireland 33.85 English Italy 13.97 French Japan 5.47 German Mexico 4.52 French Netherlands 35.84 French New Zealand 8.19 English Portugal 18.78 French Spain 12.38 French Sweden 18.22 Scandinavian Switzerland 32.57 German Turkey 11.26 French United Kingdom 13.47 English United States 2.56 English

34
Table 2. Policy indicators means over the sample period
By Legal Origin: Financial Structure
OpennessGovernment
Size Social Policy
French 15.03 67.86 14.75 18.38 English 18.35 61.40 13.59 17.01 German 16.44 59.84 11.21 20.52 Scandinavian 16.80 72.26 19.71 27.23
By Natural Openness: Financial Structure
Openness Government
Size Social Policy
1st quartile Australia 16.47 36.92 13.30 15.04 Canada 18.93 64.34 14.54 17.23 Japan 15.07 22.79 12.44 14.38 Mexico 13.27 48.10 13.67 4.57 New Zealand 17.23 58.58 15.46 19.08 United States 19.35 22.50 9.85 14.59 2nd quartile France 17.10 47.94 17.30 26.82 Italy 14.60 45.92 12.89 22.07 Spain 17.18 46.23 12.59 19.78 Turkey 11.66 44.49 15.51 9.32 United Kingdom 19.67 53.94 16.84 19.60 3rd quartile Denmark 17.61 78.35 18.88 26.19 Finland 15.12 64.29 17.35 25.44 Germany 17.80 57.68 12.95 25.15 Greece 12.33 50.70 14.19 17.35 Portugal 12.77 64.60 13.41 16.38 Sweden 17.67 74.14 22.89 30.06 4th quartile Austria 14.01 81.15 12.67 25.55 Belgium 16.94 144.87 15.55 25.86 Ireland 18.45 132.16 11.52 16.54 Netherlands 19.42 117.91 17.62 23.28 Switzerland 18.90 77.72 6.77 17.02

35
Table 3. Least squares regressions
Dependent Variable: Financial Development
1 2 3 4
Financial Structure 5.227 5.445 4.965 3.878 8.13 7.99 7.75 5.30
Openness ‐0.106 ‐0.059 ‐0.146 ‐1.01 ‐0.59 ‐1.30
Government Size ‐3.263 ‐5.000 ‐3.29 ‐4.93
Social Policy 1.991 3.16
Observations 132 132 132 132 R2 0.298 0.303 0.367 0.414
Notes: Robust t‐statistic in italics. All regressions include a constant, not reported.

36
Table 4. Instrumental variables regressions
Dependent Variable: Financial Development
1 2 3 4 5 6 7 8
Endogenous:
Financial Structure 7.092 7.598 8.643 10.393 7.643 8.349 7.364 5.936 5.98 5.36 4.81 4.35 7.10 7.31 6.68 5.03 Openness ‐0.097 ‐0.122 0.041 ‐0.182 ‐0.127 ‐0.334 ‐0.79 ‐0.91 0.18 ‐1.49 ‐1.08 ‐2.18 Government Size 3.738 6.776 ‐3.264 ‐5.795 0.94 1.38 ‐2.75 ‐4.98
Social Policy ‐2.599 2.982 ‐1.02 3.12
Exogenous:
English 9.609 7.305 8.019 3.239 Common Law 1.20 0.81 0.83 0.26
German 45.288 43.796 55.347 70.499 Commercial Code 5.10 4.78 3.11 2.85
Scandinavian 1.690 1.221 ‐19.060 ‐14.950 Commercial Code 0.17 0.12 ‐0.75 ‐0.59
Statistics: Over‐identifying 3.435 2.429 1.214 0.386 18.549 17.088 14.546 6.452 restrictions a (0.633) (0.657) (0.750) (0.824) (0.017) (0.017) (0.024) (0.265)
Specification test b 6.966 9.041 9.638 10.493 14.394 14.902 13.827 14.039 (0.008) (0.011) (0.022) (0.033) (0.000) (0.001) (0.003) (0.007)
Relevance of the instruments c
18.261 13.958 3.960 6.232 12.993 10.840 9.088 16.824
Observations 132 132 132 132 132 132 132 132
Notes: Robust t‐statistic in italics. All regressions include a constant, not reported.
Instrumental variables in columns 1‐4: Natural Openness, Global Trade, Globalization (the product of Natural Openness and Global Trade), and the products of Legal Origin dummies and Globalization.
Instrumental variables in columns 5‐8: Those in columns 1‐4 and Legal Origin dummies. Statistics (P‐values in parentheses) computed by the ivreg2 Stata module (Baum et al., 2007b), definitions: (a) Test of over‐identifying restrictions, under the null: all the excluded instruments are exogenous. (b) Specification test, under the null: estimates from OLS and IV are both consistent. (c) Weak instruments Wald F test based on the Kleibergen‐Paap rk statistic; robust to non‐i.i.d. errors;
Baum et al. (2007) suggest that weak identification should not be considered a problem if this statistic is at least 10.
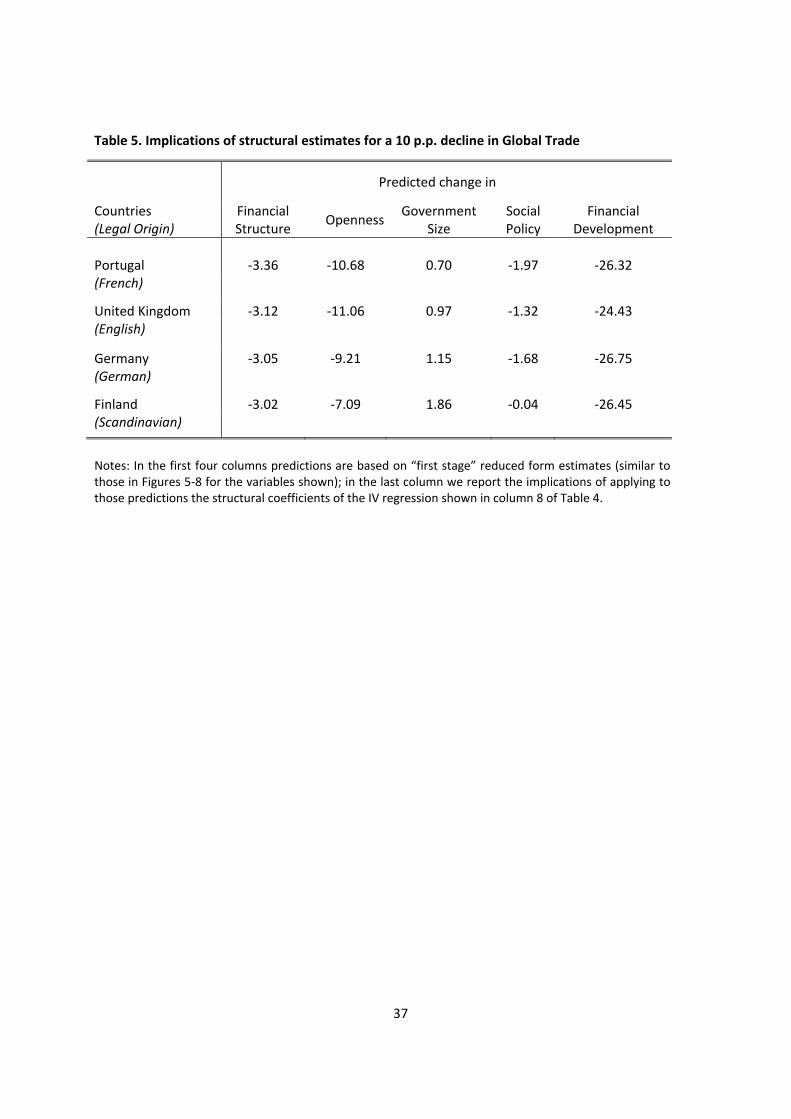
37
Table 5. Implications of structural estimates for a 10 p.p. decline in Global Trade
Predicted change in
Countries (Legal Origin)
Financial Structure
OpennessGovernment
Size Social Policy
Financial Development
Portugal ‐3.36 ‐10.68 0.70 ‐1.97 ‐26.32 (French)
United Kingdom ‐3.12 ‐11.06 0.97 ‐1.32 ‐24.43 (English)
Germany ‐3.05 ‐9.21 1.15 ‐1.68 ‐26.75 (German)
Finland ‐3.02 ‐7.09 1.86 ‐0.04 ‐26.45 (Scandinavian)
Notes: In the first four columns predictions are based on “first stage” reduced form estimates (similar to those in Figures 5‐8 for the variables shown); in the last column we report the implications of applying to those predictions the structural coefficients of the IV regression shown in column 8 of Table 4.

38
Table A.1. Robustness checks on the preferred instrumental variables results
Dependent Variable: Financial Development
Different Sets of Instrumental Variables
Different exogenous time‐varying trends
Different dependent
variable
Add per capita
GDP
Add dummy for
Advanced countries
Country dummies instead of
Legal Origin indicators
Shipment Costs
World Trade
Volume
Stock Market Capitalization
Endogenous:
Financial Structure 6.121 5.872 6.950 3.079 5.044 7.864 5.22 4.88 6.24 3.51 4.57 5.55
Openness ‐0.372 ‐0.356 ‐0.218 ‐0.388 ‐0.279 ‐0.356 ‐2.69 ‐2.86 ‐2.02 ‐2.48 ‐1.72 ‐2.90
Government Size ‐6.112 ‐6.007 ‐4.345 ‐6.608 ‐6.328 ‐2.810 ‐5.10 ‐5.08 ‐4.12 ‐5.43 ‐4.85 ‐0.95
Social Policy 3.308 3.235 1.659 3.993 2.616 2.588 3.68 4.45 2.28 4.06 2.56 1.55
Statistics:
Over‐identifying 6.479 6.580 49.797 15.132 8.549 4.348 restrictions a (0.372) (0.361) (0.001) (0.010) (0.128) (0.500)
Specification test b 26.129 29.986 4.132 6.852 10.583 28.593 (0.000) (0.000) (0.388) (0.144) (0.032) (0.000)
Relevance of the instruments c
9.780 8.742 5.955 10.738 14.676 16.824
Observations 132 132 132 132 132 132
Notes: Robust t‐statistic in italics. All regressions include a constant, not reported.
The last column uses the baseline instrumental variables of Table 4, columns 5‐8: Natural Openness, Global Trade, Globalization (the product of Natural Openness and Global Trade), Legal Origin dummies, the products of Legal Origin dummies and Globalization.
The previous columns modify the instrument set as indicated in their headings. Statistics (P‐values in parentheses) computed by the ivreg2 Stata module (Baum et al., 2007b), definitions: (a) Test of over‐identifying restrictions, under the null: all the excluded instruments are exogenous. (b) Specification test, under the null: estimates from OLS and IV are both consistent. (c) Weak instruments Wald F test based on the Kleibergen‐Paap rk statistic; robust to non‐i.i.d. errors;
Baum et al. (2007) suggest that weak identification should not be considered a problem if this statistic is at least 10.