When collateral supply is accounted for epicardial stenosis does not increase microvascular...
7
When Collateral Supply is Accounted For Epicardial Stenosis Does Not Increase Microvascular Resistance Jamie Layland, MBChB, MRCP (UK), FRACP; Andrew I. MacIsaac, MBBS, MD, FRACP; Andrew T. Burns, MBBS, MD, FRACP; Jithendra B. Somaratne, MBChB, FRACP; George Leitl, MBBS, FRACP; Robert J. Whitbourn, MBBS, BSc(Hons), FRACP; Andrew M. Wilson, MBBS, PhD, FRACP Background—The relationship between epicardial stenosis and microvascular resistance remains controversial. Exploring the relationship is critical, as many tools used in interventional cardiology imply minimal and constant resistance. However, variable collateralization may impact well on these measures. We hypothesized that when collateral supply was accounted for, microvascular resistance would be independent of epicardial stenosis. Methods and Results—Forty patients with stable angina were studied before and following percutaneous intervention. A temperature and pressure sensing guide wire was used to derive microvascular resistance using the index of microcirculatory resistance (IMR), defined as the hyperemic distal pressure multiplied by the hyperemic mean transit time. Lesion severity was assessed using fractional flow reserve. For comparison, evaluation of an angiographically normal reference vessel from the same subject also was undertaken. Both simple IMR (sIMR) and IMR corrected for collateral flow (cIMR) were calculated. When collateral supply was not accounted for, there was a significant difference in IMR values between the culprit, the post PCI, and nonculprit values (culprit sIMR 26.682.06, nonculprit sIMR 18.371.89, P0.002; post percutaneous intervention sIMR 18.51.94 versus culprit sIMR 26.682.06, P0.0001). However, when collateral supply was accounted for there was no difference observed (cIMR 16.961.78 versus nonculprit sIMR 18.371.89, P0.52; post percutaneous intervention sIMR 18.51.94 versus cIMR 16.961.78, P0.42). Conclusions—When collateral supply is accounted for, epicardial stenosis does not increase microvascular resistance in patients with stable angina. (Circ Cardiovasc Interv. 2012;5:97-102.) Key Words: microcirculation epicardial stenosis FFR PCI T here is increasing interest in the importance of microcir- culation in patients with ischemic heart disease. Novel invasive techniques allow assessment of microcirculation at the time of coronary angiography. 1 Recently, the index of microvascular resistance (IMR) has been described and val- idated as a tool to assess the coronary microcirculation. 2 It involves the use of a temperature and pressure sensing guide wire (TPSG) that now is used routinely for the assessment of fractional flow reserve (FFR), and can be used for the assessment of microvascular resistance in patients with cor- onary artery disease using a validated algorithm. 3 Whether an epicardial stenosis has an impact on microvas- cular resistance remains controversial. Recent studies exam- ining the relationship using different methodologies and techniques to assess microvascular resistance have produced conflicting results. 4,5 Severe coronary stenosis may lead to a reduction in perfusion pressure, resulting in conformational changes within the resistance arteriolar vessels to maintain myocardial blood flow. 6 The pressure dependence of the distal arterioles is such that at very low perfusion pressures they possess a capacity to collapse, a fact that may explain the curvilinear pattern of the diastolic pressure flow relationship at lower perfusion pressures. 7 Evidence for this originates from animal models, whereby a severe stenosis led to a reduction in diameter of arterioles greater than 100 m. 8 This may account for the observed increase in microvascular resistance produced by an epicardial stenosis. However, other investigators have shown that even in the presence of epicardial vessel occlusion, microvessels remain open with continued antegrade flow, possibly a result of collateral flow. 9 It also has been demonstrated that collateral flow results in a shift of the pressure intercept of the pressure flow relationship above venous pressure, but only at lower perfusion pressures (40 mm Hg). 10 This would have the effect of maintaining antegrade flow at lower perfusion pressures. Thus collateral flow could minimize the impact of an epicardial stenosis on microvascular resistance by main- taining the patency of the resistance vessels. Received March 23, 2011; accepted November 15, 2011. From the Department of Cardiology, St Vincent’s Hospital, Fitzroy, Victoria, Melbourne, Australia (J.L., A.I.M., A.T.B., J.B.S., G.L., R.J.W., A.M.W.); University of Melbourne, Department of Medicine, St Vincent’s Hospital, Melbourne, Australia (J.L., A.I.M., A.T.B., R.J.W., A.M.W.). Correspondence to Dr Jamie Layland, Department of Cardiology, St Vincent’s Hospital, Fitzroy, Victoria, Melbourne, Australia. E-mail [email protected] © 2012 American Heart Association, Inc. Circ Cardiovasc Interv is available at http://circinterventions.ahajournals.org DOI: 10.1161/CIRCINTERVENTIONS.111.964718 97 by guest on May 18, 2016 http://circinterventions.ahajournals.org/ Downloaded from
Transcript of When collateral supply is accounted for epicardial stenosis does not increase microvascular...

When Collateral Supply is Accounted For EpicardialStenosis Does Not Increase Microvascular Resistance
Jamie Layland, MBChB, MRCP (UK), FRACP; Andrew I. MacIsaac, MBBS, MD, FRACP;Andrew T. Burns, MBBS, MD, FRACP; Jithendra B. Somaratne, MBChB, FRACP;George Leitl, MBBS, FRACP; Robert J. Whitbourn, MBBS, BSc(Hons), FRACP;
Andrew M. Wilson, MBBS, PhD, FRACP
Background—The relationship between epicardial stenosis and microvascular resistance remains controversial. Exploringthe relationship is critical, as many tools used in interventional cardiology imply minimal and constant resistance.However, variable collateralization may impact well on these measures. We hypothesized that when collateral supplywas accounted for, microvascular resistance would be independent of epicardial stenosis.
Methods and Results—Forty patients with stable angina were studied before and following percutaneous intervention. Atemperature and pressure sensing guide wire was used to derive microvascular resistance using the index ofmicrocirculatory resistance (IMR), defined as the hyperemic distal pressure multiplied by the hyperemic mean transittime. Lesion severity was assessed using fractional flow reserve. For comparison, evaluation of an angiographicallynormal reference vessel from the same subject also was undertaken. Both simple IMR (sIMR) and IMR corrected forcollateral flow (cIMR) were calculated. When collateral supply was not accounted for, there was a significant differencein IMR values between the culprit, the post PCI, and nonculprit values (culprit sIMR 26.68�2.06, nonculprit sIMR18.37�1.89, P�0.002; post percutaneous intervention sIMR 18.5�1.94 versus culprit sIMR 26.68�2.06, P�0.0001).However, when collateral supply was accounted for there was no difference observed (cIMR 16.96�1.78 versus nonculpritsIMR 18.37�1.89, P�0.52; post percutaneous intervention sIMR 18.5�1.94 versus cIMR 16.96�1.78, P�0.42).
Conclusions—When collateral supply is accounted for, epicardial stenosis does not increase microvascular resistance inpatients with stable angina. (Circ Cardiovasc Interv. 2012;5:97-102.)
Key Words: microcirculation � epicardial stenosis � FFR � PCI
There is increasing interest in the importance of microcir-culation in patients with ischemic heart disease. Novel
invasive techniques allow assessment of microcirculation atthe time of coronary angiography.1 Recently, the index ofmicrovascular resistance (IMR) has been described and val-idated as a tool to assess the coronary microcirculation.2 Itinvolves the use of a temperature and pressure sensing guidewire (TPSG) that now is used routinely for the assessment offractional flow reserve (FFR), and can be used for theassessment of microvascular resistance in patients with cor-onary artery disease using a validated algorithm.3
Whether an epicardial stenosis has an impact on microvas-cular resistance remains controversial. Recent studies exam-ining the relationship using different methodologies andtechniques to assess microvascular resistance have producedconflicting results.4,5 Severe coronary stenosis may lead to areduction in perfusion pressure, resulting in conformationalchanges within the resistance arteriolar vessels to maintainmyocardial blood flow.6 The pressure dependence of the
distal arterioles is such that at very low perfusion pressuresthey possess a capacity to collapse, a fact that may explain thecurvilinear pattern of the diastolic pressure flow relationshipat lower perfusion pressures.7 Evidence for this originatesfrom animal models, whereby a severe stenosis led to areduction in diameter of arterioles greater than 100 �m.8 Thismay account for the observed increase in microvascularresistance produced by an epicardial stenosis.
However, other investigators have shown that even in thepresence of epicardial vessel occlusion, microvessels remainopen with continued antegrade flow, possibly a result ofcollateral flow.9 It also has been demonstrated that collateralflow results in a shift of the pressure intercept of the pressureflow relationship above venous pressure, but only at lowerperfusion pressures (�40 mm Hg).10 This would have theeffect of maintaining antegrade flow at lower perfusionpressures. Thus collateral flow could minimize the impact ofan epicardial stenosis on microvascular resistance by main-taining the patency of the resistance vessels.
Received March 23, 2011; accepted November 15, 2011.From the Department of Cardiology, St Vincent’s Hospital, Fitzroy, Victoria, Melbourne, Australia (J.L., A.I.M., A.T.B., J.B.S., G.L., R.J.W.,
A.M.W.); University of Melbourne, Department of Medicine, St Vincent’s Hospital, Melbourne, Australia (J.L., A.I.M., A.T.B., R.J.W., A.M.W.).Correspondence to Dr Jamie Layland, Department of Cardiology, St Vincent’s Hospital, Fitzroy, Victoria, Melbourne, Australia. E-mail
[email protected]© 2012 American Heart Association, Inc.
Circ Cardiovasc Interv is available at http://circinterventions.ahajournals.org DOI: 10.1161/CIRCINTERVENTIONS.111.964718
97 by guest on May 18, 2016http://circinterventions.ahajournals.org/Downloaded from

Knowing the effect of a stenosis on microvascular resis-tance is critical, as many techniques used in interventionalcardiology assume minimal and constant resistance.7,11 Alsoof interest is whether microvascular resistance is homog-enously distributed across coronary beds within the samepatient.12 We hypothesized that microvascular resistancewould be independent of epicardial stenosis, and that collat-eral supply would reduce the downstream impact an epicar-dial stenosis has on the microvasculature.
WHAT IS KNOWN
● The relationship between epicardial stenosis andmicrovascular resistance remains uncertain.
WHAT THE STUDY ADDS
● When compared with an angiographically normalcontrol vessel, epicardial stenosis does not increasemicrovascular resistance.
● Collateral supply reduces the impact of an epicardialstenosis on microvascular resistance.
MethodsPatient SelectionThe study population consisted of patients undergoing electivepercutaneous coronary intervention for stable angina, with singlevessel disease angiographically and a positive noninvasive func-tional test. Patients were excluded if they had a recent myocardialinfarction (within 7 days) or any history of myocardial infarction inthe culprit/nonculprit territory, severe renal impairment (estimatedglomerular filtration rate �30 mls/min), left ventricular hypertrophyon ECG, acute inflammatory illness, significant peri-proceduralmyocardial injury, defined as a troponin I level �12�99th percentile(Troponin I 0.8 �g/L)13 or creatine phosphokinase myocardial band3 times the 99th percentile, chronic atrial fibrillation, left ventriculardysfunction (ejection fraction �35%), previous coronary arterybypass surgery, significant valvular heart disease, or if the lesioninvolved a major side branch (�2.0 mm). The Human ResearchEthics Committee at St Vincent’s Hospital Melbourne approved thestudy protocol.
For the procedure, all patients received an initial bolus of 5000 Uof intravenous heparin, with additional bolus dosing to maintain anactivated clotting time of 250 seconds, and were receiving aspirinand clopidogrel. A 6F coronary guiding catheter was used to engagethe selected coronary artery. A 5F sheath was placed within the rightfemoral vein for measurement of right atrial pressure and drugdelivery. All patients received 200 micrograms of intracoronarynitroglycerin in each study artery. A 0.014 coronary TPSG wascalibrated, and then equalized to the guiding catheter pressure, withthe distal sensor placed at the ostium of the coronary artery. The wirethen was passed beyond the stenosis into the distal third of the vessel.
Microvascular resistance was measured using the IMR, as previ-ously described2 in both the culprit vessel and the nonculprit vessel.Three milliliters of room temperature saline were injected intracoro-nary to produce 3 reproducible and consistent thermodilution curves.The average of the 3 values was taken as the mean baseline transittime (TmnBase), which has been shown to be inversely proportionalto coronary blood flow.14 Intravenous adenosine then was adminis-tered via the right femoral vein (140 �g/kg/min) to achieve maximalhyperemia. Once more, 3 mL of room temperature saline wasinjected into the study artery to achieve 3 consistent thermodilutioncurves and to derive the hyperemic transit time (TmnHyp).
IMR CalculationIMR was calculated in 2 ways, with and without the incorporation ofcoronary wedge pressure. Simplified IMR (sIMR) was defined as:2
sIMR�PdHyp�TmnHyp
where Pd is the hyperemic distal pressure and Tmn is the hyperemicmean transit time. In order to account for the effect of microvascularcollateral supply on microvascular resistance, a modified equationwas used, herewith referred to as the corrected IMR (cIMR):4
cIMR�Pa�Hyperemic Tmn (Pd�Pw)/(Pa�Pw)
where Pa was the mean hyperemic aortic pressure and Pw thecoronary wedge pressure, defined as the distal coronary pressureobtained during a 30 second balloon occlusion of the culprit vesseland representing recruitable collateral vessels.15 Both simplified andcorrected IMR were measured in the target vessel before andfollowing PCI. Only sIMR was calculated in the nonculprit artery.
Coronary flow reserve (CFR) was defined as the mean restingtransit time divided by the mean hyperemic transit time. FFR wasdefined as the mean distal coronary pressure divided by the meanaortic pressure during hyperemia. Care was taken to ensure that thedistal sensor was in the same position between measurements toavoid errors in transit time acquisition.
As a reference, the procedure was repeated in a major epicardialnonculprit vessel free of epicardial stenosis. Only simplified IMR,CFR, and FFR were calculated in the nonculprit vessel.
Study ProtocolIMR, CFR, and FFR were measured in an angiographically normalreference vessel and then in the culprit artery at baseline. Stenting ofthe culprit vessel then was performed and physiological measureswere repeated. The decision to intervene was at the operators’discretion.
Statistical AnalysisStatistical analysis was performed using a SPSS (SPSS Inc.) statis-tical software package. Normality of data were assessed with theKolmogorov-Smironov statistic. Continuous variables are summa-rized as mean�SEM. Physiological values obtained in the nonculpritvessel were compared with the culprit vessel pre PCI and post PCIusing paired T tests. P�0.05 was considered statistically significant.Strength of relationships was assessed using the Pearson correlationcoefficient.
Based on previous human data that demonstrated an absolutedifference of 14 U of IMR in patients with significant epicardialstenosis if collateral flow was not accounted for,4 we hypothesized amean difference of 14 U of IMR in vessels with and withoutcorrection for collateral flow. With an alpha error of 0.05 and apower of 90%, and a standard deviation of 14, we estimated that aminimal sample size of 23 subjects would be required to demonstratethe true effect of epicardial stenosis on microvascular resistance.With 40 patients in the study population we anticipated that a type IIerror would be less likely.
ResultsOne hundred forty-nine patients were potentially eligible forinclusion in the study. However, a significant number ofpatients were excluded following either coronary angiogra-phy or PCI. Figure 1 provides information on the reasons forpatient exclusion. The total study population consisted of 40patients with stable angina. Patient demographic and proce-dural data are shown in Tables 1 and 2. Physiological data areshown in Table 3, and the distribution of IMR acrossterritories with and without correction for collateral supply isshown in Figure 2. FFR and CFR were lower in the culpritartery compared with the nonculprit values (FFR culprit0.65�0.03 versus FFR nonculprit 0.93�0.05, P�0.0001,
98 Circ Cardiovasc Interv February 2012
by guest on May 18, 2016http://circinterventions.ahajournals.org/Downloaded from

CFR culprit 1.97�0.18 versus CFR nonculprit 2.81�0.18,P�0.01). There was a significant difference in sIMR valuesbetween the culprit territory and nonculprit vessels (culpritsIMR 26.68�2.06, nonculprit sIMR 18.37�1.89, P�0.002).
However, when collateral supply was accounted for bycorrecting for coronary wedge pressure, there was no differ-ence between the nonculprit microvascular resistance andculprit microvascular resistance (cIMR 16.96�1.78 versusnonculprit sIMR 18.37�1.89, P�0.52).
Mean TmnHyp was increased (coronary blood flow wasreduced) in the culprit territory compared with the nonculpritvessel (TmnHyp culprit 0.57�0.06 versus TmnHyp nonculprit0.24�0.02, P�0.001), and also when compared with meanpost PCI values (TmnHyp post PCI 0.25�0.02, P�0.001).Furthermore, baseline and hyperemic transit time were in-versely correlated with FFR (r��0.44, P�0.004, r��0.73,P�0.0001, respectively; Figures 3 and 4, respectively). How-ever, lesion severity as assessed by quantitative coronaryangiography did not correlate with baseline transit time, yetthere was a significant relationship between stenosis severityand hyperemic transit time (r�0.56, P�0.01). There also wasa significant negative correlation between FFR in the culpritterritory and coronary wedge pressure (r��0.44, P�0.005;Figure 5), and a positive correlation between TmnHyp in theculprit vessel and the coronary wedge pressure (r�0.46,P�0.003).
Changes in Coronary Physiology Following PCIFFR and CFR were higher following PCI when comparedwith pre PCI values (FFR pre PCI 0.65�0.03 versus FFR
post PCI 0.92�0.01, P�0.0001; pre PCI CFR 1.97�0.18versus post PCI CFR 2.41�0.17, P�0.007).
Microvascular resistance decreased following PCI (culpritsIMR 26.68�2.06 versus post PCI sIMR 18.51�1.94,P�0.0001). However, when collateral supply was accountedfor using the corrected IMR equation, no effect of PCI onmicrovascular resistance was observed (culprit cIMR16.96�1.78 versus post PCI sIMR 18.51�1.94, P�0.424).There was a similar relationship observed with post PCIcIMR (culprit cIMR 16.96�1.78 versus post PCI cIMR17.06�1.88, P�0.91).
There also was no difference between post PCI IMR andthe nonculprit IMR (nonculprit sIMR 18.37�1.89 versus
Table 1. Baseline Patient Characteristics
Patient Characteristic Variable
Gender Male/female 27/13
Age (y) 61.2�1.8
Symptom duration (days) 38 (Q1, Q3/6, 367)
Culprit vessel LAD 17 (42.5),
LCx 14 (35),
RCA 9 (22.5)
Nonculprit vessel LAD 17 (42.5),
LCx 16 (40),
RCA 7 (17.5)
HMG co-enzyme A inhibitor 33 (82.5)
ACE inhibitor 17 (43.6)
Beta blocker 28 (71.8)
Smoker 21 (51.2)
Diabetes 14 (34.1)
Hypertension 30 (73.2)
Hypercholesterolemia 28 (68.3)
LV ejection fraction (%) 63�2.1
Continuous variables expressed as mean�SEM. Discrete variables ex-pressed as number and percentage in brackets. Non-normally distributedvariables expressed as median plus QI, Q3.
Drug treatment mentioned refers to percentage of patients on specificmedication at the time of the procedure.
LAD indicates left anterior descending artery; LCx, left circumflex artery;RCA, right coronary artery; HMG, HMG : 3-hydroxy-3-methylglutaryl-coenzymeA; ACE, angiotensin converting enzyme; LV, left ventricle.
Table 2. Angiographic Data
Procedural Data Value
AHA lesion class A (25), B (75), C (0)
DES/BMS 35/5 (87.5/12.5)
QCA pre PCI (%) 72.13�2.7
QCA post PCI (%) 6.4�1.3
Stent size (diameter mm) 3.01�0.07
Maximum pressure (atm) 18.2�0.58
No. of inflations 4.5�0.35
Continuous variables expressed as mean�SEM. Discrete variables ex-pressed as No. and percentage in brackets.
AHA indicates American Heart Association; DES, drug eluting stent; BMSbare metal stent; QCA, quantitative coronary angiography; atm, atmospheres.
American Heart Association lesion class A (low risk, �85% success rate), B(moderate risk, 60% to 85% success rate).
Figure 1. Study sample and reasons for patient exclusion ifeligible.
Layland et al Epicardial Stenosis and Microvascular Resistance 99
by guest on May 18, 2016http://circinterventions.ahajournals.org/Downloaded from
18.51�1.94, P�0.95). Coronary blood flow indices im-proved following PCI (pre PCI Culprit TmnBase 0.92�0.09versus post PCI TmnBase 0.57�0.06, P�0.0001; pre PCITmnHyp culprit 0.57�0.06 versus post PCI TmnHyp
0.25�0.03, P�0.0001), but there was no difference betweenindices of coronary blood flow between post PCI values inthe culprit vessel and the nonculprit territory (nonculpritTmnBase 0.64�0.07 versus post PCI TmnBase 0.57�0.06,P�0.32; nonculprit TmnHyp 0.24�0.02 versus post PCITmnHyp 0.25�0.03, P�0.7).
DiscussionOur results suggest that, when the effect of microvascularcollaterals is accounted for, epicardial stenosis does not affectmicrovascular resistance.
The effect of collateral circulation pre PCI is accountedfor by using the corrected IMR equation that incorporatescoronary wedge pressure. In accordance with prior studies,
improvements in antegrade flow following PCI meant thatthe contribution of microvascular collaterals was assumedto be negligible, and thus correction for collaterals was notperformed.16 However, for completeness of data we haveprovided the corrected IMR as well as the simplified IMRpost PCI.
Secondly, as stenosis severity increased, both resting andhyperemic blood flow was reduced. However, there was anincreasing contribution of collaterals, evident from an in-crease in coronary wedge pressure, suggesting a possiblecompensatory mechanism to maintain myocardial blood flowand maintain patency of the microvessels.
The concept of increasing stenosis severity leading toincreased microvascular resistance is controversial.4,5 Somehave shown that as the severity of epicardial stenosis in-creases, microvascular resistance increases.17,18 Using com-bined Doppler and pressure derived measures, Chamuleau etal18 demonstrated that minimal microvascular resistance in-creased distal to a significant epicardial stenosis when com-pared with a normal vessel without stenosis in the same
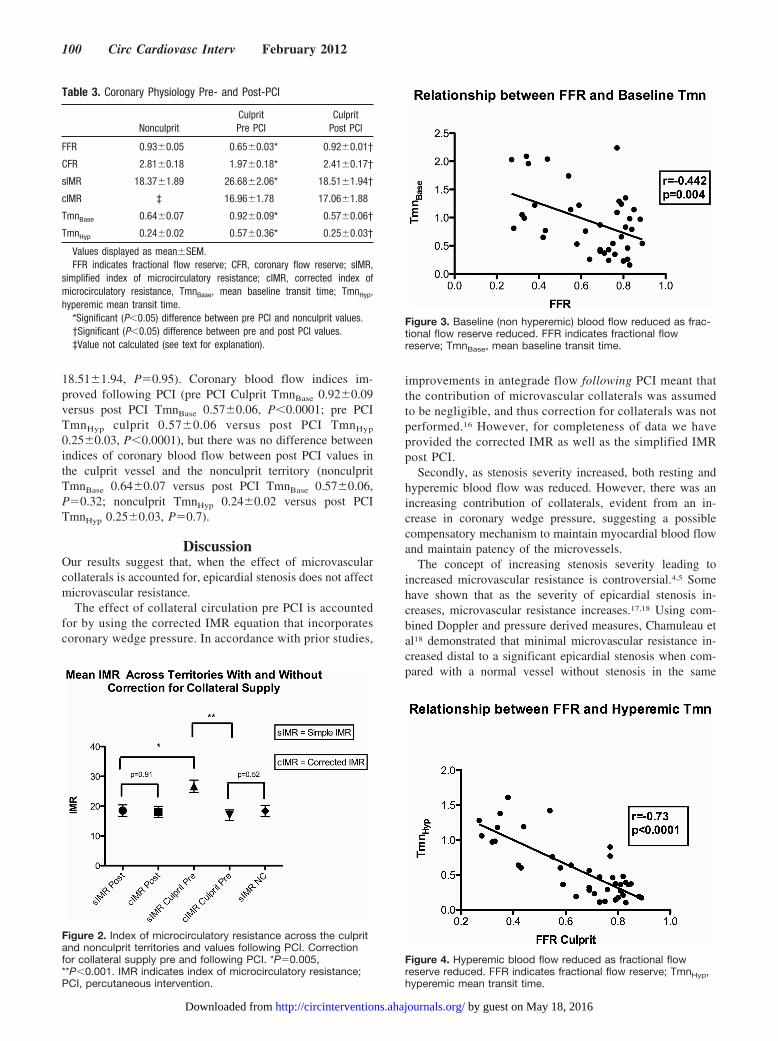
Figure 2. Index of microcirculatory resistance across the culpritand nonculprit territories and values following PCI. Correctionfor collateral supply pre and following PCI. *P�0.005,**P�0.001. IMR indicates index of microcirculatory resistance;PCI, percutaneous intervention.
Table 3. Coronary Physiology Pre- and Post-PCI
NonculpritCulpritPre PCI
CulpritPost PCI
FFR 0.93�0.05 0.65�0.03* 0.92�0.01†
CFR 2.81�0.18 1.97�0.18* 2.41�0.17†
sIMR 18.37�1.89 26.68�2.06* 18.51�1.94†
cIMR ‡ 16.96�1.78 17.06�1.88
TmnBase 0.64�0.07 0.92�0.09* 0.57�0.06†
TmnHyp 0.24�0.02 0.57�0.36* 0.25�0.03†
Values displayed as mean�SEM.FFR indicates fractional flow reserve; CFR, coronary flow reserve; sIMR,
simplified index of microcirculatory resistance; cIMR, corrected index ofmicrocirculatory resistance, TmnBase, mean baseline transit time; TmnHyp,hyperemic mean transit time.
*Significant (P�0.05) difference between pre PCI and nonculprit values.†Significant (P�0.05) difference between pre and post PCI values.‡Value not calculated (see text for explanation).
Figure 3. Baseline (non hyperemic) blood flow reduced as frac-tional flow reserve reduced. FFR indicates fractional flowreserve; TmnBase, mean baseline transit time.
Figure 4. Hyperemic blood flow reduced as fractional flowreserve reduced. FFR indicates fractional flow reserve; TmnHyp,hyperemic mean transit time.
100 Circ Cardiovasc Interv February 2012
by guest on May 18, 2016http://circinterventions.ahajournals.org/Downloaded from

patient. Verhoeff5 and colleagues drew similar conclusions,showing that microvascular resistance increased secondary toa coronary stenosis in 23 patients with stable angina. Further-more, following PCI, resistance fell below the level of anangiographically normal reference vessel also studied. How-ever, despite the measurement of collateral flow, this was notincorporated into the calculation of microvascular resistance,and therefore this may have been overestimated in patientswith significant epicardial stenoses. Thus, by using a TPSGfor IMR analysis and incorporating the effect of collateralsinto the calculation of microvascular resistance, we haveexpanded significantly on these findings.
Prior animal models using IMR as a technique to investi-gate the impact of a stenosis on minimal achievable resistancedemonstrated that there was no increase in microvascularresistance secondary to an epicardial stenosis.19 However,previous IMR studies in humans have measured microcircu-latory resistance using balloon inflation within a stent tomimic a stenosis post PCI rather than actual de novostenoses.4 Furthermore, the impact of peri-procedural infarc-tion on IMR has not been documented well, and the incidenceof cardiac biomarker elevation was not reported in previousIMR studies. Significant myonecrosis is likely to confoundevaluation of microvascular resistance by increasing distalpressure and limiting capillary recruitment. Although notstatistically significant, Cuisset et al16 demonstrated a higherIMR following PCI, which was associated with highertroponin levels. In our population, significant myonecrosiswas incorporated into our exclusion criteria to minimize itsconfounding effect. Thus, we were able to use the post PCIIMR value reliably as a point of reference. Our findings may,therefore, be more representative of coronary physiology thanartificially induced stenoses post PCI. We also have extendedthis concept to incorporate assessment of a nonculprit, angio-graphically normal vessel as a further point of reference.
In our population, there was no significant differencebetween microvascular resistance pre PCI compared withpost PCI values. There also was no difference between thenonculprit and the post PCI microvascular resistance valueswhen we accounted for the effect of collaterals. This suggeststhat microvascular resistance is not related to epicardialstenosis severity because there is no difference between theculprit and the nonculprit, or the culprit and post PCI values.
Prior animal studies have demonstrated that resting coro-nary blood flow only begins to reduce once a coronarystenosis reaches 85%.20 In contrast, hyperemic blood flowreduced when an epicardial stenosis was greater than 50%. Ina group of 35 humans with single vessel coronary arterydisease using positron emission tomography, Uren and col-leagues21 suggested that epicardial stenosis had no influenceon resting coronary blood flow, but hyperemic blood flowbegan to reduce once a stenosis reached 40%. The conflictingresults can be explained by the inherent differences betweenanimals and humans, but also by the fact that the stenosesincluded in the human study were less severe. A further pointis that collateral flow was not accounted for in the animalstudy, so that true myocardial flow may have been underes-timated. Our results are in accordance with previous humanstudies suggesting that basal flow is not significantly influ-enced by epicardial stenosis severity as assessed angiographi-cally, but hyperemic blood flow progressively reduces as thestenosis severity increases. However, we did find a signifi-cant negative correlation between FFR and basal coronaryblood flow suggesting that, contrary to our angiographicestimation of severity, FFR estimation was a better predictorfor the hemodynamic consequence of a stenosis comparedwith angiographic assessment. Stenosis is only 1 determinantof the hemodynamic significance of a lesion,22 and the poorcorrelation between angiographic severity and FFR has beenconfirmed with recent clinical trials.3,23
When using the nonculprit vessel as a control, we assumehomogeneity of microvascular resistance within the myocar-dium, an assumption that has underpinned other studies.5,12,18
Our results suggest that microvascular resistance is homog-enously distributed between different vascular territorieswithin the same patient. However, as we are measuringthermodilution derived blood flow rather than absolute myo-cardial blood flow in the calculation of microvascular resis-tance, we cannot be certain of this relationship. Furthermore,not all epicardial vessels were assessed in each patient.
LimitationsThe complexity of our study was such that only a smallnumber of patients were studied. However, it is one of thelargest cohorts of patients studied in this field, with sufficientpower to explore the underlying hypotheses. A small propor-tion of our patients had a postprocedural troponin elevation,and this may have had an effect on the distal pressure andthus, IMR. Troponin elevation following PCI is common,with studies showing an incidence of up to 30% in electivePCI.24 However, we excluded any patient with a troponin risegreater than 12 times the upper limit of normal, as elevationsabove this level have been shown to correlate with areas ofinfarction on cardiac magnetic resonance imaging.13 In fact,no patient had a troponin level greater than 5 times the upperlimit of normal. Lower troponin levels are not associated withmyocardial injury on magnetic resonance imaging, and thustheir effect on IMR is likely to be minimal.
As the decision to perform PCI was at the discretion of theoperators, some patients with an FFR �0.8 underwent inter-vention. This may have tended to underestimate the impactthat an epicardial stenosis has on microvascular resistance in
Figure 5. Increasing coronary wedge pressure with increasingseverity of stenosis. FFR indicates fractional flow reserve.
Layland et al Epicardial Stenosis and Microvascular Resistance 101
by guest on May 18, 2016http://circinterventions.ahajournals.org/Downloaded from

the overall cohort. However, by including such patients, abroader range of actual stenoses was assessed so that moreinformed conclusions about the effects of epicardial stenosison microvascular resistance could be made.
Adjustment for multiple comparisons was not undertaken,however, and where statistically significant, the differences inmeasurements were substantial, making a Type I errorunlikely.
ConclusionIn conclusion, when collateral flow is accounted for we haveshown that epicardial stenosis does not increase microvascu-lar resistance.
DisclosuresNone.
References1. Knaapen P, Camici PG, Marques KM, Nijveldt R, Bax JJ, Westerhof N,
Gotte MJ, Jerosch-Herold M, Schelbert HR, Lammertsma AA, vanRossum AC. Coronary microvascular resistance: methods for its quanti-fication in humans. Basic Res Cardiol. 2009;104:485–498.
2. Fearon WF, Balsam LB, Farouque HM, Caffarelli AD, Robbins RC,Fitzgerald PJ, Yock PG, Yeung AC. Novel index for invasively assessingthe coronary microcirculation. Circulation. 2003;107:3129–3132.
3. Tonino PA, De Bruyne B, Pijls NH, Siebert U, Ikeno F, van’t Veer M,Klauss V, Manoharan G, Engstrom T, Oldroyd KG, Ver Lee PN, Mac-Carthy PA, Fearon WF. Fractional flow reserve versus angiography forguiding percutaneous coronary intervention. N Engl J Med. 2009;360:213–224.
4. Aarnoudse W, Fearon WF, Manoharan G, Geven M, van de Vosse F,Rutten M, De Bruyne B, Pijls NH. Epicardial stenosis severity does notaffect minimal microcirculatory resistance. Circulation. 2004;110:2137–2142.
5. Verhoeff BJ, Siebes M, Meuwissen M, Atasever B, Voskuil M, de WinterRJ, Koch KT, Tijssen JG, Spaan JA, Piek JJ. Influence of percutaneouscoronary intervention on coronary microvascular resistance index.Circulation. 2005;111:76–82.
6. Chilian WM, Layne SM. Coronary microvascular responses to reductionsin perfusion pressure. Evidence for persistent arteriolar vasomotor toneduring coronary hypoperfusion. Circ Res. 1990;66:1227–1238.
7. Spaan JA, Piek JJ, Hoffman JI, Siebes M. Physiological basis of clinicallyused coronary hemodynamic indices. Circulation. 2006;113(3):446–455.
8. Kanatsuka H, Lamping KG, Eastham CL, Marcus ML. Heterogeneouschanges in epimyocardial microvascular size during graded coronarystenosis. Evidence of the microvascular site for autoregulation. Circ Res.1990;66:389–396.
9. Marcus ML, Chilian WM, Kanatsuka H, Dellsperger KC, Eastham CL,Lamping KG. Understanding the coronary circulation through studies atthe microvascular level. Circulation. 1990;82:1–7.
10. Messina LM, Hanley FL, Uhlig PN, Baer RW, Grattan MT, Hoffman JI.Effects of pressure gradients between branches of the left coronary arteryon the pressure axis intercept and the shape of steady state circumflexpressure-flow relations in dogs. Circ Res. 1985;56:11–19.
11. Pijls NH, van Son JA, Kirkeeide RL, De Bruyne B, Gould KL. Experi-mental basis of determining maximum coronary, myocardial, and col-lateral blood flow by pressure measurements for assessing functionalstenosis severity before and after percutaneous transluminal coronaryangioplasty. Circulation. 1993;87:1354–1367.
12. Melikian N, Vercauteren S, Fearon WF, Cuisset T, MacCarthy PA,Davidavicius G, Aarnoudse W, Bartunek J, Vanderheyden M, Wyffels E,Wijns W, Heyndrickx GR, Pijls NH, de Bruyne B. Quantitativeassessment of coronary microvascular function in patients with andwithout epicardial atherosclerosis. EuroIntervention. 2010;5:939–945.
13. Lim CC, van Gaal WJ, Testa L, Cuculi F, Arnold JR, Karamitsos T,Francis JM, Petersen SE, Digby JE, Westaby S, Antoniades C, KharbandaRK, Burrell LM, Neubauer S, Banning AP. With the “universal defi-nition,” measurement of creatine kinase-myocardial band rather thantroponin allows more accurate diagnosis of periprocedural necrosis andinfarction after coronary intervention. J Am Coll Cardiol. 2011;57:653–661.
14. De Bruyne B, Pijls NH, Smith L, Wievegg M, Heyndrickx GR. Coronarythermodilution to assess flow reserve: experimental validation.Circulation. 2001;104:2003–2006.
15. Meier B, Luethy P, Finci L, Steffenino GD, Rutishauser W. Coronarywedge pressure in relation to spontaneously visible and recruitable col-laterals. Circulation. 1987;75:906–913.
16. Cuisset T, Hamilos M, Melikian N, Wyffels E, Sarma J, Sarno G, BarbatoE, Bartunek J, Wijns W, De Bruyne B. Direct stenting for stable anginapectoris is associated with reduced periprocedural microcirculatory injurycompared with stenting after pre-dilation. J Am Coll Cardiol. 2008;51:1060–1065.
17. Sambuceti G, Marzilli M, Fedele S, Marini C, L’Abbate A. Paradoxicalincrease in microvascular resistance during tachycardia downstream froma severe stenosis in patients with coronary artery disease: reversal byangioplasty. Circulation. 2001;103:2352–2360.
18. Chamuleau SA, Siebes M, Meuwissen M, Koch KT, Spaan JA, Piek JJ.Association between coronary lesion severity and distal microvascularresistance in patients with coronary artery disease. Am J Physiol HeartCirc Physiol. 2003;285:H2194–H2200.
19. Fearon WF, Aarnoudse W, Pijls NH, De Bruyne B, Balsam LB, CookeDT, Robbins RC, Fitzgerald PJ, Yeung AC, Yock PG. Microvascularresistance is not influenced by epicardial coronary artery stenosis sever-ity: experimental validation. Circulation. 2004;109:2269–2272.
20. Gould KL, Lipscomb K, Hamilton GW. Physiologic basis for assessingcritical coronary stenosis. Instantaneous flow response and regional dis-tribution during coronary hyperemia as measures of coronary flowreserve. Am J Cardiol. 1974;33:87–94.
21. Uren NG, Melin JA, De Bruyne B, Wijns W, Baudhuin T, Camici PG.Relation between myocardial blood flow and the severity of coronary-artery stenosis. N Engl J Med. 1994;330:1782–1788.
22. Layland J, Wilson A, Whitbourn R, Macisaac A. Letter by Layland et alregarding article, “Validation of intravascular ultrasound-derived param-eters with fractional flow reserve for assessment of coronary stenosisseverity.” Circ Cardiovasc Interv. 2011;4:e16.
23. Tonino PA, Fearon WF, De Bruyne B, Oldroyd KG, Leesar MA, Ver LeePN, Maccarthy PA, Van’t Veer M, Pijls NH. Angiographic versus func-tional severity of coronary artery stenoses in the FAME study fractionalflow reserve versus angiography in multivessel evaluation. J Am CollCardiol. 2010;55:2816–2821.
24. Testa L, Van Gaal WJ, Biondi Zoccai GG, Agostoni P, Latini RA,Bedogni F, Porto I, Banning AP. Myocardial infarction after percutaneouscoronary intervention: a meta-analysis of troponin elevation applying thenew universal definition. QJM. 2009;102:369–378.
102 Circ Cardiovasc Interv February 2012
by guest on May 18, 2016http://circinterventions.ahajournals.org/Downloaded from
Robert J. Whitbourn and Andrew M. WilsonJamie Layland, Andrew I. MacIsaac, Andrew T. Burns, Jithendra B. Somaratne, George Leitl,
Microvascular ResistanceWhen Collateral Supply is Accounted For Epicardial Stenosis Does Not Increase
Print ISSN: 1941-7640. Online ISSN: 1941-7632 Copyright © 2012 American Heart Association, Inc. All rights reserved.
Avenue, Dallas, TX 75231is published by the American Heart Association, 7272 GreenvilleCirculation: Cardiovascular Interventions
doi: 10.1161/CIRCINTERVENTIONS.111.9647182012;5:97-102; originally published online February 7, 2012;Circ Cardiovasc Interv.
http://circinterventions.ahajournals.org/content/5/1/97World Wide Web at:
The online version of this article, along with updated information and services, is located on the
http://circinterventions.ahajournals.org//subscriptions/
is online at: Circulation: Cardiovascular Interventions Information about subscribing to Subscriptions:
http://www.lww.com/reprints Information about reprints can be found online at: Reprints:
document. Answer
Permissions and Rights Question andunder Services. Further information about this process is available in thepermission is being requested is located, click Request Permissions in the middle column of the Web pageClearance Center, not the Editorial Office. Once the online version of the published article for which
can be obtained via RightsLink, a service of the CopyrightCirculation: Cardiovascular Interventionsin Requests for permissions to reproduce figures, tables, or portions of articles originally publishedPermissions:
by guest on May 18, 2016http://circinterventions.ahajournals.org/Downloaded from