WhatsUp Gold 2018 SP3 User Guide - Documentation
957
© 2018 Ipswitch, Inc, All Rights Reserved. (www.ipswitch.com) Help Guide
-
Upload
khangminh22 -
Category
Documents
-
view
1 -
download
0
Transcript of WhatsUp Gold 2018 SP3 User Guide - Documentation

© 2018 Ipswitch, Inc, All Rights Reserved. (www.ipswitch.com)
Help Guide

i
Contents
Welcome
New features in this version of WhatsUp Gold 15
Evaluation Quick Start 16
Navigating the WhatsUp Gold User Interface
Working with the Discovered Network View..................................................................... 19 Working with the My Network Map .................................................................................. 20
Customizing the My Network Map .......................................................................... 22 Map filtering ........................................................................................................... 23
Working with the Device List ........................................................................................... 24 Searching WhatsUp Gold ................................................................................................ 25 Addressing Web Alarms .................................................................................................. 26 Using the Top Menu Navigation Admin Features ............................................................ 26
Customizing web alarm behavior ........................................................................... 27 Getting Help and More Information .................................................................................. 27
Getting Started 28
Running Discovery
Getting the Most from Your Scan .................................................................................... 32 Discovering Virtual Devices .................................................................................... 39 Discovering Storage Devices ................................................................................. 45
Discovering Cloud-based Wireless LAN Controllers ........................................................ 47 Initiating a Discovery Scan .............................................................................................. 48
Hosts File Format ................................................................................................... 52 Adding Discovered Devices ............................................................................................. 52 Using Saved Discovery Scan Settings............................................................................. 53 Handling Shared Addresses ............................................................................................ 54
Typical Uses of Shared Addressing ........................................................................ 59 Device Merge Reason Categories .......................................................................... 60
Managing Detection Categories (Device Roles) .............................................................. 61 Roles/Subroles Library ........................................................................................... 62 Create a Custom Device Role ................................................................................ 77 Fit Default Roles with Custom Monitors .................................................................. 83

ii
Device Management 85
Device Properties ............................................................................................................ 86 About Device Roles ................................................................................................ 89 About Device Dependencies .................................................................................. 90 Device Merge Decision Information ........................................................................ 95 Attributes .............................................................................................................. 104 Schedule Recurring Maintenance Times .............................................................. 104 Monitor Types ...................................................................................................... 105
Device Status ................................................................................................................ 105 Managing and Assigning Monitors ................................................................................. 106
Critical Active Monitors ......................................................................................... 110 Active Monitors..................................................................................................... 111
Example Content URLs ................................................................................................. 125 Passive Monitors .................................................................................................. 150 Performance Monitors .......................................................................................... 153 Rules Expression Editor ....................................................................................... 177 Advanced settings: performance monitor collection .............................................. 177 Configure Memory Threshold ............................................................................... 178 Configure Disk Performance threshold ................................................................. 178 Adding Custom Thresholds .................................................................................. 178 Ping Advanced Settings ....................................................................................... 178 Active Monitor Advanced Properties ..................................................................... 178 Advanced Settings ............................................................................................... 179
Device Management Actions ......................................................................................... 179 Using Tools in WhatsUp Gold .............................................................................. 181 Connecting directly to a monitored device through the WhatsUp Gold interface ... 182
Poller Configuration ....................................................................................................... 185 Using Scalability Pollers with WhatsUp Gold ........................................................ 186 Installing the Scalability Poller Application on a Remote Machine ........................ 187 Configuring Scalability Pollers in WhatsUp Gold .................................................. 189 Using Scalability Pollers with Failover and Distributed .......................................... 190
Built-in Action Types ...................................................................................................... 190 Active Script Action .............................................................................................. 191 Beeper Action ...................................................................................................... 192 E-mail Action ........................................................................................................ 194 Post To IFTTT Action ........................................................................................... 195 Log to Text File Action .......................................................................................... 197 Pager Action ........................................................................................................ 198

iii
Post To Slack Action ............................................................................................ 199 PowerShell Action ................................................................................................ 200 Program Action .................................................................................................... 201 Service Restart Action .......................................................................................... 202 SMS Action .......................................................................................................... 202 SMS Direct action ................................................................................................ 203 SNMP Set Action ................................................................................................. 204 Adding and editing a Sound Action....................................................................... 205 SSH Action ........................................................................................................... 206 Syslog action ........................................................................................................ 207 Text to Speech Action .......................................................................................... 207 VMware Action ..................................................................................................... 208 Web Alarm Action ................................................................................................ 209 Configuration Management Action ....................................................................... 210 Windows Event Log Action ................................................................................... 210
Selecting an Action Type ............................................................................................... 211 Select a State Change .................................................................................................. 212 Select Action and State ................................................................................................. 212 Guidelines for Creating Action Policies .......................................................................... 213 Working with credentials ............................................................................................... 215
Available Credentials............................................................................................ 217 SNMP v1 .............................................................................................................. 219 SNMP v2 .............................................................................................................. 220 SNMP v3 .............................................................................................................. 220 Windows .............................................................................................................. 221 ADO ..................................................................................................................... 222 Telnet ................................................................................................................... 222 SSH ..................................................................................................................... 223 VMware ................................................................................................................ 223 JMX ...................................................................................................................... 223 SMI-S Credential .................................................................................................. 224 AWS Credential .................................................................................................... 227 Azure Credential .................................................................................................. 228 Meraki Cloud Credential ....................................................................................... 240 Helpful Hints for credentials.................................................................................. 240 Creating credentials ............................................................................................. 241 Assigning credentials ........................................................................................... 241
Device groups ............................................................................................................... 242 Editing Device Group Properties .......................................................................... 243

iv
Dynamic Groups .................................................................................................. 244
Network Environment Monitoring 247
Viewing Devices on the Map ......................................................................................... 247 Viewing Information Cards ................................................................................... 250 Applying Thresholds, Alerts, Notification Schedules, and Action Policies ............. 252 Viewing Wireless Information on the Map ............................................................. 262 Viewing Virtual Information on the Map ................................................................ 263 Viewing Application Information on the Map ......................................................... 264 Manually Connecting Devices on the Map ............................................................ 265
Monitoring Wireless ....................................................................................................... 266 Monitoring Virtual Machines and Infrastructure .............................................................. 267 Monitoring Cloud-Managed Devices .............................................................................. 272 Monitoring VoIP IP SLA ................................................................................................. 274
Application Monitoring with WhatsUp Gold 278
Understanding WhatsUp Gold Application Monitoring Terminology ............................... 282 Preparing to Monitor Applications .................................................................................. 283 Discovering Applications ............................................................................................... 284 Working with Application Profiles ................................................................................... 285 Working with Application Instances ............................................................................... 286 Working with Components and Component Groups ...................................................... 287
CPU Utilization ..................................................................................................... 289 Database Query ................................................................................................... 289 Disk Utilization...................................................................................................... 289 File Content .......................................................................................................... 290 HTTP Content Check ........................................................................................... 290 Interface Statistics ................................................................................................ 290 JMX Performance Check ..................................................................................... 290 Memory Utilization ................................................................................................ 290 Network Port Check ............................................................................................. 290 Process Check ..................................................................................................... 291 Scripting (PowerShell) .......................................................................................... 291 Scripting (End User Monitor) ................................................................................ 291 Service Check ...................................................................................................... 299 SNMP .................................................................................................................. 299 SSH ..................................................................................................................... 300 WMI ..................................................................................................................... 300

v
Windows Performance Counter ............................................................................ 300 Working with Discrete Applications ................................................................................ 300 About Action Policies, Actions, and Blackout Policies and WhatsUp Gold Application Monitoring ..................................................................................................................... 301
Working with Application Monitoring Action Policies ............................................. 302 Working with Application Monitoring Actions ........................................................ 304 Working with Application Monitoring Blackout Policies ......................................... 305
Working with Application Attributes ............................................................................... 305
Configuration Management 307
CM System Overview .................................................................................................... 308 Using Task Scripts ........................................................................................................ 309
Using the Configuration Management Task Script Library .................................... 309 Creating and Editing a Task Script ....................................................................... 310 Configuring Custom Task Scripts ......................................................................... 310 Importing and Exporting Task Scripts ................................................................... 311 Debugging Task Scripts ....................................................................................... 311 Run Now .............................................................................................................. 313
Using Tasks .................................................................................................................. 314 Task Library ......................................................................................................... 314 Configuring Password Tasks ................................................................................ 315 Configuring Schedulable Tasks ............................................................................ 315 Assigning a Task to a Device ............................................................................... 317 Running a Task Immediately ................................................................................ 318
Using Device Properties ................................................................................................ 318 Viewing Configuration Management in Device Properties .................................... 318 Associating Tasks with Devices ........................................................................... 319 Viewing Archived Configuration Files ................................................................... 319 Comparing Archived Configuration Files .............................................................. 319 Modifying Archived Configuration Files ................................................................ 320 Importing Archived Configuration Files ................................................................. 320 Exporting Archived Configuration Files ................................................................. 320 Removing Tasks from Devices ............................................................................. 320 Restoring Archived Configurations ....................................................................... 321 Deleting Archived Configuration Files ................................................................... 321
Using Policies ................................................................................................................ 321 Configuration Management Policy Library ............................................................ 321 Configuring a Configuration Management policy .................................................. 322 Auditing a policy ................................................................................................... 323

vi
Viewing Archive Policy Audit Results ................................................................... 323 Using Configuration Management Templates ................................................................ 324
Capture and Add Templates ................................................................................. 325 Generating and Applying Templates .................................................................... 326 Importing and Exporting Templates ...................................................................... 326 Using the Template Library .................................................................................. 327
Leveraging and Customizing System Scripts................................................................. 328 System Script Library ........................................................................................... 329 Configuring System Scripts .................................................................................. 329 Importing and Exporting System Scripts ............................................................... 331
Managing CLI and Remote Shell Settings ..................................................................... 332 CLI Settings Library .............................................................................................. 332 CLI Settings Profile .............................................................................................. 333 Configuring CLI settings ....................................................................................... 334 Importing and exporting CLI settings .................................................................... 335 Remote Client Settings ......................................................................................... 336
Archive Search .............................................................................................................. 337 Understanding Configuration Archives ................................................................. 337 Performing an Archive Search .............................................................................. 338 Configuration Archive Search Result .................................................................... 339 Applying Regular Expressions .............................................................................. 339
Using the Configuration Management VLAN Manager .................................................. 341 Configuring VLAN trunks ...................................................................................... 343 Writing Custom VLAN Scripts ............................................................................... 343
Setting Log Expiration ................................................................................................... 345
Network Traffic Analysis 346
NTA System Overview .................................................................................................. 347 NTA System Requirements ........................................................................................... 349 NTA Quick Start ............................................................................................................ 350 View Current Flow Export Data Advertised on Your Network ........................................ 350 Choosing NTA Sources ................................................................................................. 352
SNMP Timeout and Retry .................................................................................... 354 Credentials Used for Network Traffic Analysis ...................................................... 354
Configuring and Enabling Collection on Sources ........................................................... 354 Enable and View Flow Collection Status .............................................................. 355 Browse, Configure, and Enable Potential Netflow Sources .................................. 362 Configure Flow Export on Source Devices ........................................................... 365
Aggregating Sources ..................................................................................................... 372

vii
Grouping Traffic ............................................................................................................ 373 Classifying Traffic by Port Number ................................................................................ 374 Adding Custom Labels for Type of Service (ToS) IDs .................................................... 375 Listener Port, Collection, and Retention Settings ........................................................... 376 Collector Database Maintenance ................................................................................... 378 Reduce and Analyze Traffic with Advanced Filtering ..................................................... 381
Applying System Tasks 383
Using WhatsUp Gold System Tasks .............................................................................. 384 Changing Log Persistence Settings ............................................................................... 384
WhatsUp Gold Settings 386
System Services ........................................................................................................... 387 System Settings ............................................................................................................ 387
Manage SNMP MIBs ............................................................................................ 388 About WhatsUp Gold Distributed Edition .............................................................. 391
Admin Console 391
Web Interface 392
About WhatsUp Gold Failover Edition .................................................................. 393 Scheduling Activities ..................................................................................................... 395 Configuring Actions and Alerts ...................................................................................... 395 Accessing WhatsUp Gold Libraries ............................................................................... 395 Scheduling Activities ..................................................................................................... 396 Configuring Application Monitoring-specific Settings ..................................................... 396 Configuration Management Settings ............................................................................. 397 Network Traffic Analysis Settings .................................................................................. 397 Virtual Settings .............................................................................................................. 397 Wireless Settings .......................................................................................................... 397
Global Wireless Settings ...................................................................................... 398 Wireless Client Groups ......................................................................................... 398 Wireless Excluded Rogues .................................................................................. 399
Using the WhatsUp Gold Console Application 400
Using Device Types ...................................................................................................... 401 About Device Properties - General ................................................................................ 402

viii
About Device Properties - Menus .................................................................................. 402 Operating WhatsUp Gold in FIPS 140-2 Mode .............................................................. 403 Using WhatsUp Gold Database Utilities ........................................................................ 404 Configuring File Transfer Settings ................................................................................. 405 Importing Trap Definitions ............................................................................................. 405
Administering Users and User Groups 406
About User Rights ......................................................................................................... 407 About User Groups........................................................................................................ 407 Password Expiration and Retry Policies ........................................................................ 408
Dashboarding, Reporting, and Logging 410
Create NOC Views and Custom Dashboards ................................................................ 412 Home Dashboard ................................................................................................. 415 Overview .............................................................................................................. 416 Device Status ....................................................................................................... 417 Alert Center .......................................................................................................... 419 Application Monitoring .......................................................................................... 420 Network Traffic Analysis Dashboards ................................................................... 422 Predictive Trending Report ................................................................................... 423 Virtual Monitoring ................................................................................................. 424 Traffic Overview ................................................................................................... 425 Wireless Monitoring .............................................................................................. 425 Unclassified Traffic ............................................................................................... 426 TOP 10 ................................................................................................................ 426 Rogues Dashboard .............................................................................................. 427 Quarterly Availability Summary ............................................................................ 429
Reporting Performance, Inventory, and Uptime ............................................................. 432 Alerts .................................................................................................................... 439 Applications .......................................................................................................... 444 Custom Content ................................................................................................... 452 Devices ................................................................................................................ 453 Network Traffic ..................................................................................................... 481 Performance ........................................................................................................ 571 System Info .......................................................................................................... 609 Remote System Info ............................................................................................. 637 Troubleshooting ................................................................................................... 642 Virtual Reporting .................................................................................................. 709

ix
Wireless Reporting ............................................................................................... 721 Remote Environment Reporting ........................................................................... 756
Viewing Performance Real Time ................................................................................... 788 RealTime Performance Monitor Report ................................................................ 788
Using Logs .................................................................................................................... 791 Creating and Exporting Log Data Reports ............................................................ 792 Searching, Sorting, and Reducing ........................................................................ 792 Finding the Best Logger for the Task .................................................................... 793 Log Library ........................................................................................................... 796

x
Other Reference Information 843
JMX Browser .......................................................................................................................... 843
Global SMTP Settings ............................................................................................................ 843
SMS Providers ....................................................................................................................... 843
SMS Provider Details ............................................................................................................. 844
Select computer ..................................................................................................................... 844
Email Active Monitor Advanced Properties ............................................................................. 845
Tools: Layer 2 Trace .............................................................................................................. 846
IP/MAC Address Finder .......................................................................................................... 847
Using Email Notification Message Settings............................................................................. 848
Select a Device ...................................................................................................................... 848
Select a Home Device Group ................................................................................................. 848
Welcome Guided Tour............................................................................................................ 849
Setting LDAP or Cisco ACS credentials ................................................................................. 849
Percent Variables ................................................................................................................... 851
Discovery Percent Variables................................................................................................... 855
Alert Center Percent Variables ............................................................................................... 858
Setup Actions for Passive Monitors ........................................................................................ 859

xi
Monitoring Application Performance ....................................................................................... 860
Configure Monitors - Windows Event Log settings .................................................................. 860
SNMP MIB Browser dialog ..................................................................................................... 860
Passive Monitor Properties ..................................................................................................... 861
Rescan Options ...................................................................................................................... 861
CPU Threshold ....................................................................................................................... 863
Custom Threshold .................................................................................................................. 865
Disk Threshold ....................................................................................................................... 867
Interface Threshold ................................................................................................................ 868
Interface Errors and Discard Threshold .................................................................................. 870
Memory Threshold ................................................................................................................. 872
Ping Availability Threshold ..................................................................................................... 874
Ping Response Time Threshold ............................................................................................. 876
Windows Event Log Threshold ............................................................................................... 877
SNMP Trap Threshold ............................................................................................................ 879
Syslog Threshold .................................................................................................................... 881
Hyper-V Event Threshold ....................................................................................................... 883
VMware Threshold ................................................................................................................. 885

xii
Blackout Summary Threshold ................................................................................................. 887
Failover Threshold .................................................................................................................. 889
WhatsUpHealth Threshold ..................................................................................................... 890
Conversation Partners Threshold ........................................................................................... 894
Network Traffic Analysis Custom Threshold ........................................................................... 896
Failed Connections ................................................................................................................. 898
Interface Traffic Threshold ...................................................................................................... 900
Top Sender/Receiver ............................................................................................................. 902
Threshold Hosts ............................................................................................................ 904
Access Point CPU Threshold ................................................................................................. 905
Access Point Memory Threshold ............................................................................................ 906
Banned Client MAC Threshold ............................................................................................... 908
Device Over Subscription Threshold ...................................................................................... 910
Excessive Rogue Threshold ................................................................................................... 911
Using Alert Center Notification Policy options ................................................................ 913
Rogue Access Point MAC Address Threshold ........................................................................ 914
Rogue Hidden SSID Threshold .............................................................................................. 916
Threshold Devices......................................................................................................... 918

xiii
Rogue Specific SSID Threshold ............................................................................................. 919
Rogue Unknown SSID Threshold ........................................................................................... 920
Wireless Access Point RSSI Threshold .................................................................................. 922
Wireless Clients Bandwidth Threshold ................................................................................... 924
SMS Action Notification .......................................................................................................... 926
SMS Direct Notification ........................................................................................................... 929
Email Notification .................................................................................................................... 932
Manage Notification Policies .................................................................................................. 934
Visualize Escalation Schedule ................................................................................................ 937
Blackout Policies .................................................................................................................... 938
Example: On Call Rotation ..................................................................................................... 941
Scheduled Reports Library ..................................................................................................... 942
System Status and Properties ................................................................................................ 943
Choosing Business Hours ...................................................................................................... 944
Define a Date Range .............................................................................................................. 944
Enable Virtual Monitoring Event Listeners (VMware) .............................................................. 945
Enable Virtual Monitoring Event Listeners (Hyper-V) .............................................................. 948
Visualize, Print, Share, and Export ......................................................................................... 950
xiv
Emailing Reports and Logs .................................................................................................... 950
Exporting Report Data ............................................................................................................ 951
Printing reports and logs ......................................................................................................... 952
Share Reports ........................................................................................................................ 952
Interface Report Settings ........................................................................................................ 952
Column Sort and Picker .......................................................................................................... 953
Filter Row and Search ............................................................................................................ 954
Network Traffic Report Settings .............................................................................................. 954
Scheduling maintenance ........................................................................................................ 954
Network Interfaces ................................................................................................................. 954
Add/Edit Network Interface ..................................................................................................... 954
Browse Active Directory ......................................................................................................... 955
Test LDAP Credentials ........................................................................................................... 955
Copyright notice ........................................................................................................ 956

15
CHAPTER 1
Welcome WhatsUp Gold combines monitoring with powerful alerting, notification, and policy mechanisms to keep network infrastructure, services, and applications running smoothly and stakeholders informed whenever issues arise. WhatsUp Gold ensures network administrators and managers have 360-degree visibility, actionable intelligence, and complete control to make smarter decisions faster.
WhatsUp Gold can monitor, report, alert, and take action based on the status of network devices, host systems, and services. To start, it discovers and reports on any connected assets within minutes, while leveraging several detection techniques and a comprehensive library to manage credential types.
The latest version of WhatsUp Gold enable you to discover, manage, and explore WhatsUp Gold-discovered and WhatsUp Gold-monitored devices, visually, either as a network map, or a device table, or both. The map and table work together to provide status at a glance and quick drill down into device details when you need to know more than just operating state and basic attributes.
To learn more about WhatsUp Gold features including the whole-network map and environment-specific overlays, please see Navigating the WhatsUp Gold User Interface (on page 18).
If this is your first time using WhatsUp Gold, see Getting Started (on page 28) for a logical overview of the most common workflows with corresponding links to applicable help topics.
If you are familiar with network discovery, monitoring, and instrumentation and want to integrate WhatsUp Gold with your site, you can jump to the section titled Configuring WhatsUp Gold (on page 85).
Finally, refer to the release notes (https://www.ipswitch.com/WUG2018releasenotes) for software and hardware requirements, a new feature overview, and additional details with respect to this version of WhatsUp Gold.
New features in this version of WhatsUp Gold
The following enhancements have been implemented in the latest version of WhatsUp Gold.
Enhanced map filtering to allow the end-user to filter using ANY or ALL search entries (on page 23).
Added a Post to IFTTT action (on page 195).
Added a new BGP Peer Status active monitor (on page 114).

WhatsUp Gold User Guide
16
Enhanced map customization capability by allowing the user to create links between annotations (on page 265).
Enhanced Maintenance Mode functionality to include user-defined expiration date and time (on page 179).
Added to and enhanced existing configuration and display options for several dashboard reports (on page 410).
Added a new %device.role percent variable (on page 851).
Evaluation Quick Start Important: The following topic applies to a feature only available when using an
evaluator license during the evaluation period.
The Evaluation Quick Start feature allows you to easily see the power and the value of WhatsUp Gold in moments. By providing some basic information about a few of your available network devices, you can begin a simplified discovery scan and see how the application works with your data right away.
Tip: For the best initial scan, your WhatsUp Gold server should have access to your target devices through ping. The simplified scan uses SNMP or WMI protocols to gather information from target devices, so be sure your devices are configured to respond to these protocols and that you have the login credentials ready.
Step One: Which area of your network would you like to see first? First, you'll provide WhatsUp Gold with the IP information for the devices you'd like to see. The local subnet is offered by default because those devices are easily accessible from the WhatsUp Gold server. Alternately, you can select the Gateway IP in which case the router or switch will return available information about recently connected devices. Finally, you have the flexibility to manually enter a specific IP address, range of IP addresses, or subnet for WhatsUp Gold to query. Please note, WhatsUp Gold recognizes IP ranges entered as a comma delimited list, a hyphenated range, or in CIDR notation.
Step Two: Add credentials to unlock rich device information Entering administrator credentials for your network environment is essential to a successful experience with WhatsUp Gold. Using these credentials, the Quick Start simplified scan will discover and add the target devices into the My Network device group tree and begin monitoring the devices for you.
The Quick Start scan is designed to focus on hardware (e.g., routers, switches) as well as Windows clients and servers. The most commonly used protocol for these devices are SNMP and WMI. Beyond this simplified scan, WhatsUp Gold supports a wide

WhatsUp Gold User Guide
17
variety of credential types and offers a range of options to customize the scan best suited for your network and devices. For additional information on credential types WhatsUp Gold supports, please see Available Credentials (on page 217).
Step Three: Please confirm your email address Once you've provided valid credentials for discovery to use to find the devices you've specified, you'll be asked to provide your email address. With a valid email address, WhatsUp Gold will be able to notify you of information such as alerts, notification, and updates about your network. If your mail server requires secure authentication, make sure to enable the option(s) to send and receive emails via an encrypted connection using Transport Layer Security protocol and/or to enable Simple Mail Transfer Protocol Authentication which allows an SMTP client to access the mail server of the address provided.
Scan my network As the interactive quick start guide launches the simplified discovery scan, devices will be added to the map in real time unlike the full discovery scan which allows you to select which discovered devices to monitor when the scan is complete. Additionally, monitors appropriate for the assigned device role will also be applied to these devices automatically. Click Show Me to access the rich data available about your network devices. When the quick start guide is finished, you'll be presented with several videos presenting the extended capabilities of the application.
Please note, while this utility is intended to begin discovering devices as quickly as possible, the full discovery scan feature offers several more powerful options such as the ability to include and exclude IP addresses, upload a list of Host IP addresses, and select options on how the scan should run, for example, dynamically finding additional devices using SNMP data queries and responses.
Troubleshooting
Important: If WhatsUp Gold does not provide the results you expect, check to see if a firewall exists between WhatsUp Gold and your target devices. If so, make sure the appropriate ports are open to allow WhatsUp Gold to communicate via SNMP and WMI.

18
CHAPTER 2
Navigating the WhatsUp Gold User Interface
In This Chapter Working with the Discovered Network View ............................ 19
Working with the My Network Map .......................................... 20
Working with the Device List ................................................... 24
Searching WhatsUp Gold ....................................................... 25
Addressing Web Alarms ......................................................... 26
Using the Top Menu Navigation Admin Features .................... 26
Getting Help and More Information ......................................... 27
The top of the interface contains a navigation menu divided into four areas categorized by highest level network monitoring work flow. In other words, the navigation menu is designed so you can easily select what you would like to do with WhatsUp Gold.
DISCOVER (on page 19). Initiate a discovery scan (on page 31) or view a map/table of devices seen by WhatsUp Gold during a previous discovery scan.
MY NETWORK (on page 20). Scroll a device list or visualize connectivity and status information at a glance, create custom map layouts (on page 22), and use the map or device grid to drill down on device details and open status reports.
ANALYZE (on page 410). Access built-in and custom dashboards, drag in aggregated report and log data, which is historic or the latest polled. Schedule reports, configure reports with focused map views.
SETTINGS (on page 387). Configure WhatsUp Gold to customize your network monitoring environment.
Additionally, from the top of the interface, you can:
Perform a global search of WhatsUp Gold (on page 25). (Keyword search for libraries, devices, reports, logs, flow sources, and help topics.)
Manage active web alarms (on page 26).
Access user settings (on page 26).
Access WhatsUp Gold help, support, knowledge base, and license information (on page 27), a guided welcome tour (on page 849), and much more.
These top level navigation controls persist regardless of what areas of WhatsUp Gold you access or what actions you perform.

WhatsUp Gold User Guide
19
Working with the Discovered Network View Select DISCOVER from the navigation menu, then choose from the following options:
Discovered Network. Display a map or list (or both) of discovered devices that have not yet been added to WhatsUp Gold for monitoring.
New Scan. Perform a new discovery scan to find devices to add and monitor within your WhatsUp Gold environment.
Saved Scan Settings. Access, modify, and run saved discovery profiles (on page 53) to add new devices as well as refresh device details and connectivity information for existing devices.
Tip: From Discovered Network view, you can initiate the first step to ensure a device at your site is monitored by WhatsUp Gold. Select one-or-more devices and click Start/Update Monitoring. This is a fundamental step needed to add a device to My Network (on page 20). After the device is added to WhatsUp Gold, you can manage a device fully from Device Properties (on page 86).
Use these controls to browse, filter, and reduce the view:
Filter the map by brand, location, device name or IP address, assigned credential types, current discovery or monitoring status, operating system, role, and scan time to limit the number of items displayed.
Display discovered devices previously hidden from the map.
The bottom of the interface contains the following controls for manipulating the map view:
Display/Hide the Legend or the Active Scan progress bar on the map. Please note, device states shown in the legend and throughout WhatsUp Gold remain displayed in English regardless of the language pack selected for the current user.
Zoom in, zoom out, and fit the map displayed to the available screen space.
Toggle between pan and select modes. When pan mode is enabled, clicking and dragging moves the displayed map. When select mode is enabled, clicking and dragging selects all devices within that area of the map.
Display the Device List (on page 24) both in full and in partial screen views.

WhatsUp Gold User Guide
20
A status bar showing the progress of the discovery scan in progress if applicable also appears at the bottom of the interface.
Working with the My Network Map The primary WhatsUp Gold My Network tab automatically arranges devices based upon role and connectivity information gathered during the discovery process. You can modify and customize it as needed to fit your individual network monitoring needs. You can also toggle between list (on page 24) view and map view.
Select MY NETWORK from the navigation menu to display the map/list of devices previously discovered and subsequently added (on page 52) to WhatsUp Gold for monitoring. To populate your map/list of monitored devices, switch to the Discovered Network (on page 19) map view where you can initiate your first or subsequent scan to discover devices on your network to monitor.
Layout, filtering, and bulk action selection At left are icons used to configure the map view to fit your specific monitoring needs. Using these controls you can:
Enable a custom map canvas (on page 22) that
features a versatile drawing, custom background, and annotations palette.
Add annotations directly to the map. Add shapes, draw lines, insert text captions between
devices. Drop in pictures and backgrounds (office layout,
campus layout, metropolitan areas).
Note: The Custom Layout control becomes disabled when a layer 2 dynamic group is selected.
Toggle between a map view arranged automatically according to connectivity and a custom map of your own design. Please note, selecting Custom Layout disables the Include devices in sub-groups option when selecting which devices to map. Additionally, note that custom maps are not supported for layer 2 dynamic groups.

WhatsUp Gold User Guide
21
Select specific devices and device groups (on page 242) to display on the map.
Perform bulk actions on device groups (on page 242) and edit device group properties (on page 243) such as device group user access (on page 406) (if enabled in User and Group Library (on page 406)).
(overlay palette select)
Enhance the level of map detail by applying overlays to display devices, connectivity links and link status, dependencies, and interface utilization along with virtual and wireless infrastructure devices. Please note, you may need to enable one or more overlays to display certain monitored devices and launch corresponding device information cards (on page 250). At minimum, one overlay must always be enabled.
Filter the map by brand, location, device name or IP address, assigned credential types, current discovery or monitoring status, operating system, role, and scan time to limit the number of items displayed.
Quick library selection (credentials, monitors) At right are icons used to access the most common libraries used for WhatsUp Gold device management. From here, you can not only access, but also search for and apply both credentials and monitors to devices displayed on the current map.
Access dedicated palettes which allow you to assign credentials and monitors to network devices directly from the map view. Select one or more items from within the active palette along with any device icon or icons shown on the map, then click Apply to selected devices to complete the assignment. You can also click to add a new credential or monitor to the respective library or to open that library in full screen mode. Click to hide the palette.
Device list/map toggle controls, map zoom, map legend, and more The bottom of the interface contains the following controls for manipulating and customizing the look and feel of your network map view:

WhatsUp Gold User Guide
22
Display/Hide the Legend on the map. Please note, device states shown in the legend and throughout WhatsUp Gold remain displayed in English regardless of the language pack selected for the current user.
Zoom in, zoom out, and fit the map displayed to the available screen space.
Toggle between pan and select modes. When pan mode is enabled, clicking and dragging moves the displayed map. When select mode is enabled, clicking and dragging selects all devices within that area of the map.
Display the Device List (on page 24) both in full and in partial screen views.
Display/Hide the map editing tools. Please note, this control is only displayed when Custom Layout is enabled.
Customizing the My Network Map WhatsUp Gold provides a suite of layout and drawing tools to organize, annotate, and enhance the My Network (on page 20)map. WhatsUp Gold Custom Layout tools enable you to detail and better represent your specific network environment in a way that makes your site's operational tasks more fine tuned, easier, and collaborative.
To begin customizing your map, click to disable the automatic map
arrangement defined by WhatsUp Gold, then, click to display the map editing tools.
Use the following controls to manipulate your annotations:
Bring the selected object to the front of the map.
Send the selected object to the back of the map.
Lock the selected object.
Unlock the selected object.
Clone the selected object.
Delete the selected object.
Enable Always show labels to ensure device names remain displayed on your custom map regardless of zoom level.

WhatsUp Gold User Guide
23
Enable Clip device names to display truncated device names below icons on the custom map. Please note, when this option is enabled:
For domain name servers, everything prior to the first "." is displayed.
For devices using IPv4, only the IP address is displayed.
For devices using IPv6, only the compressed IP address is displayed.
For all other devices, the first ten characters followed by an elipses "..." is displayed.
Use the following controls to annotate the map display:
Draw a line segment.
Draw a rectangle.
Draw a circle.
Draw a cloud.
Import an image file.
Add text.
Please note, for line segments, both width and color can be defined by the user by selecting the number of pixels for the former and either selecting from a color palette or entering a specific HEX code for the latter. The same controls are available for the rectangle, circle, and cloud shapes along with the added ability to control what fill color the shape uses, if any. In the case of rectangles, the corner radius may also be customized by selecting a pixel value. When text boxes are added to the custom map, line width, line color, and fill can be defined for the shape along with commonly used options for the actual text including bold, italic, underline, strike through, as well as font style and size.
Custom maps support the following bulk actions applicable to user-defined annotations:
Select
Move
Lock/Unlock
Bring to front/Send to back
Clone
Delete
The controls displayed in the annotation edit panel reflect the item or items selected on the custom map. Any changes made to style settings are applied to all selected map annotations.
Tip: You can visualize, save, and share report-ready representations of your WhatsUp Gold network map using the Map View report.
Map filtering There are two methods by which to filter the devices for display on either map view. After clicking the filter icon, you may choose generate your network map using either

WhatsUp Gold User Guide
24
ANY applied filter or ALL applied filters collectively using the applicable radio buttons found below the data entry field.
The first method by which WhatsUp Gold applies filters to the map uses the ANY option. Using this method, as you apply additional filters, the number of devices shown is potentially increased as more match any of the filters you've applied. This method can be thought of as an "OR" filter. In other words, a device must only meet one of the criterion specified to be displayed. For example:
Example: The following filters have been applied to the My Network map with the apply ANY radio button enabled.
Roles: Windows Server Credential Types: SNMPv2 Monitored Status: Up, with down monitors
In this case, any device with the primary role of Windows Server OR with valid SNMPv2 credentials OR considered Up with at least one down monitor by WhatsUp Gold would be shown on the map. Only one of the three conditions must be met.
The second method by which WhatsUp Gold applies filters to the map uses the ALL option. As you apply additional filters, the number of devices shown is potentially reduced as fewer match ALL of the filters you've applied. This method can be thought of as an "AND" filter. In other words, a device must meet ALL of the criteria specified by the filters applied collectively to be displayed.
Example: The same three filters used in the previous example are applied again, however the apply ALL radio button is now enabled.
In this case, for a device to be displayed, it must have the primary role of Windows Server AND have valid SNMPv2 credentials assigned AND be currently considered Up with at least one down monitor by WhatsUp Gold. All three conditions must be met.
Working with the Device List The device list presents discovered or monitored devices in a table. You can view devices as a detailed list, a visual map, or both.
Show. Click at the bottom of either Discovery or Network map view to slide open a device list. (Slides open bottom panel.)
Hide. Click to hide the device list panel. (Slide shut bottom panel.) Full Screen. Click to expand the table to a full screen view and hide the map.
(Show full device list.)
Switch to Map/Exit Full Screen. Click . (Show full map.)
When viewing the list on the My Network (on page 20), you can select just one or multiple devices using the checkboxes at left, then click on the information card (on page 250) that appears to perform basic actions related to device management on the

WhatsUp Gold User Guide
25
selected device or devices in bulk. Selecting a single device also allows you to access device properties and status interfaces from the information card using the respective icons. Additionally, at left, you can click Groups or Filters & Overlays to open a panel where you can specify which devices you want to appear in the device list. The Legend is also accessible from the left panel for reference.
When viewing the list on the Discovered Network tab, you can select just one or multiple devices using the checkboxes at left, then click Start/Update Monitoring on the information card (on page 250) that appears to begin monitoring or update applicable information for the device(s) on the My Network (on page 20) view. Selecting devices on the grid also allows you to hide, delete, or rescan connectivity from the information card using the respective icons. Additionally, at left, you can click Filters or X Active Scan(s) to open a panel where you can specify which devices you want to appear in the device list or view the progress of the discovery scan currently in progress, respectively. The Legend is also accessible from the left panel for reference.
Please note, device states shown in the legend and throughout WhatsUp Gold remain displayed in English regardless of the language pack selected for the current user.
Searching WhatsUp Gold At the top of the interface, click and enter keywords to search WhatsUp Gold for:
Application navigation and functionality. Monitored and discovered devices. Libraries. Flow sources. Help and reference content available in the local and online help, WUGSpace
community, and knowledge base library.
As items matching your search terminology appear, you can specify what type of results are displayed using the following filter controls within the dialog:
Limit search results to devices discovered by or currently monitored within WhatsUp Gold.
Limit search results to features and functions of WhatsUp Gold.
Limit search results to Network Traffic Analysis sources monitored within WhatsUp Gold.
Limit search results to content available within the WhatsUp Gold help system and associated online resources.

WhatsUp Gold User Guide
26
Addressing Web Alarms When a web alarm action is triggered, an information card displaying relevant details about the affected device and cause of the alarm or appears. The alert message embedded within the information card identifies the specific monitors on the device that are currently down.
Click View to launch the Web Alarms interface. This view displays a table of all active web alarms which can be acknowledged, muted, or dismissed either individually or in bulk. Or, you can temporarily Mute or Dismiss the alarm entirely from this card. If multiple alarms have been triggered for the same device you have the option to Dismiss All as well.
Using the Top Menu Navigation Admin Features Access user settings and logout ( ) from the top navigation menu.
User Preferences. Change your WhatsUp Gold password, display language, or WUGSpace Community credentials. Additionally, you can specify either Blue or Green to represent an Up status throughout the WhatsUp Gold user interface.
View Legacy Dashboards. Access dashboard views from previous WhatsUp Gold installations available for export. Please note, dashboard views displayed here are visual representations only and can not be modified.
Log Out. Exit the WhatsUp Gold application.

WhatsUp Gold User Guide
27
Tip: Use the User and Group Library (on page 406) to create users, groups, and apply specific access control rules.
Customizing web alarm behavior To modify the default sounds and settings applicable to web alarms in WhatsUp Gold, first select the Enable device web alarms checkbox in the User Preferences (on page 26) dialog. Once enabled, you can use the Checking interval control to set the amount of time to elapse before the application checks both monitored devices and the WhatsUp Gold system itself for updated web alarm information.
Also, you now have the ability to upload either a .mp3 or .wav sound file to be played when a system alarm is triggered. To do so, click Upload, browse to and select the sound file you want to use as audio for WhatsUp Gold system alarms, then click Open. Choose the uploaded filename from the System notification sound drop-down menu, then click Save.
Please note, the maximum file size allowed may be determined by your IIS settings and corresponding limitations. Ipswitch recommends selecting a brief audio clip for use as a custom web alarm.
Note: Uploaded sound files may be used as system alarm cues only.
Getting Help and More Information Access the following administrative features by clicking HELP from the top menu navigation, then selecting from the following options:
WhatsUp Gold Help. Launch the online help system. Welcome. Revisit the welcome tutorial (on page 849) that launched after
launching WhatsUp Gold for the first time. Ipswitch, Inc. Launch the Ipswitch company website. Education and Training. Launch the Ipswitch training and services website. Support. Launch the Ipswitch community forum
(https://community.ipswitch.com/s/), knowledge base library, and customer portal.
About. View product information including license type, serial number, edition, current device and poller counts, as well as license usage (points).

28
CHAPTER 3
Getting Started The main window and menu items (on page 18) highlight the individual tasks and complete workflow available for leveraging the core network, infrastructure, and application management capabilities of WhatsUp Gold.
The steps for managing your network and application infrastructure with WhatsUp Gold include:
Discover and explore your network. Use the network map and grid to browse the roles, dynamic groupings, and topologies.
Apply monitors. Reveal and share monitor operational status and trends through dashboards. Analyze historic and forensic data by way of reports, logs, charts, and graphs. Group monitors and associate them with actions to implement policy for specific
standards.
Step-by-Step Guide When managing your network infrastructure, host devices, and virtual devices in WhatsUp Gold, the typical workflow includes:
Step 1: Discover devices on your network
Run initial discovery scan with associated credential
types.
Discover devices based on IP address(es) or hosts file (on page 52).
Perform batch ('seeded') discovery walking network segments, using an IP address or range as a starting point.
Additional details and device-configuration scenarios are outlined in Getting the Most from Your Scan (on page 32).
Tip: Scan for managing hosts and services (such as WLAN controllers, cloud management service endpoints, and vCenter, VMware and Hyper-V hosts) with appropriate credentials and scan depth. This 'top-down' approach enables WhatsUp Gold to track and maintain parent-child relationships and identify associated WLAN APs, cloud resources, virtual machines, and more.

WhatsUp Gold User Guide
29
Step 2: Add discovered devices to WhatsUp Gold managed devices (on page 52) (enable device-level monitoring)
Begin managing discovered devices (on page 19) (apply monitoring (on page 52)).
View and work with managed devices (on page 247) from My Network (on page 20).
Step 3: Set up monitors (on page
106) ...
View current monitors for a selected device in Device Properties (on page 86).
Select or 'bulk select' devices and switch on/off individual monitor types.
Associate new custom monitors with device profiles (device roles) (on page 83) .
Add, re-use, and customize specialized active (on page 111), passive (on page 150), and performance (on page 153) monitors and credential sets (on page 215) as needed.
Step 4: View detailed reports and summaries (on page 410) of device statistics and status
View (on page 410), share (on page 952), export (on page 951), distribute (on page 942) and manage charts and report data.
Leverage and customize dashboards and NOC views (on page 412) (Home (on page 415), Device Status (on page 105), for example).
Schedule periodic distribution of stakeholder charts, reports, and service-level collateral (on page 942).

WhatsUp Gold User Guide
30
Step 5: Create user roles, policies, chains of notification, and automate corrective actions for handling network, device, and application alerts and events.
Create additional users and user roles (on page 406).
Create alert thresholds and alert policies (on page 258).
Create corrective actions (on page 252) and action policies (on page 149).
Install application and application platform (on page 300) monitors.
Apply configuration management controls and actions (on page 307) to critical infrastructure.
Create/implement notification schedules (on page 260).
Analyze network traffic and flow data (on page 350).

31
CHAPTER 4
Running Discovery In This Chapter Getting the Most from Your Scan ............................................ 32
Discovering Cloud-based Wireless LAN Controllers ............... 47
Initiating a Discovery Scan ...................................................... 48
Adding Discovered Devices .................................................... 52
Using Saved Discovery Scan Settings .................................... 53
Handling Shared Addresses ................................................... 54
Managing Detection Categories (Device Roles) ...................... 61
WhatsUp Gold leverages a list of credentials, a discovery scan profile, and an expert network discovery model to traverse your network, query devices and their management objects, and then line up appropriate default monitors according to the determined role (on page 89) of the discovered device. After a device is discovered, you can choose if you want to manage/monitor the discovered device by adding it (on page 52) to the devices that WhatsUp Gold monitors.
You must run discovery so that WhatsUp Gold can centrally monitor, manage, and enable you to visualize your network on the My Network map.
Tip: When you scan a device, WhatsUp Gold discovery attempts to find device and host-level attributes, to learn the device's role (on page 62) within the network (for example, DNS, SMTP, FTP server), and even to extend the scan to other machines on the network ("seeded scan") that the current device shares frequent connections/conversations with, network dependencies, or both.
This section includes the following topics:
Preparing/Getting the Most from Your Scan (on page 32). Guidelines for better device coverage and richness of scan information.
Starting/Initiating the Network Scan (on page 48). Define include/exclude rules for the scan and then launch it.
Apply Monitoring to Discovered Devices (on page 52). A fundamental step to move discovered devices to monitored devices.
Re-using Saved Discovery Profiles (on page 53). Access, copy, and edit discovery rules (profiles) from earlier scans.
WhatsUp Gold User Guide
32
Getting the Most from Your Scan This section includes some pre-discovery tips and preparation that will make your network and device discovery scan more effective.
Discovery Basics. Understand the basic elements needed for discovering your network and devices.
Goals of discovery:
Find connected devices on your network. Apply library credentials (on page 215) (and verify which credentials work for a
given device) to enable rich information flow and accurate device role detection (on page 89).
Role detection (on page 89) (and, therefore, default monitor selection). Understand relationships between hypervisor hosts and VMs (on page 267),
WLAN controllers and WLAN access points (on page 266), cloud subscriptions and tenants (on page 272), and more.
Visualization/accounting of a table or map that represents your network segments and complete network.
Decision support mechanism that enables you to determine which devices to either add to My Network (on page 20) or defer from monitoring.
Tip: After you add monitoring to a device from Discovered Network view you manage it (clone, delete, curate its monitoring scheme, and so on) from My Network view. For example, monitored devices can only be deleted from WhatsUp Gold using the device management actions available in My Network.
Effectiveness and richness of information returned from network and device discovery is dependent on:
Credential list. Credentials associated with the scan profile enable the Discovery Service to query management objects, platform attributes, and configurations on the device. Connectivity to networks and devices. For OS/virtual/application layer information, ensure devices are powered on.
Ensure firewalls can be traversed (if you want to include a device for monitoring that is facing the DMZ, for example).
Connectivity to management services.

WhatsUp Gold User Guide
33
WhatsUp Gold gathers performance metrics from platform and proprietary MIBs using SNMP, from devices running Windows using WMI, from Linux and UNIX machines using SNMP and SSH, and VMware-specific host and VM metrics using VMware credentials to query vCenter, Windows credentials for accessing Hyper-V hosts, and so on. When connectivity to management services such as these is available by way of open network routes, ports, and appropriate credentials, the Discovery Service can provide a more complete set of default health and performance monitors to the discovered device. Freshness of scan and of results. If your network composition changes frequently, you can apply periodic scans to ensure freshness of information.
Note: As it scans, WhatsUp Gold Discovery must adapt to twist and turns in your site's network topology and overall configuration. Connectivity to management services and associating the proper credentials list with the scan profile are key to an effective scan that returns rich information.
Ensure Devices Can Be Reached. Devices need to be reachable and powered on for rich discovery information.
WhatsUp Gold attempts to discover devices on your network using ping (ICMP) and by scanning for open TCP ports. Check to see if network devices respond to one or both of these request types before beginning discovery.
If a firewall exists between WhatsUp Gold and the devices to be discovered or if the Windows firewall is enabled on the computer where WhatsUp Gold is installed, make sure the appropriate ports are open to allow WhatsUp Gold to communicate via SNMP and WMI.
Include Credentials to Management Hosts or Services. For accurate tracking of parent-child relationships (virtual, cloud, storage, wireless, and more).
Sometimes devices monitored by WhatsUp Gold are running within a cluster or deliberate deployment pattern. For these cases (virtual, wireless, storage, cloud, and more) it is best practice to first discover the management host or service with the appropriate credentials.
NAS or SAN. Use Storage Management Initiative Specification (SMI-S (on page 224)) credentials.
Virtual Hosts. Use VMware (on page 223) credentials for vCenter and ESX/ESXi. Use Windows (on page 221) credentials for Hyper-V.
Wireless LAN Controllers. Typically Wireless LAN Controllers use SSH credentials (on page 223) or Meraki credentials (on page 240).
Cloud. Azure (on page 228) and Amazon (on page 227) credentials are available for discovering compute and storage resources.

WhatsUp Gold User Guide
34
Ensure Devices Have SNMP/WMI Capability. SNMP/WMI needs to be configured/enabled.
Devices should be configured to respond to SNMP requests whenever possible. Alternatively, at discovery time, WhatsUp Gold can also gather information about Windows devices using WMI.
Important: You can add an SNMP agent (Windows service) from the Turn Windows Feature On or Off dialog for your current Windows device. In most cases, this Windows feature will already be enabled.
Note: In most cases, the information available using WMI is also available using SNMP. Where SNMP requests are more efficient than WMI requests, Ipswitch recommends using SNMP for discovery.
Tip: For the best discovery results, configure all of the credentials used by devices on your network prior to initiating a discovery scan.
After WhatsUp Gold discovers a device, it uses SNMP MIB or WMI (Windows Management Instrumentation) data recorded on that device to gather any appropriate device properties and configuration information. The information it collects enables WhatsUp Gold to identify the device and includes but is not limited to:
Device manufacturer and model. Installed hardware and software components such as fans, CPUs, hard disks,
and the version and type of operating system. Specific services (such as HTTP or DNS). Discover Virtual Hosts/VMs from the Top...Down. Specify servers (like vCenter) and hypervisors in your discovery scan.
When you discover virtual resources, include IP addresses of vCenters or hypervisors in your scan specification rather than individual VMs. WhatsUp Gold becomes aware of individual virtual machines through managing elements (such as vCenters, Hyper-V hosts, and standalone hypervisors) as part of the discovery process.
When including virtual environments in your discovery scan, follow these guidelines:
Discover management services first (such as VMware vCenter). In unmanaged environments (no vCenter and one or more ‘stand-alone’
hypervisors), you can discover individual hypervisors. After the discovery scan completes, apply monitoring to all nodes belonging to
the virtual environments (select each node and click the Start/Update Monitoring button) for each of the vCenter, hypervisors, and virtual machines.

WhatsUp Gold User Guide
35
Important: To ensure that VMware vCenter, cluster, datacenter, hypervisor, and virtual machine relationships are recognized by WhatsUp Gold and later reflected on the Network Map (on page 20), you must apply/update monitoring (Start/Update Monitoring (on page 52)) to both the managing elements, the hypervisors, and the associated the virtual machines after discovery.
Prerequisites Before you invoke a discovery scan on your virtual environment, check that you have these:
VMware. Valid VMware credentials (on page 223) are used. VMware Tools are also required. VMware Tools must be installed on each virtual machine you deploy. Otherwise,
the virtual device will not be discovered during the VMware scan. For detailed statistics and system information (for example, VMware Datastore
IOPS (on page 173) monitor), add VMware credentials (on page 223) to VMware VMs as well as for the vCenter server.
Tip: If you delete a vCenter from WhatsUp Gold, applicable host/guest relationships will not be recognized. In order to retain these relationships, delete the host as well, then rediscover the host and add it back into WhatsUp Gold.
Hyper-V. Hyper-V devices are discovered when valid Windows credentials are used. Groups and users for passing WMI management objects must be in place. Host OS Application firewalls must align with default Hyper-V firewall rules.
Configure Account Access for Passing WMI The appropriate Windows users or groups must be configured to allow access to the following WMI namespaces:
root\cimv2. Allows for discovery of any windows device using WMI.
root\virtualization\v2. Allows for discovery of Hyper-V host (2012 server, 2012 R2 server, and Windows 8).
\root\default. Allows for discovery of any additional registry information available.
Align Host OS for Hyper-V/WMI Firewall Rules The following firewall exceptions must be created:
Port 135 must be opened for data collection using WMI.
TCP/UDP traffic must be allowed on ports 1024-65535 or monitored objects using WMI will not be accessible.
WMI communications use a random port between 1024 and 65535 per Microsoft Windows specifications. The actual port used is determined by the remote machine. The port number range is based on the operating system being queried. The administrator can reduce or increase the range in most Windows operating systems.

WhatsUp Gold User Guide
36
Check Order of Credentials in the Discovery Scan WhatsUp Gold attempts discovery using Windows credentials in priority order. The first credential used that is allowed any WMI access is selected. However, if that credential does not have access to each of the required namespaces discussed previously, Windows is successfully detected, but other device details which require additional namespace access fail. The result is the target device is discovered as a Windows device, but is not recognized as a Hyper-V Host.
Note: Procedures for configuring conditions for successful Hyper-V device discover may vary depending on core versus full installation as well as the operating system on which the configuration is being performed.
Discover VMware Environments When you run a discovery scan, it is best to configure your scan to learn about VMware hypervisors and virtual machines through management services (such as VMware vCenter). In unmanaged virtual environments with stand-alone hypervisors (with just VMware ESXi, for example), you can discover hypervisors individually.
When hosts are managed by vCenter.
Discovering your virtual resources by way of vCenter is the preferred approach.
Guidelines:
Provide the IP address of the vCenter at discovery scan time. Your Credentials Library (SETTINGS menu > Libraries > Credentials
Library) must include the WhatsUp Gold VMware credentials for the vCenter. (Preferred) include VMware Credentials in WhatsUp Gold for each ESXi host (if
they differ from the vCenter credentials). This is best practice, but some host/guest metrics are available through vCenter without them (that is, using only VMware credentials you provided for vCenter).
Discover and add monitoring to a vCenter and its managed elements 1 From the IP Address Scan window (DISCOVER menu > New Scan), input the IP
address of one or more vCenters. (You can unselect the Gateway IP and Local Subnet checkboxes.)
2 In the Settings tab of the IP Address Scan window, click the Checkbox in Advanced Settings > Data Collection > Expand scan to any virtualization environments.
3 In the Credentials tab of the IP Address Scan window, include the appropriate VMware credential, and click Run to begin the scan. (Including the VMware credential for vCenter enables WhatsUp Gold to identify the device as a virtual host and learn about its managed hosts and their guest VMs) Nodes (discovered devices) display on Discovery Map.
4 After the scan completes, select the VMware vCenter and discovered virtual machine nodes, and click the Start Monitoring button to add them to My Network Map with their associated default monitors.

WhatsUp Gold User Guide
37
Lines of association show relationship between hosts and virtual machines and hosts to their vCenter.
5 After a few minutes, check the virtual monitoring dashboard (ANALYZE menu > Dashboards > Virtual Monitoring) to see data gathered from monitors of newly discovered virtual devices.
Tip: If you delete a monitored vCenter from the WhatsUp Gold Network Map, the existing host/guest relationships between its managed virtual hosts and virtual machines will no longer be obvious to WhatsUp Gold. This can also impact the continuity of monitoring and logging. To retain continuity of information and host/guest relationships with WhatsUp Gold after a vCenter deletion, delete each virtual host, re-discover, and from the Discovered Devices Map, use Update Monitoring button to restore these relationships.
When hosts/hypervisors (ESX/ESXi) are run standalone (unmanaged).
For this scenario, your Credentials Library (SETTINGS menu > Libraries > Credentials Library) must include the WhatsUp Gold VMware credential for the VMware host you want to discover.
Discover and add monitoring to stand-alone ESX/ESXi hosts 1 From the IP Address Scan window (DISCOVER menu > New Scan), input the IP
address of one or more VMware ESX or ESXi hosts. (You can unselect the Gateway IP and Local Subnet checkboxes.)
2 In the Settings tab of the IP Address Scan window, click the checkbox in Advanced Settings > Data Collection > Expand scan to any virtualization environments.
3 In the Credentials tab of the IP Address Scan window, include the appropriate VMware credential(s) in your network scan. (Including the VMware credential to the hypervisor enables WhatsUp Gold to identify the device as a virtual host and query it for virtual machine information). Network nodes (discovered devices) display on Discovery Map and the discovery scan completes.
4 Select each discovered hypervisor and virtual machine and click the Start Monitoring button to add them to My Network Map with default monitors. Lines of association show relationship between hosts and virtual machines.
5 After a few minutes, check the virtual monitoring dashboard (ANALYZE menu > Dashboards > Virtual Monitoring) to see data gathered from monitors of newly discovered virtual devices.
Discover Hyper-V Environments Specify DNS hostname or IP address for Hyper-V hosts when discovering Hyper-V environments.
Discover Hyper-V hosts
For this scenario, your Credentials Library (SETTINGS menu > Libraries > Credentials Library) must include the WhatsUp Gold Hyper-V credential for the Hyper-V host you want to discover.

WhatsUp Gold User Guide
38
Discover and add monitoring to Hyper-V hosts and associated virtual machines 1 From the IP Address Scan window (DISCOVER menu > New Scan), input the IP
address of one or more Hyper-V hosts. (You can unselect the Gateway IP and Local Subnet checkboxes.)
2 In the Settings tab of the IP Address Scan window, click the checkbox in Advanced Settings > Data Collection > Expand scan to any virtualization environments.
3 In the Credentials tab of the IP Address Scan window, include the appropriate Hyper-V credential(s) in your network scan. (Including the Hyper-V credential to the hypervisor/host enables WhatsUp Gold to identify the device as a virtual host and query it for virtual machine information). Network nodes (discovered devices) display on Discovery Map and the discovery scan completes.
4 Select each discovered hypervisor and virtual machine and click the Start Monitoring button to add them to My Network Map with default monitors. Lines of association show relationship between hosts and virtual machines.
5 After a few minutes, check the virtual monitoring dashboard (ANALYZE menu > Dashboards > Virtual Monitoring) to see data gathered from monitors of newly discovered virtual devices. Expand Your Scan to Include Storage Devices. Expands scan reach to include all storage resources (as reported back from SMI-S interface, for example).
WhatsUp Gold can discover and monitor storage devices, though additional considerations must be made to successfully do so. These include but may not be limited to the device's manufacturer, applied credentials, and assigned roles. The combination of such attributes will determine the specific data points WhatsUp Gold is able to retrieve and on which it can report.
WhatsUp Gold uses SNMP and SMI-S credentials to discover and monitor storage devices within your network environment. Please ensure you have created valid credentials applicable to the storage devices you wish to monitor.
Tip: Consider discovering storage devices using either an IP range or a seeded address scan. Discovering a storage node as a single device might not gather the complete set of available information that describes the device.
Please note the following additional guidelines specific to NetApp FAS series storage devices:
Install the NetApp ONTAP SMI-S Agent on a dedicated machine before discovering NetApp devices in cluster mode.
Configure WhatsUp Gold to discover both the NetApp cluster and the Data ONTAP SMI-S Agent (on page 46) during the same scan.
Configure the NetApp cluster to enable SNMP requests in the NetApp web interface.
Configure the NetApp devices to use SNMP credentials in the NetApp web interface with matching SNMP credentials in WhatsUp Gold.
WhatsUp Gold User Guide
39
Note: There is no need to install a separate agent to discover or monitor EMC storage devices.
Expand Your Scan to Include Wireless. Expands scan reach to include WLAN access points distributed over different subnets.
It is best practice to discover using credentials for WLAN controllers. WhatsUp Gold network discovery uses these credentials to gather detailed information about WLAN access points.
You can create a regular scanning interval to detect and update active end-stations connected to your access points using the Schedule tab in the IP Address Scan wizard.
Note: In your discovery scan you must elect to Expand Scan to Include Wireless Environments (on page 48). (This will enable discovery to include WLAN access points distributed over different subnets).
Your ability to manage wireless infrastructure devices is determined by your user rights (on page 406). To view data on this dashboard, you must have the Access Wireless user right enabled. For the ability to actively manage wireless infrastructure devices as well as include, exclude, or manage rogues, the Configure Wireless option must be selected as well.
Tip: In addition to being a powerful tool that enables you to discover, query, and assign monitors to your connected-devices, regular scans help keep the picture of your network current. Seeded discovery scans can help find seldom-used, forgotten, misconfigured, or even rogue devices.
Discovering Virtual Devices When you discover virtual resources, include IP addresses of vCenters or hypervisors in your scan specification rather than individual VMs. WhatsUp Gold becomes aware of individual virtual machines through managing elements (such as vCenters, Hyper-V hosts, and standalone hypervisors) as part of the discovery process.
When including virtual environments in your discovery scan, follow these guidelines:
Discover management services first (such as VMware vCenter). In unmanaged environments (no vCenter and one or more ‘stand-alone’
hypervisors), you can discover individual hypervisors. After the discovery scan completes, apply monitoring to all nodes belonging to
the virtual environments (select each node and click the Start/Update Monitoring button) for each of the vCenter, hypervisors, and virtual machines.
WhatsUp Gold User Guide
40
Important: To ensure that VMware vCenter, cluster, datacenter, hypervisor, and virtual machine relationships are recognized by WhatsUp Gold and later reflected on the Network Map (on page 20), you must apply/update monitoring (Start/Update Monitoring (on page 52)) to both the managing elements, the hypervisors, and the associated the virtual machines after discovery.
Prerequisites Before you invoke a discovery scan on your virtual environment, check that you have these:
VMware. Valid VMware credentials (on page 223) are used. VMware Tools are also required. VMware Tools must be installed on each virtual machine you deploy. Otherwise,
the virtual device will not be discovered during the VMware scan. For detailed statistics and system information (for example, VMware Datastore
IOPS (on page 173) monitor), add VMware credentials (on page 223) to VMware VMs as well as for the vCenter server.
Tip: If you delete a vCenter from WhatsUp Gold, applicable host/guest relationships will not be recognized. In order to retain these relationships, delete the host as well, then rediscover the host and add it back into WhatsUp Gold.
Hyper-V. Hyper-V devices are discovered when valid Windows credentials are used. Groups and users for passing WMI management objects must be in place. Host OS Application firewalls must align with default Hyper-V firewall rules.
Configure Account Access for Passing WMI The appropriate Windows users or groups must be configured to allow access to the following WMI namespaces:
root\cimv2. Allows for discovery of any windows device using WMI.
root\virtualization\v2. Allows for discovery of Hyper-V host (2012 server, 2012 R2 server, and Windows 8).
\root\default. Allows for discovery of any additional registry information available.
Align Host OS for Hyper-V/WMI Firewall Rules The following firewall exceptions must be created:
Port 135 must be opened for data collection using WMI.
TCP/UDP traffic must be allowed on ports 1024-65535 or monitored objects using WMI will not be accessible.
WMI communications use a random port between 1024 and 65535 per Microsoft Windows specifications. The actual port used is determined by the remote machine. The port number range is based on the operating system being queried. The administrator can reduce or increase the range in most Windows operating systems.

WhatsUp Gold User Guide
41
Check Order of Credentials in the Discovery Scan WhatsUp Gold attempts discovery using Windows credentials in priority order. The first credential used that is allowed any WMI access is selected. However, if that credential does not have access to each of the required namespaces discussed previously, Windows is successfully detected, but other device details which require additional namespace access fail. The result is the target device is discovered as a Windows device, but is not recognized as a Hyper-V Host.
Note: Procedures for configuring conditions for successful Hyper-V device discover may vary depending on core versus full installation as well as the operating system on which the configuration is being performed.
Discover VMware Environments When you run a discovery scan, it is best to configure your scan to learn about VMware hypervisors and virtual machines through management services (such as VMware vCenter). In unmanaged virtual environments with stand-alone hypervisors (with just VMware ESXi, for example), you can discover hypervisors individually.
When hosts are managed by vCenter.
Discovering your virtual resources by way of vCenter is the preferred approach.
Guidelines:
Provide the IP address of the vCenter at discovery scan time. Your Credentials Library (SETTINGS menu > Libraries > Credentials
Library) must include the WhatsUp Gold VMware credentials for the vCenter. (Preferred) include VMware Credentials in WhatsUp Gold for each ESXi host (if
they differ from the vCenter credentials). This is best practice, but some host/guest metrics are available through vCenter without them (that is, using only VMware credentials you provided for vCenter).
Discover and add monitoring to a vCenter and its managed elements 1 From the IP Address Scan window (DISCOVER menu > New Scan), input the IP
address of one or more vCenters. (You can unselect the Gateway IP and Local Subnet checkboxes.)
2 In the Settings tab of the IP Address Scan window, click the Checkbox in Advanced Settings > Data Collection > Expand scan to any virtualization environments.
3 In the Credentials tab of the IP Address Scan window, include the appropriate VMware credential, and click Run to begin the scan. (Including the VMware credential for vCenter enables WhatsUp Gold to identify the device as a virtual host and learn about its managed hosts and their guest VMs) Nodes (discovered devices) display on Discovery Map.
4 After the scan completes, select the VMware vCenter and discovered virtual machine nodes, and click the Start Monitoring button to add them to My Network Map with their associated default monitors.

WhatsUp Gold User Guide
42
Lines of association show relationship between hosts and virtual machines and hosts to their vCenter.
5 After a few minutes, check the virtual monitoring dashboard (ANALYZE menu > Dashboards > Virtual Monitoring) to see data gathered from monitors of newly discovered virtual devices.
Tip: If you delete a monitored vCenter from the WhatsUp Gold Network Map, the existing host/guest relationships between its managed virtual hosts and virtual machines will no longer be obvious to WhatsUp Gold. This can also impact the continuity of monitoring and logging. To retain continuity of information and host/guest relationships with WhatsUp Gold after a vCenter deletion, delete each virtual host, re-discover, and from the Discovered Devices Map, use Update Monitoring button to restore these relationships.
When hosts/hypervisors (ESX/ESXi) are run standalone (unmanaged).
For this scenario, your Credentials Library (SETTINGS menu > Libraries > Credentials Library) must include the WhatsUp Gold VMware credential for the VMware host you want to discover.
Discover and add monitoring to stand-alone ESX/ESXi hosts 1 From the IP Address Scan window (DISCOVER menu > New Scan), input the IP
address of one or more VMware ESX or ESXi hosts. (You can unselect the Gateway IP and Local Subnet checkboxes.)
2 In the Settings tab of the IP Address Scan window, click the checkbox in Advanced Settings > Data Collection > Expand scan to any virtualization environments.
3 In the Credentials tab of the IP Address Scan window, include the appropriate VMware credential(s) in your network scan. (Including the VMware credential to the hypervisor enables WhatsUp Gold to identify the device as a virtual host and query it for virtual machine information). Network nodes (discovered devices) display on Discovery Map and the discovery scan completes.
4 Select each discovered hypervisor and virtual machine and click the Start Monitoring button to add them to My Network Map with default monitors. Lines of association show relationship between hosts and virtual machines.
5 After a few minutes, check the virtual monitoring dashboard (ANALYZE menu > Dashboards > Virtual Monitoring) to see data gathered from monitors of newly discovered virtual devices.
Discover Hyper-V Environments Specify DNS hostname or IP address for Hyper-V hosts when discovering Hyper-V environments.
Discover Hyper-V hosts
For this scenario, your Credentials Library (SETTINGS menu > Libraries > Credentials Library) must include the WhatsUp Gold Hyper-V credential for the Hyper-V host you want to discover.

WhatsUp Gold User Guide
43
Discover and add monitoring to Hyper-V hosts and associated virtual machines 1 From the IP Address Scan window (DISCOVER menu > New Scan), input the IP
address of one or more Hyper-V hosts. (You can unselect the Gateway IP and Local Subnet checkboxes.)
2 In the Settings tab of the IP Address Scan window, click the checkbox in Advanced Settings > Data Collection > Expand scan to any virtualization environments.
3 In the Credentials tab of the IP Address Scan window, include the appropriate Hyper-V credential(s) in your network scan. (Including the Hyper-V credential to the hypervisor/host enables WhatsUp Gold to identify the device as a virtual host and query it for virtual machine information). Network nodes (discovered devices) display on Discovery Map and the discovery scan completes.
4 Select each discovered hypervisor and virtual machine and click the Start Monitoring button to add them to My Network Map with default monitors. Lines of association show relationship between hosts and virtual machines.
5 After a few minutes, check the virtual monitoring dashboard (ANALYZE menu > Dashboards > Virtual Monitoring) to see data gathered from monitors of newly discovered virtual devices.
Discover VMware Hosts Managed By vCenter Discovering your virtual resources by way of vCenter is the preferred approach.
Guidelines:
Provide the IP address of the vCenter at discovery scan time. Your Credentials Library (SETTINGS menu > Libraries > Credentials
Library) must include the WhatsUp Gold VMware credentials for the vCenter. (Preferred) include VMware Credentials in WhatsUp Gold for each ESXi host (if
they differ from the vCenter credentials). This is best practice, but some host/guest metrics are available through vCenter without them (that is, using only VMware credentials you provided for vCenter).
Discover and add monitoring to a vCenter and its managed elements 1 From the IP Address Scan window (DISCOVER menu > New Scan), input the IP
address of one or more vCenters. (You can unselect the Gateway IP and Local Subnet checkboxes.)
2 In the Settings tab of the IP Address Scan window, click the Checkbox in Advanced Settings > Data Collection > Expand scan to any virtualization environments.
3 In the Credentials tab of the IP Address Scan window, include the appropriate VMware credential, and click Run to begin the scan. (Including the VMware credential for vCenter enables WhatsUp Gold to identify the device as a virtual host and learn about its managed hosts and their guest VMs) Nodes (discovered devices) display on Discovery Map.
4 After the scan completes, select the VMware vCenter and discovered virtual machine nodes, and click the Start Monitoring button to add them to My Network Map with their associated default monitors.
WhatsUp Gold User Guide
44
Lines of association show relationship between hosts and virtual machines and hosts to their vCenter.
5 After a few minutes, check the virtual monitoring dashboard (ANALYZE menu > Dashboards > Virtual Monitoring) to see data gathered from monitors of newly discovered virtual devices.
Tip: If you delete a monitored vCenter from the WhatsUp Gold Network Map, the existing host/guest relationships between its managed virtual hosts and virtual machines will no longer be obvious to WhatsUp Gold. This can also impact the continuity of monitoring and logging. To retain continuity of information and host/guest relationships with WhatsUp Gold after a vCenter deletion, delete each virtual host, re-discover, and from the Discovered Devices Map, use Update Monitoring button to restore these relationships.
Discover Standalone VMware Hosts For this scenario, your Credentials Library (SETTINGS menu > Libraries > Credentials Library) must include the WhatsUp Gold VMware credential for the VMware host you want to discover.
Discover and add monitoring to stand-alone ESX/ESXi hosts 1 From the IP Address Scan window (DISCOVER menu > New Scan), input the IP
address of one or more VMware ESX or ESXi hosts. (You can unselect the Gateway IP and Local Subnet checkboxes.)
2 In the Settings tab of the IP Address Scan window, click the checkbox in Advanced Settings > Data Collection > Expand scan to any virtualization environments.
3 In the Credentials tab of the IP Address Scan window, include the appropriate VMware credential(s) in your network scan. (Including the VMware credential to the hypervisor enables WhatsUp Gold to identify the device as a virtual host and query it for virtual machine information). Network nodes (discovered devices) display on Discovery Map and the discovery scan completes.
4 Select each discovered hypervisor and virtual machine and click the Start Monitoring button to add them to My Network Map with default monitors. Lines of association show relationship between hosts and virtual machines.
5 After a few minutes, check the virtual monitoring dashboard (ANALYZE menu > Dashboards > Virtual Monitoring) to see data gathered from monitors of newly discovered virtual devices.
Discover Hyper-V Hosts For this scenario, your Credentials Library (SETTINGS menu > Libraries > Credentials Library) must include the WhatsUp Gold Hyper-V credential for the Hyper-V host you want to discover.

WhatsUp Gold User Guide
45
Discover and add monitoring to Hyper-V hosts and associated virtual machines 1 From the IP Address Scan window (DISCOVER menu > New Scan), input the IP
address of one or more Hyper-V hosts. (You can unselect the Gateway IP and Local Subnet checkboxes.)
2 In the Settings tab of the IP Address Scan window, click the checkbox in Advanced Settings > Data Collection > Expand scan to any virtualization environments.
3 In the Credentials tab of the IP Address Scan window, include the appropriate Hyper-V credential(s) in your network scan. (Including the Hyper-V credential to the hypervisor/host enables WhatsUp Gold to identify the device as a virtual host and query it for virtual machine information). Network nodes (discovered devices) display on Discovery Map and the discovery scan completes.
4 Select each discovered hypervisor and virtual machine and click the Start Monitoring button to add them to My Network Map with default monitors. Lines of association show relationship between hosts and virtual machines.
5 After a few minutes, check the virtual monitoring dashboard (ANALYZE menu > Dashboards > Virtual Monitoring) to see data gathered from monitors of newly discovered virtual devices.
Discovering Storage Devices WhatsUp Gold can discover and monitor storage devices, though additional considerations must be made to successfully do so. These include but may not be limited to the device's manufacturer, applied credentials, and assigned roles. The combination of such attributes will determine the specific data points WhatsUp Gold is able to retrieve and on which it can report.
WhatsUp Gold uses SNMP and SMI-S credentials to discover and monitor storage devices within your network environment. Please ensure you have created valid credentials applicable to the storage devices you wish to monitor.
Tip: Consider discovering storage devices using either an IP range or a seeded address scan. Discovering a storage node as a single device might not gather the complete set of available information that describes the device.
Please note the following additional guidelines specific to NetApp FAS series storage devices:
Install the NetApp ONTAP SMI-S Agent on a dedicated machine before discovering NetApp devices in cluster mode.
Configure WhatsUp Gold to discover both the NetApp cluster and the Data ONTAP SMI-S Agent (on page 46) during the same scan.
Configure the NetApp cluster to enable SNMP requests in the NetApp web interface.
Configure the NetApp devices to use SNMP credentials in the NetApp web interface with matching SNMP credentials in WhatsUp Gold.

WhatsUp Gold User Guide
46
Note: There is no need to install a separate agent to discover or monitor EMC storage devices.
Installing the SMI-S Agent for use with WhatsUp Gold Use the following procedure steps to install the Data ONTAP SMI-S Agent in order to successfully monitor NetApp FAS series storage devices using WhatsUp Gold. The Agent is required for monitoring volume statistical data and must be installed on a machine that can communicate with both WhatsUp Gold and the storage device or devices being monitored.
1 Download the Data ONTAP SMI-S Agent executable file from NetApp. For detailed information such as prerequisites, supported operating systems, versions, refer to http://support.netapp.com.
2 Ensure you are logged in using the local Administrator account, then install the SMI-S Agent.
3 Reboot the machine on which the SMI-S Agent was installed. 4 Open a command line, then run the following command to ensure the 'cimserver'
has started running. If the response indicates it is not running, ensure port 5988/5989 is not in use by another program: smis cimserver status OR Access the list of running services in the Windows Control Panel and start the Data ONTAP SMI-S Agent service manually, if needed.
5 Launch the Data ONTAP SMI-S Agent program from the Windows Start menu. 6 Open a command line, then create a username and password for the SMI-S Agent
by running the following command: cimuser -a -u <username> -w <password>
Note: The user created using this command must match an existing local Windows user account. Additionally, when creating the credential in WhatsUp Gold, enter the password created using this command rather than the password for the local Windows user account.
7 Set the cache refresh rate interval time by creating a system variable named: CACHE_REFRESH_SEC
Note: The Data ONTAP SMI-S Agent uses a default collection interval of 5 minutes. Ipswitch recommends setting the cache refresh rate interval to match the interval set for disk utilization data collection in WhatsUp Gold. Refer to Windows documentation for information on creating variables.
8 Prior to connecting the Agent to the SVM, launch a web browser and log in to OnCommand System Manager.
9 Select the Network Interfaces tab. 10 Right-click the interface assigned to the SVM. 11 Select Enable Management Access.

WhatsUp Gold User Guide
47
12 Click Save. 13 Navigate to Configuration > Security > Users for the specific SVM in the
hierarchy at left. 14 Ensure the vsadmin user is present, unlocked, and sshd and ontapi are
enabled. 15 Add the SVM to the SMI-S Agent by running the following command:
smis add <SVM IP address> vsadmin OR smis addsecure <SVM IP address> vsadmin to configure SMI-S to use HTTPS instead of HTTP.
16 Ensure the SVM was successfully added by running the following command: smis list
17 Repeat the two previous steps to add each SVM you want to monitor.
Discovering Cloud-based Wireless LAN Controllers
Cloud-based wireless LAN controller (WLC) environments (e.g., Cisco Meraki) require special consideration in regards to discovery and subsequent monitoring with WhatsUp Gold. Please note the following:
API-specific credentials are required to connect to cloud-based WLCs. No additional information is required when these credentials are in use as WhatsUp Gold recognizes these as cloud solutions as well as where and how to access the environments.
Enabling Expand scan to any wireless environments under Advanced Settings in the Discovery interface allows for each cloud-controlled AP to be monitored using active monitors without any additional configuration. Please note, all access points should be accessible through an IP connection to WhatsUp Gold.
By default, only a Ping active monitor is applied to each cloud-controlled AP during discovery. If any additional active or device-specific performance monitors are required for these APs, additional credential types (e.g., SNMP) must be included when setting up the Discovery scan. Please note, at the time of this release, Cisco Meraki does not make AP device state available through their API.
Following the discovery of the cloud-based wireless LAN controller environment, WhatsUp Gold creates a cloud portal device and then associated with applicable APs. The cloud portal device must be monitored to collect and report wireless performance information for all APs controlled by the cloud-based WLC. All wireless performance information is supplied through the cloud-based WLC/API.

WhatsUp Gold User Guide
48
Initiating a Discovery Scan Before you can manage and monitor devices with WhatsUp Gold, launch the Discovery Scan wizard (DISCOVER > New Scan) and run it. The wizard guides you through steps needed to discover devices, identify device roles, and detect the services these devices provide over your network. Use the in-wizard controls to configure settings, launch scans, and save settings used for the current run. Wizard settings are saved as discovery scan settings (on page 53). Discovered devices do not count against your licensing until you select them and Start Monitoring (on page 52).
Important: Click the "circle i" ( ) next to any setting in the Discovery Wizard to get tips for how the setting works and when to apply it.
What can WhatsUp Gold discover?
WhatsUp Gold Discovery can scan any network, subnet, or IP address reachable from your WhatsUp Gold installation. Scans have the ability to apply device credentials where appropriate. This feature is what differentiates it from other network scanners and enables WhatsUp Gold to gather rich and accurate device, platform, and guest OS information. In contrast, ping, ARP, and 'public' information such as SNMPv1 queries can return sparse information, no information, or in the case of "ping" requests wrong information because the request can be ignored by a firewall. Credentials also enable you to integrate monitoring solutions with cloud resources (AWS, Azure, and Meraki) and their management endpoints at discovery time. Target IP addresses are not needed for cloud resources, but including a cloud credential with your scan settings is required to discover cloud.
Simplest case: what's needed to run Discovery Wizard?
All you need to run Discovery Wizard is a starting device IP or subnet and one or more credentials (on page 215) that can be used to query the connected device for information. The type of information you want is related to the type of credential you provide.
Tip: If you are just starting out with WhatsUp Gold, you can just click the Review and Run tab and then click Run to discover your default gateway device. (To help you out, the Discovery Scan wizard already pre-populates the Starting Device Set page with a single IP address, which is the gateway IP address known to the WhatsUp Gold server.)
Guidelines for configuring discovery with the wizard Discovery Wizard provides a full set of basic (Start tab and Limit and Expand subtabs) and advanced configuration options (Options tab). You can perform everything from a simple ping/ARP scan on an private network to a deep scan using domain, cloud, and virtual host credentials (and every range and scope of scan in-between). Use the

WhatsUp Gold User Guide
49
guidelines in this section and the "circle i" ( ) informational text to understand the settings that satisfy the goals of your scan.
Guideline Details
Understand the purpose for the scan
The simplest scans (such as ping/ARP/Public SNMPv1) run very quick but only check basic connectivity for the list of target IP addresses you provide. They validate that an IP address is in use and check that typical ports are active. When it comes time for you to add monitoring, without knowing more details about the device, WhatsUp Gold initially adds TCP and ping monitors.
Tip: Windows Firewall and other packet filtering methods can ignore or block ping (Echo) requests. If you add appropriate credentials using the Discovery Wizard (Windows in this case) your scan can see past false negatives.
Deeper Discovery scans (such as seeded scans with credential lists that might include platform, VM host, VM guest, cloud resource credentials, and more) take longer to complete because Discovery learns more as it runs and processes that information to produce more accurate and interesting results (such as target device OS, target device services that are network available, and more). When it comes time for you to add monitoring, WhatsUp Gold uses these results to start the device out with a useful list of monitors.
It is best practice to take small bites (at first)
Consider these hints:
Start with a Host List, a small subnet, or a few target IP addresses before you try to scan a larger subnet or an entire network.
Saved discovery scan settings are easy to modify and re-use. Save the settings from runs that work best.
You can add credentials to a saved settings for a simple scan so you can re-run it later as a deep discovery scan.
If you 'go big' with a scan, you can use the Limit sub tab and even the Maximum Number of Devices threshold to tune and cap a scan's reach.

WhatsUp Gold User Guide
50
Seeded scans cast a 'wide net'
For example, let's say you are starting out by using only the default gateway as a device to discover. If you run the Discovery Wizard on the IP address of the default gateway in Seeded scan, the discovered device set expands out to include all devices and conversations known to the gateway up to the Scan Depth ("hops" away from the initial target IP).
Discovery returns a view or list of candidate devices it found. You can review, filter, and select devices from this list for comprehensive management (monitoring, alerting, reporting and more) with WhatsUp Gold.
Tip: You can copy/edit/manage a scan profile in DISCOVER > Saved Scan Settings. For details, or to learn how to apply a scan based on an already created profile, see Using Saved Discovery Scan Settings (on page 53).
Step 1: Choose your starting device set Enter the identifying information WhatsUp Gold should use to attempt to discover your devices. This can include IP ranges or subnets. You also have the option to discover devices using the Gateway IP and/or local subnet. Please note, if you are attempting to discover AWS, Azure, or Cisco Meraki controlled devices, make sure to enable these options (Expand subtab) and include their credentials. Finally, this interface allows you to alternately specify a hosts file to identify scan targets as well as an option for rescanning devices already monitored by WhatsUp Gold to retrieve updated device information.

WhatsUp Gold User Guide
51
Select Expand, then enable applicable options to expand the discovery scan to search for connected guests and hosts referenced by each virtual host server, Access Points referenced by each Wireless LAN Controller and clients, and devices referenced by each storage controller or agent. You can choose to include connected wireless clients (guests), and/or storage controllers or agents. This interface also allows you to run discovery using a seed address rather than an IP range or subnet. This option uses network data (such as peer-to-peer or IP routing tables) to expand the starting set of devices or "seeds". The expanded set is then used as new seeds to expand again, repeating up to the selected scan depth.
Select Limit, then enable applicable options to force WhatsUp Gold to exclude previously discovered devices currently in the hidden device list and/or specific IP addresses, ranges, or subnets. This interface also allows you to specify the maximum number of devices discovery will find and/or limit the scan to private networks or monitored subnets.
Step 2: Select credentials for the scan Enable the applicable options to specify credentials WhatsUp Gold should use to access and communicate with network-connected devices during discovery.
Use the controls at the top of the interface to add , edit , or prioritize a credential for device discovery.
Enable Use all current and future credentials to use any appropriate credential in the library during the discovery scan.
Step 3: Configure additional/advanced options Use this interface to fine tune discovery behavior by configuring the following:
Instruct WhatsUp Gold to send an email to a specified address when discovery has completed.
Use the SNMP SysName string for the device name for discovered devices when available.
Use reverse DNS look-up to gather names for detected devices.
Use advanced discovery connectivity checks.
Limit the number of child discovery processes/jobs that run (maximum number of threads).
Specify timeout interval for Ping, SNMP, and WMI.
Select Schedule to display controls for configuring the discovery to run at a set date, time, and recurrence. You can also set an expiration date for a recurring discovery scan.
Last Step: Review scan settings and run discovery 1 Review the Settings, Credentials, and Schedule options. Click to the right of
the applicable section to make changes, if needed. 2 Click Run to initiate the discovery scan or Save to retain this scan configuration as
a discovery profile in WhatsUp Gold for future use.

WhatsUp Gold User Guide
52
Finally, to enable device-level monitoring on selected devices, proceed to Adding Discovered Devices (on page 52).
Hosts File Format For Network Discovery, you can upload a hosts file in the form:
ipaddress [ hostname | DNS-name ]
—Where the names in the hosts file will override the reverse DNS lookup for a matching DNS name.
Example
192.0.2.8 ws2.example.com 203.0.113.8 mail01.example.com
Tip: WhatsUp Gold discovery also supports upload of an unformatted list of IP addresses.
Adding Discovered Devices After you run discovery, discovered devices display on the Discovered Network Map
(on page 19). Initially, these devices display as unmonitored . This topic describes how you add them to your monitored network.
Note: When you add monitoring to a device it counts towards the points limit defined within your WhatsUp Gold license.
To add discovered devices to be monitored, you select them and apply monitoring. You can interact with the monitored devices by way of the My Network map.
To add discovered devices:
From Discovered Network (on page 19) map view (DISCOVER menu > Discovered Network), select or bulk select device(s).
Device Card (single device) or Device Summary (for more than one selected device) displays.
1 From the Device Card, click Start/Update Monitoring.

WhatsUp Gold User Guide
53
The Start/Update Monitoring dialog box displays. 2 In the Start/Update Monitoring dialog: Select a destination group, or elect the default.
Create an optional subgroup for the destination group.
Review the device names, IP addresses, and assigned roles as well as the WhatsUp Gold managed device license totals. Please note, to modify the role automatically assigned to a device by WhatsUp Gold, click on the current role to launch a list of options, then select the new role for assignment to that device.
Click Start.
Icons for each device you add transitions visually from unmonitored to
monitored .
Tip: You manage devices by way of the My Network map or list view. For example, you cannot delete devices directly from Discovered Network after you add them. You must delete them from My Network instead.
3 Begin managing and applying monitors (on page 106), threshold alerts (on page 258), actions (on page 252), and policies using the My Network map.
Tip: Contact the WhatsUp Gold Team at Ipswitch (https://www.ipswitch.com/contact-sales.aspx) to increase the number of device licenses.
Using Saved Discovery Scan Settings Saved Scan Settings Library (DISCOVER > Saved Scan Settings) enables you to manage and run saved discovery profiles.
Immediate Scan. Select a saved scan checkbox from the grid and click on Scan Now.
New/Copy. Create a new or copy an existing profile and edit to suit the task.
Edit. Modify the settings, credentials, and schedule options for the profile.
Delete. Remove a saved discovery profile from WhatsUp Gold.
Set as Default. Populate the discovery wizard with the selected profile's settings when initiating a discovery scan (on page 48).
Understand column data The default view of the saved discovery profile table includes:
Name. Discovery scan identifier or profile name. Started. Date and time group when scan was initiated.

WhatsUp Gold User Guide
54
Status. Network discovery status indicator. For example, Completed. Devices Found. Devices WhatsUp Gold discovery connected to and opened an
initial network connection with. Devices Complete. Devices specified either in IP address list or seeded this
that yielded discovery results. Devices with Valid Credentials. Number of devices where one or more
credential instances in the credential list configured for discovery was successful.
Handling Shared Addresses You can designate WhatsUp Gold Discovery address exceptions (SETTINGS > Discovery Settings > IP/MAC Address Exceptions) for cases where Discovery detects devices on your network that share an identical network or hardware address. Adding an address exception gives WhatsUp Gold Discovery the hint it needs to recognize host boundaries when it scans environments that use either non-standard hardware addressing or non-standard network configuration (or both).
Tip: Firewalls, routers, and layer 3 switches deployed in an active high-availability configuration will share the same IP address.
Background By default, WhatsUp Gold Discovery uses network or hardware addressing to identify the 'uniqueness' of devices. Shared addressing can occur in special network architectures or topologies and is normally restricted to LANs such as high-availability environments, network load balancing, and virtualization schemes. In these scenarios, IP addresses or MAC addresses can be unreliable predictors of device or host boundaries. After you apply a Discovery address exception and restart the Discovery Service, all devices using designated addresses under this exception will be visible via the Discovery Map and Discovery List.
Actions Add (IP Address). Create new IP address exception. Subnet ranges supported. IP Address. Add/Edit an address or address range. You can specify subnets by
using CIDR (https://tools.ietf.org/html/rfc4632#section-5.3) notation. Reserved IP addresses cannot be edited.
Description. You can use this field to explain the policy or scenario behind the exception.

WhatsUp Gold User Guide
55
IP Address Examples Use Classless Inter-domain Routing notation (CIDR) to specify all IPs for a given subnet. For example, to specify all IPs for a given switch or controller, use CIDR notation to specify the network part of the address.
Designate a subnet. Create address exceptions for a single subnet.
Use CIDR notation to designate address exception behavior for an entire subnet.
Syntax:
<IP-address>/<bits-to-consider-as-network-part>
Example:
198.51.100.0/24
--where "/24" denotes the first 3 octets are the network part of this address (198.51.100).
--and, where all hosts beneath the network part will exhibit address exception behavior in WhatsUp Gold.
The previous value is a more compact version of:
198.51.100.1-198.51.100.254
Designate a domain. Create exceptions for an entire network.
You can also use CIDR notation to add address exceptions across a typical corporate network or domain. 'Wide net' exceptions like this can be deployed when your WhatsUp Gold monitoring solution is discovered and in place, and as part of a discovery sweep that detects new devices or outliers.
Syntax:
<IP-address>/<bits-to-consider-as-network-part>
Example:
198.168.0.0/16
--where "/16" denotes the first 2 octets are the network part of this address (198.168).
--and, where all devices with IPs 'beneath' the network part will exhibit address exception behavior in WhatsUp Gold.
Add (MAC Address). Create new MAC address exception. Prefix matching supported. MAC Address. Add/Edit an address or prefix.

WhatsUp Gold User Guide
56
Description. You can use this field to explain the policy or scenario behind the exception.
MAC Address Example Single MAC address. Simplest case.
Simplest Case Specify a single MAC
00-00-5E-00-53-88
Designate by Vendor Prefix. Watch for duplicates over a range.
Specify MAC by Vendor Prefix
You can exclude device merging for specific NIC categories or vendors by specifying a partial MAC address. For example, the following adds address exceptions for:
VNIC "hardware" IDs generated by VMware: 00:50:56 MAC addresses reserved by ICANN, IANA for testing and documentation. 00-00-5E MAC addresses used by Dell. EC.F4.BB
Edit. Modify exception. Built-in exceptions (IANA/IETF reserved/restricted addresses, for example) cannot be modified. IP Address. Add/Edit an address or address range. You can specify subnets by
using CIDR (https://tools.ietf.org/html/rfc4632#section-5.3) notation. Reserved IP addresses cannot be edited.
Description. You can use this field to explain the policy or scenario behind the exception.
IP Address Examples Use Classless Inter-domain Routing notation (CIDR) to specify all IPs for a given subnet. For example, to specify all IPs for a given switch or controller, use CIDR notation to specify the network part of the address.
Designate a subnet. Create address exceptions for a single subnet.
Use CIDR notation to designate address exception behavior for an entire subnet.
Syntax:
<IP-address>/<bits-to-consider-as-network-part>

WhatsUp Gold User Guide
57
Example:
198.51.100.0/24
--where "/24" denotes the first 3 octets are the network part of this address (198.51.100).
--and, where all hosts beneath the network part will exhibit address exception behavior in WhatsUp Gold.
The previous value is a more compact version of:
198.51.100.1-198.51.100.254
Designate a domain. Create exceptions for an entire network.
You can also use CIDR notation to add address exceptions across a typical corporate network or domain. 'Wide net' exceptions like this can be deployed when your WhatsUp Gold monitoring solution is discovered and in place, and as part of a discovery sweep that detects new devices or outliers.
Syntax:
<IP-address>/<bits-to-consider-as-network-part>
Example:
198.168.0.0/16
--where "/16" denotes the first 2 octets are the network part of this address (198.168).
--and, where all devices with IPs 'beneath' the network part will exhibit address exception behavior in WhatsUp Gold.
Delete. Delete exception.
Delete an exception to return to default address handling rules. (WhatsUp Gold Discovery will use network or hardware addressing authoritatively to identify a single device.)
Tip: Before you delete an IP address exception, copy the IP address value. You can re-use this value, including CIDR notation if applicable, for the Discovery Scan.
Typical Workflow When Managing Devices Using Duplicate Addressing A typical workflow for managing and monitoring devices using shared addressing scheme is:

WhatsUp Gold User Guide
58
1. Identify Identify addresses or segments you want to apply address exceptions to. Typical scenarios include:
Missing devices. After discovering categories of devices mentioned in the topic titled Typical Uses of Shared Addressing (on page 59), you notice fewer devices displayed on the map/list than you expected.
Merged device records. A device such as a gateway or firewall deployed in a high availability configuration is merged with its peer(s) as shown in the Device Merge Decision Information (on page 95).
General investigation. You can apply exceptions on small segments such as those meeting the characteristics outlined in Typical Uses of Shared Addressing (on page 59) as a way to detect NAT activity, network bridging, and more.
2. Start Fresh If you already scanned your network, it is best practice to start fresh —delete any devices from WhatsUp Gold that might have been merged due to shared addressing schemes.
3. Add Exception Apply exceptions for these addresses either individually, as a subnet range, or vendor prefix (MAC).
4. Restart and Rescan
Restart the discovery service to make your exceptions active and re-run discovery.
After you apply your address exceptions, and after the Discovery service is restarted and re-reads its configuration, you will need to rescan the network, network segment, or address of interest to see the results of your changes.
5. Add Monitoring After you have scanned your network, you can determine if any new devices found based on address exception rules should be added to the monitored network and count against your licensing.
Note: To apply address exceptions to the WhatsUp Gold Discovery configuration, you need to restart the Discovery service (on page 387).
Rescan Guidelines Use these scan/rescan guidelines after making changes to the table of IP address exceptions:
WhatsUp Gold User Guide
59
Scan the same IP range. If you suspect shared address use is limited to a specific subnet or range, re-Discover (on page 48) the range you added an address exception for. For example, this is the best approach if you are looking for duplicates between address pools allocated by one-or-more wireless controllers, ranges that you know where VMs can be typically found, or any of the other scenarios where IP duplication is likely to occur. (on page 59)
Apply scan to all monitored devices. If you want to apply changes only to monitored devices, select all devices from the MY NETWORK List, and choose Rescan from the Device Management Actions (on page 179) menu.
Rescan guidelines for MAC address exceptions:
Scan specific subnets or IP ranges. For example, if you added an exception for the VMware vendor MAC prefix (00:50:56), you can target a rescan on the subnet or IP address range where you know VMware VMs are running.
Sweep the network. If you are taking a 'cast-a-wide-net' approach and you are just looking for a misconfigured, masquerading, or other unexpected use of addressing, you can widen scan coverage.
Typical Uses of Shared Addressing There are several scenarios where revealing shared addresses is critical to effective WhatsUp Gold monitoring, daily operations, and troubleshooting.
Virtualization. Catch cases of misconfiguration due to an administrator or VM deployment
application duplicating VNIC addresses (after cloning in vCenter https://kb.vmware.com/selfservice/microsites/search.do?language=en_US&cmd=displayKC&externalId=1024025, for example), correct their vCenter instance IDs, and Rescan.
Detect multiple guest operating systems with virtual network interfaces running on a single physical device.
Proxy. Multiple hosts answering Discovery queries from behind a proxy IP. Masquerading. Reveal clients (especially from wireless APs) using counterfeit addresses to gain
access to your network.
Reveal clients trying to masquerade using trusted IPs or MAC addresses.
Intentional masking. Bridging. Intentional or unintentional bridging or Network Address Translation
(NAT) that connects two networks. IoT Devices. Networked IoT devices such as point of sales kiosks, household
devices such as refrigerators, televisions, wireless media, and smart devices can be configured by the manufacturer or reseller to use the same MAC address. Additionally, while in network setup mode (when first unboxed or recently reset, for example), many consumer devices will use the same static IP.

WhatsUp Gold User Guide
60
High Availability networks or sensor arrays. Distributed deployment and architecture patterns on grids (processing or sensor, for example) can use identical addressing for network load balancing between nodes.
Note: Some VPN software clients use a network adapter with a simulated MAC layer and non-unique MAC address. Typically, this addressing is internal at the VPN endpoint and not visible to WhatsUp Gold Discovery.
Device Merge Reason Categories Device merge reasons applied by WhatsUp Gold Discovery fall into one the categories in the following table. Merging occurs during the post processing phase of discovery and can be manually turned off using Address Exceptions (on page 54).
Note: When two device records satisfy the conditions for more than one merge category, the last one evaluated displays in the Merge Decision Information table.
This reason... Indicates this match condition...
IP Address One or more IP addresses match.
IP and MAC Address One or more IP and MAC addresses match.
ipAddressTable Correlation between interface indexes, IP addresses, and MAC addresses in the IP management information.
ifTable Matching management information fields in the interface table.
MAC Address One or more MAC address match.
MAC and System Name One MAC address and one SNMP system name match.
Virtual MAC Simulated MAC layer address used by VMware and Hyper-V match.
Non Virtual MAC Non virtual MAC address match.
NetBIOS Exact NetBIOS name or exact name/domain match for device.
Serial Number Serial number (if available, manufacturer information must also match).
Resource ID Service (such as cloud services) resource ID.

WhatsUp Gold User Guide
61
Managing Detection Categories (Device Roles) Roles and Sub roles Library (on page 62) (similar to "Device Role Settings" in WhatsUp Gold 16.x and 17.0 Console Application) provides a simple workflow for extending how WhatsUp Gold classifies devices detected during discovery and refresh scans. Role determination directly influences a device's default monitor selection.
You can extend and customize the device classification models by adding and editing device roles (on page 89):
Add/Edit Role/Sub Role Wizard (on page 62). Guides you through the new role creation, definition, and monitor selection.
Roles and Sub Roles Library (on page 62). Stores roles and sub roles you create and modify using the Add/Edit Role Wizard (on page 62).
Create a Custom Device Role (on page 77). Demonstrates the steps needed for adding and enabling a custom role within your WhatsUp Gold instance.
Fit Default Roles with Custom Monitors (on page 83). Demonstrates how to extend existing roles with monitoring optimized for your site.
Before You Begin: Access Discovery Permission Needed To use Role Editor features a WhatsUp Gold user needs the Access Discovery permission selected from the User and User Groups library. This is also needed to discover devices. See Administering Users and User Groups (on page 406), for more information.
Tip: After you run Discovery, device group access rights (on page 243) (when provisioned) can affect which discovered items your user can visualize, monitor, and manage from MY NETWORK (on page 85).
Typical Leverage Points Roles and Sub roles Library (on page 62) enables you to:
Enable/disable list of device roles considered for a discovery/refresh. Customize device classification and identification. Create/apply sub roles for monitoring multipurposed systems or hardware. Apply custom monitor lists at discovery or refresh scan time (wrapped in
new/customized role). Configure custom roles to include specific host and system attribute data. Accurately identify and appropriately monitor the vast and varying landscape of
IoT devices.
Note: For a detailed explanation of how device roles work and influence default monitor selection in WhatsUp Gold, see the topic titled About Device Roles (on page 89).

WhatsUp Gold User Guide
62
Roles/Subroles Library Roles/Subroles Library (SETTINGS menu > Libraries > Roles and Sub roles) enables you to customize and extend device role determination. WhatsUp Gold applies a device role when network scans result in the discovery of a new device or refresh of a device already known.
Device Role (on page 89)
Model that WhatsUp Gold uses to predict device capabilities. A device can have only one primary role but multiple sub roles. For example, a device might have a primary role of wireless access point and switch as a sub role
Roles/Sub Roles Wizard (on page 62)
Create or edit roles/sub roles to ensure that WhatsUp Gold applies the appropriate map connectivity links, map icons, device attributes, and finally monitors.
Roles and Sub Roles Library
Create, store, and re-use default role configurations and monitor lists. (Monitor lists are activated as part of the Start/Update Monitoring (on page 52) process.)
Manage roles Add New Role. Create a custom role from scratch. (Create in wizard (on
page 62))
Add New Sub role. Create a custom sub role from scratch. (Create in wizard (on page 62))
Edit. Edit an existing role or sub role. (Open in wizard (on page 62))
Copy. Use an existing role or sub role as a template for your customizations.
Delete. Remove a role or sub role model definition from the library.
Roles/Sub Roles New/Edit Wizard Role Editor Library (on page 62) features a role and sub roles wizard (SETTINGS menu > Libraries > Roles and Sub roles Library [ , ]) used to add and edit the model needed to classify device roles and sub roles (on page 89). Role and sub role assignment determine monitoring and management characteristics for a given device.
Note: Discovery and refresh scan performance can be slower if you apply many new role definitions with large and complex scan rules.
Within the wizard, you can apply the following rules, settings, and characteristics:

WhatsUp Gold User Guide
63
General Settings. Name, select an icon, and provide a weight or 'confidence' for this role classification. Display Name/Role Icon. Role label and customizable icon. Description. Optional description. Describe the purpose for the role. Source. Indicates if role is the same as the built-in role (Default), a variant of the
built-in role (Modified), or entirely user defined (Custom). Weight. Consider this weight or rank of precedence when deciding the most
suitable role choice between two or more role matches. Set as Network Device. Consider this a device that handles or directs network
traffic and add the appropriate performance and interface monitors to it. Scan Rules. Create role-detection rules that delegate device role based on host, system, or management object (MIB) strings, values, and attributes.
Rules tab of the Roles wizard provides building blocks used to build a table of device detection rules. For example, you can combine detection rules to build an expression that excludes and/or checks for specific management objects (SNMP, WMI), system characteristics, or host attribute values.
Tip: As a practical guide for choosing and combining device detection rules, you can browse default rule sets (rules shipped within WhatsUp Gold). You can find more detailed rule sets applied in default sub roles (on page 79).
Add Rule. Apply a rule (on page 70) from the drop down list (you can also choose a negative match of the rule with ).
Edit Rule. Edit a selected detection rule.
Copy. Copy a selected detection rule.
Delete. Remove a selected detection rule.
Important: Creating many role definitions with large rule set expressions can have an impact and slow discovery and refresh scan performance.

WhatsUp Gold User Guide
64
Examples Match UPS manufacturer strings such as "MGE UPS SYSTEMS" or "MGE
Office Protection Systems." SNMP object '1.3.6.1.2.1.33.1.1.1' (upsIdentManufacturer) contains 'MGE' Match specific NETAPP device using the asset tag. SNMP object '1.3.6.1.4.1.789.1.25.2.1.6' (nodeAssetTag) contains '02040'
Suggested Roles. (Sub Roles Wizard only) Consider these roles as candidates for the current sub role definition.
Select a generalized role class to apply (given the conditions of the Scan Rules expression is satisfied).
Add. Add a monitor from the monitors library to this role definition.
Delete. Remove a monitor from this list.
Your role inherits default characteristics from this class such as discovery attributes and default monitors you can modify later.
Associated Sub Roles. (Roles Wizard only) Sub role label(s) to apply based on the rules match.
Select a generalized sub role to apply (given your Scan Rules).
Add. Add a monitor from the monitors library to this role definition.
Delete. Remove a monitor from this list. Attributes. Use system, host, and MIB values as attribute data within WhatsUp Gold.
When you define roles, you can configure your role definition to hold system and host attributes.
Add. Add an attribute using discovery percent variable (on page 855) syntax.
Edit. Edit an attribute.
Delete. Remove an attribute from this role definition. Restore System Default. Reduce attribute list to the default based on the
suggested role.
Note: Host and system attributes can be viewed from device properties (on page 86) and viewed, scheduled, and distributed as Attribute Reports (on page 456).
Examples Device Location

WhatsUp Gold User Guide
65
%Discovery.Device.Location Detected Operating System. %Discovery.Device.OS
Custom Links. (Roles Wizard only) Associate web-browsable resources with this device.
Define a custom link and apply it to the discovered device. You can customize for each device using discovery percent variable (on page 855) syntax.
Add. Add a custom link.
Edit. Edit a selected custom link.
Delete. Remove the link.
Note: Custom Links can be tabulated and distributed as Custom Link reports.
Examples Add link for viewing web role or web service running on current device.
http://%Discovery.Device.Name.example.com:80
Add link to manage vCenter using vSphere web client.
https://%Discovery.Device.Name.example.com:9443/vsphere-client
Monitors. Delegate WhatsUp Gold monitors to associate with this role when you add monitoring (on page 52).
Use the Monitors tab in the Roles and Sub roles Wizard (SETTINGS menu > Libraries > Roles and Sub roles Library) to configure the initial monitor list designated as part of network discovery.
Tip: Monitors associated with a device as part of network discovery are typically designated in a sub role definition for a device type. The monitors list for the Switch sub role (shown here) is a good example of this case.

WhatsUp Gold User Guide
66
Device Role Monitor Tab Use the Monitors tab in the Roles and Sub roles Wizard to control:
Monitors WhatsUp Gold designates for devices during discovery. (Designated monitors are activated later when you Add Monitoring (on page 52).)
Interface(s) WhatsUp Gold designates monitors for (using Filters and application rules).
Interface(s) WhatsUp Gold defers monitors for (using Filters and application rules).
Device role monitor view controls include:
Add. Add a monitor from the monitors library to this role definition.
Delete. Remove a monitor from this list. Restore System Default. Reduce monitor list to the default based on the
suggested role. Filter Library. Build rule sets (on page 75) to refine the range and scope of
devices considered for a particular filter.
Designate Priority and Conditions Use these controls to pre-determine key (critical) monitors, opt to use soft (check support first) or hard (always apply) monitor designation and to apply advanced or custom filtering (on page 75).
Critical. Monitors you designate as critical monitors denote the overall device is
in a down state if the monitor is down. Application Rule. Designate a condition or check for support before applying
the monitor to a given device. Filter. (Typically used for network interfaces) Select a filter mode: Operationally
Up Interfaces or All Interfaces.
Note: For interface ports, Operationally Up means that the port is in a running state and not in a non-operational state (such Testing, Unknown, or Down).
Tip: You can create custom filters with the Filter Library (on page 75).

WhatsUp Gold User Guide
67
Action Policy. (Roles Wizard only) Associate device role(s) with policies that sequence and bundle next steps for triggered thresholds, observed monitor state changes, and cascading events.
Action Policies bundle Actions and Notifications. Actions and Notifications are typically triggered by a condition or threshold observed by a monitor. You can combine Action and Notification building blocks as a way to implement a policy that governs selected devices and device roles (on page 89).
In WhatsUp Gold Action Policies typically trigger any of the following:
Simple notifications (on page 260) (e-mail, SMS, log). Corrective measures (such as remote script execution payload, configuration
rollback, reboot, and so on). Some combination of corrective measures and notifications.
Examples of site actions bundled to implement action policies might be:
Notifying application management engineers when production devices transition state (for example from maintenance mode to up)
Applying approved configuration to a device found out of compliance (a default password is detected, anomalous port opened or traffic detected)
"Activating" (reconfigure and restart) a backup host device whenever a primary fails
Restarting "non-responsive" critical services (an FTP or log server, for example)
Note: You can also create and apply powerful policies which enforce configuration record versioning and device configuration alignment using WhatsUp Gold Configuration Management policies (on page 321).
Creating Action Policies Begin by creating a list or matrix of critical state change events, appropriate actions, and the chain of responsible individuals for your site.
Example: Device Recovery Matrix
Policy: Internal Service Level Agreement
Device recovery actions The following matrix shows the sequence of WhatsUp Gold managed controls (thresholds and states coupled with actions) rolled into an example action policy called "Internal Service Level Agreement."

WhatsUp Gold User Guide
68
Event Actions Notification
Device crash and reboot or forced reboot after n seconds.
Run recovery action scripts.
Verify network (NIC) connectivity.
Verify application service connectivity.
If application service verification fails, trigger failed web service role policy.
Data center team notification.
On call services engineers notification.
Notification attachments
Event log report.
Follow on with availability reports.
Failed web service role policy.
(No response or after n milliseconds to application service active monitors from WhatsUp Gold pollers.)
Remove web service role endpoint from the "load balancer" configuration.
Add to WhatsUp Gold maintenance mode.
Data center team notification.
On call services engineers notification.
Product owner notification with availability reports.
Failed node.
Symptoms: External NIC or management NIC not responding, remote execution failure, remote write failure, kernel panic.
Run failed node recovery action.
Data center team notification.
Notify closest data center engineer.
1 Create an Action type from the Actions Library.
Example: Test Connectivity/Remote Execution
1 Click the new button, then select PowerShell (for Linux/UNIX, select SSH).
2 Add syntax for remote login to the device in the script text box.
2 Create the Action Policy. Example: Combine with Notification Schedule and Roll Test into Action Policy
Add a notification action you created according to your site's notification hierarchy.
Add the PowerShell action you created.
General Settings Display Name/Role Icon. Role label and customizable icon. Description. Optional description. Describe the purpose for the role.

WhatsUp Gold User Guide
69
Source. Indicates if role is the same as the built-in role (Default), a variant of the built-in role (Modified), or entirely user defined (Custom).
Weight. Consider this weight or rank of precedence when deciding the most suitable role choice between two or more role matches.
Set as Network Device. Consider this a device that handles or directs network traffic and add the appropriate performance and interface monitors to it.
Building Rule Sets for Device Detection Rules tab of the Roles wizard provides building blocks used to build a table of device detection rules. For example, you can combine detection rules to build an expression that excludes and/or checks for specific management objects (SNMP, WMI), system characteristics, or host attribute values.
Tip: As a practical guide for choosing and combining device detection rules, you can browse default rule sets (rules shipped within WhatsUp Gold). You can find more detailed rule sets applied in default sub roles (on page 79).
Add Rule. Apply a rule (on page 70) from the drop down list (you can also choose a negative match of the rule with ).
Edit Rule. Edit a selected detection rule.
Copy. Copy a selected detection rule.
Delete. Remove a selected detection rule.
Important: Creating many role definitions with large rule set expressions can have an impact and slow discovery and refresh scan performance.
Examples Match UPS manufacturer strings such as "MGE UPS SYSTEMS" or "MGE
Office Protection Systems." SNMP object '1.3.6.1.2.1.33.1.1.1' (upsIdentManufacturer) contains 'MGE' Match specific NETAPP device using the asset tag.

WhatsUp Gold User Guide
70
SNMP object '1.3.6.1.4.1.789.1.25.2.1.6' (nodeAssetTag) contains '02040'
Device Scan Rules Scan rules fall into the following categories:
Virtualization characteristics. VMware and Hyper-V. Management object checks. WMI or SNMP information. Match all. Always evaluate rule expression to true. Active TCP ports. Check if TCP connection can be initiated. Hostname. Check system hostname. Functional category. Basic role (bridge, firewall, hub ... unknown) Information set checking. Checks temporary XPATH-like objects used by
Discovery (on page 70).
Querying Management Objects and Infosets When crafting scan rule sets (on page 69) for device role detection, there can be discovery performance benefits to querying information sets (also referred to as infosets). However, for completeness of information, role detection rules that query WMI/SNMP directly are best. This section describes the differences between these two methods within the context of device role and sub role determination.
Important: Building and using a role detection rule that can query an incomplete infoset will affect the accuracy of role determination. For example, it can lead to a 'false negative' for cases when Discovery checks an infoset for a value before it can be fetched by SNMP or WMI.
Tip: When your scan rule checks for a value or field using SNMP/WMI, WhatsUp Gold Discovery associates it with an infoset. So, querying the infoset in subsequent rules (if necessary) rather than duplicating SNMP/WMI calls can be helpful when scanning large scale networks.
Scan rules that apply queries to infosets are different than other queries because:
Infosets are temporary structures used by discovery. Scan rules that query infosets are actually inspecting data cached as part of the
current discovery scan (no network call). Scan rules that query management objects (WMI/SNMP) make a network call to
the device. WhatsUp Gold populates infosets as the current discovery progresses, so not all
complimentary information are present at intermediary points in the scan. For example, attributes related to child/parent relationships are not guaranteed to be there.

WhatsUp Gold User Guide
71
How can I query infosets? Infosets are internal structures leveraged by WhatsUp Gold that are partially exposed for extending discovery support. You can find the best examples for using infosets by viewing scan rules for system sub roles.
Information Set Scan Rule Defined within Dell Storage Center Sub Role
Example Scan Detection Rules that Use Infosets (Cisco Meraki sub role rule group shown)
Queryable Parts of an Infoset Infosets leverage a namespace or tree-like structure. You can use scan rules within a role or sub role definition to query the following infoset parts:
Name. ID, root element of the infoset. Name part of a name/value pair. Value. Paired value for ID. Infoset Path. Typical paths used for a given infoset name that is in practical
use.
The following table outlines parts of infosets exposed for discovery performance optimizations.
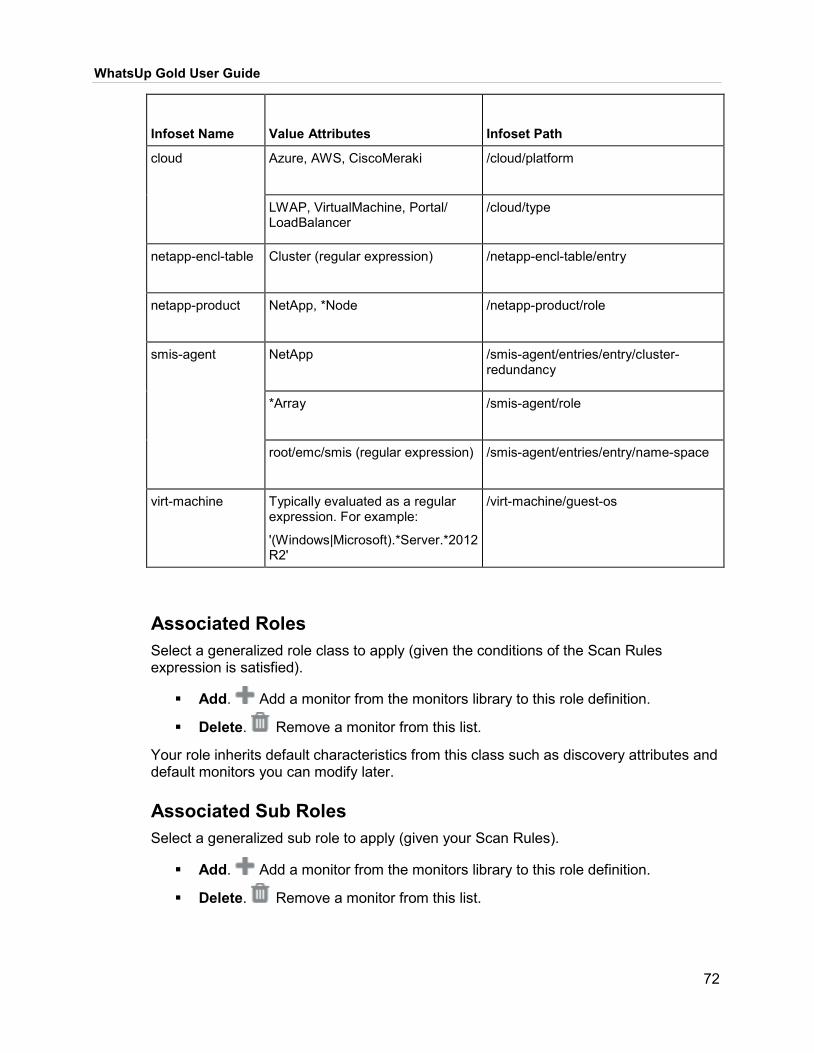
WhatsUp Gold User Guide
72
Infoset Name Value Attributes Infoset Path
cloud Azure, AWS, CiscoMeraki /cloud/platform
LWAP, VirtualMachine, Portal/ LoadBalancer
/cloud/type
netapp-encl-table Cluster (regular expression) /netapp-encl-table/entry
netapp-product NetApp, *Node /netapp-product/role
smis-agent
NetApp /smis-agent/entries/entry/cluster-redundancy
*Array /smis-agent/role
root/emc/smis (regular expression) /smis-agent/entries/entry/name-space
virt-machine Typically evaluated as a regular expression. For example:
'(Windows|Microsoft).*Server.*2012 R2'
/virt-machine/guest-os
Associated Roles Select a generalized role class to apply (given the conditions of the Scan Rules expression is satisfied).
Add. Add a monitor from the monitors library to this role definition.
Delete. Remove a monitor from this list.
Your role inherits default characteristics from this class such as discovery attributes and default monitors you can modify later.
Associated Sub Roles Select a generalized sub role to apply (given your Scan Rules).
Add. Add a monitor from the monitors library to this role definition.
Delete. Remove a monitor from this list.

WhatsUp Gold User Guide
73
Attributes When you define roles, you can configure your role definition to hold system and host attributes.
Add. Add an attribute using discovery percent variable (on page 855) syntax.
Edit. Edit an attribute.
Delete. Remove an attribute from this role definition. Restore System Default. Reduce attribute list to the default based on the
suggested role.
Note: Host and system attributes can be viewed from device properties (on page 86) and viewed, scheduled, and distributed as Attribute Reports (on page 456).
Examples Device Location %Discovery.Device.Location Detected Operating System. %Discovery.Device.OS
Monitors Use the Monitors tab in the Roles and Sub roles Wizard (SETTINGS menu > Libraries > Roles and Sub roles Library) to configure the initial monitor list designated as part of network discovery.
Tip: Monitors associated with a device as part of network discovery are typically designated in a sub role definition for a device type. The monitors list for the Switch sub role (shown here) is a good example of this case.
Device Role Monitor Tab Use the Monitors tab in the Roles and Sub roles Wizard to control:

WhatsUp Gold User Guide
74
Monitors WhatsUp Gold designates for devices during discovery. (Designated monitors are activated later when you Add Monitoring (on page 52).)
Interface(s) WhatsUp Gold designates monitors for (using Filters and application rules).
Interface(s) WhatsUp Gold defers monitors for (using Filters and application rules).
Device role monitor view controls include:
Add. Add a monitor from the monitors library to this role definition.
Delete. Remove a monitor from this list. Restore System Default. Reduce monitor list to the default based on the
suggested role. Filter Library. Build rule sets (on page 75) to refine the range and scope of
devices considered for a particular filter.
Designate Priority and Conditions Use these controls to pre-determine key (critical) monitors, opt to use soft (check support first) or hard (always apply) monitor designation and to apply advanced or custom filtering (on page 75).
Critical. Monitors you designate as critical monitors denote the overall device is
in a down state if the monitor is down. Application Rule. Designate a condition or check for support before applying
the monitor to a given device. Filter. (Typically used for network interfaces) Select a filter mode: Operationally
Up Interfaces or All Interfaces.
Note: For interface ports, Operationally Up means that the port is in a running state and not in a non-operational state (such Testing, Unknown, or Down).
Tip: You can create custom filters with the Filter Library (on page 75).

WhatsUp Gold User Guide
75
Filter Library Extend default filters or create custom filters from scratch using the Filter Library.
Add. Add a new filter (on page 75) you can apply from the Role/Sub Role's monitor list.
Edit. Edit a filter (on page 75) or extend a default filter you can apply from the Role/Sub Role's monitor list.
Delete. Remove a filter.
Note: For details on how to build a custom monitor selection filter, see the Add/Edit Filter (on page 75) topic.
Add/Edit an Interface Filter Roles can be pre-configured to use Active Monitors when conditions you select match or evaluate to true. You can filter on operational state, administrative state, regular expression matches, and much more.
Important: While Active Interface Monitor Filters help to identify which roles warrant a particular monitor, Role Monitor Apply Rules (Apply Always, Check Support) have a deciding influence.
Filter Groups Single or combined filter groups can be used. For example, you can simply filter on any combination of two operational states (let's say Operationally up and Administratively down) within a single group. Or, for example, you could use that criteria in combination with another group, let's say Interface Type, where Interface Type equals Fast Ethernet or Ethernet. Values within groups are ORed together (any can be true) but if you have more than one group, group expressions evaluate together as ANDs (criteria for each group must be true to be considered a match).
Available Filter Group... Applies Filters
Operational Status Match a single or any of the selected operating states.
Interface Type Look for the SNMP MIB ifType value as defined by https://www.iana.org/assignments/ianaiftype-mib/ianaiftype-mib.

WhatsUp Gold User Guide
76
Port Index Match the physical port position on the device.
Interface Speed Network interface speed. (This value is typically the nominal speed of the network interface.)
Regular Expression Match all or a substring of the derived or configured interface name or description.
Example WhatsUp Gold interprets the following Monitor Filter and delegates monitors to:
Given the condition that "they" (in this case detected Interface Types) have an operational status of "link up" (Operationally up)...

WhatsUp Gold User Guide
77
Delegate monitoring to any of the selected Interface Types (Ethernet, Fast Ethernet, Gigabit Ethernet)
Create a Custom Device Role The steps for creating a custom device role in WhatsUp Gold include:

WhatsUp Gold User Guide
78
Step 1: Clone an existing role (on page 79)
Copy a Default device role from the library that is close in function and monitoring objectives as the new target role.
Consider the following guidelines:
It is easiest to take an existing role or sub role (on page 62) as a starting point for your new role. A sub role similar to the custom role you envision enables you to re-use scan rules (on page 69) and its monitor list, sometimes with very little editing. Modifying Default roles from the same functional category often enables you to re-use SNMP module identifiers and enterprise MIB tables sought out by scan rules. If you clone a Default role/sub role, your new Custom role's weight of classification is much greater than the Default value. In other words, Custom roles take precedence over Default roles. (You can adjust weighting later, if needed.)
Tip: For hints and guidance on Discovery Scan classification and monitor lists, look at device sub role definitions in the Role and Sub Role Library.
Step 2: Refine scan rules (on page 79)
Refactored scan rules enable WhatsUp Gold Discovery to detect and classify your target device.
Tip: After you refactor scan rules, run your new scan on a small but representative sample to see how new detection rules and role definitions work with Default roles.
Step 3: Enable the role
Enable the role within the Role and Sub Role Library (on page 62).
Step 4: Discover Run a discovery scan (on page 48) or rescan to test your role definition.
Step 5: Customize (on page 83)
Add monitors, create custom monitors, and apply as needed.

WhatsUp Gold User Guide
79
Clone a Device Role When creating custom device roles, browse and begin with a Default device role that you can learn from and modify.
In most cases you will want to re-use the following from the default role that you clone:
Device Scan Rules. For example, scan rules are similar for devices that share the same functional category or root MIB objects (OIDs).
Monitors List. While you will be able to use some monitors such as Ping without any modifications, other monitors provide you hints of which indicators you should watch from custom SNMP or WMI monitors.
Example: Create a custom UPS sub role WhatsUp Gold Provides a role for discovering and monitoring APC brand UPS devices. This example uses this role as a starting point for discovering and monitoring other UPS brands.
1 Open Roles / Sub Roles Library (on page 62), Select the UPS sub role, and click
'copy' . WhatsUp Gold adds a new sub role to the library named Copy of UPS.
2 Select the sub role you created, click 'edit' , and add a new name. For example:
3 Next, edit sub role's scan rules and monitor list (on page 79).
Refine Scan Rules When reusing scan rules from a similar sub role, typical approaches include:
Replace enterprise OID part. In most cases, you can adapt existing rules to detect similar devices of a different brand simply by changing the enterprise part of the MIB OID.
Management protocols such as SNMP provide a reliable means to access device manangement information. Most role definitions check or test for the presence of:
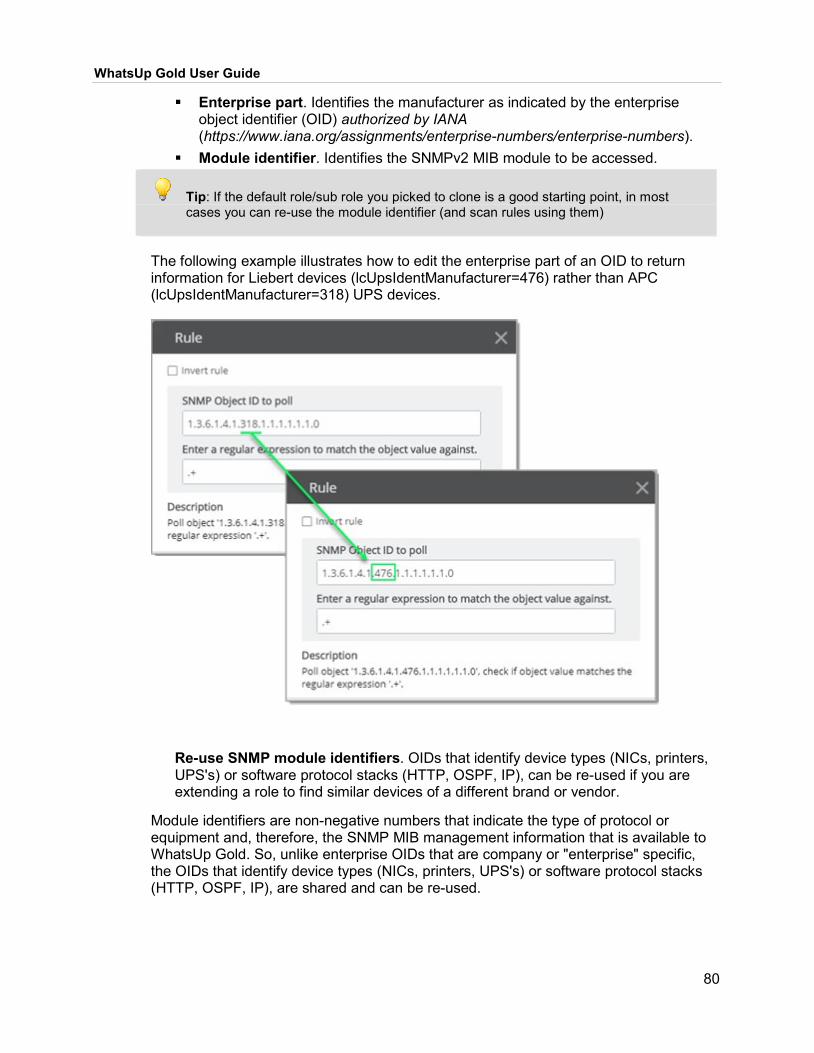
WhatsUp Gold User Guide
80
Enterprise part. Identifies the manufacturer as indicated by the enterprise object identifier (OID) authorized by IANA (https://www.iana.org/assignments/enterprise-numbers/enterprise-numbers).
Module identifier. Identifies the SNMPv2 MIB module to be accessed.
Tip: If the default role/sub role you picked to clone is a good starting point, in most cases you can re-use the module identifier (and scan rules using them)
The following example illustrates how to edit the enterprise part of an OID to return information for Liebert devices (lcUpsIdentManufacturer=476) rather than APC (lcUpsIdentManufacturer=318) UPS devices.
Re-use SNMP module identifiers. OIDs that identify device types (NICs, printers, UPS's) or software protocol stacks (HTTP, OSPF, IP), can be re-used if you are extending a role to find similar devices of a different brand or vendor.
Module identifiers are non-negative numbers that indicate the type of protocol or equipment and, therefore, the SNMP MIB management information that is available to WhatsUp Gold. So, unlike enterprise OIDs that are company or "enterprise" specific, the OIDs that identify device types (NICs, printers, UPS's) or software protocol stacks (HTTP, OSPF, IP), are shared and can be re-used.

WhatsUp Gold User Guide
81
Check logic within and between rule groups. When you copy a Default role, understand that by design they are generalized and use quick and simple 'match-any' evaluation (any one rule in a group can nominate the role). When you add scan rules that are more specific (let's say for a specific device brand), you will need to adjust your rule groups.
As you create custom monitors, compare and check evaluation logic to those used in Default roles. Make adjustments where needed.
The following infographic contrasts scan rules from a Default UPS with scan rules adapted for a Custom role.
Rule Meanings Result Observed when Rule is True...
A Default UPS sub role scan-rule group that matches on any device detected with a populated SNMP v2 UPS module OR any device that satisfies the discovery criteria for the default functional category of "UPS."
The device will be identified as a UPS and have basic monitoring enabled. If the device is an APC brand, the APC-specific monitors (which happen to be part of the default role's monitoring list) will be applied.
A Default UPS sub role rule that checks for an enterprise MIB object with the value "318" (the vendor ID for APC).
The device will be identified as an APC brand UPS and have both basic and vendor specific monitoring applied.
Custom UPS sub role scan rules chained together by Boolean AND operators (match-all-rules). Checks first that SNMP MIB module for UPS exists on the device, then checks for the vendor ID that identifies the device as Liebert ("476").
The device will be identified as a Liebert brand UPS and have both basic and vendor-specific monitoring applied.
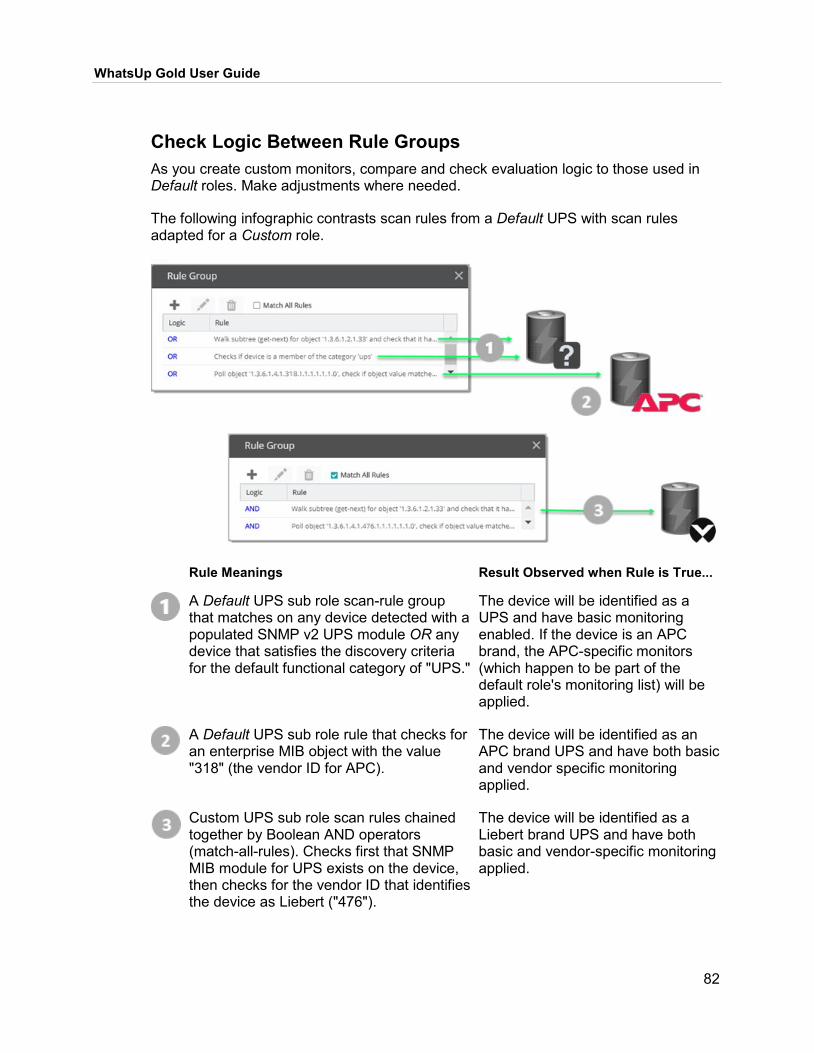
WhatsUp Gold User Guide
82
Check Logic Between Rule Groups As you create custom monitors, compare and check evaluation logic to those used in Default roles. Make adjustments where needed.
The following infographic contrasts scan rules from a Default UPS with scan rules adapted for a Custom role.
Rule Meanings Result Observed when Rule is True...
A Default UPS sub role scan-rule group that matches on any device detected with a populated SNMP v2 UPS module OR any device that satisfies the discovery criteria for the default functional category of "UPS."
The device will be identified as a UPS and have basic monitoring enabled. If the device is an APC brand, the APC-specific monitors (which happen to be part of the default role's monitoring list) will be applied.
A Default UPS sub role rule that checks for an enterprise MIB object with the value "318" (the vendor ID for APC).
The device will be identified as an APC brand UPS and have both basic and vendor specific monitoring applied.
Custom UPS sub role scan rules chained together by Boolean AND operators (match-all-rules). Checks first that SNMP MIB module for UPS exists on the device, then checks for the vendor ID that identifies the device as Liebert ("476").
The device will be identified as a Liebert brand UPS and have both basic and vendor-specific monitoring applied.

WhatsUp Gold User Guide
83
Fit Default Roles with Custom Monitors This topic shows you the best and shortest path to leverage WhatsUp Gold Device Roles and Sub Roles. When you extend your "default roles" (roles that ship with WhatsUp Gold), consider the following:
Understand the 'functional category' approach. Default roles use scan rule sets (on page 69) that identify all devices of a functional category (for example: server, bridge, firewall, printer, UPS, ...).
Add vendor-specific monitors. While Discovery catches all devices within a particular functional category, vendor-specific monitors enable Discovery to sift through the functional category matches and apply vendor-targeted monitoring capability.
Don't change default scan rules. Leaving functional category scan rules in place enables you to catch the rest of your devices (you can always apply vendor-specific monitoring to these at a later time).
Recognize Role Candidates with Generalized Scan Rules + Validate with "Custom" (Vendor-specific) Monitor Definitions From within a WhatsUp Gold Sub Role definition, it is easy to take a default device role and extend it to be vendor-specific. To do this, simply add vendor-specific monitors to the default role's monitoring list. In practice, given the appropriate scan credentials, this customization enables WhatsUp Gold to harvest more candidates for discovery while enhancing the information returned from the device and the range and scope of monitoring applied.
Most importantly, this approach enables you to keep your scan rules simple. It allows you to keep customizations and future tweaks isolated within the vendor-specific monitor configurations (rather than the WhatsUp Gold scan rules and device role).
About default roles Several default device roles cast a wide-net, platform-agnostic approach by identifying devices and applying monitors based on their functional category. To extend this capability to be vendor specific, you can create and add and curate candidate monitor lists that reflect your site's reliability objectives and adapt to environments with mixed protocols, hardware, and software vendors. This is possible because WhatsUp Gold applies these monitors to the current device only when Discovery can determine they are appropriate and supported by the device's current configuration.
Tip: Ensure you have the necessary credentials in the credential list for your scan. This example leverages how the Discovery process only applies monitors when they are appropriate to the current device.
Example: Extend default roles with vendor-specific monitoring The following visual shows a default sub role that was extended. It was extended using active monitors (on page 111) created with the Monitoring Library (on page 106) (shown in underline in the Monitors list —TrippLite UPS, Liebert Micro UPS, ...). The active

WhatsUp Gold User Guide
84
monitors were built to be vendor-specific using the SNMP Extended (on page 136) monitoring type (not shown). When you extend a default sub role in WhatsUp Gold the Source category changes from System to Modified.
This example adds vendor-specific monitoring to default roles.
Step 1: Pick a default role or sub role to extend.
Consider the following:
The scan rules should be generalized enough to detect (and not exclude) devices of varying vendor types.
Unlike creating Custom roles (on page 77), you should not modify the scan rules (after all, it's unneeded).
Step 2: Add custom monitor lists. (with Check Support First selected)
Consider the following:
SNMP Extended (on page 136) and WMI Formatted (on page 147) active monitors enable you to group management objects. They provide a nice way to build vendor-specific monitors based on management objects observed at the device, grouped by severity and service level priority.
SNMP Extended (on page 136) and WMI Formatted (on page 147) active monitors (and many others) provide MIB or management object browsers that enable you to browse the objects on the device or type of device you want to monitor.
Within the role/sub role where you include them, monitors should have the Check Support First option selected. (This enables monitors to be applied only if Discovery can check that monitoring properties are supported by the device).
Step 3: Enable the role.
Enable the role within the Role and Sub Role Library (on page 62).
Step 4: Discover. Run a discovery scan (on page 48) or rescan to test that vendor specific monitors are applied as part of your modified default role definition.

85
CHAPTER 5
Device Management In This Chapter Device Properties ................................................................... 86
Device Status ....................................................................... 105
Managing and Assigning Monitors ........................................ 106
Device Management Actions ................................................ 179
Poller Configuration .............................................................. 185
Built-in Action Types ............................................................. 190
Selecting an Action Type ...................................................... 211
Select a State Change .......................................................... 212
Select Action and State......................................................... 212
Guidelines for Creating Action Policies ................................. 213
Working with credentials ....................................................... 215
Device groups ....................................................................... 242
This section outlines how to manage a selected device in My Network (on page 20) view:
Understanding Device Status Indicators (on page 247). Useful table/legend of the colors and conventions used throughout WhatsUp Gold to indicate device health.
Applying monitors (on page 106). Apply monitors in bulk or apply individually from Device Properties (on page 86).
Configuring and applying alerts, policies, and notifications (on page 252). Build and chain models for incident handling and notification sequencing.
Defining device groups, setting dependency chains, and applying individual and bulk settings (on page 179).
Creating users, user groups, and applying information access controls (on page 406) to device information and monitoring data.
Use built-in lookup, trace, ping, and MIB query/browser tools (on page 181).
Tip: See the topic titled Getting Started (on page 28) if this is your first time applying performance, availability, and management controls using WhatsUp Gold.
WhatsUp Gold User Guide
86
Device Properties Device Properties panel ( ) is the central management/information point for any single managed device. It's the interface you leverage when bulk operations or group information (report data, for example) are not appropriate for your management task. Use Device Properties to apply changes, troubleshoot, and check configuration properties for any single device.
WhatsUp Gold User Guide
87
Device Configuration. Control how your device is monitored, managed, and represented within WhatsUp Gold. (Includes roles determination as well as network and hardware information used to identify monitor selection and device boundaries).

WhatsUp Gold User Guide
88
Monitors. Browse, apply, and configure passive, active, and performance monitors to this device. Active. Check availability, simulate user or exercise services or
APIs, and return up or down indicator. Passive (on page 150). Check for specific logged or trapped
event. Performance (on page 153). Measure performance statistics
and trigger alerts and actions based on thresholds.
Note: The grid on the Monitors tab is filtered by default to only show monitors assigned to the device that are currently enabled. To display all assigned monitors, hover your cursor over the Enabled column header, click the drop-down arrow that appears, then clear the applied filter from the options displayed.
Tip: You now have the ability to specify the protocol by which WhatsUp Gold collects CPU, Disk, Memory, and Interface utilization data from the device. From the Monitors tab, select the applicable
monitor, click , then select the desired protocol for collecting performance data at the top of the configuration dialog.
Learn More Monitor Precedence (on page 110). Monitor Types (on page 105). Complement Device Monitoring with NetFlow (NTA) (on page
346).
Tip: In WhatsUp Gold, a given device is considered to be in a down state if it has either a critical monitor down or all monitors down.
Polling. Adjust polling interval, target address, and dependency chain. Polling Interval. Determines how frequently WhatsUp Gold
fetches observations from this device. Poll Using. Select an IP address for a particular interface or
resolve to a specific DNS hostname. Maintenance. Drop the managed device to maintenance mode
and specify a date and time for the maintenance period to end without further end-user interaction, if desired. (Useful mode and marker in reports and for SLA accounting.)
[Polling Up/Down Dependency]. Poll based on the status of another device or resolved host.
Tip: If you need to apply a shorter poller interval either temporarily, or for troubleshooting performance, consider using the RealTime Performance monitor (on page 788).
Note: In WhatsUp Gold, a given device is considered to be in a down state if it has either a critical monitor down or all monitors down
Schedule Recurring Maintenance Times (on page 104)
System Status and Properties. View host properties, device role classification and status information.

WhatsUp Gold User Guide
89
Keep Details Current. Refresh host and system properties upon device rescan.
Display Name. The computer name assigned to the device. Host Name. Edit hostname (if different than when populated at
discovery, for example). IP Address. (Configure identifying strings for the NIC. Choose
polling by way of DNS or IP address.) OS. Host Operating System. Brand. Platform/Virtual Platform. Role. Role classification of this device. Role classification
determines default credentials used and monitoring schedule applied.
Device Picker, Actions, and Status Reports. Apply operations, get status, and troubleshoot network connectivity for this device.
Device Status (on page 417) . Exit to Device Status (on page 417) dashboard.
Refresh . Refresh Device Properties (on page 86) data.
Device Management Actions (on page 179) . Troubleshoot/perform management operations.
[Other operations]. Rescan, Copy, Poll, drop to Maintenance Mode.
Tools (on page 181). Gather information and troubleshoot: Traceroute, DNS Lookup, Task Manager, Ping, or check ARP cache of neighboring devices (Address Finder).
Tip: Tabs displayed in the device center are dependent upon the device role and information gathered during discovery and do not appear if not applicable to the selected device.
About Device Roles Each device discovered by WhatsUp Gold is assigned a single primary role and multiple sub roles based on data gathered from that device during the discovery scan. Roles assigned during discovery determine which monitors and attributes are assigned to the device automatically, and which actions are available for use. Additionally, role assignments affect what devices and associated icons the map views display when

WhatsUp Gold User Guide
90
filters are applied as well as Layer 2 dynamic group membership and may affect certain overlay-specific behavior such as wireless or virtual.
While WhatsUp Gold determines the most appropriate roles based on information received from the device itself, you can modify the primary role assignment by clicking Change Role in Device Properties, then selecting from the list of available roles and descriptions that appears. The ability to change the primary role and/or sub roles can be beneficial if a device serves a different purpose or performs multiple functions within your network. That is, WhatsUp Gold may assign a primary role based on a device's assumed function when it is actually being used for a different reason within your network environment. For example, you can monitor a wireless infrastructure device that could be potentially be used as a wireless controller, a router, switch, or similar in which case, it may benefit you to change its role in WhatsUp Gold to more accurately reflect its actual function.
If you modify any roles assigned to a device, new monitors are not automatically applied based on the new roles. However, the monitors associated with the role determined by WhatsUp Gold during discovery will be reapplied if you:
Update the device by clicking Update Monitoring from the information card on the Discovered Network map (on page 19).
Request updated information from the device by selecting Refresh Device Details from the actions menu. Please note, assigned credentials are used to refresh device details. If credentials or other configuration details for the device have changed since the previous refresh, the most appropriate primary role determined by WhatsUp Gold during discovery could be different depending on what modifications were made to the device configuration since the last time device details were refreshed. As a result, new monitors may also be applied to match the updated role.
If you have modified any monitors and/or attributes for the device, performing these functions neither removes, disables, or re-enables monitors, nor do they update attributes.
Tip: You can customize the default WhatsUp Gold configuration for device roles or create new roles based on your specific network monitoring needs using the Roles and Subroles Library (on page 61).
About Device Dependencies By default, WhatsUp Gold polls all of the devices and active monitors on your Device List, often creating unnecessary overhead by polling devices whose state could be assumed based on the status of other devices. The dependency feature reduces polling overhead in these cases by allowing you to create conditions under which a device will not be polled. These conditions determine if a dependent device is to be polled based on the state of another device which is the target of the dependency. The state of the target device is determined by the state of one or more of its active monitors. You can establish dependencies on either the up or down states of these active monitors, resulting in Up dependencies, or Down dependencies.

WhatsUp Gold User Guide
91
Up Dependencies An up dependency establishes a condition so that a device is polled only if the selected active monitors on a second device are in the up state. The device can be thought of as being “behind” the device to which it has a dependency, so that it will only be polled if the device "in front" of it is up.
Example In this example, an active monitor has been configured for each of the devices, and is denoted using Ping (device_name). Without dependencies, WhatsUp Gold attempts to poll the Ping monitors on the hosts even if the switch has been powered down, or is otherwise unreachable. This situation results in network and system overhead that could be avoided by creating up dependencies on the hosts.
By adding an up dependency on each host so that the polling of the hosts is dependent on the Ping monitor on Switch N being up, denoted Up Dependency: Switch N (Ping Monitor), you create the condition where WhatsUp Gold discontinues polling the hosts when Switch N is powered down or otherwise unavailable to the Ping(Switch N) monitor. This reduces the overhead required to monitor the dependent host devices, while providing information about their accessibility based on the accessibility of Switch N.

WhatsUp Gold User Guide
92
Down Dependencies
Important: If you use the Application Management feature and have components that include WhatsUp Gold devices with dependencies, be aware that components honor both WhatsUp Gold Unknown and Maintenance device states as Unknown states. Therefore, if a WhatsUp Gold device goes into an Unknown or Maintenance state, the component will change to an Unknown state.
A down dependency establishes a rule so that a device is polled only if the selected active monitors on a second device are in the down state. The device can be thought of as something is “in front of” the device to which it has a dependency. The dependent devices in front will not be polled unless the device further down the line is down.
Example In this example, a network segment has a group of devices, each with a dependency on another for its connectivity. Each of these devices has a Ping monitor used to determine the state of the device, denoted Ping (device). If Host A can be pinged from another network segment, then it can be assumed that Router R, and Switch N are up and available, so to operate separate ping monitors on these devices creates unneeded overhead as long as Host A is up. However if Host A is powered down, or otherwise unreachable by the Ping monitor, we must rely on the Ping (Switch N) and Ping (Router R) monitors to ensure that these devices are up and accessible.
Adding a down dependency on Switch N to the Ping monitor on Host A, Down Dependency: Host A (Ping Monitor), and a down dependency on Router R to the Ping monitor on Switch N, Down Dependency: Switch N (Ping Monitor), creates a chain of dependencies that will monitor the network segment and reduce the active monitors that must operate on the segment when it is fully operational.
With these dependencies added, if Ping (Host A) should go into a down state, the down dependency on Switch N will cause WhatsUp Gold to begin polling Switch N. If the polling of Switch N is successful, it will continue to be polled until Host A is recovered. However, if Switch N is also unreachable and Ping (Switch N) goes into a down state, the down dependency on Router R will cause WhatsUp Gold to begin

WhatsUp Gold User Guide
93
polling Router R. When Ping (Switch N) returns to an up state, Router R will no longer be polled. Likewise when Ping (Host A) returns to an up state, Switch N will no longer be polled.
Down dependencies and the "assumed up" state A down dependency on a device can lead to an "assumed up" state, where a monitor on the dependent device indicates that it is up, regardless of its actual state.
This condition occurs when the dependent device is in an inactive state, and is able to respond to an echo request from a ping of the device. Because of the down dependency, the dependent device is not being polled and is "assumed up", yet the actual state of the monitored service or process is unknown, and may have even failed.
An example of the dependent system would be a passive, or standby server, in support of a high-availability (HA) database cluster that has a down dependency on the active server. If the database management system (DBMS) on the standby server fails to start on a reboot, WhatsUp Gold will not show this failure until the active server fails and the standby server is polled.
Viewing dependencies There are two methods by which to see configured dependencies:

WhatsUp Gold User Guide
94
1 Dependency connectors can be seen between applicable device nodes on the map in the form of dashed arrows. Green arrows indicate Up dependencies and red arrows indicate Down dependencies.

WhatsUp Gold User Guide
95
2 Dependency configurations can be reviewed by accessing either the Up or Down
Dependency Editor dialogs from the Polling tab of the Device Properties interface. Note, these dialogs are also accessible directly from the device management actions menu launched by right-clicking on a device node.
Device Merge Decision Information WhatsUp Gold uses discovery-time rule sets in order to understand device boundaries. Properties that identify a device as a distinct entity include MAC address, network address, SNMP System Name, and NetBIOS characteristics. As Discovery harvests device information, these device-distinguishing characteristics help WhatsUp Gold to recognize and merge device records belonging to a single physical or virtual device.
Note: For special environments, you can provide hints to WhatsUp Gold to override normal device record merging using Address Exceptions (on page 54).
Viewing Device Record Merge History You can view device record merge activity as a:

WhatsUp Gold User Guide
96
Last merge summary. Select a device on the Discovery Map (on page 19) and expand Merge Information on the Discovered Network Device Card (on page 250).
Merge table (previous n merges). Either click Previous Merges from Merge
Information or select a device on the Network Map, click Device Properties (on page 86) ( ), click the Inventory tab, and from the drop down list, choose Merge.
Monitors. Browse, apply, and configure passive, active, and performance monitors to this device. Active. Check availability, simulate user or exercise services or APIs, and return
up or down indicator. Passive (on page 150). Check for specific logged or trapped event. Performance (on page 153). Measure performance statistics and trigger alerts
and actions based on thresholds.
Note: The grid on the Monitors tab is filtered by default to only show monitors assigned to the device that are currently enabled. To display all assigned monitors, hover your cursor over the Enabled column header, click the drop-down arrow that appears, then clear the applied filter from the options displayed.
Tip: You now have the ability to specify the protocol by which WhatsUp Gold collects CPU, Disk, Memory, and Interface utilization data from the device. From the Monitors
tab, select the applicable monitor, click , then select the desired protocol for collecting performance data at the top of the configuration dialog.
Learn More Monitor Precedence (on page 110). Monitor Types (on page 105). Complement Device Monitoring with NetFlow (NTA) (on page 346).
Tip: In WhatsUp Gold, a given device is considered to be in a down state if it has either a critical monitor down or all monitors down.

WhatsUp Gold User Guide
97
Polling. Adjust polling interval, target address, and dependency chain. Polling Interval. Determines how frequently WhatsUp Gold fetches
observations from this device. Poll Using. Select an IP address for a particular interface or resolve to a
specific DNS hostname. Maintenance. Drop the managed device to maintenance mode and specify a
date and time for the maintenance period to end without further end-user interaction, if desired. (Useful mode and marker in reports and for SLA accounting.)
[Polling Up/Down Dependency]. Poll based on the status of another device or resolved host.
Tip: If you need to apply a shorter poller interval either temporarily, or for troubleshooting performance, consider using the RealTime Performance monitor (on page 788).
Note: In WhatsUp Gold, a given device is considered to be in a down state if it has either a critical monitor down or all monitors down
Schedule Recurring Maintenance Times (on page 104). Specify when the selected device regularly enters/exits maintenance mode without user interaction.
Actions. Send notifications, log events, chain together corrective actions and apply escalation rules.
When you apply active monitors, you typically associate an action and a device state with changes observed by the monitor. There are three main categories of built-in action types available through the Actions Library (on page 252). Actions can be triggered or scheduled.
Note: Certain actions (CM Actions, for example) can be invoked on demand (Run Now).
Built-in action types include:
Notifications. Send messages to stakeholders and responsible individuals according to site policy.
Remote execution. Create scripts, execute remote programs, and apply configuration changes.
Log. Include state change observed by WhatsUp Gold in platform logs.
Notifications Beeper action (on page 192). Activate a beeper with this type of action. E-mail action (on page 194). Send an Email to a specific address. Log to Text File action (on page 197). Write a message to a text file. Pager action (on page 198). Send a message to a pager.
WhatsUp Gold User Guide
98
Web Alarm action (on page 209). Activate a Web Alarm in the WhatsUp Gold Web Interface
Text to Speech action (on page 207). Plays a voice message on your computer.
SMS action (on page 202). Send a text message to a specific target. SMS Direct action (on page 203). Send a text message to a wireless phone or
other wireless device. Sound action (on page 205). Play a specific sound.
Remote/Local Script or Execution Service Restart action (on page 202). Start or stop a Windows service. Active Script action (on page 191). Write code to perform a customized action. Configuration Management action (on page 308). Perform script or task from
CM Task (on page 314) (includes Task Scripts (on page 309)) or CM Script (on page 328) Libraries.
PowerShell action (on page 200). Develop custom actions through direct access to scriptable component libraries, including the .NET Framework.
SSH action (on page 206). Connect to remote devices via SSH to execute commands or scripts.
Program action (on page 201). Execute an external application. SNMP Set action (on page 204). Use SNMP to increase a counter, set a flag,
or change the attribute value of a managed object.
Log Windows Event Log action (on page 210). Write an event in the Windows
Event Log. Syslog action (on page 207). Write a message to a log in the Syslog system. VMware action (on page 208). Use the VMware API to perform an action on a
virtual machine. Credentials. View and associate built-in credential types with this device. (Needed for rich discovery and monitoring information.)
Credentials Library provides the following credential types:
Network Management. Simple Network Management Protocol (SNMPv1 (on page 219), SNMPv2 (on page 220), SNMPv3 (on page 220)).
Credential Type Description Typical Use
SNMPv1 (on page 219)
SNMPv2 (on page 220)
Administrative SNMP domains (for example, networks and subnets) are defined by a shared SNMP community string.
Poll with WhatsUp Gold performance monitors with access to MIBs on any device running an SNMP agent with a default ("public") or otherwise configured community string.

WhatsUp Gold User Guide
99
Credential Type Description Typical Use
SNMPv3 (on page 220)
User based security with SNMP message authentication for data integrity and origin authentication.
Poll with WhatsUp Gold Performance monitors for SNMP-enabled devices using SNMPv1,v2,v3.
Ensure message privacy between a SNMPv3 agent and management station.
Protect against MITM attacks due to replay.
System Attributes and Instrumentation. Windows (on page 221), VMware (on page 223), SSH (on page 223) (typically used for Linux and UNIX).
Credential Type Description Typical Use
WMI (Windows) (on page 221)
Windows user credentials. It is best practice to scope these according to the principal of least privilege.
Provides WhatsUp Gold Performance monitors WMI object access.
For Windows OS based devices, which can provide different information than SNMP.
Note: Add WMI credentials directly to Hyper-V hosts for Disk Utilization metrics.
SSH (on page 223), Telnet (on page 222) (UNIX, Linux)
Remote commands, scripts, and management.
Connect WhatsUp Gold to devices running an SSH Server.
Access filesystem partition information on Linux, UNIX devices if not available by way of SNMP.
Action scripts/Shell Scripts.
Telnet (on page 222) (UNIX, Linux)
Remote commands, scripts, and management.
Connect WhatsUp Gold to devices running a Telnet Server.
Shell access.
VMware (on page 223)
VM platform attributes, status, and logs.
Needed to connect to vCenter server.
Add to vCenter server. Enables VM and virtual server
information to be gathered by way of VMware services.

WhatsUp Gold User Guide
100
Remote Execution. Secure Shell client (SSH) (on page 223), Telnet client (on page 222).
Credential Type Description Typical Use
SSH (on page 223)
Remote commands, scripts, and management.
Connect WhatsUp Gold to devices running an SSH Server.
Access filesystem partition information on Linux, UNIX devices if not available by way of SNMP.
Linux/UNIX/router switch CLI. Action scripts/shell scripts (SSH
action (on page 206), for example).
Telnet (on page 222)
Remote commands, scripts, and management.
Connect WhatsUp Gold to devices running a Telnet Server.
Shell access. Linux/UNIX/router switch CLI.
Storage Device Management. Storage Management Initiative Specification (SMI-S (on page 224)).
Cloud. Amazon Web Services (AWS) (on page 227), Azure (on page 228).
Applications. ADO (on page 222), JMX (on page 223).
Tip: Most active monitors that include scripting (PowerShell, for example (on page 130)) have the ability to apply credential sets as part of remote processing (before and during the active session).
Learn More About Credentials.
Tips for Applying Credentials (on page 240).
Tip:: Most active monitors that include scripting (PowerShell (on page 130), for example) have the ability to apply credential sets as part of remote processing (before and during the active session).
Attributes. User-defined, role-defined, and other properties uncovered during discovery that describe the device.
Attributes panel enables you to view device system and host descriptions, modify some of this information, and populate user defined attributes (such as Contact Information).

WhatsUp Gold User Guide
101
Most fields are populated at discovery time such as device MAC address, device name, and so on. For example, for a Windows device, Discovery pulls in system and host information (Computer Properties) as attributes.
Other fields, such as contact information, can be auto populated at discovery time using custom role definitions (on page 89) or edited through the Attributes panel.
Tip: Attribute values can be auto populated using Device Role (on page 89) definitions. You can also customize Device Attributes using discovery percent variable (on page 855) syntax.
Roles. Browse, apply, and template the model applied to this device for discovery, role determination, and default monitor scheme.
Primary Role. Consider these roles as candidates for the current role definition during discovery/rescan.
Select a generalized role class to apply.
Your role will inherit default characteristics from this class such as discovery attributes and default monitors that you can modify if appropriate.
Sub Roles. Add sub roles to consider for discovery/rescan.
Select a generalized sub role to apply (given your Scan Rules).
Add. Add a monitor from the monitors library to this role definition.
Delete. Remove a monitor from this list.
Learn More About Device Roles
Tip: You can customize roles and subroles using the Roles/Subroles Editor (on page 62).
Inventory. (Information only) Tables of system-specific, host, OS, chassis and layer 2 connectivity and merge data reported by the selected device when discovered/rescanned.
Inventory provides complete views of the device management information.
Richness of information depends on credentials available at scan time. Information available depends on device role/type. (Windows devices will show
updates, switches show ARP cache, for example.) Information is read-only from this view. Discovery-time device boundary decisions and information used for merging
determination.

WhatsUp Gold User Guide
102
Links. User-defined or role-associated URLs associated with the selected device.
Define a custom link and apply it to the discovered device. You can customize for each device using discovery percent variable (on page 855) syntax.
Add. Add a custom link.
Edit. Edit a selected custom link.
Delete. Remove the link.
Note: Custom Links can be tabulated and distributed as Custom Link reports.
Examples Add link for viewing web role or web service running on current device.
http://%Discovery.Device.Name.example.com:80
Add link to manage vCenter using vSphere web client.
https://%Discovery.Device.Name.example.com:9443/vsphere-client
Tasks. Manage and run scheduled Configuration Management tasks as well as modify and compare archived configuration records assigned to the selected device.
Tasks enable you to apply controls, perform maintenance, and simulate user behavior, based on your site policies and goals.
Managing Tasks (on page 314). Associating Devices (on page 317). Scheduling Tasks (on page 315). Launching a Single Task (on page 318).
Learn More Typical Tasks
Tip: For more details on how to build Scheduled Tasks and Password Tasks, see the section titled Configuration Management (on page 307).
Understanding Merge Information Merge information includes:
Merge Time. Time that rules match was detected (typically during discovery or rescan).
Device Name. Primary device name at the time of merge. Device 1 IP. Network (IP) address of primary device at the time of merge. Device 2 Name. Name of secondary device before it was merged with primary. Device 2 IP. Network (IP) address of secondary device merged with primary.

WhatsUp Gold User Guide
103
Merge Reason. Reason category that indicates the final merge decision (on page 60) (MAC address match, for example).
Matched Key. Network (IP) address, hardware address, or other key field matched for the merge.
SNMP System Name. System name reported from SNMP management object.
Device Merge Reason Categories Device merge reasons applied by WhatsUp Gold Discovery fall into one the categories in the following table. Merging occurs during the post processing phase of discovery and can be manually turned off using Address Exceptions (on page 54).
Note: When two device records satisfy the conditions for more than one merge category, the last one evaluated displays in the Merge Decision Information table.
This reason... Indicates this match condition...
IP Address One or more IP addresses match.
IP and MAC Address One or more IP and MAC addresses match.
ipAddressTable Correlation between interface indexes, IP addresses, and MAC addresses in the IP management information.
ifTable Matching management information fields in the interface table.
MAC Address One or more MAC address match.
MAC and System Name One MAC address and one SNMP system name match.
Virtual MAC Simulated MAC layer address used by VMware and Hyper-V match.
Non Virtual MAC Non virtual MAC address match.
NetBIOS Exact NetBIOS name or exact name/domain match for device.
Serial Number Serial number (if available, manufacturer information must also match).
Resource ID Service (such as cloud services) resource ID.

WhatsUp Gold User Guide
104
Attributes Attributes panel enables you to view device system and host descriptions, modify some of this information, and populate user defined attributes (such as Contact Information).
Most fields are populated at discovery time such as device MAC address, device name, and so on. For example, for a Windows device, Discovery pulls in system and host information (Computer Properties) as attributes.
Other fields, such as contact information, can be auto populated at discovery time using custom role definitions (on page 89) or edited through the Attributes panel.
Tip: Attribute values can be auto populated using Device Role (on page 89) definitions. You can also customize Device Attributes using discovery percent variable (on page 855) syntax.
Schedule Recurring Maintenance Times In addition to using device management actions to place devices in maintenance mode manually, you can also specify when a selected device regularly enters/exits maintenance mode without any user interaction using the Device Properties interface.
To schedule recurring maintenance: 1 Access Device Properties for the device to which you want to apply a maintenance
schedule. 2 Select the Polling tab under Device Configuration. 3 Click Add ( ) to launch the Schedule Recurring Maintenance dialog. 4 Specify the following maintenance schedule details:
a) Duration Options. Set the hours in which the selected device should be in maintenance mode using the Start and End menus. Please note, if the End time is set 'earlier' than the Start time, the schedule remains active until the End time the following day. The Duration displayed updates automatically based on your selections.
b) Recurring Options. Indicate how often this schedule should be activated. Please note, the individual recurring options displayed change based on your Daily, Weekly, Monthly, or Yearly selection within the interface.
c) Schedule Range. Select the date on which this schedule should initally take effect.
5 Click OK.
Please note, for maintenance windows which exceed 24 consecutive hours, maintenance mode events can be scheduled adjacent to each other to extend total maintenance time as needed.
You can also edit ( ) or remove ( ) existing maintenance schedules by selecting the desired maintenance schedule displayed in the Device Properties, then selecting the applicable icon.

WhatsUp Gold User Guide
105
Monitor Types WhatsUp Gold provides active, passive, and performance monitors.
Active Monitoring. Active polling, measurements, and user simulation.
Active monitors typically check for network and device performance, security, and faults by:
Simulating user activity. Actively connecting to or querying device management objects.
Deploying Active Monitors is critical for cases when troubleshooting faulty network traffic or behavior caused by a single device. An obvious Active Monitor example is the FTP monitor, which simulates user activity on a target FTP server.
Passive Monitoring. Monitoring that does not generate network traffic.
Except for record retrieval performed by WhatsUp Gold, these monitors do not generate network traffic or depend on a poller.
Passive Monitors are useful for troubleshooting cases where the Active Monitor is down or when performing traffic analysis from a specific listening point in your network.
While passive monitoring is less invasive, you record less information during idle periods.
Tip: In addition to the WhatsUp Gold 'built-in' Passive Monitor types, Network Traffic Analysis provides a router-based variant of passive monitoring. NetFlow monitoring (on page 346), for example, is router-based passive monitoring. Flow packets, however, do generate a marginal amount of network traffic. Using sFlow sources with Network Traffic Analysis can limit this packet traffic to an optimal rate of sampling.
Performance Monitoring. Historic device availability and resource capacity usage.
These monitors enable you to measure and maintain history of:
Device and application availability (also known as "up time" metrics). Resource capacity utilization. Storage capacity, CPU usage, interface utilization
and other resource capacity utilization metrics.
Performance management within WhatsUp Gold leverages an ensemble of monitors that exhibit characteristics of both passive and active monitoring.
Device Status The Device Status dashboard displays information about the current health of the selected device. Upon accessing Device Status, dashboard reports containing general information for the selected device including overall status and individual active monitor states as well as assigned attributes and any custom links and notes can be seen at the

WhatsUp Gold User Guide
106
center of the interface. Use the following controls for common functions applicable to device monitoring at right:
Click to add a new tab (an empty or preconfigured dashboard "view") to the Device Status dashboard.
Click to access a menu of actions applicable to the current view.
Note: See Working with Dashboards in WhatsUp Gold (on page 412) to learn about WhatsUp Gold dashboarding capabilities and customization.
More detailed information about the health of specific aspects of the selected device can be found by navigating between views at the top of the interface. The dashboard views displayed are dependent upon the device role and information gathered during discovery and do not appear if not applicable to the selected device.
Monitoring lists monitors applied to the device, active monitor states, down interfaces, and the last ten entries in both the State Change Timeline and Action logs.
Disk/CPU/Memory displays dashboard reports graphing utilization data for drives, processors, both physical and virtual memory, as well as ping response times for the selected device.
Router/Switch/Interface graphs utilization data for communication interfaces for the selected device.
General
Managing and Assigning Monitors After you Add Discovered Devices (on page 52) to managed Monitor Summary Status
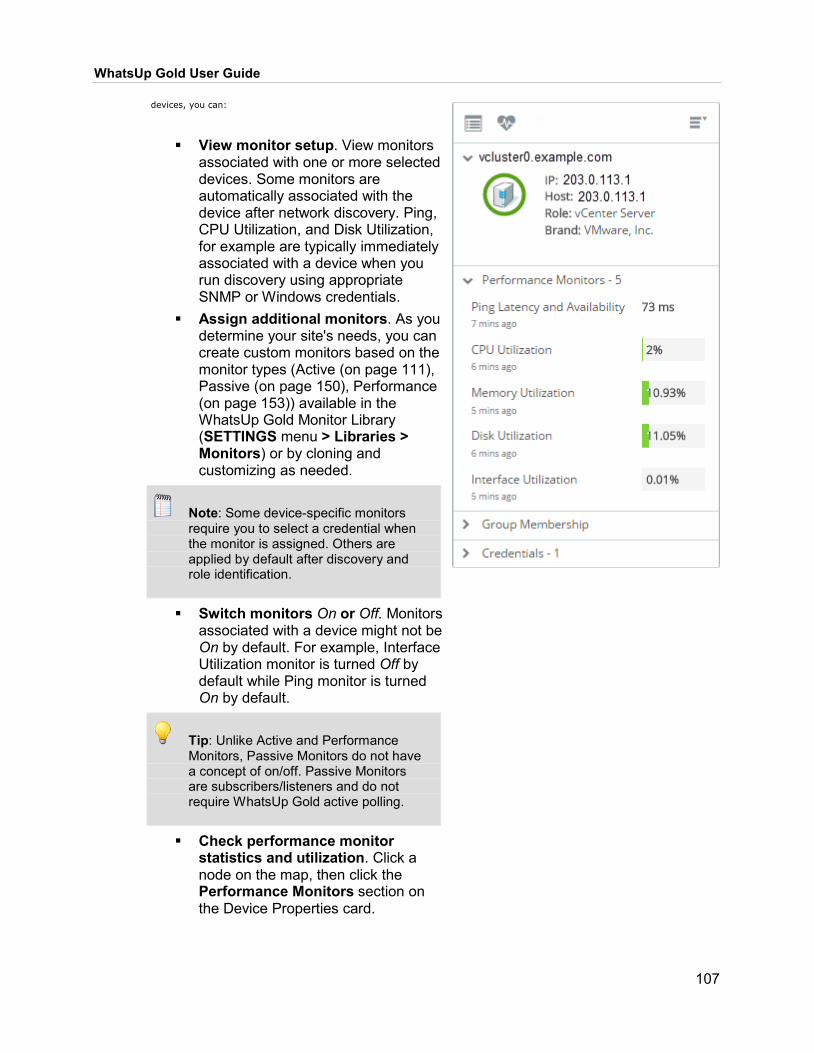
WhatsUp Gold User Guide
107
devices, you can:
View monitor setup. View monitors associated with one or more selected devices. Some monitors are automatically associated with the device after network discovery. Ping, CPU Utilization, and Disk Utilization, for example are typically immediately associated with a device when you run discovery using appropriate SNMP or Windows credentials.
Assign additional monitors. As you determine your site's needs, you can create custom monitors based on the monitor types (Active (on page 111), Passive (on page 150), Performance (on page 153)) available in the WhatsUp Gold Monitor Library (SETTINGS menu > Libraries > Monitors) or by cloning and customizing as needed.
Note: Some device-specific monitors require you to select a credential when the monitor is assigned. Others are applied by default after discovery and role identification.
Switch monitors On or Off. Monitors associated with a device might not be On by default. For example, Interface Utilization monitor is turned Off by default while Ping monitor is turned On by default.
Tip: Unlike Active and Performance Monitors, Passive Monitors do not have a concept of on/off. Passive Monitors are subscribers/listeners and do not require WhatsUp Gold active polling.
Check performance monitor statistics and utilization. Click a node on the map, then click the Performance Monitors section on the Device Properties card.

WhatsUp Gold User Guide
108
Tip: To assign specific monitoring schedules directly to a device role, see the section titled Device Role Settings.
View Monitor Setup To view the monitor setup for a device:
1 Select a device on the My Network (on page 20) map. The Device Information Card displays.
2 Click Device Properties (on page 86) ( ). Device Properties displays with current monitor setup on the Monitors tab.
Delete Multiple Monitors from a Single Device To bulk delete monitors from a single device:
1 Select a device from My Network (on page 20) map. The Device Information Card displays.
2 Click Device Properties (on page 86) ( ). Device Properties displays with current monitor setup on the Monitors tab.
3 Select multiple rows in the Monitors table (select either by CTRL+click, shift+click).
4 Click Delete ( ). The selected monitors are deleted from the device.
Turn on/off Monitors 1 Select one or more devices on the My Network (on page 20) map or the
collapsible device grid. 2 From the Device Information Card (on page 250), click Device Properties ( ). 3 On the Monitors tab, select the monitor, then toggle the switch On/Off ( ).
Assign Additional Monitors You can assign new or existing monitors to a device.
To assign monitors to a device:
After you have created monitors based on monitor types, you can assign them to your managed devices.
1 Select one or more devices on the My Network (on page 20) map or the collapsible device grid to access the Monitors window.
2 From the monitors ( ) panel, select the monitors you want to apply, and click the Apply to selected devices button.
Note: You create and manage new monitors using the Monitoring Library (SETTINGS menu > Libraries > Monitors).

WhatsUp Gold User Guide
109
To add a new monitor:
You can add new monitor instances to the monitor library based on an existing monitor or 'built in' monitor type.
1 Click the 'add' ( ) button, choose a monitor type, and configure it. 2 Assign your monitor to a device, many devices, or a device group. 3 Switch On/Off the monitor. (For example, some monitors are switched Off by
default.)
About Monitor Types WhatsUp Gold provides active, passive, and performance monitors.
Active Monitoring. Active polling, measurements, and user simulation.
Active monitors typically check for network and device performance, security, and faults by:
Simulating user activity. Actively connecting to or querying device management objects.
Deploying Active Monitors is critical for cases when troubleshooting faulty network traffic or behavior caused by a single device. An obvious Active Monitor example is the FTP monitor, which simulates user activity on a target FTP server.
Passive Monitoring. Monitoring that does not generate network traffic.
Except for record retrieval performed by WhatsUp Gold, these monitors do not generate network traffic or depend on a poller.
Passive Monitors are useful for troubleshooting cases where the Active Monitor is down or when performing traffic analysis from a specific listening point in your network.
While passive monitoring is less invasive, you record less information during idle periods.
Tip: In addition to the WhatsUp Gold 'built-in' Passive Monitor types, Network Traffic Analysis provides a router-based variant of passive monitoring. NetFlow monitoring (on page 346), for example, is router-based passive monitoring. Flow packets, however, do generate a marginal amount of network traffic. Using sFlow sources with Network Traffic Analysis can limit this packet traffic to an optimal rate of sampling.
Performance Monitoring. Historic device availability and resource capacity usage.
These monitors enable you to measure and maintain history of:
Device and application availability (also known as "up time" metrics). Resource capacity utilization. Storage capacity, CPU usage, interface utilization
and other resource capacity utilization metrics.
Performance management within WhatsUp Gold leverages an ensemble of monitors that exhibit characteristics of both passive and active monitoring.

WhatsUp Gold User Guide
110
Please note, you can test any active monitor directly from the Monitors Library to ensure it is configured properly. For additional information and applicable procedure steps, please see Active Monitors.
Critical Active Monitors Critical active monitors pair the features of critical monitor precedence with an active monitor or script you apply to assess or indicate device health. Monitor precedence is useful for high traffic periods where the device being monitored is functioning but the path to the device causes delays in poll or ping response which could indicate down status. For example, for devices running critical services, you can apply a critical active monitors to open a basic Telnet connection, a remote login session, survey the mission critical device or service through a dedicated management segment and interface (and so on).
It is best practice to escalate monitors relative to the service or application you want to ensure continuity for. So, if you are monitoring for availability of a critical web service, you could make an HTTP monitor dependent on the Ping monitor —where the HTTP monitor would be critical.
Polling Precedence In a critical monitor polling path, critical monitors are polled first. If you specify more than one critical monitor, you also specify the order in which they are polled. Critical monitors are "up" dependent on one another; if critical monitors return successful results, non-critical monitors are polled. If any of the critical monitors go down, all active monitors behind it in the critical polling order are no longer polled and are placed in an unknown state for the duration of the polling cycle. In addition performance monitors are no longer polled and are placed in an unknown state for the duration of the polling cycle.
The following table describes the exception to this rule:
IF AND THEN
The first critical monitor goes down
The critical monitors behind it in the critical polling order are APM Active or Performance monitors
All other critical monitors will continue to poll.
The first critical monitor goes down
The critical monitors behind it in the critical polling order are Wireless monitors
All other critical monitors will continue to poll.
The first critical monitor goes down
The critical monitors behind it in the critical polling order are Active script monitors
All other critical monitors will continue to poll.
The first critical monitor goes down
The critical monitors behind it in the critical polling order are Active script performance monitors
All other critical monitors will discontinue to poll.
If at the start of the next polling cycle, the critical monitor returns successful results, polling of successive critical monitors and non-critical monitors resumes.

WhatsUp Gold User Guide
111
Note: Up and Down device dependencies take precedence over critical monitor polling; if WhatsUp Gold detects device dependencies, the configured dependencies are respected.
When critical monitoring is enabled, and you specify a critical polling order, you now receive only one alert when a device loses its network connectivity.
Note: When a monitor is placed in the unknown state, assigned actions are not fired. Likewise, when a monitor comes out of the unknown state into an Up state, assigned actions are not fired.
Only monitors that you specify as critical follow a specific polling order; non-critical monitors are not polled in any specific order. Additionally, if multiple non-critical monitors fail, all associated actions fire.
Note: Independent poll frequency for all monitors is ignored when a monitor is specified as critical.
Active Monitors Active monitors enable you to verify health, simulate user events, test for specific conditions and:
Actively poll specific metrics such as MIB values or other sorts of instrumentation.
Test and measure service and application availability and latency. Scan folders, logs, and files. Apply queries. Exercise APIs.
Tip: WhatsUp Gold Also applies certain active monitors automatically, such as network interface monitors in order to show availability of network cards, switches, and hosts.
How to Test an Active Monitor You can test active monitors directly from controls in the Monitors Library to ensure proper configuration.
To test an active monitor 1 Access the Monitors Library, then select the active monitor you want to test. 2 Click Test at the top of the Monitors Library interface. 3 Select the device on which you want to test the active monitor. 4 Select the network interface to use for communication with the test device.
WhatsUp Gold User Guide
112
5 If applicable, select appropriate credentials required to successfully test the active monitor. Please note, if you do not have any credentials configured with which to test the selected active monitor, you can access the Credentials Library directly from the Test dialog and create a new set.
6 Click the Test button. The results of the test are presented within the Test dialog. 7 Click Close.
Chassis, Hardware, and Wireless APC UPS
Monitor (on page 113)
Power Supply Monitor (on page 129)
Temperature Monitor (on page 145)
Fan Monitor (on page 118)
Printer Monitor (on page 135)
WAP Radio Monitor (on page 146)
Application/Application Layer JMX (on page
125) PowerShell
Monitor (on page 130)
HTTP Content (on page 123)
Process Monitor (on page 136)
Telnet Monitor (on page 145) / SSH Monitor (on page 141)
Active Script Monitor (on page 113)
NT Service Monitor (on page 127)
SQL Query Monitor (on page 139)
Tip: Application endpoints can also be monitored using custom profiles you create or get from the Ipswitch Community. For more information, see the section titled Application Monitoring with WhatsUp Gold.
Critical Services Email Monitor (on
page 115) FTP Monitor (on
page 122) Exchange 2003 Monitor
(on page 117) DNS Monitor (on
page 115) Ping Monitor (on
page 129) Exchange Monitor (on
page 118) SQL Server
Monitor (on page 141)
Network Statistics Monitor (on page 127)
VoIP Monitor (available with VoIP Monitor plug-in) (on page 146)
Tip: Managed and unmanaged virtual machines and servers are also monitored with environment-specific passive and performance monitoring. For more information, see the section titled Monitoring Virtual Machines and Infrastructure (on page 267).

WhatsUp Gold User Guide
113
Network Management and Instrumentation SNMP Extended (on
page 136) WMI Formatted
Monitor (on page 147)
TCP/IP Monitor (on page 144)
SNMP Monitor (on page 138)
WMI Monitor (on page 147)
File System and Storage File Properties
Monitor (on page 120)
Folder Monitor (on page 121)
Storage Profile (on page 136) (SMI-S) (on page 136)
Cloud-Based Resources Cloud Resource Monitor (on page 114)
Active Script (Active) The Active Script monitor allows you write either VBScript or JScript code to perform specific customized checks on a device. If the script returns an error code, the monitor is considered Down.
Provide a unique name and description for the monitor, then configure the following:
Timeout. Enter the length of time WhatsUp Gold attempts to connect to the selected device. When the specified time is exceeded without connecting, a timeout occurs and WhatsUp Gold stops trying to connect to the server. This is considered a failed connection.
Script Type. Select either VBScript or JScript. Use in rescan. Enable this option to have the monitor appear in Device
Properties. If enabled, clicking Rescan Device from the device management actions menu within the Device Properties (on page 86) interface adds the monitor to the selected device if the applicable protocol or service is active on that device.
Script text. Enter the actual script code for the monitor to run.
APC UPS (Active) The APC UPS monitor watches your American Power Conversion Uninterruptible Power Supply (APC UPS) device and alerts you when selected thresholds are met or exceeded, output states are reached, and/or abnormal conditions are met.
Provide a unique name and description for the monitor, then configure the following:
Thresholds. Select which thresholds to monitor. Click Configure to set individual threshold settings if desired.

WhatsUp Gold User Guide
114
Monitor the following output states. Select the output state(s) on which you want to be alerted.
Monitor the following abnormal conditions. Select the abnormal condition(s) on which you want to be alerted.
Click Advanced to set the SNMP timeout and number of retries as well as enable Use in Rescan if desired.
Example: An alert can be sent when the UPS battery capacity is below 20%, when the battery temperature is high, when the battery is in bypass mode due to a battery overload state, and many other UPS alert conditions.
BGP Peer Status The Border Gateway Protocol (BGP) Peer Status active monitor checks the status of the connections between a router using BGP protocol and its Internet Service Provider (ISP) device peers. When the monitored router detects any device peer is not fully connected, WhatsUp Gold reports the monitor is Down.
When viewed on the State Change Timeline, you'll see detailed information from the router in the Message column including the IP address of the affected device peer, the current status of the connection, and the number of transitions recorded at the time the connection was interrupted or broken.
Note: Possible connection statuses can be found using the SNMP MIB Walker.
The number of transitions refers to how many times the connection intermittently switched between fully connected and either partially or fully disconnected before remaining in a disconnected state. For example, if the device peer was fully connected, then fully disconnected with no intermittent data flow, the number of transitions would be 0. If the connection went down, then up briefly, then down again before remaining disconnected, the number of transitions would be 1.
To configure, simply provide a unique name and description for the monitor.
Cloud Resource Monitor Cloud Resource Monitor determines if the selected cloud load balancer or cloud instance is available. This is useful for tracking service level for applications running in the cloud, tracking uptime, and monitoring health of managed infrastructure when your network or datacenter resources extend to the cloud.
The monitor can be used to determine availability for:
Amazon Web Service Elastic Load Balancing service Amazon Elastic Compute Cloud (EC2) instances Azure Resource Manager load balancers

WhatsUp Gold User Guide
115
Azure Resource Manager virtual machines
Note: Before you apply this monitor to a device, the device must have valid AWS or Azure credentials assigned (depending on the cloud service being utilized).
The success or failure of the monitor is dependent upon health and operational status values returned by the device that can be interpreted by WhatsUp Gold as up or down. To configure, simply provide a unique name and description for the monitor. Only a unique name and description are required to successfully configure this monitor, though you can also enable Use in Rescan if desired.
DNS The Domain Name Server (DNS) monitor is a simple service monitor that checks for the DNS on port 53. If a DNS service does not respond on this port, the service is considered Down.
Provide a unique name and description for the monitor, then configure the following:
Timeout. Enter the length of time WhatsUp Gold attempts to connect to the selected device. When the specified time is exceeded without connecting, a timeout occurs and WhatsUp Gold stops trying to connect to the server. This is considered a failed connection.
Use in rescan. Enable this option to have the monitor appear in Device Properties. If enabled, clicking Rescan Device from the device management actions menu within the Device Properties (on page 86) interface adds the monitor to the selected device if the applicable protocol or service is active on that device.
Email The Email monitor checks a mail server by first sending the server an email via SMTP. Then, in the subsequent poll, the monitor attempts to delete previously sent emails using either POP3 or IMAP. If no emails from the monitor are present in the inbox to delete, the mail server is considered Down. Please note, the first time the monitor is polled and an email message is successfully sent, the status will automatically be Up because there are no previously sent emails to delete.
Note: The email monitor supports encryption with SSL/TLS and SMTP Authentication which ensures that the monitor sends emails to a secure email account.

WhatsUp Gold User Guide
116
Important: You must use a separate email account for every monitor that you create. Failure to do so will result in false negatives. For example, if you want to check both IMAP and POP3 on the same server, and create two instances of the monitor, one configured with POP3 and one with IMAP, you must use two separate email accounts. Otherwise, one monitor deletes all emails previously sent from both instances of the monitor and incorrectly reports the mail server as Down.
Provide a unique name and description for the monitor, then configure the following:
Outgoing mail
SMTP server. Enter the address of the server on which SMTP is running. Use the default, %Device.Address, to use the device IP address on which the monitor is attached.
Port. Enter the port on which the SMTP service is listening. The standard SMTP port is 25.
Mail to. Enter the address to which the Email Monitor sends email. Mail from. Enter the address you want listed as "From" in the email sent by the
Email Monitor.
Incoming mail
Mail server. Enter the address of the server on which the POP3 or IMAP service is running.
Account type. Enter the protocol (POP3 or IMAP) you want the monitor to use to check for correct email delivery.
Username. Enter the username of the account in which the monitor uses to log in.
Password. Enter the password for the account in which the monitor uses to log in.
Click Advanced to set the following additional advanced properties for the monitor if desired:
SMTP advanced properties
SMTP server requires authentication. Enable this option if the specified SMTP server requires authentication. Please note, this monitor supports CRAM-MD5, LOGIN and PLAIN authentication methods. The authentication method is not configurable. It is negotiated with the SMTP server automatically using the strongest mutually-supported authentication method.
Username. Enter the username to be used for SMTP authentication. Password. Enter the password to be used for SMTP authentication. Use an encrypted connection (SSL/TLS). Enable this option to encrypt SMTP
traffic if your SMTP server supports encrypting data over a TLS connection. Please note, WhatsUp Gold only supports explicit SSL sessions negotiated using the STARTTLS command for SMTP connections.

WhatsUp Gold User Guide
117
Timeout. Enter the length of time WhatsUp Gold attempts to connect to the selected device. When the specified time is exceeded without connecting, a timeout occurs and WhatsUp Gold stops trying to connect to the server. This is considered a failed connection.
POP3 advanced properties
Port. Enter the port number where the POP3 or IMAP server listens. Use an encrypted connection. Enable this option to connect to a POP3 or
IMAP server in an encrypted mode. Select one of the following encryption methods:
Use implicit SSL. Select this option to login to your POP3 or IMAP server in an encrypted mode.
Use SSL with STLS. Select this option to login to your POP3 or IMAP server in an unencrypted mode, and then switch to a TLS connection by sending STARTTLS or STLS command to the server.
Important: WhatsUp Gold only supports clear text authentication for retrieving mail. To protect your username and password when retrieving mail, you must use an SSL encryption method. When connecting using STARTTLS, the connection is encrypted before any authentication information is sent or any mail is retrieved.
Timeout. Enter the length of time WhatsUp Gold attempts to connect to the selected device. When the specified time is exceeded without connecting, a timeout occurs and WhatsUp Gold stops trying to connect to the server. This is considered a failed connection.
Note: If your IMAP server is configured to move the test message sent by the monitor to any folder other than the Inbox, the monitor fails. WhatsUp Gold only detects messages in the Inbox folder on an IMAP server.
Exchange 2003 The Exchange 2003 monitor lets you monitor the Microsoft Exchange 2003 Server application. The Exchange 2003 monitor provides real-time information about the state and health of Exchange 2003 Servers on your network. Please note, to create custom parameters to monitor, the Exchange Server host must be WMI-enabled.
Important: Do not use the Exchange 2003 Monitor to monitor other Exchange (on page 118) server applications.
Provide a unique name and description for the monitor, then configure the following:
Thresholds to monitor. Select the thresholds to monitor. Click Configure to set individual threshold settings if desired.
Services to monitor. Select the services to monitor.

WhatsUp Gold User Guide
118
Use in rescan. Enable this option to have the monitor appear in Device Properties. If enabled, clicking Rescan Device from the device management actions menu within the Device Properties (on page 86) interface adds the monitor to the selected device if the applicable protocol or service is active on that device.
Exchange
Warning: This monitor has been deprecated and only supports versions 2012 and prior.
The Exchange active monitor lets you monitor the Microsoft Exchange Server application. This monitor provides real-time information about the state and health of Microsoft Exchange servers on your network. Please note, to create custom parameters to monitor, the Exchange Server host must be WMI-enabled.
Important: Do not use the Exchange Monitor to monitor Exchange 2003 (on page 117) servers.
Provide a unique name and description for the monitor, then configure the following:
Performance aspects to monitor. Select the Exchange elements to monitor. Click Configure to set individual threshold settings for the selected Exchange element if desired.
Services to monitor. Select the services to monitor. Use in rescan. Enable this option to have the monitor appear in Device
Properties. If enabled, clicking Rescan Device from the device management actions menu within the Device Properties (on page 86) interface adds the monitor to the selected device if the applicable protocol or service is active on that device.
Fan The Fan Monitor checks manufacturer-specific device fans and cooling devices, such as active and passive cooling components, to see if they are enabled and returning values signaling they are working properly.
First, the monitor first checks if the monitored device is manufactured by Dell, Cisco, HP, or EMC. Then, it checks for any enabled fans and other cooling devices. If a fan is disabled, the monitor ignores it. If a fan does not return one of the following values, the monitor is considered Down.
1 - Normal (for Cisco devices or Dell PowerConnect switches and routers) 2 - OK (for ProLiant switches and routers) 3 - OK (for Dell Servers) 4 - OK (for HP ProCurve Servers)

WhatsUp Gold User Guide
119
Note: Not all types of device fans and cooling components can be monitored.
Only a unique name and description are required to successfully configure this monitor, though you can click Advanced to set the SNMP timeout and number of retries as well as enable Use in Rescan if desired.
File Content The File Content monitor scans the specified files for a string pattern and can be used to scan log files for a known error string. It is intended for scanning text files such as logs, for example, and not binary files. For best performance, select as few files to scan as possible. Using regular expressions to specify filename and scan pattern can affect the monitor’s performance. It is imperative to create detailed regular expressions, specifically for specifying the scan pattern, in order to achieve the best results.
Provide a unique name and description for the monitor, then configure the following:
Path of the folder to monitor. The Universal Naming Convention (UNC) file path WhatsUp Gold uses to access the folder. Enable Include sub-folders to scan folders under the selection for the specified content.
Include all files. Select this option to configure the monitor to scan all accessible files.
Include files with names matching the following expression. Select either wildcard or regular, then enter all or part of a file name for which the monitor should search.
Note: Wildcards expressions can be used to filter your file search results. For example, to list all text files with .txt extension, you would use: *.txt Or, to find all text files named file_1.txt, file_2.txt, you would use: file?.txt For these examples, the * wildcard is used for matching multiple characters and the ? wildcard is used for matching a single character.
Pattern to scan. Enter the literal string or regular expression for which the monitor should search. Please note, only single line expressions are supported.
Pattern is a literal string. Enable this option if the pattern you entered is a literal string and the monitor should search the pattern without attempting to interpret anything entered as a regular expression.
Perform case sensitive comparison. Enable this option to ensure the monitor considers upper and lower case characters as entered.
Scan entire file contents. Select this option to search an entire file for the pattern.
Scan only the content added to the file since the last poll. Select this option to limit the search to only new information in a file.

WhatsUp Gold User Guide
120
Note: If the Scan only the content added to the file since the last poll option is selected, WhatsUp Gold tracks the offset within the file reached during scanning, then picks up from that point during the next scan. This is not necessarily the end of the file as a timeout could result in not reaching the end of the file. If a file scanned is deleted, then re-created with new content, then one of two things can happen: If the recreated file is smaller than the last scanned offset for that file, WhatsUp Gold start scanning from the beginning of the file. Or, if the recreated file is the same size or larger than the last scanned offset, then WhatsUp Gold picks up the scanning from the last scanned offset.
Important: Ipswitch recommends creating any associated actions to the file content monitor itself as opposed to a target device to which the monitor is applied. Applying actions to a file content monitored device when this scan method is selected can cause the monitor to report a failure followed by subsequent success each time the device is polled after a change is made to the scanned file(s).
Timeout. Enter the length of time WhatsUp Gold attempts to connect to the selected device. When the specified time is exceeded without connecting, a timeout occurs and WhatsUp Gold stops trying to connect to the server. This is considered a failed connection.
Ignore Timeout Error. Enable this option to ignore any timeout errors encountered when scanning files.
Monitor is up/down if the pattern occurs at least x times. Specify the number of instances of the pattern the monitor must find to report as either Up or Down.
File Properties The File Properties monitor checks to see if a file in a local folder or on a network share meets the conditions specified in the monitor's configuration. This monitor supports percent variables (%Device.Address or %Device.HostName) allowing you to use a macro for applying multiple devices to a monitor.
Note: The File Properties monitor only checks files in folders local to a device on which WhatsUp Gold is installed or files in network shares accessible from the WhatsUp Gold device.
Provide a unique name and description for the monitor, then configure the following:

WhatsUp Gold User Guide
121
Path of the file to monitor. Enter the Universal Naming Convention (UNC) file path that WhatsUp Gold uses to access the file. For example: \\192.168.3.1\website\product\index.htm for a file on a single device. If you provide the value for File size, File checksum using, or File modified within options, you can also use percent variables for the path of the file to monitor. For example, \\%Device.Address\website\product\index.htm or \\%Device.HostName\website\product\index.htm for a file located on multiple machines with the same file path name. Please note, mapped drive paths are not permitted.
File. Enable this option to specify if the file exists or does not exist for the monitor to report as Up.
File size is. Enable this option to determine the success or failure of the monitor scan based on the size of the specified file.
File was last modified. Enable this option to determine the success or failure of the monitor scan based on the date on which the file was last modified.
File checksum using. Enable this option to determine the success or failure of the monitor scan based on the file's checksum and specified algorithm used to calculate the checksum.
Warning: Selecting this option can greatly increase the amount of time it takes to complete the monitor scan and degrade or lag WhatsUp Gold performance. The probability of lengthy monitor scans and slower performance increases when you use algorithms other than SHA1 when you are scanning large files or when you scan files located on network shares.
File was/was not modified within X before polling time. Enable this option to specify if the file has or has not been modified within the selected interval for the monitor to report as Up.
Folder The Folder monitor uses the Windows credentials assigned to the device to determine if a local or network share folder meets the conditions specified in the monitor configuration. This monitor supports percent variables (%Device.Address or %Device.HostName), allowing you to use a macro for applying multiple devices to a monitor. If the target folder or directory contents change during a poll, the change is ignored and is not counted toward folder/file size specified in the monitor configuration.
Note: The Folder monitor only checks files in folders local to a device on which WhatsUp Gold is installed or files in network shares accessible from the WhatsUp Gold device.
Provide a unique name and description for the monitor, then configure the following:

WhatsUp Gold User Guide
122
Path of the folder to monitor. Enter the Universal Naming Convention (UNC) path that WhatsUp Gold uses to access the folder. For example: \\192.168.3.1\website\product for a folder on a single device. If you provide the value for File size, File checksum using, or File modified within options, you can also use percent variables for the path of the folder to monitor. For example, \\%Device.Address\website\product or \\%Device.HostName\website\product for a folder located on multiple machines with the same folder path name. Enable Include sub-folders to scan folders under the selection for the specified content.
Warning: Selecting this option can greatly increase the amount of time it takes to complete the monitor scan and possibly have an adverse effect on WhatsUp Gold performance.
Include all files. Select this option to configure the monitor to scan all accessible files.
Include files with names matching the following wildcard expression. Select this option to specify a wildcard expression WhatsUp Gold should use to determine which files to scan. For example, enter *.exe to check for executable (.exe) files in the selected folder. Please note, this option only works using a single wildcard expression. If multiple expressions are entered in this field, the monitor reads the entry as one wildcard expression.
Warning: When enabled, this option can significantly slow performance dependent on the wildcard expression specified. The probability of slower performance increases when this option is used in conjunction with the Include sub-folders option.
Folder. Enable this option to specify if the folder exists or does not exist for the monitor to report as Up.
Actual folder size is. Enable this option to determine the success or failure of the monitor scan based on the actual size of the specified folder.
Folder size on disk is. Enable this option to determine the success or failure of the monitor scan based on the size of the specified folder as it resides on disk.
Number of files is. Enable this option to determine the success or failure of the monitor scan based on the number of files within specified folder.
FTP The FTP monitor performs upload, download, and delete tasks on designated FTP servers to ensure they are functioning properly. You can configure a single monitor to perform all three tasks. However, if any one of the tasks fails, the entire monitor is considered Down. Ipswitch recommends creating a separate FTP monitor for each FTP server you are monitoring, unless the same username and password are used for each of the servers.

WhatsUp Gold User Guide
123
Provide a unique name and description for the monitor, then configure the following:
FTP Server. Enter the device address of the FTP server for which the FTP monitor is configured and on which the monitor performs associated tasks.
Port. Enter the port the monitor should use to communicate with the FTP server. Username. Enter the username used to access the FTP server for which the
monitor is configured. Password. Enter the password used to access the FTP server for which the
monitor is configured.
Important: Specify a username and password for an account with the appropriate user permissions for the file actions you select. To upload files to the server, the account must have write permissions. To download files from the server, the account must have read permissions. And, to delete files from the server, the account must have delete permissions.
Use Passive Mode. Enable this option to use passive (PASV) mode rather than active mode when attempting to connect to the FTP server and to perform the subsequent tasks.
Upload. Enable this option to have the active monitor upload a file to the designated FTP server. Please note, this option must be enabled to use the Download and/or Delete tasks.
Download. Select this option to have the active monitor download a file from the designated FTP server.
Delete. Select this option to have the active monitor delete a file from the designated FTP server.
Timeout. Enter the length of time WhatsUp Gold attempts to connect to the selected device. When the specified time is exceeded without connecting, a timeout occurs and WhatsUp Gold stops trying to connect to the server. This is considered a failed connection.
Use in rescan. Enable this option to have the monitor appear in Device Properties. If enabled, clicking Rescan Device from the device management actions menu within the Device Properties (on page 86) interface adds the monitor to the selected device if the applicable protocol or service is active on that device.
HTTP Content The HTTP Content monitor requests a URL and checks the HTTP response against the expected content. If the response does not return the expected content, the monitor fails. You can use this monitor to ensure web page/web server availability, to check if a page renders properly on specific browsers, or even to check for the presence/absence of specific content. If the monitor does not find the specified content, the monitor is considered Down.
Provide a unique name and description for the monitor, then configure the following:

WhatsUp Gold User Guide
124
URL. Location to check for HTTP content. The URL must begin with a proper URI, such as http:// or https://. The URL can include the full path to the document including the document's file name and any query string parameters. For example, http://www.example.com/reports.htm?ReportID=100.
Authentication username. Username the web site uses for authentication if applicable.
Authentication password. Password that coincides with the username the web site uses for authentication if applicable.
Note: This monitor only supports basic authentication.
Proxy server. If the specified content is behind a proxy server, enter the IP address of the proxy server.
Proxy port. Port on which the proxy server listens. Timeout. Enter the length of time WhatsUp Gold attempts to connect to the
selected device. When the specified time is exceeded without connecting, a timeout occurs and WhatsUp Gold stops trying to connect to the server. This is considered a failed connection.
Web page content to find. Content to search for on the specified website as either plain text or a regular expression. Enable Use regular expression when using a regular expression. Please note, this monitor uses standard regular expression processing as supported by the .NET framework.
Request URL contents. Click to populate the dialog box with the Web page contents of the URL you entered above.
Use in rescan. Enable this option to have the monitor appear in Device Properties. If enabled, clicking Rescan Device from the device management actions menu within the Device Properties (on page 86) interface adds the monitor to the selected device if the applicable protocol or service is active on that device.
Click Advanced to configure the user agent and custom headers if desired:
User agent. Select a browser from the list. The user agent string identifies which web browser is making an HTTP request. Use this feature to imitate your website being visited by various browsers. The user agent from the latest version of the browser is populated for the browser you select.
Custom headers. Specify any headers for which you want to check. Enter a header as Field:Value.
Important: Errors can result when using invalid custom headers or when modifying headers which do not allow modification, such as the HTTP Host header. Click Request URL contents in the monitor configuration interface to test custom headers. If a problem with the header exists, WhatsUp Gold displays an error message. For example, the message "An error occurred with the requested website. Error: The 'Host' header cannot be modified directly. Parameter name: name." indicates the user entered Host:myhost.com as a custom header when the Host header cannot be modified.

WhatsUp Gold User Guide
125
Example Content URLs To check content for the default page of a newly installed IIS server:
http://my-device/iisstart.htm
—where my-device is the hostname or IP address where a fresh instance of IIS is running.
To see how the HTTP Content monitor works, you can test it against one of the example documentation pages hosted by the Internet Assigned Numbers Authority (IANA):
http://www.example.com
JMX (Active) The JMX Active Monitor allows you to monitor any server that supports JMX by requesting one or more JMX attributes the server supports and allows you to easily browse and add available attributes to the monitoring list.
1 Provide a unique name and description for the monitor, then configure the following: Port. Enter the port number on the server that WhatsUp Gold should use to
communicate with the JMX service.
Use SSL with RMI Registry. Enable this option to use the JMX active monitor secured by SSL.
2 Click Add to launch the JMX Credentials dialog. 3 Enter the IP address or host name of the target device to browse. You can also
click the Browse button (...) to select a device from the device list. 4 Ensure the Port and Use SSL with RMI Registry settings reflect your selections
made in the previous dialog. 5 If needed, select an existing JMX credential (on page 223) from the list or click the
Browse button (...) to access the Credentials Library, then create a new one. 6 Click OK to proceed to the JMX Browser (on page 843) which you can use to
select the target device, domain/path, and attribute(s) to monitor. The monitor configuration dialog should now display the attributes you selected in the JMX Browser (on page 843).
7 Select one or more attributes, then click Configure to launch the Comparison Definition dialog.

WhatsUp Gold User Guide
126
Note: Multiple attributes can be selected and configured at once as long as they are of the same type. You can also select multiple attributes, then click Copy to configure multiple comparison types and values for those attributes simultaneously using the same monitor.
8 Specify the Comparison Type and Comparison Value for the selected attribute(s).
9 Click OK to return to the monitor configuration dialog. 10 Repeat procedure steps as needed to configure comparison settings for other
attributes to be monitored. 11 Click OK to save the monitor.
Add/Edit JMX Monitor The JMX Active Monitor allows you to monitor any server that supports JMX by requesting one or more JMX attributes the server supports and allows you to easily browse and add available attributes to the monitoring list.
1 Provide a unique name and description for the monitor, then configure the following: Port. Enter the port number on the server that WhatsUp Gold should use to
communicate with the JMX service.
Use SSL with RMI Registry. Enable this option to use the JMX active monitor secured by SSL.
2 Click Add to launch the JMX Credentials dialog. 3 Enter the IP address or host name of the target device to browse. You can also
click the Browse button (...) to select a device from the device list. 4 Ensure the Port and Use SSL with RMI Registry settings reflect your selections
made in the previous dialog. 5 If needed, select an existing JMX credential (on page 223) from the list or click the
Browse button (...) to access the Credentials Library, then create a new one. 6 Click OK to proceed to the JMX Browser (on page 843) which you can use to
select the target device, domain/path, and attribute(s) to monitor. The monitor configuration dialog should now display the attributes you selected in the JMX Browser (on page 843).
7 Select one or more attributes, then click Configure to launch the Comparison Definition dialog.
Note: Multiple attributes can be selected and configured at once as long as they are of the same type. You can also select multiple attributes, then click Copy to configure multiple comparison types and values for those attributes simultaneously using the same monitor.
8 Specify the Comparison Type and Comparison Value for the selected attribute(s).
9 Click OK to return to the monitor configuration dialog. 10 Repeat procedure steps as needed to configure comparison settings for other
attributes to be monitored.

WhatsUp Gold User Guide
127
Click OK to save the monitor.
Network Statistics The Network Statistics monitor uses Simple Network Management Protocol (SNMP) to query a device to collect data on three device protocols, Internet Protocol (IP), Transmission Control Protocol (TCP), and User Datagram Protocol (UDP) and alerts you when configured thresholds are met or exceeded.
Provide a unique name and description for the monitor, then configure the following:
Thresholds to monitor. Select the IP, TCP, and/or UDP thresholds to monitor. Click on any individual threshold to highlight it, then click Configure to specify Down conditions for the selected threshold. The OID and a description of the selected parameter can be found at the bottom of the configuration dialog. Please note, conditions for only one threshold may be configured at a time.
NT Service The NT Service monitor checks the status of a service on a Windows machine and attempts a restart of that service. Service restart can only occur if the appropriate administrator permissions exist. Please note, a running Windows Management Instrumentation (WMI) service on the specified device is required for this monitor to work.
Provide a unique name and description for the monitor, then configure the following:
Protocol. Select either SNMP or WMI as the protocol for the monitor to use to connect to the selected device. If using SNMP, click Advanced to set the SNMP timeout and number of retries if desired.
Service Name. Click browse (...) to specify a server or workstation running the service by entering an IP address or hostname and selecting applicable SNMP credentials.
Important: If the credentials specified when browsing for a service are not correct or do not have the proper permissions, the connection fails. Additionally, to monitor the service on a remote machine, the monitor must be configured with the correct user name and password and a user account belonging to the administrators group on that machine. Use an account with administrator privileges to browse for services when configuring this monitor.
Restart on failure. Enable this option to attempt to restart the service when it enters a Down state.
Use in rescan. Enable this option to have the monitor appear in Device Properties. If enabled, clicking Rescan Device from the device management actions menu within the Device Properties (on page 86) interface adds the monitor to the selected device if the applicable protocol or service is active on that device.
Browse For Service Use this dialog to browse for services on the specified device.

WhatsUp Gold User Guide
128
Credentials are not necessary if browsing for services on the WhatsUp Gold computer.
Host name or IP address to list services on. Enter a host name or IP address. WhatsUp connects to this computer and lists all services available on the device.
User name. Enter a user name to browse for services. Password. Enter the password for the user name specified above. To monitor
services on a Windows machine with an account that has empty password, the local security settings might have to be modified. From Administrative tools > Local Security Settings, click Security Settings > Local Policies > Security Options. Then right click on the setting: Account: Limit local account use of blank passwords to console logon only, click Properties, then select Disable.
Credentials If a domain account is used, then the expected user name is domain\user. If the device is not member of a domain, use machine name\user.
Permissions If the credentials entered on the Browse for Service dialog are not correct, and/or don't have the necessary rights, the connection fails. In order to monitor the service on another machine, the NT Service Monitor must be configured with the correct user name and password and a user account that belongs to the administrators group on the remote machine. We highly recommend that you use an account with administrator privileges to browse for services. For more information see THIS Knowledge Base article.
Firewalls In order to connect to the target computer, TCP port 135 must be open to the target computer. This port is used by the Windows Remote Procedure Call (RPC) Service, which directs Distributed COM (DCOM) traffic from remote computers. WMI uses DCOM to communicate with remote computers.
http://support.microsoft.com/default.aspx?scid=kb;en-us;Q248809 (rare)
http://msdn.microsoft.com/library/default.asp?url=/library/en-us/wmisdk/wmi/connecting_through_windows_firewall.asp (first)
http://msdn.microsoft.com/library/default.asp?url=/library/en-us/dndcom/html/msdn_dcomfirewall.asp (second)
DCOM synchronous, semi-synchronous, asynchronous connections
Ping Interarrival Jitter Ping Interarrival Jitter monitor returns resulting variance from multiple pings to a specified device.
Provide a unique name and description for the monitor, then configure the following:

WhatsUp Gold User Guide
129
Hostname/IP Address to Ping. Hostname or IP address of the target device to monitor. You can also enter the %Device.Address or %Device.HostName percent variable (on page 851) to configure the monitor to ping the device to which the monitor is assigned.
Timeout. Maximum length of time in seconds to wait for the ping reply message after sending the ping (ICMP echo).
Retries. Number of times WhatsUp Gold attempts to send the ping (ICMP echo) messages.
TTL. Number of routing nodes ("hops") that can forward the ping data before it is discarded.
Payload Size. Length in bytes of data to be sent in the ping message and returned in the ping reply message.
Jitter is greater than X ms. Amount of time the jitter value must exceed for WhatsUp Gold to report the device to which the monitor is assigned as Down.
Interarrival jitter is greater than X ms. Amount of time the interarrival jitter value must exceed for WhatsUp Gold to report the device to which the monitor is assigned as Down.
Ignore connection errors. Enable this option to prevent the monitor reporting the device as Down in the event of a connection error.
Ping Ping monitor sends an ICMP (ping) command to a device. This is the default monitor added to all devices during discovery. If the device does not respond, the monitor is considered Down.
Provide a unique name and description for the monitor, then configure the following:
Timeout. Enter the length of time WhatsUp Gold attempts to connect to the selected device. When the specified time is exceeded without connecting, a timeout occurs and WhatsUp Gold stops trying to connect to the server. This is considered a failed connection.
Retries. Enter the number of times WhatsUp Gold attempts to send the command before the device is considered Down.
Payload size. Enter the length in bytes of each packet sent by the ping command.
Use in rescan. Enable this option to have the monitor appear in Device Properties. If enabled, clicking Rescan Device from the device management actions menu within the Device Properties (on page 86) interface adds the monitor to the selected device if the applicable protocol or service is active on that device.
Power Supply The Power Supply monitor checks manufacturer-specific power supplies devices to see if they are enabled and returning values signaling they are in an Up state.
First, the monitor first checks if the monitored device is manufactured by Dell, Cisco, HP, or EMC. Then, it checks for any enabled power supply devices. If a power supply is

WhatsUp Gold User Guide
130
disabled, the monitor ignores it. If a power supply does not return one of the following values, the monitor is considered Down.
1 - Normal (for Cisco switches/routers) 1 - OK (for Dell switches/routers) 2 - OK (for HP ProLiant servers) 3 - OK (for Dell server devices) 4 - Good (for HP ProCurve switches/routers)
Note: Not all types of power supply devices can be monitored.
Only a unique name and description are required to successfully configure this monitor, though you can click Advanced to set the SNMP timeout and number of retries as well as enable Use in Rescan if desired.
PowerShell PowerShell provides remote access of the monitored device and the ability to leverage PowerShell modules and .NET libraries installed there.
Prerequisites WhatsUp Gold uses a 32-bit (in other words, "x86") PowerShell engine. Only 32-bit PowerShell snap-ins are supported and 64-bit only snap-ins will not function properly. Snap-ins that work on both 32-bit and 64-bit operating systems are configured for 64-bit systems by default and must be manually configured for 32-bit PowerShell engine to function properly with WhatsUp Gold.
Remote Connection Requirements
Ensure the following are in place for enabling the WhatsUp Gold machine to connect using PowerShell to the destination (polled) device.
Windows Credentials (on page 221). Credentials must be used explicitly using the methods and properties provided by the Context object. HTTPS must be used as transport or polled device must be in TrustedHosts list of the machine where WhatsUp Gold is running.
Domain and hostname (https://msdn.microsoft.com/en-us/powershell/reference/5.1/microsoft.powershell.core/about/about_remote_troubleshooting). If you use user's default credentials. To use IP address alone, you will need to specify credentials at PowerShell/WinRM login. (For more info see this WinRM troubleshooting help (https://msdn.microsoft.com/en-us/powershell/reference/5.1/microsoft.powershell.core/about/about_remote_troubleshooting).)
Enable-PSRemoting (https://msdn.microsoft.com/en-us/powershell/reference/4.0/microsoft.powershell.core/enable-psremoting). Enable PowerShell remoting on destination (polled) device. For more information see link to MSDN documentation provided.

WhatsUp Gold User Guide
131
Monitor Configuration Configuration fields for this active monitor include:
Name. Enter a unique name for the active monitor. This name displays in the Monitor Library.
Description. (Optional) Enter additional information about the monitor. This description displays next to the monitor name in the Monitor Library.
Timeout (Seconds). Enter the length of time WhatsUp Gold attempts to connect to the selected device.
Run under device credentials. Enable this check box to execute the script using the Windows credentials for the device.
Script text. Enter your active monitor code.
Available Monitor Objects and Attributes PowerShell active monitor scripts have two instantiated session objects available.
Context. Implementation of the IScriptContext interface. This object provides access to runtime variables and also provides mechanism for returning results to the client. A few useful methods are listed below:
object GetProperty(string propertyName) - allows retrieval of context variable values by name.
object SetProperty (string propertyName, string propertyValue ) - allows specification of context variable values by name.
void SetResult(int resultCode, ResultsString) - allows the script to set a value to indicate success, usually 0 = success and 1 = failure.
Logger. Implementation of the ILog interface. This object provides the same methods available to C# applications. A few useful methods are listed below:
void Error(string message) - Creates an error-specific log entry that includes the message.
void Information(string message) - Creates an information-specific log entry that includes the message.
void WriteLine(string message) - Creates a generic log entry that includes the message.
Getting or Setting Properties for a Context Object You can fetch values for context properties using PowerShell active monitor scripts.
Syntax
Property-Value = Context.GetProperty("Property-Name")
Context.SetProperty("Property-Name","Property-Value")
Example

WhatsUp Gold User Guide
132
$DeviceIpAddress = $Context.GetProperty("Address")
$Context.SetProperty("Timeout", "180")
Setting Result String and Monitor Status Indicator The result string you set will be added to the description in the monitor's status change. The status flag you set (0, 1) up/down determines the indicator shown in the State Change Timeline.
# After a successful Get of the deviceIP, Set as result and set success flag ...
$Context.SetResult(0, "Device IP address is: " + $DeviceIpAddress)
Context Object Properties The following properties can be accessed from the connection object created when running PowerShell.
Property Name Description
DeviceID WhatsUp Gold Device identification string.
Address IP address.
Timeout Timeout value for this session. (In seconds)
Context Object Credential Properties The following credential properties can be set for the PowerShell. These are useful when you need to connect to other services, platforms, or applications after the initial PowerShell connection is made using the active monitor.
Property Name Description
CredWindows:DomainAndUserid Domain and user for the Windows Credential.
CredWindows:Password Set the Windows Password.
CredSnmpV1:ReadCommunity SNMPv1 Read Community string.
CredSnmpV1:WriteCommunity SNMPv1 Write Community string.
CredSnmpV2:ReadCommunity SNMPv2 Read Community string.
CredSnmpV2:WriteCommunity SNMPv2 Write Community string.
CredSnmpV3:AuthPassword SNMPv3 password.
CredSnmpV3:AuthProtocol(integer-value)
SNMPv3 authentication protocol. values: 1 = None, 2 = MD5, 3 = SHA

WhatsUp Gold User Guide
133
CredSnmpV3:EncryptProtocol(integer-value)
Integer value can be one of the following:
1 = None 2 = DES56 3 = AES128 4 = AES192 5 = AES256 6 = THREEDES
CredSnmpV3:EncryptPassword SNMPv3 Encrypted password.
CredSnmpV3:Username SNMPv3 user.
CredSnmpV3:Context SNMPv3 Context.
CredADO:Password ADO password.
CredADO:Username ADO username.
CredSSH:Username SSH username.
CredSSH:Password SSH password.
CredSSH:EnablePassword Enable password flag.
CredSSH:Port SSH port if other than default.
CredSSH:Timeout Timeout for SSH session.
CredVMware:Username VMware username.
CredVMware:Password VMware password.
CredTelnet:Timeout Time out value for telnet connection.
CredTelnet:Port Telnet port (if other than default).
CredTelnet:Username Telnet username.
CredTelnet:Password Telnet password.
CredJMX:Username Java Management Extensions username.
CredJMX:Password Java Management Extensions password.
CredSMIS:Timeout Storage Management timeout.
CredSMIS:Port Storage Management port.

WhatsUp Gold User Guide
134
CredSMIS:Protocol
Storage Management protocol.
CredSMIS:Username
Storage Management username.
CredSMIS:Password
Storage Management Password.
CredAWS:AccessKeyID
Amazon Web Services account ID.
CredAWS:SecureAccessKey
Amazon Web Services access key.
CredAzure:TenantID
Azure subscription ID.
CredAzure:ClientID
Azure Client account ID.
CredAzure:SecureKey Azure account key.
Example: Check if Service is Running Create a PowerShell active monitor that shows status of up only if DNS client is running using stored credentials.
# Device to Poll
$DeviceIpAddress = $Context.GetProperty("Address")
# Set the computer name directly, or...
# $CompName = mydb02.corpnet.example.com (for example)
# ...get it using WMI...

WhatsUp Gold User Guide
135
$WmiRes = Invoke-Command -ComputerName $DeviceIpAddress -ScriptBlock { Get-WmiObject Win32_Computersystem }
$CompName = $WMIRes.PSComputerName
# Run command on remote device
$PsResult = Invoke-Command -ComputerName $DeviceName -ScriptBlock { Get-Service | where { $_.Name -match "Dnscache" } }
# Check for condition of 'running'
if ($PsResult.Status -match 'Running') {
$RespondingMessage = "Process '" + $processName + "' running on " + $DeviceIpAddress + " is responding."
$Context.SetResult(0, $RespondingMessage )
} else {
$NotRunningMessage = "Process '" + $processName + "' running on " + $DeviceIpAddress + " is not responding."
$Context.SetResult(1, $NotRunningMessage )
}
Printer Printer monitor uses SNMP to collect data on SNMP-enabled network printers. The target printer must be SNMP-enabled and support the Standard Printer MIB for this monitor to work properly. Use this monitor to check for potential issues such as ink levels, paper jams, and low input media (that is to say, "paper").
Provide a unique name and description for the monitor, then configure the following:
If the ink level in any of the cartridges falls below___%. Enter a numerical value for the threshold. If the ink level of any printer ink cartridge falls below this percentage, the monitor is considered down. By default, this option is not selected.
If the printer registers any of the following alerts. Select the printer alerts for the monitor to check. If the printer registers one of the selected alerts, the monitor is considered Down. Please note, all SNMP objects associated with the available monitor alert checks displayed in the monitor configuration may or may not be supported by the specific printer being monitored depending on its manufacturer and model.
Click Advanced to set the SNMP timeout and number of retries as well as enable Use in Rescan if desired.

WhatsUp Gold User Guide
136
Process Process monitor determines if a process running and issues state changes for the device as needed.
Provide a unique name and description for the monitor, then configure the following:
Protocol to use. Select either SNMP or WMI as the protocol for the monitor to use to connect to the selected device. If using SNMP, click Advanced to set the SNMP timeout and number of retries if desired.
Process Name. Enter name of a process or click Browse (...) to navigate and connect to a device from which to select a process to monitor.
Down if the process is. Specify if the selected process is either not loaded or is running for the monitor to report a Down status.
SMI-S The SMI-S monitor determines if the selected storage device is operational. The success or failure of the monitor is dependent upon values returned by the device that can be interpreted by WhatsUp Gold as up or down.
To configure, simply provide a unique name and description for the monitor.
Note: The features described in this help topic are included in WhatsUp Gold® Total and WhatsUp Gold® Total Plus. Additionally, you must install the SMI-S agent to successfully monitor storage devices using WhatsUp Gold. Please see Installing the SMI-S Agent (on page 46) for additional information.
SNMP Extended SNMP Extended monitor checks one or more OIDs, each against its own threshold, using an XML file you import into the monitor definition. The XML file contains a list of SNMP parameters (OIDs) to monitor. Threshold operators (greater than, less than, equals, contains, and so on) within the monitor's dialog enable you to verify up or down status against expected values. You can customize threshold values as needed based on device-specific characteristics, site service level constraints, and more.
Tip: You can assemble your own XML lists of SNMP OIDs and add them to <install-directory>\Data\SNMPExtended\ on the file system where you installed WhatsUp Gold.

WhatsUp Gold User Guide
137
The following figure shows SNMP Extended configuration from Monitors Library.
Provide a unique name and description for the monitor, then configure the following:
Import. Select a parameters file from a pre-populated directory. After import, each row of the Thresholds to monitor table displays the management object as a parameter value you can monitor. Parameters are associated with OIDs in the definition file (XML) which is pre-staged on the file system where WhatsUp Gold Server is installed.
Configure. Include parameters to monitor and configure them. Configuration enables you to build exact expressions against custom threshold values. The expression will be applied to the parameter value (MIB) observed at the device. For example:
value is. Custom comparison value. When monitoring for a specific value, determine when the monitor should the report the device as Down by specifying if the response is greater than, less than, equal to, or contains the entered numeric or string value.
value is outside the range of. When monitoring a range, enter the minimum and maximum values the response must fall within for the monitor to report the device as Down.
rate of change between two polls is. When monitoring for a range of change, determine when the monitor should the report the device as Down by specifying if the response is greater than, less than, or equal to the entered value in seconds.
Enable monitoring for specific parameters by selecting the respective checkboxes. Click Advanced to set the SNMP timeout and number of retries as well as enable Use in Rescan if desired.

WhatsUp Gold User Guide
138
Add custom SNMP parameters (custom SNMP monitors defined by XML files) When you add SNMP parameters to an XML file, WhatsUp Gold expects the following format:
Syntax
<SNMPParameter Name="MibObjectName"> <ShortDescription>ObjectValueDescription</ShortDescription> <LongDescription>DetailedObjectValueDescription</LongDescription> <Type>MibObjectValueType</Type> <IndexOID>IntegerInstanceValue</IndexOID> <OID>RequiredObjectId</OID> <DisplayOID>OptionalDisplayTheOID</DisplayOID> <Units>OptionalUnitsAssociatedWithOIDValue</Units> </SNMPParameter>
Example
<SNMPParameter Name="IcUpsAlarmUpsOff"> <ShortDescription>Onboard alarm state</ShortDescription> <LongDescription>Indicates the inverter (battery power) and bypass to wall power are both off</LongDescription> <Type>Value</Type> <IndexOID /> <OID>1.3.6.1.4.1.476.1.1.1.1.6.3.12</OID> <DisplayOID /> <Units /> </SNMPParameter>
SNMP (Active) The Simple Network Management Protocol (SNMP) monitor gathers information about the functions of an SNMP-enabled network devices by querying it to verify it returns an expected value. Depending on the specific configuration, the monitor can be considered either Up or Down depending upon the returned value.
Tip: While SNMP Active monitors are used to determine Up state, SNMP Performance monitors (on page 173) in WhatsUp Gold are used to gather historic performance, accounting, fault, and security metrics data useful for reports.
Provide a unique name and description for the monitor, then configure the following:
ObjectID/Instance. Select the target device and required credentials, then select the specific SNMP object to monitor in the SNMP MIB Browser.
Check Type. Select one of the following check types: When Constant Value is selected:
Value. Depending on the Object ID you selected, enter the appropriate value.

WhatsUp Gold User Guide
139
If the value matches, then the monitor is: select Up or Down.
When Range of Values is selected:
Low Value. Depending on the Object ID you selected, enter the appropriate value.
High Value. Depending on the Object ID you selected, enter the appropriate value.
When Rate of Change in Value is selected:
Rate of Change (in variable units per second). Enter the desired value.
If the value is above the rate, then the monitor is: select Up or Down.
Click Advanced to set the SNMP timeout and number of retries as well as enable Use in Rescan if desired.
Choose MIB Select counters from computer. Specify the target host devices IP address or
click (...) to browse. SNMP v1/v2/v3 credentials. Specify the credential needed to access the MIB
on the target host or click (...) to browse. Timeout. Time interval that Network Traffic Analysis collector waits for the
Source message. Retry. Number of times that collector attempts SNMP request.
SQL Query (Active) The SQL Query monitor uses WMI or ADO authentication to determine if specific conditions exist in a Microsoft SQL, MySQL, or ORACLE database by querying the database. If the configured conditions are present, the monitor is Up. If changes made to the database since the last query cause data to no longer fall within the defined criteria, the monitor is Down.
Important: To monitor a MySQL database, download and install the MySQL .NET Connector on the WhatsUp Gold machine. Please note, only MySQL version 5.2.5 is supported due to potential compatibility issues. MySQL .NET Connector version 5.2.5 can be downloaded directly from the WhatsUp Gold website found here (http://www.ipswitch.com/mysqlnet).
Note: When connecting to a remote SQL instance, WhatsUp Gold only supports the TCP/IP network library.
Provide a unique name and description for the monitor, then configure the following:
Server Type. Select Microsoft SQL Server, MySQL, or ORACLE as the database server type. Please note, MySQL database is supported and listed as a server type option only if the MySQL 5.2.5 Connector is installed.

WhatsUp Gold User Guide
140
Connection Timeout. Enter the amount of time WhatsUp Gold waits for the server to respond before terminating the connection and returning the timeout error. The minimum allowed value is 1 second whereas maximum allowed value is 120. Please note, this setting only applies to polling whereas the query builder assumes a default of 15 seconds for the connection timeout.
Server Address. Enter the server address in the applicable format: ServerName\Instance format for Microsoft SQL Server. Example:
WUGServer\SQLEXPRESS
ServerName for MySQL. Example: WUGServer
ServerName/ServiceName for Oracle. Example: WUGServer/Oracle. Port. Enter the database server port number. SQL Query to Run. Type in a query to run against the specified database to
check for certain database conditions.
Tip: When using MS SQL, begin your query with a SELECT statement that uses full namespace notation to identify the database. For example: SELECT * FROM WhatsUp.dbo.Device
Click Build to launch the SQL Query Builder for assistance with developing proper query syntax. Only SELECT queries are allowed.
Important: WhatsUp Gold Active monitors do not store results data. If you want to track query results, use the SQL Query Performance Monitor.
Click Verify to test if the entered database query is valid.
Number of rows returned is. Select this option to determine the success or failure of the monitor scan based on rows returned by the SQL query. All database rows must match the criteria settings for the monitor to be considered Up.
Content of each retrieved row matches the following criteria. Select this option to determine the success or failure of the monitor scan based on criteria each database row must match. If multiple threshold criteria are used, all thresholds must match the criteria in each row for the monitor to be considered Up.
Click Add, Edit, and Delete as needed to create, modify, and remove database column values and conditions, respectively.
Choose Credential The ADO or Windows credential you specify is used to connect to the server and create the SQL Query monitor.
To select an ADO or Windows credential: 1 Select the ADO or Windows credential from the list or click browse (...) to choose
from the Credentials Library.

WhatsUp Gold User Guide
141
2 Click OK. SQL Query Monitor (Active) (on page 139) or SQL Query Monitor (Performance) dialog displays.
SQL Server The SQL Server monitor provides real-time information about the state and health of Microsoft SQL Server applications on your network. This monitor supports monitoring of Microsoft SQL Server 2000, and MSDE 2000 or later versions, which can be installed on any machine in your network.
WhatsUp Gold can monitor and report the status of the standard services associated with TCP/IP servers, such as SMTP, POP3, and IMAP, FTP, HTTP. If fail, users are unable to get mail, transfer files, or use the web. It is a good practice to set up monitoring on these services so you are the first to know if they fail. The SQL Server monitor extends monitoring to parameters reported by Microsoft SQL Server (and Microsoft MSDE), allowing you to get an early warning of a degradation in performance. For example, you can monitor system parameters on your SQL Server database server to see if performance is within an expected range, and if not, you can intervene before the SQL Server fails.
Provide a unique name and description for the monitor, then configure the following:
SQL Server Instance Name. Enter the name of the database to monitor. Thresholds to monitor. Enable monitoring for specific parameters by selecting
the respective checkboxes. Configure. Click to specify values for the selected parameter. Services to monitor. Enable monitoring for specific services by selecting the
respective checkboxes. Use in rescan. Enable this option to have the monitor appear in Device
Properties. If enabled, clicking Rescan Device from the device management actions menu within the Device Properties (on page 86) interface adds the monitor to the selected device if the applicable protocol or service is active on that device.
Please note, to create custom parameters to monitor, the SQL Server host must be WMI-enabled.
SSH (Active) The SSH monitor uses SSH authentication to connect to a remote device to execute commands or scripts which can be either embedded in the monitor or placed as an executable script file on the remote machine with a command embedded in the monitor to run the script. The success or failure of the monitor is dependent upon values returned by the commands or scripts that can be interpreted by WhatsUp Gold as Up or Down.
Provide a unique name and description for the monitor, then configure the following:

WhatsUp Gold User Guide
142
Command to run. Enter the command to run and execute on the remote device. The command can be anything the device can interpret and run; for example, a Unix shell command or a perl script. The command or script must return a string value. Please note, if you create a script to run on the remote device, it must be developed, tested, and/or debugged on the remote machine.
Line end character. Select the appropriate line end type:None, Linefeed, Carriage return, or Carriage return linefeed. Multiline scripts are entered and persisted on a Windows operating system and include line-ending characters that may not be recognized on the target device. This configuration feature instructs WhatsUp Gold to replace the line-ending characters with the selected characters prior to connection and command execution.
The monitor is considered Up if the following output. Select the appropriate output criteria. For example, if you are checking to see that a specific network connection is present on the remote device, ensure the output contains the specific connection. If the network connection you specify is not present when the monitor checks, the monitor is considered Down.
Use regular expression. Enable this option to apply the target string as a regular expression as it searches the output from the command and considers the selected output criteria. The target string is evaluated as simple text if this option is disabled.
SSH credential. Select the appropriate SSH credential WhatsUp Gold uses to connect to the remote device. WhatsUp Gold uses the SSH credential assigned to the monitored device if Use the device SSH credential is selected.
Use in rescan. Enable this option to have the monitor appear in Device Properties. If enabled, clicking Rescan Device from the device management actions menu within the Device Properties (on page 86) interface adds the monitor to the selected device if the applicable protocol or service is active on that device.
SSL Certificate The SSL Certificate monitor checks a specific location for the existence of a valid SSL certificate.
The monitor reports as down if one of the following is true:
URL cannot be resolved. Location on shared network cannot be accessed. SSL certificate is not found.
Monitor-Specific Settings Check certificate by URL. Select to enter a URL where the monitor should look
for a certificate. The URL must begin with a proper URI, such as http:// or https://. Additionally, this field supports appending the URL with a custom port number. Port 443 is used by default, however, you can specify an alternate port number as well. For example, to use Port 8081, use the following format: https://www.<domain>.com:8081.

WhatsUp Gold User Guide
143
Check certificate by file. Select this option to specify a shared network location of the certificate in UNC format. The monitor searches for and uses credentials tied to the target device. The device must have valid Windows credentials and you must have proper permissions to access the network share as configured.
Note: Both methods support the percent variables %device.hostname and %device.address.
Down if certificate expires in the next n days. Enable this option to have the monitor report as Down if the SSL certificate expiration date falls within a specified time frame. Enter the number of days for the monitor to consider.
Check certificate usage (verifies the Common Name matches the URL domain). Enable this option to have the monitor check that the common name on the SSL certificate matches the domain on the URL.
HTTP Proxy Settings Click on the Use Proxy Settings checkbox if the SSL Certificate you are
monitoring sits behind a proxy. Apply the following settings to forward SSL Certificate monitor traffic through the HTTP proxy.
Proxy server. Enter the address of the required proxy server if needed to access the configured URL. This option is not valid for Path to File.
Proxy port. Enter the port on which the proxy server listens.
Proxy username. If required, enter the username for the proxy server.
Proxy password. Enter the password that coincides with the username for the proxy server.
Timeout. Enter the length of time WhatsUp Gold attempts to connect to the selected device. When the specified time is exceeded without connecting, a timeout occurs and WhatsUp Gold stops trying to connect to the server. This is considered a failed connection. This option is not valid for Path to File.
Refresh Connectivity Profile Use in rescan. Enable this option to have the monitor appear in Device
Properties. If enabled, clicking Rescan Device from the device management actions menu within the Device Properties (on page 86) interface adds the monitor to the selected device if the applicable protocol or service is active on that device.
Storage Controller Health monitor Storage Controller Health monitor uses SNMP to communicate with and determine if a node within the selected storage device is operational. The success or failure of the monitor is dependent upon values returned by the device that can be interpreted by WhatsUp Gold as up or down.
To configure, simply provide a unique name and description for the monitor. Click Advanced to set the SNMP timeout and number of retries as well as enable Use in Rescan if desired.
WhatsUp Gold User Guide
144
Note: The features described in this help topic are included in WhatsUp Gold® Total and WhatsUp Gold® Total Plus. Additionally, you must install the SMI-S agent to successfully monitor storage devices using WhatsUp Gold. Please see Installing the SMI-S Agent (on page 46) for additional information.
Storage File System The Storage File System monitor determines if the selected storage device is operational. It is automatically assigned when a storage device is discovered. The success or failure of the monitor is dependent upon health and operational status values returned by the device that can be interpreted by WhatsUp Gold as up or down. To configure, simply provide a unique name and description for the monitor.
Storage Disk Drives The Storage Disk Drives monitor determines if the selected storage device is operational. It is automatically assigned when a storage device is discovered. The success or failure of the monitor is dependent upon health and operational status values returned by the device that can be interpreted by WhatsUp Gold as up or down. To configure, simply provide a unique name and description for the monitor.
Storage LUN The Storage LUN monitor determines if the selected storage device is operational. It is automatically assigned when a storage device is discovered. The success or failure of the monitor is dependent upon health and operational status values returned by the device that can be interpreted by WhatsUp Gold as up or down. To configure, simply provide a unique name and description for the monitor.
Storage Pool The Storage Pool monitor determines if the selected storage device is operational. It is automatically assigned when a storage device is discovered. The success or failure of the monitor is dependent upon health and operational status values returned by the device that can be interpreted by WhatsUp Gold as up or down. To configure, simply provide a unique name and description for the monitor.
TCPIP The TCP/IP monitor determines the status of a TCP/IP service that either does not appear in the list of standard services or uses a non-standard port.
Provide a unique name and description for the monitor, then configure the following:
Network type. Select the network type for the FTP (File Transfer Protocol) service is TCP; the network type for the RADIUS (Remote Authentication and Dial-In User Service) service is UDP; the HTTPS monitor uses the SSL type.
Port number. Enter the TCP or UDP port that you want to monitor.
WhatsUp Gold User Guide
145
Timeout. Enter the length of time WhatsUp Gold attempts to connect to the selected device. When the specified time is exceeded without connecting, a timeout occurs and WhatsUp Gold stops trying to connect to the server. This is considered a failed connection.
Script. Enter your script using as many Send, Expect, SimpleExpect, and Flow Control keywords as you would like. For more information, see Script Syntax.
Use in rescan. Enable this option to have the monitor appear in Device Properties. If enabled, clicking Rescan Device from the device management actions menu within the Device Properties (on page 86) interface adds the monitor to the selected device if the applicable protocol or service is active on that device.
Click Expect to open the Rules Expression editor if desired. Any text placed in the Expression box appends to the end of the script as an Expect expression.
Telnet The Telnet monitor checks for a Telnet server on port 23. If no telnet service responds on this port, then the service is considered Down.
Provide a unique name and description for the monitor, then configure the following:
Timeout. Enter the length of time WhatsUp Gold attempts to connect to the selected device. When the specified time is exceeded without connecting, a timeout occurs and WhatsUp Gold stops trying to connect to the server. This is considered a failed connection.
Use in rescan. Enable this option to have the monitor appear in Device Properties. If enabled, clicking Rescan Device from the device management actions menu within the Device Properties (on page 86) interface adds the monitor to the selected device if the applicable protocol or service is active on that device.
Temperature Temperature monitor checks manufacturer-specific temperature probes to see if they return a value signaling they are in an Up state. The monitor initially checks the manufacturer of the device (Cisco, Dell, HP, or Ravica, for example). It then checks enabled temperature probes.
If a temperature probe is disabled, the monitor ignores it. If a temperature probe does not return one of the following run state indicators (with respect to the manufacturer), the monitor is considered Down.
1 - Normal (for Cisco switches and routers) 2 - OK (for HP ProLiant servers) 2 - Normal (for Ravica temperature probes) 3 - OK (for Dell Servers) 4 - Good (for HP ProCurve switches and routers)

WhatsUp Gold User Guide
146
Only a unique name and description are required to successfully configure this monitor, though you can click Advanced to set the SNMP timeout and number of retries as well as enable Use in Rescan if desired.
VoIP The VoIP monitor determines if the Mean Opinion Score (MOS) for an IP SLA device 'falls out' of the configured threshold. If the returned value exceeds the defined threshold, the monitor is considered Down.
Provide a unique name and description for the monitor, then configure the following:
Acceptable MOS threshold. Select the acceptable MOS https://www.itu.int/rec/dologin_pub.asp?lang=e&id=T-REC-P.800.1-201607-I!!PDF-E&type=items threshold on a scale from 1 to 5 —where 5 denotes perfect call quality.
Check MOS values of all jitters configured on the device. Select this option to include all of the device RTT entries to check MOS https://www.itu.int/rec/dologin_pub.asp?lang=e&id=T-REC-P.800.1-201607-I!!PDF-E&type=items performance thresholds.
Only check MOS if tag contains. Select this option to limit the device RTT entries that use this MOS https://www.itu.int/rec/dologin_pub.asp?lang=e&id=T-REC-P.800.1-201607-I!!PDF-E&type=items performance threshold. Enter all, or a portion, of the tag used to identify the source and destination devices.
Click Advanced to set the timeout and number of retries if desired.
Note: For more information, see the topic titled Monitoring VoIP IP SLA (on page 274).
WAP Radio The WAP Radio monitor uses SNMP authentication to determine the status of a Cisco Aironet wireless access point.
First, the monitor first checks the ifType (OID 1.3.6.1.2.1.2.2.1.3) value. The ifType value of 71 - IEEE 80211 must be present for the monitor to continue checking the WAP radio device status. Then, if the ifType value is true, the ifAdminStatus (OID: 1.3.6.1.2.1.2.2.1.7) value is checked. If the ifAdminStatus value for the interface is in the Down or Testing state, the active monitor is considered Down and the ifOperStatus (OID: 1.3.6.1.2.1.2.2.1.8) value is checked. If the ifOperStatus value is 1 - Up or 5 - Dormant, the WAP radio is determined to be in the Up state. Otherwise, the device is considered to be in the Down state.
Only a unique name and description are required to successfully configure this monitor, though you can click Advanced to set the SNMP timeout and number of retries as well as enable Use in Rescan if desired.

WhatsUp Gold User Guide
147
WMI Formatted The WMI Formatted monitor checks for specific values on WMI-enabled devices. Monitored metrics include systems resources like CPU, disk, and memory utilization, as well as specific process performance counters. While similar to the WMI monitor that uses raw data, the WMI Formatted active monitor uses calculated counter data.
Provide a unique name and description for the monitor, then configure the following:
Performance Counter/Instance. Select the target device, performance object, counter, and instance to monitor.
Check Type. Select one of the following check types: When Constant Value is selected:
Value. Depending on the performance counter selected, enter the appropriate value.
If the value matches, then the monitor is: select Up or Down.
When Range of Values is selected:
Low Value. Depending on the performance counter selected, enter the appropriate value.
High Value. Depending on the performance counter selected, enter the appropriate value.
When Rate of Change in Value is selected:
Rate of Change (in variable units per second). Enter the desired value.
If the value is above the rate, then the monitor is: select Up or Down.
Click Advanced to set the rescan usage information.
WMI The WMI monitor checks for specific values on WMI-enabled devices. Monitored metrics include systems resources like CPU, disk, and memory utilization, as well as specific process performance counters.
Provide a unique name and description for the monitor, then configure the following:
Performance Counter/Instance. Select the target device, performance object, counter, and instance to monitor.
Check Type. Select one of the following check types: When Constant Value is selected:
Value. Depending on the performance counter selected, enter the appropriate value.
If the value matches, then the monitor is: select Up or Down.

WhatsUp Gold User Guide
148
When Range of Values is selected:
Low Value. Depending on the performance counter selected, enter the appropriate value.
High Value. Depending on the performance counter selected, enter the appropriate value.
When Rate of Change in Value is selected:
Rate of Change (in variable units per second). Enter the desired value.
If the value is above the rate, then the monitor is: select Up or Down.
Click Advanced to set the rescan usage information.
Advanced WMI Monitor Properties Rescan usage. Use this option to select how you want this WMI monitor to
operate during discovery rescan. Don't use in rescan. Select this option if you do not want to use this particular
WMI monitor definition during rescan. As a result, this monitor will not appear in the list of monitors to choose during rescan.
Use in rescan/Don't monitor. Select this option if you want to use this monitor during rescan, but do not want to use it as a monitor on the devices that were found during that scan. This is useful in typing a device by a particular aspect, but not always monitoring that aspect.
Use in rescan/Enable monitoring. Select this option if you want to use this monitor during rescan, and want to add this WMI active monitor to the devices found during rescan. (This option is not available for the CPU and Ping Performance Monitor advanced settings.)
Note: If WMI is used during rescan, you may notice that rescan takes quite a bit longer than if you do not use it. This is because WMI timeouts are relatively long, so the newly discovered device will have to expire this timeout before rescan continues.
Set Polling Properties Set these active monitor polling properties, then click Next >>.
Enable polling for this Active Monitor. Select this option to have WhatsUp Gold poll the active monitor. (Or, clear this option to stop polling.)
Network interface to use for this poll. Select a network interface you want to send the ICMP echo ("ping") packets to.
Advanced. (Optional) Click if you want to set the timeout for polling frequency or to permit the active monitor for rescan use.
Apply Action to Monitor Apply an Action to fire upon state change (on page 212) of this monitor.

WhatsUp Gold User Guide
149
To apply an Action Policy to the monitor: 1 Select the Apply this Action Policy option. 2 Select a policy from the Action policy list. This list is populated with action
policies currently configured in the Action Policy Library. You can also create a new, or edit an existing action policy by clicking the browse (...) button next to the list box.
To apply one or more individual actions to the monitor: 1 Select the Apply individual actions option. 2 Do one or more of the following: Click Add to configure an action for the monitor.
Select a configured action and click Edit to change the settings for that action.
Select a configured action and click Remove to delete the action from the list. Removing the action from the list also deletes all records for this action (on this monitor) from the Action Log (on page 797).
Using Action Policies Action Policies Library wizard enables you to associate this monitor with a sequence of one or more actions that implements a policy (such as sending e-mail or SMS notifications if a load balancer is down). Policies in WhatsUp Gold enable you to sequence multiple actions together and apply appropriate controls after a specific condition is detected.
Note: If you make changes to the controls in place for an action policy, the changes are applied to all of the devices and monitors that use that particular policy.
For more information, see:
Adding and editing Action Policies (on page 252)
Configuring an Implicit Action Policy (on page 149)
WhatsUp Gold Builtin Action Types
Implicit Action Policy The Implicit Action policy automatically assigns actions to all devices in your database. You cannot opt out of the Implicit Action policy and it only assigns actions to devices. You must create separate action policies for device monitors.
If at any time during the normal operation of Network Performance Monitor you notice that actions are firing and you cannot find the action associated to the down device or monitor, remember to check the Implicit Action Policy. In previous versions of Network Performance Monitor, the Web Alarm action was included in the Implicit Action policy. This is no longer true in Network Performance Monitor. For more information on the Web Alarm action, see About Web Alarms.

WhatsUp Gold User Guide
150
To configure the Implicit Action Policy
1 Go to the Index tab, then navigate to Network Performance Monitor Alerts and Actions > Actions > Action Policies. The Action Policies Library appears.
2 Select the Implicit Action policy, then click Edit from the row Options menu. The Edit Action Policy dialog appears.
To add an action to the policy, click Add.
To modify an action in the policy, select it, then click Edit. To delete an action form the policy, select it, then click Remove.
To have Network Performance Monitor execute only the first action in the list for each state, and stop when that action fires successfully, select Only execute first action (for each state).
To modify an action's placement in the list, click Up or Down.
3. Click OK to save changes.
Passive Monitors Passive Monitors run as background processes (OS-level logging, SNMP traps waiting for a condition, for example) on the monitored device, Passive Monitors are not initiated by WhatsUp Gold like an active monitor.
Windows Event Log (on page 151). Platform log for Windows device. Syslog (on page 150). Platform log for Linux/UNIX device. SNMP Trap (on page 152). Trigger/predicate that denotes an event/threshold
was met on the machine where the trap was set.
Syslog Syslog monitor listens for Syslog messages on the devices to which it is assigned.
Note: For more information about Syslog facilities and levels of severity, see RFC5424 (http://tools.ietf.org/html/rfc5424) (page 9 for facilities and page 10 for levels of severity).
Provide a unique name and description for the monitor, then click Add to launch the Rules Expression Editor to create an expression, test it, and compare it to potential payloads.
Important: If you define multiple payload Match On expressions, each expression is considered individually (think "or" operator).

WhatsUp Gold User Guide
151
Windows Event Log The Windows Event Log monitor uses WMI authentication to listen for Windows events on the devices to which it is assigned. To use multiple Windows Event Log monitors, assign a unique monitor to each device. When assigning a Windows Event Log monitor, ensure the device has credentials assigned to it first.
Provide a unique name and description for the monitor, then configure the following:
Condition. Enter a list of conditions to match. Only log entries matching these expressions are converted to events. Conditions are processed sequentially from top to bottom. As each condition is evaluated, its results are applied to the next condition until all conditions are evaluated. For complex sets of conditions involving both ANDs and ORs, this serial logic may produce different results than intended. As a best practice, we recommend keeping conditions simple by opting for multiple Passive Monitors over complex sets of conditions. When complex conditions are unavoidable, we recommend grouping all OR conditions together at the beginning of the set of conditions, followed by the ANDs. Click Edit to add or edit a condition or Clear to remove a condition from the box.
Match On. Click Add to launch the Rules Expression Editor to create an expression, test it, and compare it to potential payloads.
Important: If you have multiple payload "match on" expressions, they are linked by "OR" logic—not "AND" logic. If you have two expressions, one set to "AB" and the other to "BA", it matches against a trap containing any of the following: "AB" or "BA" or "ABBA".
WinEvent Conditions Not. Select this option to filter the conditions that match the string. Parameter. Select a Windows Event Log parameter for which to match on. Category. Subcategory for this event. This subcategory is source-specific. CategoryString. Translation of the subcategory. The translation is source-
specific. Computer. The computer that the event took place on. Event ID. Identifier of the Windows event. This is specific to the source that
generated the event log entry, and is used, together with Source, to uniquely identify a Windows event type.
Event Type. Type of event. Value and Meaning of the Event Type:
1 Error
2 Warning
3 Information

WhatsUp Gold User Guide
152
4 Security audit success
5 Security audit failure
Logfile. Name of Windows event log file. Description. Use this parameter to give a brief description of the logged event. Source. Name of the source (application, service, driver, subsystem) that
generated the entry. It is used, together with EventIdentifier to uniquely identify a Windows event type.
Type. Type of event. This is an enumerated string. It is preferable to use the EventType property rather than the Type property, because Type is a string. Strings are localized and using Type will not allow for matching on non-English operating systems.
User. User name for the logged-on user when an event occurred. If the user name cannot be determined, this will be NULL.
Operator. Select the operator that links the parameter to the value: =, >, <, > =, < =, ! =
Value. Enter a value for the selected parameter. And/Or. You may select and/or to add another condition to the string.
SNMP Trap The SNMP Trap monitor listens for unsolicited messages from a monitored network device notifying WhatsUp Gold of a specific event. The monitor can be configured to listen for all SNMP traps or for only specific types.
Provide a unique name and description for the monitor, then configure the following:
Enterprise/OID. Select the desired object identifier (OID) from the Enterprise section of the MIB. This is the SNMP enterprise identifier in the trap, which is used for unique identification of traps for a particular application. If you specify the OID in this box, then an incoming trap matches this rule only if the trap enterprise box begins with the OID that you have specified. If you are unsure of the OID to use, or you do not need to be specific, you can leave this box blank and it is ignored. Please note, this option is only available if Generic Type is set to 6-EnterpriseSpecific.
Generic Type (Major). Select the SNMP Trap type. Each trap has a generic type number which is part of the rule determining the matching criteria for an incoming trap.
Specific Type (Minor). Enter an integer value from 0 to 4294967296. Please note, the Generic Type (Major) must be set to Enterprise Specific.
Payload. Click Add to launch the Rules Expression Editor to create an expression, test it, and compare it to potential payloads.
Important: If you have multiple payload "match on" expressions, they are linked by "OR" logic—not "AND" logic. If you have two expressions, one set to "AB" and the other to "BA", it matches against a trap containing any of the following: "AB" or "BA" or "ABBA".

WhatsUp Gold User Guide
153
Performance Monitors Performance Monitors return health and performance metrics over time and enable you to leverage WhatsUp Gold Reporting (on page 410) for calculating averages, visualizing trends, and tracking history.
Tip: Performance monitors provide historic data and up-to-moment troubleshooting data (on page 788).
Hardware APC UPS
(Performance) (on page 160)
Printer (Performance) (on page 168)
Interface Utilization (on page 169)
Session / OS JMX
(Performance) (on page 168)
PowerShell (Performance) (on page 164)
SSH (on page 173)
Active Script (Performance) (on page 154)
SQL Query Monitor (on page 139)
Windows Performance Counter (on page 174)
Hyper-V Event Log (on page 175)
Hyper-V Host VM Monitor (on page 177)
Network Management and Instrumentation SNMP Monitor (on page 173) WMI Formatted Monitor (on page
174) WMI Monitor (on page 175) Ping Latency and Availability (on
page 171)
Disk I/O and Disk Throughput Disk Utilization
(on page 167) VMware IOPS
Monitor (on page 173)
Hyper-V Disk Activity (on page 168)
Cloud Azure Billing (on
page 164) Azure
Performance (on page 161)
AWS Cloudwatch (on page 160)
AWS Billing (on page 160) (AWS Cloudwatch using Billing namespace)

WhatsUp Gold User Guide
154
Active Script (Performance) The Active Script Performance monitor enables you to write VBScript and JScript to easily poll one or more SNMP or WMI values, perform math or other operations on those values, and graph a single output value. You should only use the Active Script Performance Monitor when you need to perform calculations on the polled values. Keep in mind that although you can poll multiple values using the feature, only one value will be stored to the database: the outcome of your scripted calculation.
The Active Script performance monitor requires one or more of the following credentials:
SNMPv1
SNMPv2
SNMPv3
WMI
Configure the Active Script performance monitor using the following boxes:
Name. Enter a unique name for the performance monitor. This name displays in the Monitor Library.
Description. (Optional) Enter a short description for the performance monitor. This description displays next to the performance monitor in the Monitor library.
Script type. Select either JScript or VBScript.
Timeout. Enter the length of time WhatsUp Gold attempts to connect to the selected device.
Polling interval. Specify how often WhatsUp Gold should request updated information from the device.
Reference variables. Add, Edit, or Remove SNMP and WMI reference variables . Please note, the use of reference variables in the Active Script performance monitor is optional. For additional information, please see Using Reference Variables with Script Monitors (on page 156).
Script text. Enter your monitor code.
To configure an SNMP Active Script performance monitor: 1 Click from the Add Active Script Performance Monitor dialog to add a new
variable to the Reference variables field. The Add New Reference Variable dialog appears.
2 Enter the appropriate information: Variable name. Enter a unique name for the variable.
Description. (Optional) Enter a short description for the variable. 3 Select the SNMP radio button. 4 Enter the Timeout and Retries count for connection to the device. These are
optional field entries.
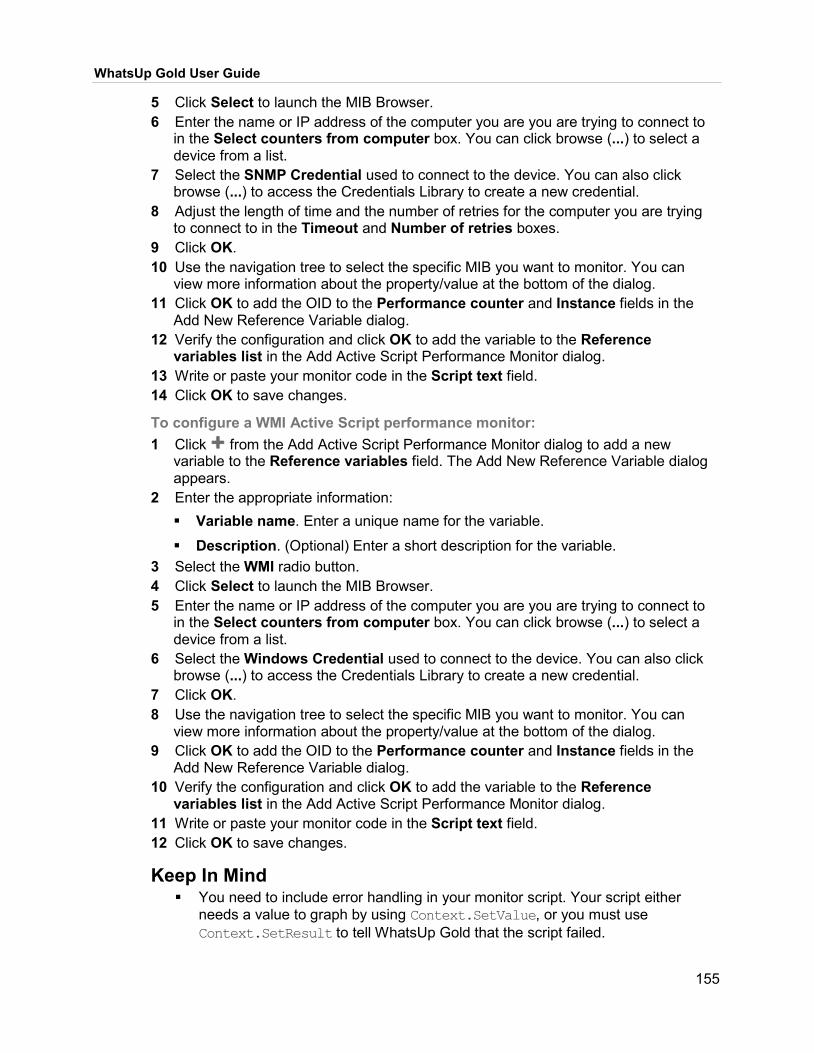
WhatsUp Gold User Guide
155
5 Click Select to launch the MIB Browser. 6 Enter the name or IP address of the computer you are you are trying to connect to
in the Select counters from computer box. You can click browse (...) to select a device from a list.
7 Select the SNMP Credential used to connect to the device. You can also click browse (...) to access the Credentials Library to create a new credential.
8 Adjust the length of time and the number of retries for the computer you are trying to connect to in the Timeout and Number of retries boxes.
9 Click OK. 10 Use the navigation tree to select the specific MIB you want to monitor. You can
view more information about the property/value at the bottom of the dialog. 11 Click OK to add the OID to the Performance counter and Instance fields in the
Add New Reference Variable dialog. 12 Verify the configuration and click OK to add the variable to the Reference
variables list in the Add Active Script Performance Monitor dialog. 13 Write or paste your monitor code in the Script text field. 14 Click OK to save changes.
To configure a WMI Active Script performance monitor: 1 Click from the Add Active Script Performance Monitor dialog to add a new
variable to the Reference variables field. The Add New Reference Variable dialog appears.
2 Enter the appropriate information: Variable name. Enter a unique name for the variable.
Description. (Optional) Enter a short description for the variable. 3 Select the WMI radio button. 4 Click Select to launch the MIB Browser. 5 Enter the name or IP address of the computer you are you are trying to connect to
in the Select counters from computer box. You can click browse (...) to select a device from a list.
6 Select the Windows Credential used to connect to the device. You can also click browse (...) to access the Credentials Library to create a new credential.
7 Click OK. 8 Use the navigation tree to select the specific MIB you want to monitor. You can
view more information about the property/value at the bottom of the dialog. 9 Click OK to add the OID to the Performance counter and Instance fields in the
Add New Reference Variable dialog. 10 Verify the configuration and click OK to add the variable to the Reference
variables list in the Add Active Script Performance Monitor dialog. 11 Write or paste your monitor code in the Script text field. 12 Click OK to save changes.
Keep In Mind You need to include error handling in your monitor script. Your script either
needs a value to graph by using Context.SetValue, or you must use Context.SetResult to tell WhatsUp Gold that the script failed.

WhatsUp Gold User Guide
156
Context.GetReferenceVariable will return 'null' if the poll fails for any reason. If you do not have a call to SetValue or SetResult, the script does not report
any errors and no data is graphed. If SetValue is used, it is not necessary to use SetResult, as SetValue
implicitly sets SetResult to 0, or "good." Results from this performance monitor are displayed on Custom Performance
Monitors full and dashboard reports. Errors from this performance monitor are displayed in the Performance Monitor
Error log, as well as EventViewer.exe.
Important: The first time that you poll a WMI reference variable that requires two polls in order to calculate an average (such as "Processor\% Processor Time"), it returns "Null."
Warning: Modifying the configuration of any of the VoIP Active Script performance monitors is not recommended; doing so prevents the VoIP setup utility from detecting pre-existing VoIP configuration.
Using Reference Variables with Script Monitors Reference variables (also called "percent variables") (on page 851) enable you reference and represent device properties and underlying SNMP or WMI object data. The use of reference variables in the Active Script Performance Monitor is optional.
Use Context.GetReferenceVariable,for reference variables to be polled and their data graphed. By using the Context.GetReferenceVariable (variable name), you only need to specify the name of a pre-defined variable. WhatsUp Gold uses device credentials and connects to the target device using SNMP or WMI to retrieve the requested information. This information is stored in a variable that you can use later in your script.
Note: You can use up to 10 reference variables in each Active Script Performance Monitor.
Add New Reference Variable Use this dialog to add a reference variable. Reference variables simplify access to SNMP and WMI mechanisms for use in your script. They allow point-and-click configuration of many common performance values, reducing the overall complexity of the script. Create reference variable names at monitor creation time and access the reference variables by name using the Context method GetReferenceVariable("variable name"). For more information, see Using the Context Object with Performance Monitors (on page 157).
Variable name. Enter a name for the variable. The name cannot contain spaces or special characters.

WhatsUp Gold User Guide
157
Note: You cannot use the same variable name twice when creating an Active Script performance monitor. You can use a different variable name to call for the same reference variable, but it must use a different name.
Description. Enter a description for the variable. Object type. Select either SNMP, WMI (Raw), or WMI (Formatted).
Important: The option to select WMI (Raw) or WMI (Formatted) is only available when adding a reference variables to a Powershell Scripting Performance Monitor. When adding a reference variable to an Active Script Performance monitor, you can select WMI as an object type but cannot specify Raw or Formatted. For Active Script Performance monitors, when WMI is selected, Raw is implied.
Timeout. If you select SNMP, you will have the option to enter a value for the timeout, or the amount of seconds WhatsUp Gold will wait for a response to the poll.
Important: The timeout specified here should not exceed the timeout for the entire monitor as a whole.
Retries. If you select SNMP, you will have the option to enter a value for the number of times WhatsUp Gold should attempt to retry the poll.
Performance Counter. For SNMP, it is the OID of the object to poll. For WMI, this and the Instance box are read-only and will display the contents you have selected in the WMI Browser.
Instance. The instance of the performance counter.
Using the Context Object with Performance Monitors The context object provides an interface for your script to interact with WhatsUp Gold.
All methods and properties are retrieved using the Context namespace.
Note: You may have to remove the copyright information from the cut and paste if it appears when you copy from this help file.
Methods Method description LogMessage(sText); This method allows for a message to be written to the
WhatsUp Gold debug log.
Example
JScript
Context.LogMessage( "Checking Monitor name using
Context.GetProperty()");
VBScript

WhatsUp Gold User Guide
158
Context.LogMessage "Checking Address using Context.GetProperty()"
PutProperty(sPropertyName); This method allows you to store a value in the INMSerialize object. This value is retained across polls. (This method is for Active Script only.)
Example
JScript
var nCount = parselnt(nNum) +1;
Context.PutProperty("MyNumeric",nCount);
SetProperty(sPropertyName); This method allows you to store a value in the INMSerialize object. This value is retained across polls. (This method is for PowerShell only.)
SetResult(nCode, sText); This method allows for a result code and result message to be set. This is how you can tell the WhatsUp Gold system if the monitor succeeds or fails.
Every script should call SetResult. If SetResult is not called, the script is always assumed to have succeeded.
Example
JScript
Context.SetResult(0, "Script completed
successfully."); //Success
Context.SetResult(1, "An error occurred.");
//Failure
VBScript
Context.SetResult 1, "An error occurred."
GetReferenceVariable(sRefVarName );
This method allows the code to grab a reference variable to be used in the monitor.
Example
JScript
Context.GetReferenceVariable("A")
A reference variable "A" would have had to have been created.
SetValue(nValue); This method allows you to graph a value.
Example
JScript
Context.SetValue(245)

WhatsUp Gold User Guide
159
GetProperty(sPropertyName); This method offers access to any of the device properties listed below. These names are case sensitive.
Property Description "ActiveMonitorTypeName" The active monitor
display name
"Address" The IP address of the device
"DeviceID" The device ID
"Mode" 1 = doing discovery 2 = polling 3 = test
"ActiveMonitorTypeID" The active monitor's type ID
"CredSnmpV1:ReadCommunity" SNMP V1 Read community
"CredSnmpV1:WriteCommunity" SNMP V1 Write community
"CredSnmpV2:ReadCommunity" SNMP V2 Read community
"CredSnmpV2:WriteCommunity" SNMP V2 Write community
"CredSnmpV3:Username" SNMP V3 Username
"CredSnmpV3:Context" SNMP V3 Context
"CredSnmpV3:AuthPassword" SNMP V3 Authentication password
"CredSnmpV3:AuthProtocol" SNMP V3 Authentication protocol
"CredSnmpV3:EncryptPassword" SNMP V3 Encrypt password
"CredSnmpV3:EncryptProtocol" SNMP V3 Encrypt protocol
"CredWindows:DomainAndUserid" Windows NT Domain and User ID
"CredWindows:Password" Windows NT Password
Example
JScript
var sAddress = Context.GetProperty("Address");
var sReadCommunity =
Context.GetProperty("CredSnmpV1:ReadCommunity");
var nDeviceID = Context.GetProperty("DeviceID");
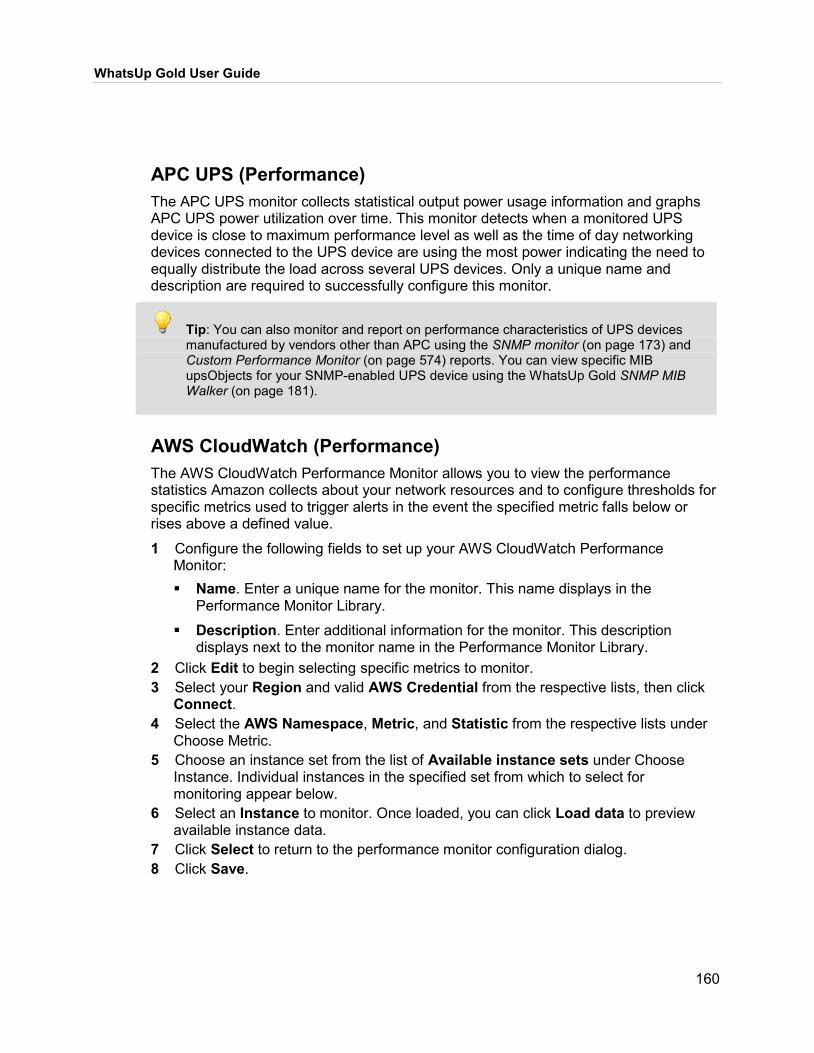
WhatsUp Gold User Guide
160
APC UPS (Performance) The APC UPS monitor collects statistical output power usage information and graphs APC UPS power utilization over time. This monitor detects when a monitored UPS device is close to maximum performance level as well as the time of day networking devices connected to the UPS device are using the most power indicating the need to equally distribute the load across several UPS devices. Only a unique name and description are required to successfully configure this monitor.
Tip: You can also monitor and report on performance characteristics of UPS devices manufactured by vendors other than APC using the SNMP monitor (on page 173) and Custom Performance Monitor (on page 574) reports. You can view specific MIB upsObjects for your SNMP-enabled UPS device using the WhatsUp Gold SNMP MIB Walker (on page 181).
AWS CloudWatch (Performance) The AWS CloudWatch Performance Monitor allows you to view the performance statistics Amazon collects about your network resources and to configure thresholds for specific metrics used to trigger alerts in the event the specified metric falls below or rises above a defined value.
1 Configure the following fields to set up your AWS CloudWatch Performance Monitor: Name. Enter a unique name for the monitor. This name displays in the
Performance Monitor Library.
Description. Enter additional information for the monitor. This description displays next to the monitor name in the Performance Monitor Library.
2 Click Edit to begin selecting specific metrics to monitor. 3 Select your Region and valid AWS Credential from the respective lists, then click
Connect. 4 Select the AWS Namespace, Metric, and Statistic from the respective lists under
Choose Metric. 5 Choose an instance set from the list of Available instance sets under Choose
Instance. Individual instances in the specified set from which to select for monitoring appear below.
6 Select an Instance to monitor. Once loaded, you can click Load data to preview available instance data.
7 Click Select to return to the performance monitor configuration dialog. 8 Click Save.

WhatsUp Gold User Guide
161
Polling Interval After you configure and apply a AWS CloudWatch (Performance) monitor to a device, you can adjust its Polling Interval from Device Properties (on page 86) ( ).
AWS Cloud (Billing and Usage) Azure Cloud Billing Monitor gets periodic usage and billing totals from the Enterprise Azure Management Portal (https://ea.azure.com/).
Note: This monitor requires (enrollment number/API key). For more information, see the topic titled Azure Credential (on page 228).
Name. Enter a unique name for the monitor. This name displays in the Performance Monitor Library.
Description. Enter additional information for the monitor. This description displays next to the monitor name in the Performance Monitor Library.
Polling Interval. (Unused). Polling is triggered at regular intervals by Microsoft.
Azure Cloud (Performance) The Azure Cloud Performance Monitor allows you to select, poll, and record Microsoft Azure performance data. Cloud monitors enable you to integrate WhatsUp Gold with the cloud vendor's management service and track your subscription services and resources from WhatsUp Gold like traditional WhatsUp Gold device roles.
Tip: You can select the cloud resource you want to monitor at configuration time using the Create Azure Cloud Monitor dialog. For example, if you add an Azure blob storage or table service to your cloud subscription and want to add a new monitor, you can create and apply a new monitor directly —no new discovery scan is needed.
1 Configure the following fields to set up your Azure Cloud Performance Monitor: Name. Enter a unique name for the monitor. This name displays in the
Performance Monitor Library.
Description. Enter additional information for the monitor. This description displays next to the monitor name in the Performance Monitor Library.

WhatsUp Gold User Guide
162
2 Click Edit —select an Azure credential from the list, then click OK.
3 Browse for Azure resources associated with this credential and select them for
monitoring. Browse for resources in either of two modes: Device Context. A device (VMs, for example) managed by the Azure
subscription associated with the current credential. (show me)

WhatsUp Gold User Guide
163
Subscription. Any resource groups that you granted access to when you created your API Key, and scope down: (show me)
Resource Group
Resource Type
Resource 1 Select a Metric. And click Load data to preview current data with the given
Aggregation Type (Average, Total, ...) 2 Click Save to return to the performance monitor configuration dialog. 3 View the summary, and click Save to add the monitor.

WhatsUp Gold User Guide
164
Edit Polling Interval After you configure and apply a Azure Cloud (Performance) monitor to a device, you can edit the Polling Interval applied to a specific device from Device Properties (on page 86) ( ).
Azure Cloud (Billing Usage) Azure Cloud Billing Monitor gets periodic usage and billing totals from the Enterprise Azure Management Portal (https://ea.azure.com/).
Note: This monitor requires (enrollment number/API key). For more information, see the topic titled Azure Credential (on page 228).
Name. Enter a unique name for the monitor. This name displays in the Performance Monitor Library.
Description. Enter additional information for the monitor. This description displays next to the monitor name in the Performance Monitor Library.
Polling Interval. Enter an interval to fetch the billing total. The frequency and availability of usage values is determined by Azure.
CPU Utilization (Performance) Choose collection options for your CPU Utilization (Performance) monitor:
Collect data for. Select CPU(s) you want to gather data on. Data collection interval. Enter how often you want data to be collected
(minutes). Click Advanced to access Data Collection Advanced Settings (on page 177).
PowerShell Scripting PowerShell Scripting enables you to create custom performance monitors using Windows PowerShell.

WhatsUp Gold User Guide
165
Important: WhatsUp Gold uses a 32-bit (i.e. x86) PowerShell engine. Therefore, only 32-bit PowerShell snap-ins are supported and 64-bit only snap-ins will not function properly. Snap-ins usable in both 32-bit and 64-bit operating systems are configured for 64-bit systems by default and must be manually configured for 32-bit PowerShell engine to function properly with WhatsUp Gold.
The PowerShell Scripting performance monitor requires the following credential:
Windows
Configure the PowerShell Scripting performance monitor using the following boxes:
Name. Name for the performance monitor. This name displays in the Monitor Library.
Description. Optional description for the performance monitor that displays as column data in the Monitor Library.
Timeout. Duration WhatsUp Gold attempts to connect to the selected device. This is considered a failed connection.
Polling Interval. Specify how often WhatsUp Gold should request updated information from the device.
Note: Though the maximum timeout allowed is 60 seconds, Ipswitch does not recommend setting a timeout exceeding 10 seconds. You are encouraged to use the shortest timeout possible.
Reference variables. Add, edit, or remove SNMP and WMI reference variables. See steps below to configure either an SNMP or WMI PowerShell Scripting Performance monitor.
Note: The use of reference variables in the PowerShell performance monitor is optional. If you do use them, you must use Context.GetReferenceVariable, for reference variables to be polled and their data graphed. Reference variables simplify your scripting code and enable you to write scripts efficiently, without having to use a list of device properties, as with the Script Action and Script Active Monitor. They manage the underlying SNMP or WMI mechanisms you would normally have to manage in order to access SNMP or WMI counters on a remote device. By using the Context.GetReferenceVariable (variable name), you only need to specify the name of a pre-defined variable. WhatsUp Gold uses device credentials and connects to the target device using SNMP or WMI to retrieve the requested information. This information is stored in a variable that you can use later in your script. For more information, see Using the Context Object with Performance Monitors (on page 157).
Run using Windows credentials assigned to the device. Enable this option to execute the script using the Windows credentials for the affected device.
Script text. Enter your monitor code.

WhatsUp Gold User Guide
166
Important: The first time that you poll a WMI reference variable that requires two polls in order to calculate an average (such as "Processor\% Processor Time"), it returns "Null."
To configure an SNMP PowerShell Scripting performance monitor: 1 Click from the Powershell Scripting Performance Monitor dialog to add a new
variable to the Reference variables field. The Add New Reference Variable dialog appears.
2 Enter the appropriate information: Variable name. Enter a unique name for the variable.
Description. (Optional) Enter a short description for the variable. 3 Select the SNMP radio button. 4 Enter the Timeout and Retries count for connection to the device. These are
optional field entries. 5 Click Select to launch the MIB Browser. 6 Enter the name or IP address of the computer you are you are trying to connect to
in the Select counters from computer box. You can click browse (...) to select a device from a list.
7 Select the SNMP Credential used to connect to the device. You can also click browse (...) to access the Credentials Library to create a new credential.
8 Adjust the length of time and the number of retries for the computer you are trying to connect to in the Timeout and Number of retries boxes.
9 Click OK. 10 Use the navigation tree to select the specific MIB you want to monitor. You can
view more information about the property/value at the bottom of the dialog. 11 Click OK to add the OID to the Performance counter and Instance fields in the
Add New Reference Variable dialog. 12 Verify the configuration and click OK to add the variable to the Reference
variables list in the Powershell Scripting Performance Monitor dialog. 13 Write or paste your monitor code in the Script text field. 14 Click OK to save changes.
To configure a WMI PowerShell Scripting performance monitor: 1 Click from the Powershell Scripting Performance Monitor dialog to add a new
variable to the Reference variables field. The Add New Reference Variable dialog appears.
2 Enter the appropriate information: Variable name. Enter a unique name for the variable.
Description. (Optional) Enter a short description for the variable. 3 Select the WMI radio button. 4 Click Select to launch the MIB Browser. 5 Enter the name or IP address of the computer you are you are trying to connect to
in the Select counters from computer box. You can click browse (...) to select a device from a list.

WhatsUp Gold User Guide
167
6 Select the Windows Credential used to connect to the device. You can also click browse (...) to access the Credentials Library to create a new credential.
7 Click OK. 8 Use the navigation tree to select the specific MIB you want to monitor. You can
view more information about the property/value at the bottom of the dialog. 9 Click OK to add the OID to the Performance counter and Instance fields in the
Add New Reference Variable dialog. 10 Verify the configuration and click OK to add the variable to the Reference
variables list in the Powershell Scripting Performance Monitor dialog. 11 Write or paste your monitor code in the Script text field. 12 Click OK to save changes.
Disk Utilization (Performance) Disk Utilization (Performance) monitor provides disk capacity and utilization metrics. It is a core WhatsUp Gold performance monitor that cannot be removed from the Monitors Library. This monitor requires SNMP or Windows (WMI) credentials. If you collect from a VMware environment, you will need VMware credentials.
Note: If you want to return disk utilization metrics for a Hyper-V guest VM, you must enable the VM to record WMI or SNMP metrics as described in a community article (https://community.ipswitch.com/s/article/Disk-Utilization-Information-may-not-be-available-when-using-HyperV-with-Virtual-Monitoring) titled Hyper-V Disk Utilization Information May Not Be Available. Outside of this requirement, Virtual Monitoring also provides read/write metrics in the Virtual Machines Disk Activity (on page 710) report. (The Virtual Machines Disk Activity monitor is a default monitor added to devices exhibiting the VM role (on page 89)).
Tip: This community article (https://community.ipswitch.com/s/article/Requirements-for-Remote-WMI-Access) (Requirements for Remote WMI Access) details how to enable WMI on the device(s) you want to poll.
1 Configure the following fields from the Device Properties view. Protocol. Choose a Network Management protocol to use for performance
metrics.
Collect data for. Specify either of the following:
Specific disks to collect metrics for.
All Disks.
Data collection interval. Specify polling frequency.
Advanced Options. You can select Timeout, Retry, and disk identification (Disk Uniqueness), which is how it will be identified in the table grid in the disk utilization reports.
2 Click OK to save the monitor settings for this device.

WhatsUp Gold User Guide
168
Printer Ink/Toner Performance Monitor The Printer Ink/Toner performance monitor uses SNMP to collect current ink/toner level data from SNMP-enabled network printers. The target printer must be SNMP-enabled and support the Standard Printer MIB for this monitor to work properly. Use this monitor to check for potential issues such as low ink levels. The monitored printer must support the Standard Printer MIB.
Provide a unique name and description for the monitor, then configure the following:
Ink/Toner Cartridge. Select the ink/toner cartridge from which to collect ink/toner level data. Please note, you must create a Printer performance monitor for each color ink/toner cartridge you want to monitor.
Polling interval. Specify how often data should be collected from the selected toner cartridge.
Please note, all SNMP objects may or may not be supported by the specific printer being monitored depending on its manufacturer and model.
Hyper-V Virtual Machine Disk Activity Hyper-V Virtual Machine Disk Activity provides disk activity metrics for Hyper-V virtual machines. It is a core Virtual Monitoring performance monitor that cannot be removed from the Monitors Library (on page 106).
1 Configure the following fields from the Device Properties view. Name. Monitor instance name.
Description. Optional description.
Collection interval. Specify polling frequency (minutes). 2 Click OK to save the monitor settings for this device. 3 For charts and table data this monitor makes possible, check the Hyper-V Virtual
Machine Disk Activity (on page 710) report.
JMX (Performance) The JMX Performance Monitor allows you to monitor any server that supports JMX by requesting a single JMX performance counter the server supports and allows you to easily browse and add available counters to the monitoring list.
1 Configure the following fields to set up your JMX Performance Monitor: Name. Enter a unique name for the monitor. This name displays in the
Performance Monitor Library.
Description. Enter additional information for the monitor. This description displays next to the monitor name in the Performance Monitor Library.
Object Path/Attribute. Select the target device, domain/path, and attribute to monitor. Please see the following procedure steps for additional details about selecting the object path and attribute.
Port. Enter the port number WhatsUp Gold should use to communicate with the JMX object.

WhatsUp Gold User Guide
169
Use SSL with RMI Registry. Select this option to use Secure Socket Layer connection for communication with the JMX object.
2 Click Select to launch the JMX Credentials dialog. 3 Enter the IP address or host name of the target device to browse. You can also
click the Browse button (...) to select a device from the device list. 4 Ensure the Port and Use SSL with RMI Registry settings reflect your selections
made in the previous dialog. 5 If needed, select an existing JMX credential (on page 223) from the list or click the
Browse button (...) to access the Credentials Library, then create a new one. 6 Click OK to proceed to the JMX Browser (on page 843) which you can use to
select the target device, domain/path, and attribute to monitor. 7 The monitor configuration dialog should now display the attribute you selected in
the JMX Browser (on page 843). Click OK to save the monitor.
Interface Utilization Interface Utilization monitor provides performance and capacity measurements for network interfaces associated with the current device. Interface Utilization monitors are applied automatically to network devices.
Note: You can view Interface Utilization measurements, history, and trends using the RealTime Performance Monitor (on page 788) or the Interface Utilization Report.
Select management protocol and target interfaces Depending on the management scheme configured on the device, WhatsUp Gold Interface Utilization monitors can retrieve network interface statistics using:
WMI. Measurements and attributes stored in WMI (Windows Management Instrumentation) objects on the device.
SNMP. Contents of Management Information Base Objects ("MIBs") stored on the device.
Tip: Select either SNMP or WMI to view collection information associated with discovered interfaces for the current device.
Filter and view discovered interfaces The discovered interfaces table populates after you discover a device with the appropriate WMI or SNMP credentials (or both).
Interface. WhatsUp Gold gets the value for Interface from one-of-three fields. It typically uses the first non-blank field it finds in this order: ifAlias (administrator-assigned name), ifDescr (manufacturer and product name), ifName (name from the OS, for example "WLAN adapter 1"). Please note, a Null interface represents traffic discarded or generated by a router.
Index. The numeric designator (typically ifIndex) of the individual interface for the selected device.

WhatsUp Gold User Guide
170
Type. Interface type (typically ifType) object value returned. Speed. Nominal interface speed reported by the interface. This value is used for
calculating interface capacity utilization. (Speed settings) If the nominal speed is different than the configured speed,
constrained by factors surrounding the interface, or if it is simply unpopulated, you can define a custom value that WhatsUp Gold will use for reports and calculations.
If nominal network interface speed used to calculate bandwidth capacity utilization is incorrect or unpopulated at the device's management object, you can define a custom speed using the Configure Interface Speed dialog.
Specify a custom speed for this interface. Click this check box to enable the In and Out text boxes.
In and Out. Define the speed of each traffic direction. WhatsUp Gold uses this value to calculate bandwidth capacity as a percentage of the total interface speed. Enter the upper limit of the interface in bps (bits per second). Common interface speeds expressed in bps are:
1 Gbps = 1,000,000,000 bps
100 Mbps = 100,000,000 bps
10 Mbps = 10,000,000 bps
Status. Ready state of the interface. Either of the following: Active / Inactive.
Option to record error statistics and discarded packet count Collect errors and discards... Record measurements of error and discards.
This option is useful for debugging and visualizing incidents using the Interface Errors and Discards (on page 655) report.
Polling interval Collection Interval. Define the normal period to wait between data collection
attempts.
Advanced settings Timeout. Time to wait before timing out the polling request. Retries. Number of times WhatsUp Gold attempts to send the command before
the interface is considered down. Determine Uniqueness by. Determine uniqueness by Disk Description,
Memory Description, or Interface Description and prevent collecting data under a different identity when a re-index occurs.
Index. Track and identify the interface by its interface index.
Interface Description. Track and identify the interface by its description (descriptions assigned during hardware manufacturing, for example).
Poll Interface Traffic Counters. Used to determine if interface uses regular (RFC1213) or high capacity (RFC2233) counters.

WhatsUp Gold User Guide
171
Memory Utilization (Performance) Choose collection options for your Memory Utilization (Performance) monitor:
Collect data for. Select which specific memory items you want to gather data on.
Data collection interval. Enter how often you want data to be collected (minutes).
Click Advanced to access Data Collection Advanced Settings (on page 177).
Ping Latency and Availability Through this data stream, you can monitor and report on how often and quickly the device responds to a ping check. Data collected is displayed in the Ping Availability report.
Configure the following:
Collect data for. Select which interfaces you want to gather data on. Advanced. Click to access Data Collection Advanced Settings. Data collection interval. Minutes between each collection attempt.
SNMP (Performance) The Simple Network Management Protocol (SNMP) monitor accesses SNMP-supported network devices and graphs performance output.
Provide a unique name and description for the monitor, then configure the following:
1 Click Select from list to launch the MIB Browser. 2 Enter the Name or IP Address for any monitored device or click Browse (...) to
select a device, then click OK to return to the MIB Browser. 3 Select a valid SNMP v1/v2/v3 credential from the list or click Browse (...) to access
the Credentials Library where you can create a new one, then click Save to return to the MIB Browser.
4 Update the default Timeout and/or Number of retries if desired, then click OK to connect to the device.
5 Select the specific Object ID and Instance to be monitored from the navigation tree displayed within the SNMP MIB Browser dialog, then click OK.
6 Enable Plot raw values to monitor the current polled value instead of tracking the rate of change over time. Use this feature to graph the current value of the SNMP object.
Tip: While SNMP Performance monitors are used to gather historic performance, accounting, fault, and security metrics data useful for reports, SNMP active monitors (on page 138) are used to determine device Up state.

WhatsUp Gold User Guide
172
SQL Query (Performance) The SQL Query monitor uses WMI or ADO authentication to determine if specific conditions exist in a Microsoft SQL, MySQL, or ORACLE database by querying the database.
Important: To monitor a MySQL database, download and install the MySQL .NET Connector on the WhatsUp Gold machine. Please note, only MySQL version 5.2.5 is supported due to potential compatibility issues. MySQL .NET Connector version 5.2.5 can be downloaded directly from the WhatsUp Gold website (https://www.ipswitch.com/MySQL525Connector).
Note: When connecting to a remote SQL instance, WhatsUp Gold only supports the TCP/IP network library.
Provide a unique name and description for the monitor, then configure the following:
Server type. Select Microsoft SQL Server, MySQL, or ORACLE as the database server type. Please note, MySQL database is supported and listed as a server type option only if the MySQL 5.2.5 Connector is installed.
Timeout. Enter the amount of time WhatsUp Gold waits for the server to respond before terminating the connection and returning the timeout error. The minimum allowed value is 1 second whereas maximum allowed value is 120. Please note, this setting only applies to polling whereas the query builder assumes a default of 15 seconds for the connection timeout.
Server address. Enter the server address in the applicable format: ServerName\Instance format for Microsoft SQL Server. Example:
WUGServer\SQLEXPRESS
ServerName for MySQL. Example: WUGServer
ServerName/ServiceName for Oracle. Example: WUGServer/Oracle. Port. Enter the database server port number. SQL Query to run. Enter the query to run against the specified database to
check for certain database conditions. .
Click Build to launch the SQL Query Builder for assistance with developing proper query syntax. Only SELECT queries are allowed.
Important: The SQL query you enter must return a single numeric value. Specifically, a single record that has just one column. If the query returns more than one record, the monitor fails to store the data. If the query returns a single record but there are multiple columns in the record returned, then the monitor will pick the first column as the value to store and this first column has to be numeric, otherwise the monitor will fail to store the data.
Click Verify to test if the entered database query is valid.

WhatsUp Gold User Guide
173
SSH (Performance) The SSH monitor uses SSH authentication to connect to a remote device to execute commands or scripts which can be either embedded in the monitor or placed as an executable script file on the remote machine with a command embedded in the monitor to run the script. Each monitor returns a single numeric value which is recorded in the database and then used later by other WhatsUp Gold functions as needed.
Provide a unique name and description for the monitor, then configure the following:
Command to run. Enter the command to run and execute on the remote device. The command can be anything the device can interpret and run; for example, a UNIX shell command or a perl script. Please note, if you create a script to run on the remote device, it must be developed, tested, and/or debugged on the remote machine. Select one of the following script options:
Numeric. The command or script must return a single numeric value. The script can be as complex as required, but MUST only return a numeric value. For example, old, single-line UNIX-style: free -m | awk 'NR==2{print $3}' This is the script format required prior to WhatsUp Gold 16.2.3.
Shell Interactive. This script is not constrained to only returning single numeric values; however, the output MUST contain the string 'Result=xxxx' where xxxx represents a numeric value. For example, new multi-line Linux-style: echo Result=$(free -m | awk 'NR==2{print $3}') This newer script format supports all the features of the target script interpreters without burdening the script developer to limit the output to a single numeric value.
Line end character. Select the appropriate line end type:None, Linefeed, Carriage return, or Carriage return linefeed. Multiline scripts are entered and persisted on a Windows operating system and include line-ending characters that may not be recognized on the target device. This configuration feature instructs WhatsUp Gold to replace the line-ending characters with the selected characters prior to connection and command execution.
VMware Datastore IOPS VMware Datastore IOPS provides raw disk I/O operations per second (IOPS) for both hosts and guests (virtual machines). This report is helpful for diagnosing read and write efficiency and in some cases memory exhaustion.
1 Configure the following fields from the Device Properties view. Name. Monitor instance name.
Description. Optional description.
Collection interval. Specify polling frequency (minutes). 2 Click OK to save the monitor settings for this device. 3 To view charts and table data this monitor makes possible, check either or both of
these reports:

WhatsUp Gold User Guide
174
VMware Device Datastore IOPS Report (on page 717) (table data)
VMware Virtual Machines Datastore IOPS Report (table data, graphs, and charts)
Windows Performance Counter The Windows Performance Counter Monitor gathers data from performance counters exposed by various Windows applications. This monitor can only monitor Windows applications and requires Windows credentials on the device for which you want to monitor Windows applications.
Important: Devices monitored with the Windows Performance Counter monitor must have the Remote Procedure Call and Remote Registry services enabled and running.
Provide a unique name and description for the monitor, then configure the following:
1 Click Select from List to launch the Performance Counters dialog. 2 Select a Performance Counter from the navigation tree at left. 3 Select a Performance Instance from the options at right, if applicable. Please note,
not all counters have specific instances. This field may be left blank. 4 Click OK to return to the performance monitor configuration dialog. 5 Click Save.
Configuring WMI Formatted Counter monitors Configuring WMI Formatted Counter monitors collects performance data on devices using the Windows Management Instrumentation (WMI) technology. WMI is Microsoft Windows standard for retrieving information Windows platforms.
WMI Formatted Counter performance monitor uses calculated counter data.
The WMI Formatted Counter performance monitor requires:
Windows credential for the polled device.
WMI statistics gathering (and remote access) configured at the polled device. For details, see KB 000017307 https://community.ipswitch.com/s/article/Requirements-for-Remote-WMI-Access.
Provide a unique name and description for the monitor, then configure the following:
Important Configuration Fields Performance Counter and Instance. Enter the OID and instance in the
respective fields or click Select to access the Performance Counters dialog.
Computer name. Name or IP address of the computer you are trying to connect to and gather instrumentation from. You can click browse (...) to select a device from a list.

WhatsUp Gold User Guide
175
Windows Credential. Select a credential to connect to the device you want to monitor. Click browse (...) if you need to access the Credentials Library.
Add WMI Formatted Performance Monitor Dialog Performance Counter. Select the WMI object to monitor.
Performance Instance. Select the instance of the counter.
Performance counter and Instance boxes on the Add WMI Formatted Performance Monitor dialog.
WMI Performance Monitor The WMI performance monitor watches for specific values on Windows Management Instrumentation (WMI) enabled devices. WMI is a Microsoft Windows standard for retrieving information from computer systems running Windows and is installed by default on most Windows operating systems. The WMI performance monitor requires the following credential:
Windows
Provide a unique name and description for the monitor, then configure the following:
1 Enter the OID and instance in the respective fields or click Select to access the Performance Counters dialog.
2 Use the navigation tree in the left panel to select the specific performance counter you want to monitor. You can view more information about the property/value at the bottom of the dialog.
3 In the right pane, select the specific performance instance of the selected counter you want to monitor.
4 Click OK to populate the Performance counter and Instance with your selected values on the Add WMI Performance Monitor dialog.
5 Click OK to save the configuration.
Hyper-V Event Log Monitor Hyper-V Event Log Monitor is a built-in performance monitor added to devices automatically when they are identified as Hyper-V Hosts at discovery time. Hyper-V Event Log Monitor is turned off by default.
Enable Hyper-V Event Log Monitor To switch it on, select the Hyper-V host, you can either:
Switch Hyper-V Event Log Monitor to On from Device Properties. Select Device Properties > Virtual Monitoring and then click the Enable
button.
Configure Hyper-V Event Log Monitor From the Hyper-V host device card, select Device Properties > Virtual Monitoring.

WhatsUp Gold User Guide
176
Click the checkboxes to include the Hyper-V Event Log messages you want to include in monitoring.
Option Description
Hyper-V-Config Relates to virtual machine configuration files. For example, a missing or corrupt virtual machine configuration file generates these types of event messages.
Hyper-V-EmulatedNic-Admin
Messages related to emulation of the host NIC.
Hyper-V-High-Availability
Denotes actions and changes that happen because of Hyper-V clustering. (Applicable to full versions of Windows Server 2012)
Hyper-V-Hypervisor Hypervisor specific events. For example, a hypervisor fails to start.
Hyper-V-Image-Management-Service-Admin
Information related to virtual hard disk operations.
Hyper-V-Integration-Admin
Integration services events.
Hyper-V-Network-Admin Messages related to the creation of virtual networks.
Hyper-VShared-VHDX Virtual Hard Disk (VHD) messages for Hyper-V in Windows Server 2012 (VHDX).
Hyper-V-SythFc-Admin Messages for virtual Fibre Channel used to connect to virtual SANS.
Hyper-V-SynthNic Virtual network adapter events. For example, event messages for each time a virtual machine with virtual network adapters powers up or fails to power up as the result of a network adapter configuration issue.
Hyper-V-SynthStor Virtual hard disk events that are associated with running virtual machines (storage equivalent of the SynthNic section).
Hyper-V-VID Messages related to the Virtualization Infrastructure Driver (VID).

WhatsUp Gold User Guide
177
Hyper-V-VMMS Messages concerning virtual machine management services event files such as partition management, virtual processor management, and memory management.
Hyper-V-VmSwitch-Operational
Host virtual switch messages.
Hyper-V-Worker VM worker process specific events.
Hyper-V Host Virtual Machines Monitor Hyper-V Host Virtual Machines Monitor is a built-in performance monitor used to access performance management metrics and information on Hyper-V virtual machines. Currently, this monitor returns the power state of all Hyper-V guests to the Hyper-V host.
Rules Expression Editor Passive monitors and other monitors that provide pattern checking enable you to apply simple regular expression syntax.
You can use a rule expression to test a string or a page of text for pattern matching. You can check for word frequency, HTTP error pages, literal strings, and much more.
Expression >>. Select from a list of patterns.
Match case. Enable case-sensitive match. Invert result. (Inverse match) Evaluate to true when not a match. Comparison text. Provide a target string for testing purposes. Test. Test if your expression pattern matches the target.
After creating and testing the expression, click OK to insert the string into the Match on box.
Note: If you have multiple payload "match on" expressions, they are linked by "OR" logic - not "AND" logic. Example: If you have two expressions, one set to "AB" and the other to "BA", it will match against a trap containing any of the following: "AB" or "BA" or "ABBA".
Advanced settings: performance monitor collection Timeout. Time to wait before timing out the polling request. Retry. Number of times WhatsUp Gold attempts to send the command before
the device is considered down. Determine Uniqueness by. Relevant to the Disk, Memory, and Interface
performance monitors.

WhatsUp Gold User Guide
178
Disk Index. Select to determine uniqueness by the disk, memory, or interface index.
Disk Description. Select to determine the uniqueness by the disk, memory, or interface description. This prevents interruptions in data gathering if a re-index occurs.
Poll Interface Traffic Counters. Used to determine if interface uses regular (RFC1213) or high capacity (RFC2233) counters.
Configure Memory Threshold Enter the amount of free memory, in kilobytes, that the SQL server needs to have available for optimum performance. If the amount of free memory falls below this threshold, the monitor is considered down.
Configure Disk Performance threshold Set thresholds on disk reads and writes for the SQL server host.
Property Definition
Disk reads not above (KBytes/sec)
Enter the maximum number of Kbytes read per second allowed before the monitor fails.
Disk writes not above (KBytes/sec)
Enter the maximum number of Kbytes written per second allowed before the monitor fails.
Adding Custom Thresholds Specify the performance counter to monitor.
Click Add. Select a performance counter in the list and click Edit.
Ping Advanced Settings Use this dialog to set advanced ping data collection settings.
Timeout. The amount of time (in seconds) you want the system to wait before failing the connection to the computer.
Iterations. The number of times WhatsUp Gold will attempt to send the command before the device is considered down.
Active Monitor Advanced Properties Set the following advanced options for the active monitor.
Argument. Enter text to append to the OID for the interface on the selected device. By default, it identifies the number used by the SNMP interface.
Comment. Enter user defined text to appear in the Active Monitors list.

WhatsUp Gold User Guide
179
Use independent poll frequency for this monitor. Select this option to have the selected device polled based on the Poll frequency.
Poll frequency. Enter the amount of time (in seconds) between polls for the selected device. This setting is not displayed unless you select the Use independent poll frequency for this monitor option.
Note: Independent poll frequency for all monitors is ignored when an active monitor is specified as critical.
Advanced Settings Timeout (seconds). Time interval that WhatsUp Gold waits for the poll request. Number of Retries. Retries applied after failed attempts to poll. Use in Rescan. WhatsUp Gold adds the monitor type to the device during a
rescan, which is launched using the Rescan button. Please note, this option is only present when applicable.
Device Management Actions A number of manual actions can be performed on a selected device directly from the My Network (on page 20) view. Simply right-click on the device's icon on the map and select from the options displayed. You can also select any device to display the corresponding device information card, then click and select the action to be performed.
Device Properties. Selecting this option launches the Device Properties (on page 86) interface for the device.
Device Status. Selecting this option launches the Device Status (on page 417) dashboard for the device.
State Change Timeline. Selecting this option launches the State Change Timeline (on page 642) full-page report for the device.
Traffic Analysis. Selecting this option launches the Traffic Analysis (on page 422) dashboard for the device.
Copy Device To. This action creates a shortcut to a device within a selected group which provides access to that device still residing in its original group.
Move Device To. This action relocates a device from its original group to another group.
Clone Device To. This action creates a deep copy of a device that includes all active monitors, passive monitors, actions, attributes, etc. applied to the new device. Please use caution when enabling the Include layer 2 information (and above) option when cloning a device. Ipswitch recommends leaving this option disabled unless the Layer 2 and above connectivity data specific to the selected device is also needed for the device clone. Enabling the feature could potentially

WhatsUp Gold User Guide
180
generate inaccurate connectivity and/or dependency links between the initial device or the cloned device and associated devices displayed on the map.
Delete Device. Force delete of a monitored device from WhatsUp Gold. This frees any balance the device has against your device license total (if applicable). Full delete is only possible from My Network (on page 20) view.
Remove From Group. This action launches a dialog where you can select one or more devices from which to remove group membership. Please note, this does not delete the device from WhatsUp Gold.
Acknowledge Device. This action allows you to acknowledge a state change on a device. Please note, acknowledging a state change does not prevent a device from firing actions. Place the device in maintenance mode to stop actions from firing.
Poll Now. This action immediately requests an updated status from a device prior to the next automatic polling time per the configured polling interval.
Refresh Device Details. Use to update device roles and subroles and retrieve any updated and/or additional system attribute and network connectivity information since the device was originally added to WhatsUp Gold. For syncing inventory information, you can apply the Keep Details Current for this device.
Note: Refresh, which leverages Discovery, is the best method for refreshing Host, System, and Inventory information.
Rescan Device. Combines Refresh Device Details and adds applicable monitors. Use this feature to add recently added monitors configured with the Use In Rescan option. Please note, only credentials already applied to the selected device are used to determine which monitors may be applied during the rescan. If the device does not pass preconditions for the monitor (such as the presence of specific MIB objects), no monitor is added.
Set Up/Down Dependency. These actions launch a dialog where you can specify which active monitors on the selected device must be up/down for the device status to be reported as up/down.
Set as Dependency Root. This action designates the selected device as a root device meaning anything connected to it should have an Up dependency to that device and any device connected to those devices should have an up dependency to them.
Start Maintenance Mode. This action prevents the selected device from being polled, actions from being triggered, and disables logging activity.
Tools. This action displays a menu of tools (on page 181) used to assist with troubleshooting potential problems as well as connect directly to the selected device (on page 182).
When multiple devices are selected, the device management actions available vary slightly. Actions specific to a device group selection are as follows:

WhatsUp Gold User Guide
181
Edit Group. This launches a configuration dialog where you can modify the properties of the selected device group including the name, description, and access rights.
New Device. This action allows you to manually add a device to the selected group by entering its IP Address, Host Name, or DNS Name. Additionally, WhatsUp Gold allows you to add the device without scanning it first and to force a specific device role assignment. Please note, if Add device Immediately without scanning is disabled, a number of advanced settings are also available which, when enabled, allow WhatsUp Gold to discover as much information as possible about the device being added along with any associated devices that may be found. You can expand the discovery scan to include virtualization and wireless environments, resolve hostnames for discovered devices, enable device naming based on SNMP Sysname, and prioritize credentials used during device discovery.
Edit Devices appears in place of Tools. This option allows you to make configuration changes to the selected devices in bulk including assigning credentials, monitors (on page 106), and action policies (on page 252), editing active and passive monitor properties, assigning maintenance schedules, setting dependencies and dependency roots, specifying polling interval and interfaces, creating attributes, and appending notes to the device properties.
Using Tools in WhatsUp Gold WhatsUp Gold provides a full complement of network tools to find devices, query management information, and troubleshoot potential connectivity and configuration issues at your site. You can access a complete suite of WhatsUp Gold tools by selecting ANALYZE > Tools.
Many of these, along with additional tools used to connect directly to a monitored device (on page 182), are also accessible directly from both the My Network (on page 20) map and list (on page 24) views and can be found by right-clicking on any device icon to launch the device management actions (on page 179) menu.
DNS Lookup. This tool queries your Internet domain name system (DNS) server for information about a domain and its registered hosts and can show you what happens when an application on your network uses your DNS server to find the address of a remote host.
IP/MAC Address Finder. This tool locates and displays network interfaces which have sighting information for the specified IP or MAC address.
Layer 2 Trace. This tool finds the path between the two devices, then displays each network interface used to build the path. It also allows for a quick check of status and availability of each step along the path.
MAC Address. This tool discovers what MAC addresses are present on your network and provides physical connectivity information for those devices. It can be useful to solve IP address conflicts within your network by providing you with specific switch information.

WhatsUp Gold User Guide
182
Ping. This tool sends an ICMP echo request to the selected device to determine if connectivity exists. If the ping is returned, WhatsUp Gold reports the IP address, the number of data packets sent, received, and lost in transit, the round trip time in milliseconds, and if the ping request succeeded or failed.
SNMP MIB Walker. This tool provides detailed information about the SNMP objects a device supports and that can be monitored with WhatsUp Gold. It actively polls for objects and does not require MIB files for the polled objects to be loaded.
SNMP MIB File Explorer. This tool allows you search for or explore through SNMP objects defined in MIB files.
Traceroute. This tool sends echo requests to the selected device, then traces the path taken to reach that device and can be used to determine where on the network a data transmission interruption occurs.
Web Performance Monitor. This tool graphs and displays real-time information about user-specified SNMP and WMI performance counters. It can be used for a quick inspection of a specific network device.
Web Task Manager. This tool graphs and displays real-time information about processes occurring on a device, device performance, and device interface activity using SNMP or WMI device connections.
Lookup. This tool queries your Internet domain name system (DNS) server for information about a domain and its registered hosts and can be used to show what happens when an application on your network uses your DNS server to find the address of a remote host.
Connecting directly to a monitored device through the WhatsUp Gold interface
First, select any device on the map view to display the corresponding device information card. Click , then select Tools from the device management actions menu. You can also access the menu of device management actions, and more specifically the three connection tools, by right-clicking the device's icon on the map. Use the following tools to connect to the selected device:
Browse. Launches the selected device's user interface in a new browser tab.
SSH. Launches a secure, encrypted Secure Shell window pointed to the selected device.
Telnet. Launches a telnet window where the user can interact with the selected device using a command line interface.
Remote Desktop. Launches a Remote Desktop Connection window displaying the desktop for the selected device.
Before attempting to connect to a device using the Browse tool, access Device Properties for that device, select the Links tab, and create a Custom Link called Browse that points to the device's name or IP address in URL format. If no Custom Link is defined, the Browse tool will attempt to dynamically create one using the IP address. If the tool is unable to create the link automatically, a blank browser tab will appear.

WhatsUp Gold User Guide
183
While the Browse tool can be used without the need for any additional action on the part of the user, any client device that will be accessed by WhatsUp Gold must be configured prior to connecting through SSH, Telnet, or Remote Desktop. Use the following operating system-specific guidelines and examples to enable your client device to be accessed directly from the WhatsUp Gold map or list view.
Windows To utilize Telnet, SSH, or RDP tools in WhatsUp Gold from a Windows client: 1 Enable/Install the applicable program or feature on the device to which you are
connecting. a) For SSH, install a third party SSH client. (Please note, during development of
this feature, PuTTY was used to test SSH connections originating from WhatsUp Gold, though other SSH client options are available for use.)
b) For Telnet, ensure Telnet Client is enabled in Programs and Features on that device.
c) For Remote Desktop, ensure the option for allowing remote access is enabled in System Properties on that device.
2 Create a batch script file specific to your desired connection method, then place it in an accessible location on the machine from which you access WhatsUp Gold. Please note, you must modify this script for your specific configuration, potentially to include adding flags to the command line such /v for Remote Desktop. Examples of batch script files required: telnet_launcher.bat that contains: @echo off set var=%1 set extract=%var:~9,-1% start "telnet window" "C:\Path_To_Telnet\telnet.exe" %extract% Please note, Path_To_name refers to the path needed to find the specified file on your client machine that is accessing WhatsUp Gold. ssh_launcher.bat that contains: @echo off set var=%1 set extract=%var:~6,-1% start "putty window" "C:\Path_To_putty\putty.exe" %extract% Please note, putty.exe is used as the SSH client example; you may utilize a different SSH client. rdp_launcher.bat that contains:

WhatsUp Gold User Guide
184
@echo off set var=%1 set extract=%var:~6,-1% start "rdp window" "C:\Path_To_RDP\mstsc.exe" /v:%extract%
3 Create a registry file specific to your desired connection method and modified for your individual needs. Place it in an accessible location on the device, then double-click the file to add it to your registry. Examples of registry files required: telnet.reg that contains: REGEDIT4 [HKEY_CLASSES_ROOT\telnet] @="URL:telnet Protocol" "URL Protocol"="" [HKEY_CLASSES_ROOT\telnet\shell] [HKEY_CLASSES_ROOT\telnet\shell\open] [HKEY_CLASSES_ROOT\telnet\shell\open\command] @="\"C:\\Path_To_Batch_Files\\telnet_launcher.bat\" %1" Please note, the double backslashes are required inside the "" as single backslashes are dropped. ssh.reg that contains: REGEDIT4 [HKEY_CLASSES_ROOT\ssh] @="URL:ssh Protocol" "URL Protocol"="" [HKEY_CLASSES_ROOT\ssh\shell] [HKEY_CLASSES_ROOT\ssh\shell\open] [HKEY_CLASSES_ROOT\ssh\shell\open\command] @="\"C:\\Path_To_Batch_Files\\ssh_launcher.bat\" %1" rdp.reg that contains: REGEDIT4 [HKEY_CLASSES_ROOT\rdp] @="URL:rdp Protocol"

WhatsUp Gold User Guide
185
"URL Protocol"="" [HKEY_CLASSES_ROOT\rdp\shell] [HKEY_CLASSES_ROOT\rdp\shell\open] [HKEY_CLASSES_ROOT\rdp\shell\open\command] @="\"C:\\Path_To_Batch_Files\\rdp_launcher.bat\" %1"
4 Test the connectivity by right-clicking on the device from the map or list view, then selecting the desired tool from the device management actions menu.
Mac OSX No additional configuration is necessary when connecting to a monitored device running Mac OSX. At the time of this WhatsUp Gold release, SSH and Telnet protocols are configured for use by default and Microsoft offers an application used for Remote Desktop connections for Mac.
Poller Configuration Polling is the active watching, or monitoring, of your network with WhatsUp Gold. This is done in a variety of ways, depending on the service monitors you have configured on your devices. The default polling method is accomplished through Internet Control Message Protocol (ICMP). The default polling interval for WhatsUp Gold is 60 seconds.
A small amount of data is sent from the WhatsUp Gold computer across the network to the device it is watching. If the device is up, it echoes the data back to the WhatsUp Gold computer. WhatsUp Gold considers a device is down when it does not send the data back.
Tuning polling intervals It's important to note that polling interval settings affect how WhatsUp Gold determines a specific device state. For example, if a user has specified that she only wants to poll a device every 5 minutes, WhatsUp Gold will only recognize device state changes at the 5 minute polling intervals. If a device has been down 2 minutes, it will be recognized as down when the 5 minute polling interval occurs. Corresponding Up actions will be triggered after the 5 minute poll occurs rather than when the device went down at the two minute point.
The device polling interval affects the way WhatsUp Gold determines the specific device state. When a device transitions from Up to Down, it checks to determine the last time the device was Up. For example, with the default polling interval of 60 seconds, when a device goes down it looks back and determines that the last time it was up was 63 seconds ago so it goes from "Up at least 5" to "Down." In the next polling interval when the device still returns down, WhatsUp Gold looks backward and determines that the last Up time was 125 seconds ago so it now is "Down at least 2 minutes."
If a 5 minute polling interval is set, the first time that a device returns down, WhatsUp Gold looks back and determines that the last time the device was up was 304 seconds
WhatsUp Gold User Guide
186
ago so it transitions directly from "Up at least 5 minutes" to "Down at least 5 minutes" (skipping the Down and Down 2 states). Similarly, when the device comes back up, WhatsUp Gold looks back to determine the last time the device was Down and it registers that it was 301 seconds ago so it transitions directly from "Down at least 5" to "Up at least 5 minutes."
In short, if you plan to use polling intervals longer than the default of 60 seconds, we recommend that you associate actions with device states that will not be skipped because of the extended polling interval.
An average poll lag time of a few seconds or more indicates your system may not be performing optimally. If WhatsUp Gold device polling seems to be experiencing performance lag, use the Poller Health dashboard report to assess and confirm poller performance. The WhatsUp Gold CPU and memory utilization reports can also be used to indicate performance issues. There are a number of ways to improve poller performance by reducing the workload of the WhatsUp Gold machine.
The recommended option is adding one or more additional pollers to your WhatsUp Gold system depending on the size of your network. When additional pollers are installed, load balancing should be disabled on the local poller. This transfers the majority of the polling workload to the additional pollers, reserving the local poller for polling activity on the WhatsUp Gold server. However, if your network is distributed across a large geographic area, you may benefit from assigning a poller to a specific subnet or device. In this case, load balancing should also be disabled on the specific poller to limit its activity to the assigned device(s). Please refer to Using Scalability Pollers with WhatsUp Gold (on page 186) for more details.
Other options include removing the local poller from the load balancing queue which reduces the workload of the WhatsUp Gold server and allows it to perform other tasks for which it is responsible or relocating your SQL instance to a machine separate from your WhatsUp Gold server.
If you are still experiencing polling performance issues, consider adding additional memory and increasing disk speed on the machine hosting your SQL instance and/or adding or assigning a machine on your WhatsUp Gold system dedicated solely to polling operations.
Using Scalability Pollers with WhatsUp Gold The WhatsUp Gold Scalability poller is a separate application installed on any Windows system on the network. The Scalability poller is in addition to the poller integrated within WhatsUp Gold. Extending polling activity across multiple pollers increases the number of devices for which WhatsUp Gold can poll and collect data to send back to the WhatsUp Gold system. Using additional pollers can efficiently scale polling operations to a larger number of network devices, ultimately providing the capacity to monitor and manage larger networks. Scalability pollers can also simplify traversing across private networks.
More specifically, scalability pollers installed on your WhatsUp Gold system transmit specific data elements to the WhatsUp Gold server for reporting. However, note that these pollers only support selected features and their use is not necessarily a substitute

WhatsUp Gold User Guide
187
for a full WhatsUp Gold Distributed set up depending on your network environment and monitoring needs.
Currently, the following features must be handled by the WhatsUp Gold server:
Active Script Performance Monitor Discovery MIB Walker Passive Monitors Configuration Management Tasks Wireless Polling
Installing the Scalability Poller Application on a Remote Machine
The installation file can be downloaded from the WhatsUp Gold support website. The following are prerequisites for installing an additional poller on your WhatsUp Gold system:
Local admin privileges for the host machine are required to install the WhatsUp Gold poller.
The Windows account from which you install the poller must have a known password. You will be prompted to enter this password during the poller installation process.
Microsoft .NET is required for installation and is available to install if not already installed on the host machine. If prompted to allow .NET installation, click Yes.
Important: The machine on which the WhatsUp Gold poller is installed MUST have the same access to the network as the WhatsUp Gold machine. Polling data is always reported from the viewpoint of the WhatsUp Gold machine regardless of which device performed the polling task. Therefore, if a poller can only access a portion of the network, devices to which the poller does not have access (even if previously discovered by WhatsUp Gold) are reported as down.
During installation, you must configure each poller to send data to the WhatsUp Gold server by entering a name to identify the poller, the server name or IP address to identify the device running WhatsUp Gold, and valid credentials required to access the WhatsUp Gold host computer. You must also use this information to configure WhatsUp Gold to receive data from each poller installed on your network.
To install the WhatsUp Gold poller: 1 Double-click the executable file. If the Security Warning dialog appears, click Run.
The WhatsUp Gold Polling Engine - InstallShield Wizard launches. 2 Click Next. The License Agreement dialog appears. 3 Review the Ipswitch License Agreement, select I accept the terms of the license
agreement, and click Next to continue. The Choose Destination Location dialog appears.

WhatsUp Gold User Guide
188
4 Click Next to install the WhatsUp Gold poller in the default directory or click Change to select a different location. The WhatsUp Gold info dialog appears.
5 Enter a unique name to identify the poller in the Name box. Please note, following installation, you will need the poller name to successfully add the poller to the configuration library in WhatsUp Gold.
6 Enter the server name or IP address for the WhatsUp Gold machine in the Server box.
Note: The default port shown in the WhatsUp Gold installation info dialog is 9713. This is the port assigned to the WhatsUp Gold host system and should not be altered unless the port on the WhatsUp Gold machine/polling controller has been changed.
Note: In order for a poller to successfully connect to WhatsUp Gold, enable communication on the following ports: TCP 9713 - Polling Data Communications and TCP - 9730 Polling Control Communications.
7 Click Next. The Login dialog appears. 8 Enter a valid user name and password for the WhatsUp Gold server. 9 Click Next. The Password dialog appears. 10 Enter the password for the current Windows account on the machine on which the
poller is being installed.
Note: WhatsUp Gold Poller inherits the security attributes in place on the machine on which it is installed. Ipswitch recommends the poller be installed using an administrator-level Windows account.
Note: To modify applicable credentials after installation, access the Windows Vault from the Control Panel of the machine on which the WhatsUp Gold Poller is installed.
11 Click Next. The Ready to Install the Program dialog appears. 12 Click Install. InstallShield Wizard installs the WhatsUp Gold Poller. 13 After installation is complete, click Finish to exist the InstallShield Wizard. 14 Click Finish.
Please note, after a poller is installed on a remote machine, you can modify the poller User name and Password in the Windows Credential Manager, accessible via the Windows Control Panel. Ensure you log in to this machine using the same user credentials used during the poller installation. You can also run the remote machine poller install program (repair install) on the target poller system to change the user name and password.
In the event you need to remove a poller from your WhatsUp Gold system, you can choose one of two methods. First, you can simply remove the poller from your system by deleting it from the Polling Configuration library in WhatsUp Gold, in which case the poller will no longer be active but the application will remain installed on the remote machine. Or, you can completely uninstall the poller application from the remote machine. Please note, the poller will continue to be displayed in WhatsUp Gold in an error state until you delete it from the Polling Configuration library.

WhatsUp Gold User Guide
189
Configuring Scalability Pollers in WhatsUp Gold Poller Configurations displays a list of scalability pollers currently in or available for use with WhatsUp Gold. The status of each poller is indicated by color. Green indicates the poller has started, registered with the WhatsUp Gold server, or is currently idle. Yellow indicates the poller is starting, registering with WhatsUp Gold, stopping, or restarting. Red indicates an error has occurred, the poller cannot be found, or the status is unknown. Poller status can also be viewed using the Poller Health dashboard report.
Use the following controls to manage scalability pollers:
Click this icon to create a new poller record.
Click this icon to edit an existing poller record.
Click this icon to remove a poller record.
Click this icon to refresh poller status and reported data.
Note: Using these controls affects the poller configurations stored in WhatsUp Gold and does not modify the actual poller applications installed on remote machines.
When configuring poller settings for either a new or existing record, first enter a name for the poller. This name should match the name used when installing and configuring the poller application on the remote machine. Then, use enable the poller and, if enabled, use the poller for load balancing. At least one poller must be configured for load balancing at all times to ensure all devices are being polled.
Now, you can use the Devices tab to select the device(s) you want to apply to the poller. Click Add, then select a single device, multiple devices, or device group from the list, and click OK.
You can also assign a subnet to a poller. Select the Subnets tab, then click Add. Enter the subnet address in the x.x.x.x/xx format and click OK. Please note, the specified subnet must include devices discovered by WhatsUp Gold.
Important: Any devices assigned to a given poller, either directly or through a subnet assignment, are automatically reallocated to a suitable load-balanced poller should that assigned poller be disabled or go offline to ensure every device is polled.
Please note, all load-balanced pollers must have sufficient IP network access to all devices regardless of how you may have assigned devices to particular pollers to ensure any device can be successfully polled from any load-balanced poller. Similarly, any non-load-balanced poller must have sufficient IP network access to any devices assigned to it, either directly or through subnet assignment. "Sufficient IP network access" indicates a network configuration which allows for ICMP, SNMP, and WMI protocols to communicate with the polled devices.

WhatsUp Gold User Guide
190
Using Scalability Pollers with Failover and Distributed If you have Failover features enabled, any scalability pollers pointing to the primary WhatsUp Gold machine must be identical in both name and configuration to scalability pollers pointing to the secondary WhatsUp Gold machine so the failover system is redundant, receiving and reporting the same data in a failover scenario. Any variation in name, configuration, or access permissions between pollers assigned to the primary and secondary WhatsUp Gold machines will cause incomplete data to be returned on the WhatsUp Gold failover system.
Caution: Scalability pollers do not failover independently of WhatsUp Gold. If an individual poller fails, its counterpart on the secondary WhatsUp Gold system will not assume the failed pollers' operations. Your secondary WhatsUp Gold system must mirror your primary WhatsUp Gold system completely.
Important: Because scalability pollers assigned to the primary and secondary systems must be named identically and in a failover scenario only one WhatsUp Gold system is active at a time, each poller name only needs to be entered into the polling configuration library once.
Scalability pollers work with a WhatsUp Gold Distributed configuration exactly like a standard WhatsUp Gold configuration. No special configuration is necessary.
Built-in Action Types When you apply active monitors, you typically associate an action and a device state with changes observed by the monitor. There are three main categories of built-in action types available through the Actions Library (on page 252). Actions can be triggered or scheduled.
Note: Certain actions (CM Actions, for example) can be invoked on demand (Run Now).
Built-in action types include:
Notifications. Send messages to stakeholders and responsible individuals according to site policy.
Remote execution. Create scripts, execute remote programs, and apply configuration changes.
Log. Include state change observed by WhatsUp Gold in platform logs.
Notifications Beeper action (on page 192). Activate a beeper with this type of action.

WhatsUp Gold User Guide
191
E-mail action (on page 194). Send an Email to a specific address. Log to Text File action (on page 197). Write a message to a text file. Pager action (on page 198). Send a message to a pager. Post To Slack action (on page 199). Post a message to a specific Slack
channel or user. Web Alarm action (on page 209). Activate a Web Alarm in the WhatsUp Gold
Web Interface Text to Speech action (on page 207). Plays a voice message on your
computer. SMS action (on page 202). Send a text message to a specific target. SMS Direct action (on page 203). Send a text message to a wireless phone or
other wireless device. Sound action (on page 205). Play a specific sound.
Remote/Local Script or Execution Service Restart action (on page 202). Start or stop a Windows service. Active Script action (on page 191). Write code to perform a customized action. Configuration Management action (on page 308). Perform script or task from
CM Task (on page 314) (includes Task Scripts (on page 309)) or CM Script (on page 328) Libraries.
PowerShell action (on page 200). Develop custom actions through direct access to scriptable component libraries, including the .NET Framework.
SSH action (on page 206). Connect to remote devices via SSH to execute commands or scripts.
Program action (on page 201). Execute an external application. SNMP Set action (on page 204). Use SNMP to increase a counter, set a flag,
or change the attribute value of a managed object.
Log Windows Event Log action (on page 210). Write an event in the Windows
Event Log. Syslog action (on page 207). Write a message to a log in the Syslog system. VMware action (on page 208). Use the VMware API to perform an action on a
virtual machine.
Active Script Action This action allows you to write either VBScript or JScript code to perform a customized action. If the script returns an error code, the action failed. This script has a context object you can use to get specific information about the context of the action. We have provided several code samples for you to create useful script actions for your devices. All script features in WhatsUp Gold utilize the SNMP API.
Configure the following:

WhatsUp Gold User Guide
192
Name. Enter a unique name for the action. This name displays in the Actions Library.
Description. Enter a short description about the action. This description displays next to the action in the Actions Library.
Timeout (seconds). Enter the length of time WhatsUp Gold attempts to connect to the selected device. When the time you enter is exceeded without connecting, a timeout occurs and WhatsUp Gold stops trying to connect to the SMTP server. This is considered a failed connection. Though the maximum timeout is 60 seconds, you are discouraged from using a timeout longer than the default of 10 seconds. You are encouraged to use the shortest timeout possible.
Script type. Select the scripting language that you want to use to write this active script (either VBScript or JScript).
Script text. Enter your action code in this box.
Note: Using percent variables in Script Text can be parsed by the Script Text interpreter literally and break your script.
Click OK to save your changes.
Tip: To check the status of an action or to cancel an action, in the WhatsUp Gold console go to Tools > Running Actions.
Beeper Action The Beeper action activates a beeper when a device reaches a certain state change. The settings below are used to automatically build a dial string for use by the modem sending the beeper action.
Tip: The Beeper Action can identify network devices through a specific device attribute.
Configure the following:
Name. Enter a unique name for the action. This name displays in the Actions Library.
Description. (Optional) Enter short description about the action. This description displays next to the action in the Actions Library.
Beeper number. Enter the phone number to dial. You can use parentheses to delimit the area code and a dash to separate the exchange from the extension numbers, for example: (617) 555-5555.
Pause after answer (sec). Enter a number of seconds the modem should pause before sending the signal codes once a connection is made.
End transmission. By default, # is the correct symbol for the end transmission command. Some international systems require other or additional symbols.

WhatsUp Gold User Guide
193
Modem setup. Select Primary or one of the alternate setups. Click Port Settings to further define your selection. Modem Setup is used specifically to support different service providers in case you use more than one provider for sending your beeper notifications. There could also be times you want to change your settings to meet a specific service provider requirements for a specific notification (for example, a lower baud rate). To do this, set up an alternate Modem Setup and associate this to the notification instead of using your Primary setting.
Note: Changing the port settings for the desired modem setup affects all uses of that setting.
Up code. Specifies the characters sent to the beeper to indicate that the device is up after being down (the default value is 0*).
Down Code. Specifies the code sent to indicate the device is down (the default value is 1*).
On passive monitor code. Specifies the code sent to indicate that an active monitor has been received for the device. (Default value is 2*) You can use the asterisk (*) character to separate codes from a subsequent message.
Recurring action code. The percent variables for the action. The default action code is: %System.NumberofUpDevices*%System.NumberofDownDevices
Click OK to save your changes.
Tip: To check the status of an action, or to cancel an action, in the WhatsUp Gold console go to Tools > Running Actions.
Setting Modem Connection Preferences Modem Initialization String (ATE0). The default string is ATE0Q0V1X4F1. (E0) Command Echo Off
(Q0) results code
(V1) verbal results code (as opposed to numeric)
(X4) result codes for some specific phone/modem conditions (see modem manufacturer for details)
(F1) local echo off COM Port. Select the port to which your modem is attached. Baud Rate. Select the speed (measured in bits per second) at which the serial
port communicates with the modem.
Note: Newer modems (e.g. 56K versions) may be used if their rate of transfer can be stepped down to a maximum of 2400 bps (TAP specification). However, some newer modems cannot be adjusted to transfer below 9600 bps even though you may use an initialization string that specifies a lower rate of transfer.

WhatsUp Gold User Guide
194
Data bits. Select the type of data bit transmission used to communicate with the selected port. 6, 7, or 8 data bits.
Parity. Select the type of parity expected by the modem connected to the selected serial port.
Stop. Select the stop bits used to communicate with the selected port. 1 or 2 data bits.
E-mail Action The E-mail action sends an SMTP mail message to a specific e-mail account. An E-mail action can also be used as an e-mail notification in the WhatsUp Gold Alert Center.
Configuration tab Configure the following:
Name. Enter a unique name for the action. This name displays in the Actions Library.
Description. Enter a short description about the action. This description displays next to the action in the Actions Library.
SMTP Server. Enter the IP Address or Host (DNS) name of your e-mail server (SMTP mail host).
Port. Enter the port number on which the SMTP server is listening. Timeout(sec). Enter the length of time WhatsUp Gold attempts to connect to
the selected device. When the time you enter is exceeded without connecting, a timeout occurs and WhatsUp Gold stops trying to connect to the SMTP server. This is considered a failed connection.
Mail to. Enter the email addresses to which you want to send the alert. Email addresses must be fully qualified. You can enter multiple addresses, separated by a semi-colon (;), comma (,), or the [SPACE] character. The address should not contain brackets, braces, quotes, or parentheses.
Mail from. Enter the email address you want to appear in the From field of the e-mail that is sent by the Email action.
SMTP server requires authentication. Check this option if your SMTP server uses authentication. This enables the Username and Password boxes. The Email action supports three authentication types: CRAM-MD5, login, and plain. The authentication type is not configurable. It is negotiated with the SMTP server automatically.
Username. Enter the user name of the SMTP authentication. Password. Enter the password of the SMTP authentication.
Mail Content tab Configure the following:
Subject. Enter a text message or edit the default message. You can use percent variable codes to display specific information in the subject.
Message body. Enter a text message or edit the default message.

WhatsUp Gold User Guide
195
Tip: You can use Percent Variable (on page 851) snippets to embed specific information in the message body.
Plain text. Html.
Tip: You can add a link to either or both the Device Status and Mobile Device Status reports by clicking the appropriate button.
Alert Center Settings Configure the following:
Alert Center email subject. Enter a subject for the message. This text appears as the subject in the e-mail that is sent by the Alert Center notification. This subject can include percent variables.
Tip: To insert an Alert Center Percent Variable (on page 851), right click inside the box.
Include hyperlink to Alert Center in the email content. Select to include a link to the Alert Center home page in the email message sent by the Alert Center notification.
Use HTTP. Select to use HTTP in the link address. Use HTTPS. Select to use HTTPS in the link address. Use dynamic address. If you select to use the dynamic address, WhatsUp
Gold automatically generates the URL using the current IP address or hostname at the time the action runs.
Use static hostname or IP address. If you select static hostname or IP address, specify the Hostname or IP address to include in the link address.
Port. Specify the port number to include in the link address.
Important: The address you enter here must be the exact address of the Alert Center home page to which you want to connect. Verify the address and enter its exact contents in the above options.
Post To IFTTT Action
Please note, some or all of the following procedure steps describe actions to be taken outside of WhatsUp Gold and were deemed to be accurate at the time of this release. Ipswitch is not responsible for changes to vendor software and/or online resources that may affect the accuracy of this content.

WhatsUp Gold User Guide
196
The Post to IFTTT action in WhatsUp Gold leverages the webhooks service available in IFTTT to trigger one or more actions using several available services which have the ability to connect to IFTTT. The services library supported by IFTTT is extensive and capable of executing a wide variety of actions. For detailed information, please see the IFTTT website (http://www.ipswitch.com/ifttt). The following procedure steps represent the general end-to-end workflow for creating an "if this, then that" applet using the IFTTT web interface.
1 Go to the IFTTT website (http://www.ipswitch.com/ifttt), click Sign up, and follow the prompts to create an IFTTT account.
2 Once logged in, click My Applets. 3 Click the Services tab. 4 Click the Webhooks icon. If the Webhooks icon is not visible, click All services,
then search for 'webhooks' in the Filter services entry field. 5 Click Connect. 6 Click Settings. 7 Copy the webhook key portion of the URL displayed. The webhook key is the
string of characters following the slash (/) at the end of the URL. You'll need this webhook key when creating the Post To IFTTT action in WhatsUp Gold.
8 Click My Applets. 9 Click New Applet. 10 Click + this. 11 Click the Webhooks icon. 12 Click Receive a web request. 13 Enter an Event Name for the trigger. The Event Name is case sensitive and
cannot contain spaces.
Note: The Post To IFTTT action in WhatsUp Gold sends events with names which follow the pattern: WUGDevice<Device State> by default. For example, when the device is in the Down state, the name of the event sent to IFTTT will be “WUGDeviceDown” and when the device is in Up state, the name of the event sent to IFTTT will be “WUGDeviceUp”.
14 Click Create Trigger. 15 Click + that. 16 Search for and select the service you'd like to carry out the action external of
WhatsUp Gold when the Post to IFTTT action is triggered within WhatsUp Gold. At this point, the applet creation workflow will vary wildly depending on the service you've selected and the subsequent connection and configuration options required therein. Some example use cases are as follows. Create a Post to IFTTT action which results in:
posting to social media using services like Facebook or Twitter.
controlling household electronic devices using services like Nest or SmartThings.
upload to data storage using services like Dropbox or Google Drive.

WhatsUp Gold User Guide
197
Please refer to the IFTTT website (http://www.ipswitch.com/ifttt) as well as the website(s) and support material available for your chosen service for more instruction.
17 Once the applet is created, log into WhatsUp Gold, create a new Post to IFTTT action, and configure the following: Name. Enter a unique name for the action. This name displays in the Actions
Library.
Description. Enter a short description about the action. This description displays next to the action in the Actions Library.
IFTTT webhook key. Enter the webhook key portion of the URL generated by the IFTTT service. Refer to the preceding procedures for information on generating the webhook.
Event name. Enter the Event Name used when creating the applet in IFTTT. Remember the name of the event is case sensitive and cannot contain spaces. We recommend using the default value of WUGDevice%Device.State as it resolves to event names which reflect the device state. For example, when the device is in down state the name of the event sent to IFTTT will be “WUGDeviceDown” and when the device is in up state, the name of the event sent to IFTTT will be “WUGDeviceUp”.
Value1/2/3. Enter the desired values to be made available in IFTTT applets as ingredients when the selected service is triggered.
Log to Text File Action The Log to Text action logs custom messages to specified text files.
Configure the following:
Name. Enter a unique name for the action. This name displays in the Actions Library.
Description. Enter a short description about the action. This description displays next to the action in the Actions Library.
Log file. Enter the full path to the location where the log file will be written.
Log file write mode. Select Append to have log messages appended to the Log file. Select Overwrite to have log messages overwrite existing log messages.
Log Message. Enter the message that will be written to the log file. This message supports percent variables. The default log message is: %Device.ActiveMonitorDownNames is %Device.State on %Device.Type: %Device.HostName (%Device.Address).
Details: Monitors that are down include: %Device.ActiveMonitorDownNames
Monitors that are up include: %Device.ActiveMonitorUpNames
Notes on this device (from device property page):

WhatsUp Gold User Guide
198
%Device.Notes
----------------------------------------
This message was logged on %System.Date at %System.Time Ipswitch WhatsUp Gold
Tip: Right-click in the Log Message box to select the percent variables you would like to use in the action.
Click OK to save your changes.
Pager Action Pager Action sends a user-specified message to a pager.
Configure the following:
Name. Enter a unique name for the action. This name displays in the Actions Library.
Description. Enter a short description about the action. This description displays next to the action in the Actions Library.
Terminal number. Enter the pager number to dial. Your service provider can provide you with this number.
Terminal password. If required, enter the pager password here. This is a password that is required to log in to some paging services.
Modem Setup. Select either Primary, or one of the Alternate setups. Protocol. Select the type of protocol used by your pager service. Pager ID. Enter the pager identification number. Message. Text message plus embedded percent variable (on page 851) code
snippets, as needed. Port Settings. Select to further define your modem setup selection. Modem
Setup is used specifically to support different service providers in case you use more than one provider for sending your pager notifications. There could also be times you want to change your settings to meet a specific service provider’s requirements for a specific notification (for example: a lower baud rate). To do this, you can set up an alternate Modem Setup and associate this to the notification instead of using your Primary setting.
Note: Changing the port settings for the desired modem setup affects ALL uses of that setting.
Click OK to save your changes.
Tip: To check the status of an action, or to cancel an action, in the WhatsUp Gold console go to Tools > Running Actions.

WhatsUp Gold User Guide
199
Post To Slack Action
Please note, some or all of the following procedure steps describe actions to be taken outside of WhatsUp Gold and were deemed to be accurate at the time of this release. Ipswitch is not responsible for changes to vendor software and/or online resources that may affect the accuracy of this content.
The Post to Slack action generates a notification message in the specified Slack channel/workspace or alternately to a specific Slack user. Prior to configuring this action in WhatsUp Gold, you must create and retrieve an incoming webhook URL from the Slack App Directory. For detailed information and procedures, please see Incoming WebHooks for Slack (http://www.ipswitch.com/incomingwebhooksforslack).
Configure the following:
Name. Enter a unique name for the action. This name displays in the Actions Library.
Description. Enter a short description about the action. This description displays next to the action in the Actions Library.
Webhook URL. Enter the URL of the incoming webhook created using the Slack App Directory.
Channel Override (Optional). Enter a specific Slack channel or user to which the message should be directed. To post the message to a specific channel, format the channel override as #channel. To direct the message to a specific user, format the channel override as @user. Note that the message to @user will appear in the slackbot Direct Message group. Leaving this configuration field blank causes the message to be posted to the channel selected when generating the initial incoming webhook.
Post as (Username). Enter the name of the message sender as it should be displayed in Slack. While any username may be specified, Slack notifications generated by this action appear to be sent by "WhatsUp Gold" by default. If the WhatsUp Gold default username is removed from the dialog and the configuration field is left blank, the message posted displays the username used when configuring the incoming webhook.

WhatsUp Gold User Guide
200
Message to post. Enter the actual text of the notification message to post in Slack. Please note, this configuration field supports the use of percent variables (on page 851). To insert a percent variable into your Slack message, right-click within the field, then select the desired option from the menu displayed.
PowerShell Action Windows PowerShell is a scripting language and command-line shell that system administrators can use to manage Windows operating systems. For more information on PowerShell, please visit the Microsoft web site.
The PowerShell action delivers a robust and flexible environment to the experienced user for developing custom actions through direct access to script component libraries, including the .NET Framework. For more information, see PowerShell script examples.
Important: WhatsUp Gold uses a 32-bit (i.e. x86) PowerShell engine. Therefore, only 32-bit PowerShell snap-ins are supported and 64-bit only snap-ins will not function properly. Snap-ins usable in both 32-bit and 64-bit operating systems are configured for 64-bit systems by default and must be manually configured for 32-bit PowerShell engine to function properly with WhatsUp Gold. If you are using additional pollers with WhatsUp Gold, PowerShell must be installed and any desired snap-ins must be registered identically on all poller machines for any PowerShell performance monitors, active monitors, and actions to function properly. Associated errors resulting from failed monitors will appear in the WhatsUp Gold Status Center. Errors resulting from failed actions will display in the WhatsUp Gold Event Viewer.
Configure the following:
Name. Enter a unique name for the action. This name displays in the Actions Library.
Description. (Enter a short description about the action. This description displays next to the action in the Actions Library.
Timeout (seconds). Enter the length of time WhatsUp Gold attempts to connect to the selected device. When the time you enter is exceeded without connecting,

WhatsUp Gold User Guide
201
a timeout occurs and WhatsUp Gold stops trying to connect to the device. This is considered a failed connection.
Note: You are highly discouraged from using a timeout longer than 10 seconds. Please use the shortest timeout possible.
Run under device credentials. Select this check box to execute the script using the Windows credentials for the affected device. For additional information, see Using the Credentials Library.
Important: If Run under device credentials is enabled, the Test functionality in the WhatsUp Gold Admin Console will not work.
Script Text. Enter your action code.
Important: When using percent variables as part of string literals in your PowerShell scripts, please use double quotation marks (" ") instead of single quotation marks (' ') to enclose the string literal. For example: $Message = "%Device.DisplayName changed state".
Click OK to save your changes.
Program Action Program actions can be defined to launch an external application when a state change occurs.
Program actions can be defined to launch an external application when a state change occurs.
Configure the following:
Name. Enter a unique name for the action. This name displays in the Actions Library.
Description. Enter a short description about the action. This description displays next to the action in the Actions Library.
Program file name. Enter the file path where the working files for the application are stored.
Working path. Enter the file path where the working files for the application are stored. The working path is located on the server where WhatsUp Gold is running.
Program arguments. Enter any percent variables you want to pass to the specified program.
OK. Click to save your changes.

WhatsUp Gold User Guide
202
Tip: To check the status of an action, or to cancel an action, in the WhatsUp Gold console go to Tools > Running Actions.
Service Restart Action The Restart action starts a previously stopped service.
Configure the following:
Name. Enter a unique name for the action. This name displays in the Action Library.
Description. Enter a short description about the action. This description displays next to the action in the Action Library.
Host. Enter the desired host from your network neighborhood.
User name (domain\username). Enter a user login to use with this monitor. In order to monitor the service on another machine, the Service Restart monitor has to be configured with the correct user name and password and a user account that belongs to the administrators group on the remote machine. If a domain account is used, then the expected user name is domain\user. If the device is on a workgroup, there are two possible user names: workgroup name\user or machine name\user. No user name and password is needed for local services (services on the machine where WhatsUp Gold is running).
Password. Enter the password for the login used above.
Service. Click browse (...) to select the desired service associated with your host.
Command. Select either Start or Stop, depending on whether you want the associated alert to start or stop the service you have selected.
OK. Click to save your changes.
Tip: To check the status of an action, or to cancel an action, in the WhatsUp Gold console go to Tools > Running Actions.
SMS Action SMS Action sends a Short Message Service (SMS) notification to a pager or cell phone using an email gateway or dial-up modem. An SMS Action can also be used as an SMS notification in the WhatsUp Gold Alert Center.
Configure the following:
Message Name. Enter a unique name for the action. This name displays in the Actions
Library.

WhatsUp Gold User Guide
203
Description. Enter a short description about the action. This description displays next to the action in the Actions Library.
Country. Select the country for the SMS provider. Provider. Select the desired provider. If the provider list is incomplete and/or
incorrect, you can click browse (...) to add, edit, or delete providers in this list. Mode. Select either Email or Dialup, depending on how the provider was
created in the system. Phone number. Phone number to call. You can enter multiple phone numbers,
separated by a comma. There is a 2,000 character limit in this field. Non-numeric characters such as "-" and "." are ignored.
Message. Text message plus embedded percent variable (on page 851) code snippets, as needed.
Tip: To enter Message variables, right click inside the Message box.
Note: If the message exceeds 140 characters, the message will be broken into up to 3 parts and will be sent as separate messages ("1 of 3", "1 of 2").
Mobile Device Status. Click to insert a link to the device status in the message.
Alert Center Message Alert Center Message. Message that is to be sent from a WhatsUp Gold Alert Center notification including percent variable codes. Note that applying percent variables (on page 851) can expand actual character count.
Tip: To enter Alert Center variables, right click inside the Alert Center Message box.
Note: If the message exceeds 140 characters, the message will be broken into up to 3 parts and will be sent as separate messages ("1 of 3", "1 of 2", etc.).
SMS Direct action SMS Direct messages are similar to SMS messages, except a phone line is not required. Instead, messages are sent directly to a cell phone, or other texting capable device, via a GSM modem. If the receiving phone is not active or is out of range when a SMS message is sent, messages are received when the phone is turned on. SMS messages are listed in the WhatsUp Gold Action log.
You need the following items to use the SMS Action:
GSM modem to connect to the WhatsUp Gold machine SIM card for the GSM modem Cell service/signal in the room in which the WhatsUp Gold machine and GSM
modem reside
Configure the following:

WhatsUp Gold User Guide
204
Message Name. Name for the action. Description. Short description about the action. Phone number. Cell phone number(s) of the intended SMS message
recipients. All non-numeric characters such as "-" and "." are ignored. There is a 2,000 character limit in this box.
Note: All non-numeric characters, other than the comma, such as "-" and ".", are ignored.
Note: There is a 2,000 character limit in this box.
COM Port. Select the COM port you want to use with this notification.
Note: The list displays all ports associated with the GSM modem, including virtual and hard-wired, serial ports. You must select the port that is assigned to the modem in the Windows Device Manager.
Message. Enter a text message, plus any desired percent variable codes. Note that percent variables can expand actual character count.
Alert Center Message Alert Center Message. Message that is to be sent from a WhatsUp Gold Alert Center notification including percent variable codes. Note that embedding percent variables (on page 851) can expand actual character count.
Tip: To enter Alert Center percent variables (on page 851), click the Alert Center Message box.
Note: If the message exceeds 140 characters, the message will be broken into up to 3 parts and will be sent as separate messages ("1 of 3", "1 of 2", etc.).
SNMP Set Action This action sends an SNMP Set to a device in order to change a specific SNMP action. You can configure SNMP Set actions to perform a number of tasks, including rebooting a device, changing the state of a network remotely, disabling or enabling a device feature, etc.
The SNMP Set action can use any SNMP credential defined in the Credentials Library and supports all types of writable objects (strings, integers, timeticks, etc.).
If the action operation fails, errors are reported to the Action log.
Configure the following:

WhatsUp Gold User Guide
205
Name. Enter a unique name for the action. This name displays in the Action Library.
Description. (Optional) Enter additional information about the action. This description displays next to the action in the Action Library.
IP address or host name. Enter the IP address or host name of the device to which the action to send the SNMP Set.
SNMP v1/v2/v3 credentials. Select the SNMP credential that the action is to use. This list is populated with credentials currently configured in the Credentials Library.
Object identifier. Enter the object identifier (OID) that the action is to use or click browse (...) to select the OID.
Instance. Enter the instance that coincides with the OID that the action is to use or click browse (...) to select the instance.
Value type. Select the type of written object the action is to use.
Value to set. Enter a value for the type you selected.
Note: The action only allows you to set one value at a time.
Advanced. Click to change the SNMP timeout and retry settings.
OK. Click to save your changes.
Adding and editing a Sound Action A sound file can be assigned to an action by creating a sound action. The Desktop Actions application must be running for the Sound action to work. For more information, see About the Task Tray and Desktop Actions applications.
Configure the following:
Name. Enter a unique name for the action. This name displays in the Action Library.
Description. (Optional) Enter additional information about the action. This description displays next to the action in the Action Library.
Sound file name. Enter the full path to the sound file. The sound file name is located on the server where WhatsUp Gold is running.
Continuous play. Select this option to have the sound play continuously until the Cancel Sound button is clicked on the main WhatsUp Gold toolbar.
OK. Click to save your changes.
Tip: To check the status of an action, or to cancel an action, in the WhatsUp Gold console go to Tools > Running Actions.

WhatsUp Gold User Guide
206
If you want to bring text-to-speech action sound to a Windows 2003 or Windows 2008 server class remote desktop (RDP) system, you need to enable audio mapping for the remote system Terminal Services Configuration.
Configure the following:
1 In Windows, click Start > Run, in the Run dialog type TSCC.msc, then click OK. 2 In the Connections folder, double-click RDP-tcp. The RDP-TCP Properties dialog
appears. 3 Select the Client Settings tab, then click to clear the Audio Mapping check box.
When enabled, the text-to-speech action sound only plays on the remote desktop system.
SSH Action The SSH action connects to remote devices via SSH to execute commands or scripts.
Configure the following:
Name. Enter a unique name for the action. This name displays in the Actions Library.
Description. Enter a short description about the action. This description displays next to the action in the Actions Library.
IP address. Enter the IP address of the device to which you want to connect using SSH.
Note: You can enter %Device.Address into the IP Address box; however, an SSH action that does not specify a specific IP address in this box is not available in the Recurring Actions wizard.
Command to run. Enter the command to be run and executed on the remote device. This command can be anything that the device can interpret and run; for example, a Unix shell command or a perl script.
Note: If you create a script to run on the remote device, the script must be developed, tested, and/or debugged on the remote machine. WhatsUp Gold does not support manipulation of the remote script.
Line End Character. SSH credential. Select the appropriate SSH credential that WhatsUp Gold uses
to connect to the remote device. If you select Use the device SSH credential, WhatsUp Gold uses the SSH credential assigned to the device for which the IP address is listed above. If the appropriate SSH credential is not listed, or the device has no SSH credentials assigned, browse (...) to the WhatsUp Gold Credentials Library to configure a set of credentials.

WhatsUp Gold User Guide
207
Syslog action When a device does not respond to polling, you can send a Syslog message to a host that is running a Syslog server.
Configure the following:
Name. Enter a unique name for the action. This name displays in the Actions Library.
Description. Enter a short description about the action. This description displays next to the action in the Actions Library.
Syslog Server. Enter the IP address or hostname of the machine that is running the Syslog server.
Port. Enter the UDP port that the Syslog listener is listening on. The default port is 514.
Message. Enter a text message to send to the Syslog server. This message may include notification variables. The Syslog message box limits input to 511 characters. If notification variables are used, then the message that actually gets sent is limited to 1023 bytes, in order to comply with the Syslog protocol. Non-visible ASCII characters such as tabs and line feeds are replaced by space characters.
OK. Click to save your changes.
Note: If you attempt to run another application on the same system that also listens on the same Syslog port as WhatsUp Gold, the error message Unable to Open Socket displays.
Note: The WhatsUp Gold Syslog listener runs on Port 514 by default. This port can be configured in the WhatsUp Gold console at Configure > Program Options > Passive Monitor Listeners > Syslog.
Tip: To check the status of an action, or to cancel an action, in the WhatsUp Gold console go to Tools > Running Actions.
Text to Speech Action This action plays a text-to-speech message on your computer.
Configure the following:
Name. Enter a unique name for the action. This name displays in the Action Library.
Description. (Optional) Enter additional information about the action. This description displays next to the action in the Action Library.
Speak Rate. Select how fast the voice speaks the message.
Volume. Select the volume of the message.

WhatsUp Gold User Guide
208
Message. Enter any text message you want audibly repeated. You can use your own text in addition to percent variables.
OK. Click to save your changes.
Tip: To check the status of an action, or to cancel an action, in the WhatsUp Gold console go to Tools > Running Actions.
The Desktop Actions application must be running for the Text to Speech action to work.
If you want to bring the text-to-speech action sound to a Windows 2003 or Windows 2008 server class remote desktop (RDP) system, you need to enable audio mapping for the remote system's Terminal Services Configuration.
If you want to bring the text-to-speech action sound to a Windows 2012 server class RDP system, you need to ensure the ‘Windows Audio’ and ‘Windows Audio Endpoint Builder’ Services are running and you are connected through an RDP connection with the remote audio playback radio set to ‘Play on this computer’.
Configure the following:
1 in Windows, click Start>Run, in the Run dialog type TSCC.msc, then click OK. 2 In the Connections folder, double-click RDP-tcp. The RDP-TCP Properties dialog
appears. 3 Select the Client Settings tab, then click to clear the Audio Mapping check box.
When enabled, the text-to-speech action sound only plays on the remote desktop system.
VMware Action VMWare actions perform operations such as starting, stopping, or taking a snapshot of virtual machines running on a VMWare host or being managed by a VMWare vCenter server.
Configure the following:
Name. Enter a unique name for the action. This name displays in the Actions Library.
Description. Enter a short description about the action. This description displays next to the action in the Actions Library.
VMware server IP address. Enter the IP address of the VMware host or vCenter server managing the virtual machine.
VMware credentials. Select the VMware credentials from the Credentials Library for the VMware host or vCenter server managing the virtual machine. Click browse (...) to manage credentials in the Credentials Library.
VMware name. Select the Virtual machine VMware name for the virtual machine on which you want the action performed. You can enter the VMware name, or select from the list of virtual machines associated with the VMware host or

WhatsUp Gold User Guide
209
vCenter server. Click browse (...) to access the list of virtual machines associated with the VMware host.
Operation. Select the operation you want the action to perform from the list box.
The following operations can be performed on a virtual machine:
Power On. Powers up the virtual machine and boots the guest operating system if the guest operating system is installed.
Power Off. Powers down the virtual machine. The virtual machine does not attempt to gracefully shut down the guest operating system.
Reset. Powers down the virtual machine and restarts it.
Shutdown. Shuts down the guest operating system. If the guest operating system automatically powers off its host, then the virtual machine also powers off.
Suspend. Pauses the virtual machine activity; all transactions are frozen.
Restart. Shuts down and restarts the guest operating system; does not power off the virtual machine.
Take snapshot. Saves the current state of the virtual machine to the virtual disk of the guest system.
OK. Click to save your changes.
Web Alarm Action The Web Alarm action sounds an alarm by playing sound file on the WhatsUp Gold console. For more information on how Web Alarms work, see the Working with Web Alarms topic.
Note: In previous versions of WhatsUp Gold, the Web Alarm action was included in the Implicit Action Policy. This is no longer true in WhatsUp Gold v14 and later.
Configure the following:
Name. Enter a unique name for the action. This name displays in the Actions Library.
Description. Enter a short description about the action. This description displays next to the action in the Actions Library.
Message. Enter a short message to send to the visual cue part of the Web Alarm in the web interface. You can use percent variable (on page 851) snippets to display specific information in the message body.
Play Sound. Select this option to play the sound file whenever a web alarm action fires. Clear this option to only have the visual cue appear in the Web Interface.
Sound file name. Select a sound file that is installed in your \Program Files\Ipswitch\WhatsUp\HTML\Nm.UI\WebSounds directory. Custom sounds added to this directory appear in the drop-down list.
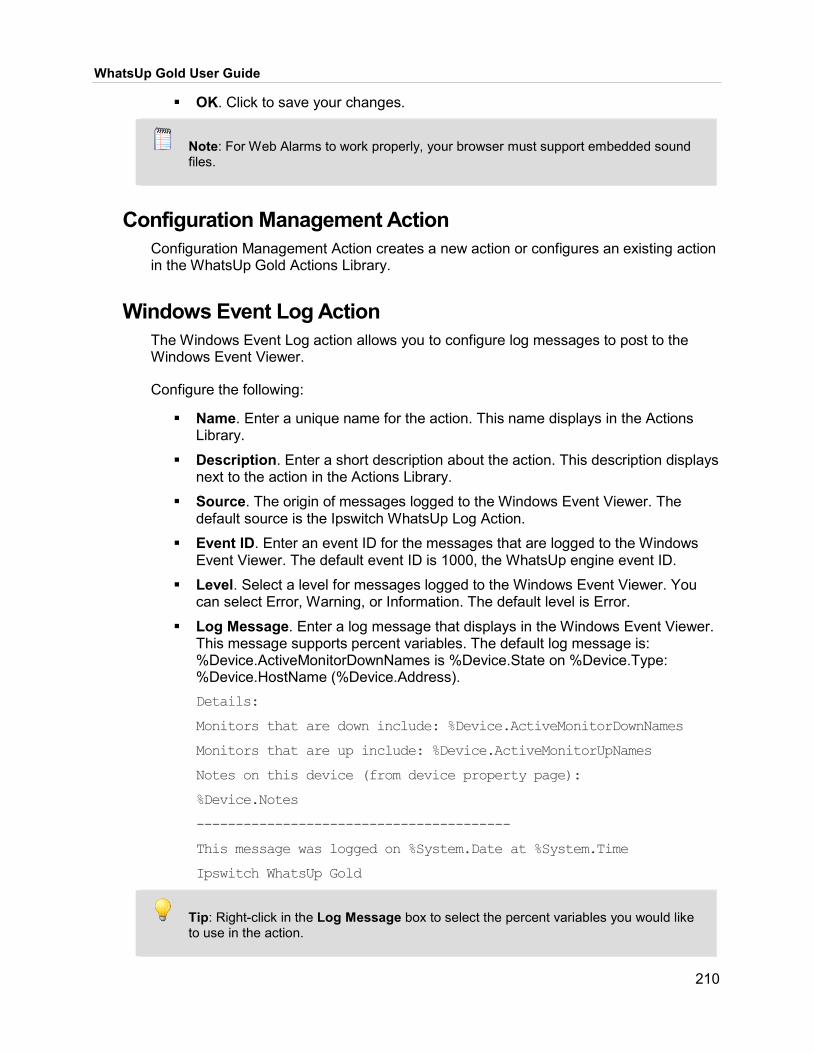
WhatsUp Gold User Guide
210
OK. Click to save your changes.
Note: For Web Alarms to work properly, your browser must support embedded sound files.
Configuration Management Action Configuration Management Action creates a new action or configures an existing action in the WhatsUp Gold Actions Library.
Windows Event Log Action The Windows Event Log action allows you to configure log messages to post to the Windows Event Viewer.
Configure the following:
Name. Enter a unique name for the action. This name displays in the Actions Library.
Description. Enter a short description about the action. This description displays next to the action in the Actions Library.
Source. The origin of messages logged to the Windows Event Viewer. The default source is the Ipswitch WhatsUp Log Action.
Event ID. Enter an event ID for the messages that are logged to the Windows Event Viewer. The default event ID is 1000, the WhatsUp engine event ID.
Level. Select a level for messages logged to the Windows Event Viewer. You can select Error, Warning, or Information. The default level is Error.
Log Message. Enter a log message that displays in the Windows Event Viewer. This message supports percent variables. The default log message is: %Device.ActiveMonitorDownNames is %Device.State on %Device.Type: %Device.HostName (%Device.Address). Details:
Monitors that are down include: %Device.ActiveMonitorDownNames
Monitors that are up include: %Device.ActiveMonitorUpNames
Notes on this device (from device property page):
%Device.Notes
----------------------------------------
This message was logged on %System.Date at %System.Time Ipswitch WhatsUp Gold
Tip: Right-click in the Log Message box to select the percent variables you would like to use in the action.

WhatsUp Gold User Guide
211
OK. Click to save your changes.
Selecting an Action Type When you apply active monitors, you typically associate an action and a device state with changes observed by the monitor. There are three main categories of built-in action types available through the Actions Library (on page 252). Actions can be triggered or scheduled.
Note: Certain actions (CM Actions, for example) can be invoked on demand (Run Now).
Built-in action types include:
Notifications. Send messages to stakeholders and responsible individuals according to site policy.
Remote execution. Create scripts, execute remote programs, and apply configuration changes.
Log. Include state change observed by WhatsUp Gold in platform logs.
Notifications Beeper action (on page 192). Activate a beeper with this type of action. E-mail action (on page 194). Send an Email to a specific address. Log to Text File action (on page 197). Write a message to a text file. Pager action (on page 198). Send a message to a pager. Web Alarm action (on page 209). Activate a Web Alarm in the WhatsUp Gold
Web Interface Text to Speech action (on page 207). Plays a voice message on your
computer. SMS action (on page 202). Send a text message to a specific target. SMS Direct action (on page 203). Send a text message to a wireless phone or
other wireless device. Sound action (on page 205). Play a specific sound.
Remote/Local Script or Execution Service Restart action (on page 202). Start or stop a Windows service. Active Script action (on page 191). Write code to perform a customized action. Configuration Management action (on page 308). Perform script or task from
CM Task (on page 314) (includes Task Scripts (on page 309)) or CM Script (on page 328) Libraries.
PowerShell action (on page 200). Develop custom actions through direct access to scriptable component libraries, including the .NET Framework.

WhatsUp Gold User Guide
212
SSH action (on page 206). Connect to remote devices via SSH to execute commands or scripts.
Program action (on page 201). Execute an external application. SNMP Set action (on page 204). Use SNMP to increase a counter, set a flag,
or change the attribute value of a managed object.
Log Windows Event Log action (on page 210). Write an event in the Windows
Event Log. Syslog action (on page 207). Write a message to a log in the Syslog system. VMware action (on page 208). Use the VMware API to perform an action on a
virtual machine.
Select a State Change Select a state change from the list.
If the selected state change occurs on the item, the action is fired. If an Up state is selected, you may also choose a Down state that must be
reached before that action is fired.
Select Action and State Associate an Action with the monitor.
Select an Action from the Action Library. Pull-down menu is populated by entries in the Actions Library.
Execute Action on the Following State Change. For example, select Maintenance state if you want to fire an action after transitioning to Maintenance Mode.
Select Up State Dependency This option bundles Up and its transition state. For example, let's say you only want to fire if Up transitions to Down for at least 20 minutes —where Down would be the Only if the Following State Was Reached.
Only if the Following State Was Reached. Select either: A state in the list to watch for following the Up state before this Action can be
triggered. For example, trigger an Action notification when after holding an Up state later transitioning to Down at Least 20 min.
No dependency on a preceding state.
Add Blackout Period Blackout period. Schedule a blackout time for the action.

WhatsUp Gold User Guide
213
Repeat Options Repeat Action. Useful when mission critical incidents occur. For example, let's
say you define an action that sends a notification to the responsible team for state changes that must be resolved or require site or service admin intervention (Down events, for example)
Repeat Every. Frequency to fire the action. For example, send an SMS or e-mail or log message.
Tip: Repeating action stop if device goes from Down to Up or if you put the device into Maintenance mode. You may also stop repeating actions manually:WhatsUp Gold Admin Console: click Tools > Running Actions... > then select the action / repeating action you want to stop. click Action > Cancel Selected Action.
Guidelines for Creating Action Policies Action Policies bundle Actions and Notifications. Actions and Notifications are typically triggered by a condition or threshold observed by a monitor. You can combine Action and Notification building blocks as a way to implement a policy that governs selected devices and device roles (on page 89).
In WhatsUp Gold Action Policies typically trigger any of the following:
Simple notifications (on page 260) (e-mail, SMS, log). Corrective measures (such as remote script execution payload, configuration
rollback, reboot, and so on). Some combination of corrective measures and notifications.
Examples of site actions bundled to implement action policies might be:
Notifying application management engineers when production devices transition state (for example from maintenance mode to up)
Applying approved configuration to a device found out of compliance (a default password is detected, anomalous port opened or traffic detected)
"Activating" (reconfigure and restart) a backup host device whenever a primary fails
Restarting "non-responsive" critical services (an FTP or log server, for example)
Note: You can also create and apply powerful policies which enforce configuration record versioning and device configuration alignment using WhatsUp Gold Configuration Management policies (on page 321).
Creating Action Policies Begin by creating a list or matrix of critical state change events, appropriate actions, and the chain of responsible individuals for your site.

WhatsUp Gold User Guide
214
Example: Device Recovery Matrix
Policy: Internal Service Level Agreement
Device recovery actions The following matrix shows the sequence of WhatsUp Gold managed controls (thresholds and states coupled with actions) rolled into an example action policy called "Internal Service Level Agreement."
Event Actions Notification
Device crash and reboot or forced reboot after n seconds.
Run recovery action scripts.
Verify network (NIC) connectivity.
Verify application service connectivity.
If application service verification fails, trigger failed web service role policy.
Data center team notification.
On call services engineers notification.
Notification attachments
Event log report.
Follow on with availability reports.
Failed web service role policy.
(No response or after n milliseconds to application service active monitors from WhatsUp Gold pollers.)
Remove web service role endpoint from the "load balancer" configuration.
Add to WhatsUp Gold maintenance mode.
Data center team notification.
On call services engineers notification.
Product owner notification with availability reports.
Failed node.
Symptoms: External NIC or management NIC not responding, remote execution failure, remote write failure, kernel panic.
Run failed node recovery action.
Data center team notification.
Notify closest data center engineer.
1 Create an Action type from the Actions Library.
Example: Test Connectivity/Remote Execution
1 Click the new button, then select PowerShell (for Linux/UNIX, select SSH).
2 Add syntax for remote login to the device in the script text box.
2 Create the Action Policy.

WhatsUp Gold User Guide
215
Example: Combine with Notification Schedule and Roll Test into Action Policy
Add a notification action you created according to your site's notification hierarchy.
Add the PowerShell action you created.
Working with credentials To identify, monitor, and perform actions on devices, WhatsUp Gold uses one or more credential sets per device.
Tips for applying credentials (on page 240). Creating credentials (on page 241). Assigning credentials (on page 241).
You can apply credentials to a devices at discovery or rescan time (on page 31), as part of credential maintenance, and as new or additional monitors require them.
Credentials are needed for network discovery. Each credential type you apply can affect the richness of information returned
for discovering, monitoring, and reporting purposes. For core WhatsUp Gold performance monitors (CPU utilization, Memory
Utilization) you need at least SNMP or Windows credentials during network discovery.
Credential Types (Built into WhatsUp Gold) Credentials Library provides the following credential types:
Network Management. Simple Network Management Protocol (SNMPv1 (on page 219), SNMPv2 (on page 220), SNMPv3 (on page 220)).
Credential Type Description Typical Use
SNMPv1 (on page 219)
SNMPv2 (on page 220)
Administrative SNMP domains (for example, networks and subnets) are defined by a shared SNMP community string.
Poll with WhatsUp Gold performance monitors with access to MIBs on any device running an SNMP agent with a default ("public") or otherwise configured community string.
SNMPv3 (on page 220)
User based security with SNMP message authentication for data integrity and origin authentication.
Poll with WhatsUp Gold Performance monitors for SNMP-enabled devices using SNMPv1,v2,v3.
Ensure message privacy between a SNMPv3 agent and management station.
Protect against MITM attacks due to replay.

WhatsUp Gold User Guide
216
System Attributes and Instrumentation. Windows (on page 221), VMware (on page 223), SSH (on page 223) (typically used for Linux and UNIX).
Credential Type Description Typical Use
WMI (Windows) (on page 221)
Windows user credentials. It is best practice to scope these according to the principal of least privilege.
Provides WhatsUp Gold Performance monitors WMI object access.
For Windows OS based devices, which can provide different information than SNMP.
Note: Add WMI credentials directly to Hyper-V hosts for Disk Utilization metrics.
SSH (on page 223), Telnet (on page 222) (UNIX, Linux)
Remote commands, scripts, and management.
Connect WhatsUp Gold to devices running an SSH Server.
Access filesystem partition information on Linux, UNIX devices if not available by way of SNMP.
Action scripts/Shell Scripts.
Telnet (on page 222) (UNIX, Linux)
Remote commands, scripts, and management.
Connect WhatsUp Gold to devices running a Telnet Server.
Shell access.
VMware (on page 223)
VM platform attributes, status, and logs.
Needed to connect to vCenter server.
Add to vCenter server. Enables VM and virtual server
information to be gathered by way of VMware services.

WhatsUp Gold User Guide
217
Remote Execution. Secure Shell client (SSH) (on page 223), Telnet client (on page 222).
Credential Type Description Typical Use
SSH (on page 223)
Remote commands, scripts, and management.
Connect WhatsUp Gold to devices running an SSH Server.
Access filesystem partition information on Linux, UNIX devices if not available by way of SNMP.
Linux/UNIX/router switch CLI. Action scripts/shell scripts (SSH
action (on page 206), for example).
Telnet (on page 222)
Remote commands, scripts, and management.
Connect WhatsUp Gold to devices running a Telnet Server.
Shell access. Linux/UNIX/router switch CLI.
Storage Device Management. Storage Management Initiative Specification (SMI-S (on page 224)).
Cloud. Amazon Web Services (AWS) (on page 227), Microsoft Azure (Tenant and Enterprise) (on page 228).
Wireless. Meraki Cloud (on page 240).
Applications. ADO (on page 222), JMX (on page 223).
Tip: Most active monitors that include scripting (PowerShell, for example (on page 130)) have the ability to apply credential sets as part of remote processing (before and during the active session).
Available Credentials Credentials Library provides the following credential types:

WhatsUp Gold User Guide
218
Network Management. Simple Network Management Protocol (SNMPv1 (on page 219), SNMPv2 (on page 220), SNMPv3 (on page 220)).
Credential Type Description Typical Use
SNMPv1 (on page 219)
SNMPv2 (on page 220)
Administrative SNMP domains (for example, networks and subnets) are defined by a shared SNMP community string.
Poll with WhatsUp Gold performance monitors with access to MIBs on any device running an SNMP agent with a default ("public") or otherwise configured community string.
SNMPv3 (on page 220)
User based security with SNMP message authentication for data integrity and origin authentication.
Poll with WhatsUp Gold Performance monitors for SNMP-enabled devices using SNMPv1,v2,v3.
Ensure message privacy between a SNMPv3 agent and management station.
Protect against MITM attacks due to replay.
System Attributes and Instrumentation. Windows (on page 221), VMware (on page 223), SSH (on page 223) (typically used for Linux and UNIX).
Credential Type Description Typical Use
WMI (Windows) (on page 221)
Windows user credentials. It is best practice to scope these according to the principal of least privilege.
Provides WhatsUp Gold Performance monitors WMI object access.
For Windows OS based devices, which can provide different information than SNMP.
Note: Add WMI credentials directly to Hyper-V hosts for Disk Utilization metrics.
SSH (on page 223), Telnet (on page 222) (UNIX, Linux)
Remote commands, scripts, and management.
Connect WhatsUp Gold to devices running an SSH Server.
Access filesystem partition information on Linux, UNIX devices if not available by way of SNMP.
Action scripts/Shell Scripts.
Telnet (on page 222) (UNIX, Linux)
Remote commands, scripts, and management.
Connect WhatsUp Gold to devices running a Telnet Server.
Shell access.

WhatsUp Gold User Guide
219
Credential Type Description Typical Use
VMware (on page 223)
VM platform attributes, status, and logs.
Needed to connect to vCenter server.
Add to vCenter server. Enables VM and virtual server
information to be gathered by way of VMware services.
Remote Execution. Secure Shell client (SSH) (on page 223), Telnet client (on page 222).
Credential Type Description Typical Use
SSH (on page 223)
Remote commands, scripts, and management.
Connect WhatsUp Gold to devices running an SSH Server.
Access filesystem partition information on Linux, UNIX devices if not available by way of SNMP.
Linux/UNIX/router switch CLI. Action scripts/shell scripts (SSH
action (on page 206), for example).
Telnet (on page 222)
Remote commands, scripts, and management.
Connect WhatsUp Gold to devices running a Telnet Server.
Shell access. Linux/UNIX/router switch CLI.
Storage Device Management. Storage Management Initiative Specification (SMI-S (on page 224)).
Cloud. Amazon Web Services (AWS) (on page 227), Microsoft Azure (Tenant and Enterprise) (on page 228).
Wireless. Meraki Cloud (on page 240).
Applications. ADO (on page 222), JMX (on page 223).
SNMP v1 The Credentials Library stores community string information for SNMP devices in your WhatsUp Gold database to be used whenever a read or write community string is needed to monitor a device. In WhatsUp Gold, credentials are used to limit access to a device's SNMP data. Devices need SNMP credentials assigned to them before SNMP-based Active Monitors can be applied. Configure the following fields to create a SNMP v1 credential:

WhatsUp Gold User Guide
220
Name. Enter a unique name for the credential. This name displays in the Credentials Library.
Description. (Optional) Enter additional information about the credential. This information displays next to the credential in the Credentials Library.
SNMP read community. Enter the read community string you want to use for this credential.
SNMP write community. Enter the write community string you want to use for this credential.
SNMP v2 The Credentials Library stores community string information for SNMP devices in your WhatsUp Gold database to be used whenever a read or write community string is needed to monitor a device. In WhatsUp Gold, credentials are used to limit access to a device's SNMP data. Devices need SNMP credentials assigned to them before SNMP-based Active Monitors can be applied. Configure the following fields to create a SNMP v2 credential:
Name. Enter a unique name for the credential. This name displays in the Credentials Library.
Description. (Optional) Enter additional information about the credential. This information displays next to the credential in the Credentials Library.
SNMP read community. Enter the read community string you want to use for this credential.
SNMP write community. Enter the write community string you want to use for this credential.
SNMP v3 The Credentials Library stores community string information for SNMP devices in your WhatsUp Gold database to be used whenever a read or write community string is needed to monitor a device. In WhatsUp Gold, credentials are used to limit access to a device's SNMP data. Devices need SNMP credentials assigned to them before SNMP-based Active Monitors can be applied. Configure the following fields to create a SNMP v3 credential:
Name. Enter a unique name for the credential. This name displays in the Credentials Library.
Description. (Optional) Enter additional information about the credential. This information displays next to the credential in the Credentials Library.
Username. Enter the username that is configured for the SNMP agent. This username is included in every SNMP packet in the authentication header. An SNMP device, upon reception of a packet, uses this username to look for configured authentication and encryption parameters and applies them to the received message.
Context. (Optional) Enter the context needed to identify specific SNMP instances on your network.

WhatsUp Gold User Guide
221
Authentication. If required, select the authentication protocol for this SNMP credential.
Protocol. Select the algorithm method for authenticating SNMP v3 packets. MD5 creates a 128 bit digital signature, SHA-1 creates a 160 bit digital signature and SHA-256 creates a 256 bit digital signature.
Password. Enter the authentication password.
Confirm password. Re-enter the authentication password a second time for confirmation.
Encryption. If supported, and an authentication protocol was selected for the SNMP v3 device, select the encryption protocol for the SNMP credential.
Protocol. Select the algorithm method for encrypting SNMP v3 packets. DES56 uses a 56 bit encryption scheme, AES-128 uses a 128 bit encryption scheme, AES-192 uses a 192 bit encryption scheme, and AES-256 uses a 256 bit encryption scheme. Triple DES encryption may also be selected.
Password. Enter the encryption password.
Confirm password. Re-enter the authentication password a second time for confirmation.
Note: SNMP v3 passwords are limited to 64 characters.
Windows Apply Windows credentials to gather Windows Management Information (WMI) metrics and Windows system information from Windows host devices.
Windows credential types are also used for Hyper-V host machines to enable performance metrics and data to be gathered from Hyper-V virtual machines.
Configure the following fields to create a Windows credential:
Name. Credential name. Description. Optional description. Domain\UserID. Enter the domain and user login to use with this credential. To
monitor a service on your devices, configure the Windows credential with the correct domain, user name and password and a user account that belongs to the administrators group on the remote machine. If a domain account is used, the expected user name format is domain\user. If the device is on a workgroup, there are two possible user names: workgroup name\user or machine name\user. In any case, the Domain\UserID must contain the backslash (\) character.
Password. Enter the password for the login used above. To monitor NT services on a XP machine with an account that has an empty password, the XP Local Security Settings might have to be modified. To do this:
Go to Administrative tools > Local Security Settings.
Select Security Settings > Local Policies > Security Options.

WhatsUp Gold User Guide
222
Right-click on the setting Account: Limit local account use of blank passwords to console logon only, choose Properties, then select Disable.
Confirm password. Re-enter the authentication password for confirmation.
ADO The Credentials Library stores ADO database connection string information in your WhatsUp Gold database. Configure the following fields to create an ADO credential:
Name. Enter a unique name for the credential. This name displays in the Credentials Library.
Description. (Optional) Enter additional information about the credential. This information displays next to the credential in the Credentials Library.
Username. Enter a username. This username is used to authenticate to the device.
Password. Enter a password. This password is used with the above username to authenticate to the device
Confirm password. Re-enter the authentication password for confirmation.
Telnet The Credentials Library allows you to create a new Telnet credential type for use with WhatsUp Gold and the Configuration Management plug-in. Configure the following fields to create a Telnet credential:
Name. Enter a unique name for the credential. This name displays in the Credentials Library.
Description. (Optional) Enter additional information about the credential. This information displays next to the credential in the Credentials Library.
Password. Enter a password. This password is used with the above username to authenticate to the device.
Confirm password. Re-enter the authentication password for confirmation. Enable/privilege password. Enter the password that enables the router to go
to privileged EXEC mode, enabling you to configure the router. If the username and password provided above provide the privilege needed to run the required commands, the enable/privilege password is not needed.
Confirm enable/privilege password. Re-enter the authentication privilege password for confirmation.
Port. Enter the Telnet port associated with the router. The default Telnet port is 23.
Timeout. Enter a timeout (in seconds) for the length of time the connection should be attempted. The default timeout is 10 seconds.

WhatsUp Gold User Guide
223
SSH The Credentials Library stores SSH authentication data for devices in your WhatsUp Gold database to be used whenever authentication is needed to connect to and gather data from a device. Configure the following fields to create an SSH credential:
Name. Enter a unique name for the credential. This name displays in the Credentials Library.
Description. (Optional) Enter additional information about the credential. This information displays next to the credential in the Credentials Library.
Username. Enter a username. This username is used to authenticate to the device.
Password. Enter a password. This password is used with the above username to authenticate to the device.
Confirm password. Re-enter the authentication password for confirmation. Enable/privilege password. Enter the password that enables the router to go
to privileged EXEC mode, enabling you to configure the router. If the username and password provided above provide the privilege needed to run the required commands, the enable/privilege password is not needed.
Confirm enable/privilege password. Re-enter the authentication privilege password for confirmation.
Port. Enter the SSH port associated with the router. The default SSH port is 22. Timeout. Enter a timeout (in seconds) for the length of time the connection
should be attempted. The default timeout is 10 seconds.
VMware The Credentials Library stores VMware authentication data for vCenter and associated VMs in your WhatsUp Gold database. They will be used whenever authentication is needed to connect to and gather data from the vCenter server or VMware host. Configure the following fields to create a VMware credential:
Name. Enter a unique name for the credential. This name displays in the Credentials Library.
Description. Optional description. Username. User name needed to authenticate to the device. Password. Password associated with the user name. Confirm password. Re-enter the authentication password for confirmation.
JMX The Credentials Library stores Java Management Extension authentication data for specific active and performance monitors configured in WhatsUp Gold as well as certain application profiles configured in APM. Configure the following fields to create a JMX credential:
Name. Enter a unique name for the credential. This name displays in the Credentials Library.

WhatsUp Gold User Guide
224
Description. (Optional) Enter additional information about the credential. This information displays next to the credential in the Credentials Library.
Username. Enter a username. This username is used to authenticate to the device.
Password. Enter a password. This password is used with the above username to authenticate to the device.
Confirm password. Re-enter the authentication password for confirmation.
SMI-S Credential The Credentials Library stores SMIS authentication data for devices in your WhatsUp Gold database to be used whenever authentication is needed to connect to and gather data from a NetApp FAS series storage device. Configure the following fields to create a SMIS credential:
Name. Enter a unique name for the credential. This name displays in the Credentials Library.
Description. Enter additional information about the credential. This information displays next to the credential in the Credentials Library.
Username. Enter a username. This username is used to authenticate to the device.
Password. Enter a password. This password is used with the above username to authenticate to the device.
Confirm password. Re-enter the authentication password for confirmation. Protocol. Select either HTTP or HTTPS as the authentication protocol to be
used for communication between the WhatsUp Gold server and the storage device.
Port. Enter the port number WhatsUp Gold should use to communicate with the storage device.
Timeout. Enter a timeout (in seconds) for the length of time the connection should be attempted. The default timeout is 10 seconds.
Note: The features described in this help topic are included in WhatsUp Gold® Total and WhatsUp Gold® Total Plus. Additionally, you must install the SMI-S agent to successfully monitor storage devices using WhatsUp Gold. Please see Installing the SMI-S Agent (on page 46) for additional information.
Installing the SMI-S Agent for use with WhatsUp Gold Use the following procedure steps to install the Data ONTAP SMI-S Agent in order to successfully monitor NetApp FAS series storage devices using WhatsUp Gold. The Agent is required for monitoring volume statistical data and must be installed on a machine that can communicate with both WhatsUp Gold and the storage device or devices being monitored.

WhatsUp Gold User Guide
225
1 Download the Data ONTAP SMI-S Agent executable file from NetApp. For detailed information such as prerequisites, supported operating systems, versions, refer to http://support.netapp.com.
2 Ensure you are logged in using the local Administrator account, then install the SMI-S Agent.
3 Reboot the machine on which the SMI-S Agent was installed. 4 Open a command line, then run the following command to ensure the 'cimserver'
has started running. If the response indicates it is not running, ensure port 5988/5989 is not in use by another program: smis cimserver status OR Access the list of running services in the Windows Control Panel and start the Data ONTAP SMI-S Agent service manually, if needed.
5 Launch the Data ONTAP SMI-S Agent program from the Windows Start menu. 6 Open a command line, then create a username and password for the SMI-S Agent
by running the following command: cimuser -a -u <username> -w <password>
Note: The user created using this command must match an existing local Windows user account. Additionally, when creating the credential in WhatsUp Gold, enter the password created using this command rather than the password for the local Windows user account.
7 Set the cache refresh rate interval time by creating a system variable named: CACHE_REFRESH_SEC
Note: The Data ONTAP SMI-S Agent uses a default collection interval of 5 minutes. Ipswitch recommends setting the cache refresh rate interval to match the interval set for disk utilization data collection in WhatsUp Gold. Refer to Windows documentation for information on creating variables.
8 Prior to connecting the Agent to the SVM, launch a web browser and log in to OnCommand System Manager.
9 Select the Network Interfaces tab. 10 Right-click the interface assigned to the SVM. 11 Select Enable Management Access. 12 Click Save. 13 Navigate to Configuration > Security > Users for the specific SVM in the
hierarchy at left. 14 Ensure the vsadmin user is present, unlocked, and sshd and ontapi are
enabled. 15 Add the SVM to the SMI-S Agent by running the following command:
smis add <SVM IP address> vsadmin OR smis addsecure <SVM IP address> vsadmin to configure SMI-S to use HTTPS instead of HTTP.
16 Ensure the SVM was successfully added by running the following command: smis list

WhatsUp Gold User Guide
226
17 Repeat the two previous steps to add each SVM you want to monitor.
Monitoring Dell Compellent Storage Environments Please note, some or all of the following procedure steps describe actions to be taken outside of WhatsUp Gold and were deemed to be accurate at the time of this release. Ipswitch is not responsible for changes to vendor software and/or online resources that may affect the accuracy of this content.
Use the following procedure steps to configure Dell Compellent devices in order to successfully monitor them using WhatsUp Gold.
1 Log in to the Dell Storage Manager client. 2 Select the storage center you want to monitor using WhatsUp Gold. 3 Select Edit Settings. 4 Select SNMP Server. 5 Select the SNMP version you want to use for access 6 Create a new SNMP credential set. You'll create a matching SNMP credential in
WhatsUp Gold to discover and monitor the device. 7 Click Apply. 8 Log in to the Dell Storage Manager Data Collector. 9 Select Users and User Groups. 10 Create a new user account with administrator privileges. These account details will
be used when creating the SMI-S credential in WhatsUp Gold. 11 Select SMI-S. 12 Select the Enabled checkbox and make note of the port number displayed. These
account details will also be used when creating the SMI-S credential in WhatsUp Gold.
13 Click Apply.
Monitoring Dell EMC Storage Environments Please note, some or all of the following procedure steps describe actions to be taken outside of WhatsUp Gold and were deemed to be accurate at the time of this release. Ipswitch is not responsible for changes to vendor software and/or online resources that may affect the accuracy of this content.
Use the following procedure steps to configure Dell EMC devices in order to successfully monitor them using WhatsUp Gold.
1 Log in to the Dell EMC Unisphere application.
2 Click the settings icon ( ) to launch the Settings interface. 3 Select Users and Groups from the options at left, then click the plus icon ( ) to
begin creating a new user account. 4 Select Local User, then click Next. 5 Create a Username and Password credential combination for the new user, then
click Next. 6 Select the Operator role, then click Next. 7 Click Finish.

WhatsUp Gold User Guide
227
8 Log in to the WhatsUp Gold server and access the Credentials Library. 9 Create an SMI-S Credential using the new user Username and Password. 10 Set the Protocol to HTTPS and the Port to 5989. 11 Click Save.
AWS Credential The Credentials Library stores Amazon Web Services authentication data for devices in your WhatsUp Gold database to be used whenever authentication is needed to connect to and gather data from AWS-managed resources.
Configure the following fields to create an AWS credential:
Name. Enter a unique name for the credential. This name displays in the Credentials Library.
Description. Optional description. Access Key ID. Enter the access key ID to the AWS environment you want to
monitor. Secret Access Key. Enter the secret access key to the AWS environment you
want to monitor.
Please see Creating AWS Access Keys (on page 227) for additional information on obtaining access keys from the Amazon Web Services IAM Portal (https://console.aws.amazon.com/iam/home?#home).
Creating AWS Access Keys
Please note, some or all of the following procedure steps describe actions to be taken outside of WhatsUp Gold and were deemed to be accurate at the time of this release. Ipswitch is not responsible for changes to vendor software and/or online resources that may affect the accuracy of this content.
To obtain the access keys required to create an AWS credential in WhatsUp Gold: 1 Log in to the AWS portal (https://console.aws.amazon.com/iam
(https://console.aws.amazon.com/iam/home?#home)). 2 Click IAM under the Security, Identity, & Compliance section of the portal. 3 Select Users from the menu at left, then click Add user. 4 Enter a User name in the entry field provided. 5 Enable the Programmatic access option. 6 Click Next: Permissions. 7 Click Attach existing policies directly, then select
AmazonEC2ReadOnlyAccess, CloudWatchReadOnlyAccess, and IAMReadOnlyAccess from the policy list.
8 Click Create user. 9 Copy the Access key ID and Secret access key displayed. 10 Return to WhatsUp Gold to continue creating the AWS credential (on page 227).

WhatsUp Gold User Guide
228
Azure Credential Azure Credential instances store Microsoft Azure authentication fields needed to connect to, discover, and monitor Microsoft Azure cloud devices. Optionally, you can also configure this credential type with fields that enable WhatsUp Gold to gather enterprise-wide billing (usage) information.
You can apply the following credential sets to an Azure Credential instance:
Azure Tenant Credential Fields. Tenant credentials provide WhatsUp Gold discovery, monitors, tasks, and so on the ability to interact with and manage your Azure resources. For details on how to populate these fields, see the topic titled Steps needed outside of WhatsUp Gold (on page 234).
Step 1: Name the credential set Configure/edit the following fields:
Name. Enter a unique name for the credential. This name displays in the Credentials Library.
Description. Enter additional information about the credential. This information displays next to the credential in the Credentials Library.
Step 2: Azure tenant credential fields These fields are needed for discovery and monitoring of tenant-level cloud resources (compute, storage, applications, and so on).
Tip: While this credential identifies the Azure Tenant, permissions associated with the credential are limited in scope according to the resource group and permissions associated with the Client ID (API key).
For details on how to get information from Azure in order to populate these fields, see Generate an Application Access Key for WhatsUp Gold...
Before you proceed! The procedure that follows includes steps you or your Azure administrator perform outside of WhatsUp Gold. Ipswitch is not responsible for changes to documentation, online resources, and hosted software that originate from Microsoft Azure or other third-party vendors. The documentation that follows was accurate at the time of this WhatsUp Gold release.
In order for your WhatsUp Gold Azure credential to function correctly, you must:
Step 1: Create an Active Directory (AD) registered application instance from the Azure Management Portal.
Step 2: Create a secret key that is associated with the AD-application instance you created.
Step 3: Grant the AD-application instance permissions to the resource group you want to monitor.

WhatsUp Gold User Guide
229
Steps 1 & 2: Create an AD-registered Azure Application and generate an application access ("client") key This topic shows you how to generate an application access key. This is needed to grant WhatsUp Gold polling and discovery access to Azure. You will need to copy this key and add it to your WhatsUp Gold Azure Credential. The key (along with the Tenant and Client IDs) enable WhatsUp Gold to retrieve monitoring information from your Azure environment.
Important: If you are creating a new AD Application Role for WhatsUp Gold you will also need to associate this application with the Azure Resource Group that contains the resources that you want to monitor. For more information, see Step 3.
This topic also walks you through steps for finding your Azure Tenant and Client IDs.
1 Login to your Azure Account through the Microsoft Azure Management Portal (https://portal.azure.com/).
2 Create an Azure Active Directory application as detailed by Microsoft here (https://docs.microsoft.com/en-us/azure/azure-resource-manager/resource-group-create-service-principal-portal?view=azure-cli-latest#create-an-azure-active-directory-application).
Note: When you provide a Name and Application Type, choose Web App / API.
3 Get the Client ID (also known as "application ID") and authentication key as detailed here (https://docs.microsoft.com/en-us/azure/azure-resource-manager/resource-group-create-service-principal-portal?view=azure-cli-latest#get-application-id-and-authentication-key).
Important: Once you click the Save button, the key value (password) will be displayed. THIS VALUE IS AVAILABLE ONLY ONCE. Copy down this password.
4 Extend required API Access permissions within Azure Management Portal to your application role. From the Azure Management Portal, go to Azure Active Directory > App registrations and select your app from the App Registrations Grid.
Tip: Your Application ID is the Client ID needed for WhatsUp Gold.
5 Under API Access, check that the following Required Permissions are needed: Windows Azure Active Directory

WhatsUp Gold User Guide
230
Windows Azure Service Management API
First Add them, and then Grant Permissions. 6 You can get your Tenant ID as detailed here (https://docs.microsoft.com/en-
us/azure/azure-resource-manager/resource-group-create-service-principal-portal?view=azure-cli-latest#get-tenant-id).
Step 3: Grant the AD Application Role access to the appropriate Azure Resource Group(s) If you are creating a new AD Application role for WhatsUp Gold you will also need to associate this application with the Azure Resource Group(s) containing the resources that you want to monitor. After this step, you should be able to discover Azure resources from the selected Resource Group.
1 Login to your Azure Account through the Microsoft Azure Management Portal (https://portal.azure.com/).
2 Select the appropriate Resource Group from Dashboard. For example:
3 From the Resource Group you opened, select Access Control (IAM). 4 From the Access Control (IAM) page, click Add.
The Add Permissions blade opens. 5 From Add Permissions blade, choose the following and click Save. Role. Select Reader. (Access level WhatsUp Gold requires when gathering
information from your Azure environment.)
Assign access to. No change needed. (The selection should be: Azure AD user, group or application.)
Select. Type in the name of the Azure Application role to filter the list. Select your AD application from the filtered results, and click Save. For example:
6 From WhatsUp Gold, you can now scan for Azure resources. When you run a
discovery scan, include this WhatsUp Gold credential. No IP address or domain name will be needed for the scan, WhatsUp Gold discovery gathers host and resource information from the Azure Management API (using the secret key and AD application ID you created and associated with your resource groups).
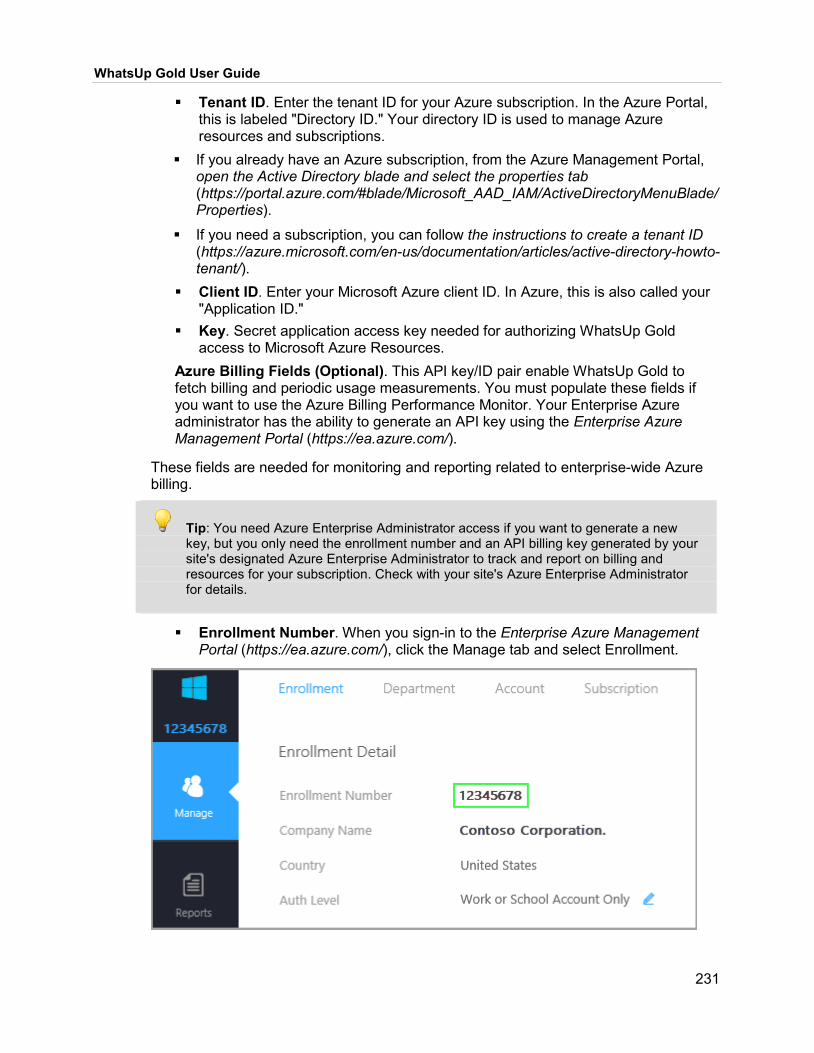
WhatsUp Gold User Guide
231
Tenant ID. Enter the tenant ID for your Azure subscription. In the Azure Portal, this is labeled "Directory ID." Your directory ID is used to manage Azure resources and subscriptions.
If you already have an Azure subscription, from the Azure Management Portal, open the Active Directory blade and select the properties tab (https://portal.azure.com/#blade/Microsoft_AAD_IAM/ActiveDirectoryMenuBlade/Properties).
If you need a subscription, you can follow the instructions to create a tenant ID (https://azure.microsoft.com/en-us/documentation/articles/active-directory-howto-tenant/).
Client ID. Enter your Microsoft Azure client ID. In Azure, this is also called your "Application ID."
Key. Secret application access key needed for authorizing WhatsUp Gold access to Microsoft Azure Resources.
Azure Billing Fields (Optional). This API key/ID pair enable WhatsUp Gold to fetch billing and periodic usage measurements. You must populate these fields if you want to use the Azure Billing Performance Monitor. Your Enterprise Azure administrator has the ability to generate an API key using the Enterprise Azure Management Portal (https://ea.azure.com/).
These fields are needed for monitoring and reporting related to enterprise-wide Azure billing.
Tip: You need Azure Enterprise Administrator access if you want to generate a new key, but you only need the enrollment number and an API billing key generated by your site's designated Azure Enterprise Administrator to track and report on billing and resources for your subscription. Check with your site's Azure Enterprise Administrator for details.
Enrollment Number. When you sign-in to the Enterprise Azure Management Portal (https://ea.azure.com/), click the Manage tab and select Enrollment.

WhatsUp Gold User Guide
232
API Access Key. A key you can generate using the Enterprise Azure Management Portal (https://ea.azure.com/). Click Reports tab and select Download Usage.
Steps needed outside of WhatsUp Gold for this credential to work
Before you proceed! The procedure that follows includes steps you or your Azure administrator perform outside of WhatsUp Gold. Ipswitch is not responsible for changes to documentation, online resources, and hosted software that originate from Microsoft Azure or other third-party vendors. The documentation that follows was accurate at the time of this WhatsUp Gold release.
In order for your WhatsUp Gold Azure credential to function correctly, you must:
Step 1: Create an Active Directory (AD) registered application instance from the Azure Management Portal.
Step 2: Create a secret key that is associated with the AD-application instance you created.
Step 3: Grant the AD-application instance permissions to the resource group you want to monitor.
Steps 1 & 2: Create an AD-registered Azure Application and generate an application access ("client") key This topic shows you how to generate an application access key. This is needed to grant WhatsUp Gold polling and discovery access to Azure. You will need to copy this key and add it to your WhatsUp Gold Azure Credential. The key (along with the Tenant and Client IDs) enable WhatsUp Gold to retrieve monitoring information from your Azure environment.
Important: If you are creating a new AD Application Role for WhatsUp Gold you will also need to associate this application with the Azure Resource Group that contains the resources that you want to monitor. For more information, see Step 3.
This topic also walks you through steps for finding your Azure Tenant and Client IDs.
1 Login to your Azure Account through the Microsoft Azure Management Portal (https://portal.azure.com/).
2 Create an Azure Active Directory application as detailed by Microsoft here (https://docs.microsoft.com/en-us/azure/azure-resource-manager/resource-group-create-service-principal-portal?view=azure-cli-latest#create-an-azure-active-directory-application).
Note: When you provide a Name and Application Type, choose Web App / API.
3 Get the Client ID (also known as "application ID") and authentication key as detailed here (https://docs.microsoft.com/en-us/azure/azure-resource-

WhatsUp Gold User Guide
233
manager/resource-group-create-service-principal-portal?view=azure-cli-latest#get-application-id-and-authentication-key).
Important: Once you click the Save button, the key value (password) will be displayed. THIS VALUE IS AVAILABLE ONLY ONCE. Copy down this password.
4 Extend required API Access permissions within Azure Management Portal to your application role. From the Azure Management Portal, go to Azure Active Directory > App registrations and select your app from the App Registrations Grid.
Tip: Your Application ID is the Client ID needed for WhatsUp Gold.
5 Under API Access, check that the following Required Permissions are needed: Windows Azure Active Directory
Windows Azure Service Management API
First Add them, and then Grant Permissions. 6 You can get your Tenant ID as detailed here (https://docs.microsoft.com/en-
us/azure/azure-resource-manager/resource-group-create-service-principal-portal?view=azure-cli-latest#get-tenant-id).
Step 3: Grant the AD Application Role access to the appropriate Azure Resource Group(s) If you are creating a new AD Application role for WhatsUp Gold you will also need to associate this application with the Azure Resource Group(s) containing the resources that you want to monitor. After this step, you should be able to discover Azure resources from the selected Resource Group.
1 Login to your Azure Account through the Microsoft Azure Management Portal (https://portal.azure.com/).
2 Select the appropriate Resource Group from Dashboard. For example:
3 From the Resource Group you opened, select Access Control (IAM). 4 From the Access Control (IAM) page, click Add.

WhatsUp Gold User Guide
234
The Add Permissions blade opens. 5 From Add Permissions blade, choose the following and click Save. Role. Select Reader. (Access level WhatsUp Gold requires when gathering
information from your Azure environment.)
Assign access to. No change needed. (The selection should be: Azure AD user, group or application.)
Select. Type in the name of the Azure Application role to filter the list. Select your AD application from the filtered results, and click Save. For example:
From WhatsUp Gold, you can now scan for Azure resources. When you run a discovery scan, include this WhatsUp Gold credential. No IP address or domain name will be needed for the scan, WhatsUp Gold discovery gathers host and resource information from the Azure Management API (using the secret key and AD application ID you created and associated with your resource groups).
Create an Application Access Key with the Azure Management Portal
Before you proceed! The procedure that follows includes steps you or your Azure administrator perform outside of WhatsUp Gold. Ipswitch is not responsible for changes to documentation, online resources, and hosted software that originate from Microsoft Azure or other third-party vendors. The documentation that follows was accurate at the time of this WhatsUp Gold release.
In order for your WhatsUp Gold Azure credential to function correctly, you must:
Step 1: Create an Active Directory (AD) registered application instance from the Azure Management Portal.
Step 2: Create a secret key that is associated with the AD-application instance you created.
Step 3: Grant the AD-application instance permissions to the resource group you want to monitor.
Steps 1 & 2: Create an AD-registered Azure Application and generate an application access ("client") key This topic shows you how to generate an application access key. This is needed to grant WhatsUp Gold polling and discovery access to Azure. You will need to copy this key and add it to your WhatsUp Gold Azure Credential. The key (along with the Tenant and Client IDs) enable WhatsUp Gold to retrieve monitoring information from your Azure environment.

WhatsUp Gold User Guide
235
Important: If you are creating a new AD Application Role for WhatsUp Gold you will also need to associate this application with the Azure Resource Group that contains the resources that you want to monitor. For more information, see Step 3.
This topic also walks you through steps for finding your Azure Tenant and Client IDs.
1 Login to your Azure Account through the Microsoft Azure Management Portal (https://portal.azure.com/).
2 Create an Azure Active Directory application as detailed by Microsoft here (https://docs.microsoft.com/en-us/azure/azure-resource-manager/resource-group-create-service-principal-portal?view=azure-cli-latest#create-an-azure-active-directory-application).
Note: When you provide a Name and Application Type, choose Web App / API.
3 Get the Client ID (also known as "application ID") and authentication key as detailed here (https://docs.microsoft.com/en-us/azure/azure-resource-manager/resource-group-create-service-principal-portal?view=azure-cli-latest#get-application-id-and-authentication-key).
Important: Once you click the Save button, the key value (password) will be displayed. THIS VALUE IS AVAILABLE ONLY ONCE. Copy down this password.
4 Extend required API Access permissions within Azure Management Portal to your application role. From the Azure Management Portal, go to Azure Active Directory > App registrations and select your app from the App Registrations Grid.
Tip: Your Application ID is the Client ID needed for WhatsUp Gold.
5 Under API Access, check that the following Required Permissions are needed: Windows Azure Active Directory
Windows Azure Service Management API
First Add them, and then Grant Permissions. 6 You can get your Tenant ID as detailed here (https://docs.microsoft.com/en-
us/azure/azure-resource-manager/resource-group-create-service-principal-portal?view=azure-cli-latest#get-tenant-id).

WhatsUp Gold User Guide
236
Step 3: Grant the AD Application Role access to the appropriate Azure Resource Group(s) If you are creating a new AD Application role for WhatsUp Gold you will also need to associate this application with the Azure Resource Group(s) containing the resources that you want to monitor. After this step, you should be able to discover Azure resources from the selected Resource Group.
1 Login to your Azure Account through the Microsoft Azure Management Portal (https://portal.azure.com/).
2 Select the appropriate Resource Group from Dashboard. For example:
3 From the Resource Group you opened, select Access Control (IAM). 4 From the Access Control (IAM) page, click Add.
The Add Permissions blade opens. 5 From Add Permissions blade, choose the following and click Save. Role. Select Reader. (Access level WhatsUp Gold requires when gathering
information from your Azure environment.)
Assign access to. No change needed. (The selection should be: Azure AD user, group or application.)
Select. Type in the name of the Azure Application role to filter the list. Select your AD application from the filtered results, and click Save. For example:
6 From WhatsUp Gold, you can now scan for Azure resources. When you run a
discovery scan, include this WhatsUp Gold credential. No IP address or domain name will be needed for the scan, WhatsUp Gold discovery gathers host and resource information from the Azure Management API (using the secret key and AD application ID you created and associated with your resource groups).
Azure Tenant Credential Fields Step 1: Name the credential set Configure/edit the following fields:
WhatsUp Gold User Guide
237
Name. Enter a unique name for the credential. This name displays in the Credentials Library.
Description. Enter additional information about the credential. This information displays next to the credential in the Credentials Library.
Step 2: Azure tenant credential fields These fields are needed for discovery and monitoring of tenant-level cloud resources (compute, storage, applications, and so on).
Tip: While this credential identifies the Azure Tenant, permissions associated with the credential are limited in scope according to the resource group and permissions associated with the Client ID (API key).
For details on how to get information from Azure in order to populate these fields, see Generate an Application Access Key for WhatsUp Gold...
Before you proceed! The procedure that follows includes steps you or your Azure administrator perform outside of WhatsUp Gold. Ipswitch is not responsible for changes to documentation, online resources, and hosted software that originate from Microsoft Azure or other third-party vendors. The documentation that follows was accurate at the time of this WhatsUp Gold release.
In order for your WhatsUp Gold Azure credential to function correctly, you must:
Step 1: Create an Active Directory (AD) registered application instance from the Azure Management Portal.
Step 2: Create a secret key that is associated with the AD-application instance you created.
Step 3: Grant the AD-application instance permissions to the resource group you want to monitor.
Steps 1 & 2: Create an AD-registered Azure Application and generate an application access ("client") key This topic shows you how to generate an application access key. This is needed to grant WhatsUp Gold polling and discovery access to Azure. You will need to copy this key and add it to your WhatsUp Gold Azure Credential. The key (along with the Tenant and Client IDs) enable WhatsUp Gold to retrieve monitoring information from your Azure environment.
Important: If you are creating a new AD Application Role for WhatsUp Gold you will also need to associate this application with the Azure Resource Group that contains the resources that you want to monitor. For more information, see Step 3.
This topic also walks you through steps for finding your Azure Tenant and Client IDs.

WhatsUp Gold User Guide
238
1 Login to your Azure Account through the Microsoft Azure Management Portal (https://portal.azure.com/).
2 Create an Azure Active Directory application as detailed by Microsoft here (https://docs.microsoft.com/en-us/azure/azure-resource-manager/resource-group-create-service-principal-portal?view=azure-cli-latest#create-an-azure-active-directory-application).
Note: When you provide a Name and Application Type, choose Web App / API.
3 Get the Client ID (also known as "application ID") and authentication key as detailed here (https://docs.microsoft.com/en-us/azure/azure-resource-manager/resource-group-create-service-principal-portal?view=azure-cli-latest#get-application-id-and-authentication-key).
Important: Once you click the Save button, the key value (password) will be displayed. THIS VALUE IS AVAILABLE ONLY ONCE. Copy down this password.
4 Extend required API Access permissions within Azure Management Portal to your application role. From the Azure Management Portal, go to Azure Active Directory > App registrations and select your app from the App Registrations Grid.
Tip: Your Application ID is the Client ID needed for WhatsUp Gold.
5 Under API Access, check that the following Required Permissions are needed: Windows Azure Active Directory
Windows Azure Service Management API
First Add them, and then Grant Permissions. 6 You can get your Tenant ID as detailed here (https://docs.microsoft.com/en-
us/azure/azure-resource-manager/resource-group-create-service-principal-portal?view=azure-cli-latest#get-tenant-id).
Step 3: Grant the AD Application Role access to the appropriate Azure Resource Group(s) If you are creating a new AD Application role for WhatsUp Gold you will also need to associate this application with the Azure Resource Group(s) containing the resources that you want to monitor. After this step, you should be able to discover Azure resources from the selected Resource Group.

WhatsUp Gold User Guide
239
1 Login to your Azure Account through the Microsoft Azure Management Portal (https://portal.azure.com/).
2 Select the appropriate Resource Group from Dashboard. For example:
3 From the Resource Group you opened, select Access Control (IAM). 4 From the Access Control (IAM) page, click Add.
The Add Permissions blade opens. 5 From Add Permissions blade, choose the following and click Save. Role. Select Reader. (Access level WhatsUp Gold requires when gathering
information from your Azure environment.)
Assign access to. No change needed. (The selection should be: Azure AD user, group or application.)
Select. Type in the name of the Azure Application role to filter the list. Select your AD application from the filtered results, and click Save. For example:
6 From WhatsUp Gold, you can now scan for Azure resources. When you run a
discovery scan, include this WhatsUp Gold credential. No IP address or domain name will be needed for the scan, WhatsUp Gold discovery gathers host and resource information from the Azure Management API (using the secret key and AD application ID you created and associated with your resource groups). Tenant ID. Enter the tenant ID for your Azure subscription. In the Azure Portal,
this is labeled "Directory ID." Your directory ID is used to manage Azure resources and subscriptions.
If you already have an Azure subscription, from the Azure Management Portal, open the Active Directory blade and select the properties tab (https://portal.azure.com/#blade/Microsoft_AAD_IAM/ActiveDirectoryMenuBlade/Properties).
If you need a subscription, you can follow the instructions to create a tenant ID (https://azure.microsoft.com/en-us/documentation/articles/active-directory-howto-tenant/).
Client ID. Enter your Microsoft Azure client ID. In Azure, this is also called your "Application ID."

WhatsUp Gold User Guide
240
Key. Secret application access key needed for authorizing WhatsUp Gold access to Microsoft Azure Resources.
Meraki Cloud Credential Apply Meraki Cloud credentials to gather data from Meraki Cloud devices. Configure the following fields to create a Meraki Cloud credential:
Name. Enter a unique name for the credential. This name displays in the Credentials Library.
Description. (Optional) Enter additional information about the credential. This information displays next to the credential in the Credentials Library.
API Key. Generate and retrieve the API Key from your Cisco Meraki Dashboard (on page 240), then enter it here.
Organization. Select the applicable organization name from the list. The organization options displayed are dependent upon the API Key entered prior. Please note, if the API Key entered is not valid, the organization list will not be populated.
Generating a Meraki API Key
Please note, some or all of the following procedure steps describe actions to be taken outside of WhatsUp Gold and were deemed to be accurate at the time of this release. Ipswitch is not responsible for changes to vendor software and/or online resources that may affect the accuracy of this content.
To obtain the API key required to create a Meraki credential in WhatsUp Gold: 1 Log in to the Meraki dashboard (http://dashboard.meraki.com
(http://dashboard.meraki.com)). 2 Click your username in the upper-right corner of the dashboard, then select My
profile from the menu that appears. 3 Click Generate API key under the API access section of the dashboard. 4 Copy the API key displayed. 5 Return to WhatsUp Gold to continue creating the Meraki Cloud credential (on page
240).
Please note, you can click Revoke API key if your Meraki Cloud credential is no longer needed in WhatsUp Gold or Regenerate API key if you need a new one.
Helpful Hints for credentials When choosing credentials, consider the following:
Quick win: for quick and wide discovery coverage, try SNMPv2 credentials with a public community string first.

WhatsUp Gold User Guide
241
Tip: You can find community strings in use at your site by looking in network device configurations or consulting your site's documentation.
For Windows host devices, add Windows credentials. (Additional steps might be needed if you need these credentials in order to gather information managed by WMI https://community.ipswitch.com/s/article/Requirements-for-Remote-WMI-Access.)
Some Linux/UNIX and Windows hosts might need an SNMP agent (service) running to fetch SNMP statistic values for initial discovery.
From most Windows versions, you can add this from the Windows Turn Windows Features On or Off dialog.
From Linux, install the SNMP package from your respective package manager (yum, apt-get, zypper).
Add SSH credentials for Linux/UNIX host devices. Apply VMware credentials to vCenter hosts. When reapplying existing Hyper-V host credentials, an additional step is needed
to distribute the new credentials to the VMs. For details, see Windows credential for Hyper-V.
Creating credentials Create credential records in the Credentials Library (SETTINGS menu > Library > Credentials) based on WhatsUp Gold credential types and apply them to devices you select on the My Network map or its associated device grid.
To access the Credentials Library, either from the MY NETWORK MAP or the SETTINGS menu:
From the SETTINGS menu. Library > Credentials.
From the MY NETWORK MAP. Click to open the Credentials palette, then click the library button .
Assigning credentials Typically, you apply credentials through at either or both of the following intervals:
At network discovery time (on page 31). Assign credentials to enable default monitoring capabilities.
From the MY NETWORK map. Assign to satisfy specific monitor requirements.
To assign credentials to a device:
1 Select one or more devices on the My Network map or the collapsible device grid.

WhatsUp Gold User Guide
242
2 Click to access the Credentials Library.
3 Select a credential from the library.
4 Click the Apply to selected devices button.
To add a new credential record to the Credential Library:
Click 'add' ( ) to create a new credential based on an existing credential type.
Device groups Using device groups in WhatsUp Gold helps you to:
Organize devices into easy to browse and selectable groups. Administrative groups for reporting purposes. Group devices by partner/client/department. Quickly find and diagnose problems within your network environment. Much more...
Note: Creating/modifying device groups requires specific user permissions. For more information, see the topic titled Administering Users and User Groups (on page 406).
In addition to creating a number of dynamic groups automatically, the application also allows you to create as many device groups as needed to organize your network in a way that is meaningful to you and to fit your specific monitoring needs.
All devices discovered on your network are placed into a single dynamic group named 'All devices' by default. Additional groups are created automatically when SQL queries search for devices based on user-specified criteria during discovery. These are referred to as dynamic groups because group membership can change automatically based on the data WhatsUp Gold receives from the devices therein.
There are two types of dynamic groups that exist in WhatsUp Gold: Layer 2 dynamic
groups and WhatsUp Gold dynamic groups . These advanced dynamic groups do not have customizable maps available, but allow you to specify rules for dynamic membership of devices in the group.
For Layer 2 dynamic groups, you may assign user rights and specify membership based on device properties such as Role, Name or IP, and choose to include connected devices. For WhatsUp Gold dynamic groups, user access is not configurable and membership is determined with a rule builder which can access status, properties, and configurations such as assigned credential types.
WhatsUp Gold also creates a static group each time you perform a discovery scan which contains every device found during that scan.

WhatsUp Gold User Guide
243
You can manage device group properties (MY NETWORK + Groups ) for a selected device or selected group, by using the device actions menu ( ) from the Group Picker ( ). Only users that have permissions to access the selected device group option (administrator and others with specific device Group Write permissions) can manage the selected device group. For more information, see About user rights.
To edit a device group: 1 Select any device and then click the Groups tab (MY NETWORK + Groups ).
A group for the selected device is highlighted in the device picker.
2 Click the 'actions' menu and choose an operation (Edit Group, Copy Group, ...)
Note: You can also modify device groups from the Device and Groups page Map tab by right-clicking, then clicking Edit.
Understanding device group properties Device Group Name. Enter a new device group name.
Description. Enter a short description of the device group.
Device Group access rights. Select the user name for which you want to change access rights.
Device Group Access Rights for. Select the access rights you want to apply to the selected group. For more information, see Understanding device group access rights.
Copy changes to all sub Device Groups recursively for. Click the check box to propagate the selected device group access rights' to all sub device groups.
Editing Device Group Properties You can manage device group properties (MY NETWORK + Groups ) for a selected device or selected group, by using the device actions menu ( ) from the Group Picker ( ). Only users that have permissions to access the selected device group option (administrator and others with specific device Group Write permissions) can manage the selected device group. For more information, see About user rights.
To edit a device group: 1 Select any device and then click the Groups tab (MY NETWORK + Groups ).
A group for the selected device is highlighted in the device picker.
2 Click the 'actions' menu and choose an operation (Edit Group, Copy Group, ...)

WhatsUp Gold User Guide
244
Note: You can also modify device groups from the Device and Groups page Map tab by right-clicking, then clicking Edit.
Understanding device group properties Device Group Name. Enter a new device group name.
Description. Enter a short description of the device group.
Device Group access rights. Select the user name for which you want to change access rights.
Device Group Access Rights for. Select the access rights you want to apply to the selected group. For more information, see Understanding device group access rights.
Copy changes to all sub Device Groups recursively for. Click the check box to propagate the selected device group access rights' to all sub device groups.
Dynamic Groups After you create a new group or select an existing group (on page 243), you can add/remove devices to the group or apply dynamic device filters.
Note: Dynamic groups do not follow group access rights. Anyone with the ability to view a device group can view any dynamic groups contained in that device group as well. However, only devices the user has the ability to view appear in the group.
To configure a new dynamic group using the Dynamic Group Builder: 1 Enter or select the appropriate information: Group Name. Enter a name for the Dynamic Group as it will appear in the
WhatsUp Gold Device List.
Description. (Optional) Enter additional information for the new Dynamic Group. This description is visible to all users who can open the dynamic group.
Filter. Select All devices to show all devices that match the criteria of the dynamic group, select All devices in the parent group to show all devices that match the criteria of the dynamic group and are located in the group in which the dynamic group is located, or select All devices in the parent group and its children groups to show all devices that match the criteria of the dynamic group and are located in the group in which the dynamic group is located or any of that group's children groups.
2 Create and edit rules to form an SQL filter for the Dynamic Group. Click Add to begin writing the rules for your SQL filter. The Dynamic Group Rule
Editor appears.
Enter the appropriate information in the Dynamic Group Rule Editor. As you create rules, they are added to the Dynamic Group Builder dialog where you can add more rules, edit, or delete existing rules by clicking Add, Edit, or Delete.

WhatsUp Gold User Guide
245
Note: Parentheses (single, double, triple, and quadruple) are available for use in your filter code - add them by selecting them from the lists before and after your rules.
Tip: You can move existing rules up or down within your filter code by selecting a rule and then clicking on Up or Down.
Validating your filter code As you configure your rules, the SQL filter is displayed at the bottom of the Builder dialog. When you are satisfied with the filter code that is displayed, click Validate to test the filter code syntax. If the test returns no errors, click OK to save the configured SQL filter and to add the new Dynamic Group to your Device List.
If the code returns errors, either make the needed changes at this time, then click OK. Additionally, you have the option to save the filter code so that you may edit it at a later time. You can then select the Dynamic Group from the Device List and right-click, then select Properties to edit the group filter code.
Converting your filter code You can convert a Dynamic Group created with the Dynamic Group Builder to the SQL dialog by clicking Convert. It is important to note that once you convert the Dynamic Group to the SQL dialog, you are not able to edit the group in the Dynamic Group Builder again—you are only able to make changes to the group from the SQL dialog. If you aren't an advanced SQL user, we recommend that you make a copy of the Dynamic Group so that you can keep a copy available for edit in the Dynamic Group Builder.
To create a new Dynamic Group using the Advanced SQL dialog: 1 Enter the appropriate information: Group name. Enter a name for the dynamic group. This name appears on the
device list.
Description. (Optional) Enter additional information that describes the dynamic group.
SQL Filter. Enter the SQL query statement that retrieves the list you want from the database. For the dynamic group to appear in your device list, the first line must be 'SELECT DISTINCT nDeviceID'.
2 Click OK to save and add the Dynamic Group to your Device List.
Validating your filter code When you are satisfied with the filter code that is displayed, click Validate to test the filter. If it runs as you expect, click OK to save the configured SQL filter and to add the new Dynamic Group to your Device List. If the code does not run as you expect, but you would still like to save the filter code so that you may edit it at a later time, click OK. You can then select the Dynamic Group from the Device List and right-click, then select Properties to edit the group filter code.

WhatsUp Gold User Guide
246
If you do not know how to formulate SQL queries, you can use the WhatsUp Gold Dynamic Group Builder, or cut and paste filter entries from existing dynamic groups, then edit them to read data from other tables.
WhatsUp Gold is preconfigured with dynamic group examples, which you can see in the Devices view, under Device Groups. In addition to the preconfigured dynamic groups, we have provided several sample filters for you to create some very interesting dynamic groups.
Note: You can learn more about the database structure by downloading the database schema file on the WhatsUp Gold support page (https://www.ipswitch.com/support/).

247
CHAPTER 6
Network Environment Monitoring In This Chapter Viewing Devices on the Map ................................................. 247
Monitoring Wireless .............................................................. 266
Monitoring Virtual Machines and Infrastructure ..................... 267
Monitoring Cloud-Managed Devices ..................................... 272
Monitoring VoIP IP SLA ........................................................ 274
This section outlines tasks you perform for monitoring specific environments:
Application Management (on page 278). Monitor applications and their dependencies using built in or custom application profiles.
Wireless (on page 266). Access points, WLAN controllers, and clients.
Virtual (on page 267). Virtual hosts, virtual machines, and associated infrastructure.
Cloud (on page 272). Integrate WhatsUp Gold with AWS, Azure, and Meraki management services.
VoIP (on page 274). (Voice over IP).
Network Traffic Analysis (on page 346). Apply 'whole-network' passive packet collection and analysis. (Discovery not required.)
Configuration Management (on page 307). Apply version management, controls, and auditing to your infrastructure and device configurations.
Tip: You can use the Monitors tab in the Role Sub Role Wizard to pre-designate or manage at scale which network interfaces are assigned active monitors during Discovery.
Viewing Devices on the Map Icons displayed on both the Discovered Network (on page 19) and My Network (on page 20) map views represent devices either seen or monitored by WhatsUp Gold, respectively. Each device icon reveals device information and a visual indicator of its current status. The image within the icon indicates the device type or primary role.

WhatsUp Gold User Guide
248
Tip: Device icons can be customized using the Device Role Editor (on page 62).
A green ring indicates the device is Up. It is operating as expected per the specific monitors assigned and enabled.
A green ring annotated with a red dot indicates the device is Up. However, one or more assigned active monitors reported as Down the last time the device was polled.
A green ring annotated with a black triangle indicates the device is Up. However, one or more assigned passive monitors reported as Down the last time the device was polled.
A red ring indicates the device is Down. One or more assigned monitors has detected a problem per the configured threshold(s).
A yellow ring indicates the device is currently in Maintenance Mode. The device will not be polled, actions will not be triggered, and activity will not be logged until it is taken out of maintenance mode.
A light gray ring indicates the status of the device can not be determined because WhatsUp Gold was unable to successfully communicate with and/or gather useful data from the device when polled.
A light gray ring annotated with a red dot indicates the status of the device can not be determined because WhatsUp Gold was unable to gather useful data from the device when polled. However, WhatsUp Gold was able to determine one or more assigned active monitors reported as Down the last time the device was polled.
A light gray ring annotated with a black triangle indicates the status of the device can not be determined because WhatsUp Gold was unable to gather useful data from the device when polled. However, WhatsUp Gold was able to determine one or more assigned passive monitors reported as Down the last time the device was polled.
A dark gray diamond indicates the device has been discovered by WhatsUp Gold but is not yet being monitored. Please note, this iconography is only used on the Discovered Network (on page 19) map.

WhatsUp Gold User Guide
249
Please note, devices in either an Up or Unknown state which have both active and passive monitors reported as Down are annotated with both a red dot and a black triangle.
Just as icons shown on the map reflect assigned role, device status, and individual monitor status, the links connecting those icons also reflect useful network monitoring information.
A solid line segment between icons indicates network connectivity between devices.
A dotted line segment between icons indicates wireless connectivity between devices.
A dashed line segment between icons indicates virtual connectivity between devices.
A curved and dashed line segment with an arrow between icons indicates the status of one device is dependent upon the status of the other.
A line segment with status color applied indicates interface utilization data is available for this connection.
Please note, depending on data received and specific thresholds configured, device connectors overlaid with interface utilization status may be divided into two segments which become visually distinct when hovering your mouse over them. Each segment of the connector is representative of interface utilization status for the device it touches. Additionally, clicking on a connector launches the device information with interface utilization data in focus.
Zooming in enhances the detail available by displaying the name or IP address beneath its respective device. Conversely, zooming out hides device images and changes status rings to solid icons which simplifies the overall map view while maintaining the same at-a-glance status. Hovering over any device icon obscures any devices displayed on the map which aren't direct dependencies of that device.
Click to apply overlays to enhance what devices appear on the map including connectivity links and link status, dependency detail, wireless, virtualization and interface utilization. Please see Viewing

WhatsUp Gold User Guide
250
Wireless Information on the Map (on page 262) for additional information about the Wireless overlay.
Click to select specific device groups to display on the map. Default groups, dynamic groups, user-created groups, and groups based on discovery scan history are shown.
Click to apply filters to limit what devices appear on the map. Available filters include location, name, IP address, assigned credential types, discovery status, monitored status, operating system, assigned roles, and/or scan time depending on the map being viewed.
Click to view a list of devices currently hidden from the map. Please note, this control is only used on the Discovered Network (on page 19) map.
Important: Map filters are not all inclusive like Search results. Any filters applied to either map view are done so collectively. For example, if you applied two filters to display only devices located in Atlanta that are up, the map would obscure icons representing devices which do not meet the criteria. However, if you were apply a third filter to display devices that are down or devices in Boston, all devices would be obscured since a single device can neither be up and down, nor can it be located in Atlanta and Boston simultaneously.
When Include devices in sub-groups is disabled and the map displays device groups as folders, double-clicking any folder icon updates the map to display the devices in that group.
Viewing Information Cards Select any device icon on either map to display its Device Information card.
When viewing the My Network (on page 20) map, the card displays extensive information about the device's identity, status, role, attributes, group membership, and assigned monitors without obscuring the map view. It also provides controls for accessing the Device Properties (on page 86) ( ) and Device Status (on page 105) ( ) interfaces as well as performing basic actions related to device management (on page 179) ( ). When multiple devices on this map view are selected, this interface changes to display a dropdown menu of group management actions (on page 179). Choosing an action from this menu performs that action to each selected device.
Please note the following regarding performance monitor utilization values reported in the information card:
CPU. This value represents the average utilization for all CPUs on the selected device.
Disk. This value represents the highest utilization value reported by a single disk of every disk on the selected device.
Memory. This value represents the highest memory utilization value reported by a single memory type for the selected device.

WhatsUp Gold User Guide
251
Interface. This value represents the highest Tx or Rx utilization value reported by a single interface of every interface configured on the selected device.

WhatsUp Gold User Guide
252
Discovery and merge information When viewing the Discovered Network map (on page 19), the card displays information about the device, though the level of detail can vary depending on if that device is currently being monitored by WhatsUp Gold and how much data was gathered during the discovery scan. It also provides controls for hiding ( ), deleting ( ), or refreshing ( ) the selected device and contains a dedicated button to Start or Update Monitoring. Click Start Monitoring to add the selected device to the My Network (on page 20) map. When multiple devices on this map view are selected, you can hide, delete, rescan, and/or Start/Update Monitoring your selection simultaneously.
Tip: See the topic titled Device Merge Decision Information (on page 95) to understand merge attributes and history.
Applying Thresholds, Alerts, Notification Schedules, and Action Policies
WhatsUp Gold provides a suite of libraries you can leverage to implement site availability, performance, and security policies into practice. These provide the building blocks for implementing availability, performance, and security model on top of your WhatsUp Gold monitoring.
Libraries you can use to implement site policies (on page 213) include:
Thresholds Library (on page 258) (SETTINGS > Actions and Alerts > Alert Center Libraries [Thresholds])
Create and configure customized threshold definitions and apply them to monitored devices (on page 52), services, applications, and processes within your managed network. Re-use, clone, and customize as needed. Actions Library (SETTINGS > Actions and Alerts > Actions & Policies
[Action Library])

WhatsUp Gold User Guide
253
Create and configure triggered actions (notifications, remote/local script execution, write to log) to initiate a chain of notifications to responsible individuals, apply corrective actions, mitigate and recover from performance, security, and application incidents, and uphold terms of service level agreements. Notifications Library (on page 260) (SETTINGS > Actions and Alerts > Alert
Center Libraries [Notifications]) Create and configure custom e-mail, SMS, and desktop alert notifications. Used for both scheduling and distribution of incident notifications together with the Blackout Policy Library (on page 261). Notifications Policy Library (on page 260). (SETTINGS > Actions and Alerts >
Alert Center Libraries [Notifications Policies Library]) Define hierarchy and rules of escalation for notifying responsible individuals of the threshold incident. Instituting deterministic notifications polices at your site is a cornerstone requirement of information assurance and networking security certifications (HIPAA, SOX, PCI, CSC) and an 'all-around' best practice, in general. Action Policies (on page 213) (SETTINGS menu > Actions & Alerts > Actions
& Policies [Action Policies]) Define site policy using by configuring rules that trigger mitigating, corrective, and recovery actions (typically groups of actions) to occur in response to change of state events on your managed network hosts, applications, and infrastructure.
Note: You can also create and apply powerful policies which enforce configuration record versioning and device configuration alignment using WhatsUp Gold Configuration Management policies (on page 321).
Recurring Action Library Recurring actions (SETTINGS menu > Scheduling Activities > Recurring Actions) enable users to fire Actions stored in the Actions Library (on page 252) based on a regular schedule, independent of the status of devices. Recurring actions can perform tasks such as sending checkpoint messages through email or SMS text letting users know a system is up and running.
Note: Recurring actions can be configured to adhere to a blackout schedules specified by Blackout Policies.
Managing Recurring Action Library:
From the Notification Policies Library (on page 260) in the WhatsUp Gold Alert Center Libraries (on page 258) view, you can perform the following Recurring Action Library operations.
. Create new Recurring Action Library.
From the WhatsUp Gold navigation menu: 1 Select Settings > Alerts and Actions > Alert Center.

WhatsUp Gold User Guide
254
Alert Center Libraries view displays. 2 Click Blackout Policies panel (to expand it if collapsed).
Blackout Policies Library displays.
3 Click the "add" button ( ). The New/Edit Blackout Policy dialog appears.
4 Enter the appropriate information: Name. Enter a unique name for the blackout policy.
Description. Enter additional information about the blackout policy. 5 Click and drag to select the blackout periods you want to create.
6 Click Save or Save and Close. The blackout policy is added to the Blackout
Policies list.
. Adjust, tune, and configure existing Recurring Action Library.
From the WhatsUp Gold navigation menu: 1 Select Settings > Alerts and Actions > Alert Center.

WhatsUp Gold User Guide
255
Alert Center Libraries view displays. 2 Click Blackout Policies panel (to expand it if collapsed).
Blackout Policies Library displays.
3 Click the "add" button ( ). The New/Edit Blackout Policy dialog appears.
4 Enter the appropriate information: Name. Enter a unique name for the blackout policy.
Description. Enter additional information about the blackout policy. 5 Click and drag to select the blackout periods you want to create.
6 Click Save or Save and Close. The blackout policy is added to the Blackout
Policies list.

WhatsUp Gold User Guide
256
. Create policy cloned from the configuration of existing Recurring Action Library.
Clone a notification policy based on an existing policy: 1 Click on a Recurring Action Library you want to copy, from the Recurring Action
Library panel.
2 Click the Copy button, and click OK to create a new Recurring Action Library. 3 Save or customize your new Recurring Action Library, either: Type in a new value for Name field (or keep the default) and click OK to save to
the Recurring Action Library Library.
Follow the Edit Recurring Action Library instructions.
. Remove Recurring Action Library from library.
Delete a Recurring Action Library: 1 Click an existing Recurring Action Library you want to delete from the Recurring
Action Library Library panel.
2 Click the Delete button, and then click Yes to confirm the deletion. The Recurring Action Library configuration is deleted.
Adding and editing a Recurring Action To add or edit a recurring action:
Go to the Recurring Actions Library (SETTINGS menu > Scheduling Activities > Recurring Actions).
Recurring Actions Library displays.
1 Click 'add' ( ) to create a new recurring action or select and action you want to modify, then click 'edit' ( ).

WhatsUp Gold User Guide
257
Add Recurring Action - General dialog displays.
2 Complete the following, then click on Next. Recurring action name. Name displayed in Recurring Actions Library.
Select an Action. Action type this action is based on. (Web Alarm actions cannot be used as recurring actions.)
Add Recurring Action - Schedule dialog displays. 3 Complete the following boxes: Enable Schedule. Select this option to activate the recurring action schedule;
clear the option to disable the recurring report schedule.
Blackout Schedule. Select to access the Weekly Blackout Schedule dialog.
Monthly. Select the time, day, and month or months you want the action to fire. The action only fires during the month selected from this list. Quarterly actions can be created by selecting the last day of each quarter. If a day is entered that does not exist in a selected month (September 31, February 30, etc.) then the action is fired on the last day of that month.
Weekly. Select the day and time each week you want the action to fire. 4 Click Finish to save your changes.

258
CHAPTER 7 Creating Alerts
In This Chapter Thresholds ............................................................................ 258
Notifications Library .............................................................. 260
Notification Policies ............................................................... 260
Notification Blackout Policies ................................................ 261
WhatsUp Gold Alert Center enables you to detect and follow critical messages, failures, and other key events occurring within your network and host infrastructure. Once detected, notifications and escalation policies enable you to raise awareness, whether this includes the WhatsUp Gold user interface displaying an alert dialog, a simple email and SMS notification, or a policy-based chain of notification to site administrators, support specialists, and responsible individuals.
Alert Center provides the following:
Thresholds Library (on page 258). Configure threshold value, magnitude (greater than or less than), and frequency.
Notifications Library (on page 260). Configure types of alert notifications (SMS, email).
Notifications Policies (on page 260). Sequence, chain, and escalate alert notifications to satisfy site policy and SLA.
Blackout Policies (on page 261). Add 'off notification' periods, personnel, and notification method exceptions.
Thresholds Configure threshold value, direction (greater than or less than), and frequency. Thresholds is part of the Alert Center Libraries (on page 258).
Available Threshold Types Thresholds Library in Alert Center provides the following threshold types.
Performance. System performance and resource related events, I/O events, ping.
CPU (on page 863)
Custom (on page 865)
Disk (on page 867)
Interface (on page 868)
Interface Errors and Discards (on page 870)

WhatsUp Gold User Guide
259
Memory (on page 872)
Ping Availability (on page 874)
Ping Response Time (on page 876)
Passive. SNMP traps, detection and frequency of Syslog events, detection and frequency of Windows Events.
SNMP Trap (on page 879)
Syslog (on page 881)
Windows Event Log (on page 877)
Network Traffic Analysis. Connection events and metrics, interface traffic, conversation events and metrics, custom thresholds.
Conversation Partners (on page 894)
Custom Threshold (on page 896)
Failed Connections (on page 898)
Interface Traffic (on page 900)
Top Sender/Receiver (on page 902)
System. System health and failover tracking, Virtual Machine (VM) tracking, system configuration auditing.
Blackout Summary (on page 887)
VMware (on page 885)
Hyper-V (on page 883)
Failover (on page 889)
WhatsUpHealth (on page 890)
Wireless. CPU and memory metrics of access points, rogue SSIDs, rogue clients.
Wireless Access Point Signal Strength (RSSI (on page 922))
Wireless Banned Client MAC Address (on page 908)
Wireless Access Point CPU Utilization (on page 905)
Wireless Clients Bandwidth Threshold (on page 924)
Wireless Device Over Subscription (on page 910)
Wireless Excessive Rogues (on page 911)
Wireless Access Point Memory Utilization (on page 906)
Wireless Rogue Access Point MAC Address (on page 914)
Wireless Rogue Hidden SSID (on page 916)
Wireless Rogue Specific SSID (on page 919)
Wireless Rogue Unknown SSID (on page 920)

WhatsUp Gold User Guide
260
Tip: WhatsUp Gold provides interactive dashboards and reports for situational management of thresholding incidents including the Device Thresholds (on page 439) report and Threshold Summary. For more information, see Logging, Reporting, and Dashboarding (on page 410).
Open Thresholds from the WhatsUp Gold navigation menu 1 Select SETTINGS > Actions and Alerts > Alert Center Libraries.
Alert Center Libraries view displays. 2 Click the Thresholds Library panel, and either:
Click the "add" ( ) symbol to Add a new threshold configuration based on available threshold types.
Select an existing threshold configuration and click either Edit ( ), Delete (
), or Copy ( ).
Please note, when configuring Alert Center thresholds, ensure the Automatically resolve items no longer out of threshold is enabled to avoid receiving continuous notifications from WhatsUp Gold applicable to the specific exceeded threshold.
Notifications Library Configure types of alert notifications (for example, SMS or email).
Tip: You can embed Percent Variable (on page 851) syntax in notification message fields.
Available Notification Types SMS Action (on page 926) SMS Direct (on page 929) Email (on page 932)
Open Notifications Library from the WhatsUp Gold navigation menu: 1 Select SETTINGS > Actions and Alerts > Alert Center Libraries.
Alert Center Libraries (on page 258) view displays. 2 Click the Notifications Library panel, and either:
Click the "add" ( ) symbol to Add a new notification configuration based on available notification types.
Select an existing notification configuration and click either Edit ( ), Delete
( ), or Copy ( ).
Notification Policies Create an alerting and notification schedule that aligns threshold events (on page 258) and notifications (on page 260) with levels of responsibility and site escalation policies.

WhatsUp Gold User Guide
261
Apply and manage Notification Policies (on page 934). Visualize escalation schedule (on page 937).
Open Notification Policies Library from the WhatsUp Gold navigation menu: 1 Select SETTINGS > Actions and Alerts > Alert Center Libraries.
Alert Center Libraries (on page 258) view displays. 2 Click the Notification Policies panel, and either:
Click "add" ( ) to create a new notification configuration based on available notification types.
Select an existing notification configuration and click either Edit ( ), Delete
( ), or Copy ( ).
Notification Blackout Policies Partition notification schedules by selecting intervals of 'off notification' for personnel, notification methods, and times.
Apply and manage Notification Blackout Policies (on page 938). Example: On call rotation (on page 941).
Open Notification Blackout Policies Library from the WhatsUp Gold navigation menu: 1 Select SETTINGS > Actions and Alerts > Alert Center Libraries.
Alert Center Libraries (on page 258) view displays. 2 Click the Notification Blackout Policies panel, and either:
Click the "add" ( ) symbol to Add a new Blackout Policy configuration based on an existing one.
Select an existing Blackout Policy configuration and click either Edit ( ) or Delete ( ).

WhatsUp Gold User Guide
262
Viewing Wireless Information on the Map When the Wireless overlay is enabled, additional icons representing individual SSIDs associated with monitored access points and wireless controllers appear on the map.

WhatsUp Gold User Guide
263
Within each SSID icon, you can see a number indicating how many wireless clients are connected using that SSID. Click any SSID icon to launch an information card specific to the SSID. This is similar to a device information card (on page 250) in behavior and appearance, however it reports wireless-specific information about the SSID and its connections including the access point broadcasting it, the number of clients currently connected using it, and a list of the top ten connected clients along with their MAC addresses sorted by utilization. You can click Total clients: X to launch the Wireless Clients report or click an individual client name to launch the Wireless Clients: Specific Client (on page 750) report for that wireless device.
Viewing Virtual Information on the Map
When the Virtual overlay is enabled, additional graphics representing virtual infrastructure node types appear.
First, the following full size map icons are used:
VMware vCenter
VMware Data Center

WhatsUp Gold User Guide
264
VMware Cluster
Next the following annotations are appended to existing device icons:
VMware Host
VMware Virtual Machine
Hyper-V Host
Hyper-V Host Virtual Machine
Viewing Application Information on the Map When the Application Monitoring overlay is enabled, annotations representing rolled-up application monitoring status are applied to applicable device icons on the map.
Up
Down

WhatsUp Gold User Guide
265
Warning
Maintenance
Unknown
Manually Connecting Devices on the Map While connectivity links between network devices are generated automatically by WhatsUp Gold using information gathered during discovery, you can also create custom links between devices on the map view manually. Additionally, custom links can also be created between an individual device and a device group or between two device groups.
To create a custom connectivity link: 1 Select two nodes on the map. 2 Click Add a custom link in the information card to create the link line. 3 Enter link labels in the fields that appear in the information card.
Please note, custom links are actual connections, not simply map annotations (on page 22), and are considered when determining dependencies in a root device configuration. The link line remains connected when either device is moved around the map view. Additionally, custom link lines will disappear if the applicable overlay is disabled.
In addition to creating connectivity links between devices, you also have the ability to configure those links to reflect the current status of the device to which they are connected using the active monitors already assigned to the device.
To assign a monitor to a custom connectivity link: 1 Select two devices connected by a custom link. 2 On the device information card that appears, click edit ( ) beneath the connected
device to which you want to apply a monitor. 3 Select a monitor from the active monitor inventory for the device. 4 Repeat steps 2 and 3 to apply an active monitor to the other connected device.
Please note, if only one connected device has a monitor applied, the entire link reflects the status of that monitor.
5 Click OK.
WhatsUp Gold User Guide
266
To remove a monitor from a custom connectivity link, select two devices connected by a custom link, then click remove ( ) on the device information card. In the event a custom connectivity link needs to be deleted from the map entirely, simply select the connected devices, then click Remove link.
Monitoring Wireless WhatsUp Gold allows you to monitor the performance of lightweight access points, wireless LAN controllers, and wireless autonomous access points as well as manage wireless rogues. WhatsUp Gold defines "rogues" as devices detected due to proximity to an access point but unknown to the network, which should be investigated to determine potential risk.
You can also monitor and report on Cisco Meraki cloud-managed WLAN infrastructure.
Discover It is best practice to discover using credentials for WLAN controllers. WhatsUp Gold network discovery uses these credentials to gather detailed information about WLAN access points.
You can create a regular scanning interval to detect and update active end-stations connected to your access points using the Schedule tab in the IP Address Scan wizard.
Note: In your discovery scan you must elect to Expand Scan to Include Wireless Environments (on page 48). (This will enable discovery to include WLAN access points distributed over different subnets).
Your ability to manage wireless infrastructure devices is determined by your user rights (on page 406). To view data on this dashboard, you must have the Access Wireless user right enabled. For the ability to actively manage wireless infrastructure devices as well as include, exclude, or manage rogues, the Configure Wireless option must be selected as well.
Map/organize/interact/monitor (My Network Map) Wireless infrastructure (WLAN controllers and access points) and clients (devices running as wireless "end stations") can be filtered from other devices on the My Network Map (on page 20) using the Wireless Overlay ( ).
Show Wireless Devices. Click on the Wireless Overlay (on page 20) . Create Custom Views. Create custom layouts (on page 22) or report views
customized for your environment.
Add and Enable Individual Monitors. Select a device, click Device Properties , then assign and enable individual monitors (on page 106).

WhatsUp Gold User Guide
267
Apply Controls. Add Thresholds, Notifications, Actions and Policies (on page 252).
Analyze (dashboard, log, and report) Analyze log, reporting, and dashboard data to assess performance, quality of service, and impact.
Wireless Dashboard (on page 425). Select a Hyper-V host or VMware host and see metrics and system info for associated VMs.
Wireless Clients Dashboard (on page 747). Reveals clients connected to your wireless network.
Rogues Dashboard (on page 427). Lists unknown wireless devices and the MAC addresses they use.
Home Dashboard (on page 415). Add a custom view and configure and drag in Wireless Monitoring performance and inventory reports from the reports palette.
Wireless Log (on page 731). Wireless service events.
Capture/share/export Wireless monitoring data can be visualized, shared, and reused using Export ( ) and Dashboard Options ( ).
PDF. Save grid and chart views as PDF. Share. Share Monitoring Wireless reports (on page 952) with other users in a
single or combined view. Export. Export Monitoring Wireless data (on page 951) as PDF, XML, or Excel
and leverage outside of WhatsUp Gold Email. Email reports, charts, and log data (on page 950). (Create and then
edit/manage from Scheduled Reports (on page 942).)
Monitoring Virtual Machines and Infrastructure Virtual Monitoring provides the monitoring, thresholding, and reporting infrastructure to monitor VMware and Hyper-V virtual machines, hosts, and servers.
Discover Discovery (on page 31) works differently for virtual servers and virtual machines than for physical devices. Create a discovery profile (DISCOVER menu > New Scan) that enables you to discover management services (such as VMware vCenters) or else individual hypervisors (Hyper-V, ESX/ESXi) when these hypervisors run in an unmanaged environment. Discovering virtual machines by way of their management services or hypervisor provides continuity of monitoring and logging information and is particularly useful in high-availability environments where VMs 'spin up' according to fault tolerant schemes or workload managers.

WhatsUp Gold User Guide
268
Note: In your discovery scan you must elect to Expand Scan to Include Virtual Environments (on page 31).
Apply the guidelines in this section to ensure WhatsUp Gold learns about the host/guest relationships between the hypervisors and their associated VMs running on your network.
Discovery Scan Prerequisites.
Prerequisites Before you invoke a discovery scan on your virtual environment, check that you have these:
VMware. Valid VMware credentials (on page 223) are used. VMware Tools are also required. VMware Tools must be installed on each virtual machine you deploy. Otherwise,
the virtual device will not be discovered during the VMware scan. For detailed statistics and system information (for example, VMware Datastore
IOPS (on page 173) monitor), add VMware credentials (on page 223) to VMware VMs as well as for the vCenter server.
Tip: If you delete a vCenter from WhatsUp Gold, applicable host/guest relationships will not be recognized. In order to retain these relationships, delete the host as well, then rediscover the host and add it back into WhatsUp Gold.
Hyper-V. Hyper-V devices are discovered when valid Windows credentials are used. Groups and users for passing WMI management objects must be in place. Host OS Application firewalls must align with default Hyper-V firewall rules.
Configure Account Access for Passing WMI The appropriate Windows users or groups must be configured to allow access to the following WMI namespaces:
root\cimv2. Allows for discovery of any windows device using WMI.
root\virtualization\v2. Allows for discovery of Hyper-V host (2012 server, 2012 R2 server, and Windows 8).
\root\default. Allows for discovery of any additional registry information available.
Align Host OS for Hyper-V/WMI Firewall Rules The following firewall exceptions must be created:
Port 135 must be opened for data collection using WMI.
TCP/UDP traffic must be allowed on ports 1024-65535 or monitored objects using WMI will not be accessible.

WhatsUp Gold User Guide
269
WMI communications use a random port between 1024 and 65535 per Microsoft Windows specifications. The actual port used is determined by the remote machine. The port number range is based on the operating system being queried. The administrator can reduce or increase the range in most Windows operating systems.
Check Order of Credentials in the Discovery Scan WhatsUp Gold attempts discovery using Windows credentials in priority order. The first credential used that is allowed any WMI access is selected. However, if that credential does not have access to each of the required namespaces discussed previously, Windows is successfully detected, but other device details which require additional namespace access fail. The result is the target device is discovered as a Windows device, but is not recognized as a Hyper-V Host.
Note: Procedures for configuring conditions for successful Hyper-V device discover may vary depending on core versus full installation as well as the operating system on which the configuration is being performed.
Discover Your Virtual Environments from the Top...Down.
When you discover virtual resources, include IP addresses of vCenters or hypervisors in your scan specification rather than individual VMs. WhatsUp Gold becomes aware of individual virtual machines through managing elements (such as vCenters, Hyper-V hosts, and standalone hypervisors) as part of the discovery process.
When including virtual environments in your discovery scan, follow these guidelines:
Discover management services first (such as VMware vCenter). In unmanaged environments (no vCenter and one or more ‘stand-alone’
hypervisors), you can discover individual hypervisors. After the discovery scan completes, apply monitoring to all nodes belonging to
the virtual environments (select each node and click the Start/Update Monitoring button) for each of the vCenter, hypervisors, and virtual machines.
Important: To ensure that VMware vCenter, cluster, datacenter, hypervisor, and virtual machine relationships are recognized by WhatsUp Gold and later reflected on the Network Map (on page 20), you must apply/update monitoring (Start/Update Monitoring (on page 52)) to both the managing elements, the hypervisors, and the associated the virtual machines after discovery.
Run Discovery Scan and Apply Monitoring.
Discover VMware Environments When you run a discovery scan, it is best to configure your scan to learn about VMware hypervisors and virtual machines through management services (such as VMware vCenter). In unmanaged virtual environments with stand-alone hypervisors (with just VMware ESXi, for example), you can discover hypervisors individually.

WhatsUp Gold User Guide
270
When hosts are managed by vCenter.
Discovering your virtual resources by way of vCenter is the preferred approach.
Guidelines:
Provide the IP address of the vCenter at discovery scan time. Your Credentials Library (SETTINGS menu > Libraries > Credentials
Library) must include the WhatsUp Gold VMware credentials for the vCenter. (Preferred) include VMware Credentials in WhatsUp Gold for each ESXi host (if
they differ from the vCenter credentials). This is best practice, but some host/guest metrics are available through vCenter without them (that is, using only VMware credentials you provided for vCenter).
Discover and add monitoring to a vCenter and its managed elements 1 From the IP Address Scan window (DISCOVER menu > New Scan), input the IP
address of one or more vCenters. (You can unselect the Gateway IP and Local Subnet checkboxes.)
2 In the Settings tab of the IP Address Scan window, click the Checkbox in Advanced Settings > Data Collection > Expand scan to any virtualization environments.
3 In the Credentials tab of the IP Address Scan window, include the appropriate VMware credential, and click Run to begin the scan. (Including the VMware credential for vCenter enables WhatsUp Gold to identify the device as a virtual host and learn about its managed hosts and their guest VMs) Nodes (discovered devices) display on Discovery Map.
4 After the scan completes, select the VMware vCenter and discovered virtual machine nodes, and click the Start Monitoring button to add them to My Network Map with their associated default monitors. Lines of association show relationship between hosts and virtual machines and hosts to their vCenter.
5 After a few minutes, check the virtual monitoring dashboard (ANALYZE menu > Dashboards > Virtual Monitoring) to see data gathered from monitors of newly discovered virtual devices.
Tip: If you delete a monitored vCenter from the WhatsUp Gold Network Map, the existing host/guest relationships between its managed virtual hosts and virtual machines will no longer be obvious to WhatsUp Gold. This can also impact the continuity of monitoring and logging. To retain continuity of information and host/guest relationships with WhatsUp Gold after a vCenter deletion, delete each virtual host, re-discover, and from the Discovered Devices Map, use Update Monitoring button to restore these relationships.
When hosts/hypervisors (ESX/ESXi) are run standalone (unmanaged).
For this scenario, your Credentials Library (SETTINGS menu > Libraries > Credentials Library) must include the WhatsUp Gold VMware credential for the VMware host you want to discover.

WhatsUp Gold User Guide
271
Discover and add monitoring to stand-alone ESX/ESXi hosts 1 From the IP Address Scan window (DISCOVER menu > New Scan), input the IP
address of one or more VMware ESX or ESXi hosts. (You can unselect the Gateway IP and Local Subnet checkboxes.)
2 In the Settings tab of the IP Address Scan window, click the checkbox in Advanced Settings > Data Collection > Expand scan to any virtualization environments.
3 In the Credentials tab of the IP Address Scan window, include the appropriate VMware credential(s) in your network scan. (Including the VMware credential to the hypervisor enables WhatsUp Gold to identify the device as a virtual host and query it for virtual machine information). Network nodes (discovered devices) display on Discovery Map and the discovery scan completes.
4 Select each discovered hypervisor and virtual machine and click the Start Monitoring button to add them to My Network Map with default monitors. Lines of association show relationship between hosts and virtual machines.
5 After a few minutes, check the virtual monitoring dashboard (ANALYZE menu > Dashboards > Virtual Monitoring) to see data gathered from monitors of newly discovered virtual devices.
Tip: In order to Discover a VM or hypervisor you need to provide WMI (Hyper-V) or VMware credentials at scan time. Otherwise, the device category or "Role (on page 89)" that WhatsUp Gold sees will be limited to a set of simple SNMP objects.
Note: Where VM endpoints on a network are different than physical devices, can be leveraged as a flexible resource, and typically provisioned on demand, WhatsUp Gold performs a periodic Virtualization Sync task (on page 383) to keep device information current. Device card VM counts are current as of the last periodic scan.
Map/organize/monitor (My Network Map) Virtual servers and virtual machines can be viewed and monitored like physical devices, but they have distinct roles, additional monitoring capability, added logging, and a
specific filter (Virtual Overlay (on page 20) ) that enables you to bring focus only to virtual devices when viewing them from My Network Map (on page 20).
Show Virtual Monitoring Devices. Click on the Virtual Overlay (on page 20)
.
Add and Enable Individual Monitors. Select a device, click Device Properties (on page 86) , then assign and enable individual monitors (on page 106).
Event Logging. Virtual platform logging is built-in and configurable (Hyper-V Event Log monitor (on page 948) / VMware Event Logging (on page 945)).
WhatsUp Gold User Guide
272
Install Alert Controls. Alert Thresholds (on page 258) (Hyper-V (on page 883) / VMware (on page 885)), Alert Notifications (on page 260), Blackout Schedule (on page 261), and Alert Policies (on page 260).
Analyze (Dashboard, log, and report) Analyze log, reporting, and dashboard data to assess performance, quality of service, and impact.
Virtual Monitoring Dashboard (on page 424). Select a Hyper-V host or VMware host and see metrics and system info for associated VMs.
Home Dashboard (on page 415). Add a custom view and configure and drag in Virtual Monitoring performance and inventory reports from the reports palette.
VMware Event Log (on page 825). vCenter managed logs. Configured in the Device Properties (on page 945).
Hyper-V Event Log (on page 808). Hyper-V virtual machine events are configured in Monitor Setup.
Capture/share/export Generated Virtual Monitoring report data can be visualized, shared, and reused using Export Data ( ) or Dashboard Options ( ).
PDF. Save grid and chart views as PDF.
Share. Share Monitoring Virtual Machines and Infrastructure reports (on page 952) with other users in a single or combined view.
Export. Export Monitoring Virtual Machines and Infrastructure data (on page 951) as PDF, XML, or Excel and leverage outside of WhatsUp Gold
Email. Email reports, charts, and log data (on page 950). (Create and then edit/manage from Scheduled Reports (on page 942).)
Monitoring Cloud-Managed Devices WhatsUp Gold allows you to monitor, configure thresholds and alerting, and generate performance, health, and inventory reports for your cloud-based resources and infrastructure. WhatsUp Gold provides an integrated monitoring and management solution for cloud vendors such as Microsoft Azure, Amazon AWS, and Cisco Meraki. This walkthrough provides instructions for integrating WhatsUp Gold for each of these vendors.
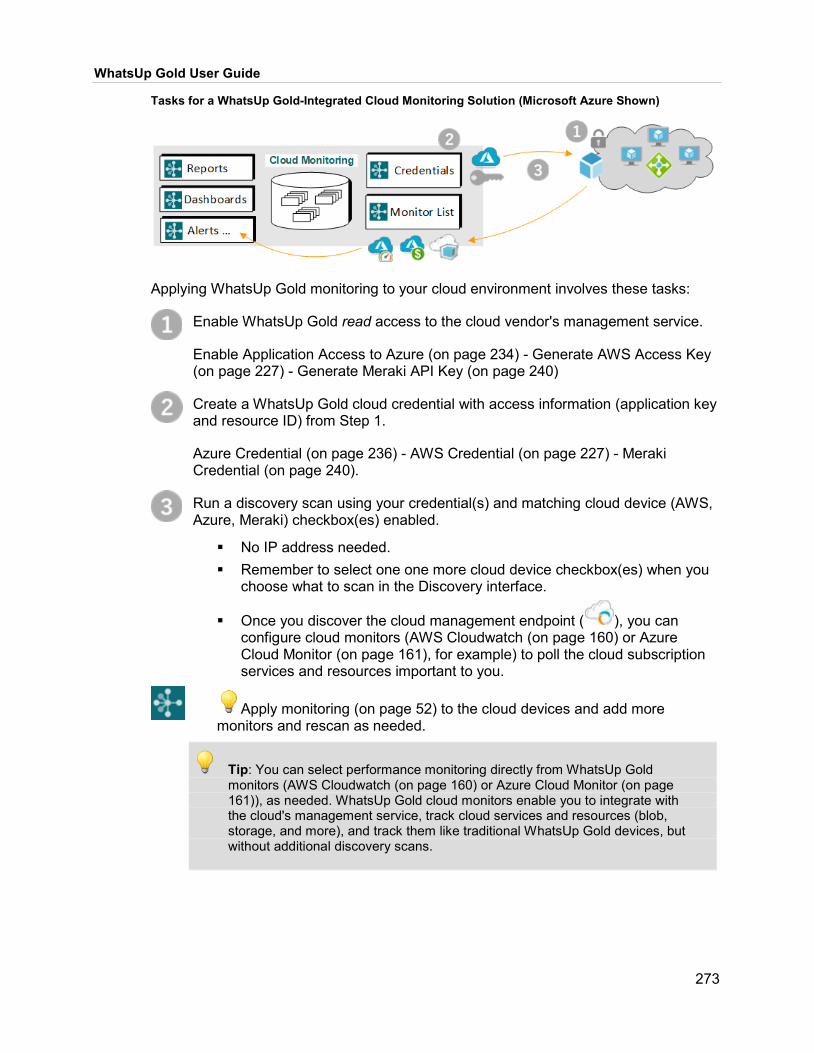
WhatsUp Gold User Guide
273
Tasks for a WhatsUp Gold-Integrated Cloud Monitoring Solution (Microsoft Azure Shown)
Applying WhatsUp Gold monitoring to your cloud environment involves these tasks:
Enable WhatsUp Gold read access to the cloud vendor's management service.
Enable Application Access to Azure (on page 234) - Generate AWS Access Key (on page 227) - Generate Meraki API Key (on page 240)
Create a WhatsUp Gold cloud credential with access information (application key and resource ID) from Step 1.
Azure Credential (on page 236) - AWS Credential (on page 227) - Meraki Credential (on page 240).
Run a discovery scan using your credential(s) and matching cloud device (AWS, Azure, Meraki) checkbox(es) enabled.
No IP address needed. Remember to select one one more cloud device checkbox(es) when you
choose what to scan in the Discovery interface.
Once you discover the cloud management endpoint ( ), you can configure cloud monitors (AWS Cloudwatch (on page 160) or Azure Cloud Monitor (on page 161), for example) to poll the cloud subscription services and resources important to you.
Apply monitoring (on page 52) to the cloud devices and add more monitors and rescan as needed.
Tip: You can select performance monitoring directly from WhatsUp Gold monitors (AWS Cloudwatch (on page 160) or Azure Cloud Monitor (on page 161)), as needed. WhatsUp Gold cloud monitors enable you to integrate with the cloud's management service, track cloud services and resources (blob, storage, and more), and track them like traditional WhatsUp Gold devices, but without additional discovery scans.

WhatsUp Gold User Guide
274
Monitor
When monitored with WhatsUp Gold, a placeholder device ( ) displays on the Network Map. The placeholder device stands for your vendor's cloud management endpoint. Where the placeholder device represents an endpoint for the cloud vendor's management service and not a device in the traditional sense of WhatsUp Gold it carries a zeroed-out IP address ("0.0.0.0").
Track Performance and Health Cloud Resource Monitor (on page 114). Automatically added to AWS and Azure
resources including VMs and load balancers. AWS Cloudwatch (on page 160). Highly configurable WhatsUp Gold monitor
type that provides alerting and reporting on AWS instrumentation. Azure Cloud Monitor (on page 161). Highly configurable WhatsUp Gold monitor
type that provides alerting, reporting, and aggregation of AMS instrumentation. Much more (on page 106). You can apply credentials for the cloud VMs (Azure,
AWS) or WLCs (Meraki) and rescan so any additional monitors can be applied (TCP, HTTPS, SFTP, SQL, and more).
Track Costs and Billing Azure Billing Monitor (on page 164). Requires Enterprise Azure Portal (EAP)
credential fields filled in for you Azure Credential. AWS Cloudwatch (on page 160) (with Billing namespace).
Monitoring VoIP IP SLA WhatsUp Gold provides specialized VoIP SLA monitoring necessary for tracking Quality of Service (QoS) and Service Level Agreement metrics for Voice over IP (VoIP). After you discover and configure devices for VoIP monitoring, you can view metrics using the WhatsUp Gold Custom Performance Monitors (on page 574) dashboard.
Background Voice over Internet Protocol (IP) sessions must transport telephony data as a continuous or near-continuous stream to ensure each side of the voice conversation sounds natural, not jittery, and free from discernible drop offs or echo. Where the Quality of Service (QoS) of Internet Protocol is 'best-effort' (first-come, first-serve), IP routers and IP call centers collect end-point and round-trip statistics critical for tracking and indicating call quality. WhatsUp Gold VoIP applies specialized monitors to gather and aggregate these IP SLA metrics. The VoIP measurements include call jitter (one
WhatsUp Gold User Guide
275
way latency), predictive level of call impairment ICPIF (Impairment / Calculated Planning Impairment Factor (https://www.itu.int/rec/dologin_pub.asp?lang=e&id=T-REC-G.113-199602-S!!PDF-E&type=items)), round trip times, and an active monitor that gathers a periodic call quality metric as a 'virtual' VoIP session and generates a Mean Opinion Score (MOS) https://www.itu.int/rec/dologin_pub.asp?lang=e&id=T-REC-P.800.1-201607-I!!PDF-E&type=items.
WhatsUp Gold VoIP monitoring provides:
VoIP performance monitors. Used to track round trip and end point characteristics of call traffic. (Packet loss, ICPIF, Jitter, round-trip latency)
Active monitoring (on page 146). Simulates voice traffic and returns a quality score based on a trained model. (MOS)
Custom Performance Monitor reports (on page 574). Ability to alert on monitor status (on page 258).
Before You Begin Before you run the VoIP Configuration Utility and begin VoIP monitoring, you will need:
Username/password pair for the Windows host machine running WhatsUp Gold. (These are necessary to launch and run the WhatsUp Gold Admin Console.)
WhatsUp Gold-discovered routers that support VoIP MIBs and/or devices running Cisco CallManager. (The VoIP configuration utility pulls candidates for VoIP monitoring from devices you have already promoted to MY NETWORK MAP).
SNMP read credentials for routers and SNMP credentials for Cisco CallManager.
Monitoring enabled (on page 106) in WhatsUp Gold for devices you want to add VoIP monitoring to.
Important: Prior to launching the VoIP Configuration Utility, select ANALYZE > Dashboards > Home Dashboard to ensure dashboard views are successfully created and properly configured before the VoIP-specific view is created.
Configuring VoIP Monitors After network discovery of routers and Cisco call centers that support VoIP statistics, you can configure VoIP monitors on devices supporting VoIP metrics.

WhatsUp Gold User Guide
276
Step 1: Launch the VoIP Configuration Utility (from the WhatsUp Gold Admin Console)
1 Log into the Windows host where WhatsUp Gold is running. 2 Launch the WhatsUp Gold Admin Console (Windows start menu > All Programs
> Ipswitch WhatsUp Gold > WhatsUp Gold Admin Console). 3 From the Admin Console, launch the VoIP Configuration Utility (Tools menu >
VoIP Configuration Utility). 4 Follow the instructions described in Step 2: Finding and Configuring Devices that
Support VoIP SLA Monitoring.
Step 2: Find and Configure Devices that Support VoIP SLA Monitoring
1 From the VoIP Monitor Configuration Utility welcome screen, click on Next.
The utility returns a list of devices in WhatsUp Gold with monitoring enabled. 2 Select the device(s) in the list you want to monitor for VoIP statistics. If the device
you want to monitor is not in the list, apply one of the following and then click Reload. Find the device you want to add in the Discovered Network map (on page 19),
select it, and from the device card click on Start/Update Monitoring (on page 52).
If the device you want to monitor is neither in the list, nor in the Discovered Network map, ensure you have the correct credentials, get the IP address for the device and perform a single IP scan to include it as part of the Discovered Network map (on page 19).
Apply monitoring. Select it on the map. Then from the device card click Start/Update Monitoring (on page 52).
3 Click Next.

WhatsUp Gold User Guide
277
Performance Monitors Setup Screen displays with a summary of current statistics. 4 Select the Round Trip Time tables representing end-stations on your network that
you want to capture VoIP statistics for and then click on Next. 5 Filter devices you want performance monitoring on and then click on Next. 6 Select the devices you want to measure Mean Opinion Score from and then click
on Next. WhatsUp Gold VoIP Monitor Configuration Summary screen displays.
7 Ensure that the log messages in the summary screen indicate that monitors were added successfully. Click on Next and then Finish to exit the utility.
Step 3: Check the monitor setup on the Source Device and View Report Data
To ensure you are monitoring VoIP IP SLA data, you can:
View enabled monitors. From the My Network Map or the table grid underneath it, select a device to display the Device Information Card, then click Device Properties ( ).
Example: VoIP Monitor View report data. Open the ANALYZE menu > Performance > Custom
Monitors (on page 574) Dashboard.
Tip: Mean Opinion Score (MOS) is measured on a scale from 1 to 5 —where 5 is perfect call quality and 1 denotes bad call quality.

278
CHAPTER 8
Application Monitoring with WhatsUp Gold
In This Chapter Understanding WhatsUp Gold Application Monitoring Terminology 282
Preparing to Monitor Applications ......................................... 283
Discovering Applications ....................................................... 284
Working with Application Profiles .......................................... 285
Working with Application Instances ....................................... 286
Working with Components and Component Groups ............. 287
Working with Discrete Applications ....................................... 300
About Action Policies, Actions, and Blackout Policies and WhatsUp Gold Application
Monitoring ............................................................................. 301
Working with Application Attributes ....................................... 305
Application Monitoring (SETTINGS menu > Application Monitoring > Application and Profile Setup) (also referred to as "APM") gathers performance statistics and overall application health while alerting on performance degradation and potential problems before they result in service outages. APM can assist organizations to measure service level and guarantee Service Level Agreements (SLAs) as well as assist in pinpointing application performance bottlenecks and points of failure. APM allows you to monitor the performance of "applications" and application-layer services running on your monitored devices.
Background This section outlines the essential building blocks you use to build your full APM solution.
WhatsUp Gold and its supporting reference content use the following terminology when discussing application monitoring:
Application Type. Groups application profiles, instances, and components by the type of application (e.g., Microsoft SQL Server, Microsoft IIS, Microsoft Windows). After profiles, instances, and components are configured for an application, you will begin monitoring information about application health.
Application. An application is made up of one or more programs running on one or more monitored systems. There are three distinct application types leveraged by WhatsUp Gold:

WhatsUp Gold User Guide
279
Simple application. A simple application is an application that is not dependent on another application to run. Example: Microsoft Server 2008 R2.
Complex application. A complex application is an application configured to be dependent on one or more applications to run (e.g., WhatsUp Gold requires IIS and SQL Server).
Discrete application. A discrete application is an application upon which a complex application has a dependency. (e.g., IIS and SQL Server are discrete applications on which the complex application WhatsUp Gold is dependent.) A discrete application is used when you are monitoring a complex application.
Application Profile. An application profile is a blueprint for monitoring a given type of application within WhatsUp Gold. It defines the collection of components and distinct applications that reflect the health and status of a specific type of application. An application instance is created from the application profile by associating it with the actual devices that host the components of the application as defined by the application profile. Changes to the application profile are inherited by all of the instances created from the profile. Changes in the profile are not inherited by overridden fields.
Application Instance. An application instance is a running copy of an application profile that monitors the defined collection of components, distinct applications, and thresholds necessary to define the health and performance of a given type of application. An application instance can extend the application profile by adding components, component groups, or discrete applications. The application profile is not changed when an application instance is extended.
Component. A component is a single data point collected as part of an application profile (e.g., CPU Utilization)
Critical component. A critical component is a component that impacts the status of an application instance. As a result, a critical component that goes into the down state, causes the application instance to go into the down state. However, if a non-critical component goes into a down state, the application instance goes into a warning state and only the component indicates being in the down state.
Critical component group. A critical component group is a grouping of components that contains specific logic to allow for complex evaluation of the up/down state of an application. For example, given four components A,B,C and D, the following logic can be applied, so that if A and B are down or C and D are down the application is placed into the down state. ((A and B) or (C and D)). Critical component groups are always considered "critical", in that if a critical component group is evaluated to be in the down state, the entire application is in the down state.
Application Profile. Each monitored application is comprised of a collection of individual components as defined by an application profile.
Application Instance (on page 286). By applying an application profile to a monitored device, you instantiate an application monitoring instance ("Application Instance").

WhatsUp Gold User Guide
280
Discover Preparing to Discover. Select profiles you want applied during discovery or add new ones.
Configuring WhatsUp Gold to monitor an application is a simple process. It starts with selecting a profile that captures data points necessary to understand the performance, health, and status of a given type of application. The application profile groups the components, discrete applications, and associated thresholds necessary to capture the data points into a blueprint that can be used to create individual application instances. These instances actively monitor your applications.
Ipswitch provides a selection of profiles which are available upon successful WhatsUp Gold installation. You can also create your own application profiles.
After you have the necessary profiles, you can automatically discover your applications and create instances for each discovered application, or you may choose to manually create and modify instances individually before you begin monitoring.
Discovering Applications. Discover devices with resident applications that match selected application profiles.
You can discover applications on and create application instances for devices monitored by WhatsUp Gold. To be discoverable, an application must have at least one discoverable service or process component associated with its profile. Ensure Use in discovery is enabled when adding or editing Windows service or process components within the application profile.
To discover applications: 1 Select SETTINGS > Application Monitoring > Application and Profile Setup
from the top navigation menu. 2 Initiate application discovery by selecting one or more applications to discover,
then click Discover Applications. Depending on your selection, this control is available within the For selected and Options menus as well as at the top of the application grid. A navigation tree appears mirroring your device list which displays dynamic groups and discovery scans. Please note, if a dialog appears indicating one or more of the application profiles selected does not have discoverable components and will not be included in the search.", click OK.
3 Select the groups and/or devices for which you want to discover applications by clicking the applicable check boxes in the navigation tree.
4 Click Discover applications. The Application Discovery: Discovery Results page appears.
After applications are discovered, use the list of newly discovered applications to select which ones to monitor and subsequently create application instances.
To monitor newly-discovered applications: 1 Identify an application on the list you want to begin monitoring and click Start
monitoring. A Start Monitoring Application dialog appears and WhatsUp Gold automatically begins testing the application profile components.

WhatsUp Gold User Guide
281
2 Use the Start Monitoring Application dialog to make any desired changes to the instance you are creating. The dialog contains the following information: Name. Use this box to modify the default name of the application instance.
Action Policy. Use this list to select an action policy to be applied to the application instance.
TEST Timeout. Use this box to indicate how long a component test should run prior to timeout.
Test Components. Use this button to immediately initiate component testing.
Enabled. Use these check boxes to enable or disable individual components for the Application instance.
Warning Threshold. Use this box to indicate when WhatsUp Gold reports the component is experiencing a problem.
Down Threshold. Use this box to indicate when WhatsUp Gold reports the component as 'Down'.
3 Click Finish to save the application instance. 4 Close the dialog to return to the Application Discovery: Discovery Results page. 5 Repeat these procedures as needed to create additional application instances.
Manage/Add Profiles/Monitor You manage application instances by way of the Application and Profile Setup view (SETTINGS menu > Application Monitoring > Application and Profile Setup).
Working with Application Profiles (on page 285). Using built-in profiles, importing from WUGspace, and creating your own.
Working with Application Instances (on page 286). Managing deployed application monitors.
Working with Components and Groups (on page 287). Select data values to be monitored/sampled.
Working with Discrete Applications (on page 300). Monitoring underlying platforms for applications.
Applying Actions and Action Policies (on page 301). Apply state transition rules and corrective actions.
Working with Application-Specific Attributes (on page 301). Manage application descriptive data.
Analyze (dashboard, log, and report) Analyze log, reporting, and dashboard data to assess performance, quality of service, and impact.
Application Monitoring Dashboard. View, filter, and share application monitoring availability and performance.

WhatsUp Gold User Guide
282
Application Event Log (on page 444). Shows application events, actions, and state changes.
Applications State Change Log (on page 838). Shows transitions in application monitor states.
Capture/share/export Application monitoring data can be visualized, shared, and reused using Export Data ( ) and Dashboard Options ( ).
PDF. Save grid and chart views as PDF. Share. Share Application Monitoring with WhatsUp Gold reports (on page 952)
with other users in a single or combined view. Export. Export Application Monitoring with WhatsUp Gold data (on page 951)
as PDF, XML, or Excel and leverage outside of WhatsUp Gold Email. Email reports, charts, and log data (on page 950). (Create and then
edit/manage from Scheduled Reports (on page 942).)
Understanding WhatsUp Gold Application Monitoring Terminology
WhatsUp Gold and its supporting reference content use the following terminology when discussing application monitoring:
Application Type. Groups application profiles, instances, and components by the type of application (e.g., Microsoft SQL Server, Microsoft IIS, Microsoft Windows). After profiles, instances, and components are configured for an application, you will begin monitoring information about application health.
Application. An application is made up of one or more programs running on one or more monitored systems. There are three distinct application types leveraged by WhatsUp Gold:
Simple application. A simple application is an application that is not dependent on another application to run. Example: Microsoft Server 2008 R2.
Complex application. A complex application is an application configured to be dependent on one or more applications to run (e.g., WhatsUp Gold requires IIS and SQL Server).
Discrete application. A discrete application is an application upon which a complex application has a dependency. (e.g., IIS and SQL Server are discrete applications on which the complex application WhatsUp Gold is dependent.) A discrete application is used when you are monitoring a complex application.

WhatsUp Gold User Guide
283
Application Profile. An application profile is a blueprint for monitoring a given type of application within WhatsUp Gold. It defines the collection of components and distinct applications that reflect the health and status of a specific type of application. An application instance is created from the application profile by associating it with the actual devices that host the components of the application as defined by the application profile. Changes to the application profile are inherited by all of the instances created from the profile. Changes in the profile are not inherited by overridden fields.
Application Instance. An application instance is a running copy of an application profile that monitors the defined collection of components, distinct applications, and thresholds necessary to define the health and performance of a given type of application. An application instance can extend the application profile by adding components, component groups, or discrete applications. The application profile is not changed when an application instance is extended.
Component. A component is a single data point collected as part of an application profile (e.g., CPU Utilization)
Critical component. A critical component is a component that impacts the status of an application instance. As a result, a critical component that goes into the down state, causes the application instance to go into the down state. However, if a non-critical component goes into a down state, the application instance goes into a warning state and only the component indicates being in the down state.
Critical component group. A critical component group is a grouping of components that contains specific logic to allow for complex evaluation of the up/down state of an application. For example, given four components A,B,C and D, the following logic can be applied, so that if A and B are down or C and D are down the application is placed into the down state. ((A and B) or (C and D)). Critical component groups are always considered "critical", in that if a critical component group is evaluated to be in the down state, the entire application is in the down state.
Preparing to Monitor Applications Configuring WhatsUp Gold to monitor an application is a simple process. It starts with selecting a profile that captures data points necessary to understand the performance, health, and status of a given type of application. The application profile groups the components, discrete applications, and associated thresholds necessary to capture the data points into a blueprint that can be used to create individual application instances. These instances actively monitor your applications.
Ipswitch provides a selection of profiles which are available upon successful WhatsUp Gold installation. You can also create your own application profiles.
After you have the necessary profiles, you can automatically discover your applications and create instances for each discovered application, or you may choose to manually create and modify instances individually before you begin monitoring.

WhatsUp Gold User Guide
284
Discovering Applications You can discover applications on and create application instances for devices monitored by WhatsUp Gold. To be discoverable, an application must have at least one discoverable service or process component associated with its profile. Ensure Use in discovery is enabled when adding or editing Windows service or process components within the application profile.
To discover applications: 1 Select SETTINGS > Application Monitoring > Application and Profile Setup
from the top navigation menu. 2 Initiate application discovery by selecting one or more applications to discover,
then click Discover Applications. Depending on your selection, this control is available within the For selected and Options menus as well as at the top of the application grid. A navigation tree appears mirroring your device list which displays dynamic groups and discovery scans. Please note, if a dialog appears indicating one or more of the application profiles selected does not have discoverable components and will not be included in the search.", click OK.
3 Select the groups and/or devices for which you want to discover applications by clicking the applicable check boxes in the navigation tree.
4 Click Discover applications. The Application Discovery: Discovery Results page appears.
After applications are discovered, use the list of newly discovered applications to select which ones to monitor and subsequently create application instances.
To monitor newly-discovered applications: 1 Identify an application on the list you want to begin monitoring and click Start
monitoring. A Start Monitoring Application dialog appears and WhatsUp Gold automatically begins testing the application profile components.
2 Use the Start Monitoring Application dialog to make any desired changes to the instance you are creating. The dialog contains the following information: Name. Use this box to modify the default name of the application instance.
Action Policy. Use this list to select an action policy to be applied to the application instance.
TEST Timeout. Use this box to indicate how long a component test should run prior to timeout.
Test Components. Use this button to immediately initiate component testing.
Enabled. Use these check boxes to enable or disable individual components for the Application instance.
Warning Threshold. Use this box to indicate when WhatsUp Gold reports the component is experiencing a problem.

WhatsUp Gold User Guide
285
Down Threshold. Use this box to indicate when WhatsUp Gold reports the component as 'Down'.
3 Click Finish to save the application instance. 4 Close the dialog to return to the Application Discovery: Discovery Results page. 5 Repeat these procedures as needed to create additional application instances.
Working with Application Profiles Access the application monitoring configuration interface by selecting SETTINGS > Application Monitoring > Application and Profile Setup. This interface allows you to create new application profiles as well as import profiles from your local machine. Additionally, for existing application profiles, you can also:
Add application instances. Define application attributes. Make configuration changes. Export application profiles to an .xml file. Copy application profiles. Delete application profiles.
Please note, to perform these functions, you must have the Configure APM Application Profiles user right enabled.
To add a new application profile: 1 Select any application profile type displayed in the navigation tree, then click Add
Application Profile. The Configure New Application Profile page appears. 2 Configure the following: Enter a Name, Version, and Description for the application.
Select the application type from the Type list. The application type selected in the navigation tree is populated by default.
Select any Attributes to apply to the profile if desired.
Select a configured action policy using the Action Policy list to apply to the profile, if desired.
Click the Browse button (...) and use the dialog displaying the device tree that appears to select a test device for the profile.
Specify the maximum duration in seconds before the test will time out in the TEST Timeout field.
3 Click Save.
In addition to these basic profile configuration elements, you can also use the controls on the Components grid on this page to:

WhatsUp Gold User Guide
286
Add components to or remove components from the profile.
Create critical component groups.
Create copies of components within the profile.
Test any or all components within the profile.
Modify the polling frequency for one or more components within the profile.
For more information, see Working with Components and Component Groups (on page 287).
Working with Application Instances An application instance is a running copy of an application profile that monitors the defined collection of components, distinct applications, and thresholds necessary to define the health and performance of a given type of application. An application instance can extend the application profile by adding components, component groups, or discrete applications. The application profile is not changed when an application instance is extended.
Important: In order to perform these procedures, you must have the Configure APM Application Instances user right enabled.
To create an instance for monitoring an application on a specific device: 1 Select an application type displayed, then select New Instance from the Options
menu for the applicable profile. OR
Select an application profile displayed, then click Add Application Instance. The Configure New Application Instance page appears.
2 Configure the following: Enter a Name and Description for the application instance.
Select any Attributes to apply to the instance if desired.
Click the Browse button (...) and use the dialog displaying the device tree that appears to select a test device for the instance.
Specify the maximum duration in seconds before the test will time out in the TEST Timeout field.
Select a configured action policy using the Action Policy list to apply to the instance, if desired.
Enable the In Maintenance option to place the instance in maintenance mode. While in maintenance mode, the application instance will not be monitored.
In addition to these basic instance configuration elements, you can also use the controls on the Components grid on this page to:
WhatsUp Gold User Guide
287
Add components to or remove components from the instance.
Create critical component groups.
Create copies of components within the instance.
Test any or all components within the instance.
Modify the polling frequency for one or more components within the instance
For more information, see Working With Components and Component Groups (on page 287).
Working with Components and Component Groups
A component is a single data point collected as part of an application profile. Some application profiles can be edited, in which case individual components can be added to or removed from the profile. For editable application profiles, components can also be added to or removed from specific instances as opposed to the entire profile.
Adding components to an application profile helps create the foundation of the application profile. After adding components to an application profile, you must create an application instance to monitor an application on a device.
To add components: 1 Select an application profile displayed, click Edit Application Profile, then click
Add components. If the application profile does not allow for the addition/removal of components, View Application Profile is seen in place of Edit Application Profile. OR
Select a specific instance and then click Add components. Individual components can be added to specific instances even if the application profile overall is not editable. The Add Components dialog containing the Component Library appears.
2 Click the icon to the left of the component types you want to add to the application profile or instance. This expands the Component Library to display available component options.
3 Use the up and down arrows to specify the number of components of each type to add.
4 Click Add Selected. Configuration dialogs for each added component appear in the Component grid.
5 Use the Test Device browse button (...) to select a specific device on which to test a component if desired. If no test device is selected, the component is tested on the test device associated with the application profile. Test devices are not saved as part of the application profile.

WhatsUp Gold User Guide
288
6 Configure each component as needed. Component configuration fields vary depending upon type. Refer to the Component Library for individual component descriptions and their corresponding configuration fields.
7 Click Save.
To remove a component from an application profile or instance, select Delete from the applicable Options menu.
To test components: Click the applicable Test button to test a single component. Click Test all to test every component. Use the selection boxes at left to select components and then select For
selected > Test to test multiple components.
A critical component group is a grouping of components that contains specific logic to allow for complex evaluation of the up/down state of an application. For example, given four components A,B,C and D, the following logic can be applied, so that if A and B are down or C and D are down the application is placed into the down state. ((A and B) or (C and D)). Critical component groups are always considered "critical", in that if a critical component group is evaluated to be in the down state, the entire application is in the down state.
Components can be added to or removed from entire application profiles or specific instances.
For example, you can create a critical component group called Device Utilization and assign the following components to the group:
CPU Utilization Disk Utilization Physical Memory Utilization Virtual Memory Utilization
You can then assign the following state logic to the critical component group: If CPU Utilization and Virtual Memory Utilization equal Down and Disk Utilization equal Warning, then the component group is Down. Since this component group is considered "critical", the application instance that contains this critical component group would also be Down.
There must be at least two components included in a critical component group. For more information, see Working with critical component groups.
To add a critical component group to an application profile: 1 Select the application profile for which you want to add a critical component group,
then click Edit/View Application Profile. The Components list appears. 2 In the Components section, click Add critical component group.
The Critical Component Group information displays. 3 Enter a unique name and description if desired for the component group, then
select a specific state configuration. For example, if CPU Utilization component is

WhatsUp Gold User Guide
289
down and the Disk Utilization component is down, then the component group is down.
4 Click Save.
To add a critical component group to an application instance: 1 Create an application instance. 2 In the Components section, click Add critical component group. The Critical
Component Group information appears. 3 Ensure the critical component group is enabled. 4 Select the desired action policy to be applied and executed when triggered. 5 Select a configuration for the critical component group. For example, if CPU
Utilization component is down and the Disk Utilization component is down, then the component group is down. Please note, when a critical component group is added to an application instance, not inherited from the profile, you must add additional unique components for the critical component group to evaluate for application states.
6 Click Save.
To copy components and critical component groups, select Copy from the Options menu of the individual component or critical component group you want to duplicate.
CPU Utilization The CPU Utilization component allows you to monitor the percentage of CPU being used on a particular device and alerts you if certain thresholds are exceeded.
Database Query There are two types of database components you can configure depending on your database server:
The Oracle Query Check component allows you to create a query to run on a specific device to assess the health of an Oracle database.
The Microsoft SQL Server Query Check component provides you with real-time information about the state and health of a Microsoft SQL Server application on a specific device.
Disk Utilization The Disk Utilization component allows you to monitor the percentage of disk space being utilized on a specific device.
WhatsUp Gold User Guide
290
File Content The File Content component scans for the existence or occurrences of a specified string pattern within application and system log files and uses those file in the application profile of which it is a part. It is intended for scanning text files such as logs, for example, and not binary files. For best performance, select as few files to scan as possible. Using regular expressions to specify filename and scan pattern can affect performance. It is imperative to create detailed regular expressions, specifically for specifying the scan pattern, in order to achieve the best results.
HTTP Content Check The HTTP Content Check component requests a URL and checks the HTTP response against the expected content. Use this component to ensure your web pages are available for viewing, check if they are rendering properly on specific browsers, or check for specific content to be posted after a certain date.
Interface Statistics There are three types of Interface components you can configure:
The Interface Utilization In/Out components allow you to monitor the percentage of in or out utilization on a specific device interface.
The Interface Errors In/Out components allow you to monitor the number of in or out errors on a specific device interface.
The Interface Discards In/Out components allow you to monitor the number inbound or outbound packets which were chosen to be discarded on a specific device interface.
JMX Performance Check The JMX component allows you to monitor Java applications running on network devices by requesting one or more JMX attributes.
Memory Utilization Memory Utilization components allows you to monitor the percentage or absolute amount of either physical or virtual memory being utilized on a specific device. In addition to specifying if the component monitors physical or virtual memory, you must also indicate if the component uses SNMP/Virtual or WMI credentials to access the test device.
Network Port Check The Network Port Check component allows you to create a script to run on a specific device that monitors a designated TCP, UDP, or SSL network port. There are a number of options for this component type depending on the communication protocol you want to use to monitor the port:
WhatsUp Gold User Guide
291
Custom Echo
FTP HTTP
HTTPS IMAP4
NNTP POP3
Radius SNMP
Time
Process Check The Process Check component allows you to monitor a process on a specific device using either SNMP or WMI.
Scripting (PowerShell) This component allows you to run a PowerShell script and analyze the output. You may add a PowerShell Execution component to an application profile or an application instance. Windows PowerShell is a scripting language and command-line shell that system administrators can use to manage Windows operating systems. For additional information about PowerShell, please contact Microsoft support.
Important: WhatsUp Gold uses a 32-bit (i.e., x86) PowerShell engine. Therefore, only 32-bit PowerShell snap-ins are supported and 64-bit only snap-ins will not function properly. Snap-ins usable in both 32-bit and 64-bit operating systems are configured for 64-bit systems by default and must be manually configured for 32-bit PowerShell engine to function properly with WhatsUp Gold.
If you are using additional pollers with WhatsUp Gold, PowerShell must be installed and any desired snap-ins must be registered identically on all poller machines for any PowerShell performance monitors, active monitors, and actions to function properly.
Scripting (End User Monitor) This component enables you to monitor the experience of end users for specific web transactions – a series of steps through a web site or application. By continuously replaying your recorded web transactions from anywhere in your network, End User Monitor (EUM) components can let you know when your web sites or applications are down, broken, or slow before your end-users do. Before configuring an End User Monitor component in WhatsUp Gold, you must:
Deploy an iDrone (EUM Poller) which executes the web transaction from anywhere on your network. See Configuring iDrone (EUM Poller) (on page 293).
Use Ipswitch’s iMacros web recording engine to record the web transaction to be monitored. See Using iMacros with End User Monitor components (on page 298).

WhatsUp Gold User Guide
292
End User Monitor components require an iDrone (EUM Poller) registered with WhatsUp Gold. iDrone software installed on a VM is an iDrone virtual appliance, which you can locate anywhere in your network. They replay your recorded web site and application transactions, just as an end user, measuring response times and testing functionality. iDrones are not licensed. You may deploy as many as you like, such as one at headquarters and one at a branch office, to give you multiple perspectives of an application’s performance. For information on installing and configuring iDrone, see Configuring iDrone (EUM Poller) (on page 293).
Ipswitch’s iMacros web recording engine is used to record the web transactions to be monitored by End User Monitor components. Simply perform the web transaction you want to monitor while in recording mode. iMacros will generate an editable iMacros script that defines your transaction. The contents of the iMacros scripts are included in End User Monitor components’ configuration. WhatsUp Gold passes the scripts’ text to iDrones, which replay the macros, just as if an end user was performing the transactions.
About iDrone (EUM Poller) and using EUM Components End User Monitor (EUM) components enable you to monitor the experience of end users for specific web transactions – a series of steps through a web site or application. By continuously replaying your recorded web transactions from anywhere in your network, End User Monitor components let you know when your web sites or applications are down, broken or slow before your end users complain.
There are three pieces to the End User Monitoring architecture:
1 iDrones (EUM Pollers) which execute the web transaction from anywhere on your network, see Configuring iDrone (EUM Poller) (on page 293).
2 Ipswitch’s iMacros web recording engine to record the web transaction to be monitored, See Using iMacros with End User Monitor components (on page 298).
3 WhatsUp Gold’s End User Monitor component configuration to define the polling parameters for monitoring the web transaction, see Scripting (End User Monitor) (on page 291) components.
End User Monitor components require an iDrone (EUM Poller) registered with WhatsUp Gold. iDrone software installed on a VM is an iDrone virtual appliance, which you can locate anywhere in your network. They replay your recorded web site and application transactions, just as an end user, measuring response times and testing functionality. iDrones are not licensed. You may deploy as many as you like, such as one at headquarters and one at a branch office, to give you multiple perspectives of an application’s performance. For information on configuring iDrone, see Configuring iDrone (EUM Poller) (on page 293).
Ipswitch’s iMacros web recording engine is used to record the web transactions to be monitored by End User Monitor components. Simply perform the web transaction you want to monitor while in recording mode. iMacros will generate an editable iMacros script that defines your transaction. The contents of the iMacros scripts are included in End User Monitor components’ configuration. WhatsUp Gold passes the scripts’ text to iDrones, which replay the macros, just as if an end user was performing the transactions. See Using iMacros with End User Monitor components.

WhatsUp Gold User Guide
293
Once you have deployed iDrones as monitoring locations throughout your network and recorded the web transactions you want to monitor with iMacros, you can configure End User Monitor components. Each End User Monitor component monitors one web transaction (iMacros script) from one location (iDrone). Just choose the iDrone to monitor from, paste in the iMacros script content for your recorded transaction and set the rest of the polling parameters as you like, see Scripting (End User Monitor) (on page 291) components.
Configuring iDrone (EUM Poller) Installing the iDrone software converts an empty virtual machine into an iDrone (EUM Poller) virtual appliance. Once configured and registered with WhatsUp Gold, iDrones enable End User Monitor (EUM) components to monitor the performance of your most important web transactions from locations throughout your network. The iDrone software is not licensed. You can deploy multiple iDrone virtual appliances to monitor your end users’ experience from where they are located. Each End User Monitor component can only use one iDrone. To monitor the same web transaction from multiple iDrones, you must configure an End User Monitor component for each iDrone.
Note: You can give multiple iDrones the same iDrone Name. End User Monitor components configured with that iDrone Name use any of the iDrones sharing the name randomly. This configuration can help to scale iDrone’s monitoring or give you transaction monitoring from multiple locations with a single End User Monitor component. You will not be able to know which measurement came from which iDrone.
To prepare for the installation, create a new virtual machine using or VirtualBox and one of the following Guest Operating Systems:VMware
Windows 7
Windows Server 2008 R2 or Windows Server 2012 R2 with the latest updates and all service packs installed (for Win 2008 R2 and Win 2012 R2, you need to enable .NET Framework 3.5)
1 Take a snapshot of your virtual machine configuration. 2 Download (https://community.ipswitch.com/s/article/ka036000000oX4nAAE/Install-
and-Configure-an-EUM-Poller-iDrone-Virtual-Appliance) the iDrone installer onto your new virtual machine.
Important: Ipswitch recommends installing the iDrone on a dedicated VM that is not used for any other purposes.
3 Run the installer and complete the installation process. If prompted, reboot the virtual machine after installation. Once the installation is complete, the iDrone Configuration dialog launches automatically.

WhatsUp Gold User Guide
294
4 At the initial iDrone for WhatsUp APM Welcome tab, click Next.
5 Enter the IP address or host name of the server running WhatsUp Gold, then click
Check to ensure the iDrone can communicate with APM.
Important: If your WhatsUp Gold IIS instance is using a non-standard port, access Application Monitoring Settings (on page 396), then click Auto Detect to update the iDrone Service Manager’s URL. If your WhatsUp Gold server is configured to use SSL only: a. Choose https:// from the list. b. Enter the host name of the machine where WhatsUp Gold is installed. The host name of the WhatsUp Gold server must match the common name (Subject) on the certificate configured on the WhatsUp Gold server. The certificate also needs to be imported into the Trusted Root Certification Authorities store for the local machine where the iDrone is installed. c. In APM Application Settings, click Auto Detect to update the iDrone Service Manager’s URL. Verify the URL starts with https and the host name is exactly the same as the host name you used in the iDrone configuration.

WhatsUp Gold User Guide
295

WhatsUp Gold User Guide
296
6 Enter a name for your iDrone and ensure Add this iDrone to WhatsUp APM is enabled, then click Register.

WhatsUp Gold User Guide
297
7 Select the number of macros that can be run in parallel if desired, then click Save.

WhatsUp Gold User Guide
298
8 To begin monitoring using the iDrone, click Start Operation.
Using iMacros with End User Monitor (EUM) Components Ipswitch’s iMacros web recording engine is used to record the web transactions to be monitored by End User Monitor (EUM) components. It supports WYSIWYG recording of web site and application transactions. Simply perform the web transaction you want to monitor while in recording mode. iMacros generates an editable iMacros script that defines your transaction. iMacros uses these scripts to playback the web transaction. In WhatsUp Gold, iMacros plays back the script on iDrones throughout your network to monitor the performance and verify the functionality of your web sites and applications.
You can record and play back web transactions in the iMacros Browser which is an emulated browser based on Internet Explorer. Or, you can use Internet Explorer and Firefox browsers using the iMacros browser addons. The browser addons are useful if you are concerned about the performance and function of your web transactions in a specific browser. If you don’t have a need to monitor your transactions in a specific browser, use the iMacros browser. For additional information and download, visit the iMacros website (http://www.iMacros.net).
The iMacros Browser Enterprise Edition and Internet Explorer and Firefox browser addons are already installed on the iDrone for you to get started. Once your iDrone is operational, Ipswitch recommends you install iMacros on your desktop for recording or

WhatsUp Gold User Guide
299
editing iMacros scripts. If you would prefer not to install iMacros or license the iMacros browser, you can register another iDrone with WhatsUp Gold just to use for script recording and editing. Please note, End User Monitor components do not currently support the iMacros addon for Chrome.
To create a macro for use with End User Monitor components: 1 Log in to a registered iDrone or install a version of iMacros on your desktop. 2 Launch the Internet Explorer, Firefox or iMacros Browser. If you are using Internet
Explorer or Firefox, click the iMacros icon found in the browser’s Command Bar or to the left of the address window, respectively. You should see the iMacros sidebar once iMacros has been started.
3 Navigate to the URL of the site or application where your web transaction begins. 4 Select the Rec or Recording tab in the iMacros sidebar, then click Record. 5 Perform your transaction. Whenever possible, use mouse clicks instead of
keystrokes. When your transaction is complete, click Stop. iMacros saves the most recently recorded macro in #Current.iim. The macro is now highlighted in the navigation tree in the iMacros sidebar.
6 Navigation to the Play tab, then click Play to view the transaction and confirm it was recorded as intended.
7 Save your macro to another filename so it will not be overwritten with the next recording: a) Select #Current.iim in the navigation tree.
b) Navigate to the Rec or Record tab.
c) Click Save Macro As.
d) Enter a new filename and location as desired. 8 To see the script text of the macro, make sure the correct file is highlighted in the
navigation tree. 9 Navigate to the Manage tab, then click Edit Macro to launch the iMacros Editor. 10 Edit your scripts as needed. 11 Copy the script content to your clipboard. 12 Return to the End User Monitor component you are configuring, then paste the
script content into the Script Text field.
Service Check The Service Check component allows you to monitor a service on a specific device using either SNMP or WMI credentials.
SNMP The SNMP Check component allows you to use SNMP credentials to monitor a specific application instance running on a device.

WhatsUp Gold User Guide
300
SSH The SSH component allows you to run a command on a specific device and analyze the output. You can configure the SSH component as either an active monitor check or a performance monitor check.
WMI The WMI component allows you to use Windows credentials to monitor either formatted or raw data for a specific application instance.
Windows Performance Counter The Windows Performance Counter component enables data collection from performance counters exposed by various Windows applications. This monitor requires Windows credentials on the device for which you want to monitor Windows applications. Additionally, devices for which you want to monitor Windows applications must have the Remote Procedure Call and Remote Registry services enabled and running.
You can utilize the Windows Performance Monitor tool available from the Windows Start menu. Click Start, type perfmon.exe, and then press Enter to view available Windows performance counters on Windows devices.
Working with Discrete Applications A discrete application is an application upon which a complex application has a dependency. For example, IIS and SQL Server are discrete applications on which the complex application WhatsUp Gold is dependent. A discrete application is used when you are monitoring a complex application. You may add a discrete application to an application profile or add a discrete application to an application instance as a component.
Note: Adding a discrete application to an application profile helps build the foundation of the profile, but does not add the discrete application to an application instance.
To add a discrete application to an application profile: 1 Select the application profile for which you want to add a critical component group,
then click Edit/View Application Profile. The Components list appears. 2 In the Components section, click Add application, then select an application
profile type from the list. The discrete application appears in the Components section.
3 Enter a unique name and description if desired for the discrete application, then indicate if the application is critical.
4 Click Save.

WhatsUp Gold User Guide
301
To add a discrete application to an application instance: 1 Create an application instance from an existing application profile. 2 In the Components section, click Add application, then select an application. The
discrete application appears in the Components section. 3 Select the application instance to be monitored for the component along with the
desired action policy. 4 Ensure the discrete application is enabled and specify if WhatsUp Gold should
consider it as critical. 5 Click Save.
About Action Policies, Actions, and Blackout Policies and WhatsUp Gold Application Monitoring
WhatsUp Gold allows you to configure action policies that can be applied to application instances and components you are monitoring. An action policy determines actions to take when an application instance or component transitions from one state to another. The transition to states are up, down, warning, and maintenance. You must create one or more actions before creating an action policy. You may also apply a blackout policy to the action policy. The blackout policy determines when to apply the action policy and when it should be ignored due to routine activities, such as maintenance periods. Please note, all applications and systems monitored should have their system clocks synchronized so that actions and policies work correctly according to the settings and scheduled actions.
To begin configuring action policies, individual actions, as well as associated blackout schedules specific to application monitoring, select SETTINGS > Application Monitoring > Application Monitoring Actions and Policies. While configurations using this interface are saved and maintained separately from actions and policies applicable to monitored devices, the controls and procedures for creating and managing them are the same. Once created, you can assign action policies to application instances or individual components within an instance.
To assign an action policy to a single application instance or component: 1 Select the application profile for which you want to add an action policy in the
navigation tree. 2 Select the component within the profile or the specific application instance for
which you want to add an action policy, then click Edit Application Profile. 3 Select the action policy you want to apply. If you select from the Action Policy list
for the instance, the action policy is applied to every component within the instance. If you select from the Action Policy list for an individual expanded component in the Components section below, the action policy is only applied to that component.
4 Click Save.

WhatsUp Gold User Guide
302
To assign an action policy to multiple application instances or components: 1 Select an application profile from the Application Profiles navigation tree if you
want to apply an action policy to multiple instances of an application. OR Select an application instance from the Application Profiles navigation tree if you want to apply an action policy to specific components within an individual instance.
2 Use the selection boxes at left to choose specific application instances or components. Whether you select instances or components depends upon your selection from the Application Profile navigation tree in the previous step.
3 Select For selected > Assign Action Policy and then choose the action policy you want to apply.
4 Click Save.
Note: If you select All Application Profiles from the top level of the Application Profiles navigation tree, you also have the ability to apply action policies to multiple application profiles as once using the same methods described here. However, assigning action policies to application profiles only serves to modify the profiles’ settings in the event an instance is created using that profile in the future.
Working with Application Monitoring Action Policies Action policies enable you to determine the actions you would like the system to perform when an instance or component transitions from one state to another. The state transition rules evaluate whether to permit the associated action to fire based on the amount of time the source was in a previous state. The action rules determine which action to fire, how long to wait in the target state before firing the action, and which blackout policy to apply. The blackout policy prohibits an action from firing during defined periods of time when activities such as server maintenance generate large numbers of actions that are not of interest.
To create an action policy: 1 Select SETTINGS > Application Monitoring > Application Monitoring Actions
and Policies, then click Action Policies. 2 Click to launch the action policy configuration (on page 302) interface. 3 Configure the action policy as needed, then click Save. For additional information
on configuration options, refer to the applicable action-specific topic referenced previously.
You can also click to edit an existing action or to delete the selected action from Application Monitoring.
Configuring an Application Monitoring Action Policy Configure the following settings to create an action policy for monitoring applications using WhatsUp Gold.
WhatsUp Gold User Guide
303
Sources The Sources area displays the application instances to which the application policy is applied.
State Transition Rules State transition rules use the time in the previous state (state transition criteria) to evaluate whether to perform an associated action for each state transition type (Up to Down, Maintenance to Down, Warning to Down, Up to Unknown, etc.). If the source was in the previous state for the amount of time stated in the rule prior to transitioning to the current state, the action defined in the Action Rules section is performed. Using state transition criteria can help reduce the number of state transitions that cause an action to fire by ignoring state transitions that are short lived or intermittent.
For example, you can create a state transition rule that performs an email action when the source goes to the Down state (target current state) from the Up state (previous state) and had been in the Up state for at least 5 minutes prior to entering the Down state (state transition criteria). This state transition rule does not cause the action to fire for state transitions where the source was in the Down state for less than 5 minutes.
The state transition rules may be defined for the following current states, each represented by a separate tab:
Up. Designate the state transition rules for each event going to the Up state from Down, Maintenance, Warning, or Unknown.
Down. Designate the state transition rules for each event going to the Down state from Maintenance, Up, Warning, or Unknown.
Warning. Designate the state transition rules for each event going to the Warning state from Down, Maintenance, Up, or Unknown.
Maintenance. Designate the state transition rules for each event going to the Maintenance state from Down, Up, Warning, or Unknown.
Action Rules The Action Rules section allows you to designate the actions that occur when a State Transition Rule for the target current state is met. For example, you may assign the email action to occur when the source goes into the Up state from the Down state and remains in the up state for 5 minutes, after meeting the state transition rule of having been in the Down state for at least 10 minutes before transitioning to the Up state.
To create a new action policy: 1 Click the APM tab, then select Actions. The Action Policies page appears. 2 Click Add Action Policy. The Edit Action Policy page appears. 3 Enter a unique Name for the Action Policy. 4 Select the Up tab and create the state transition and action rules for the Up state. 5 Select the Down tab and create the state transition and action rules for the Down
state. 6 Select the Warning tab and create the state transition and action rules for the
Warning state.

WhatsUp Gold User Guide
304
7 Select the Maintenance tab and create the state transition and action rules for the Maintenance state.
8 Click Save or Save and Close. The Action Policy is added to the Action Policies list on the Action Policies screen.
To create the state transition and action rules for transitions to the Up state: 1 If the associated actions are to be triggered from the Down to Up transition, select
Down and enter the minimum amount of time the source must have been in the Down state prior to the transition.
2 If the associated actions are to be triggered from the Maintenance to Up transition, select Maintenance and enter the minimum amount of time the source must have been in the Maintenance state prior to the transition.
3 If the action is to be triggered by a transition from the Warning to Up transition, select Warning and enter the minimum amount of time the source must have been in the Warning state prior to the transition.
4 If the action is to be triggered by a transition from the Unknown to Up transition, select Unknown and enter the minimum amount of time the source must have been in the Unknown state prior to the transition.
5 Create the action rules to be associated with transitions to the Up state. a) Click Add action rule. The Action rule dialog controls appear.
b) Select an Action from the list of currently configure actions. If the list is empty, click Create new action to configure a new action for the policy.
c) Enter the number of minutes to wait after entering the Up state before firing the action in the Fire after (minutes) box.
d) Select the Blackout policy you want to apply to the action. If the list is empty, click Create new blackout policy to configure a new blackout policy for the action policy.
e) Click Save. The action is added to the Actions list. 6 When you have completed configuring the policy, click Save and Close.
Working with Application Monitoring Actions Application Monitoring Actions work much like actions configured for devices. The following action types are available for monitoring applications:
Active Script (on page 191)
Email (on page 197) Log To File (on page 197)
PowerShell Script (on page 200)
Program (on page 201)
Service Restart (on page 202)
SMS (on page 202) SMS Direct (on page 203)
SSH (on page 206) Syslog (on page 207) VMWare (on page 208)
Windows Event Log (on page 210)
To create an individual action: 1 Select SETTINGS > Application Monitoring > Application Monitoring Actions
and Policies, then click Actions. 2 Click , then select the type of action you want to create from the menu.

WhatsUp Gold User Guide
305
3 Configure the action as needed, then click Save. For additional information on configuration options, refer to the applicable action-specific topic referenced previously.
You can also click to edit an existing action or to delete the selected action from Application Monitoring.
Working with Application Monitoring Blackout Policies Application Monitoring blackout policies allow you to designate specific days of the week and times that WhatsUp Gold does not alert you on the health of monitored components. For example, you may not want to receive alerts on the weekend in which case you would create a blackout policy including blackout times from 12:00 a.m. Saturday to 12:00 a.m. Monday.
To create an individual action: 1 Select SETTINGS > Application Monitoring > Application Monitoring Actions
and Policies, then click Blackout Policies. 2 Click to launch the New Blackout Policy dialog. 3 Enter a Name and Description for the policy, then use the date/time grid to specify
when the blackout policy will be in effect. See On call rotation (on page 941) for an example of how the blackout policy interface can be used.
4 Click Save.
You can also click to edit an existing blackout policy or to delete the selected blackout policy from Application Monitoring.
Working with Application Attributes Attributes are used to specify identifying information about an application. Just as attributes can be created for and applied to devices, they can also be created for and applied to application profiles. Application attributes can be used when configuring components and actions. They can also be applied to individual application instances without changing the parent application profile. When instances are created from an application profile, any attributes applied to that profile are inherited by the instance. However, inherited attributes can be overridden if desired.
To add an attribute to an application profile: 1 Select All Application Profiles or any application profile type displayed in the
application monitoring tree, then click Add Application Profile. Or, select an existing editable application profile, then click Edit Application Profile.
Tip: You can also create a new application profile using an existing application profile as a template by clicking Edit a Copy.
2 Expand the Details configuration table to the right of Attributes.

WhatsUp Gold User Guide
306
3 Click Add attribute, then select an attribute from the list. Please note, you can add global attribute names to WhatsUp Gold using the Application Monitoring Settings (on page 396) dialog which will appear in the dropdown list. This prevents you from having to enter duplicate attribute names when different values are needed.
4 Enter a Value for the new attribute. If you selected Create new attribute from the list, enter a Name for the attribute as well.
5 Click Save.
Important: When an attribute is applied to an application profile, it is automatically included when that profile is imported into or exported from WhatsUp Gold by another end-user.
After an attribute has been created and has an assigned value, it is available for use and can easily be applied when configuring actions or components using percent variables (on page 851). When added to actions, attributes automatically populate their assigned values in message content. When added to component definitions, attributes are used to poll components and test functionality.
Please note, when using application attributes when configuring components:
Application attribute values are resolved when you initiate the Test feature so the correct component settings are sent.
Application attribute values are resolved when polling components that use them.
If an inherited application attribute value is overridden at instance level, that value is used during polling.
Global attribute names may not contain spaces.
307
CHAPTER 9
Configuration Management In This Chapter CM System Overview ........................................................... 308
Using Task Scripts ................................................................ 309
Using Tasks .......................................................................... 314
Using Device Properties ....................................................... 318
Using Policies ....................................................................... 321
Using Configuration Management Templates ....................... 324
Leveraging and Customizing System Scripts ........................ 328
Managing CLI and Remote Shell Settings............................. 332
Archive Search ..................................................................... 337
Using the Configuration Management VLAN Manager .......... 341
Setting Log Expiration ........................................................... 345
Configuration Management (formerly known as "WhatsConfigured") enables automated management, compliance, and periodic auditing of device configurations —the most critical aspect of your network and application infrastructure. Leveraging configuration templates, archives, and automated management tasks provided by CM libraries and visibly tracked with WhatsUp Gold dashboards, reporting, and logging (on page 410) yields better network performance, frees valuable time, and provides transparency to your stakeholders.
Important: For the latest command syntax, usage, and script examples see the Configuration Management Custom Script Language
(http://www.whatsupgold.com/WCfg31CustScriptLangforWUG165) guide.
WhatsUp Gold Configuration Management framework and toolboxes enable you to:
Apply policies and alerts that minimize both risk and possibility of misconfiguration.
Ensure optimal performance and utilization of application, storage, and compute resources.
Reduce risk of service interruptions and outages. Schedule and get 'on-demand' reporting, which reveals critical facets of device
configuration and policy compliance.
WhatsUp Gold User Guide
308
Mitigate the impact of incidents and instrumenting automated tasks for incident recovery.
WhatsUp Gold Configuration Management provides the following:
Archive Management (on page 337). Search, browse, and manage device configurations centrally.
CLI Settings Library (on page 332). Add, store, reuse CLI session settings. Task Script Library (on page 309). Build a library of frequently used script
snippets. Task Library (on page 314). Schedule and run scripts as tasks on managed
devices. Configuration Policy Library (on page 321). Bundle CM tasks to implement a
specific policy. Configuration Template Library (on page 324). Align configurations with
templates and percent variables. VLAN Manager (on page 341). Manage and standardize virtual LAN
configurations.
CM System Overview Configuration Management is built around an automated task execution engine that allows network managers to dynamically gather configuration data about their network devices through configuration tasks. These tasks can be scheduled to run on a regular basis or can be manually invoked as needed to upload, download, and backup configuration files, manage device credentials, and much more.
Configuration Management comes with several pre-defined configuration tasks with the option to create custom tasks. Additionally, Configuration Management works with the Network Performance Monitor Alert Center and can alert you on the success or failure of a task, or when changes are detected on a device.
With support for heterogeneous networks, Configuration Management provides secure SNMP, SSH and Telnet, SNMPv1, SNMPv2 or TFTP access, to download and store device configuration files in an independently secured repository, keeping them readily available for file compares and restoration on a device.
Configuration Management not only reduces the time and effort required to maintain device configurations and changes while providing increased security, compliance, and visibility, it also reduces the risk of costly network downtime.

WhatsUp Gold User Guide
309
Using Task Scripts Configuration Management Task Script Library (SETTINGS menu > Configuration Management > Task Script Library) displays all scripts currently configured and able to be invoked from Configuration Management tasks.
Task scripts login to devices through SSH or Telnet and run command-line interface (CLI) commands on devices. These tasks can perform a number of operations, such as restoring or backing up a running or startup configuration, or changing an application password.
Configuration Management Task Script Library enables you to:
Create and edit custom scripts you can embed in tasks (on page 310). Run Now (on page 313). Run scripts stand-alone (without a scheduled task) on
a device or device group, check failure/success and run failed scripts in debugger.
Debug (on page 311). Run a script in the debugger, view credential and CLI settings, step through commands, and see log, trace, and results.
Import and export Task Scripts (on page 311). Use built-in scripts to backup device configuration (on page 309).
Script examples Configuration Management comes with two pre-configured task scripts. You can also configure your own custom task scripts using the Configuration Management Custom Script Language (http://www.whatsupgold.com/WCfg31CustScriptLang) .
Example
This script example shows the current running configuration of the selected device.
@login @enable [running-config] show run [-] exit
Note: Manufacturer-specific delimiters and keywords are visible when debugging (on page 311) and handled through settings in the CLI Settings Library (on page 332).
Using the Configuration Management Task Script Library The following configuration scripts are shipped with Configuration Management.
Backup Running Config Backup Startup Config
Backup Running Config

WhatsUp Gold User Guide
310
The backup running config task script makes a backup copy of a device's running config and stores it in the Configuration Management database. After you have made a backup copy of a running config, you can restore it on the device at any time for as long as the copy is stored in the database.
Backup Startup Config
The backup startup config task script makes a backup copy of a device's startup config and stores it in the Configuration Management database. After you have made a backup copy of a startup config, you can restore it on the device at any time for as long as the copy is stored in the database.
Tip: You can set the number of maximum configuration files to store in Configuration Management database on the New Configuration Management Task dialog's Schedule tab.
Creating and Editing a Task Script Use the Task Script dialog to create or edit a Configuration Management task script. Task scripts are used in Configuration Management scheduled tasks.
To configure a Task Script: 1 Go to the Task Script Library (SETTINGS menu > Configuration Management >
Task Script Library). The Task Script Library displays.
To create a new custom task script, click 'add' ( ).
- or -
To modify an existing custom script, select the appropriate script, then click 'edit' ( ).
2 In the Task Script dialog, enter the appropriate information into its boxes. Name. The script name will display in the Task Script Library.
Description. Optional description.
Script. Enter or paste the script syntax for the task you want Configuration Management to apply.
3 Click OK to save changes.
Configuring Custom Task Scripts In addition to the pre-configured task scripts included in Configuration Management, you can configure custom task scripts that either configure devices or gather device data and store it in the Network Performance Monitor database. These tasks are configured using the Configuration Management Custom Script Language, a combination of Configuration Management and device commands

WhatsUp Gold User Guide
311
Importing and Exporting Task Scripts You can import scripts written outside of Configuration Management into Configuration Management to be used in tasks.
To import a custom script for use in a Configuration Management task: 1 Click Import from the Task Script Library (SETTINGS menu > Configuration
Management > Task Script Library). The Import Configuration Scripts dialog displays.
2 Browse to the script file that you want to import. 3 Click OK to import the selected script file.
To export a custom task script: 1 Select the custom script you want to export, then click Export from the Task Script
Library (SETTINGS menu > Configuration Management > Task Script Library). 2 You can inspect and modify the script, share, and re-import at a later time.
Note: Configuration Management default scripts cannot be exported.
Debugging Task Scripts Use Debug to:
Interactively write, run, and test script command syntax for a specific device. Test, tweak, and save CLI Settings (on page 333). Step through a sequence of script commands (and for failed tasks, view partial
results).

WhatsUp Gold User Guide
312
Troubleshoot.
Using the task script debugger After a failed run, you can interactively run, fix, and Save changes using the Task Script Debugger.
Item Description
Device selector.
Connection protocol and credentials. These are determined by the Remote Client Settings (on page 336).
View and change CLI settings (on page 332) between runs.
Script body.
Debug controls and script command sequence.

WhatsUp Gold User Guide
313
View terminal interaction and detailed (verbose) trace information.
Save changes to your script or the current CLI profile used (or both).
Tip: Edited fields display a red pencil icon ( ).
Run Now Using Run Now, you can apply Task Scripts and view task success/failure indicators and output for:
A single device. Batches of selected devices. Entire device groups.
Tip: If a Task Script fails, use the Task Script Debugger (on page 311) to view partial results, step through commands, and troubleshoot.
Viewing task results and runtime properties After a run, you can view and Save the following information and settings:
Output. Task status, status description, and full terminal capture. Script. Script body/payload. Variables. Name value/pairs and CLI profile settings available to the script. Commands. Command sequence, result status, and output. Log. Output redirected to logs.

WhatsUp Gold User Guide
314
Settings. Remote execution settings and credentials.
Using Tasks Task Library (on page 314) (SETTINGS menu > Configuration Management > Task Library) enables you to create tasks to be run on managed devices. Tasks enable you to apply controls, perform maintenance, and simulate user behavior, based on your site policies and goals.
Task Library (on page 314) enables the following:
Managing Tasks (on page 314). Associating Devices (on page 317). Scheduling Tasks (on page 315). Launching a Single Task (on page 318).
Typical Tasks A typical task might be:
Check for lock, write permissions, or integrity (MD5 sum, for example) of a critical file.
Query a license server or match a string pattern (regex) on a license file. Run scans on configuration directories for non-compliant files. Run system commands on devices to validate kernel and software versioning. Custom shell commands, scripts, and much more...
Task Library The Configuration Management Task Library (SETTINGS menu > Configuration Management > Task Library) lists tasks configured for use in Configuration Management.
Configuration Management Task Library provides the following features:
Add. Create a new scheduled (on page 315) or password (on page 315) task.
Edit. Modify an existing task.
Copy. Clone an existing task profile.
Delete. Remove a task record from the Network Performance Monitor Task Library.
Run Now (on page 318). Run selected task on devices that use it.

WhatsUp Gold User Guide
315
Configuring Password Tasks Password tasks configured from the Task Library (on page 314) enable you to add, edit, or delete device SNMP, SSH, or Telnet credentials.
Note: Password tasks only modify credentials by device. Changes made using a Configuration Management password task do not affect the Credential Library.
To add, edit, or remove SNMP, SSH, or Telnet credentials: 1 Go to the CM Task Library (on page 314) (SETTINGS menu > Configuration
Management > Task Library). Configuration Management Task Library displays.
2 Click 'add' ( ) and select New Password Task. New Password Task dialog displays.
3 Configure the following: Name. Name of the task.
Description. Description also listed in the Task Library view.
4 Under the Devices box, click 'add' ( ) to select the device(s) to which you want to add the credentials. - or - If removing credentials from a device, select the device(s) in the Devices box, then select Remove, to remove selected credentials from the device.
5 Credential Type. Select the credential type that you want to add, either SNMP, SSH, or Telnet.
6 Select an Action. Add/Remove/Modify the credential. 7 Select a Credential Name. Select a credential to apply the action to. 8 Associate this credential with discovered devices. Selecting this option adds
the set of credentials to the selected devices.
Note: If you are using HP ProCurve series devices, you must select to Add Credential first, then select the Add this credential with read only privileges box to remove the Operator credential password or you must clear the Add this credential with read only privileges box to remove the Manager credential password. The SNMP credential type only allows Manager credentials and the SSH and Telnet credential types allow both Manager and Operator credential types.
9 Click OK to save changes.
Configuring Schedulable Tasks Use the New/Edit Configuration Management Task dialog to configure a task to run on a daily, weekly, monthly, yearly, or custom schedule.
To access this dialog: 1 From Task Library (on page 314), click 'new' ( ) and then select Schedule.
WhatsUp Gold User Guide
316
2 The New Schedule Task dialog displays. 3 Configure the following: Enter a Name for the scheduled task. This name is listed in the Configuration
Management Task Library.
Enter a brief Description for the scheduled task.
Select the Task Script that you want performed on the schedule you specify. Click Add Script to create a new custom task script. For more information, see Configuring custom task scripts (on page 310).
Select Save a copy of configuration to, to save Configuration Management task configuration information to a text file in a selected folder each time the scheduled task completes successfully. A separate file is created for each configuration key defined in the scheduled tasks script.
Note: If you select to save copies of configurations, be aware that new files are created/saved only when Configuration Management detects a change in the configuration.
Devices Tab
Use the Devices tab to select the device(s) to which you want to apply the task.
To apply the task to a device, click 'add' ( ). Select a Device dialog displays.
To remove a device from the task, select a device from the list, then click 'remove' ( ).
Threshold Tab
Use the Threshold tab to configure an Alert Center threshold to notify you on the scheduled task.
Select Enable this threshold to enable and configure the threshold options.
Enter a Name for the threshold. This name is displayed in the Network Performance Monitor Alert Center Threshold Library.
Select to have the Threshold alert if the task matches any of the selected conditions:
Detects configuration changes on a device Fails to run for a device
Successfully runs for a device
Fails this policy
Note: If you do not see the appropriate policy, or if the list is empty, browse (...) to the Policy Library to configure a new policy.
Select the Notification policy you would like Alert Center to use to notify you when the threshold is met. If the list is empty or you want to configure a new notification policy, browse (...) to the Alert Center Notification Policy Library.

WhatsUp Gold User Guide
317
Optionally, click to select Email Configuration Changes to have an email sent to the email address specified in the notification policy. If you do not select this option, Configuration Management threshold information displayed in Alert Center reports may be clipped.
Note: To email configuration changes, you must have a notification policy with an email action set, and you must select Detects configuration changes on a device threshold option.
Schedule Tab
Use the Schedule tab to configure the schedule on which you would like the task performed. You can configure the task to run daily, weekly, monthly, yearly, or on a custom schedule. You can also specify if this task can be run on demand, outside of the schedule you configure.
Select Enable this schedule to begin configuring the task's schedule.
Run this task
Select the type of schedule you are configuring, then configure its schedule. For more information, see Configuring task schedules.
Select the duration to save backups
At the bottom of the dialog, select either:
Keep up to ___ configuration backups
- or -
Do not limit the number of configuration backups
If you select the first option, specify the appropriate number of backup configuration files that Configuration Management should store for each device to which task is assigned. The default number of backup configuration files saved per device is 5.
Assigning a Task to a Device Tasks are assigned to individual devices from either the Device Properties - Tasks dialog or when configuring the task in the Task Library.
To assign a task to a device from Device Properties:
1 Select a device on the My Network map or the collapsible device grid. Device Card displays.
2 On the Device Card, click Device Properties ( ) and then click the Tasks tab. Configuration Management section displays.
3 Under Configuration Management tasks attached to this device, click 'add' ( ).

WhatsUp Gold User Guide
318
The Add Task to Device dialog displays. 4 Select the task that you want to assign to the device, then click OK. If the list is
empty, or you do not see the task you want to assign, browse (...) to the Configuration Management Task Library to configure a new task.
Running a Task Immediately To run a task immediately from the Task Library: 1 From the Task Library (on page 314), select the scheduled task that you would like
to run. 2 Click on Run Now.
The task runs in the background. Review task results in the Task Log report.
Using Device Properties Using the Configuration Management section of Device Properties (on page 318), you can:
View and access Configuration Management tasks and archived configuration files.
Associate Configuration Management tasks with the selected device. Run a task immediately. Restore a device to a previously archived configuration file. Add, delete, modify, export, and import configuration files.
Tip: In order to view, manage, and export configuration archives (files), your WhatsUp Gold user must have Manage Configuration Management Tasks and Manage Devices Permissions. For more information, see the topic titled Administering Users and User Groups (on page 406).
Viewing Configuration Management in Device Properties To access the Configuration Management panel in Device Properties: 1 Go to My Network map and select a device.
The Device Card displays for the selected device. 2 Click Properties ( ) and from Device Properties (on page 86) click the
Configuration Management tab. The Configuration Management section of Device Properties (on page 86) displays.

WhatsUp Gold User Guide
319
Associating Tasks with Devices Use the Add Task to Device to add tasks to add to the device for which you are viewing properties.
To associate a task with a device:
1 Select a device on the My Network map or the collapsible device grid. Device Card displays.
2 On the Device Card, click Device Properties ( ) and then click the Tasks tab. Configuration Management section displays.
3 On the Tasks Using This Device section of Device Properties, click 'add' ( ). Add Task to Device dialog displays.
4 Select an existing Task from your Task Library, and click OK. The task is now available for you to run in the Configuration Management Task Library.
Viewing Archived Configuration Files To view an archived configuration file for a device:
1 Select a device on the My Network map or the collapsible device grid. Device Card displays.
2 On the Device Card, click Device Properties ( ) and then click the Tasks tab. Configuration Management section displays.
3 Under Archives saved for this device, select two configuration files, then click Edit/View. The Edit/View Configuration Archive dialog displays.
Comparing Archived Configuration Files To compare two device config files:
1 Select a device on the My Network map or the collapsible device grid. Device Card displays.
2 On the Device Card, click Device Properties ( ) and then click the Tasks tab. Configuration Management section displays.
3 From the Archives Saved for this Device section of Device Properties, select two configurations and click Compare. Configuration Management Diff Viewer displays.

WhatsUp Gold User Guide
320
Modifying Archived Configuration Files To edit an archived configuration file for a device:
1 Select a device on the My Network map or the collapsible device grid. Device Card displays.
2 On the Device Card, click Device Properties ( ) and then click the Tasks tab. Configuration Management section displays.
3 Under Archives saved for this device, select an archived config file, then click 'edit' ( ). The Edit/View Configuration Archive dialog displays.
4 You can modify all dialog boxes except for the Time Stamp. 5 Click OK to save changes.
Importing Archived Configuration Files Use the Import Configuration Management Archives dialog to browse to configuration files to import into Configuration Management.
To import configuration files:
1 Select a device on the My Network map or the collapsible device grid. Device Card displays.
2 On the Device Card, click Device Properties ( ) and then click the Tasks tab. Configuration Management section displays.
3 In the Archives saved for this device section, click Import Archives. The Import Configuration Management Archives dialog displays.
4 Browse to the configuration file you want to import, then click OK.
Exporting Archived Configuration Files To export an archived configuration file:
1 Select a device on the My Network map or the collapsible device grid. Device Card displays.
2 On the Device Card, click Device Properties ( ) and then click the Tasks tab. Configuration Management section displays.
3 Click Export. The file is downloaded.
Removing Tasks from Devices To remove a task from a device:
1 Select a device on the My Network map or the collapsible device grid.

WhatsUp Gold User Guide
321
The Device Properties panel displays. 2 Click on the Configuration Management tab.
The Configuration Management section displays.
3 Select on or more tasks and then click 'delete' ( ).
Restoring Archived Configurations To restore a device to an archived configuration: 1 In the Device List or Map View, right-click a device, then click Properties. The
Device Properties dialog displays. 2 Click Tasks. The Tasks section of Device Properties displays. 3 Under Configuration archives saved for this device, select a configuration, then
click Restore to restore the device to the selected configuration.
Deleting Archived Configuration Files To delete an archived configuration file from a device:
1 Select a device on the My Network map or the collapsible device grid. Device Card displays.
2 On the Device Card, click Device Properties ( ) and then click the Tasks tab. Configuration Management section displays.
3 In the Archives saved for this device section, select an archived config file, then click 'delete' ( ).
Using Policies Configuration Management policies (SETTINGS menu > Configuration Management > Policy Library) search through archived configuration files for strings that are either expected or not expected within the file(s).
Manage/Configure a Policy (on page 322). Configuration Management Policy Library operations (on page 321).
Tip: Policies can be added to Alert Center Task Thresholds (on page 258). When a scheduled task fails a policy, any associated notification policies alert you that the policy has failed due to unexpected content that has been flagged in an archived config file.
Configuration Management Policy Library Configuration Management Policy Library (SETTINGS menu > Configuration Management > Policy Library) displays all policies currently configured for use with

WhatsUp Gold User Guide
322
Configuration Management archive configuration (on page 337) files by name, description, and type (either system, pre-defined policies, or user-defined policies).
Use the Configuration Management Policy Library to configure new or existing policies.
Click 'add' ( ) to create a new policy.
Select a policy, click 'edit' ( ) to modify.
Select a policy, then click 'copy' ( ) duplicate a policy.
Select a policy, then click 'delete' ( ) remove it from the library.
Select a policy then click Audit Now to audit (test) a policy.
Click Import to add a previously configured policy to the Policy Library.
Click Export to save the policy as an .xml file to another location.
For more information, see Configuring a policy (on page 322).
Configuring a Configuration Management policy Use the Configuration Policy dialog to configure a Configuration Management Policy.
To configure a Configuration Management Policy: 1 From the CM Policy Library (SETTINGS menu > Configuration Management >
Policy Library).
Click 'add' ( ). The Configuration Management Policy dialog displays.
- or -
Select an existing policy, then click 'edit' ( ). The Configuration Management Policy dialog displays.
2 Enter a Name for the policy. This name is displayed in the Configuration Management Policy Library.
3 Enter a short Description for the policy. This description is displayed next to the policy's name in the Configuration Management Policy Library.
4 In the following sections of the dialog, you have the opportunity to specify strings that you either expect or do not expect to see within the configuration files the policy audits. You can choose to enter only include patters, only exclude patterns, or both.
Note: The more restrictive the audit criteria, the less audit results you may obtain as a result.
5 Under the Include Patterns section of the dialog, click 'add' ( ) to enter a string Pattern that you expect to see in the archived configuration files. RegEx. Select if you want the string to be interpreted as a Regular Expression.
Ignore Case. Match upper and lowercase characters.

WhatsUp Gold User Guide
323
Description. Optional notes to describe the include pattern.
6 Under the Exclude Patterns section of the dialog, click 'add' ( ) to enter a string Pattern that you do not expect to see in the archived configuration files. RegEx. Select if you want the string to be interpreted as a Regular Expression.
Ignore Case. Match upper and lowercase characters.
Description. Optional notes to describe the include pattern. 7 Click OK to save changes.
Auditing a policy To audit a Configuration Management policy: 1 Go to the Policy Library (SETTINGS menu > Configuration Management >
Policy Library). The Policy Library displays.
2 Select a policy, then click Audit Now. The Configuration Management Policy Audit dialog displays.
3 Under the Audit Criteria section of the dialog, click Add to select the device(s) against which to audit the policy.
4 Select the Archive Key of the configuration files for which the policy will be audited. For example, to view audit results for running config archives, select the running-config key from the list. This list is populated with all of the keys from the configuration files archived for the selected device(s). To view all possible archives, select All.
Tip: To limit audit results to a device's most recently archived configuration file for a particular key, select Latest Archive Only.
5 After you have specified the appropriate audit criteria, click Audit to verify the policy. Results from the audit are displayed in the Audit Results section of the dialog: The either successful or failed Audit Result. The Device Name of the device by which the policy was audited.
Any relevant Message regarding the policy audit. For example, the number of archives that failed against the policy.
Tip: Select an audit result, then click View to see the details for that result.
6 Click Close to exit the dialog.
Viewing Archive Policy Audit Results The Archive Policy Audit dialog displays the results of a Configuration Management policy audit.

WhatsUp Gold User Guide
324
Archives
The following information is displayed for each archive found as a result of the policy audit:
The successful or failed Audit Result. The specific Archive config file and the time it was created.
Any relevant Message regarding the policy audit.
Audit Results
The following information is displayed for any Include Patterns or Exclude Patterns.
The audit Result of the pattern.
The specific Pattern selected in the policy configuration.
If the pattern was interpreted as a regular expression (RegEx).
Whether the pattern's case was relevant to the audit results (Ignore Case).
Pattern Matches
Any matches found during the audit are displayed in the bottom section of the dialog.
Tip: Use the forward and backward buttons to navigate through the matches.
Button Description
Moves one match forward
Moves one match backward
Moves to the first match
Moves to the last match
Using Configuration Management Templates Configuration Management Template Library (on page 327) (SETTINGS menu > Configuration Management > Template Library) enables you to standardize and reuse template device configurations. You can embed templates with tokens that use a variable syntax grammar (http://www.whatsupgold.com/WCfg31CustScriptLang) to ensure alignment of device configurations throughout your application, enterprise, or network-wide infrastructure.
The variable syntax (http://www.whatsupgold.com/WCfg31CustScriptLang) enables you to apply device-specific (IP address, hostname) information, save time, and reduce the possibility of incidents or errors occurring on production systems due to mis-alignment or restart with non-standard configurations.

WhatsUp Gold User Guide
325
Note: There are no default, pre-configured templates. This topic outlines the steps for creating templates and generating configurations from your managed devices.
Template library enables the following:
Capture and add (on page 325) device configurations to the library. Apply templates to devices (on page 326). Import and Export templates (on page 326). Delete, copy, and manage template records (on page 327).
Capture and Add Templates The first step in using templates is configuring the template script. After you configure a template, it will then need to be generated and applied to your network devices. For more information, see Generating and applying templates.
To configure a new template: 1 From the Template Library (on page 327) (SETTINGS menu > Configuration
Management > Template Library), click 'add' ( ). New Configuration Template dialog displays.
2 Enter a Name and Description. 3 Click Capture.
Select Configuration Archive dialog displays. 4 Click Select Device to select a device from which to choose the config file upon
which you are basing this template. If the device you select has archived config files, they are displayed in the Select Config Archive dialog. If there are no archived config files for the device, click Capture to grab a config file with the Select Configuration dialog. After you capture a config, it is displayed in the Select Configuration Archive dialog.
5 Select the archive upon which you want to base the template. The config script is added to the Template section of the New Configuration Template dialog.
6 Adjust the config file as needed to replace any relevant device-specific information with variables, such as the hostname and the IP address. For information on variables in Configuration Management, see the Configuration Management for Network Performance Monitor v.17.0 Custom Script Language Guide (http://www.whatsupgold.com/WCfg31CustScriptLangforWUG162).
7 Click OK to save the template.
To modify an existing template: 1 From the Template Library (on page 327) (SETTINGS menu > Configuration
Management > Template Library), select an existing template, then click 'edit' ( ).

WhatsUp Gold User Guide
326
Edit Configuration Template dialog displays. 2 Modify the Description as needed.
Note: You cannot modify the template Name.
3 Modify the Template script as needed. For information on Configuration Management variables you can use to replace device specific information, such as hostname and IP address, see Using the Configuration Management Custom Script Language (http://www.whatsupgold.com/WCfg31CustScriptLang).
4 Click OK to save the template.
Generating and Applying Templates After you configure a template, you can generate the template for specific devices to ensure that the script is properly configured to be pushed to the device(s).
To generate and apply a template: 1 Go to the Template Library (SETTINGS menu > Configuration Management >
Template Library). Template Library displays.
2 Select the template you want to verify, then click Generate. The Configuration Template Artifacts dialog displays.
3 Click Add to select the device(s) for which you want to apply the template.
Important: Ensure that the devices you select are able to accept the configuration you are applying with the template.
Tip: To view the template in the context of a certain device, select a device from the list, then click Preview. If something looks awry in the template in relation to the selected device, you can adjust the template script or remove the device from the list of devices to which you are applying the template.
4 After you have verified both the template in relation to the devices you have selected, you are ready to apply the template by clicking Upload. You are prompted to be sure that you are applying the correct template to the appropriate device(s).
5 Ensure that you are applying the correct template, then click Yes to apply the template.
Importing and Exporting Templates To import a config file: 1 From the Template Library (on page 327) (SETTINGS menu > Configuration
Management > Template Library), click Import. Import Configuration Templates dialog displays.
2 Navigate to the location on your directory of the .xml file that you want to import.

WhatsUp Gold User Guide
327
3 Select the file, then click OK. The file is added to the Template Library.
Note: If the .xml file that you are importing is identical to any existing templates stored in the library, the file does not import.
To export a template: 1 From the Template Library (on page 327) (SETTINGS menu > Configuration
Management > Template Library), select a template. 2 Click Export.
Using the Template Library The Configuration Manager Template Library (SETTINGS menu > Configuration Manager > Template Library) displays all templates currently configured for use on network devices. Use the Template Library to view, configure, and apply templates. Additionally, use the Import and Export buttons to import previously saved configuration templates, or to export configuration templates.
Use the Configuration Manager Template Library to configure new or existing templates:
Click 'add' ( ) to create a new template.
Select a template, click 'edit' ( ) to modify.
Select a template, then click 'copy' ( ) to duplicate a template.
Select a template, then click 'delete' ( ) remove it from the library.
Click Import to add a previously configured template to the Library.
Click Export to save the template as an .xml file.

328
CHAPTER 10
Leveraging and Customizing System Scripts
In This Chapter System Script Library ............................................................ 329
Configuring System Scripts ................................................... 329
Importing and Exporting System Scripts ............................... 331
Configuration Management System Script Library (on page 329) (SETTINGS menu > Configuration Management > System Script Library) stores pre-defined scripts configured for use with Configuration Management configuration tasks. You can associate these scripts with devices and invoke them through tasks or use them as a starting point for your own custom scripts.
System Script Library (on page 329) enables the following:
View, Filter, and Manage System Scripts (on page 329). Define and Configure System Scripts (on page 329). Import and Export System Scripts (on page 331).
Built-in Script Types System Script Library (on page 329) provides the following system script types:
BackupStartupConfig. Create a script to backup a device's startup config file.
BackupRunningConfig. Create a script to backup a device's running config file.
UploadStartupConfig. Create a script to upload a device's startup config file.
UploadRunningConfig. Create a script to upload a device's running config file.
TelnetPasswordAdd. Create a script to add a new Telnet password to a device.
TelnetPasswordEdit. Create a script to edit a device's Telnet password.
TelnePasswordDelete. Create a script to delete a device's Telnet password.
SshPasswordAdd. Create a script to add a new SSH password to a device.
SshPasswordEdit. Create a script to edit a device's SSH password.
SshPasswordDelete. Create a script to delete a device's SSH password.
SnmpPasswordAdd. Create a script to add a new SNMP password to a device.
SnmpPasswordEdit. Create a script to edit a device's SNMP password.
SnmpPasswordDelete. Create a script to delete a device's SNMP password.
CustomScript. Create a custom script type.

WhatsUp Gold User Guide
329
TftpBackupStartupConfig. Create a script to backup a device's TFTP startup config file.
TftpBackupRunningConfig. Create a script to backup a device's TFTP running config file.
UploadStartupConfig_REBOOT. Create a script to upload a startup config for a device in order to reboot that device.
System Script Library Configuration Management System Script Library (SETTINGS menu > Configuration Management > System Script Library) ships with ready-to-run scripts that you can invoke by way of Configuration Management configuration tasks. You can add to this script library by adding new scripts or copying and modifying existing scripts.
Configuration Management System Script Library provides the following features:
Add. Create a new system script based on a built-in type.
Edit. Modify an existing system script.
Copy. Clone an existing system script.
Delete. Remove a task record from the Network Performance Monitor Task Library.
Export (on page 331). Generate a text file with the current script settings. Import (on page 331). Add a previously exported script settings file to the library.
Configuring System Scripts To add a new default script: 1 Go to the System Script Library (SETTINGS menu > Configuration Management
> System Script Library). The System Script Library displays. 2 Click 'add' ( ). The New Configuration Management System Script dialog
displays. Use the dialog options to modify the script as desired. 3 Enter a Description for the script. This description is displayed in the default script
library to differentiate the script from other scripts. 4 In the Keys section of the dialog, click 'add' ( ) to add a new OID or IP key and
value. 5 Select a Script Type. Select to create one of the following: BackupStartupConfig. Create a script to backup a device's startup config file.
BackupRunningConfig. Create a script to backup a device's running config file.

WhatsUp Gold User Guide
330
UploadStartupConfig. Create a script to upload a device's startup config file.
UploadRunningConfig. Create a script to upload a device's running config file.
TelnetPasswordAdd. Create a script to add a new Telnet password to a device.
TelnetPasswordEdit. Create a script to edit a device's Telnet password.
TelnetPasswordDelete. Create a script to delete a device's Telnet password.
SshPasswordAdd. Create a script to add a new SSH password to a device.
SshPasswordEdit. Create a script to edit a device's SSH password.
SshPasswordDelete. Create a script to delete a device's SSH password.
SnmpPasswordAdd. Create a script to add a new SNMP password to a device.
SnmpPasswordEdit. Create a script to edit a device's SNMP password.
SnmpPasswordDelete. Create a script to delete a device's SNMP password.
CustomScript. Create a custom script type.
TftpBackupStartupConfig. Create a script to backup a device's TFTP startup config file.
TftpBackupRunningConfig. Create a script to backup a device's TFTP running config file.
UploadStartupConfig_REBOOT. Create a script to upload a startup config for a device in order to reboot that device.
SecureUploadStartupConfig. Create a script to upload a startup config file for a device using either SCP or SFCP.
SecureUploadRunningConfig. Create a script to upload a running config file for a device using either SCP or SFCP.
VlanAdds (VlanEdits, VlanDeletes). Manage a device's (layer 3 switch) VLAN database specification. (Called directly by VLAN manager.)
VlanAssignPorts. Manage switch ports for VLAN assignments. (Called directly by VLAN manager.)
VlanTrunkAdd (VlanTrunkDelete). Manage VLAN trunks. (Called directly by VLAN manager.)
6 Enter the Script Text. 7 Click OK to save changes.
To modify an existing system script:
Note: You cannot modify default system scripts provided by Configuration Management. You can only modify system scripts that you and other Network Performance Monitor users have configured for use on your network.
1 Go to the System Script Library (SETTINGS menu > Configuration Management > System Script Library). The Default Script Library appears.
2 Select an existing script, then click 'edit' ( ). The Edit Configuration Script dialog appears. Use the dialog options to modify the script as desired.

WhatsUp Gold User Guide
331
3 Enter a Description for the script. 4 In the Keys section of the dialog, click 'add' ( ) to add a new OID or IP key and
value. - or -
Select an existing Key, then click 'edit' ( ) or 'delete' ( ) to modify or remove the key value.
5 Select a Script Type. For a complete listing of available script types, see the previous section, To add a new default script.
6 Enter or modify the Script Text as needed. 7 Click OK to save changes.
To copy an existing script to modify for a new script: 1 Go to System Script Library (SETTINGS menu > Configuration Management >
System Script Library). The Default Script Library displays. 2 Select an existing script, then click Copy. The New Configuration Script dialog
displays with a copy of the existing script. Use the dialog options to modify the script as desired.
3 Enter a Description for the script. 4 In the Keys section of the dialog, click 'add' ( ) to add a new OID or IP key and
value. - or -
Select an existing Key, then click 'edit' ( ) or 'delete' ( ) to modify or remove the key value.
5 Select a Script Type. For a complete listing of available script types, see the previous section, To add a new default script.
6 Enter or modify the Script Text as needed. 7 Click OK to save changes.
Importing and Exporting System Scripts To import a script file: 1 Go to the System Script Library (SETTINGS menu > Configuration Management
> System Script Library), then click Import. 2 The Import Configuration Management System Script dialog displays. 3 Click Browse. The Choose File to Upload dialog displays. 4 Browse to the .xml file you want to import, then click Open.
The script is added to the System Script Library.
Note: If the .xml file that you are importing is identical to any existing templates stored in the library, the file does not import.

WhatsUp Gold User Guide
332
To export a template:
Note: You can only export user-defined system scripts. Configuration Management default scripts cannot be exported.
1 Go to the System Script Library (SETTINGS menu > Configuration Management > System Script Library), then click Export. Export Configuration Management System Script dialog displays.
2 Browse to the location on your directory where you want to export the .xml file. 3 Click Save.
A copy of the file is saved in the location you specified.
Managing CLI and Remote Shell Settings CLI Settings Library (SETTINGS menu > Configuration Management > CLI Settings Library) stores session-profile settings (on page 332) needed to invoke commands and run Configuration Management tasks on remote devices.
Configuration Management enables you to create and associate Configuration Management tasks that apply device and system-specific login attributes needed to connect to devices using a Telnet or ssh (secure shell) session. These session attributes are saved to records stored in the CLI Library.
Using the CLI Library, you can:
Add. Create a new CLI settings profile (on page 333).
Edit. Change credentials and session attributes for a CLI settings profile (on page 333).
Copy. Clone an existing CLI profile and modify it slightly.
Delete. Remove a CLI settings profile from WhatsUp Gold. Export (on page 335). Generate a text file with the current profile settings. Import (on page 335). Create a profile from a previously exported CLI settings
file.
CLI Settings Library CLI Settings Library enables you to create telnet and SSH session/connection profiles (on page 333) needed to login, invoke scripts, and apply configuration commands to routers and other devices. For network devices such as routers, a CLI Settings profile can be associated with a specific OID that identifies the manufacturer and model of device.
WhatsUp Gold User Guide
333
OID and Device IP Address Keys Pre-configured session profiles that ship with the CLI Settings Library are based on specific OIDs, SNMP objects assigned by manufacturers in their private MIBs that identify different models of the equipment. Configuration Management can use these settings on any device that supports the OID specified in the set of CLI settings. User-defined settings can be based on either a single or grouping of OIDs, or on a specific device IP address. The library also ships with default scripts for telnet and SSH that do not use keys. Configuration Management uses the default scripts to communicate with devices for which it does not find OIDs or an IP address.
Order of Settings Configuration Management first looks for and uses user-defined settings to communicate with a device. If no user-specified settings exist, it looks for and uses appropriate system settings. If a device does not support an OID specified within any of the system settings, Configuration Management falls back on the default settings which do not specify specific OIDs.
In the event that you configure two sets of settings for the same IP address or OID/grouping of OIDs, Configuration Management uses the last set of settings in the list, or the second set of settings you created for the specific IP address or OID(s).
CLI Settings Profile The following CLI settings are used by Configuration Management to issue commands on your network devices.
Username Prompt. Telnet or ssh username needed to login to the device. Password Prompt. Password associated with username to provide for the
remote shell session. Command Prompt. The character sequence Configuration Management looks
for to know it is the appropriate time to issue a device CLI or remote shell command.
More Prompt. The character sequence Configuration Management looks for from the device to know that multiple pages of information exist.
More Response. The character sequence Configuration Management automatically sends after receiving the More Prompt specified above.
Login Terminator. The character sequence Configuration Management issues after submitting the username and password to login to the device at login time.
Command Terminator. The character sequence Configuration Management issues at the end of a device CLI or shell command to submit the command to the device.
Tip: CLI settings can be specified as either strings or regular expressions.

WhatsUp Gold User Guide
334
Configuring CLI settings The simplest way for you to configure a new set of CLI settings is to use an existing set of system settings as a template and to modify the template settings as desired for use with a specific device or group of devices.
To configure new remote CLI settings: 1 Go to the Remote CLI Settings dialog (SETTINGS menu > Configuration
Management > CLI Settings Library). The CLI Settings Library displays.
Tip: By default, the dialog displays all remote CLI settings currently configured. You can filter this list by selecting a specific device by which to filter.
2 Click the 'add' ( ) button. New Remote Login CLI Settings dialog displays.
3 Enter a Description for the settings. 4 To add an IP address, or another OID, click 'add' ( ). The Add Key dialog
displays. 5 Select the Key Type that you want to add, either oid or ip. If you choose to map
the settings to an OID, or group of OIDs, the settings apply to any device with that OID that uses the SSH or Telnet credentials associated with the settings you are configuring. If you choose to map the settings to a specific IP address, the settings only apply to the device with the specific IP address you specify.
6 Enter the appropriate OID or IP address. 7 Click OK to add the new key and to return to the settings configuration dialog. 8 Ensure that the correct Protocol is selected, ssh, telnet, or All. 9 Ensure that all prompt, response and terminator boxes are specified appropriately.
For more information about these boxes, see About CLI Settings (on page 333).
Note: If you leave any box blank, Configuration Management uses either the default Telnet or SSH settings for that box.
10 Click OK to save copied/modified settings to the Remote CLI Settings library.
To copy a set of remote CLI settings: 1 Go to the CLI Settings Library (SETTINGS menu > Configuration Management >
CLI Settings Library). CLI Settings Library displays.
Tip: By default, the dialog displays all remote CLI settings currently configured. You can filter this list by selecting a specific device by which to filter.
2 Click Copy. The New Settings: Copy of ... dialog appears. 3 Enter a unique Description for the settings. This description differentiates it from
other settings in the Remote CLI Settings library.

WhatsUp Gold User Guide
335
4 To add an IP address, or another OID, click 'add' ( ). Add Key dialog appears. Alternatively, select an existing key from the list and click 'edit' ( ) to modify it, or click 'delete' ( ) to remove it from the list of keys.
5 If you add or modify a key, select the Key Type that you want to add, either oid or ip. If you choose to map the settings to an OID, or group of OIDs, the settings apply to any device with that OID that uses the SSH or Telnet credentials associated with the settings you are configuring. If you choose to map the settings to a specific IP address, the settings only apply to the device with the specific IP address you specify.
6 Enter the appropriate OID or IP address. 7 Click OK to add the new key and to return to the settings configuration dialog. 8 Ensure that the correct Protocol is selected, ssh, telnet, or All. 9 Ensure that all prompt, response and terminator boxes are specified appropriately.
For more information about these boxes, see About CLI Settings (on page 333).
Note: Boxes that indicate specific settings override the default settings. If boxes are blank, Configuration Management uses either the default Telnet or SSH settings for that box.
10 Click OK to save copied/modified settings to the Remote CLI Settings library.
If none of the existing system and/or previously-configured user settings can serve as a template for settings that you need, you can configure entirely new settings.
To remove settings from the Remote CLI Settings library: 1 From the CLI Settings Library, select a CLI settings record. 2 Click on Delete.
Note: You cannot remove pre-defined, system settings from the Remote CLI Settings library.
Importing and exporting CLI settings To import CLI settings: 1 From the CLI Settings Library (on page 332), click Import.
The Import Configuration Management Remote CLI Settings dialog displays. 2 Navigate to the location on your directory of the .xml file that you want to import. 3 Select the file, then click OK.
The file is added to the CLI Settings Library.
Note: If the .xml file that you are importing is identical to any existing templates stored in the library, the file does not import.

WhatsUp Gold User Guide
336
To export CLI settings:
Note: Configuration Management default CLI settings cannot be exported. You can only export user-defined CLI settings.
1 Go to the CLI Settings Library (SETTINGS menu > Configuration Management > CLI Settings Library). The CLI Settings Library displays.
2 Select a set of user-defined settings, then click Export. The Export Configuration Templates dialog displays.
3 Navigate to the location on your directory where you want to export the .xml file. 4 Click Save. A copy of the file is saved in the location you specified.
Remote Client Settings Use Remote Client Settings (SETTINGS menu > Configuration Management > Remote Client Settings) to set operating system paths that WhatsUp Gold Configuration Management will use to run remote clients.
Telnet Client Settings Use Default Client. Click to select this option if you want to use the default
WhatsUp Gold Telnet client application.
Note: Make sure that you use an application that is capable of running in non-interactive (command line) mode.
Application. Browse to the preferred Telnet application to use with Configuration Management. For example: C:\Program Files (x86)\Ipswitch\WhatsUp\plink.exe
Application Arguments. Enter any application argument strings to take specific actions when the application starts. Refer to your application help content for more information about application arguments.
SSH Client Settings Use Default Client. Click to select this option if you want to use the default
WhatsUp Gold SSH client application.
Note: Make sure that you use an application that is capable of running in non-interactive (command line) mode.
Application. Browse to the preferred SSH application to use with Configuration Management. For example: C:\Program Files (x86)\Ipswitch\WhatsUp\plink.exe
Application Arguments. Enter any application argument strings to take specific actions when the application starts. Refer to your application help content for more information about application arguments.

WhatsUp Gold User Guide
337
Archive Search Archive Search (SETTINGS menu > Configuration Management > Archive Search) enables you to quickly search, match patterns, and traverse device configuration archives. It offers a quick mechanism to verify alignment of selected device configurations across your site or enterprise.
Tip: In order to view, manage, and export archives, your WhatsUp Gold user must have Manage Configuration Management Tasks and Manage Devices Permissions. For more information, see the topic titled Administering Users and User Groups (on page 406).
This section includes the following topics:
Understanding device archives (on page 337). Select devices and perform an archive search (on page 338). Select search results and view files (on page 339). Apply regex pattern matching across archives (on page 339).
Understanding Configuration Archives A configuration archive is any device output captured when running a configuration task (on page 314) or script (on page 309), such as a configuration backup task (on page 309). When a configuration script is run, the output from one or more commands may

WhatsUp Gold User Guide
338
be captured and stored in a user or system specified key. The output is saved to the device using the key name and the time-stamp to identify it.
Note: Archives are persisted with their respective device records in the Configuration Management database.
Permissions Required for Managing Configuration Archives You can add the permissions needed for managing archived device permissions from the User and Group Library (on page 406) (SETTINGS menu > User and Group Library).
In order to view, manage, and export archives, your WhatsUp Gold user must have the following permissions:
Manage Configuration Management Tasks Manage Devices Permissions
Performing an Archive Search To perform an archive search: 1 Go to the Archive Search view (SETTINGS menu > Configuration Management
> Archive Search): The Archive Search view displays.
2 Click 'add' ( ) to add devices or groups to search from. The Select Device dialog displays.
3 Select the device(s) for which you want to perform an archive search, then click OK.
4 Define search criteria: Archive Key. Specify a key to denote the type of configuration. (For example,
running-config, startup-config). The list is populated with all of the keys from the archived configuration files for the selected device(s). Otherwise, select All.
To view only the latest archives for the selected device(s), select Latest Archive Only.
Search Pattern. String or regular expression to match.
Regular Expression. Allows regular expression syntax.
Ignore Case. Match regardless of case.
Tip: Select a device, then click Remove to delete it from the list.
5 Click Search.

WhatsUp Gold User Guide
339
Search Results display. Results include the following columns:
Archive Key. Database key for the archive.
Device. Device the archive/configuration is associated with.
Time Created. Date and time the archive was created.
Created by. Name of the configuration task that created/returned the archive. 6 Select the result you want to edit, and the click on the View button to traverse the
pattern matches:
Tip: Select an archive file, then click View to see the specific archived file.
Configuration Archive Search Result The Configuration Archive Search Result dialog displays the following results from a Configuration Management Archive Search.
Archive Key. Database key for the archive.
Device. Device the archive/configuration is associated with.
Time Created. Date and time the archive was created.
Created by. Name of the configuration task that created/returned the archive.
Tip: Click the view button to traverse the highlighted pattern matches for a selected archive file.
Applying Regular Expressions Archive Search (SETTINGS menu > Configuration Management > Archive Search) applies a regular expression processing engine to your search results. This feature enables you to perform pattern matching or inverse pattern matching when managing archived configuration records.
Note: The Configuration Management regex engine uses features and syntax similar to .NET/Perl 5.
Regular expression processing is a powerful compliment to archive search. You can leverage it for many tasks, for example:
Returning only devices with a certain range of IP addresses. (on page 340)
WhatsUp Gold User Guide
340
Pattern exclusion (Validating Subnet Changes) (on page 340). Checking a combination of values or settings that are important to site security
and performance.
Pattern Range (IP Address) Configuration Management regular expression (regex) engine (on page 339) is useful for returning only records that match a pattern representing a range of values. This is especially helpful when searching for configuration records with certain IP addresses or TCP ports.
Return Records Containing IETF Reserved Addresses The following regex syntax used with Configuration Management regex engine returns any configuration records or archived files containing IP addresses within the block of address reserved by the IETF for documentation (192.0.2.0/24) as defined in RFC 5737 (https://tools.ietf.org/html/rfc5737). You can use this example as a starting point for your own IP address pattern matches.
Syntax
^192\.0\.2\.([0-9]|[1-9][0-9]|1([0-9][0-9])|2([0-4][0-9]|5[0-5]))$
Pattern Exclusion Configuration Management regular expression (regex) engine (on page 339) supports both pattern matching and pattern exclusion.
Pattern exclusion is applied using a mechanism referred to as negative look-ahead. It takes this syntax:
(?!(myvalue))
—Where "?!" is the negative lookahead operator.
Return Records Containing String A but not B Let's say you want to validate changes to your subnet mask across your enterprise 255.255.0.0, but you suspect that some of your routers might have the wrong value for the second octet. Ensure the Regex checkbox is checked.
Syntax
.*255\.(?!(255)).*
Regex Syntax Details This section explains the syntax used for the preceding example.
" .* " matches 0 or more of any character (such as tabs, whitespace characters, keywords)
The literal string "255" matches the first octet of the submask.

WhatsUp Gold User Guide
341
" \. " (escaped dot character) matches the octet separator literal. (?!(255)) excludes matches with the literal string "255" for indicating the
second octet in the subnet.
Using the Configuration Management VLAN Manager
Configuration Management VLAN Manager (SETTINGS menu > Configuration Management > VLAN Manager) enables easy and dynamic update of VLAN configurations. Through the VLAN Manager, you can add, edit, and delete VLANs from individual devices. You can also take advantage of VLAN Trunking Protocol (VTP) enabled by Cisco switches where updating VLAN properties on one device triggers VLAN database refresh on other devices. Otherwise, you can copy and move single or multiple VLAN specifications from one network device to other VLAN-capable network devices.
Important: Devices in WhatsUp Gold must have proper read/write credentials assigned before you can apply VLAN specification changes. Some switches/routers allow configuration using SNMP, in other cases you will need SSH or Telnet credentials (that enable WhatsUp Gold to run system scripts (on page 328)) to apply VLAN configuration changes.
VLAN Manager Guidelines To manage device VLAN configurations, consider the following:
For Cisco devices, your device must support the Cisco VTP MIB (http://tools.cisco.com/ITDIT/MIBS/servlet/index).
If you want to take advantage of automatic distribution of changes to other VTP-enabled devices on your network, the device you choose to modify must be running in VTP server mode.
VLAN Manager operations that execute by way of SSH/Telnet will exercise system scripts (on page 328) that you can customize.
Note: Cisco VTP-enabled devices run in VTP server mode by default.

WhatsUp Gold User Guide
342
Tip: For more information on Cisco trunking, see Cisco's documentation (http://www.cisco.com/c/en/us/tech/lan-switching/virtual-lans-vlan-trunking-protocol-vlans-vtp/index.html) and read Understanding VTP https://www.cisco.com/c/en/us/support/docs/lan-switching/vtp/10558-21.html.
To configure device VLANs using the VLAN Manager: 1 Click Select Device... to choose a device from the Select Device dialog. 2 Click Discover to discover and view the VLAN configuration for the selected
device. The discovered VLAN information is displayed in the VLANs section of the dialog.
3 In the VLANs section of the dialog, configure VLAN for the switch:
Add. Add a VLAN to the switch configuration.
Edit. Edit a VLAN name property for the switch configuration.
Note: You cannot edit the VLAN Index. If you want to modify a VLAN's index number, you must delete the VLAN and add the VLAN again with the desired index number. You cannot edit VLANs that are reserved by the switch vendor. For example, you cannot use default VLANs or Cisco Reserved VLAN indexes (1000-1024).
Delete. Remove the VLAN property from the device.
Note: You will be prompted before you remove a VLAN from a device.
Copy To. Copy the selected VLAN to duplicate the VLAN Name/Index configuration to another VLAN capable device.
(Bulk actions) select VLANs and then click the operation you want to perform in bulk. For example, you can copy complete VLAN specifications to a backup or temporary device.
4 In the Port VLAN Configuration section of the dialog, configure VLAN port assignments, and/or commit configuration changes. Select a VLAN switch port, then click Assign To to set the static (primary) VLAN
ID.
Select a VLAN switch port, then click Add/Edit Trunk to modify its Trunk configuration tags.
Select a VLAN switch port, then click Remove Trunk to return the port to its default, non-trunking configuration.
Select multiple VLAN switch ports, then click Bulk Action > Assign To to set the static (primary) VLAN ID.
5 Click Commit Changes to copy the currently running config of the selected device to the startup config.
6 Click Close to exit the dialog.

WhatsUp Gold User Guide
343
Configuring VLAN trunks Use the Add/Edit VLAN Trunk dialog to configure VLAN trunking and tagging for local Configuration Management devices.
To configure VLAN trunk settings: 1 Ensure that the appropriate device is selected. 2 Select the appropriate Interface/Port. 3 Ensure that the appropriate Primary VLAN ID (PVID) is selected. Select the VLANs to which you want to assign membership for the selected port.
Click Deselect All to clear selection from all VLANs.
Note: The Primary VLAN ID (PVID) cannot be tagged.
4 Click OK to save changes.
Writing Custom VLAN Scripts WhatsUp Gold ships with VLAN scripts for editing Cisco switches. You run these system scripts directly from the UI controls embedded in the VLAN Manager. You can also modify these scripts using percent variables (http://www.whatsupgold.com/WCfg31CustScriptLangforWUG165).
Caution: Before you proceed, ensure that you understand VLANs, how they work, and verify the necessary controls are in place to validate (or rollback) any changes you make to your network's operating state before you run VLAN configuration scripts.
Note: VLAN changes to your network use custom (layer 3) instructions to bridge switches. They potentially enable devices on different layer 2 networks to share access to network-wide services and resources.
Tip: When you edit a system VLAN script, the CM System Script Library makes a copy. You can always revert back to the system script.
VLAN Item Iterator You can use a percent variable that enables you to iterate through tagged VLANs or VLANs configured for the selected VLAN Trunk.
This iterator is supported by the following script types:

WhatsUp Gold User Guide
344
Add VLANs, Edit VLANs, Delete VLANs Create VLAN Trunk Assign Ports to VLAN
Syntax
@forEachItemInList
<Vlan-Or-Port-Operation>
@endfor
Example
@forEachItemInList
name $(Item.VlanName)
@endfor
Note: The Primary VLAN ID (PVID) cannot be tagged.
VLAN Item Variables In each script type variables are supported within the command (@forEachItemInList), these variables always start with "Item." For example, $(Item.VlanIndex).
Name Description
Item.VlanName Supported item variables in Add VLANs, Edit VLANs, Delete VLANs, and Create VLAN Trunk scripts.
Item.VlanIndex
Item.PortName Supported item variables in Assign ports to VLAN script.
Item.PortIndex
Item.VlanIndex (Current VLAN the port is assigned to)
VLAN Properties Name Description
VlanName Supported variables in Assign Ports to VLAN (these variables refer to the new VLAN the ports will be assigned to).
VlanIndex
WhatsUp Gold User Guide
345
PortName Supported variables in Create VLAN Trunk and Delete VLAN Trunk
PortIndex
VlanName Refers to the primary or native VLAN.
VlanIndex Refers to the primary or native VLAN.
Setting Log Expiration Use the Configuration Management (on page 307) Log Expiration dialog to limit how much CM log data to retain.
Maximum log data collection setting = 365 days. Default setting = 365 days.

346
CHAPTER 11
Network Traffic Analysis In This Chapter NTA System Overview .......................................................... 347
NTA System Requirements .................................................. 349
NTA Quick Start .................................................................... 350
Choosing NTA Sources ........................................................ 352
Configuring and Enabling Collection on Sources .................. 354
Aggregating Sources ............................................................ 372
Grouping Traffic .................................................................... 373
Classifying Traffic by Port Number ........................................ 374
Adding Custom Labels for Type of Service (ToS) IDs ........... 375
Listener Port, Collection, and Retention Settings .................. 376
Collector Database Maintenance .......................................... 378
Reduce and Analyze Traffic with Advanced Filtering ............ 381
License Message .................................................................. 382
Network Traffic Analysis (formerly known as "Flow Monitor") provides router-based and interface-level monitoring to capture network traffic patterns and statistics from selected observation points (source devices) throughout your network. Right away, after install, Network Traffic Analysis finds potential sources for gathering router-based flow data (see NTA Quick Start (on page 350)). Network Traffic Analysis provides a superset of analysis and monitoring capabilities for what was referred to in earlier versions of WhatsUp Gold as Flow Monitor.

WhatsUp Gold User Guide
347
You can view, analyze, and share observed flow patterns and data by way of a suite of reports (on page 481), logs (on page 834), and dashboards (on page 422) that provide rich interactive table grid, charting, and graphing capability.
The following sections detail Network Traffic Analysis capabilities, setup, configuration and system management:
Network Traffic Analysis Overview (on page 347). Network Traffic Analysis Requirements (on page 349) / Quick Start (on page
350). Choosing NTA Sources (on page 352). Configure and Enable Flow Collection from Source Devices (on page 365). Adding and Defining Flow Sources (on page 354). Aggregating Sources (on page 372). Grouping Traffic (on page 373). Adding Custom Labels to Service Identifier (ToS) Traffic (on page 375). Classifying Application Traffic by Port Number (on page 374). Flow Collection and Raw Data Retention Settings (on page 376). Flow Storage and Record Maintenance (on page 378).
NTA System Overview Network Traffic Analysis uses the flow caching/exporter enabled on your source device (a properly configured interface, switch, or gateway) to get flow packets.
SNMP or flow caching/export must be enabled at the potential flow export devices (network switches and interfaces, for example). Network Traffic Analysis flow collectors identify potential flow export devices on your network (also referred to herein as flow "source devices") and automatically begin gathering their flow packets. You can elect

WhatsUp Gold User Guide
348
to stop and later restart Network Traffic Analysis monitoring on selected source devices using controls provided in the NTA Sources Library (on page 356).
A network flow is a unidirectional sequence of packets observed traveling through a flow caching and export device (referred to throughout this guide as an NTA source), which is intended for a destination device. In other words, a single TCP connection between two hosts can only be represented by two different flows.
Flow monitor data is comprised of the following data fields:
Source IP address and port number Destination IP address and port number IP Protocol Ingress interface IP Type of Service (ToS)
Using Network Traffic Analysis Monitoring to Complement WhatsUp Gold Monitoring Network Traffic Analysis complements other forms of monitoring because it is less invasive and returns network data independent of the availability of both the sender or receiver device. In other words, even if a particular destination device is down or not responding to active monitors, you can use Network Traffic Analysis monitoring to generate reports and dashboards that provide check points from each network hop (upstream or downstream network devices, for example) that support flow packet export.
With Network Traffic Analysis, WhatsUp Gold can return critical availability, usage metrics, and indicators for entire segments and sections of your network. For example, Network Traffic Analysis provides visibility into network status even when a device stops responding to WhatsUp Gold active and performance monitoring. For example, Network Traffic Analysis enables you analyze root cause and designate attribution when aberrant or misconfigured devices degrade QoS, cause congestion, and disrupt service availability.
Network Traffic Analysis Data Analysis and Reporting You can leverage Network Traffic Analysis logs, data, and dashboards in order to:
Identify network usage needed to make hardware upgrade, network capacity, and other scaling decisions.
Recognize and correct network configuration issues that consume network resources or expose your network to security vulnerabilities.
Identify traffic which may indicate unauthorized use of peer-to-peer file sharing applications or a denial-of-service attack against your organization.
Troubleshoot and correct causes of periodic spikes in network traffic before they become problems.

WhatsUp Gold User Guide
349
Tip: Network Traffic Analysis can collect and generate reports for Flow data from multiple devices.
NTA System Requirements Network Traffic Analysis requires either of the following enabled on source devices:
Flow Export. Such as NetFlow, NetFlow-Lite, sFlow, J-flow, and IPFIX. SNMP. Returns traffic totals when flow source export is not enabled or for
sampled flow (sFlow, for example).
Network Traffic Analysis System Architecture
Note: The flow exporter can be either an included function of the network device, such as the NetFlow export functionality on Cisco routers, or an external probe configured to monitor one or more interfaces on the device, such as the Ipswitch NetFlow Probe.
Network Traffic Analysis provides flow collection and analysis. It provides a centralized location for the collection, processing, analysis, and storage of network traffic data. As network traffic data is observed at observation points, it is captured as flow data, and it is delivered by network monitoring protocols configured on flow export source devices. When a router or other device sends flow data to Network Traffic Analysis, it follows the sequence demonstrated in the illustration.
1 Flow Source (Exporter)
The flow source device (shown in the illustration as a router) observes pass-through traffic and summarizes data characteristics into a NetFlow, NetFlow-Lite, sFlow, J-Flow (sampled NetFlow) or an IP Flow Information Export (IPFIX) export datagram.
2 Flow Data Flow packets are sent in the form of an export datagram sent to a Network Traffic Analysis collector running on the WhatsUp Gold system.
3 Collector The Network Traffic Analysis collector stores the NetFlow, NetFlow-Lite, sFlow, J-Flow (sampled NetFlow) or IP Flow Information Export (IPFIX) export in the Network Traffic Analysis database.

WhatsUp Gold User Guide
350
4 Database NTA and flow data are archived in a database running on the WhatsUp Gold system.
5 Web UI WhatsUp Gold enables you to view, share, apply user-based access controls, and analyze interactive dashboards and reports for network operations, forensic analysis, capacity planning, and much more.
Note: sFlow data is sent every x number of packets (configurable on the sFlow device), whereas all NetFlow data is collected and monitored. This means that sFlow data provides a sampling of network traffic data characteristics, whereas NetFlow data provides all network traffic data.
NTA Quick Start The quickest path for seeing flow traffic data and exploring Network Traffic Analysis capabilities in WhatsUp Gold is to either:
View current flow export data advertised on your network. Enable flow source data collection on devices that are flow-export ready. Enable flow source data collection on devices that are not yet configured.
(Remote configuration MIB support required on flow export device.)
Note: If a source device does not fall into any of these categories, ensure that your device supports export of flow monitoring. For details, see Configure Flow Export on Source Devices (on page 365) and Adding and Defining Flow Sources (on page 354).
View Current Flow Export Data Advertised on Your Network
As soon as Network Traffic Analysis is up and running, WhatsUp Gold begins collecting flow statistics from source devices sending flow packets and populating the flow database, which you can analyze, apply to reports, and share. This procedure envisions that simple scenario.
1 Open the NTA Sources Library (SETTINGS menu > Network Traffic Analysis > NTA Sources).
2 Look for devices registered both as Enabled and Receiving packets from the flow exporter. If you do not find an active device, you need to configure one. See the section
titled Enable Flow-Export-Ready Source Devices.
If you find an active and enabled flow device, select it in the grid and then click the Source Traffic button to review the report.
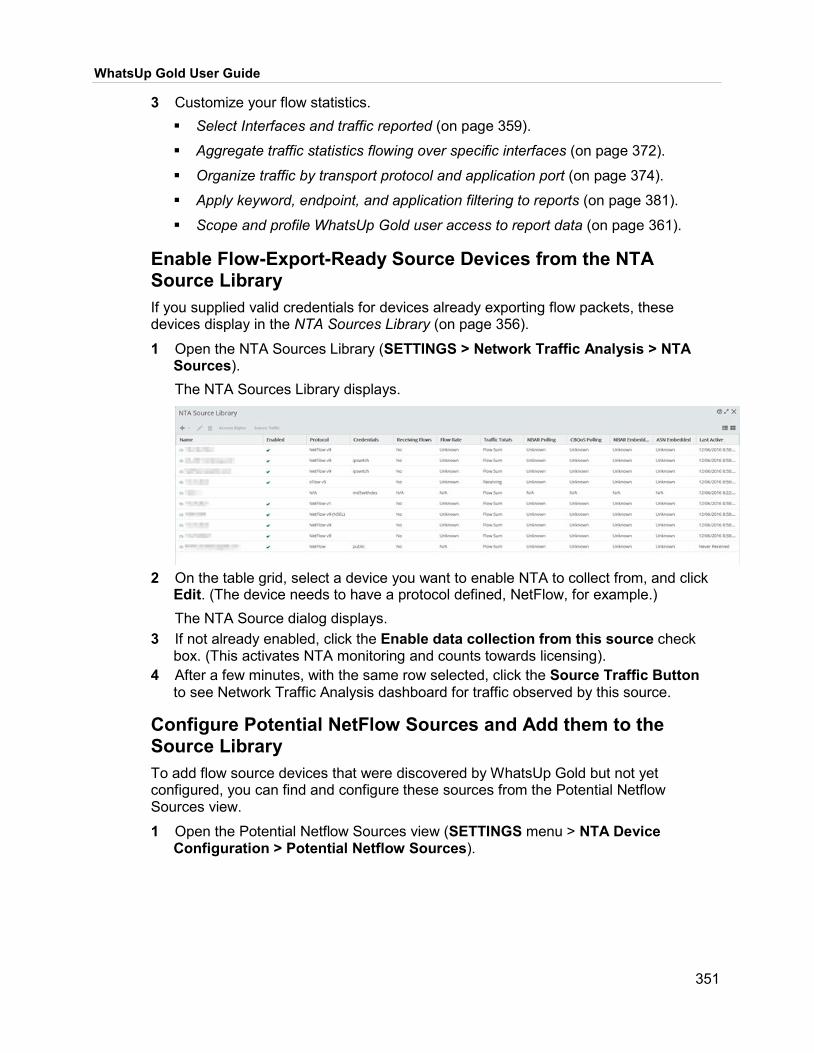
WhatsUp Gold User Guide
351
3 Customize your flow statistics. Select Interfaces and traffic reported (on page 359).
Aggregate traffic statistics flowing over specific interfaces (on page 372).
Organize traffic by transport protocol and application port (on page 374).
Apply keyword, endpoint, and application filtering to reports (on page 381).
Scope and profile WhatsUp Gold user access to report data (on page 361).
Enable Flow-Export-Ready Source Devices from the NTA Source Library If you supplied valid credentials for devices already exporting flow packets, these devices display in the NTA Sources Library (on page 356).
1 Open the NTA Sources Library (SETTINGS > Network Traffic Analysis > NTA Sources). The NTA Sources Library displays.
2 On the table grid, select a device you want to enable NTA to collect from, and click
Edit. (The device needs to have a protocol defined, NetFlow, for example.) The NTA Source dialog displays.
3 If not already enabled, click the Enable data collection from this source check box. (This activates NTA monitoring and counts towards licensing).
4 After a few minutes, with the same row selected, click the Source Traffic Button to see Network Traffic Analysis dashboard for traffic observed by this source.
Configure Potential NetFlow Sources and Add them to the Source Library To add flow source devices that were discovered by WhatsUp Gold but not yet configured, you can find and configure these sources from the Potential Netflow Sources view.
1 Open the Potential Netflow Sources view (SETTINGS menu > NTA Device Configuration > Potential Netflow Sources).

WhatsUp Gold User Guide
352
The Potential Netflow Sources view displays.
2 Choose a device that supports remote configuration MIBs (NetFlow MIB Support =
true) and click the Configure button (on page 363). 3 Select the Interfaces you what to gather flow statistics from. 4 Click Auto, wait for the remote configuration to complete and then click Save.
The Flow source displays in the Source Library. 5 Enable Network Traffic Analysis monitoring. --Complete the steps in the section
titled Enable Flow-Export-Ready Source Devices from the NTA Source Library.
Choosing NTA Sources Consider the following when adding NTA sources:
Review your site's policy goals and ask how flow or SNMP traffic statistics can satisfy these.
Browse the NTA Sources Library (on page 356) for devices already configured for flow export but not yet enabled.
Check NTA Sources Library (on page 356) to and Potential Netflow Sources (on page 362) dialog to understand which metrics are readily available (flow, SNMP, NBAR for example).
Ensure flow export or SNMP is configured and available on the source devices.
Identify Critical Paths and Potential Source Devices Understanding the purpose of the monitoring helps you to identify the target source device.
Device Purpose
Gateway to ISP Measure WAN traffic movement. Application level traffic analysis. SLA and uptime auditing. Track traffic by application, geographic region,
and domain. Anomaly tracking, forensics, and diagnostics.
WhatsUp Gold User Guide
353
WAN and LAN routers and significant interfaces and ports.
Capacity planning. Validate traffic rules implemented at switch. Anomaly tracking, forensics, and diagnostics.
Ingress and egress interfaces for proxy host, critical services, and head nodes.
Validate IP rules/traffic. Capacity planning. Validate load balancer function. Anomaly tracking, forensics, and diagnostics.
Browse for Devices Already Configured to Export Flow Packets You can browse for devices which are already configured or support remote configuration MIBs from the Potential Netflow Sources dialog.
Firewall Considerations Once a potential Network Traffic Analysis source has been identified, you should consider the location of the device with respect to other networking devices, particularly those devices that perform network address translation (NAT). Depending on where the source is located relative to the device performing NAT, traffic to and from an internal (private) IP addresses are reported differently in the exported NetFlow data.
If the device is inside the firewall, or if no firewall exists, the exported flow data includes the internal IP address for devices generating and receiving traffic. This allows you to pinpoint the exact device in the internal network to which the traffic belongs.
If the device is outside the firewall, the exported flow data aggregates all traffic to and from internal devices and reports it as belonging to a single public address belonging to the device performing the address translation. In this case, you can only determine that an internal device originated or received traffic, but you cannot pinpoint the traffic as belonging to a specific internal device.
If the device exporting flows is also performing NAT, you can configure the device to export the flow data using either the private or the public translated address, mimicking either of the above scenarios. To see internal IP addresses, configure the device to export data on ingress and egress for the internal interface. To see all traffic reported using the external translated IP address, configure the device to export data on ingress and egress for external interfaces.

WhatsUp Gold User Guide
354
NAT and Virtual Machine Considerations Other conditions that may also change the nature of the data reported by Network Traffic Analysis include:
When address translation occurs anywhere in the path between the source and the destination, IP addresses reported are altered to include the translated address. In most cases, this does not present a problem, but it may require monitoring multiple flow-enabled devices to track traffic in complex network environments.
Virtual private networks and other tunneling technology (such as ESP or SSH) can appear to distort reports. In these cases, Network Traffic Analysis reports large amounts of traffic sent over a small number of flows. This is expected behavior, as VPNs and other tunnels aggregate traffic from multiple connections and funnel it through a single connection.
SNMP Timeout and Retry Timeout. Time interval that Network Traffic Analysis collector waits for the
Source message. Retry. Number of times that collector attempts SNMP request.
Credentials Used for Network Traffic Analysis Credentials Library provides the following credential types needed for retrieving flow, NBAR, and SNMP metrics.
Credential Type Description Typical Use
SNMPv1 (on page 219)
SNMPv2 (on page 220)
Administrative SNMP domains (for example, networks and subnets) are defined by a shared SNMP community string.
Poll with WhatsUp Gold performance monitors with access to MIBs on any device running an SNMP agent with a default ("public") or otherwise configured community string.
SNMPv3 (on page 220)
User based security with SNMP message authentication for data integrity and origin authentication.
Poll with WhatsUp Gold Performance monitors for SNMP-enabled devices using SNMPv1,v2,v3.
Ensure message privacy between a SNMPv3 agent and management station.
Protect against MITM attacks due to replay.
Configuring and Enabling Collection on Sources In order to gather exported flow, SNMP, and NBAR information and statistics from source devices, you must add the device as a source within WhatsUp Gold.
WhatsUp Gold User Guide
355
Tip: If you just installed Network Traffic Analysis, check NTA Sources Library (on page 356) for flow listening that is enabled on any export sources detected on your network. This happens as soon as NTA starts up.
There are three basic steps for adding Network Traffic Analysis sources in WhatsUp Gold:
Step 1: Configure source device. Before you can add a Network Traffic Analysis source device, you must first ensure it is configured to export statistics. There are two basic approaches to configuring flow devices for export:
Configure source remotely using WhatsUp Gold (on page 362). (Requires remote network management MIB support on target source device.)
Configure source locally. (Manually, using CLI.) (on page 365)
Step 2: Enable the source device for NTA monitoring (licensing step).
Flow-export-ready (configured) devices found during WhatsUp Gold Network Discovery scans display in the NTA Sources Library (on page 356).
Enabling flow is automatic when you configure a flow source remotely using WhatsUp Gold (on page 362).
You can check the NTA Sources Library view to see if flow is enabled and when the last flow packet was received.
Step 3: View results. Open NTA dashboards and reports to view gathered data.
Enable and View Flow Collection Status Enable Flow-Export-Ready Source Devices from the NTA Source Library If you supplied valid credentials for devices already exporting flow packets, these devices display in the NTA Sources Library (on page 356).
1 Open the NTA Sources Library (SETTINGS > Network Traffic Analysis > NTA Sources).

WhatsUp Gold User Guide
356
The NTA Sources Library displays.
2 On the table grid, select a device you want to enable NTA to collect from, and click
Edit. (The device needs to have a protocol defined, NetFlow, for example.) The NTA Source dialog displays.
3 If not already enabled, click the Enable data collection from this source check box. (This activates NTA monitoring and counts towards licensing).
4 After a few minutes, with the same row selected, click the Source Traffic Button to see Network Traffic Analysis dashboard for traffic observed by this source.
NTA Sources Library NTA Sources Library (SETTINGS menu > Network Traffic Analysis > NTA Sources) enables you to view and manage Netflow and NTA sources.
Add NBAR/QoS Source. Add endpoints for gathering NBAR classification statistics (on page 360).
Add Aggregated Source. Organize interfaces into aggregate groups (on page 372).
Edit. Edit the selected NTA source, flow source, or aggregated interface (on page 372).
Delete. Delete the NTA source, flow source, or aggregated interface. Access Rights. Scope user access to view and share traffic data (on page
361). Source Traffic. Access NTA results data and dashboard views (on page 362).
View, Edit, Delete, and Enable Flow Sources NTA Source Library (SETTINGS menu > Network Traffic Analysis > NTA Sources) provides a table view of:
Flow sources detected on your network. Flow sources you configured manually or automatically using NTA Device
Configuration (on page 362). Devices polled for NBAR traffic totals. Groups or individual interfaces providing SNMP or flow statistics.

WhatsUp Gold User Guide
357
Understanding Column Data Name. Name of source device. Enabled. Indicates if flow or statistics are gathered from this device. Protocol. Flow protocol (if supported). Credentials. Credential types. Receiving Flows. Indicates if flow source is active. ("n/a" indicates not a
configured flow source). Flow Rate. Flow packet rate. Traffic Totals. Indicates if traffic totaling is active. Flow Sum denotes traffic
totals are summed from flow packets. Receiving indicates traffic totals are estimated (typical of sFlow).
NBAR Polling. Indicates if endpoint is polled for NBAR classification data. NBAR Embedded. Indicates if NBAR is provided by the flow protocol. ASN Embedded. Indicates if ASN identification is provided by the current flow
protocol. Last Active. Time of last information.
Click a column heading ( ) to display the column selection listing . You can also include:
IP Address. Device IP address. Reliability. Estimated reliability based on the volume and sampling rate. Sample Rate. Fraction of observed traffic data reported by source.
Edit Flow Source Properties You can edit configuration properties of a NTA Flow source from either:
NTA Sources Library (SETTINGS menu > Network Traffic Analysis > NTA Sources). Select a source listed in the grid and click 'edit' ( ).
Row options ( ) for most NTA Dashboard reports, for example those that include interface metrics (ANALYZE menu > Traffic Analysis > Top Interfaces by Traffic Report).
Name and Licensing Display Name. Friendly label for the flow source. Enable data collection from this source. Data collection is switched 'On' by
default when a flow source is found on your network. When this checkbox is checked it denotes use of an NTA license instance.
SNMP Polling Options Credential drop down list. SNMP credentials are needed for querying and
making configuration changes to the flow exporter. Select a credential. Click the Query button to ensure the credential is valid.
To add new credentials, click the ellipsis button (. . .) to open the Credentials Library dialog.

WhatsUp Gold User Guide
358
Poll source for interface traffic. Some Netflow implementations sample and do not return the full complement of flow packets. Use this to poll for traffic totals using SNMP.
Poll source for NBAR information. Some Netflow implementations do not return NBAR (application classification) information. Use this to gather this information using SNMP.
Advanced Options. Click on this button to configure SNMP client behavior such as timeout and number of retries.
Access Rights. Click on this button to scope user access to traffic data (on page 361).
Note: Network Traffic Analysis uses SNMP to gather information about the network interfaces on the source device.
Hide Interfaces, Show Interfaces, and Define Interface Bandwidth (Needed for Capacity Utilization Calculation)
Hiding interfaces can be useful when you have specific interfaces that need no performance monitoring or monitoring is happening by way of a different flow source.
To hide or show interfaces from the Flow Properties dialog, select an interface, then click Hide or Show to hide.
To hide, show, and define interface bandwidth, select an interface and then click on Edit.
If nominal network interface speed used to calculate bandwidth capacity utilization is incorrect or not populated at the device's management object, you can define a custom speed using the Edit Interface Properties dialog.
Hide and Show Interfaces and Define Total Network Bandwidth (for Calculation Purposes) 1 Select an interface from the Interfaces list window.
The Flow Interface dialog displays.
Hide this interface from the NTA Home page and related configuration properties. Hides the selected interface from the Network Traffic Analysis reports and dashboards. This enables you to display only the interfaces relevant to your bandwidth monitoring objectives.
Note: Null(0) interface names are hidden by default because they are not a true source interface. Null(0) interfaces show traffic that a router has dropped or traffic that a router has generated. In both cases the ifIndex = 0 and as a default convention we name an interface = Null because the interface is non existent. If you want Null(0) interface information to display as a source interface, uncheck the Hide this interface from the NTA Home page and related configuration properties option.
Specify a custom speed for this interface. Click this check box to enable the In and Out text boxes.

WhatsUp Gold User Guide
359
In and Out. Define the speed of each interface, which is used to calculate bandwidth capacity as a percentage of the total interface speed. Enter the upper limit of the interface in bps (bits per second). Common interface speeds expressed in bps are:
1 Gbps = 1,000,000,000 bps
100 Mbps = 100,000,000 bps
10 Mbps = 10,000,000 bps 2 Click Save to save your settings.
Edit Interface Properties If nominal network interface speed used to calculate bandwidth capacity utilization is incorrect or not populated at the device's management object, you can define a custom speed using the Edit Interface Properties dialog.
Hide and Show Interfaces and Define Total Network Bandwidth (for Calculation Purposes) 1 Select an interface from the Interfaces list window.
The Flow Interface dialog displays.
Hide this interface from the NTA Home page and related configuration properties. Hides the selected interface from the Network Traffic Analysis reports and dashboards. This enables you to display only the interfaces relevant to your bandwidth monitoring objectives.
Note: Null(0) interface names are hidden by default because they are not a true source interface. Null(0) interfaces show traffic that a router has dropped or traffic that a router has generated. In both cases the ifIndex = 0 and as a default convention we name an interface = Null because the interface is non existent. If you want Null(0) interface information to display as a source interface, uncheck the Hide this interface from the NTA Home page and related configuration properties option.
Specify a custom speed for this interface. Click this check box to enable the In and Out text boxes.
In and Out. Define the speed of each interface, which is used to calculate bandwidth capacity as a percentage of the total interface speed. Enter the upper limit of the interface in bps (bits per second). Common interface speeds expressed in bps are:
1 Gbps = 1,000,000,000 bps
100 Mbps = 100,000,000 bps
10 Mbps = 10,000,000 bps 2 Click Save to save your settings.

WhatsUp Gold User Guide
360
Add NBAR Source To add NBAR classification to an Network Traffic Analysis source: 1 Open the NTA Sources Library (on page 356) (SETTINGS menu > Network
Traffic Analysis > NTA Sources). 2 Click Add > NBAR Polling Source.
The Flow Source dialog displays. 3 Enable data collection from this source. When you enable the current source
will count as points against your Network Traffic Analysis license. 4 Provide the following field values: Source IP Address. IP address of the flow source device.
Display Name. (Optional.) Name to display in source and NTA reports. 5 Polling source. NBAR. Click to enable NBAR classification data.
Poll source for total interface traffic. Click on this box to enable the device as an SNMP statistics source for Network Traffic Analysis.
6 SNMP credentials. Select appropriate credentials from the drop down list. WhatsUp Gold Network Traffic Analysis queries the source device for interface information. The Interfaces frame displays known network interfaces for the current device.
7 Access rights. (Optional) Opens the Flow Source access rights dialog that enables you to block WhatsUp Gold users from the flow data.
8 Interfaces. Select one or more interfaces and click OK. Network Traffic Analysis saves your SNMP source which also displays in your NTA Sources Library (on page 356).
9 Check the NBAR Top n Applications (on page 526) report to ensure flow data is received by WhatsUp Gold.
Get SNMP Traffic Totals When certain flow sources export flow statistics for a portion or "sample" over overall traffic observed, you can complement flow sampling by gathering packet count totals using SNMP.
To add a device as an SNMP Source for traffic and packet totals: 1 Open the NTA Sources Library (on page 356) (SETTINGS menu > Network
Traffic Analysis > NTA Sources). 2 Click Add > NBAR Polling Source.
The Flow Source dialog displays. 3 Enable data collection from this source. When you enable the current source
will count as points against your Flow Monitor license. 4 Provide the following field values: Source IP Address. IP address of the flow source device.
Display Name. (Optional.) Name to display in source and NTA reports.

WhatsUp Gold User Guide
361
5 Polling source. NBAR. Click to enable NBAR classification data.
Poll source for total interface traffic. Click on this box to enable the device as an SNMP statistics source for Network Traffic Analysis.
6 SNMP credentials. Select appropriate credentials from the drop down list. WhatsUp Gold Network Traffic Analysis queries the source device for interface information. The Interfaces frame displays known network interfaces for the current device.
7 Access rights. (Optional) Opens the Flow Source access rights dialog that enables you to block WhatsUp Gold users from the flow data.
8 Interfaces. Select one or more interfaces and click OK. Network Traffic Analysis saves your SNMP source which also displays in your NTA Sources Library (on page 356).
9 Check a report that reveals traffic totals for the network segment where there is no flow monitoring or where flow packets exported are only a sample (such as with Sflow-enabled devices).
Scope User Access to NTA Traffic Data You can scope user access to NTA traffic data from the NTA Source Library (SETTINGS menu > Network Traffic Analysis > NTA Sources). You can either:
Access Rights button in NTA Source Library. (After selecting a source from the grid.)
Access Rights button from the Add/Edit Flow Source dialog. (When adding a new or editing an existing source.)
Scoping user access from NTA Sources Library: 1 From NTA Source Library, select an existing source and click on Access Rights.
The Flow Source Access Rights dialog displays. 2 Click Block Access to hide source and destination data from the current device
for each selected user. 3 Click OK.
The current device will not be selectable from reporting and dashboard views of the users you blocked.
Scoping user access from NTA Add/Edit Flow dialog: 1 From NTA Source Library, select an existing NTA source or click add to create a
new NTA source. The Add/Edit Flow Source dialog displays.
2 Click the Access Rights button. The Flow Source Access Rights dialog displays.
3 Click Block Access to hide source and destination data from the current device for each selected user.
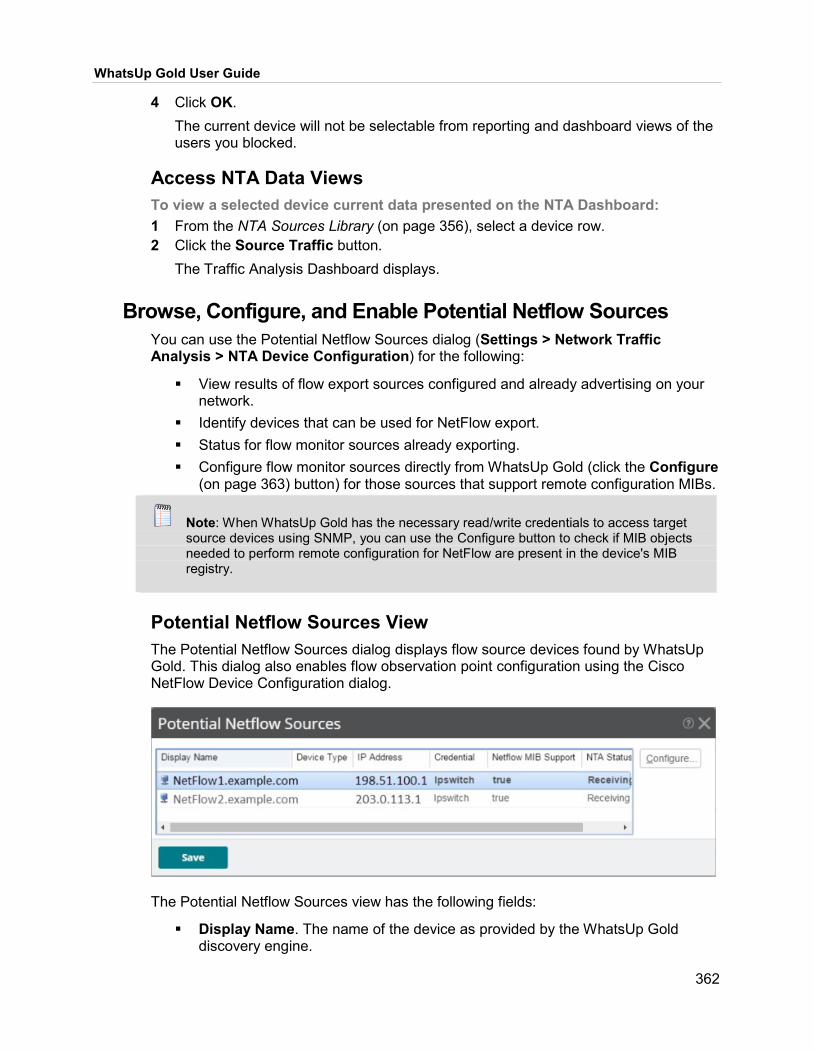
WhatsUp Gold User Guide
362
4 Click OK. The current device will not be selectable from reporting and dashboard views of the users you blocked.
Access NTA Data Views To view a selected device current data presented on the NTA Dashboard: 1 From the NTA Sources Library (on page 356), select a device row. 2 Click the Source Traffic button.
The Traffic Analysis Dashboard displays.
Browse, Configure, and Enable Potential Netflow Sources You can use the Potential Netflow Sources dialog (Settings > Network Traffic Analysis > NTA Device Configuration) for the following:
View results of flow export sources configured and already advertising on your network.
Identify devices that can be used for NetFlow export. Status for flow monitor sources already exporting. Configure flow monitor sources directly from WhatsUp Gold (click the Configure
(on page 363) button) for those sources that support remote configuration MIBs.
Note: When WhatsUp Gold has the necessary read/write credentials to access target source devices using SNMP, you can use the Configure button to check if MIB objects needed to perform remote configuration for NetFlow are present in the device's MIB registry.
Potential Netflow Sources View The Potential Netflow Sources dialog displays flow source devices found by WhatsUp Gold. This dialog also enables flow observation point configuration using the Cisco NetFlow Device Configuration dialog.
The Potential Netflow Sources view has the following fields:
Display Name. The name of the device as provided by the WhatsUp Gold discovery engine.

WhatsUp Gold User Guide
363
Device Type. The type of the device. Only Cisco devices can be remotely configured using the Cisco NetFlow Device Configuration dialog.
IP Address. The IP address of the device. Credentials. The name of the credential that will be used when authenticating
with the device. Netflow MIB. Displays a true if the device has the MIB object with the OID
matching the NetFlow MIB. Device can be configured by Network Traffic Analysis if the correct credentials are available.
Flow Monitor Status. Displays the status of the device with respect to Network Traffic Analysis.
Receiving - This device is currently sending flows to the flow collector.
Never Received - This device has never sent flows to the flow collector.
Disabled - This device exists as a source in Network Traffic Analysis, but is disabled.
Remotely Configure Cisco Netflow Device For devices with remote configuration MIBs enabled, the Cisco NetFlow Device Configuration dialog provides Network Traffic Analysis with the ability to configure a Cisco device to export flow records to the Network Traffic Analysis flow collector.
Use this dialog to:
Enter connection information and credentials used to connect to the Cisco device.
Set the NetFlow version to be used by the flow exporter. Set the active and inactive timeouts used for cache management. Select the interfaces from which you want the device to collect and send flow
data. Configure the NetFlow collectors, which in most cases includes Network Traffic
Analysis.
Enter the connection information and credentials to connect and authenticate with the Cisco network device.
Source IP address. Enter the IP address of the Cisco NetFlow enabled device from which you want to collect NetFlow statistics.
SNMP credentials. Select or create the SNMP credentials (on page 354) to use, with permission to write, to connect to the Cisco NetFlow enabled device. Click the browse (...) button to add, edit or delete SNMP credentials. Click the Advanced (on page 354) button to set SNMP timeout and retry parameters.
When you have selected valid SNMP credentials, the dialog queries the device and populates the NetFlow configuration parameters as well as the interface list. Use the Query button to update this information from the Cisco device. A message appears if you do not have a write credential.
Click Auto to automatically configure the device to collect and send flow data to Network Traffic Analysis. When automatically configured, the device enables collection of flow data on the device and adds itself as a netflow collector.

WhatsUp Gold User Guide
364
Enter the NetFlow configuration parameters to set the NetFlow version and configure the NetFlow cache on the Cisco device.
NetFlow version. Enter the NetFlow version you want the exporter to deliver the flow records.
Active timeout. Enter the Active timeout for flow records in the NetFlow cache. This value determines how long active, long-lived flows are kept in the NetFlow cache before sending to the collector (Range: 1-60 minutes) (Default: 2 minutes).
Important: In cases where Network Traffic Analysis is monitoring data flow between devices that have a long-lived connection, such as router linked between two office sites, you may get spikes in the flow data. Cisco routers by default break and send NetFlow stats every thirty-minutes for long-lived connections. To reduce the data spikes, change the router configuration with the following command: ip flow-cache timeout active <n>
Note: Where n is the number of minutes. The minutes should be configured to less than or equal to the NefFlow Data collection interval setting which is 2 minutes by default.
Inactive timeout. Enter the Inactive timeout value for flow records in the NetFlow cache. This value is used to ensure that completed or inactive flows are not kept in the NetFlow cache indefinitely. (Range 10 - 600 seconds) (Default: 30 seconds)
The Interface list displays the interfaces that can provide NetFlow data.
Name. Displays the interface name as configured on the Cisco network device. Ingress. Select this option if you want to collect flow statistics on incoming traffic
on this interface. Egress. Select this option if you want to collect flow statistics on outgoing traffic
on this interface.
Note: If you have selected to collect flow statistics from both Ingress and Egress traffic on a single interface, we recommend that you do not select to collect flow statistics from any other interface, otherwise traffic may be duplicated as traffic that is internally routed and appear on two interfaces within the device.
Enter the IP address and port number for the devices collecting Network Traffic Analysis traffic.
IP address. Enter the IP address of the collector. Port. Enter the Port number on which the collector is listening for flow data.
(Default port for Network Traffic Analysis: 9999)
Click Update to save the settings.

WhatsUp Gold User Guide
365
Configure Flow Export on Source Devices If you have devices such as routers that are discovered by WhatsUp Gold, but do not display in the NTA Sources Library (on page 356), this typically means that SNMP support for flow metrics and remote configuration of the device are not configured at the device. This section outlines how to perform these configuration tasks manually. It includes the following topics:
Configure Flow Export on NetFlow Devices (on page 365). Configure Flow Export on sFlow Devices. (on page 366) Configure Flow Export on Flexible NetFlow (on page 370)
Configure Flow Export Network devices must be configured to generate and send NetFlow data to Network Traffic Analysis. This is accomplished manually using the device's command line interface (CLI), or automatically through the Source configuration dialog (Flow Monitor > Configuration) for devices that are NetFlow enabled and have the Cisco NetFlow MIB (OID: 1.3.6.1.4.1.9.9.387).
To manually configure NetFlow enabled devices to send Flow data to the Network Traffic Analysis collector:
Caution: This procedure applies to a Cisco 1812 router and should not be used for other devices. The process for configuring a device to export Flow data varies widely from device to device and dependent upon your network configuration. Please see your router's documentation to determine the correct process for your device.
Step 1. Open the configuration interface for the router and enter the commands detailed in the following table to configure global options for all interfaces on the router.
Command Purpose
enable Enters privileged EXEC mode. Enter your password if prompted.
configure terminal Enters configuration mode.
ip flow-export version <version_number>
Example: ip flow-export version 5
Sets the version of the NetFlow protocol that should be used to export data. Network Traffic Analysis supports versions 1, 5, 7, and 9 only.
ip flow-export destination <IP> <port> Example:
Enables the router to export Flow data.
—where <IP> is the Network Traffic Analysis server's
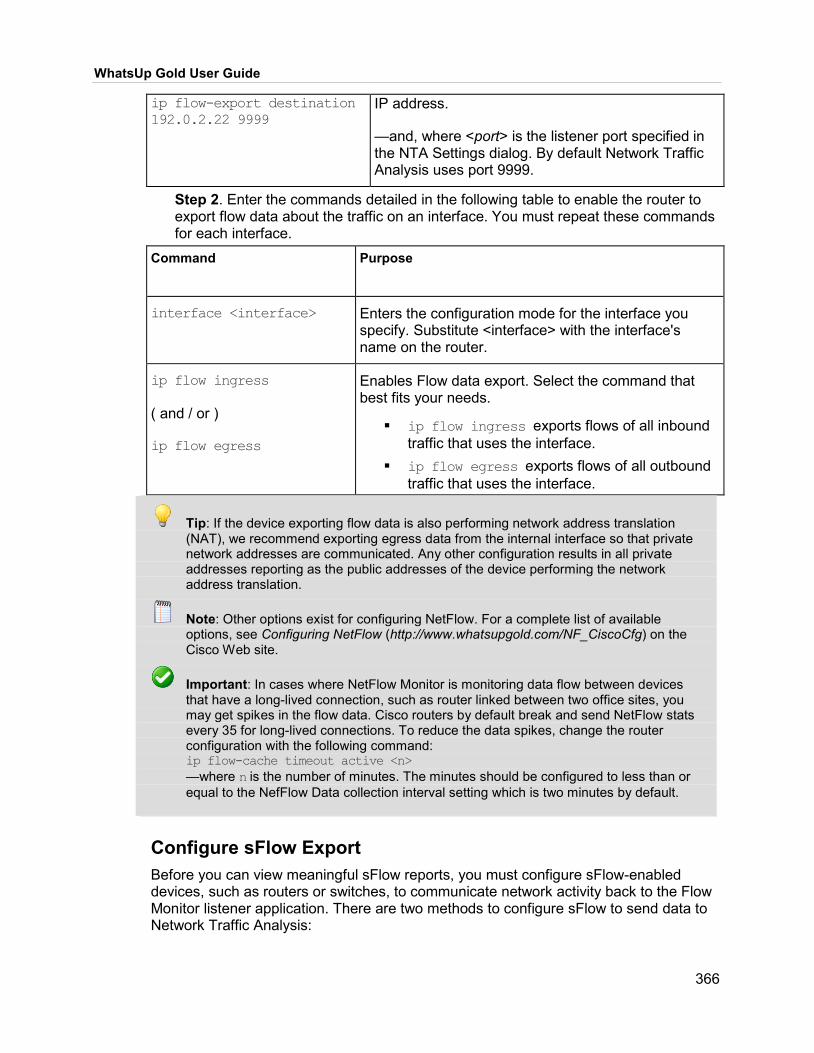
WhatsUp Gold User Guide
366
ip flow-export destination 192.0.2.22 9999
IP address.
—and, where <port> is the listener port specified in the NTA Settings dialog. By default Network Traffic Analysis uses port 9999.
Step 2. Enter the commands detailed in the following table to enable the router to export flow data about the traffic on an interface. You must repeat these commands for each interface.
Command Purpose
interface <interface> Enters the configuration mode for the interface you specify. Substitute <interface> with the interface's name on the router.
ip flow ingress
( and / or )
ip flow egress
Enables Flow data export. Select the command that best fits your needs.
ip flow ingress exports flows of all inbound traffic that uses the interface.
ip flow egress exports flows of all outbound traffic that uses the interface.
Tip: If the device exporting flow data is also performing network address translation (NAT), we recommend exporting egress data from the internal interface so that private network addresses are communicated. Any other configuration results in all private addresses reporting as the public addresses of the device performing the network address translation.
Note: Other options exist for configuring NetFlow. For a complete list of available options, see Configuring NetFlow (http://www.whatsupgold.com/NF_CiscoCfg) on the Cisco Web site.
Important: In cases where NetFlow Monitor is monitoring data flow between devices that have a long-lived connection, such as router linked between two office sites, you may get spikes in the flow data. Cisco routers by default break and send NetFlow stats every 35 for long-lived connections. To reduce the data spikes, change the router configuration with the following command: ip flow-cache timeout active <n> —where n is the number of minutes. The minutes should be configured to less than or equal to the NefFlow Data collection interval setting which is two minutes by default.
Configure sFlow Export Before you can view meaningful sFlow reports, you must configure sFlow-enabled devices, such as routers or switches, to communicate network activity back to the Flow Monitor listener application. There are two methods to configure sFlow to send data to Network Traffic Analysis:

WhatsUp Gold User Guide
367
Configure the sFlow device with the device OS commands using the command line interface (CLI). - or -
Configure the sFlow device using SNMP commands.
The following examples shows how to configure sFlow devices to send data to Network Traffic Analysis.
Configuring sFlow using the CLI To configure a sFlow enabled device to send sFlow data to Flow Monitor using the command line interface (CLI):
Caution: This procedure is an example that applies only to an HP ProCurve 3500 switch and should not be used for other devices. The process for configuring a device to export sFlow data varies widely from device to device and is dependent upon your network configuration.
The following example uses CLI configuration to enable sFlow on an HP ProCurve 3500 series switch. The configuration is for Flow Monitor running on a system with IP address 192.168.3.31 and receiving sFlow data on UDP port 9999.
1 Access the sFlow device via the command line interface (CLI). 2 Set the sFlow device IP (sFlow collector) using the following commands. Command Purpose
(config)# sflow 1 destination <ipaddress> <port>
Sets the sFlow receiving device address (192.168.3.31) and UDP port (9999). For example: (config)# sflow 1 destination 192.168.3.31 9999
(config)# sflow 1 sampling ethernet <interface ID> <sample every n packets>
Sets the sFlow sample rate for each interface (1-24). One out of every 128 packets will be collected in this example. For example: (config)# sflow 1 sampling ethernet A1-A24 128
(config)# sflow 1 polling ethernet <interface ID> <polling frequency in seconds>
Sets the sFlow polling interval. Polls every 30 seconds in this example. For example: config)# sflow 1 polling ethernet A1-A24 30
Configuring sFlow using SNMP The following example uses SNMP commands to enable sFlow on an HP ProCurve 2610 series switch. We recommend configuring the sFlow device via the device OS commands from the command line interface (CLI); however, some sFlow devices do not include this capability. In this case, you can use SNMP commands to configure sFlow. This configuration example is for Flow Monitor running on a system with IP address 192.168.3.31 and receiving sFlow data on UDP port 9999.

WhatsUp Gold User Guide
368
To configure an sFlow device, using SNMP commands, to send sFlow data to Flow Monitor:
Important: This procedure is an example that applies to an HP ProCurve 2610 switch and should not be used for other devices. The process for configuring a device to export sFlow data varies widely from device to device and is dependent upon your network configuration. Refer to the documentation to determine the correct process for your device.
Important: An sFlow device configured with the SNMP commands typically do not save the configuration to memory. If the device is rebooted, or power is lost, all sFlow configuration is lost and must be manually reset using the SNMP commands. Make sure that you save the SNMP configuration commands for future device configuration.
Note: Make sure that the sFlow device is configured to allow SNMP read/write access and make sure that you have the community string information for read/write access. Refer to the documentation to determine the correct process for your device.
1 Access the sFlow device via the console, Telnet, or SSH management interface. 2 Set the sFlow device IP (sFlow collector) using the following example commands. Command Purpose
setmib sFlowRcvrAddress.1 -o <collector IP address in hexadecimal format>
Sets the sFlow receiving device address. In this example, the IP address (192.168.3.31) must be provided as a hexadecimal value (C0A8031F). For example: setmib sFlowRcvrAddress.1 -o C0A8031F
Important: The example IP address must be entered as a hexadecimal value. Use an IP to hexadecimal calculator to determine the hexadecimal value for your sFlow collector's IP address. This example IP address breaks down into a hex value as follows: 192 = C0 168 = A8 3 = 03 31 = 1F
setmib sFlowRcvrPort.1 -i <port> Sets the sFlow receiving device port address. The default Flow Monitor port is 9999. For example: setmib sFlowRcvrPort.1 -i 9999
setmib sFlowRcvrOwner.1 -D <Display String value> sFlowRcvrTimeout.1 -i <Timeout
Sets the sFlow receiver owner. The -D is a TYPE-STR identifier that specifies a Display String value. This value can be any string, for

WhatsUp Gold User Guide
369
integer value> example NFmonitor (referring to Flow Monitor application which will receive the sFlow data).
The -i is a TYPE-STR identifier that specifies an Integer value. The 100,000,000 value is a timeout value that defines the timeout countdown starting point value (in milliseconds).
For example: setmib sFlowRcvrOwner.1 -D NFmonitor sFlowRcvrTimeout.1 -i 100000000
Note: Repeat the following settings for each interface on the sFlow device you want to monitor. The last number in the MIB OID represents the interface number.
setmib 1.3.6.1.4.1.14706.1.1.5.1.4.11.1.3.6.1.2.1.2.2.1.1.1.<interface integer value> For example: setmib 1.3.6.1.4.1.14706.1.1.5.1.4.11.1.3.6.1.2.1.2.2.1.1.1.1
setmib 1.3.6.1.4.1.14706.1.1.5.1.4.11.1.3.6.1.2.1.2.2.1.1.1.1 -i <sample every n packets>
Sets the sFlow sample rate. One out of every 128 packets will be collected in this example. For example: setmib 1.3.6.1.4.1.14706.1.1.5.1.4.11.1.3.6.1.2.1.2.2.1.1.1.1 -i 128
setmib 1.3.6.1.4.1.14706.1.1.5.1.3.11.1.3.6.1.2.1.2.2.1.1.1.1 -i <Enable/Disable sFlow integer value>
Enables sFlow on the device. 1 enables / 0 disables sFlow. For example: setmib 1.3.6.1.4.1.14706.1.1.5.1.3.11.1.3.6.1.2.1.2.2.1.1.1.1 -i 1
setmib 1.3.6.1.4.1.14706.1.1.6.1.4.11.1.3.6.1.2.1.2.2.1.1.53.1 -i <polling frequency in seconds>
Sets the sFlow polling interval. Polls every 30 seconds in this example. For example: setmib 1.3.6.1.4.1.14706.1.1.6.1.4.11.1.3.6.1.2.1.2.2.1.1.53.1 -i 30
setmib 1.3.6.1.4.1.14706.1.1.6.1.3.11.1.3.6.1.2.1.2.2.1.1.53.1 -i <Enable/Disable sFlow polling integer value>
Enables sFlow polling. 1 enables / 0 disables sFlow polling. For example: setmib 1.3.6.1.4.1.14706.1.1.6.1.3.11.1.3.6.1.2.1.2.2.1.1.53.1 -i 1

WhatsUp Gold User Guide
370
Configuring Flexible NetFlow on a Cisco device Flexible NetFlow can be used to support the implementation of Cisco Network Based Application Recognition (NBAR) technology. To configure a network device to use Flexible NetFlow, perform with the following configuration steps:
1 Create a flow monitor 2 Define the flow record (use one of the two configuration methods) 3 Create a flow exporter
These tasks are described in the following sections, using an example configuration to illustrate how to complete the tasks from the Cisco IOS command line interface (CLI).
Important: The network device you want to configure must be running a Cisco IOS release that supports Cisco IOS Flexible NetFlow.
Creating a flow monitor The following example illustrates how to configure a Flexible NetFlow enabled device to utilize Flexible NetFlow in support of NBAR and Network Traffic Analysis application monitoring. For more information see the Cisco IOS Flexible NetFlow configuration guide (http://www.whatsupgold.com/CiscoIOSFlexibleNetFlow).
To create a flow monitor: 1 Enter the privileged EXEC mode, and then enter the global configuration mode.
Router> enable
Router# configure terminal 2 Create a flow monitor, and enter the flow monitor configuration mode.
Router(config)# flow monitor application-mon Router(config-flow-monitor)# description app traffic analysis
Router(config-flow-monitor)# cache timeout active 60
Defining a flow record There are two methods to define a flow record to use Flexible NetFlow. The first, and simplest to configure option, is to run a command on the Cisco device to configure sources with a predefined format as follows:
(Option 1) To define a flow record: Run the following command on the Cisco device for which you want configure
Flexible NetFlow sources: record netflow ipv4 original-input
- or -
record netflow ipv6 original-input
- or - record netflow original-input

WhatsUp Gold User Guide
371
(Option 2) To define a flow record: 1 Enter the privileged EXEC mode, and then enter the global configuration mode.
Router > enable
Router# configure terminal 2 Enter the flow monitor configuration mode.
Router(config)# flow monitor application-mon 3 Name the record and enter a description.
Router(config-flow-monitor)# flow record nbar-appmon
Router(config-flow-record)# description NBAR Flow Monitor 4 Define key boxes, using the match keyword.
Router(config-flow-record)# match ipv6 tos
Router(config-flow-record)# match ipv6 protocol
Router(config-flow-record)# match ipv6 source address Router(config-flow-record)# match ipv6 destination address
Router(config-flow-record)# match transport source-port
Router(config-flow-record)# match transport destination-port
Router(config-flow-record)# match interface input
Router(config-flow-record)# match application name
Note: By using the application name as a match parameter, you can utilize Network Based Application Recognition (NBAR) to collect statistics and report on network usage by individual applications.
5 Define nonkey boxes, using the collect keyword. Router(config-flow-record)# collect interface output
Router(config-flow-record)# collect counter bytes
Router(config-flow-record)# collect counter packets
Router(config-flow-record)# collect transport tcp flags (for networks using the BGP protocol, include the following two commands) Router(config-flow-record)# collect routing source as
Router(config-flow-record)# collect routing destination as 6 Enter the flow monitor configuration mode and configure the flow monitor to use
the newly configured record.

WhatsUp Gold User Guide
372
Router(config)# flow monitor application-mon
Router(config-flow-monitor)# record nbar-appmon
Creating a flow exporter When the record is complete, you can create the flow exporter. This component exports records from the flow monitor on the network device to the flow collector, in this case Flow Monitor.
To create a flow exporter: 1 Enter the privileged EXEC mode, then enter the global configuration mode.
Router > enable
Router# configure terminal 2 Create and describe the flow exporter.
Router(config)# flow exporter export-to-ipswitch-flow-monitor
Router(config-flow-exporter)# description Flexible NF v9 3 Set the destination flow collector IP address.
Router(config-flow-exporter)# destination <Collector IP Address> 4 Define the PDU type and destination port.
Router(config-flow-exporter)# transport udp 9999
Note: Port 9999 is the default port for Flow Monitor
5 Set options for exporter operation. Router(config-flow-exporter)# template data timeout
6 Enter the global configuration mode and configure the flow monitor to use the new flow exporter. Router# configure terminal Router(config)# exporter export-to-ipswitch_flow_monitor
Aggregating Sources You can aggregate (organize) traffic metrics handled by one or more specific network interfaces into single views using aggregate sources. Aggregate sources can be selected like other sources for purposes of dashboards and reporting. An aggregate source combines data from all of the assigned interfaces, and reports on that data as if it originated from a single Network Traffic Analysis source.
Create an aggregate source: 1 Go to SETTINGS menu > Network Traffic Analysis > NTA Sources.
The NTA Source Library displays. 2 Select Add > Aggregate Source.

WhatsUp Gold User Guide
373
The Interface Aggregation dialog displays. 3 Type in and select the following. Aggregate Name. Type in a name for your group of interfaces. For example,
Aggregated Interfaces from Proxy to Load Balancer.
Enable Interface Aggregation. Click the checkbox to enable these interfaces to be counted against your Network Traffic Analysis licensing.
Interfaces. Click Add to browse for and select interfaces to add to your aggregate source.
4 Click OK and check the NTA Sources Library (on page 356) for your new aggregate source.
Grouping Traffic NTA IP Groups enable you to divide monitored traffic into organized chunks that align better with site policies, divisions, departments, stakeholders, or other reasons for grouping.
Examples where it is useful to divide and organize traffic into groups can include:
Domain name. Top level domain (.com, .org, .edu, .de, and so on). By country. A single or custom range of IP addresses.
Tip: After you configure a group, you can use that group's name to filter reports to show only the traffic sent to or received by devices that belong to the group.
To create or edit an IP group: 1 Open the NTA Applications Library (SETTINGS menu > Network Traffic Analysis
> NTA IP Groups). The IP Groups Library displays.
Click 'add' ( ). The IP Group Settings dialog displays.
—or—
Select a group, then click 'edit' ( ). The IP Group dialog appears. 2 Enter or select the appropriate information: Group. Enter a name for the NTA IP group.
IP Range Start. Enter the first IP address for the NTA IP group range.
IP Range End. Enter the last IP address for the NTA IP group range.
Domain. Enter the domain that you want Network Traffic Analysis to report for the specified IP addresses. For example, yourcompany.com.

WhatsUp Gold User Guide
374
Top Level Domain. Select the domain that you want Network Traffic Analysis to report for the specified IP addresses. For example, com.
Country. Select the country that you want Network Traffic Analysis to report for the specified IP addresses.
3 Click OK to save changes. 4 View group data. —After a few minutes, check for the latest groups report. For
example, check for IP grouped traffic data in one of the following: Top Endpoint Groups (on page 544).
Top Sender Groups (on page 513).
Top Receiver Groups (on page 492).
Classifying Traffic by Port Number You can help identify traffic that is considered unclassified by associating source and destination ports (or both) with a protocol or application by way of the NTA Applications Library. Network Traffic Analysis considers network traffic to be "unclassified" when both source and destination ports are either outside the well-known port range or not classified in the Application Library.
To edit a port to application relationship: 1 Open the NTA Applications Library (SETTINGS menu > Network Traffic Analysis
> NTA Applications). The NTA Applications Library dialog displays.
2 Click a value in a table cell and type in a new value or click the Add button to map additional ports to the current protocol.
3 Click Save. 4 Check report data such as the Top n Applications (on page 538) or Top n
Conversations (on page 541) report for the mapping you applied. Conversely, these mappings should remove them from the Unclassified Traffic report.
To add a port mapping: 1 Open the NTA Applications Library (Settings > Network Traffic Analysis > NTA
Applications). The NTA Applications Library dialog displays.
2 Click Add. Application. Type in a name/label you want to associate with the port. Example:
Apache Tomcat.
Port or Range. Add a port or range. Example: 8088
TCP/UDP/SCTP/DCCP. Expected transport protocol (select one). Example: TCP
Subnets. Add subnet IPs if you want these rules to apply only to certain network segments.
3 Add more ports and click Save, or just click Save.

WhatsUp Gold User Guide
375
4 Check report data such as the Top n Applications (on page 538) or Top n Conversations (on page 541) report for the mapping you applied. Conversely, these mappings should remove them from the Unclassified Traffic report.
Adding Custom Labels for Type of Service (ToS) IDs
The Flow Types of Service dialog (SETTINGS menu > Network Traffic Analysis > NTA Types of Service) lists the Flow Types of Service and their associated service IDs. Types of Service (ToS) is a part of an IP specification suite (https://tools.ietf.org/html/rfc1349) that allows routers to use routing protocols that help optimize how data is routed (according to the type of service requested). The ToS field is assigned by the routers on your network.
You can assign service type display names to make the Top Types of Service dashboard report more meaningful to you. By default Network Traffic Analysis is configured with the standard types of service.
Applying User-Defined Name to Type of Service 1 To rename a Type of Service, select it from the list, then click 'edit' ( ). 2 Use The Edit Type of Service dialog to assign a display name to a Type of
Service. Service ID. This is a numeric value that is automatically assigned by the router.
Type of Service. Enter the desired ToS display name. The name will also display in the Network Traffic Analysis Types of Service dialog, and the Top Types of Service dashboard report (on page 532).
3 Click OK to save changes.

WhatsUp Gold User Guide
376
Listener Port, Collection, and Retention Settings NTA Settings dialog (SETTINGS menu > Network Traffic Analysis > NTA Settings) provides NTA system and application settings such as logging, listening port, data retention, and data management properties.
(General settings) Listener(s). Specify the TCP/IP port number and/or IP address on which the
Network Traffic Analysis collector service should listen to receive flow packets, or leave blank to keep the default setting. Network Traffic Analysis can listen on one or more ports/IP addresses.
If you do not specify a port number, 9999 is the designated default.
If you do not define an IP address or you specify a value of "0.0.0.0", the NTA collector listens on all IP addresses (all IP addresses configured for the device where the collector is running).
Note: If you configure Network Traffic Analysis to listen on a port other than default port, verify the port is not being used by another service. Additionally, if you are using Windows Firewall, ensure that an exception is added to the firewall.
Log level. Select the log level details. Each level includes higher levels of severity. Verbose includes Normal and Error, for example.
Errors Only. Record log messages that are errors.
Normal. Record log messages with error and information-level severity.
Verbose. Select for the highest level of logging detail. Best for troubleshooting. This option can generate a lot of log messages and be resource intensive.
Data collection interval. Select how often Network Traffic Analysis writes raw data from its sources to the database. You may select 1, 2, 3, 4, 5, or 10 minutes. By default, raw data is written to the database every 2 minutes.
Note: Modifying collection interval settings affects the granularity and sampling revealed in Network Traffic Analysis reports. If the interval is set to five minutes, you cannot distinguish traffic collected during the first minute from traffic collected during the fourth minute.
Resolve private address interval. When the Network Traffic Analysis collector service encounters an IP address, it tries to determine information about the host attached to the IP address. After this information is resolved, it is stored in the Network Traffic Analysis database. Enter the interval (in hours) that you want Network Traffic Analysis to wait, before it checks the private IP address again, to resolve information that may have changed for the address. By default, private addresses are resolved every 48 hours.

WhatsUp Gold User Guide
377
Resolve public address interval. When the Network Traffic Analysis collector service encounters an IP address, it tries to determine information about the host attached to the IP address. After this information is resolved, it is stored in the Network Traffic Analysis database. Enter the interval (in hours) that you want Network Traffic Analysis to wait, before it checks the public IP address again, to resolve information that may have changed on the address. By default, public addresses are resolved every 720 hours (30 days).
Tip: Because public IP addresses are less likely to be changed, you may want to use longer intervals than used for the Resolve private address interval option.
Expire unclassified traffic after. Enter the number of hours after which Network Traffic Analysis should purge unclassified traffic. Unclassified traffic is traffic transmitted over ports that are currently not monitored by Network Traffic Analysis. By default, this option is set to 1, which causes Network Traffic Analysis to aggregate and retain data for all unclassified ports as a single value; detailed information about the individual unclassified ports over which traffic was transmitted is discarded.
Important: Be cautious about increasing the time for Expire Unclassified Traffic After value because the Network Traffic Analysis database can grow very large as the time is increased.
Note: The collector will purge any unclassified data that has no activity after the Expire Unclassified Traffic After threshold value is satisfied.
Data retention You can use the data retention section of the Flow Monitor Settings dialog to set data retention parameters for flow and interface data. Periodic roll-up and archiving of flow data minimizes system resources needed for data storage and improves system responsive during data intensive operations.
Data retention settings You can either manually tune data retention or allow Network Traffic Analysis to self-tune and optimize retention of flow data. Tuning is necessary to manage the growth rate of the Network Traffic Analysis databases.
Flow data includes many parameters (input and output interfaces, source and destination IP addresses, port numbers, byte rates, flow end times, and so on) which provide useful information at the price of storage. Rolling up the data makes for efficient storage, but there may be losses of time-related information within individual flows.
The following parameters are used to control the cleanup of flow data.
Auto tune flow data retention. When selected, Network Traffic Analysis collector optimizes the flow data cleanup settings. Use these controls to manage database size with regards to system performance. Auto tune is set by default. It is best practice have Auto tune of flow data retention enabled.

WhatsUp Gold User Guide
378
Percentage of traffic to retain. Use this option to determine the percentage of raw traffic the collector will write to the database. You must clear the Auto tune flow data retention check box for access to this setting.
Caution: While the default settings for data cleanup are conservative, when you modify the roll-up settings it can directly affect the size of the Network Traffic Analysis databases and the performance of the application. Take care when you modify these settings. Monitor the effects of these changes to these settings on Network Traffic Analysis collector database size (on page 634) and application performance.
Note: When you place the cursor in a box to change a value, a message appears at the bottom of the dialog. This message provides information about the number and percentage of the recommended maximum flow records being stored in the Network Traffic Analysis data and archive databases. As you make changes, the message predicts how the change affects the number of records stored in the Network Traffic Analysis data and archive databases.
Retain raw data for. Specify the minimum number of hours of raw flow packet data to retain or keep the default value (4 hours). This setting establishes a sliding time window of raw flow packet data. At the end of the period constrained by this window, raw flow data is rolled up. The roll up of raw data happens every hour, on the hour. After data has been rolled up, Network Traffic Analysis can only report using the hourly summations.
Retain hourly data for. Specify the number of days you would like to maintain hourly data or keep the default value (24 hours). This setting establishes a sliding time window of hourly data that spans the specified number of days. As hourly data ages beyond this period it is rolled up. The roll up of hourly data takes place daily. After hourly data is rolled up, Network Traffic Analysis can only report aggregated totals for the entire 24-hour block of time.
Retain daily data for. Specify the minimum number of days to maintain daily data before archiving it or keep the default value (3 days). As daily data ages beyond this period, it is archived. Network Traffic Analysis continues to have visibility into archived data with some restrictions. This is implemented using a sliding time window of daily data. For example, if you save one day's data before archiving, the limits of the period would be all data from the 24 hour period in the past until now.
Retain archive data for. Specify the minimum number of days of archived data to maintain or keep the default value (7 days). This setting establishes a sliding time window of archived daily data that spans the specified number of days. After archived data extends beyond the period specified, it is purged from the flow collector database. Network Traffic Analysis can no longer report on data once it is purged.
Collector Database Maintenance Use the Network Traffic Analysis Database Table Maintenance (SETTINGS menu > Network Traffic Analysis > NTA Record Maintenance) dialog to perform table maintenance on the Network Traffic Analysis database and archive database.

WhatsUp Gold User Guide
379
Regularly purging database tables can improve performance of Network Traffic Analysis.
Important: Purged data cannot be recovered. Make sure that you export and save any Flow data you need for your records.
Step 1: Stop the Ipswitch Flow Collector Service To perform any of the purge actions listed in this dialog, you must first stop the Flow Collector service.
1 From the Network Traffic Analysis Database Table Maintenance dialog (SETTINGS menu > Network Traffic Analysis > NTA Record Maintenance) , click on the Stop Service button. An alert box confirms the service shutdown.
2 Click the Start Ipswitch NTA Collector upon completion checkbox. 3 Enter a freshness period in days using the Delete log records older than text
box. 4 Select the category of database item(s) you want to purge.
Step 2: Select items to purge When the Ipswitch Flow Collector service has been stopped, you can select the Network Traffic Analysis database tables you want to purge.
Purge the log table. Select this option to purge the log table. The log table holds messages generated by Network Traffic Analysis about the status of Network Traffic Analysis, as well as errors and warnings that have occurred during operations.
Purge temporary tables. Select this option to purge host update and flush tables. These tables temporarily hold data during the configuration and flushing of flow data.
Purge flow tables. Select this option to purge flow data. This table holds flow data gathered from the NetFlow exporter on the Network Traffic Analysis source, this information includes source and destination IP addresses, with traffic values in number of flows, packets and bytes.
Purge the Host table. Select this option to purge host data. This table holds information on hosts discovered during the processing of flow information, and successfully resolved using DNS.
Purge the Interface table. Select this option to purge interface traffic data. This table holds information about interface traffic, including traffic values in number of flows, packets and bytes.
Purge NBAR tables. Select this option to purge NBAR information gathered by Network Traffic Analysis. These tables hold information gathered using NBAR, including application identification as well as traffic values in number of packets and bytes.

WhatsUp Gold User Guide
380
Purge flows with unclassified ports. Select this option to purge flows with unclassified ports from the Data table. Ports are classified by mapping the port to an application.
Purge the Archive Flow table. Select this option to purge archived flow data. This table holds archived flow information, includes source and destination host identification as well as traffic values in number of flows, packets and bytes.
Purge the Archive Host table. This table holds archived host information discovered during the processing of flow information.
Purge the Archive Interface table. Select this option to purge interface traffic data. This table holds archived information about interface traffic, including traffic values in number of flows, packets and bytes.
Purge the Archive NBAR table. Select this option to purge NBAR information gathered by Network Traffic Analysis. This table holds archived information gathered using NBAR, including application identification as well as traffic values in number of packets and bytes.
Step 3: (optional) Maintain log data during a purge You can configure Network Traffic Analysis to keep a given number of days of log data during a purge of the Log table.
Enter the number of days of logs you want Network Traffic Analysis to maintain in Delete log records older than xx days. Log data that is older than the configured number of days will be purged from the Log table.
Step 4: Initiate the purge (and with immediate restart of collector service) After you have selected or configured all of the appropriate database table maintenance tasks:
1 Ensure Start Ipswitch Flow Collector service upon completion is checked (otherwise, you will need to restart the Flow Collector service from SETTINGS menu > System Services).
2 Review your selections, then click Purge to begin database maintenance. The database maintenance process could be lengthy depending on the size of the tables in your Network Traffic Analysis database and archive database.
Important: Do not navigate away from this page or close the Web browser until the process finishes completely. Failure to wait on the process to complete may result in database corruption or data loss.
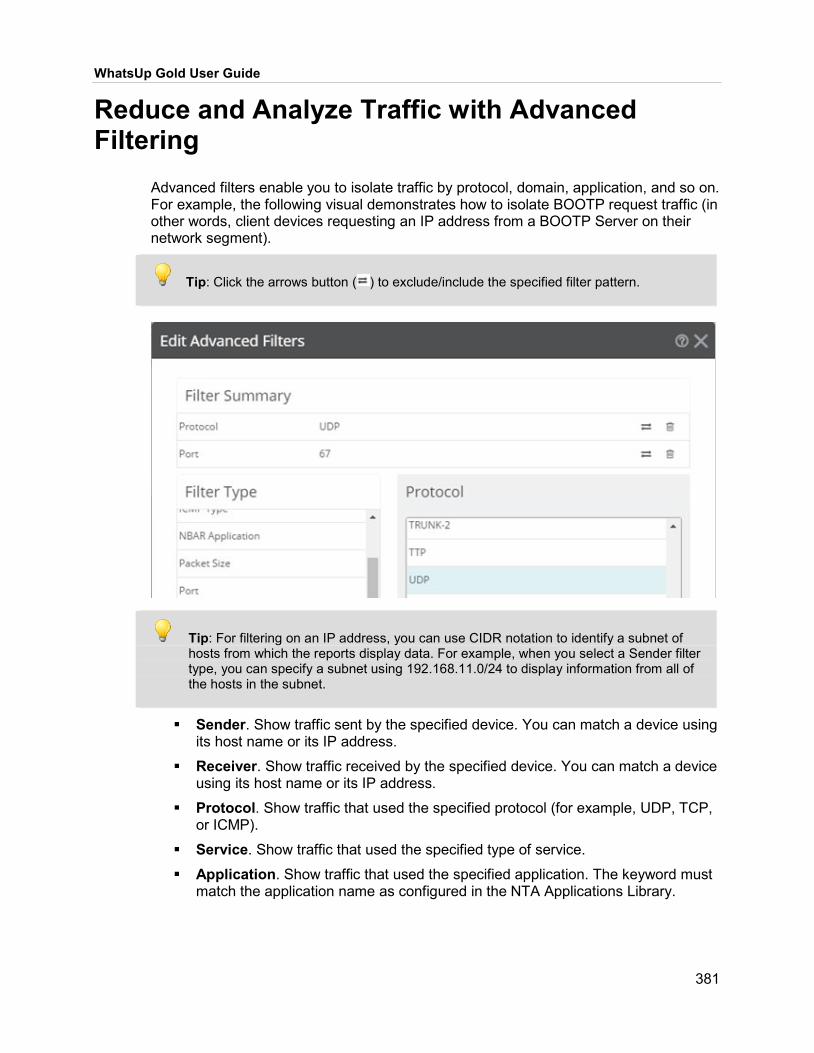
WhatsUp Gold User Guide
381
Reduce and Analyze Traffic with Advanced Filtering
Advanced filters enable you to isolate traffic by protocol, domain, application, and so on. For example, the following visual demonstrates how to isolate BOOTP request traffic (in other words, client devices requesting an IP address from a BOOTP Server on their network segment).
Tip: Click the arrows button ( ) to exclude/include the specified filter pattern.
Tip: For filtering on an IP address, you can use CIDR notation to identify a subnet of hosts from which the reports display data. For example, when you select a Sender filter type, you can specify a subnet using 192.168.11.0/24 to display information from all of the hosts in the subnet.
Sender. Show traffic sent by the specified device. You can match a device using its host name or its IP address.
Receiver. Show traffic received by the specified device. You can match a device using its host name or its IP address.
Protocol. Show traffic that used the specified protocol (for example, UDP, TCP, or ICMP).
Service. Show traffic that used the specified type of service.
Application. Show traffic that used the specified application. The keyword must match the application name as configured in the NTA Applications Library.

WhatsUp Gold User Guide
382
Tip: You can enter a port number instead of an application name to show all traffic transmitting over a certain port.
Sender Domain. Show traffic sent by hosts on the specified domain.
Receiver Domain. Show traffic received by hosts on the specified domain.
Sender Location. Show traffic sent by devices whose IP addresses are registered to a country, state, subdivision, or city.
Receiver Location. Show traffic received by devices whose IP addresses are registered to a country, state, subdivision, or city.
Sender Group. Show traffic sent by the specified group.
Receiver Group. Show traffic received by the specified group.
Sender TLD. Show traffic sent by domains that have the specified top level domain (such as .com, .net, .us, or .uk).
Receiver TLD. Show traffic received by domains that have the specified top level domain (such as .com, .net, .us, or .uk).
ICMP Type. Show traffic by ICMP type.
Packet Size. Show traffic by packet size.
Sender ASN. Show traffic by sender Autonomous System Number (ASN).
Receiver ASN. Show traffic by receiver Autonomous System Number (ASN).
NBAR Application. Show traffic by NBAR classified application.
Port. Show traffic by port number.

383
CHAPTER 12
Applying System Tasks In This Chapter Using WhatsUp Gold System Tasks ..................................... 384
Changing Log Persistence Settings ...................................... 384
WhatsUp Gold System Tasks Library (SETTINGS menu > Libraries > WhatsUp Gold System Tasks Library) includes built-in task types you either run or copy, refine, and run to perform common and recurring system administration tasks.
Note: Not all WhatsUp Gold System Tasks can be copied and modified.
System Tasks Library ships with the following task types:
Alert Center DB Maintenance. Cleans the AlertCenterItems and AlertCenterLog tables.
APM Hourly Availability Rollup. Rolls application availability data.
Defrag Performance Tables. Manages hourly roll-up of application instances, component instances, and group instances availability data.
Delete Daily Rollup Data. Delete daily roll up data.
Diagnostics and Usage. Sending telemetry data helps Ipswitch improve its products and services.
Dynamic Group Membership Updater. Calls the SP which updates the devices in dynamic groups for the PivotDeviceToDynamicGroup table.
NetFlow Database Backup. Performs a database backup of the NetFlow SQL database, which stores data for Network Traffic Analysis.
NFArchive Database Backup. Performs a database backup of the NFArchive SQL database, which stores archived data for Network Traffic Analysis.
WhatsUp Database Backup. Performs a database backup of the Network Performance Monitor SQL database, which stores data for Network Performance Monitor and any plug-in product except for Network Traffic Analysis.
Group Updater. Update device groups.
Purge Expired Action Activity Data. Clean expired data related to Action Manager.
Purge Expired APM Data. Clean expired data and configurations.
Purge Log Tables. Cleans various log tables.
Purge Report Data. Cleans all reports tables.

WhatsUp Gold User Guide
384
Roll up Hourly Raw Statistical Data. Clean up hourly raw data store used for reporting.
Roll up Raw Statistical Data. Clean up raw data store used for reporting.
Trim WindowsSystemLog table. WindowsSystemLog database maintenance.
Virtualization Sync. Synchronizes Virtual Monitoring database with the central device inventory.
Important: At this time, task pass and fail events are not logged in the Network Performance Monitor log reports. While errors are logged for all non-database backup tasks, they are not for database backup tasks.
Using WhatsUp Gold System Tasks To create a new WhatsUp Gold System Task: 1 From the WhatsUp Gold System Tasks Library (on page 383), click on 'new' ( ),
and select a WhatsUp Gold System Task type (on page 383). New WhatsUp Gold Task dialog appears.
2 Enter or select the appropriate information: Name. System task name.
Description. (Optional) short description.
Enable this schedule. Select to apply a schedule.
Send Interval radio buttons and day selection become active.
Start time. Configure the time of day the scheduled task begins.
Send Interval. Select a frequency or select Custom to specify it. You can configure the task to run on a custom, daily, weekly, monthly, or yearly schedule.
3 Click OK to save changes.
Changing Log Persistence Settings Log persistence settings are set to 8760 hours (one year). If you want to change this setting, go to the following location on your computer: HKEY_LOCAL_MACHINE\SOFTWARE\Ipswitch\Network Monitor\WhatsUp Engine\Database Settings\Log Expiration Settings
The following table displays which tables are associated with each registry key:

WhatsUp Gold User Guide
385
Registry Key Name Associated Report Name
Action Activity Log Expiration Time Limit
Action Log (on page 797)
General Error Log Expiration Time Limit
General Error Log (on page 806)
Passive Monitor Error Log Expiration Time Limit
Passive Monitor Error Log (on page 811)
Performance Monitor Log Expiration Time Limit
Performance Monitor Error Log (on page 811)
Recurring Report Log Expiration Time Limit
Recurring/Scheduled Report Log (on page 818)
System Activity Log Expiration Time Limit
Activity Log (on page 800)
Web Alarm Log Expiration Time Limit
N/A
Web User Activity Log Expiration Time Limit
Web User Activity Log (on page 827)
Configuration Management Config Expiration Time Limit
Configuration Management Task Log (on page 824)
Logger Expiration Time Limit Logger Health Messages (on page 810)
Wireless Logger (WrlsLog) Expiration Time Limit
Wireless Log (on page 731)

386
CHAPTER 13
WhatsUp Gold Settings In This Chapter System Services ................................................................... 387
System Settings .................................................................... 387
Scheduling Activities ............................................................. 395
Configuring Actions and Alerts .............................................. 395
Accessing WhatsUp Gold Libraries ....................................... 395
Scheduling Activities ............................................................. 396
Configuring Application Monitoring-specific Settings ............. 396
Configuration Management Settings ..................................... 397
Network Traffic Analysis Settings .......................................... 397
Virtual Settings ..................................................................... 397
Wireless Settings .................................................................. 397
Selecting SETTINGS from the top menu navigation provides access to multiple interfaces where you can configure and customize a number of features within WhatsUp Gold to fit your specific monitoring needs:
System Services (on page 387). Manage individual WhatsUp Gold services and monitor database usage.
System Settings (on page 387). System-specific defaults, and database constraints (on page 386).
Users & User Groups (on page 406). Create, modify, and remove individual user accounts or groups of users from WhatsUp Gold.
Actions & Alerts (on page 395). Access the action policy and Alert Center libraries.
Libraries (on page 395). Access the credential, monitor, role editor, and system task libraries.
Scheduling Activities (on page 395). Configure business hours, scheduled reports, and recurring actions.
Application Monitoring (on page 396). Set application state parameters, data retention times, global application attribute names, and other settings specific to monitoring application performance.
Configuration Management (on page 307). Manage, archive, audit, monitor, and ensure policy compliance of your application, network infrastructure, and device configurations.

WhatsUp Gold User Guide
387
Network Traffic Analysis (on page 346). Manage and configure router-based and interface-level network traffic monitoring with a powerful report and analysis capability.
Virtual Monitoring (on page 397). Specify the expiration timeframe for collected virtual event log data and the polling interval for the applicable monitoring service.
Wireless Monitoring (on page 397). Specify global settings applicable to all wireless device monitoring, data collection, and retention as well as manage wireless client groups and excluded rogues.
System Services The System Services panel (SETTINGS menu > System Services) allows you to monitor WhatsUp Gold database usage and manage WhatsUp Gold services.
The Database Status section reports the names of each database in use by WhatsUp Gold along with their respective capacity and current usage statistics.
The Services Status section lists each process in use by WhatsUp Gold. Use the checkboxes to the left of the service descriptions with the following controls to manually administer WhatsUp Gold services either individually or in bulk:
Start the selected service or services. If no service is selected, click this icon to start all services.
Stop the selected service or services. If no service is selected, click this icon to stop all services.
Restart the selected service or services.
Start all services.
Stop all services.
System Settings The Systems Settings menu provides access to a number of configuration options you can use to customize specific areas within your WhatsUp Gold setup.
Alert Center Data Retention. Specify how long Alert Center should keep both log and item data.

WhatsUp Gold User Guide
388
Alert Center Email Notification. Specify the maximum number of email notifications generated by Alert Center for both new and existing alarmed items.
Default Email Settings. Configure email account and SMTP server settings to be used by WhatsUp Gold when generating notifications.
External Authentication. Configure WhatsUp Gold user authentication using existing Active Directory/Lightweight Directory Access Protocol (LDAP) or Cisco ACS settings.
General Settings. Enable individual WhatsUp Gold features and functionality, specify data rollup timeframes for monitors, and configure the application to launch either online or local help files.
Warning: The General Settings dialog includes the Allow Auto-Login feature which when enabled allows you to manually include login credentials within the WhatsUp Gold URL for the purposes of sharing your network monitoring environment with non-users. Please be aware that enabling Auto-Login could introduce a potential security risk to WhatsUp Gold and your network environment. Ipswitch does NOT recommend enabling this feature unless absolutely necessary. Example Auto-Login URL: https://<servername>/NmConsole/?u=<username>&p=<password>.
Note: When using the Auto-Login feature, unencrypted usernames and passwords in the URL cannot contain special characters.
Passive Monitor Listeners. Configure behavior applicable to SNMP traps, Syslog settings, and Windows event log settings as well as passwords required for using JMX monitors and application components.
Polling Configurations. Manage configuration settings applicable to poller applications installed on remote devices.
SNMP MIB Manager. Validate MIB files imported into or existing in WhatsUp Gold.
Manage SNMP MIBs WhatsUp Gold SNMP MIB manager enables you to:
View (on page 389). Browse/open a MIB file selected from the WhatsUp Gold local library (actual ASN1 syntax and comments).
Add (on page 388). Import/compile MIB modules, custom, and enterprise MIB extensions not already contained by the WhatsUp Gold local library.
Reload. Recompile newly added/changed modules. Status. View module compile and dependency status.
Import MIB Definitions WhatsUp Gold enables you to import additional MIB definitions to its local collection. You leverage these trees when querying and browsing MIBs on monitored devices.

WhatsUp Gold User Guide
389
The local store/MIB manager provides:
A visual aid and browsable reference of the MIB objects and types used by various vendors and OSI layers (https://www.ietf.org/rfc/rfc1136.txt).
A helpful reference for cases where proprietary MIB extensions (or similar) are defined at the target device.
A way to validate ASN1.
Tip: MIB source files can be found in Program Files\Ipswitch\WhatsUp\Data\Mibs.
Import a MIB definition To add a MIB definition to the local tree represented by WhatsUp Gold in the MIB browser:
1 Open the SNMP MIB Manager (on page 388) (SETTINGS menu > General Settings > SNMP MIB Manager).
2 Click 'add' ( ). 3 Select a MIB file (.my extension) to compile it and add it to the collection/tree
representation in WhatsUp Gold. 4 Check compile status and troubleshoot module syntax/dependencies (on page
389) if needed.
Handling MIB Syntax or Dependency Errors There are two main errors that can occur when uploading MIB files into WhatsUp Gold using the MIB Manager:
Dependency errors. The most common. Dependency errors occur when a module's syntax compiles but cannot link with another MIB table that the new/modified MIB module requires.
Syntax errors. Syntax occurs when the ASN2 syntax (the source code grammar used for MIB tables) is not valid.
Tip: To fix syntax errors you can adjust .my file in place according to error messages displayed by MIB manager, then Reload. For dependency errors, you will need to download the missing .my files and refresh the MIB collection (or fix syntax errors for dependency MIBs).
View MIB Definitions Select and click a MIB module listed in the SNMP MIB Manager (on page 388) to view:
ASN1 syntax of contained in the MIB source file. Path on disk of the source file. MIB object compile status.

WhatsUp Gold User Guide
390
Tip: MIB source files can be found in Program Files\Ipswitch\WhatsUp\Data\Mibs.

391
CHAPTER 14
About WhatsUp Gold Distributed Edition In This Chapter Configuring WhatsUp Gold Distributed Edition ...................... 391
WhatsUp Gold Distributed Edition extends the capabilities of the application to multiple remote networks. This solution includes a central installation and one or more remote installations of WhatsUp Gold. A single instance of WhatsUp Gold is determined to be either the central site or a remote site in a distributed environment based solely on the license used during installation. The central site installation coordinates data feeds from remote site installations and the network data collected from remote sites can be viewed in WhatsUp Gold reports on the central site. Together, the central and remote installations provide high visibility to multiple networks from one location.
Configuring WhatsUp Gold Distributed Edition Settings specific to WhatsUp Gold Distributed Edition must be configured in both the web interface and in the Admin Console application.
Admin Console On the central WhatsUp Gold installation, launch the Admin Console application from the Windows Start menu, then select Configure > Program Options > Central Site Configuration. First, enable Allow Remote Site connections to this Central Site to access additional configuration settings. Next, enter the TCP Port, User Name, and Password specified during Remote Site installation. If desired, modify the Polling Interval and/or indicate specific hosts which the Central Site will allow or deny remote site connections. Then, click OK.
On the remote WhatsUp Gold installation, launch the Admin Console application from the Windows Start menu, then select Configure > Program Options > Remote Site Configuration. First, enable Enable Remote Site reporting to Central Site to access additional configuration settings. Next, enter the Central Site IP Address, login credentials, Remote Site display name, and HTTP address. Then, click OK.

WhatsUp Gold User Guide
392
Web Interface On the central WhatsUp Gold installation, select SETTINGS > System Settings > Configure Remote Sites to launch the Remote Client Site Configuration dialog. This dialog displays a table of WhatsUp Gold instances configured as remote sites. In addition to the name of each remote site which is assigned during that site's installation, the dialog provides the IP address and the local device name. The local device is the remote site's device name as it appears in the central site's monitoring inventory. From here, you can select a remote site configuration and either edit ( ) or remove ( ) it from WhatsUp Gold. Please note, removing a remote site configuration using this dialog only removes the record from the central site installation of WhatsUp Gold. It does not uninstall WhatsUp Gold from the remote site. Additionally, if you remove a remote site configuration, any dashboard view containing reports with data for the remote site will need to be removed, then re-added to the dashboard to display data for that device.
When editing a remote site configuration, two controls are available:
Enable Accept remote site connection to begin using the selected site in your WhatsUp Gold distributed environment.
Enable Local device to associate the selected site with a device currently monitored by WhatsUp Gold. When enabled, click Select Device to display the current WhatsUp Gold inventory from which to choose the device to associate with the remote site.
Additional Information To ensure a secure connection when communicating between central and remotes sites, Ipswitch recommends using signed SSL certificates. Additionally, to successfully do so, you must configure remote site(s) NOT to ignore certificate errors. Completion of the following steps should allow for successful configuration of a signed SSL certificate:
1 Generate a certificate request from IIS. 2 Have the request signed and imported into IIS. 3 Export the signed certificate. 4 Replace the default certificate. The default certificate is named NmDistributed.pfx
and can be found here: \Data\SSL\NmDistributed.pfx. 5 Update the certificate password using the NmDistributed Service Settings
configuration dialog as follows:
Locate and run the NmDistributed.exe executable file which can be found in the same location where the WhatsUp Gold installer resides on the server. This launches a dialog where you can:
Enable/disable TLS 1.0, 1.1, and 1.2 protocols. Force WhatsUp Gold to ignore certificate errors. Log Trace Messages. Specify the certificate password.
The NmDistributed service must be restarted for changes made within this dialog to take effect.

WhatsUp Gold User Guide
393
About WhatsUp Gold Failover Edition Failover is a mechanism with the capacity to automatically switch from a primary installation of WhatsUp Gold to a standby WhatsUp system when the primary system is not functioning normally. Failover differs from switchover, because it is an automatic switch, whereas switchover requires that a network administrator manually make the switch. The WhatsUp Gold Failover Manager reduces costly downtime by automatically taking action in the event of a primary system failure.
The Failover Manager utilizes user-configurable criteria to determine a failed state. You can choose to have the primary system go down if all services are disabled, or if any specified service is disabled. For example, if you select all services, the services used by WhatsUp Gold must go down on the primary service for the secondary system to take over. If you select only the Polling Engine and Web Server, and both are disabled on the primary system for any reason, the secondary system takes over WhatsUp Gold network management duties until the primary system is restored.
Important: Data redundancy occurs when the primary system and/or secondary systems write data to two or more locations for backup and data recovery. In WhatsUp Gold's Failover Manager, data from either the primary or secondary system is written to one database. To increase your network's complete coverage and protect data, make sure to schedule regular backups or take other measures to protect and save data on the system hosting the WhatsUp Gold database.
About the WhatsUp Gold Failover Console On the primary WhatsUp Gold installation, launch the Admin Console application from the Windows Start menu, then select Tools > Failover Console to launch the Failover Console interface. The Failover Console displays the following information for the primary and secondary WhatsUp Gold machines:
Host. The machine's host address. Status. The machine's current status. Possible statuses are as follows: Active -
currently polling the network, Standby - ready to assume network polling duties if/when the active machine goes down, Down - unable to perform network polling duties, or Unknown - status is not known to Failover.

WhatsUp Gold User Guide
394
Communication State. The communication state is listed from the point of view from the other machine. For example, if the primary machine has attempted to communicate with the secondary machine and is unable to for some reason, the communication state is listed as Unknown. Possible states are as follows: Unknown - a machine is unable to communicate with the other machine for an unknown reason, Connection failed - a machine is unable to communicate with the other machine because the other machine is not known to exist from the machine's standpoint (no known host, etc.), Service running - a machine has communicated with the other machine and finds that the Failover service is running, Good credential - a machine has communicated with the other machine and finds a good credential for further heartbeat communication, or Bad credential - a machine has communicated with the other machine and while the machine does in fact exist, the credentials provided for communication are bad.
Last Active. The last time the machine successfully sent a heartbeat message to the other machine.
Click Configure to access Failover options (on page 394).
Configuring Failover Options To configure specific services for Failover: 1 Select the service monitoring criteria: Use ALL selected services. Selecting this option tells Failover that unless all of
the services selected go down, the primary WhatsUp Gold machine continues to perform network polling duties. In the event that all of the selected services go down, the primary WhatsUp Gold machine is considered to be in a failed state and the secondary WhatsUp gold machine takes over network polling duties.
Use ANY selected services. Selecting this option tells Failover that if any one of the selected services goes down, the primary WhatsUp Gold machine is considered to be in a failed state and the secondary WhatsUp Gold machine takes over network polling duties.
2 Select the service(s) you want to apply to Failover. 3 Configure Advanced Failover Options described below, if desired. 4 Click OK.
To configure advanced Failover options: 1 Click Advanced on the Failover Service Configuration dialog to launch the
Failover Advanced Configuration interface. 2 Configure the following: Primary Automatic Restart. When this option is enabled and the primary
machine returns to a normal state after a previous failed state, WhatsUp Gold starts the required WhatsUp services.
Failure duration (minutes). Enter the amount of time in minutes that the Primary WhatsUp machine should be considered in a failed state before Failover switches network polling duties to the Secondary machine.
Status Query Interval (minutes): Specify the amount of time in minutes that indicates how often the Primary and Secondary WhatsUp Gold machines ping one another for a heartbeat status.

WhatsUp Gold User Guide
395
Primary Credentials. Select the set of Windows credentials the secondary machine will use to communicate with the primary WhatsUp Gold machine. If you do not see the appropriate credentials, browse (...) to the Windows Credentials Library to configure a set of Windows credentials.
Secondary Credentials. Select the set of Windows credentials the primary machine will use to communicate with the secondary WhatsUp Gold machine. If you do not see the appropriate credentials, browse (...) to the Windows Credentials Library to configure a set of Windows credentials.
3 Click OK.
Note: The WhatsUp Gold secondary installation remains active even when the primary site comes back online. The WhatsUp Gold administrator must transfer network monitoring activities back to the primary site manually.
Scheduling Activities Selecting SETTINGS > Scheduling Activities from the top menu navigation to access the following:
Business Hours (on page 944). Scheduled Reports (on page 942). Recurring Actions (on page 253).
Configuring Actions and Alerts Selecting SETTINGS > Actions and Alerts from the top menu navigation to access the following:
Actions and Policies (on page 252) provides access to libraries where you can manage individual actions as well as action policies.
Alert Center Libraries (on page 258) provides access to libraries where you can manage individual notification configurations as well as notification polices.
Accessing WhatsUp Gold Libraries Selecting SETTINGS > Libraries from the top menu navigation to access the following:
Credentials (on page 217). Associate and reuse credential sets used for deep-discovery, monitoring, and configuration of devices.
Monitors (on page 106). Extend and create WhatsUp Gold monitor types you can instantiate and apply/bulk apply to devices and roles.
Roles and Sub Roles (on page 61). Extend and create WhatsUp Gold device categories.

WhatsUp Gold User Guide
396
System Tasks (on page 383). Apply system-wide tasks.
Scheduling Activities Selecting SETTINGS > Scheduling Activities from the top menu navigation to access the following:
Business Hours (on page 944). Scheduled Reports (on page 942). Recurring Actions (on page 253).
Configuring Application Monitoring-specific Settings
Access settings specific to application monitoring by selecting SETTINGS > Application Monitoring > Application Monitoring Settings from the top navigation menu. This dialog allows you to customize the following features of application monitoring in WhatsUp Gold:
Configure WhatsUp Gold to report the application states Warning, Maintenance, or Unknown as either Up or Down depending on your preferences or needs.
Specify data retention times for individual application monitoring data types including Hourly, Raw, Action Log, Resolved Items Log, and State Change Log.
Enable Component and group data in parent status logs to include data for all components and groups under your current selection in the application monitoring tree when displaying reporting data and logging activity.
Enable Disabled Non-Critical Components in status to include applicable component data when determining application status.
The application monitoring settings dialog also provides the following additional controls:
Specify the URL for the iDrone Manager Service when monitoring applications using end user monitoring components. If your WhatsUp Gold IIS instance is using a non-standard port, click Auto Detect to update the URL. For more information, see Configuring iDrone (EUM Poller) (on page 293).
Manage user-defined global attribute names in a library interface similar to Credentials and Monitors (on page 106). To create a new global attribute name, click , name the new attribute, then click Save. The new attribute now appears in the applicable dropdown menu for adding attributes when creating an application profile. For more information, see Working with Application Attributes (on page 305). Please note, global attribute names may not contain spaces.

WhatsUp Gold User Guide
397
Configuration Management Settings Access database and application settings specific to Configuration Management by selecting either of the following from the SETTINGS menu:
SETTINGS > Configuration Management > Log Expiration. For Configuration Management log file persistence.
SETTINGS > Configuration Management > Remote Client Settings. For setting operating system paths WhatsUp Gold Configuration Management will use to run remote clients.
Note: For more details of how to use WhatsUp Gold Configuration Management, see Configuration Management (on page 307).
Network Traffic Analysis Settings Access database and application settings specific to Network Traffic Analysis by selecting either of the following from the SETTINGS menu:
SETTINGS > Network Traffic Analysis > NTA Record Maintenance. For flow collector database maintenance (on page 378) settings.
SETTINGS > Network Traffic Analysis > NTA Settings. For flow listener port, collection interval, and retention settings (on page 376).
Note: For more details of how to use WhatsUp Gold Network Traffic Analysis, see Traffic Analysis (on page 346).
Virtual Settings Access settings specific to virtualization by selecting SETTINGS > Virtual Monitoring Settings from the top navigation menu.
Event Data. Select for Virtual Monitoring event and log data expiry. VMware Monitoring Interval. Polling interval for VMware monitoring service.
Wireless Settings Access settings specific to wireless infrastructure device monitoring by selecting SETTINGS > Wireless Monitoring from the top navigation menu. From here you can access dialogs where you can:
WhatsUp Gold User Guide
398
Configure global settings (on page 398) applicable to all wireless device monitoring, data collection, and retention.
Manage client groups (on page 398). Manage excluded rogues (on page 399).
Global Wireless Settings This dialog provides access to configuration settings specific to wireless device monitoring and associated data retention schedules. Ensure Global wireless enabled is selected for these settings to be successfully applied to your WhatsUp Gold wireless infrastructure:
Polling interval. Enter the length in time in minutes for Wireless to wait between polls. Please note, that setting the polling interval to less than 5 minutes has a direct impact on the quantity of data collected. Because more data is collected, a polling interval less than 5 minutes could affect performance. Additionally, increasing the polling interval does not change wireless threshold configurations in WhatsUp Gold. WhatsUp Gold will simply return identical results for applicable wireless infrastructure devices until the next global polling interval.
Log expiration. Enter the desired interval for log information to be retained in Wireless.
SNMP timeout. Enter the desired time, in seconds, for the poller to wait for an SNMP response from a wireless infrastructure device.
Session timeout. Enter the desired time of inactivity to be reached by a client before statistics for that client are associated with a new session.
SNMP retries. Enter the desired number of times to retry polling wireless infrastructure devices for SNMP data.
Data retention allows you to enable data collection from wireless infrastructure devices for specific data types as well as configure retention schedules for each type. When determining settings for data retention schedules, make modifications based on your network size. Consider that specificity is lost as data is rolled up from raw to hourly data and from hourly to daily data. However, keeping raw data for less time may improve performance. Data retention can be configured for rogues, access point statistics, client statistics, CPU/memory utilization data, and client group data. Please note, in order to collect statistical data on clients, data collection for access point statistics must also be enabled.
Important: You must have client groups created for client group data retention settings to be successfully enabled and applied.
Wireless Client Groups Using this interface, you can manage user-defined client groups consisting of wireless infrastructure devices on your network based on MAC addresses or MAC prefixes.

WhatsUp Gold User Guide
399
These groups can be beneficial for hardware comparison and tracking purposes. Client groups can be configured to represent device owners by name, company department, vendors or manufacturers, device types, or any other categorization you find beneficial. Additionally, a single device can reside in multiple groups to provide more comprehensive organizational options for wireless clients monitored by WhatsUp Gold. Please note, entries in a Client Group can be the specific/individual MAC address of one client device or the MAC prefix shared by multiple devices.
To create a new wireless client group, click , enter a delimited list of MAC prefixes and/or MAC addresses, then click OK. Entries may be delimited using a comma or semicolon.
To edit an existing client group, select its group name in the grid, then click , make changes to the group name or membership as needed, then click OK.
To delete a client group, select its group name in the grid, then click and confirm your selection.
Wireless Excluded Rogues Rogues can be excluded from WhatsUp Gold if they are known devices or if you are certain they pose no threat to your network. When a rogue is excluded, existing data for that rogue is hidden from applicable dashboard reports. Additionally, any applicable thresholds will no longer report trigger alerts for the rogue and WhatsUp Gold no longer collects data for that rogue when wireless devices are polled. Please note, removing a rogue from the excluded rogues list results in a gap in data logged for that rogue between time of initial exclusion and inclusion back into WhatsUp Gold.
To identify a rogue as a known device, simply select the applicable checkbox, then click Exclude Rogue to remove it from the rogues list. If you need to classify a device as a rogue that was previously removed from the list in error, select its checkbox on the Excluded Rogues list, then click Include Rogue.
Finally, you can click Add Exclusion to launch a dialog where you can specify a delimited list of SSIDs and/or MAC addresses to exclude devices from the rogue list in bulk.

400
CHAPTER 15
Using the WhatsUp Gold Console Application
In This Chapter Using Device Types .............................................................. 401
About Device Properties - General ....................................... 402
About Device Properties - Menus ......................................... 402
Operating WhatsUp Gold in FIPS 140-2 Mode ..................... 403
Using WhatsUp Gold Database Utilities ................................ 404
Configuring File Transfer Settings ......................................... 405
Importing Trap Definitions ..................................................... 405
WhatsUp Gold console is a Windows application installed with WhatsUp Gold and is used for the configuration and management of specific WhatsUp Gold features and its databases. Following installation, you can launch WhatsUp Gold Console from the Windows Start menu. It provides access to the following menus and associated functionality:
File. Open, print, close the current application window or exit the application. Configure. Manage access to WhatsUp Gold with the following controls: Enable FIPS 140-2 mode which requires you to enter valid WhatsUp Gold
user credentials to access the console application. For more information, see About operating WhatsUp Gold in FIPS 140-2 mode (on page 403).
Configure new and edit existing device states available for use and reported by WhatsUp Gold.
Configure settings for Remote/Central Site installations when using WhatsUp Gold Distributed Edition (on page 391).
Test configured active monitors, actions, and recurring actions.
Access configuration management task and task script libraries.
Reset passwords for web user accounts. Tools. Perform the following WhatsUp Gold administrative functions: Launch the VoIP Configuration Utility (on page 274) used to configure IP SLA
devices to monitor VoIP performance.
Launch the Failover Console (on page 393) used to configure settings specific to services switchover from the primary to the secondary site when a failure occurs (if enabled).

WhatsUp Gold User Guide
401
Launch the Running Actions dialog where you can view the status of actions as they are fired and cancel actions currently in use.
Access Database Utilities (on page 404) used for WhatsUp Gold-specific SQL backup and restore operations.
Access File Transfer Settings (on page 405) used to configure file transfer settings applicable to WhatsUp Gold configuration management.
Launch the Trap Definition Import tool (on page 405) used to import SNMP trap definitions into the WhatsUp Gold Passive Monitor Library.
Window. Close the current window, open a new one, or modify the layout of all windows open within the console interface.
Help. Access both local and online help documentation and launch the About dialog to view product serial number and current licensing information.
Note: For instructions how to find and use the Roles and Subroles Library (known in earlier versions as Device Roles Settings), see the topic titled Managing WhatsUp Gold Device Role Classification (on page 61).
Using Device Types An important display option is device types and icons. These icons represent network devices on maps. WhatsUp Gold provides device types for more than 40 device types with an option to create additional custom types.
To configure device types: 1 Open the Device Types Library:
In either Device or Map View, click Configure > Device Types. The Device Types Library dialog appears.
2 In the Device Type Library, do one of the following: Click New to configure a new device type.
Select a device type, then click Edit to reconfigure the selected device type.

WhatsUp Gold User Guide
402
Select a device type, then click Copy to make a duplicate of the selected device type.
Select a device type, then click Delete to remove it from the Device Type Library.
3 Click OK to save changes.
To change a device's type: 1 In Map View, right-click a device. The right-click menu appears. 2 Click Properties. The Device Properties dialog appears. 3 Select a new Device Type from the list on the right side of the dialog. 4 Click OK to save changes. 5 The device's type and coinciding icon updates on the map.
About Device Properties - General The General section of the Device Properties dialog provides, and lets you modify, basic information for the selected device.
Display name. An identifying name for the current device. This name is populated during discovery, but can be changed by the user at any time. Changing the name will not change how the device is polled, only how it is displayed in WhatsUp Gold.
Host name (DNS name). This should be the official network name of the device if the polling method is ICMP. The network name must be a name that can be resolved to an IP address. If the polling method is NetBIOS or IPX, this must be the NetBIOS or IPX name.
Address. Enter an IP or IPX address.
Device Type. Select the appropriate device type from the menu. The icon displayed will represent the device in all views.
About Device Properties - Menus In the WhatsUp Gold console, you can use the Menu dialog to create a custom context menu for a device. Context menus are custom menu items that appear when you right-click a device; they serve as "shortcuts" to launch applications.
The menu item can launch programs based on the command line you enter. You can also append command line arguments, including WhatsUp Gold Percent Variable (on page 851) arguments to include device IP address, device host name, and other types of percent variable arguments. When you select the new menu item, the associated command is launched with the arguments that were included in the device's custom menu configuration.

WhatsUp Gold User Guide
403
Customize the menu on this device (don't use device type menu). Select this option to create and/or modify a context menu for this device. This overrides any separate context menu that has already been created for the device type of the device.
Menu list. This box displays the commands that are currently configured for the device. After an item has been configured, it appears on the context (right-click) menu. When you click the menu command, the menu command is executed.
Click Add to add a new menu command.
Select a Menu Name, then click Edit to change the settings.
- or -
Double-click a Menu Name to edit its configuration.
Select an Menu Name, then click Remove to delete it from the list.
Important: Menu items can only be configured on the WhatsUp Gold console.
Use the Add/Edit Menu Item dialogs to create and edit custom context device menus.
Display Name. Enter or edit the name of the custom menu item. This custom menu item (shortcut) appears when you right-click the device with which it is associated.
Command. Enter or edit the full path to the command that you want executed when the menu item is selected. The command can be anything that can be executed through the Windows Run dialog, such as http, ftp, telnet, etc. Enter the full web address if opening a browser window to a specific Website.
Arguments. Anything added or edited in the argument box is appended to the command as it is executed. See the Percent Variable (on page 851) table for more information about arguments that are available to use.
Important: Only Device and System Percent Variables work for a device menu.
Operating WhatsUp Gold in FIPS 140-2 Mode There are several important things to take into consideration if you plan to operate WhatsUp Gold in FIPS 140-2 mode:
When the FIPS 140-2 mode is selected (enabled), WhatsUp Gold prompts users for the web interface user credentials to log into the console application.
If WhatsUp Gold is being installed on an operating system that is currently running in FIPS140-2 mode, WhatsUp Gold detects the FIPS compliant operating system and automatically places WhatsUp Gold in FIPS 140-2 mode upon initial installation and start-up. However, if WhatsUp Gold is installed on an operating system that is not running in the FIPS compliant mode and the operating system has the FIPS compliant
WhatsUp Gold User Guide
404
mode enabled after a WhatsUp Gold install occurs, then you must manually enable the Operate in FIPS 140-2 mode option in the WhatsUp Gold console application Program Options General dialog.
If you plan to use FIPS 140-2, we recommend that you use credentials and SSL certificates that use strong encryption.
If you plan to use FIPS 140-2, make sure that devices with SSH-based monitoring are configured to use SSHv2.
SNMPv3 credentials using MD5 and/or DES56 are prohibited; you are unable to enable FIPS if SNMPv3 credentials using MD5 and/or DES56 exist in the Credentials Library. You must modify or remove such credentials in order to enable FIPS.
The following may occur when you try to enable FIPS 140-2 mode in the Program Options dialog:
If a message is presented that you have non-compliant SNMPv3 credentials:
This option is disabled because the SNMPv3 credentials are not FIPS compliant. Go to the Credentials Library to edit or remove the SNMP credentials. After editing or removing credentials, you can enable this option in the Program Options dialog.
For more information about the FIPS 140-2 specification, see the U.S. Department of Commerce documentation (http://www.whatsupgold.com/wug_USDOC_FIPS).
Using WhatsUp Gold Database Utilities The Database Utilities menu allows you to perform multiple WhatsUp Gold-specific SQL backup and restore operations directly from the Console Application user interface.
Back Up WhatsUp SQL Database. Select this option to make a copy of your WhatsUp Gold SQL database.
Restore WhatsUp SQL Database. Select this option to restore your WhatsUp Gold SQL database with a previous version.
Back Up Network Traffic Analysis SQL Databases. Select this option to make a copy of either your Network Traffic Analysis Current or Archive database.
Restore Network Traffic Analysis SQL Databases. Select this option to restore either your Network Traffic Analysis Current or Archive database.
Tools. Launch the Database Tools dialog. This dialog contains the following utilities: Database Performance is used to monitor the size of your database and to
manage the index fragmentation percentage of the individual tables.
Database Table Maintenance is used to purge expired data from data tables in your database. Please exercise caution when using this utility; data purged through this process cannot be restored.
WhatsUp Gold User Guide
405
Configuring File Transfer Settings Launch the File Transfer Settings dialog to specify the following settings applicable to Configuration Management:
Trivial File Transfer Protocol (TFTP) Set TFTP timeout values
Determine cleanup transfer file settings
Use TFTP for configuration backups
Configure an alternate TFTP server Secure Copy Protocol (SCP) Set SCP timeout values
Configure SCP server settings
Configure SCP client settings Secure File Transfer Protocol (SFTP) Set timeout values
Configure SFTP server settings
Configure SFTP client settings
—as well as:
Ipswitch TFTP Server Set transfer settings, including the port on which the TFTP server will listen,
server timeout setting, path to the TFTP server's root directory and permissions to upload and download configurations from specific subnets.
Set management settings, including the server IP address, management port and timeout.
Ipswitch TFTP Log View information about errors which occurred when running the server,
transfer details, and negotiation between the client and server.
Importing Trap Definitions Launch the Trap Definition Import tool to import SNMP Trap definitions into the Passive Monitor Library. The list displayed is populated by the MIBs typically found in the MIB folder on your WhatsUp Gold server. Simply select the applicable checkboxes to the left of the desired trap definitions, then click Import to passive monitor library. Please note, traps that already exist in the database are not imported.

WhatsUp Gold User Guide
406
Administering Users and User Groups User and Group Library (SETTINGS menu > Users & User Groups) is where you can create, modify, and remove individual user accounts or groups of users from WhatsUp Gold. Upon accessing the library, the list of current users is displayed along with any assigned group memberships and authentication type.
Managing users and groups Use the following controls to administer WhatsUp Gold users and groups:
Add User, Add Group. After configuring settings specific to the new user or group, click Save to proceed to Device Group Properties where you can configure applicable device group access rights.
Edit. Edit settings for selected user or group. From here, you can make changes to account information or groups to which the user is assigned. Click Advanced User Rights Settings to enable/disable individual user rights.
The default admin user account created during WhatsUp Gold installation cannot be modified.
Copy. Create a new user account using the settings and permissions for the selected account as a template.
Delete. Delete the user from WhatsUp Gold entirely.
Apply device specific user access To enable device group access rights, click Change in the upper-right corner of the User and Group library, then click Enable. When enabled, device group access rights will be applied throughout WhatsUp Gold. Device groups and individual devices will both respect the read/write access applied for each user account. Please note, device group access rights must be enabled prior to being configured.
Select a user or group, then select Configure Device Group Access Rights to allow the selected user to view and/or modify settings for specific groups and devices. This feature can be used when WhatsUp Gold manages administrative domains, each with their own devices, environment and level and scope of privilege. For such a case, any one user or administrator might need to view/edit/consume monitor data only for relevant devices. When Device Group Access Rights are enabled, responsible individuals can grant each user permissions for only those devices for specific device groups. Please note, to add a device to a group, a user must have Group Write rights to that group.

WhatsUp Gold User Guide
407
Important: When you enable Device Group Access Rights, WhatsUp Gold users will only have access to devices as configured using Device Group Properties (on page 243). It is best practice to begin these users with read-only access to their home device group increase privilege as need warrants. Please note, a user can only edit access rights for their home device group using the Device Group Access Rights interface. To edit access rights for other device groups, the user must use the Device Group Properties (on page 243) interface.
Manage WhatsUp Gold user password policy Click Account Policy Settings (on page 408) to manage settings specific to password usage with WhatsUp Gold including lockout, expiration, reuse, retention, notification, and complexity.
Important: WhatsUp Gold does not support unicode characters for passwords. The use of unicode characters in passwords could result in a possible security threat to your WhatsUp Gold environment.
Note: Ipswitch recommends changing default passwords for both the admin and guest user accounts created automatically during WhatsUp Gold installation.
About User Rights User rights can be enabled based on assigned user group or individually using the Edit User Rights interface. When any group under Assigned User Group is enabled at left, the corresponding user rights associated with that group are automatically enabled at right. You can then enable additional user rights beyond those which were inherited individually. Please note, inherited rights enabled based group membership cannot be disabled unless the user is removed from the group.
Important: Depending on the specific configuration of user rights, group assignment(s), and authentication method, it may take up to five minutes for changes to be reflected.
About User Groups While WhatsUp Gold allows you to create and customize user groups as well as enable individual user rights (on page 407) for those groups in order to meet your specific network monitoring needs, you can also take advantage of several preconfigured user groups which have common and/or logical combinations of user rights enabled to reflect typical user group profiles.

WhatsUp Gold User Guide
408
WUG Administrators. Users should be assigned to this group if they are responsible for administering and/or configuring the WhatsUp Gold server. The user rights enabled for this group are equivalent to the default admin user.
Super Users. Users should be assigned to this group if they are responsible for configuring the WhatsUp Gold server. The user rights enabled for this group are equivalent to the WUG Administrators user group except for the Manage Users user right which is disabled.
Network Managers. Users assigned to this group manage larger, segmented networks. They can access all reports, configure monitors, actions, manage alert center thresholds, and manage devices and device groups as well as create and share dashboard views with other users.
Network Admins. This group should consist of network engineers who monitor outages and receive alerts. Users assigned to this group can access reports related to devices and alerts, but do not have access to system logs or real time performance reports. They can manage devices assigned to device groups, but cannot manage those groups. Users in this group can also view and manage personal dashboard views, but cannot share them with other users.
Report Viewers. This group is for users who only need to view device, group, inventory, and alert center reports. Users in this group can also view and manage personal dashboard views.
These user group options are available when creating or editing a user account and can be accessed and subsequently edited to better fit your organization directly from the User and Group Library.
Password Expiration and Retry Policies Manage password policy controls in the User and Group Library (SETTINGS menu > Users and User Groups, click Account Policy Settings).
To manage WhatsUp Gold password policy from the User and Group Library (on page 406): Account Lockout Policy. Enter the lockout duration time in minutes that the
system should delay before allowing a locked out user from performing a log on attempt.
Password Aging Policy. Enter the minimum/maximum number of days between password changes, the number of passwords that are not to be reused against previous passwords, the number of days to retain historical passwords, and the number of days between initial notification and password expiration.
Password Complexity Policy. Enter the minimum number of complex characters required for a valid password. The default minimum complex password requirement is one special character, one upper case letter, one lower case letter, and one number.

WhatsUp Gold User Guide
409
Important: Password policies are enforced when a user attempts to modify their own account password. However, these settings are not considered when the admin account modifies the password for that user within the User and Group Library.

410
CHAPTER 16
Dashboarding, Reporting, and Logging In This Chapter Create NOC Views and Custom Dashboards ....................... 412
Reporting Performance, Inventory, and Uptime .................... 432
Viewing Performance Real Time ........................................... 788
Using Logs............................................................................ 791
WhatsUp Gold Dashboarding, Reporting, and Logging provides rich summaries, dashboard-like views, interactivity, and charting capabilities needed to leverage event, monitor, resource availability, and system attribute data along with the necessary export and scheduling controls to distribute this data to stakeholders.
Track, journal, and distribute WhatsUp Gold monitor data This section outlines easy steps and best practices for tracking health, status, and performance data for your network devices, infrastructure, and applications.
Begin your logging and reporting efforts:
1 Start with one of the following: An existing dashboard (ANALYZE menu > Dashboards) in full or just as a
starting point that you can add views, logs, and reports to.
A built-in full-page report (ANALYZE menu > Performance, Network, Device, Traffic Analysis, Wireless, Alerts and Actions, Inventory).
A built-in log view (ANALYZE menu > Logs). 2 Select devices and apply settings.
Note: For scheduled reports, it is best practice to create an additional WhatsUp Gold user to ensure that the scheduled export and email of report data maintains consistent settings, graphing modes, and format. WhatsUp Gold Report Settings (settings for graphing, top n, and thresholding, for example) persist based on the report instance, the current device selected, and the WhatsUp Gold login you use.
3 Distribute monitor data: Share dashboard views (on page 412) with stakeholders or team members that
log in as other WhatsUp Gold users.
E-mail (on page 950) reports, charts, and data to stakeholders and team members.

WhatsUp Gold User Guide
411
Use these components to leverage and visualize your monitoring data Logging (on page 791). View, filter, and distribute historic or up-to minute log
messages from managed devices or WhatsUp Gold services. Reporting (on page 432). View and distribute performance, alerts, inventory,
accounting, and all data associated with operationalized monitors and policies. Dashboarding (on page 412). Use, assemble, or share dashboards to perform
critical management, troubleshooting, and forensics tasks. Each dashboard supports multiple views. Within each view, you can assemble your choice of logs, reports, and summaries.
Real-time reporting (on page 788). When informed decisions are time-critical, use the RealTime Performance monitor (RTM) reports. RTM returns streams of Windows Task Manager and Linux Top visual and performance and capacity utilization over split-second intervals to your web browser.

412
CHAPTER 17
Create NOC Views and Custom Dashboards
In This Chapter Home Dashboard .................................................................. 415
Overview .............................................................................. 416
Device Status ....................................................................... 417
Alert Center .......................................................................... 419
Application Monitoring .......................................................... 420
Network Traffic Analysis Dashboards ................................... 422
Predictive Trending Report ................................................... 423
Virtual Monitoring .................................................................. 424
Traffic Overview .................................................................... 425
Wireless Monitoring .............................................................. 425
Unclassified Traffic ............................................................... 426
TOP 10 ................................................................................. 426
Rogues Dashboard ............................................................... 427
Quarterly Availability Summary ............................................. 429
Open built-in dashboards, add views, and drag in and arrange reports critical for operational monitoring, troubleshooting, and forensics tasks.
Step 1: Envision the target scenario Before you choose a built-in dashboard to begin from:
Envision the operations, monitoring, and reporting scenarios your dashboard views will leverage.
Consider the audience/consumers for the dashboard and (if applicable) periodic reporting and scheduled email distribution.

WhatsUp Gold User Guide
413
Service Level Management
Quarterly Availability (on page 429)
State Change Timeline (on page 642)
Alert Center Dashboard
Blackout Summary Log (on page 804)
more... (on page 410)
Wireless
Wireless Monitoring (on page 425)
Rogues (on page 427)
more... (on page 410)
Configuration Management
Start vs. Run
CM Policy Audit Log (on page 815)
CM Task Log (on page 824)
Software Updates (on page 628)
BIOS Inventory (on page 627)
more... (on page 410)
Traffic Analysis
Top N (connections, bandwidth utilization) (on page 423)
Unclassified traffic
Senders and receivers (on page 423)
Significant activities (troubleshooting) (on page 423)
NTA Log (on page 834)
more... (on page 410)
Inventory
Asset Inventory (on page 615)
Element Count (on page 632) (summary table)
Device Connectivity (on page 618)
Switch Port Utilization (on page 620)
VLAN View (on page 622)
Subnet View (on page 623)
Custom Maps
more... (on page 609)
OS/Update Compliance
Installed Software (on page 617)
BIOS (on page 627)
Software Updates (on page 628)
Services (on page 630)
Warranty Information (on page 632)
(

WhatsUp Gold User Guide
414
Virtual resource monitoring (on page 424)
Hyper-V Event Log (on page 808)
VMware Event Log (on page 825)
more... (on page 410)
Step 2: Choose and open a dashboard From the analyze menu (ANALYZE menu > Dashboards) on the main toolbar:
1 Choose a dashboard as a starting point. (Home Dashboard (on page 415), is a good place to start.)
2 Click the 'add view' button ( ) to create a new tabbed panel that you can add reports to.
Step 3: Create and customize views Open and search the Add Reports palette and 'drag in' any of the reports into the current or an existing view.
Use dashboard actions ( ) to access settings, share, delete, or organize views and to schedule export or e-mail snapshots (on page 942).
Use dashboard settings ( ) to change the view name or to initialize/reset column layout.
Use report options ( ) to refresh, move, expand to full screen, delete reports, and get report specific help.
Use row options ( ) to apply filters, jump to device properties (on page 86), and jump to device status (on page 105).
Use Business Hours (on page 944) scheduling (when applicable) to reduce the scope of report period.
Step 4: Share, schedule, and collaborate WhatsUp Gold provides expert features and functionality that enable you share with internal and external stakeholders periodically, on-demand, or whenever you feel this collaboration is appropriate:
Share views with other WhatsUp Gold users. Schedule export/email of dashboard reports or data. Send as part of an internal or external service level agreement. Post views in team areas.
Note: For scheduled reports, it is best practice to create an additional WhatsUp Gold user to ensure that the scheduled export and email of report data maintains consistent settings, graphing modes, and format. WhatsUp Gold Report Settings (settings for graphing, top n, and thresholding, for example) persist based on the report instance, the current device selected, and the WhatsUp Gold login you use.

WhatsUp Gold User Guide
415
Tip: Spread related/auxiliary views across dedicated displays You can customize views that help your team anticipate, track, and react quickly to critical incidents.
For example, you can create a dashboards that:
Track latency or signal interference of wireless traffic. Create view(s) to include wireless reports (access points, rogues, and clients) and custom overlay on a map of your office, building, or campus. Track intrusion and penetration attempts. Create view(s) to display traffic and connection attempts (such as Network Traffic Analysis) as well as active monitors that track login attempts or intrusion attempts on devices that are likely to be compromised. Failed Connections and Discarded packets can be indicators of Denial of Service attacks often used as a diversion to mask intrusion and penetration attacks. Received/transmit packet volume asymmetry in the transmit direction following a suspected intrusion attempt can indicate a breach of data is in process. Track inventory. Leverage builtin inventory dashboards (ANALYZE menu > Inventory) to track and report on network and application infrastructure and devices.
Home Dashboard Home Dashboard includes a range of reports that survey common performance, availability, and system auditing scenarios. You can also add your preference of reports from the Reports Library (on page 410) to the default Home Dashboard views or to custom views you create.
Tip: To show reports in full screen with most if not all possible columns, click on report options ( ) menu and choose Expand ( ).
Built-in report views Top 10. Ranked top n list of built-in performance as well as active monitor (ping) reports. Interface Errors (on page 587). Ranked list of network interfaces reporting
errors. Interface Discards (on page 583). Ranked list of network interfaces discarding
packets. Interface Utilization (on page 593). Ranked list of network interface capacity
utilization. Interface Traffic (on page 590). Ranked list of network interface traffic totals.

WhatsUp Gold User Guide
416
Ping Availability (on page 600). Ranked list of responses to ICMP echo ("ping") requests.
Disk Utilization (on page 580). Ranked list of storage capacity utilization. CPU Utilization (on page 571). Ranked list of CPU capacity utilization/CPU Idle. Memory Utilization (on page 596). Ranked list of RAM capacity utilization. Actions & Alerts. Operational summary for monitored devices including device health, active monitor status, and triggered notifications, actions, and scripts. Actions Fired (on page 667). Devices that satisfied a policy condition that
caused WhatsUp Gold to invoke an action (corrective action, notification, backup, and so on.)
Completely Down Devices (on page 670). Devices that due to monitor precedence and policy are considered down.
Down Active Monitors. Devices with active monitors in a down state. Wireless. Access point performance, traffic, and summaries. Client volume per wireless segment and rogue accounting. System Summary (on page 744). Remote station (client) inventory, client types,
radio parameters such as SNR and RSSI. Bandwidth (on page 721). (Inbound and outbound wireless traffic comparison). Bandwidth Summary (on page 724). Average total input and output utilization.
Top client station MAC address. Client Count (on page 728). Highest number of wireless clients observed. Rogue Count (on page 738). Remote stations that are not yet identified. RSSI (on page 735). Radio frequency signal strength for given device(s). Signal to Noise Ratio (on page 740). RF signal to noise ratio.
Customize report views Add a new view ( ). Browse or search the collapsible Add Reports panel, drag new reports into your
view. Use row options ( ) to apply filters or jump to device properties and status. Use report options ( ) to refresh, move, full screen, and delete reports. Use dashboard options ( ) to share, export, and schedule export or e-mail of
report snapshots.
Overview The Overview full-page report presents a high-level view of your WhatsUp Gold network monitoring environment. It includes the following dashboard reports to provide at-a-glance information:
Current Device States (on page 457). Device counts color-coded and categorized by current state.

WhatsUp Gold User Guide
417
Enabled Active Monitors (on page 459). Active monitor counts color-coded and categorized as either up or down.
Network Composition (on page 635). Total device count categorized by assigned role.
Network Coverage (on page 635). Total device count categorized by monitored versus unmonitored.
Device Status Device Status dashboard (ANALYZE menu > Dashboards [Device Status]) provides a complete system summary and performance survey for a single device.
Click to add a new tab (an empty or preconfigured dashboard "view") to the Device Status dashboard.
Click to access a menu of actions applicable to the current view.
Note: See Working with Dashboards in WhatsUp Gold (on page 412) to learn about WhatsUp Gold dashboarding capabilities and customization.
Device Status dashboard includes the following individual dashboard views:
General. Custom and polled system information and links.
General view of the Device Status dashboard includes:
Device Attributes (on page 456). Table of attribute values, labels, and descriptions that characterize a single device.
Device Notes (on page 468). Notes field associated with the current device. Device Custom Links (on page 452). Add frequently used or critical hyperlinks
by device to dashboard. Disk/CPU/Memory. Performance, capacity utilization, and availability.
Disk/CPU/Memory view of the Device Status dashboard includes:

WhatsUp Gold User Guide
418
CPU Utilization (on page 571). CPU load metrics. Memory Utilization (on page 596). Memory usage metrics. Disk Utilization (on page 580). Storage usage metrics. Ping Response Time (on page 605). Ping response time for the current device. Router/Switch/Interface. Network capacity utilization. Interface Utilization (on page 593). Network traffic across one or more network
interfaces for each device or device group you specify. Monitoring. Monitor status, summary, and logs.
Monitoring view of the Device Status dashboard includes:
Down Active Monitors (on page 644). Active monitors reporting a down state. Device Active Monitor States. Active monitor health for the current device (at a
glance) All Down Interfaces (on page 647). Interfaces with all monitors or critical monitor
in down state. Tail of State Change Log (on page 642). Last n device state changes recorded. Monitors Applied. Monitors configured and applied to the current device. Tail of Action Activity Log (on page 686). Last n actions recorded and logged to
the activity log. Virtualization. Virtual server and associated VM summary, capacity utilization, and availability.
Virtualization view of the Device Status dashboard includes:
Virtual Server (on page 610). List of virtual servers and associated VMs. Virtual Server Attribute (on page 612). Table of attribute values, labels, and
descriptions that characterize a single virtual host. VM CPU Utilization (on page 709). Last polled virtual machine processor load. VM Memory Utilization (on page 714). Last polled virtual machine interface
traffic metrics. Interface Utilization (on page 712). Receive and transmit total bandwidth usage. VM Disk Activity (on page 710). Last polled virtual machine disk I/O rates. Ping Response Time. Ping response time for the virtual host device. Virtualization Current Utilization. Up to minute (last polled) VM statistics.
Virtualization Current view of the Device Status dashboard includes:
VM CPU Utilization (on page 709). Last polled virtual machine processor load. VM Disk Activity (on page 710). Last polled virtual machine disk I/O rates. VM Memory Utilization (on page 714). Last polled virtual machine interface
traffic metrics.

WhatsUp Gold User Guide
419
Alert Center Alert Center dashboard (formerly called the Alerts Home Page) provides a centralized view of device thresholds and policies applied using the Alert Center Libraries (on page 258). You can toggle between items last polled within threshold and items currently alerting.
Alert Center dashboard reports include:
Running Notification Policies. Events triggered due to and Alert Center Notification Policy.
Threshold events. Events organized by threshold type that WhatsUp Gold observed for designated devices out of threshold.
Running Notifications Policies Policy name. Name as configured in the Notification Policy Library Notification progress. Step in the notification schedule. Triggered by. Threshold that triggered the notification policy. Time created: Date and time that notification policy was triggered.
Tip: Click on a policy name to view current and historical data for the notification policy.
Threshold Reports Alert Center dashboard displays out of threshold items in reports organized by built-in and custom threshold type. The number of affected devices is displayed in parentheses next to the threshold report title.
Acknowledge/Resolve. To Acknowledge/Resolve a threshold, click on 'row details' ( ) and select Item Details (on page 419).
Export. Click Export ( ) to save the report as a PDF file, leverage that data in Excel (ooxml), CSV, or TXT (on page 951)or configure scheduled report output (on page 942).
Alert Center Item Details Alert Center Item Details enables you to acknowledge, resolve, and annotate alert events observed by WhatsUp Gold.
Item details Aspect. Aspect of device that is out of threshold. Value. Value observed. Current State. Current state of device threshold. Notification Progress. Step in the notification schedule.

WhatsUp Gold User Guide
420
Created On: Date and time of threshold.
Update alert for this item (and related items when necessary) Acknowledge or resolve the alert.
Apply to this item. Simplest case. Apply only to the current item. Apply to any items created at the same time as this item. Apply to alerts
triggered during the same poll. Apply to any items older than ___ hours/minutes/days. Update this and
older alerts. Useful for cascading alerts such as attempting to ping a devices on the far side of a failed switch, gateway, or router.
Apply to all items in this threshold. Apply to any items with the current threshold type.
Update comments Add optional notes to characterize the acknowledgment/resolution you applied to the alert.
Application Monitoring Application Monitoring includes a range of reports that allow you to view the performance status for monitored applications on your network. You can also add your preference of reports from the Reports Library (on page 410) to the default Application Monitoring views or to custom views you create.
Tip: To show reports in full screen with most if not all possible columns, click on report options ( ) menu and choose Expand ( ).

WhatsUp Gold User Guide
421
Built-in report views Application State Summary. Reveals application status based on profile type, customized profile, or a specific application instance.
Running Action Policies. Reveals actions invoked or pending as part of an application policy implementation.
Status Over Time. Charts application or service availability.
Application Availability Summary. Reveals application instances, their current state, and provides quick access to monitor status for a given instance.
Application State Change Log. Records transitions in application monitoring states. By default, it displays the last n events.
Application Resolved Items Log. Displays a record of the action policies previously acknowledged in the Running Action Policies report.
Application Action Log. Records actions, triggers, recorded activities, and their associated policies.
Customize report views Add a new view ( ). Browse or search the collapsible Add Reports panel, drag new reports into your
view. Use row options ( ) to apply filters or jump to device properties and status. Use report options ( ) to refresh, move, full screen, and delete reports. Use Dashboard Actions ( ) to share, export, and schedule export or e-mail of
report snapshots.

422
CHAPTER 18
Network Traffic Analysis Dashboards In This Chapter NTA Home Dashboard.......................................................... 423
NTA Senders and Receivers ................................................ 423
NTA Troubleshooting ............................................................ 423
Network Traffic Analysis Dashboards dashboard enables you to view, analyze, and share observed traffic patterns as well as current and historic network performance data by way of both built-in and custom dashboards.
The Traffic Analysis dashboard provides three operational views, each with its own suite of reports, charting, graphing along with endpoint, application, and keyword filtering (on page 381).
Home (on page 423). Top n traffic, connections, and bandwidth utilization reports at a glance.
Senders and Receivers (on page 423). Top n interfaces ranked by incoming and outgoing traffic, geo location, and Internet domain.
Troubleshooting (on page 423). Top concurrent connections received/initiated, half-open or failed connections received/initiated, and traffic hitting non-standard ports.
Note: You can add custom views with the Add View control ( ) and custom and built-in reports using the Add Reports palette.
Traffic data metrics are collected from any network devices that support flow export (referred to in WhatsUp Gold as "flow sources"). Each flow source Network Traffic Analysis collects from provides a key observation point for gauging proper function and

WhatsUp Gold User Guide
423
performance of critical network segments, services, and application infrastructure. You manage flow source configuration and collection status from the NTA Sources Library (on page 356).
Tip: If you are using Network Traffic Analysis for the first time, walk through the steps in the NTA Quick Start (on page 350) to find active or ready-to configure flow sources already on your network.
NTA Home Dashboard NTA Home Dashboard provides top n reports for utilization and bandwidth.
Top Interfaces by Traffic (on page 553). Interfaces showing the most traffic volume.
Top Interfaces by Utilization (on page 556). Interfaces showing the highest capacity utilization.
Top Applications (on page 538). Application types creating the most traffic. Top Conversations (on page 541). Endpoints showing the most traffic streams. Top Endpoints (on page 547). Endpoints showing the greatest traffic volume.
NTA Senders and Receivers NTA Troubleshooting NTA Troubleshooting dashboard provides a default All-NTA-Sources view that helps you identify, isolate, and understand out-of-specification network traffic, network incident indicators, and other outlier activity. Use the flow source picker and advanced filter (on page 381) to scope down and choose specific observation points, network segments, and applications.
Predictive Trending Report The Predictive Trending Report displays a suite of reports that present historical and average statistics for common performance measures so you can better anticipate how the selected device or devices will perform in the future. This allows you to take action before there is a problem if a metric is trending toward a critical limit.
Predictive trending provides the following five individual dashboard reports:
CPU Utilization. Reports average CPU utilization percentage for each individual processor.
Memory Utilization. Reports both physical and virtual memory capacity and usage.
Disk Utilization. Reports disk utilization percentage for individual drives.

WhatsUp Gold User Guide
424
Interface Utilization. Reports measurements for network traffic across network interfaces.
Ping Response Time. Reports minimum, maximum, and average response times.
Please note, this dashboard is completely static. Additional reports cannot be added and the five default reports described previously cannot be removed. Only the device(s) displayed ( ), reporting time frame ( ), and applied business hours ( ) may be modified.
Virtual Monitoring Virtual Monitoring Host Details dashboard is a built-in dashboard that reveals data for an individual VMware or Hyper-V host. Use the source selector to choose the host device.
The dashboard contains the following reports:
Host Machine Attributes (on page 610). Host machine characteristics and info.
Virtual Machines CPU Utilization (on page 709). VM CPU capacity usage.
Host CPU Utilization (on page 709). Host machine VM CPU capacity usage.
Virtual Machines Memory Utilization (on page 714). VM memory capacity usage.
Memory Utilization (on page 596). Host machine VM capacity usage.
Virtual Machines Disk Activity (on page 710). VM read/write metrics.
Disk Utilization (on page 580). Host machine disk capacity usage.
Virtual Machines Interface Utilization (on page 712). VM network bandwidth utilization.
Platform Considerations Hyper-V and VMWare virtual devices report memory statistics differently.
When reporting usage, VMWare displays active memory and Hyper-V displays assigned memory.
When reporting allocation, VMWare displays consumed memory and Hyper-V displays memory demand.
When reporting maximum, VMWare displays granted memory and Hyper-V displays maximum memory.
When viewed on the Virtual Host Details dashboard, the individual reports can not be customized aside from selecting the target device. To create a customized version of this dashboard, create a new view and add, arrange and configure these reports or others individually.

WhatsUp Gold User Guide
425
Traffic Overview Traffic Overview provides a highest level view of your NTA-monitored traffic. It includes:
Interface Usage (on page 523). Report of interface activity and trends from selected sources.
NBAR Applications - Interface Totals (on page 529). Traffic volume by application category.
Top Sources with Interfaces (on page 559). Top n of the sources with traffic broken down by interface and direction.
Traffic Totals (on page 562). Total traffic volumes.
Note: You can add custom views with the Add View control ( ) and custom and built-in reports using the Add Reports pallet.
Wireless Monitoring Wireless Monitoring dashboard reveals both end-station and access point wireless traffic and Radio Frequency (RF) performance measurements for the selected interval.
Important: Wireless reports use the client's local time rather than the time local to the WhatsUp Gold server.
Wireless Infrastructure
Bandwidth (on page 721). (Inbound and outbound wireless traffic comparison). Bandwidth Summary (on page 724). Average total input and output utilization.
Top client station MAC address.

WhatsUp Gold User Guide
426
System Summary (on page 744). Remote station (client) inventory, client types, radio parameters such as SnR and RSSI.
RSSI (on page 735). Radio frequency signal strength for given device(s). Signal to Noise Ratio (on page 740). Radio frequency signal to noise ratio.
Clients and Rogues
Client Count (on page 728). Highest number of wireless clients observed. Rogue Count (on page 738). Remote stations that are not yet identified.
CPU and Memory
CPU Utilization (on page 725). CPU capacity usage on the wireless access point.
Memory Utilization (on page 733). Memory capacity utilization on the wireless access point.
Unclassified Traffic Unclassified Traffic dashboard provides a summary of IP network traffic that uses ports outside of the expected or 'well-known (https://www.ietf.org/rfc/rfc1700.txt)' port range. Network Traffic Analysis considers traffic unclassified if both source and destination ports cannot be identified or are outside the IETF well-known range.
TOP 10 TOP 10 dashboard reveals top n report items within a ranked list or chart (where n=10 by default) for selected monitors that enable capacity utilization and performance measurements as well as active monitor (ping) availability.
By default, TOP 10 dashboard includes the following reports:
Interface Errors (on page 587). NIC/VIF observed errors.
Ping Response Time (on page 605). ICMP echo "Ping" latency.
Interface Discards (on page 583). NIC/VIF discarded packets.
Disk Utilization (on page 580). Storage capacity utilization.
Interface Utilization (on page 593). NIC/VIF bandwidth capacity utilization.
CPU Utilization (on page 571). Processor time capacity utilization.
Interface Traffic (on page 590). NIC/VIF total traffic observed.
Memory Utilization (on page 596). Memory capacity utilization.
Ping Availability (on page 600). ICMP echo "Ping" polling results.

WhatsUp Gold User Guide
427
Rogues Dashboard Rogues Dashboard report helps identify and track wireless devices unknown to the network. This dashboard helps you to report on and reduce risk of unsecured wireless networks, MAC spoofing of wireless clients, and wireless Man-in-the-Middle attacks facilitated by rogue access points.
You can sort displayed devices by any column (SSID, MAC address, time noticed, and so on), search for a specific device, exclude known devices, and track any known devices in RF signal range to your wireless network.
Understand column data The default view of each report contains a grid with the following columns:
SSID. SSID broadcast by the access point (AP). If the AP has been configured not to broadcast an SSID, the SSID box is blank.
MAC Address. MAC address specific to the rogue detected by the network.
Duration. Amount of time the SSID/MAC Address combination has been seen on the specific access point since the listed poll time.
First Seen. Date and time the rogue was first seen during the defined date/time interval.
Last Seen. Date and time the rogue was last seen during the defined date/time interval.
Percent Seen. Percent of time the rogue was connected in relation to the defined date/time interval.
Generate a report Choose Device. Choose one or more host devices you want Rogues Dashboard measurements for.
Use the Select Device dialog for one of the following:
Control Purpose
Device Browse and choose a single device.
Device Group
Choose an existing group of one or more devices. You can also create custom or dynamic groups.
Note: You can organize devices into custom or dynamic groups. For more information, see Grouping Devices (on page 242).

WhatsUp Gold User Guide
428
Tip: If a device is identified as a virtual machine, Hyper-V or VMware credentials will be used to retrieve data and only those physical resources allocated to the virtual machine will be visible in the report.
Choose time constraints. Choose times for the Rogues Dashboard. (For recently observed measurements, select Last Polled from the Date Range drop down list.)
Filter and reduce by row and by column. Sort and remove columns, group rows based on specific column values, and hide records with the Exclude Rogue button.
Filter and pick by column
Click a report heading and use the following from the drop down list:
Control Purpose
Sort. Sort column in ascending or descending order.
Columns. Pick the columns you want to view. Click a check box to display the column. Clear the check box to hide it.
Group by this field.
Group table into collapsible rows wherever the current column contains identical data ("field") values.
Filters. Provide a keyword to view only rows that contain the keyword for this column.
Rename Report. Edit report name using the Report Settings dialog.
Note: This report only returns Rogues Dashboard metrics for devices that already have the appropriate WMI or SNMP credentials. For more information, see Using Credentials.
Note: If Current is selected as the reporting interval, the Rogues page only displays the SSID and MAC Address of rogues currently visible.
The devices displayed on the Rogues Dashboard page are grouped by the access points on which they are/were connected. An SSID/MAC Address combination may appear under more than one access point indicating it is a roaming device hopping from one access point to another. Clicking the icon to the left of any access point displayed launches a dialog containing detailed AP information. Specific dialog content is identical to detailed device information displayed when you click on an access point icon on the My Network Map.

WhatsUp Gold User Guide
429
Share, export, and save as PDF Most generated Rogues Dashboard report data can be printed, shared, and exported when selecting Expand ( ) from the Dashboard Options ( ) menu. After the report has been expanded, select export ( ) to access the following options:
Export to PDF. Generate a PDF file of the report with user-defined page size and orientation.
Export Data. Export Rogues Dashboard data (on page 951) and leverage outside of WhatsUp Gold.
Schedule Export. Set a recurring date and time, format, and email destination for report data export (on page 942).
Quarterly Availability Summary Quarterly Availability Summary report reveals device availability indicated by all applied active monitors.
Understand column data The default view of each report contains a grid with the following columns:
Group Information
Group name. The device group for which the report displays activity data. You can change the group by clicking the group context at the top of the log to the right of the log title.
Group description. A short description for the device group. Number of devices. The number of monitored devices in the selected group. Length of time reported over. The amount of time the information displayed
represents.
Monitor Summary
All monitors of type. The type of Active Monitor. The number in parenthesis next to the monitor name depicts the total number of that type of monitor in the device group.
Up. The percentage of time the Active Monitor was up during the selected time period for all devices.
Maintenance. The percentage of time the Active Monitor was in maintenance during the selected time period for all devices.
Down. The percentage of time the Active Monitor was down during the selected time period for all devices.
Down count. The number of times the Active Monitor was in the down state during the selected time period for all devices.
Availability. The overall availability for the Active Monitor during the selected time period, by color. The colors in this section match the Device States colors (configured in Program Options > Device States).

WhatsUp Gold User Guide
430
Note: When hovering over any percentage data listed, a popup appears displaying the total number of seconds the monitor has been in the listed state.
Device Details
Device. The group device's display name (or IP address if a display name isn't specified in its Device Properties) and device state icon.
Monitor. The Active Monitor configured for this device. Up. The percentage of time the Active Monitor on this device was up during the
selected time period. Maintenance. The percentage of time the Active Monitor on this device was in
maintenance during the selected time period. Down. The percentage of time the Active Monitor on this device was down
during the selected time period. Down time. Specifies how long the Active Monitor on this device was in the
down state during the selected time period. Down count. Specifies the number of times the Active Monitor on these devices
went down during the selected time period.
Note: When hovering over any percentage data listed, a popup appears displaying the total number of seconds the monitor has been in the listed state.
Rounded percentages When calculating percentages of uptime for a monitor, WhatsUp Gold rounds values to the nearest thousandth of one percent (three decimal places). If this rounded value is greater than 99.999 percent, the uptime is displayed as 100% with an asterisk notation to indicate the displayed value is slightly larger than the actual value. The precise downtime value is always visible in the Down time column for the monitor.
Generate a report Choose Device. Choose one or more host devices you want Quarterly Availability Summary measurements for.
Use the Select Device dialog for one of the following:
Control Purpose
Device Browse and choose a single device.
Single Interface
Choose an interface on a device.
Device Group
Choose an existing group of one or more devices. You can also create custom or dynamic groups.

WhatsUp Gold User Guide
431
Note: You can organize devices into custom or dynamic groups. For more information, see Grouping Devices (on page 242).
Filter and reduce by row and by column. Sort and remove columns, group rows based on specific column values, and remove unwanted information from the table.
Filter and pick by column
Click a report heading and use the following from the drop down list:
Control Purpose
Sort. Sort column in ascending or descending order.
Columns. Pick the columns you want to view. Click a check box to display the column. Clear the check box to hide it.
Group by this field.
Group table into collapsible rows wherever the current column contains identical data ("field") values.
Filters. Provide a keyword to view only rows that contain the keyword for this column.
Rename Report. Edit report name using the Report Settings dialog.
Note: This report only returns Quarterly Availability Summary metrics for devices that already have the appropriate WMI or SNMP credentials. For more information, see Using Credentials.
Share, export, and save as PDF Most generated Quarterly Availability Summary report data can be printed, shared, and exported when selecting Expand ( ) from the Dashboard Options ( ) menu. After the report has been expanded, select export ( ) to access the following options:
Export to PDF. Generate a PDF file of the report with user-defined page size and orientation.
Export Data. Export Quarterly Availability Summary data (on page 951) and leverage outside of WhatsUp Gold.
Schedule Export. Set a recurring date and time, format, and email destination for report data export (on page 942).
432
CHAPTER 19
Reporting Performance, Inventory, and Uptime
In This Chapter Alerts .................................................................................... 439
Applications .......................................................................... 444
Custom Content .................................................................... 452
Devices ................................................................................. 453
Network Traffic ..................................................................... 481
Performance ......................................................................... 571
System Info ........................................................................... 609
Remote System Info ............................................................. 637
Troubleshooting .................................................................... 642
Virtual Reporting ................................................................... 709
Wireless Reporting ............................................................... 721
Remote Environment Reporting ............................................ 756
WhatsUp Gold reporting and dashboarding tools (ANALYZE menu ... ) are invaluable for many network operations and monitoring scenarios, including:
Daily operations. Display alerts, critical state changes, and up-to-minute load utilization and quality of service (QoS) trends into easy to comprehend tables, charts, and dashboards for your operations center. Use report actions and hyperlinks within table views to access underlying device, group, and interface details. Scheduled and periodic audits. Gather, audit, and analyze periodic snapshots of your critical network infrastructure. Investigate anomalies and manage trends. Schedule daily export and e-mail of charts and data. Performance assessment, resource accounting, and capacity utilization. Track recent, latest, and historic trends of bandwidth usage, device resource usage, and device availability. Fault detection, fault correction, and troubleshooting.

WhatsUp Gold User Guide
433
Careful and predefined grouping of report and log data attributes enables quick access to device status and activities that are most interesting during alerts, outages, and other network incidents. Reports and logs that include thresholds, actions taken, and monitoring provide data and visualization of critical incidents, milestones, scheduled events, and actions taken. More. WhatsUp Gold provides a complete monitoring platform and hundreds of customizable reports you can use as part of routine status checks, notifications, audits, and more.
Report Categories WhatsUp Gold provides periodic and on-demand display and distribution of monitored device data. The broad categories of reports are:
Alerts
Device Thresholds (on page 439) Applications State Change Log (on page 838)
Threshold Summary (on page 439) State Summary (applications) (on page 446)
Alert Center Items Status over Time (applications) (on page 451)
State Change Timeline (on page 642) Unacknowledged Devices (on page 704)
Blackout Summary Log (on page 804)
Applications
Application Event Log (on page 444) Top Applications (on page 538)
State Summary (on page 446) NBAR Applications (NTA) (on page 526)
Running Action Policy (on page 447) NBAR Applications - Interface Totals (NTA) (on page 529)
Instance Summary (on page 449) Applications State Change Log (on page 838)
Hourly Availability over Time (on page 451)
Custom Content
Custom Links (on page 452)
Free Form Text/HTML (on page 755)
Custom Network Maps

WhatsUp Gold User Guide
434
Devices
Active Monitor Availability
Attributes (on page 456)
Dependencies (on page 463)
Device Active Monitor States
Device Custom Links (on page 466)
Interface Details (on page 467)
Device Notes (on page 468)
Monitors Applied
Performance Monitor Summary (on page 470)
Active Monitor Outages (on page 472)
Alert Center Items
Device Uptime (on page 474)
Device Health (on page 476)
Start vs. Run
State Change Acknowledgment Report (on page 685)
Group Status (on page 459)
SNMP Details (on page 461)
Status
Network Traffic
Receivers
Top Receivers (on page 481)
Top Receiver ASN (on page 484)
Top Receiver Cities (on page 487)
Top Receiver Domains (on page 490)
Top Receiver Groups (on page 492)
Top Receiver TLDs (on page 495)
WhatsUp Gold User Guide
435
Top Receivers with the Most Conversation Partners (on page 497)
Top Receivers with the Most Failed Connections (on page 500)
Senders
Senders (on page 502)
Top Sender ASN (on page 505)
Top Sender Cities (on page 508)
Top Sender Domains (on page 510)
Top Sender Groups (on page 513)
Top Sender TLDs (on page 515)
Top Senders with the Most Conversation Partners (on page 518)
Top Senders with the Most Failed Connections (on page 521)
Misc. Network Traffic
Interface Usage (on page 523)
NBAR Applications - Flow Details (on page 526)
NBAR Applications - Interface Totals (on page 529)
NTA Types of Services (ToS) (on page 532)
Packet Size Distribution (on page 534)
Top Applications (on page 538)
Conversations (on page 541)
Top Endpoint Groups (on page 544)
Top Endpoints (on page 547)
ICMP Types (on page 550)
Top Interfaces by Traffic (on page 553)
Top Interfaces by Utilization (on page 556)
Top Sources with Interfaces (on page 559)
Traffic Totals (on page 562)
WhatsUp Gold User Guide
436
Unclassified Traffic
Performance
Virtual
CPU Utilization (on page 571)
Custom Performance Monitor (on page 574)
Disk Free Space
Disk Utilization (on page 580)
Interface Discards (on page 583)
Interface Errors (on page 587)
Interface Traffic (on page 590)
Interface Utilization (on page 593)
Memory Utilization (on page 596)
Ping Availability (on page 600)
Ping Packet Loss (on page 603)
Ping Response Time (on page 605)
Inventory and Updates
Asset Inventory (on page 615)
Element Count (on page 632) (summary table)
Device Connectivity (on page 618)
Switch Port Utilization (on page 620)
VLAN View (on page 622)
Subnet View (on page 623)
Custom Maps
more... (on page 609)
OS/Update Compliance
Installed Software (on page 617)
BIOS (on page 627)

WhatsUp Gold User Guide
437
Software Updates (on page 628)
Services (on page 630)
Warranty Information (on page 632)
more... (on page 609)
WhatsUp Gold System
Total Active Monitors by Type
Poller Health
Total Actions Applied by Type (on page 632)
WhatsUp Database Size (on page 633)
Summary Counts (on page 682)
Troubleshooting
Tail of Action Activity Log (on page 686)
Actions Fired (on page 667)
Completely Down Devices (on page 670)
Devices with Down Critical Monitors (on page 677)
Devices with Down Active Monitors
Down Interfaces (on page 679)
Unacknowledged Devices (on page 704)
Device Group Mini Status (on page 673)
Virtual
Virtual Host Attributes (on page 612)
Virtual Machine Attributes (on page 614)
Virtual resource monitoring (on page 424)
Hyper-V Event Log (on page 808)
VMware Event Log (on page 825)
more... (on page 410)

WhatsUp Gold User Guide
438
Wireless
RSSI (on page 735). Radio frequency signal strength for given device(s).
Signal to Noise Ratio (on page 740). RF signal to noise ratio.
Bandwidth (on page 721). (Inbound and outbound wireless traffic comparison).
Bandwidth Summary (on page 724). Average total input and output utilization. Top client station MAC address.
CPU Utilization (on page 725). CPU capacity usage on the wireless access point.
Client Count (on page 728). Highest number of wireless clients observed.
Rogue Count (on page 738). Remote stations that are not yet identified.
Memory Utilization (on page 733). Memory capacity utilization on the wireless access point.
System Summary (on page 744). Remote station (client) inventory, client types, radio parameters such as SnR and RSSI.

439
CHAPTER 20
Alerts In This Chapter Device Thresholds ................................................................ 439
Threshold Summary ............................................................. 440
Alert Center Items ................................................................. 441
Alert Center Item History ....................................................... 442
Device Thresholds Device Thresholds report reveals thresholds grouped by type and alerts for a single device.
Understand column data The default view of each report contains a grid with the following columns:
Threshold Name. Thresholds are organized by Passive Monitor and Performance Monitor. Specific thresholds are listed under each threshold type.
Aspect. Aspect out of threshold. For example, CPU or interface. Value. Thresholded value.
Note: This report displays other thresholds as applicable for add-on features such as Network Traffic Analysis, Virtual Monitoring, and Wireless.
Generate a report Choose device. Choose a single device.
Filter and reduce by row and by column. Sort and remove columns, group rows based on specific column values, and find specific field values in the table.
Filter and pick by column
Click a report heading and use the following from the drop down list:
Control Purpose
Sort. Sort column in ascending or descending order.
Columns. Pick the columns you want to view. Click a check box to display the column. Clear the check box to hide it.

WhatsUp Gold User Guide
440
Group by this field.
Group table into collapsible rows wherever the current column contains identical data ("field") values.
Filters. Provide a keyword to view only rows that contain the keyword for this column.
Share, export, and save as PDF Most generated Device Thresholds report data can be printed, shared, and exported when selecting Expand ( ) from the Dashboard Options ( ) menu. After the report has been expanded, select export ( ) to access the following options:
Export to PDF. Generate a PDF file of the report with user-defined page size and orientation.
Export Data. Export Device Thresholds data (on page 951) and leverage outside of WhatsUp Gold.
Schedule Export. Set a recurring date and time, format, and email destination for report data export (on page 942).
Threshold Summary Threshold Summary report reveals the unresolved item count for each threshold type and provides drill down into device monitoring details.
Understand column data The default view of each report contains a grid with the following columns:
Threshold Type. Thresholds are grouped by type; Network Traffic Analysis, Passive Monitor, Performance Monitor, System, and Wireless. Specific thresholds are listed under each threshold type.
Unresolved Items Count. Displays the number of unresolved items for each threshold.

WhatsUp Gold User Guide
441
Generate a report Filter and reduce by row and by column. Sort and remove columns, group rows based on specific column values, remove and remove noise and chaff from the table.
Filter and pick by column
Click a report heading and use the following from the drop down list:
Control Purpose
Sort. Sort column in ascending or descending order.
Columns. Pick the columns you want to view. Click a check box to display the column. Clear the check box to hide it.
Group by this field.
Group table into collapsible rows wherever the current column contains identical data ("field") values.
Filters. Provide a keyword to view only rows that contain the keyword for this column.
Rename Report. Edit report name using the Report Settings dialog.
Share, export, and save as PDF Most generated Threshold Summary report data can be printed, shared, and exported when selecting Expand ( ) from the Dashboard Options ( ) menu. After the report has been expanded, select export ( ) to access the following options:
Export to PDF. Generate a PDF file of the report with user-defined page size and orientation.
Export Data. Export Threshold Summary data (on page 951) and leverage outside of WhatsUp Gold.
Schedule Export. Set a recurring date and time, format, and email destination for report data export (on page 942).
Alert Center Items Alert Center Items report reveals notes or "items" you can use to annotate a given threshold event.
Understand column data The default view of each report contains a grid with the following columns:

WhatsUp Gold User Guide
442
Tip: Click an item to view its history report.
Item. Denotes out of threshold device or service.
Threshold. Specific threshold.
Aspect. Device aspect is out of threshold.
Value. Value observed that caused the device aspect to fall out of threshold.
Creation time. Alert Center found the device aspect out of threshold and created the item.
Comment. Comments entered at the time the item was updated.
Share, export, and save as PDF Most generated Alert Center Items report data can be printed, shared, and exported when selecting Expand ( ) from the Dashboard Options ( ) menu. After the report has been expanded, select export ( ) to access the following options:
Export to PDF. Generate a PDF file of the report with user-defined page size and orientation.
Export Data. Export Alert Center Items data (on page 951) and leverage outside of WhatsUp Gold.
Schedule Export. Set a recurring date and time, format, and email destination for report data export (on page 942).
Alert Center Item History Alert Center Item History report tracks an item through the system from creation to completion.
Understand column data The default view of each report contains a grid with the following columns:
State. Current item state.
Notification Progress. Displays the progress status of an assigned notification policy. Possible progress states include Pending, Step 1, Step 2, Step 3, Done, Acknowledged, Resolved, or Repeating Step 3.
Value. Value observed that caused the device aspect to fall out of threshold.
Comment. Comments entered at the time the item was updated.
Entry Time. Time updated.
Duration. How long the item has remained in the current state since it went out of threshold.

WhatsUp Gold User Guide
443
Share, export, and save as PDF Most generated Alert Center Item History report data can be printed, shared, and exported when selecting Expand ( ) from the Dashboard Options ( ) menu. After the report has been expanded, select export ( ) to access the following options:
Export to PDF. Generate a PDF file of the report with user-defined page size and orientation.
Export Data. Export Alert Center Item History data (on page 951) and leverage outside of WhatsUp Gold.
Schedule Export. Set a recurring date and time, format, and email destination for report data export (on page 942).

444
CHAPTER 21
Applications In This Chapter Application Event Log ........................................................... 444
Application State Summary ................................................... 446
Running Action Policy Report ............................................... 447
Instance Summary ................................................................ 449
Hourly Availability Over Time ................................................ 451
Application Event Log Application Event Log report reveals application events, actions, and state changes for a profile type, customized profile, or instance.
Understand column data The default view of each report contains a grid with the following columns:
Date. Date and time for the event message. Log Type. Application logging category. Source Name. Application that registered the message. Source Type. APM library type used for monitoring. Details. Log message string.
Generate a report Choose application. Choose one or more applications you want to see Application Event Log measurements for.
Choose time constraints. ( , ) Choose times for the Application Event Log. (For recently observed measurements, select Last Polled from the Date Range drop down list.)
Choose time constraints for data view Control Purpose
Date Range (on page 944)
Choose or define an overall date range.

WhatsUp Gold User Guide
445
Business hours (on page 944)
Focus on specific days of the week and periods within each day. Reveal trends that are sensitive to business hours, time zones,
and other periodic attributes in the observed data.
Filter and reduce by row and by column. Sort and remove columns, group rows based on specific column values, and remove unwanted information from the table.
Filter and pick by column
Click a report heading and use the following from the drop down list:
Control Purpose
Sort. Sort column in ascending or descending order.
Columns. Pick the columns you want to view. Click a check box to display the column. Clear the check box to hide it.
Group by this field.
Group table into collapsible rows wherever the current column contains identical data ("field") values.
Filters. Provide a keyword to view only rows that contain the keyword for this column.
Chart, adjust output, and visualize. Fine tune report presentation and range of values displayed using the Report Settings dialog (optional).
Specify n report entries: Control Purpose
Show Top n Items Limit items to the samples with the highest utilization.
Note: This report returns data only if access to the application service or instance needs no credentials or the appropriate SNMP/WMI/SSH or application-specific credentials are associated with the relevant APM monitors. For more information, see Using Credentials.

WhatsUp Gold User Guide
446
Share, export, and save as PDF Most generated Application Event Log report data can be printed, shared, and exported when selecting Expand ( ) from the Dashboard Options ( ) menu. After the report has been expanded, select export ( ) to access the following options:
Export to PDF. Generate a PDF file of the report with user-defined page size and orientation.
Export Data. Export Application Event Log data (on page 951) and leverage outside of WhatsUp Gold.
Schedule Export. Set a recurring date and time, format, and email destination for report data export (on page 942).
Application State Summary Application State Summary report reveals application status based on profile type, customized profile, or a specific application instance. Application monitoring can be coupled with core WhatsUp Gold monitoring to monitor application layer resources and endpoints.
Note: WhatsUp Gold Application Monitoring has dedicated discovery and configuration methods. For more information, see the section titled Monitoring Applications.
Charted summary Status includes a charted summary that provides the following:
Applications Up. Applications Down. Applications in Maintenance. Applications Showing Warning.
Understand grid column data The default view of each report contains a grid with the following columns:
Current State. Current state detected by the application monitor. Name. Name of the device/monitor. Time in State. Duration observed in operational state indicated.
Generate a report Choose Device. Choose one or more host devices you want Application State Summary measurements for.
Use the Select Device dialog for one of the following:
Control Purpose
Device Browse and choose a single device.

WhatsUp Gold User Guide
447
Single Interface
Choose an interface on a device.
Device Group
Choose an existing group of one or more devices. You can also create custom or dynamic groups.
Note: You can organize devices into custom or dynamic groups. For more information, see Grouping Devices (on page 242).
Rename Report. Edit report name using the Report Settings dialog.
Note: This report returns data only if monitoring of application or platforms has been configured. For more information, see the topic titled Monitoring Applications.
Share, export, and save as PDF Most generated Application State Summary report data can be printed, shared, and exported when selecting Expand ( ) from the Dashboard Options ( ) menu. After the report has been expanded, select export ( ) to access the following options:
Export to PDF. Generate a PDF file of the report with user-defined page size and orientation.
Export Data. Export Application State Summary data (on page 951) and leverage outside of WhatsUp Gold.
Schedule Export. Set a recurring date and time, format, and email destination for report data export (on page 942).
Running Action Policy Report Running Action Policy Report report reveals actions invoked or pending as part of an application policy implementation. An example might be applying restart action to a web service instance that polls as unavailable for more than three times the ping interval.
Understand column data The default view of each report contains a grid with the following columns:
Source Name. Instance or component governed by the policy. State. State detected when polled. For example, Up, Down, Maintenance,
Unknown. Action Policy. Action policy in effect. Next Action. Action applied if state does not change. Next Action Time. Anticipated time next action will fire.

WhatsUp Gold User Guide
448
Generate a report Choose Device. Choose one or more host devices you want Running Action Policy Report measurements for.
Use the Select Device dialog for one of the following:
Control Purpose
Device Browse and choose a single device.
Single Interface
Choose an interface on a device.
Device Group
Choose an existing group of one or more devices. You can also create custom or dynamic groups.
Note: You can organize devices into custom or dynamic groups. For more information, see Grouping Devices (on page 242).
Choose, filter, and reorder columns. Choose and hide columns, reorder columns, and customize your data view.
Filter and pick by column
Click a report heading ( ) and use the "column picker" ( ) from the drop down list.
Control Purpose
Columns. Click a check box to display the column. Clear the check box to hide it.
Move Column. Click on a column heading and drag it to reorder your table's columns.
Chart, adjust output, and visualize. Fine tune report presentation and range of values displayed using the Report Settings dialog (optional).
Specify n report entries: Control Purpose
Show Top n Items Limit items to the samples with the highest utilization.
Note: This report returns data only if access to the application service or instance needs no credentials or the appropriate SNMP/WMI/SSH or application-specific credentials are associated with the relevant APM monitors. For more information, see Using Credentials.

WhatsUp Gold User Guide
449
Share, export, and save as PDF Most generated Running Action Policy Report report data can be printed, shared, and exported when selecting Expand ( ) from the Dashboard Options ( ) menu. After the report has been expanded, select export ( ) to access the following options:
Export to PDF. Generate a PDF file of the report with user-defined page size and orientation.
Export Data. Export Running Action Policy Report data (on page 951) and leverage outside of WhatsUp Gold.
Schedule Export. Set a recurring date and time, format, and email destination for report data export (on page 942).
Instance Summary Instance Summary report reveals application instances, their current state, and provides quick access to monitor status for a given instance.
Understand column data The default view of each report contains a grid with the following columns:
Instance Name. Application instance identifier. Type. Application instance type. Application. Application identifier. Device. Device where monitor is running. Availability. Bar graph indicating percent of time available. Color of bar denotes
current state.
Generate a report Choose application. Choose one or more applications you want to see Instance Summary measurements for.
Choose time constraints. ( , ) Choose times for the Instance Summary. (For recently observed measurements, select Last Polled from the Date Range drop down list.)
Choose time constraints for data view Control Purpose
Date Range (on page 944)
Choose or define an overall date range.
Business hours (on page 944)
Focus on specific days of the week and periods within each day. Reveal trends that are sensitive to business hours, time zones,
and other periodic attributes in the observed data.
WhatsUp Gold User Guide
450
Filter and reduce by row and by column. Sort and remove columns, group rows based on specific column values, and remove unwanted information from the table.
Filter and pick by column
Click a report heading and use the following from the drop down list:
Control Purpose
Sort. Sort column in ascending or descending order.
Columns. Pick the columns you want to view. Click a check box to display the column. Clear the check box to hide it.
Group by this field.
Group table into collapsible rows wherever the current column contains identical data ("field") values.
Filters. Provide a keyword to view only rows that contain the keyword for this column.
Chart, adjust output, and visualize. Fine tune report presentation and range of values displayed using the Report Settings dialog (optional).
Specify n report entries: Control Purpose
Show Top n Items Limit items to the samples with the highest utilization.
Note: This report returns data only if access to the application service or instance needs no credentials or the appropriate SNMP/WMI/SSH or application-specific credentials are associated with the relevant APM monitors. For more information, see Using Credentials.
Share, export, and save as PDF Most generated Instance Summary report data can be printed, shared, and exported when selecting Expand ( ) from the Dashboard Options ( ) menu. After the report has been expanded, select export ( ) to access the following options:
Export to PDF. Generate a PDF file of the report with user-defined page size and orientation.
Export Data. Export Instance Summary data (on page 951) and leverage outside of WhatsUp Gold.

WhatsUp Gold User Guide
451
Schedule Export. Set a recurring date and time, format, and email destination for report data export (on page 942).
Hourly Availability Over Time Hourly Availability Over Time charts application or service availability.
Choose application. Choose one or more applications you want to see Hourly Availability Over Time measurements for.
Choose time constraints. ( , ) Choose times for the Hourly Availability Over Time. (For recently observed measurements, select Last Polled from the Date Range drop down list.)
Choose time constraints for data view Control Purpose
Date Range (on page 944)
Choose or define an overall date range.
Business hours (on page 944)
Focus on specific days of the week and periods within each day. Reveal trends that are sensitive to business hours, time zones,
and other periodic attributes in the observed data.
Rename Report. Edit report name using the Report Settings dialog.
Share, export, and save as PDF Most generated Hourly Availability Over Time report data can be printed, shared, and exported when selecting Expand ( ) from the Dashboard Options ( ) menu. After the report has been expanded, select export ( ) to access the following options:
Export to PDF. Generate a PDF file of the report with user-defined page size and orientation.
Export Data. Export Hourly Availability Over Time data (on page 951) and leverage outside of WhatsUp Gold.
Schedule Export. Set a recurring date and time, format, and email destination for report data export (on page 942).

452
CHAPTER 22
Custom Content In This Chapter Custom Links ........................................................................ 452
Custom Links Custom Links enables you to add frequently used or critical hyperlinks to a dashboard view.
Understand column data The default view of each report contains a grid with the following columns:
URL. Hyperlink address. Description. (Optional) Custom text string.
Share, export, and save as PDF Most generated Custom Links report data can be printed, shared, and exported when selecting Expand ( ) from the Dashboard Options ( ) menu. After the report has been expanded, select export ( ) to access the following options:
Export to PDF. Generate a PDF file of the report with user-defined page size and orientation.
Export Data. Export Custom Links data (on page 951) and leverage outside of WhatsUp Gold.
Schedule Export. Set a recurring date and time, format, and email destination for report data export (on page 942).

453
CHAPTER 23
Devices In This Chapter Active Monitor Availability ..................................................... 453
Attributes .............................................................................. 456
Current Device States ........................................................... 457
Device State Summary ......................................................... 458
Enabled Active Monitors ....................................................... 459
Group Status ........................................................................ 459
Map View .............................................................................. 460
SNMP Details ....................................................................... 461
Device Information and Status .............................................. 461
Dependencies ....................................................................... 463
Device Active Monitor States ................................................ 464
Device Custom Links ............................................................ 466
Interface Details .................................................................... 467
Notes .................................................................................... 468
Monitors Applied ................................................................... 468
Performance Monitor Summary ............................................ 470
Active Monitor Outages......................................................... 472
Alert Center Items ................................................................. 474
Device Uptime ...................................................................... 474
Device Health ....................................................................... 476
Start vs. Run ......................................................................... 478
Active Monitor Availability Active Monitor Availability report provides a comprehensive set of states and measurements that account for the monitor's absolute availability or "uptime" for each active monitor associated with one or more devices. Active Monitor Availability report displays complete accounting information for each Active Monitor.
WhatsUp Gold User Guide
454
The sum of state categories for a given monitor reflect 100% of observed device activity over a given time interval. These reporting metrics reveal service level and uptime compliance at a glance.
When the report is filtered to present data for a specific device and active monitor, a chart representing monitor availability over time for the selected interval is also displayed.
Understand column data The default view of each report contains a grid with the following columns:
Device. Device hostname, IP address, or alias. Monitor. Active monitor name. Up, Down, Maintenance, Unknown. Observed state categories for a given
active monitor: This active monitor state Is measured as
Up Fraction of uptime for the current date range.
Down Fraction of downtime for the current date range.
Unknown Fraction of time that no data was collected. For example, before monitoring began or during monitor off times not considered maintenance.
Maintenance Fraction of time that device was placed into maintenance mode. When production servers are taken offline for diagnostics or performance testing, for example.
Availability. Monitor state color indicator. One of the following:
This indicator Denotes
Green/blue Up.
Red Down.
Orange Maintenance.
Gray Unknown.
Generate a report Choose Device. Choose one or more host devices you want Active Monitor Availability measurements for.
Use the Select Device dialog for one of the following:
Control Purpose
Device Browse and choose a single device.

WhatsUp Gold User Guide
455
Single Interface
Choose an interface on a device.
Device Group
Choose an existing group of one or more devices. You can also create custom or dynamic groups.
Note: You can organize devices into custom or dynamic groups. For more information, see Grouping Devices (on page 242).
Choose time constraints. ( , ) Choose times for the Active Monitor Availability. (For recently observed measurements, select Last Polled from the Date Range drop down list.)
Choose time constraints for data view Control Purpose
Date Range (on page 944)
Choose or define an overall date range.
Business hours (on page 944)
Focus on specific days of the week and periods within each day. Reveal trends that are sensitive to business hours, time zones,
and other periodic attributes in the observed data.
Filter and reduce by row and by column. Sort and remove columns, group rows based on specific column values, and remove unwanted information from the table.
Filter and pick by column
Click a report heading and use the following from the drop down list:
Control Purpose
Sort. Sort column in ascending or descending order.
Columns. Pick the columns you want to view. Click a check box to display the column. Clear the check box to hide it.
Group by this field.
Group table into collapsible rows wherever the current column contains identical data ("field") values.
Filters. Provide a keyword to view only rows that contain the keyword for this column.

WhatsUp Gold User Guide
456
Rename Report. Edit report name using the Report Settings dialog.
Note: This report only returns Active Monitor Availability metrics for devices that already have the appropriate WMI or SNMP credentials. For more information, see Using Credentials.
Share, export, and save as PDF Most generated Active Monitor Availability report data can be printed, shared, and exported when selecting Expand ( ) from the Dashboard Options ( ) menu. After the report has been expanded, select export ( ) to access the following options:
Export to PDF. Generate a PDF file of the report with user-defined page size and orientation.
Export Data. Export Active Monitor Availability data (on page 951) and leverage outside of WhatsUp Gold.
Schedule Export. Set a recurring date and time, format, and email destination for report data export (on page 942).
Attributes Attributes report reveals all attributes known for the selected device including host-specific, platform, and user-defined data. These attributes combine to characterize and uniquely identify a single discovered device.
Most device attributes are gathered during the device discovery process. You can also add and edit custom attribute data for a device from its Device Properties (on page 86) card. Device-specific reports are useful for browsing, reporting, and tracking your inventory.
Understand column data The default view of each report contains a grid with the following columns:
Name. Attribute ID. Value. Attribute value.
Generate a report Choose device. Choose a single device.
Filter and reduce by row and by column. Sort and remove columns, group rows based on specific column values, and find specific field values in the table.
Filter and pick by column
Click a report heading and use the following from the drop down list:

WhatsUp Gold User Guide
457
Control Purpose
Sort. Sort column in ascending or descending order.
Columns. Pick the columns you want to view. Click a check box to display the column. Clear the check box to hide it.
Group by this field.
Group table into collapsible rows wherever the current column contains identical data ("field") values.
Filters. Provide a keyword to view only rows that contain the keyword for this column.
Share, export, and save as PDF Most generated Attributes report data can be printed, shared, and exported when selecting Expand ( ) from the Dashboard Options ( ) menu. After the report has been expanded, select export ( ) to access the following options:
Export to PDF. Generate a PDF file of the report with user-defined page size and orientation.
Export Data. Export Attributes data (on page 951) and leverage outside of WhatsUp Gold.
Schedule Export. Set a recurring date and time, format, and email destination for report data export (on page 942).
Current Device States Current Device States report reveals the device counts for each state reported by WhatsUp Gold for the selected group. Each count is color-coded by device state and displayed in large font for easy, at-a-glance viewing and automatically adjusts if the report is resized. You have the ability to access applicable data in greater detail directly from Current Device States. Click any individual device state within the report to return directly to the My Network map (on page 20) filtered to display only devices currently in that state.
Click to access Report Settings where you enable/disable individual states for display as well as rename the report, if desired.
Share, export, and save as PDF Most generated Current Device States report data can be printed, shared, and exported when selecting Expand ( ) from the Dashboard Options ( ) menu. After the report has been expanded, select export ( ) to access the following options:
Export to PDF. Generate a PDF file of the report with user-defined page size and orientation.

WhatsUp Gold User Guide
458
Export Data. Export Current Device States data (on page 951) and leverage outside of WhatsUp Gold.
Schedule Export. Set a recurring date and time, format, and email destination for report data export (on page 942).
Device State Summary Device State Summary report reveals core WhatsUp Gold device monitor status.
Understand column data The default view of each report contains a grid with the following columns:
Devices. Devices Up. Device Down. Devices in Maintenance. Monitors Up. Monitors Down.
Generate a report Choose Device. Choose one or more host devices you want Device State Summary measurements for.
Use the Select Device dialog for one of the following:
Control Purpose
Device Browse and choose a single device.
Single Interface
Choose an interface on a device.
Device Group
Choose an existing group of one or more devices. You can also create custom or dynamic groups.
Note: You can organize devices into custom or dynamic groups. For more information, see Grouping Devices (on page 242).
Choose, filter, and reorder columns. Choose and hide columns, reorder columns, and customize your data view.
Filter and pick by column
Click a report heading ( ) and use the "column picker" ( ) from the drop down list.
Control Purpose
Columns. Click a check box to display the column. Clear the check box to hide it.

WhatsUp Gold User Guide
459
Move Column. Click on a column heading and drag it to reorder your table's columns.
Note: This report only returns Device State Summary metrics for devices that already have the appropriate credentials. For more information, see Using Credentials.
Share, export, and save as PDF Most generated Device State Summary report data can be printed, shared, and exported when selecting Expand ( ) from the Dashboard Options ( ) menu. After the report has been expanded, select export ( ) to access the following options:
Export to PDF. Generate a PDF file of the report with user-defined page size and orientation.
Export Data. Export Device State Summary data (on page 951) and leverage outside of WhatsUp Gold.
Schedule Export. Set a recurring date and time, format, and email destination for report data export (on page 942).
Enabled Active Monitors Enabled Active Monitors report reveals a count of all active monitors currently enabled for monitored devices in WhatsUp Gold. Chart elements are color-coded to match status; green for up and red for down.
Click to access Report Settings where you can rename the report or modify the chart type displayed, if desired.
Share, export, and save as PDF Most generated Enabled Active Monitors report data can be printed, shared, and exported when selecting Expand ( ) from the Dashboard Options ( ) menu. After the report has been expanded, select export ( ) to access the following options:
Export to PDF. Generate a PDF file of the report with user-defined page size and orientation.
Export Data. Export Enabled Active Monitors data (on page 951) and leverage outside of WhatsUp Gold.
Schedule Export. Set a recurring date and time, format, and email destination for report data export (on page 942).
Group Status Group Status displays a summary for the selected device group including the current status.
Category. Monitor/device metric name. Count. Monitor/device metric.

WhatsUp Gold User Guide
460
Report Links. Hyperlink to report associated with monitor metric.
Map View Map View enables you to spin-up a customized and situation-specific device map for the selected static and Layer 2 Dynamic groups. This report features similar capabilities of the MY NETWORK (on page 20) map and enables you to organize devices for site-specific operations, refine scope for troubleshooting, and has obvious advantages for system management and inventory scenarios. Please note, when creating a custom map for use within the Map View dashboard report, it should be sized to accommodate the relevant map information when zoomed to fit ( ). Please note, the zoom in ( ) and zoom out ( ) controls are intended for temporary use and will not persist the next time the dashboard report is loaded.
Map view reports enable:
Single view/multiple maps. View device, network, or application assets from multiple perspectives (inventory, availably, performance, for example).
Maps organized by site/location/region. Maximize visualization and awareness of critical infrastructure for Network Operations Center (NOC) scenarios
Incident tracking. Create map combinations that anticipate critical incidents where distinct indicators (monitor states) will display simultaneously in different views.
Distributed map views. Leverage situation-specific maps and leverage screen arrays or wide screen displays (such as those mounted in team areas).
Collaboration. Share map views with other WhatsUp Gold users or schedule a snapshot delivery to stakeholders.
Generate a report Choose Device Group. Choose a device group.
Use the Select Device dialog for one of the following:
Control Description
Device Group
Choose an existing group of one or more devices. You can also create custom or dynamic groups.
Network Choose the All Devices dynamic group.
Note: You can organize devices into custom or dynamic groups. For more information, see Grouping Devices (on page 242).
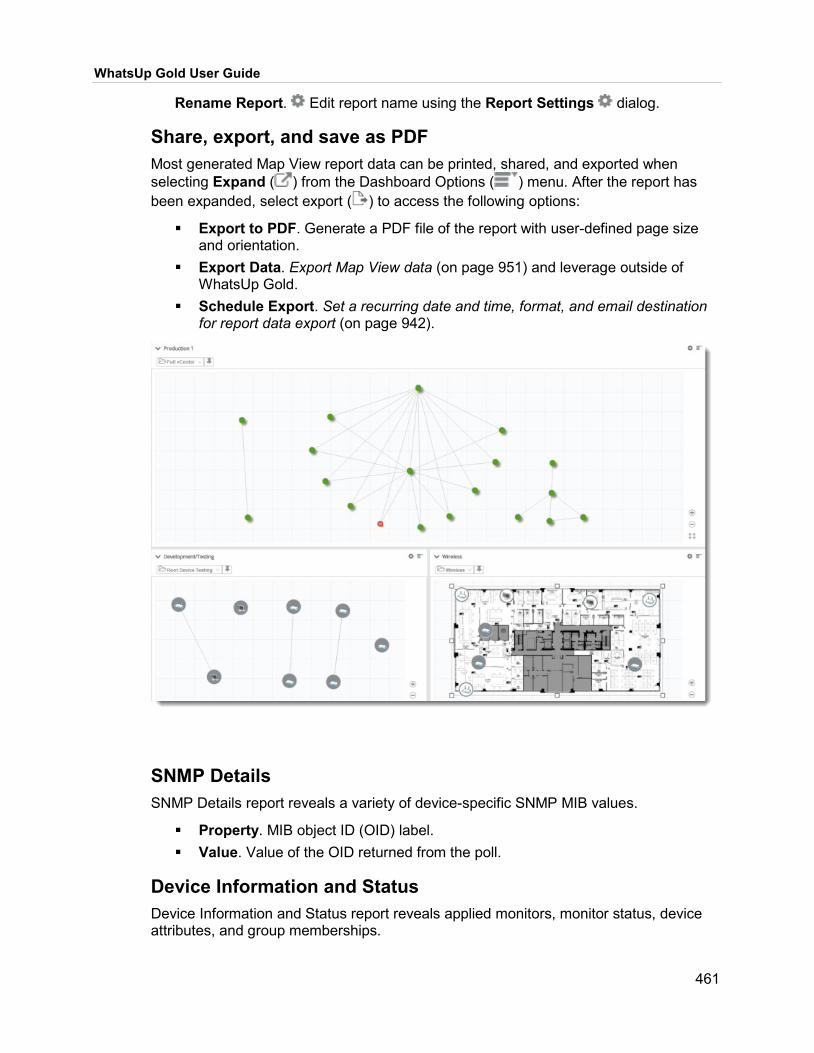
WhatsUp Gold User Guide
461
Rename Report. Edit report name using the Report Settings dialog.
Share, export, and save as PDF Most generated Map View report data can be printed, shared, and exported when selecting Expand ( ) from the Dashboard Options ( ) menu. After the report has been expanded, select export ( ) to access the following options:
Export to PDF. Generate a PDF file of the report with user-defined page size and orientation.
Export Data. Export Map View data (on page 951) and leverage outside of WhatsUp Gold.
Schedule Export. Set a recurring date and time, format, and email destination for report data export (on page 942).
SNMP Details SNMP Details report reveals a variety of device-specific SNMP MIB values.
Property. MIB object ID (OID) label. Value. Value of the OID returned from the poll.
Device Information and Status Device Information and Status report reveals applied monitors, monitor status, device attributes, and group memberships.

WhatsUp Gold User Guide
462
Understand column data The default view of each report contains a grid with the following columns:
IP. IP address for device. Host. DNS hostname for device. Role. Assigned primary role determined by discovery. Brand. Device manufacturer.
Active Monitors
Monitor. Monitor name. Status. State last polled. Criticality. Indicates if the active monitor is critical.
Performance Monitors
Monitor. Monitor name. Last Poll. State last polled. Value. Current value.
Credentials
Type. Credential type. Name. Credential name.
Group Membership
Group(s) to which the device is assigned.
Generate a report Choose device. Choose a single device.
Filter and reduce by row and by column. Sort and remove columns, group rows based on specific column values, and find specific field values in the table.
Filter and pick by column
Click a report heading and use the following from the drop down list:
Control Purpose
Sort. Sort column in ascending or descending order.
Columns. Pick the columns you want to view. Click a check box to display the column. Clear the check box to hide it.
Group by this field.
Group table into collapsible rows wherever the current column contains identical data ("field") values.

WhatsUp Gold User Guide
463
Filters. Provide a keyword to view only rows that contain the keyword for this column.
Share, export, and save as PDF Most generated Device Information and Status report data can be printed, shared, and exported when selecting Expand ( ) from the Dashboard Options ( ) menu. After the report has been expanded, select export ( ) to access the following options:
Export to PDF. Generate a PDF file of the report with user-defined page size and orientation.
Export Data. Export Device Information and Status data (on page 951) and leverage outside of WhatsUp Gold.
Schedule Export. Set a recurring date and time, format, and email destination for report data export (on page 942).
Dependencies Dependencies report reveals devices dependent on the current device and their status (and monitor status) for the selected interval.
Understand column data The default view of each report contains a grid with the following columns:
Device Name. Device name. Status. Device status (power state, monitor, and critical monitor status). Dependency. Dependency type (Up or Down). Dependency With. Device name, interface name, or dependent monitor name.
Generate a report Choose Device. Choose a single device, device group, or managed network.
Use the Select Device dialog for one of the following:
Control Description
Device Browse and choose a single device.
Device Group
Choose an existing group of one or more devices. You can also create custom or dynamic groups.
Network Network of devices managed by WhatsUp Gold.

WhatsUp Gold User Guide
464
Note: You can organize devices into custom or dynamic groups. For more information, see Grouping Devices (on page 242).
Filter and reduce by row and by column. Sort and remove columns, group rows based on specific column values, and find specific field values in the table.
Filter and pick by column
Click a report heading and use the following from the drop down list:
Control Purpose
Sort. Sort column in ascending or descending order.
Columns. Pick the columns you want to view. Click a check box to display the column. Clear the check box to hide it.
Group by this field.
Group table into collapsible rows wherever the current column contains identical data ("field") values.
Filters. Provide a keyword to view only rows that contain the keyword for this column.
Share, export, and save as PDF Most generated Dependencies report data can be printed, shared, and exported when selecting Expand ( ) from the Dashboard Options ( ) menu. After the report has been expanded, select export ( ) to access the following options:
Export to PDF. Generate a PDF file of the report with user-defined page size and orientation.
Export Data. Export Dependencies data (on page 951) and leverage outside of WhatsUp Gold.
Schedule Export. Set a recurring date and time, format, and email destination for report data export (on page 942).
Device Active Monitor States Device Active Monitor States report reveals current and historical active monitor down time for selected devices.
Understand column data The default view of each report contains a grid with the following columns:
(Report Options). Jump to a detailed dashboard or control panel for either:

WhatsUp Gold User Guide
465
Device Properties (on page 86).
Device Status (on page 105).
State Change Timeline (on page 642). Device. IP address or device name that indicates where monitor is applied. Monitor. Active monitor name as it appears in the Active Monitor Library. State. Status of monitor. Duration. Length of time active monitor has been in the current state.
Generate a report Choose time constraints. ( , ) Choose times for the Device Active Monitor States. (For recently observed measurements, select Last Polled from the Date Range drop down list.)
Choose time constraints for data view Control Purpose
Date Range (on page 944)
Choose or define an overall date range.
Business hours (on page 944)
Focus on specific days of the week and periods within each day. Reveal trends that are sensitive to business hours, time zones,
and other periodic attributes in the observed data.
Filter and reduce by row and by column. Sort and remove columns, group rows based on specific column values, and remove unwanted information from the table.
Filter and pick by column
Click a report heading and use the following from the drop down list:
Control Purpose
Sort. Sort column in ascending or descending order.
Columns. Pick the columns you want to view. Click a check box to display the column. Clear the check box to hide it.
Group by this field.
Group table into collapsible rows wherever the current column contains identical data ("field") values.

WhatsUp Gold User Guide
466
Filters. Provide a keyword to view only rows that contain the keyword for this column.
Rename Report and Reveal Top N. Edit report name and show top n table rows using the Report Settings dialog.
Specify top n: Control Purpose
Show Top n Items Limit items to the samples with the highest values.
Note: This report only returns Device Active Monitor States metrics for devices that already have the appropriate WMI or SNMP credentials. For more information, see Using Credentials.
Share, export, and save as PDF Most generated Device Active Monitor States report data can be printed, shared, and exported when selecting Expand ( ) from the Dashboard Options ( ) menu. After the report has been expanded, select export ( ) to access the following options:
Export to PDF. Generate a PDF file of the report with user-defined page size and orientation.
Export Data. Export Device Active Monitor States data (on page 951) and leverage outside of WhatsUp Gold.
Schedule Export. Set a recurring date and time, format, and email destination for report data export (on page 942).
Device Custom Links Device Custom Links enables you to embed a report that contains custom links previously created on the properties page for the selected device.
Understand column data The default view of each report contains a grid with the following columns:
Custom Link. Hyperlink to a useful endpoint such as a diagnostics page, a site map, email address of the current site administrator, and so on.
Share, export, and save as PDF Most generated Device Custom Links report data can be printed, shared, and exported when selecting Expand ( ) from the Dashboard Options ( ) menu. After the report has been expanded, select export ( ) to access the following options:

WhatsUp Gold User Guide
467
Export to PDF. Generate a PDF file of the report with user-defined page size and orientation.
Export Data. Export Device Custom Links data (on page 951) and leverage outside of WhatsUp Gold.
Schedule Export. Set a recurring date and time, format, and email destination for report data export (on page 942).
Interface Details Interface Details displays SNMP information reported by a single interface. To gather this data, you must have the SNMP credentials configured for the device.
Device Information This information includes:
Current state of the device. Display name and device type (with links to the Device Status report).
Interface Information Device metrics returned from SNMP includes:
Interface name. Name and IP address of the interface. (Links to Interface Utilization report for this interface).
Type. Type code of the interface as defined in the MIB file for the interface. Index. SNMP index of the interface. Description. Usually the interface or port name on the device.
Polling Information Status. Current status of the device as reported through SNMP. (Status code
hyperlinks to Router/Switch/Interface view of the Device Status report.) 1 - up
2 - down
3 - testing
4 - unknown
5 - dormant
6 - notPresent
7 - lowerLayerDown Last poll time. Date and time of the last successful poll. Last poll time interval. Time (in seconds) between the last two successful
polls.
Received octets Rx speed. Maximum bandwidth (in Mbps) that the interface allows for received
octets.

WhatsUp Gold User Guide
468
Last rx octets. Bandwidth (in Kbps) used by the interface during the last polling period for received octets.
Rx octets total. Total number of octets received (in KB) during the last polling cycle.
Rx utilization. Percent of the total bandwidth used by the interface for received octets during the last polling cycle.
Transmitted octets Tx speed. Maximum bandwidth (in Mbps) that the interface allows for
transmitted octets. Last tx octets. Bandwidth (in Kbps) used by the interface during the last polling
period for transmitted octets. Tx octets total. Total number of octets transmitted (in KB) during the last polling
cycle. Tx utilization. Percent of the total bandwidth used by the interface for
transmitted octets during the last polling cycle.
Notes Notes report reveals device notes present in the Properties Panel for the selected device.
Annotations to devices can be added:
Automatically, for instance, as part of device discovery. Manually from the Properties Panel.
Monitors Applied Monitors Applied report reveals monitors applied to a specific device.
Understand column data The default view of each report contains a grid with the following columns:
(Report Options). Jump to a detailed dashboard or control panel for either the:

WhatsUp Gold User Guide
469
Current device details. Jump to device and status dashboards.
Device Properties (on page 86). Properties panel for the current device.
Device Status (on page 105). Up/down status history for the current device.
Selected monitor details. Availability reports for the particular type of monitor.
Active Monitor Availability.
SNMP Trap Log. (on page 820)
Passive Monitor Error Log (on page 811).
Windows Event Log (on page 829).
Syslog (on page 822).
CPU Utilization (on page 571).
Disk Utilization (on page 580).
Interface Utilization (on page 593), Errors (on page 587), Discards (on page 583).
Memory Utilization (on page 596).
Ping Availability (on page 600), Response Time (on page 605).
Custom Performance Monitor (on page 574).
Monitor Name. Monitor name. Monitor Type. Active, Passive, or Performance.
Generate a report Choose device. Choose a single device.
Filter and reduce by row and by column. Sort and remove columns, group rows based on specific column values, and find specific field values in the table.
Filter and pick by column
Click a report heading and use the following from the drop down list:
Control Purpose
Sort. Sort column in ascending or descending order.
Columns. Pick the columns you want to view. Click a check box to display the column. Clear the check box to hide it.

WhatsUp Gold User Guide
470
Group by this field.
Group table into collapsible rows wherever the current column contains identical data ("field") values.
Filters. Provide a keyword to view only rows that contain the keyword for this column.
Rename Report. Edit report name using the Report Settings dialog.
Share, export, and save as PDF Most generated Monitors Applied report data can be printed, shared, and exported when selecting Expand ( ) from the Dashboard Options ( ) menu. After the report has been expanded, select export ( ) to access the following options:
Export to PDF. Generate a PDF file of the report with user-defined page size and orientation.
Export Data. Export Monitors Applied data (on page 951) and leverage outside of WhatsUp Gold.
Schedule Export. Set a recurring date and time, format, and email destination for report data export (on page 942).
Performance Monitor Summary Performance Monitor Summary report reveals performance monitors applied to the selected devices.
Understand column data The default view of each report contains a grid with the following columns:
Performance Monitor Types. Type of performance monitor. Polling Collection. Collection of monitors polled. For example, All CPUs or
active interfaces. Polling Interval in Minutes. Interval between polling requests.
Generate a report Choose Device. Choose one or more host devices you want Performance Monitor Summary measurements for.
Use the Select Device dialog for one of the following:
Control Purpose
Device Browse and choose a single device.

WhatsUp Gold User Guide
471
Single Interface
Choose an interface on a device.
Device Group
Choose an existing group of one or more devices. You can also create custom or dynamic groups.
Note: You can organize devices into custom or dynamic groups. For more information, see Grouping Devices (on page 242).
Filter and reduce by row and by column. Sort and remove columns, group rows based on specific column values, and remove unwanted information from the table.
Filter and pick by column
Click a report heading and use the following from the drop down list:
Control Purpose
Sort. Sort column in ascending or descending order.
Columns. Pick the columns you want to view. Click a check box to display the column. Clear the check box to hide it.
Group by this field.
Group table into collapsible rows wherever the current column contains identical data ("field") values.
Filters. Provide a keyword to view only rows that contain the keyword for this column.
Rename Report. Edit report name using the Report Settings dialog.
Note: This report only returns Performance Monitor Summary metrics for devices that already have the appropriate WMI or SNMP credentials. For more information, see Using Credentials.
Share, export, and save as PDF Most generated Performance Monitor Summary report data can be printed, shared, and exported when selecting Expand ( ) from the Dashboard Options ( ) menu. After the report has been expanded, select export ( ) to access the following options:
Export to PDF. Generate a PDF file of the report with user-defined page size and orientation.

WhatsUp Gold User Guide
472
Export Data. Export Performance Monitor Summary data (on page 951) and leverage outside of WhatsUp Gold.
Schedule Export. Set a recurring date and time, format, and email destination for report data export (on page 942).
Active Monitor Outages Active Monitor Outages report reveals current and historical active monitor down time for selected devices.
Understand column data The default view of each report contains a grid with the following columns:
Device. Device state indicator, host name, and IP address. Monitor. Active monitor name as it appears in the Active Monitor Library. Down time. Duration the active monitor has been in the down state. Down count. How many times the active monitor has gone into the down state
during the down time.
Generate a report Choose Device. Choose one or more host devices you want Active Monitor Outages measurements for.
Use the Select Device dialog for one of the following:
Control Purpose
Device Browse and choose a single device.
Single Interface
Choose an interface on a device.
Device Group
Choose an existing group of one or more devices. You can also create custom or dynamic groups.
Note: You can organize devices into custom or dynamic groups. For more information, see Grouping Devices (on page 242).
Choose time constraints. ( , ) Choose times for the Active Monitor Outages. (For recently observed measurements, select Last Polled from the Date Range drop down list.)
Choose time constraints for data view Control Purpose
Date Range (on page 944)
Choose or define an overall date range.
WhatsUp Gold User Guide
473
Business hours (on page 944)
Focus on specific days of the week and periods within each day. Reveal trends that are sensitive to business hours, time zones,
and other periodic attributes in the observed data.
Filter and reduce by row and by column. Sort and remove columns, group rows based on specific column values, and remove unwanted information from the table.
Filter and pick by column
Click a report heading and use the following from the drop down list:
Control Purpose
Sort. Sort column in ascending or descending order.
Columns. Pick the columns you want to view. Click a check box to display the column. Clear the check box to hide it.
Group by this field.
Group table into collapsible rows wherever the current column contains identical data ("field") values.
Filters. Provide a keyword to view only rows that contain the keyword for this column.
Rename Report. Edit report name using the Report Settings dialog.
Note: This report only returns Active Monitor Outages metrics for devices that already have the appropriate WMI or SNMP credentials. For more information, see Using Credentials.
Share, export, and save as PDF Most generated Active Monitor Outages report data can be printed, shared, and exported when selecting Expand ( ) from the Dashboard Options ( ) menu. After the report has been expanded, select export ( ) to access the following options:
Export to PDF. Generate a PDF file of the report with user-defined page size and orientation.
Export Data. Export Active Monitor Outages data (on page 951) and leverage outside of WhatsUp Gold.
Schedule Export. Set a recurring date and time, format, and email destination for report data export (on page 942).

WhatsUp Gold User Guide
474
Alert Center Items Alert Center Items report reveals notes or "items" you can use to annotate a given threshold event.
Understand column data The default view of each report contains a grid with the following columns:
Tip: Click an item to view its history report.
Item. Denotes out of threshold device or service.
Threshold. Specific threshold.
Aspect. Device aspect is out of threshold.
Value. Value observed that caused the device aspect to fall out of threshold.
Creation time. Alert Center found the device aspect out of threshold and created the item.
Comment. Comments entered at the time the item was updated.
Share, export, and save as PDF Most generated Alert Center Items report data can be printed, shared, and exported when selecting Expand ( ) from the Dashboard Options ( ) menu. After the report has been expanded, select export ( ) to access the following options:
Export to PDF. Generate a PDF file of the report with user-defined page size and orientation.
Export Data. Export Alert Center Items data (on page 951) and leverage outside of WhatsUp Gold.
Schedule Export. Set a recurring date and time, format, and email destination for report data export (on page 942).
Device Uptime Device Uptime report reveals uptime status of monitored devices for the selected interval.
Understand column data The default view of each report contains a grid with the following columns:
Device. Name of the device. Address. IP address of the device. Up. Percentage of time device was in an "Up" state. Maintenance. Percentage of time device was in Maintenance mode. Unknown. Percentage of time in an undetermined stated. Down. Percentage of time in a "Down" state.

WhatsUp Gold User Guide
475
Availability. Device availability for the selected timeframe.
Generate a report Choose Device. Choose one or more host devices you want Device Uptime measurements for.
Use the Select Device dialog for one of the following:
Control Purpose
Device Browse and choose a single device.
Single Interface
Choose an interface on a device.
Device Group
Choose an existing group of one or more devices. You can also create custom or dynamic groups.
Note: You can organize devices into custom or dynamic groups. For more information, see Grouping Devices (on page 242).
Choose time constraints. ( , ) Choose times for the Device Uptime. (For recently observed measurements, select Last Polled from the Date Range drop down list.)
Choose time constraints for data view Control Purpose
Date Range (on page 944)
Choose or define an overall date range.
Business hours (on page 944)
Focus on specific days of the week and periods within each day. Reveal trends that are sensitive to business hours, time zones,
and other periodic attributes in the observed data.
Filter and reduce by row and by column. Sort and remove columns, group rows based on specific column values, and remove unwanted information from the table.
Filter and pick by column
Click a report heading and use the following from the drop down list:
Control Purpose
Sort. Sort column in ascending or descending order.

WhatsUp Gold User Guide
476
Columns. Pick the columns you want to view. Click a check box to display the column. Clear the check box to hide it.
Group by this field.
Group table into collapsible rows wherever the current column contains identical data ("field") values.
Filters. Provide a keyword to view only rows that contain the keyword for this column.
Rename Report. Edit report name using the Report Settings dialog.
Note: This report only returns Device Uptime metrics for devices that already have the appropriate WMI or SNMP credentials. For more information, see Using Credentials.
Share, export, and save as PDF Most generated Device Uptime report data can be printed, shared, and exported when selecting Expand ( ) from the Dashboard Options ( ) menu. After the report has been expanded, select export ( ) to access the following options:
Export to PDF. Generate a PDF file of the report with user-defined page size and orientation.
Export Data. Export Device Uptime data (on page 951) and leverage outside of WhatsUp Gold.
Schedule Export. Set a recurring date and time, format, and email destination for report data export (on page 942).
Device Health Device Health report reveals a rolling list of monitor events for a single device or device group.
Understand column data The default view of each report contains a grid with the following columns:
Device. Device hostname, IP address, or custom label. Monitor. Monitor associated with the health status message. State. Current monitor state. How long. Duration/continuity of reported state. When. Time of information/poll time.

WhatsUp Gold User Guide
477
Generate a report Choose Device. Choose a single device, device group, or subnet/network organized within a group.
Use the Select Device dialog for one of the following:
Control Purpose
Device Browse and choose a single device.
Device Group
Choose an existing group of one or more devices. You can also create custom or dynamic groups.
Note: You can organize devices into custom or dynamic groups. For more information, see Grouping Devices (on page 242).
Tip: If a device is identified as a virtual machine, Hyper-V or VMware credentials will be used to retrieve data and only those physical resources allocated to the virtual machine will be visible in the report.
Filter and reduce by row and by column. Sort and remove columns, group rows based on specific column values, and find specific field values in the table.
Filter and pick by column
Click a report heading and use the following from the drop down list:
Control Purpose
Sort. Sort column in ascending or descending order.
Columns. Pick the columns you want to view. Click a check box to display the column. Clear the check box to hide it.
Group by this field.
Group table into collapsible rows wherever the current column contains identical data ("field") values.
Filters. Provide a keyword to view only rows that contain the keyword for this column.

WhatsUp Gold User Guide
478
Share, export, and save as PDF Most generated Device Health report data can be printed, shared, and exported when selecting Expand ( ) from the Dashboard Options ( ) menu. After the report has been expanded, select export ( ) to access the following options:
Export to PDF. Generate a PDF file of the report with user-defined page size and orientation.
Export Data. Export Device Health data (on page 951) and leverage outside of WhatsUp Gold.
Schedule Export. Set a recurring date and time, format, and email destination for report data export (on page 942).
Start vs. Run Start vs. Run records pattern changes in startup vs. runtime configurations for network devices deployed on your network.
Each log message record contains the following data columns:
Result. Change of state. One of the following: Unavailable, Different, Same. Device. Device hostname, IP address, or custom label. Startup Config. Configuration at startup (archived file). Running Config. Running configuration (current snapshot). Differences. Count of differences detected.
Fetch and filter log data Choose device. Choose one or more host devices.
Use the Select Device dialog for one of the following:
Control Purpose
Device Browse and choose a single device.
Device Group
Choose an existing group of one or more devices. You can also create custom or dynamic groups.
Note: You can organize devices into custom or dynamic groups. For more information, see Grouping Devices (on page 242).

WhatsUp Gold User Guide
479
Choose time constraints. Choose specific windows for log data, or choose Last Polled for the latest.
Choose time constraints for data view Control Purpose
Date Range (on page 944)
Choose or define an overall date range.
Business hours (on page 944)
Focus on specific days of the week and periods within each day. Reveal trends that are sensitive to business hours, time zones,
and other periodic attributes in the observed data.
Filter and reduce by row and by column. Select rows based on specific column values, remove columns, and remove noise and chaff from the table.
Filter tables rows and hide and select columns
Click a column heading and use the following from the drop down list:
Control Purpose
Sort. Sort column in ascending or descending order.
Columns. Pick the columns you want to view. Click a check box to display the column. Clear the check box to hide it.
Group by this field.
Group table into collapsible rows wherever the current column contains identical data ("field") values.
Filters. Provide a keyword and use wildcards to view only rows that contain the keyword for the selected column or view.
Most column and log view filters provide the following wildcard matching:
Match either zero characters or any one character ('?'). Example: 198.51.100.2? (Matches tokens with IP address ending with 2, or 20-29.)
Match either zero, any one, or many characters ('*'). Example: Stop* (Matches log strings containing Stop, Stopped, Stopping, and so on.)
WhatsUp Gold User Guide
480
Share, export, and save as PDF Most generated Start vs. Run report data can be printed, shared, and exported when selecting Expand ( ) from the Dashboard Options ( ) menu. After the report has been expanded, select export ( ) to access the following options:
Export to PDF. Generate a PDF file of the report with user-defined page size and orientation.
Export Data. Export Start vs. Run data (on page 951) and leverage outside of WhatsUp Gold.
Schedule Export. Set a recurring date and time, format, and email destination for report data export (on page 942).

481
CHAPTER 24
Network Traffic In This Chapter Receivers ............................................................................. 481
Senders ................................................................................ 502
Interface Usage .................................................................... 523
NBAR Applications - Flow Details ......................................... 526
NBAR Applications - Interface Totals .................................... 529
Types of Services ................................................................. 532
Packet Size Distribution ........................................................ 534
Top Ports .............................................................................. 537
Top Protocols ....................................................................... 538
Top Applications ................................................................... 538
Conversations ....................................................................... 541
Top Endpoint Groups ............................................................ 544
Top Endpoints ...................................................................... 547
ICMP Types .......................................................................... 550
Top Interfaces by Traffic ....................................................... 553
Top Interfaces by Utilization .................................................. 556
Top Sources with Interfaces ................................................. 559
Traffic Totals ......................................................................... 562
Unclassified Traffic ............................................................... 564
Class-Based QoS Usage ...................................................... 567
Receivers Top Receivers Top Receivers report reveals devices receiving the most traffic based on a global level, source level, or selected interface level in the selected direction (Inbound, Outbound, Inbound and Outbound, or Bounce).
Understand column data The default view of each report contains a grid with the following columns:

WhatsUp Gold User Guide
482
Receiver. Top receiver device name. Bytes. Number of bytes received. (Use Report Settings Sort by option to
rank the list by packet or flow count, not bytes.) Bit Rate. Average bit rate, in bits per second (bps), for the selected date range. Byte Percentage. Percentage of the total traffic.
To display Flow and Packet measurements, click a column heading ( ) for column selection list ( ). You can also include:
IP address. Receiver's IP address. Hostname. Receiver's hostname. Domain. Receiver's domain. Utilization. Fraction of total bandwidth capacity used. "N/A" denotes the
measurement cannot be calculated because the bandwidth capability is unknown for the current interface.
Tip: To show reports in full screen with most if not all possible columns, click on report options ( ) menu and choose Expand ( ).
Generate a report Choose source. , Choose a networking device or single physical or virtual interface you want to see Top Receivers measurements for. Choose traffic direction across an interface.
Use the Select Device dialog for one of the following:
Control Description
Device. Browse and choose a networking device that is a Network Traffic Analysis monitoring source.
Network Interface.
Choose a single physical or virtual interface Network Traffic Analysis you want traffic statistics for.
Choose direction of traffic over the network interface (Inbound, Outbound, Inbound and Outbound, or Bounce for invalid traffic.).
Choose time constraints. Choose times for the Top Receivers.Choose, filter, and reorder columns. Choose and hide columns, reorder columns, and apply advanced filters (on page 381) to customize your data view.
Filter and pick by column
Click a report heading ( ) and use the "column picker" ( ) from the drop down list.

WhatsUp Gold User Guide
483
Control Purpose
Columns. Click a check box to display the column. Clear the check box to hide it.
Move Column. Click on a column heading and drag it to reorder your table's columns.
Advanced Filtering (on page 381).
Apply category, pattern, and keyword filtering to column data.
Choose time constraints for data view Control Purpose
Date Range (on page 944)
Choose or define an overall date range.
Business hours (on page 944)
Focus on specific days of the week and periods within each day. Reveal trends that are sensitive to business hours, time zones,
and other periodic attributes in the observed data.
Chart, adjust output, and visualize. Fine tune report presentation and range of values displayed using the Report Settings dialog (optional).
Specify threshold and top n: Control Purpose
Show Top n Items Limit items to the samples with the highest values.
Sort by Field Select a column to sort by (if applicable).
Chart and view options Control Purpose
View Options Select/clear the checkboxes to display/hide Totals. Display totals for each column. Others. Remainder values that do not make the top n. Chart. Display the selected Chart Type. Legend. Include legend and grid lines for readability. Trend Lines. Present data a smoothed average to show trend.

WhatsUp Gold User Guide
484
Chart Type Select a chart type and associated options: Pie. Pie distribution chart. Line/Area. Scatter graph that connects adjacent measurements
with straight lines. Spline/Area Spline. Choose a graph with a smoothed
appearance where adjacent samples exhibit a gradual slope. Vertical Bar/Horizontal Bar. Vertical or horizontal bar
chart/histogram. Y-Axis Scale Scale Y-axis (chart and graph height) automatically or choose a fixed size.
Share, export, and save as PDF Most generated Top Receivers report data can be printed, shared, and exported when selecting Expand ( ) from the Dashboard Options ( ) menu. After the report has been expanded, select export ( ) to access the following options:
Export to PDF. Generate a PDF file of the report with user-defined page size and orientation.
Export Data. Export Top Receivers data (on page 951) and leverage outside of WhatsUp Gold.
Schedule Export. Set a recurring date and time, format, and email destination for report data export (on page 942).
Top Receiver ASN Top Receiver ASN report reveals organizations identified by provider ASNs receiving the most traffic for the selected interval.
Understand column data The default view of each report contains a grid with the following columns:
ASN. Autonomous System Number when supplied by systems using Border Gateway Protocol (BGP).
Organization. Name associated with the receiver ASN. Bytes. Number of bytes received. (Use Report Settings Sort by option to
rank the list by packet or flow count, not bytes.) Bit Rate. Average bit rate, in bits per second (bps), for the selected date range. Utilization. Fraction of total bandwidth capacity used. "N/A" denotes the
measurement cannot be calculated because the bandwidth capability is unknown for the current interface.
Byte Percentage. Percentage of the total traffic.
To display Flow and Packet measurements, click a column heading ( ) for column selection list ( ). You can also include:

WhatsUp Gold User Guide
485
Utilization. Fraction of total bandwidth capacity used. "N/A" denotes the measurement cannot be calculated because the bandwidth capability is unknown for the current interface.
Tip: To show reports in full screen with most if not all possible columns, click on report options ( ) menu and choose Expand ( ).
Tip: You can hover over a host name to display popup information about the hostname's IP address. If you click the hostname, a filter is created that uses the IP address of this hostname as the filter criteria and the Interface Details dashboard reloads with this filter applied.
Tip: You can hover over the icon preceding the Receiver's host name to display WHOIS information about the host. This information is gathered using a WHOIS query of the American Registry for Internet Numbers https://tools.ietf.org/html/rfc812 (ARIN).
Generate a report Choose source. , Choose a networking device or single physical or virtual interface you want to see Top Receiver ASN measurements for. Choose traffic direction across an interface.
Use the Select Device dialog for one of the following:
Control Description
Device. Browse and choose a networking device that is a Network Traffic Analysis monitoring source.
Network Interface.
Choose a single physical or virtual interface Network Traffic Analysis you want traffic statistics for.
Choose direction of traffic over the network interface (Inbound, Outbound, Inbound and Outbound, or Bounce for invalid traffic.).
Choose time constraints. Choose times for the Top Receiver ASN.Choose, filter, and reorder columns. Choose and hide columns, reorder columns, and apply advanced filters (on page 381) to customize your data view.
Filter and pick by column
Click a report heading ( ) and use the "column picker" ( ) from the drop down list.
Control Purpose
Columns. Click a check box to display the column. Clear the check box to hide it.
Move Column. Click on a column heading and drag it to reorder your table's columns.

WhatsUp Gold User Guide
486
Advanced Filtering (on page 381).
Apply category, pattern, and keyword filtering to column data.
Choose time constraints for data view Control Purpose
Date Range (on page 944)
Choose or define an overall date range.
Business hours (on page 944)
Focus on specific days of the week and periods within each day. Reveal trends that are sensitive to business hours, time zones,
and other periodic attributes in the observed data.
Chart, adjust output, and visualize. Fine tune report presentation and range of values displayed using the Report Settings dialog (optional).
Specify threshold and top n: Control Purpose
Show Top n Items Limit items to the samples with the highest values.
Sort by Field Select a column to sort by (if applicable).
Chart and view options Control Purpose
View Options Select/clear the checkboxes to display/hide Totals. Display totals for each column. Others. Remainder values that do not make the top n. Chart. Display the selected Chart Type. Legend. Include legend and grid lines for readability. Trend Lines. Present data a smoothed average to show trend.
Chart Type Select a chart type and associated options: Pie. Pie distribution chart. Line/Area. Scatter graph that connects adjacent measurements
with straight lines. Spline/Area Spline. Choose a graph with a smoothed
appearance where adjacent samples exhibit a gradual slope. Vertical Bar/Horizontal Bar. Vertical or horizontal bar
chart/histogram. Y-Axis Scale Scale Y-axis (chart and graph height) automatically or choose a fixed size.

WhatsUp Gold User Guide
487
Share, export, and save as PDF Most generated Top Receiver ASN report data can be printed, shared, and exported when selecting Expand ( ) from the Dashboard Options ( ) menu. After the report has been expanded, select export ( ) to access the following options:
Export to PDF. Generate a PDF file of the report with user-defined page size and orientation.
Export Data. Export Top Receiver ASN data (on page 951) and leverage outside of WhatsUp Gold.
Schedule Export. Set a recurring date and time, format, and email destination for report data export (on page 942).
Top Receiver Cities Top Receiver Cities report reveals the top cities receiving traffic for the selected interval.
Geo data is useful for understanding traffic patterns and resource utilization and troubleshooting WAN and backbone carrier or DNS record distribution issues.
Note: The country denotes the location of the organization that owns the IP address range. This is not necessarily the geographic location of the network or the device.
Geographic information can be useful when tracking the origins of network traffic. For example, if your company has a website, you can detect the locations of the persons and businesses that are visiting your website by viewing the Top Receiver Cities dashboard report.
Understand column data The default view of each report contains a grid with the following columns:
City. Top receiver city. Subdivision. Top state or province. Country. Top receiver country. Bytes. Number of bytes received. (Use Report Settings Sort by option to
rank the list by packet or flow count, not bytes.) Bit Rate. Average bit rate, in bits per second (bps). Percentage. Percentage of the total traffic.
To display Flow and Packet measurements, click a column heading ( ) for column selection list ( ). You can also include:
Utilization. Fraction of total bandwidth capacity used. "N/A" denotes the measurement cannot be calculated because the bandwidth capability is unknown for the current interface.

WhatsUp Gold User Guide
488
Tip: To show reports in full screen with most if not all possible columns, click on report options ( ) menu and choose Expand ( ).
Generate a report Choose source. , Choose a networking device or single physical or virtual interface you want to see Top Receiver Cities measurements for. Choose traffic direction across an interface.
Use the Select Device dialog for one of the following:
Control Description
Device. Browse and choose a networking device that is a Network Traffic Analysis monitoring source.
Network Interface.
Choose a single physical or virtual interface Network Traffic Analysis you want traffic statistics for.
Choose direction of traffic over the network interface (Inbound, Outbound, Inbound and Outbound, or Bounce for invalid traffic.).
Choose time constraints. Choose times for the Top Receiver Cities.Choose, filter, and reorder columns. Choose and hide columns, reorder columns, and apply advanced filters (on page 381) to customize your data view.
Filter and pick by column
Click a report heading ( ) and use the "column picker" ( ) from the drop down list.
Control Purpose
Columns. Click a check box to display the column. Clear the check box to hide it.
Move Column. Click on a column heading and drag it to reorder your table's columns.
Advanced Filtering (on page 381).
Apply category, pattern, and keyword filtering to column data.
Choose time constraints for data view Control Purpose
Date Range (on page 944)
Choose or define an overall date range.

WhatsUp Gold User Guide
489
Business hours (on page 944)
Focus on specific days of the week and periods within each day. Reveal trends that are sensitive to business hours, time zones,
and other periodic attributes in the observed data.
Chart, adjust output, and visualize. Fine tune report presentation and range of values displayed using the Report Settings dialog (optional).
Specify threshold and top n: Control Purpose
Show Top n Items Limit items to the samples with the highest values.
Sort by Field Select a column to sort by (if applicable).
Chart and view options Control Purpose
View Options Select/clear the checkboxes to display/hide Totals. Display totals for each column. Others. Remainder values that do not make the top n. Chart. Display the selected Chart Type. Legend. Include legend and grid lines for readability. Trend Lines. Present data a smoothed average to show trend.
Chart Type Select a chart type and associated options: Pie. Pie distribution chart. Line/Area. Scatter graph that connects adjacent measurements
with straight lines. Spline/Area Spline. Choose a graph with a smoothed
appearance where adjacent samples exhibit a gradual slope. Vertical Bar/Horizontal Bar. Vertical or horizontal bar
chart/histogram. Y-Axis Scale Scale Y-axis (chart and graph height) automatically or choose a fixed size.
Share, export, and save as PDF Most generated Top Receiver Cities report data can be printed, shared, and exported when selecting Expand ( ) from the Dashboard Options ( ) menu. After the report has been expanded, select export ( ) to access the following options:
Export to PDF. Generate a PDF file of the report with user-defined page size and orientation.
Export Data. Export Top Receiver Cities data (on page 951) and leverage outside of WhatsUp Gold.

WhatsUp Gold User Guide
490
Schedule Export. Set a recurring date and time, format, and email destination for report data export (on page 942).
Top Receiver Domains Top Receiver Domains report reveals a list of domains receiving the most traffic.
Understand column data The default view of each report contains a grid with the following columns:
Domain. Top receiver domain name. Bytes. Number of bytes received. (Use Report Settings Sort by option to
rank the list by packet or flow count, not bytes.) Bit Rate. Average bit rate, in bits per second (bps), for the selected date range. Percentage. Percentage of the total traffic.
To display Flow and Packet measurements, click a column heading ( ) for column selection list ( ). You can also include:
Utilization. Fraction of total bandwidth capacity used. "N/A" denotes the measurement cannot be calculated because the bandwidth capability is unknown for the current interface.
Tip: To show reports in full screen with most if not all possible columns, click on report options ( ) menu and choose Expand ( ).
Generate a report Choose source. , Choose a networking device or single physical or virtual interface you want to see Top Receiver Domains measurements for. Choose traffic direction across an interface.
Use the Select Device dialog for one of the following:
Control Description
Device. Browse and choose a networking device that is a Network Traffic Analysis monitoring source.
Network Interface.
Choose a single physical or virtual interface Network Traffic Analysis you want traffic statistics for.
Choose direction of traffic over the network interface (Inbound, Outbound, Inbound and Outbound, or Bounce for invalid traffic.).

WhatsUp Gold User Guide
491
Choose time constraints. Choose times for the Top Receiver Domains.Choose, filter, and reorder columns. Choose and hide columns, reorder columns, and apply advanced filters (on page 381) to customize your data view.
Filter and pick by column
Click a report heading ( ) and use the "column picker" ( ) from the drop down list.
Control Purpose
Columns. Click a check box to display the column. Clear the check box to hide it.
Move Column. Click on a column heading and drag it to reorder your table's columns.
Advanced Filtering (on page 381).
Apply category, pattern, and keyword filtering to column data.
Choose time constraints for data view Control Purpose
Date Range (on page 944)
Choose or define an overall date range.
Business hours (on page 944)
Focus on specific days of the week and periods within each day. Reveal trends that are sensitive to business hours, time zones,
and other periodic attributes in the observed data.
Chart, adjust output, and visualize. Fine tune report presentation and range of values displayed using the Report Settings dialog (optional).
Specify threshold and top n: Control Purpose
Show Top n Items Limit items to the samples with the highest values.
Sort by Field Select a column to sort by (if applicable).

WhatsUp Gold User Guide
492
Chart and view options Control Purpose
View Options Select/clear the checkboxes to display/hide Totals. Display totals for each column. Others. Remainder values that do not make the top n. Chart. Display the selected Chart Type. Legend. Include legend and grid lines for readability. Trend Lines. Present data a smoothed average to show trend.
Chart Type Select a chart type and associated options: Pie. Pie distribution chart. Line/Area. Scatter graph that connects adjacent measurements
with straight lines. Spline/Area Spline. Choose a graph with a smoothed
appearance where adjacent samples exhibit a gradual slope. Vertical Bar/Horizontal Bar. Vertical or horizontal bar
chart/histogram. Y-Axis Scale Scale Y-axis (chart and graph height) automatically or choose a fixed size.
Share, export, and save as PDF Most generated Top Receiver Domains report data can be printed, shared, and exported when selecting Expand ( ) from the Dashboard Options ( ) menu. After the report has been expanded, select export ( ) to access the following options:
Export to PDF. Generate a PDF file of the report with user-defined page size and orientation.
Export Data. Export Top Receiver Domains data (on page 951) and leverage outside of WhatsUp Gold.
Schedule Export. Set a recurring date and time, format, and email destination for report data export (on page 942).
Top Receiver Groups Top Receiver Groups report reveals IP groups receiving the most traffic.
Groups are defined ranges of host IP addresses you specify using the NTA IP Groups dialog.
Understand column data The default view of each report contains a grid with the following columns:
Group. Receiver IP group name. Bytes. Number of bytes received. (Use Report Settings Sort by option to
rank the list by packet or flow count, not bytes.)

WhatsUp Gold User Guide
493
Bit Rate. Total average bit rate. Byte Percentage. Percentage of the total traffic.
To display Flow and Packet measurements, click a column heading ( ) for column selection list ( ). You can also include:
Utilization. Fraction of total bandwidth capacity used. "N/A" denotes the measurement cannot be calculated because the bandwidth capability is unknown for the current interface.
Tip: To show reports in full screen with most if not all possible columns, click on report options ( ) menu and choose Expand ( ).
Generate a report Choose source. , Choose a networking device or single physical or virtual interface you want to see Top Receiver Groups measurements for. Choose traffic direction across an interface.
Use the Select Device dialog for one of the following:
Control Description
Device. Browse and choose a networking device that is a Network Traffic Analysis monitoring source.
Network Interface.
Choose a single physical or virtual interface Network Traffic Analysis you want traffic statistics for.
Choose direction of traffic over the network interface (Inbound, Outbound, Inbound and Outbound, or Bounce for invalid traffic.).
Choose time constraints. Choose times for the Top Receiver Groups .Choose, filter, and reorder columns. Choose and hide columns, reorder columns, and apply advanced filters (on page 381) to customize your data view.
Filter and pick by column
Click a report heading ( ) and use the "column picker" ( ) from the drop down list.
Control Purpose
Columns. Click a check box to display the column. Clear the check box to hide it.
Move Column. Click on a column heading and drag it to reorder your table's columns.
Advanced Filtering (on page 381).
Apply category, pattern, and keyword filtering to column data.

WhatsUp Gold User Guide
494
Choose time constraints for data view Control Purpose
Date Range (on page 944)
Choose or define an overall date range.
Business hours (on page 944)
Focus on specific days of the week and periods within each day. Reveal trends that are sensitive to business hours, time zones,
and other periodic attributes in the observed data.
Chart, adjust output, and visualize. Fine tune report presentation and range of values displayed using the Report Settings dialog (optional).
Specify threshold and top n: Control Purpose
Show Top n Items Limit items to the samples with the highest values.
Sort by Field Select a column to sort by (if applicable).
Chart and view options Control Purpose
View Options Select/clear the checkboxes to display/hide Totals. Display totals for each column. Others. Remainder values that do not make the top n. Chart. Display the selected Chart Type. Legend. Include legend and grid lines for readability. Trend Lines. Present data a smoothed average to show trend.
Chart Type Select a chart type and associated options: Pie. Pie distribution chart. Line/Area. Scatter graph that connects adjacent measurements
with straight lines. Spline/Area Spline. Choose a graph with a smoothed
appearance where adjacent samples exhibit a gradual slope. Vertical Bar/Horizontal Bar. Vertical or horizontal bar
chart/histogram. Y-Axis Scale Scale Y-axis (chart and graph height) automatically or choose a fixed size.
Share, export, and save as PDF Most generated Top Receiver Groups report data can be printed, shared, and exported when selecting Expand ( ) from the Dashboard Options ( ) menu. After the report has been expanded, select export ( ) to access the following options:

WhatsUp Gold User Guide
495
Export to PDF. Generate a PDF file of the report with user-defined page size and orientation.
Export Data. Export Top Receiver Groups data (on page 951) and leverage outside of WhatsUp Gold.
Schedule Export. Set a recurring date and time, format, and email destination for report data export (on page 942).
Top Receiver TLDs Top Receiver TLDs report reveals top level domains (TLD) (the "root" domain name such as.com, .edu, or .us) associated with received traffic. The traffic displayed for each TLD is the sum of the traffic received by each device on that TLD.
In most cases, the TLD for a device is the same as the country that is listed in the Top Sender and Receiver Countries dashboard reports. However, in the case of the TLD, the country is where the domain name was obtained, and not necessarily where the host is located.
Understand column data The default view of each report contains a grid with the following columns:
TLD. Displays an icon and the extension that represents the top level domain. Type. Definition of the extension that is used to represent the top level domain. Bytes. Number of bytes received. (Use Report Settings Sort by option to
rank the list by packet or flow count, not bytes.) Bit Rate. Total average bit rate. Byte Percentage. Percentage of the total traffic.
To display Flow and Packet measurements, click a column heading ( ) for column selection list ( ). You can also include:
Utilization. Fraction of total bandwidth capacity used. "N/A" denotes the measurement cannot be calculated because the bandwidth capability is unknown for the current interface.
Generate a report Choose source. , Choose a networking device or single physical or virtual interface you want to see Top Receiver TLDs measurements for. Choose traffic direction across an interface.
Use the Select Device dialog for one of the following:
Control Description
Device. Browse and choose a networking device that is a Network Traffic Analysis monitoring source.

WhatsUp Gold User Guide
496
Network Interface.
Choose a single physical or virtual interface Network Traffic Analysis you want traffic statistics for.
Choose direction of traffic over the network interface (Inbound, Outbound, Inbound and Outbound, or Bounce for invalid traffic.).
Choose time constraints. Choose times for the Top Receiver TLDs.Choose, filter, and reorder columns. Choose and hide columns, reorder columns, and apply advanced filters (on page 381) to customize your data view.
Filter and pick by column
Click a report heading ( ) and use the "column picker" ( ) from the drop down list.
Control Purpose
Columns. Click a check box to display the column. Clear the check box to hide it.
Move Column. Click on a column heading and drag it to reorder your table's columns.
Advanced Filtering (on page 381).
Apply category, pattern, and keyword filtering to column data.
Choose time constraints for data view Control Purpose
Date Range (on page 944)
Choose or define an overall date range.
Business hours (on page 944)
Focus on specific days of the week and periods within each day. Reveal trends that are sensitive to business hours, time zones,
and other periodic attributes in the observed data.
Chart, adjust output, and visualize. Fine tune report presentation and range of values displayed using the Report Settings dialog (optional).
Specify threshold and top n: Control Purpose
Show Top n Items Limit items to the samples with the highest values.
Sort by Field Select a column to sort by (if applicable).

WhatsUp Gold User Guide
497
Chart and view options Control Purpose
View Options Select/clear the checkboxes to display/hide Totals. Display totals for each column. Others. Remainder values that do not make the top n. Chart. Display the selected Chart Type. Legend. Include legend and grid lines for readability. Trend Lines. Present data a smoothed average to show trend.
Chart Type Select a chart type and associated options: Pie. Pie distribution chart. Line/Area. Scatter graph that connects adjacent measurements
with straight lines. Spline/Area Spline. Choose a graph with a smoothed
appearance where adjacent samples exhibit a gradual slope. Vertical Bar/Horizontal Bar. Vertical or horizontal bar
chart/histogram. Y-Axis Scale Scale Y-axis (chart and graph height) automatically or choose a fixed size.
Share, export, and save as PDF Most generated Top Receiver TLDs report data can be printed, shared, and exported when selecting Expand ( ) from the Dashboard Options ( ) menu. After the report has been expanded, select export ( ) to access the following options:
Export to PDF. Generate a PDF file of the report with user-defined page size and orientation.
Export Data. Export Top Receiver TLDs data (on page 951) and leverage outside of WhatsUp Gold.
Schedule Export. Set a recurring date and time, format, and email destination for report data export (on page 942).
Top Receivers with the Most Conversation Partners Top Receivers with the Most Conversation Partners report reveals devices receiving the most traffic from the highest number of other devices for the selected interval.
A conversation is a connection between two devices that are transmitting information to one another over a single port. Conversation partner statistics can helps reveal traffic patterns, load balancer effectiveness, and devices with application servers or Web sites under connection load. Also, symmetry of traffic, where many devices have many partners can indicate disruptive or peer-to-peer applications.
Understand column data The default view of each report contains a grid with the following columns:

WhatsUp Gold User Guide
498
Receiver. Devices with the most traffic from the highest number of conversation partners on the selected interface.
Number of Partners. Number of partners with which the receiver is conducting conversations.
Packet Percentage. Percentage of top n items ranked.
Click a column heading ( ) to display the column selection listing . You can also include:
IP Address. IP address of top receiver. Hostname. Hostname of top receiver.
Generate a report Choose source. , Choose a networking device or single physical or virtual interface you want to see Top Receivers with the Most Conversation Partners measurements for. Choose traffic direction across an interface.
Use the Select Device dialog for one of the following:
Control Description
Device. Browse and choose a networking device that is a Network Traffic Analysis monitoring source.
Network Interface.
Choose a single physical or virtual interface Network Traffic Analysis you want traffic statistics for.
Choose direction of traffic over the network interface (Inbound, Outbound, Inbound and Outbound, or Bounce for invalid traffic.).
Choose time constraints. Choose times for the Top Receivers with the Most Conversation Partners.Choose, filter, and reorder columns. Choose and hide columns, reorder columns, and apply advanced filters (on page 381) to customize your data view.
Filter and pick by column
Click a report heading ( ) and use the "column picker" ( ) from the drop down list.
Control Purpose
Columns. Click a check box to display the column. Clear the check box to hide it.
Move Column. Click on a column heading and drag it to reorder your table's columns.
Advanced Filtering (on page 381).
Apply category, pattern, and keyword filtering to column data.

WhatsUp Gold User Guide
499
Choose time constraints for data view Control Purpose
Date Range (on page 944)
Choose or define an overall date range.
Business hours (on page 944)
Focus on specific days of the week and periods within each day. Reveal trends that are sensitive to business hours, time zones,
and other periodic attributes in the observed data.
Chart, adjust output, and visualize. Fine tune report presentation and range of values displayed using the Report Settings dialog (optional).
Specify threshold and top n: Control Purpose
Show Top n Items Limit items to the samples with the highest values.
Sort by Field Select a column to sort by (if applicable).
Chart and view options Control Purpose
View Options Select/clear the checkboxes to display/hide Totals. Display totals for each column. Others. Remainder values that do not make the top n. Chart. Display the selected Chart Type. Legend. Include legend and grid lines for readability. Trend Lines. Present data a smoothed average to show trend.
Chart Type Select a chart type and associated options: Pie. Pie distribution chart. Line/Area. Scatter graph that connects adjacent measurements
with straight lines. Spline/Area Spline. Choose a graph with a smoothed
appearance where adjacent samples exhibit a gradual slope. Vertical Bar/Horizontal Bar. Vertical or horizontal bar
chart/histogram. Y-Axis Scale Scale Y-axis (chart and graph height) automatically or choose a fixed size.
Share, export, and save as PDF Most generated Top Receivers with the Most Conversation Partners report data can be printed, shared, and exported when selecting Expand ( ) from the Dashboard Options

WhatsUp Gold User Guide
500
( ) menu. After the report has been expanded, select export ( ) to access the following options:
Export to PDF. Generate a PDF file of the report with user-defined page size and orientation.
Export Data. Export Top Receivers with the Most Conversation Partners data (on page 951) and leverage outside of WhatsUp Gold.
Schedule Export. Set a recurring date and time, format, and email destination for report data export (on page 942).
Top Receivers with the Most Failed Connections Top Receivers with the Most Failed Connections report reveals devices that initiated the highest number of unsuccessful TCP connection attempts, or SYN packets.
Unsuccessful connections (incomplete TCP handshakes) can imply port scanning, penetration testing, and methods used by security testers or hackers to find potential intrusion points on a network. Large numbers of these half-open or incomplete connections can also denote an attempt at a denial of service (DoS) attack.
Understand column data The default view of each report contains a grid with the following columns:
Receiver. Host name of the top receiver with the most failed connections. Connection Attempts. Number of failed connection attempts. Packet Rate. Total average packet rate. Packet Percentage. Percentage of top n items ranked.
Several report columns do not appear by default and can be configured to display in this report. You can display the following additional report columns:
IP address. Receiver's IP address. Hostname. Receiver's hostname.
Tip: To show reports in full screen with most if not all possible columns, click on report options ( ) menu and choose Expand ( ).
Generate a report Choose source. , Choose a networking device or single physical or virtual interface you want to see Top Receivers with the Most Failed Connections measurements for. Choose traffic direction across an interface.
Use the Select Device dialog for one of the following:
Control Description
Device. Browse and choose a networking device that is a Network Traffic Analysis monitoring source.

WhatsUp Gold User Guide
501
Network Interface.
Choose a single physical or virtual interface Network Traffic Analysis you want traffic statistics for.
Choose direction of traffic over the network interface (Inbound, Outbound, Inbound and Outbound, or Bounce for invalid traffic.).
Choose time constraints. Choose times for the Top Receivers with the Most Failed Connections.Choose, filter, and reorder columns. Choose and hide columns, reorder columns, and apply advanced filters (on page 381) to customize your data view.
Filter and pick by column
Click a report heading ( ) and use the "column picker" ( ) from the drop down list.
Control Purpose
Columns. Click a check box to display the column. Clear the check box to hide it.
Move Column. Click on a column heading and drag it to reorder your table's columns.
Advanced Filtering (on page 381).
Apply category, pattern, and keyword filtering to column data.
Choose time constraints for data view Control Purpose
Date Range (on page 944)
Choose or define an overall date range.
Business hours (on page 944)
Focus on specific days of the week and periods within each day. Reveal trends that are sensitive to business hours, time zones,
and other periodic attributes in the observed data.
Chart, adjust output, and visualize. Fine tune report presentation and range of values displayed using the Report Settings dialog (optional).
Specify threshold and top n: Control Purpose
Show Top n Items Limit items to the samples with the highest values.
Sort by Field Select a column to sort by (if applicable).

WhatsUp Gold User Guide
502
Chart and view options Control Purpose
View Options Select/clear the checkboxes to display/hide Totals. Display totals for each column. Others. Remainder values that do not make the top n. Chart. Display the selected Chart Type. Legend. Include legend and grid lines for readability. Trend Lines. Present data a smoothed average to show trend.
Chart Type Select a chart type and associated options: Pie. Pie distribution chart. Line/Area. Scatter graph that connects adjacent measurements
with straight lines. Spline/Area Spline. Choose a graph with a smoothed
appearance where adjacent samples exhibit a gradual slope. Vertical Bar/Horizontal Bar. Vertical or horizontal bar
chart/histogram. Y-Axis Scale Scale Y-axis (chart and graph height) automatically or choose a fixed size.
Share, export, and save as PDF Most generated Top Receivers with the Most Failed Connections report data can be printed, shared, and exported when selecting Expand ( ) from the Dashboard Options ( ) menu. After the report has been expanded, select export ( ) to access the following options:
Export to PDF. Generate a PDF file of the report with user-defined page size and orientation.
Export Data. Export Top Receivers with the Most Failed Connections data (on page 951) and leverage outside of WhatsUp Gold.
Schedule Export. Set a recurring date and time, format, and email destination for report data export (on page 942).
Senders Top Senders Top Senders report reveals devices generating the most traffic over the selected interval.
Understand column data The default view of each report contains a grid with the following columns:
Sender. Top sender's hostname or IP address.
WhatsUp Gold User Guide
503
Bytes. Number of bytes transmitted. Use Report Settings to sort by packet or flow count, or bytes.
Bit Rate. Average bit rate, in bits per second (bps). Percentage. Percentage of the total traffic.
To display Flow and Packet measurements, click a column heading ( ) for column selection list ( ). You can also include:
IP address. Top sender's IP address. Hostname. Top sender's hostname. Domain. Top sender's domain. Utilization. Fraction of total bandwidth capacity used. "N/A" denotes the
measurement cannot be calculated because the bandwidth capability is unknown for the current interface.
Tip: To show reports in full screen with most if not all possible columns, click on report options ( ) menu and choose Expand ( ).
Generate a report Choose source. , Choose a networking device or single physical or virtual interface you want to see Top Senders measurements for. Choose traffic direction across an interface.
Use the Select Device dialog for one of the following:
Control Description
Device. Browse and choose a networking device that is a Network Traffic Analysis monitoring source.
Network Interface.
Choose a single physical or virtual interface Network Traffic Analysis you want traffic statistics for.
Choose direction of traffic over the network interface (Inbound, Outbound, Inbound and Outbound, or Bounce for invalid traffic.).
Choose time constraints. Choose times for the Top Senders.Choose, filter, and reorder columns. Choose and hide columns, reorder columns, and apply advanced filters (on page 381) to customize your data view.
Filter and pick by column
Click a report heading ( ) and use the "column picker" ( ) from the drop down list.
Control Purpose
Columns. Click a check box to display the column. Clear the check box to hide it.

WhatsUp Gold User Guide
504
Move Column. Click on a column heading and drag it to reorder your table's columns.
Advanced Filtering (on page 381).
Apply category, pattern, and keyword filtering to column data.
Choose time constraints for data view Control Purpose
Date Range (on page 944)
Choose or define an overall date range.
Business hours (on page 944)
Focus on specific days of the week and periods within each day. Reveal trends that are sensitive to business hours, time zones,
and other periodic attributes in the observed data.
Chart, adjust output, and visualize. Fine tune report presentation and range of values displayed using the Report Settings dialog (optional).
Specify threshold and top n: Control Purpose
Show Top n Items Limit items to the samples with the highest values.
Sort by Field Select a column to sort by (if applicable).
Chart and view options Control Purpose
View Options Select/clear the checkboxes to display/hide Totals. Display totals for each column. Others. Remainder values that do not make the top n. Chart. Display the selected Chart Type. Legend. Include legend and grid lines for readability. Trend Lines. Present data a smoothed average to show trend.
Chart Type Select a chart type and associated options: Pie. Pie distribution chart. Line/Area. Scatter graph that connects adjacent measurements
with straight lines. Spline/Area Spline. Choose a graph with a smoothed
appearance where adjacent samples exhibit a gradual slope. Vertical Bar/Horizontal Bar. Vertical or horizontal bar
chart/histogram.

WhatsUp Gold User Guide
505
Y-Axis Scale Scale Y-axis (chart and graph height) automatically or choose a fixed size.
Share, export, and save as PDF Most generated Top Senders report data can be printed, shared, and exported when selecting Expand ( ) from the Dashboard Options ( ) menu. After the report has been expanded, select export ( ) to access the following options:
Export to PDF. Generate a PDF file of the report with user-defined page size and orientation.
Export Data. Export Top Senders data (on page 951) and leverage outside of WhatsUp Gold.
Schedule Export. Set a recurring date and time, format, and email destination for report data export (on page 942).
Top Sender ASN Top Sender ASN report reveals organizations identified by provider ASNs sending the most traffic for the selected interval.
Understand column data The default view of each report contains a grid with the following columns:
ASN. Autonomous System Number when supplied by systems using Border Gateway Protocol (BGP).
Organization. Organization name associated with the top sender ASN. Bytes. Number of bytes transmitted. Use Report Settings to sort by packet or
flow count, or bytes. Bit Rate. Average bit rate, in bits per second (bps). Percentage. Percentage of the total traffic.
To display Flow and Packet measurements, click a column heading ( ) for column selection list ( ). You can also include:
Utilization. Fraction of total bandwidth capacity used. "N/A" denotes the measurement cannot be calculated because the bandwidth capability is unknown for the current interface.
Tip: You can hover over a host name to display popup information about the hostname's IP address. If you click the hostname, a filter is created that uses the host as the filter criteria and the Interface Details dashboard reloads with this filter applied.
Tip: You can hover over the icon preceding the Senders host name to display WHOIS information about the host. This information is gathered using a WHOIS query of the American Registry for Internet Numbers (ARIN).

WhatsUp Gold User Guide
506
Tip: To show reports in full screen with most if not all possible columns, click on report options ( ) menu and choose Expand ( ).
Generate a report Choose source. , Choose a networking device or single physical or virtual interface you want to see Top Sender ASN measurements for. Choose traffic direction across an interface.
Use the Select Device dialog for one of the following:
Control Description
Device. Browse and choose a networking device that is a Network Traffic Analysis monitoring source.
Network Interface.
Choose a single physical or virtual interface Network Traffic Analysis you want traffic statistics for.
Choose direction of traffic over the network interface (Inbound, Outbound, Inbound and Outbound, or Bounce for invalid traffic.).
Choose time constraints. Choose times for the Top Sender ASN.Choose, filter, and reorder columns. Choose and hide columns, reorder columns, and apply advanced filters (on page 381) to customize your data view.
Filter and pick by column
Click a report heading ( ) and use the "column picker" ( ) from the drop down list.
Control Purpose
Columns. Click a check box to display the column. Clear the check box to hide it.
Move Column. Click on a column heading and drag it to reorder your table's columns.
Advanced Filtering (on page 381).
Apply category, pattern, and keyword filtering to column data.
Choose time constraints for data view Control Purpose
Date Range (on page 944)
Choose or define an overall date range.

WhatsUp Gold User Guide
507
Business hours (on page 944)
Focus on specific days of the week and periods within each day. Reveal trends that are sensitive to business hours, time zones,
and other periodic attributes in the observed data.
Chart, adjust output, and visualize. Fine tune report presentation and range of values displayed using the Report Settings dialog (optional).
Specify threshold and top n: Control Purpose
Show Top n Items Limit items to the samples with the highest values.
Sort by Field Select a column to sort by (if applicable).
Chart and view options Control Purpose
View Options Select/clear the checkboxes to display/hide Totals. Display totals for each column. Others. Remainder values that do not make the top n. Chart. Display the selected Chart Type. Legend. Include legend and grid lines for readability. Trend Lines. Present data a smoothed average to show trend.
Chart Type Select a chart type and associated options: Pie. Pie distribution chart. Line/Area. Scatter graph that connects adjacent measurements
with straight lines. Spline/Area Spline. Choose a graph with a smoothed
appearance where adjacent samples exhibit a gradual slope. Vertical Bar/Horizontal Bar. Vertical or horizontal bar
chart/histogram. Y-Axis Scale Scale Y-axis (chart and graph height) automatically or choose a fixed size.
Share, export, and save as PDF Most generated Top Sender ASN report data can be printed, shared, and exported when selecting Expand ( ) from the Dashboard Options ( ) menu. After the report has been expanded, select export ( ) to access the following options:
Export to PDF. Generate a PDF file of the report with user-defined page size and orientation.
Export Data. Export Top Sender ASN data (on page 951) and leverage outside of WhatsUp Gold.

WhatsUp Gold User Guide
508
Schedule Export. Set a recurring date and time, format, and email destination for report data export (on page 942).
Top Sender Cities Top Sender Cities report reveals geographic locations of devices sending the most traffic for the selected interval.
Note: The country specifies where the organization that owns the IP address is based, not necessarily its geographic location.
Geographic information can be useful when tracking the origins of network traffic. For example, if your company has a website, you can detect the locations of the persons and businesses that are visiting your website by viewing the Top Sender Countries dashboard report.
Understand column data The default view of each report contains a grid with the following columns:
City. Top sender city. Subdivision. Top sender state or province. Country. Top sender country. Bytes. Number of bytes transmitted. Use Report Settings to sort by packet or
flow count, or bytes. Bit Rate. Average bit rate, in bits per second (bps). Percentage. Percentage of the total traffic for the specific item in the report
category for the selected date range.
To display Flow and Packet measurements, click a column heading ( ) for column selection list ( ). You can also include:
Utilization. Fraction of total bandwidth capacity used. "N/A" denotes the measurement cannot be calculated because the bandwidth capability is unknown for the current interface.
Tip: To show reports in full screen with most if not all possible columns, click on report options ( ) menu and choose Expand ( ).
Generate a report Choose source. , Choose a networking device or single physical or virtual interface you want to see Top Sender Cities measurements for. Choose traffic direction across an interface.
Use the Select Device dialog for one of the following:

WhatsUp Gold User Guide
509
Control Description
Device. Browse and choose a networking device that is a Network Traffic Analysis monitoring source.
Network Interface.
Choose a single physical or virtual interface Network Traffic Analysis you want traffic statistics for.
Choose direction of traffic over the network interface (Inbound, Outbound, Inbound and Outbound, or Bounce for invalid traffic.).
Choose time constraints. Choose times for the Top Sender Cities.Choose, filter, and reorder columns. Choose and hide columns, reorder columns, and apply advanced filters (on page 381) to customize your data view.
Filter and pick by column
Click a report heading ( ) and use the "column picker" ( ) from the drop down list.
Control Purpose
Columns. Click a check box to display the column. Clear the check box to hide it.
Move Column. Click on a column heading and drag it to reorder your table's columns.
Advanced Filtering (on page 381).
Apply category, pattern, and keyword filtering to column data.
Choose time constraints for data view Control Purpose
Date Range (on page 944)
Choose or define an overall date range.
Business hours (on page 944)
Focus on specific days of the week and periods within each day. Reveal trends that are sensitive to business hours, time zones,
and other periodic attributes in the observed data.
Chart, adjust output, and visualize. Fine tune report presentation and range of values displayed using the Report Settings dialog (optional).
Specify threshold and top n: Control Purpose
Show Top n Items Limit items to the samples with the highest values.
Sort by Field Select a column to sort by (if applicable).

WhatsUp Gold User Guide
510
Chart and view options Control Purpose
View Options Select/clear the checkboxes to display/hide Totals. Display totals for each column. Others. Remainder values that do not make the top n. Chart. Display the selected Chart Type. Legend. Include legend and grid lines for readability. Trend Lines. Present data a smoothed average to show trend.
Chart Type Select a chart type and associated options: Pie. Pie distribution chart. Line/Area. Scatter graph that connects adjacent measurements
with straight lines. Spline/Area Spline. Choose a graph with a smoothed
appearance where adjacent samples exhibit a gradual slope. Vertical Bar/Horizontal Bar. Vertical or horizontal bar
chart/histogram. Y-Axis Scale Scale Y-axis (chart and graph height) automatically or choose a fixed size.
Share, export, and save as PDF Most generated Top Sender Cities report data can be printed, shared, and exported when selecting Expand ( ) from the Dashboard Options ( ) menu. After the report has been expanded, select export ( ) to access the following options:
Export to PDF. Generate a PDF file of the report with user-defined page size and orientation.
Export Data. Export Top Sender Cities data (on page 951) and leverage outside of WhatsUp Gold.
Schedule Export. Set a recurring date and time, format, and email destination for report data export (on page 942).
Top Sender Domains Top Sender Domains report reveals the top domains generating traffic for the selected interval.
Note: The domains listed in this dashboard report are obtained from the last two parts of a host name.
Understand column data The default view of each report contains a grid with the following columns:
Domain. Top sender domain.

WhatsUp Gold User Guide
511
Bytes. Number of bytes transmitted. Use Report Settings to sort by packet or flow count, or bytes.
Bit Rate. Average bit rate, in bits per second (bps). Percentage. Percentage of the total traffic for the specific item in the report
category for the selected date range.
To display Flow and Packet measurements, click a column heading ( ) for column selection list ( ). You can also include:
Utilization. Fraction of total bandwidth capacity used. "N/A" denotes the measurement cannot be calculated because the bandwidth capability is unknown for the current interface.
Tip: To show reports in full screen with most if not all possible columns, click on report options ( ) menu and choose Expand ( ).
Generate a report Choose source. , Choose a networking device or single physical or virtual interface you want to see Top Sender Domains measurements for. Choose traffic direction across an interface.
Use the Select Device dialog for one of the following:
Control Description
Device. Browse and choose a networking device that is a Network Traffic Analysis monitoring source.
Network Interface.
Choose a single physical or virtual interface Network Traffic Analysis you want traffic statistics for.
Choose direction of traffic over the network interface (Inbound, Outbound, Inbound and Outbound, or Bounce for invalid traffic.).
Choose time constraints. Choose times for the Top Sender Domains.Choose, filter, and reorder columns. Choose and hide columns, reorder columns, and apply advanced filters (on page 381) to customize your data view.
Filter and pick by column
Click a report heading ( ) and use the "column picker" ( ) from the drop down list.
Control Purpose
Columns. Click a check box to display the column. Clear the check box to hide it.
Move Column. Click on a column heading and drag it to reorder your table's columns.

WhatsUp Gold User Guide
512
Advanced Filtering (on page 381).
Apply category, pattern, and keyword filtering to column data.
Choose time constraints for data view Control Purpose
Date Range (on page 944)
Choose or define an overall date range.
Business hours (on page 944)
Focus on specific days of the week and periods within each day. Reveal trends that are sensitive to business hours, time zones,
and other periodic attributes in the observed data.
Chart, adjust output, and visualize. Fine tune report presentation and range of values displayed using the Report Settings dialog (optional).
Specify threshold and top n: Control Purpose
Show Top n Items Limit items to the samples with the highest values.
Sort by Field Select a column to sort by (if applicable).
Chart and view options Control Purpose
View Options Select/clear the checkboxes to display/hide Totals. Display totals for each column. Others. Remainder values that do not make the top n. Chart. Display the selected Chart Type. Legend. Include legend and grid lines for readability. Trend Lines. Present data a smoothed average to show trend.
Chart Type Select a chart type and associated options: Pie. Pie distribution chart. Line/Area. Scatter graph that connects adjacent measurements
with straight lines. Spline/Area Spline. Choose a graph with a smoothed
appearance where adjacent samples exhibit a gradual slope. Vertical Bar/Horizontal Bar. Vertical or horizontal bar
chart/histogram. Y-Axis Scale Scale Y-axis (chart and graph height) automatically or choose a fixed size.

WhatsUp Gold User Guide
513
Share, export, and save as PDF Most generated Top Sender Domains report data can be printed, shared, and exported when selecting Expand ( ) from the Dashboard Options ( ) menu. After the report has been expanded, select export ( ) to access the following options:
Export to PDF. Generate a PDF file of the report with user-defined page size and orientation.
Export Data. Export Top Sender Domains data (on page 951) and leverage outside of WhatsUp Gold.
Schedule Export. Set a recurring date and time, format, and email destination for report data export (on page 942).
Top Sender Groups Top Sender Groups report reveals sender groups generating the most traffic for the selected interval.
Groups are user defined sets of hosts that allow customized reporting and are configured via the NTA Groups dialog.
Understand column data The default view of each report contains a grid with the following columns:
Group. Sender group name. Bytes. Number of bytes transmitted. Use Report Settings to sort by packet or
flow count, or bytes. Bit Rate. Average bit rate, in bits per second (bps). Percentage. Percentage of the total traffic for the specific item in the report
category for the selected date range.
To display Flow and Packet measurements, click a column heading ( ) for column selection list ( ). You can also include:
Utilization. Fraction of total bandwidth capacity used. "N/A" denotes the measurement cannot be calculated because the bandwidth capability is unknown for the current interface.
Tip: To show reports in full screen with most if not all possible columns, click on report options ( ) menu and choose Expand ( ).
Generate a report Choose source. , Choose a networking device or single physical or virtual interface you want to see Top Sender Groups measurements for. Choose traffic direction across an interface.
Use the Select Device dialog for one of the following:

WhatsUp Gold User Guide
514
Control Description
Device. Browse and choose a networking device that is a Network Traffic Analysis monitoring source.
Network Interface.
Choose a single physical or virtual interface Network Traffic Analysis you want traffic statistics for.
Choose direction of traffic over the network interface (Inbound, Outbound, Inbound and Outbound, or Bounce for invalid traffic.).
Choose time constraints. Choose times for the Top Sender Groups.Choose, filter, and reorder columns. Choose and hide columns, reorder columns, and apply advanced filters (on page 381) to customize your data view.
Filter and pick by column
Click a report heading ( ) and use the "column picker" ( ) from the drop down list.
Control Purpose
Columns. Click a check box to display the column. Clear the check box to hide it.
Move Column. Click on a column heading and drag it to reorder your table's columns.
Advanced Filtering (on page 381).
Apply category, pattern, and keyword filtering to column data.
Choose time constraints for data view Control Purpose
Date Range (on page 944)
Choose or define an overall date range.
Business hours (on page 944)
Focus on specific days of the week and periods within each day. Reveal trends that are sensitive to business hours, time zones,
and other periodic attributes in the observed data.
Chart, adjust output, and visualize. Fine tune report presentation and range of values displayed using the Report Settings dialog (optional).
Specify threshold and top n: Control Purpose
Show Top n Items Limit items to the samples with the highest values.
Sort by Field Select a column to sort by (if applicable).

WhatsUp Gold User Guide
515
Chart and view options Control Purpose
View Options Select/clear the checkboxes to display/hide Totals. Display totals for each column. Others. Remainder values that do not make the top n. Chart. Display the selected Chart Type. Legend. Include legend and grid lines for readability. Trend Lines. Present data a smoothed average to show trend.
Chart Type Select a chart type and associated options: Pie. Pie distribution chart. Line/Area. Scatter graph that connects adjacent measurements
with straight lines. Spline/Area Spline. Choose a graph with a smoothed
appearance where adjacent samples exhibit a gradual slope. Vertical Bar/Horizontal Bar. Vertical or horizontal bar
chart/histogram. Y-Axis Scale Scale Y-axis (chart and graph height) automatically or choose a fixed size.
Share, export, and save as PDF Most generated Top Sender Groups report data can be printed, shared, and exported when selecting Expand ( ) from the Dashboard Options ( ) menu. After the report has been expanded, select export ( ) to access the following options:
Export to PDF. Generate a PDF file of the report with user-defined page size and orientation.
Export Data. Export Top Sender Groups data (on page 951) and leverage outside of WhatsUp Gold.
Schedule Export. Set a recurring date and time, format, and email destination for report data export (on page 942).
Top Sender TLDs Top Sender TLDs report reveals top level domains (the last portion of an Internet domain name, such as .com, .edu, or .us) to which traffic is routed for the selected interval. The traffic displayed for each TLD is the sum of the traffic sent by each device on that TLD.
Understand column data The default view of each report contains a grid with the following columns:

WhatsUp Gold User Guide
516
Note: This report only returns Network Traffic Analysis metrics for devices configured as Network Traffic Analysis sources. By default, the report displays a stacked area chart to illustrate the top sender TLDs. Below the chart, the report displays the following column information by default.
TLD. Displays an icon and the extension that represents the top level domain. Type. Definition of the extension that is used to represent the top level domain. Bytes. Number of bytes transmitted. Use Report Settings to sort by packet or
flow count, or bytes. Bit Rate. Average bit rate, in bits per second (bps). Percentage. Percentage of the total traffic.
To display Flow and Packet measurements, click a column heading ( ) for column selection list ( ). You can also include:
Utilization. Fraction of total bandwidth capacity used. "N/A" denotes the measurement cannot be calculated because the bandwidth capability is unknown for the current interface.
Generate a report Choose source. , Choose a networking device or single physical or virtual interface you want to see Top Sender TLDs measurements for. Choose traffic direction across an interface.
Use the Select Device dialog for one of the following:
Control Description
Device. Browse and choose a networking device that is a Network Traffic Analysis monitoring source.
Network Interface.
Choose a single physical or virtual interface Network Traffic Analysis you want traffic statistics for.
Choose direction of traffic over the network interface (Inbound, Outbound, Inbound and Outbound, or Bounce for invalid traffic.).
Choose time constraints. Choose times for the Top Sender TLDs.Choose, filter, and reorder columns. Choose and hide columns, reorder columns, and apply advanced filters (on page 381) to customize your data view.
Filter and pick by column
Click a report heading ( ) and use the "column picker" ( ) from the drop down list.
Control Purpose
Columns. Click a check box to display the column. Clear the check box to hide it.
WhatsUp Gold User Guide
517
Move Column. Click on a column heading and drag it to reorder your table's columns.
Advanced Filtering (on page 381).
Apply category, pattern, and keyword filtering to column data.
Choose time constraints for data view Control Purpose
Date Range (on page 944)
Choose or define an overall date range.
Business hours (on page 944)
Focus on specific days of the week and periods within each day. Reveal trends that are sensitive to business hours, time zones,
and other periodic attributes in the observed data.
Chart, adjust output, and visualize. Fine tune report presentation and range of values displayed using the Report Settings dialog (optional).
Specify threshold and top n: Control Purpose
Show Top n Items Limit items to the samples with the highest values.
Sort by Field Select a column to sort by (if applicable).
Chart and view options Control Purpose
View Options Select/clear the checkboxes to display/hide Totals. Display totals for each column. Others. Remainder values that do not make the top n. Chart. Display the selected Chart Type. Legend. Include legend and grid lines for readability. Trend Lines. Present data a smoothed average to show trend.
Chart Type Select a chart type and associated options: Pie. Pie distribution chart. Line/Area. Scatter graph that connects adjacent measurements
with straight lines. Spline/Area Spline. Choose a graph with a smoothed
appearance where adjacent samples exhibit a gradual slope. Vertical Bar/Horizontal Bar. Vertical or horizontal bar
chart/histogram.

WhatsUp Gold User Guide
518
Y-Axis Scale Scale Y-axis (chart and graph height) automatically or choose a fixed size.
Share, export, and save as PDF Most generated Top Sender TLDs report data can be printed, shared, and exported when selecting Expand ( ) from the Dashboard Options ( ) menu. After the report has been expanded, select export ( ) to access the following options:
Export to PDF. Generate a PDF file of the report with user-defined page size and orientation.
Export Data. Export Top Sender TLDs data (on page 951) and leverage outside of WhatsUp Gold.
Schedule Export. Set a recurring date and time, format, and email destination for report data export (on page 942).
Top Senders with the Most Conversation Partners Top Senders with the Most Conversation Partners report reveals senders with the most conversation partners for the selected interval.
A conversation is a connection between two devices that are transmitting information to one another over a single port. Conversation partner data has many uses. For example, the presence of a top sender with many conversation partners can denote activity by peer-to-peer application instances running on that host (for example, a download service).
Understand column data The default view of each report contains a grid with the following columns:
Sender. Host name of the top sender with the most conversation partners. Number of Partners. Number of successful connections that the sender has
shared data over. Packet Rate. Total average packet rate. Packet Percentage. Percent of top n ranking total.
Click a column heading ( ) to display the column selection listing . You can also include:
IP address. Top sender IP address. Hostname. Top sender hostname.
Tip: You can hover over a host name to display popup information about the host name's IP address. If you right-click on the host-name, a filter will be created that uses the host as the filter criteria and the Interface Details dashboard will reload with this filter applied.

WhatsUp Gold User Guide
519
Generate a report Choose source. , Choose a networking device or single physical or virtual interface you want to see Top Senders with the Most Conversation Partners measurements for. Choose traffic direction across an interface.
Use the Select Device dialog for one of the following:
Control Description
Device. Browse and choose a networking device that is a Network Traffic Analysis monitoring source.
Network Interface.
Choose a single physical or virtual interface Network Traffic Analysis you want traffic statistics for.
Choose direction of traffic over the network interface (Inbound, Outbound, Inbound and Outbound, or Bounce for invalid traffic.).
Choose time constraints. Choose times for the Top Senders with the Most Conversation Partners.Choose, filter, and reorder columns. Choose and hide columns, reorder columns, and apply advanced filters (on page 381) to customize your data view.
Filter and pick by column
Click a report heading ( ) and use the "column picker" ( ) from the drop down list.
Control Purpose
Columns. Click a check box to display the column. Clear the check box to hide it.
Move Column. Click on a column heading and drag it to reorder your table's columns.
Advanced Filtering (on page 381).
Apply category, pattern, and keyword filtering to column data.
Choose time constraints for data view Control Purpose
Date Range (on page 944)
Choose or define an overall date range.
Business hours (on page 944)
Focus on specific days of the week and periods within each day. Reveal trends that are sensitive to business hours, time zones,
and other periodic attributes in the observed data.

WhatsUp Gold User Guide
520
Chart, adjust output, and visualize. Fine tune report presentation and range of values displayed using the Report Settings dialog (optional).
Specify threshold and top n: Control Purpose
Show Top n Items Limit items to the samples with the highest values.
Sort by Field Select a column to sort by (if applicable).
Chart and view options Control Purpose
View Options Select/clear the checkboxes to display/hide Totals. Display totals for each column. Others. Remainder values that do not make the top n. Chart. Display the selected Chart Type. Legend. Include legend and grid lines for readability. Trend Lines. Present data a smoothed average to show trend.
Chart Type Select a chart type and associated options: Pie. Pie distribution chart. Line/Area. Scatter graph that connects adjacent measurements
with straight lines. Spline/Area Spline. Choose a graph with a smoothed
appearance where adjacent samples exhibit a gradual slope. Vertical Bar/Horizontal Bar. Vertical or horizontal bar
chart/histogram. Y-Axis Scale Scale Y-axis (chart and graph height) automatically or choose a fixed size.
Share, export, and save as PDF Most generated Top Senders with the Most Conversation Partners report data can be printed, shared, and exported when selecting Expand ( ) from the Dashboard Options ( ) menu. After the report has been expanded, select export ( ) to access the following options:
Export to PDF. Generate a PDF file of the report with user-defined page size and orientation.
Export Data. Export Top Senders with the Most Conversation Partners data (on page 951) and leverage outside of WhatsUp Gold.
Schedule Export. Set a recurring date and time, format, and email destination for report data export (on page 942).

WhatsUp Gold User Guide
521
Top Senders with the Most Failed Connections Top Senders with the Most Failed Connections report reveals devices that initiated the highest number of unsuccessful TCP connection attempts, or SYN packets for the selected interval.
Understand column data The default view of each report contains a grid with the following columns:
Sender. Host name of the top sender with the most failed connections. Failed Connections. Number of failed connection attempts. Packet Rate. Total average packet rate. Packet Percentage. Percent of top n ranking total.
Click a column heading ( ) to display the column selection listing . You can also include:
IP address. Top sender IP address. Hostname. Top sender hostname.
Tip: To show reports in full screen with most if not all possible columns, click on report options ( ) menu and choose Expand ( ).
Generate a report Choose source. , Choose a networking device or single physical or virtual interface you want to see Top Senders with the Most Failed Connections measurements for. Choose traffic direction across an interface.
Use the Select Device dialog for one of the following:
Control Description
Device. Browse and choose a networking device that is a Network Traffic Analysis monitoring source.
Network Interface.
Choose a single physical or virtual interface Network Traffic Analysis you want traffic statistics for.
Choose direction of traffic over the network interface (Inbound, Outbound, Inbound and Outbound, or Bounce for invalid traffic.).

WhatsUp Gold User Guide
522
Choose time constraints. Choose times for the Top Senders with the Most Failed Connections.Choose, filter, and reorder columns. Choose and hide columns, reorder columns, and apply advanced filters (on page 381) to customize your data view.
Filter and pick by column
Click a report heading ( ) and use the "column picker" ( ) from the drop down list.
Control Purpose
Columns. Click a check box to display the column. Clear the check box to hide it.
Move Column. Click on a column heading and drag it to reorder your table's columns.
Advanced Filtering (on page 381).
Apply category, pattern, and keyword filtering to column data.
Choose time constraints for data view Control Purpose
Date Range (on page 944)
Choose or define an overall date range.
Business hours (on page 944)
Focus on specific days of the week and periods within each day. Reveal trends that are sensitive to business hours, time zones,
and other periodic attributes in the observed data.
Chart, adjust output, and visualize. Fine tune report presentation and range of values displayed using the Report Settings dialog (optional).
Specify threshold and top n: Control Purpose
Show Top n Items Limit items to the samples with the highest values.
Sort by Field Select a column to sort by (if applicable).

WhatsUp Gold User Guide
523
Chart and view options Control Purpose
View Options Select/clear the checkboxes to display/hide Totals. Display totals for each column. Others. Remainder values that do not make the top n. Chart. Display the selected Chart Type. Legend. Include legend and grid lines for readability. Trend Lines. Present data a smoothed average to show trend.
Chart Type Select a chart type and associated options: Pie. Pie distribution chart. Line/Area. Scatter graph that connects adjacent measurements
with straight lines. Spline/Area Spline. Choose a graph with a smoothed
appearance where adjacent samples exhibit a gradual slope. Vertical Bar/Horizontal Bar. Vertical or horizontal bar
chart/histogram. Y-Axis Scale Scale Y-axis (chart and graph height) automatically or choose a fixed size.
Share, export, and save as PDF Most generated Top Senders with the Most Failed Connections report data can be printed, shared, and exported when selecting Expand ( ) from the Dashboard Options ( ) menu. After the report has been expanded, select export ( ) to access the following options:
Export to PDF. Generate a PDF file of the report with user-defined page size and orientation.
Export Data. Export Top Senders with the Most Failed Connections data (on page 951) and leverage outside of WhatsUp Gold.
Schedule Export. Set a recurring date and time, format, and email destination for report data export (on page 942).
Interface Usage Interface Usage report reveals Network Traffic Analysis source, incoming and outgoing interface traffic totals (and trends) for the selected period. Interfaces can be displayed separately, or grouped together by name. If you group by interface name, all interfaces under a single display name are summed, and all data displayed is a total for those interfaces.
Understand column data The default view of each report contains a grid with the following columns:
Interface. Device hostname, IP address, or custom label.

WhatsUp Gold User Guide
524
Incoming Bytes. Traffic volume received on the interface. Incoming Rate. Total average rate of inbound traffic. Incoming 95th Percentile. Usage is at or below this figure 95% of the time.
(Raw data calculation.) Incoming Minimum. Maximum incoming rate observed. Incoming Maximum. Maximum incoming rate observed. Outgoing Bytes. Total bytes transmitted from the interface. Outgoing Rate. Total average rate of outbound traffic. Outgoing Minimum. Minimum outgoing rate observed. Outgoing Maximum. Maximum outgoing rate observed. Outgoing 95th Percentile. Usage is at or below this figure 95% of the time.
(Raw data calculation.)
Click a column heading ( ) to display the column selection listing . You can also include:
Source Name. Device hostname, IP address, or custom label. Interface Name. Textual name of the interface (ifName). SNMP Index. Network interface SNMP table identifier (ifIndex).
Tip: Interfaces with an index of 0 denote the NULL interface.
Generate a report Choose source. , Choose a networking device or single physical or virtual interface you want to see Interface Usage measurements for. Choose traffic direction across an interface.
Use the Select Device dialog for one of the following:
Control Description
Device. Browse and choose a networking device that is a Network Traffic Analysis monitoring source.
Network Interface.
Choose a single physical or virtual interface Network Traffic Analysis you want traffic statistics for.
Choose direction of traffic over the network interface (Inbound, Outbound, Inbound and Outbound, or Bounce for invalid traffic.).

WhatsUp Gold User Guide
525
Choose time constraints. ( , ) Choose times for the Interface Usage. (For recently observed measurements, select Last Polled from the Date Range drop down list.)
Choose time constraints for data view Control Purpose
Date Range (on page 944)
Choose or define an overall date range.
Business hours (on page 944)
Focus on specific days of the week and periods within each day. Reveal trends that are sensitive to business hours, time zones,
and other periodic attributes in the observed data.
Filter and reduce by row and by column. Sort and remove columns, group rows based on specific column values, and remove unwanted information from the table.
Filter and pick by column
Click a report heading and use the following from the drop down list:
Control Purpose
Sort. Sort column in ascending or descending order.
Columns. Pick the columns you want to view. Click a check box to display the column. Clear the check box to hide it.
Group by this field.
Group table into collapsible rows wherever the current column contains identical data ("field") values.
Filters. Provide a keyword to view only rows that contain the keyword for this column.
Chart, adjust output, and visualize. Fine tune report presentation and range of values displayed using the Report Settings dialog (optional).
Specify threshold and top n: Control Purpose
Show Top n Items Limit items to the samples with the highest values.
Sort by Field Select a column to sort by (if applicable).

WhatsUp Gold User Guide
526
Chart and view options Control Purpose
View Options Select/clear the checkboxes to display/hide Totals. Display totals for each column. Others. Remainder values that do not make the top n. Chart. Display the selected Chart Type. Legend. Include legend and grid lines for readability. Trend Lines. Present data a smoothed average to show trend.
Chart Type Select a chart type and associated options: Pie. Pie distribution chart. Line/Area. Scatter graph that connects adjacent measurements
with straight lines. Spline/Area Spline. Choose a graph with a smoothed
appearance where adjacent samples exhibit a gradual slope. Vertical Bar/Horizontal Bar. Vertical or horizontal bar
chart/histogram. Y-Axis Scale Scale Y-axis (chart and graph height) automatically or choose a fixed size.
Share, export, and save as PDF Most generated Interface Usage report data can be printed, shared, and exported when selecting Expand ( ) from the Dashboard Options ( ) menu. After the report has been expanded, select export ( ) to access the following options:
Export to PDF. Generate a PDF file of the report with user-defined page size and orientation.
Export Data. Export Interface Usage data (on page 951) and leverage outside of WhatsUp Gold.
Schedule Export. Set a recurring date and time, format, and email destination for report data export (on page 942).
NBAR Applications - Flow Details NBAR Applications - Flow Details report reveals top n applications ranked by bandwidth usage for the selected interval. Applications reported are detected and classified by a network based application recognition engine (NBAR) across interfaces associated with a device or group. This report is useful for identifying application traffic that uses randomly allocated rather than "dedicated" logical ports.
Note: The device running the Cisco NBAR engine must be configured to classify traffic before you run this report.

WhatsUp Gold User Guide
527
Understand column data The default view of each report contains a grid with the following columns:
Application. Application category detected by the Cisco NBAR identification engine. Others indicates bandwidth utilized by unclassified traffic.
Bytes. Total number of bytes. Bit Rate. Average bit rate between two endpoints (browser and webserver, for
example). Byte Percentage. Percentage of total traffic associated with each detected
application.
To display Flow and Packet measurements, click a column heading ( ) for column selection list ( ). You can also include:
Utilization. Fraction of total bandwidth capacity used. "N/A" denotes the measurement cannot be calculated because the bandwidth capability is unknown for the current interface.
Generate a report Choose source. , Choose a networking device or single physical or virtual interface you want to see NBAR Applications - Flow Details measurements for. Choose traffic direction across an interface.
Use the Select Device dialog for one of the following:
Control Description
Device. Browse and choose a networking device that is a Network Traffic Analysis monitoring source.
Network Interface.
Choose a single physical or virtual interface Network Traffic Analysis you want traffic statistics for.
Choose direction of traffic over the network interface (Inbound, Outbound, Inbound and Outbound, or Bounce for invalid traffic.).
Choose time constraints. Choose times for the NBAR Applications - Flow Details.Choose, filter, and reorder columns. Choose and hide columns, reorder columns, and apply advanced filters (on page 381) to customize your data view.
Filter and pick by column
Click a report heading ( ) and use the "column picker" ( ) from the drop down list.
Control Purpose
Columns. Click a check box to display the column. Clear the check box to hide it.

WhatsUp Gold User Guide
528
Move Column. Click on a column heading and drag it to reorder your table's columns.
Advanced Filtering (on page 381).
Apply category, pattern, and keyword filtering to column data.
Choose time constraints for data view Control Purpose
Date Range (on page 944)
Choose or define an overall date range.
Business hours (on page 944)
Focus on specific days of the week and periods within each day. Reveal trends that are sensitive to business hours, time zones,
and other periodic attributes in the observed data.
Chart, adjust output, and visualize. Fine tune report presentation and range of values displayed using the Report Settings dialog (optional).
Specify threshold and top n: Control Purpose
Show Top n Items Limit items to the samples with the highest values.
Sort by Field Select a column to sort by (if applicable).
Chart and view options Control Purpose
View Options Select/clear the checkboxes to display/hide Totals. Display totals for each column. Others. Remainder values that do not make the top n. Chart. Display the selected Chart Type. Legend. Include legend and grid lines for readability. Trend Lines. Present data a smoothed average to show trend.
Chart Type Select a chart type and associated options: Pie. Pie distribution chart. Line/Area. Scatter graph that connects adjacent measurements
with straight lines. Spline/Area Spline. Choose a graph with a smoothed
appearance where adjacent samples exhibit a gradual slope. Vertical Bar/Horizontal Bar. Vertical or horizontal bar
chart/histogram.
WhatsUp Gold User Guide
529
Y-Axis Scale Scale Y-axis (chart and graph height) automatically or choose a fixed size.
Share, export, and save as PDF Most generated NBAR Applications - Flow Details report data can be printed, shared, and exported when selecting Expand ( ) from the Dashboard Options ( ) menu. After the report has been expanded, select export ( ) to access the following options:
Export to PDF. Generate a PDF file of the report with user-defined page size and orientation.
Export Data. Export NBAR Applications - Flow Details data (on page 951) and leverage outside of WhatsUp Gold.
Schedule Export. Set a recurring date and time, format, and email destination for report data export (on page 942).
NBAR Applications - Interface Totals NBAR Applications - Interface Totals report reveals the top n NBAR-classified traffic categories observed at the network interface for the selected interval.
Understand column data The default view of each report contains a grid with the following columns:
NBAR Application. Application category detected by the Cisco NBAR identification engine.
Bytes. Total number of bytes. Bit Rate. Average number of application bits transferred between two endpoints
(browser and webserver, for example). Byte Percentage. Percentage of overall traffic.
To display Flow and Packet measurements, click a column heading ( ) for column selection list ( ). You can also include:
Utilization. Fraction of total bandwidth capacity used. "N/A" denotes the measurement cannot be calculated because the bandwidth capability is unknown for the current interface.
Generate a report Choose source. , Choose a networking device or single physical or virtual interface you want to see NBAR Applications - Interface Totals measurements for. Choose traffic direction across an interface.
Use the Select Device dialog for one of the following:

WhatsUp Gold User Guide
530
Control Description
Device. Browse and choose a networking device that is a Network Traffic Analysis monitoring source.
Network Interface.
Choose a single physical or virtual interface Network Traffic Analysis you want traffic statistics for.
Choose direction of traffic over the network interface (Inbound, Outbound, Inbound and Outbound, or Bounce for invalid traffic.).
Choose time constraints. ( , ) Choose times for the NBAR Applications - Interface Totals. (For recently observed measurements, select Last Polled from the Date Range drop down list.)
Choose time constraints for data view Control Purpose
Date Range (on page 944)
Choose or define an overall date range.
Business hours (on page 944)
Focus on specific days of the week and periods within each day. Reveal trends that are sensitive to business hours, time zones,
and other periodic attributes in the observed data.
Filter and reduce by row and by column. Sort and remove columns, group rows based on specific column values, and remove unwanted information from the table.
Filter and pick by column
Click a report heading and use the following from the drop down list:
Control Purpose
Sort. Sort column in ascending or descending order.
Columns. Pick the columns you want to view. Click a check box to display the column. Clear the check box to hide it.
Group by this field.
Group table into collapsible rows wherever the current column contains identical data ("field") values.
Filters. Provide a keyword to view only rows that contain the keyword for this column.
WhatsUp Gold User Guide
531
Chart, adjust output, and visualize. Fine tune report presentation and range of values displayed using the Report Settings dialog (optional).
Specify threshold and top n: Control Purpose
Show Top n Items Limit items to the samples with the highest values.
Sort by Field Select a column to sort by (if applicable).
Chart and view options Control Purpose
View Options Select/clear the checkboxes to display/hide Totals. Display totals for each column. Others. Remainder values that do not make the top n. Chart. Display the selected Chart Type. Legend. Include legend and grid lines for readability. Trend Lines. Present data a smoothed average to show trend.
Chart Type Select a chart type and associated options: Pie. Pie distribution chart. Line/Area. Scatter graph that connects adjacent measurements
with straight lines. Spline/Area Spline. Choose a graph with a smoothed
appearance where adjacent samples exhibit a gradual slope. Vertical Bar/Horizontal Bar. Vertical or horizontal bar
chart/histogram. Y-Axis Scale Scale Y-axis (chart and graph height) automatically or choose a fixed size.
Share, export, and save as PDF Most generated NBAR Applications - Interface Totals report data can be printed, shared, and exported when selecting Expand ( ) from the Dashboard Options ( ) menu. After the report has been expanded, select export ( ) to access the following options:
Export to PDF. Generate a PDF file of the report with user-defined page size and orientation.
Export Data. Export NBAR Applications - Interface Totals data (on page 951) and leverage outside of WhatsUp Gold.
Schedule Export. Set a recurring date and time, format, and email destination for report data export (on page 942).

WhatsUp Gold User Guide
532
Types of Services Types of Services report reveals a ranked list of traffic organized by Type of Service (ToS) for the current interval. Some routers use ToS to prioritize traffic flow. For instance, VoIP data may be given a higher ToS than general network use to ensure the timeliness of voice quality over the IP connection.
Note: You can add friendly labels to Code Point Identifiers using the Type of Service Library (on page 375).
Understand column data The default view of each report contains a grid with the following columns:
Type of Service. Type of Service (ToS) using differentiated services code point (DSCP) labeling.
Bytes. Combined (incoming/outgoing) number of bytes transferred. (Use Report Settings Sort by option to rank the list by packet or flow count, not bytes.)
Bit Rate. Average bit rate. Byte Percentage. Service type percentage of the total traffic.
To display Flow and Packet measurements, click a column heading ( ) for column selection list ( ). You can also include:
DSCP. Differentiated Services Code Point identifier as defined by the IETF in RFC2474 (https://tools.ietf.org/html/rfc2474).
Utilization. Fraction of total bandwidth capacity used. "N/A" denotes the measurement cannot be calculated because the bandwidth capability is unknown for the current interface.
Note: For this report, Network Traffic Analysis defines ToS as the first 6 bits of a Type of Service (ToS) byte, or the Differentiated Services Code Point (DSCP).
Generate a report Choose source. , Choose a networking device or single physical or virtual interface you want to see Types of Services measurements for. Choose traffic direction across an interface.
Use the Select Device dialog for one of the following:
Control Description
Device. Browse and choose a networking device that is a Network Traffic Analysis monitoring source.
WhatsUp Gold User Guide
533
Network Interface.
Choose a single physical or virtual interface Network Traffic Analysis you want traffic statistics for.
Choose direction of traffic over the network interface (Inbound, Outbound, Inbound and Outbound, or Bounce for invalid traffic.).
Choose time constraints. Choose times for the Types of Services.Choose, filter, and reorder columns. Choose and hide columns, reorder columns, and apply advanced filters (on page 381) to customize your data view.
Filter and pick by column
Click a report heading ( ) and use the "column picker" ( ) from the drop down list.
Control Purpose
Columns. Click a check box to display the column. Clear the check box to hide it.
Move Column. Click on a column heading and drag it to reorder your table's columns.
Advanced Filtering (on page 381).
Apply category, pattern, and keyword filtering to column data.
Choose time constraints for data view Control Purpose
Date Range (on page 944)
Choose or define an overall date range.
Business hours (on page 944)
Focus on specific days of the week and periods within each day. Reveal trends that are sensitive to business hours, time zones,
and other periodic attributes in the observed data.
Chart, adjust output, and visualize. Fine tune report presentation and range of values displayed using the Report Settings dialog (optional).
Specify threshold and top n: Control Purpose
Show Top n Items Limit items to the samples with the highest values.
Sort by Field Select a column to sort by (if applicable).

WhatsUp Gold User Guide
534
Chart and view options Control Purpose
View Options Select/clear the checkboxes to display/hide Totals. Display totals for each column. Others. Remainder values that do not make the top n. Chart. Display the selected Chart Type. Legend. Include legend and grid lines for readability. Trend Lines. Present data a smoothed average to show trend.
Chart Type Select a chart type and associated options: Pie. Pie distribution chart. Line/Area. Scatter graph that connects adjacent measurements
with straight lines. Spline/Area Spline. Choose a graph with a smoothed
appearance where adjacent samples exhibit a gradual slope. Vertical Bar/Horizontal Bar. Vertical or horizontal bar
chart/histogram. Y-Axis Scale Scale Y-axis (chart and graph height) automatically or choose a fixed size.
Share, export, and save as PDF Most generated Types of Services report data can be printed, shared, and exported when selecting Expand ( ) from the Dashboard Options ( ) menu. After the report has been expanded, select export ( ) to access the following options:
Export to PDF. Generate a PDF file of the report with user-defined page size and orientation.
Export Data. Export Types of Services data (on page 951) and leverage outside of WhatsUp Gold.
Schedule Export. Set a recurring date and time, format, and email destination for report data export (on page 942).
Packet Size Distribution Packet Size Distribution report reveals IP packet size for the selected interval. Packet size distribution metrics is a useful tool for characterizing Internet traffic and analyzing both TCP and routing performance.
Tip: The maximum transfer unit of Ethernet v2 frames is 1500 kilobytes.
Understand column data The default view of each report contains a grid with the following columns:
Packet Size. Size of packets being transmitted.

WhatsUp Gold User Guide
535
Bytes. Total bytes transmitted for the traffic type. Bit Rate. Total average bit rate. Packets. Number of packets of a particular size transmitted. Packet Rate. Total average packet rate. Packet Percentage. Service type current percentage of the total traffic.
Generate a report Choose source. , Choose a networking device or single physical or virtual interface you want to see Packet Size Distribution measurements for. Choose traffic direction across an interface.
Use the Select Device dialog for one of the following:
Control Description
Device. Browse and choose a networking device that is a Network Traffic Analysis monitoring source.
Network Interface.
Choose a single physical or virtual interface Network Traffic Analysis you want traffic statistics for.
Choose direction of traffic over the network interface (Inbound, Outbound, Inbound and Outbound, or Bounce for invalid traffic.).
Choose time constraints. Choose times for the Packet Size Distribution.Choose, filter, and reorder columns. Choose and hide columns, reorder columns, and apply advanced filters (on page 381) to customize your data view.
Filter and pick by column
Click a report heading ( ) and use the "column picker" ( ) from the drop down list.
Control Purpose
Columns. Click a check box to display the column. Clear the check box to hide it.
Move Column. Click on a column heading and drag it to reorder your table's columns.
Advanced Filtering (on page 381).
Apply category, pattern, and keyword filtering to column data.

WhatsUp Gold User Guide
536
Choose time constraints for data view Control Purpose
Date Range (on page 944)
Choose or define an overall date range.
Business hours (on page 944)
Focus on specific days of the week and periods within each day. Reveal trends that are sensitive to business hours, time zones,
and other periodic attributes in the observed data.
Chart, adjust output, and visualize. Fine tune report presentation and range of values displayed using the Report Settings dialog (optional).
Specify threshold and top n: Control Purpose
Show Top n Items Limit items to the samples with the highest values.
Sort by Field Select a column to sort by (if applicable).
Chart and view options Control Purpose
View Options Select/clear the checkboxes to display/hide Totals. Display totals for each column. Others. Remainder values that do not make the top n. Chart. Display the selected Chart Type. Legend. Include legend and grid lines for readability. Trend Lines. Present data a smoothed average to show trend.
Chart Type Select a chart type and associated options: Pie. Pie distribution chart. Line/Area. Scatter graph that connects adjacent measurements
with straight lines. Spline/Area Spline. Choose a graph with a smoothed
appearance where adjacent samples exhibit a gradual slope. Vertical Bar/Horizontal Bar. Vertical or horizontal bar
chart/histogram. Y-Axis Scale Scale Y-axis (chart and graph height) automatically or choose a fixed size.
Share, export, and save as PDF Most generated Packet Size Distribution report data can be printed, shared, and exported when selecting Expand ( ) from the Dashboard Options ( ) menu. After the report has been expanded, select export ( ) to access the following options:
WhatsUp Gold User Guide
537
Export to PDF. Generate a PDF file of the report with user-defined page size and orientation.
Export Data. Export Packet Size Distribution data (on page 951) and leverage outside of WhatsUp Gold.
Schedule Export. Set a recurring date and time, format, and email destination for report data export (on page 942).
Top Ports The Top Ports dashboard report displays the top TCP or UDP ports used the most. Port usage data can be used to determine if new or unapproved applications are in use, and can be used to assist in port to application mapping that generates the Top Applications report. You can choose to display and sort sender traffic by bytes, packets, or flows using the report settings dialog. Providing alternate sorting methods allows you to monitor and identify hosts that are the largest consumers of interface resources other than bandwidth.
Note: When ports in a flow are not configured in any application, the port number saved is 0. A second record is created in the Unclassified table which contains the initial flow source and destination ports.
Port. Displays the port associated with the application.
Bytes. Displays the total number of bytes transmitted for the specific item in the report category for the selected date range.
Bit Rate. Displays the average bit rate in multiples of the selected unit (e.g., Kbps, Mbps, or Gbps) for the specific item in the report category for the selected date range.
Byte Percentage. Displays the percentage of the total traffic for the specific item in the report category for the selected date range.
To display Flow and Packet measurements, click a column heading ( ) for column selection list ( ). You can also include:
Packets. Percentage of the total traffic.
Packet Rate. Average packet rate.
Packet Percentage. Percent of packets for this category.
Flows. Total number of flow messages.
Flow Rate. Rate at which WhatsUp Gold receives measurements observed at the device.
Flow Percentage. Percentage of total measurement for samples received.
Utilization. Fraction of interface capacity needed for application traffic.

WhatsUp Gold User Guide
538
Top Protocols The Top Protocols dashboard report displays the transport Layer 4 protocols (e.g., TCP, UDP, ICMP) used the most. This data is useful in determining what protocol is used the most on a network during a specified time period.
Note: This report only displays layer 4 networking protocols. Other traffic that is commonly referred to as a protocol, such as HTTP, FTP, or IMAP, is displayed on the Top Applications dashboard report.
You can choose to display sender traffic by bytes, packets, or flows using the report settings dialog. Providing alternate sorting methods allows you to monitor and identify hosts that are the largest consumers of interface resources other than bandwidth.
Protocol. Displays the protocol name.
Bytes. Displays the total number of bytes transmitted for the specific item in the report category for the selected date range.
Bit Rate. Displays the average bit rate in multiples of the selected unit (e.g., Kbps, Mbps, or Gbps) for the specific item in the report category for the selected date range.
Byte Percentage. Displays the percentage of the total traffic for the specific item in the report category for the selected date range.
To display Flow and Packet measurements, click a column heading ( ) for column selection list ( ). You can also include:
Packets. Percentage of the total traffic.
Packet Rate. Average packet rate.
Packet Percentage. Percent of packets for this category.
Flows. Total number of flow messages.
Flow Rate. Rate at which WhatsUp Gold receives measurements observed at the device.
Flow Percentage. Percentage of total measurement for samples received.
Utilization. Fraction of interface capacity needed for application traffic.
Top Applications Top Applications report reveals applications creating the most network traffic for the selected interval.
Understand column data The default view of each report contains a grid with the following columns:
Application. Application or transport layer protocol (if unidentified). Others indicates bandwidth utilized by unclassified traffic.

WhatsUp Gold User Guide
539
Bytes. Combined (incoming/outgoing) number of bytes transferred. (Use Report Settings Sort by option to rank the list by packet or flow count, not bytes.)
Bit Rate. Average bit rate. Byte Percentage. Percentage of the total traffic.
To display Flow and Packet measurements, click a column heading ( ) for column selection list ( ). You can also include:
More Application ID. Application layer protocol name. Type. Application traffic type. Packets. Percentage of the total traffic. Packet Rate. Average packet rate. Packet Percentage. Percent of packets for this category. Flows. Total number of flow messages. Flow Rate. Rate at which WhatsUp Gold receives measurements observed at
the device. Flow Percentage. Percentage of total measurement for samples received. Utilization. Fraction of interface capacity needed for application traffic.
Generate a report Choose source. , Choose a networking device or single physical or virtual interface you want to see Top Applications measurements for. Choose traffic direction across an interface.
Use the Select Device dialog for one of the following:
Control Description
Device. Browse and choose a networking device that is a Network Traffic Analysis monitoring source.
Network Interface.
Choose a single physical or virtual interface Network Traffic Analysis you want traffic statistics for.
Choose direction of traffic over the network interface (Inbound, Outbound, Inbound and Outbound, or Bounce for invalid traffic.).
Choose time constraints. Choose times for the Top Applications.Choose, filter, and reorder columns. Choose and hide columns, reorder columns, and apply advanced filters (on page 381) to customize your data view.
Filter and pick by column
Click a report heading ( ) and use the "column picker" ( ) from the drop down list.

WhatsUp Gold User Guide
540
Control Purpose
Columns. Click a check box to display the column. Clear the check box to hide it.
Move Column. Click on a column heading and drag it to reorder your table's columns.
Advanced Filtering (on page 381).
Apply category, pattern, and keyword filtering to column data.
Choose time constraints for data view Control Purpose
Date Range (on page 944)
Choose or define an overall date range.
Business hours (on page 944)
Focus on specific days of the week and periods within each day. Reveal trends that are sensitive to business hours, time zones,
and other periodic attributes in the observed data.
Chart, adjust output, and visualize. Fine tune report presentation and range of values displayed using the Report Settings dialog (optional).
Specify threshold and top n: Control Purpose
Show Top n Items Limit items to the samples with the highest values.
Sort by Field Select a column to sort by (if applicable).
Chart and view options Control Purpose
View Options Select/clear the checkboxes to display/hide Totals. Display totals for each column. Others. Remainder values that do not make the top n. Chart. Display the selected Chart Type. Legend. Include legend and grid lines for readability. Trend Lines. Present data a smoothed average to show trend.

WhatsUp Gold User Guide
541
Chart Type Select a chart type and associated options: Pie. Pie distribution chart. Line/Area. Scatter graph that connects adjacent measurements
with straight lines. Spline/Area Spline. Choose a graph with a smoothed
appearance where adjacent samples exhibit a gradual slope. Vertical Bar/Horizontal Bar. Vertical or horizontal bar
chart/histogram. Y-Axis Scale Scale Y-axis (chart and graph height) automatically or choose a fixed size.
Share, export, and save as PDF Most generated Top Applications report data can be printed, shared, and exported when selecting Expand ( ) from the Dashboard Options ( ) menu. After the report has been expanded, select export ( ) to access the following options:
Export to PDF. Generate a PDF file of the report with user-defined page size and orientation.
Export Data. Export Top Applications data (on page 951) and leverage outside of WhatsUp Gold.
Schedule Export. Set a recurring date and time, format, and email destination for report data export (on page 942).
Conversations Conversations report reveals end points participating in network traffic streams (conversations) and the application level protocol they employ for the selected interval. By default, this report shows the top n conversations.
Understand column data The default view of each report contains a grid with the following columns:
Conversation. Host ID or IP address of source and destination endpoints (SourceHost —> DestinationHost).
Application. Application layer protocol being used. For example FTP, HTTP, SMTP.
Bytes. Combined (incoming/outgoing) number of bytes transferred. (Use Report Settings Sort by option to rank the list by packet or flow count, not bytes.)
Bit Rate. Total average bit rate. Byte Percentage. Percentage of overall traffic.
To display Flow and Packet measurements, click a column heading ( ) for column selection list ( ). You can also include:
WhatsUp Gold User Guide
542
Utilization. Fraction of total bandwidth capacity used. "N/A" denotes the measurement cannot be calculated because the bandwidth capability is unknown for the current interface.
Sender IP. Conversation originator's IP address. Sender Hostname. Conversation originator's hostname. Receiver IP. Conversation destination IP address. Receiver Hostname. Conversation destination hostname.
Generate a report Choose source. , Choose a networking device or single physical or virtual interface you want to see Conversations measurements for. Choose traffic direction across an interface.
Use the Select Device dialog for one of the following:
Control Description
Device. Browse and choose a networking device that is a Network Traffic Analysis monitoring source.
Network Interface.
Choose a single physical or virtual interface Network Traffic Analysis you want traffic statistics for.
Choose direction of traffic over the network interface (Inbound, Outbound, Inbound and Outbound, or Bounce for invalid traffic.).
Choose time constraints. Choose times for the Conversations.Choose, filter, and reorder columns. Choose and hide columns, reorder columns, and apply advanced filters (on page 381) to customize your data view.
Filter and pick by column
Click a report heading ( ) and use the "column picker" ( ) from the drop down list.
Control Purpose
Columns. Click a check box to display the column. Clear the check box to hide it.
Move Column. Click on a column heading and drag it to reorder your table's columns.
Advanced Filtering (on page 381).
Apply category, pattern, and keyword filtering to column data.

WhatsUp Gold User Guide
543
Choose time constraints for data view Control Purpose
Date Range (on page 944)
Choose or define an overall date range.
Business hours (on page 944)
Focus on specific days of the week and periods within each day. Reveal trends that are sensitive to business hours, time zones,
and other periodic attributes in the observed data.
Chart, adjust output, and visualize. Fine tune report presentation and range of values displayed using the Report Settings dialog (optional).
Specify threshold and top n: Control Purpose
Show Top n Items Limit items to the samples with the highest values.
Sort by Field Select a column to sort by (if applicable).
Chart and view options Control Purpose
View Options Select/clear the checkboxes to display/hide Totals. Display totals for each column. Others. Remainder values that do not make the top n. Chart. Display the selected Chart Type. Legend. Include legend and grid lines for readability. Trend Lines. Present data a smoothed average to show trend.
Chart Type Select a chart type and associated options: Pie. Pie distribution chart. Line/Area. Scatter graph that connects adjacent measurements
with straight lines. Spline/Area Spline. Choose a graph with a smoothed
appearance where adjacent samples exhibit a gradual slope. Vertical Bar/Horizontal Bar. Vertical or horizontal bar
chart/histogram. Y-Axis Scale Scale Y-axis (chart and graph height) automatically or choose a fixed size.
Share, export, and save as PDF Most generated Conversations report data can be printed, shared, and exported when selecting Expand ( ) from the Dashboard Options ( ) menu. After the report has been expanded, select export ( ) to access the following options:

WhatsUp Gold User Guide
544
Export to PDF. Generate a PDF file of the report with user-defined page size and orientation.
Export Data. Export Conversations data (on page 951) and leverage outside of WhatsUp Gold.
Schedule Export. Set a recurring date and time, format, and email destination for report data export (on page 942).
Top Endpoint Groups Top Endpoint Groups report reveals the top endpoint groups that are sending and receiving the most traffic for the selected interval.
Understand column data The default view of each report contains a grid with the following columns:
Group. Top endpoint group name. Other indicates traffic not associated with a group.
Bytes. Combined (incoming/outgoing) number of bytes transferred. (Use Report Settings Sort by option to rank the list by packet or flow count, not bytes.) Red ( ) indicates fraction received. Blue ( ) indicates fraction sent. (Mouse hover to display in/out summary.)
Bit Rate. Average bit rate, in total bits per second (bps). Byte Percentage. Percentage of the total traffic.
To display Flow and Packet measurements, click a column heading ( ) for column selection list ( ). You can also include:
Utilization. Fraction of total bandwidth capacity used. "N/A" denotes the measurement cannot be calculated because the bandwidth capability is unknown for the current interface.
More Bit Rate Received. The rate of bits transmitted in the interface for the selected
date range. Bit Rate Sent. The rate of bits transmitted out of the interface for the selected
date range. Flows Received. The number of flows transmitted in the interface during the
selected date range. Flows Sent. The number of flows transmitted out of the interface during the
selected date range. Flows Total. The total number of flows for the interface during the selected date
range. Flows Rate Received. The rate of flows transmitted in the interface during the
selected date range.

WhatsUp Gold User Guide
545
Flows Rate Sent. The rate of flows transmitted out of the interface during the selected date range.
Flow Rate Total. The average flow rate, in multiples of flows per second (fps) for the selected date range.
Packets Received. The number of packets transmitted in the interface for the selected date range.
Packets Sent. The number of packets transmitted out of the interface for the selected date range.
Packets Total. The total number of packets for the specific item in the report category for the selected date range.
Packet Rate Received. The rate of packets transmitted in the interface for the selected date range.
Packet Rate Sent. The rate of packets transmitted out of the interface for the selected date range.
Packet Rate Total. Displays the average packet rate, in packets per second (pps), for the selected date range.
Generate a report Choose source. , Choose a networking device or single physical or virtual interface you want to see Top Endpoint Groups measurements for. Choose traffic direction across an interface.
Use the Select Device dialog for one of the following:
Control Description
Device. Browse and choose a networking device that is a Network Traffic Analysis monitoring source.
Network Interface.
Choose a single physical or virtual interface Network Traffic Analysis you want traffic statistics for.
Choose direction of traffic over the network interface (Inbound, Outbound, Inbound and Outbound, or Bounce for invalid traffic.).
Choose time constraints. Choose times for the Top Endpoint Groups.Choose, filter, and reorder columns. Choose and hide columns, reorder columns, and apply advanced filters (on page 381) to customize your data view.
Filter and pick by column
Click a report heading ( ) and use the "column picker" ( ) from the drop down list.
Control Purpose
Columns. Click a check box to display the column. Clear the check box to hide it.
Move Column. Click on a column heading and drag it to reorder your table's columns.

WhatsUp Gold User Guide
546
Advanced Filtering (on page 381).
Apply category, pattern, and keyword filtering to column data.
Choose time constraints for data view Control Purpose
Date Range (on page 944)
Choose or define an overall date range.
Business hours (on page 944)
Focus on specific days of the week and periods within each day. Reveal trends that are sensitive to business hours, time zones,
and other periodic attributes in the observed data.
Chart, adjust output, and visualize. Fine tune report presentation and range of values displayed using the Report Settings dialog (optional).
Specify threshold and top n: Control Purpose
Show Top n Items Limit items to the samples with the highest values.
Sort by Field Select a column to sort by (if applicable).
Chart and view options Control Purpose
View Options Select/clear the checkboxes to display/hide
Totals. Display totals for each column. Others. Remainder values that do not make the top n. Chart. Display the selected Chart Type. Legend. Include legend and grid lines for readability. Trend Lines. Present data a smoothed average to show trend.

WhatsUp Gold User Guide
547
Chart Type Select a chart type and associated options:
Pie. Pie distribution chart. Line/Area. Scatter graph that connects adjacent measurements with straight lines. Spline/Area Spline. Choose a graph with a smoothed appearance where adjacent samples exhibit a gradual slope. Vertical Bar/Horizontal Bar. Vertical or horizontal bar chart/histogram.
Note: The magnitudes of incoming and outgoing bandwidth utilization per interface are summed when presented in plotted
graphs and charted distributions .
Y-Axis Scale Scale Y-axis (chart and graph height) automatically or choose a fixed size.
Share, export, and save as PDF Most generated Top Endpoint Groups report data can be printed, shared, and exported when selecting Expand ( ) from the Dashboard Options ( ) menu. After the report has been expanded, select export ( ) to access the following options:
Export to PDF. Generate a PDF file of the report with user-defined page size and orientation.
Export Data. Export Top Endpoint Groups data (on page 951) and leverage outside of WhatsUp Gold.
Schedule Export. Set a recurring date and time, format, and email destination for report data export (on page 942).
Top Endpoints Top Endpoints reveals top endpoint devices with the greatest traffic volumes for the selected interval.
Understand column data The default view of each report contains a grid with the following columns:
Endpoint. Name of the source or destination endpoint device. Bytes. Combined (incoming/outgoing) number of bytes transferred. (Use Report
Settings Sort by option to rank the list by packet or flow count, not bytes.) Red ( ) indicates fraction received. Blue ( ) indicates fraction sent. (Mouse hover to display in/out summary.)

WhatsUp Gold User Guide
548
Bit Rate. Average bit rate, in total bits per second (bps). Byte Percentage. Percentage of the total traffic.
To display Flow and Packet measurements, click a column heading ( ) for column selection list ( ). You can also include:
Utilization. Fraction of total bandwidth capacity used. "N/A" denotes the measurement cannot be calculated because the bandwidth capability is unknown for the current interface.
IP Address. Endpoint's IP address. Hostname. Endpoint's hostname. Domain. Endpoint's domain.
Tip: To show reports in full screen with most if not all possible columns, click on report options ( ) menu and choose Expand ( ).
Generate a report Choose source. , Choose a networking device or single physical or virtual interface you want to see Top Endpoints measurements for. Choose traffic direction across an interface.
Use the Select Device dialog for one of the following:
Control Description
Device. Browse and choose a networking device that is a Network Traffic Analysis monitoring source.
Network Interface.
Choose a single physical or virtual interface Network Traffic Analysis you want traffic statistics for.
Choose direction of traffic over the network interface (Inbound, Outbound, Inbound and Outbound, or Bounce for invalid traffic.).
Choose time constraints. Choose times for the Top Endpoints.Choose, filter, and reorder columns. Choose and hide columns, reorder columns, and apply advanced filters (on page 381) to customize your data view.
Filter and pick by column
Click a report heading ( ) and use the "column picker" ( ) from the drop down list.
Control Purpose
Columns. Click a check box to display the column. Clear the check box to hide it.
Move Column. Click on a column heading and drag it to reorder your table's columns.

WhatsUp Gold User Guide
549
Advanced Filtering (on page 381).
Apply category, pattern, and keyword filtering to column data.
Choose time constraints for data view Control Purpose
Date Range (on page 944)
Choose or define an overall date range.
Business hours (on page 944)
Focus on specific days of the week and periods within each day. Reveal trends that are sensitive to business hours, time zones,
and other periodic attributes in the observed data.
Chart, adjust output, and visualize. Fine tune report presentation and range of values displayed using the Report Settings dialog (optional).
Specify threshold and top n: Control Purpose
Show Top n Items Limit items to the samples with the highest values.
Sort by Field Select a column to sort by (if applicable).
Chart and view options Control Purpose
View Options Select/clear the checkboxes to display/hide
Totals. Display totals for each column. Others. Remainder values that do not make the top n. Chart. Display the selected Chart Type. Legend. Include legend and grid lines for readability. Trend Lines. Present data a smoothed average to show trend.
WhatsUp Gold User Guide
550
Chart Type Select a chart type and associated options:
Pie. Pie distribution chart. Line/Area. Scatter graph that connects adjacent measurements with straight lines. Spline/Area Spline. Choose a graph with a smoothed appearance where adjacent samples exhibit a gradual slope. Vertical Bar/Horizontal Bar. Vertical or horizontal bar chart/histogram.
Note: The magnitudes of incoming and outgoing bandwidth utilization per interface are summed when presented in plotted
graphs and charted distributions .
Y-Axis Scale Scale Y-axis (chart and graph height) automatically or choose a fixed size.
Share, export, and save as PDF Most generated Top Endpoints report data can be printed, shared, and exported when selecting Expand ( ) from the Dashboard Options ( ) menu. After the report has been expanded, select export ( ) to access the following options:
Export to PDF. Generate a PDF file of the report with user-defined page size and orientation.
Export Data. Export Top Endpoints data (on page 951) and leverage outside of WhatsUp Gold.
Schedule Export. Set a recurring date and time, format, and email destination for report data export (on page 942).
ICMP Types ICMP Types report reveals the top ICMP (Internet Control Message Protocol) messages and errors for network interfaces associated with the device hosts you specify for the selected interval.
These reports are useful for identifying periods where your network is flooded with ICMP ping packets due to aberrant IP network clients or deliberate network activity that tries to swamp network resources or bandwidth capacity.
Understand column data The default view of each report contains a grid with the following columns:
ICMP type. ICMP message type (for example, Echo Request). Others indicates ICMP types not included in the top n.
Bytes. Number of bytes received with that error during the selected period.

WhatsUp Gold User Guide
551
Bit Rate. Average bit rate, in total bits per second (bps). Byte Percentage. Percentage of ICMP error type compared to other ICMP
errors during the selected period.
To display Flow and Packet measurements, click a column heading ( ) for column selection list ( ). You can also include:
Utilization. Bandwidth percentage used by the ICMP messages.
Generate a report Choose source. , Choose a networking device or single physical or virtual interface you want to see ICMP Types measurements for. Choose traffic direction across an interface.
Use the Select Device dialog for one of the following:
Control Description
Device. Browse and choose a networking device that is a Network Traffic Analysis monitoring source.
Network Interface.
Choose a single physical or virtual interface Network Traffic Analysis you want traffic statistics for.
Choose direction of traffic over the network interface (Inbound, Outbound, Inbound and Outbound, or Bounce for invalid traffic.).
Choose time constraints. Choose times for the ICMP Types.Choose, filter, and reorder columns. Choose and hide columns, reorder columns, and apply advanced filters (on page 381) to customize your data view.
Filter and pick by column
Click a report heading ( ) and use the "column picker" ( ) from the drop down list.
Control Purpose
Columns. Click a check box to display the column. Clear the check box to hide it.
Move Column. Click on a column heading and drag it to reorder your table's columns.
Advanced Filtering (on page 381).
Apply category, pattern, and keyword filtering to column data.

WhatsUp Gold User Guide
552
Choose time constraints for data view Control Purpose
Date Range (on page 944)
Choose or define an overall date range.
Business hours (on page 944)
Focus on specific days of the week and periods within each day. Reveal trends that are sensitive to business hours, time zones,
and other periodic attributes in the observed data.
Chart, adjust output, and visualize. Fine tune report presentation and range of values displayed using the Report Settings dialog (optional).
Specify threshold and top n: Control Purpose
Show Top n Items Limit items to the samples with the highest values.
Sort by Field Select a column to sort by (if applicable).
Chart and view options Control Purpose
View Options Select/clear the checkboxes to display/hide Totals. Display totals for each column. Others. Remainder values that do not make the top n. Chart. Display the selected Chart Type. Legend. Include legend and grid lines for readability. Trend Lines. Present data a smoothed average to show trend.
Chart Type Select a chart type and associated options: Pie. Pie distribution chart. Line/Area. Scatter graph that connects adjacent measurements
with straight lines. Spline/Area Spline. Choose a graph with a smoothed
appearance where adjacent samples exhibit a gradual slope. Vertical Bar/Horizontal Bar. Vertical or horizontal bar
chart/histogram. Y-Axis Scale Scale Y-axis (chart and graph height) automatically or choose a fixed size.
Share, export, and save as PDF Most generated ICMP Types report data can be printed, shared, and exported when selecting Expand ( ) from the Dashboard Options ( ) menu. After the report has been expanded, select export ( ) to access the following options:

WhatsUp Gold User Guide
553
Export to PDF. Generate a PDF file of the report with user-defined page size and orientation.
Export Data. Export ICMP Types data (on page 951) and leverage outside of WhatsUp Gold.
Schedule Export. Set a recurring date and time, format, and email destination for report data export (on page 942).
Top Interfaces by Traffic Top Interfaces by Traffic report reveals a ranked list of network interfaces with the most traffic for the selected interval. This is a useful tool for analyzing traffic symmetry.
Tip: Use Report Settings ( ) to display a graph that displays a side-by-side comparison of incoming and outgoing traffic volume.
Understand column data The default view of each report contains a grid with the following columns:
Interface. Device hostname, IP address, or custom label. Incoming Bytes. Traffic volume received on the interface. Incoming Rate. Total average rate of inbound traffic. Incoming Utilization. Fraction of total bandwidth capacity used. "N/A" denotes
the measurement cannot be calculated because the bandwidth capability is unknown for the current interface.
Outgoing Bytes. Total bytes transmitted from the interface. Outgoing Rate. Total average rate of outbound traffic. Outgoing Utilization. Fraction of bandwidth capacity used.
To display Flow and Packet measurements, click a column heading ( ) for column selection list ( ). You can also include:
Source Name. Device hostname, IP address, or custom label. Interface Name. Textual name of the interface (ifName). SNMP Index. Network interface SNMP table identifier (ifIndex). In Speed. Inbound hardware speed. Out Speed. Outbound hardware speed.
Tip: Interfaces with an index of 0 denote the NULL interface.

WhatsUp Gold User Guide
554
Generate a report Choose source. , Choose a networking device or single physical or virtual interface you want to see Top Interfaces by Traffic measurements for. Choose traffic direction across an interface.
Use the Select Device dialog for one of the following:
Control Description
Device. Browse and choose a networking device that is a Network Traffic Analysis monitoring source.
Network Interface.
Choose a single physical or virtual interface Network Traffic Analysis you want traffic statistics for.
Choose direction of traffic over the network interface (Inbound, Outbound, Inbound and Outbound, or Bounce for invalid traffic.).
Choose time constraints. Choose times for the Top Interfaces by Traffic.Choose, filter, and reorder columns. Choose and hide columns, reorder columns, and apply advanced filters (on page 381) to customize your data view.
Filter and pick by column
Click a report heading ( ) and use the "column picker" ( ) from the drop down list.
Control Purpose
Columns. Click a check box to display the column. Clear the check box to hide it.
Move Column. Click on a column heading and drag it to reorder your table's columns.
Advanced Filtering (on page 381).
Apply category, pattern, and keyword filtering to column data.
Choose time constraints for data view Control Purpose
Date Range (on page 944)
Choose or define an overall date range.
Business hours (on page 944)
Focus on specific days of the week and periods within each day. Reveal trends that are sensitive to business hours, time zones,
and other periodic attributes in the observed data.

WhatsUp Gold User Guide
555
Chart, adjust output, and visualize. Fine tune report presentation and range of values displayed using the Report Settings dialog (optional).
Specify threshold and top n: Control Purpose
Show Top n Items Limit items to the samples with the highest values.
Sort by Field Select a column to sort by (if applicable).
Chart and view options Control Purpose
View Options Select/clear the checkboxes to display/hide
Totals. Display totals for each column. Others. Remainder values that do not make the top n. Chart. Display the selected Chart Type. Legend. Include legend and grid lines for readability. Trend Lines. Present data a smoothed average to show trend.
Chart Type Select a chart type and associated options:
Pie. Pie distribution chart. Line/Area. Scatter graph that connects adjacent measurements with straight lines. Spline/Area Spline. Choose a graph with a smoothed appearance where adjacent samples exhibit a gradual slope. Vertical Bar/Horizontal Bar. Vertical or horizontal bar chart/histogram.
Note: The magnitudes of incoming and outgoing bandwidth utilization per interface are summed when presented in plotted
graphs and charted distributions .
Y-Axis Scale Scale Y-axis (chart and graph height) automatically or choose a fixed size.
Share, export, and save as PDF Most generated Top Interfaces by Traffic report data can be printed, shared, and exported when selecting Expand ( ) from the Dashboard Options ( ) menu. After the report has been expanded, select export ( ) to access the following options:
Export to PDF. Generate a PDF file of the report with user-defined page size and orientation.

WhatsUp Gold User Guide
556
Export Data. Export Top Interfaces by Traffic data (on page 951) and leverage outside of WhatsUp Gold.
Schedule Export. Set a recurring date and time, format, and email destination for report data export (on page 942).
Top Interfaces by Utilization Top Interfaces by Utilization report reveals a ranked list of network interfaces showing the highest percentages of capacity utilization for the selected interval. Ranked items display in order of maximum utilization (incoming and outgoing).
Understand column data The default view of each report contains a grid with the following columns:
Interface. Device hostname, IP address, or custom label. Incoming Bytes. Number of bytes received. (Use Report Settings Sort by
option to rank the list by packet or flow count, not bytes.) Incoming Rate. Total average rate of inbound traffic. Incoming Utilization. Fraction of total bandwidth capacity used. "N/A" denotes
the measurement cannot be calculated because the bandwidth capability is unknown for the current interface.
Outgoing Bytes. Number of bytes transmitted from the interface. Outgoing Rate. Total average rate of outbound traffic. Outgoing Utilization. Fraction of bandwidth capacity used.
To display Flow and Packet measurements, click a column heading ( ) for column selection list ( ). You can also include:
More columns... Source Name. Name or IP address of origin host device. Interface Name. Textual name of the interface (ifName). SNMP Index. Network interface SNMP table identifier (ifIndex). Packets. Percentage of the total traffic. Packet Rate. Average packet rate. Packet Percentage. Percent of packets for this category. Flows. Total number of flow messages. Flow Rate. Rate at which WhatsUp Gold receives measurements observed at
the device. Flow Percentage. Percentage of total measurement for samples received. Incoming Utilization. Percentage of interface usage needed for incoming
traffic. Outgoing Utilization Percentage of interface usage needed for outgoing traffic.

WhatsUp Gold User Guide
557
Generate a report Choose source. , Choose a networking device or single physical or virtual interface you want to see Top Interfaces by Utilization measurements for. Choose traffic direction across an interface.
Use the Select Device dialog for one of the following:
Control Description
Device. Browse and choose a networking device that is a Network Traffic Analysis monitoring source.
Network Interface.
Choose a single physical or virtual interface Network Traffic Analysis you want traffic statistics for.
Choose direction of traffic over the network interface (Inbound, Outbound, Inbound and Outbound, or Bounce for invalid traffic.).
Choose time constraints. Choose times for the Top Interfaces by Utilization.Choose, filter, and reorder columns. Choose and hide columns, reorder columns, and apply advanced filters (on page 381) to customize your data view.
Filter and pick by column
Click a report heading ( ) and use the "column picker" ( ) from the drop down list.
Control Purpose
Columns. Click a check box to display the column. Clear the check box to hide it.
Move Column. Click on a column heading and drag it to reorder your table's columns.
Advanced Filtering (on page 381).
Apply category, pattern, and keyword filtering to column data.
Choose time constraints for data view Control Purpose
Date Range (on page 944)
Choose or define an overall date range.
Business hours (on page 944)
Focus on specific days of the week and periods within each day. Reveal trends that are sensitive to business hours, time zones,
and other periodic attributes in the observed data.

WhatsUp Gold User Guide
558
Chart, adjust output, and visualize. Fine tune report presentation and range of values displayed using the Report Settings dialog (optional).
Specify threshold and top n: Control Purpose
Show Top n Items Limit items to the samples with the highest values.
Sort by Field Select a column to sort by (if applicable).
Chart and view options Control Purpose
View Options Select/clear the checkboxes to display/hide
Totals. Display totals for each column. Others. Remainder values that do not make the top n. Chart. Display the selected Chart Type. Legend. Include legend and grid lines for readability. Trend Lines. Present data a smoothed average to show trend.
Chart Type Select a chart type and associated options:
Pie. Pie distribution chart. Line/Area. Scatter graph that connects adjacent measurements with straight lines. Spline/Area Spline. Choose a graph with a smoothed appearance where adjacent samples exhibit a gradual slope. Vertical Bar/Horizontal Bar. Vertical or horizontal bar chart/histogram.
Note: The magnitudes of incoming and outgoing bandwidth utilization per interface are summed when presented in plotted
graphs and charted distributions .
Y-Axis Scale Scale Y-axis (chart and graph height) automatically or choose a fixed size.
Share, export, and save as PDF Most generated Top Interfaces by Utilization report data can be printed, shared, and exported when selecting Expand ( ) from the Dashboard Options ( ) menu. After the report has been expanded, select export ( ) to access the following options:
Export to PDF. Generate a PDF file of the report with user-defined page size and orientation.

WhatsUp Gold User Guide
559
Export Data. Export Top Interfaces by Utilization data (on page 951) and leverage outside of WhatsUp Gold.
Schedule Export. Set a recurring date and time, format, and email destination for report data export (on page 942).
Top Sources with Interfaces Top Sources with Interfaces reveals interface metrics grouped by the flow source that exports them.
Identifying data transfer rate and capacity utilization from specific points on your network enables you to:
Identify packet choke points by checking where send or receive utilization is close to capacity.
Plan scaling and build out periods. Track high traffic routes over time. Sanity check load balancing and track ToS-specific policies applied at routers. Localize disruptive traffic to a specific router or interface. Drill down into specific flow sources and configuration properties ( ) of a
particular network interface. Be proactive.
Understand column data The default view of each report contains a grid with the following columns:
Interface. Device hostname, IP address, or custom label grouped by Source with Ethernet port index. Index of 0 denotes the NULL interface.
Incoming Bytes. Number of bytes received. (Use Report Settings Sort by option to rank the list by packet or flow count, not bytes.)
Incoming Rate. Total average rate of inbound traffic. Incoming Utilization. Fraction of total bandwidth capacity used. "N/A" denotes
the measurement cannot be calculated because the bandwidth capability is unknown for the current interface.
Outgoing Bytes. Total bytes transmitted from the interface. Outgoing Rate. Total average rate of outbound traffic.
To display Flow and Packet measurements, click a column heading ( ) for column selection list ( ). You can also include:
Source Name. Device hostname, IP address, or custom label. Interface Name. Textual name of the interface (ifName). SNMP Index. Network interface SNMP table identifier (ifIndex). In Speed. Inbound hardware speed. Out Speed. Outbound hardware speed.
WhatsUp Gold User Guide
560
Tip: To show reports in full screen with most if not all possible columns, click on report options ( ) menu and choose Expand ( ).
Generate a report Choose source. , Choose a networking device or single physical or virtual interface you want to see Top Sources with Interfaces measurements for. Choose traffic direction across an interface.
Use the Select Device dialog for one of the following:
Control Description
Device. Browse and choose a networking device that is a Network Traffic Analysis monitoring source.
Network Interface.
Choose a single physical or virtual interface Network Traffic Analysis you want traffic statistics for.
Choose direction of traffic over the network interface (Inbound, Outbound, Inbound and Outbound, or Bounce for invalid traffic.).
Choose time constraints. ( , ) Choose times for the Top Sources with Interfaces. (For recently observed measurements, select Last Polled from the Date Range drop down list.)
Choose time constraints for data view Control Purpose
Date Range (on page 944)
Choose or define an overall date range.
Business hours (on page 944)
Focus on specific days of the week and periods within each day. Reveal trends that are sensitive to business hours, time zones,
and other periodic attributes in the observed data.
Filter and reduce by row and by column. Sort and remove columns, group rows based on specific column values, and remove unwanted information from the table.
Filter and pick by column
Click a report heading and use the following from the drop down list:
Control Purpose
Sort. Sort column in ascending or descending order.

WhatsUp Gold User Guide
561
Columns. Pick the columns you want to view. Click a check box to display the column. Clear the check box to hide it.
Group by this field.
Group table into collapsible rows wherever the current column contains identical data ("field") values.
Filters. Provide a keyword to view only rows that contain the keyword for this column.
Chart, adjust output, and visualize. Fine tune report presentation and range of values displayed using the Report Settings dialog (optional).
Specify threshold and top n: Control Purpose
Show Top n Items Limit items to the samples with the highest values.
Sort by Field Select a column to sort by (if applicable).
Chart and view options Control Purpose
View Options Select/clear the checkboxes to display/hide Totals. Display totals for each column. Others. Remainder values that do not make the top n. Chart. Display the selected Chart Type. Legend. Include legend and grid lines for readability. Trend Lines. Present data a smoothed average to show trend.
Chart Type Select a chart type and associated options: Pie. Pie distribution chart. Line/Area. Scatter graph that connects adjacent measurements
with straight lines. Spline/Area Spline. Choose a graph with a smoothed
appearance where adjacent samples exhibit a gradual slope. Vertical Bar/Horizontal Bar. Vertical or horizontal bar
chart/histogram. Y-Axis Scale Scale Y-axis (chart and graph height) automatically or choose a fixed size.

WhatsUp Gold User Guide
562
Share, export, and save as PDF Most generated Top Sources with Interfaces report data can be printed, shared, and exported when selecting Expand ( ) from the Dashboard Options ( ) menu. After the report has been expanded, select export ( ) to access the following options:
Export to PDF. Generate a PDF file of the report with user-defined page size and orientation.
Export Data. Export Top Sources with Interfaces data (on page 951) and leverage outside of WhatsUp Gold.
Schedule Export. Set a recurring date and time, format, and email destination for report data export (on page 942).
Traffic Totals Traffic Totals report reveals incoming and outgoing traffic and bandwidth totals for the selected interval.
Understand column data The default view of each report contains a grid with the following columns:
Traffic Direction. Incoming or Outgoing. 95th Percentile. Metrics that include only the 95th percentile. Top 5% inbound
and outbound peaks are clipped and discarded. Maximum. Peak value. Bytes. Combined (incoming/outgoing) number of bytes transferred. (Use Report
Settings Sort by option to rank the list by packet or flow count, not bytes.) Bit Rate. Total average bit rate. Byte Percentage. Percentage of total bandwidth.
To display Flow and Packet measurements, click a column heading ( ) for column selection list ( ). You can also include:
Utilization. Fraction of total bandwidth capacity used. "N/A" denotes the measurement cannot be calculated because the bandwidth capability is unknown for the current interface.
Generate a report Choose source. , Choose a networking device or single physical or virtual interface you want to see Traffic Totals measurements for. Choose traffic direction across an interface.
Use the Select Device dialog for one of the following:
Control Description
Device. Browse and choose a networking device that is a Network Traffic Analysis monitoring source.

WhatsUp Gold User Guide
563
Network Interface.
Choose a single physical or virtual interface Network Traffic Analysis you want traffic statistics for.
Choose direction of traffic over the network interface (Inbound, Outbound, Inbound and Outbound, or Bounce for invalid traffic.).
Choose time constraints. ( , ) Choose times for the Traffic Totals. (For recently observed measurements, select Last Polled from the Date Range drop down list.)
Choose time constraints for data view Control Purpose
Date Range (on page 944)
Choose or define an overall date range.
Business hours (on page 944)
Focus on specific days of the week and periods within each day. Reveal trends that are sensitive to business hours, time zones,
and other periodic attributes in the observed data.
Filter and reduce by row and by column. Sort and remove columns, group rows based on specific column values, and remove unwanted information from the table.
Filter and pick by column
Click a report heading and use the following from the drop down list:
Control Purpose
Sort. Sort column in ascending or descending order.
Columns. Pick the columns you want to view. Click a check box to display the column. Clear the check box to hide it.
Group by this field.
Group table into collapsible rows wherever the current column contains identical data ("field") values.
Filters. Provide a keyword to view only rows that contain the keyword for this column.

WhatsUp Gold User Guide
564
Chart, adjust output, and visualize. Fine tune report presentation and range of values displayed using the Report Settings dialog (optional).
Specify threshold and top n: Control Purpose
Show Top n Items Limit items to the samples with the highest values.
Sort by Field Select a column to sort by (if applicable).
Chart and view options Control Purpose
View Options Select/clear the checkboxes to display/hide Totals. Display totals for each column. Others. Remainder values that do not make the top n. Chart. Display the selected Chart Type. Legend. Include legend and grid lines for readability. Trend Lines. Present data a smoothed average to show trend.
Chart Type Select a chart type and associated options: Pie. Pie distribution chart. Line/Area. Scatter graph that connects adjacent measurements
with straight lines. Spline/Area Spline. Choose a graph with a smoothed
appearance where adjacent samples exhibit a gradual slope. Vertical Bar/Horizontal Bar. Vertical or horizontal bar
chart/histogram. Y-Axis Scale Scale Y-axis (chart and graph height) automatically or choose a fixed size.
Share, export, and save as PDF Most generated Traffic Totals report data can be printed, shared, and exported when selecting Expand ( ) from the Dashboard Options ( ) menu. After the report has been expanded, select export ( ) to access the following options:
Export to PDF. Generate a PDF file of the report with user-defined page size and orientation.
Export Data. Export Traffic Totals data (on page 951) and leverage outside of WhatsUp Gold.
Schedule Export. Set a recurring date and time, format, and email destination for report data export (on page 942).
Unclassified Traffic Unclassified Traffic report reveals IP network traffic that uses ports outside of the well-known (https://www.ietf.org/rfc/rfc1700.txt) port range or has not otherwise been identified for the selected interval. Network Traffic Analysis considers traffic unclassified

WhatsUp Gold User Guide
565
if both source and destination ports cannot be identified or are outside the IETF well-known range.
Each log message record contains the following data columns:
Date. Date and time for the event message. Sender IP. IP address of the source device. Sender Port. Source device port number on which the traffic is flowing. Receiver IP. IP address of the destination device. Receiver Port. Destination device port number on which the traffic is flowing. Protocol. Protocol used by the traffic; either TCP, UDP, SCTP, or DCCP. Bytes. Combined (incoming/outgoing) number of bytes transferred. (Use Report
Settings Sort by option to rank the list by packet or flow count, not bytes.) Bit Rate. Total average bit rate.
To display Flow and Packet measurements, click a column heading ( ) for column selection list ( ). You can also include:
Receiver Hostname. Name of the destination device. Sender Hostname. Name of the origin device.
Generate a report Choose source. , Choose a networking device or single physical or virtual interface you want to see Unclassified Traffic measurements for. Choose traffic direction across an interface.
Use the Select Device dialog for one of the following:
Control Description
Device. Browse and choose a networking device that is a Network Traffic Analysis monitoring source.
Network Interface.
Choose a single physical or virtual interface Network Traffic Analysis you want traffic statistics for.
Choose direction of traffic over the network interface (Inbound, Outbound, Inbound and Outbound, or Bounce for invalid traffic.).
Choose time constraints. Choose times for the Unclassified Traffic.Choose, filter, and reorder columns. Choose and hide columns, reorder columns, and apply advanced filters (on page 381) to customize your data view.
Filter and pick by column
Click a report heading ( ) and use the "column picker" ( ) from the drop down list.

WhatsUp Gold User Guide
566
Control Purpose
Columns. Click a check box to display the column. Clear the check box to hide it.
Move Column. Click on a column heading and drag it to reorder your table's columns.
Advanced Filtering (on page 381).
Apply category, pattern, and keyword filtering to column data.
Choose time constraints for data view Control Purpose
Date Range (on page 944)
Choose or define an overall date range.
Business hours (on page 944)
Focus on specific days of the week and periods within each day. Reveal trends that are sensitive to business hours, time zones,
and other periodic attributes in the observed data.
Chart, adjust output, and visualize. Fine tune report presentation and range of values displayed using the Report Settings dialog (optional).
Specify threshold and top n: Control Purpose
Show Top n Items Limit items to the samples with the highest values.
Sort by Field Select a column to sort by (if applicable).
Chart and view options Control Purpose
View Options Select/clear the checkboxes to display/hide Totals. Display totals for each column. Others. Remainder values that do not make the top n. Chart. Display the selected Chart Type. Legend. Include legend and grid lines for readability. Trend Lines. Present data a smoothed average to show trend.

WhatsUp Gold User Guide
567
Chart Type Select a chart type and associated options: Pie. Pie distribution chart. Line/Area. Scatter graph that connects adjacent measurements
with straight lines. Spline/Area Spline. Choose a graph with a smoothed
appearance where adjacent samples exhibit a gradual slope. Vertical Bar/Horizontal Bar. Vertical or horizontal bar
chart/histogram. Y-Axis Scale Scale Y-axis (chart and graph height) automatically or choose a fixed size.
Share, export, and save as PDF Most generated Unclassified Traffic report data can be printed, shared, and exported when selecting Expand ( ) from the Dashboard Options ( ) menu. After the report has been expanded, select export ( ) to access the following options:
Export to PDF. Generate a PDF file of the report with user-defined page size and orientation.
Export Data. Export Unclassified Traffic data (on page 951) and leverage outside of WhatsUp Gold.
Schedule Export. Set a recurring date and time, format, and email destination for report data export (on page 942).
Class-Based QoS Usage Class-Based QoS Usage report reveals class-based quality of service (CBQoS) metrics within your network, where "class" denotes a traffic stream that can be identified by different criteria such as interface, port, and so on. This report indicates the effectiveness of class-based policies applied for specific traffic classes, which are used to prioritize and shape network traffic patterns. Note that class-based polices can be applied to specific interfaces and traffic direction.
Class-Based QoS Usage chart data reflect the following:
QoS Class Map. Displays the QoS class name as defined by the policy assigned to the interface.
Pre-Policy. Displays the amount of traffic for the class before the policy is applied (for the selected date range).
Post-Policy. Displays the amount of traffic for the class after the policy is applied (for the selected date range).
Dropped. Displays the number of bytes dropped as a result of applying the policy to the class (for the selected date range).
Understand column data The default view of each report contains a grid with the following columns:

WhatsUp Gold User Guide
568
QoS Class. Traffic class. Policy. Policy applied. Definition. Policy rules. Source. Flow source. Interface. Network interface. Direction. Traffic direction across the interface (In/Out). Bounced traffic is not
considered. Pre Policy. Pre-policy bandwidth. Pre Policy Rate. Pre-policy observed rate. Post Policy. Post-policy bandwidth. Post Policy Rate. Post policy observed rate. Dropped. Dropped volume. Dropped Rate. Rate observed where traffic was dropped.
Note: You must have defined QoS classes and policies on the source device before this report is able to display results.
Note: The CBQoS information generated by the source device must be gathered using SNMP polling for CBQoS information.
Generate a report Choose source. , Choose a networking device or single physical or virtual interface you want to see Class-Based QoS Usage measurements for. Choose traffic direction across an interface.
Use the Select Device dialog for one of the following:
Control Description
Device. Browse and choose a networking device that is a Network Traffic Analysis monitoring source.
Network Interface.
Choose a single physical or virtual interface Network Traffic Analysis you want traffic statistics for.
Choose direction of traffic over the network interface (Inbound, Outbound, Inbound and Outbound, or Bounce for invalid traffic.).

WhatsUp Gold User Guide
569
Choose time constraints. Choose times for the Class-Based QoS Usage.Choose, filter, and reorder columns. Choose and hide columns, reorder columns, and apply advanced filters (on page 381) to customize your data view.
Filter and pick by column
Click a report heading ( ) and use the "column picker" ( ) from the drop down list.
Control Purpose
Columns. Click a check box to display the column. Clear the check box to hide it.
Move Column. Click on a column heading and drag it to reorder your table's columns.
Advanced Filtering (on page 381).
Apply category, pattern, and keyword filtering to column data.
Choose time constraints for data view Control Purpose
Date Range (on page 944)
Choose or define an overall date range.
Business hours (on page 944)
Focus on specific days of the week and periods within each day. Reveal trends that are sensitive to business hours, time zones,
and other periodic attributes in the observed data.
Chart, adjust output, and visualize. Fine tune report presentation and range of values displayed using the Report Settings dialog (optional).
Specify threshold and top n: Control Purpose
Show Top n Items Limit items to the samples with the highest values.
Sort by Field Select a column to sort by (if applicable).

WhatsUp Gold User Guide
570
Chart and view options Control Purpose
View Options Select/clear the checkboxes to display/hide Totals. Display totals for each column. Others. Remainder values that do not make the top n. Chart. Display the selected Chart Type. Legend. Include legend and grid lines for readability. Trend Lines. Present data a smoothed average to show trend.
Chart Type Select a chart type and associated options: Pie. Pie distribution chart. Line/Area. Scatter graph that connects adjacent measurements
with straight lines. Spline/Area Spline. Choose a graph with a smoothed
appearance where adjacent samples exhibit a gradual slope. Vertical Bar/Horizontal Bar. Vertical or horizontal bar
chart/histogram. Y-Axis Scale Scale Y-axis (chart and graph height) automatically or choose a fixed size.
Share, export, and save as PDF Most generated Class-Based QoS Usage report data can be printed, shared, and exported when selecting Expand ( ) from the Dashboard Options ( ) menu. After the report has been expanded, select export ( ) to access the following options:
Export to PDF. Generate a PDF file of the report with user-defined page size and orientation.
Export Data. Export Class-Based QoS Usage data (on page 951) and leverage outside of WhatsUp Gold.
Schedule Export. Set a recurring date and time, format, and email destination for report data export (on page 942).

571
CHAPTER 25
Performance In This Chapter CPU Utilization ..................................................................... 571
Custom Performance Monitor ............................................... 574
Disk Free Space ................................................................... 577
Disk Utilization ...................................................................... 580
Interface Discards ................................................................. 583
Interface Errors ..................................................................... 587
Interface Traffic ..................................................................... 590
Interface Utilization ............................................................... 593
Memory Utilization ................................................................ 596
Ping Availability .................................................................... 600
Ping Packet Loss .................................................................. 603
Ping Response Time ............................................................ 605
CPU Utilization CPU Utilization reports present each processor load and idle time for one or more host devices. These reports help you to visualize the demand for processing resources, identify peak periods, and help troubleshoot and denote 'root cause' for incidents involving CPU exhaustion.
Understand column data The default view of each report contains a grid with the following columns:
(Report Options). Jump to a detailed dashboard or control panel for: Device Properties (on page 86).
Device Status (on page 417).
RealTime Performance Monitor (on page 788). Device. Device hostname, IP address, or custom label. CPU. Device name/CPU type (CPU index in parenthesis). % Avg. Average CPU load percentage for the selected period. % Min. Minimum CPU load percentage observed for the selected period.

WhatsUp Gold User Guide
572
% Max. Maximum CPU load percentage observed for the selected period. Last Poll. Duration since last sample.
Note: This report returns CPU Utilization metrics for devices that already have the appropriate performance monitoring enabled. To enable these polled measurements, see CPU Utilization Monitor.
Generate a report Choose Device. Choose one or more host devices you want CPU Utilization measurements for. (Virtual machines show only allocated resources)
Use the Select Device dialog for one of the following:
Control Purpose
Device Browse and choose a single device.
Device Group
Choose an existing group of one or more devices. You can also create custom or dynamic groups.
Note: You can organize devices into custom or dynamic groups. For more information, see Grouping Devices (on page 242).
Tip: If a device is identified as a virtual machine, Hyper-V or VMware credentials will be used to retrieve data and only those physical resources allocated to the virtual machine will be visible in the report.
Choose time constraints. ( , ) Choose times for the CPU Utilization. (For recently observed measurements, select Last Polled from the Date Range drop down list.)
Choose time constraints for data view Control Purpose
Date Range (on page 944)
Choose or define an overall date range.
Business hours (on page 944)
Focus on specific days of the week and periods within each day. Reveal trends that are sensitive to business hours, time zones,
and other periodic attributes in the observed data.

WhatsUp Gold User Guide
573
Sort and pick columns. Sort and pick columns.
Filter and pick by column
Click a report heading and use the following from the drop down list:
Control Purpose
Sort. Sort column in ascending or descending order.
Columns. Pick the columns you want to view. Click a check box to display the column. Clear the check box to hide it.
Chart, adjust output, and visualize. Fine tune report presentation and range of values displayed using the Report Setting dialog (optional).
Specify threshold and top n: Control Purpose
Show Top n Items Limit items to the samples with the highest (or lowest) latency.
Threshold Type Switch between minimum or maximum mode for cutoff values for the ranked list.
At or Over. Show peak usage period. (Latency percentage equal to or greater than Threshold.)
At or Under. Show usage periods where resources are unused or possibly down. (Latency percentage equal to or less than Threshold.)
Threshold (percent)
Baseline value used to trim ranked device list based on peak or subpeak capacity when returning the Top n.
Chart and visualize data over time (single host device ) Charting and visualization is available when you select a single device.
Control Purpose
Display Options Present data as a chart, a table grid, or both.
Chart Type Gauge charts . Available when you select a Date Range of Last Polled .
Time series . Available when you select a Date Range interval (Today , for example).
Line/Area. Scatter graph that connects adjacent measurements with straight lines.
Spline/Area Spline. Choose a graph with a smoothed appearance where adjacent samples exhibit a gradual slope.

WhatsUp Gold User Guide
574
Chart Options Legend, Grid Lines, Range Selector. Include legend, grid lines, and range selector for readability.
Trend Lines. Present data with a smoothed average to show trend.
Tip: Trend lines represent a moving average that can be compared with line and area graphs to reveal peak and sub peak intervals.
Note: This report only returns CPU Utilization metrics for devices that already have the appropriate WMI or SNMP credentials. For more information, see Using Credentials.
Share, export, and save as PDF Most generated CPU Utilization report data can be printed, shared, and exported when selecting Expand ( ) from the Dashboard Options ( ) menu. After the report has been expanded, select export ( ) to access the following options:
Export to PDF. Generate a PDF file of the report with user-defined page size and orientation.
Export Data. Export CPU Utilization data (on page 951) and leverage outside of WhatsUp Gold.
Schedule Export. Set a recurring date and time, format, and email destination for report data export (on page 942).
Custom Performance Monitor Custom Performance Monitor report reveals measurements for your custom performance monitor.
Understand column data The default view of each report contains a grid with the following columns:
(Report Options). Jump to a detailed dashboard or control panel for: Device Properties (on page 86).
Device Status (on page 105).
RealTime Performance Monitor (on page 788). Device. Device identifier. Monitor. Name of monitor. Avg. Average monitor value for the specified time period. Min. Minimum monitor value observed. Max. Maximum monitor value observed. Last Poll. Duration since last sample.

WhatsUp Gold User Guide
575
Generate a report Choose Device. Choose one or more host devices you want Custom Performance Monitor measurements for.
Use the Select Device dialog for one of the following:
Control Purpose
Device Browse and choose a single device.
Single Interface
Choose an interface on a device.
Device Group
Choose an existing group of one or more devices. You can also create custom or dynamic groups.
Note: You can organize devices into custom or dynamic groups. For more information, see Grouping Devices (on page 242).
Choose time constraints. ( , ) Choose times for the Custom Performance Monitor. (For recently observed measurements, select Last Polled from the Date Range drop down list.)
Choose time constraints for data view Control Purpose
Date Range (on page 944)
Choose or define an overall date range.
Business hours (on page 944)
Focus on specific days of the week and periods within each day. Reveal trends that are sensitive to business hours, time zones,
and other periodic attributes in the observed data.
Filter and reduce by row and by column. Sort and remove columns, group rows based on specific column values, and remove unwanted information from the table.
Filter and pick by column
Click a report heading and use the following from the drop down list:
Control Purpose
Sort. Sort column in ascending or descending order.
Columns. Pick the columns you want to view. Click a check box to display the column. Clear the check box to hide it.

WhatsUp Gold User Guide
576
Group by this field.
Group table into collapsible rows wherever the current column contains identical data ("field") values.
Filters. Provide a keyword to view only rows that contain the keyword for this column.
Chart, adjust output, and visualize. Fine tune report presentation and range of values displayed using the Report Settings dialog (optional).
Specify threshold and top n: Control Purpose
Show Top n Items Limit items to the samples with the highest (or lowest) utilization.
Threshold Type Switch between minimum or maximum mode for cutoff values for the ranked list.
At or Over. Show peak usage period. (Utilization percentage equal to or greater than Threshold.)
At or Under. Show usage periods where resources are unused or possibly down. (Utilization percentage equal to or less than Threshold.)
Threshold (percent)
Baseline value used to trim ranked device list based on peak or subpeak capacity when returning the Top n.
Chart and visualize data over time (single device ) Charting and visualization is available when you select a single device.
Control Purpose
Display Options Present data as a chart, a table grid, or both.
Chart Type Gauge charts. Available when you select a Date Range of Last Polled .
Time series. Available when you select a Date Range interval (Today , for example).
Line/Area. Scatter graph that connects adjacent measurements with straight lines.
Spline/Area Spline. Choose a graph with a smoothed appearance where adjacent samples exhibit a gradual slope.
Chart Options Legend, Grid Lines, Range Selector. Include legend, grid lines, and range selector for readability.
Trend Lines. Present data with a smoothed average to show trend.

WhatsUp Gold User Guide
577
Tip: Trend lines represent a moving average that can be compared with line and area graphs to reveal peak and sub peak intervals, periods of burstiness, latency, and interruption.
Note: This report only returns Custom Performance Monitor metrics for devices that already have the appropriate WMI or SNMP credentials. For more information, see Using Credentials.
Note: If a device group is selected, you can also filter the Custom Performance Monitor report to display data for an individual custom performance monitor.
Tip: For certain custom monitor types (VoIP SLA, for example) you have another way to filter or reduce the row data displayed. For these scenarios, use the Custom Performance Monitor Selection table in Report Settings to hide/reveal monitor rows from the report table.
Share, export, and save as PDF Most generated Custom Performance Monitor report data can be printed, shared, and exported when selecting Expand ( ) from the Dashboard Options ( ) menu. After the report has been expanded, select export ( ) to access the following options:
Export to PDF. Generate a PDF file of the report with user-defined page size and orientation.
Export Data. Export Custom Performance Monitor data (on page 951) and leverage outside of WhatsUp Gold.
Schedule Export. Set a recurring date and time, format, and email destination for report data export (on page 942).
Disk Free Space Disk Free Space reports compare disk storage capacity to actual utilization for devices with on-disk storage. These reports are useful for assessing current needs and predicting future trends for storage resources.
Understand column data The default view of each report contains a grid with the following columns:
(Report Options). Jump to a detailed dashboard or control panel for: Device Properties (on page 86).
Device Status (on page 417). Device. Network device name. Disk. Disk name and index. Size. Disk capacity. Free. Free space on the drive. Last Poll. Duration since last sample.

WhatsUp Gold User Guide
578
Generate a report Choose Device. Choose one or more host devices you want Disk Free Space measurements for.
Use the Select Device dialog for one of the following:
Control Description
Device Table/chart(s) of disks and usage metrics. Choose a single device to display all disks and their capacity usage.
Device Group
Ranked list. Choose to return the top-ranked disk with respect to capacity usage for each device in the selected group. You can also create custom or dynamic groups.
Network Ranked list. Choose to display the top-ranked disk with respect to capacity usage for each WhatsUp Gold managed device.
Note: You can organize devices into custom or dynamic groups. For more information, see Grouping Devices (on page 242).
Choose time constraints. ( , ) Choose times for the Disk Free Space. (For recently observed measurements, select Last Polled from the Date Range drop down list.)
Choose time constraints for data view Control Purpose
Date Range (on page 944)
Choose or define an overall date range.
Business hours (on page 944)
Focus on specific days of the week and periods within each day. Reveal trends that are sensitive to business hours, time zones,
and other periodic attributes in the observed data.
Choose, filter, and reorder columns. Choose and hide columns, reorder columns, and customize your data view.
Filter and pick by column
Click a report heading ( ) and use the "column picker" ( ) from the drop down list.
Control Purpose
Columns. Click a check box to display the column. Clear the check box to hide it.
Move Column. Click on a column heading and drag it to reorder your table's columns.

WhatsUp Gold User Guide
579
Chart, adjust output, and visualize. Fine tune report presentation and range of values displayed using the Report Setting dialog (optional).
Specify threshold and top n: Control Purpose
Show Top n Items Limit items to the samples with the highest (or lowest) latency.
Threshold Type Switch between minimum or maximum mode for cutoff values for the ranked list.
At or Over. Show peak usage period. (Latency percentage equal to or greater than Threshold.)
At or Under. Show usage periods where resources are unused or possibly down. (Latency percentage equal to or less than Threshold.)
Threshold (percent)
Baseline value used to trim ranked device list based on peak or subpeak capacity when returning the Top n.
Chart and visualize data over time (single host device ) Charting and visualization is available when you select a single device.
Control Purpose
Display Options Present data as a chart, a table grid, or both.
Chart Type Gauge charts . Available when you select a Date Range of Last Polled .
Time series . Available when you select a Date Range interval (Today , for example).
Line/Area. Scatter graph that connects adjacent measurements with straight lines.
Spline/Area Spline. Choose a graph with a smoothed appearance where adjacent samples exhibit a gradual slope.
Chart Options Legend, Grid Lines, Range Selector. Include legend, grid lines, and range selector for readability.
Trend Lines. Present data with a smoothed average to show trend.
Tip: Trend lines represent a moving average that can be compared with line and area graphs to reveal peak and sub peak intervals.

WhatsUp Gold User Guide
580
Share, export, and save as PDF Most generated Disk Free Space report data can be printed, shared, and exported when selecting Expand ( ) from the Dashboard Options ( ) menu. After the report has been expanded, select export ( ) to access the following options:
Export to PDF. Generate a PDF file of the report with user-defined page size and orientation.
Export Data. Export Disk Free Space data (on page 951) and leverage outside of WhatsUp Gold.
Schedule Export. Set a recurring date and time, format, and email destination for report data export (on page 942).
Disk Utilization Disk Utilization reports compare disk storage capacity to actual utilization for devices with on-disk storage. These reports are useful for assessing current needs and predicting future trends for storage resources.
(Report Options). Jump to a detailed dashboard or control panel for: Device Properties (on page 86).
Device Status (on page 417).
RealTime Performance Monitor (on page 788). Device. Device hostname/IP address. Disk. Disk label (device index in parenthesis). Size. Disk capacity. % Used. Average percent of disk used for the selected date range. For
understanding how to report the freshest measurements for storage associated with virtual machines, see VM considerations.
Tip: If you want to return disk utilization metrics for a Hyper-V guest VM, you must enable the VM to record WMI or SNMP metrics as described in a community article (https://community.ipswitch.com/s/article/Disk-Utilization-Information-may-not-be-available-when-using-HyperV-with-Virtual-Monitoring) titled Hyper-V Disk Utilization Information May Not Be Available. Outside of this requirement, Virtual Monitoring also includes read/write metrics in the Virtual Machines Disk Activity (on page 710) report.
To display additional measurements, click a column heading ( ) for column selection ( ). You can also include:
% Min. Minimum percent used for the selected date range. % Max. Maximum percent disk used for the selected date range. Avg. Average disk space used since polling began.

WhatsUp Gold User Guide
581
Min. Minimum disk space used since polling began. Max. Maximum disk space used since polling began. Avg Free. Average free space since polling began. Last Poll. Duration since last sample.
Generate a report Choose Device. Choose one or more host devices you want Disk Utilization measurements for.
Use the Select Device dialog for one of the following:
Control Description
Device Table/chart(s) of disks and usage metrics. Choose a single device to display all disks and their capacity usage.
Device Group
Ranked list. Choose to return the top-ranked disk with respect to capacity usage for each device in the selected group. You can also create custom or dynamic groups.
Network Ranked list. Choose to display the top-ranked disk with respect to capacity usage for each WhatsUp Gold managed device.
Note: You can organize devices into custom or dynamic groups. For more information, see Grouping Devices (on page 242).
Choose time constraints. ( , ) Choose times for the Disk Utilization. (For recently observed measurements, select Last Polled from the Date Range drop down list.)
Choose time constraints for data view Control Purpose
Date Range (on page 944)
Choose or define an overall date range.
Business hours (on page 944)
Focus on specific days of the week and periods within each day. Reveal trends that are sensitive to business hours, time zones,
and other periodic attributes in the observed data.
Choose, filter, and reorder columns. Choose and hide columns, reorder columns, and customize your data view.
Filter and pick by column
Click a report heading ( ) and use the "column picker" ( ) from the drop down list.

WhatsUp Gold User Guide
582
Control Purpose
Columns. Click a check box to display the column. Clear the check box to hide it.
Move Column. Click on a column heading and drag it to reorder your table's columns.
Chart, adjust output, and visualize. Fine tune report presentation and range of values displayed using the Report Settings dialog (optional).
Specify threshold and top n: Control Purpose
Show Top n Items Limit items to the samples with the highest (or lowest) utilization.
Threshold Type Switch between minimum or maximum mode for cutoff values for the ranked list.
At or Over. Show peak usage period. (Utilization percentage equal to or greater than Threshold.)
At or Under. Show usage periods where resources are unused or possibly down. (Utilization percentage equal to or less than Threshold.)
Threshold (percent)
Baseline value used to trim ranked device list based on peak or subpeak capacity when returning the Top n.
Chart and visualize data over time (single device ) Charting and visualization is available when you select a single device.
Control Purpose
Display Options Present data as a chart, a table grid, or both.
Chart Type Gauge charts. Available when you select a Date Range of Last Polled .
Time series. Available when you select a Date Range interval (Today , for example).
Line/Area. Scatter graph that connects adjacent measurements with straight lines.
Spline/Area Spline. Choose a graph with a smoothed appearance where adjacent samples exhibit a gradual slope.
Chart Options Legend, Grid Lines, Range Selector. Include legend, grid lines, and range selector for readability.
Trend Lines. Present data with a smoothed average to show trend.

WhatsUp Gold User Guide
583
Tip: Trend lines represent a moving average that can be compared with line and area graphs to reveal peak and sub peak intervals, periods of burstiness, latency, and interruption.
Note: This report only returns disk utilization metrics for devices that already have the appropriate performance monitoring enabled. To enable these polled measurements, see Disk Utilization Monitor (on page 167).
Tip: You can gain access to "root" (/) partition metrics for Linux and UNIX OS by using the SSH Monitor (on page 173) or by assigning the SNMP user (as designated in snmp.conf) with appropriate Sudoer privileges. Disk utilization measurements for a Linux or UNIX "root" partition (/) are at first typically not included in this report. When "root" (/) partition totals are not included, total disk capacity in the report typically appears 5% less than the physical disk.
Share, export, and save as PDF Most generated Disk Utilization report data can be printed, shared, and exported when selecting Expand ( ) from the Dashboard Options ( ) menu. After the report has been expanded, select export ( ) to access the following options:
Export to PDF. Generate a PDF file of the report with user-defined page size and orientation.
Export Data. Export Disk Utilization data (on page 951) and leverage outside of WhatsUp Gold.
Schedule Export. Set a recurring date and time, format, and email destination for report data export (on page 942).
Interface Discards Interface Discards report reveals measurements for dropped or untransmitted network traffic across one or more network interfaces for each device or device group you specify. Packets can be routinely discarded due to policy, hardware faults, network outages, and so on.
Understand column data The default view of each report contains a grid with the following columns:
(Report Options). Jump to a detailed dashboard or control panel for: Device Properties (on page 86).
Device Status (on page 417).
RealTime Performance Monitor (on page 788). Device. Device hostname, IP address, or custom label. Interface. Textual name of the interface (ifName).

WhatsUp Gold User Guide
584
Tx Discards. Count of packets abandoned at transmit time. Rx Discards. Total discards on receive channel. Last Poll. Duration since last sample.
To display additional measurements, click a column heading ( ) for column selection ( ). You can also include:
Rx Min. Fewest incoming packets discarded over a one minute interval specified period.
Rx Max. Largest number of incoming packets discarded per minute for the specified period.
Rx Avg. Average number of discarded incoming packets per minute for the specified period.
Tx Min. Fewest outgoing packets discarded over a one minute interval specified period.
Tx Max. Largest number of outgoing packets discarded per minute for the specified period.
Tx Avg. Average number of outgoing packets discarded per minute for the specified period.
Generate a report Choose Device. Choose one or more host devices you want Interface Discards measurements for.
Use the Select Device dialog for one of the following:
Control Purpose
Device Browse and choose a single device.
Single Interface
Choose an interface on a device.
Device Group
Choose an existing group of one or more devices. You can also create custom or dynamic groups.
Note: You can organize devices into custom or dynamic groups. For more information, see Grouping Devices (on page 242).
WhatsUp Gold User Guide
585
Choose time constraints. ( , ) Choose times for the Interface Discards. (For recently observed measurements, select Last Polled from the Date Range drop down list.)
Choose time constraints for data view Control Purpose
Date Range (on page 944)
Choose or define an overall date range.
Business hours (on page 944)
Focus on specific days of the week and periods within each day. Reveal trends that are sensitive to business hours, time zones,
and other periodic attributes in the observed data.
Filter and reduce by row and by column. Sort and remove columns, group rows based on specific column values, and remove unwanted information from the table.
Filter and pick by column
Click a report heading and use the following from the drop down list:
Control Purpose
Sort. Sort column in ascending or descending order.
Columns. Pick the columns you want to view. Click a check box to display the column. Clear the check box to hide it.
Group by this field.
Group table into collapsible rows wherever the current column contains identical data ("field") values.
Filters. Provide a keyword to view only rows that contain the keyword for this column.
Chart, adjust output, and visualize. Fine tune report presentation and range of values displayed using the Report Setting dialog (optional).
Specify threshold and top n: Control Purpose
Show Top n Items Limit items to the samples with the highest (or lowest) interface errors.

WhatsUp Gold User Guide
586
Threshold Type Switch between minimum or maximum mode for cutoff values for the ranked list.
At or Over. Show peak occurrence period. (Observations equal to or greater than Threshold.)
At or Under. Show occurrences equal to or less than Threshold.
Threshold (percent)
Baseline value used to trim ranked device list based on peak or subpeak periods when returning the Top n.
Chart and visualize data over time (single device ) Charting and visualization is available when you select a single device.
Control Purpose
Display Options Present data as a chart, a table grid, or both.
Chart Type Gauge charts. Available when you select a Date Range of Last Polled .
Time series. Available when you select a Date Range interval (Today , for example).
Line/Area. Scatter graph that connects adjacent measurements with straight lines.
Spline/Area Spline. Choose a graph with a smoothed appearance where adjacent samples exhibit a gradual slope.
Chart Options Legend, Grid Lines, Range Selector. Include legend, grid lines, and range selector for readability.
Trend Lines. Present data with a smoothed average to show trend.
Tip: Trend lines represent a moving average that can be compared with line and area graphs to reveal peak and sub peak intervals, collision periods, and indicate transmission problems.
Note: This report only returns Interface Discards metrics for devices that already have the appropriate WMI or SNMP credentials. For more information, see Using Credentials.
Note: To harvest data for this report, you must enable collection of Interface Utilization performance monitor data collection under Device Properties and ensure the Collect errors and discards data for all selected interfaces interface data collection configuration option is selected .

WhatsUp Gold User Guide
587
Share, export, and save as PDF Most generated Interface Discards report data can be printed, shared, and exported when selecting Expand ( ) from the Dashboard Options ( ) menu. After the report has been expanded, select export ( ) to access the following options:
Export to PDF. Generate a PDF file of the report with user-defined page size and orientation.
Export Data. Export Interface Discards data (on page 951) and leverage outside of WhatsUp Gold.
Schedule Export. Set a recurring date and time, format, and email destination for report data export (on page 942).
Interface Errors Interface Errors report reveals packet discard count (specially due to error) for network interfaces associated with each device or device group you specify. Packets can be routinely discarded due to policy, hardware faults, and network outages. Interface Errors reports reveal an error-specific fraction of the total packet discard count reported in the Interface Discards (on page 583) report. At the network interface, discards due to error typically occur when a CRC (Cyclic Redundancy Check) or packet header inspection returns unexpected results.
Understand column data The default view of each report contains a grid with the following columns:
Device. Device hostname, IP address, or custom label. Interface. Network interface with reported errors. Rx Avg. Average incoming packets discarded due to error per minute for Date
Range specified. Rx Errors. Errors reported from inbound packets since polling began for Date
Range specified. Tx Avg. Average number of outgoing packets discarded due to error per minute
for Date Range specified. Tx Errors. Errors reported from inbound packets since polling began for Date
Range specified. Last Poll. Duration since last sample.
To display additional measurements, click a column heading ( ) for column selection ( ). You can also include:
Rx Min. Minimum average received. Rx Max. Maximum average received. Tx Min. Minimum average transmitted. Tx Max. Maximum average transmitted.

WhatsUp Gold User Guide
588
Generate a report Choose Device. Choose one or more host devices you want Interface Errors measurements for.
Use the Select Device dialog for one of the following:
Control Purpose
Device Browse and choose a single device.
Single Interface
Choose an interface on a device.
Device Group
Choose an existing group of one or more devices. You can also create custom or dynamic groups.
Note: You can organize devices into custom or dynamic groups. For more information, see Grouping Devices (on page 242).
Choose time constraints. ( , ) Choose times for the Interface Errors. (For recently observed measurements, select Last Polled from the Date Range drop down list.)
Choose time constraints for data view Control Purpose
Date Range (on page 944)
Choose or define an overall date range.
Business hours (on page 944)
Focus on specific days of the week and periods within each day. Reveal trends that are sensitive to business hours, time zones,
and other periodic attributes in the observed data.
Filter and reduce by row and by column. Sort and remove columns, group rows based on specific column values, and remove unwanted information from the table.
Filter and pick by column
Click a report heading and use the following from the drop down list:
Control Purpose
Sort. Sort column in ascending or descending order.
Columns. Pick the columns you want to view. Click a check box to display the column. Clear the check box to hide it.

WhatsUp Gold User Guide
589
Group by this field.
Group table into collapsible rows wherever the current column contains identical data ("field") values.
Filters. Provide a keyword to view only rows that contain the keyword for this column.
Chart, adjust output, and visualize. Fine tune report presentation and range of values displayed using the Report Setting dialog (optional).
Specify threshold and top n: Control Purpose
Show Top n Items Limit items to the samples with the highest (or lowest) interface errors.
Threshold Type Switch between minimum or maximum mode for cutoff values for the ranked list.
At or Over. Show peak occurrence period. (Observations equal to or greater than Threshold.)
At or Under. Show occurrences equal to or less than Threshold.
Threshold (percent)
Baseline value used to trim ranked device list based on peak or subpeak periods when returning the Top n.
Chart and visualize data over time (single device ) Charting and visualization is available when you select a single device.
Control Purpose
Display Options Present data as a chart, a table grid, or both.
Chart Type Gauge charts. Available when you select a Date Range of Last Polled .
Time series. Available when you select a Date Range interval (Today , for example).
Line/Area. Scatter graph that connects adjacent measurements with straight lines.
Spline/Area Spline. Choose a graph with a smoothed appearance where adjacent samples exhibit a gradual slope.
Chart Options Legend, Grid Lines, Range Selector. Include legend, grid lines, and range selector for readability.
Trend Lines. Present data with a smoothed average to show trend.

WhatsUp Gold User Guide
590
Tip: Trend lines represent a moving average that can be compared with line and area graphs to reveal peak and sub peak intervals, collision periods, and indicate transmission problems.
Note: This report only returns Interface Errors metrics for devices that already have the appropriate WMI or SNMP credentials. For more information, see Using Credentials.
Note: To harvest data for this report, you must enable collection of Interface Utilization performance monitor data collection under Device Properties and ensure the Collect errors and discards data for all selected interfaces interface data collection configuration option is selected .
Share, export, and save as PDF Most generated Interface Errors report data can be printed, shared, and exported when selecting Expand ( ) from the Dashboard Options ( ) menu. After the report has been expanded, select export ( ) to access the following options:
Export to PDF. Generate a PDF file of the report with user-defined page size and orientation.
Export Data. Export Interface Errors data (on page 951) and leverage outside of WhatsUp Gold.
Schedule Export. Set a recurring date and time, format, and email destination for report data export (on page 942).
Interface Traffic Interface Traffic report reveals source and destination traffic accounting for one or more devices.
Understand column data The default view of each report contains a grid with the following columns:
(Report Options). Jump to a detailed dashboard or control panel for: Device Properties (on page 86).
Device Status (on page 417).
RealTime Performance Monitor (on page 788). Device. Device hostname, IP address, or custom label. Interface. Textual name of the interface (ifName). Tx Speed. Configured transmit speed of the network interface. Tx Min. Minimum average transmitted. Tx Max. Maximum average transmitted.

WhatsUp Gold User Guide
591
Tx % Avg. Average usage of the transmit bandwidth speed. Tx Avg. Average transmitted. Tx Bytes. Transmitted byte count. Rx Speed. Configured receive speed of the network interface. Rx Min. Minimum average received. Rx Max. Maximum average received. Rx % Avg. Average usage of the receive bandwidth speed. Rx Avg. Average received. Rx Bytes. Received byte count. Last Poll. Duration since last sample.
Generate a report Choose Device. Choose one or more host devices you want Interface Traffic measurements for.
Use the Select Device dialog for one of the following:
Control Purpose
Device Browse and choose a single device.
Single Interface
Choose an interface on a device.
Device Group
Choose an existing group of one or more devices. You can also create custom or dynamic groups.
Note: You can organize devices into custom or dynamic groups. For more information, see Grouping Devices (on page 242).
Choose time constraints. ( , ) Choose times for the Interface Traffic. (For recently observed measurements, select Last Polled from the Date Range drop down list.)
Choose time constraints for data view Control Purpose
Date Range (on page 944)
Choose or define an overall date range.
Business hours (on page 944)
Focus on specific days of the week and periods within each day. Reveal trends that are sensitive to business hours, time zones,
and other periodic attributes in the observed data.

WhatsUp Gold User Guide
592
Filter and reduce by row and by column. Sort and remove columns, group rows based on specific column values, and remove unwanted information from the table.
Filter and pick by column
Click a report heading and use the following from the drop down list:
Control Purpose
Sort. Sort column in ascending or descending order.
Columns. Pick the columns you want to view. Click a check box to display the column. Clear the check box to hide it.
Group by this field.
Group table into collapsible rows wherever the current column contains identical data ("field") values.
Filters. Provide a keyword to view only rows that contain the keyword for this column.
Chart, adjust output, and visualize. Fine tune report presentation and range of values displayed using the Report Settings dialog (optional).
Specify threshold and top n: Control Purpose
Show Top n Items Limit items to the samples with the highest values.
Threshold Type Switch between minimum or maximum mode for cutoff values (for displaying either peak or sub peak usage periods, for example).
Threshold (percent) Control and trim peak values to trim outliers.
Note: This report only returns Interface Traffic metrics for devices that already have the appropriate WMI or SNMP credentials. For more information, see Using Credentials.
Share, export, and save as PDF Most generated Interface Traffic report data can be printed, shared, and exported when selecting Expand ( ) from the Dashboard Options ( ) menu. After the report has been expanded, select export ( ) to access the following options:
Export to PDF. Generate a PDF file of the report with user-defined page size and orientation.

WhatsUp Gold User Guide
593
Export Data. Export Interface Traffic data (on page 951) and leverage outside of WhatsUp Gold.
Schedule Export. Set a recurring date and time, format, and email destination for report data export (on page 942).
Interface Utilization Interface Utilization reports reveal measurements for network traffic across one or more network interfaces for each device or device group you specify. These reports help you to visualize current and historic flow of network traffic.
If you specify a device group, the report reveals average rate and total volume of traffic for each device within the group. If you specify a switch, this report returns average rate and traffic volume across each LAN segment —a subscript (n) follows the device name to denote the port number.
Important: Capacity utilization figures are typically calculated using an interface speed value returned from the device. For cases where the "nominal" speed (actual operational speed adjusted for other factors such as available bandwidth) for the interface is different than the value reported back from the device, you can edit this value from the Monitors tab in Device Properties ( ). For more information, see the Interface Utilization monitor topic.
Understand column data The default view of each report contains a grid with the following columns:
(Report Options). Jump to a detailed dashboard or control panel for: Device Properties (on page 86).
Device Status (on page 417).
RealTime Performance Monitor (on page 788). Device. Device hostname, IP address, or custom label. Interface. Textual name of the interface (ifName). % Tx Avg. Fraction of the interface bandwidth needed for transmitted bytes. % Rx Avg. Fraction of bandwidth utilized by received bytes. Last Poll. Duration since last sample.
To display additional measurements, click a column heading ( ) for column selection ( ). You can also include:
Tx Avg. Average of available bandwidth needed for transmit. Rx Avg. Average of available bandwidth needed for received traffic. Tx Speed. Displays observed transmit speed for a point in time if you selected
Last Polled. Displays average transmit speed if you selected a range of time (for example, Today).

WhatsUp Gold User Guide
594
Rx Speed. Displays observed receive speed for a point in time if you selected Last Polled. Displays average receive speed if you selected a range of time (for example, Today).
Tx Bytes. Byte count transmitted for the specified period. Rx Bytes. Byte count received for the specified period.
Generate a report Choose Device. Choose one or more host devices you want Interface Utilization measurements for.
Use the Select Device dialog for one of the following:
Control Purpose
Device Browse and choose a single device.
Single Interface
Choose an interface on a device.
Device Group
Choose an existing group of one or more devices. You can also create custom or dynamic groups.
Note: You can organize devices into custom or dynamic groups. For more information, see Grouping Devices (on page 242).
Choose time constraints. ( , ) Choose times for the Interface Utilization. (For recently observed measurements, select Last Polled from the Date Range drop down list.)
Choose time constraints for data view Control Purpose
Date Range (on page 944)
Choose or define an overall date range.
Business hours (on page 944)
Focus on specific days of the week and periods within each day. Reveal trends that are sensitive to business hours, time zones,
and other periodic attributes in the observed data.
Filter and reduce by row and by column. Sort and remove columns, group rows based on specific column values, and remove unwanted information from the table.
Filter and pick by column
Click a report heading and use the following from the drop down list:

WhatsUp Gold User Guide
595
Control Purpose
Sort. Sort column in ascending or descending order.
Columns. Pick the columns you want to view. Click a check box to display the column. Clear the check box to hide it.
Group by this field.
Group table into collapsible rows wherever the current column contains identical data ("field") values.
Filters. Provide a keyword to view only rows that contain the keyword for this column.
Chart, adjust output, and visualize. Fine tune report presentation and range of values displayed using the Report Settings dialog (optional).
Specify threshold and top n: Control Purpose
Show Top n Items Limit items to the samples with the highest (or lowest) utilization.
Threshold Type Switch between minimum or maximum mode for cutoff values for the ranked list.
At or Over. Show peak usage period. (Utilization percentage equal to or greater than Threshold.)
At or Under. Show usage periods where resources are unused or possibly down. (Utilization percentage equal to or less than Threshold.)
Threshold (percent)
Baseline value used to trim ranked device list based on peak or subpeak capacity when returning the Top n.
Chart and visualize data over time (single device ) Charting and visualization is available when you select a single device.
Control Purpose
Display Options Present data as a chart, a table grid, or both.

WhatsUp Gold User Guide
596
Chart Type Gauge charts. Available when you select a Date Range of Last Polled .
Time series. Available when you select a Date Range interval (Today , for example).
Line/Area. Scatter graph that connects adjacent measurements with straight lines.
Spline/Area Spline. Choose a graph with a smoothed appearance where adjacent samples exhibit a gradual slope.
Chart Options Legend, Grid Lines, Range Selector. Include legend, grid lines, and range selector for readability.
Trend Lines. Present data with a smoothed average to show trend.
Tip: Trend lines represent a moving average that can be compared with line and area graphs to reveal peak and sub peak intervals, periods of burstiness, latency, and interruption.
Note: This report only returns Interface Utilization metrics for devices that already have the appropriate WMI or SNMP credentials. For more information, see Using Credentials.
Share, export, and save as PDF Most generated Interface Utilization report data can be printed, shared, and exported when selecting Expand ( ) from the Dashboard Options ( ) menu. After the report has been expanded, select export ( ) to access the following options:
Export to PDF. Generate a PDF file of the report with user-defined page size and orientation.
Export Data. Export Interface Utilization data (on page 951) and leverage outside of WhatsUp Gold.
Schedule Export. Set a recurring date and time, format, and email destination for report data export (on page 942).
Memory Utilization Memory Utilization reports present minimum, maximum, and average memory utilization for one or more devices you specify.
Understand column data The default view of each report contains a grid with the following columns:
(Report Options). Jump to a detailed dashboard or control panel for: Device Properties (on page 86).
Device Status (on page 105).
State Change Timeline (on page 642)
WhatsUp Gold User Guide
597
Device. Device identifier. Description. Type of memory. For example, Physical Memory. Size. Total memory capacity of monitored host. Min. Minimum 'in-use' memory footprint on the device. Max. Maximum amount of memory in use on the device. Avg. Displays value of average usage when you select a range of time (for
example, Today). Displays value for total usage observed for a point in time when you select Last Polled.
Min % Used. Minimum percentage observed. Max % Used. Maximum percentage observed. % Avg. Displays average percent used if you selected a range of time (for
example, Today). Displays value for total usage observed for a point in time if you selected Last Polled.
Poll Time. Time when memory capacity measurements were retrieved from the device.
Generate a report Choose Device. Choose one or more host devices you want Memory Utilization measurements for. (Virtual machines show only allocated resources)
Use the Select Device dialog for one of the following:
Control Purpose
Device Browse and choose a single device.
Device Group
Choose an existing group of one or more devices. You can also create custom or dynamic groups.
Note: You can organize devices into custom or dynamic groups. For more information, see Grouping Devices (on page 242).
Tip: If a device is identified as a virtual machine, Hyper-V or VMware credentials will be used to retrieve data and only those physical resources allocated to the virtual machine will be visible in the report.

WhatsUp Gold User Guide
598
Choose time constraints. ( , ) Choose times for the Memory Utilization. (For recently observed measurements, select Last Polled from the Date Range drop down list.)
Choose time constraints for data view Control Purpose
Date Range (on page 944)
Choose or define an overall date range.
Business hours (on page 944)
Focus on specific days of the week and periods within each day. Reveal trends that are sensitive to business hours, time zones,
and other periodic attributes in the observed data.
Sort and pick columns. Sort and pick columns.
Filter and pick by column
Click a report heading and use the following from the drop down list:
Control Purpose
Sort. Sort column in ascending or descending order.
Columns. Pick the columns you want to view. Click a check box to display the column. Clear the check box to hide it.
Chart, adjust output, and visualize. Fine tune report presentation and range of values displayed using the Report Setting dialog (optional).
Specify threshold and top n: Control Purpose
Show Top n Items Limit items to the samples with the highest (or lowest) latency.
Threshold Type Switch between minimum or maximum mode for cutoff values for the ranked list.
At or Over. Show peak usage period. (Latency percentage equal to or greater than Threshold.)
At or Under. Show usage periods where resources are unused or possibly down. (Latency percentage equal to or less than Threshold.)
Threshold (percent)
Baseline value used to trim ranked device list based on peak or subpeak capacity when returning the Top n.

WhatsUp Gold User Guide
599
Chart and visualize data over time (single host device ) Charting and visualization is available when you select a single device.
Control Purpose
Display Options Present data as a chart, a table grid, or both.
Chart Type Gauge charts . Available when you select a Date Range of Last Polled .
Time series . Available when you select a Date Range interval (Today , for example).
Line/Area. Scatter graph that connects adjacent measurements with straight lines.
Spline/Area Spline. Choose a graph with a smoothed appearance where adjacent samples exhibit a gradual slope.
Chart Options Legend, Grid Lines, Range Selector. Include legend, grid lines, and range selector for readability.
Trend Lines. Present data with a smoothed average to show trend.
Tip: Trend lines represent a moving average that can be compared with line and area graphs to reveal peak and sub peak intervals.
Note: This report only returns Memory Utilization metrics for devices that already have the appropriate WMI or SNMP credentials. For more information, see Using Credentials.
Note: Memory Utilization report only returns metrics for devices that already have the appropriate performance monitoring enabled. To enable these polled measurements, see Memory Utilization Monitor (on page 171).
Share, export, and save as PDF Most generated Memory Utilization report data can be printed, shared, and exported when selecting Expand ( ) from the Dashboard Options ( ) menu. After the report has been expanded, select export ( ) to access the following options:
Export to PDF. Generate a PDF file of the report with user-defined page size and orientation.
Export Data. Export Memory Utilization data (on page 951) and leverage outside of WhatsUp Gold.
Schedule Export. Set a recurring date and time, format, and email destination for report data export (on page 942).

WhatsUp Gold User Guide
600
Ping Availability Ping Availability report reveals device response to ICMP ("ping") requests.
Understand column data The default view of each report contains a grid with the following columns:
(Report Options). Jump to a detailed dashboard or control panel for: Device Properties (on page 86).
Device Status (on page 105).
RealTime Performance Monitor (on page 788). Device. Name of network device. Interface. Network interface. % Available. Availability score based on ping samples for the selected time
period. % Lost. Fraction of ICMP packets that failed to reach the target, timed out, or
received no reply for the selected time period. Last Poll. Time of last sample.
To display additional measurements, click a column heading ( ) for column selection ( ). You can also include:
Sent. Number of ICMP packets sent for the selected time period. Lost. Number of ICMP packets that failed to reach the target, timed out, or
received no reply for the selected time period. Poll Time (min). Total minutes this device has been polled. Unavailable (min). Total minutes device was unavailable.
Generate a report Choose Device. Choose one or more host devices you want Ping Availability measurements for.
Use the Select Device dialog for one of the following:
Control Purpose
Device Browse and choose a single device.
Single Interface
Choose an interface on a device.
Device Group
Choose an existing group of one or more devices. You can also create custom or dynamic groups.
Note: You can organize devices into custom or dynamic groups. For more information, see Grouping Devices (on page 242).
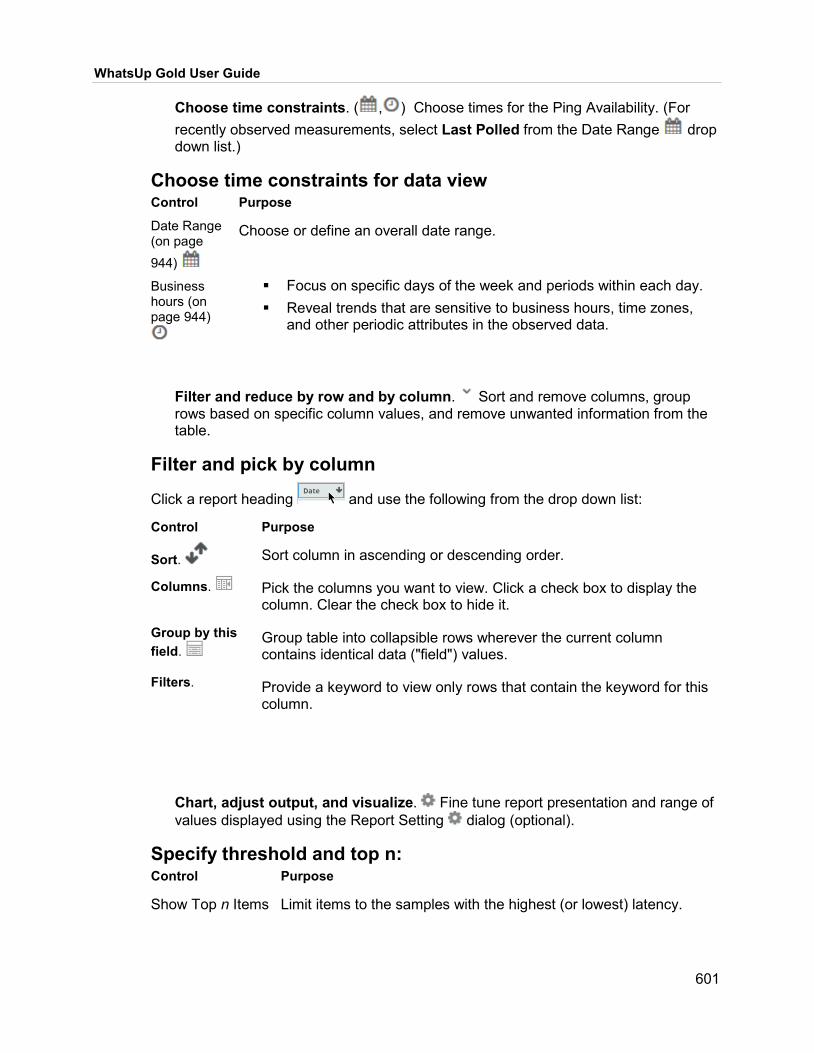
WhatsUp Gold User Guide
601
Choose time constraints. ( , ) Choose times for the Ping Availability. (For recently observed measurements, select Last Polled from the Date Range drop down list.)
Choose time constraints for data view Control Purpose
Date Range (on page 944)
Choose or define an overall date range.
Business hours (on page 944)
Focus on specific days of the week and periods within each day. Reveal trends that are sensitive to business hours, time zones,
and other periodic attributes in the observed data.
Filter and reduce by row and by column. Sort and remove columns, group rows based on specific column values, and remove unwanted information from the table.
Filter and pick by column
Click a report heading and use the following from the drop down list:
Control Purpose
Sort. Sort column in ascending or descending order.
Columns. Pick the columns you want to view. Click a check box to display the column. Clear the check box to hide it.
Group by this field.
Group table into collapsible rows wherever the current column contains identical data ("field") values.
Filters. Provide a keyword to view only rows that contain the keyword for this column.
Chart, adjust output, and visualize. Fine tune report presentation and range of values displayed using the Report Setting dialog (optional).
Specify threshold and top n: Control Purpose
Show Top n Items Limit items to the samples with the highest (or lowest) latency.

WhatsUp Gold User Guide
602
Threshold Type Switch between minimum or maximum mode for cutoff values for the ranked list.
At or Over. Show peak usage period. (Latency percentage equal to or greater than Threshold.)
At or Under. Show usage periods where resources are unused or possibly down. (Latency percentage equal to or less than Threshold.)
Threshold (percent)
Baseline value used to trim ranked device list based on peak or subpeak capacity when returning the Top n.
Chart and visualize data over time (single device ) Charting and visualization is available when you select a single device.
Control Purpose
Display Options Present data as a chart, a table grid, or both.
Chart Type Gauge charts . Available when you select a Date Range of Last Polled .
Time series . Available when you select a Date Range interval (Today , for example).
Line/Area. Scatter graph that connects adjacent measurements with straight lines.
Spline/Area Spline. Choose a graph with a smoothed appearance where adjacent samples exhibit a gradual slope.
Chart Options Legend, Grid Lines, Range Selector. Include legend, grid lines, and range selector for readability.
Trend Lines. Present data with a smoothed average to show trend.
Tip: Trend lines represent a moving average that can be compared with line and area graphs to reveal peak and sub peak intervals, periods of latency and interruption.
Note: This report only returns Ping Availability metrics for devices that already have the appropriate WMI or SNMP credentials. For more information, see Using Credentials.
Share, export, and save as PDF Most generated Ping Availability report data can be printed, shared, and exported when selecting Expand ( ) from the Dashboard Options ( ) menu. After the report has been expanded, select export ( ) to access the following options:
Export to PDF. Generate a PDF file of the report with user-defined page size and orientation.
Export Data. Export Ping Availability data (on page 951) and leverage outside of WhatsUp Gold.

WhatsUp Gold User Guide
603
Schedule Export. Set a recurring date and time, format, and email destination for report data export (on page 942).
Ping Packet Loss Ping Packet Loss report reveals ICMP echo request ("ping") packet loss or timeout for selected target devices.
Understand column data The default view of each report contains a grid with the following columns:
Device. Device name. Interface. Network interface identifier. Sent. Number of ICMP packets sent. Lost. Number of ICMP packets lost. %Loss. Fraction of ICMP packet replies observed versus replies expected.
Generate a report Choose Device. Choose one or more host devices you want Ping Packet Loss measurements for.
Use the Select Device dialog for one of the following:
Control Purpose
Device Browse and choose a single device.
Single Interface
Choose an interface on a device.
Device Group
Choose an existing group of one or more devices. You can also create custom or dynamic groups.
Note: You can organize devices into custom or dynamic groups. For more information, see Grouping Devices (on page 242).
Choose time constraints. ( , ) Choose times for the Ping Packet Loss. (For recently observed measurements, select Last Polled from the Date Range drop down list.)
Choose time constraints for data view Control Purpose
Date Range (on page 944)
Choose or define an overall date range.

WhatsUp Gold User Guide
604
Business hours (on page 944)
Focus on specific days of the week and periods within each day. Reveal trends that are sensitive to business hours, time zones,
and other periodic attributes in the observed data.
Filter and reduce by row and by column. Sort and remove columns, group rows based on specific column values, and remove unwanted information from the table.
Filter and pick by column
Click a report heading and use the following from the drop down list:
Control Purpose
Sort. Sort column in ascending or descending order.
Columns. Pick the columns you want to view. Click a check box to display the column. Clear the check box to hide it.
Group by this field.
Group table into collapsible rows wherever the current column contains identical data ("field") values.
Filters. Provide a keyword to view only rows that contain the keyword for this column.
Chart, adjust output, and visualize. Fine tune report presentation and range of values displayed using the Report Settings dialog (optional).
Specify threshold and top n: Control Purpose
Show Top n Items Limit items to the samples with the highest (or lowest) utilization.
Threshold Type Switch between minimum or maximum mode for cutoff values for the ranked list.
At or Over. Show peak usage period. (Utilization percentage equal to or greater than Threshold.)
At or Under. Show usage periods where resources are unused or possibly down. (Utilization percentage equal to or less than Threshold.)
Threshold (percent)
Baseline value used to trim ranked device list based on peak or subpeak capacity when returning the Top n.
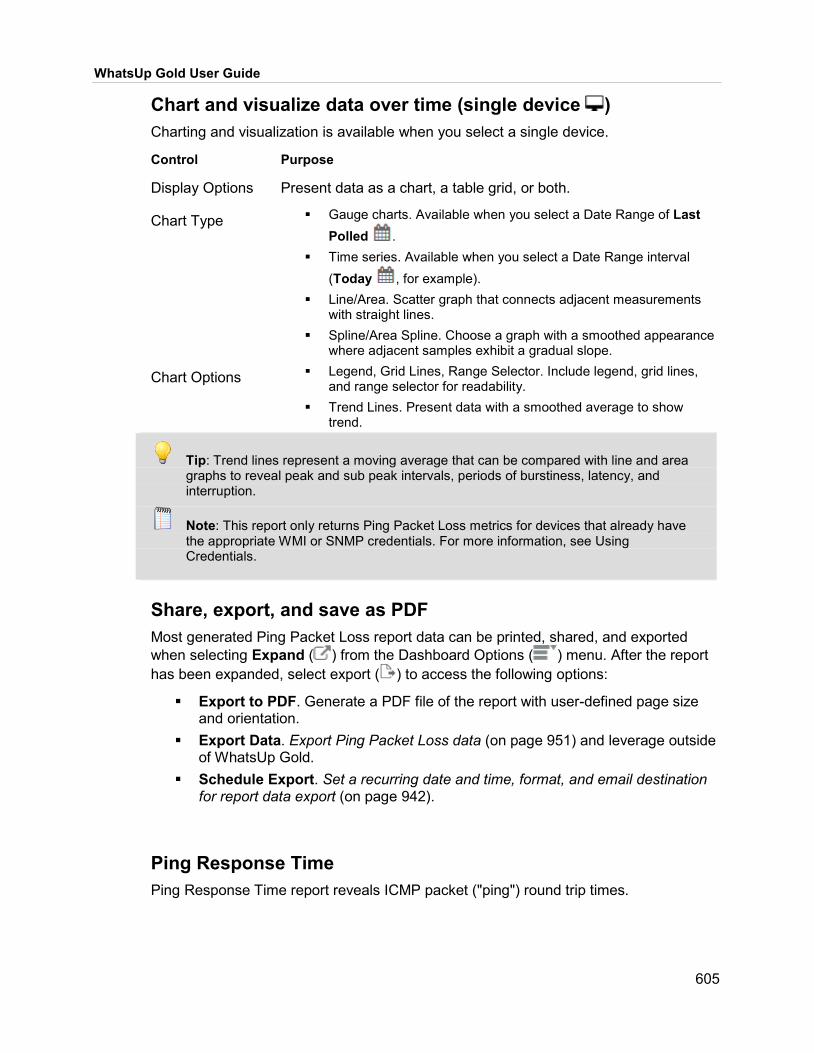
WhatsUp Gold User Guide
605
Chart and visualize data over time (single device ) Charting and visualization is available when you select a single device.
Control Purpose
Display Options Present data as a chart, a table grid, or both.
Chart Type Gauge charts. Available when you select a Date Range of Last Polled .
Time series. Available when you select a Date Range interval (Today , for example).
Line/Area. Scatter graph that connects adjacent measurements with straight lines.
Spline/Area Spline. Choose a graph with a smoothed appearance where adjacent samples exhibit a gradual slope.
Chart Options Legend, Grid Lines, Range Selector. Include legend, grid lines, and range selector for readability.
Trend Lines. Present data with a smoothed average to show trend.
Tip: Trend lines represent a moving average that can be compared with line and area graphs to reveal peak and sub peak intervals, periods of burstiness, latency, and interruption.
Note: This report only returns Ping Packet Loss metrics for devices that already have the appropriate WMI or SNMP credentials. For more information, see Using Credentials.
Share, export, and save as PDF Most generated Ping Packet Loss report data can be printed, shared, and exported when selecting Expand ( ) from the Dashboard Options ( ) menu. After the report has been expanded, select export ( ) to access the following options:
Export to PDF. Generate a PDF file of the report with user-defined page size and orientation.
Export Data. Export Ping Packet Loss data (on page 951) and leverage outside of WhatsUp Gold.
Schedule Export. Set a recurring date and time, format, and email destination for report data export (on page 942).
Ping Response Time Ping Response Time report reveals ICMP packet ("ping") round trip times.

WhatsUp Gold User Guide
606
Understand column data The default view of each report contains a grid with the following columns:
(Report Options). Jump to a detailed dashboard or control panel for either: Device Properties (on page 86).
Device Status (on page 105). Device. Name of target device for ping monitor. Interface. Specific interface the ping monitor is active on. Min (ms). Minimum ping response time in milliseconds observed during the
selected interval. Max (ms). Maximum ping response time in milliseconds observed during the
selected interval. Avg (ms). Average ping response time in milliseconds observed during the
selected interval. Last Poll. Duration since last sample.
Generate a report Choose Device. Choose one or more host devices you want Ping Response Time measurements for.
Use the Select Device dialog for one of the following:
Control Purpose
Device Browse and choose a single device.
Single Interface
Choose an interface on a device.
Device Group
Choose an existing group of one or more devices. You can also create custom or dynamic groups.
Note: You can organize devices into custom or dynamic groups. For more information, see Grouping Devices (on page 242).
Choose time constraints. ( , ) Choose times for the Ping Response Time. (For recently observed measurements, select Last Polled from the Date Range drop down list.)
Choose time constraints for data view Control Purpose
Date Range (on page 944)
Choose or define an overall date range.

WhatsUp Gold User Guide
607
Business hours (on page 944)
Focus on specific days of the week and periods within each day. Reveal trends that are sensitive to business hours, time zones,
and other periodic attributes in the observed data.
Filter and reduce by row and by column. Sort and remove columns, group rows based on specific column values, and remove unwanted information from the table.
Filter and pick by column
Click a report heading and use the following from the drop down list:
Control Purpose
Sort. Sort column in ascending or descending order.
Columns. Pick the columns you want to view. Click a check box to display the column. Clear the check box to hide it.
Group by this field.
Group table into collapsible rows wherever the current column contains identical data ("field") values.
Filters. Provide a keyword to view only rows that contain the keyword for this column.
Chart, adjust output, and visualize. Fine tune report presentation and range of values displayed using the Report Setting dialog (optional).
Specify threshold and top n: Control Purpose
Show Top n Items Limit items to the samples with the highest (or lowest) latency.
Threshold Type Switch between minimum or maximum mode for cutoff values for the ranked list.
At or Over. Show peak usage period. (Latency percentage equal to or greater than Threshold.)
At or Under. Show usage periods where resources are unused or possibly down. (Latency percentage equal to or less than Threshold.)
Threshold (percent)
Baseline value used to trim ranked device list based on peak or subpeak capacity when returning the Top n.
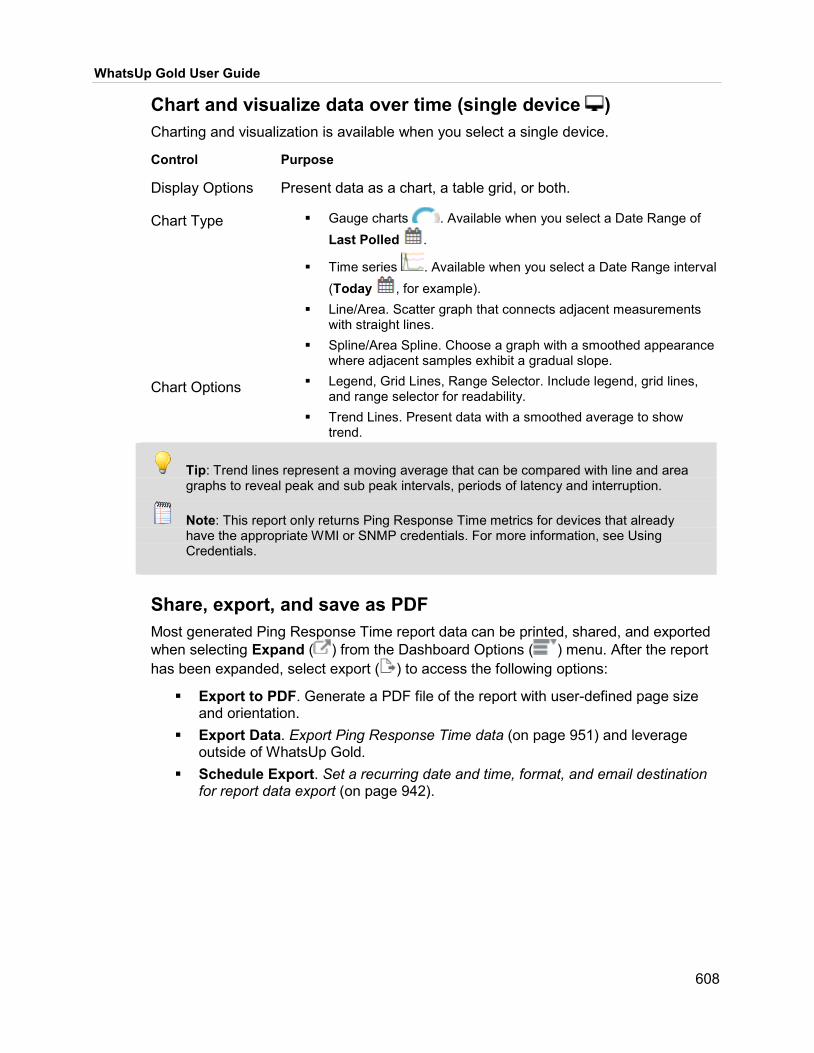
WhatsUp Gold User Guide
608
Chart and visualize data over time (single device ) Charting and visualization is available when you select a single device.
Control Purpose
Display Options Present data as a chart, a table grid, or both.
Chart Type Gauge charts . Available when you select a Date Range of Last Polled .
Time series . Available when you select a Date Range interval (Today , for example).
Line/Area. Scatter graph that connects adjacent measurements with straight lines.
Spline/Area Spline. Choose a graph with a smoothed appearance where adjacent samples exhibit a gradual slope.
Chart Options Legend, Grid Lines, Range Selector. Include legend, grid lines, and range selector for readability.
Trend Lines. Present data with a smoothed average to show trend.
Tip: Trend lines represent a moving average that can be compared with line and area graphs to reveal peak and sub peak intervals, periods of latency and interruption.
Note: This report only returns Ping Response Time metrics for devices that already have the appropriate WMI or SNMP credentials. For more information, see Using Credentials.
Share, export, and save as PDF Most generated Ping Response Time report data can be printed, shared, and exported when selecting Expand ( ) from the Dashboard Options ( ) menu. After the report has been expanded, select export ( ) to access the following options:
Export to PDF. Generate a PDF file of the report with user-defined page size and orientation.
Export Data. Export Ping Response Time data (on page 951) and leverage outside of WhatsUp Gold.
Schedule Export. Set a recurring date and time, format, and email destination for report data export (on page 942).

609
CHAPTER 26
System Info In This Chapter Inventory ............................................................................... 609
NTA ...................................................................................... 633
Database Size ...................................................................... 633
Database Table Usage ......................................................... 634
Poller Health ......................................................................... 634
Network Coverage ................................................................ 635
Network Composition ............................................................ 635
Inventory Virtual Host List Host List report reveals a list of virtual hosts for the selected physical device, device group, or managed network.
Understand column data The default view of each report contains a grid with the following columns:
Host Device. Device hostname, IP address, or custom label. Virtual Device. Virtual device hostname, IP address, or custom label of VM
running on the host device.
Generate a report Choose Device. Choose a single device, device group, or managed network.
Use the Select Device dialog for one of the following:
Control Description
Device Browse and choose a single device.
Device Group
Choose an existing group of one or more devices. You can also create custom or dynamic groups.
Network Network of devices managed by WhatsUp Gold.

WhatsUp Gold User Guide
610
Note: You can organize devices into custom or dynamic groups. For more information, see Grouping Devices (on page 242).
Filter and reduce by row and by column. Sort and remove columns, group rows based on specific column values, and find specific field values in the table.
Filter and pick by column
Click a report heading and use the following from the drop down list:
Control Purpose
Sort. Sort column in ascending or descending order.
Columns. Pick the columns you want to view. Click a check box to display the column. Clear the check box to hide it.
Group by this field.
Group table into collapsible rows wherever the current column contains identical data ("field") values.
Filters. Provide a keyword to view only rows that contain the keyword for this column.
Share, export, and save as PDF Most generated Host List report data can be printed, shared, and exported when selecting Expand ( ) from the Dashboard Options ( ) menu. After the report has been expanded, select export ( ) to access the following options:
Export to PDF. Generate a PDF file of the report with user-defined page size and orientation.
Export Data. Export Host List data (on page 951) and leverage outside of WhatsUp Gold.
Schedule Export. Set a recurring date and time, format, and email destination for report data export (on page 942).
Virtual Server Virtual Server report reveals system inventory information reported back from Hyper-V manager or vCenter management stations associated with the selected virtual server hosts and their associated virtual machines.
Understand column data The default view of each report contains a grid with the following columns:
Virtual Sever IP Address. Virtual server IP address.

WhatsUp Gold User Guide
611
Virtual Server Name. Host name for virtual server. Hostname. Physical host device where vCenter or Hyper-V manager is running. Host IP address. Host device IP address where vCenter or Hyper-V manager is
running. VM Names. Virtual machine list
Generate a report Choose Device. Choose a single device, device group, or managed network.
Use the Select Device dialog for one of the following:
Control Description
Device Browse and choose a single device.
Device Group
Choose an existing group of one or more devices. You can also create custom or dynamic groups.
Network Network of devices managed by WhatsUp Gold.
Note: You can organize devices into custom or dynamic groups. For more information, see Grouping Devices (on page 242).
Filter and reduce by row and by column. Sort and remove columns, group rows based on specific column values, and find specific field values in the table.
Filter and pick by column
Click a report heading and use the following from the drop down list:
Control Purpose
Sort. Sort column in ascending or descending order.
Columns. Pick the columns you want to view. Click a check box to display the column. Clear the check box to hide it.
Group by this field.
Group table into collapsible rows wherever the current column contains identical data ("field") values.
Filters. Provide a keyword to view only rows that contain the keyword for this column.

WhatsUp Gold User Guide
612
Share, export, and save as PDF Most generated Virtual Server report data can be printed, shared, and exported when selecting Expand ( ) from the Dashboard Options ( ) menu. After the report has been expanded, select export ( ) to access the following options:
Export to PDF. Generate a PDF file of the report with user-defined page size and orientation.
Export Data. Export Virtual Server data (on page 951) and leverage outside of WhatsUp Gold.
Schedule Export. Set a recurring date and time, format, and email destination for report data export (on page 942).
Virtual Host Attributes Virtual Host Attributes report reveals attributes for a device running vCenter or Hyper-V server including power states of virtual machines associated with the server.
Understand column data The default view of each report contains a grid with the following columns:
System Name. Device hostname, IP address, or custom label. Device Type. Hypervisor ("host") device software. (Hyper-V or VMware). System IP Address. Host IP address. Last Boot Time. Last time the hypervisor was booted. Hardware Information (For vCenter servers only Vendor information will be
available.) Vendor. Hardware vendor.
OS and Version. Host OS for the machine where the hypervisor is running.
Note: Hardware Information is only available if VMware (or Windows for Hyper-V) credentials were supplied at discovery scan time.
Virtual Machine Information Powered On. VMs in the powered On state.
Powered Off. VMs in the powered Off state.
Suspended/Paused VMs. VMs in Suspended state.
Total Monitored VMs. Number of virtual machines running off of the host.
Saved VMs. (Hyper-V only) VMs in a Saved state.
Clustered VMs. (VMware only) VMs configured as a cluster.
Generate a report Choose Device. Choose a single device, device group, or managed network.
Use the Select Device dialog for one of the following:

WhatsUp Gold User Guide
613
Control Description
Device Browse and choose a single device.
Device Group
Choose an existing group of one or more devices. You can also create custom or dynamic groups.
Network Network of devices managed by WhatsUp Gold.
Note: You can organize devices into custom or dynamic groups. For more information, see Grouping Devices (on page 242).
Filter and reduce by row and by column. Sort and remove columns, group rows based on specific column values, and find specific field values in the table.
Filter and pick by column
Click a report heading and use the following from the drop down list:
Control Purpose
Sort. Sort column in ascending or descending order.
Columns. Pick the columns you want to view. Click a check box to display the column. Clear the check box to hide it.
Group by this field.
Group table into collapsible rows wherever the current column contains identical data ("field") values.
Filters. Provide a keyword to view only rows that contain the keyword for this column.
Share, export, and save as PDF Most generated Virtual Host Attributes report data can be printed, shared, and exported when selecting Expand ( ) from the Dashboard Options ( ) menu. After the report has been expanded, select export ( ) to access the following options:
Export to PDF. Generate a PDF file of the report with user-defined page size and orientation.
Export Data. Export Virtual Host Attributes data (on page 951) and leverage outside of WhatsUp Gold.
Schedule Export. Set a recurring date and time, format, and email destination for report data export (on page 942).

WhatsUp Gold User Guide
614
Virtual Machine Attributes Virtual Machine Attributes report reveals data specific to an individual VMWare or Hyper-V virtual machine.
Understand column data The default view of each report contains a grid with the following columns:
System Name. Name of the virtual machine. Device Type. Type of virtual machine (VMWare or Hyper-V). IP Address. IP address assigned to the virtual machine. Operating System. Operating system running on the virtual machine. Power State. Indicates if the virtual machine is powered on or powered off.
VMWare virtual devices may also be displayed as suspended and Hyper-V virtual machines my also be displayed as paused or saved.
Host. Name (or IP address) of the host on which the virtual machine is running. VMware Tools Status. Indicates if VMware Tools application is running.
(Displayed for VMWare virtual machines only)
Generate a report Choose device. Choose a single device.
Filter and reduce by row and by column. Sort and remove columns, group rows based on specific column values, and find specific field values in the table.
Filter and pick by column
Click a report heading and use the following from the drop down list:
Control Purpose
Sort. Sort column in ascending or descending order.
Columns. Pick the columns you want to view. Click a check box to display the column. Clear the check box to hide it.
Group by this field.
Group table into collapsible rows wherever the current column contains identical data ("field") values.
Filters. Provide a keyword to view only rows that contain the keyword for this column.
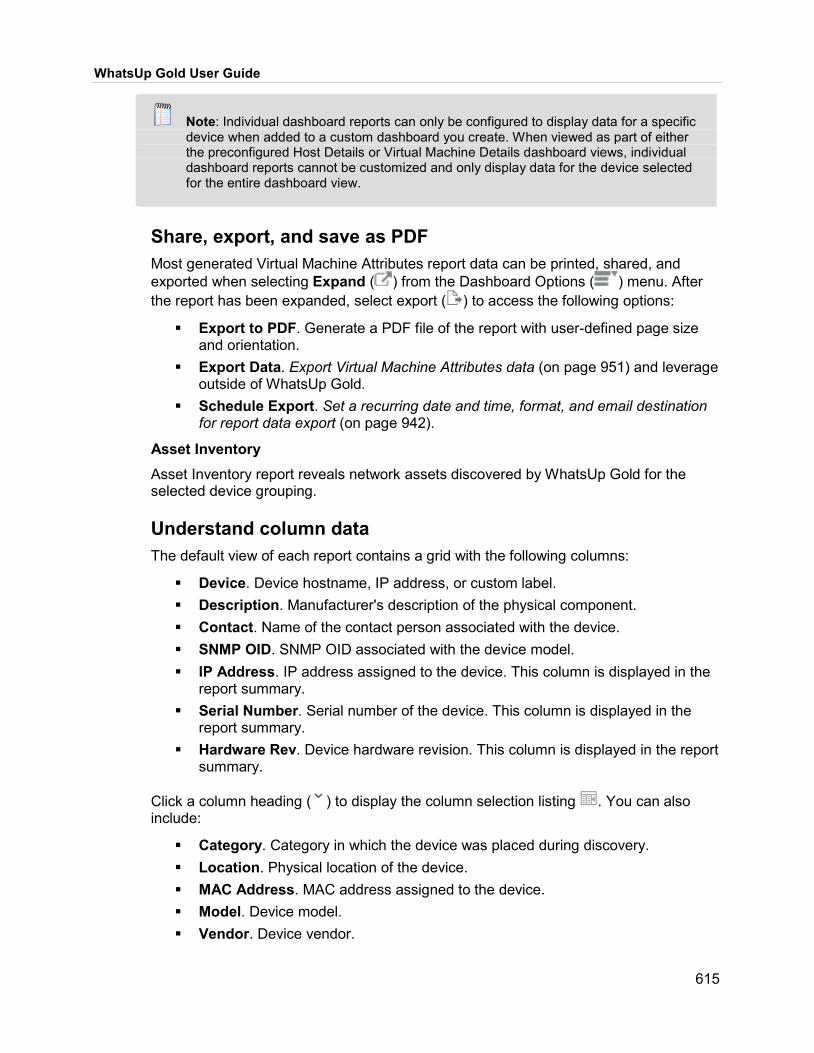
WhatsUp Gold User Guide
615
Note: Individual dashboard reports can only be configured to display data for a specific device when added to a custom dashboard you create. When viewed as part of either the preconfigured Host Details or Virtual Machine Details dashboard views, individual dashboard reports cannot be customized and only display data for the device selected for the entire dashboard view.
Share, export, and save as PDF Most generated Virtual Machine Attributes report data can be printed, shared, and exported when selecting Expand ( ) from the Dashboard Options ( ) menu. After the report has been expanded, select export ( ) to access the following options:
Export to PDF. Generate a PDF file of the report with user-defined page size and orientation.
Export Data. Export Virtual Machine Attributes data (on page 951) and leverage outside of WhatsUp Gold.
Schedule Export. Set a recurring date and time, format, and email destination for report data export (on page 942).
Asset Inventory Asset Inventory report reveals network assets discovered by WhatsUp Gold for the selected device grouping.
Understand column data The default view of each report contains a grid with the following columns:
Device. Device hostname, IP address, or custom label. Description. Manufacturer's description of the physical component. Contact. Name of the contact person associated with the device. SNMP OID. SNMP OID associated with the device model. IP Address. IP address assigned to the device. This column is displayed in the
report summary. Serial Number. Serial number of the device. This column is displayed in the
report summary. Hardware Rev. Device hardware revision. This column is displayed in the report
summary.
Click a column heading ( ) to display the column selection listing . You can also include:
Category. Category in which the device was placed during discovery. Location. Physical location of the device. MAC Address. MAC address assigned to the device. Model. Device model. Vendor. Device vendor.

WhatsUp Gold User Guide
616
Serial Number. Serial number of the device. Service Tag. Service tag associated with the device. Software Rev. Software revision of the device operating system, Firmware Rev. Device firmware revision.
Please note, information displayed in this report is only updated when a device is rediscovered. Update and rediscover any device shown to ensure the most up-to-date information for that device is reported here.
Generate a report Choose Device. Choose one or more host devices you want Asset Inventory measurements for.
Use the Select Device dialog for one of the following:
Control Purpose
Device Browse and choose a single device.
Single Interface
Choose an interface on a device.
Device Group
Choose an existing group of one or more devices. You can also create custom or dynamic groups.
Note: You can organize devices into custom or dynamic groups. For more information, see Grouping Devices (on page 242).
Choose, filter, and reorder columns. Choose and hide columns, reorder columns, and customize your data view.
Filter and pick by column
Click a report heading ( ) and use the "column picker" ( ) from the drop down list.
Control Purpose
Columns. Click a check box to display the column. Clear the check box to hide it.
Move Column. Click on a column heading and drag it to reorder your table's columns.
Note: This report only returns Asset Inventory metrics for devices that already have the appropriate credentials. For more information, see Using Credentials.

WhatsUp Gold User Guide
617
Share, export, and save as PDF Most generated Asset Inventory report data can be printed, shared, and exported when selecting Expand ( ) from the Dashboard Options ( ) menu. After the report has been expanded, select export ( ) to access the following options:
Export to PDF. Generate a PDF file of the report with user-defined page size and orientation.
Export Data. Export Asset Inventory data (on page 951) and leverage outside of WhatsUp Gold.
Schedule Export. Set a recurring date and time, format, and email destination for report data export (on page 942).
Installed Software Installed Software report reveals software installed on devices WhatsUp Gold discovers on the network through SNMP/WMI/SSH for the selected device.
Understand column data The default view of each report contains a grid with the following columns:
Device. Device hostname, IP address, or custom label. Category. Category the device was associated with during discovery. IP Address. IP address of the device. Software Name. Name of the software found on the device. Product ID. Software product ID information.
Please note, information displayed in this report is only updated when a device is rediscovered. Update and rediscover any device shown to ensure the most up-to-date information for that device is reported here.
Generate a report Choose Device. Choose one or more host devices you want Installed Software measurements for.
Use the Select Device dialog for one of the following:
Control Purpose
Device Browse and choose a single device.
Single Interface
Choose an interface on a device.
Device Group
Choose an existing group of one or more devices. You can also create custom or dynamic groups.

WhatsUp Gold User Guide
618
Note: You can organize devices into custom or dynamic groups. For more information, see Grouping Devices (on page 242).
Choose, filter, and reorder columns. Choose and hide columns, reorder columns, and customize your data view.
Filter and pick by column
Click a report heading ( ) and use the "column picker" ( ) from the drop down list.
Control Purpose
Columns. Click a check box to display the column. Clear the check box to hide it.
Move Column. Click on a column heading and drag it to reorder your table's columns.
Note: This report only returns Installed Software metrics for devices that already have the appropriate credentials. For more information, see Using Credentials.
Share, export, and save as PDF Most generated Installed Software report data can be printed, shared, and exported when selecting Expand ( ) from the Dashboard Options ( ) menu. After the report has been expanded, select export ( ) to access the following options:
Export to PDF. Generate a PDF file of the report with user-defined page size and orientation.
Export Data. Export Installed Software data (on page 951) and leverage outside of WhatsUp Gold.
Schedule Export. Set a recurring date and time, format, and email destination for report data export (on page 942).
Device Connectivity Device Connectivity report reveals a list of the devices connected to a network device in the selected device group.
Understand column data The default view of each report contains a grid with the following columns:
Device. Device hostname, IP address, or custom label. IP Address. IP address of the device.

WhatsUp Gold User Guide
619
IF Name/Port. Displays the interface name and associated port. This column is displayed in the report summary.
Connected Device. Hostname of the connected device.
Click a column heading ( ) to display the column selection listing . You can also include:
Description. Manufacturer's description of the device. Category. Assigned category based on functional characteristics uncovered in
discovery. Location. Physical location of the device. Contact. Name of the contact associated with the device. SNMP OID. SNMP Object ID that identifies the device model. IF Index. Displays the network interface index. Connected IP Address. IP address of the connected device.
Please note, information displayed in this report is only updated when a device is rediscovered. Update and rediscover any device shown to ensure the most up-to-date information for that device is reported here.
Generate a report Choose Device. Choose one or more host devices you want Device Connectivity measurements for.
Use the Select Device dialog for one of the following:
Control Purpose
Device Browse and choose a single device.
Single Interface
Choose an interface on a device.
Device Group
Choose an existing group of one or more devices. You can also create custom or dynamic groups.
Note: You can organize devices into custom or dynamic groups. For more information, see Grouping Devices (on page 242).
Choose, filter, and reorder columns. Choose and hide columns, reorder columns, and customize your data view.
Filter and pick by column
Click a report heading ( ) and use the "column picker" ( ) from the drop down list.

WhatsUp Gold User Guide
620
Control Purpose
Columns. Click a check box to display the column. Clear the check box to hide it.
Move Column. Click on a column heading and drag it to reorder your table's columns.
Choose device type. Apply a filter to return only devices with certain characteristics (specific credentials, OS, and so forth).
Choose type of connected device. Apply a filter to return only connected devices with certain characteristics.
Note: This report only returns Device Connectivity metrics for devices that already have the appropriate credentials. For more information, see Using Credentials.
Share, export, and save as PDF Most generated Device Connectivity report data can be printed, shared, and exported when selecting Expand ( ) from the Dashboard Options ( ) menu. After the report has been expanded, select export ( ) to access the following options:
Export to PDF. Generate a PDF file of the report with user-defined page size and orientation.
Export Data. Export Device Connectivity data (on page 951) and leverage outside of WhatsUp Gold.
Schedule Export. Set a recurring date and time, format, and email destination for report data export (on page 942).
Switch Port Utilization Switch Port Utilization report reveals a list of the bridge ports available on network devices in the selected device group.
Understand column data The default view of each report contains a grid with the following columns:
Device. Device hostname, IP address, or custom label. IP Address. IP address of the device. Port Count. Total number of bridge ports provided by the network device. Ports Used. Number of bridge ports that are being used on the network device.
Click a column heading ( ) to display the column selection listing . You can also include:
Description. Manufacturer's description of the physical component. Location. Physical location of the device.

WhatsUp Gold User Guide
621
Contact. Name of the contact person associated with the device. SNMP OID. SNMP Object ID of the network device model.
Please note, information displayed in this report is only updated when a device is rediscovered. Update and rediscover any device shown to ensure the most up-to-date information for that device is reported here.
Generate a report Choose Device. Choose one or more host devices you want Switch Port Utilization measurements for.
Use the Select Device dialog for one of the following:
Control Purpose
Device Browse and choose a single device.
Single Interface
Choose an interface on a device.
Device Group
Choose an existing group of one or more devices. You can also create custom or dynamic groups.
Note: You can organize devices into custom or dynamic groups. For more information, see Grouping Devices (on page 242).
Choose, filter, and reorder columns. Choose and hide columns, reorder columns, and customize your data view.
Filter and pick by column
Click a report heading ( ) and use the "column picker" ( ) from the drop down list.
Control Purpose
Columns. Click a check box to display the column. Clear the check box to hide it.
Move Column. Click on a column heading and drag it to reorder your table's columns.
Note: This report only returns Switch Port Utilization metrics for devices that already have the appropriate credentials. For more information, see Using Credentials.
Share, export, and save as PDF Most generated Switch Port Utilization report data can be printed, shared, and exported when selecting Expand ( ) from the Dashboard Options ( ) menu. After the report has been expanded, select export ( ) to access the following options:

WhatsUp Gold User Guide
622
Export to PDF. Generate a PDF file of the report with user-defined page size and orientation.
Export Data. Export Switch Port Utilization data (on page 951) and leverage outside of WhatsUp Gold.
Schedule Export. Set a recurring date and time, format, and email destination for report data export (on page 942).
VLAN VLAN report reveals devices in the selected device group that belong to network VLANs.
Understand column data The default view of each report contains a grid with the following columns:
Device. Device hostname, IP address, or custom label. IP Address. IP address of the device. Description. The network device description. Serial Number. The network device serial number.
Click a column heading ( ) to display the column selection listing . You can also include:
Model. Device model. Vendor. Device vendor.
Please note, information displayed in this report is only updated when a device is rediscovered. Update and rediscover any device shown to ensure the most up-to-date information for that device is reported here.
Generate a report Choose Device. Choose one or more host devices you want VLAN measurements for.
Use the Select Device dialog for one of the following:
Control Purpose
Device Browse and choose a single device.
Single Interface
Choose an interface on a device.
Device Group
Choose an existing group of one or more devices. You can also create custom or dynamic groups.

WhatsUp Gold User Guide
623
Note: You can organize devices into custom or dynamic groups. For more information, see Grouping Devices (on page 242).
Choose, filter, and reorder columns. Choose and hide columns, reorder columns, and customize your data view.
Filter and pick by column
Click a report heading ( ) and use the "column picker" ( ) from the drop down list.
Control Purpose
Columns. Click a check box to display the column. Clear the check box to hide it.
Move Column. Click on a column heading and drag it to reorder your table's columns.
Note: This report only returns VLAN metrics for devices that already have the appropriate credentials. For more information, see Using Credentials.
Share, export, and save as PDF Most generated VLAN report data can be printed, shared, and exported when selecting Expand ( ) from the Dashboard Options ( ) menu. After the report has been expanded, select export ( ) to access the following options:
Export to PDF. Generate a PDF file of the report with user-defined page size and orientation.
Export Data. Export VLAN data (on page 951) and leverage outside of WhatsUp Gold.
Schedule Export. Set a recurring date and time, format, and email destination for report data export (on page 942).
Subnet Subnet report reveals devices in the selected subnets for a selected device group.
Understand column data The default view of each report contains a grid with the following columns:
Device. Device hostname, IP address, or custom label. IP Address. IP address of the device. Description. The network device description. Serial Number. The network device serial number.

WhatsUp Gold User Guide
624
Click a column heading ( ) to display the column selection listing . You can also include:
Model. Device model. Vendor. Device vendor.
Please note, information displayed in this report is only updated when a device is rediscovered. Update and rediscover any device shown to ensure the most up-to-date information for that device is reported here.
Generate a report Choose Device. Choose one or more host devices you want Subnet measurements for.
Use the Select Device dialog for one of the following:
Control Purpose
Device Browse and choose a single device.
Single Interface
Choose an interface on a device.
Device Group
Choose an existing group of one or more devices. You can also create custom or dynamic groups.
Note: You can organize devices into custom or dynamic groups. For more information, see Grouping Devices (on page 242).
Choose, filter, and reorder columns. Choose and hide columns, reorder columns, and customize your data view.
Filter and pick by column
Click a report heading ( ) and use the "column picker" ( ) from the drop down list.
Control Purpose
Columns. Click a check box to display the column. Clear the check box to hide it.
Move Column. Click on a column heading and drag it to reorder your table's columns.
Note: This report only returns Subnet metrics for devices that already have the appropriate credentials. For more information, see Using Credentials.

WhatsUp Gold User Guide
625
Share, export, and save as PDF Most generated Subnet report data can be printed, shared, and exported when selecting Expand ( ) from the Dashboard Options ( ) menu. After the report has been expanded, select export ( ) to access the following options:
Export to PDF. Generate a PDF file of the report with user-defined page size and orientation.
Export Data. Export Subnet data (on page 951) and leverage outside of WhatsUp Gold.
Schedule Export. Set a recurring date and time, format, and email destination for report data export (on page 942).
Computer Systems Computer Systems report reveals a view of OS and hardware characteristics for devices WhatsUp Gold discovers on the network.
Understand column data The default view of each report contains a grid with the following columns:
Device. Device hostname, IP address, or custom label. System Description. System description. Operating System. Operating system running on the device. OS Service Pack. Operating system service packs or patch information. OS Version. Operating system version at discovery time. Memory Capacity. Amount of the device's RAM that is currently in use. Total Disk Space. Total amount of device disk capacity. Processors. Device processor characteristics.
Click a column heading ( ) to display the column selection listing . You can also include:
Category. Displays the category in which the device was placed during discovery.
System Vendor. Displays the device vendor. System ID Number. Device serial number. OS Manufacturer. Operating system's manufacturer. OS Serial Number. Serial number that was used to register the operating
system. Free Disk Space. Unused disk space on the device.
Please note, information displayed in this report is only updated when a device is rediscovered. Update and rediscover any device shown to ensure the most up-to-date information for that device is reported here.

WhatsUp Gold User Guide
626
Generate a report Choose Device. Choose one or more host devices you want Computer Systems measurements for.
Use the Select Device dialog for one of the following:
Control Purpose
Device Browse and choose a single device.
Single Interface
Choose an interface on a device.
Device Group
Choose an existing group of one or more devices. You can also create custom or dynamic groups.
Note: You can organize devices into custom or dynamic groups. For more information, see Grouping Devices (on page 242).
Choose, filter, and reorder columns. Choose and hide columns, reorder columns, and customize your data view.
Filter and pick by column
Click a report heading ( ) and use the "column picker" ( ) from the drop down list.
Control Purpose
Columns. Click a check box to display the column. Clear the check box to hide it.
Move Column. Click on a column heading and drag it to reorder your table's columns.
Note: This report only returns Computer Systems metrics for devices that already have the appropriate credentials. For more information, see Using Credentials.
Share, export, and save as PDF Most generated Computer Systems report data can be printed, shared, and exported when selecting Expand ( ) from the Dashboard Options ( ) menu. After the report has been expanded, select export ( ) to access the following options:
Export to PDF. Generate a PDF file of the report with user-defined page size and orientation.
Export Data. Export Computer Systems data (on page 951) and leverage outside of WhatsUp Gold.

WhatsUp Gold User Guide
627
Schedule Export. Set a recurring date and time, format, and email destination for report data export (on page 942).
BIOS BIOS report reveals provides a view of the hardware operating system information for the Windows systems that WhatsUp Gold discovers on the network.
Understand column data The default view of each report contains a grid with the following columns:
Device. Device hostname, IP address, or custom label. BIOS Name. Name of the BIOS manufacturer. Serial Number. Device serial number.
Click a column heading ( ) to display the column selection listing . You can also include:
IP Address. Device primary IP address. BIOS Description. Additional BIOS manufacturer description information. Caption. Short description of the BIOS. Release Date. BIOS release date information. Manufacturer. Manufacturer of this software element.
Please note, information displayed in this report is only updated when a device is rediscovered. Update and rediscover any device shown to ensure the most up-to-date information for that device is reported here.
Generate a report Choose Device. Choose one or more host devices you want BIOS measurements for.
Use the Select Device dialog for one of the following:
Control Purpose
Device Browse and choose a single device.
Single Interface
Choose an interface on a device.
Device Group
Choose an existing group of one or more devices. You can also create custom or dynamic groups.
Note: You can organize devices into custom or dynamic groups. For more information, see Grouping Devices (on page 242).

WhatsUp Gold User Guide
628
Choose, filter, and reorder columns. Choose and hide columns, reorder columns, and customize your data view.
Filter and pick by column
Click a report heading ( ) and use the "column picker" ( ) from the drop down list.
Control Purpose
Columns. Click a check box to display the column. Clear the check box to hide it.
Move Column. Click on a column heading and drag it to reorder your table's columns.
Note: This report only returns BIOS metrics for devices that already have the appropriate credentials. For more information, see Using Credentials.
Important: WMI credentials must be applied to each Windows host device for which you want to collect software inventory, operating system inventory, BIOS inventory, and warranty inventory information.
Share, export, and save as PDF Most generated BIOS report data can be printed, shared, and exported when selecting Expand ( ) from the Dashboard Options ( ) menu. After the report has been expanded, select export ( ) to access the following options:
Export to PDF. Generate a PDF file of the report with user-defined page size and orientation.
Export Data. Export BIOS data (on page 951) and leverage outside of WhatsUp Gold.
Schedule Export. Set a recurring date and time, format, and email destination for report data export (on page 942).
Software Updates Software Updates report reveals software updates on Windows systems that WhatsUp Gold discovers.
Understand column data The default view of each report contains a grid with the following columns:
Device. Device hostname, IP address, or custom label. Hot Fix. KB article ID associated with the software update fix. Caption. KB article URL associated with the hot fix update.

WhatsUp Gold User Guide
629
Fix Description. Type of software update that was installed. For example, a security fix or a hot fix.
Click a column heading ( ) to display the column selection listing . You can also include:
Category. Category in which the device was placed during discovery. IP Address. IP address of the device. Comments. Displays any comments provided about the software update. Installed By. Displays username of the person that installed the software. Installed On. Displays the date that the software update was installed. Status. Software update status.
Please note, information displayed in this report is only updated when a device is rediscovered. Update and rediscover any device shown to ensure the most up-to-date information for that device is reported here.
Generate a report Choose Device. Choose one or more host devices you want Software Updates measurements for.
Use the Select Device dialog for one of the following:
Control Purpose
Device Browse and choose a single device.
Single Interface
Choose an interface on a device.
Device Group
Choose an existing group of one or more devices. You can also create custom or dynamic groups.
Note: You can organize devices into custom or dynamic groups. For more information, see Grouping Devices (on page 242).
Choose, filter, and reorder columns. Choose and hide columns, reorder columns, and customize your data view.
Filter and pick by column
Click a report heading ( ) and use the "column picker" ( ) from the drop down list.
Control Purpose
Columns. Click a check box to display the column. Clear the check box to hide it.
Move Column. Click on a column heading and drag it to reorder your table's columns.

WhatsUp Gold User Guide
630
Note: This report only returns Software Updates metrics for devices that already have the appropriate credentials. For more information, see Using Credentials.
Important: To collect software update information, each Windows host device must have WMI (Windows) credentials.
Share, export, and save as PDF Most generated Software Updates report data can be printed, shared, and exported when selecting Expand ( ) from the Dashboard Options ( ) menu. After the report has been expanded, select export ( ) to access the following options:
Export to PDF. Generate a PDF file of the report with user-defined page size and orientation.
Export Data. Export Software Updates data (on page 951) and leverage outside of WhatsUp Gold.
Schedule Export. Set a recurring date and time, format, and email destination for report data export (on page 942).
Windows Services Windows Services report reveals Windows services that WhatsUp Gold discovers.
Understand column data The default view of each report contains a grid with the following columns:
Device. Device hostname, IP address, or custom label. Display Name. Display name of the application service. Description. Description for the application service. State. Status of the application service (Running or Stopped).
Click a column heading ( ) to display the column selection listing . You can also include:
Category. Category in which the device was placed during discovery. IP Address. Device IP address. Name. Device name. Caption. Short description of the service. Install Date. Date on which the service was installed. PathName. Service directory path for the executable (.exe) file. ProcessId. Service process ID. Service Type. Indicates if application service is a unique or shared service. Started. Indicates if service started; True or False.

WhatsUp Gold User Guide
631
Start Mode. Start mode of the Windows base service; either Boot, System, Auto, Manual, or Disabled.
Start Name. Account name under which a service runs. Status. Status information about the software update.
Please note, information displayed in this report is only updated when a device is rediscovered. Update and rediscover any device shown to ensure the most up-to-date information for that device is reported here.
Generate a report Choose Device. Choose one or more host devices you want Windows Services measurements for.
Use the Select Device dialog for one of the following:
Control Purpose
Device Browse and choose a single device.
Single Interface
Choose an interface on a device.
Device Group
Choose an existing group of one or more devices. You can also create custom or dynamic groups.
Note: You can organize devices into custom or dynamic groups. For more information, see Grouping Devices (on page 242).
Choose, filter, and reorder columns. Choose and hide columns, reorder columns, and customize your data view.
Filter and pick by column
Click a report heading ( ) and use the "column picker" ( ) from the drop down list.
Control Purpose
Columns. Click a check box to display the column. Clear the check box to hide it.
Move Column. Click on a column heading and drag it to reorder your table's columns.
Note: This report only returns Windows Services metrics for devices that already have the appropriate credentials. For more information, see Using Credentials.
Important: To collect service information, each Windows host device must have WMI (Windows) credentials.

WhatsUp Gold User Guide
632
Share, export, and save as PDF Most generated Windows Services report data can be printed, shared, and exported when selecting Expand ( ) from the Dashboard Options ( ) menu. After the report has been expanded, select export ( ) to access the following options:
Export to PDF. Generate a PDF file of the report with user-defined page size and orientation.
Export Data. Export Windows Services data (on page 951) and leverage outside of WhatsUp Gold.
Schedule Export. Set a recurring date and time, format, and email destination for report data export (on page 942).
Warranty Information
Warning: The Warranty Information report has been deprecated due to lack of vendor support.
Element Count Element Count table returns a list of devices and interfaces managed by WhatsUp Gold.
Element. A device type managed by WhatsUp Gold (Flow Source or Hyper-V Host Count, for example).
Count. Number of device types managed by WhatsUp Gold.
Total Actions Applied by Type Total Actions Applied by Type provides a summary of actions applied by WhatsUp Gold organized by action type.
Action Name. Displays the type of action. Percentage. Displays the percentage accounted for on the network by that
specific type of action. Count. Displays the total number of that specific type of action on the network.
Active Monitors by Type Active Monitors by Type table lists the numbers of configured and polling active monitors.
Active Monitors by Type provides the following column data:
Active Monitor. <monitor-type>:<monitor-name> Percentage. Percent coverage by this monitor type. Count. Number of instances polling.

WhatsUp Gold User Guide
633
Note: Active Monitors can be added and configured by way of Device Properties and the Monitors Library (on page 106).
Devices by Type Devices with a Specific Attribute Total Devices by Role Total Devices by Role table lists the numbers of WhatsUp Gold managed devices by device role (on page 89).
Total Devices by Role provides the following column data:
Device Role. Role setting as determined at discovery time or set manually in Device Properties (on page 86).
Percentage. Percent of total. Count. Number of devices.
Passive Monitors by Type Passive Monitors by Type gives a summary of passive monitors on the network by type. This can be useful for gathering statistical information as well as general knowledge about the type of monitoring currently in use for your network.
Passive Monitor Type. The type of passive monitor. Percentage. The percentage accounted for on the network by that specific type
of passive monitor. Count. The total number of that specific type of passive monitor on the network.
Share, export, and save as PDF Most generated Passive Monitors by Type report data can be printed, shared, and exported when selecting Expand ( ) from the Dashboard Options ( ) menu. After the report has been expanded, select export ( ) to access the following options:
Export to PDF. Generate a PDF file of the report with user-defined page size and orientation.
Export Data. Export Passive Monitors by Type data (on page 951) and leverage outside of WhatsUp Gold.
Schedule Export. Set a recurring date and time, format, and email destination for report data export (on page 942).
Total Performance Monitors by Type
NTA Database Size Database Size report reveals capacity utilization of your Microsoft SQL Server Express database represented as a pie chart or a gauge.
WhatsUp Gold User Guide
634
Note: No graphs are needed for full Microsoft SQL Server, which does not have the same size limitation as the SQL Server Express.
Database Table Usage Database Table Usage illustrates the distribution of database record types, represented as a bar chart, for a selected WhatsUp Gold database table. By default, it displays the top five record types. The record type "Other" denotes all record types outside the top five's distribution.
Use Report Settings to get record distributions for the following databases:
WhatsUp. (Default) You can purge expired rows in the database using the WhatsUp Gold Admin Console (Tools > Database Utilities > Tools) on the machine where you installed WhatsUp Gold.
NetFlow. (NTA required) Includes NetFlow collector and other NTA data. See Collector Database Maintenance (on page 378) for pruning information. See Listener Port, Collection, and Retention Settings (on page 376) for details regarding NetFlow data retention tuning and archive retention.
NFArchive. (NTA required) Includes archived NetFlow collector and other NTA data. See Collector Database Maintenance (on page 378) for archive purging information.
Note: Microsoft SQL Server Express is limited to a maximum of 10GB in total database size. Microsoft SQL Server has no size limitations.
Generate a report Select a database to chart. Select a database to create a bar chart from using the Report Settings dialog.
Poller Health Poller Health report reveals the status of the local poller as well as any additional pollers installed on your network and allows you to ascertain at a glance if one or more pollers are down.
Understand column data The default view of each report contains a grid with the following columns:
Status. A color-coded indicator of poller status. Name. Displays the name of the poller. Lag Time. The amount of time in seconds the poller is behind its scheduled time
to poll devices; indicates the poller is overloaded. Lag Time Status. Indicates if lag time is causing a polling issue.

WhatsUp Gold User Guide
635
To the left of each poller name is a circular icon that serves as a visual indicator of poller status:
Red. Indicates the listed poller is not active or status is unknown. Yellow. Indicates the poller is starting up or beginning to fail. Green. Indicates the listed poller is active and running properly.
Please note, a yellow status icon is rare and is only seen as an automatic intermediary between red and green when a poller starts up or is failing.
Network Coverage Network Coverage report reveals an at-a-glance breakdown of monitored versus unmonitored devices.
Click to access Report Settings where you can rename the report, if desired.
Share, export, and save as PDF Most generated Network Coverage report data can be printed, shared, and exported when selecting Expand ( ) from the Dashboard Options ( ) menu. After the report has been expanded, select export ( ) to access the following options:
Export to PDF. Generate a PDF file of the report with user-defined page size and orientation.
Export Data. Export Network Coverage data (on page 951) and leverage outside of WhatsUp Gold.
Schedule Export. Set a recurring date and time, format, and email destination for report data export (on page 942).
Network Composition Network Composition report reveals a chart depicting the breakdown of primary roles assigned to devices in the network.
Click to access Report Settings where you can specify chart type, options, and scale as well as rename the report, if desired.
Share, export, and save as PDF Most generated Network Composition report data can be printed, shared, and exported when selecting Expand ( ) from the Dashboard Options ( ) menu. After the report has been expanded, select export ( ) to access the following options:
Export to PDF. Generate a PDF file of the report with user-defined page size and orientation.
Export Data. Export Network Composition data (on page 951) and leverage outside of WhatsUp Gold.
Schedule Export. Set a recurring date and time, format, and email destination for report data export (on page 942).

WhatsUp Gold User Guide
636

637
CHAPTER 27
Remote System Info In This Chapter Remote Group List ................................................................ 637
Remote Site Overview .......................................................... 637
Remote Sites Licensing Usage ............................................. 638
Remote Site List ................................................................... 638
Remote Sites Status ............................................................. 639
Remote Sites Error Log ........................................................ 639
Remote Group List Remote Group List report reveals a summary of the remote WhatsUp Gold polling station you select.
Understand column data The default view of each report contains a grid with the following columns:
HTTP Address. URL to WhatsUp Gold remote station. Last Connect. Last time distributed session was established with remote
station. Last Snapshot. Time of last data retrieval cycle from the remote station. Number of Devices. Number of devices on the remote site. Number of Monitors. Total number of monitors configured for the remote site. Number of Queries. Number of queries running on the remote site.
Remote Site Overview Remote Site Overview report reveals a summary of the remote WhatsUp Gold polling station you select.
Understand column data The default view of each report contains a grid with the following columns:
HTTP Address. URL to WhatsUp Gold remote station. Last Connect. Last time distributed session was established with remote
station. Last Snapshot. Time of last data retrieval cycle from the remote station.

WhatsUp Gold User Guide
638
Number of Devices. Number of devices on the remote site. Number of Monitors. Total number of monitors configured for the remote site. Number of Queries. Number of queries running on the remote site.
Remote Sites Licensing Usage Remote Sites Licensing Usage report reveals licensing usage applied to remotes sites.
Understand column data The default view of each report contains a grid with the following columns:
Central Site. Name of central site. Remote Site. Name of remote site. Points Used. Total number of license points used. Points Licensed. Total number of Points Licensed.
Share, export, and save as PDF Most generated Remote Sites Licensing Usage report data can be printed, shared, and exported when selecting Expand ( ) from the Dashboard Options ( ) menu. After the report has been expanded, select export ( ) to access the following options:
Export to PDF. Generate a PDF file of the report with user-defined page size and orientation.
Export Data. Export Remote Sites Licensing Usage data (on page 951) and leverage outside of WhatsUp Gold.
Schedule Export. Set a recurring date and time, format, and email destination for report data export (on page 942).
Remote Site List Remote Site List reveals all sites configured to use WhatsUp Gold distributed polling environments.
Remote Site. Remote WhatsUp Gold environment name. Local Device. Device paired with remote site. Last Connect Time. Last time distributed session was established with remote
station. Last Snapshot. Time of last data retrieval cycle from the remote station.
Share, export, and save as PDF Most generated Remote Site List report data can be printed, shared, and exported when selecting Expand ( ) from the Dashboard Options ( ) menu. After the report has been expanded, select export ( ) to access the following options:
Export to PDF. Generate a PDF file of the report with user-defined page size and orientation.

WhatsUp Gold User Guide
639
Export Data. Export Remote Site List data (on page 951) and leverage outside of WhatsUp Gold.
Schedule Export. Set a recurring date and time, format, and email destination for report data export (on page 942).
Remote Sites Status Remote Sites Status reveals status of devices and monitors running in WhatsUp Gold distributed polling environments.
Remote Site. Remote WhatsUp Gold environment name. Devices Up. Remote environment devices observed in the Up state. Devices Down. Remote environment devices observed in the Down state. Devices in Maintenance. Remote environment devices observed in
Maintenance state. Monitors Up. Total monitors in remote environment observed in the Up state. Monitors Down. Total monitors in remote environment observed in the Down
state. Last Snapshot. Time of last data retrieval cycle from the remote station.
Share, export, and save as PDF Most generated Remote Sites Status report data can be printed, shared, and exported when selecting Expand ( ) from the Dashboard Options ( ) menu. After the report has been expanded, select export ( ) to access the following options:
Export to PDF. Generate a PDF file of the report with user-defined page size and orientation.
Export Data. Export Remote Sites Status data (on page 951) and leverage outside of WhatsUp Gold.
Schedule Export. Set a recurring date and time, format, and email destination for report data export (on page 942).
Remote Sites Error Log Remote Sites Error Log report reveals all error messages generated by remote site connection attempts.
Understand column data The default view of each report contains a grid with the following columns:
Date. Date and time of event. Type. Category of error. For example: Con. Failed (Connection Failed), Auth
Error (Authentication Error). Message. The error message received. Remote Site. Remote site on which the failed connection took place.

WhatsUp Gold User Guide
640
Fetch and filter log data Choose time constraints. Choose specific windows for log data, reduce by date range, or choose Last Polled for the latest.
Choose time constraints for data view Control Purpose
Date Range (on page 944)
Choose or define an overall date range.
Business hours (on page 944)
Focus on specific days of the week and periods within each day. Reveal trends that are sensitive to business hours, time zones,
and other periodic attributes in the observed data.
Filter and reduce by row and by column. Select rows based on specific column values, remove columns, and remove noise and chaff from the table.
Filter tables rows and hide and select columns
Click a column heading and use the following from the drop down list:
Control Purpose
Sort. Sort column in ascending or descending order.
Columns. Pick the columns you want to view. Click a check box to display the column. Clear the check box to hide it.
Group by this field.
Group table into collapsible rows wherever the current column contains identical data ("field") values.
Filters. Provide a keyword and use wildcards to view only rows that contain the keyword for the selected column or view.
Most column and log view filters provide the following wildcard matching:
Match either zero characters or any one character ('?'). Example: 198.51.100.2? (Matches tokens with IP address ending with 2, or 20-29.)
Match either zero, any one, or many characters ('*'). Example: Stop* (Matches log strings containing Stop, Stopped, Stopping, and so on.)
WhatsUp Gold User Guide
641
Share, export, and save as PDF Most generated Remote Sites Error Log report data can be printed, shared, and exported when selecting Expand ( ) from the Dashboard Options ( ) menu. After the report has been expanded, select export ( ) to access the following options:
Export to PDF. Generate a PDF file of the report with user-defined page size and orientation.
Export Data. Export Remote Sites Error Log data (on page 951) and leverage outside of WhatsUp Gold.
Schedule Export. Set a recurring date and time, format, and email destination for report data export (on page 942).

642
CHAPTER 28
Troubleshooting In This Chapter Specific Device ..................................................................... 642
Actions Fired ......................................................................... 667
Completely Down Devices .................................................... 670
Device Group Mini Status ..................................................... 673
Down Active Monitors ........................................................... 674
Devices with Down Critical Monitors ..................................... 677
Down Interfaces .................................................................... 679
Summary Counts .................................................................. 682
State Change Acknowledgment Report ................................ 685
Tail of Action Activity Log ...................................................... 686
Tail of Passive Monitor Error Log .......................................... 689
Tail of SNMP Trap Log ......................................................... 692
Tail of State Change Log ...................................................... 695
Tail of Syslog ........................................................................ 698
Tail of Windows Event Log ................................................... 701
Unacknowledged Devices ..................................................... 704
Down Active Monitors ........................................................... 705
Specific Device State Change Timeline State Change Timeline report reveals the timeline of when a monitor on a device, or all monitors on all devices in a group, changed from one state to another during a selected time period.
Understand column data The default view of each report contains a grid with the following columns:
Device. Device hostname, IP address, or custom label. Monitor. Monitor that experienced the state change. Start Time. Date and time of the state change.

WhatsUp Gold User Guide
643
State. State of the condition at the time of the poll. The thin gray bar on a state indicator color block means that the device state change has not been acknowledged.
Duration. Period the state remained unchanged. Message. Result message returned to WhatsUp Gold at the time of the poll.
Generate a report Choose Device. Choose one or more host devices you want State Change Timeline measurements for.
Use the Select Device dialog for one of the following:
Control Purpose
Device Browse and choose a single device.
Single Interface
Choose an interface on a device.
Device Group
Choose an existing group of one or more devices. You can also create custom or dynamic groups.
Note: You can organize devices into custom or dynamic groups. For more information, see Grouping Devices (on page 242).
Choose time constraints. ( , ) Choose times for the State Change Timeline. (For recently observed measurements, select Last Polled from the Date Range drop down list.)
Choose time constraints for data view Control Purpose
Date Range (on page 944)
Choose or define an overall date range.
Business hours (on page 944)
Focus on specific days of the week and periods within each day. Reveal trends that are sensitive to business hours, time zones,
and other periodic attributes in the observed data.
Filter and reduce by row and by column. Sort and remove columns, group rows based on specific column values, and remove unwanted information from the table.
Filter and pick by column
Click a report heading and use the following from the drop down list:

WhatsUp Gold User Guide
644
Control Purpose
Sort. Sort column in ascending or descending order.
Columns. Pick the columns you want to view. Click a check box to display the column. Clear the check box to hide it.
Group by this field.
Group table into collapsible rows wherever the current column contains identical data ("field") values.
Filters. Provide a keyword to view only rows that contain the keyword for this column.
Rename Report. Edit report name using the Report Settings dialog.
Note: This report only returns State Change Timeline metrics for devices that already have the appropriate WMI or SNMP credentials. For more information, see Using Credentials.
Share, export, and save as PDF Most generated State Change Timeline report data can be printed, shared, and exported when selecting Expand ( ) from the Dashboard Options ( ) menu. After the report has been expanded, select export ( ) to access the following options:
Export to PDF. Generate a PDF file of the report with user-defined page size and orientation.
Export Data. Export State Change Timeline data (on page 951) and leverage outside of WhatsUp Gold.
Schedule Export. Set a recurring date and time, format, and email destination for report data export (on page 942).
Down Active Monitors Down Active Monitors report reveals active monitors showing a down state.
Understand column data The default view of each report contains a grid with the following columns:
Device. Device hostname, IP address, or custom label. Status. Status of the monitor after the last poll.

WhatsUp Gold User Guide
645
Generate a report Choose Device. Choose one or more host devices you want Down Active Monitors measurements for.
Use the Select Device dialog for one of the following:
Control Purpose
Device Browse and choose a single device.
Single Interface
Choose an interface on a device.
Device Group
Choose an existing group of one or more devices. You can also create custom or dynamic groups.
Note: You can organize devices into custom or dynamic groups. For more information, see Grouping Devices (on page 242).
Choose time constraints. ( , ) Choose times for the Down Active Monitors. (For recently observed measurements, select Last Polled from the Date Range drop down list.)
Choose time constraints for data view Control Purpose
Date Range (on page 944)
Choose or define an overall date range.
Business hours (on page 944)
Focus on specific days of the week and periods within each day. Reveal trends that are sensitive to business hours, time zones,
and other periodic attributes in the observed data.
Filter and reduce by row and by column. Sort and remove columns, group rows based on specific column values, and remove unwanted information from the table.
Filter and pick by column
Click a report heading and use the following from the drop down list:
Control Purpose
Sort. Sort column in ascending or descending order.
Columns. Pick the columns you want to view. Click a check box to display the column. Clear the check box to hide it.

WhatsUp Gold User Guide
646
Group by this field.
Group table into collapsible rows wherever the current column contains identical data ("field") values.
Filters. Provide a keyword to view only rows that contain the keyword for this column.
Chart, adjust output, and visualize. Fine tune report presentation and range of values displayed using the Report Settings dialog (optional).
Specify threshold and top n: Control Purpose
Show Top n Items Limit items to the samples with the highest (or lowest) utilization.
Threshold Type Switch between minimum or maximum mode for cutoff values for the ranked list.
At or Over. Show peak usage period. (Utilization percentage equal to or greater than Threshold.)
At or Under. Show usage periods where resources are unused or possibly down. (Utilization percentage equal to or less than Threshold.)
Threshold (percent)
Baseline value used to trim ranked device list based on peak or subpeak capacity when returning the Top n.
Chart and visualize data over time (single device ) Charting and visualization is available when you select a single device.
Control Purpose
Display Options Present data as a chart, a table grid, or both.
Chart Type Gauge charts. Available when you select a Date Range of Last Polled .
Time series. Available when you select a Date Range interval (Today , for example).
Line/Area. Scatter graph that connects adjacent measurements with straight lines.
Spline/Area Spline. Choose a graph with a smoothed appearance where adjacent samples exhibit a gradual slope.
Chart Options Legend, Grid Lines, Range Selector. Include legend, grid lines, and range selector for readability.
Trend Lines. Present data with a smoothed average to show trend.

WhatsUp Gold User Guide
647
Tip: Trend lines represent a moving average that can be compared with line and area graphs to reveal peak and sub peak intervals, periods of burstiness, latency, and interruption.
Note: This report only returns Down Active Monitors metrics for devices that already have the appropriate WMI or SNMP credentials. For more information, see Using Credentials.
Share, export, and save as PDF Most generated Down Active Monitors report data can be printed, shared, and exported when selecting Expand ( ) from the Dashboard Options ( ) menu. After the report has been expanded, select export ( ) to access the following options:
Export to PDF. Generate a PDF file of the report with user-defined page size and orientation.
Export Data. Export Down Active Monitors data (on page 951) and leverage outside of WhatsUp Gold.
Schedule Export. Set a recurring date and time, format, and email destination for report data export (on page 942).
Down Interfaces Down Interfaces report reveals interfaces in a down state.
Understand column data The default view of each report contains a grid with the following columns:
Device. Device hostname, IP address, or custom label. Status. Status of the monitor after the last poll.
Generate a report Choose Device. Choose one or more host devices you want Down Interfaces measurements for.
Use the Select Device dialog for one of the following:
Control Purpose
Device Browse and choose a single device.
Single Interface
Choose an interface on a device.
Device Group
Choose an existing group of one or more devices. You can also create custom or dynamic groups.

WhatsUp Gold User Guide
648
Note: You can organize devices into custom or dynamic groups. For more information, see Grouping Devices (on page 242).
Choose time constraints. ( , ) Choose times for the Down Interfaces. (For recently observed measurements, select Last Polled from the Date Range drop down list.)
Choose time constraints for data view Control Purpose
Date Range (on page 944)
Choose or define an overall date range.
Business hours (on page 944)
Focus on specific days of the week and periods within each day. Reveal trends that are sensitive to business hours, time zones,
and other periodic attributes in the observed data.
Filter and reduce by row and by column. Sort and remove columns, group rows based on specific column values, and remove unwanted information from the table.
Filter and pick by column
Click a report heading and use the following from the drop down list:
Control Purpose
Sort. Sort column in ascending or descending order.
Columns. Pick the columns you want to view. Click a check box to display the column. Clear the check box to hide it.
Group by this field.
Group table into collapsible rows wherever the current column contains identical data ("field") values.
Filters. Provide a keyword to view only rows that contain the keyword for this column.
WhatsUp Gold User Guide
649
Chart, adjust output, and visualize. Fine tune report presentation and range of values displayed using the Report Settings dialog (optional).
Specify threshold and top n: Control Purpose
Show Top n Items Limit items to the samples with the highest (or lowest) utilization.
Threshold Type Switch between minimum or maximum mode for cutoff values for the ranked list.
At or Over. Show peak usage period. (Utilization percentage equal to or greater than Threshold.)
At or Under. Show usage periods where resources are unused or possibly down. (Utilization percentage equal to or less than Threshold.)
Threshold (percent)
Baseline value used to trim ranked device list based on peak or subpeak capacity when returning the Top n.
Chart and visualize data over time (single device ) Charting and visualization is available when you select a single device.
Control Purpose
Display Options Present data as a chart, a table grid, or both.
Chart Type Gauge charts. Available when you select a Date Range of Last Polled .
Time series. Available when you select a Date Range interval (Today , for example).
Line/Area. Scatter graph that connects adjacent measurements with straight lines.
Spline/Area Spline. Choose a graph with a smoothed appearance where adjacent samples exhibit a gradual slope.
Chart Options Legend, Grid Lines, Range Selector. Include legend, grid lines, and range selector for readability.
Trend Lines. Present data with a smoothed average to show trend.
Tip: Trend lines represent a moving average that can be compared with line and area graphs to reveal peak and sub peak intervals, periods of burstiness, latency, and interruption.
Note: This report only returns Down Interfaces metrics for devices that already have the appropriate WMI or SNMP credentials. For more information, see Using Credentials.

WhatsUp Gold User Guide
650
Share, export, and save as PDF Most generated Down Interfaces report data can be printed, shared, and exported when selecting Expand ( ) from the Dashboard Options ( ) menu. After the report has been expanded, select export ( ) to access the following options:
Export to PDF. Generate a PDF file of the report with user-defined page size and orientation.
Export Data. Export Down Interfaces data (on page 951) and leverage outside of WhatsUp Gold.
Schedule Export. Set a recurring date and time, format, and email destination for report data export (on page 942).
Interface Discards Interface Discards report reveals top interfaces with packet discards for inbound and outbound data. Discards typically occur when interfaces are under a high traffic load. An interface showing high discard counts under normal traffic load is an indicator of hardware issues.
Understand column data The default view of each report contains a grid with the following columns:
Device. Device hostname, IP address, or custom label. Interface. Displays a short description of the interface. Transmit. Count of outbound (transmit channel) discarded. Receive. Count of received packets discarded. Total. Packet discard count for each interface.
Generate a report Choose source. , Choose a networking device or single physical or virtual interface you want to see Interface Discards measurements for. Choose traffic direction across an interface.
Use the Select Device dialog for one of the following:
Control Description
Device. Browse and choose a networking device that is a Network Traffic Analysis monitoring source.
Network Interface.
Choose a single physical or virtual interface Network Traffic Analysis you want traffic statistics for.
Choose direction of traffic over the network interface (Inbound, Outbound, Inbound and Outbound, or Bounce for invalid traffic.).

WhatsUp Gold User Guide
651
Choose time constraints. Choose times for the Interface Discards.Choose, filter, and reorder columns. Choose and hide columns, reorder columns, and apply advanced filters (on page 381) to customize your data view.
Filter and pick by column
Click a report heading ( ) and use the "column picker" ( ) from the drop down list.
Control Purpose
Columns. Click a check box to display the column. Clear the check box to hide it.
Move Column. Click on a column heading and drag it to reorder your table's columns.
Advanced Filtering (on page 381).
Apply category, pattern, and keyword filtering to column data.
Choose time constraints for data view Control Purpose
Date Range (on page 944)
Choose or define an overall date range.
Business hours (on page 944)
Focus on specific days of the week and periods within each day. Reveal trends that are sensitive to business hours, time zones,
and other periodic attributes in the observed data.
Chart, adjust output, and visualize. Fine tune report presentation and range of values displayed using the Report Settings dialog (optional).
Specify threshold and top n: Control Purpose
Show Top n Items Limit items to the samples with the highest values.
Sort by Field Select a column to sort by (if applicable).

WhatsUp Gold User Guide
652
Chart and view options Control Purpose
View Options Select/clear the checkboxes to display/hide Totals. Display totals for each column. Others. Remainder values that do not make the top n. Chart. Display the selected Chart Type. Legend. Include legend and grid lines for readability. Trend Lines. Present data a smoothed average to show trend.
Chart Type Select a chart type and associated options: Pie. Pie distribution chart. Line/Area. Scatter graph that connects adjacent measurements
with straight lines. Spline/Area Spline. Choose a graph with a smoothed
appearance where adjacent samples exhibit a gradual slope. Vertical Bar/Horizontal Bar. Vertical or horizontal bar
chart/histogram. Y-Axis Scale Scale Y-axis (chart and graph height) automatically or choose a fixed size.
Share, export, and save as PDF Most generated Interface Discards report data can be printed, shared, and exported when selecting Expand ( ) from the Dashboard Options ( ) menu. After the report has been expanded, select export ( ) to access the following options:
Export to PDF. Generate a PDF file of the report with user-defined page size and orientation.
Export Data. Export Interface Discards data (on page 951) and leverage outside of WhatsUp Gold.
Schedule Export. Set a recurring date and time, format, and email destination for report data export (on page 942).
Interface Errors Interface Errors report reveals the top n network interfaces errors. Errors can occur due to resource or buffer availability, collisions, and so on. A packet can have more than one error.
Understand column data The default view of each report contains a grid with the following columns:
Device. Device hostname, IP address, or custom label. Interface. Textual name of the interface (ifName). Transmit. Error count at transmit time. Receive. Error count at receive time.

WhatsUp Gold User Guide
653
Total. Displays the number of errors for each interface.
Generate a report Choose Device. Choose one or more host devices you want Interface Errors measurements for.
Use the Select Device dialog for one of the following:
Control Purpose
Device Browse and choose a single device.
Single Interface
Choose an interface on a device.
Device Group
Choose an existing group of one or more devices. You can also create custom or dynamic groups.
Note: You can organize devices into custom or dynamic groups. For more information, see Grouping Devices (on page 242).
Choose time constraints. ( , ) Choose times for the Interface Errors. (For recently observed measurements, select Last Polled from the Date Range drop down list.)
Choose time constraints for data view Control Purpose
Date Range (on page 944)
Choose or define an overall date range.
Business hours (on page 944)
Focus on specific days of the week and periods within each day. Reveal trends that are sensitive to business hours, time zones,
and other periodic attributes in the observed data.
Filter and reduce by row and by column. Sort and remove columns, group rows based on specific column values, and remove unwanted information from the table.
Filter and pick by column
Click a report heading and use the following from the drop down list:
Control Purpose
Sort. Sort column in ascending or descending order.

WhatsUp Gold User Guide
654
Columns. Pick the columns you want to view. Click a check box to display the column. Clear the check box to hide it.
Group by this field.
Group table into collapsible rows wherever the current column contains identical data ("field") values.
Filters. Provide a keyword to view only rows that contain the keyword for this column.
Chart, adjust output, and visualize. Fine tune report presentation and range of values displayed using the Report Settings dialog (optional).
Specify threshold and top n: Control Purpose
Show Top n Items Limit items to the samples with the highest (or lowest) utilization.
Threshold Type Switch between minimum or maximum mode for cutoff values for the ranked list.
At or Over. Show peak usage period. (Utilization percentage equal to or greater than Threshold.)
At or Under. Show usage periods where resources are unused or possibly down. (Utilization percentage equal to or less than Threshold.)
Threshold (percent)
Baseline value used to trim ranked device list based on peak or subpeak capacity when returning the Top n.
Chart and visualize data over time (single device ) Charting and visualization is available when you select a single device.
Control Purpose
Display Options Present data as a chart, a table grid, or both.
Chart Type Gauge charts. Available when you select a Date Range of Last Polled .
Time series. Available when you select a Date Range interval (Today , for example).
Line/Area. Scatter graph that connects adjacent measurements with straight lines.
Spline/Area Spline. Choose a graph with a smoothed appearance where adjacent samples exhibit a gradual slope.
WhatsUp Gold User Guide
655
Chart Options Legend, Grid Lines, Range Selector. Include legend, grid lines, and range selector for readability.
Trend Lines. Present data with a smoothed average to show trend.
Tip: Trend lines represent a moving average that can be compared with line and area graphs to reveal peak and sub peak intervals, periods of burstiness, latency, and interruption.
Note: This report only returns Interface Errors metrics for devices that already have the appropriate WMI or SNMP credentials. For more information, see Using Credentials.
Share, export, and save as PDF Most generated Interface Errors report data can be printed, shared, and exported when selecting Expand ( ) from the Dashboard Options ( ) menu. After the report has been expanded, select export ( ) to access the following options:
Export to PDF. Generate a PDF file of the report with user-defined page size and orientation.
Export Data. Export Interface Errors data (on page 951) and leverage outside of WhatsUp Gold.
Schedule Export. Set a recurring date and time, format, and email destination for report data export (on page 942).
Interface Errors and Discards Interface Errors and Discards report reveals interface error and discard data. A packet can have more than one error.
Understand column data The default view of each report contains a grid with the following columns:
Device. Device hostname, IP address, or custom label. This is the host where the interface is configured.
Description. Text string associated with interface. Transmit Errors. Packet error count on transmit. Receive Errors. Packet error count on receive. Transmit Discards. Count of packets abandoned at transmit time. Receive Discards. Count of received packets discarded.
Generate a report Choose Device. Choose one or more host devices you want Interface Errors and Discards measurements for.
Use the Select Device dialog for one of the following:

WhatsUp Gold User Guide
656
Control Purpose
Device Browse and choose a single device.
Single Interface
Choose an interface on a device.
Device Group
Choose an existing group of one or more devices. You can also create custom or dynamic groups.
Note: You can organize devices into custom or dynamic groups. For more information, see Grouping Devices (on page 242).
Choose time constraints. ( , ) Choose times for the Interface Errors and Discards. (For recently observed measurements, select Last Polled from the Date Range drop down list.)
Choose time constraints for data view Control Purpose
Date Range (on page 944)
Choose or define an overall date range.
Business hours (on page 944)
Focus on specific days of the week and periods within each day. Reveal trends that are sensitive to business hours, time zones,
and other periodic attributes in the observed data.
Filter and reduce by row and by column. Sort and remove columns, group rows based on specific column values, and remove unwanted information from the table.
Filter and pick by column
Click a report heading and use the following from the drop down list:
Control Purpose
Sort. Sort column in ascending or descending order.
Columns. Pick the columns you want to view. Click a check box to display the column. Clear the check box to hide it.
Group by this field.
Group table into collapsible rows wherever the current column contains identical data ("field") values.

WhatsUp Gold User Guide
657
Filters. Provide a keyword to view only rows that contain the keyword for this column.
Chart, adjust output, and visualize. Fine tune report presentation and range of values displayed using the Report Settings dialog (optional).
Specify threshold and top n: Control Purpose
Show Top n Items Limit items to the samples with the highest (or lowest) utilization.
Threshold Type Switch between minimum or maximum mode for cutoff values for the ranked list.
At or Over. Show peak usage period. (Utilization percentage equal to or greater than Threshold.)
At or Under. Show usage periods where resources are unused or possibly down. (Utilization percentage equal to or less than Threshold.)
Threshold (percent)
Baseline value used to trim ranked device list based on peak or subpeak capacity when returning the Top n.
Chart and visualize data over time (single device ) Charting and visualization is available when you select a single device.
Control Purpose
Display Options Present data as a chart, a table grid, or both.
Chart Type Gauge charts. Available when you select a Date Range of Last Polled .
Time series. Available when you select a Date Range interval (Today , for example).
Line/Area. Scatter graph that connects adjacent measurements with straight lines.
Spline/Area Spline. Choose a graph with a smoothed appearance where adjacent samples exhibit a gradual slope.
Chart Options Legend, Grid Lines, Range Selector. Include legend, grid lines, and range selector for readability.
Trend Lines. Present data with a smoothed average to show trend.
Tip: Trend lines represent a moving average that can be compared with line and area graphs to reveal peak and sub peak intervals, periods of burstiness, latency, and interruption.

WhatsUp Gold User Guide
658
Note: This report only returns Interface Errors and Discards metrics for devices that already have the appropriate WMI or SNMP credentials. For more information, see Using Credentials.
Note: To harvest data for this report, you must enable collection of Interface Utilization performance monitor data collection under Device Properties and ensure the Collect errors and discards data for all selected interfaces interface data collection configuration option is selected .
Share, export, and save as PDF Most generated Interface Errors and Discards report data can be printed, shared, and exported when selecting Expand ( ) from the Dashboard Options ( ) menu. After the report has been expanded, select export ( ) to access the following options:
Export to PDF. Generate a PDF file of the report with user-defined page size and orientation.
Export Data. Export Interface Errors and Discards data (on page 951) and leverage outside of WhatsUp Gold.
Schedule Export. Set a recurring date and time, format, and email destination for report data export (on page 942).
Quarterly Availability Summary The Quarterly Availability Summary displays a suite of reports that present the state of all active monitors within a device group for the selected time period.
The Group Information chart displays a list of attributes applied to the selected device or group of devices along with their associated values.
The Monitor Summary chart displays an overview of active monitors by type. Data points reported include the percentage of time each monitor was determined to be up, in maintenance mode or down, the number of instances in which each monitor went down, and the overall availability for the active monitor, by color.
The Device Details chart displays more detailed information about each active monitor by device. It contains percentage values of time each monitor was determined to be up, in maintenance mode, down, or if the status was unknown, how long each monitor was down, and the number of instances in which each monitor went down.
Please note, this dashboard is completely static. Additional reports cannot be added and the charts described previously cannot be removed. Only the device(s) displayed ( ), reporting time frame ( ).

WhatsUp Gold User Guide
659
Tail of Action Activity Log Tail of Action Activity Log report reveals the n most recent actions recorded (also known as the "tail") for the activity log. This report is useful for quick access to the most recent actions, triggers, and last recorded activities on your network.
Understand column data The default view of each report contains a grid with the following columns:
Device. Source of the action or event. Click to bring up Device Status report. Date. Date and time of event. Action Name. Name of the action. Trigger. Trigger for the action Click a trigger to open the State Change
Timeline.
Generate a report Choose Device. Choose one or more host devices you want Tail of Action Activity Log measurements for.
Use the Select Device dialog for one of the following:
Control Purpose
Device Browse and choose a single device.
Single Interface
Choose an interface on a device.
Device Group
Choose an existing group of one or more devices. You can also create custom or dynamic groups.
Note: You can organize devices into custom or dynamic groups. For more information, see Grouping Devices (on page 242).
Choose time constraints. ( , ) Choose times for the Tail of Action Activity Log. (For recently observed measurements, select Last Polled from the Date Range drop down list.)
Choose time constraints for data view Control Purpose
Date Range (on page 944)
Choose or define an overall date range.
Business hours (on page 944)
Focus on specific days of the week and periods within each day. Reveal trends that are sensitive to business hours, time zones,
and other periodic attributes in the observed data.
WhatsUp Gold User Guide
660
Filter and reduce by row and by column. Sort and remove columns, group rows based on specific column values, and remove unwanted information from the table.
Filter and pick by column
Click a report heading and use the following from the drop down list:
Control Purpose
Sort. Sort column in ascending or descending order.
Columns. Pick the columns you want to view. Click a check box to display the column. Clear the check box to hide it.
Group by this field.
Group table into collapsible rows wherever the current column contains identical data ("field") values.
Filters. Provide a keyword to view only rows that contain the keyword for this column.
Chart, adjust output, and visualize. Fine tune report presentation and range of values displayed using the Report Settings dialog (optional).
Specify threshold and top n: Control Purpose
Show Top n Items Limit items to the samples with the highest (or lowest) utilization.
Threshold Type Switch between minimum or maximum mode for cutoff values for the ranked list.
At or Over. Show peak usage period. (Utilization percentage equal to or greater than Threshold.)
At or Under. Show usage periods where resources are unused or possibly down. (Utilization percentage equal to or less than Threshold.)
Threshold (percent)
Baseline value used to trim ranked device list based on peak or subpeak capacity when returning the Top n.
Chart and visualize data over time (single device ) Charting and visualization is available when you select a single device.
WhatsUp Gold User Guide
661
Control Purpose
Display Options Present data as a chart, a table grid, or both.
Chart Type Gauge charts. Available when you select a Date Range of Last Polled .
Time series. Available when you select a Date Range interval (Today , for example).
Line/Area. Scatter graph that connects adjacent measurements with straight lines.
Spline/Area Spline. Choose a graph with a smoothed appearance where adjacent samples exhibit a gradual slope.
Chart Options Legend, Grid Lines, Range Selector. Include legend, grid lines, and range selector for readability.
Trend Lines. Present data with a smoothed average to show trend.
Tip: Trend lines represent a moving average that can be compared with line and area graphs to reveal peak and sub peak intervals, periods of burstiness, latency, and interruption.
Note: This report only returns Tail of Action Activity Log metrics for devices that already have the appropriate WMI or SNMP credentials. For more information, see Using Credentials.
Share, export, and save as PDF Most generated Tail of Action Activity Log report data can be printed, shared, and exported when selecting Expand ( ) from the Dashboard Options ( ) menu. After the report has been expanded, select export ( ) to access the following options:
Export to PDF. Generate a PDF file of the report with user-defined page size and orientation.
Export Data. Export Tail of Action Activity Log data (on page 951) and leverage outside of WhatsUp Gold.
Schedule Export. Set a recurring date and time, format, and email destination for report data export (on page 942).
Tail of Passive Monitor Error Log Tail of SNMP Trap Log Tail of Syslog Tail of Syslog report reveals the n most recent UNIX and Linux device system log (on page 822) ("syslog") messages recorded (also referred to as the "tail") for devices you select. This report enables quick access to the last known events to occur on UNIX and Linux host devices on your network.

WhatsUp Gold User Guide
662
Understand column data The default view of each report contains a grid with the following columns:
Date. Date and time of event. Device. Device hostname, IP address, or custom label. Syslog Type. Severity of message. Payload. Full syslog message.
Note: Syslog listener with the appropriate credentials must be enabled in order for this report to show syslog messages from UNIX and Linux devices in your network. For more information, see Working with Credentials.
Generate a report Choose Device. Choose one or more host devices you want Tail of Syslog measurements for.
Use the Select Device dialog for one of the following:
Control Purpose
Device Browse and choose a single device.
Single Interface
Choose an interface on a device.
Device Group
Choose an existing group of one or more devices. You can also create custom or dynamic groups.
Note: You can organize devices into custom or dynamic groups. For more information, see Grouping Devices (on page 242).
Choose time constraints. ( , ) Choose times for the Tail of Syslog. (For recently observed measurements, select Last Polled from the Date Range drop down list.)
Choose time constraints for data view Control Purpose
Date Range (on page 944)
Choose or define an overall date range.
Business hours (on page 944)
Focus on specific days of the week and periods within each day. Reveal trends that are sensitive to business hours, time zones,
and other periodic attributes in the observed data.

WhatsUp Gold User Guide
663
Filter and reduce by row and by column. Sort and remove columns, group rows based on specific column values, and remove unwanted information from the table.
Filter and pick by column
Click a report heading and use the following from the drop down list:
Control Purpose
Sort. Sort column in ascending or descending order.
Columns. Pick the columns you want to view. Click a check box to display the column. Clear the check box to hide it.
Group by this field.
Group table into collapsible rows wherever the current column contains identical data ("field") values.
Filters. Provide a keyword to view only rows that contain the keyword for this column.
Chart, adjust output, and visualize. Fine tune report presentation and range of values displayed using the Report Settings dialog (optional).
Specify threshold and top n: Control Purpose
Show Top n Items Limit items to the samples with the highest (or lowest) utilization.
Threshold Type Switch between minimum or maximum mode for cutoff values for the ranked list.
At or Over. Show peak usage period. (Utilization percentage equal to or greater than Threshold.)
At or Under. Show usage periods where resources are unused or possibly down. (Utilization percentage equal to or less than Threshold.)
Threshold (percent)
Baseline value used to trim ranked device list based on peak or subpeak capacity when returning the Top n.
Chart and visualize data over time (single device ) Charting and visualization is available when you select a single device.
Control Purpose
Display Options Present data as a chart, a table grid, or both.

WhatsUp Gold User Guide
664
Chart Type Gauge charts. Available when you select a Date Range of Last Polled .
Time series. Available when you select a Date Range interval (Today , for example).
Line/Area. Scatter graph that connects adjacent measurements with straight lines.
Spline/Area Spline. Choose a graph with a smoothed appearance where adjacent samples exhibit a gradual slope.
Chart Options Legend, Grid Lines, Range Selector. Include legend, grid lines, and range selector for readability.
Trend Lines. Present data with a smoothed average to show trend.
Tip: Trend lines represent a moving average that can be compared with line and area graphs to reveal peak and sub peak intervals, periods of burstiness, latency, and interruption.
Note: This report only returns Tail of Syslog metrics for devices that already have the appropriate WMI or SNMP credentials. For more information, see Using Credentials.
Share, export, and save as PDF Most generated Tail of Syslog report data can be printed, shared, and exported when selecting Expand ( ) from the Dashboard Options ( ) menu. After the report has been expanded, select export ( ) to access the following options:
Export to PDF. Generate a PDF file of the report with user-defined page size and orientation.
Export Data. Export Tail of Syslog data (on page 951) and leverage outside of WhatsUp Gold.
Schedule Export. Set a recurring date and time, format, and email destination for report data export (on page 942).
Tail of Windows Event Log Web Alarms Web Alarms report reveals recent web alarms observed on your network.
Understand column data The default view of each report contains a grid with the following columns:
Date. Date and time of event. Source. Source of the alarm. Message. Web alarm message. Trigger. Condition or state changed that caused the alarm.
WhatsUp Gold User Guide
665
Generate a report Choose Device. Choose one or more host devices you want Web Alarms measurements for.
Use the Select Device dialog for one of the following:
Control Purpose
Device Browse and choose a single device.
Single Interface
Choose an interface on a device.
Device Group
Choose an existing group of one or more devices. You can also create custom or dynamic groups.
Note: You can organize devices into custom or dynamic groups. For more information, see Grouping Devices (on page 242).
Choose time constraints. ( , ) Choose times for the Web Alarms. (For recently observed measurements, select Last Polled from the Date Range drop down list.)
Choose time constraints for data view Control Purpose
Date Range (on page 944)
Choose or define an overall date range.
Business hours (on page 944)
Focus on specific days of the week and periods within each day. Reveal trends that are sensitive to business hours, time zones,
and other periodic attributes in the observed data.
Filter and reduce by row and by column. Sort and remove columns, group rows based on specific column values, and remove unwanted information from the table.
Filter and pick by column
Click a report heading and use the following from the drop down list:
Control Purpose
Sort. Sort column in ascending or descending order.
Columns. Pick the columns you want to view. Click a check box to display the column. Clear the check box to hide it.

WhatsUp Gold User Guide
666
Group by this field.
Group table into collapsible rows wherever the current column contains identical data ("field") values.
Filters. Provide a keyword to view only rows that contain the keyword for this column.
Chart, adjust output, and visualize. Fine tune report presentation and range of values displayed using the Report Settings dialog (optional).
Specify threshold and top n: Control Purpose
Show Top n Items Limit items to the samples with the highest (or lowest) utilization.
Threshold Type Switch between minimum or maximum mode for cutoff values for the ranked list.
At or Over. Show peak usage period. (Utilization percentage equal to or greater than Threshold.)
At or Under. Show usage periods where resources are unused or possibly down. (Utilization percentage equal to or less than Threshold.)
Threshold (percent)
Baseline value used to trim ranked device list based on peak or subpeak capacity when returning the Top n.
Chart and visualize data over time (single device ) Charting and visualization is available when you select a single device.
Control Purpose
Display Options Present data as a chart, a table grid, or both.
Chart Type Gauge charts. Available when you select a Date Range of Last Polled .
Time series. Available when you select a Date Range interval (Today , for example).
Line/Area. Scatter graph that connects adjacent measurements with straight lines.
Spline/Area Spline. Choose a graph with a smoothed appearance where adjacent samples exhibit a gradual slope.
Chart Options Legend, Grid Lines, Range Selector. Include legend, grid lines, and range selector for readability.
Trend Lines. Present data with a smoothed average to show trend.

WhatsUp Gold User Guide
667
Tip: Trend lines represent a moving average that can be compared with line and area graphs to reveal peak and sub peak intervals, periods of burstiness, latency, and interruption.
Note: This report only returns Web Alarms metrics for devices that already have the appropriate WMI or SNMP credentials. For more information, see Using Credentials.
Share, export, and save as PDF Most generated Web Alarms report data can be printed, shared, and exported when selecting Expand ( ) from the Dashboard Options ( ) menu. After the report has been expanded, select export ( ) to access the following options:
Export to PDF. Generate a PDF file of the report with user-defined page size and orientation.
Export Data. Export Web Alarms data (on page 951) and leverage outside of WhatsUp Gold.
Schedule Export. Set a recurring date and time, format, and email destination for report data export (on page 942).
Actions Fired Actions Fired report reveals network devices that satisfied a condition ("trigger") that cause an action to fire during the selected polling period.
Understand column data The default view of each report contains a grid with the following columns:
Date. Date and time of event. Origin. Device that caused the action to fire. Action. Action name as listed in the Active Monitor Library. Trigger. Action trigger. One of the following: Up, Down.
Generate a report Choose Device. Choose one or more host devices you want Actions Fired measurements for.
Use the Select Device dialog for one of the following:
Control Purpose
Device Browse and choose a single device.
Single Interface
Choose an interface on a device.
Device Group
Choose an existing group of one or more devices. You can also create custom or dynamic groups.

WhatsUp Gold User Guide
668
Note: You can organize devices into custom or dynamic groups. For more information, see Grouping Devices (on page 242).
Choose time constraints. ( , ) Choose times for the Actions Fired. (For recently observed measurements, select Last Polled from the Date Range drop down list.)
Choose time constraints for data view Control Purpose
Date Range (on page 944)
Choose or define an overall date range.
Business hours (on page 944)
Focus on specific days of the week and periods within each day. Reveal trends that are sensitive to business hours, time zones,
and other periodic attributes in the observed data.
Filter and reduce by row and by column. Sort and remove columns, group rows based on specific column values, and remove unwanted information from the table.
Filter and pick by column
Click a report heading and use the following from the drop down list:
Control Purpose
Sort. Sort column in ascending or descending order.
Columns. Pick the columns you want to view. Click a check box to display the column. Clear the check box to hide it.
Group by this field.
Group table into collapsible rows wherever the current column contains identical data ("field") values.
Filters. Provide a keyword to view only rows that contain the keyword for this column.

WhatsUp Gold User Guide
669
Chart, adjust output, and visualize. Fine tune report presentation and range of values displayed using the Report Settings dialog (optional).
Specify threshold and top n: Control Purpose
Show Top n Items Limit items to the samples with the highest (or lowest) utilization.
Threshold Type Switch between minimum or maximum mode for cutoff values for the ranked list.
At or Over. Show peak usage period. (Utilization percentage equal to or greater than Threshold.)
At or Under. Show usage periods where resources are unused or possibly down. (Utilization percentage equal to or less than Threshold.)
Threshold (percent)
Baseline value used to trim ranked device list based on peak or subpeak capacity when returning the Top n.
Chart and visualize data over time (single device ) Charting and visualization is available when you select a single device.
Control Purpose
Display Options Present data as a chart, a table grid, or both.
Chart Type Gauge charts. Available when you select a Date Range of Last Polled .
Time series. Available when you select a Date Range interval (Today , for example).
Line/Area. Scatter graph that connects adjacent measurements with straight lines.
Spline/Area Spline. Choose a graph with a smoothed appearance where adjacent samples exhibit a gradual slope.
Chart Options Legend, Grid Lines, Range Selector. Include legend, grid lines, and range selector for readability.
Trend Lines. Present data with a smoothed average to show trend.
Tip: Trend lines represent a moving average that can be compared with line and area graphs to reveal peak and sub peak intervals, periods of burstiness, latency, and interruption.
Note: This report only returns Actions Fired metrics for devices that already have the appropriate WMI or SNMP credentials. For more information, see Using Credentials.

WhatsUp Gold User Guide
670
Share, export, and save as PDF Most generated Actions Fired report data can be printed, shared, and exported when selecting Expand ( ) from the Dashboard Options ( ) menu. After the report has been expanded, select export ( ) to access the following options:
Export to PDF. Generate a PDF file of the report with user-defined page size and orientation.
Export Data. Export Actions Fired data (on page 951) and leverage outside of WhatsUp Gold.
Schedule Export. Set a recurring date and time, format, and email destination for report data export (on page 942).
Completely Down Devices Completely Down Devices report reveals discovered network devices considered to be in a down state. In WhatsUp Gold, a given device is considered to be in a down state if it has either a critical monitor down or all monitors down.
Understand column data The default view of each report contains a grid with the following columns:
Device. Device hostname, IP address, or custom label. Monitor. Active monitor name. Status. Status of the monitor after the last poll.
Generate a report Choose Device. Choose one or more host devices you want Completely Down Devices measurements for.
Use the Select Device dialog for one of the following:
Control Purpose
Device Browse and choose a single device.
Single Interface
Choose an interface on a device.
Device Group
Choose an existing group of one or more devices. You can also create custom or dynamic groups.
Note: You can organize devices into custom or dynamic groups. For more information, see Grouping Devices (on page 242).

WhatsUp Gold User Guide
671
Choose time constraints. ( , ) Choose times for the Completely Down Devices. (For recently observed measurements, select Last Polled from the Date Range drop down list.)
Choose time constraints for data view Control Purpose
Date Range (on page 944)
Choose or define an overall date range.
Business hours (on page 944)
Focus on specific days of the week and periods within each day. Reveal trends that are sensitive to business hours, time zones,
and other periodic attributes in the observed data.
Filter and reduce by row and by column. Sort and remove columns, group rows based on specific column values, and remove unwanted information from the table.
Filter and pick by column
Click a report heading and use the following from the drop down list:
Control Purpose
Sort. Sort column in ascending or descending order.
Columns. Pick the columns you want to view. Click a check box to display the column. Clear the check box to hide it.
Group by this field.
Group table into collapsible rows wherever the current column contains identical data ("field") values.
Filters. Provide a keyword to view only rows that contain the keyword for this column.
Chart, adjust output, and visualize. Fine tune report presentation and range of values displayed using the Report Settings dialog (optional).
Specify threshold and top n: Control Purpose
Show Top n Items Limit items to the samples with the highest (or lowest) utilization.
WhatsUp Gold User Guide
672
Threshold Type Switch between minimum or maximum mode for cutoff values for the ranked list.
At or Over. Show peak usage period. (Utilization percentage equal to or greater than Threshold.)
At or Under. Show usage periods where resources are unused or possibly down. (Utilization percentage equal to or less than Threshold.)
Threshold (percent)
Baseline value used to trim ranked device list based on peak or subpeak capacity when returning the Top n.
Chart and visualize data over time (single device ) Charting and visualization is available when you select a single device.
Control Purpose
Display Options Present data as a chart, a table grid, or both.
Chart Type Gauge charts. Available when you select a Date Range of Last Polled .
Time series. Available when you select a Date Range interval (Today , for example).
Line/Area. Scatter graph that connects adjacent measurements with straight lines.
Spline/Area Spline. Choose a graph with a smoothed appearance where adjacent samples exhibit a gradual slope.
Chart Options Legend, Grid Lines, Range Selector. Include legend, grid lines, and range selector for readability.
Trend Lines. Present data with a smoothed average to show trend.
Tip: Trend lines represent a moving average that can be compared with line and area graphs to reveal peak and sub peak intervals, periods of burstiness, latency, and interruption.
Note: This report only returns Completely Down Devices metrics for devices that already have the appropriate WMI or SNMP credentials. For more information, see Using Credentials.
Share, export, and save as PDF Most generated Completely Down Devices report data can be printed, shared, and exported when selecting Expand ( ) from the Dashboard Options ( ) menu. After the report has been expanded, select export ( ) to access the following options:
Export to PDF. Generate a PDF file of the report with user-defined page size and orientation.

WhatsUp Gold User Guide
673
Export Data. Export Completely Down Devices data (on page 951) and leverage outside of WhatsUp Gold.
Schedule Export. Set a recurring date and time, format, and email destination for report data export (on page 942).
Device Group Mini Status Device Group Mini Status report reveals status for all devices for a given group.
Understand column data The default view of each report contains a grid with the following columns:
Device. Device hostname, IP address, or custom label. Active Monitors. Active monitors associated with device. [Monitor status indicator]. Row background color denotes one of the following: Blue-green: Up.
Red: Down.
Gray: Unknown.
Generate a report Choose Device. Choose a single device, device group, or managed network.
Use the Select Device dialog for one of the following:
Control Description
Device Browse and choose a single device.
Device Group
Choose an existing group of one or more devices. You can also create custom or dynamic groups.
Network Network of devices managed by WhatsUp Gold.
Note: You can organize devices into custom or dynamic groups. For more information, see Grouping Devices (on page 242).
Filter and reduce by row and by column. Sort and remove columns, group rows based on specific column values, and find specific field values in the table.
Filter and pick by column
Click a report heading and use the following from the drop down list:
Control Purpose
Sort. Sort column in ascending or descending order.

WhatsUp Gold User Guide
674
Columns. Pick the columns you want to view. Click a check box to display the column. Clear the check box to hide it.
Group by this field.
Group table into collapsible rows wherever the current column contains identical data ("field") values.
Filters. Provide a keyword to view only rows that contain the keyword for this column.
Share, export, and save as PDF Most generated Device Group Mini Status report data can be printed, shared, and exported when selecting Expand ( ) from the Dashboard Options ( ) menu. After the report has been expanded, select export ( ) to access the following options:
Export to PDF. Generate a PDF file of the report with user-defined page size and orientation.
Export Data. Export Device Group Mini Status data (on page 951) and leverage outside of WhatsUp Gold.
Schedule Export. Set a recurring date and time, format, and email destination for report data export (on page 942).
Down Active Monitors Down Active Monitors report reveals devices with active monitors in a down state.
Understand column data The default view of each report contains a grid with the following columns:
Device. Device hostname, IP address, or custom label. Count. The number of down monitors on the device. Monitors. A list of each down monitor on the device.
Generate a report Choose Device. Choose one or more host devices you want Down Active Monitors measurements for.
Use the Select Device dialog for one of the following:
Control Purpose
Device Browse and choose a single device.
Single Interface
Choose an interface on a device.

WhatsUp Gold User Guide
675
Device Group
Choose an existing group of one or more devices. You can also create custom or dynamic groups.
Note: You can organize devices into custom or dynamic groups. For more information, see Grouping Devices (on page 242).
Choose time constraints. ( , ) Choose times for the Down Active Monitors. (For recently observed measurements, select Last Polled from the Date Range drop down list.)
Choose time constraints for data view Control Purpose
Date Range (on page 944)
Choose or define an overall date range.
Business hours (on page 944)
Focus on specific days of the week and periods within each day. Reveal trends that are sensitive to business hours, time zones,
and other periodic attributes in the observed data.
Filter and reduce by row and by column. Sort and remove columns, group rows based on specific column values, and remove unwanted information from the table.
Filter and pick by column
Click a report heading and use the following from the drop down list:
Control Purpose
Sort. Sort column in ascending or descending order.
Columns. Pick the columns you want to view. Click a check box to display the column. Clear the check box to hide it.
Group by this field.
Group table into collapsible rows wherever the current column contains identical data ("field") values.
Filters. Provide a keyword to view only rows that contain the keyword for this column.

WhatsUp Gold User Guide
676
Chart, adjust output, and visualize. Fine tune report presentation and range of values displayed using the Report Settings dialog (optional).
Specify threshold and top n: Control Purpose
Show Top n Items Limit items to the samples with the highest (or lowest) utilization.
Threshold Type Switch between minimum or maximum mode for cutoff values for the ranked list.
At or Over. Show peak usage period. (Utilization percentage equal to or greater than Threshold.)
At or Under. Show usage periods where resources are unused or possibly down. (Utilization percentage equal to or less than Threshold.)
Threshold (percent)
Baseline value used to trim ranked device list based on peak or subpeak capacity when returning the Top n.
Chart and visualize data over time (single device ) Charting and visualization is available when you select a single device.
Control Purpose
Display Options Present data as a chart, a table grid, or both.
Chart Type Gauge charts. Available when you select a Date Range of Last Polled .
Time series. Available when you select a Date Range interval (Today , for example).
Line/Area. Scatter graph that connects adjacent measurements with straight lines.
Spline/Area Spline. Choose a graph with a smoothed appearance where adjacent samples exhibit a gradual slope.
Chart Options Legend, Grid Lines, Range Selector. Include legend, grid lines, and range selector for readability.
Trend Lines. Present data with a smoothed average to show trend.
Tip: Trend lines represent a moving average that can be compared with line and area graphs to reveal peak and sub peak intervals, periods of burstiness, latency, and interruption.
Note: This report only returns Down Active Monitors metrics for devices that already have the appropriate WMI or SNMP credentials. For more information, see Using Credentials.
WhatsUp Gold User Guide
677
Share, export, and save as PDF Most generated Down Active Monitors report data can be printed, shared, and exported when selecting Expand ( ) from the Dashboard Options ( ) menu. After the report has been expanded, select export ( ) to access the following options:
Export to PDF. Generate a PDF file of the report with user-defined page size and orientation.
Export Data. Export Down Active Monitors data (on page 951) and leverage outside of WhatsUp Gold.
Schedule Export. Set a recurring date and time, format, and email destination for report data export (on page 942).
Devices with Down Critical Monitors Devices with Down Critical Monitors report reveals devices with one or more critical monitors in a down state.
Understand column data The default view of each report contains a grid with the following columns:
Device/CPU. Device hostname, IP address, or custom label. (Click to reveal CPUs).
Monitor. Critical monitor name. Status. Status of the monitor after the last poll.
Generate a report Choose Device. Choose one or more host devices you want Devices with Down Critical Monitors measurements for.
Use the Select Device dialog for one of the following:
Control Purpose
Device Browse and choose a single device.
Single Interface
Choose an interface on a device.
Device Group
Choose an existing group of one or more devices. You can also create custom or dynamic groups.
Note: You can organize devices into custom or dynamic groups. For more information, see Grouping Devices (on page 242).

WhatsUp Gold User Guide
678
Choose time constraints. ( , ) Choose times for the Devices with Down Critical Monitors. (For recently observed measurements, select Last Polled from the Date Range drop down list.)
Choose time constraints for data view Control Purpose
Date Range (on page 944)
Choose or define an overall date range.
Business hours (on page 944)
Focus on specific days of the week and periods within each day. Reveal trends that are sensitive to business hours, time zones,
and other periodic attributes in the observed data.
Filter and reduce by row and by column. Sort and remove columns, group rows based on specific column values, and remove unwanted information from the table.
Filter and pick by column
Click a report heading and use the following from the drop down list:
Control Purpose
Sort. Sort column in ascending or descending order.
Columns. Pick the columns you want to view. Click a check box to display the column. Clear the check box to hide it.
Group by this field.
Group table into collapsible rows wherever the current column contains identical data ("field") values.
Filters. Provide a keyword to view only rows that contain the keyword for this column.
Rename Report. Edit report name using the Report Settings dialog.
Note: This report only returns Devices with Down Critical Monitors metrics for devices that already have the appropriate WMI or SNMP credentials. For more information, see Using Credentials.
WhatsUp Gold User Guide
679
Share, export, and save as PDF Most generated Devices with Down Critical Monitors report data can be printed, shared, and exported when selecting Expand ( ) from the Dashboard Options ( ) menu. After the report has been expanded, select export ( ) to access the following options:
Export to PDF. Generate a PDF file of the report with user-defined page size and orientation.
Export Data. Export Devices with Down Critical Monitors data (on page 951) and leverage outside of WhatsUp Gold.
Schedule Export. Set a recurring date and time, format, and email destination for report data export (on page 942).
Down Interfaces Down Interfaces report reveals network interfaces that show either a critical monitor or all monitors in a down state.
Understand column data The default view of each report contains a grid with the following columns:
Device. Device hostname, IP address, or custom label. Interface. Interface name and unique index. For example, Ethernet0.
Note: The Interface column displays the interface name because Discovery automatically populates the report with Active Monitor information. When creating an active monitor manually, add the interface name to the Comment field of the Active Monitor Properties dialog, otherwise the Interface column in this report will appear blank.
Status. State of device as of last poll. Last Poll. Date and time of last poll.
Generate a report Choose Device. Choose one or more host devices you want Down Interfaces measurements for.
Use the Select Device dialog for one of the following:
Control Purpose
Device Browse and choose a single device.
Single Interface
Choose an interface on a device.
Device Group
Choose an existing group of one or more devices. You can also create custom or dynamic groups.
WhatsUp Gold User Guide
680
Note: You can organize devices into custom or dynamic groups. For more information, see Grouping Devices (on page 242).
Choose time constraints. ( , ) Choose times for the Down Interfaces. (For recently observed measurements, select Last Polled from the Date Range drop down list.)
Choose time constraints for data view Control Purpose
Date Range (on page 944)
Choose or define an overall date range.
Business hours (on page 944)
Focus on specific days of the week and periods within each day. Reveal trends that are sensitive to business hours, time zones,
and other periodic attributes in the observed data.
Filter and reduce by row and by column. Sort and remove columns, group rows based on specific column values, and remove unwanted information from the table.
Filter and pick by column
Click a report heading and use the following from the drop down list:
Control Purpose
Sort. Sort column in ascending or descending order.
Columns. Pick the columns you want to view. Click a check box to display the column. Clear the check box to hide it.
Group by this field.
Group table into collapsible rows wherever the current column contains identical data ("field") values.
Filters. Provide a keyword to view only rows that contain the keyword for this column.

WhatsUp Gold User Guide
681
Chart, adjust output, and visualize. Fine tune report presentation and range of values displayed using the Report Settings dialog (optional).
Specify threshold and top n: Control Purpose
Show Top n Items Limit items to the samples with the highest (or lowest) utilization.
Threshold Type Switch between minimum or maximum mode for cutoff values for the ranked list.
At or Over. Show peak usage period. (Utilization percentage equal to or greater than Threshold.)
At or Under. Show usage periods where resources are unused or possibly down. (Utilization percentage equal to or less than Threshold.)
Threshold (percent)
Baseline value used to trim ranked device list based on peak or subpeak capacity when returning the Top n.
Chart and visualize data over time (single device ) Charting and visualization is available when you select a single device.
Control Purpose
Display Options Present data as a chart, a table grid, or both.
Chart Type Gauge charts. Available when you select a Date Range of Last Polled .
Time series. Available when you select a Date Range interval (Today , for example).
Line/Area. Scatter graph that connects adjacent measurements with straight lines.
Spline/Area Spline. Choose a graph with a smoothed appearance where adjacent samples exhibit a gradual slope.
Chart Options Legend, Grid Lines, Range Selector. Include legend, grid lines, and range selector for readability.
Trend Lines. Present data with a smoothed average to show trend.
Tip: Trend lines represent a moving average that can be compared with line and area graphs to reveal peak and sub peak intervals, periods of burstiness, latency, and interruption.
Note: This report only returns Down Interfaces metrics for devices that already have the appropriate WMI or SNMP credentials. For more information, see Using Credentials.

WhatsUp Gold User Guide
682
Share, export, and save as PDF Most generated Down Interfaces report data can be printed, shared, and exported when selecting Expand ( ) from the Dashboard Options ( ) menu. After the report has been expanded, select export ( ) to access the following options:
Export to PDF. Generate a PDF file of the report with user-defined page size and orientation.
Export Data. Export Down Interfaces data (on page 951) and leverage outside of WhatsUp Gold.
Schedule Export. Set a recurring date and time, format, and email destination for report data export (on page 942).
Summary Counts Summary Counts report reveals device health for a selected group at a glance.
Understand column data The default view of each report contains a grid with the following columns:
Devices in Group. Total devices in group. Monitored Devices. Count of devices with monitoring applied. Up Devices. Count of devices in Up state. Down Devices. Count of devices in Down state. Devices with Down Active Monitors. Count of devices with active monitors in
Down state. Devices in Maintenance. Count of devices in Maintenance mode. Enabled Active Monitors. Total active monitors enabled on this group. Up Active Monitors. Total active monitors polling in an Up state. Down Active Monitors. Total active monitors polling in a Down state. Down Critical Monitors. Total critical monitors polling in a Down state. Up Interfaces. Interfaces in Up state. Down Interfaces. Interfaces in Down state. Unacknowledged Devices. Devices with alerts in the Unacknowledged state. Actions Fired in Last 4 Hours. Count of device events that caused actions to
fire in the last 4 hours.
Generate a report Choose Device. Choose one or more host devices you want Summary Counts measurements for.
Use the Select Device dialog for one of the following:
Control Purpose
Device Browse and choose a single device.

WhatsUp Gold User Guide
683
Single Interface
Choose an interface on a device.
Device Group
Choose an existing group of one or more devices. You can also create custom or dynamic groups.
Note: You can organize devices into custom or dynamic groups. For more information, see Grouping Devices (on page 242).
Choose time constraints. ( , ) Choose times for the Summary Counts. (For recently observed measurements, select Last Polled from the Date Range drop down list.)
Choose time constraints for data view Control Purpose
Date Range (on page 944)
Choose or define an overall date range.
Business hours (on page 944)
Focus on specific days of the week and periods within each day. Reveal trends that are sensitive to business hours, time zones,
and other periodic attributes in the observed data.
Filter and reduce by row and by column. Sort and remove columns, group rows based on specific column values, and remove unwanted information from the table.
Filter and pick by column
Click a report heading and use the following from the drop down list:
Control Purpose
Sort. Sort column in ascending or descending order.
Columns. Pick the columns you want to view. Click a check box to display the column. Clear the check box to hide it.
Group by this field.
Group table into collapsible rows wherever the current column contains identical data ("field") values.
Filters. Provide a keyword to view only rows that contain the keyword for this column.

WhatsUp Gold User Guide
684
Chart, adjust output, and visualize. Fine tune report presentation and range of values displayed using the Report Settings dialog (optional).
Specify threshold and top n: Control Purpose
Show Top n Items Limit items to the samples with the highest (or lowest) utilization.
Threshold Type Switch between minimum or maximum mode for cutoff values for the ranked list.
At or Over. Show peak usage period. (Utilization percentage equal to or greater than Threshold.)
At or Under. Show usage periods where resources are unused or possibly down. (Utilization percentage equal to or less than Threshold.)
Threshold (percent)
Baseline value used to trim ranked device list based on peak or subpeak capacity when returning the Top n.
Chart and visualize data over time (single device ) Charting and visualization is available when you select a single device.
Control Purpose
Display Options Present data as a chart, a table grid, or both.
Chart Type Gauge charts. Available when you select a Date Range of Last Polled .
Time series. Available when you select a Date Range interval (Today , for example).
Line/Area. Scatter graph that connects adjacent measurements with straight lines.
Spline/Area Spline. Choose a graph with a smoothed appearance where adjacent samples exhibit a gradual slope.
Chart Options Legend, Grid Lines, Range Selector. Include legend, grid lines, and range selector for readability.
Trend Lines. Present data with a smoothed average to show trend.
Tip: Trend lines represent a moving average that can be compared with line and area graphs to reveal peak and sub peak intervals, periods of burstiness, latency, and interruption.
Note: This report only returns Summary Counts metrics for devices that already have the appropriate WMI or SNMP credentials. For more information, see Using Credentials.

WhatsUp Gold User Guide
685
Share, export, and save as PDF Most generated Summary Counts report data can be printed, shared, and exported when selecting Expand ( ) from the Dashboard Options ( ) menu. After the report has been expanded, select export ( ) to access the following options:
Export to PDF. Generate a PDF file of the report with user-defined page size and orientation.
Export Data. Export Summary Counts data (on page 951) and leverage outside of WhatsUp Gold.
Schedule Export. Set a recurring date and time, format, and email destination for report data export (on page 942).
State Change Acknowledgment Report State Change Acknowledgment Report journals the acknowledgment of state change notifications. When a device state change is detected, WhatsUp Gold puts the device into a 'waiting for acknowledgment' mode.
Note: Acknowledging a device state change does not keep that device from firing actions. To stop a device from firing actions, you must put the device into maintenance mode.
Understand column data The default view of each report contains a grid with the following columns:
Device. Current state indicator and name of the device. Device Type. The type of device. Unacknowledged for. Amount of time the device has remained
unacknowledged on this report. In Maintenance. Indicates whether or not the device is in maintenance mode.
The state is either yes or no.
Generate a report Choose Device. Choose one or more host devices you want State Change Acknowledgment Report measurements for.
Use the Select Device dialog for one of the following:
Control Purpose
Device Browse and choose a single device.
Device Group
Choose an existing group of one or more devices. You can also create custom or dynamic groups.

WhatsUp Gold User Guide
686
Note: You can organize devices into custom or dynamic groups. For more information, see Grouping Devices (on page 242).
Tip: If a device is identified as a virtual machine, Hyper-V or VMware credentials will be used to retrieve data and only those physical resources allocated to the virtual machine will be visible in the report.
Choose, filter, and reorder columns. Choose and hide columns, reorder columns, and customize your data view.
Filter and pick by column
Click a report heading ( ) and use the "column picker" ( ) from the drop down list.
Control Purpose
Columns. Click a check box to display the column. Clear the check box to hide it.
Move Column. Click on a column heading and drag it to reorder your table's columns.
Rename Report. Edit report name using the Report Settings dialog.
Share, export, and save as PDF Most generated State Change Acknowledgment Report report data can be printed, shared, and exported when selecting Expand ( ) from the Dashboard Options ( ) menu. After the report has been expanded, select export ( ) to access the following options:
Export to PDF. Generate a PDF file of the report with user-defined page size and orientation.
Export Data. Export State Change Acknowledgment Report data (on page 951) and leverage outside of WhatsUp Gold.
Schedule Export. Set a recurring date and time, format, and email destination for report data export (on page 942).
Tail of Action Activity Log Tail of Action Activity Log report reveals the n most recent actions recorded (also known as the "tail") for the activity log. This report is useful for quick access to the most recent actions, triggers, and last recorded activities on your network.
WhatsUp Gold User Guide
687
Understand column data The default view of each report contains a grid with the following columns:
Device. Source of the action or event. Click to bring up Device Status report. Date. Date and time of event. Action Name. Name of the action. Trigger. Trigger for the action Click a trigger to open the State Change
Timeline.
Generate a report Choose Device. Choose one or more host devices you want Tail of Action Activity Log measurements for.
Use the Select Device dialog for one of the following:
Control Purpose
Device Browse and choose a single device.
Single Interface
Choose an interface on a device.
Device Group
Choose an existing group of one or more devices. You can also create custom or dynamic groups.
Note: You can organize devices into custom or dynamic groups. For more information, see Grouping Devices (on page 242).
Choose time constraints. ( , ) Choose times for the Tail of Action Activity Log. (For recently observed measurements, select Last Polled from the Date Range drop down list.)
Choose time constraints for data view Control Purpose
Date Range (on page 944)
Choose or define an overall date range.
Business hours (on page 944)
Focus on specific days of the week and periods within each day. Reveal trends that are sensitive to business hours, time zones,
and other periodic attributes in the observed data.

WhatsUp Gold User Guide
688
Filter and reduce by row and by column. Sort and remove columns, group rows based on specific column values, and remove unwanted information from the table.
Filter and pick by column
Click a report heading and use the following from the drop down list:
Control Purpose
Sort. Sort column in ascending or descending order.
Columns. Pick the columns you want to view. Click a check box to display the column. Clear the check box to hide it.
Group by this field.
Group table into collapsible rows wherever the current column contains identical data ("field") values.
Filters. Provide a keyword to view only rows that contain the keyword for this column.
Chart, adjust output, and visualize. Fine tune report presentation and range of values displayed using the Report Settings dialog (optional).
Specify threshold and top n: Control Purpose
Show Top n Items Limit items to the samples with the highest (or lowest) utilization.
Threshold Type Switch between minimum or maximum mode for cutoff values for the ranked list.
At or Over. Show peak usage period. (Utilization percentage equal to or greater than Threshold.)
At or Under. Show usage periods where resources are unused or possibly down. (Utilization percentage equal to or less than Threshold.)
Threshold (percent)
Baseline value used to trim ranked device list based on peak or subpeak capacity when returning the Top n.
Chart and visualize data over time (single device ) Charting and visualization is available when you select a single device.
Control Purpose
Display Options Present data as a chart, a table grid, or both.

WhatsUp Gold User Guide
689
Chart Type Gauge charts. Available when you select a Date Range of Last Polled .
Time series. Available when you select a Date Range interval (Today , for example).
Line/Area. Scatter graph that connects adjacent measurements with straight lines.
Spline/Area Spline. Choose a graph with a smoothed appearance where adjacent samples exhibit a gradual slope.
Chart Options Legend, Grid Lines, Range Selector. Include legend, grid lines, and range selector for readability.
Trend Lines. Present data with a smoothed average to show trend.
Tip: Trend lines represent a moving average that can be compared with line and area graphs to reveal peak and sub peak intervals, periods of burstiness, latency, and interruption.
Note: This report only returns Tail of Action Activity Log metrics for devices that already have the appropriate WMI or SNMP credentials. For more information, see Using Credentials.
Share, export, and save as PDF Most generated Tail of Action Activity Log report data can be printed, shared, and exported when selecting Expand ( ) from the Dashboard Options ( ) menu. After the report has been expanded, select export ( ) to access the following options:
Export to PDF. Generate a PDF file of the report with user-defined page size and orientation.
Export Data. Export Tail of Action Activity Log data (on page 951) and leverage outside of WhatsUp Gold.
Schedule Export. Set a recurring date and time, format, and email destination for report data export (on page 942).
Tail of Passive Monitor Error Log Tail of Passive Monitor Error Log report reveals the n most recent actions recorded (also known as the "tail") in the Passive Monitor Error log. This report is useful for quick access to the last recorded passive monitor failure and exception activities on your network.
Understand column data The default view of each report contains a grid with the following columns:
Date. Date and time of event. Passive Monitor. Passive monitor name. Device. Device hostname, IP address, or custom label.

WhatsUp Gold User Guide
690
Category. Category of error. For example: Con. Failed (Connection Failed), Auth Error (Authentication Error).
Details. Log message string.
Generate a report Choose Device. Choose one or more host devices you want Tail of Passive Monitor Error Log measurements for.
Use the Select Device dialog for one of the following:
Control Purpose
Device Browse and choose a single device.
Single Interface
Choose an interface on a device.
Device Group
Choose an existing group of one or more devices. You can also create custom or dynamic groups.
Note: You can organize devices into custom or dynamic groups. For more information, see Grouping Devices (on page 242).
Choose time constraints. ( , ) Choose times for the Tail of Passive Monitor Error Log. (For recently observed measurements, select Last Polled from the Date Range drop down list.)
Choose time constraints for data view Control Purpose
Date Range (on page 944)
Choose or define an overall date range.
Business hours (on page 944)
Focus on specific days of the week and periods within each day. Reveal trends that are sensitive to business hours, time zones,
and other periodic attributes in the observed data.
Filter and reduce by row and by column. Sort and remove columns, group rows based on specific column values, and remove unwanted information from the table.
Filter and pick by column
Click a report heading and use the following from the drop down list:

WhatsUp Gold User Guide
691
Control Purpose
Sort. Sort column in ascending or descending order.
Columns. Pick the columns you want to view. Click a check box to display the column. Clear the check box to hide it.
Group by this field.
Group table into collapsible rows wherever the current column contains identical data ("field") values.
Filters. Provide a keyword to view only rows that contain the keyword for this column.
Chart, adjust output, and visualize. Fine tune report presentation and range of values displayed using the Report Settings dialog (optional).
Specify threshold and top n: Control Purpose
Show Top n Items Limit items to the samples with the highest (or lowest) utilization.
Threshold Type Switch between minimum or maximum mode for cutoff values for the ranked list.
At or Over. Show peak usage period. (Utilization percentage equal to or greater than Threshold.)
At or Under. Show usage periods where resources are unused or possibly down. (Utilization percentage equal to or less than Threshold.)
Threshold (percent)
Baseline value used to trim ranked device list based on peak or subpeak capacity when returning the Top n.
Chart and visualize data over time (single device ) Charting and visualization is available when you select a single device.
Control Purpose
Display Options Present data as a chart, a table grid, or both.

WhatsUp Gold User Guide
692
Chart Type Gauge charts. Available when you select a Date Range of Last Polled .
Time series. Available when you select a Date Range interval (Today , for example).
Line/Area. Scatter graph that connects adjacent measurements with straight lines.
Spline/Area Spline. Choose a graph with a smoothed appearance where adjacent samples exhibit a gradual slope.
Chart Options Legend, Grid Lines, Range Selector. Include legend, grid lines, and range selector for readability.
Trend Lines. Present data with a smoothed average to show trend.
Tip: Trend lines represent a moving average that can be compared with line and area graphs to reveal peak and sub peak intervals, periods of burstiness, latency, and interruption.
Note: This report only returns Tail of Passive Monitor Error Log metrics for devices that already have the appropriate WMI or SNMP credentials. For more information, see Using Credentials.
Share, export, and save as PDF Most generated Tail of Passive Monitor Error Log report data can be printed, shared, and exported when selecting Expand ( ) from the Dashboard Options ( ) menu. After the report has been expanded, select export ( ) to access the following options:
Export to PDF. Generate a PDF file of the report with user-defined page size and orientation.
Export Data. Export Tail of Passive Monitor Error Log data (on page 951) and leverage outside of WhatsUp Gold.
Schedule Export. Set a recurring date and time, format, and email destination for report data export (on page 942).
Tail of SNMP Trap Log Tail of SNMP Trap Log report reveals the n most recent SNMP trap notifications recorded (also known as the "tail") in the SNMP trap log. This report is useful for quick access to recent trap notifications which can be indicators of significant activities happening on your network.
Understand column data The default view of each report contains a grid with the following columns:
Date. Date and time of event. Device. Device hostname, IP address, or custom label.

WhatsUp Gold User Guide
693
SNMP Trap Type. Reflects Trap Type value in SNMP Trap Protocol Data Unit (PDU). For example: coldStart(0), linkDown(2), authenticationFailure(4), and where n>5 indicates an enterprise specific trap type.
Payload. SNMP PDU data fields.
Note: SNMP Trap listener must be enabled and either a SNMP passive monitor must be associated with a monitored device or unsolicited SNMP traps accepted. For more information, see Enabling the SNMP Trap Listener (on page 106).
Generate a report Choose Device. Choose one or more host devices you want Tail of SNMP Trap Log measurements for.
Use the Select Device dialog for one of the following:
Control Purpose
Device Browse and choose a single device.
Single Interface
Choose an interface on a device.
Device Group
Choose an existing group of one or more devices. You can also create custom or dynamic groups.
Note: You can organize devices into custom or dynamic groups. For more information, see Grouping Devices (on page 242).
Choose time constraints. ( , ) Choose times for the Tail of SNMP Trap Log. (For recently observed measurements, select Last Polled from the Date Range drop down list.)
Choose time constraints for data view Control Purpose
Date Range (on page 944)
Choose or define an overall date range.
Business hours (on page 944)
Focus on specific days of the week and periods within each day. Reveal trends that are sensitive to business hours, time zones,
and other periodic attributes in the observed data.
WhatsUp Gold User Guide
694
Filter and reduce by row and by column. Sort and remove columns, group rows based on specific column values, and remove unwanted information from the table.
Filter and pick by column
Click a report heading and use the following from the drop down list:
Control Purpose
Sort. Sort column in ascending or descending order.
Columns. Pick the columns you want to view. Click a check box to display the column. Clear the check box to hide it.
Group by this field.
Group table into collapsible rows wherever the current column contains identical data ("field") values.
Filters. Provide a keyword to view only rows that contain the keyword for this column.
Chart, adjust output, and visualize. Fine tune report presentation and range of values displayed using the Report Settings dialog (optional).
Specify threshold and top n: Control Purpose
Show Top n Items Limit items to the samples with the highest (or lowest) utilization.
Threshold Type Switch between minimum or maximum mode for cutoff values for the ranked list.
At or Over. Show peak usage period. (Utilization percentage equal to or greater than Threshold.)
At or Under. Show usage periods where resources are unused or possibly down. (Utilization percentage equal to or less than Threshold.)
Threshold (percent)
Baseline value used to trim ranked device list based on peak or subpeak capacity when returning the Top n.
Chart and visualize data over time (single device ) Charting and visualization is available when you select a single device.
Control Purpose
Display Options Present data as a chart, a table grid, or both.

WhatsUp Gold User Guide
695
Chart Type Gauge charts. Available when you select a Date Range of Last Polled .
Time series. Available when you select a Date Range interval (Today , for example).
Line/Area. Scatter graph that connects adjacent measurements with straight lines.
Spline/Area Spline. Choose a graph with a smoothed appearance where adjacent samples exhibit a gradual slope.
Chart Options Legend, Grid Lines, Range Selector. Include legend, grid lines, and range selector for readability.
Trend Lines. Present data with a smoothed average to show trend.
Tip: Trend lines represent a moving average that can be compared with line and area graphs to reveal peak and sub peak intervals, periods of burstiness, latency, and interruption.
Note: This report only returns Tail of SNMP Trap Log metrics for devices that already have the appropriate WMI or SNMP credentials. For more information, see Using Credentials.
Share, export, and save as PDF Most generated Tail of SNMP Trap Log report data can be printed, shared, and exported when selecting Expand ( ) from the Dashboard Options ( ) menu. After the report has been expanded, select export ( ) to access the following options:
Export to PDF. Generate a PDF file of the report with user-defined page size and orientation.
Export Data. Export Tail of SNMP Trap Log data (on page 951) and leverage outside of WhatsUp Gold.
Schedule Export. Set a recurring date and time, format, and email destination for report data export (on page 942).
Tail of State Change Log Tail of State Change Log report reveals the n most recent state changes recorded (also known as the "tail") for the selected interval. Tail of State Change Log enables quick access to the last known device startup, shutdown, and restart information.
Understand column data The default view of each report contains a grid with the following columns:
Start Time. Date and time reflecting when the state change was recorded. Device. Device hostname, IP address, or custom label. Indicates the device
where change of state occurred. Monitor. Active monitor name.

WhatsUp Gold User Guide
696
State. Nature of state change detected when polled. For example, Startup.
Generate a report Choose Device. Choose one or more host devices you want Tail of State Change Log measurements for.
Use the Select Device dialog for one of the following:
Control Purpose
Device Browse and choose a single device.
Single Interface
Choose an interface on a device.
Device Group
Choose an existing group of one or more devices. You can also create custom or dynamic groups.
Note: You can organize devices into custom or dynamic groups. For more information, see Grouping Devices (on page 242).
Choose time constraints. ( , ) Choose times for the Tail of State Change Log. (For recently observed measurements, select Last Polled from the Date Range drop down list.)
Choose time constraints for data view Control Purpose
Date Range (on page 944)
Choose or define an overall date range.
Business hours (on page 944)
Focus on specific days of the week and periods within each day. Reveal trends that are sensitive to business hours, time zones,
and other periodic attributes in the observed data.
Filter and reduce by row and by column. Sort and remove columns, group rows based on specific column values, and remove unwanted information from the table.
Filter and pick by column
Click a report heading and use the following from the drop down list:
Control Purpose
Sort. Sort column in ascending or descending order.

WhatsUp Gold User Guide
697
Columns. Pick the columns you want to view. Click a check box to display the column. Clear the check box to hide it.
Group by this field.
Group table into collapsible rows wherever the current column contains identical data ("field") values.
Filters. Provide a keyword to view only rows that contain the keyword for this column.
Chart, adjust output, and visualize. Fine tune report presentation and range of values displayed using the Report Settings dialog (optional).
Specify threshold and top n: Control Purpose
Show Top n Items Limit items to the samples with the highest (or lowest) utilization.
Threshold Type Switch between minimum or maximum mode for cutoff values for the ranked list.
At or Over. Show peak usage period. (Utilization percentage equal to or greater than Threshold.)
At or Under. Show usage periods where resources are unused or possibly down. (Utilization percentage equal to or less than Threshold.)
Threshold (percent)
Baseline value used to trim ranked device list based on peak or subpeak capacity when returning the Top n.
Chart and visualize data over time (single device ) Charting and visualization is available when you select a single device.
Control Purpose
Display Options Present data as a chart, a table grid, or both.
Chart Type Gauge charts. Available when you select a Date Range of Last Polled .
Time series. Available when you select a Date Range interval (Today , for example).
Line/Area. Scatter graph that connects adjacent measurements with straight lines.
Spline/Area Spline. Choose a graph with a smoothed appearance where adjacent samples exhibit a gradual slope.

WhatsUp Gold User Guide
698
Chart Options Legend, Grid Lines, Range Selector. Include legend, grid lines, and range selector for readability.
Trend Lines. Present data with a smoothed average to show trend.
Tip: Trend lines represent a moving average that can be compared with line and area graphs to reveal peak and sub peak intervals, periods of burstiness, latency, and interruption.
Note: This report only returns Tail of State Change Log metrics for devices that already have the appropriate WMI or SNMP credentials. For more information, see Using Credentials.
Share, export, and save as PDF Most generated Tail of State Change Log report data can be printed, shared, and exported when selecting Expand ( ) from the Dashboard Options ( ) menu. After the report has been expanded, select export ( ) to access the following options:
Export to PDF. Generate a PDF file of the report with user-defined page size and orientation.
Export Data. Export Tail of State Change Log data (on page 951) and leverage outside of WhatsUp Gold.
Schedule Export. Set a recurring date and time, format, and email destination for report data export (on page 942).
Tail of Syslog Tail of Syslog report reveals the n most recent UNIX and Linux device system log (on page 822) ("syslog") messages recorded (also referred to as the "tail") for devices you select. This report enables quick access to the last known events to occur on UNIX and Linux host devices on your network.
Understand column data The default view of each report contains a grid with the following columns:
Date. Date and time of event. Device. Device hostname, IP address, or custom label. Syslog Type. Severity of message. Payload. Full syslog message.
Note: Syslog listener with the appropriate credentials must be enabled in order for this report to show syslog messages from UNIX and Linux devices in your network. For more information, see Working with Credentials.

WhatsUp Gold User Guide
699
Generate a report Choose Device. Choose one or more host devices you want Tail of Syslog measurements for.
Use the Select Device dialog for one of the following:
Control Purpose
Device Browse and choose a single device.
Single Interface
Choose an interface on a device.
Device Group
Choose an existing group of one or more devices. You can also create custom or dynamic groups.
Note: You can organize devices into custom or dynamic groups. For more information, see Grouping Devices (on page 242).
Choose time constraints. ( , ) Choose times for the Tail of Syslog. (For recently observed measurements, select Last Polled from the Date Range drop down list.)
Choose time constraints for data view Control Purpose
Date Range (on page 944)
Choose or define an overall date range.
Business hours (on page 944)
Focus on specific days of the week and periods within each day. Reveal trends that are sensitive to business hours, time zones,
and other periodic attributes in the observed data.
Filter and reduce by row and by column. Sort and remove columns, group rows based on specific column values, and remove unwanted information from the table.
Filter and pick by column
Click a report heading and use the following from the drop down list:
Control Purpose
Sort. Sort column in ascending or descending order.
Columns. Pick the columns you want to view. Click a check box to display the column. Clear the check box to hide it.

WhatsUp Gold User Guide
700
Group by this field.
Group table into collapsible rows wherever the current column contains identical data ("field") values.
Filters. Provide a keyword to view only rows that contain the keyword for this column.
Chart, adjust output, and visualize. Fine tune report presentation and range of values displayed using the Report Settings dialog (optional).
Specify threshold and top n: Control Purpose
Show Top n Items Limit items to the samples with the highest (or lowest) utilization.
Threshold Type Switch between minimum or maximum mode for cutoff values for the ranked list.
At or Over. Show peak usage period. (Utilization percentage equal to or greater than Threshold.)
At or Under. Show usage periods where resources are unused or possibly down. (Utilization percentage equal to or less than Threshold.)
Threshold (percent)
Baseline value used to trim ranked device list based on peak or subpeak capacity when returning the Top n.
Chart and visualize data over time (single device ) Charting and visualization is available when you select a single device.
Control Purpose
Display Options Present data as a chart, a table grid, or both.
Chart Type Gauge charts. Available when you select a Date Range of Last Polled .
Time series. Available when you select a Date Range interval (Today , for example).
Line/Area. Scatter graph that connects adjacent measurements with straight lines.
Spline/Area Spline. Choose a graph with a smoothed appearance where adjacent samples exhibit a gradual slope.
Chart Options Legend, Grid Lines, Range Selector. Include legend, grid lines, and range selector for readability.
Trend Lines. Present data with a smoothed average to show trend.

WhatsUp Gold User Guide
701
Tip: Trend lines represent a moving average that can be compared with line and area graphs to reveal peak and sub peak intervals, periods of burstiness, latency, and interruption.
Note: This report only returns Tail of Syslog metrics for devices that already have the appropriate WMI or SNMP credentials. For more information, see Using Credentials.
Share, export, and save as PDF Most generated Tail of Syslog report data can be printed, shared, and exported when selecting Expand ( ) from the Dashboard Options ( ) menu. After the report has been expanded, select export ( ) to access the following options:
Export to PDF. Generate a PDF file of the report with user-defined page size and orientation.
Export Data. Export Tail of Syslog data (on page 951) and leverage outside of WhatsUp Gold.
Schedule Export. Set a recurring date and time, format, and email destination for report data export (on page 942).
Tail of Windows Event Log Tail of Windows Event Log report reveals the n most recent Windows OS system log (on page 829) ("Event Log") messages (also referred to as the "tail") for devices you select. This report enables quick access to last known events to occur on selected Windows OS host devices.
Understand column data The default view of each report contains a grid with the following columns:
Date. Date and time of event. WinEvent Type. Windows Event message category. Payload. Full message data.
Generate a report Choose Device. Choose one or more host devices you want Tail of Windows Event Log measurements for.
Use the Select Device dialog for one of the following:
Control Purpose
Device Browse and choose a single device.
Single Interface
Choose an interface on a device.

WhatsUp Gold User Guide
702
Device Group
Choose an existing group of one or more devices. You can also create custom or dynamic groups.
Note: You can organize devices into custom or dynamic groups. For more information, see Grouping Devices (on page 242).
Choose time constraints. ( , ) Choose times for the Tail of Windows Event Log. (For recently observed measurements, select Last Polled from the Date Range drop down list.)
Choose time constraints for data view Control Purpose
Date Range (on page 944)
Choose or define an overall date range.
Business hours (on page 944)
Focus on specific days of the week and periods within each day. Reveal trends that are sensitive to business hours, time zones,
and other periodic attributes in the observed data.
Filter and reduce by row and by column. Sort and remove columns, group rows based on specific column values, and remove unwanted information from the table.
Filter and pick by column
Click a report heading and use the following from the drop down list:
Control Purpose
Sort. Sort column in ascending or descending order.
Columns. Pick the columns you want to view. Click a check box to display the column. Clear the check box to hide it.
Group by this field.
Group table into collapsible rows wherever the current column contains identical data ("field") values.
Filters. Provide a keyword to view only rows that contain the keyword for this column.

WhatsUp Gold User Guide
703
Chart, adjust output, and visualize. Fine tune report presentation and range of values displayed using the Report Settings dialog (optional).
Specify threshold and top n: Control Purpose
Show Top n Items Limit items to the samples with the highest (or lowest) utilization.
Threshold Type Switch between minimum or maximum mode for cutoff values for the ranked list.
At or Over. Show peak usage period. (Utilization percentage equal to or greater than Threshold.)
At or Under. Show usage periods where resources are unused or possibly down. (Utilization percentage equal to or less than Threshold.)
Threshold (percent)
Baseline value used to trim ranked device list based on peak or subpeak capacity when returning the Top n.
Chart and visualize data over time (single device ) Charting and visualization is available when you select a single device.
Control Purpose
Display Options Present data as a chart, a table grid, or both.
Chart Type Gauge charts. Available when you select a Date Range of Last Polled .
Time series. Available when you select a Date Range interval (Today , for example).
Line/Area. Scatter graph that connects adjacent measurements with straight lines.
Spline/Area Spline. Choose a graph with a smoothed appearance where adjacent samples exhibit a gradual slope.
Chart Options Legend, Grid Lines, Range Selector. Include legend, grid lines, and range selector for readability.
Trend Lines. Present data with a smoothed average to show trend.
Tip: Trend lines represent a moving average that can be compared with line and area graphs to reveal peak and sub peak intervals, periods of burstiness, latency, and interruption.
Note: This report only returns Tail of Windows Event Log metrics for devices that already have the appropriate WMI or SNMP credentials. For more information, see Using Credentials.

WhatsUp Gold User Guide
704
Share, export, and save as PDF Most generated Tail of Windows Event Log report data can be printed, shared, and exported when selecting Expand ( ) from the Dashboard Options ( ) menu. After the report has been expanded, select export ( ) to access the following options:
Export to PDF. Generate a PDF file of the report with user-defined page size and orientation.
Export Data. Export Tail of Windows Event Log data (on page 951) and leverage outside of WhatsUp Gold.
Schedule Export. Set a recurring date and time, format, and email destination for report data export (on page 942).
Unacknowledged Devices Unacknowledged Devices report reveals devices with an unacknowledged alert or change of state.
Understand column data The default view of each report contains a grid with the following columns:
Device. Device hostname, IP address, or custom label. Device Type. Type of host device. Unacknowledged for. Time device state change or alert has been
unacknowledged. In Maintenance. Denotes if device is currently in maintenance mode. Either Yes
or No.
Generate a report Choose Device. Choose one or more host devices you want Unacknowledged Devices measurements for.
Use the Select Device dialog for one of the following:
Control Purpose
Device Browse and choose a single device.
Device Group
Choose an existing group of one or more devices. You can also create custom or dynamic groups.
Note: You can organize devices into custom or dynamic groups. For more information, see Grouping Devices (on page 242).

WhatsUp Gold User Guide
705
Tip: If a device is identified as a virtual machine, Hyper-V or VMware credentials will be used to retrieve data and only those physical resources allocated to the virtual machine will be visible in the report.
Choose, filter, and reorder columns. Choose and hide columns, reorder columns, and customize your data view.
Filter and pick by column
Click a report heading ( ) and use the "column picker" ( ) from the drop down list.
Control Purpose
Columns. Click a check box to display the column. Clear the check box to hide it.
Move Column. Click on a column heading and drag it to reorder your table's columns.
Rename Report. Edit report name using the Report Settings dialog.
Share, export, and save as PDF Most generated Unacknowledged Devices report data can be printed, shared, and exported when selecting Expand ( ) from the Dashboard Options ( ) menu. After the report has been expanded, select export ( ) to access the following options:
Export to PDF. Generate a PDF file of the report with user-defined page size and orientation.
Export Data. Export Unacknowledged Devices data (on page 951) and leverage outside of WhatsUp Gold.
Schedule Export. Set a recurring date and time, format, and email destination for report data export (on page 942).
Down Active Monitors Down Active Monitors report reveals active monitors showing a down state.
Understand column data The default view of each report contains a grid with the following columns:
Device. Device hostname, IP address, or custom label. Status. Status of the monitor after the last poll.
Generate a report Choose Device. Choose one or more host devices you want Down Active Monitors measurements for.
Use the Select Device dialog for one of the following:

WhatsUp Gold User Guide
706
Control Purpose
Device Browse and choose a single device.
Single Interface
Choose an interface on a device.
Device Group
Choose an existing group of one or more devices. You can also create custom or dynamic groups.
Note: You can organize devices into custom or dynamic groups. For more information, see Grouping Devices (on page 242).
Choose time constraints. ( , ) Choose times for the Down Active Monitors. (For recently observed measurements, select Last Polled from the Date Range drop down list.)
Choose time constraints for data view Control Purpose
Date Range (on page 944)
Choose or define an overall date range.
Business hours (on page 944)
Focus on specific days of the week and periods within each day. Reveal trends that are sensitive to business hours, time zones,
and other periodic attributes in the observed data.
Filter and reduce by row and by column. Sort and remove columns, group rows based on specific column values, and remove unwanted information from the table.
Filter and pick by column
Click a report heading and use the following from the drop down list:
Control Purpose
Sort. Sort column in ascending or descending order.
Columns. Pick the columns you want to view. Click a check box to display the column. Clear the check box to hide it.
Group by this field.
Group table into collapsible rows wherever the current column contains identical data ("field") values.

WhatsUp Gold User Guide
707
Filters. Provide a keyword to view only rows that contain the keyword for this column.
Chart, adjust output, and visualize. Fine tune report presentation and range of values displayed using the Report Settings dialog (optional).
Specify threshold and top n: Control Purpose
Show Top n Items Limit items to the samples with the highest (or lowest) utilization.
Threshold Type Switch between minimum or maximum mode for cutoff values for the ranked list.
At or Over. Show peak usage period. (Utilization percentage equal to or greater than Threshold.)
At or Under. Show usage periods where resources are unused or possibly down. (Utilization percentage equal to or less than Threshold.)
Threshold (percent)
Baseline value used to trim ranked device list based on peak or subpeak capacity when returning the Top n.
Chart and visualize data over time (single device ) Charting and visualization is available when you select a single device.
Control Purpose
Display Options Present data as a chart, a table grid, or both.
Chart Type Gauge charts. Available when you select a Date Range of Last Polled .
Time series. Available when you select a Date Range interval (Today , for example).
Line/Area. Scatter graph that connects adjacent measurements with straight lines.
Spline/Area Spline. Choose a graph with a smoothed appearance where adjacent samples exhibit a gradual slope.
Chart Options Legend, Grid Lines, Range Selector. Include legend, grid lines, and range selector for readability.
Trend Lines. Present data with a smoothed average to show trend.
Tip: Trend lines represent a moving average that can be compared with line and area graphs to reveal peak and sub peak intervals, periods of burstiness, latency, and interruption.
WhatsUp Gold User Guide
708
Note: This report only returns Down Active Monitors metrics for devices that already have the appropriate WMI or SNMP credentials. For more information, see Using Credentials.
Share, export, and save as PDF Most generated Down Active Monitors report data can be printed, shared, and exported when selecting Expand ( ) from the Dashboard Options ( ) menu. After the report has been expanded, select export ( ) to access the following options:
Export to PDF. Generate a PDF file of the report with user-defined page size and orientation.
Export Data. Export Down Active Monitors data (on page 951) and leverage outside of WhatsUp Gold.
Schedule Export. Set a recurring date and time, format, and email destination for report data export (on page 942).

709
CHAPTER 29
Virtual Reporting In This Chapter Virtual Machines CPU Utilization .......................................... 709
Virtual Machines Disk Activity ............................................... 710
Virtual Machines Interface Utilization .................................... 712
Virtual Machines Memory Utilization ..................................... 714
VMware Virtual Machines Datastore IOPS............................ 715
VMware Device Datastore IOPS ........................................... 717
Virtual Machines CPU Utilization Virtual Machines CPU Utilization report reveals the fraction of CPU percentage used by "guest" or virtual machines while running on host cores allocated and scheduled by the hypervisor.
Understand column data The default view of each report contains a grid with the following columns:
Virtual Machine. Device name/CPU type (CPU index in parenthesis). Current Percent. Percent utilized of CPUs allocated at time of measurement. 1 Hour Max Percent. Highest utilization observed within last hour. 1 Hour Avg Percent. Average utilization for last hour. Poll Time. Date and time of last poll.
Generate a report Choose Device. Choose one or more host devices you want Virtual Machines CPU Utilization measurements for.
Use the Select Device dialog for one of the following:
Control Purpose
Device Browse and choose a single device.
Device Group
Choose an existing group of one or more devices. You can also create custom or dynamic groups.

WhatsUp Gold User Guide
710
Note: You can organize devices into custom or dynamic groups. For more information, see Grouping Devices (on page 242).
Tip: If a device is identified as a virtual machine, Hyper-V or VMware credentials will be used to retrieve data and only those physical resources allocated to the virtual machine will be visible in the report.
Sort and pick columns. Sort and pick columns.
Filter and pick by column
Click a report heading and use the following from the drop down list:
Control Purpose
Sort. Sort column in ascending or descending order.
Columns. Pick the columns you want to view. Click a check box to display the column. Clear the check box to hide it.
Rename Report. Edit report name using the Report Settings dialog.
Share, export, and save as PDF Most generated Virtual Machines CPU Utilization report data can be printed, shared, and exported when selecting Expand ( ) from the Dashboard Options ( ) menu. After the report has been expanded, select export ( ) to access the following options:
Export to PDF. Generate a PDF file of the report with user-defined page size and orientation.
Export Data. Export Virtual Machines CPU Utilization data (on page 951) and leverage outside of WhatsUp Gold.
Schedule Export. Set a recurring date and time, format, and email destination for report data export (on page 942).
Virtual Machines Disk Activity Virtual Machines Disk Activity report reveals disk I/O performance statistics. This report is helpful for diagnosing read and write latency.
Slow read and write speeds can be indicators of VM memory exhaustion. Use this report together with the VM Memory Utilization (on page 714) report.

WhatsUp Gold User Guide
711
Understand column data The default view of each report contains a grid with the following columns:
Virtual Machine. Device name/CPU type (CPU index in parenthesis). Read: 1 Hour Avg. Average disk read rate. Read: 1 Hour Max. Peak disk read rate observed in last hour. Read: Hour Current. Last observed disk read rate. Write: 1 Hour Avg. Average disk write rate. Write: 1 Hour Max. Peak disk write rate observed in last hour. Write: Hour Current. Last observed disk write rate. Poll Time. Date and time of last poll.
Generate a report Choose Device. Choose one or more host devices you want Virtual Machines Disk Activity measurements for.
Use the Select Device dialog for one of the following:
Control Purpose
Device Browse and choose a single device.
Device Group
Choose an existing group of one or more devices. You can also create custom or dynamic groups.
Note: You can organize devices into custom or dynamic groups. For more information, see Grouping Devices (on page 242).
Tip: If a device is identified as a virtual machine, Hyper-V or VMware credentials will be used to retrieve data and only those physical resources allocated to the virtual machine will be visible in the report.
Sort and pick columns. Sort and pick columns.
Filter and pick by column
Click a report heading and use the following from the drop down list:
Control Purpose
Sort. Sort column in ascending or descending order.

WhatsUp Gold User Guide
712
Columns. Pick the columns you want to view. Click a check box to display the column. Clear the check box to hide it.
Rename Report. Edit report name using the Report Settings dialog.
Hyper-V Considerations To return each Hyper-V virtual machine's metrics in this report, Virtual Machines Disk Activity monitoring needs to be switched on in the virtual machine's monitor setup tab found on the Device Properties interface ( ). For more information, see Hyper-V Disk Activity Monitor (on page 168).
Share, export, and save as PDF Most generated Virtual Machines Disk Activity report data can be printed, shared, and exported when selecting Expand ( ) from the Dashboard Options ( ) menu. After the report has been expanded, select export ( ) to access the following options:
Export to PDF. Generate a PDF file of the report with user-defined page size and orientation.
Export Data. Export Virtual Machines Disk Activity data (on page 951) and leverage outside of WhatsUp Gold.
Schedule Export. Set a recurring date and time, format, and email destination for report data export (on page 942).
Virtual Machines Interface Utilization Virtual Machines Interface Utilization report reveals a list of the virtual machines associated with a virtual host or vCenter server and interface utilization values for each virtual machine.
Understand column data The default view of each report contains a grid with the following columns:
Virtual Machine. Device name/CPU type (CPU index in parenthesis). Rx: 1 Hour Avg. Average bit rate received for the last hour. Rx: 1 Hour Max. Peak bit rate received for the last hour. Rx: Current. Current (last polled) bit rate. Tx: 1 Hour Avg. Average bit rate received for the last hour. Tx: 1 Hour Max. Peak bit rate received for the last hour. Tx: Current. Current (last polled) transmit bit rate. Poll Time. Date and time of last poll.

WhatsUp Gold User Guide
713
Generate a report Choose Device. Choose one or more host devices you want Virtual Machines Interface Utilization measurements for.
Use the Select Device dialog for one of the following:
Control Purpose
Device Browse and choose a single device.
Device Group
Choose an existing group of one or more devices. You can also create custom or dynamic groups.
Note: You can organize devices into custom or dynamic groups. For more information, see Grouping Devices (on page 242).
Tip: If a device is identified as a virtual machine, Hyper-V or VMware credentials will be used to retrieve data and only those physical resources allocated to the virtual machine will be visible in the report.
Sort and pick columns. Sort and pick columns.
Filter and pick by column
Click a report heading and use the following from the drop down list:
Control Purpose
Sort. Sort column in ascending or descending order.
Columns. Pick the columns you want to view. Click a check box to display the column. Clear the check box to hide it.
Rename Report. Edit report name using the Report Settings dialog.
Share, export, and save as PDF Most generated Virtual Machines Interface Utilization report data can be printed, shared, and exported when selecting Expand ( ) from the Dashboard Options ( ) menu. After the report has been expanded, select export ( ) to access the following options:
Export to PDF. Generate a PDF file of the report with user-defined page size and orientation.

WhatsUp Gold User Guide
714
Export Data. Export Virtual Machines Interface Utilization data (on page 951) and leverage outside of WhatsUp Gold.
Schedule Export. Set a recurring date and time, format, and email destination for report data export (on page 942).
Virtual Machines Memory Utilization Virtual Machines Memory Utilization report reveals minimum, maximum, and average memory utilization for one or more virtual devices you specify.
Understand column data The default view of each report contains a grid with the following columns:
Virtual Machine. Device name/CPU type (CPU index in parenthesis). Usage 1 Hour Avg (MB). Average memory usage for the last hour. Usage 1 Hour Max (MB). Maximum memory usage observed in the last hour. Allocated (MB). Total allocated memory. Maximum (MB). Peak memory utilization observed. Poll Time. Date and time of last poll.
Generate a report Choose Device. Choose one or more host devices you want Virtual Machines Memory Utilization measurements for.
Use the Select Device dialog for one of the following:
Control Purpose
Device Browse and choose a single device.
Device Group
Choose an existing group of one or more devices. You can also create custom or dynamic groups.
Note: You can organize devices into custom or dynamic groups. For more information, see Grouping Devices (on page 242).
Tip: If a device is identified as a virtual machine, Hyper-V or VMware credentials will be used to retrieve data and only those physical resources allocated to the virtual machine will be visible in the report.

WhatsUp Gold User Guide
715
Sort and pick columns. Sort and pick columns.
Filter and pick by column
Click a report heading and use the following from the drop down list:
Control Purpose
Sort. Sort column in ascending or descending order.
Columns. Pick the columns you want to view. Click a check box to display the column. Clear the check box to hide it.
Rename Report. Edit report name using the Report Settings dialog.
Share, export, and save as PDF Most generated Virtual Machines Memory Utilization report data can be printed, shared, and exported when selecting Expand ( ) from the Dashboard Options ( ) menu. After the report has been expanded, select export ( ) to access the following options:
Export to PDF. Generate a PDF file of the report with user-defined page size and orientation.
Export Data. Export Virtual Machines Memory Utilization data (on page 951) and leverage outside of WhatsUp Gold.
Schedule Export. Set a recurring date and time, format, and email destination for report data export (on page 942).
VMware Virtual Machines Datastore IOPS VMware Virtual Machines Datastore IOPS report reveals raw disk I/O operations per second (IOPS) of virtual machines. This report is helpful for diagnosing read and write efficiency and in some cases memory exhaustion.
High IOPS metrics can indicate virtual memory usage where RAM needs exceed allocation. Use this report together with the VM Memory Utilization (on page 714) and Disk Activity (on page 710) report.
Understand column data The default view of each report contains a grid with the following columns:
Virtual Machine. Device name/CPU type (CPU index in parenthesis). Read: 1 Hour Avg. Average disk operations per second. Read: 1 Hour Max. Peak disk operations per second observed in last hour. Read: Hour Current. Last observed disk read operations per second. Write: 1 Hour Avg. Average disk write operations per second. Write: 1 Hour Max. Peak disk write operations per second observed in last
hour.

WhatsUp Gold User Guide
716
Write: Hour Current. Last observed disk write operations per second. Poll Time. Date and time of last poll.
Generate a report Choose Device. Choose one or more host devices you want VMware Virtual Machines Datastore IOPS measurements for.
Use the Select Device dialog for one of the following:
Control Purpose
Device Browse and choose a single device.
Device Group
Choose an existing group of one or more devices. You can also create custom or dynamic groups.
Note: You can organize devices into custom or dynamic groups. For more information, see Grouping Devices (on page 242).
Tip: If a device is identified as a virtual machine, Hyper-V or VMware credentials will be used to retrieve data and only those physical resources allocated to the virtual machine will be visible in the report.
Sort and pick columns. Sort and pick columns.
Filter and pick by column
Click a report heading and use the following from the drop down list:
Control Purpose
Sort. Sort column in ascending or descending order.
Columns. Pick the columns you want to view. Click a check box to display the column. Clear the check box to hide it.
Rename Report. Edit report name using the Report Settings dialog.
Note: This report only returns VMware Virtual Machines Datastore IOPS metrics for virtual machines when VMware hosts or VMs share the appropriate VMware credentials. For more information, see Using Credentials.

WhatsUp Gold User Guide
717
Tip: To return each virtual machine's metrics in this report, VMware Virtual Machines Datastore IOPS monitoring needs to be switched on in the virtual machine's Device Properties interface ( ) on the monitors tab.
Share, export, and save as PDF Most generated VMware Virtual Machines Datastore IOPS report data can be printed, shared, and exported when selecting Expand ( ) from the Dashboard Options ( ) menu. After the report has been expanded, select export ( ) to access the following options:
Export to PDF. Generate a PDF file of the report with user-defined page size and orientation.
Export Data. Export VMware Virtual Machines Datastore IOPS data (on page 951) and leverage outside of WhatsUp Gold.
Schedule Export. Set a recurring date and time, format, and email destination for report data export (on page 942).
VMware Device Datastore IOPS VMware Device Datastore IOPS report reveals the average count of raw I/O operations per second (IOPS) for a virtual machine This report is helpful for diagnosing read and write efficiency and in some cases memory exhaustion.
High IOPS metrics can indicate virtual memory usage where RAM needs exceed allocation. Use this report together with the VM Memory Utilization (on page 714) and Disk Activity (on page 710) report.
Understand column data The default view of each report contains a grid with the following columns:
Disk. Disk name (index in parenthesis). Poll Time. Date and time of last poll. Average Read Requests per Second. Average disk operations per second. Average Write Requests per Second. Average disk operations per second.
Generate a report Choose Device. Choose one or more host devices you want VMware Device Datastore IOPS measurements for.
Use the Select Device dialog for one of the following:
Control Purpose
Device Browse and choose a single device.

WhatsUp Gold User Guide
718
Device Group
Choose an existing group of one or more devices. You can also create custom or dynamic groups.
Note: You can organize devices into custom or dynamic groups. For more information, see Grouping Devices (on page 242).
Tip: If a device is identified as a virtual machine, Hyper-V or VMware credentials will be used to retrieve data and only those physical resources allocated to the virtual machine will be visible in the report.
Choose time constraints. ( , ) Choose times for the VMware Device Datastore IOPS. (For recently observed measurements, select Last Polled from the Date Range drop down list.)
Choose time constraints for data view Control Purpose
Date Range (on page 944)
Choose or define an overall date range.
Business hours (on page 944)
Focus on specific days of the week and periods within each day. Reveal trends that are sensitive to business hours, time zones,
and other periodic attributes in the observed data.
Filter and reduce by row and by column. Sort and remove columns, group rows based on specific column values, and remove unwanted information from the table.
Filter and pick by column
Click a report heading and use the following from the drop down list:
Control Purpose
Sort. Sort column in ascending or descending order.
Columns. Pick the columns you want to view. Click a check box to display the column. Clear the check box to hide it.

WhatsUp Gold User Guide
719
Chart, adjust output, and visualize. Fine tune report presentation and range of values displayed using the Report Settings dialog (optional).
Specify threshold and top n: Control Purpose
Show Top n Items Limit items to the samples with the highest (or lowest) utilization.
Threshold Type Switch between minimum or maximum mode for cutoff values for the ranked list.
At or Over. Show peak usage period. (Utilization percentage equal to or greater than Threshold.)
At or Under. Show usage periods where resources are unused or possibly down. (Utilization percentage equal to or less than Threshold.)
Threshold (percent)
Baseline value used to trim ranked device list based on peak or subpeak capacity when returning the Top n.
Chart and visualize data over time (single device ) Charting and visualization is available when you select a single device.
Control Purpose
Display Options Present data as a chart, a table grid, or both.
Chart Type Gauge charts. Available when you select a Date Range of Last Polled .
Time series. Available when you select a Date Range interval (Today , for example).
Line/Area. Scatter graph that connects adjacent measurements with straight lines.
Spline/Area Spline. Choose a graph with a smoothed appearance where adjacent samples exhibit a gradual slope.
Chart Options Legend, Grid Lines, Range Selector. Include legend, grid lines, and range selector for readability.
Trend Lines. Present data with a smoothed average to show trend.
Tip: Trend lines represent a moving average that can be compared with line and area graphs to reveal peak and sub peak intervals, periods of burstiness, latency, and interruption.
Note: This report only returns VMware Device Datastore IOPS metrics for virtual machines when host machines have the appropriate VMware credentials. For more information, see Using Credentials.

WhatsUp Gold User Guide
720
Share, export, and save as PDF Most generated VMware Device Datastore IOPS report data can be printed, shared, and exported when selecting Expand ( ) from the Dashboard Options ( ) menu. After the report has been expanded, select export ( ) to access the following options:
Export to PDF. Generate a PDF file of the report with user-defined page size and orientation.
Export Data. Export VMware Device Datastore IOPS data (on page 951) and leverage outside of WhatsUp Gold.
Schedule Export. Set a recurring date and time, format, and email destination for report data export (on page 942).

721
CHAPTER 30
Wireless Reporting In This Chapter Wireless Bandwidth Utilization .............................................. 721
Bandwidth Summary ............................................................. 724
Wireless CPU Utilization ....................................................... 725
Client Count .......................................................................... 728
Wireless ................................................................................ 731
Wireless Memory Utilization .................................................. 733
RSSI ..................................................................................... 735
Rogue Count ........................................................................ 738
Signal to Noise Ratio ............................................................ 740
Wireless System Summary ................................................... 744
Wireless Rogue Setting ........................................................ 747
Wireless Clients .................................................................... 747
Wireless Clients: Specific Client ............................................ 750
Free Form Text/HTML .......................................................... 755
Wireless Bandwidth Utilization Wireless Bandwidth Utilization report reveals top bi-directional wireless bandwidth capacity utilization for a particular SSID, wireless client, or wireless access point for the selected interval. In addition, it also reveals top n usage for client groups.
Understand column data The default view of each report contains a grid with the following columns:
Access Point. Wireless device in access point mode with the most overall bandwidth usage.
Min. Lowest observed bitrate. Max. Highest observed bitrate. Avg. Average bit rate.
Click a column heading ( ) to display the column selection listing . You can also include:

WhatsUp Gold User Guide
722
Client. Domain/user/MAC address of client using the most overall wireless bandwidth usage.
SSID. Service set identifier associated with the most overall wireless bandwidth usage.
Client Group. Top n clients by bandwidth utilized.
Generate a report Choose Device. Choose one or more host devices you want Wireless Bandwidth Utilization measurements for.
Use the Select Device dialog for one of the following:
Control Purpose
Device Browse and choose a single device.
Single Interface
Choose an interface on a device.
Device Group
Choose an existing group of one or more devices. You can also create custom or dynamic groups.
Note: You can organize devices into custom or dynamic groups. For more information, see Grouping Devices (on page 242).
Choose time constraints. ( , ) Choose times for the Wireless Bandwidth Utilization. (For recently observed measurements, select Last Polled from the Date Range drop down list.)
Choose time constraints for data view Control Purpose
Date Range (on page 944)
Choose or define an overall date range.
Business hours (on page 944)
Focus on specific days of the week and periods within each day. Reveal trends that are sensitive to business hours, time zones,
and other periodic attributes in the observed data.
Filter and reduce by row and by column. Sort and remove columns, group rows based on specific column values, and remove unwanted information from the table.
Filter and pick by column
Click a report heading and use the following from the drop down list:

WhatsUp Gold User Guide
723
Control Purpose
Sort. Sort column in ascending or descending order.
Columns. Pick the columns you want to view. Click a check box to display the column. Clear the check box to hide it.
Group by this field.
Group table into collapsible rows wherever the current column contains identical data ("field") values.
Filters. Provide a keyword to view only rows that contain the keyword for this column.
Chart, adjust output, and visualize. Fine tune report presentation and range of values displayed using the Report Settings dialog (optional).
Specify threshold and top n: Control Purpose
Show Top n Items Limit items to the samples with the highest (or lowest) utilization.
Threshold Type Switch between minimum or maximum mode for cutoff values for the ranked list.
At or Over. Show peak usage period. (Utilization percentage equal to or greater than Threshold.)
At or Under. Show usage periods where resources are unused or possibly down. (Utilization percentage equal to or less than Threshold.)
Threshold (percent)
Baseline value used to trim ranked device list based on peak or subpeak capacity when returning the Top n.
Chart and visualize data over time (single device ) Charting and visualization is available when you select a single device.
Control Purpose
Display Options Present data as a chart, a table grid, or both.

WhatsUp Gold User Guide
724
Chart Type Gauge charts. Available when you select a Date Range of Last Polled .
Time series. Available when you select a Date Range interval (Today , for example).
Line/Area. Scatter graph that connects adjacent measurements with straight lines.
Spline/Area Spline. Choose a graph with a smoothed appearance where adjacent samples exhibit a gradual slope.
Chart Options Legend, Grid Lines, Range Selector. Include legend, grid lines, and range selector for readability.
Trend Lines. Present data with a smoothed average to show trend.
Tip: Trend lines represent a moving average that can be compared with line and area graphs to reveal peak and sub peak intervals, periods of burstiness, latency, and interruption.
Note: This report only returns Wireless Bandwidth Utilization metrics for devices that already have the appropriate WMI or SNMP credentials. For more information, see Using Credentials.
Share, export, and save as PDF Most generated Wireless Bandwidth Utilization report data can be printed, shared, and exported when selecting Expand ( ) from the Dashboard Options ( ) menu. After the report has been expanded, select export ( ) to access the following options:
Export to PDF. Generate a PDF file of the report with user-defined page size and orientation.
Export Data. Export Wireless Bandwidth Utilization data (on page 951) and leverage outside of WhatsUp Gold.
Schedule Export. Set a recurring date and time, format, and email destination for report data export (on page 942).
Bandwidth Summary Bandwidth Summary report reveals current wireless bandwidth statistics at a glance.
Understand column data The default view of each report contains a grid with the following columns:
Aggregated Transmit. Traffic in. Aggregated wireless bandwidth usage for the transmit (TX) channel in bits per second.
Aggregated Receive. Traffic out. Aggregated wireless bandwidth usage for the receive (RX) channel in bits per second.
Top client usage (last 12 hours). Domain/user/MAC address for the wireless client with highest bandwidth consumption within the last 12 hours.

WhatsUp Gold User Guide
725
Total Traffic (last 12 hours). Total bandwidth usage over the last 12 hours.
Generate a report Choose Device. Choose one or more host devices you want Bandwidth Summary measurements for.
Use the Select Device dialog for one of the following:
Control Purpose
Device Browse and choose a single device.
Single Interface
Choose an interface on a device.
Device Group
Choose an existing group of one or more devices. You can also create custom or dynamic groups.
Note: You can organize devices into custom or dynamic groups. For more information, see Grouping Devices (on page 242).
Rename Report. Edit report name using the Report Settings dialog.
Note: This report only returns Bandwidth Summary metrics for devices that already have the appropriate WMI or SNMP credentials. For more information, see Using Credentials.
Share, export, and save as PDF Most generated Bandwidth Summary report data can be printed, shared, and exported when selecting Expand ( ) from the Dashboard Options ( ) menu. After the report has been expanded, select export ( ) to access the following options:
Export to PDF. Generate a PDF file of the report with user-defined page size and orientation.
Export Data. Export Bandwidth Summary data (on page 951) and leverage outside of WhatsUp Gold.
Schedule Export. Set a recurring date and time, format, and email destination for report data export (on page 942).
Wireless CPU Utilization Wireless CPU Utilization report reveals the top n access points using the largest fraction of the overall CPU processor time during the selected interval.
Understand column data The default view of each report contains a grid with the following columns:
Device-CPU. Device name or IP Address and the CPU identifier.

WhatsUp Gold User Guide
726
Processor. Processor index (if device is multi processor or many core). Min. Minimum observed average utilization. Max. Highest observed average utilization. Average. Overall average utilization for the selected interval.
Generate a report Choose Device. Choose one or more host devices you want Wireless CPU Utilization measurements for.
Use the Select Device dialog for one of the following:
Control Purpose
Device Browse and choose a single device.
Single Interface
Choose an interface on a device.
Device Group
Choose an existing group of one or more devices. You can also create custom or dynamic groups.
Note: You can organize devices into custom or dynamic groups. For more information, see Grouping Devices (on page 242).
Choose time constraints. ( , ) Choose times for the Wireless CPU Utilization. (For recently observed measurements, select Last Polled from the Date Range drop down list.)
Choose time constraints for data view Control Purpose
Date Range (on page 944)
Choose or define an overall date range.
Business hours (on page 944)
Focus on specific days of the week and periods within each day. Reveal trends that are sensitive to business hours, time zones,
and other periodic attributes in the observed data.
Filter and reduce by row and by column. Sort and remove columns, group rows based on specific column values, and remove unwanted information from the table.
Filter and pick by column
Click a report heading and use the following from the drop down list:

WhatsUp Gold User Guide
727
Control Purpose
Sort. Sort column in ascending or descending order.
Columns. Pick the columns you want to view. Click a check box to display the column. Clear the check box to hide it.
Group by this field.
Group table into collapsible rows wherever the current column contains identical data ("field") values.
Filters. Provide a keyword to view only rows that contain the keyword for this column.
Chart, adjust output, and visualize. Fine tune report presentation and range of values displayed using the Report Settings dialog (optional).
Specify threshold and top n: Control Purpose
Show Top n Items Limit items to the samples with the highest (or lowest) utilization.
Threshold Type Switch between minimum or maximum mode for cutoff values for the ranked list.
At or Over. Show peak usage period. (Utilization percentage equal to or greater than Threshold.)
At or Under. Show usage periods where resources are unused or possibly down. (Utilization percentage equal to or less than Threshold.)
Threshold (percent)
Baseline value used to trim ranked device list based on peak or subpeak capacity when returning the Top n.
Chart and visualize data over time (single device ) Charting and visualization is available when you select a single device.
Control Purpose
Display Options Present data as a chart, a table grid, or both.

WhatsUp Gold User Guide
728
Chart Type Gauge charts. Available when you select a Date Range of Last Polled .
Time series. Available when you select a Date Range interval (Today , for example).
Line/Area. Scatter graph that connects adjacent measurements with straight lines.
Spline/Area Spline. Choose a graph with a smoothed appearance where adjacent samples exhibit a gradual slope.
Chart Options Legend, Grid Lines, Range Selector. Include legend, grid lines, and range selector for readability.
Trend Lines. Present data with a smoothed average to show trend.
Tip: Trend lines represent a moving average that can be compared with line and area graphs to reveal peak and sub peak intervals, periods of burstiness, latency, and interruption.
Note: This report only returns Wireless CPU Utilization metrics for devices that already have the appropriate WMI or SNMP credentials. For more information, see Using Credentials.
Share, export, and save as PDF Most generated Wireless CPU Utilization report data can be printed, shared, and exported when selecting Expand ( ) from the Dashboard Options ( ) menu. After the report has been expanded, select export ( ) to access the following options:
Export to PDF. Generate a PDF file of the report with user-defined page size and orientation.
Export Data. Export Wireless CPU Utilization data (on page 951) and leverage outside of WhatsUp Gold.
Schedule Export. Set a recurring date and time, format, and email destination for report data export (on page 942).
Client Count Client Count report reveals the highest number of wireless "clients" (wireless devices operating in station mode) for each device serving as a wireless access point during the selected reporting interval.
Understand column data The default view of each report contains a grid with the following columns:
Device. Device name or IP Address. Min. Least number of clients the device provided wireless access point services
to for the specified interval.

WhatsUp Gold User Guide
729
Max. Greatest number of clients the device provided wireless access point services to for the specified interval.
Average. Average number of clients the device provided wireless access point services to for the specified interval.
Generate a report Choose Device. Choose one or more host devices you want Client Count measurements for.
Use the Select Device dialog for one of the following:
Control Purpose
Device Browse and choose a single device.
Single Interface
Choose an interface on a device.
Device Group
Choose an existing group of one or more devices. You can also create custom or dynamic groups.
Note: You can organize devices into custom or dynamic groups. For more information, see Grouping Devices (on page 242).
Choose time constraints. ( , ) Choose times for the Client Count. (For recently observed measurements, select Last Polled from the Date Range drop down list.)
Choose time constraints for data view Control Purpose
Date Range (on page 944)
Choose or define an overall date range.
Business hours (on page 944)
Focus on specific days of the week and periods within each day. Reveal trends that are sensitive to business hours, time zones,
and other periodic attributes in the observed data.
Filter and reduce by row and by column. Sort and remove columns, group rows based on specific column values, and remove unwanted information from the table.
Filter and pick by column
Click a report heading and use the following from the drop down list:

WhatsUp Gold User Guide
730
Control Purpose
Sort. Sort column in ascending or descending order.
Columns. Pick the columns you want to view. Click a check box to display the column. Clear the check box to hide it.
Group by this field.
Group table into collapsible rows wherever the current column contains identical data ("field") values.
Filters. Provide a keyword to view only rows that contain the keyword for this column.
Chart, adjust output, and visualize. Fine tune report presentation and range of values displayed using the Report Settings dialog (optional).
Specify threshold and top n: Control Purpose
Show Top n Items Limit items to the samples with the highest (or lowest) utilization.
Threshold Type Switch between minimum or maximum mode for cutoff values for the ranked list.
At or Over. Show peak usage period. (Utilization percentage equal to or greater than Threshold.)
At or Under. Show usage periods where resources are unused or possibly down. (Utilization percentage equal to or less than Threshold.)
Threshold (percent)
Baseline value used to trim ranked device list based on peak or subpeak capacity when returning the Top n.
Chart and visualize data over time (single device ) Charting and visualization is available when you select a single device.
Control Purpose
Display Options Present data as a chart, a table grid, or both.

WhatsUp Gold User Guide
731
Chart Type Gauge charts. Available when you select a Date Range of Last Polled .
Time series. Available when you select a Date Range interval (Today , for example).
Line/Area. Scatter graph that connects adjacent measurements with straight lines.
Spline/Area Spline. Choose a graph with a smoothed appearance where adjacent samples exhibit a gradual slope.
Chart Options Legend, Grid Lines, Range Selector. Include legend, grid lines, and range selector for readability.
Trend Lines. Present data with a smoothed average to show trend.
Tip: Trend lines represent a moving average that can be compared with line and area graphs to reveal peak and sub peak intervals, periods of burstiness, latency, and interruption.
Note: This report only returns Client Count metrics for devices that already have the appropriate WMI or SNMP credentials. For more information, see Using Credentials.
Share, export, and save as PDF Most generated Client Count report data can be printed, shared, and exported when selecting Expand ( ) from the Dashboard Options ( ) menu. After the report has been expanded, select export ( ) to access the following options:
Export to PDF. Generate a PDF file of the report with user-defined page size and orientation.
Export Data. Export Client Count data (on page 951) and leverage outside of WhatsUp Gold.
Schedule Export. Set a recurring date and time, format, and email destination for report data export (on page 942).
Wireless Wireless log records WhatsUp Gold wireless service events.
Each log message record contains the following data columns:
Date. Date and time for the event message. Severity. Log message classification. For example Warning. Message. Log message string.
Fetch and filter log data Choose Date Range. Choose date/time range or choose Last Polled for the latest.
From the Date Range drop down selector, you can choose:

WhatsUp Gold User Guide
732
A pre-configured date range relative to now (Week to Date, for example). A specific date range relative to now (Last n Days, for example). A custom range that you specify.
Filter and reduce by row and by column. Select rows based on specific column values, remove columns, and remove noise and chaff from the table.
Filter tables rows and hide and select columns
Click a column heading and use the following from the drop down list:
Control Purpose
Sort. Sort column in ascending or descending order.
Columns. Pick the columns you want to view. Click a check box to display the column. Clear the check box to hide it.
Group by this field.
Group table into collapsible rows wherever the current column contains identical data ("field") values.
Filters. Provide a keyword and use wildcards to view only rows that contain the keyword for the selected column or view.
Most column and log view filters provide the following wildcard matching:
Match either zero characters or any one character ('?'). Example: 198.51.100.2? (Matches tokens with IP address ending with 2, or 20-29.)
Match either zero, any one, or many characters ('*'). Example: Stop* (Matches log strings containing Stop, Stopped, Stopping, and so on.)
Share, export, and save as PDF Most generated Wireless report data can be printed, shared, and exported when selecting Expand ( ) from the Dashboard Options ( ) menu. After the report has been expanded, select export ( ) to access the following options:
Export to PDF. Generate a PDF file of the report with user-defined page size and orientation.
Export Data. Export Wireless data (on page 951) and leverage outside of WhatsUp Gold.
Schedule Export. Set a recurring date and time, format, and email destination for report data export (on page 942).

WhatsUp Gold User Guide
733
Wireless Memory Utilization Wireless Memory Utilization report reveals reports present minimum, maximum, and average memory utilization for one or more wireless devices you specify.
Understand column data The default view of each report contains a grid with the following columns:
Min. Minimum 'in-use' memory footprint on the device. Max. Maximum amount of memory in use on the device. Percent. Percent utilization averaged for the selected period.
Generate a report Choose Device. Choose one or more host devices you want Wireless Memory Utilization measurements for.
Use the Select Device dialog for one of the following:
Control Purpose
Device Browse and choose a single device.
Single Interface
Choose an interface on a device.
Device Group
Choose an existing group of one or more devices. You can also create custom or dynamic groups.
Note: You can organize devices into custom or dynamic groups. For more information, see Grouping Devices (on page 242).
Choose time constraints. Choose times for the Wireless Memory Utilization. (For recently observed measurements, select Last Polled from the Date Range drop down list.)
Choose time constraints for data view Control Purpose
Date Range (on page 944)
Choose or define an overall date range.
Business hours (on page 944)
Focus on specific days of the week and periods within each day. Reveal trends that are sensitive to business hours, time zones,
and other periodic attributes in the observed data.

WhatsUp Gold User Guide
734
Filter and reduce by row and by column. Sort and remove columns, group rows based on specific column values, remove and remove noise and chaff from the table.
Filter and pick by column
Click a report heading and use the following from the drop down list:
Control Purpose
Sort. Sort column in ascending or descending order.
Columns. Pick the columns you want to view. Click a check box to display the column. Clear the check box to hide it.
Group by this field.
Group table into collapsible rows wherever the current column contains identical data ("field") values.
Filters. Provide a keyword to view only rows that contain the keyword for this column.
Choose device filter. Return only devices with certain roles or characteristics (SSID, access point, single client).
Chart, adjust output, and visualize. Fine tune report presentation and range of values displayed using the Report Settings dialog (optional).
Specify threshold and top n: Control Purpose
Show Top n Items Limit items to the samples with the highest values.
Sort by Field Select a column to sort by (if applicable).
Chart and view options Control Purpose
View Options Select/clear the checkboxes to display/hide Totals. Display totals for each column. Others. Remainder values that do not make the top n. Chart. Display the selected Chart Type. Legend. Include legend and grid lines for readability. Trend Lines. Present data a smoothed average to show trend.

WhatsUp Gold User Guide
735
Chart Type Select a chart type and associated options: Pie. Pie distribution chart. Line/Area. Scatter graph that connects adjacent measurements
with straight lines. Spline/Area Spline. Choose a graph with a smoothed
appearance where adjacent samples exhibit a gradual slope. Vertical Bar/Horizontal Bar. Vertical or horizontal bar
chart/histogram. Y-Axis Scale Scale Y-axis (chart and graph height) automatically or choose a fixed size.
Choose device filter. Return only devices with certain roles or characteristics (SSID, access point, single client).
Note: This report only returns Wireless Memory Utilization metrics for devices that already have the appropriate credentials. For more information, see Using Credentials.
Share, export, and save as PDF Most generated Wireless Memory Utilization report data can be printed, shared, and exported when selecting Expand ( ) from the Dashboard Options ( ) menu. After the report has been expanded, select export ( ) to access the following options:
Export to PDF. Generate a PDF file of the report with user-defined page size and orientation.
Export Data. Export Wireless Memory Utilization data (on page 951) and leverage outside of WhatsUp Gold.
Schedule Export. Set a recurring date and time, format, and email destination for report data export (on page 942).
RSSI RSSI report reveals RF signal strength for wireless devices.
Understand column data The default view of each report contains a grid with the following columns:
Device. Device hostname, IP address, or custom label. Min. Lowest average signal transmission strength observed within the selected
interval. Max. Greatest signal transmission strength observed within the selected
interval. Avg. Average signal strength observed for the selected interval.

WhatsUp Gold User Guide
736
Generate a report Choose Device. Choose one or more host devices you want RSSI measurements for.
Use the Select Device dialog for one of the following:
Control Purpose
Device Browse and choose a single device.
Single Interface
Choose an interface on a device.
Device Group
Choose an existing group of one or more devices. You can also create custom or dynamic groups.
Note: You can organize devices into custom or dynamic groups. For more information, see Grouping Devices (on page 242).
Choose time constraints. ( , ) Choose times for the RSSI. (For recently observed measurements, select Last Polled from the Date Range drop down list.)
Choose time constraints for data view Control Purpose
Date Range (on page 944)
Choose or define an overall date range.
Business hours (on page 944)
Focus on specific days of the week and periods within each day. Reveal trends that are sensitive to business hours, time zones,
and other periodic attributes in the observed data.
Filter and reduce by row and by column. Sort and remove columns, group rows based on specific column values, and remove unwanted information from the table.
Filter and pick by column
Click a report heading and use the following from the drop down list:
Control Purpose
Sort. Sort column in ascending or descending order.
Columns. Pick the columns you want to view. Click a check box to display the column. Clear the check box to hide it.

WhatsUp Gold User Guide
737
Group by this field.
Group table into collapsible rows wherever the current column contains identical data ("field") values.
Filters. Provide a keyword to view only rows that contain the keyword for this column.
Chart, adjust output, and visualize. Fine tune report presentation and range of values displayed using the Report Settings dialog (optional).
Specify threshold and top n: Control Purpose
Show Top n Items Limit items to the samples with the highest (or lowest) utilization.
Threshold Type Switch between minimum or maximum mode for cutoff values for the ranked list.
At or Over. Show peak usage period. (Utilization percentage equal to or greater than Threshold.)
At or Under. Show usage periods where resources are unused or possibly down. (Utilization percentage equal to or less than Threshold.)
Threshold (percent)
Baseline value used to trim ranked device list based on peak or subpeak capacity when returning the Top n.
Chart and visualize data over time (single device ) Charting and visualization is available when you select a single device.
Control Purpose
Display Options Present data as a chart, a table grid, or both.
Chart Type Gauge charts. Available when you select a Date Range of Last Polled .
Time series. Available when you select a Date Range interval (Today , for example).
Line/Area. Scatter graph that connects adjacent measurements with straight lines.
Spline/Area Spline. Choose a graph with a smoothed appearance where adjacent samples exhibit a gradual slope.
Chart Options Legend, Grid Lines, Range Selector. Include legend, grid lines, and range selector for readability.
Trend Lines. Present data with a smoothed average to show trend.

WhatsUp Gold User Guide
738
Tip: Trend lines represent a moving average that can be compared with line and area graphs to reveal peak and sub peak intervals, periods of burstiness, latency, and interruption.
Note: This report only returns RSSI metrics for devices that already have the appropriate WMI or SNMP credentials. For more information, see Using Credentials.
Share, export, and save as PDF Most generated RSSI report data can be printed, shared, and exported when selecting Expand ( ) from the Dashboard Options ( ) menu. After the report has been expanded, select export ( ) to access the following options:
Export to PDF. Generate a PDF file of the report with user-defined page size and orientation.
Export Data. Export RSSI data (on page 951) and leverage outside of WhatsUp Gold.
Schedule Export. Set a recurring date and time, format, and email destination for report data export (on page 942).
Rogue Count Rogue Count report reveals the names of unknown ("rogue") wireless end stations connected to the access point you specify.
Understand column data The default view of each report contains a grid with the following columns:
Device. Device name or IP address of access point. Rogue Count. Average number of unknown ("rogue") wireless end stations
connected to the access point during the specified time frame.
Important: The rogue count displayed in the Wireless Rogue Count (on page 738) dashboard report represents the average number of rouges seen by the specified access point(s) within the selected timeframe. However, the rogue count displayed in the Wireless System Summary (on page 744) dashboard report represents the total number of rogue end stations seen on the network.
Generate a report Choose Device. Choose one or more host devices you want Rogue Count measurements for.
Use the Select Device dialog for one of the following:

WhatsUp Gold User Guide
739
Control Purpose
Device Browse and choose a single device.
Device Group
Choose an existing group of one or more devices. You can also create custom or dynamic groups.
Note: You can organize devices into custom or dynamic groups. For more information, see Grouping Devices (on page 242).
Tip: If a device is identified as a virtual machine, Hyper-V or VMware credentials will be used to retrieve data and only those physical resources allocated to the virtual machine will be visible in the report.
Sort and pick columns. Sort and pick columns.
Filter and pick by column
Click a report heading and use the following from the drop down list:
Control Purpose
Sort. Sort column in ascending or descending order.
Columns. Pick the columns you want to view. Click a check box to display the column. Clear the check box to hide it.
Chart, adjust output, and visualize. Fine tune report presentation and range of values displayed using the Report Settings dialog (optional).
Specify threshold and top n: Control Purpose
Show Top n Items Limit items to the samples with the highest (or lowest) utilization.
Threshold Type Switch between minimum or maximum mode for cutoff values for the ranked list.
At or Over. Show peak usage period. (Utilization percentage equal to or greater than Threshold.)
At or Under. Show usage periods where resources are unused or possibly down. (Utilization percentage equal to or less than Threshold.)

WhatsUp Gold User Guide
740
Threshold (percent)
Baseline value used to trim ranked device list based on peak or subpeak capacity when returning the Top n.
Chart and visualize data over time (single device ) Charting and visualization is available when you select a single device.
Control Purpose
Display Options Present data as a chart, a table grid, or both.
Chart Type Gauge charts. Available when you select a Date Range of Last Polled .
Time series. Available when you select a Date Range interval (Today , for example).
Line/Area. Scatter graph that connects adjacent measurements with straight lines.
Spline/Area Spline. Choose a graph with a smoothed appearance where adjacent samples exhibit a gradual slope.
Chart Options Legend, Grid Lines, Range Selector. Include legend, grid lines, and range selector for readability.
Trend Lines. Present data with a smoothed average to show trend.
Tip: Trend lines represent a moving average that can be compared with line and area graphs to reveal peak and sub peak intervals, periods of burstiness, latency, and interruption.
Note: This report only returns Rogue Count metrics for devices that already have the appropriate WMI or SNMP credentials. For more information, see Using Credentials.
Share, export, and save as PDF Most generated Rogue Count report data can be printed, shared, and exported when selecting Expand ( ) from the Dashboard Options ( ) menu. After the report has been expanded, select export ( ) to access the following options:
Export to PDF. Generate a PDF file of the report with user-defined page size and orientation.
Export Data. Export Rogue Count data (on page 951) and leverage outside of WhatsUp Gold.
Schedule Export. Set a recurring date and time, format, and email destination for report data export (on page 942).
Signal to Noise Ratio Signal to Noise Ratio report reveals lowest overall radio frequency (RF) signal-to-noise (SNR) percentages observed for the selected duration. SNR is particularly important for

WhatsUp Gold User Guide
741
wireless networking for ensuring QoS for voice and other continuous media traffic over IP. When measured in dB, SNR should fall between 25 and 40 dB —where:
SNR >= 40dB. Excellent. 25dB < SNR < 40dB. Good. SNR < 25dB. Poor.
SNR is calculated by subtracting the wireless signal strength from that of the noise floor. Poor signal to noise ratio can occur due to hardware transmit issues, nearby devices emitting radio frequency interference (RFI), and other sources of higher than normal RFI present in the ambient that combine to contribute to the normal background noise also referred to as the noise floor.
Understand column data The default view of each report contains a grid with the following columns:
Device. Device hostname, IP address, or custom label. Min. Lowest average signal to noise ratio observed during the selected interval. Max. Highest average signal to noise ratio observed during the selected interval. Avg. Average signal to noise ratio for the selected time interval.
Note: Percentages reported likely will never reach 0 or 100. Generally, An SNR of 40% is considered good. Anything less than 20% is considered poor.
Generate a report Choose Device. Choose one or more host devices you want Signal to Noise Ratio measurements for.
Use the Select Device dialog for one of the following:
Control Purpose
Device Browse and choose a single device.
Single Interface
Choose an interface on a device.
Device Group
Choose an existing group of one or more devices. You can also create custom or dynamic groups.
Note: You can organize devices into custom or dynamic groups. For more information, see Grouping Devices (on page 242).

WhatsUp Gold User Guide
742
Choose time constraints. ( , ) Choose times for the Signal to Noise Ratio. (For recently observed measurements, select Last Polled from the Date Range drop down list.)
Choose time constraints for data view Control Purpose
Date Range (on page 944)
Choose or define an overall date range.
Business hours (on page 944)
Focus on specific days of the week and periods within each day. Reveal trends that are sensitive to business hours, time zones,
and other periodic attributes in the observed data.
Filter and reduce by row and by column. Sort and remove columns, group rows based on specific column values, and remove unwanted information from the table.
Filter and pick by column
Click a report heading and use the following from the drop down list:
Control Purpose
Sort. Sort column in ascending or descending order.
Columns. Pick the columns you want to view. Click a check box to display the column. Clear the check box to hide it.
Group by this field.
Group table into collapsible rows wherever the current column contains identical data ("field") values.
Filters. Provide a keyword to view only rows that contain the keyword for this column.
Chart, adjust output, and visualize. Fine tune report presentation and range of values displayed using the Report Settings dialog (optional).
Specify threshold and top n: Control Purpose
Show Top n Items Limit items to the samples with the highest (or lowest) utilization.

WhatsUp Gold User Guide
743
Threshold Type Switch between minimum or maximum mode for cutoff values for the ranked list.
At or Over. Show peak usage period. (Utilization percentage equal to or greater than Threshold.)
At or Under. Show usage periods where resources are unused or possibly down. (Utilization percentage equal to or less than Threshold.)
Threshold (percent)
Baseline value used to trim ranked device list based on peak or subpeak capacity when returning the Top n.
Chart and visualize data over time (single device ) Charting and visualization is available when you select a single device.
Control Purpose
Display Options Present data as a chart, a table grid, or both.
Chart Type Gauge charts. Available when you select a Date Range of Last Polled .
Time series. Available when you select a Date Range interval (Today , for example).
Line/Area. Scatter graph that connects adjacent measurements with straight lines.
Spline/Area Spline. Choose a graph with a smoothed appearance where adjacent samples exhibit a gradual slope.
Chart Options Legend, Grid Lines, Range Selector. Include legend, grid lines, and range selector for readability.
Trend Lines. Present data with a smoothed average to show trend.
Tip: Trend lines represent a moving average that can be compared with line and area graphs to reveal peak and sub peak intervals, periods of burstiness, latency, and interruption.
Note: This report only returns Signal to Noise Ratio metrics for devices that already have the appropriate WMI or SNMP credentials. For more information, see Using Credentials.
Share, export, and save as PDF Most generated Signal to Noise Ratio report data can be printed, shared, and exported when selecting Expand ( ) from the Dashboard Options ( ) menu. After the report has been expanded, select export ( ) to access the following options:
Export to PDF. Generate a PDF file of the report with user-defined page size and orientation.

WhatsUp Gold User Guide
744
Export Data. Export Signal to Noise Ratio data (on page 951) and leverage outside of WhatsUp Gold.
Schedule Export. Set a recurring date and time, format, and email destination for report data export (on page 942).
Wireless System Summary Wireless System Summary report reveals wireless LAN system information for a network you specify.
Understand column data The default view of each report contains a grid with the following columns:
WLCs. Number of wireless LAN controllers connected to the selected network. Lightweight APs. Number of lightweight wireless access points (access points
managed by WLCs). Autonomous APs. Number of stand-alone (locally managed) wireless access
points. SSIDs. Number of service set identifiers (SSIDs) in use. Clients. Number of known wireless end stations detected. Rogues. Number of unknown ("rogue") wireless end stations detected. RSSI Avg. Average radio frequency (RF) signal strength percentage observed. SNR Avg. Average signal to noise ratio (SNR) observed.
Important: The rogue count displayed in the Wireless Rogue Count (on page 738) dashboard report represents the average number of rouges seen by the specified access point(s) within the selected timeframe. However, the rogue count displayed in the Wireless System Summary (on page 744) dashboard report represents the total number of rogue end stations seen on the network.
Generate a report Choose Device. Choose one or more host devices you want Wireless System Summary measurements for.
Use the Select Device dialog for one of the following:
Control Purpose
Device Browse and choose a single device.
Single Interface
Choose an interface on a device.
Device Group
Choose an existing group of one or more devices. You can also create custom or dynamic groups.

WhatsUp Gold User Guide
745
Note: You can organize devices into custom or dynamic groups. For more information, see Grouping Devices (on page 242).
Choose time constraints. ( , ) Choose times for the Wireless System Summary. (For recently observed measurements, select Last Polled from the Date Range drop down list.)
Choose time constraints for data view Control Purpose
Date Range (on page 944)
Choose or define an overall date range.
Business hours (on page 944)
Focus on specific days of the week and periods within each day. Reveal trends that are sensitive to business hours, time zones,
and other periodic attributes in the observed data.
Filter and reduce by row and by column. Sort and remove columns, group rows based on specific column values, and remove unwanted information from the table.
Filter and pick by column
Click a report heading and use the following from the drop down list:
Control Purpose
Sort. Sort column in ascending or descending order.
Columns. Pick the columns you want to view. Click a check box to display the column. Clear the check box to hide it.
Group by this field.
Group table into collapsible rows wherever the current column contains identical data ("field") values.
Filters. Provide a keyword to view only rows that contain the keyword for this column.
WhatsUp Gold User Guide
746
Chart, adjust output, and visualize. Fine tune report presentation and range of values displayed using the Report Settings dialog (optional).
Specify threshold and top n: Control Purpose
Show Top n Items Limit items to the samples with the highest (or lowest) utilization.
Threshold Type Switch between minimum or maximum mode for cutoff values for the ranked list.
At or Over. Show peak usage period. (Utilization percentage equal to or greater than Threshold.)
At or Under. Show usage periods where resources are unused or possibly down. (Utilization percentage equal to or less than Threshold.)
Threshold (percent)
Baseline value used to trim ranked device list based on peak or subpeak capacity when returning the Top n.
Chart and visualize data over time (single device ) Charting and visualization is available when you select a single device.
Control Purpose
Display Options Present data as a chart, a table grid, or both.
Chart Type Gauge charts. Available when you select a Date Range of Last Polled .
Time series. Available when you select a Date Range interval (Today , for example).
Line/Area. Scatter graph that connects adjacent measurements with straight lines.
Spline/Area Spline. Choose a graph with a smoothed appearance where adjacent samples exhibit a gradual slope.
Chart Options Legend, Grid Lines, Range Selector. Include legend, grid lines, and range selector for readability.
Trend Lines. Present data with a smoothed average to show trend.
Tip: Trend lines represent a moving average that can be compared with line and area graphs to reveal peak and sub peak intervals, periods of burstiness, latency, and interruption.
Note: This report only returns Wireless System Summary metrics for devices that already have the appropriate WMI or SNMP credentials. For more information, see Using Credentials.

WhatsUp Gold User Guide
747
Share, export, and save as PDF Most generated Wireless System Summary report data can be printed, shared, and exported when selecting Expand ( ) from the Dashboard Options ( ) menu. After the report has been expanded, select export ( ) to access the following options:
Export to PDF. Generate a PDF file of the report with user-defined page size and orientation.
Export Data. Export Wireless System Summary data (on page 951) and leverage outside of WhatsUp Gold.
Schedule Export. Set a recurring date and time, format, and email destination for report data export (on page 942).
Wireless Rogue Setting Wireless Clients Wireless Clients report reveals clients connected to your wireless network and what is known about them. If the client name is not available or cannot be determined, the client's MAC address is displayed. The client name is determined by Wi-Fi authentication and may not be present under all authentication schemes.
Select a client and click the Assign Group button to organize clients into an existing wireless client group. You can also click Managing Wireless Client Groups (on page 398) to access the Wireless Client Group library where you can create new groups, edit existing ones, or remove them from the application.
Tip: If a client is displayed as 0.0.0.0, this indicates the device's controller is unable to obtain its IP address or the access point cannot determine it.
Understand column data The default view of each report contains a grid with the following columns:
Client. Device name or string identifier. Click any client name to display the Wireless Client Details (on page 750) dashboard view for that device.
MAC Address. Client MAC address. IP Address. Client IP address. AP. The access point to which the client was connected. SSID. Service Set Identifier of the connected access point. First Seen. Date and time when the client first connected. Last Seen. Date and time when the client disconnected. Rx Avg. The average amount of data received by the client device from the
access point during the session. Tx Avg. The average amount of data transmitted by the client device to the
access point during the session.

WhatsUp Gold User Guide
748
% Connected. Percent of the interval connected between the first seen and last seen marks.
The following additional columns are hidden but can be enabled using the menu accessible from the column headers:
User. Name of the user logged in to the client device. Group. Name of the group to which the client belongs. See Managing Wireless
Client Groups (on page 398) for additional detail. Radio Type. The classification of physical device broadcasting the SSID. Bytes Sent. Total data sent. Bytes Received. Total data received.
Generate a report Choose Device. Choose one or more host devices you want Wireless Clients measurements for.
Use the Select Device dialog for one of the following:
Control Purpose
Device Browse and choose a single device.
Single Interface
Choose an interface on a device.
Device Group
Choose an existing group of one or more devices. You can also create custom or dynamic groups.
Note: You can organize devices into custom or dynamic groups. For more information, see Grouping Devices (on page 242).
Choose time constraints. ( , ) Choose times for the Wireless Clients. (For recently observed measurements, select Last Polled from the Date Range drop down list.)
Choose time constraints for data view Control Purpose
Date Range (on page 944)
Choose or define an overall date range.
Business hours (on page 944)
Focus on specific days of the week and periods within each day. Reveal trends that are sensitive to business hours, time zones,
and other periodic attributes in the observed data.

WhatsUp Gold User Guide
749
Filter and reduce by row and by column. Sort and remove columns, group rows based on specific column values, and remove unwanted information from the table.
Filter and pick by column
Click a report heading and use the following from the drop down list:
Control Purpose
Sort. Sort column in ascending or descending order.
Columns. Pick the columns you want to view. Click a check box to display the column. Clear the check box to hide it.
Group by this field.
Group table into collapsible rows wherever the current column contains identical data ("field") values.
Filters. Provide a keyword to view only rows that contain the keyword for this column.
Chart, adjust output, and visualize. Fine tune report presentation and range of values displayed using the Report Settings dialog (optional).
Specify threshold and top n: Control Purpose
Show Top n Items Limit items to the samples with the highest (or lowest) utilization.
Threshold Type Switch between minimum or maximum mode for cutoff values for the ranked list.
At or Over. Show peak usage period. (Utilization percentage equal to or greater than Threshold.)
At or Under. Show usage periods where resources are unused or possibly down. (Utilization percentage equal to or less than Threshold.)
Threshold (percent)
Baseline value used to trim ranked device list based on peak or subpeak capacity when returning the Top n.
Chart and visualize data over time (single device ) Charting and visualization is available when you select a single device.
Control Purpose
Display Options Present data as a chart, a table grid, or both.

WhatsUp Gold User Guide
750
Chart Type Gauge charts. Available when you select a Date Range of Last Polled .
Time series. Available when you select a Date Range interval (Today , for example).
Line/Area. Scatter graph that connects adjacent measurements with straight lines.
Spline/Area Spline. Choose a graph with a smoothed appearance where adjacent samples exhibit a gradual slope.
Chart Options Legend, Grid Lines, Range Selector. Include legend, grid lines, and range selector for readability.
Trend Lines. Present data with a smoothed average to show trend.
Tip: Trend lines represent a moving average that can be compared with line and area graphs to reveal peak and sub peak intervals, periods of burstiness, latency, and interruption.
Note: This report only returns Wireless Clients metrics for devices that already have the appropriate WMI or SNMP credentials. For more information, see Using Credentials.
Share, export, and save as PDF Most generated Wireless Clients report data can be printed, shared, and exported when selecting Expand ( ) from the Dashboard Options ( ) menu. After the report has been expanded, select export ( ) to access the following options:
Export to PDF. Generate a PDF file of the report with user-defined page size and orientation.
Export Data. Export Wireless Clients data (on page 951) and leverage outside of WhatsUp Gold.
Schedule Export. Set a recurring date and time, format, and email destination for report data export (on page 942).
Wireless Clients: Specific Client The Wireless Clients: Specific Client displays a suite of reports that present identifying and connection information specific to the individual client selected from within the Wireless Clients (on page 747) report. If the client name is not available or cannot be determined, the client's MAC address is displayed. The client name is determined by Wi-Fi authentication and may not be present under all authentication schemes. Please note, if a client is displayed as 0.0.0.0, this indicates the device's controller is unable to obtain its IP address or the access point cannot determine it.
The Bandwidth (on page 752) report displays traffic in and out.
The Session Details (on page 751) report displays the following information:
IP Address. IP Address assigned to the wireless client.

WhatsUp Gold User Guide
751
SSID. SSID of the connected access point.
Device. Access point to which the client connected
First Seen. Date and time when the client first connected.
Last Seen. Date and time when the client disconnected.
Bytes Sent. Total data sent.
Bytes Received. Total data received.
% Connected. Percent of the interval connected between the first seen and last seen marks.
The Associations (on page 752) report displays connection time by percentage for each associated access point and SSID.
The Signal Quality (on page 753) report displays radio signal strength indicator (on page 735) and signal-to-noise (on page 740) ratio percentages.
Please note, this dashboard is completely static. Additional reports cannot be added and the charts described previously cannot be removed. However, you can modify the date range ( ), expand any individual dashboard report to a full page view ( ), and specify the minimum and maximum number of items to be displayed.
Wireless Session Details Wireless Session Details report reveals clients connected to your wireless network and what is known about them. If the client name is not available or cannot be determined, the client's MAC address is displayed. The client name is determined by Wi-Fi authentication and may not be present under all authentication schemes.
Select a client and click the Assign Group button to organize clients into a group.
Tip: If a client is displayed as 0.0.0.0, this indicates the device's controller is unable to obtain its IP address or the access point cannot determine it.
Understand column data The default view of each report contains a grid with the following columns:
Client. Client name or string identifier. MAC. Client MAC address. SSID. SSID of the connected access point. Device. Access point to which the client connected First Seen. Date and time when the client first connected. Last Seen. Date and time when the client disconnected. Bytes Sent. Total data sent. Bytes Received. Total data received.

WhatsUp Gold User Guide
752
% Connected. Percent of the interval connected between the first seen and last seen marks.
Client Bandwidth Client Bandwidth report reveals wireless client bandwidth utilization.
Client Associations Client Associations report reveals a pair of charts displaying access point and SSID associations for the selected client. The report also includes an Associations Summary grid below the chart reporting the following:
Type. The association type for which data is being reported; either AP or SSID.
Name. The name assigned to the access point or the service set identifier to which the client device is connected.
Total Time. The amount of time the client device was connected to the access point during the selected date range in hours/minutes.
% Connected. The percentage time the client device was connected to the access point during the selected date range.
Click to access Report Settings where you can specify chart type, options, and scale as well as rename the report, if desired.
Share, export, and save as PDF Most generated Client Associations report data can be printed, shared, and exported when selecting Expand ( ) from the Dashboard Options ( ) menu. After the report has been expanded, select export ( ) to access the following options:
Export to PDF. Generate a PDF file of the report with user-defined page size and orientation.
Export Data. Export Client Associations data (on page 951) and leverage outside of WhatsUp Gold.
Schedule Export. Set a recurring date and time, format, and email destination for report data export (on page 942).
Wireless Client Session Details Wireless Client Session Details report reveals a chart displaying a wireless client as it moves through different access points in the network. This chart plots the client device as it moves from wireless access point to wireless access point over time. Each access point is represented by a line on the y-axis with each connection represented by a segment on that line. The report also includes a Session Summary grid below the chart reporting the following:
AP. The name assigned to the access point to which the client device is connected.
First Seen. The date and time the client device connected to the access point.
Rx Avg. The average amount of data received by the client device from the access point during the session.

WhatsUp Gold User Guide
753
Tx Avg. The average amount of data transmitted by the client device to the access point during the session.
% Connected. The amount of time the client device was connected to the access point during the selected date range.
The following additional columns are visible when the Wireless Client Session Details report is expanded to full screen view:
IP. The IP Address of the selected wireless client.
SSID. The service set identifier to which the client device is connected.
Radio Type. The classification of physical device broadcasting the SSID.
Last Seen. The date and time the client device disconnected from the access point.
Rx Bytes. The quantity of data received by the client device from the access point during the session.
Tx Bytes. The quantity of data transmitted by the client device to the access point during the session.
Click to access Report Settings where you enable/disable individual session metrics for display as well as rename the report, if desired.
Share, export, and save as PDF Most generated Wireless Client Session Details report data can be printed, shared, and exported when selecting Expand ( ) from the Dashboard Options ( ) menu. After the report has been expanded, select export ( ) to access the following options:
Export to PDF. Generate a PDF file of the report with user-defined page size and orientation.
Export Data. Export Wireless Client Session Details data (on page 951) and leverage outside of WhatsUp Gold.
Schedule Export. Set a recurring date and time, format, and email destination for report data export (on page 942).
Wireless Client Signal Quality Wireless Client Signal Quality report reveals a chart displaying Received Signal Strength Indication (RSSI) and Signal to Noise Ratio (SNR) data for the selected wireless client device and timeframe. The report also includes a Session Summary grid below the chart reporting the following:
Type. The individual metric displayed on the chart; either RSSI or SNR.
Last Seen. The date and time the client device was last detected during the selected timeframe.
Min. The minimum RSSI or SNR during the selected timeframe.
Max. The maximum RSSI or SNR during the selected timeframe.
Avg. The average RSSI or SNR during the selected timeframe.

WhatsUp Gold User Guide
754
Click to access Report Settings where you can specify chart type, options, and scale as well as rename the report, if desired.
Share, export, and save as PDF Most generated Wireless Client Signal Quality report data can be printed, shared, and exported when selecting Expand ( ) from the Dashboard Options ( ) menu. After the report has been expanded, select export ( ) to access the following options:
Export to PDF. Generate a PDF file of the report with user-defined page size and orientation.
Export Data. Export Wireless Client Signal Quality data (on page 951) and leverage outside of WhatsUp Gold.
Schedule Export. Set a recurring date and time, format, and email destination for report data export (on page 942).
Wireless Client Bandwidth (Specific Client) Wireless Client Bandwidth (Specific Client) report reveals a chart displaying traffic data for the selected wireless client device and timeframe. The report also includes a Bandwidth Summary grid below the chart reporting the following:
Type. The individual metric displayed on the chart; either Traffic In or Traffic Out.
Last Seen. The date and time the client device was last detected during the selected timeframe.
Min. The minimum kilobytes per second received/sent by the specified wireless client device during the selected timeframe.
Max. The maximum kilobytes per second received/sent by the specified wireless client device during the selected timeframe.
Avg. The average kilobytes per second received/sent by the specified wireless client device during the selected timeframe.
Click to access Report Settings where you can specify chart type, options, and scale as well as rename the report, if desired.
Share, export, and save as PDF Most generated Wireless Client Bandwidth (Specific Client) report data can be printed, shared, and exported when selecting Expand ( ) from the Dashboard Options ( ) menu. After the report has been expanded, select export ( ) to access the following options:
Export to PDF. Generate a PDF file of the report with user-defined page size and orientation.
Export Data. Export Wireless Client Bandwidth (Specific Client) data (on page 951) and leverage outside of WhatsUp Gold.
Schedule Export. Set a recurring date and time, format, and email destination for report data export (on page 942).

WhatsUp Gold User Guide
755
Free Form Text/HTML Free Form Text/HTML enables you to embed either free form text or custom HTML content within a dashboard view.
To configure the Free Form Text/HTML report:
Click to launch the Report Settings dialog. Then, populate the report by entering text manually and formatting it using the following controls contained within the dialog:
Font Type Bold
Italic
Underline
Increase Font Size
Decrease Font Size
Font Color
Highlight
Align Left
Align Center
Align Right
Hyperlink
Numbered List
Bulleted List
OR
Click to switch to source editing mode and copy/paste wrapped HTML code to be rendered by the report. Then, click OK.

756
CHAPTER 31
Remote Environment Reporting In This Chapter Action Activity Log (Remote) ................................................. 756
Device Active Monitor States (Remote) ................................ 759
CPU Utilization ..................................................................... 761
Custom Performance Monitor ............................................... 764
Disk Free Space (Remote) ................................................... 766
Disk Utilization ...................................................................... 769
Interface Traffic (Remote) ..................................................... 772
Interface Utilization (Remote)................................................ 774
Memory Utilization (Remote)................................................. 776
Ping Availability (Remote) ..................................................... 779
Ping Response Time (Remote) ............................................. 782
Summary Counts (Remote) .................................................. 785
Action Activity Log (Remote) Action Activity Log (Remote) report reveals the n most recent actions recorded for the activity log. This report is useful for quick access to the most recent actions, triggers, and last recorded activities on your network.
Understand column data The default view of each report contains a grid with the following columns:
Device. Source of the action or event. Click to bring up Device Status report. Date. Date and time of event. Action Name. Name of the action. Trigger. Trigger for the action Click a trigger to open the State Change
Timeline.
WhatsUp Gold User Guide
757
Generate a report Choose WhatsUp Gold Environment. Choose the remote WhatsUp Gold environment that logged the activity.
Choose Device. Choose one or more host devices you want Action Activity Log (Remote) measurements for.
Use the Select Device dialog for one of the following:
Control Purpose
Device Browse and choose a single device.
Single Interface
Choose an interface on a device.
Device Group
Choose an existing group of one or more devices. You can also create custom or dynamic groups.
Note: You can organize devices into custom or dynamic groups. For more information, see Grouping Devices (on page 242).
Choose time constraints. ( , ) Choose times for the Action Activity Log (Remote). (For recently observed measurements, select Last Polled from the Date Range drop down list.)
Choose time constraints for data view Control Purpose
Date Range (on page 944)
Choose or define an overall date range.
Business hours (on page 944)
Focus on specific days of the week and periods within each day. Reveal trends that are sensitive to business hours, time zones,
and other periodic attributes in the observed data.
Filter and reduce by row and by column. Sort and remove columns, group rows based on specific column values, and remove unwanted information from the table.
Filter and pick by column
Click a report heading and use the following from the drop down list:
Control Purpose
Sort. Sort column in ascending or descending order.

WhatsUp Gold User Guide
758
Columns. Pick the columns you want to view. Click a check box to display the column. Clear the check box to hide it.
Group by this field.
Group table into collapsible rows wherever the current column contains identical data ("field") values.
Filters. Provide a keyword to view only rows that contain the keyword for this column.
Chart, adjust output, and visualize. Fine tune report presentation and range of values displayed using the Report Settings dialog (optional).
Specify threshold and top n: Control Purpose
Show Top n Items Limit items to the samples with the highest (or lowest) utilization.
Threshold Type Switch between minimum or maximum mode for cutoff values for the ranked list.
At or Over. Show peak usage period. (Utilization percentage equal to or greater than Threshold.)
At or Under. Show usage periods where resources are unused or possibly down. (Utilization percentage equal to or less than Threshold.)
Threshold (percent)
Baseline value used to trim ranked device list based on peak or subpeak capacity when returning the Top n.
Chart and visualize data over time (single device ) Charting and visualization is available when you select a single device.
Control Purpose
Display Options Present data as a chart, a table grid, or both.
Chart Type Gauge charts. Available when you select a Date Range of Last Polled .
Time series. Available when you select a Date Range interval (Today , for example).
Line/Area. Scatter graph that connects adjacent measurements with straight lines.
Spline/Area Spline. Choose a graph with a smoothed appearance where adjacent samples exhibit a gradual slope.

WhatsUp Gold User Guide
759
Chart Options Legend, Grid Lines, Range Selector. Include legend, grid lines, and range selector for readability.
Trend Lines. Present data with a smoothed average to show trend.
Tip: Trend lines represent a moving average that can be compared with line and area graphs to reveal peak and sub peak intervals, periods of burstiness, latency, and interruption.
Share, export, and save as PDF Most generated Action Activity Log (Remote) report data can be printed, shared, and exported when selecting Expand ( ) from the Dashboard Options ( ) menu. After the report has been expanded, select export ( ) to access the following options:
Export to PDF. Generate a PDF file of the report with user-defined page size and orientation.
Export Data. Export Action Activity Log (Remote) data (on page 951) and leverage outside of WhatsUp Gold.
Schedule Export. Set a recurring date and time, format, and email destination for report data export (on page 942).
Device Active Monitor States (Remote) Device Active Monitor States (Remote) report reveals current and historical active monitor down time for selected devices.
Understand column data The default view of each report contains a grid with the following columns:
(Report Options). Jump to a detailed dashboard or control panel for either: Device Properties (on page 86).
Device Status (on page 417).
State Change Timeline (on page 642). Device. IP address or device name that indicates where monitor is applied. (state indicator) Monitor. (Monitor state color indicator) Active monitor name
as it appears in the Active Monitor Library.

WhatsUp Gold User Guide
760
Generate a report Choose WhatsUp Gold Environment. Choose a remote WhatsUp Gold environment where active monitors are enabled.
Select WhatsUp Gold environment Control Purpose
Select environment.
Choose an observation point from the list of configured WhatsUp Gold environments.
Filter by Active Monitor. Filter by active monitors in use and defined in the Monitor Library.
Active monitors typically check for network and device performance, security, and faults by:
Simulating user activity. Actively connecting to or querying device management objects.
Deploying Active Monitors is critical for cases when troubleshooting faulty network traffic or behavior caused by a single device. An obvious Active Monitor example is the FTP monitor, which simulates user activity on a target FTP server.
Filter by State. Filter by observed monitor state. This active monitor state Is measured as
Up Fraction of uptime for the current date range.
Down Fraction of downtime for the current date range.
Unknown Fraction of time that no data was collected. For example, before monitoring began or during monitor off times not considered maintenance.
Maintenance Fraction of time that device was placed into maintenance mode. When production servers are taken offline for diagnostics or performance testing, for example.
Choose, filter, and reorder columns. Choose and hide columns, reorder columns, and customize your data view.
Filter and pick by column
Click a report heading ( ) and use the "column picker" ( ) from the drop down list.
Control Purpose
Columns. Click a check box to display the column. Clear the check box to hide it.

WhatsUp Gold User Guide
761
Move Column. Click on a column heading and drag it to reorder your table's columns.
Rename Report and Reveal Top N. Edit report name and show top n table rows using the Report Settings dialog.
Specify top n: Control Purpose
Show Top n Items Limit items to the samples with the highest values.
Note: This report only returns Device Active Monitor States (Remote) metrics for devices that already have the appropriate WMI or SNMP credentials. For more information, see Using Credentials.
Share, export, and save as PDF Most generated Device Active Monitor States (Remote) report data can be printed, shared, and exported when selecting Expand ( ) from the Dashboard Options ( ) menu. After the report has been expanded, select export ( ) to access the following options:
Export to PDF. Generate a PDF file of the report with user-defined page size and orientation.
Export Data. Export Device Active Monitor States (Remote) data (on page 951) and leverage outside of WhatsUp Gold.
Schedule Export. Set a recurring date and time, format, and email destination for report data export (on page 942).
CPU Utilization CPU Utilization reports present each processor load and idle time for one or more host devices. These reports help you to visualize the demand for processing resources, identify peak periods, and help troubleshoot and denote 'root cause' for incidents involving CPU exhaustion.
Understand column data The default view of each report contains a grid with the following columns:
(Report Options). Jump to a detailed dashboard or control panel for: Device Status (on page 417). Device/CPU. Device name/CPU type (CPU index in parenthesis). Avg. Load %. Average CPU load percentage for the selected period.

WhatsUp Gold User Guide
762
Note: This report returns CPU Utilization metrics for devices that already have the appropriate performance monitoring enabled. To enable these polled measurements, see CPU Utilization Monitor.
Generate a report Choose WhatsUp Gold Environment. Choose the remote WhatsUp Gold environment monitoring CPU usage.
Select WhatsUp Gold environment Control Purpose
Select environment.
Choose an observation point from the list of configured WhatsUp Gold environments.
Choose Device. Choose one or more host devices you want CPU Utilization measurements for.
Use the Select Device dialog for one of the following:
Control Purpose
Device Browse and choose a single device.
Single Interface
Choose an interface on a device.
Device Group
Choose an existing group of one or more devices. You can also create custom or dynamic groups.
Note: You can organize devices into custom or dynamic groups. For more information, see Grouping Devices (on page 242).
Sort and pick columns. Sort and pick columns.
Filter and pick by column
Click a report heading and use the following from the drop down list:
Control Purpose
Sort. Sort column in ascending or descending order.
Columns. Pick the columns you want to view. Click a check box to display the column. Clear the check box to hide it.

WhatsUp Gold User Guide
763
Chart, adjust output, and visualize. Fine tune report presentation and range of values displayed using the Report Setting dialog (optional).
Specify threshold and top n: Control Purpose
Show Top n Items Limit items to the samples with the highest (or lowest) latency.
Threshold Type Switch between minimum or maximum mode for cutoff values for the ranked list.
At or Over. Show peak usage period. (Latency percentage equal to or greater than Threshold.)
At or Under. Show usage periods where resources are unused or possibly down. (Latency percentage equal to or less than Threshold.)
Threshold (percent)
Baseline value used to trim ranked device list based on peak or subpeak capacity when returning the Top n.
Chart and visualize data over time (single host device ) Charting and visualization is available when you select a single device.
Control Purpose
Display Options Present data as a chart, a table grid, or both.
Chart Type Gauge charts . Available when you select a Date Range of Last Polled .
Time series . Available when you select a Date Range interval (Today , for example).
Line/Area. Scatter graph that connects adjacent measurements with straight lines.
Spline/Area Spline. Choose a graph with a smoothed appearance where adjacent samples exhibit a gradual slope.
Chart Options Legend, Grid Lines, Range Selector. Include legend, grid lines, and range selector for readability.
Trend Lines. Present data with a smoothed average to show trend.
Tip: Trend lines represent a moving average that can be compared with line and area graphs to reveal peak and sub peak intervals.
Share, export, and save as PDF Most generated CPU Utilization report data can be printed, shared, and exported when selecting Expand ( ) from the Dashboard Options ( ) menu. After the report has been expanded, select export ( ) to access the following options:

WhatsUp Gold User Guide
764
Export to PDF. Generate a PDF file of the report with user-defined page size and orientation.
Export Data. Export CPU Utilization data (on page 951) and leverage outside of WhatsUp Gold.
Schedule Export. Set a recurring date and time, format, and email destination for report data export (on page 942).
Custom Performance Monitor Custom Performance Monitor report reveals measurements for your custom performance monitor.
Understand column data The default view of each report contains a grid with the following columns:
Device. Device identifier. Monitor. Name of monitor. Minimum. Minimum monitor value observed. Maximum. Maximum monitor value observed. Average. Average monitor value for the specified time period. Last Poll. Time of last sample.
Generate a report Choose WhatsUp Gold Environment. Choose the remote WhatsUp Gold environment.
Select WhatsUp Gold environment Control Purpose
Select environment.
Choose an observation point from the list of configured WhatsUp Gold environments.
Choose Device. Choose one or more host devices you want Custom Performance Monitor measurements for.
Use the Select Device dialog for one of the following:
Control Purpose
Device Browse and choose a single device.
Single Interface
Choose an interface on a device.
Device Group
Choose an existing group of one or more devices. You can also create custom or dynamic groups.

WhatsUp Gold User Guide
765
Note: You can organize devices into custom or dynamic groups. For more information, see Grouping Devices (on page 242).
Chart, adjust output, and visualize. Fine tune report presentation and range of values displayed using the Report Settings dialog (optional).
Specify threshold and top n: Control Purpose
Show Top n Items Limit items to the samples with the highest (or lowest) utilization.
Threshold Type Switch between minimum or maximum mode for cutoff values for the ranked list.
At or Over. Show peak usage period. (Utilization percentage equal to or greater than Threshold.)
At or Under. Show usage periods where resources are unused or possibly down. (Utilization percentage equal to or less than Threshold.)
Threshold (percent)
Baseline value used to trim ranked device list based on peak or subpeak capacity when returning the Top n.
Chart and visualize data over time (single device ) Charting and visualization is available when you select a single device.
Control Purpose
Display Options Present data as a chart, a table grid, or both.
Chart Type Gauge charts. Available when you select a Date Range of Last Polled .
Time series. Available when you select a Date Range interval (Today , for example).
Line/Area. Scatter graph that connects adjacent measurements with straight lines.
Spline/Area Spline. Choose a graph with a smoothed appearance where adjacent samples exhibit a gradual slope.
Chart Options Legend, Grid Lines, Range Selector. Include legend, grid lines, and range selector for readability.
Trend Lines. Present data with a smoothed average to show trend.
Tip: Trend lines represent a moving average that can be compared with line and area graphs to reveal peak and sub peak intervals, periods of burstiness, latency, and interruption.

WhatsUp Gold User Guide
766
Note: This report only returns Custom Performance Monitor metrics for devices that already have the appropriate WMI or SNMP credentials. For more information, see Using Credentials.
Tip: For certain custom monitor types (VoIP SLA, for example) you have another way to filter or reduce the row data displayed. For these scenarios, use the Custom Performance Monitor Selection table in Report Settings to hide/reveal monitor rows from the report table.
Share, export, and save as PDF Most generated Custom Performance Monitor report data can be printed, shared, and exported when selecting Expand ( ) from the Dashboard Options ( ) menu. After the report has been expanded, select export ( ) to access the following options:
Export to PDF. Generate a PDF file of the report with user-defined page size and orientation.
Export Data. Export Custom Performance Monitor data (on page 951) and leverage outside of WhatsUp Gold.
Schedule Export. Set a recurring date and time, format, and email destination for report data export (on page 942).
Disk Free Space (Remote) Disk Free Space (Remote) reports compare disk storage capacity to actual utilization for devices with on-disk storage. These reports are useful for assessing current needs and predicting future trends for storage resources.
Understand column data The default view of each report contains a grid with the following columns:
(Report Options). Jump to a detailed dashboard or control panel for: Device Status (on page 417). Device. Network device name. Disk. Disk name and index. Size. Disk capacity. Free Space. Free space on the drive. Free Space %. Fraction of space used in percent. Last Poll. Time of last sample.

WhatsUp Gold User Guide
767
Generate a report Choose WhatsUp Gold Environment. Choose the remote WhatsUp Gold environment monitoring disk usage.
Select WhatsUp Gold environment Control Purpose
Select environment.
Choose an observation point from the list of configured WhatsUp Gold environments.
Choose Device. Choose one or more host devices you want Disk Free Space (Remote) measurements for.
Use the Select Device dialog for one of the following:
Control Description
Device Table/chart(s) of disks and usage metrics. Choose a single device to display all disks and their capacity usage.
Device Group
Ranked list. Choose to return the top-ranked disk with respect to capacity usage for each device in the selected group. You can also create custom or dynamic groups.
Network Ranked list. Choose to display the top-ranked disk with respect to capacity usage for each WhatsUp Gold managed device.
Note: You can organize devices into custom or dynamic groups. For more information, see Grouping Devices (on page 242).
Choose time constraints for data view Control Purpose
Date Range (on page 944)
Choose or define an overall date range.
Business hours (on page 944)
Focus on specific days of the week and periods within each day. Reveal trends that are sensitive to business hours, time zones,
and other periodic attributes in the observed data.
Choose, filter, and reorder columns. Choose and hide columns, reorder columns, and customize your data view.
Filter and pick by column
Click a report heading ( ) and use the "column picker" ( ) from the drop down list.

WhatsUp Gold User Guide
768
Control Purpose
Columns. Click a check box to display the column. Clear the check box to hide it.
Move Column. Click on a column heading and drag it to reorder your table's columns.
Chart, adjust output, and visualize. Fine tune report presentation and range of values displayed using the Report Setting dialog (optional).
Specify threshold and top n: Control Purpose
Show Top n Items Limit items to the samples with the highest (or lowest) latency.
Threshold Type Switch between minimum or maximum mode for cutoff values for the ranked list.
At or Over. Show peak usage period. (Latency percentage equal to or greater than Threshold.)
At or Under. Show usage periods where resources are unused or possibly down. (Latency percentage equal to or less than Threshold.)
Threshold (percent)
Baseline value used to trim ranked device list based on peak or subpeak capacity when returning the Top n.
Chart and visualize data over time (single host device ) Charting and visualization is available when you select a single device.
Control Purpose
Display Options Present data as a chart, a table grid, or both.
Chart Type Gauge charts . Available when you select a Date Range of Last Polled .
Time series . Available when you select a Date Range interval (Today , for example).
Line/Area. Scatter graph that connects adjacent measurements with straight lines.
Spline/Area Spline. Choose a graph with a smoothed appearance where adjacent samples exhibit a gradual slope.
Chart Options Legend, Grid Lines, Range Selector. Include legend, grid lines, and range selector for readability.
Trend Lines. Present data with a smoothed average to show trend.

WhatsUp Gold User Guide
769
Tip: Trend lines represent a moving average that can be compared with line and area graphs to reveal peak and sub peak intervals.
Share, export, and save as PDF Most generated Disk Free Space (Remote) report data can be printed, shared, and exported when selecting Expand ( ) from the Dashboard Options ( ) menu. After the report has been expanded, select export ( ) to access the following options:
Export to PDF. Generate a PDF file of the report with user-defined page size and orientation.
Export Data. Export Disk Free Space (Remote) data (on page 951) and leverage outside of WhatsUp Gold.
Schedule Export. Set a recurring date and time, format, and email destination for report data export (on page 942).
Disk Utilization Disk Utilization reports compare disk storage capacity to actual utilization for devices with on-disk storage. These reports are useful for assessing current needs and predicting future trends for storage resources.
Device. Device hostname/IP address. Disk. Disk label (device index in parenthesis). Avg. Used. Average disk space used since polling began. Avg Used %. Average percent of disk used for the selected date range.
Generate a report Choose WhatsUp Gold Environment. Choose the remote WhatsUp Gold environment monitoring CPU usage.
Select WhatsUp Gold environment Control Purpose
Select environment.
Choose an observation point from the list of configured WhatsUp Gold environments.
Choose Device. Choose one or more host devices you want Disk Utilization measurements for.
Use the Select Device dialog for one of the following:

WhatsUp Gold User Guide
770
Control Description
Device Table/chart(s) of disks and usage metrics. Choose a single device to display all disks and their capacity usage.
Device Group
Ranked list. Choose to return the top-ranked disk with respect to capacity usage for each device in the selected group. You can also create custom or dynamic groups.
Network Ranked list. Choose to display the top-ranked disk with respect to capacity usage for each WhatsUp Gold managed device.
Note: You can organize devices into custom or dynamic groups. For more information, see Grouping Devices (on page 242).
Choose time constraints for data view Control Purpose
Date Range (on page 944)
Choose or define an overall date range.
Business hours (on page 944)
Focus on specific days of the week and periods within each day. Reveal trends that are sensitive to business hours, time zones,
and other periodic attributes in the observed data.
Choose, filter, and reorder columns. Choose and hide columns, reorder columns, and customize your data view.
Filter and pick by column
Click a report heading ( ) and use the "column picker" ( ) from the drop down list.
Control Purpose
Columns. Click a check box to display the column. Clear the check box to hide it.
Move Column. Click on a column heading and drag it to reorder your table's columns.
Chart, adjust output, and visualize. Fine tune report presentation and range of values displayed using the Report Settings dialog (optional).
Specify threshold and top n: Control Purpose
Show Top n Items Limit items to the samples with the highest (or lowest) utilization.

WhatsUp Gold User Guide
771
Threshold Type Switch between minimum or maximum mode for cutoff values for the ranked list.
At or Over. Show peak usage period. (Utilization percentage equal to or greater than Threshold.)
At or Under. Show usage periods where resources are unused or possibly down. (Utilization percentage equal to or less than Threshold.)
Threshold (percent)
Baseline value used to trim ranked device list based on peak or subpeak capacity when returning the Top n.
Chart and visualize data over time (single device ) Charting and visualization is available when you select a single device.
Control Purpose
Display Options Present data as a chart, a table grid, or both.
Chart Type Gauge charts. Available when you select a Date Range of Last Polled .
Time series. Available when you select a Date Range interval (Today , for example).
Line/Area. Scatter graph that connects adjacent measurements with straight lines.
Spline/Area Spline. Choose a graph with a smoothed appearance where adjacent samples exhibit a gradual slope.
Chart Options Legend, Grid Lines, Range Selector. Include legend, grid lines, and range selector for readability.
Trend Lines. Present data with a smoothed average to show trend.
Tip: Trend lines represent a moving average that can be compared with line and area graphs to reveal peak and sub peak intervals, periods of burstiness, latency, and interruption.
Note: This report only returns disk utilization metrics for devices that already have the appropriate performance monitoring enabled. To enable these polled measurements, see Disk Utilization Monitor (on page 167).
Tip: You can gain access to "root" (/) partition metrics for Linux and UNIX OS by using the SSH Monitor (on page 173) or by assigning the SNMP user (as designated in snmp.conf) with appropriate Sudoer privileges. Disk utilization measurements for a Linux or UNIX "root" partition (/) are at first typically not included in this report. When "root" (/) partition totals are not included, total disk capacity in the report typically appears 5% less than the physical disk.

WhatsUp Gold User Guide
772
Share, export, and save as PDF Most generated Disk Utilization report data can be printed, shared, and exported when selecting Expand ( ) from the Dashboard Options ( ) menu. After the report has been expanded, select export ( ) to access the following options:
Export to PDF. Generate a PDF file of the report with user-defined page size and orientation.
Export Data. Export Disk Utilization data (on page 951) and leverage outside of WhatsUp Gold.
Schedule Export. Set a recurring date and time, format, and email destination for report data export (on page 942).
Interface Traffic (Remote) Interface Traffic (Remote) report reveals source and destination traffic accounting for one or more devices.
Understand column data The default view of each report contains a grid with the following columns:
(Report Options). Jump to a detailed dashboard or control panel for: Device Status (on page 417). Device. Device name, hostname, or IP address. Interface. Textual name of the interface (ifName). Bytes Transmitted. Transmitted byte count. Bytes Received. Received byte count.
Generate a report Choose WhatsUp Gold Environment. Observe metrics gathered from this WhatsUp Gold environment.
Select WhatsUp Gold environment Control Purpose
Select environment.
Choose an observation point from the list of configured WhatsUp Gold environments.
Choose Device. Choose one or more host devices you want Interface Traffic (Remote) measurements for.
Use the Select Device dialog for one of the following:
Control Purpose
Device Browse and choose a single device.

WhatsUp Gold User Guide
773
Single Interface
Choose an interface on a device.
Device Group
Choose an existing group of one or more devices. You can also create custom or dynamic groups.
Note: You can organize devices into custom or dynamic groups. For more information, see Grouping Devices (on page 242).
Choose time constraints. ( , ) Choose times for the Interface Traffic (Remote). (For recently observed measurements, select Last Polled from the Date Range drop down list.)
Choose time constraints for data view Control Purpose
Date Range (on page 944)
Choose or define an overall date range.
Business hours (on page 944)
Focus on specific days of the week and periods within each day. Reveal trends that are sensitive to business hours, time zones,
and other periodic attributes in the observed data.
Filter and reduce by row and by column. Sort and remove columns, group rows based on specific column values, and remove unwanted information from the table.
Filter and pick by column
Click a report heading and use the following from the drop down list:
Control Purpose
Sort. Sort column in ascending or descending order.
Columns. Pick the columns you want to view. Click a check box to display the column. Clear the check box to hide it.
Group by this field.
Group table into collapsible rows wherever the current column contains identical data ("field") values.
Filters. Provide a keyword to view only rows that contain the keyword for this column.

WhatsUp Gold User Guide
774
Chart, adjust output, and visualize. Fine tune report presentation and range of values displayed using the Report Settings dialog (optional).
Specify threshold and top n: Control Purpose
Show Top n Items Limit items to the samples with the highest values.
Threshold Type Switch between minimum or maximum mode for cutoff values (for displaying either peak or sub peak usage periods, for example).
Threshold (percent) Control and trim peak values to trim outliers.
Note: This report only returns Interface Traffic (Remote) metrics for devices that already have the appropriate WMI or SNMP credentials. For more information, see Using Credentials.
Share, export, and save as PDF Most generated Interface Traffic (Remote) report data can be printed, shared, and exported when selecting Expand ( ) from the Dashboard Options ( ) menu. After the report has been expanded, select export ( ) to access the following options:
Export to PDF. Generate a PDF file of the report with user-defined page size and orientation.
Export Data. Export Interface Traffic (Remote) data (on page 951) and leverage outside of WhatsUp Gold.
Schedule Export. Set a recurring date and time, format, and email destination for report data export (on page 942).
Interface Utilization (Remote) Interface Utilization (Remote) reports reveal measurements for network traffic across one or more network interfaces for each device or device group you specify. If you specify a device group, the report reveals average rate and total volume of traffic for each device within the group. If you specify a switch, this report returns average rate and traffic volume across each LAN segment —a subscript (n) follows the device name to denote the port number. These reports help you to visualize current and historic flow of network traffic.
Understand column data The default view of each report contains a grid with the following columns:
(Report Options). Jump to a detailed dashboard or control panel for: Device Status (on page 417). Device/Interface. Device hostname, IP address, or alias.

WhatsUp Gold User Guide
775
Avg. Transmit %. Fraction of the interface bandwidth needed for transmitted bytes.
Avg. Receive % . Fraction of bandwidth utilized by received bytes.
Generate a report Choose WhatsUp Gold Environment. Choose the remote WhatsUp Gold environment.
Select WhatsUp Gold environment Control Purpose
Select environment.
Choose an observation point from the list of configured WhatsUp Gold environments.
Choose Device. Choose one or more host devices you want Interface Utilization (Remote) measurements for.
Use the Select Device dialog for one of the following:
Control Purpose
Device Browse and choose a single device.
Single Interface
Choose an interface on a device.
Device Group
Choose an existing group of one or more devices. You can also create custom or dynamic groups.
Note: You can organize devices into custom or dynamic groups. For more information, see Grouping Devices (on page 242).
Chart, adjust output, and visualize. Fine tune report presentation and range of values displayed using the Report Settings dialog (optional).
Specify threshold and top n: Control Purpose
Show Top n Items Limit items to the samples with the highest (or lowest) utilization.
Threshold Type Switch between minimum or maximum mode for cutoff values for the ranked list.
At or Over. Show peak usage period. (Utilization percentage equal to or greater than Threshold.)
At or Under. Show usage periods where resources are unused or possibly down. (Utilization percentage equal to or less than Threshold.)

WhatsUp Gold User Guide
776
Threshold (percent)
Baseline value used to trim ranked device list based on peak or subpeak capacity when returning the Top n.
Chart and visualize data over time (single device ) Charting and visualization is available when you select a single device.
Control Purpose
Display Options Present data as a chart, a table grid, or both.
Chart Type Gauge charts. Available when you select a Date Range of Last Polled .
Time series. Available when you select a Date Range interval (Today , for example).
Line/Area. Scatter graph that connects adjacent measurements with straight lines.
Spline/Area Spline. Choose a graph with a smoothed appearance where adjacent samples exhibit a gradual slope.
Chart Options Legend, Grid Lines, Range Selector. Include legend, grid lines, and range selector for readability.
Trend Lines. Present data with a smoothed average to show trend.
Tip: Trend lines represent a moving average that can be compared with line and area graphs to reveal peak and sub peak intervals, periods of burstiness, latency, and interruption.
Note: This report only returns Interface Utilization (Remote) metrics for devices that already have the appropriate WMI or SNMP credentials. For more information, see Using Credentials.
Share, export, and save as PDF Most generated Interface Utilization (Remote) report data can be printed, shared, and exported when selecting Expand ( ) from the Dashboard Options ( ) menu. After the report has been expanded, select export ( ) to access the following options:
Export to PDF. Generate a PDF file of the report with user-defined page size and orientation.
Export Data. Export Interface Utilization (Remote) data (on page 951) and leverage outside of WhatsUp Gold.
Schedule Export. Set a recurring date and time, format, and email destination for report data export (on page 942).
Memory Utilization (Remote) Memory Utilization (Remote) reports present minimum, maximum, and average memory utilization for one or more devices you specify.
WhatsUp Gold User Guide
777
Understand column data The default view of each report contains a grid with the following columns:
(Report Options). Jump to a detailed dashboard or control panel for: Device Status (on page 417). Device. Device identifier. Description. Details such as type of memory monitored. For example, Physical
Memory. Total Size. Total memory capacity of monitored host. Avg. Displays value of average usage when you select a range of time (for
example, Today). Displays value for total usage observed for a point in time when you select Last Polled.
% Avg. Displays average percent used if you selected a range of time (for example, Today). Displays value for total usage observed for a point in time if you selected Last Polled.
Generate a report Choose WhatsUp Gold Environment. Observe metrics gathered from this WhatsUp Gold environment.
Select WhatsUp Gold environment Control Purpose
Select environment.
Choose an observation point from the list of configured WhatsUp Gold environments.
Choose Device. Choose one or more host devices you want Memory Utilization (Remote) measurements for.
Use the Select Device dialog for one of the following:
Control Purpose
Device Browse and choose a single device.
Device Group
Choose an existing group of one or more devices. You can also create custom or dynamic groups.
Note: You can organize devices into custom or dynamic groups. For more information, see Grouping Devices (on page 242).
WhatsUp Gold User Guide
778
Tip: If a device is identified as a virtual machine, Hyper-V or VMware credentials will be used to retrieve data and only those physical resources allocated to the virtual machine will be visible in the report.
Sort and pick columns. Sort and pick columns.
Filter and pick by column
Click a report heading and use the following from the drop down list:
Control Purpose
Sort. Sort column in ascending or descending order.
Columns. Pick the columns you want to view. Click a check box to display the column. Clear the check box to hide it.
Chart, adjust output, and visualize. Fine tune report presentation and range of values displayed using the Report Setting dialog (optional).
Specify threshold and top n: Control Purpose
Show Top n Items Limit items to the samples with the highest (or lowest) latency.
Threshold Type Switch between minimum or maximum mode for cutoff values for the ranked list.
At or Over. Show peak usage period. (Latency percentage equal to or greater than Threshold.)
At or Under. Show usage periods where resources are unused or possibly down. (Latency percentage equal to or less than Threshold.)
Threshold (percent)
Baseline value used to trim ranked device list based on peak or subpeak capacity when returning the Top n.
Chart and visualize data over time (single host device ) Charting and visualization is available when you select a single device.
Control Purpose
Display Options Present data as a chart, a table grid, or both.

WhatsUp Gold User Guide
779
Chart Type Gauge charts . Available when you select a Date Range of Last Polled .
Time series . Available when you select a Date Range interval (Today , for example).
Line/Area. Scatter graph that connects adjacent measurements with straight lines.
Spline/Area Spline. Choose a graph with a smoothed appearance where adjacent samples exhibit a gradual slope.
Chart Options Legend, Grid Lines, Range Selector. Include legend, grid lines, and range selector for readability.
Trend Lines. Present data with a smoothed average to show trend.
Tip: Trend lines represent a moving average that can be compared with line and area graphs to reveal peak and sub peak intervals.
Note: This report only returns Memory Utilization (Remote) metrics for devices that already have the appropriate WMI or SNMP credentials. For more information, see Using Credentials.
Note: Memory Utilization (Remote) report only returns metrics for devices that already have the appropriate performance monitoring enabled. To enable these polled measurements, see Memory Utilization Monitor (on page 171).
Share, export, and save as PDF Most generated Memory Utilization (Remote) report data can be printed, shared, and exported when selecting Expand ( ) from the Dashboard Options ( ) menu. After the report has been expanded, select export ( ) to access the following options:
Export to PDF. Generate a PDF file of the report with user-defined page size and orientation.
Export Data. Export Memory Utilization (Remote) data (on page 951) and leverage outside of WhatsUp Gold.
Schedule Export. Set a recurring date and time, format, and email destination for report data export (on page 942).
Ping Availability (Remote) Ping Availability (Remote) report reveals device response to ICMP ("ping") requests.
Understand column data The default view of each report contains a grid with the following columns:

WhatsUp Gold User Guide
780
Device. Name of network device. Interface. Network interface. Packets Lost. Number of ICMP packets that failed to reach the target, timed
out, or received no reply for the selected time period. Percent Packets Lost. Number of ICMP packets that failed to reach the target,
timed out, or received no reply for the selected time period. Percent Available. Availability score based on ping samples for the selected
time period.
Generate a report Choose WhatsUp Gold Environment. Observe metrics gathered from this WhatsUp Gold environment.
Select WhatsUp Gold environment Control Purpose
Select environment.
Choose an observation point from the list of configured WhatsUp Gold environments.
Choose Device. Choose one or more host devices you want Ping Availability (Remote) measurements for.
Use the Select Device dialog for one of the following:
Control Purpose
Device Browse and choose a single device.
Device Group
Choose an existing group of one or more devices. You can also create custom or dynamic groups.
Note: You can organize devices into custom or dynamic groups. For more information, see Grouping Devices (on page 242).
Tip: If a device is identified as a virtual machine, Hyper-V or VMware credentials will be used to retrieve data and only those physical resources allocated to the virtual machine will be visible in the report.

WhatsUp Gold User Guide
781
Sort and pick columns. Sort and pick columns.
Filter and pick by column
Click a report heading and use the following from the drop down list:
Control Purpose
Sort. Sort column in ascending or descending order.
Columns. Pick the columns you want to view. Click a check box to display the column. Clear the check box to hide it.
Chart, adjust output, and visualize. Fine tune report presentation and range of values displayed using the Report Setting dialog (optional).
Specify threshold and top n: Control Purpose
Show Top n Items Limit items to the samples with the highest (or lowest) latency.
Threshold Type Switch between minimum or maximum mode for cutoff values for the ranked list.
At or Over. Show peak usage period. (Latency percentage equal to or greater than Threshold.)
At or Under. Show usage periods where resources are unused or possibly down. (Latency percentage equal to or less than Threshold.)
Threshold (percent)
Baseline value used to trim ranked device list based on peak or subpeak capacity when returning the Top n.
Chart and visualize data over time (single host device ) Charting and visualization is available when you select a single device.
Control Purpose
Display Options Present data as a chart, a table grid, or both.
WhatsUp Gold User Guide
782
Chart Type Gauge charts . Available when you select a Date Range of Last Polled .
Time series . Available when you select a Date Range interval (Today , for example).
Line/Area. Scatter graph that connects adjacent measurements with straight lines.
Spline/Area Spline. Choose a graph with a smoothed appearance where adjacent samples exhibit a gradual slope.
Chart Options Legend, Grid Lines, Range Selector. Include legend, grid lines, and range selector for readability.
Trend Lines. Present data with a smoothed average to show trend.
Tip: Trend lines represent a moving average that can be compared with line and area graphs to reveal peak and sub peak intervals.
Share, export, and save as PDF Most generated Ping Availability (Remote) report data can be printed, shared, and exported when selecting Expand ( ) from the Dashboard Options ( ) menu. After the report has been expanded, select export ( ) to access the following options:
Export to PDF. Generate a PDF file of the report with user-defined page size and orientation.
Export Data. Export Ping Availability (Remote) data (on page 951) and leverage outside of WhatsUp Gold.
Schedule Export. Set a recurring date and time, format, and email destination for report data export (on page 942).
Ping Response Time (Remote) Ping Response Time (Remote) report reveals ICMP packet ("ping") round trip times.
Understand column data The default view of each report contains a grid with the following columns:
(Report Options). Jump to a detailed dashboard or control panel for: Device Status (on page 417). Device. Name of target device for ping monitor. Interface. Specific interface the ping monitor is active on. Max Response Time (ms). Maximum ping response time in milliseconds
observed during the selected interval. Avg Response Time (ms). Average ping response time in milliseconds
observed during the selected interval.

WhatsUp Gold User Guide
783
Generate a report Choose WhatsUp Gold Environment. Observe metrics gathered from this WhatsUp Gold environment.
Select WhatsUp Gold environment Control Purpose
Select environment.
Choose an observation point from the list of configured WhatsUp Gold environments.
Choose Device. Choose one or more host devices you want Ping Response Time (Remote) measurements for.
Use the Select Device dialog for one of the following:
Control Purpose
Device Browse and choose a single device.
Device Group
Choose an existing group of one or more devices. You can also create custom or dynamic groups.
Note: You can organize devices into custom or dynamic groups. For more information, see Grouping Devices (on page 242).
Tip: If a device is identified as a virtual machine, Hyper-V or VMware credentials will be used to retrieve data and only those physical resources allocated to the virtual machine will be visible in the report.
Sort and pick columns. Sort and pick columns.
Filter and pick by column
Click a report heading and use the following from the drop down list:
Control Purpose
Sort. Sort column in ascending or descending order.
Columns. Pick the columns you want to view. Click a check box to display the column. Clear the check box to hide it.

WhatsUp Gold User Guide
784
Chart, adjust output, and visualize. Fine tune report presentation and range of values displayed using the Report Setting dialog (optional).
Specify threshold and top n: Control Purpose
Show Top n Items Limit items to the samples with the highest (or lowest) latency.
Threshold Type Switch between minimum or maximum mode for cutoff values for the ranked list.
At or Over. Show peak usage period. (Latency percentage equal to or greater than Threshold.)
At or Under. Show usage periods where resources are unused or possibly down. (Latency percentage equal to or less than Threshold.)
Threshold (percent)
Baseline value used to trim ranked device list based on peak or subpeak capacity when returning the Top n.
Chart and visualize data over time (single host device ) Charting and visualization is available when you select a single device.
Control Purpose
Display Options Present data as a chart, a table grid, or both.
Chart Type Gauge charts . Available when you select a Date Range of Last Polled .
Time series . Available when you select a Date Range interval (Today , for example).
Line/Area. Scatter graph that connects adjacent measurements with straight lines.
Spline/Area Spline. Choose a graph with a smoothed appearance where adjacent samples exhibit a gradual slope.
Chart Options Legend, Grid Lines, Range Selector. Include legend, grid lines, and range selector for readability.
Trend Lines. Present data with a smoothed average to show trend.
Tip: Trend lines represent a moving average that can be compared with line and area graphs to reveal peak and sub peak intervals.
Share, export, and save as PDF Most generated Ping Response Time (Remote) report data can be printed, shared, and exported when selecting Expand ( ) from the Dashboard Options ( ) menu. After the report has been expanded, select export ( ) to access the following options:

WhatsUp Gold User Guide
785
Export to PDF. Generate a PDF file of the report with user-defined page size and orientation.
Export Data. Export Ping Response Time (Remote) data (on page 951) and leverage outside of WhatsUp Gold.
Schedule Export. Set a recurring date and time, format, and email destination for report data export (on page 942).
Summary Counts (Remote) Summary Counts (Remote) report reveals device health for a selected group at a glance.
Understand column data The default view of each report contains a grid with the following columns:
Devices in Group. Total devices in group. Monitored Devices. Count of devices with monitoring applied. Up Devices. Count of devices in Up state. Down Devices. Count of devices in Down state. Devices with Down Active Monitors. Count of devices with active monitors in
Down state. Devices in Maintenance. Count of devices in Maintenance mode. Enabled Active Monitors. Total active monitors enabled on this group. Up Active Monitors. Total active monitors polling in an Up state. Down Active Monitors. Total active monitors polling in a Down state. Down Critical Monitors. Total critical monitors polling in a Down state. Up Interfaces. Interfaces in Up state. Down Interfaces. Interfaces in Down state. Unacknowledged Devices. Devices with alerts in the Unacknowledged state. Actions Fired in Last 4 Hours. Count of device events that caused actions to
fire in the last 4 hours.
Generate a report Choose WhatsUp Gold Environment. Choose the remote WhatsUp Gold environment.
Select WhatsUp Gold environment Control Purpose
Select environment.
Choose an observation point from the list of configured WhatsUp Gold environments.

WhatsUp Gold User Guide
786
Choose Device. Choose one or more host devices you want Summary Counts (Remote) measurements for.
Use the Select Device dialog for one of the following:
Control Purpose
Device Browse and choose a single device.
Single Interface
Choose an interface on a device.
Device Group
Choose an existing group of one or more devices. You can also create custom or dynamic groups.
Note: You can organize devices into custom or dynamic groups. For more information, see Grouping Devices (on page 242).
Chart, adjust output, and visualize. Fine tune report presentation and range of values displayed using the Report Settings dialog (optional).
Specify threshold and top n: Control Purpose
Show Top n Items Limit items to the samples with the highest (or lowest) utilization.
Threshold Type Switch between minimum or maximum mode for cutoff values for the ranked list.
At or Over. Show peak usage period. (Utilization percentage equal to or greater than Threshold.)
At or Under. Show usage periods where resources are unused or possibly down. (Utilization percentage equal to or less than Threshold.)
Threshold (percent)
Baseline value used to trim ranked device list based on peak or subpeak capacity when returning the Top n.
Chart and visualize data over time (single device ) Charting and visualization is available when you select a single device.
Control Purpose
Display Options Present data as a chart, a table grid, or both.

WhatsUp Gold User Guide
787
Chart Type Gauge charts. Available when you select a Date Range of Last Polled .
Time series. Available when you select a Date Range interval (Today , for example).
Line/Area. Scatter graph that connects adjacent measurements with straight lines.
Spline/Area Spline. Choose a graph with a smoothed appearance where adjacent samples exhibit a gradual slope.
Chart Options Legend, Grid Lines, Range Selector. Include legend, grid lines, and range selector for readability.
Trend Lines. Present data with a smoothed average to show trend.
Tip: Trend lines represent a moving average that can be compared with line and area graphs to reveal peak and sub peak intervals, periods of burstiness, latency, and interruption.
Note: This report only returns Summary Counts (Remote) metrics for devices that already have the appropriate WMI or SNMP credentials. For more information, see Using Credentials.
Share, export, and save as PDF Most generated Summary Counts (Remote) report data can be printed, shared, and exported when selecting Expand ( ) from the Dashboard Options ( ) menu. After the report has been expanded, select export ( ) to access the following options:
Export to PDF. Generate a PDF file of the report with user-defined page size and orientation.
Export Data. Export Summary Counts (Remote) data (on page 951) and leverage outside of WhatsUp Gold.
Schedule Export. Set a recurring date and time, format, and email destination for report data export (on page 942).

WhatsUp Gold User Guide
788
Viewing Performance Real Time In addition to logs, reports, and built-in dashboards, you can use the Realtime-Performance Monitor (on page 788) (RPM) to visualize device performance, capacity utilization, and network availability on a rolling basis.
Guidelines for using the RPM monitor Keep these hints and guidelines in mind when setting up RPM reporting.
RPM leverages a performance monitor. (You cannot use it for WhatsUp Gold passive or active monitors.)
Ensure the relevant performance monitor on the managed device is enabled (on page 106). (Otherwise, RPM will not be an option for the measurements that monitor provides.)
Active Script, Storage Array, HyperV Host Machine, HyperV Host Event Log are not available for RPM.
Except for the Refresh Interval setting, RPM inherits its configuration from the particular performance monitor running on the managed device.
RealTime Performance Monitor Report WhatsUp Gold RealTime Performance monitor (RPM) report returns quick observations when informed decisions can't wait between polling intervals. RPM works best for 'eyes-

WhatsUp Gold User Guide
789
on' performance checks of individual devices, traffic between specific endpoints, and occasional 'zooming in' on capacity utilization metrics.
Like Network Traffic Analysis, RPM sessions generate traffic on your network. They also give more work to the WhatsUp Gold Poller. For this reason, RPM limits the number of sessions that can be open at one time for a single deployment of WhatsUp Gold.
Tip: It is best to use RPM for decision support during critical periods, troubleshooting, or in environments where polling does not interfere with normal network traffic such as when devices run dedicated management NICs.
RPM monitor provides several advantages:
Provides a rich, platform-agnostic tool for viewing real-time capacity utilization (an alternative, for example, for Task Manager on Windows or Top on Linux and Unix).
No remote login is needed. No SSH/Powershell/Remote desktop commands are necessary.
Polling interval (time between observations) is split by seconds rather than minutes.
Catch visual signatures of bursty periods that would otherwise be smoothed and normalized by the polling interval.
Check tips and guidelines...
Guidelines for using the RPM monitor Keep these hints and guidelines in mind when setting up RPM reporting.
RPM leverages a performance monitor. (You cannot use it for WhatsUp Gold passive or active monitors.)
Ensure the relevant performance monitor on the managed device is enabled (on page 106). (Otherwise, RPM will not be an option for the measurements that monitor provides.)
Active Script, Storage Array, HyperV Host Machine, HyperV Host Event Log are not available for RPM.
Except for the Refresh Interval setting, RPM inherits its configuration from the particular performance monitor running on the managed device.
Generate a report Choose Device. Choose a device to observe.
Use the Select Device dialog for a single device:
Control Purpose
Device Browse and choose a single device.
WhatsUp Gold User Guide
790
Choose a Monitor. Choose a monitor to return RPM monitor performance statistics for. Interface Utilization (on page 593). Memory Utilization (on page 596). Ping Response Time (on page 605). More... (on page 571) Determine Refresh Interval. Optimize the polling interval to match the task and the monitor.
Chart and visualize data over time (aspect of single device ) Charting and visualization is available when you select an aspect and device.
Control Purpose
Summary Config Include table of aspects (if applicable).
Chart Type Line/Area. Scatter graph that connects adjacent measurements with straight lines.
Spline/Area Spline. Choose a graph with a smoothed appearance where adjacent samples exhibit a gradual slope.
Chart Options Legend, Grid Lines, Range Selector. Include legend, grid lines, and range selector for readability.
Trend Lines. Present data with a smoothed average to show trend.
Refresh Interval Select an interval for polling the management information on the device.
Tip: Trend lines represent a moving average that can be compared with line and area graphs to reveal peak and sub peak intervals, periods of burstiness, latency, and interruption.
Control the observation stream Play. Stream observations. Stop. Stop observations.
Reset. Clear and restart the observation stream.
Export as XML Most generated RPM report data can be exported as XML by selecting Expand ( ) from the Report Actions ( ) menu.
Export. Export RealTime Performance Monitor Report data (on page 951) and leverage graphed data outside of WhatsUp Gold.
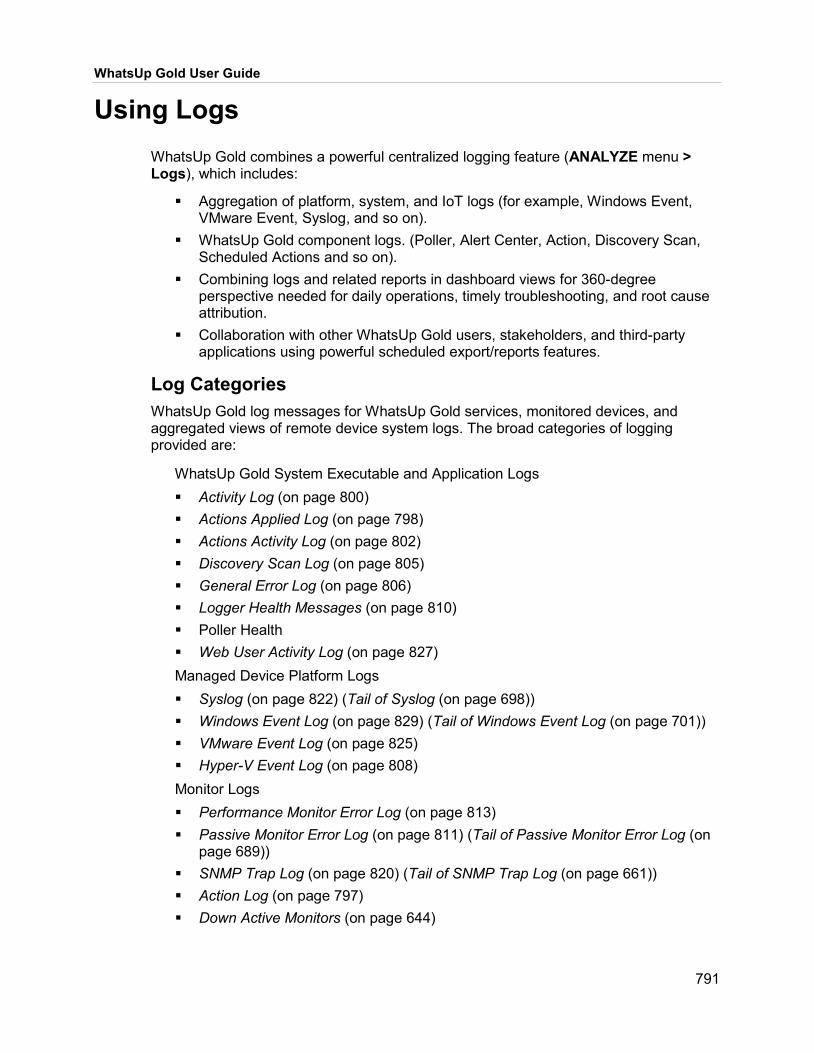
WhatsUp Gold User Guide
791
Using Logs WhatsUp Gold combines a powerful centralized logging feature (ANALYZE menu > Logs), which includes:
Aggregation of platform, system, and IoT logs (for example, Windows Event, VMware Event, Syslog, and so on).
WhatsUp Gold component logs. (Poller, Alert Center, Action, Discovery Scan, Scheduled Actions and so on).
Combining logs and related reports in dashboard views for 360-degree perspective needed for daily operations, timely troubleshooting, and root cause attribution.
Collaboration with other WhatsUp Gold users, stakeholders, and third-party applications using powerful scheduled export/reports features.
Log Categories WhatsUp Gold log messages for WhatsUp Gold services, monitored devices, and aggregated views of remote device system logs. The broad categories of logging provided are:
WhatsUp Gold System Executable and Application Logs Activity Log (on page 800) Actions Applied Log (on page 798) Actions Activity Log (on page 802) Discovery Scan Log (on page 805) General Error Log (on page 806) Logger Health Messages (on page 810) Poller Health Web User Activity Log (on page 827) Managed Device Platform Logs Syslog (on page 822) (Tail of Syslog (on page 698)) Windows Event Log (on page 829) (Tail of Windows Event Log (on page 701)) VMware Event Log (on page 825) Hyper-V Event Log (on page 808) Monitor Logs Performance Monitor Error Log (on page 813) Passive Monitor Error Log (on page 811) (Tail of Passive Monitor Error Log (on
page 689)) SNMP Trap Log (on page 820) (Tail of SNMP Trap Log (on page 661)) Action Log (on page 797) Down Active Monitors (on page 644)

WhatsUp Gold User Guide
792
Control and Management of Runtime and Startup Configurations
Network Traffic Network Traffic Analysis Log (on page 834) Unclassified Traffic Log Wireless Log (on page 731) More... (on page 796)
Creating and Exporting Log Data Reports Fetch log records: Choose one or more host devices you want to see Creating and Exporting Log
Data Reports measurements for. Choose time constraints for the Creating and Exporting Log Data Reports
records. For the most recent entries, select "Last Polled" from the time period drop down list.
Work with log data: Understand log record columns. Reduce log records and log record attributes, keyword search, wildcards, and
filters. Use Business Hours (on page 944) scheduling (when applicable) to choose the
period of log messages reported.
Email, print, and export: Data export. Schedule distribution (on page 942).
Searching, Sorting, and Reducing WhatsUp Gold logging views (on page 793) provide a running journal you can filter and distribute as part of daily operations, tracking, or periodic audits.
Search. Full text search on log views. Wildcard character support.
Provide a keyword and use wildcards to view only rows that contain the keyword for the selected column or view.
Most column and log view filters provide the following wildcard matching:
Match either zero characters or any one character ('?'). Example: 198.51.100.2? (Matches tokens with IP address ending with 2, or 20-29.)
Match either zero, any one, or many characters ('*'). Example: Stop* (Matches log strings containing Stop, Stopped, Stopping, and so on.) Sort. Columns are sortable.
Filter. Filter for specific substrings.
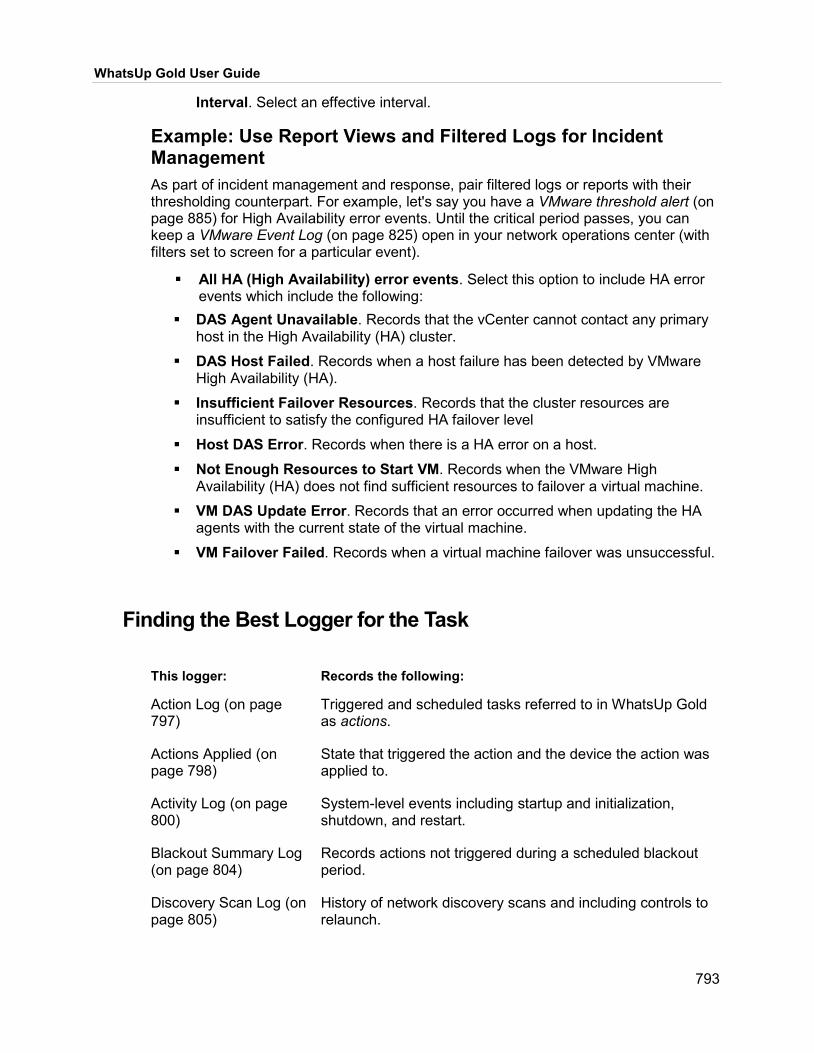
WhatsUp Gold User Guide
793
Interval. Select an effective interval.
Example: Use Report Views and Filtered Logs for Incident Management As part of incident management and response, pair filtered logs or reports with their thresholding counterpart. For example, let's say you have a VMware threshold alert (on page 885) for High Availability error events. Until the critical period passes, you can keep a VMware Event Log (on page 825) open in your network operations center (with filters set to screen for a particular event).
All HA (High Availability) error events. Select this option to include HA error events which include the following:
DAS Agent Unavailable. Records that the vCenter cannot contact any primary host in the High Availability (HA) cluster.
DAS Host Failed. Records when a host failure has been detected by VMware High Availability (HA).
Insufficient Failover Resources. Records that the cluster resources are insufficient to satisfy the configured HA failover level
Host DAS Error. Records when there is a HA error on a host.
Not Enough Resources to Start VM. Records when the VMware High Availability (HA) does not find sufficient resources to failover a virtual machine.
VM DAS Update Error. Records that an error occurred when updating the HA agents with the current state of the virtual machine.
VM Failover Failed. Records when a virtual machine failover was unsuccessful.
Finding the Best Logger for the Task
This logger: Records the following:
Action Log (on page 797)
Triggered and scheduled tasks referred to in WhatsUp Gold as actions.
Actions Applied (on page 798)
State that triggered the action and the device the action was applied to.
Activity Log (on page 800)
System-level events including startup and initialization, shutdown, and restart.
Blackout Summary Log (on page 804)
Records actions not triggered during a scheduled blackout period.
Discovery Scan Log (on page 805)
History of network discovery scans and including controls to relaunch.

WhatsUp Gold User Guide
794
Error Log - General (on page 806)
Error notifications, failure notifications, and unhandled exception messages re-directed from standard error.
Error Log - Logger Health Messages (on page 810)
Reveals both failures and routine health checkpoint messages for the WhatsUp Gold polling engine.
Error Log - Passive Monitor (on page 811)
Error and failure messages gathered from passive monitors.
Error Log - Performance Monitor (on page 813)
Error and failure messages gathered from performance monitors.
Policy Audit (on page 815)
Configuration record changes based on deployed patterns and policies.
Recurring Action Log (on page 817)
Records scheduled tasks that are recurring.
SNMP Trap Log (on page 820)
History of SNMP trap notifications.
Scheduled Report Log (on page 818)
Records recurring and scheduled report events.
Syslog (on page 822) Syslog events. (Appropriate syslog listener needs to be configured.)
Web User Activity Log (on page 827)
Records user interaction with the WhatsUp Gold web UI.
Windows Event Log (on page 829)
Records Windows Event Log entries. (Appropriate WMI listener needs to be configured.)
Task Log (on page 824) (Configuration Management)
Aggregates messages generated by Configuration Management.
Start vs. Run (Configuration Management)
Startup vs. running configuration change events tracked by Configuration Management.
Policy Audit (on page 815) (Configuration Management)
Configuration Management Policy out of compliance events.
NTA Log (on page 834) Network Traffic Analysis (NTA) events.
Unclassified Traffic Events for traffic over unexpected ports and the network interface that carried the traffic.

WhatsUp Gold User Guide
795
Hyper-V Event Log (on page 808) (Virtual Monitoring)
Hyper-V virtual machine events received from configured monitors.
VMware Event Log (on page 825) (Virtual Monitoring)
VMware virtual machine events received from configured monitors.
Wireless Log (on page 731)
Wireless device and monitoring events.
Alert Center (on page 832)
View alert center engine events.
APM Applications State Change Log (on page 838)
Transitions in application monitoring states
APM Resolved Items Log (on page 840)
Resolved actions for all instances or components in the selected application, profile, or selected component.

796
CHAPTER 32
Log Library In This Chapter Action Log............................................................................. 797
Actions Applied Log .............................................................. 798
Activity Log ........................................................................... 800
Actions Activity Log ............................................................... 802
Blackout Summary Log ......................................................... 804
Discovery Scan Log .............................................................. 805
General Error Log ................................................................. 806
Hyper-V Event Log ............................................................... 808
Logger Health Messages ...................................................... 810
Passive Monitor Error Log .................................................... 811
Performance Monitor Error Log ............................................. 813
Policy Audit ........................................................................... 815
Recurring Action Log ............................................................ 817
Scheduled Report Log .......................................................... 818
SNMP Trap Log .................................................................... 820
Syslog ................................................................................... 822
Task Log ............................................................................... 824
VMware Event Log ............................................................... 825
Web User Activity Log .......................................................... 827
Windows Event Log .............................................................. 829
Wireless ................................................................................ 831
Alert Center Log View ........................................................... 832
Network Traffic Analysis Logs ............................................... 834
Applications State Change Log ............................................. 838
APM-Resolved Items Log ..................................................... 840
Quick Help Links ................................................................... 841

WhatsUp Gold User Guide
797
Action Log Action Log displays log records for triggered and scheduled tasks referred to in WhatsUp Gold as actions.
Each log message record contains the following data columns:
Date. Date and time for the event message. Action. Specific action type that triggered. This string value corresponds to the
name of the action in the Actions Library. Category. Action category (failure, cancel, retry, or blacked out). Device. Device that the action is assigned to. Active Monitor. Active Monitor to which the action is assigned. Passive Monitor. Passive Monitor to which the action is assigned. Trigger State. State that caused the action to fire. The trigger state is
determined when the Action is configured on the device. Details. Log message string.
Note: At the bottom of the Action Log report, the record summary displays the total number of rows matching your filter criteria.
Note: When Only execute first action (for each state) option is selected, logging is skipped for all but the first state change. For these cases, a skipped due to priority message will be recorded in the log.
Fetch and filter log data Choose time constraints. Choose specific windows for log data, reduce by date range, or choose Last Polled for the latest.
Choose time constraints for data view Control Purpose
Date Range (on page 944)
Choose or define an overall date range.
Business hours (on page 944)
Focus on specific days of the week and periods within each day. Reveal trends that are sensitive to business hours, time zones,
and other periodic attributes in the observed data.
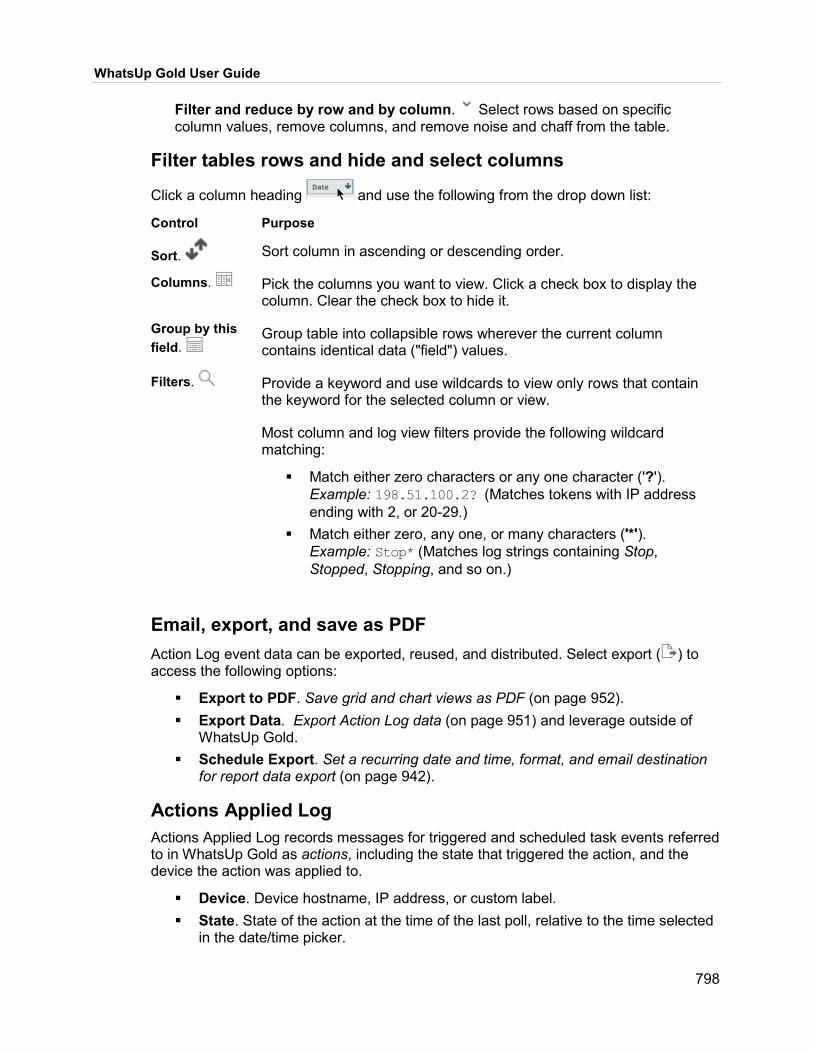
WhatsUp Gold User Guide
798
Filter and reduce by row and by column. Select rows based on specific column values, remove columns, and remove noise and chaff from the table.
Filter tables rows and hide and select columns
Click a column heading and use the following from the drop down list:
Control Purpose
Sort. Sort column in ascending or descending order.
Columns. Pick the columns you want to view. Click a check box to display the column. Clear the check box to hide it.
Group by this field.
Group table into collapsible rows wherever the current column contains identical data ("field") values.
Filters. Provide a keyword and use wildcards to view only rows that contain the keyword for the selected column or view.
Most column and log view filters provide the following wildcard matching:
Match either zero characters or any one character ('?'). Example: 198.51.100.2? (Matches tokens with IP address ending with 2, or 20-29.)
Match either zero, any one, or many characters ('*'). Example: Stop* (Matches log strings containing Stop, Stopped, Stopping, and so on.)
Email, export, and save as PDF Action Log event data can be exported, reused, and distributed. Select export ( ) to access the following options:
Export to PDF. Save grid and chart views as PDF (on page 952). Export Data. Export Action Log data (on page 951) and leverage outside of
WhatsUp Gold. Schedule Export. Set a recurring date and time, format, and email destination
for report data export (on page 942).
Actions Applied Log Actions Applied Log records messages for triggered and scheduled task events referred to in WhatsUp Gold as actions, including the state that triggered the action, and the device the action was applied to.
Device. Device hostname, IP address, or custom label. State. State of the action at the time of the last poll, relative to the time selected
in the date/time picker.

WhatsUp Gold User Guide
799
Action Name. Action triggered or applied to the device. This string value corresponds to the name of the action in the Actions Library.
Action Type. Category of action applied. Monitor. Type of monitor.
Fetch and filter log data Choose device. Choose one or more host devices.
Use the Select Device dialog for one of the following:
Control Purpose
Device Browse and choose a single device.
Device Group
Choose an existing group of one or more devices. You can also create custom or dynamic groups.
Note: You can organize devices into custom or dynamic groups. For more information, see Grouping Devices (on page 242).
Choose time constraints. Choose specific windows for log data, or choose Last Polled for the latest.
Choose time constraints for data view Control Purpose
Date Range (on page 944)
Choose or define an overall date range.
Business hours (on page 944)
Focus on specific days of the week and periods within each day. Reveal trends that are sensitive to business hours, time zones,
and other periodic attributes in the observed data.
Filter and reduce by row and by column. Select rows based on specific column values, remove columns, and remove noise and chaff from the table.
Filter tables rows and hide and select columns
Click a column heading and use the following from the drop down list:
Control Purpose
Sort. Sort column in ascending or descending order.
Columns. Pick the columns you want to view. Click a check box to display the column. Clear the check box to hide it.

WhatsUp Gold User Guide
800
Group by this field.
Group table into collapsible rows wherever the current column contains identical data ("field") values.
Filters. Provide a keyword and use wildcards to view only rows that contain the keyword for the selected column or view.
Most column and log view filters provide the following wildcard matching:
Match either zero characters or any one character ('?'). Example: 198.51.100.2? (Matches tokens with IP address ending with 2, or 20-29.)
Match either zero, any one, or many characters ('*'). Example: Stop* (Matches log strings containing Stop, Stopped, Stopping, and so on.)
Email, export, and save as PDF Actions Applied Log event data can be exported, reused, and distributed. Select export ( ) to access the following options:
Export to PDF. Save grid and chart views as PDF (on page 952). Export Data. Export Actions Applied Log data (on page 951) and leverage
outside of WhatsUp Gold. Schedule Export. Set a recurring date and time, format, and email destination
for report data export (on page 942).
Activity Log Activity Log displays log records for system-level events including startup and initialization, shutdown, and restart.
Each log message record contains the following data columns:
Date. Date and time for the event message. Type. Denotes message severity level, for example Information. Source. WhatsUp Gold component that registered the message. For example,
NmEngine. Category. Category of activity. For example, startup. Message. WhatsUp Gold component's logged message. For example,
NmEngine. started.
Note: At the bottom of the Activity Log report, the record summary displays the total number of rows matching your filter criteria.
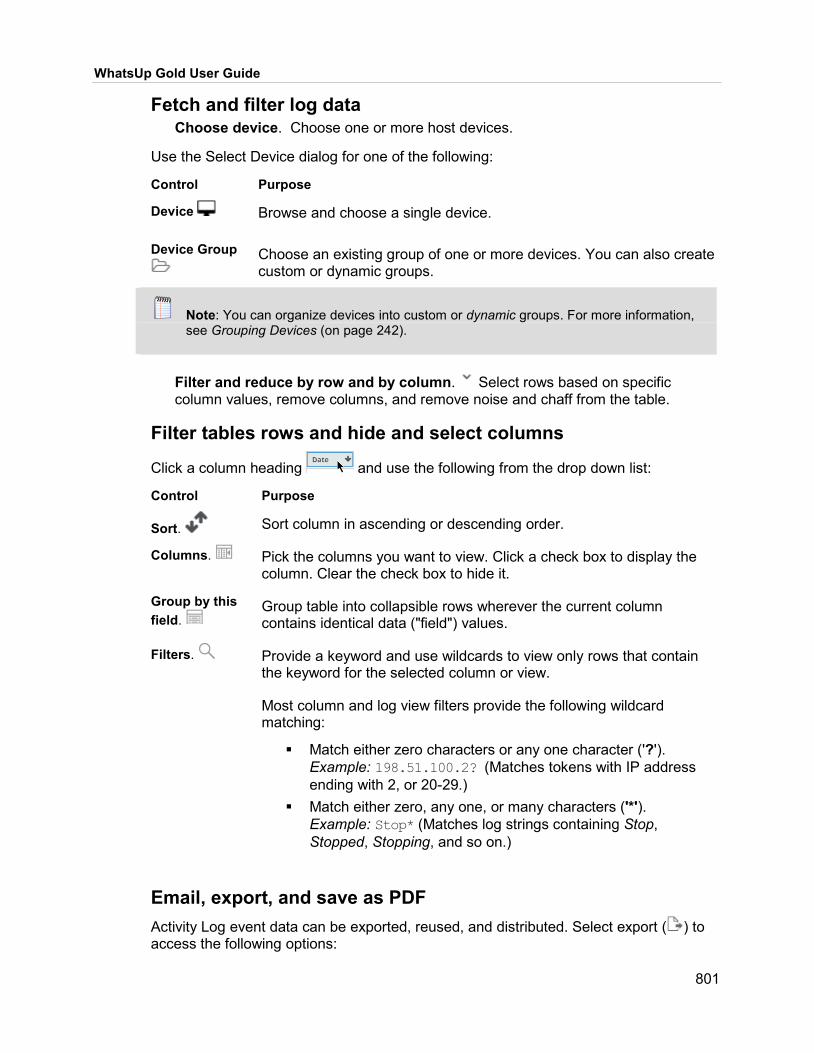
WhatsUp Gold User Guide
801
Fetch and filter log data Choose device. Choose one or more host devices.
Use the Select Device dialog for one of the following:
Control Purpose
Device Browse and choose a single device.
Device Group
Choose an existing group of one or more devices. You can also create custom or dynamic groups.
Note: You can organize devices into custom or dynamic groups. For more information, see Grouping Devices (on page 242).
Filter and reduce by row and by column. Select rows based on specific column values, remove columns, and remove noise and chaff from the table.
Filter tables rows and hide and select columns
Click a column heading and use the following from the drop down list:
Control Purpose
Sort. Sort column in ascending or descending order.
Columns. Pick the columns you want to view. Click a check box to display the column. Clear the check box to hide it.
Group by this field.
Group table into collapsible rows wherever the current column contains identical data ("field") values.
Filters. Provide a keyword and use wildcards to view only rows that contain the keyword for the selected column or view.
Most column and log view filters provide the following wildcard matching:
Match either zero characters or any one character ('?'). Example: 198.51.100.2? (Matches tokens with IP address ending with 2, or 20-29.)
Match either zero, any one, or many characters ('*'). Example: Stop* (Matches log strings containing Stop, Stopped, Stopping, and so on.)
Email, export, and save as PDF Activity Log event data can be exported, reused, and distributed. Select export ( ) to access the following options:

WhatsUp Gold User Guide
802
Export to PDF. Save grid and chart views as PDF (on page 952). Export Data. Export Activity Log data (on page 951) and leverage outside of
WhatsUp Gold. Schedule Export. Set a recurring date and time, format, and email destination
for report data export (on page 942).
Actions Activity Log Actions Activity Log records actions, triggers, recorded activities, and their associated policies.
Source Name. Source of the action or event. State. State of the action that triggered the event. Action Policy. Action policy associated with the conditions of the action. Action Name. Action applied. Action Type. Category of action applied. Details. Log string message. Date. Date and time for the action.
Fetch and filter log data Choose device. Choose one or more host devices.
Use the Select Device dialog for one of the following:
Control Purpose
Device Browse and choose a single device.
Device Group
Choose an existing group of one or more devices. You can also create custom or dynamic groups.
Note: You can organize devices into custom or dynamic groups. For more information, see Grouping Devices (on page 242).
Choose time constraints. Choose specific windows for log data, or choose Last Polled for the latest.
Choose time constraints for data view Control Purpose
Date Range (on page 944)
Choose or define an overall date range.

WhatsUp Gold User Guide
803
Business hours (on page 944)
Focus on specific days of the week and periods within each day. Reveal trends that are sensitive to business hours, time zones,
and other periodic attributes in the observed data.
Filter and reduce by row and by column. Select rows based on specific column values, remove columns, and remove noise and chaff from the table.
Filter tables rows and hide and select columns
Click a column heading and use the following from the drop down list:
Control Purpose
Sort. Sort column in ascending or descending order.
Columns. Pick the columns you want to view. Click a check box to display the column. Clear the check box to hide it.
Group by this field.
Group table into collapsible rows wherever the current column contains identical data ("field") values.
Filters. Provide a keyword and use wildcards to view only rows that contain the keyword for the selected column or view.
Most column and log view filters provide the following wildcard matching:
Match either zero characters or any one character ('?'). Example: 198.51.100.2? (Matches tokens with IP address ending with 2, or 20-29.)
Match either zero, any one, or many characters ('*'). Example: Stop* (Matches log strings containing Stop, Stopped, Stopping, and so on.)
Email, export, and save as PDF Actions Activity Log event data can be exported, reused, and distributed. Select export ( ) to access the following options:
Export to PDF. Save grid and chart views as PDF (on page 952). Export Data. Export Actions Activity Log data (on page 951) and leverage
outside of WhatsUp Gold. Schedule Export. Set a recurring date and time, format, and email destination
for report data export (on page 942).

WhatsUp Gold User Guide
804
Blackout Summary Log Blackout Summary Log records actions not triggered or preempted due to a scheduled blackout period.
Each log message record contains the following data columns:
Date. Date and time for the event message. Device. Target device blackout was applied to. Action. Preempted or "blacked out" action. Trigger Type. Trigger that would have normally caused the action to fire. State. State of device at the time of the preempted action. Blackout Start. Date and time the blackout period began. Blackout End. Date and time the blackout period ended.
Fetch and filter log data Choose device. Choose one or more host devices.
Use the Select Device dialog for one of the following:
Control Purpose
Device Browse and choose a single device.
Device Group
Choose an existing group of one or more devices. You can also create custom or dynamic groups.
Note: You can organize devices into custom or dynamic groups. For more information, see Grouping Devices (on page 242).
Choose time constraints. Choose specific windows for log data, or choose Last Polled for the latest.
Choose time constraints for data view Control Purpose
Date Range (on page 944)
Choose or define an overall date range.
Business hours (on page 944)
Focus on specific days of the week and periods within each day. Reveal trends that are sensitive to business hours, time zones,
and other periodic attributes in the observed data.

WhatsUp Gold User Guide
805
Filter and reduce by row and by column. Select rows based on specific column values, remove columns, and remove noise and chaff from the table.
Filter tables rows and hide and select columns
Click a column heading and use the following from the drop down list:
Control Purpose
Sort. Sort column in ascending or descending order.
Columns. Pick the columns you want to view. Click a check box to display the column. Clear the check box to hide it.
Group by this field.
Group table into collapsible rows wherever the current column contains identical data ("field") values.
Filters. Provide a keyword and use wildcards to view only rows that contain the keyword for the selected column or view.
Most column and log view filters provide the following wildcard matching:
Match either zero characters or any one character ('?'). Example: 198.51.100.2? (Matches tokens with IP address ending with 2, or 20-29.)
Match either zero, any one, or many characters ('*'). Example: Stop* (Matches log strings containing Stop, Stopped, Stopping, and so on.)
Email, export, and save as PDF Blackout Summary Log event data can be exported, reused, and distributed. Select export ( ) to access the following options:
Export to PDF. Save grid and chart views as PDF (on page 952). Export Data. Export Blackout Summary Log data (on page 951) and leverage
outside of WhatsUp Gold. Schedule Export. Set a recurring date and time, format, and email destination
for report data export (on page 942).
Discovery Scan Log Discovery Scan Log view lists discovery scan history. Use this view to traceback scans in the timeframe they were made, verify results, and re-run them.
Understand column data The default view of each report contains a grid with the following columns:
Name. Discovery scan identifier or profile name.

WhatsUp Gold User Guide
806
Started. Date and time group when scan was initiated. Status. Network discovery status indicator. For example, Completed. Devices Found. Devices WhatsUp Gold discovery connected to and opened an
initial network connection with. Devices Complete. Devices specified either in IP address list or seeded this
that yielded discovery results. Devices with Valid Credentials. Number of devices where one or more
credential instances in the credential list configured for discovery was successful.
General Error Log General Error Log aggregates logged errors and failures for a time period you specify. The types of errors captured that are considered general in WhatsUp Gold can include:
Failure to contact services. Failure to fetch statistics. Failure to access or complete database access transactions. Passive monitor startup failures. Handled and unhandled exception messages and their equivalents, which are
re-directed from standard error.
Each log message record contains the following data columns:
Date. Date and time for the event message. Category. Category of the activity, for example, startup. Source. The WhatsUp Gold component that registered the message, for
example, NmEngine. Message. The WhatsUp Gold component's message, for example, NmEngine.
started.
Note: At the bottom of the General Error Log report, the record summary displays the total number of rows matching your filter criteria.
Fetch and filter log data Choose time constraints. Choose specific windows for log data, reduce by date range, or choose Last Polled for the latest.
Choose time constraints for data view Control Purpose
Date Range (on page 944)
Choose or define an overall date range.

WhatsUp Gold User Guide
807
Business hours (on page 944)
Focus on specific days of the week and periods within each day. Reveal trends that are sensitive to business hours, time zones,
and other periodic attributes in the observed data.
Filter and reduce by row and by column. Select rows based on specific column values, remove columns, and remove noise and chaff from the table.
Filter tables rows and hide and select columns
Click a column heading and use the following from the drop down list:
Control Purpose
Sort. Sort column in ascending or descending order.
Columns. Pick the columns you want to view. Click a check box to display the column. Clear the check box to hide it.
Group by this field.
Group table into collapsible rows wherever the current column contains identical data ("field") values.
Filters. Provide a keyword and use wildcards to view only rows that contain the keyword for the selected column or view.
Most column and log view filters provide the following wildcard matching:
Match either zero characters or any one character ('?'). Example: 198.51.100.2? (Matches tokens with IP address ending with 2, or 20-29.)
Match either zero, any one, or many characters ('*'). Example: Stop* (Matches log strings containing Stop, Stopped, Stopping, and so on.)
Email, export, and save as PDF General Error Log event data can be exported, reused, and distributed. Select export ( ) to access the following options:
Export to PDF. Save grid and chart views as PDF (on page 952). Export Data. Export General Error Log data (on page 951) and leverage
outside of WhatsUp Gold. Schedule Export. Set a recurring date and time, format, and email destination
for report data export (on page 942).

WhatsUp Gold User Guide
808
Hyper-V Event Log Hyper-V Event Log records virtual machine events received from configured monitors. Log file entries reflect event logs maintained on the given hypervisor host.
Each log message record contains the following data columns:
Date. Date and time for the event message. (Relative to the time configured for the hypervisor.)
Host. Identifier (hostname or IP address) for the hypervisor. Event Type. Category for the event (Hyper-V-Config, for example) Log Name. Source log on the Hyper-V host. Message. Log message string.
Note: Hyper-V Event Log only returns log messages for hosts that have the appropriate Virtual Monitoring listeners and event collection enabled. For more details, see Enable Virtual Monitoring Event Listeners (on page 948).
Tip: Date-time stamp for Hyper-V Event Log log messages are relative to time settings configured for the hypervisor.
Fetch and filter log data Choose device. Choose one or more host devices.
Use the Select Device dialog for one of the following:
Control Purpose
Device Browse and choose a single device.
Device Group
Choose an existing group of one or more devices. You can also create custom or dynamic groups.
Note: You can organize devices into custom or dynamic groups. For more information, see Grouping Devices (on page 242).

WhatsUp Gold User Guide
809
Choose time constraints. Choose specific windows for log data, or choose Last Polled for the latest.
Choose time constraints for data view Control Purpose
Date Range (on page 944)
Choose or define an overall date range.
Business hours (on page 944)
Focus on specific days of the week and periods within each day. Reveal trends that are sensitive to business hours, time zones,
and other periodic attributes in the observed data.
Filter and reduce by row and by column. Select rows based on specific column values, remove columns, and remove noise and chaff from the table.
Filter tables rows and hide and select columns
Click a column heading and use the following from the drop down list:
Control Purpose
Sort. Sort column in ascending or descending order.
Columns. Pick the columns you want to view. Click a check box to display the column. Clear the check box to hide it.
Group by this field.
Group table into collapsible rows wherever the current column contains identical data ("field") values.
Filters. Provide a keyword and use wildcards to view only rows that contain the keyword for the selected column or view.
Most column and log view filters provide the following wildcard matching:
Match either zero characters or any one character ('?'). Example: 198.51.100.2? (Matches tokens with IP address ending with 2, or 20-29.)
Match either zero, any one, or many characters ('*'). Example: Stop* (Matches log strings containing Stop, Stopped, Stopping, and so on.)
Email, export, and save as PDF Hyper-V Event Log event data can be exported, reused, and distributed. Select export ( ) to access the following options:

WhatsUp Gold User Guide
810
Export to PDF. Save grid and chart views as PDF (on page 952). Export Data. Export Hyper-V Event Log data (on page 951) and leverage
outside of WhatsUp Gold. Schedule Export. Set a recurring date and time, format, and email destination
for report data export (on page 942).
Logger Health Messages Logger Health Messages provides insight when communication with the logging engine fails. It reveals both failures and routine health checkpoint messages for the WhatsUp Gold logger engine. This logger health journal also traces the various source assemblies where checkpoint, failure messages, and exceptions originate.
Each log message record contains the following data columns:
Date. Date and time for the event message. Assembly. Name of the main program that owns the message. Typically the
name of an executable. Sub Assembly. Name of the component or library where the log health or
exception message originates. Severity. Failures and exceptions take the Error severity level. Message. WhatsUp Gold component message, for example, NmEngine.
started.
Note: At the bottom of the Logger Health Messages report, the record summary displays the total number of rows matching your filter criteria.
Fetch and filter log data Choose time constraints. Choose specific windows for log data, reduce by date range, or choose Last Polled for the latest.
Choose time constraints for data view Control Purpose
Date Range (on page 944)
Choose or define an overall date range.
Business hours (on page 944)
Focus on specific days of the week and periods within each day. Reveal trends that are sensitive to business hours, time zones,
and other periodic attributes in the observed data.

WhatsUp Gold User Guide
811
Filter and reduce by row and by column. Select rows based on specific column values, remove columns, and remove noise and chaff from the table.
Filter tables rows and hide and select columns
Click a column heading and use the following from the drop down list:
Control Purpose
Sort. Sort column in ascending or descending order.
Columns. Pick the columns you want to view. Click a check box to display the column. Clear the check box to hide it.
Group by this field.
Group table into collapsible rows wherever the current column contains identical data ("field") values.
Filters. Provide a keyword and use wildcards to view only rows that contain the keyword for the selected column or view.
Most column and log view filters provide the following wildcard matching:
Match either zero characters or any one character ('?'). Example: 198.51.100.2? (Matches tokens with IP address ending with 2, or 20-29.)
Match either zero, any one, or many characters ('*'). Example: Stop* (Matches log strings containing Stop, Stopped, Stopping, and so on.)
Email, export, and save as PDF Logger Health Messages event data can be exported, reused, and distributed. Select export ( ) to access the following options:
Export to PDF. Save grid and chart views as PDF (on page 952). Export Data. Export Logger Health Messages data (on page 951) and leverage
outside of WhatsUp Gold. Schedule Export. Set a recurring date and time, format, and email destination
for report data export (on page 942).
Passive Monitor Error Log Passive Monitor Error Log records error and failure messages gathered from passive monitors for a time period you specify.
Each log message record contains the following data columns:
Date. Date and time for the event message. Passive Monitor. Passive monitor name for the observed error.

WhatsUp Gold User Guide
812
Device. Target device monitor was applied to. Category. Category of the activity. For example, Con. Failed (connection failed). Details. Log message string.
Note: At the bottom of the Passive Monitor Error Log report, the record summary displays the total number of rows matching your filter criteria.
Fetch and filter log data Choose time constraints. Choose specific windows for log data, reduce by date range, or choose Last Polled for the latest.
Choose time constraints for data view Control Purpose
Date Range (on page 944)
Choose or define an overall date range.
Business hours (on page 944)
Focus on specific days of the week and periods within each day. Reveal trends that are sensitive to business hours, time zones,
and other periodic attributes in the observed data.
Filter and reduce by row and by column. Select rows based on specific column values, remove columns, and remove noise and chaff from the table.
Filter tables rows and hide and select columns
Click a column heading and use the following from the drop down list:
Control Purpose
Sort. Sort column in ascending or descending order.
Columns. Pick the columns you want to view. Click a check box to display the column. Clear the check box to hide it.
Group by this field.
Group table into collapsible rows wherever the current column contains identical data ("field") values.

WhatsUp Gold User Guide
813
Filters. Provide a keyword and use wildcards to view only rows that contain the keyword for the selected column or view.
Most column and log view filters provide the following wildcard matching:
Match either zero characters or any one character ('?'). Example: 198.51.100.2? (Matches tokens with IP address ending with 2, or 20-29.)
Match either zero, any one, or many characters ('*'). Example: Stop* (Matches log strings containing Stop, Stopped, Stopping, and so on.)
Email, export, and save as PDF Passive Monitor Error Log event data can be exported, reused, and distributed. Select export ( ) to access the following options:
Export to PDF. Save grid and chart views as PDF (on page 952). Export Data. Export Passive Monitor Error Log data (on page 951) and
leverage outside of WhatsUp Gold. Schedule Export. Set a recurring date and time, format, and email destination
for report data export (on page 942).
Performance Monitor Error Log Performance Monitor Error Log records error and failure messages gathered from performance monitors for a time period you specify.
Each log message record contains the following data columns:
Date. Date and time for the event message. Device. Device hostname, IP address, or custom label. Target device
performance monitor was applied to. Type. Denotes message severity level, for example Information. Source. Monitor that was the source for this log message. Details. Log message string.
Note: At the bottom of the Performance Monitor Error Log report, the record summary displays the total number of rows matching your filter criteria.
Fetch and filter log data Choose device. Choose one or more host devices.
Use the Select Device dialog for one of the following:

WhatsUp Gold User Guide
814
Control Purpose
Device Browse and choose a single device.
Device Group
Choose an existing group of one or more devices. You can also create custom or dynamic groups.
Note: You can organize devices into custom or dynamic groups. For more information, see Grouping Devices (on page 242).
Choose time constraints. Choose specific windows for log data, or choose Last Polled for the latest.
Choose time constraints for data view Control Purpose
Date Range (on page 944)
Choose or define an overall date range.
Business hours (on page 944)
Focus on specific days of the week and periods within each day. Reveal trends that are sensitive to business hours, time zones,
and other periodic attributes in the observed data.
Filter and reduce by row and by column. Select rows based on specific column values, remove columns, and remove noise and chaff from the table.
Filter tables rows and hide and select columns
Click a column heading and use the following from the drop down list:
Control Purpose
Sort. Sort column in ascending or descending order.
Columns. Pick the columns you want to view. Click a check box to display the column. Clear the check box to hide it.
Group by this field.
Group table into collapsible rows wherever the current column contains identical data ("field") values.

WhatsUp Gold User Guide
815
Filters. Provide a keyword and use wildcards to view only rows that contain the keyword for the selected column or view.
Most column and log view filters provide the following wildcard matching:
Match either zero characters or any one character ('?'). Example: 198.51.100.2? (Matches tokens with IP address ending with 2, or 20-29.)
Match either zero, any one, or many characters ('*'). Example: Stop* (Matches log strings containing Stop, Stopped, Stopping, and so on.)
Email, export, and save as PDF Performance Monitor Error Log event data can be exported, reused, and distributed. Select export ( ) to access the following options:
Export to PDF. Save grid and chart views as PDF (on page 952). Export Data. Export Performance Monitor Error Log data (on page 951) and
leverage outside of WhatsUp Gold. Schedule Export. Set a recurring date and time, format, and email destination
for report data export (on page 942).
Policy Audit Policy Audit records pattern changes in runtime configurations for network devices deployed on your network. Matches to preconfigured patterns are logged.
Result. Change of state. One of the following: Unavailable, Different, Same. Device. Device hostname, IP address, or custom label. Archive. Configuration archive. Pattern. Pattern string. Description. Pattern description. Ignore Case. Boolean. Denotes case sensitive pattern matching. Regex. Boolean. Denotes Regex pattern usage. Type. Denotes policy pattern type. One of the following: Exclude, Include. Match Line. Comma separated list of line numbers matching the pattern.
Fetch and filter log data Choose device. Choose one or more host devices.
Use the Select Device dialog for one of the following:
Control Purpose
Device Browse and choose a single device.

WhatsUp Gold User Guide
816
Device Group
Choose an existing group of one or more devices. You can also create custom or dynamic groups.
Note: You can organize devices into custom or dynamic groups. For more information, see Grouping Devices (on page 242).
Filter and reduce by row and by column. Select rows based on specific column values, remove columns, and remove noise and chaff from the table.
Filter tables rows and hide and select columns
Click a column heading and use the following from the drop down list:
Control Purpose
Sort. Sort column in ascending or descending order.
Columns. Pick the columns you want to view. Click a check box to display the column. Clear the check box to hide it.
Group by this field.
Group table into collapsible rows wherever the current column contains identical data ("field") values.
Filters. Provide a keyword and use wildcards to view only rows that contain the keyword for the selected column or view.
Most column and log view filters provide the following wildcard matching:
Match either zero characters or any one character ('?'). Example: 198.51.100.2? (Matches tokens with IP address ending with 2, or 20-29.)
Match either zero, any one, or many characters ('*'). Example: Stop* (Matches log strings containing Stop, Stopped, Stopping, and so on.)
Email, export, and save as PDF Policy Audit event data can be exported, reused, and distributed. Select export ( ) to access the following options:
Export to PDF. Save grid and chart views as PDF (on page 952). Export Data. Export Policy Audit data (on page 951) and leverage outside of
WhatsUp Gold. Schedule Export. Set a recurring date and time, format, and email destination
for report data export (on page 942).

WhatsUp Gold User Guide
817
Recurring Action Log Recurring Action Log records WhatsUp Gold activity related to scheduled or recurring actions. It is useful for validating action completion, actions preempted due to a blackout period, and so on.
Each log message record contains the following data columns:
Date. Date and time for the event message. Recurring Action. Name of scheduled recurring action. Category. Result of the attempt to fire the action (success, failure, information,
or cancel). Details. Message string. Denotes if action fired, was blacked out, or manually
prevented by user intervention or WhatsUp Gold service shutdown.
Fetch and filter log data Choose time constraints. Choose specific windows for log data, reduce by date range, or choose Last Polled for the latest.
Choose time constraints for data view Control Purpose
Date Range (on page 944)
Choose or define an overall date range.
Business hours (on page 944)
Focus on specific days of the week and periods within each day. Reveal trends that are sensitive to business hours, time zones,
and other periodic attributes in the observed data.
Filter and reduce by row and by column. Select rows based on specific column values, remove columns, and remove noise and chaff from the table.
Filter tables rows and hide and select columns
Click a column heading and use the following from the drop down list:
Control Purpose
Sort. Sort column in ascending or descending order.
Columns. Pick the columns you want to view. Click a check box to display the column. Clear the check box to hide it.
Group by this field.
Group table into collapsible rows wherever the current column contains identical data ("field") values.

WhatsUp Gold User Guide
818
Filters. Provide a keyword and use wildcards to view only rows that contain the keyword for the selected column or view.
Most column and log view filters provide the following wildcard matching:
Match either zero characters or any one character ('?'). Example: 198.51.100.2? (Matches tokens with IP address ending with 2, or 20-29.)
Match either zero, any one, or many characters ('*'). Example: Stop* (Matches log strings containing Stop, Stopped, Stopping, and so on.)
Email, export, and save as PDF Recurring Action Log event data can be exported, reused, and distributed. Select export ( ) to access the following options:
Export to PDF. Save grid and chart views as PDF (on page 952). Export Data. Export Recurring Action Log data (on page 951) and leverage
outside of WhatsUp Gold. Schedule Export. Set a recurring date and time, format, and email destination
for report data export (on page 942).
Scheduled Report Log Scheduled Report Log records recurring and scheduled reports that have occurred during the selected time period.
Tip: Scheduled reports are enabled through the Scheduled Report Library.
Each log message record contains the following data columns:
Date. Date and time for the event message. Recurring Report. Name of scheduled recurring report as configured. Category. Result of report attempt (success, failure, information, or cancel). Details. Message string. Denotes if action fired, was blacked out, or manually
prevented by user intervention or WhatsUp Gold service shutdown.

WhatsUp Gold User Guide
819
Fetch and filter log data Choose time constraints. Choose specific windows for log data, reduce by date range, or choose Last Polled for the latest.
Choose time constraints for data view Control Purpose
Date Range (on page 944)
Choose or define an overall date range.
Business hours (on page 944)
Focus on specific days of the week and periods within each day. Reveal trends that are sensitive to business hours, time zones,
and other periodic attributes in the observed data.
Filter and reduce by row and by column. Select rows based on specific column values, remove columns, and remove noise and chaff from the table.
Filter tables rows and hide and select columns
Click a column heading and use the following from the drop down list:
Control Purpose
Sort. Sort column in ascending or descending order.
Columns. Pick the columns you want to view. Click a check box to display the column. Clear the check box to hide it.
Group by this field.
Group table into collapsible rows wherever the current column contains identical data ("field") values.
Filters. Provide a keyword and use wildcards to view only rows that contain the keyword for the selected column or view.
Most column and log view filters provide the following wildcard matching:
Match either zero characters or any one character ('?'). Example: 198.51.100.2? (Matches tokens with IP address ending with 2, or 20-29.)
Match either zero, any one, or many characters ('*'). Example: Stop* (Matches log strings containing Stop, Stopped, Stopping, and so on.)

WhatsUp Gold User Guide
820
Email, export, and save as PDF Scheduled Report Log event data can be exported, reused, and distributed. Select export ( ) to access the following options:
Export to PDF. Save grid and chart views as PDF (on page 952). Export Data. Export Scheduled Report Log data (on page 951) and leverage
outside of WhatsUp Gold. Schedule Export. Set a recurring date and time, format, and email destination
for report data export (on page 942).
SNMP Trap Log SNMP Trap Log records SNMP trap notifications for devices in the selected group.
Each log message record contains the following data columns:
Date. Date and time for the event message. Source. Device or application that initiated the trap. Trap. Type of trap. Payload. Trap message data such as trap name, the IP address of trap
notification, date, and so on.
Fetch and filter log data Choose device. Choose one or more host devices.
Use the Select Device dialog for one of the following:
Control Purpose
Device Browse and choose a single device.
Device Group
Choose an existing group of one or more devices. You can also create custom or dynamic groups.
Note: You can organize devices into custom or dynamic groups. For more information, see Grouping Devices (on page 242).
Choose time constraints. Choose specific windows for log data, or choose Last Polled for the latest.
Choose time constraints for data view Control Purpose
Date Range (on page 944)
Choose or define an overall date range.
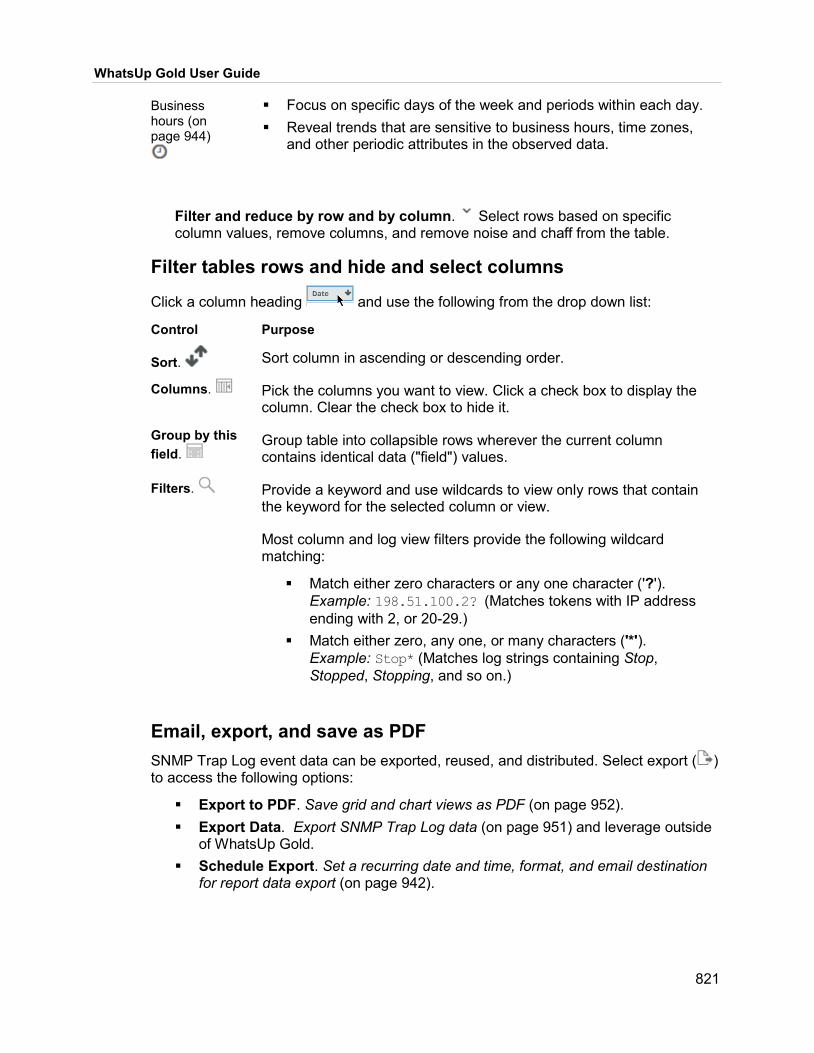
WhatsUp Gold User Guide
821
Business hours (on page 944)
Focus on specific days of the week and periods within each day. Reveal trends that are sensitive to business hours, time zones,
and other periodic attributes in the observed data.
Filter and reduce by row and by column. Select rows based on specific column values, remove columns, and remove noise and chaff from the table.
Filter tables rows and hide and select columns
Click a column heading and use the following from the drop down list:
Control Purpose
Sort. Sort column in ascending or descending order.
Columns. Pick the columns you want to view. Click a check box to display the column. Clear the check box to hide it.
Group by this field.
Group table into collapsible rows wherever the current column contains identical data ("field") values.
Filters. Provide a keyword and use wildcards to view only rows that contain the keyword for the selected column or view.
Most column and log view filters provide the following wildcard matching:
Match either zero characters or any one character ('?'). Example: 198.51.100.2? (Matches tokens with IP address ending with 2, or 20-29.)
Match either zero, any one, or many characters ('*'). Example: Stop* (Matches log strings containing Stop, Stopped, Stopping, and so on.)
Email, export, and save as PDF SNMP Trap Log event data can be exported, reused, and distributed. Select export ( ) to access the following options:
Export to PDF. Save grid and chart views as PDF (on page 952). Export Data. Export SNMP Trap Log data (on page 951) and leverage outside
of WhatsUp Gold. Schedule Export. Set a recurring date and time, format, and email destination
for report data export (on page 942).

WhatsUp Gold User Guide
822
Syslog Syslog records UNIX/Linux system-wide events. Network Performance Monitor can accept Syslog messages from specific devices running Syslog or from all devices, depending on the selected options.
It is not unusual for WhatsUp Gold to receive Syslog messages from a Syslog server daemon (syslogd) running on a non-UNIX operating system (OS). For example, some environments will deploy such a device as a centralized/dedicated Syslog host. Syslog uses standard C libraries and can be ported to run on operating systems other than UNIX.
Each log message record contains the following data columns:
Date. Date and time for the event message. Source. Device where the message originated. Syslog Type. Type of syslog message received. Details. Information contained in the syslog message.
Fetch and filter log data Choose device. Choose one or more host devices.
Use the Select Device dialog for one of the following:
Control Purpose
Device Browse and choose a single device.
Device Group
Choose an existing group of one or more devices. You can also create custom or dynamic groups.
Note: You can organize devices into custom or dynamic groups. For more information, see Grouping Devices (on page 242).
Choose time constraints. Choose specific windows for log data, or choose Last Polled for the latest.
Choose time constraints for data view Control Purpose
Date Range (on page 944)
Choose or define an overall date range.
Business hours (on page 944)
Focus on specific days of the week and periods within each day. Reveal trends that are sensitive to business hours, time zones,
and other periodic attributes in the observed data.

WhatsUp Gold User Guide
823
Filter and reduce by row and by column. Select rows based on specific column values, remove columns, and remove noise and chaff from the table.
Filter tables rows and hide and select columns
Click a column heading and use the following from the drop down list:
Control Purpose
Sort. Sort column in ascending or descending order.
Columns. Pick the columns you want to view. Click a check box to display the column. Clear the check box to hide it.
Group by this field.
Group table into collapsible rows wherever the current column contains identical data ("field") values.
Filters. Provide a keyword and use wildcards to view only rows that contain the keyword for the selected column or view.
Most column and log view filters provide the following wildcard matching:
Match either zero characters or any one character ('?'). Example: 198.51.100.2? (Matches tokens with IP address ending with 2, or 20-29.)
Match either zero, any one, or many characters ('*'). Example: Stop* (Matches log strings containing Stop, Stopped, Stopping, and so on.)
Note: If the receiving port is not on the list of firewall exceptions, messages may not be receivable and as a result will not be added to Syslog. Please ensure that the syslog receiving port is on the firewall's list of exceptions.
Tip: If you experience page load delays for device or system passive monitor reports (SNMP Trap, Syslog, and Windows Event Log), this may be caused by too many records to display for this report time range. Change the time range or reduce the Maximum Passive Monitor Records setting to display fewer records. Reducing the maximum number of passive monitor records improves Network Performance Monitor report display performance. For more information, see Managing server options.
Email, export, and save as PDF Syslog event data can be exported, reused, and distributed. Select export ( ) to access the following options:
Export to PDF. Save grid and chart views as PDF (on page 952). Export Data. Export Syslog data (on page 951) and leverage outside of
WhatsUp Gold.
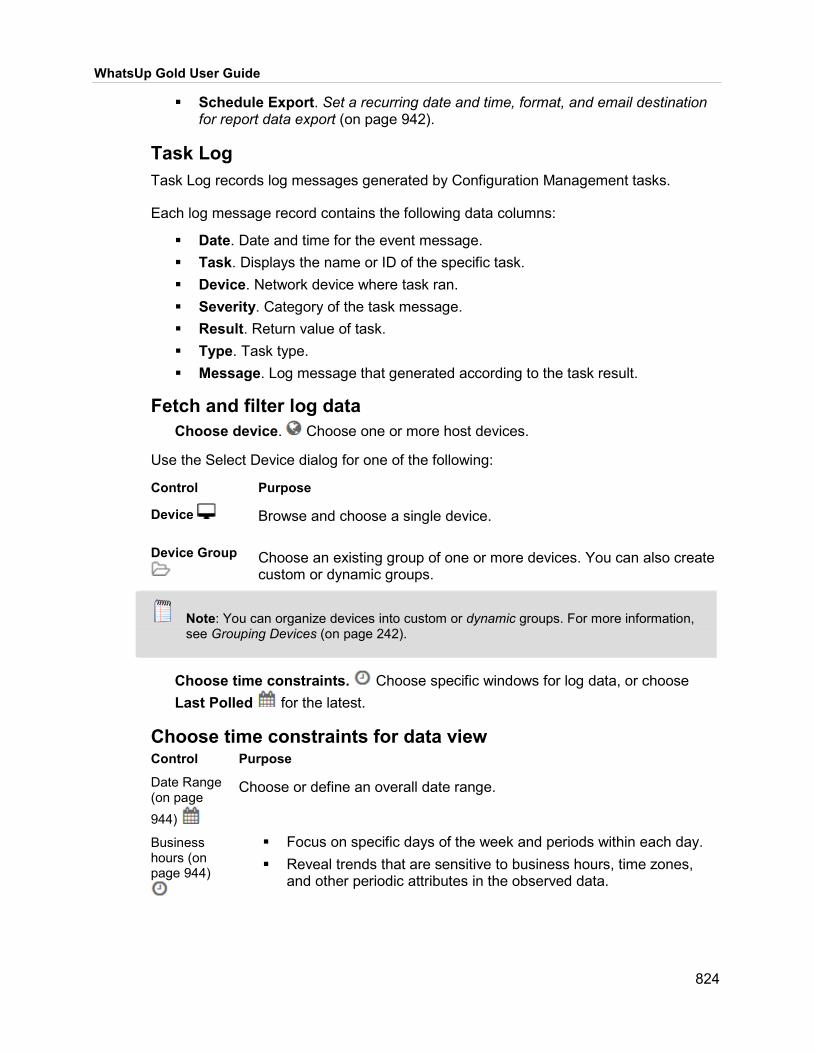
WhatsUp Gold User Guide
824
Schedule Export. Set a recurring date and time, format, and email destination for report data export (on page 942).
Task Log Task Log records log messages generated by Configuration Management tasks.
Each log message record contains the following data columns:
Date. Date and time for the event message. Task. Displays the name or ID of the specific task. Device. Network device where task ran. Severity. Category of the task message. Result. Return value of task. Type. Task type. Message. Log message that generated according to the task result.
Fetch and filter log data Choose device. Choose one or more host devices.
Use the Select Device dialog for one of the following:
Control Purpose
Device Browse and choose a single device.
Device Group
Choose an existing group of one or more devices. You can also create custom or dynamic groups.
Note: You can organize devices into custom or dynamic groups. For more information, see Grouping Devices (on page 242).
Choose time constraints. Choose specific windows for log data, or choose Last Polled for the latest.
Choose time constraints for data view Control Purpose
Date Range (on page 944)
Choose or define an overall date range.
Business hours (on page 944)
Focus on specific days of the week and periods within each day. Reveal trends that are sensitive to business hours, time zones,
and other periodic attributes in the observed data.

WhatsUp Gold User Guide
825
Filter and reduce by row and by column. Select rows based on specific column values, remove columns, and remove noise and chaff from the table.
Filter tables rows and hide and select columns
Click a column heading and use the following from the drop down list:
Control Purpose
Sort. Sort column in ascending or descending order.
Columns. Pick the columns you want to view. Click a check box to display the column. Clear the check box to hide it.
Group by this field.
Group table into collapsible rows wherever the current column contains identical data ("field") values.
Filters. Provide a keyword and use wildcards to view only rows that contain the keyword for the selected column or view.
Most column and log view filters provide the following wildcard matching:
Match either zero characters or any one character ('?'). Example: 198.51.100.2? (Matches tokens with IP address ending with 2, or 20-29.)
Match either zero, any one, or many characters ('*'). Example: Stop* (Matches log strings containing Stop, Stopped, Stopping, and so on.)
Email, export, and save as PDF Task Log event data can be exported, reused, and distributed. Select export ( ) to access the following options:
Export to PDF. Save grid and chart views as PDF (on page 952). Export Data. Export Task Log data (on page 951) and leverage outside of
WhatsUp Gold. Schedule Export. Set a recurring date and time, format, and email destination
for report data export (on page 942).
VMware Event Log VMware Event Log returns an aggregate view of vCenter managed logging. You can determine which categories of event messages to collect when you enable Virtual Monitoring event listeners (on page 945) for each vCenter server device.
Each log message record contains the following data columns:
Date. Date and time for the event message. (Relative to the time configured for the hypervisor.)

WhatsUp Gold User Guide
826
Device. Device hostname, IP address, or custom label. This is the device where the event occurred.
DataCenter. Name of the data center if event is specific to a data center. Host. Name of the host if event is specific to a host. VirtualMachine. Name of the virtual machine if event is specific to a virtual
machine. User. VMWare user name associated with the event (applicable when event is
the result of user action).
Fetch and filter log data Choose device. Choose one or more host devices.
Use the Select Device dialog for one of the following:
Control Purpose
Device Browse and choose a single device.
Device Group
Choose an existing group of one or more devices. You can also create custom or dynamic groups.
Note: You can organize devices into custom or dynamic groups. For more information, see Grouping Devices (on page 242).
Choose time constraints. Choose specific windows for log data, or choose Last Polled for the latest.
Choose time constraints for data view Control Purpose
Date Range (on page 944)
Choose or define an overall date range.
Business hours (on page 944)
Focus on specific days of the week and periods within each day. Reveal trends that are sensitive to business hours, time zones,
and other periodic attributes in the observed data.
Filter and reduce by row and by column. Select rows based on specific column values, remove columns, and remove noise and chaff from the table.
Filter tables rows and hide and select columns
Click a column heading and use the following from the drop down list:

WhatsUp Gold User Guide
827
Control Purpose
Sort. Sort column in ascending or descending order.
Columns. Pick the columns you want to view. Click a check box to display the column. Clear the check box to hide it.
Group by this field.
Group table into collapsible rows wherever the current column contains identical data ("field") values.
Filters. Provide a keyword and use wildcards to view only rows that contain the keyword for the selected column or view.
Most column and log view filters provide the following wildcard matching:
Match either zero characters or any one character ('?'). Example: 198.51.100.2? (Matches tokens with IP address ending with 2, or 20-29.)
Match either zero, any one, or many characters ('*'). Example: Stop* (Matches log strings containing Stop, Stopped, Stopping, and so on.)
Note: VMware Event Log only returns log messages for hosts that have the appropriate Virtual Monitoring listeners and event collection enabled. For more details, see Enable Virtual Monitoring Event Listeners (on page 945).
Tip: Date-time stamp for VMware Event Log log messages are relative to time settings configured for the vCenter/hypervisor.
Email, export, and save as PDF VMware Event Log event data can be exported, reused, and distributed. Select export ( ) to access the following options:
Export to PDF. Save grid and chart views as PDF (on page 952). Export Data. Export VMware Event Log data (on page 951) and leverage
outside of WhatsUp Gold. Schedule Export. Set a recurring date and time, format, and email destination
for report data export (on page 942).
Web User Activity Log Web User Activity Log displays all categories of messages gathered from end-user interaction with the WhatsUp Gold web UI for a time period you specify.

WhatsUp Gold User Guide
828
Each log message record contains the following data columns:
Date. Date and time for the event message. Type. Denotes message severity level, for example Information. Web User. Web user account that initiated activity that was logged. Details. Log message string.
Note: At the bottom of the Web User Activity Log report, the record summary displays the total number of rows matching your filter criteria.
Fetch and filter log data Choose time constraints. Choose specific windows for log data, reduce by date range, or choose Last Polled for the latest.
Choose time constraints for data view Control Purpose
Date Range (on page 944)
Choose or define an overall date range.
Business hours (on page 944)
Focus on specific days of the week and periods within each day. Reveal trends that are sensitive to business hours, time zones,
and other periodic attributes in the observed data.
Filter and reduce by row and by column. Select rows based on specific column values, remove columns, and remove noise and chaff from the table.
Filter tables rows and hide and select columns
Click a column heading and use the following from the drop down list:
Control Purpose
Sort. Sort column in ascending or descending order.
Columns. Pick the columns you want to view. Click a check box to display the column. Clear the check box to hide it.
Group by this field.
Group table into collapsible rows wherever the current column contains identical data ("field") values.

WhatsUp Gold User Guide
829
Filters. Provide a keyword and use wildcards to view only rows that contain the keyword for the selected column or view.
Most column and log view filters provide the following wildcard matching:
Match either zero characters or any one character ('?'). Example: 198.51.100.2? (Matches tokens with IP address ending with 2, or 20-29.)
Match either zero, any one, or many characters ('*'). Example: Stop* (Matches log strings containing Stop, Stopped, Stopping, and so on.)
Email, export, and save as PDF Web User Activity Log event data can be exported, reused, and distributed. Select export ( ) to access the following options:
Export to PDF. Save grid and chart views as PDF (on page 952). Export Data. Export Web User Activity Log data (on page 951) and leverage
outside of WhatsUp Gold. Schedule Export. Set a recurring date and time, format, and email destination
for report data export (on page 942).
Windows Event Log Windows Event Log records Windows Event Log messages. Windows Event Log messages include application, security, setup, system, and forwarded events.
Each log message record contains the following data columns:
Date. Date and time for the event message. Source. Source of the event message notification. Trap. Type of WinEvent message received. Details. Log message string.
Note: In order for entries to be added to this report, the Windows Event Log listener must be enabled and a Windows Event passive monitor must be added to a device. For more information on the Windows Event Log listener, see Enabling the Windows Event Log Listener (on page 860).
Fetch and filter log data Choose device. Choose one or more host devices.
Use the Select Device dialog for one of the following:
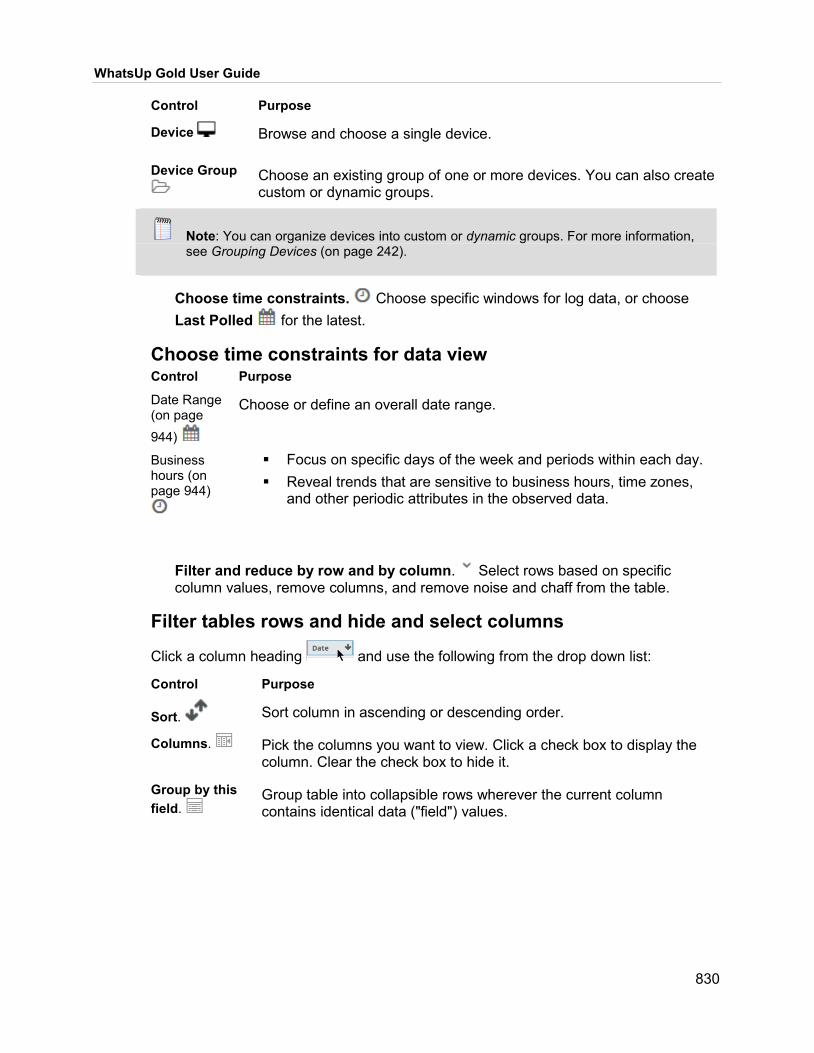
WhatsUp Gold User Guide
830
Control Purpose
Device Browse and choose a single device.
Device Group
Choose an existing group of one or more devices. You can also create custom or dynamic groups.
Note: You can organize devices into custom or dynamic groups. For more information, see Grouping Devices (on page 242).
Choose time constraints. Choose specific windows for log data, or choose Last Polled for the latest.
Choose time constraints for data view Control Purpose
Date Range (on page 944)
Choose or define an overall date range.
Business hours (on page 944)
Focus on specific days of the week and periods within each day. Reveal trends that are sensitive to business hours, time zones,
and other periodic attributes in the observed data.
Filter and reduce by row and by column. Select rows based on specific column values, remove columns, and remove noise and chaff from the table.
Filter tables rows and hide and select columns
Click a column heading and use the following from the drop down list:
Control Purpose
Sort. Sort column in ascending or descending order.
Columns. Pick the columns you want to view. Click a check box to display the column. Clear the check box to hide it.
Group by this field.
Group table into collapsible rows wherever the current column contains identical data ("field") values.
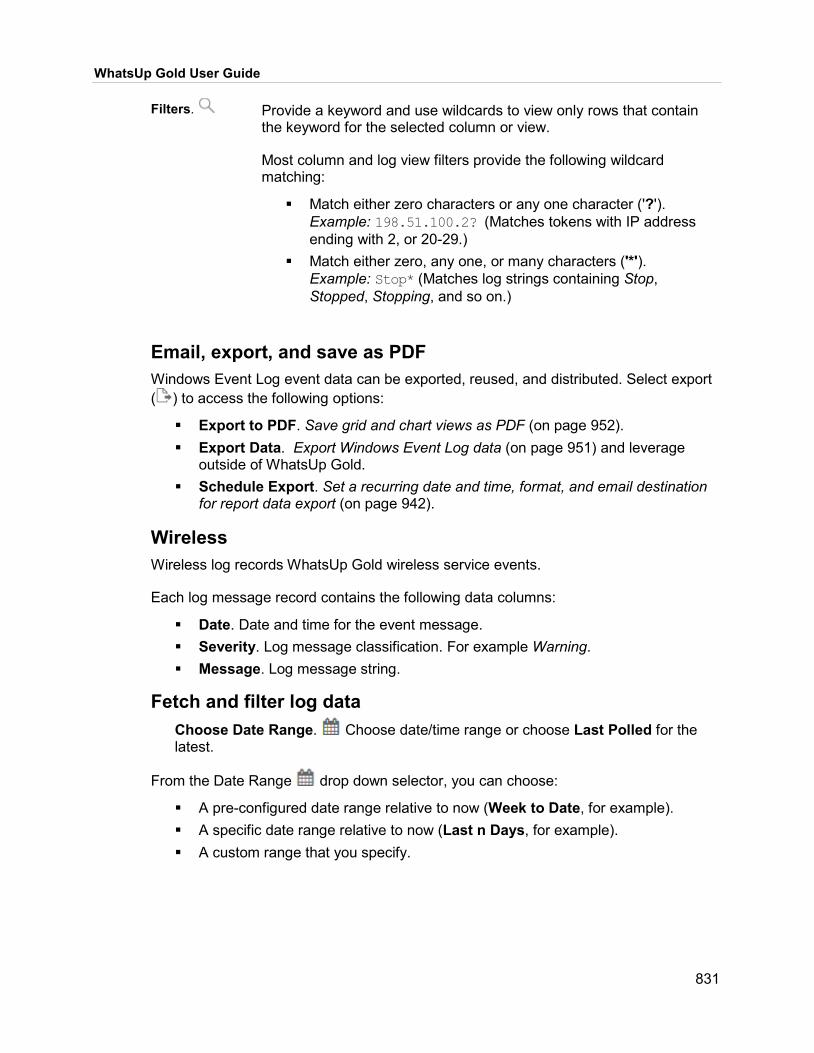
WhatsUp Gold User Guide
831
Filters. Provide a keyword and use wildcards to view only rows that contain the keyword for the selected column or view.
Most column and log view filters provide the following wildcard matching:
Match either zero characters or any one character ('?'). Example: 198.51.100.2? (Matches tokens with IP address ending with 2, or 20-29.)
Match either zero, any one, or many characters ('*'). Example: Stop* (Matches log strings containing Stop, Stopped, Stopping, and so on.)
Email, export, and save as PDF Windows Event Log event data can be exported, reused, and distributed. Select export ( ) to access the following options:
Export to PDF. Save grid and chart views as PDF (on page 952). Export Data. Export Windows Event Log data (on page 951) and leverage
outside of WhatsUp Gold. Schedule Export. Set a recurring date and time, format, and email destination
for report data export (on page 942).
Wireless Wireless log records WhatsUp Gold wireless service events.
Each log message record contains the following data columns:
Date. Date and time for the event message. Severity. Log message classification. For example Warning. Message. Log message string.
Fetch and filter log data Choose Date Range. Choose date/time range or choose Last Polled for the latest.
From the Date Range drop down selector, you can choose:
A pre-configured date range relative to now (Week to Date, for example). A specific date range relative to now (Last n Days, for example). A custom range that you specify.

WhatsUp Gold User Guide
832
Filter and reduce by row and by column. Select rows based on specific column values, remove columns, and remove noise and chaff from the table.
Filter tables rows and hide and select columns
Click a column heading and use the following from the drop down list:
Control Purpose
Sort. Sort column in ascending or descending order.
Columns. Pick the columns you want to view. Click a check box to display the column. Clear the check box to hide it.
Group by this field.
Group table into collapsible rows wherever the current column contains identical data ("field") values.
Filters. Provide a keyword and use wildcards to view only rows that contain the keyword for the selected column or view.
Most column and log view filters provide the following wildcard matching:
Match either zero characters or any one character ('?'). Example: 198.51.100.2? (Matches tokens with IP address ending with 2, or 20-29.)
Match either zero, any one, or many characters ('*'). Example: Stop* (Matches log strings containing Stop, Stopped, Stopping, and so on.)
Share, export, and save as PDF Most generated Wireless report data can be printed, shared, and exported when selecting Expand ( ) from the Dashboard Options ( ) menu. After the report has been expanded, select export ( ) to access the following options:
Export to PDF. Generate a PDF file of the report with user-defined page size and orientation.
Export Data. Export Wireless data (on page 951) and leverage outside of WhatsUp Gold.
Schedule Export. Set a recurring date and time, format, and email destination for report data export (on page 942).
Alert Center Log View Alert Center Log View displays alert center events.
Each log message record contains the following data columns:
Date. Date and time for the event message.

WhatsUp Gold User Guide
833
Message. Log message generated by WhatsUp Gold Alert Center. Severity. Denotes message severity level, for example Information.
Fetch and filter log data Choose time constraints. Choose specific windows for log data, reduce by date range, or choose Last Polled for the latest.
Choose time constraints for data view Control Purpose
Date Range (on page 944)
Choose or define an overall date range.
Business hours (on page 944)
Focus on specific days of the week and periods within each day. Reveal trends that are sensitive to business hours, time zones,
and other periodic attributes in the observed data.
Filter and reduce by row and by column. Select rows based on specific column values, remove columns, and remove noise and chaff from the table.
Filter tables rows and hide and select columns
Click a column heading and use the following from the drop down list:
Control Purpose
Sort. Sort column in ascending or descending order.
Columns. Pick the columns you want to view. Click a check box to display the column. Clear the check box to hide it.
Group by this field.
Group table into collapsible rows wherever the current column contains identical data ("field") values.
Filters. Provide a keyword and use wildcards to view only rows that contain the keyword for the selected column or view.
Most column and log view filters provide the following wildcard matching:
Match either zero characters or any one character ('?'). Example: 198.51.100.2? (Matches tokens with IP address ending with 2, or 20-29.)
Match either zero, any one, or many characters ('*'). Example: Stop* (Matches log strings containing Stop, Stopped, Stopping, and so on.)

WhatsUp Gold User Guide
834
Email, export, and save as PDF Alert Center Log View event data can be exported, reused, and distributed. Select export ( ) to access the following options:
Export to PDF. Save grid and chart views as PDF (on page 952). Export Data. Export Alert Center Log View data (on page 951) and leverage
outside of WhatsUp Gold. Schedule Export. Set a recurring date and time, format, and email destination
for report data export (on page 942).
Network Traffic Analysis Logs Network Traffic Analysis includes the following logs:
NTA Log (on page 834). Network Traffic Analysis common log. Unclassified Traffic Log. Unexpected port usage log.
NTA Log NTA Log records system-wide messages generated by Network Traffic Analysis.
Each log message record contains the following data columns:
Date. Date and time for the event message. Severity Logging level of the entries. For example, Normal or Verbose. Message Activity message. Contains the reason for the log entry, error number,
and so on.
Fetch and filter log data Choose time constraints. Choose specific windows for log data, reduce by date range, or choose Last Polled for the latest.
Choose time constraints for data view Control Purpose
Date Range (on page 944)
Choose or define an overall date range.
Business hours (on page 944)
Focus on specific days of the week and periods within each day. Reveal trends that are sensitive to business hours, time zones,
and other periodic attributes in the observed data.
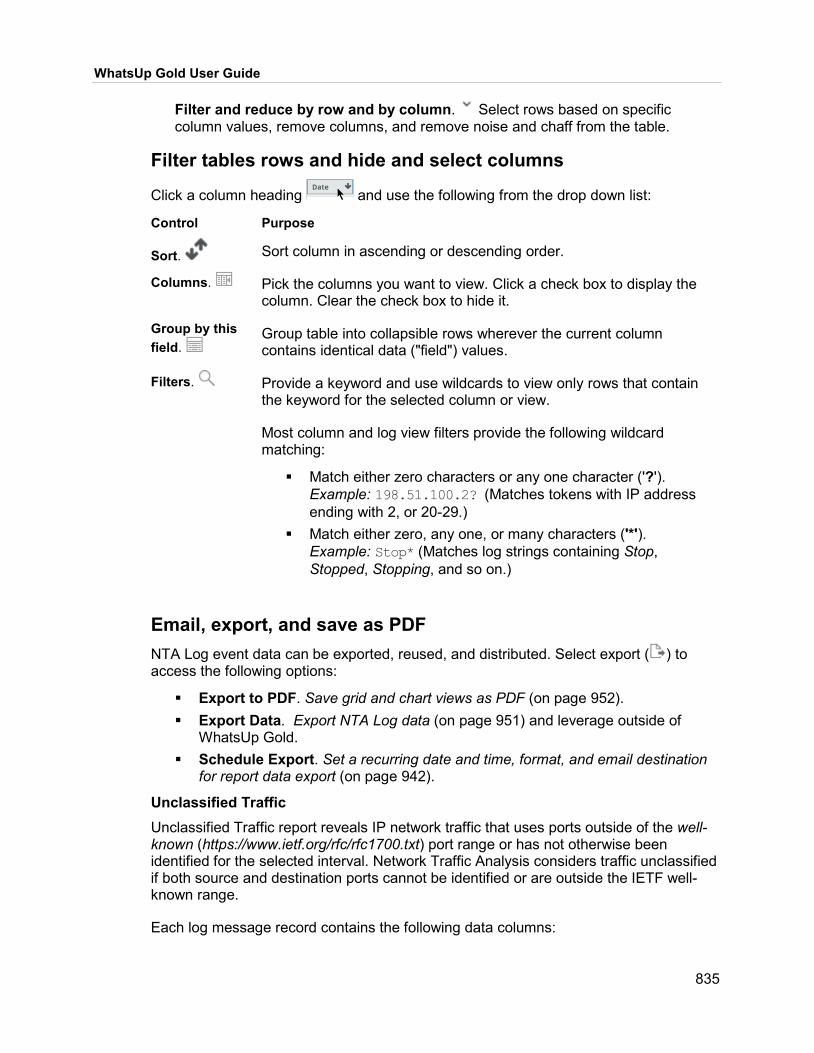
WhatsUp Gold User Guide
835
Filter and reduce by row and by column. Select rows based on specific column values, remove columns, and remove noise and chaff from the table.
Filter tables rows and hide and select columns
Click a column heading and use the following from the drop down list:
Control Purpose
Sort. Sort column in ascending or descending order.
Columns. Pick the columns you want to view. Click a check box to display the column. Clear the check box to hide it.
Group by this field.
Group table into collapsible rows wherever the current column contains identical data ("field") values.
Filters. Provide a keyword and use wildcards to view only rows that contain the keyword for the selected column or view.
Most column and log view filters provide the following wildcard matching:
Match either zero characters or any one character ('?'). Example: 198.51.100.2? (Matches tokens with IP address ending with 2, or 20-29.)
Match either zero, any one, or many characters ('*'). Example: Stop* (Matches log strings containing Stop, Stopped, Stopping, and so on.)
Email, export, and save as PDF NTA Log event data can be exported, reused, and distributed. Select export ( ) to access the following options:
Export to PDF. Save grid and chart views as PDF (on page 952). Export Data. Export NTA Log data (on page 951) and leverage outside of
WhatsUp Gold. Schedule Export. Set a recurring date and time, format, and email destination
for report data export (on page 942).
Unclassified Traffic Unclassified Traffic report reveals IP network traffic that uses ports outside of the well-known (https://www.ietf.org/rfc/rfc1700.txt) port range or has not otherwise been identified for the selected interval. Network Traffic Analysis considers traffic unclassified if both source and destination ports cannot be identified or are outside the IETF well-known range.
Each log message record contains the following data columns:

WhatsUp Gold User Guide
836
Date. Date and time for the event message. Sender IP. IP address of the source device. Sender Port. Source device port number on which the traffic is flowing. Receiver IP. IP address of the destination device. Receiver Port. Destination device port number on which the traffic is flowing. Protocol. Protocol used by the traffic; either TCP, UDP, SCTP, or DCCP. Bytes. Combined (incoming/outgoing) number of bytes transferred. (Use Report
Settings Sort by option to rank the list by packet or flow count, not bytes.) Bit Rate. Total average bit rate.
To display Flow and Packet measurements, click a column heading ( ) for column selection list ( ). You can also include:
Receiver Hostname. Name of the destination device. Sender Hostname. Name of the origin device.
Generate a report Choose source. , Choose a networking device or single physical or virtual interface you want to see Unclassified Traffic measurements for. Choose traffic direction across an interface.
Use the Select Device dialog for one of the following:
Control Description
Device. Browse and choose a networking device that is a Network Traffic Analysis monitoring source.
Network Interface.
Choose a single physical or virtual interface Network Traffic Analysis you want traffic statistics for.
Choose direction of traffic over the network interface (Inbound, Outbound, Inbound and Outbound, or Bounce for invalid traffic.).
Choose time constraints. Choose times for the Unclassified Traffic.Choose, filter, and reorder columns. Choose and hide columns, reorder columns, and apply advanced filters (on page 381) to customize your data view.
Filter and pick by column
Click a report heading ( ) and use the "column picker" ( ) from the drop down list.
Control Purpose
Columns. Click a check box to display the column. Clear the check box to hide it.
Move Column. Click on a column heading and drag it to reorder your table's columns.

WhatsUp Gold User Guide
837
Advanced Filtering (on page 381).
Apply category, pattern, and keyword filtering to column data.
Choose time constraints for data view Control Purpose
Date Range (on page 944)
Choose or define an overall date range.
Business hours (on page 944)
Focus on specific days of the week and periods within each day. Reveal trends that are sensitive to business hours, time zones,
and other periodic attributes in the observed data.
Chart, adjust output, and visualize. Fine tune report presentation and range of values displayed using the Report Settings dialog (optional).
Specify threshold and top n: Control Purpose
Show Top n Items Limit items to the samples with the highest values.
Sort by Field Select a column to sort by (if applicable).
Chart and view options Control Purpose
View Options Select/clear the checkboxes to display/hide Totals. Display totals for each column. Others. Remainder values that do not make the top n. Chart. Display the selected Chart Type. Legend. Include legend and grid lines for readability. Trend Lines. Present data a smoothed average to show trend.
Chart Type Select a chart type and associated options: Pie. Pie distribution chart. Line/Area. Scatter graph that connects adjacent measurements
with straight lines. Spline/Area Spline. Choose a graph with a smoothed
appearance where adjacent samples exhibit a gradual slope. Vertical Bar/Horizontal Bar. Vertical or horizontal bar
chart/histogram. Y-Axis Scale Scale Y-axis (chart and graph height) automatically or choose a fixed size.

WhatsUp Gold User Guide
838
Share, export, and save as PDF Most generated Unclassified Traffic report data can be printed, shared, and exported when selecting Expand ( ) from the Dashboard Options ( ) menu. After the report has been expanded, select export ( ) to access the following options:
Export to PDF. Generate a PDF file of the report with user-defined page size and orientation.
Export Data. Export Unclassified Traffic data (on page 951) and leverage outside of WhatsUp Gold.
Schedule Export. Set a recurring date and time, format, and email destination for report data export (on page 942).
Applications State Change Log Applications State Change Log records transitions in application monitor states. By default, it displays the last n events.
Each log message record contains the following data columns:
Source Name. Application monitor name. State. Nature of state change detected when polled. For example, Up. State Details. Log string associated with the state change. Start Time. Date and time reflecting when the state change was recorded.
Generate a report Choose application. Choose one or more applications you want to see Applications State Change Log measurements for.
Choose time constraints. ( , ) Choose times for the Applications State Change Log. (For recently observed measurements, select Last Polled from the Date Range drop down list.)
Choose time constraints for data view Control Purpose
Date Range (on page 944)
Choose or define an overall date range.
Business hours (on page 944)
Focus on specific days of the week and periods within each day. Reveal trends that are sensitive to business hours, time zones,
and other periodic attributes in the observed data.
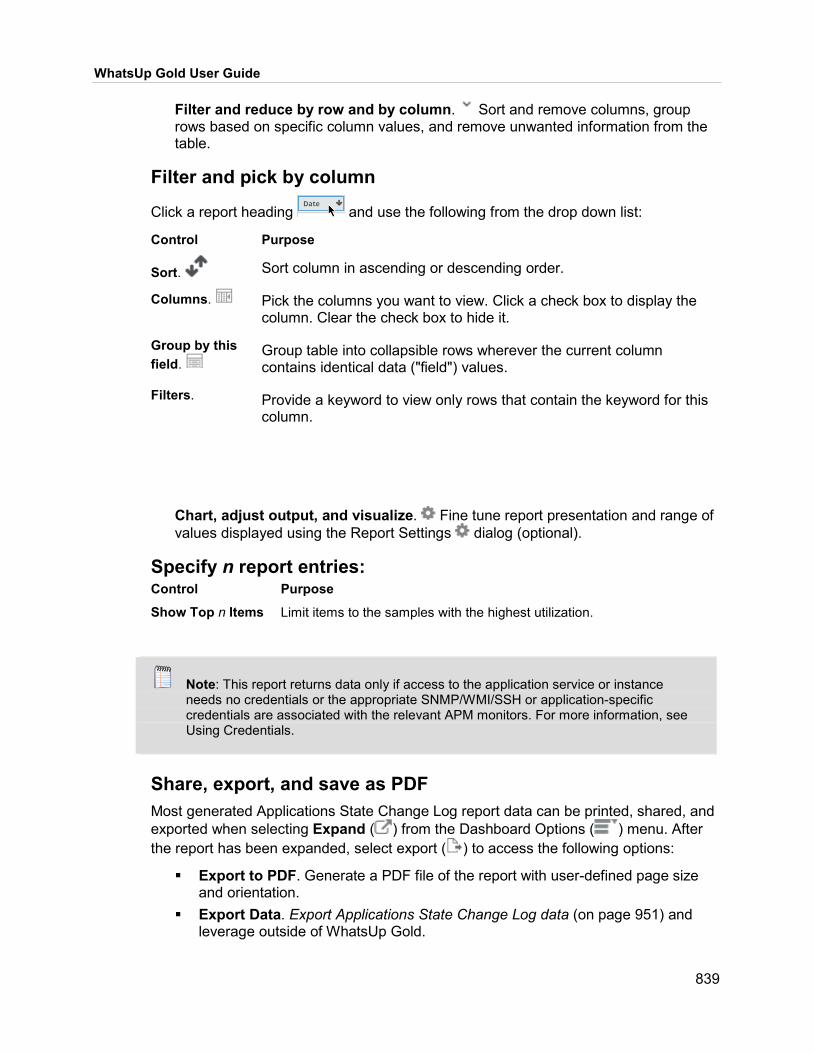
WhatsUp Gold User Guide
839
Filter and reduce by row and by column. Sort and remove columns, group rows based on specific column values, and remove unwanted information from the table.
Filter and pick by column
Click a report heading and use the following from the drop down list:
Control Purpose
Sort. Sort column in ascending or descending order.
Columns. Pick the columns you want to view. Click a check box to display the column. Clear the check box to hide it.
Group by this field.
Group table into collapsible rows wherever the current column contains identical data ("field") values.
Filters. Provide a keyword to view only rows that contain the keyword for this column.
Chart, adjust output, and visualize. Fine tune report presentation and range of values displayed using the Report Settings dialog (optional).
Specify n report entries: Control Purpose
Show Top n Items Limit items to the samples with the highest utilization.
Note: This report returns data only if access to the application service or instance needs no credentials or the appropriate SNMP/WMI/SSH or application-specific credentials are associated with the relevant APM monitors. For more information, see Using Credentials.
Share, export, and save as PDF Most generated Applications State Change Log report data can be printed, shared, and exported when selecting Expand ( ) from the Dashboard Options ( ) menu. After the report has been expanded, select export ( ) to access the following options:
Export to PDF. Generate a PDF file of the report with user-defined page size and orientation.
Export Data. Export Applications State Change Log data (on page 951) and leverage outside of WhatsUp Gold.

WhatsUp Gold User Guide
840
Schedule Export. Set a recurring date and time, format, and email destination for report data export (on page 942).
APM-Resolved Items Log APM-Resolved Items Log records resolved actions that occurred for the selected interval for all instances or components in the selected application, profile, or selected component (for the case where a single component is selected).
State. Displays the state which the instance or component was in when the Action Policy was Acknowledged.
Source Name. Displays the name of the instance or component that triggered the action.
Action Policy. Displays the name of the Action Policy which was Acknowledged in the Running Action Policies report.
User Name. Displays the name of the user who acknowledged the Action Policy in the Running Action Policies report.
Details. Displays the details entered by the user to describe the reason for Acknowledging the Action Policy.
Time of Resolution. Displays the date and time that the user acknowledged the Action Policy.
Generate a report Choose application. Choose one or more applications you want to see APM-Resolved Items Log measurements for.
Choose time constraints. ( , ) Choose times for the APM-Resolved Items Log. (For recently observed measurements, select Last Polled from the Date Range drop down list.)
Choose time constraints for data view Control Purpose
Date Range (on page 944)
Choose or define an overall date range.
Business hours (on page 944)
Focus on specific days of the week and periods within each day. Reveal trends that are sensitive to business hours, time zones,
and other periodic attributes in the observed data.
Filter and reduce by row and by column. Sort and remove columns, group rows based on specific column values, and remove unwanted information from the table.
Filter and pick by column
Click a report heading and use the following from the drop down list:

WhatsUp Gold User Guide
841
Control Purpose
Sort. Sort column in ascending or descending order.
Columns. Pick the columns you want to view. Click a check box to display the column. Clear the check box to hide it.
Group by this field.
Group table into collapsible rows wherever the current column contains identical data ("field") values.
Filters. Provide a keyword to view only rows that contain the keyword for this column.
Chart, adjust output, and visualize. Fine tune report presentation and range of values displayed using the Report Settings dialog (optional).
Specify n report entries: Control Purpose
Show Top n Items Limit items to the samples with the highest utilization.
Note: This report returns data only if access to the application service or instance needs no credentials or the appropriate SNMP/WMI/SSH or application-specific credentials are associated with the relevant APM monitors. For more information, see Using Credentials.
Share, export, and save as PDF Most generated APM-Resolved Items Log report data can be printed, shared, and exported when selecting Expand ( ) from the Dashboard Options ( ) menu. After the report has been expanded, select export ( ) to access the following options:
Export to PDF. Generate a PDF file of the report with user-defined page size and orientation.
Export Data. Export APM-Resolved Items Log data (on page 951) and leverage outside of WhatsUp Gold.
Schedule Export. Set a recurring date and time, format, and email destination for report data export (on page 942).
Quick Help Links
General Libraries Dashboards, Reports, and Logs

WhatsUp Gold User Guide
842
Navigation (on page 18) Credentials Using Logs and Reports (on page 410)
Discovery Actions (on page 252) and Tasks (on page 314)
Dashboards
Monitoring Applications Monitors (on page 106) Active Passive (on page 150) Performance (on page 153)
Logs (on page 793)
Configuration Management (on page 307)
Alert Center (on page 258)
Reporting (on page 432)
Network Traffic Analysis (on page 346)
System Tasks (on page 383)
Troubleshooting

843
CHAPTER 33
Other Reference Information
JMX Browser JMX Browser allows you to discover, or explore in detail, the JMX objects and attributes a device supports and that can be monitored with WhatsUp Gold.
1 Select the applicable domain and object on the device using the navigation tree at left.
2 Select the specific attribute(s) to monitor from the list at right. 3 Click OK to close the JMX Browser and return to the monitor configuration dialog.
Global SMTP Settings Email Addresses From Email Address. Enter the name and address you want to display for
notifications sent from WhatsUp Gold Log Management. Reply To Email. Enter the email address to which you want to reply to
messages within WhatsUp Gold Log Management.
SMTP and Encryption Settings SMTP Server. For SMTP relay of Scheduled Reports, enter in the fully-qualified
domain name (for example, mail.example.com) or IP address of the mail server in this field. Make sure you setup your SMTP server to allow relay from the machine(s) running WhatsUp Gold Log Management.
SMTP Port. Enter the SMTP port number (no default port is set). Use an Encrypted Connection (SSL/TLS). Indicates that relay from SMTP
client to SMTP server will be encrypted.
SMS Providers Select a country, then select a provider in that country.
Select a country, then click New to add another provider for that country. Select a provider, then click Edit to make changes to an existing provider. Select a provider, then click Delete to remove a provider.

WhatsUp Gold User Guide
844
SMS Provider Details Enter or select the appropriate information from the following boxes.
Provider. Enter the desired display name for this provider. Country. Enter the desired country for this provider. Max Message Length. Enter the maximum number of characters you want
available in the Message text box. Email. If you want to use email with this provider, select Email and provide your
Server name and the provider's From email address. Example:
Server = mymailserver.com
From = [email protected] Dialup. If you want to use this provider with a dialup connection, select Dialup,
and provide the appropriate Phone number. Click the Modem Settings button to set your modem to the correct specifications for this provider.
Password. If a password is used, enter it here. SMS Script. Use the list box to select the desired SMS script. Modem retry. This value specifies how many times to try to connect to the
modem. For example: If the value entered is 3, WhatsUp Gold will make 3 attempts to connect to the modem. If after three attempts, there is no connection to the modem, the notification fails and goes into the retry queue.
Click OK to save changes.
Select computer Choose a device and select credentials needed to browse that device’s performance counters.
To connect to a device using SNMP credentials: 1 Enter or select the appropriate information: Computer name. Enter the computer name or IP address for which you want to
connect. Click browse (...) to select a device.
SNMP v1/v2/v3 credentials. Select valid SNMP credentials for this computer. Click browse (...) to edit the Credentials Library.
Timeout. The length of time WhatsUp Gold attempts to connect to the selected device. When the time you enter is exceeded without connecting, a timeout occurs and WhatsUp Gold stops trying to connect to the device. This is considered a failed connection.

WhatsUp Gold User Guide
845
Retries. The number of times you want WhatsUp Gold to attempt to make the connection to the selected computer.
2 Click OK to save changes.
To connect to a device using WMI credentials: 1 Enter or select the appropriate information: Computer name. Enter the computer name or IP address for which you want to
connect. Click browse (...) to select a device.
Windows credential. Select a credential from a list of Windows credentials (accessed from the Credentials Library). Click browse (...) to edit the Credentials Library.
2 Click OK to save changes.
Email Active Monitor Advanced Properties
You can configure the advanced properties for the Email Monitor.
Type or select the appropriate information in the following fields.
SMTP Advanced Properties
SMTP server requires authentication. Select this option if your SMTP server requires authentication.
Note: The Email Monitor supports CRAM-MD5, LOGIN and PLAIN authentication methods. The authentication method is not configurable. It is negotiated with the SMTP server automatically using the strongest mutually supported authentication method.
Username. Type the username to be used with SMTP authentication.
Password. Type the password of the username to be used with authentication.
Use an encrypted connection (SSL/TLS). If your SMTP server supports encrypting data over a TLS connection (formerly known as SSL), select this option to encrypt SMTP traffic.
Note: For SMTP connections, WhatsUp Gold only supports explicit SSL sessions negotiated using the STARTTLS command.
Timeout. Type the amount of time (in seconds) to wait for a response from the SMTP server for each command WhatsUp Gold issued. If this time limit is exceeded, the monitor fails.
Incoming server (IMAP or POP3) advanced properties

WhatsUp Gold User Guide
846
Note: WhatsUp Gold supports only clear text authentication method for retrieving mail. To protect your username and password while retrieving mail, you must use one of the SSL encryption methods.
Port. Type the port on which your POP3 or IMAP server is running.
Use an encrypted connection. Select this option to connect to a POP3 or IMAP server in an encrypted mode. Select one of the following encryption methods:
Use implicit SSL. Select this option to login to your POP3 or IMAP server in an encrypted mode.
Use SSL with STLS. Select this option to login to your POP3 or IMAP server in an unencrypted mode, and then switch to a TLS connection by sending STARTTLS or STLS command to the server.
Important: When connecting using STARTTLS, the connection is encrypted before any authentication information is sent or any mail is retrieved.
Timeout. Time (in seconds) to wait for a response from the IMAP/POP3 server for each command WhatsUp Gold issued. If this time limit is exceeded, the monitor fails.
Note: If your IMAP server is configured to move the test message sent by the monitor to a folder other than the Inbox, the monitor fails. WhatsUp Gold only detects messages in the Inbox folder on an IMAP server.
Click OK to save changes.
Tools: Layer 2 Trace Tools: Layer 2 Trace traces the physical network path from one device to another. Using previously discovered network connectivity data, the Layer 2 Trace tool finds the path between the two devices and then displays each network interface that is used to build the path. The trace tool also allows for a quick check of the status and availability of each step along the layer 2 path.
To use the Layer 2 Trace tool: Source Device. Browse for a select a source device. This is the starting point
for the layer 2 trace. Destination Device. Browse for the endpoint of the layer 2 trace. Trace/Ping. Show trace result records/test connectivity. Result records take the
following format: Device. Lists the devices that the network path traverses.

WhatsUp Gold User Guide
847
IP Address. Lists the IP address of each device on the network path.
Interface Name. Lists the interfaces that the network path traverses.
Ping Status. Lists the device ping status.
Tip: After a trace is completed, you can click Ping to view the current status of the layer 2 path. This tool pings each device identified in the trace and uses SNMP to query the interface for its status.
IP/MAC Address Finder IP/MAC Address Finder provides visibility into how WhatsUp Gold identified or 'sighted' a resource showing a particular hardware (MAC) or network (IP) address. You can use it for gaining insight on how WhatsUp Gold Discovery came to identify the device on your network.
Tip: IP/MAC Address Finder can be a powerful diagnostic tool for scenarios of MAC address spoofing, stale ARP cache detection, and so on.
To find an IP by way of its MAC or IP address:
IP Address. Enter the IP address used by a network interface on the device. Leave blank if you are scanning for a MAC address. --or-- Click Select to select a device, in the Select Devices dialog, and choose from already added or discovered devices.
Note: The IP/MAC Finder tool does not support IPv6 addresses.
MAC Address. Enter The MAC address (for the network interface card) for which you are scanning the network.
Use Network Devices Only. Select to display the IP/MAC sightings found only on network device types (routers and switches, for example). --or-- Clear (leave unselected) to display all IP/MAC sightings found on all device types.
Find/Clear. Click to return/clear result records ('sightings') of the IP or MAC returned from network resources.
Device. Name of the network device.
IP Address. Last known IP of the device that reported the results record.

WhatsUp Gold User Guide
848
Interface Name. Lists the network interface that is routing or forwarding traffic to the IP or MAC address.
Is Linked To. Lists the network devices to which the device is linked.
Sighting Type. Lists where the information was seen, such as an ARP cache, a forwarding database, or the device itself.
Using Email Notification Message Settings
Use the Configure Email Notification Message Settings dialog to configure email notification (on page 932) message settings. Email notifications are sent as part of a notification policy (on page 260) when an item goes out of threshold.
To configure email notification settings: Maximum newly alarmed items. Limits how many newly 'out-of-threshold'
items to include.
Show currently alarmed items. Displays currently alarmed items in email messages.
Maximum currently alarmed items. Specifies how many total items will be included in a single message.
Select a Device Use this dialog to select a device group from which you want to view a list of devices.
To select a device: 1 Click + to expand the preferred device group. The device list displays. 2 Select a device or device group from the list, then click OK.
Select a Home Device Group Home Device Groups (SETTINGS menu > Users and Groups, click the Home device group [...] button) provide users and user roles with the following:
Read access to the device group. Default browsing point when selecting monitors using the Group/Device Picker.
To choose a Home Device Group
From the Home device group dialog:
1 Click (+) to expand the list and select a home device group for the user or role. 2 Click OK.
WhatsUp Gold User Guide
849
Welcome Guided Tour WhatsUp Gold Guided Welcome Tour (HELP > Welcome) walks new users through the powerful and simplified user interface developed for WhatsUp Gold.
Setting LDAP or Cisco ACS credentials Use this dialog to:
Configure LDAP or Active Directory (AD) credentials and to configure WhatsUp Gold to connect with an Active Directory server to import group information from a Microsoft Domain Controller into WhatsUp Gold.
-or- Configure Cisco ACS credentials and configure WhatsUp Gold to connect with a
Cisco ACS server.
To configure Active Directory/LDAP external authentication: 1 Enter the following information: Domain Controller or LDAP Server. Enter the Domain Controller IP address or
hostname for the Domain Controller or LDAP server. If you are authenticating to an Active Directory domain, the LDAP server for your domain is a DC (domain controller).
Server port. Enter the port the Active Directory server uses to listen for connections (Default: 389).
Secure. Select this option if you want Active Directory domain or LDAP queries to be encrypted using SSL (Default port: 636).
2 Select Active Directory to enable Active Directory domain credentials. Then, enter the Active Directory Logon Domain from which you want to access and import AD groups. -or- Select Standard LDAP to enable Active Directory domain credentials. Then, enter the path to the container which holds the users you want to access the WhatsUp Gold web interface in Authorize DN.

WhatsUp Gold User Guide
850
Note: The following Authorize DN example could be used for an LDAP server on the ipswitch.com domain, with a "Users" container located in the root level of the Active Directory database: CN=%s,CN=Users,DC=ipswitch,DC=com. For more information, see the LDAP authentication with Active Directory (https://community.ipswitch.com/s/article/LDAP-authentication-with-Active-Directory-1307717741826) KB article.
3 Click Test to open the Test dialog. The Test dialog allows you to verify that your credentials are configured correctly.
4 Click Browse to open the Browse Active Directory dialog. The Browse Active Directory dialog allows you to select the AD groups you would like to map to existing WhatsUp Gold user groups. Please note, authentication for nested Active Directory groups are not supported.
5 In the Active Directory group list, select the WhatsUp Gold group you want to map to each AD group.
Note: Before you can map AD groups to WhatsUp Gold groups, you must create the WhatsUp Gold groups using the Add User Group dialog. When you have added the WhatsUp Gold user groups you can then select the AD groups you want to map to WhatsUp Gold groups using the Browse Active Directory dialog.
Note: When a member of an AD group logs into WhatsUp Gold using their Windows Domain credentials, they will be added as a member of the WhatsUp Gold group mapped to that AD group.
6 Click OK. WhatsUp Gold saves the Active Directory credentials and the LDAP Credentials dialog closes.
To configure WhatsUp Gold to use Cisco ACS for authentication:
Use the Cisco ACS tab to configure Cisco ACS credentials and to configure WhatsUp Gold to connect with a Cisco ACS server. Before configuring in WhatsUp Gold, make sure to enable the UCP interface on the respective Cisco ACS device and make sure the device uses a valid certificate.
1 Enter or select the appropriate information: Cisco ACS server hostname / IP address. Enter the server hostname or IP
address for the Cisco ACS server.
Cisco ACS server port number. Enter the port the Cisco ACS server uses to listen for connections (Default: 431).
2 Click Test to open the Test Cisco ACS Authentication dialog. The Test dialog allows you to verify that your credentials are configured correctly.
3 Click OK to save changes. WhatsUp Gold saves the Cisco ACS credentials and the Configure External Authentication dialog closes.

WhatsUp Gold User Guide
851
Percent Variables You can customize an action's message and certain configuration content using percent variables.
Note: For a table of WhatsUp Gold Alert Center specific variables, see the topic titled Alert Center Percent Variables (on page 858).
Important guidelines when using percent variables All percent variables in WhatsUp Gold are case sensitive. Use of percent variables in script text (for example, Active Script Action (on
page 191)) can expand to text containing special characters. For example ', ", %, [new line]. When unescaped, these literals can cause unexpected syntax or parsing errors, which break your script.
Active monitor variables are only used when an action is associated directly with an active monitor, and not the device as a whole.
When using percent variables as part of string literals in your PowerShell scripts, please use double quotation marks (" ") instead of single quotation marks (' ') to enclose the string literal. Example: $Message = "%Device.DisplayName changed state"
Active Monitor Variables Description
%ActiveMonitor.Argument SNMP instance number. This is only used when an action is associated directly with an active monitor, and not the device as a whole.
%ActiveMonitor.Comment String value that coincides with the comment(s) associated with the monitor. This is only used when an action is associated directly with an active monitor and not the device as a whole. Please note, in the case of interface active monitors, discovery uses this percent variable to automatically populate with the interface description.
%ActiveMonitor.Name
The name of the active monitor that fired an action. This is only used when an action is associated directly with an active monitor, and not the device as a whole.
%ActiveMonitor.NetworkInterfaceAddress IP address for the network interface. This is only used when an action is associated directly with an active monitor, and not the device as a whole.
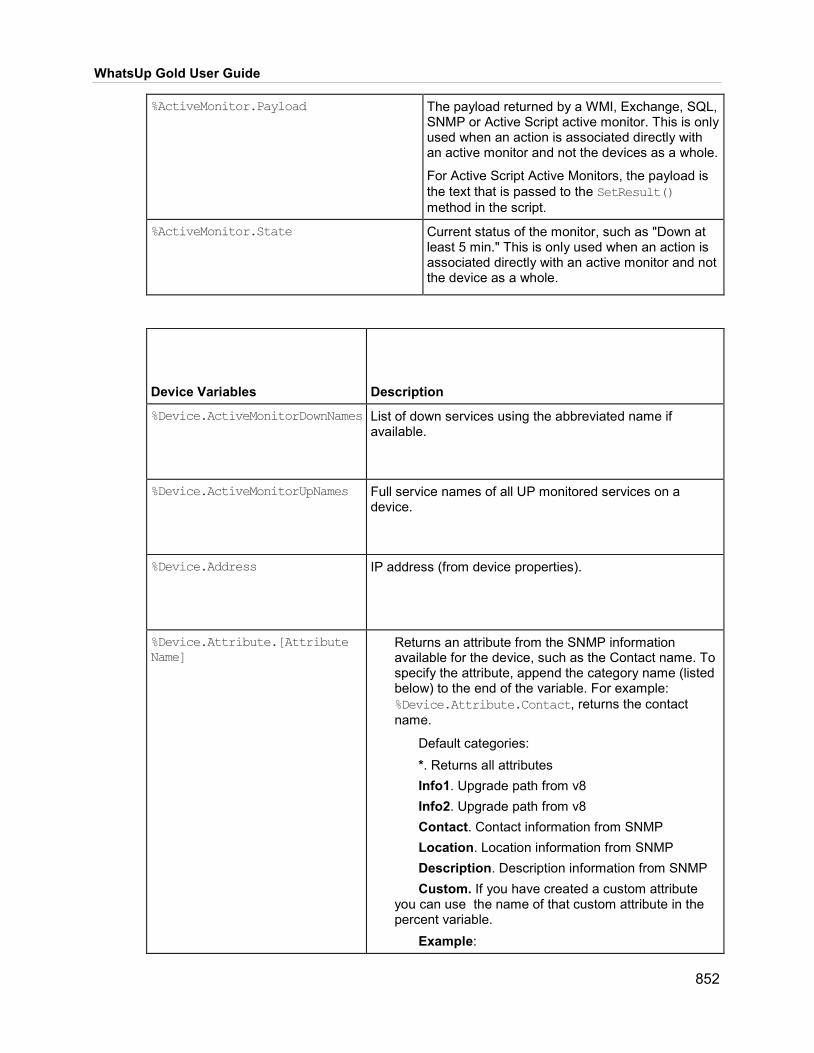
WhatsUp Gold User Guide
852
%ActiveMonitor.Payload The payload returned by a WMI, Exchange, SQL, SNMP or Active Script active monitor. This is only used when an action is associated directly with an active monitor and not the devices as a whole.
For Active Script Active Monitors, the payload is the text that is passed to the SetResult() method in the script.
%ActiveMonitor.State
Current status of the monitor, such as "Down at least 5 min." This is only used when an action is associated directly with an active monitor and not the device as a whole.
Device Variables Description
%Device.ActiveMonitorDownNames List of down services using the abbreviated name if available.
%Device.ActiveMonitorUpNames Full service names of all UP monitored services on a device.
%Device.Address IP address (from device properties).
%Device.Attribute.[Attribute Name]
Returns an attribute from the SNMP information available for the device, such as the Contact name. To specify the attribute, append the category name (listed below) to the end of the variable. For example: %Device.Attribute.Contact, returns the contact name.
Default categories: *. Returns all attributes Info1. Upgrade path from v8 Info2. Upgrade path from v8 Contact. Contact information from SNMP Location. Location information from SNMP Description. Description information from SNMP Custom. If you have created a custom attribute you can use the name of that custom attribute in the percent variable. Example:

WhatsUp Gold User Guide
853
%Device.Attribute.Phone %Device.Attribute.RackPosition
Tip: To avoid an parsing error, ensure you include a space or line break at the end of the entire embedded percent variable (in other words, after the attribute name).
%Device.DatabaseID Returns the database ID of a device.
%Device.DisplayName Display Name (from General of device properties)
%Device.HostName Host Name (from General of device properties)
%Device.Notes Notes. (Notes are from the device properties Notes)
%Device.SNMPOid SNMP Object identifier.
%Device.State Device status description (for example, "Down at least 2 min" or "Up at least 5 min")
%Device.Status This shows the name of the active monitor, preceded by the device state id.
Example:
10 | DNS.
Device State ID values:
0 = Not Started, 1 = Paused, 2 = Canceled, 3 = Running, 4 = Complete, 5 = Resolving Hostname, 6 = Looking for Type, 7 = Scanning for SNMP Credentials, 8 = Scanning for Windows Credentials, 9 = Device Detail Scan, 10 = Scanning Custom Monitors, 12 = Scanning Custom Monitors, 13 = Device VMWare Host Scan, 14 = Scanning SSH Credentials, 15 = Layer 2 Scan, 16 = Computing Layer 2 Topology, 17

WhatsUp Gold User Guide
854
= Wireless Scan, 18 = Scanning Network Interfaces, 19 = Checking for Duplicate Devices, 21 = Scanning for Known Addresses
%Device.Type Device Type (from General of device properties)
Passive Monitor Variables Description
%PassiveMonitor.DisplayName The name of the monitor as it appears in the Passive Monitor Library.
%PassiveMonitor.LoggedText Detailed Event description. (SNMP traps - Returns the full SNMP trap text.) (Windows Log Entries - Returns information contained in the Windows Event Log entries.) (Syslog Entries - Returns the text contained in the Syslog message.)
%PassiveMonitor.Payload.* Payload generated by a passive monitor.
%PassiveMonitor.Payload.EventType The type of passive monitor (Syslog, Windows Event, or SNMP Trap)
%PassiveMonitor.Payload.LogicalSource Shows the device's logical IP address.
%PassiveMonitor.Payload.PhysicalSource Shows the device's physical IP address.

WhatsUp Gold User Guide
855
System Variables Description
%System.Date The current system date. Configure the date format in Regional Options (from Program Options)
%System.DisplayNamesDownDevices Display names of devices with down monitors
%System.DisplayNamesDownMonitors
Shows the name of a device and each monitor that is down on that device. The format of the response is 'device name':'monitor 1','monitor 2','...'
Example: ARNOR: FTP, HTTPS, Ping
%System.DisplayNamesUpDevices Display names of up devices
%System.DisplayNamesUpMonitors Shows the name of a device and each monitor that is up on that device. The format of the response is 'device name':'monitor 1','monitor 2','...'
Example: ARNOR: FTP, HTTPS, Ping
%System.InstallDir Displays the directory on which WhatsUp Gold is installed
%System.NumberofDownDevices Number of down devices on your network
%System.NumberOfDownMonitors Shows the number of down monitors on your network
%System.NumberofUpDevices Number of up devices on your network
%System.NumberOfUpMonitors Shows the number of up monitors on your network
%System.Time The current system time. The format is hh:mm:ss
Discovery Percent Variables You can customize discovery, device role, and scheduled discovery information with the variables in the following tables. For more information about where you can use the discovery percent variables, see the Roles/Sub roles New/Edit Wizard (on page 62).

WhatsUp Gold User Guide
856
Device Discovery variables Description
%Discovery.Device.DeviceID Returns the device ID.
%Discovery.Device.Description Returns the device description information.
%Discovery.Device.Contact Returns the device contact information.
%Discovery.Device.Location Returns the device location information.
%Discovery.Device.Name Returns the device name information.
%Discovery.Device.OID Returns the device OID information.
%Discovery.Device.PrimaryRole Returns the device's primary role setting.
%Discovery.Device.Model Returns the device product model information.
%Discovery.Device.Brand Returns the device product brand information.
%Discovery.Device.OS Returns the device operating system information.
%Discovery.Device.OSVersion Returns the device operating system version.
%Discovery.Device.PhysicalAddress Returns the device MAC address.
%Discovery.Device.PhysicalAddressVendor Returns the device vendor name information.
%Discovery.Device.VMware.Host.Name Returns the VMware host name.
%Discovery.Device.VMware.Host.FullName Returns the full name of the VMware host.
%Discovery.Device.VMware.Host.OSType Returns the VMware host operating system information.
%Discovery.Device.VMware.Host.VIMVersion Returns the VMware virtual server version.
%Discovery.Device.VMware.Host.APIVersion Returns the VMware virtual server API version.
%Discovery.Device.VMware.Host.APIType Returns the VMware virtual server API type.
%Discovery.Device.VMware.Host.Build Returns the VMware virtual server build number.
%Discovery.Device.VMware.Host.BootTime Returns the VMware virtual server boot time.
%Discovery.Device.VMware.Host.HardwareVendor Returns the hardware vendor name
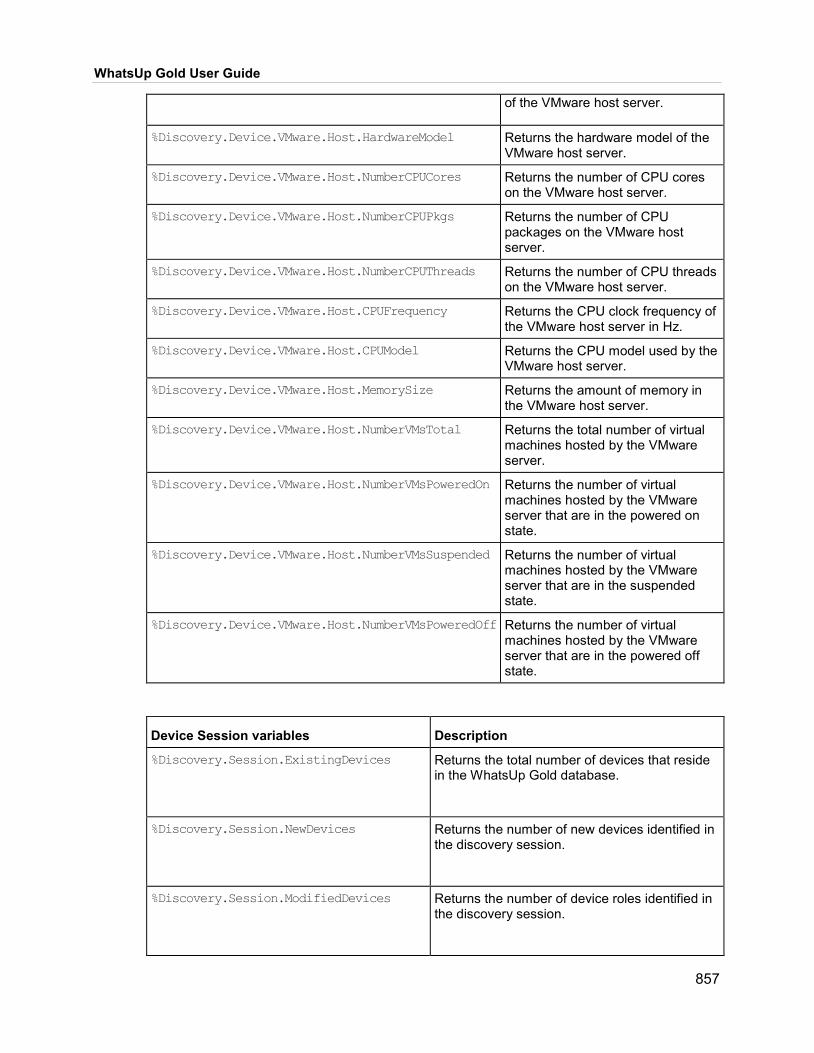
WhatsUp Gold User Guide
857
of the VMware host server.
%Discovery.Device.VMware.Host.HardwareModel Returns the hardware model of the VMware host server.
%Discovery.Device.VMware.Host.NumberCPUCores Returns the number of CPU cores on the VMware host server.
%Discovery.Device.VMware.Host.NumberCPUPkgs Returns the number of CPU packages on the VMware host server.
%Discovery.Device.VMware.Host.NumberCPUThreads Returns the number of CPU threads on the VMware host server.
%Discovery.Device.VMware.Host.CPUFrequency Returns the CPU clock frequency of the VMware host server in Hz.
%Discovery.Device.VMware.Host.CPUModel Returns the CPU model used by the VMware host server.
%Discovery.Device.VMware.Host.MemorySize Returns the amount of memory in the VMware host server.
%Discovery.Device.VMware.Host.NumberVMsTotal Returns the total number of virtual machines hosted by the VMware server.
%Discovery.Device.VMware.Host.NumberVMsPoweredOn Returns the number of virtual machines hosted by the VMware server that are in the powered on state.
%Discovery.Device.VMware.Host.NumberVMsSuspended Returns the number of virtual machines hosted by the VMware server that are in the suspended state.
%Discovery.Device.VMware.Host.NumberVMsPoweredOff Returns the number of virtual machines hosted by the VMware server that are in the powered off state.
Device Session variables Description
%Discovery.Session.ExistingDevices Returns the total number of devices that reside in the WhatsUp Gold database.
%Discovery.Session.NewDevices Returns the number of new devices identified in the discovery session.
%Discovery.Session.ModifiedDevices Returns the number of device roles identified in the discovery session.

WhatsUp Gold User Guide
858
%Discovery.Session.LicensedDevices Returns the number of devices WhatsUp Gold is licensed to manage.
%Discovery.Session.DiscoveredDevices Returns the total number of devices that needed to be refreshed do to pending and potential monitor assignments.
%Discovery.Session.StartDate Returns the discovery session starting date and time.
%Discovery.Session.EndDate Returns the discovery session ending date and time.
%Discovery.Session.ElapsedTime Returns the total discovery session scan time.
Alert Center Percent Variables The Email, SMS, and SMS Direct Actions can include three categories of percent variables in Alert Center notification message:
Threshold Notification Policy System
Use Alert Center percent variables in the Alert Center message body for SMS Direct and SMS action notifications, and in the subject line of Email notifications.
Threshold percent variables Name Description
%AlertCenter.Threshold.ID The threshold ID listed in the ProActiveAlert table.
%AlertCenter.Threshold.Name The threshold name.
%AlertCenter.Threshold.Description The threshold description.
%AlertCenter.Threshold.PollingInterval The threshold polling interval.
%AlertCenter.Threshold.TotalItems The total new new and current items out of threshold.
%AlertCenter.Threshold.TotalNewItems The total of newly alerted items.

WhatsUp Gold User Guide
859
%AlertCenter.Threshold.TotalCurrentItems The total of existing items out of threshold (not including new items).
%AlertCenter.Threshold.TotalMonitoredItems The count of items that can be evaluated in the threshold, i.e. there are 22 devices that have a Disk Performance Monitor configured.
%AlertCenter.Threshold.TotalAutoResolvedItems The number of items automatically resolved.
%AlertCenter.Threshold.NewItemNames The display name of each new item in an alert.
%AlertCenter.Threshold.CurrentItemNames The display name of each current item in an alert.
Notification policy percent variables Name Description
%AlertCenter.NotificationPolicy.ID The notification policy ID.
%AlertCenter.NotificationPolicy.Name The notification policy name.
%AlertCenter.NotificationPolicy.Description The notification policy description.
%AlertCenter.NotificationPolicy.Recipients The list of actions included in the policy.
%AlertCenter.NotificationPolicy.NextEscalationTime When the next step is to be sent.
%AlertCenter.NotificationPolicy.EscalationStep The current escalation step.
System percent variables Name Description
%System.Date The current system date.
%System.Time The current system time.
Setup Actions for Passive Monitors Select an action policy to use on the passive monitor or configure alerts specifically for the passive monitor. Configured alerts appear in the list, displaying the action type that fires, and the state change that triggers the action. You can assign more than one action to a passive monitor.
Configure the following:
Click Add to configure an action for the passive monitor.
Select a configured action and click Edit to change the configuration.
Select a configured action and click Remove to delete the action from the list. Removing the action from the list also deletes all records of the action/passive monitor association from the Action Log.
WhatsUp Gold User Guide
860
Monitoring Application Performance WhatsUp Gold allows you to monitor the performance of "applications" and application-layer services running on your monitored devices.
Application monitoring availability and performance can be shared and monitored using the Application Monitoring Dashboard and supporting logs.
Your ability to monitor applications is determined by your user rights. To view data on this dashboard, you must have the Access APM user right enabled. For the ability to actively manage profiles and instances, the Configure APM Application Profiles and Configure APM Instances options must be selected, respectively, as well.
Configure Monitors - Windows Event Log settings
Configure Windows Event Log Settings (SETTINGS > Passive Monitor Listeners [ Windows Event Log ]).
1 Configure the following: Start Listener. Select this option to enable Network Performance Monitor to
listen for Windows Event Log messages.
Do not generate payload. Select this option to only add the event time and message to the Windows Event Log; the payload is withheld from the entry.
Check connections interval. Specify the number of seconds to elapse between the points at which WhatsUp Gold poller checks for and closes inactive connections.
2 Click Save.
SNMP MIB Browser dialog Use this dialog to browse MIBs installed on your WhatsUp Gold system in the context of a specified computer or networked device.
If the target device is SNMP-enabled and is configured to use a selected MIB, you can use this dialog to select very specific information to be gathered on that device. This is a live MIB browser. Therefore, the selected device is polled as you browse and expand the MIB tree. If a portion of the MIB tree is not supported by the device, even though it is defined in the MIB file, it will not be shown on the tree and you should browse (...) for a device that is configured to use that section of the MIB tree.

WhatsUp Gold User Guide
861
In general, to use the MIB Browser, enter the IP address of the device you want to monitor in the Select counters from computer box. For example, if you are searching for a printer MIB, you should enter a printer's IP address.
Go to the Passive Monitor Library and create a new SNMP Trap. In the SNMP Passive Monitor Instance dialog, click browse (...).
To select a MIB from the SNMP MIB Browser: 1 Select the appropriate node from the MIB Tree list. After the MIB is selected, view
the available properties and values of that item in the right pane.
Note: A description of the MIB appears at the bottom of the dialog.
2 Select the specific property for which you want to monitor or collect statistics.
Note: After you select a specific property, the box at the bottom of the dialog shows a detailed description of the property. That description may contain a list of possible values for that property. The selected Object ID and Instance appear as well.
3 Click OK to save changes.
Passive Monitor Properties The Passive Monitor Properties option allows you to configure changes to passive monitors for multiple devices. If a selected device is not currently assigned to the monitor, no modifications are made to that device; only devices that are assigned to the active monitor are changed.
Configure the following:
Passive monitor types found in selected devices. Select a passive monitor type from the list. This list is populated with all passive monitor types associated with the selected devices.
Passive monitor found in selected devices. Select a passive monitor you want to modify.
Change action policy. Indicate whether you want to Add an action to policy or Remove action from policy.
Actions. Select an action to add to or remove from the selected devices.
Rescan Options Rescan options enable you to refine scanning behavior associated with certain active monitors including interface active monitors. These options are most useful when performing rescan on selected batches or groups of devices.
Update names for Interface Active Monitors

WhatsUp Gold User Guide
862
Label and description data generated during the scan (such as name data harvested from the discovery scan according to scan rules) will replace/refresh old labels and descriptions. Enable or disable Active Interface Monitors (Based on 'Configured' and
'Ready' State) This option is helpful for enabling or disabling active monitors on large switches in bulk. For switches with many physical interfaces/ports, selecting the option enables rescan to place Interface Monitors (a WhatsUp Gold active monitor type) in enabled state with the condition that the interface is administratively configured and ready. If the interface is not configured and ready, WhatsUp Gold brings active monitors to the disabled state. Apply 'Use in Rescan' options for Active Monitors Most active monitors such as FTP (on page 122) and SSH (on page 141) feature a Use in Rescan option (checkbox). Select Use in Rescan to apply this behavior for the current rescan. Deselect Use in Rescan to override it. The Use in Rescan option indicates to WhatsUp Gold that it should attempt to apply this active monitor when Discovery detects any new conditions (a new SSH endpoint, for example) that warrant it.
WhatsUp Gold adds the monitor type to the device during a rescan, which is launched using the Rescan button or action menu selection. For example:
Tip: you can check this monitor configuration setting for any of your monitors from the Monitors Library (on page 106).

WhatsUp Gold User Guide
863
CPU Threshold Managing CPU Thresholds:
From the Thresholds Library (on page 258) in the WhatsUp Gold Alert Center Libraries view, you can perform the following CPU Threshold operations.
. Create a new CPU Threshold.
From the WhatsUp Gold navigation menu: 1 Select SETTINGS menu > Alerts and Actions > Alert Center.
Alert Center Libraries view displays. 2 Click Thresholds Library panel (to expand it if collapsed).
The Thresholds Library displays.
3 On the Thresholds Library panel, click the "add" button ( ). The Select Threshold Type dialog displays.
4 Choose CPU Threshold and click OK. (This adds a new CPU Threshold to your library.) The New/Edit CPU Threshold Alert dialog displays. (Now, you must configure your CPU Threshold.)
5 Edit the CPU Threshold configuration.
. Adjust, tune, and configure an existing CPU Threshold.
To configure a CPU utilization threshold: 1 Configure the following: Name. Specify a name for the threshold. This name helps you identify the
threshold in the Threshold Library and displays as the report title on the Alert Center Home page.
Threshold. Select and enter the desired threshold criteria variables and values. The default threshold is configured to alert when CPU utilization exceeds 90% for more than 30 minutes.
Report per. Select CPU utilization threshold monitor method, device or CPU option.
Device. Select this option to calculate the threshold based on the average CPU load evaluated as a single device. Therefore, if the average CPU performance of a quad-core CPU (an average of all CPU performance combined) exceeds the threshold, then an alert is triggered.
CPU. Select this option to calculate the threshold based on individual CPU load for the selected device. Therefore, if one of the CPUs on a quad-core CPU exceeds the threshold, then an alert is triggered.
Devices to Monitor. Click Select to choose the devices to which the threshold applies. By default, the threshold monitors all devices on which the applicable monitor is enabled.

WhatsUp Gold User Guide
864
Notification. Select the notification policy to apply to this threshold. This policy begins sending notifications when an item is outside the configured threshold limits. If you do not see an appropriate threshold policy, or if the list is empty, click browse (...) to open the Notification Policy dialog and configure a new policy.
Tip: Notification policies are optional for most thresholds. Out of threshold items still appear on the Alert Center dashboard.
Threshold check. Enter a value for the threshold check interval, or the interval at which the Alert Center checks the Network Performance Monitor database to see if there are items that are out of the threshold's parameters.
Select Automatically resolve items no longer out of threshold to have Alert Center automatically resolve items when they go back inside the parameters of the threshold.
Note: Configure the threshold check interval for a longer time than the sampling interval for thresholds relating to trends, such as percent utilization. Configure it for a time the same as (or similar to) the sampling interval when configuring a threshold for a health check. Avoid setting the threshold check interval to a very short time, as this can degrade system performance. In general, setting the threshold check interval to less than five minutes is not advised.
2 Click OK to save the threshold settings.
. Clone a new CPU Threshold based on an existing CPU Threshold's configuration.
Clone a threshold based on a custom or built-in configuration: 1 Click on a threshold on the Thresholds Library panel you want to copy.
2 Click the Copy button, and click OK to create a new CPU Threshold. The Edit CPU Threshold dialog displays.
3 Save or customize your new threshold, either: Type in a new value for Name field (or keep the default) and click OK to save to
the Thresholds Library.
Follow the Edit CPU Threshold instructions.
. Remove CPU Threshold from library.
Delete an existing CPU Threshold: 1 Select CPU Threshold you want to delete from the CPU Threshold panel.
2 Click the Delete button, and then click Yes to confirm the deletion. The CPU Threshold configuration is deleted.

WhatsUp Gold User Guide
865
Custom Threshold Managing Custom Thresholds:
From the Thresholds Library (on page 258) in the WhatsUp Gold Alert Center Libraries view, you can perform the following Custom Threshold operations.
. Create a new Custom Threshold.
From the WhatsUp Gold navigation menu: 1 Select SETTINGS menu > Alerts and Actions > Alert Center.
Alert Center Libraries view displays. 2 Click Thresholds Library panel (to expand it if collapsed).
The Thresholds Library displays.
3 On the Thresholds Library panel, click the "add" button ( ). The Select Threshold Type dialog displays.
4 Choose Custom Threshold and click OK. (This adds a new Custom Threshold to your library.) The New/Edit Custom Threshold Alert dialog displays. (Now, you must configure your Custom Threshold.)
5 Edit the Custom Threshold configuration.
. Adjust, tune, and configure an existing Custom Threshold.
To configure a custom performance monitor threshold: 1 Configure the following: Name. Specify a name for the threshold. This name helps you identify the
threshold in the Threshold library and displays as the report title on the Alert Center Home page.
Show. Select either Global Monitors or Device Specific Monitors for the custom performance monitor type that you choose.
Custom performance monitor type. Select the custom performance monitor type from the menu. Select APC UPS, Printer, Active Script, SNMP, or WMI.
Monitor. The configured monitors of the selected type. These are the monitors used to determine if the measured parameters have dropped below or exceeded threshold limits.
Note: When you select Global Monitors, this list is populated with custom performance monitors currently configured in the Monitor Library. When you select Device Specific Monitors, this list is populated with custom performance monitors currently configured for specific devices.
Threshold. Select and enter the desired threshold criteria variables and values. The default threshold is configured to alert when the custom performance monitor average value exceeds 10 for 30 minutes.

WhatsUp Gold User Guide
866
Devices to Monitor. Click Select to choose the devices to which the threshold applies. By default, the threshold applies to all devices where the applicable monitor is enabled.
Notification. Select the notification policy to apply to this threshold. This policy begins sending notifications when an item is outside the configured threshold limits. If you do not see an appropriate threshold policy, or if the list is empty, click browse (...) to open the Notification Policy dialog and configure a new policy.
Tip: Notification policies are optional for most thresholds. Out of threshold items still appear on the Alert Center dashboard.
Threshold Check. Enter a value for the threshold check interval, or the interval at which the Alert Center checks the WhatsUp Gold database to see if there are items that are outside the threshold parameters.
Select Automatically resolve items no longer out of threshold to have Alert Center automatically resolve items when they go back inside the parameters of the threshold.
Note: Configure the threshold check interval for a longer time than the sampling interval for thresholds relating to trends, such as percent utilization. Configure it for a time the same as (or similar to) the sampling interval when configuring a threshold for a health check. Avoid setting the threshold check interval to a very short time, as this can degrade system performance. In general, setting the threshold check interval to less than five minutes is not advised.
2 Click OK to save the threshold settings.
. Clone a new Custom Threshold based on an existing Custom Threshold's configuration.
Clone a threshold based on a custom or built-in configuration: 1 Click on a threshold on the Thresholds Library panel you want to copy.
2 Click the Copy button, and click OK to create a new Custom Threshold. The Edit Custom Threshold dialog displays.
3 Save or customize your new threshold, either: Type in a new value for Name field (or keep the default) and click OK to save to
the Thresholds Library.
Follow the Edit Custom Threshold instructions.
. Remove Custom Threshold from library.
Delete an existing Custom Threshold: 1 Select Custom Threshold you want to delete from the Custom Threshold panel.

WhatsUp Gold User Guide
867
2 Click the Delete button, and then click Yes to confirm the deletion. The Custom Threshold configuration is deleted.
Disk Threshold Managing Disk Thresholds:
From the Thresholds Library (on page 258) in the WhatsUp Gold Alert Center Libraries view, you can perform the following Disk Threshold operations.
Add. Create a new threshold.
From the WhatsUp Gold navigation menu: 1 Select SETTINGS menu > Alerts and Actions > Alert Center.
Alert Center Libraries view displays. 2 Click Thresholds Library panel (to expand it if collapsed).
The Thresholds Library displays.
3 On the Thresholds Library panel, click the "add" button ( ). The Select Threshold Type dialog displays.
4 Choose Disk Threshold and click OK. (This adds a new Disk Threshold to your library.) The New/Edit Disk Threshold Alert dialog displays. (Now, you must configure your Disk Threshold.)
5 Edit the Disk Threshold configuration.
Edit. Adjust, tune, and configure an existing threshold.
Through this data stream, you can monitor and report on the available disk space for the selected device. Data collected is displayed in the Disk Utilization Report.
Configure the following:
Protocol. Select SNMP or WMI (which includes volume mount points) as the protocol for which you want to use to monitor the disk. Make sure that you have credentials set up for the protocol you select. For more information, see Using Credentials.
Collect data for. Select which disk you want to gather data on. If you select All Disks from the pull-down menu, all items in the list are selected automatically.
Advanced. Click to access Data Collection Advanced Settings. Data collection interval. Enter how often you want data to be collected for the
selected item or items. This number represents the number of minutes between each collection.
OK. Click to save your changes.

WhatsUp Gold User Guide
868
Copy. Clone a new threshold based on an existing threshold's configuration.
Clone a threshold based on a custom or built-in configuration: 1 Click on a threshold on the Thresholds Library panel you want to copy.
2 Click the Copy button, and click OK to create a new Disk Threshold. The Edit Disk Threshold dialog displays.
3 Save or customize your new threshold, either: Type in a new value for Name field (or keep the default) and click OK to save to
the Thresholds Library.
Follow the Edit Disk Threshold instructions.
Delete. Clone and customize existing threshold.
Delete an existing Disk Threshold: 1 Select Disk Threshold you want to delete from the Disk Threshold panel.
2 Click the Delete button, and then click Yes to confirm the deletion. The Disk Threshold configuration is deleted.
Interface Threshold Managing Interface Thresholds:
From the Thresholds Library (on page 258) in the WhatsUp Gold Alert Center Libraries view, you can perform the following Interface Threshold operations.
. Create a new Interface Threshold.
From the WhatsUp Gold navigation menu: 1 Select SETTINGS menu > Alerts and Actions > Alert Center.
Alert Center Libraries view displays. 2 Click Thresholds Library panel (to expand it if collapsed).
The Thresholds Library displays.
3 On the Thresholds Library panel, click the "add" button ( ). The Select Threshold Type dialog displays.
4 Choose Interface Threshold and click OK. (This adds a new Interface Threshold to your library.) The New/Edit Interface Threshold Alert dialog displays. (Now, you must configure your Interface Threshold.)
5 Edit the Interface Threshold configuration.
. Adjust, tune, and configure an existing Interface Threshold.
To configure an interface utilization threshold: 1 Configure the following:

WhatsUp Gold User Guide
869
Name. Specify a name for the threshold. This name helps you identify the threshold in the Threshold library and displays as the report title on the Alert Center Home page.
Threshold. Select and enter the threshold criteria variables and values. The default threshold is configured to alert when inbound or outbound utilization exceeds 90% for more than 60 minutes.
Devices to Monitor. Click Select to choose the devices to which the threshold applies. By default, the threshold monitors all devices where the applicable monitor is enabled.
Notification. Select the notification policy you would like to apply to this threshold. This policy kicks off when an item falls out of the threshold you configure above. If you do not see an appropriate threshold policy, or if the list is empty, browse (...) to the Notification Policy dialog to configure a new policy.
Note: Notification policies are optional for most thresholds. If you do not select a notification policy, no notifications are generated for the threshold, but a dashboard report listing the out of threshold items still appears on the Alert Center Home page.
Threshold check. Enter a value for the threshold check interval, or the interval at which the Alert Center checks the Network Performance Monitor database to see if there are items that are out of the threshold's parameters.
Select Automatically resolve items no longer out of threshold to have Alert Center automatically resolve items when they go back inside the parameters of the threshold.
Note: Configure the threshold check interval for a longer time than the sampling interval for thresholds relating to trends, such as percent utilization. Configure it for a time the same as (or similar to) the sampling interval when configuring a threshold for a health check. Avoid setting the threshold check interval to a very short time, as this can degrade system performance. In general, setting the threshold check interval to less than five minutes is not advised.
2 Click OK to save the threshold settings.
. Clone a new Interface Threshold based on an existing Interface Threshold's configuration.
Clone a threshold based on a custom or built-in configuration: 1 Click on a threshold on the Thresholds Library panel you want to copy.
2 Click the Copy button, and click OK to create a new Interface Threshold. The Edit Interface Threshold dialog displays.
3 Save or customize your new threshold, either:

WhatsUp Gold User Guide
870
Type in a new value for Name field (or keep the default) and click OK to save to the Thresholds Library.
Follow the Edit Interface Threshold instructions.
. Remove Interface Threshold from library.
Delete an existing Interface Threshold: 1 Select Interface Threshold you want to delete from the Interface Threshold panel.
2 Click the Delete button, and then click Yes to confirm the deletion. The Interface Threshold configuration is deleted.
Interface Errors and Discard Threshold Managing Interface Errors and Discard Thresholds:
From the Thresholds Library (on page 258) in the WhatsUp Gold Alert Center Libraries view, you can perform the following Interface Errors and Discard Threshold operations.
Add. Create a new threshold.
From the WhatsUp Gold navigation menu: 1 Select SETTINGS menu > Alerts and Actions > Alert Center.
Alert Center Libraries view displays. 2 Click Thresholds Library panel (to expand it if collapsed).
The Thresholds Library displays.
3 On the Thresholds Library panel, click the "add" button ( ). The Select Threshold Type dialog displays.
4 Choose Interface Errors and Discard Threshold and click OK. (This adds a new Interface Errors and Discard Threshold to your library.) The New/Edit Interface Errors and Discard Threshold Alert dialog displays. (Now, you must configure your Interface Errors and Discard Threshold.)
5 Edit the Interface Errors and Discard Threshold configuration.
Edit. Adjust, tune, and configure an existing threshold.
To configure an interface errors and discards threshold: 1 Configure the following: Name. Specify a name for the threshold. This name helps you identify the
threshold in the Threshold library and displays as the report title on the Alert Center Home page.
Threshold. Select and enter the threshold criteria variables and values. You can choose to create a threshold based on discards, errors, or a combination of the two. The default threshold is configured to alert when inbound or outbound interface utilization exceeds 100 discards per minute for more than 20 minutes.

WhatsUp Gold User Guide
871
- and / or - when errors for inbound or outbound interface utilization exceeds 100 errors per minute for more than 20 minutes.
Tip: Notification policies are optional for most thresholds. Out of threshold items still appear on the Alert Center dashboard.
Devices to Monitor. Click Select to choose the devices to which the threshold applies. By default, the threshold monitors all devices where the applicable monitor is enabled.
Notification. Select the notification policy to apply to this threshold. This policy begins sending notifications when an item is outside the configured threshold limits. If you do not see an appropriate threshold policy, or if the list is empty, click browse (...) to open the Notification Policy dialog and configure a new policy.
Tip: Notification policies are optional for most thresholds. Out of threshold items still appear on the Alert Center dashboard.
Threshold check. Enter a value for the threshold check interval, or the interval at which the Alert Center checks the Network Performance Monitor database to see if there are items that are outside the threshold parameters. The default threshold check is 10 minutes.
Select Automatically resolve items no longer out of threshold to have Alert Center automatically resolve items when they go back inside the parameters of the threshold.
Note: Configure the threshold check interval for a longer time than the sampling interval for thresholds relating to trends, such as percent utilization. Configure it for a time the same as (or similar to) the sampling interval when configuring a threshold for a health check. Avoid setting the threshold check interval to a very short time, as this can degrade system performance. In general, setting the threshold check interval to less than five minutes is not advised.
2 Click OK to save the threshold settings.
Copy. Clone a new threshold based on an existing threshold's configuration.
Clone a threshold based on a custom or built-in configuration: 1 Click on a threshold on the Thresholds Library panel you want to copy.
2 Click the Copy button, and click OK to create a new Interface Errors and Discard Threshold. The Edit Interface Errors and Discard Threshold dialog displays.
3 Save or customize your new threshold, either:

WhatsUp Gold User Guide
872
Type in a new value for Name field (or keep the default) and click OK to save to the Thresholds Library.
Follow the Edit Interface Errors and Discard Threshold instructions.
Delete. Clone and customize existing threshold.
Delete an existing Interface Errors and Discard Threshold: 1 Select Interface Errors and Discard Threshold you want to delete from the
Interface Errors and Discard Threshold panel.
2 Click the Delete button, and then click Yes to confirm the deletion. The Interface Errors and Discard Threshold configuration is deleted.
Memory Threshold Managing Memory Thresholds:
From the Thresholds Library (on page 258) in the WhatsUp Gold Alert Center Libraries view, you can perform the following Memory Threshold operations.
Add. Create a new threshold.
From the WhatsUp Gold navigation menu: 1 Select SETTINGS menu > Alerts and Actions > Alert Center.
Alert Center Libraries view displays. 2 Click Thresholds Library panel (to expand it if collapsed).
The Thresholds Library displays.
3 On the Thresholds Library panel, click the "add" button ( ). The Select Threshold Type dialog displays.
4 Choose Memory Threshold and click OK. (This adds a new Memory Threshold to your library.) The New/Edit Memory Threshold Alert dialog displays. (Now, you must configure your Memory Threshold.)
5 Edit the Memory Threshold configuration.
Edit. Adjust, tune, and configure an existing threshold.
To configure a memory utilization threshold: 1 Configure the following: Name. Specify a name for the threshold. This name helps you identify the
threshold in the Threshold library and displays as the report title on the Alert Center Home page.
Threshold. Select and enter the desired threshold criteria variables and values. The default threshold is configured to alert when disk utilization exceeds 95% for more than 1 hour.

WhatsUp Gold User Guide
873
Devices to Monitor. Click Select to choose the devices to which the threshold applies. By default, the threshold monitors all devices on which the applicable monitor is enabled.
Notification. Select the notification policy to apply to this threshold. This policy begins sending notifications when an item is outside the configured threshold limits. If you do not see an appropriate threshold policy, or if the list is empty, click browse (...) to open the Notification Policy dialog and configure a new policy.
Note: Notification policies are optional for most thresholds. If you do not select a notification policy, no notifications are generated for the threshold, but a dashboard report listing the out of threshold items still appears on the Alert Center Home page.
Threshold check. Enter a value for the threshold check interval, or the interval at which the Alert Center checks the Network Performance Monitor database to see if there are items that are outside the threshold parameters. Select Automatically resolve items no longer out of threshold to have Alert Center automatically resolve items when they go back inside the parameters of the threshold.
Note: Configure the threshold check interval for a longer time than the sampling interval for thresholds relating to trends, such as percent utilization. Configure it for a time the same as (or similar to) the sampling interval when configuring a threshold for a health check. Avoid setting the threshold check interval to a very short time, as this can degrade system performance. In general, setting the threshold check interval to less than five minutes is not advised.
2 Click OK to save the threshold settings.
Copy. Clone a new threshold based on an existing threshold's configuration.
Clone a threshold based on a custom or built-in configuration: 1 Click on a threshold on the Thresholds Library panel you want to copy.
2 Click the Copy button, and click OK to create a new Memory Threshold. The Edit Memory Threshold dialog displays.
3 Save or customize your new threshold, either: Type in a new value for Name field (or keep the default) and click OK to save to
the Thresholds Library.
Follow the Edit Memory Threshold instructions.

WhatsUp Gold User Guide
874
Delete. Clone and customize existing threshold.
Delete an existing Memory Threshold: 1 Select Memory Threshold you want to delete from the Memory Threshold panel.
2 Click the Delete button, and then click Yes to confirm the deletion. The Memory Threshold configuration is deleted.
Ping Availability Threshold Managing Ping Availability Thresholds:
From the Thresholds Library (on page 258) in the WhatsUp Gold Alert Center Libraries view, you can perform the following Ping Availability Threshold operations.
. Create a new Ping Availability Threshold.
From the WhatsUp Gold navigation menu: 1 Select SETTINGS menu > Alerts and Actions > Alert Center.
Alert Center Libraries view displays. 2 Click Thresholds Library panel (to expand it if collapsed).
The Thresholds Library displays.
3 On the Thresholds Library panel, click the "add" button ( ). The Select Threshold Type dialog displays.
4 Choose Ping Availability Threshold and click OK. (This adds a new Ping Availability Threshold to your library.) The New/Edit Ping Availability Threshold Alert dialog displays. (Now, you must configure your Ping Availability Threshold.)
5 Edit the Ping Availability Threshold configuration.
. Adjust, tune, and configure an existing Ping Availability Threshold.
To configure a ping availability threshold: 1 Configure the following: Name. Specify a name for the threshold. This name helps you identify the
threshold in the Threshold library and displays as the report title on the Alert Center Home page.
Threshold. Select and enter the desired threshold criteria variables and values. The default threshold is configured to alert when ping availability average falls below 95% for more than 30 minutes.
Devices to Monitor. Click Select to choose the devices to which the threshold applies. By default, the threshold monitors all devices on which the applicable monitor is enabled.
Notification. Select the notification policy to apply to this threshold. This policy begins sending notifications when an item is outside the configured threshold

WhatsUp Gold User Guide
875
limits. If you do not see an appropriate threshold policy, or if the list is empty, click browse (...) to open the Notification Policy dialog and configure a new policy.
Tip: Notification policies are optional for most thresholds. Out of threshold items still appear on the Alert Center dashboard.
Threshold Check. Enter a value for the threshold check interval, or the interval at which the Alert Center checks the Network Performance Monitor database to see if there are items that are out of the threshold's parameters.
Select Automatically resolve items no longer out of threshold to have Alert Center automatically resolve items when they go back inside the parameters of the threshold.
Note: Configure the threshold check interval for a longer time than the sampling interval for thresholds relating to trends, such as percent utilization. Configure it for a time the same as (or similar to) the sampling interval when configuring a threshold for a health check. Avoid setting the threshold check interval to a very short time, as this can degrade system performance. In general, setting the threshold check interval to less than five minutes is not advised.
2 Click OK to save the threshold settings.
. Clone a new Ping Availability Threshold based on an existing Ping Availability Threshold's configuration.
Clone a threshold based on a custom or built-in configuration: 1 Click on a threshold on the Thresholds Library panel you want to copy.
2 Click the Copy button, and click OK to create a new Ping Availability Threshold. The Edit Ping Availability Threshold dialog displays.
3 Save or customize your new threshold, either: Type in a new value for Name field (or keep the default) and click OK to save to
the Thresholds Library.
Follow the Edit Ping Availability Threshold instructions.
. Remove Ping Availability Threshold from library.
Delete an existing Ping Availability Threshold: 1 Select Ping Availability Threshold you want to delete from the Ping Availability
Threshold panel.
2 Click the Delete button, and then click Yes to confirm the deletion. The Ping Availability Threshold configuration is deleted.

WhatsUp Gold User Guide
876
Ping Response Time Threshold Managing Ping Response Time Thresholds:
From the Thresholds Library (on page 258) in the WhatsUp Gold Alert Center Libraries view, you can perform the following Ping Response Time Threshold operations.
. Create a new Ping Response Time Threshold.
From the WhatsUp Gold navigation menu: 1 Select SETTINGS menu > Alerts and Actions > Alert Center.
Alert Center Libraries view displays. 2 Click Thresholds Library panel (to expand it if collapsed).
The Thresholds Library displays.
3 On the Thresholds Library panel, click the "add" button ( ). The Select Threshold Type dialog displays.
4 Choose Ping Response Time Threshold and click OK. (This adds a new Ping Response Time Threshold to your library.) The New/Edit Ping Response Time Threshold Alert dialog displays. (Now, you must configure your Ping Response Time Threshold.)
5 Edit the Ping Response Time Threshold configuration.
. Adjust, tune, and configure an existing Ping Response Time Threshold.
To configure a ping response time threshold: 1 Configure the following: Name. Specify a name for the threshold. This name helps you identify the
threshold in the Threshold library and displays as the report title on the Alert Center Home page.
Threshold. Select and enter the desired threshold criteria variables and values. The default threshold is configured to alert when ping response time average exceeds 2 ms for more than 30 minutes.
Devices to Monitor. Click Select to choose the devices to which the threshold applies. By default, the threshold monitors all devices on which the applicable monitor is enabled.
Notification. Select the notification policy to apply to this threshold. This policy begins sending notifications when an item is outside the configured threshold limits. If you do not see an appropriate threshold policy, or if the list is empty, click browse (...) to open the Notification Policy dialog and configure a new policy.
Tip: Notification policies are optional for most thresholds. Out of threshold items still appear on the Alert Center dashboard.

WhatsUp Gold User Guide
877
Threshold check. Enter a value for the threshold check interval, or the interval at which the Alert Center checks the Network Performance Monitor database to see if there are items that are outside the threshold parameters.
Select Automatically resolve items no longer out of threshold to have Alert Center automatically resolve items when they go back inside the parameters of the threshold.
Note: Configure the threshold check interval for a longer time than the sampling interval for thresholds relating to trends, such as percent utilization. Configure it for a time the same as (or similar to) the sampling interval when configuring a threshold for a health check. Avoid setting the threshold check interval to a very short time, as this can degrade system performance. In general, setting the threshold check interval to less than five minutes is not advised.
2 Click OK to save the threshold settings.
. Clone a new Ping Response Time Threshold based on an existing Ping Response Time Threshold's configuration.
Clone a threshold based on a custom or built-in configuration: 1 Click on a threshold on the Thresholds Library panel you want to copy.
2 Click the Copy button, and click OK to create a new Ping Response Time Threshold. The Edit Ping Response Time Threshold dialog displays.
3 Save or customize your new threshold, either: Type in a new value for Name field (or keep the default) and click OK to save to
the Thresholds Library.
Follow the Edit Ping Response Time Threshold instructions.
. Remove Ping Response Time Threshold from library.
Delete an existing Ping Response Time Threshold: 1 Select Ping Response Time Threshold you want to delete from the Ping Response
Time Threshold panel.
2 Click the Delete button, and then click Yes to confirm the deletion. The Ping Response Time Threshold configuration is deleted.
Windows Event Log Threshold Managing Windows Event Log Thresholds:
From the Thresholds Library (on page 258) in the WhatsUp Gold Alert Center Libraries view, you can perform the following Windows Event Log Threshold operations.

WhatsUp Gold User Guide
878
. Create a new Windows Event Log Threshold.
From the WhatsUp Gold navigation menu: 1 Select SETTINGS menu > Alerts and Actions > Alert Center.
Alert Center Libraries view displays. 2 Click Thresholds Library panel (to expand it if collapsed).
The Thresholds Library displays.
3 On the Thresholds Library panel, click the "add" button ( ). The Select Threshold Type dialog displays.
4 Choose Windows Event Log Threshold and click OK. (This adds a new Windows Event Log Threshold to your library.) The New/Edit Windows Event Log Threshold Alert dialog displays. (Now, you must configure your Windows Event Log Threshold.)
5 Edit the Windows Event Log Threshold configuration.
. Adjust, tune, and configure an existing Windows Event Log Threshold.
To configure a Windows Event Log threshold: 1 Configure the following: Name. Specify a name for the threshold. This name helps you identify the
threshold in the Threshold library and displays as the report title on the Alert Center Home page.
Windows event type. Select the Windows Event Log monitor to use with this threshold. The list is populated with Windows Event Log monitors currently configured in the Passive Monitor Library.
Threshold. Select and enter the desired threshold criteria variables and values. The default threshold is configured to alert when the number of events exceeds 500 in the past 60 minutes.
Devices to Monitor. Click Select to choose the devices to which the threshold applies. By default, the threshold monitors all devices on which the applicable monitor is enabled.
Notification. Select the notification policy to apply to this threshold. This policy begins sending notifications when an item is outside the configured threshold limits. If you do not see an appropriate threshold policy, or if the list is empty, click browse (...) to open the Notification Policy dialog and configure a new policy.
Note: Notification policies are optional for most thresholds. If you do not select a notification policy, no notifications are generated for the threshold, but a dashboard report listing the out of threshold items still appears on the Alert Center Home page.
Threshold check. Enter a value for the threshold check interval, or the interval at which the Alert Center checks the Network Performance Monitor database to see if there are items that are outside the threshold parameters.

WhatsUp Gold User Guide
879
Note: Configure the threshold check interval for a longer time than the sampling interval for thresholds relating to trends, such as percent utilization. Configure it for a time the same as (or similar to) the sampling interval when configuring a threshold for a health check. Avoid setting the threshold check interval to a very short time, as this can degrade system performance. In general, setting the threshold check interval to less than five minutes is not advised.
Select Automatically resolve items no longer out of threshold to have Alert Center automatically resolve items when they go back inside the parameters of the threshold.
2 Click OK to save the threshold settings.
. Clone a new Windows Event Log Threshold based on an existing Windows Event Log Threshold's configuration.
Clone a threshold based on a custom or built-in configuration: 1 Click on a threshold on the Thresholds Library panel you want to copy.
2 Click the Copy button, and click OK to create a new Windows Event Log Threshold. The Edit Windows Event Log Threshold dialog displays.
3 Save or customize your new threshold, either: Type in a new value for Name field (or keep the default) and click OK to save to
the Thresholds Library.
Follow the Edit Windows Event Log Threshold instructions.
. Remove Windows Event Log Threshold from library.
Delete an existing Windows Event Log Threshold: 1 Select Windows Event Log Threshold you want to delete from the Windows Event
Log Threshold panel.
2 Click the Delete button, and then click Yes to confirm the deletion. The Windows Event Log Threshold configuration is deleted.
SNMP Trap Threshold Managing SNMP Trap Thresholds:
From the Thresholds Library (on page 258) in the WhatsUp Gold Alert Center Libraries view, you can perform the following SNMP Trap Threshold operations.

WhatsUp Gold User Guide
880
Add. Create a new threshold.
From the WhatsUp Gold navigation menu: 1 Select SETTINGS menu > Alerts and Actions > Alert Center.
Alert Center Libraries view displays. 2 Click Thresholds Library panel (to expand it if collapsed).
The Thresholds Library displays.
3 On the Thresholds Library panel, click the "add" button ( ). The Select Threshold Type dialog displays.
4 Choose SNMP Trap Threshold and click OK. (This adds a new SNMP Trap Threshold to your library.) The New/Edit SNMP Trap Threshold Alert dialog displays. (Now, you must configure your SNMP Trap Threshold.)
5 Edit the SNMP Trap Threshold configuration.
Edit. Adjust, tune, and configure an existing threshold.
To configure an SNMP trap threshold: 1 Configure the following: Name. Specify a name for the threshold. This name helps you identify the
threshold in the Threshold library and displays as the report title on the Alert Center Home page.
SNMP Trap type. Select the SNMP trap type from the list that you want to associate with this threshold.The list is populated with SNMP traps currently configured in the Passive Monitor Library.
Threshold. Select and enter the desired threshold criteria variables and values. The default threshold is configured to alert when the number of traps exceeds 500 in the past 60 minutes.
Devices to Monitor. Click Select to choose the devices to which the threshold applies. By default, the threshold monitors all devices on which the applicable monitor is enabled.
Notification. Select the notification policy to apply to this threshold. This policy begins sending notifications when an item is outside the configured threshold limits. If you do not see an appropriate threshold policy, or if the list is empty, click browse (...) to open the Notification Policy dialog and configure a new policy.
Note: Notification policies are optional for most thresholds. If you do not select a notification policy, no notifications are generated for the threshold, but a dashboard report listing the out of threshold items still appears on the Alert Center Home page.
Threshold check. Enter a value for the threshold check interval, or the interval at which the Alert Center checks the Network Performance Monitor database to see if there are items that are outside the threshold parameters. By default, the threshold check is set to every five minutes.

WhatsUp Gold User Guide
881
Select Automatically resolve items no longer out of threshold to have Alert Center automatically resolve items when they go back inside the parameters of the threshold.
Note: Configure the threshold check interval for a longer time than the sampling interval for thresholds relating to trends, such as percent utilization. Configure it for a time the same as (or similar to) the sampling interval when configuring a threshold for a health check. Avoid setting the threshold check interval to a very short time, as this can degrade system performance. In general, setting the threshold check interval to less than five minutes is not advised.
2 Click OK to save the threshold settings.
Copy. Clone a new threshold based on an existing threshold's configuration.
Clone a threshold based on a custom or built-in configuration: 1 Click on a threshold on the Thresholds Library panel you want to copy.
2 Click the Copy button, and click OK to create a new SNMP Trap Threshold. The Edit SNMP Trap Threshold dialog displays.
3 Save or customize your new threshold, either: Type in a new value for Name field (or keep the default) and click OK to save to
the Thresholds Library.
Follow the Edit SNMP Trap Threshold instructions.
Delete. Clone and customize existing threshold.
Delete an existing SNMP Trap Threshold: 1 Select SNMP Trap Threshold you want to delete from the SNMP Trap Threshold
panel.
2 Click the Delete button, and then click Yes to confirm the deletion. The SNMP Trap Threshold configuration is deleted.
Syslog Threshold Managing Syslog Thresholds:
From the Thresholds Library (on page 258) in the WhatsUp Gold Alert Center Libraries view, you can perform the following Syslog Threshold operations.
Add. Create a new threshold.
From the WhatsUp Gold navigation menu: 1 Select SETTINGS menu > Alerts and Actions > Alert Center.

WhatsUp Gold User Guide
882
Alert Center Libraries view displays. 2 Click Thresholds Library panel (to expand it if collapsed).
The Thresholds Library displays.
3 On the Thresholds Library panel, click the "add" button ( ). The Select Threshold Type dialog displays.
4 Choose Syslog Threshold and click OK. (This adds a new Syslog Threshold to your library.) The New/Edit Syslog Threshold Alert dialog displays. (Now, you must configure your Syslog Threshold.)
5 Edit the Syslog Threshold configuration.
Edit. Adjust, tune, and configure an existing threshold.
To configure a Syslog threshold: 1 Configure the following: Name. Specify a name for the threshold. This name helps you identify the
threshold in the Threshold library and displays as the report title on the Alert Center Home page.
Syslog type. Select the Syslog monitor to use with the threshold. This list is populated with Syslog monitors currently configured in the Passive Monitor Library.
Threshold. Select and enter the desired threshold criteria variables and values. The default threshold is configured to alert when the number of messages exceeds 500 in the past 60 minutes.
Devices to Monitor. Click Select to choose the devices to which the threshold applies. By default, the threshold monitors all devices on which the applicable monitor is enabled.
Notification. Select the notification policy to apply to this threshold. This policy begins sending notifications when an item is outside the configured threshold limits. If you do not see an appropriate threshold policy, or if the list is empty, click browse (...) to open the Notification Policy dialog and configure a new policy.
Note: Notification policies are optional for most thresholds. If you do not select a notification policy, no notifications are generated for the threshold, but a dashboard report listing the out of threshold items still appears on the Alert Center Home page.
Threshold check. Enter a value for the threshold check interval, or the interval at which the Alert Center checks the Network Performance Monitor database to see if there are items that are outside the threshold parameters.
Select Automatically resolve items no longer out of threshold to have Alert Center automatically resolve items when they go back inside the parameters of the threshold.

WhatsUp Gold User Guide
883
Note: Configure the threshold check interval for a longer time than the sampling interval for thresholds relating to trends, such as percent utilization. Configure it for a time the same as (or similar to) the sampling interval when configuring a threshold for a health check. Avoid setting the threshold check interval to a very short time, as this can degrade system performance. In general, setting the threshold check interval to less than five minutes is not advised.
2 Click OK to save the threshold settings.
Copy. Clone a new threshold based on an existing threshold's configuration.
Clone a threshold based on a custom or built-in configuration: 1 Click on a threshold on the Thresholds Library panel you want to copy.
2 Click the Copy button, and click OK to create a new Syslog Threshold. The Edit Syslog Threshold dialog displays.
3 Save or customize your new threshold, either: Type in a new value for Name field (or keep the default) and click OK to save to
the Thresholds Library.
Follow the Edit Syslog Threshold instructions.
Delete. Clone and customize existing threshold.
Delete an existing Syslog Threshold: 1 Select Syslog Threshold you want to delete from the Syslog Threshold panel.
2 Click the Delete button, and then click Yes to confirm the deletion. The Syslog Threshold configuration is deleted.
Hyper-V Event Threshold Managing Hyper-V Event Thresholds:
From the Thresholds Library (on page 258) in the WhatsUp Gold Alert Center Libraries view, you can perform the following Hyper-V Event Threshold operations.
. Create a new Hyper-V Event Threshold.
From the WhatsUp Gold navigation menu: 1 Select the Settings tab, select Alerts and Actions and choose Alert Center.
Alert Center Libraries view displays. 2 Click the Hyper-V Event Threshold panel (if collapsed).

WhatsUp Gold User Guide
884
The Hyper-V Event Threshold displays.
3 On the Hyper-V Event Threshold panel, click "add" ( ). The Select Hyper-V Event Threshold Type dialog displays.
4 Choose Hyper-V Event Threshold and click OK. The Configure Threshold Alert dialog displays.
5 Edit the Hyper-V Event Threshold configuration.
. Adjust, tune, and configure an existing Hyper-V Event Threshold.
Edit Hyper-V Event Threshold configuration.
From the Hyper-V Event Threshold dialog:
1 Enter or choose the following: Name. Enter a name for the Hyper-V threshold.
Hyper-V Host. Select a host from the list to gather logs from or select All Hyper-V Hosts.
Hyper-V Event Log. Select an event log to fetch from the host(s) or select All Hyper-V Event Logs.
Hyper-V Event Log Level. Select a single severity level for log messages to alert on.
2 Select alerting threshold: The threshold will alert immediately if an event occurred within the last
Threshold Check of <Threshold_Check_Period> minutes. Select option to alert on a single threshold event.
--where <Threshold_Check_Period> is the value defined in the Threshold Check area of this dialog.
The threshold will alert when: Select option to alert on a frequency of events during a given time range.
Number of events <exceeds_or_falls_below> <number>. Use to configure the number of events of the selected event type that must be received before firing the alert, where <exceeds_or_falls_below> determines if the number should Exceed or Fall Below the threshold value, and <number> is the threshold value.

WhatsUp Gold User Guide
885
in the past <number> <unit_of_time>. Use to configure the number and units of time that the threshold check should check for events, where <number> is the number of units of time, and <unit_of_time> is the unit of time.
3 Select Notification. Use the browse (...) button to access the Alert Center Notification Policies dialog. You can create new policies or edit existing policies from the Alert Center Notification Policies dialog.
4 Enter time interval in the Threshold Check area of the dialog. 5 Click OK to apply changes.
. Clone a new Hyper-V Event Threshold based on an existing Hyper-V Event Threshold's configuration.
Clone a threshold based on a custom or built-in configuration: 1 Click on a threshold on the Thresholds Library panel you want to copy.
2 Click the Copy button, and click OK to create a new Hyper-V Event Threshold. The Edit Hyper-V Event Threshold dialog displays.
3 Save or customize your new threshold, either: Type in a new value for Name field (or keep the default) and click OK to save to
the Thresholds Library.
Follow the Edit Hyper-V Event Threshold instructions.
. Remove Hyper-V Event Threshold from library.
Delete an existing Hyper-V Event Threshold: 1 Select Hyper-V Event Threshold you want to delete from the Hyper-V Event
Threshold panel.
2 Click the Delete button, and then click Yes to confirm the deletion. The Hyper-V Event Threshold configuration is deleted.
VMware Threshold Managing VMware Thresholds:
From the Thresholds Library (on page 258) in the WhatsUp Gold Alert Center Libraries view, you can perform the following VMware Threshold operations.
Add. Create a new threshold.
From the WhatsUp Gold navigation menu: 1 Select SETTINGS menu > Alerts and Actions > Alert Center.
Alert Center Libraries view displays. 2 Click Thresholds Library panel (to expand it if collapsed).
The Thresholds Library displays.
3 On the Thresholds Library panel, click the "add" button ( ).

WhatsUp Gold User Guide
886
The Select Threshold Type dialog displays. 4 Choose VMware Threshold and click OK. (This adds a new VMware Threshold to
your library.) The New/Edit VMware Threshold Alert dialog displays. (Now, you must configure your VMware Threshold.)
5 Edit the VMware Threshold configuration.
Edit. Adjust, tune, and configure an existing threshold.
To configure a VMware threshold: 1 Configure the following: Name. Enter a name for the VMware threshold. The name entered here is
displayed as the threshold's dashboard report title on the Alert Center Home page.
Virtualization Events type. Select the event type for which you want to create a threshold. The following options are available:
All HA (High Availability) error events
All Virtual machine migration events
All security related events
Other events
Note: When Other events are collected from the vCenter server, and you select Other events in the threshold configuration, you only see those events that were selected when event collection was configured in the Device Properties - Virtualization menu.
Note: For more information about event types and event type selection, see the Configure VMware event listener dialog help.
2 Select one of the following alert criteria: The threshold will alert immediately if an event occurred within the last
Threshold Check of <Threshold_Check_Period> minutes. Select this option if you want alerts to occur immediately when an event has occurred within the threshold check period, where <Threshold_Check_Period> is the value defined in the Threshold Check area of this dialog.
The threshold will alert when:. Select this option if you want to define a number of events and time range for the threshold alert.
Number of events <exceeds_or_falls_below> <number>. Use this setting to configure the number of events of the selected event type that must be received before firing the alert, where <exceeds_or_falls_below> determines if the number should Exceed or Fall Below the threshold value, and <number> is the threshold value.
in the past <number> <unit_of_time>. Use this setting to configure the number and units of time that the threshold check should check for events, where <number> is the number of units of time, and <unit_of_time> is the unit of time.
WhatsUp Gold User Guide
887
3 Select the policy you want to apply to the threshold from the Notification boxes. Use the browse (...) button to access the Alert Center Notification Policies dialog. You can create new policies or edit existing policies from the Alert Center Notification Policies dialog.
4 Enter the number of minutes to wait between threshold checks in the Threshold Check area of the dialog.
5 Click OK when you have completed your configuration.
Copy. Clone a new threshold based on an existing threshold's configuration.
Clone a threshold based on a custom or built-in configuration: 1 Click on a threshold on the Thresholds Library panel you want to copy.
2 Click the Copy button, and click OK to create a new VMware Threshold. The Edit VMware Threshold dialog displays.
3 Save or customize your new threshold, either: Type in a new value for Name field (or keep the default) and click OK to save to
the Thresholds Library.
Follow the Edit VMware Threshold instructions.
Delete. Clone and customize existing threshold.
Delete an existing VMware Threshold: 1 Select VMware Threshold you want to delete from the VMware Threshold panel.
2 Click the Delete button, and then click Yes to confirm the deletion. The VMware Threshold configuration is deleted.
Blackout Summary Threshold Managing Blackout Summary Thresholds:
From the Thresholds Library (on page 258) in the WhatsUp Gold Alert Center Libraries view, you can perform the following Blackout Summary Threshold operations.
Add. Create a new threshold.
From the WhatsUp Gold navigation menu: 1 Select SETTINGS menu > Alerts and Actions > Alert Center.
Alert Center Libraries view displays. 2 Click Thresholds Library panel (to expand it if collapsed).
The Thresholds Library displays.
3 On the Thresholds Library panel, click the "add" button ( ). The Select Threshold Type dialog displays.
4 Choose Blackout Summary Threshold and click OK. (This adds a new Blackout Summary Threshold to your library.)

WhatsUp Gold User Guide
888
The New/Edit Blackout Summary Threshold Alert dialog displays. (Now, you must configure your Blackout Summary Threshold.)
5 Edit the Blackout Summary Threshold configuration.
Edit. Adjust, tune, and configure an existing threshold.
To configure a Blackout Summary threshold: 1 Configure the following: Name. Specify a name for the threshold. This name helps you identify the
threshold in the Threshold library and displays as the report title on the Alert Center Home page.
Threshold. The threshold alerts you when a blackout period has ended and an action would have been triggered by a passive monitor or state change.
Note: You cannot configure threshold criteria for the Blackout Summary threshold.
Devices to Monitor. Click Select to select the devices to which the threshold applies. By default, the threshold applies to all devices. Use this dialog to select groups to which this threshold does not apply.
Notification. Select the notification policy to apply to this threshold. This policy begins sending notifications when an item is outside the configured threshold limits. If you do not see an appropriate threshold policy, or if the list is empty, click browse (...) to open the Notification Policy dialog and configure a new policy.
Threshold check. Enter a time interval for Alert Center to check the Network Performance Monitor database for actions that were not triggered because of a scheduled blackout period that has finished.
Note: Configure the threshold check interval for a longer time than the sampling interval for thresholds relating to trends, such as percent utilization. Configure it for a time the same as (or similar to) the sampling interval when configuring a threshold for a health check. Avoid setting the threshold check interval to a very short time, as this can degrade system performance. In general, setting the threshold check interval to less than five minutes is not advised.
2 Click OK to save the threshold settings.
Copy. Clone a new threshold based on an existing threshold's configuration.
Clone a threshold based on a custom or built-in configuration: 1 Click on a threshold on the Thresholds Library panel you want to copy.
2 Click the Copy button, and click OK to create a new Blackout Summary Threshold. The Edit Blackout Summary Threshold dialog displays.
3 Save or customize your new threshold, either:

WhatsUp Gold User Guide
889
Type in a new value for Name field (or keep the default) and click OK to save to the Thresholds Library.
Follow the Edit Blackout Summary Threshold instructions.
Delete. Clone and customize existing threshold.
Delete an existing Blackout Summary Threshold: 1 Select Blackout Summary Threshold you want to delete from the Blackout
Summary Threshold panel.
2 Click the Delete button, and then click Yes to confirm the deletion. The Blackout Summary Threshold configuration is deleted.
Failover Threshold Managing Failover Thresholds:
From the Thresholds Library (on page 258) in the WhatsUp Gold Alert Center Libraries view, you can perform the following Failover Threshold operations.
. Create a new Failover Threshold.
From the WhatsUp Gold navigation menu: 1 Select the Settings tab, select Alerts and Actions and choose Alert Center.
Alert Center Libraries view displays. 2 Click the Failover Threshold panel (if collapsed).
The Failover Threshold displays.
3 On the Failover Threshold panel, click "add" ( ). The Select Failover Threshold Type dialog displays.
4 Choose Failover Threshold and click OK. The Configure Threshold Alert dialog displays.
5 Edit the Failover Threshold configuration.
. Adjust, tune, and configure an existing Failover Threshold.
To configure a failover threshold: 1 Configure the following: Name. Specify a name for the threshold. This name helps you identify the
threshold in the Threshold library and displays as the report title on the Alert Center Home page.
Threshold. Select the desired threshold criteria variables and values. You can configure the threshold to alert you when any event occurs, when an error occurs, or when an informational event occurs. By default, the threshold is configured to alert you when any event has occurred in Failover.
Notification. Select the notification policy to apply to this threshold. This policy begins sending notifications when an item is outside the configured threshold

WhatsUp Gold User Guide
890
limits. If you do not see an appropriate threshold policy, or if the list is empty, click browse (...) to open the Notification Policy dialog and configure a new policy.
Tip: Notification policies are optional for most thresholds. Out of threshold items still appear on the Alert Center dashboard.
Threshold check. Enter a value for the threshold check interval, or the interval at which the Alert Center checks the Network Performance Monitor database to see if there are items that are outside the threshold parameters.
Note: Configure the threshold check interval for a longer time than the sampling interval for thresholds relating to trends, such as percent utilization. Configure it for a time the same as (or similar to) the sampling interval when configuring a threshold for a health check. Avoid setting the threshold check interval to a very short time, as this can degrade system performance. In general, setting the threshold check interval to less than five minutes is not advised.
2 Click OK to save the threshold.
. Clone a new Failover Threshold based on an existing Failover Threshold's configuration.
Clone a threshold based on a custom or built-in configuration: 1 Click on a threshold on the Thresholds Library panel you want to copy.
2 Click the Copy button, and click OK to create a new Failover Threshold. The Edit Failover Threshold dialog displays.
3 Save or customize your new threshold, either: Type in a new value for Name field (or keep the default) and click OK to save to
the Thresholds Library.
Follow the Edit Failover Threshold instructions.
. Remove Failover Threshold from library.
Delete an existing Failover Threshold: 1 Select Failover Threshold you want to delete from the Failover Threshold panel.
2 Click the Delete button, and then click Yes to confirm the deletion. The Failover Threshold configuration is deleted.
WhatsUpHealth Threshold Managing WhatsUpHealth Thresholds:
From the Thresholds Library (on page 258) in the WhatsUp Gold Alert Center Libraries view, you can perform the following WhatsUpHealth Threshold operations.

WhatsUp Gold User Guide
891
. Create a new WhatsUpHealth Threshold.
From the WhatsUp Gold navigation menu: 1 Select the Settings tab, select Alerts and Actions and choose Alert Center.
Alert Center Libraries view displays. 2 Click the WhatsUpHealth Threshold panel (if collapsed).
The WhatsUpHealth Threshold displays.
3 On the WhatsUpHealth Threshold panel, click "add" ( ). The Select WhatsUpHealth Threshold Type dialog displays.
4 Choose WhatsUpHealth Threshold and click OK. The Configure Threshold Alert dialog displays.
5 Edit the WhatsUpHealth Threshold configuration.
. Adjust, tune, and configure an existing WhatsUpHealth Threshold.
To configure a WhatsUp Health threshold: 1 From the WhatsUp Gold web interface, go to Alert Center > Threshold Library.
The Alert Center Threshold Library dialog appears. 2 Click New. The Select Threshold Type dialog appears. 3 Select WhatsUp Health, then click OK. The New WhatsUp Health Threshold
dialog appears. 4 Enter a Name for the threshold. This name is displayed as the threshold
dashboard report title on the Alerts Home page. 5 Click the Database tab. Enter the appropriate threshold information: Database size exceeds ___ %/GB/MB. Select this option to have the threshold
alert when the database size exceeds the value you specify. The default threshold value is 80%.
Note: If you have an unlimited-size database, WhatsUp Gold uses a 4GB cap to calculate the size of your database.
Total performance monitors exceed ____. Select this option to have the threshold alert when the total number of performance monitors exceeds the number you specify. The default number of total performance monitors is 3,000.
Total performance monitor records exceed ____. Select this option to have the threshold alert when the total number of performance monitor records exceeds the number you specify. The default number of total performance monitor records is 2,000,000.
Total passive monitor records exceed ____. Select this option to have the threshold alert when the total number of passive monitor records exceeds the number you specify. The default number of total passive monitor records is 1,000,000.
Total expired records exceed ____. Select this option to have the threshold alert when the total number of expired records exceeds the number you specify. The default number of total expired records is 500,000.

WhatsUp Gold User Guide
892
Total devices being monitored exceeds ____ % of license limit. Select this option to have the threshold alert when the total number of devices being monitored exceeds the percentage of the license limit you specify. The default percentage of the license limit is 90%.
Tip: Click View WhatsUp database to view a graph of the current WhatsUp database usage.
6 Click the Services tab. Enter the appropriate threshold information: WhatsUp polling service is down ____ minutes. Select this option to have the
threshold alert when the WhatsUp service has been down for the number of minutes you specify. The default threshold value is 5 minutes.
WhatsUp discovery service is down ____ minutes. Select this option to have the threshold alert when the WhatsUp discovery service is down the number of minutes that you specify. The default number is 5 minutes.
Note: Web service threshold checks do not apply to users running IIS.
Note: If you are experiencing a high volume of errors from your WhatsUp Health threshold service checks, please see Troubleshooting the WhatsUp Health Threshold.
7 Click the Flow Monitor tab. Enter the appropriate threshold information pertaining to the WhatsUp Gold Flow Monitor. Netflow database size exceeds ____ %/GB/MB. Select this option to have the
threshold alert when the Netflow database exceeds the value you specify. The default threshold value is 80%.
Note: If you have an unlimited-size database, WhatsUp Gold uses a 4GB cap to calculate the size of your database.
NfArchive database size exceeds ____ %/GB/MB. Select this option to have the threshold alert when the NfArchive database size exceeds the value you specify. The default threshold value is 80%.
Note: If you have an unlimited-size database, WhatsUp Gold uses a 4GB cap to calculate the size of your database.
Flow collector service is down ____ minutes. Select this option to have the threshold alert when the Flow collector service is down for the number of minutes you specify. The default threshold value is 5 minutes.
Any bounce traffic occurs. Select this option to have the threshold alert when bounce traffic occurs on a Flow Monitor source.
Host records exceed ____. Select this option to have the threshold alert when the number of host records exceeds the amount you specify. The default threshold value is 2,000,000 records.

WhatsUp Gold User Guide
893
Raw, hourly, or daily records exceed ____. Select this option to have the threshold alert when the number of raw data records exceeds the amount you specify. The default threshold value is 10,000,000 records.
Total sources sending data exceeds ____ % of license limit. Select this option to have the threshold alert when the total sources sending data exceeds the percentage of license limit that you specify. The default threshold value is 90% of license limit.
Tip: Click View Netflow database usage to view a graph of the current Netflow database usage. Click View NfArchive database usage to view a graph of the current NfArchive database usage.
8 After selecting the desired options for each tab and entering the appropriate threshold variables and values, specify your choices for the Notification and Polling sections of the dialog. Notification. Select the notification policy to apply to this threshold. This policy
begins sending notifications when an item is outside the configured threshold limits. If you do not see an appropriate threshold policy, or if the list is empty, click browse (...) to open the Notification Policy dialog and configure a new policy.
Note: Notification policies are optional for most thresholds. If you do not select a notification policy, no notifications are generated for the threshold, but a dashboard report listing the out of threshold items still appears on the Alerts Home page.
Threshold check. Enter a value for the polling interval, or the interval at which the Alert Center checks the WhatsUp Gold database to see if there are items out of the threshold's parameters. The default polling interval is 5 minutes. Select Automatically resolve items no longer out of threshold to have Alert Center automatically resolve items when they go back inside the parameters of the threshold.
Note: Configure the threshold check interval for a longer time than the sampling interval for thresholds relating to trends, such as percent utilization. Configure it for a time the same as (or similar to) the sampling interval when configuring a threshold for a health check. Avoid setting the threshold check interval to a very short time, as this can degrade system performance. In general, setting the threshold check interval to less than five minutes is not advised.
9 Click OK to save the threshold settings.
. Clone a new WhatsUpHealth Threshold based on an existing WhatsUpHealth Threshold's configuration.
Clone a threshold based on a custom or built-in configuration: 1 Click on a threshold on the Thresholds Library panel you want to copy.

WhatsUp Gold User Guide
894
2 Click the Copy button, and click OK to create a new WhatsUpHealth Threshold. The Edit WhatsUpHealth Threshold dialog displays.
3 Save or customize your new threshold, either: Type in a new value for Name field (or keep the default) and click OK to save to
the Thresholds Library.
Follow the Edit WhatsUpHealth Threshold instructions.
. Remove WhatsUpHealth Threshold from library.
Delete an existing WhatsUpHealth Threshold: 1 Select WhatsUpHealth Threshold you want to delete from the WhatsUpHealth
Threshold panel.
2 Click the Delete button, and then click Yes to confirm the deletion. The WhatsUpHealth Threshold configuration is deleted.
Conversation Partners Threshold Managing Conversation Partners Thresholds:
From the Thresholds Library (on page 258) in the WhatsUp Gold Alert Center Libraries view, you can perform the following Conversation Partners Threshold operations.
. Create a new Conversation Partners Threshold.
From the WhatsUp Gold navigation menu: 1 Select the Settings tab, select Alerts and Actions and choose Alert Center.
Alert Center Libraries view displays. 2 Click the Conversation Partners Threshold panel (if collapsed).
The Conversation Partners Threshold displays.
3 On the Conversation Partners Threshold panel, click "add" ( ). The Select Conversation Partners Threshold Type dialog displays.
4 Choose Conversation Partners Threshold and click OK. The Configure Threshold Alert dialog displays.
5 Edit the Conversation Partners Threshold configuration.
. Adjust, tune, and configure an existing Conversation Partners Threshold.
To configure a Network Traffic Analysis conversation partners threshold: 1 Configure the following: Name. Specify a name for the threshold. This name helps you identify the
threshold in the Threshold library and displays as the report title on the Alert Center Home page.

WhatsUp Gold User Guide
895
Threshold. Select and enter the desired threshold criteria variables and values. The default threshold is configured to alert when a host has sent to or received from more than 1000 conversation partners in the past 15 minutes.
Traffic to monitor. Select the Network Traffic Analysis source or interface from which to monitor traffic. When you select a source, traffic for all interfaces on the source is monitored. When you select an interface, only traffic for the selected interface is monitored. By default, the threshold is set to monitor traffic from all Network Traffic Analysis sources.
Note: Sources sending sampled data are not displayed as a selection option in the Traffic to monitor list because Network Traffic Analysis cannot determine that traffic has failed on sampled data.
Hosts to monitor. Click Select to choose the hosts to which the threshold applies. By default, the threshold monitors all applicable hosts.
Notification. Select the notification policy to apply to this threshold. This policy begins sending notifications when an item is outside the configured threshold limits. If you do not see an appropriate threshold policy, or if the list is empty, click browse (...) to open the Notification Policy dialog and configure a new policy.
Note: Notification policies are optional for most thresholds. If you do not select a notification policy, no notifications are generated for the threshold, but a dashboard report listing the out of threshold items still appears on the Alert Center Home page.
Threshold check. Enter a time interval for Alert Center to check the Network Performance Monitor database for items that are out of the threshold parameters.
Select Automatically resolve items no longer out of threshold to have Alert Center automatically resolve items when they return to the parameters inside the threshold.
Note: Configure the threshold check interval for a longer time than the sampling interval for thresholds relating to trends, such as percent utilization. Configure it for a time the same as (or similar to) the sampling interval when configuring a threshold for a health check. Avoid setting the threshold check interval to a very short time, as this can degrade system performance. In general, setting the threshold check interval to less than five minutes is not advised.
2 Click OK to save the threshold settings.

WhatsUp Gold User Guide
896
. Clone a new Conversation Partners Threshold based on an existing Conversation Partners Threshold's configuration.
Clone a threshold based on a custom or built-in configuration: 1 Click on a threshold on the Thresholds Library panel you want to copy.
2 Click the Copy button, and click OK to create a new Conversation Partners Threshold. The Edit Conversation Partners Threshold dialog displays.
3 Save or customize your new threshold, either: Type in a new value for Name field (or keep the default) and click OK to save to
the Thresholds Library.
Follow the Edit Conversation Partners Threshold instructions.
. Remove Conversation Partners Threshold from library.
Delete an existing Conversation Partners Threshold: 1 Select Conversation Partners Threshold you want to delete from the Conversation
Partners Threshold panel.
2 Click the Delete button, and then click Yes to confirm the deletion. The Conversation Partners Threshold configuration is deleted.
Network Traffic Analysis Custom Threshold
Managing Network Traffic Analysis Custom Thresholds:
From the Thresholds Library (on page 258) in the WhatsUp Gold Alert Center Libraries view, you can perform the following Network Traffic Analysis Custom Threshold operations.
. Create a new Network Traffic Analysis Custom Threshold.
From the WhatsUp Gold navigation menu: 1 Select the Settings tab, select Alerts and Actions and choose Alert Center.
Alert Center Libraries view displays. 2 Click the Network Traffic Analysis Custom Threshold panel (if collapsed).
The Network Traffic Analysis Custom Threshold displays.
3 On the Network Traffic Analysis Custom Threshold panel, click "add" ( ). The Select Network Traffic Analysis Custom Threshold Type dialog displays.
4 Choose Network Traffic Analysis Custom Threshold and click OK. The Configure Threshold Alert dialog displays.
5 Edit the Network Traffic Analysis Custom Threshold configuration.

WhatsUp Gold User Guide
897
. Adjust, tune, and configure an existing Network Traffic Analysis Custom Threshold.
To configure a Network Traffic Analysis custom threshold: 1 Configure the following: Name. Specify a name for the threshold. This name helps you identify the
threshold in the Threshold library and displays as the report title on the Alert Center Home page.
Description. As you configure threshold criteria settings, the description automatically updates to include your selections.
Threshold. Select the threshold filters and limits, and enter the values to use for each. You can define up to three filters for each Network Traffic Analysis custom threshold.
An example threshold involving multiple filters could state, "This threshold will alert when any host with Protocol matching TCP and Application matching pop3 sent or received more than 100 MB of data in the past 15 minutes."
The default threshold time value is data in the past 15 minutes.
Traffic to monitor. Select the Network Traffic Analysis source or interface from which to monitor traffic. When you select a source, traffic for all interfaces on the source is monitored. When you select an interface, only traffic for the selected interface is monitored. By default, the threshold is set to monitor traffic from all Network Traffic Analysis sources.
Note: Sources sending sampled data are not displayed as a selection option in the Traffic to monitor list because Network Traffic Analysis cannot determine that traffic has failed on sampled data.
Hosts to monitor. Click Select to choose the hosts to which the threshold applies. By default, the threshold monitors all applicable hosts.
Notification. Select the notification policy to apply to this threshold. This policy begins sending notifications when an item is outside the configured threshold limits. If you do not see an appropriate threshold policy, or if the list is empty, click browse (...) to open the Notification Policy dialog and configure a new policy.
Tip: Notification policies are optional for most thresholds. Out of threshold items still appear on the Alert Center dashboard.
Threshold check. Enter a value for the threshold check interval, or the interval at which the Alert Center checks the Network Performance Monitor database to see if there are items that are out of the threshold's parameters.
Select Automatically resolve items no longer out of threshold to have Alert Center automatically resolve items when they go back inside the parameters of the threshold.
WhatsUp Gold User Guide
898
Note: Configure the threshold check interval for a longer time than the sampling interval for thresholds relating to trends, such as percent utilization. Configure it for a time the same as (or similar to) the sampling interval when configuring a threshold for a health check. Avoid setting the threshold check interval to a very short time, as this can degrade system performance. In general, setting the threshold check interval to less than five minutes is not advised.
2 Click OK to save the threshold settings.
. Clone a new Network Traffic Analysis Custom Threshold based on an existing Network Traffic Analysis Custom Threshold's configuration.
Clone a threshold based on a custom or built-in configuration: 1 Click on a threshold on the Thresholds Library panel you want to copy.
2 Click the Copy button, and click OK to create a new Network Traffic Analysis Custom Threshold. The Edit Network Traffic Analysis Custom Threshold dialog displays.
3 Save or customize your new threshold, either: Type in a new value for Name field (or keep the default) and click OK to save to
the Thresholds Library.
Follow the Edit Network Traffic Analysis Custom Threshold instructions.
. Remove Network Traffic Analysis Custom Threshold from library.
Delete an existing Network Traffic Analysis Custom Threshold: 1 Select Network Traffic Analysis Custom Threshold you want to delete from the
Network Traffic Analysis Custom Threshold panel.
2 Click the Delete button, and then click Yes to confirm the deletion. The Network Traffic Analysis Custom Threshold configuration is deleted.
Failed Connections Managing Failed Connections:
From the Thresholds Library (on page 258) in the WhatsUp Gold Alert Center Libraries view, you can perform the following Failed Connections operations.
. Create a new Failed Connections.
From the WhatsUp Gold navigation menu: 1 Select the Settings tab, select Alerts and Actions and choose Alert Center.
Alert Center Libraries view displays. 2 Click the Failed Connections panel (if collapsed).

WhatsUp Gold User Guide
899
The Failed Connections displays.
3 On the Failed Connections panel, click "add" ( ). The Select Failed Connections Type dialog displays.
4 Choose Failed Connections and click OK. The Configure Threshold Alert dialog displays.
5 Edit the Failed Connections configuration.
. Adjust, tune, and configure an existing Failed Connections.
To configure a Network Traffic Analysis failed connections threshold: 1 Configure the following: Name. Specify a name for the threshold. This name helps you identify the
threshold in the Threshold library and displays as the report title on the Alert Center Home page.
Threshold. Select and enter the desired threshold criteria variables and values. The default threshold is exceeded when a host has sent or received more than 1000 failed connections in the past 15 minutes.
Note: Network Performance Monitor can only find failed connections on sources that are not sending sampled data.
Traffic to monitor. Select the Network Traffic Analysis source or interface from which to monitor traffic. When you select a source, traffic for all interfaces on the source is monitored. When you select an interface, only traffic for the selected interface is monitored. By default, the threshold is set to monitor traffic from all Network Traffic Analysis sources.
Note: Sources sending sampled data are not displayed as a selection option in the Traffic to monitor list because Network Traffic Analysis cannot determine that traffic has failed on sampled data.
Hosts to monitor. Click Select to choose the hosts to which the threshold applies. By default, the threshold monitors all applicable hosts.
Notification. Select the notification policy to apply to this threshold. This policy begins sending notifications when an item is outside the configured threshold limits. If you do not see an appropriate threshold policy, or if the list is empty, click browse (...) to open the Notification Policy dialog and configure a new policy.
Tip: Notification policies are optional for most thresholds. Out of threshold items still appear on the Alert Center dashboard.

WhatsUp Gold User Guide
900
Threshold check. Enter a value for the threshold check interval, or the interval at which the Alert Center checks the Network Performance Monitor database to see if there are items that are outside the threshold parameters.
Select Automatically resolve items no longer out of threshold to have Alert Center automatically resolve items when they go back inside the parameters of the threshold.
Note: Configure the threshold check interval for a longer time than the sampling interval for thresholds relating to trends, such as percent utilization. Configure it for a time the same as (or similar to) the sampling interval when configuring a threshold for a health check. Avoid setting the threshold check interval to a very short time, as this can degrade system performance. In general, setting the threshold check interval to less than five minutes is not advised.
2 Click OK to save the threshold.
Copy. Clone a new Failed Connections based on an existing Failed Connection configuration.
Clone a threshold based on a custom or built-in configuration: 1 Click on a threshold on the Thresholds Library panel you want to copy.
2 Click the Copy button, and click OK to create a new Failed Connections. The Edit Failed Connections dialog displays.
3 Save or customize your new threshold, either: Type in a new value for Name field (or keep the default) and click OK to save to
the Thresholds Library.
Follow the Edit Failed Connections instructions.
. Remove Failed Connections from library.
Delete an existing Failed Connections: 1 Select Failed Connections you want to delete from the Failed Connections panel.
2 Click the Delete button, and then click Yes to confirm the deletion. The Failed Connections configuration is deleted.
Interface Traffic Threshold Managing Interface Traffic Thresholds:
From the Thresholds Library (on page 258) in the WhatsUp Gold Alert Center Libraries view, you can perform the following Interface Traffic Threshold operations.

WhatsUp Gold User Guide
901
. Create a new Interface Traffic Threshold.
From the WhatsUp Gold navigation menu: 1 Select the Settings tab, select Alerts and Actions and choose Alert Center.
Alert Center Libraries view displays. 2 Click the Interface Traffic Threshold panel (if collapsed).
The Interface Traffic Threshold displays.
3 On the Interface Traffic Threshold panel, click "add" ( ). The Select Interface Traffic Threshold Type dialog displays.
4 Choose Interface Traffic Threshold and click OK. The Configure Threshold Alert dialog displays.
5 Edit the Interface Traffic Threshold configuration.
. Adjust, tune, and configure an existing Interface Traffic Threshold.
To configure a Network Traffic Analysis interface traffic threshold: 1 Configure the following: Name. Specify a name for the threshold. This name helps you identify the
threshold in the Threshold library and displays as the report title on the Alert Center Home page.
Threshold. Select and enter the desired threshold criteria variables and values. The default threshold is configured to alert when incoming or outgoing interface traffic exceeds 90% for more than 60 minutes.
Traffic to monitor. Select the Network Traffic Analysis sources from which to monitor traffic; all interfaces on a Network Traffic Analysis source are monitored. By default, the threshold is set to monitor traffic from all Network Traffic Analysis sources.
Notification. Select the notification policy to apply to this threshold. This policy begins sending notifications when an item is outside the configured threshold limits. If you do not see an appropriate threshold policy, or if the list is empty, click browse (...) to open the Notification Policy dialog and configure a new policy.
Note: Notification policies are optional for most thresholds. If you do not select a notification policy, no notifications are generated for the threshold, but a dashboard report listing the out of threshold items still appears on the Alert Center Home page.
Threshold check. Enter a value for the threshold check interval, or the interval at which the Alert Center checks the Network Performance Monitor database to see if there are items that are outside the threshold parameters.
Select Automatically resolve items no longer out of threshold to have Alert Center automatically resolve items when they go back inside the parameters of the threshold.

WhatsUp Gold User Guide
902
Note: Configure the threshold check interval for a longer time than the sampling interval for thresholds relating to trends, such as percent utilization. Configure it for a time the same as (or similar to) the sampling interval when configuring a threshold for a health check. Avoid setting the threshold check interval to a very short time, as this can degrade system performance. In general, setting the threshold check interval to less than five minutes is not advised.
2 Click OK to save the threshold settings.
. Clone a new Interface Traffic Threshold based on an existing Interface Traffic Threshold's configuration.
Clone a threshold based on a custom or built-in configuration: 1 Click on a threshold on the Thresholds Library panel you want to copy.
2 Click the Copy button, and click OK to create a new Interface Traffic Threshold. The Edit Interface Traffic Threshold dialog displays.
3 Save or customize your new threshold, either: Type in a new value for Name field (or keep the default) and click OK to save to
the Thresholds Library.
Follow the Edit Interface Traffic Threshold instructions.
. Remove Interface Traffic Threshold from library.
Delete an existing Interface Traffic Threshold: 1 Select Interface Traffic Threshold you want to delete from the Interface Traffic
Threshold panel.
2 Click the Delete button, and then click Yes to confirm the deletion. The Interface Traffic Threshold configuration is deleted.
Top Sender/Receiver Managing Top Sender/Receivers:
From the Thresholds Library (on page 258) in the WhatsUp Gold Alert Center Libraries view, you can perform the following Top Sender/Receiver operations.
. Create a new Top Sender/Receiver.
From the WhatsUp Gold navigation menu: 1 Select the Settings tab, select Alerts and Actions and choose Alert Center.

WhatsUp Gold User Guide
903
Alert Center Libraries view displays. 2 Click the Top Sender/Receiver panel (if collapsed).
The Top Sender/Receiver displays.
3 On the Top Sender/Receiver panel, click "add" ( ). The Select Top Sender/Receiver Type dialog displays.
4 Choose Top Sender/Receiver and click OK. The Configure Threshold Alert dialog displays.
5 Edit the Top Sender/Receiver configuration.
. Adjust, tune, and configure an existing Top Sender/Receiver.
To configure a Network Traffic Analysis top sender/receiver threshold: 1 Configure the following: Name. Specify a name for the threshold. This name helps you identify the
threshold in the Threshold library and displays as the report title on the Alert Center Home page.
Threshold. Select and enter the desired threshold criteria variable and values. The default threshold is configured to alert when a host has sent or received more than 500 MB in the past 15 minutes.
Traffic to monitor. Select the Network Traffic Analysis source or interface from which to monitor traffic. When you select a source, traffic for all interfaces on the source is monitored. When you select an interface, only traffic for the selected interface is monitored. By default, the threshold is set to monitor traffic from all Network Traffic Analysis sources.
Hosts to monitor. Click Select to choose the hosts to which the threshold applies. By default, the threshold monitors all applicable hosts.
Notification. Select the notification policy to apply to this threshold. This policy begins sending notifications when an item is outside the configured threshold limits. If you do not see an appropriate threshold policy, or if the list is empty, click browse (...) to open the Notification Policy dialog and configure a new policy.
Note: Notification policies are optional for most thresholds. If you do not select a notification policy, no notifications are generated for the threshold, but a dashboard report listing the out of threshold items still appears on the Alert Center Home page.
Threshold check. Enter a value for the threshold check interval, or the interval at which the Alert Center checks the Network Performance Monitor database to see if there are items that are out of the threshold's parameters. The default polling interval is 5 minutes.
Select Automatically resolve items no longer out of threshold to have Alert Center automatically resolve items when they go back inside the parameters of the threshold.

WhatsUp Gold User Guide
904
Note: Configure the threshold check interval for a longer time than the sampling interval for thresholds relating to trends, such as percent utilization. Configure it for a time the same as (or similar to) the sampling interval when configuring a threshold for a health check. Avoid setting the threshold check interval to a very short time, as this can degrade system performance. In general, setting the threshold check interval to less than five minutes is not advised.
2 Click OK to save the threshold settings.
. Clone a new Top Sender/Receiver based on an existing Top Sender/Receiver's configuration.
Clone a threshold based on a custom or built-in configuration: 1 Click on a threshold on the Thresholds Library panel you want to copy.
2 Click the Copy button, and click OK to create a new Top Sender/Receiver. The Edit Top Sender/Receiver dialog displays.
3 Save or customize your new threshold, either: Type in a new value for Name field (or keep the default) and click OK to save to
the Thresholds Library.
Follow the Edit Top Sender/Receiver instructions.
. Remove Top Sender/Receiver from library.
Delete an existing Top Sender/Receiver: 1 Select Top Sender/Receiver you want to delete from the Top Sender/Receiver
panel.
2 Click the Delete button, and then click Yes to confirm the deletion. The Top Sender/Receiver configuration is deleted.
Threshold Hosts For each Network Traffic Analysis threshold you configure, you can define inclusion or exclusion rules to the set of devices the threshold applies.
This threshold applies to all hosts EXCEPT. Click the radio button to add excluded devices to this set.
This threshold applies to ONLY the following hosts. Click the radio button to add included devices to this set.
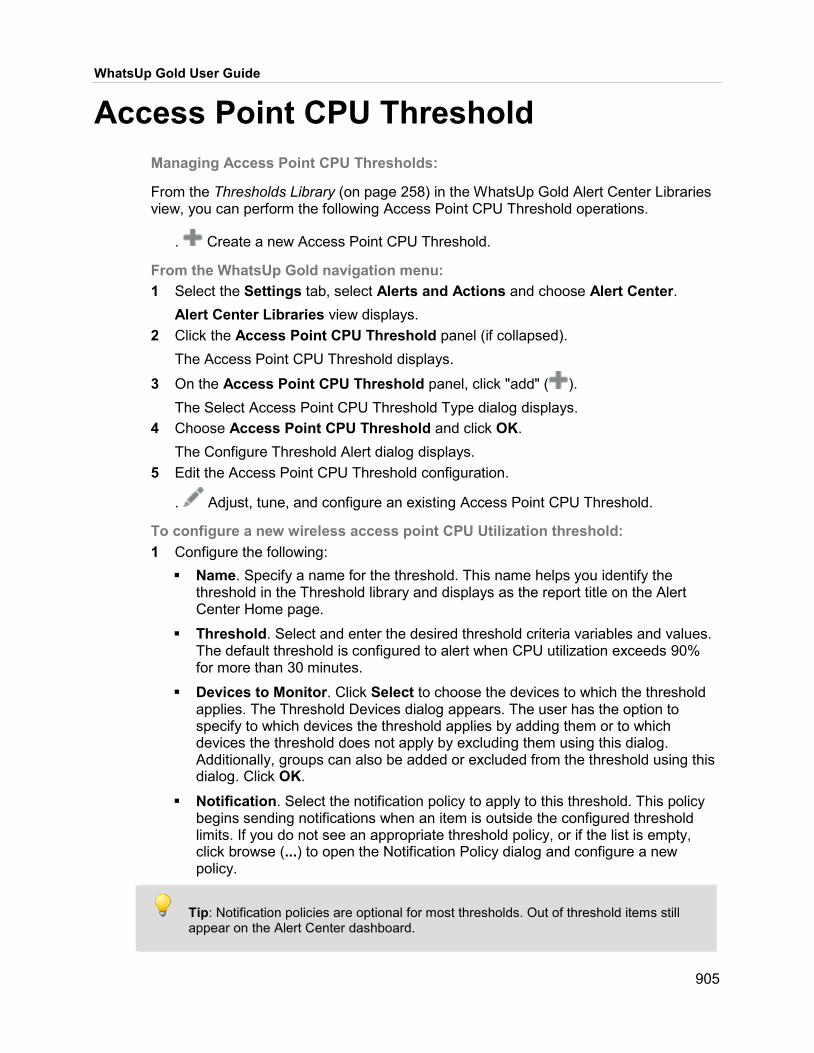
WhatsUp Gold User Guide
905
Access Point CPU Threshold Managing Access Point CPU Thresholds:
From the Thresholds Library (on page 258) in the WhatsUp Gold Alert Center Libraries view, you can perform the following Access Point CPU Threshold operations.
. Create a new Access Point CPU Threshold.
From the WhatsUp Gold navigation menu: 1 Select the Settings tab, select Alerts and Actions and choose Alert Center.
Alert Center Libraries view displays. 2 Click the Access Point CPU Threshold panel (if collapsed).
The Access Point CPU Threshold displays.
3 On the Access Point CPU Threshold panel, click "add" ( ). The Select Access Point CPU Threshold Type dialog displays.
4 Choose Access Point CPU Threshold and click OK. The Configure Threshold Alert dialog displays.
5 Edit the Access Point CPU Threshold configuration.
. Adjust, tune, and configure an existing Access Point CPU Threshold.
To configure a new wireless access point CPU Utilization threshold: 1 Configure the following: Name. Specify a name for the threshold. This name helps you identify the
threshold in the Threshold library and displays as the report title on the Alert Center Home page.
Threshold. Select and enter the desired threshold criteria variables and values. The default threshold is configured to alert when CPU utilization exceeds 90% for more than 30 minutes.
Devices to Monitor. Click Select to choose the devices to which the threshold applies. The Threshold Devices dialog appears. The user has the option to specify to which devices the threshold applies by adding them or to which devices the threshold does not apply by excluding them using this dialog. Additionally, groups can also be added or excluded from the threshold using this dialog. Click OK.
Notification. Select the notification policy to apply to this threshold. This policy begins sending notifications when an item is outside the configured threshold limits. If you do not see an appropriate threshold policy, or if the list is empty, click browse (...) to open the Notification Policy dialog and configure a new policy.
Tip: Notification policies are optional for most thresholds. Out of threshold items still appear on the Alert Center dashboard.

WhatsUp Gold User Guide
906
Threshold check. Enter a value for the threshold check interval, or the interval at which the Alert Center checks the Network Performance Monitor database to see if there are items that are out of the threshold's parameters. The default check interval is every 5 minutes.
Select Automatically resolve items no longer out of threshold to have Alert Center automatically resolve items when they go back inside the parameters of the threshold.
2 Click OK.
. Clone a new Access Point CPU Threshold based on an existing Access Point CPU Threshold's configuration.
Clone a threshold based on a custom or built-in configuration: 1 Click on a threshold on the Thresholds Library panel you want to copy.
2 Click the Copy button, and click OK to create a new Access Point CPU Threshold. The Edit Access Point CPU Threshold dialog displays.
3 Save or customize your new threshold, either: Type in a new value for Name field (or keep the default) and click OK to save to
the Thresholds Library.
Follow the Edit Access Point CPU Threshold instructions.
. Remove Access Point CPU Threshold from library.
Delete an existing Access Point CPU Threshold: 1 Select Access Point CPU Threshold you want to delete from the Access Point
CPU Threshold panel.
2 Click the Delete button, and then click Yes to confirm the deletion. The Access Point CPU Threshold configuration is deleted.
Access Point Memory Threshold Managing Access Point Memory Thresholds:
From the Thresholds Library (on page 258) in the WhatsUp Gold Alert Center Libraries view, you can perform the following Access Point Memory Threshold operations.
. Create a new Access Point Memory Threshold.
From the WhatsUp Gold navigation menu: 1 Select the Settings tab, select Alerts and Actions and choose Alert Center.
Alert Center Libraries view displays. 2 Click the Access Point Memory Threshold panel (if collapsed).
The Access Point Memory Threshold displays.
3 On the Access Point Memory Threshold panel, click "add" ( ).

WhatsUp Gold User Guide
907
The Select Access Point Memory Threshold Type dialog displays. 4 Choose Access Point Memory Threshold and click OK.
The Configure Threshold Alert dialog displays. 5 Edit the Access Point Memory Threshold configuration.
. Adjust, tune, and configure an existing Access Point Memory Threshold.
To configure a new Wireless Memory Utilization threshold: 1 Configure the following: Name. Specify a name for the threshold. This name helps you identify the
threshold in the Threshold library and displays as the report title on the Alert Center Home page.
Threshold. Select and enter the desired threshold criteria variables and values. The default threshold is configured to alert when memory utilization exceeds 90% for more than 30 minutes.
Devices to Monitor. Click Select to choose the devices to which the threshold applies. The Threshold Devices dialog appears. Specify to which devices the threshold applies by adding them or to which devices the threshold does not apply by excluding them using this dialog. Additionally, groups can also be added or excluded from the threshold using this dialog. Click OK.
Notification. Select the notification policy to apply to this threshold. This policy begins sending notifications when an item is outside the configured threshold limits. If you do not see an appropriate threshold policy, or if the list is empty, click browse (...) to open the Notification Policy dialog and configure a new policy.
Note: Notification policies are optional for most thresholds. If you do not select a notification policy, no notifications are generated for the threshold, but a dashboard report listing the out of threshold items still appears on the Alert Center Home page.
Threshold check. Enter a value for the threshold check interval, or the interval at which the Alert Center checks the Network Performance Monitor database to see if there are items that are out of the threshold's parameters. The default check interval is every 5 minutes.
Select Automatically resolve items no longer out of threshold to have Alert Center automatically resolve items when they go back inside the parameters of the threshold.
2 Click OK.
. Clone a new Access Point Memory Threshold based on an existing Access Point Memory Threshold's configuration.
Clone a threshold based on a custom or built-in configuration: 1 Click on a threshold on the Thresholds Library panel you want to copy.
2 Click the Copy button, and click OK to create a new Access Point Memory Threshold.

WhatsUp Gold User Guide
908
The Edit Access Point Memory Threshold dialog displays. 3 Save or customize your new threshold, either: Type in a new value for Name field (or keep the default) and click OK to save to
the Thresholds Library.
Follow the Edit Access Point Memory Threshold instructions.
. Remove Access Point Memory Threshold from library.
Delete an existing Access Point Memory Threshold: 1 Select Access Point Memory Threshold you want to delete from the Access Point
Memory Threshold panel.
2 Click the Delete button, and then click Yes to confirm the deletion. The Access Point Memory Threshold configuration is deleted.
Banned Client MAC Threshold Managing Banned Client MAC Thresholds:
From the Thresholds Library (on page 258) in the WhatsUp Gold Alert Center Libraries view, you can perform the following Banned Client MAC Threshold operations.
. Create a new Banned Client MAC Threshold.
From the WhatsUp Gold navigation menu: 1 Select the Settings tab, select Alerts and Actions and choose Alert Center.
Alert Center Libraries view displays. 2 Click the Banned Client MAC Threshold panel (if collapsed).
The Banned Client MAC Threshold displays.
3 On the Banned Client MAC Threshold panel, click "add" ( ). The Select Banned Client MAC Threshold Type dialog displays.
4 Choose Banned Client MAC Threshold and click OK. The Configure Threshold Alert dialog displays.
5 Edit the Banned Client MAC Threshold configuration.
. Adjust, tune, and configure an existing Banned Client MAC Threshold.
To configure a new Wireless Banned Client MAC Address threshold: 1 Configure the following: Name. Specify a name for the threshold. This name helps you identify the
threshold in the Threshold library and displays as the report title on the Alert Center Home page.
Threshold. Enter any banned MAC addresses separated by commas and select an interval time range. The default range is 30 minutes. The threshold will alert when any MAC addresses listed are connected to the network in the given time interval.
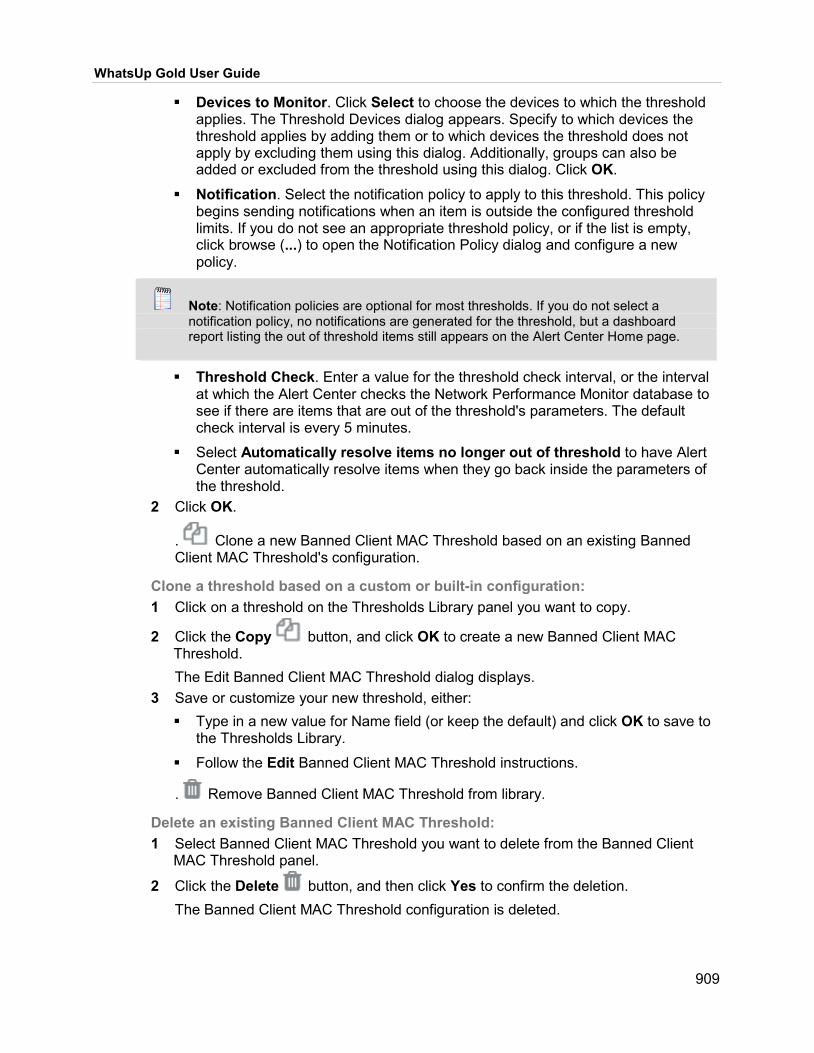
WhatsUp Gold User Guide
909
Devices to Monitor. Click Select to choose the devices to which the threshold applies. The Threshold Devices dialog appears. Specify to which devices the threshold applies by adding them or to which devices the threshold does not apply by excluding them using this dialog. Additionally, groups can also be added or excluded from the threshold using this dialog. Click OK.
Notification. Select the notification policy to apply to this threshold. This policy begins sending notifications when an item is outside the configured threshold limits. If you do not see an appropriate threshold policy, or if the list is empty, click browse (...) to open the Notification Policy dialog and configure a new policy.
Note: Notification policies are optional for most thresholds. If you do not select a notification policy, no notifications are generated for the threshold, but a dashboard report listing the out of threshold items still appears on the Alert Center Home page.
Threshold Check. Enter a value for the threshold check interval, or the interval at which the Alert Center checks the Network Performance Monitor database to see if there are items that are out of the threshold's parameters. The default check interval is every 5 minutes.
Select Automatically resolve items no longer out of threshold to have Alert Center automatically resolve items when they go back inside the parameters of the threshold.
2 Click OK.
. Clone a new Banned Client MAC Threshold based on an existing Banned Client MAC Threshold's configuration.
Clone a threshold based on a custom or built-in configuration: 1 Click on a threshold on the Thresholds Library panel you want to copy.
2 Click the Copy button, and click OK to create a new Banned Client MAC Threshold. The Edit Banned Client MAC Threshold dialog displays.
3 Save or customize your new threshold, either: Type in a new value for Name field (or keep the default) and click OK to save to
the Thresholds Library.
Follow the Edit Banned Client MAC Threshold instructions.
. Remove Banned Client MAC Threshold from library.
Delete an existing Banned Client MAC Threshold: 1 Select Banned Client MAC Threshold you want to delete from the Banned Client
MAC Threshold panel.
2 Click the Delete button, and then click Yes to confirm the deletion. The Banned Client MAC Threshold configuration is deleted.

WhatsUp Gold User Guide
910
Device Over Subscription Threshold Managing Device Over Subscription Thresholds:
From the Thresholds Library (on page 258) in the WhatsUp Gold Alert Center Libraries view, you can perform the following Device Over Subscription Threshold operations.
. Create a new Device Over Subscription Threshold.
From the WhatsUp Gold navigation menu: 1 Select the Settings tab, select Alerts and Actions and choose Alert Center.
Alert Center Libraries view displays. 2 Click the Device Over Subscription Threshold panel (if collapsed).
The Device Over Subscription Threshold displays.
3 On the Device Over Subscription Threshold panel, click "add" ( ). The Select Device Over Subscription Threshold Type dialog displays.
4 Choose Device Over Subscription Threshold and click OK. The Configure Threshold Alert dialog displays.
5 Edit the Device Over Subscription Threshold configuration.
. Adjust, tune, and configure an existing Device Over Subscription Threshold.
To configure a new Wireless Access Point Over subscription threshold: 1 Configure the following: Name. Specify a name for the threshold. This name helps you identify the
threshold in the Threshold library and displays as the report title on the Alert Center Home page.
Threshold. Select and enter the desired threshold criteria variables and values. The default threshold is configured to alert when the average number of clients attached exceeds the 'Client Count' for more than the specified 'Time Range'.
Devices to Monitor. Click Select to choose the devices to which the threshold applies. The Threshold Devices dialog appears. Specify to which devices the threshold applies by adding them or to which devices the threshold does not apply by excluding them using this dialog. Additionally, groups can also be added or excluded from the threshold using this dialog. Click OK.
Notification. Select the notification policy to apply to this threshold. This policy begins sending notifications when an item is outside the configured threshold limits. If you do not see an appropriate threshold policy, or if the list is empty, click browse (...) to open the Notification Policy dialog and configure a new policy.
Note: Notification policies are optional for most thresholds. If you do not select a notification policy, no notifications are generated for the threshold, but a dashboard report listing the out of threshold items still appears on the Alert Center Home page.

WhatsUp Gold User Guide
911
Threshold check. Enter a value for the threshold check interval, or the interval at which the Alert Center checks the Network Performance Monitor database to see if there are items that are out of the threshold's parameters. The default check interval is every 10 minutes.
Select Automatically resolve items no longer out of threshold to have Alert Center automatically resolve items when they go back inside the parameters of the threshold.
2 Click OK.
. Clone a new Device Over Subscription Threshold based on an existing Device Over Subscription Threshold's configuration.
Clone a threshold based on a custom or built-in configuration: 1 Click on a threshold on the Thresholds Library panel you want to copy.
2 Click the Copy button, and click OK to create a new Device Over Subscription Threshold. The Edit Device Over Subscription Threshold dialog displays.
3 Save or customize your new threshold, either: Type in a new value for Name field (or keep the default) and click OK to save to
the Thresholds Library.
Follow the Edit Device Over Subscription Threshold instructions.
. Remove Device Over Subscription Threshold from library.
Delete an existing Device Over Subscription Threshold: 1 Select Device Over Subscription Threshold you want to delete from the Device
Over Subscription Threshold panel.
2 Click the Delete button, and then click Yes to confirm the deletion. The Device Over Subscription Threshold configuration is deleted.
Excessive Rogue Threshold Managing Excessive Rogue Thresholds:
From the Thresholds Library (on page 258) in the WhatsUp Gold Alert Center Libraries view, you can perform the following Excessive Rogue Threshold operations.
. Create a new Excessive Rogue Threshold.
From the WhatsUp Gold navigation menu: 1 Select the Settings tab, select Alerts and Actions and choose Alert Center.
Alert Center Libraries view displays. 2 Click the Excessive Rogue Threshold panel (if collapsed).
The Excessive Rogue Threshold displays.
3 On the Excessive Rogue Threshold panel, click "add" ( ).

WhatsUp Gold User Guide
912
The Select Excessive Rogue Threshold Type dialog displays. 4 Choose Excessive Rogue Threshold and click OK.
The Configure Threshold Alert dialog displays. 5 Edit the Excessive Rogue Threshold configuration.
. Adjust, tune, and configure an existing Excessive Rogue Threshold.
To configure a new Wireless Excessive Rogues threshold: 1 Configure the following: Name. Specify a name for the threshold. This name helps you identify the
threshold in the Threshold library and displays as the report title on the Alert Center Home page.
Threshold. Select and enter the desired rogue alert threshold criteria. The default time range interval is 30 minutes.
Devices to Monitor. Click Select to choose the devices to which the threshold applies. The Threshold Devices dialog appears. Specify to which devices the threshold applies by adding them or to which devices the threshold does not apply by excluding them using this dialog. Additionally, groups can also be added or excluded from the threshold using this dialog. Click OK.
Notification. Select the notification policy to apply to this threshold. This policy begins sending notifications when an item is outside the configured threshold limits. If you do not see an appropriate threshold policy, or if the list is empty, click browse (...) to open the Notification Policy dialog and configure a new policy.
Note: Notification policies are optional for most thresholds. If you do not select a notification policy, no notifications are generated for the threshold, but a dashboard report listing the out of threshold items still appears on the Alert Center Home page.
Threshold Check. Enter a value for the threshold check interval, or the interval at which the Alert Center checks the Network Performance Monitor database to see if there are items that are out of the threshold's parameters. The default check interval is every 5 minutes.
Select Automatically resolve items no longer out of threshold to have Alert Center automatically resolve items when they go back inside the parameters of the threshold.
2 Click OK.
. Clone a new Excessive Rogue Threshold based on an existing Excessive Rogue Threshold's configuration.
Clone a threshold based on a custom or built-in configuration: 1 Click on a threshold on the Thresholds Library panel you want to copy.
2 Click the Copy button, and click OK to create a new Excessive Rogue Threshold.

WhatsUp Gold User Guide
913
The Edit Excessive Rogue Threshold dialog displays. 3 Save or customize your new threshold, either: Type in a new value for Name field (or keep the default) and click OK to save to
the Thresholds Library.
Follow the Edit Excessive Rogue Threshold instructions.
. Remove Excessive Rogue Threshold from library.
Delete an existing Excessive Rogue Threshold: 1 Select Excessive Rogue Threshold you want to delete from the Excessive Rogue
Threshold panel.
2 Click the Delete button, and then click Yes to confirm the deletion. The Excessive Rogue Threshold configuration is deleted.
Using Alert Center Notification Policy options
To access notification policy options: 1 Click the Alert Center tab. 2 Click Notification Policies. The Alert Center Notification Policies dialog appears. Click New to configure a new policy.
Select a policy, then click Edit to modify the policy configuration.
Select a policy, then click Copy to make a duplicate of the selected policy.
Select a policy, then click Delete to remove the policy from the dialog.

WhatsUp Gold User Guide
914
Caution: When you delete a policy from the list, it is removed from any threshold to which it is assigned.
Rogue Access Point MAC Address Threshold
Managing Rogue Access Point MAC Address Thresholds:
From the Thresholds Library (on page 258) in the WhatsUp Gold Alert Center Libraries view, you can perform the following Rogue Access Point MAC Address Threshold operations.
. Create a new Rogue Access Point MAC Address Threshold.
From the WhatsUp Gold navigation menu: 1 Select the Settings tab, select Alerts and Actions and choose Alert Center.
Alert Center Libraries view displays. 2 Click the Rogue Access Point MAC Address Threshold panel (if collapsed).
The Rogue Access Point MAC Address Threshold displays.
3 On the Rogue Access Point MAC Address Threshold panel, click "add" ( ). The Select Rogue Access Point MAC Address Threshold Type dialog displays.
4 Choose Rogue Access Point MAC Address Threshold and click OK. The Configure Threshold Alert dialog displays.
5 Edit the Rogue Access Point MAC Address Threshold configuration.
. Adjust, tune, and configure an existing Rogue Access Point MAC Address Threshold.
To configure a new Wireless Rogue Access Point MAC Addresses threshold: 1 Configure the following: Name. Specify a name for the threshold. This name helps you identify the
threshold in the Threshold library and displays as the report title on the Alert Center Home page.
Threshold. Enter any rogue MAC addresses separated by commas and select an interval time range. The default range is 30 minutes. The threshold will alert when any MAC addresses listed here broadcast SSID's in the given time interval.
Devices to Monitor. Click Select to choose the devices to which the threshold applies. The Threshold Devices dialog appears. Specify to which devices the threshold applies by adding them or to which devices the threshold does not apply by excluding them using this dialog. Additionally, groups can also be added or excluded from the threshold using this dialog. Click OK.

WhatsUp Gold User Guide
915
Notification. Select the notification policy to apply to this threshold. This policy begins sending notifications when an item is outside the configured threshold limits. If you do not see an appropriate threshold policy, or if the list is empty, click browse (...) to open the Notification Policy dialog and configure a new policy.
Note: Notification policies are optional for most thresholds. If you do not select a notification policy, no notifications are generated for the threshold, but a dashboard report listing the out of threshold items still appears on the Alert Center Home page.
Threshold Check. Enter a value for the threshold check interval, or the interval at which the Alert Center checks the Network Performance Monitor database to see if there are items that are out of the threshold's parameters. The default check interval is every 5 minutes.
Select Automatically resolve items no longer out of threshold to have Alert Center automatically resolve items when they go back inside the parameters of the threshold.
2 Click OK.
. Clone a new Rogue Access Point MAC Address Threshold based on an existing Rogue Access Point MAC Address Threshold's configuration.
Clone a threshold based on a custom or built-in configuration: 1 Click on a threshold on the Thresholds Library panel you want to copy.
2 Click the Copy button, and click OK to create a new Rogue Access Point MAC Address Threshold. The Edit Rogue Access Point MAC Address Threshold dialog displays.
3 Save or customize your new threshold, either: Type in a new value for Name field (or keep the default) and click OK to save to
the Thresholds Library.
Follow the Edit Rogue Access Point MAC Address Threshold instructions.
. Remove Rogue Access Point MAC Address Threshold from library.
Delete an existing Rogue Access Point MAC Address Threshold: 1 Select Rogue Access Point MAC Address Threshold you want to delete from the
Rogue Access Point MAC Address Threshold panel.
2 Click the Delete button, and then click Yes to confirm the deletion. The Rogue Access Point MAC Address Threshold configuration is deleted.

WhatsUp Gold User Guide
916
Rogue Hidden SSID Threshold Managing Rogue Hidden SSID Thresholds:
From the Thresholds Library (on page 258) in the WhatsUp Gold Alert Center Libraries view, you can perform the following Rogue Hidden SSID Threshold operations.
. Create a new Rogue Hidden SSID Threshold.
From the WhatsUp Gold navigation menu: 1 Select the Settings tab, select Alerts and Actions and choose Alert Center.
Alert Center Libraries view displays. 2 Click the Rogue Hidden SSID Threshold panel (if collapsed).
The Rogue Hidden SSID Threshold displays.
3 On the Rogue Hidden SSID Threshold panel, click "add" ( ). The Select Rogue Hidden SSID Threshold Type dialog displays.
4 Choose Rogue Hidden SSID Threshold and click OK. The Configure Threshold Alert dialog displays.
5 Edit the Rogue Hidden SSID Threshold configuration.
. Adjust, tune, and configure an existing Rogue Hidden SSID Threshold.
To configure a new Wireless Rogue Hidden SSID threshold: 1 Configure the following: Name. Specify a name for the threshold. This name helps you identify the
threshold in the Threshold library and displays as the report title on the Alert Center Home page.
Threshold. Click the hyperlink to edit the list of acceptable rogues and select an interval time range. The default range is 30 minutes.
Devices to Monitor. Click Select to choose the devices to which the threshold applies. The Threshold Devices dialog appears. Specify to which devices the threshold applies by adding them or to which devices the threshold does not apply by excluding them using this dialog. Additionally, groups can also be added or excluded from the threshold using this dialog. Click OK.
Notification. Select the notification policy to apply to this threshold. This policy begins sending notifications when an item is outside the configured threshold limits. If you do not see an appropriate threshold policy, or if the list is empty, click browse (...) to open the Notification Policy dialog and configure a new policy.
Note: Notification policies are optional for most thresholds. If you do not select a notification policy, no notifications are generated for the threshold, but a dashboard report listing the out of threshold items still appears on the Alert Center Home page.
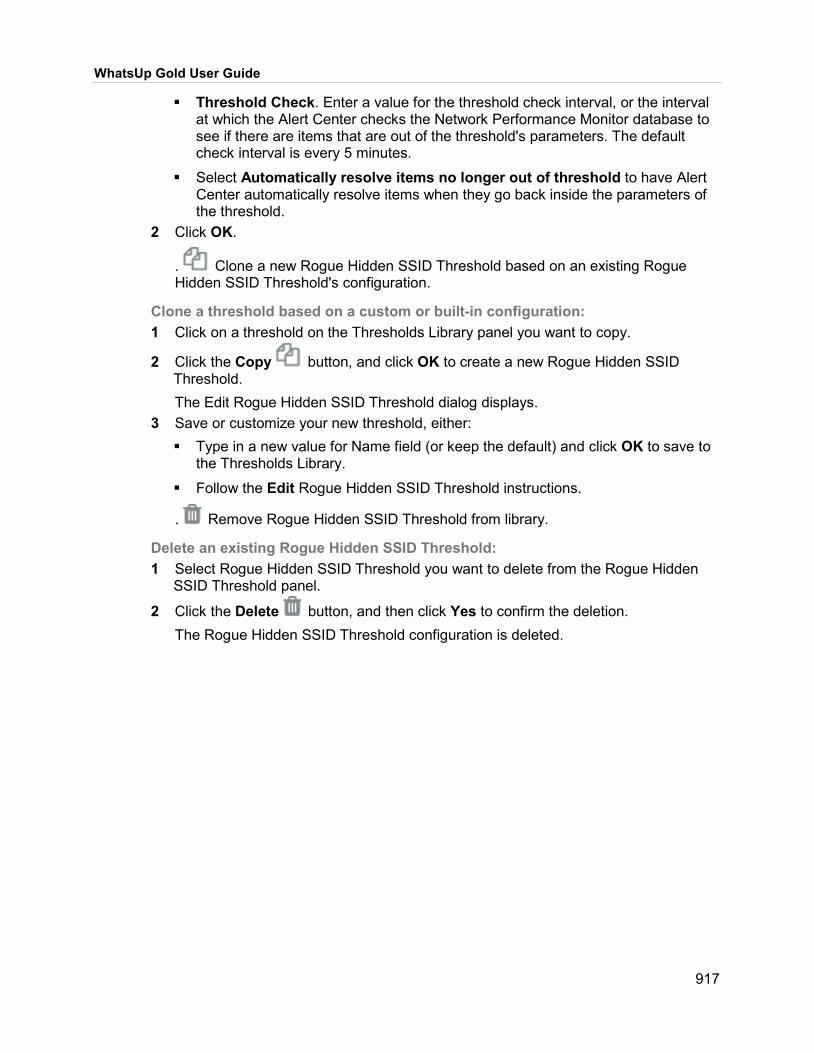
WhatsUp Gold User Guide
917
Threshold Check. Enter a value for the threshold check interval, or the interval at which the Alert Center checks the Network Performance Monitor database to see if there are items that are out of the threshold's parameters. The default check interval is every 5 minutes.
Select Automatically resolve items no longer out of threshold to have Alert Center automatically resolve items when they go back inside the parameters of the threshold.
2 Click OK.
. Clone a new Rogue Hidden SSID Threshold based on an existing Rogue Hidden SSID Threshold's configuration.
Clone a threshold based on a custom or built-in configuration: 1 Click on a threshold on the Thresholds Library panel you want to copy.
2 Click the Copy button, and click OK to create a new Rogue Hidden SSID Threshold. The Edit Rogue Hidden SSID Threshold dialog displays.
3 Save or customize your new threshold, either: Type in a new value for Name field (or keep the default) and click OK to save to
the Thresholds Library.
Follow the Edit Rogue Hidden SSID Threshold instructions.
. Remove Rogue Hidden SSID Threshold from library.
Delete an existing Rogue Hidden SSID Threshold: 1 Select Rogue Hidden SSID Threshold you want to delete from the Rogue Hidden
SSID Threshold panel.
2 Click the Delete button, and then click Yes to confirm the deletion. The Rogue Hidden SSID Threshold configuration is deleted.

WhatsUp Gold User Guide
918
Threshold Devices Use this dialog to specify the devices or device groups to which an Alert Center threshold does or does not apply.
To apply the threshold to all devices except for the device(s) or group of devices that you specify, select This threshold applies to ALL applicable devices EXCEPT. After you select this option, you will choose the devices to exclude from the threshold.
To apply the threshold to only the device(s) or group of devices that you specify, select This threshold applies to ONLY the following devices. After you select this option, you will choose the devices to include in the threshold.
To specify a device to exclude or include in the threshold, in the upper section of the dialog, click Add.
To specify a group of devices to exclude or include in the threshold, in the lower section of the dialog, click Add.
Note: When you add a device group to the list of exceptions, all devices within this device group, as well as any sub-groups contained within the group (and devices in those sub-groups), are excluded from, or include in the threshold. Additionally, if you add a device group to the list of exceptions that contains a device shortcut, then that device is excluded from the threshold—even if that device is also a member of another group which is not part of the list of excluded groups.

WhatsUp Gold User Guide
919
Tip: To delete a device or device group from the list, select it, then click Remove.
Rogue Specific SSID Threshold Managing Rogue Specific SSID Thresholds:
From the Thresholds Library (on page 258) in the WhatsUp Gold Alert Center Libraries view, you can perform the following Rogue Specific SSID Threshold operations.
. Create a new Rogue Specific SSID Threshold.
From the WhatsUp Gold navigation menu: 1 Select the Settings tab, select Alerts and Actions and choose Alert Center.
Alert Center Libraries view displays. 2 Click the Rogue Specific SSID Threshold panel (if collapsed).
The Rogue Specific SSID Threshold displays.
3 On the Rogue Specific SSID Threshold panel, click "add" ( ). The Select Rogue Specific SSID Threshold Type dialog displays.
4 Choose Rogue Specific SSID Threshold and click OK. The Configure Threshold Alert dialog displays.
5 Edit the Rogue Specific SSID Threshold configuration.
. Adjust, tune, and configure an existing Rogue Specific SSID Threshold.
To configure a new Wireless Rogue Specific SSID threshold: 1 Configure the following: Name. Specify a name for the threshold. This name helps you identify the
threshold in the Threshold library and displays as the report title on the Alert Center Home page.
Threshold. Enter one or more SSIDs and select an interval time range. The threshold is configured to alert when any of the listed SSIDs are detected in the specified time range. The default range is 30 minutes.
Devices to Monitor. Click Select to choose the devices to which the threshold applies. The Threshold Devices dialog appears. Specify to which devices the threshold applies by adding them or to which devices the threshold does not apply by excluding them using this dialog. Additionally, groups can also be added or excluded from the threshold using this dialog. Click OK.
Notification. Select the notification policy to apply to this threshold. This policy begins sending notifications when an item is outside the configured threshold limits. If you do not see an appropriate threshold policy, or if the list is empty, click browse (...) to open the Notification Policy dialog and configure a new policy.

WhatsUp Gold User Guide
920
Note: Notification policies are optional for most thresholds. If you do not select a notification policy, no notifications are generated for the threshold, but a dashboard report listing the out of threshold items still appears on the Alert Center Home page.
Threshold Check. Enter a value for the threshold check interval, or the interval at which the Alert Center checks the Network Performance Monitor database to see if there are items that are out of the threshold's parameters. The default check interval is every 5 minutes.
Select Automatically resolve items no longer out of threshold to have Alert Center automatically resolve items when they go back inside the parameters of the threshold.
2 Click OK.
. Clone a new Rogue Specific SSID Threshold based on an existing Rogue Specific SSID Threshold's configuration.
Clone a threshold based on a custom or built-in configuration: 1 Click on a threshold on the Thresholds Library panel you want to copy.
2 Click the Copy button, and click OK to create a new Rogue Specific SSID Threshold. The Edit Rogue Specific SSID Threshold dialog displays.
3 Save or customize your new threshold, either: Type in a new value for Name field (or keep the default) and click OK to save to
the Thresholds Library.
Follow the Edit Rogue Specific SSID Threshold instructions.
. Remove Rogue Specific SSID Threshold from library.
Delete an existing Rogue Specific SSID Threshold: 1 Select Rogue Specific SSID Threshold you want to delete from the Rogue Specific
SSID Threshold panel.
2 Click the Delete button, and then click Yes to confirm the deletion. The Rogue Specific SSID Threshold configuration is deleted.
Rogue Unknown SSID Threshold Managing Rogue Unknown SSID Thresholds:
From the Thresholds Library (on page 258) in the WhatsUp Gold Alert Center Libraries view, you can perform the following Rogue Unknown SSID Threshold operations.
. Create a new Rogue Unknown SSID Threshold.
From the WhatsUp Gold navigation menu: 1 Select the Settings tab, select Alerts and Actions and choose Alert Center.

WhatsUp Gold User Guide
921
Alert Center Libraries view displays. 2 Click the Rogue Unknown SSID Threshold panel (if collapsed).
The Rogue Unknown SSID Threshold displays.
3 On the Rogue Unknown SSID Threshold panel, click "add" ( ). The Select Rogue Unknown SSID Threshold Type dialog displays.
4 Choose Rogue Unknown SSID Threshold and click OK. The Configure Threshold Alert dialog displays.
5 Edit the Rogue Unknown SSID Threshold configuration.
. Adjust, tune, and configure an existing Rogue Unknown SSID Threshold.
To configure a new Wireless Rogue Unknown SSID threshold: 1 Configure the following: Name. Specify a name for the threshold. This name helps you identify the
threshold in the Threshold library and displays as the report title on the Alert Center Home page.
Threshold. The threshold is configured to alert when any new or previously unseen SSIDs are detected in the specified time range. The default range is 30 minutes.
Devices to Monitor. Click Select to choose the devices to which the threshold applies. The Threshold Devices dialog appears. Specify to which devices the threshold applies by adding them or to which devices the threshold does not apply by excluding them using this dialog. Additionally, groups can also be added or excluded from the threshold using this dialog. Click OK.
Notification. Select the notification policy to apply to this threshold. This policy begins sending notifications when an item is outside the configured threshold limits. If you do not see an appropriate threshold policy, or if the list is empty, click browse (...) to open the Notification Policy dialog and configure a new policy.
Note: Notification policies are optional for most thresholds. If you do not select a notification policy, no notifications are generated for the threshold, but a dashboard report listing the out of threshold items still appears on the Alert Center Home page.
Threshold Check. Enter a value for the threshold check interval, or the interval at which the Alert Center checks the Network Performance Monitor database to see if there are items that are out of the threshold's parameters. The default check interval is every 5 minutes.
Select Automatically resolve items no longer out of threshold to have Alert Center automatically resolve items when they go back inside the parameters of the threshold.
2 Click OK.

WhatsUp Gold User Guide
922
. Clone a new Rogue Unknown SSID Threshold based on an existing Rogue Unknown SSID Threshold's configuration.
Clone a threshold based on a custom or built-in configuration: 1 Click on a threshold on the Thresholds Library panel you want to copy.
2 Click the Copy button, and click OK to create a new Rogue Unknown SSID Threshold. The Edit Rogue Unknown SSID Threshold dialog displays.
3 Save or customize your new threshold, either: Type in a new value for Name field (or keep the default) and click OK to save to
the Thresholds Library.
Follow the Edit Rogue Unknown SSID Threshold instructions.
. Remove Rogue Unknown SSID Threshold from library.
Delete an existing Rogue Unknown SSID Threshold: 1 Select Rogue Unknown SSID Threshold you want to delete from the Rogue
Unknown SSID Threshold panel.
2 Click the Delete button, and then click Yes to confirm the deletion. The Rogue Unknown SSID Threshold configuration is deleted.
Wireless Access Point RSSI Threshold Managing Wireless Access Point RSSI Thresholds:
From the Thresholds Library (on page 258) in the WhatsUp Gold Alert Center Libraries view, you can perform the following Wireless Access Point RSSI Threshold operations.
. Create a new Wireless Access Point RSSI Threshold.
From the WhatsUp Gold navigation menu: 1 Select the Settings tab, select Alerts and Actions and choose Alert Center.
Alert Center Libraries view displays. 2 Click the Wireless Access Point RSSI Threshold panel (if collapsed).
The Wireless Access Point RSSI Threshold displays.
3 On the Wireless Access Point RSSI Threshold panel, click "add" ( ). The Select Wireless Access Point RSSI Threshold Type dialog displays.
4 Choose Wireless Access Point RSSI Threshold and click OK. The Configure Threshold Alert dialog displays.
5 Edit the Wireless Access Point RSSI Threshold configuration.

WhatsUp Gold User Guide
923
. Adjust, tune, and configure an existing Wireless Access Point RSSI Threshold.
To configure a new Wireless Access Point RSSI (Received Signal Strength Indication) threshold: 1 Configure the following: Name. Specify a name for the threshold. This name helps you identify the
threshold in the Threshold library and displays as the report title on the Alert Center Home page.
Threshold. Select and enter the desired threshold criteria variables and values. The default threshold is configured to alert when RSSI falls below 20% for more than 30 minutes. Additionally, specify the minimum number of clients to user in the averaging. The default minimum is 3.
Devices to Monitor. Click Select to choose the devices to which the threshold applies. The Threshold Devices dialog appears. Specify to which devices the threshold applies by adding them or to which devices the threshold does not apply by excluding them using this dialog. Additionally, groups can also be added or excluded from the threshold using this dialog.Click OK.
Notification. Select the notification policy to apply to this threshold. This policy begins sending notifications when an item is outside the configured threshold limits. If you do not see an appropriate threshold policy, or if the list is empty, click browse (...) to open the Notification Policy dialog and configure a new policy.
Note: Notification policies are optional for most thresholds. If you do not select a notification policy, no notifications are generated for the threshold, but a dashboard report listing the out of threshold items still appears on the Alert Center Home page.
Threshold check. Enter a value for the threshold check interval, or the interval at which the Alert Center checks the Network Performance Monitor database to see if there are items that are out of the threshold's parameters. The default check interval is every 5 minutes.
Select Automatically resolve items no longer out of threshold to have Alert Center automatically resolve items when they go back inside the parameters of the threshold.
2 Click OK.
. Clone a new Wireless Access Point RSSI Threshold based on an existing Wireless Access Point RSSI Threshold's configuration.
Clone a threshold based on a custom or built-in configuration: 1 Click on a threshold on the Thresholds Library panel you want to copy.
2 Click the Copy button, and click OK to create a new Wireless Access Point RSSI Threshold. The Edit Wireless Access Point RSSI Threshold dialog displays.
3 Save or customize your new threshold, either:

WhatsUp Gold User Guide
924
Type in a new value for Name field (or keep the default) and click OK to save to the Thresholds Library.
Follow the Edit Wireless Access Point RSSI Threshold instructions.
. Remove Wireless Access Point RSSI Threshold from library.
Delete an existing Wireless Access Point RSSI Threshold: 1 Select Wireless Access Point RSSI Threshold you want to delete from the
Wireless Access Point RSSI Threshold panel.
2 Click the Delete button, and then click Yes to confirm the deletion. The Wireless Access Point RSSI Threshold configuration is deleted.
Wireless Clients Bandwidth Threshold Managing Wireless Clients Bandwidth Thresholds:
From the Thresholds Library (on page 258) in the WhatsUp Gold Alert Center Libraries view, you can perform the following Wireless Clients Bandwidth Threshold operations.
. Create a new Wireless Clients Bandwidth Threshold.
To configure a new Wireless Client Bandwidth threshold: 1 Configure the following: Name. Specify a name for the threshold. This name helps you identify the
threshold in the Threshold library and displays as the report title on the Alert Center Home page.
Threshold. Select and enter the desired threshold criteria variables and values. The threshold will alert when clients that are connected to the specified SSID(s) exceed their bandwidth quota for the specified traffic direction, in the given time range. The default criteria is 20 MB transmitted and received in a time range of 30 minutes.
Devices to Monitor. Click Select to choose the devices to which the threshold applies. The Threshold Devices dialog appears. The user has the option to specify to which devices the threshold applies by adding them or to which devices the threshold does not apply by excluding them using this dialog. Additionally, groups can also be added or excluded from the threshold using this dialog. Click OK.
Notification. Select the notification policy to apply to this threshold. This policy begins sending notifications when an item is outside the configured threshold limits. If you do not see an appropriate threshold policy, or if the list is empty, click browse (...) to open the Notification Policy dialog and configure a new policy.
Tip: Notification policies are optional for most thresholds. Out of threshold items still appear on the Alert Center dashboard.

WhatsUp Gold User Guide
925
Threshold check. Enter a value for the threshold check interval, or the interval at which the Alert Center checks the Network Performance Monitor database to see if there are items that are out of the threshold's parameters. The default check interval is every 5 minutes.
Select Automatically resolve items no longer out of threshold to have Alert Center automatically resolve items when they go back inside the parameters of the threshold.
2 Click OK.
. Adjust, tune, and configure an existing Wireless Clients Bandwidth Threshold.
To configure a new Wireless Client Bandwidth threshold: 1 Configure the following: Name. Specify a name for the threshold. This name helps you identify the
threshold in the Threshold library and displays as the report title on the Alert Center Home page.
Threshold. Select and enter the desired threshold criteria variables and values. The threshold will alert when clients that are connected to the specified SSID(s) exceed their bandwidth quota for the specified traffic direction, in the given time range. The default criteria is 20 MB transmitted and received in a time range of 30 minutes.
Devices to Monitor. Click Select to choose the devices to which the threshold applies. The Threshold Devices dialog appears. The user has the option to specify to which devices the threshold applies by adding them or to which devices the threshold does not apply by excluding them using this dialog. Additionally, groups can also be added or excluded from the threshold using this dialog. Click OK.
Notification. Select the notification policy to apply to this threshold. This policy begins sending notifications when an item is outside the configured threshold limits. If you do not see an appropriate threshold policy, or if the list is empty, click browse (...) to open the Notification Policy dialog and configure a new policy.
Tip: Notification policies are optional for most thresholds. Out of threshold items still appear on the Alert Center dashboard.
Threshold check. Enter a value for the threshold check interval, or the interval at which the Alert Center checks the Network Performance Monitor database to see if there are items that are out of the threshold's parameters. The default check interval is every 5 minutes.
Select Automatically resolve items no longer out of threshold to have Alert Center automatically resolve items when they go back inside the parameters of the threshold.
2 Click OK.

WhatsUp Gold User Guide
926
. Clone a new Wireless Clients Bandwidth Threshold based on an existing Wireless Clients Bandwidth Threshold's configuration.
Clone a threshold based on a custom or built-in configuration: 1 Click on a threshold on the Thresholds Library panel you want to copy.
2 Click the Copy button, and click OK to create a new Wireless Clients Bandwidth Threshold. The Edit Wireless Clients Bandwidth Threshold dialog displays.
3 Save or customize your new threshold, either: Type in a new value for Name field (or keep the default) and click OK to save to
the Thresholds Library.
Follow the Edit Wireless Clients Bandwidth Threshold instructions.
. Remove Wireless Clients Bandwidth Threshold from library.
Delete an existing Wireless Clients Bandwidth Threshold: 1 Select Wireless Clients Bandwidth Threshold you want to delete from the Wireless
Clients Bandwidth Threshold panel.
2 Click the Delete button, and then click Yes to confirm the deletion. The Wireless Clients Bandwidth Threshold configuration is deleted.
SMS Action Notification Managing SMS Action Notifications:
From the Notifications Library (on page 260) in the WhatsUp Gold Alert Center Libraries (on page 258) view, you can perform the following SMS Action Notification operations.
. Create a new SMS Action Notification.
Add a notification type: 1 From Alert Center Libraries (on page 258), click the Notification Library panel (if
collapsed). The Notifications Library (on page 260) displays.
2 On the Notifications Library panel, click "add" ( ). The Select Notification Type dialog displays.
3 Choose a notification type and click OK. The New Notification Type dialog displays.
4 Edit the SMS Action Notification Type configuration.

WhatsUp Gold User Guide
927
. Adjust, tune, and configure an existing SMS Action Notification.
Note: Alert Center SMS notifications and Network Performance Monitor SMS actions use the same configuration dialog. For more information about SMS Actions, see Adding and editing an SMS Action (on page 202).
To edit/configure an SMS action notification: 1 Configure the following fields in the edit/new SMS Action dialog (Alert Center
Libraries (on page 258) > Notification Library panel).
2 Configure the following: Name. Enter a unique display name to identify the SMS notification.
Description. Enter a short description of the action. This description is displayed in the Action Library along with the action name.
Country. Select the country for the SMS provider from the list.
Provider. Select the appropriate SMS provider from the list.
Note: If the provider list is incomplete and/or incorrect, you can click browse (...), then click New or Edit to add or edit an SMS provider.

WhatsUp Gold User Guide
928
Mode. Select either Email or Dialup, depending on the Provider configuration in the system.
Email to. If Email is selected as the Mode, type the SMS device email address.
Phone Number. If Dialup is selected as the Mode, type the phone number to call with the message. You can enter multiple phone numbers, separated by a comma. There is a 2,000-character limit in this boxes, so you can enter many numbers.
Note: Non-numeric characters such as "-" and "." are ignored.
3 In the Alert Center Message boxes, specify the options pertaining to the message that is to be sent from an Network Performance Monitor Alert Center notification. Enter a text message plus any necessary percent variable codes. Keep in mind that using percent variables can greatly increase the character count.
Tip: To add Alert Center percent variables (on page 858), right-click inside the message boxes and make selections from the lists.
Note: The size limit for the message is 160 characters (140 bytes).
4 Click OK to save the changes.
. Clone a new SMS Action Notification based on an existing SMS Action Notification's configuration.
Clone a notification based on an existing SMS Action Notification: 1 Click on a notification you want to copy within the Notification Library panel.
2 Click the Copy button, and click OK to create a new SMS Action Notification. The Edit SMS Action Notification dialog displays.
3 Save or customize your new SMS Action Notification, either: Type in a new value for Name field (or keep the default) and click OK to save to
the Notifications Library.
Follow the Edit SMS Action Notification instructions.
. Remove SMS Action Notification from library.
Delete an existing SMS Action Notification: 1 Select SMS Action Notification you want to delete from the SMS Action Notification
panel.
2 Click the Delete button, and then click Yes to confirm the deletion. The SMS Action Notification configuration is deleted.

WhatsUp Gold User Guide
929
SMS Direct Notification Managing SMS Direct Notifications:
From the Notifications Library (on page 260) in the WhatsUp Gold Alert Center Libraries (on page 258) view, you can perform the following SMS Direct Notification operations.
. Create a new SMS Direct Notification.
Add a notification type: 1 From Alert Center Libraries (on page 258), click the Notification Library panel (if
collapsed). The Notifications Library (on page 260) displays.
2 On the Notifications Library panel, click "add" ( ). The Select Notification Type dialog displays.
3 Choose a notification type and click OK. The New Notification Type dialog displays.
4 Edit the SMS Direct Notification Type configuration.
. Adjust, tune, and configure an existing SMS Direct Notification.
Alert Center SMS Direct notifications and Network Performance Monitor SMS Direct actions use the same configuration dialog.
For more information about SMS Direct Actions, see Adding and editing an SMS Direct Action (on page 203).
To configure an SMS Direct notification: 1 Go to the Index, then navigate to Network Performance Monitor > Alerts &
Actions > Alert Center > Notifications.

WhatsUp Gold User Guide
930
2 Click Create New. The Select Notification Type dialog appears. 3 Select SMS Direct. The New SMS Direct Action dialog appears.
4 Configure the following. Name. Enter a name for this notification. This name is for your reference only
and is not displayed to the notification recipient.
Description. Create or modify the description. This description appears in the Action Library and is for your reference only.
Phone number. Enter the cell phone number(s) of the intended SMS message recipients.
Note: All non-numeric characters such as "-" and ".", are ignored.

WhatsUp Gold User Guide
931
Note: There is a 2,000 character limit in this boxes, so you can enter many numbers.
COM Port. Select the COM port you want to use with this notification.
Note: The list displays all ports associated with the GSM modem, including virtual and hard-wired, serial ports. You must select the port that is assigned to the modem in the Windows Device Manager.
5 Select the Alert Center Message tab to specify the appropriate settings for the SMS notification message. The Alert Center Message tab contains options pertaining to the message that is to be sent from an Network Performance Monitor Alert Center notification. Enter a text message plus any necessary percent variable (on page 851) snippets. Note that embedding percent variables (on page 851) can expand actual character count.
Tip: To enter Alert Center percent variables (on page 858), right-click inside the message boxes.
Note: The size limit for the message is 160 characters (140 bytes).
6 Click OK to save changes. Enter a text message plus any desired percent variable codes. Keep in mind that if you use percent variables, this greatly increases the character count.
Tip: To enter Alert Center percent variables, right click inside the message boxes.
Note: If the message exceeds 140 characters, the message is broken into up to 3 parts and is sent as separate messages ("1 of 3", "1 of 2", etc.).
7 Click OK to save changes.
. Clone a new SMS Direct Notification based on an existing SMS Direct Notification's configuration.
Clone a notification based on an existing SMS Direct Notification: 1 Click on a notification you want to copy within the Notification Library panel.
2 Click the Copy button, and click OK to create a new SMS Direct Notification. The Edit SMS Direct Notification dialog displays.
3 Save or customize your new SMS Direct Notification, either: Type in a new value for Name field (or keep the default) and click OK to save to
the Notifications Library.
Follow the Edit SMS Direct Notification instructions.

WhatsUp Gold User Guide
932
. Remove SMS Direct Notification from library.
Delete an existing SMS Direct Notification: 1 Select SMS Direct Notification you want to delete from the SMS Direct Notification
panel.
2 Click the Delete button, and then click Yes to confirm the deletion. The SMS Direct Notification configuration is deleted.
Email Notification Managing Email Notifications:
From the Notifications Library (on page 260) in the WhatsUp Gold Alert Center Libraries (on page 258) view, you can perform the following Email Notification operations.
. Create a new Email Notification.
Add a notification type: 1 From Alert Center Libraries (on page 258), click the Notification Library panel (if
collapsed). The Notifications Library (on page 260) displays.
2 On the Notifications Library panel, click "add" ( ). The Select Notification Type dialog displays.
3 Choose a notification type and click OK. The New Notification Type dialog displays.
4 Edit the Email Notification Type configuration.
. Adjust, tune, and configure an existing Email Notification.
Note: Alert Center email notifications and Network Performance Monitor email actions use the same configuration dialog. For more information about email actions, see Adding and editing an Email action (on page 194).
To configure an email notification: 1 Provide the following: Name. Name for the action.
Description. Optional description. 2 Click the Alert Center Settings tab to complete options for the Network
Performance Monitor Alert Center notification. Alert Center Email Subject. Subject line for the email (can include Alert Center
percent variables).

WhatsUp Gold User Guide
933
Alert Center Link. Select Include hyperlink to Alert Center in the email content to include a link to the Alerts Home page in the email message sent by the Alert Center notification.
Protocol. Variant of HTTP used for WhatsUp Gold Alert Center status page. (Choose one).
Use HTTP.
Use HTTPS.
Current Host Use dynamic address. Provide the current hostname or IP address at the
time the action runs.
Use static hostname or IP address. Provide a static hostname or IP address, type the server address in the boxes. (Helpful when your site uses a web proxy).
Port. Specify the specific port to include in the link URL.
Important: The address you enter here must be the exact address of the Alerts Home page to which you want to connect. Verify the address and enter its exact contents in the above options.
Note: Click the Configuration tab to edit the email action settings and specify a destination address for the notification.
3 Click OK to save changes.
. Clone a new Email Notification based on an existing Email Notification's configuration.
Clone a notification based on an existing Email Notification: 1 Click on a notification you want to copy within the Notification Library panel.
2 Click the Copy button, and click OK to create a new Email Notification. The Edit Email Notification dialog displays.
3 Save or customize your new Email Notification, either: Type in a new value for Name field (or keep the default) and click OK to save to
the Notifications Library.
Follow the Edit Email Notification instructions.
. Remove Email Notification from library.
Delete an existing Email Notification: 1 Select Email Notification you want to delete from the Email Notification panel.
2 Click the Delete button, and then click Yes to confirm the deletion. The Email Notification configuration is deleted.

WhatsUp Gold User Guide
934
Manage Notification Policies Managing Manage Notification Policies:
From the Notification Policies Library (on page 260) in the WhatsUp Gold Alert Center Libraries (on page 258) view, you can perform the following Manage Notification Policies operations.
. Create new Manage Notification Policies.
To add a notification policy to the Notification Policies Library: 1 From the Notification Policies Library, click the 'add' icon( ).
The New Alert Center Notification Policy dialog displays.
2 Modify the appropriate information. Name. Identifies the policy in the Alert Center Notification Policies dialog.
Description. Optional description. 3 Click the Step 1, Step 2, and Step 3 checkboxes to select a notification schedule
for each notification profile and for each of the three (3) phases in the notification policy sequence. Step 1 of the notification policy begins as soon as an item falls out of the
threshold.
Click browse (...) to open the Notification Library and configure a new notification.
4 Specify time interval between Escalation Steps.

WhatsUp Gold User Guide
935
You can choose to repeat Step 3 of the policy at a regular interval until the notification is stopped. By default, the policy is set to repeat step 3 every hour until the notification is stopped.
In order for the repeat function to work properly, Step 3 must be enabled for at least one notification in the policy.
Click Show me a graph of this notification policy in action to see the escalation schedule.
5 Click OK to apply your changes and save them to the Notifications Policy.
. Adjust, tune, and configure existing Manage Notification Policies.
To edit a notification policy in the Notifications Library:
1 Select an existing Notification Policy, then click the pencil button ( ). The Edit Alert Center Notification Policy dialog displays.
2 Edit text fields. Name. Identifies the policy in the Alert Center Notification Policies dialog.
Description. Optional description.

WhatsUp Gold User Guide
936
3 Click the Step 1, Step 2, and Step 3 checkboxes to select or clear the notification schedule for each notification profile and each of the three (3) phases in the notification policy sequence.
4 Specify time interval between Escalation Steps. You can choose to repeat step 3 of the policy at a regular interval until the
notification is stopped. By default, the policy is set to repeat step 3 every hour until the notification is stopped.
Click Show me a graph of this notification policy in action to see a graphical schedule (on page 937) of the escalation steps.
5 Click OK to apply your changes and save them to the Notifications Policy.
. Create policy cloned from the configuration of existing Manage Notification Policies.
Clone a notification policy based on an existing policy: 1 Click on a Manage Notification Policies you want to copy, from the Manage
Notification Policies panel.
2 Click the Copy button, and click OK to create a new Manage Notification Policies.
3 Save or customize your new Manage Notification Policies, either: Type in a new value for Name field (or keep the default) and click OK to save to
the Manage Notification Policies Library.
Follow the Edit Manage Notification Policies instructions.
. Remove Manage Notification Policies from library.
Delete a Manage Notification Policies: 1 Click an existing Manage Notification Policies you want to delete from the Manage
Notification Policies Library panel.
2 Click the Delete button, and then click Yes to confirm the deletion. The Manage Notification Policies configuration is deleted.

WhatsUp Gold User Guide
937
Visualize Escalation Schedule Notification Policies in WhatsUp Gold enable you to ensure critical application, host, and network infrastructure controls follow a shared sequence of awareness and chain of escalation and responsibility.
Tip: Implementing escalation policies enables effective incident and risk management. These policies enable you to associate monitors and thresholds with comprehensive alert notification schedules. These controls help your site comply with critical aspects of security management and information assurance specifications such as HIPAA, PCI, SOX and so on.
Click the graph icon in the New/Edit Notification Policy dialog box to see a graphical
representation of this escalation schedule . For example, the following selection:

WhatsUp Gold User Guide
938
—generates an escalation graph like this:
Blackout Policies Managing Blackout Policies:
From the Notification Policies Library (on page 260) in the WhatsUp Gold Alert Center Libraries (on page 258) view, you can perform the following Blackout Policies operations.
. Create new Blackout Policies.
From the WhatsUp Gold navigation menu: 1 Select Settings > Alerts and Actions > Alert Center.
Alert Center Libraries view displays. 2 Click Blackout Policies panel (to expand it if collapsed).
Blackout Policies Library displays.
3 Click the "add" button ( ).
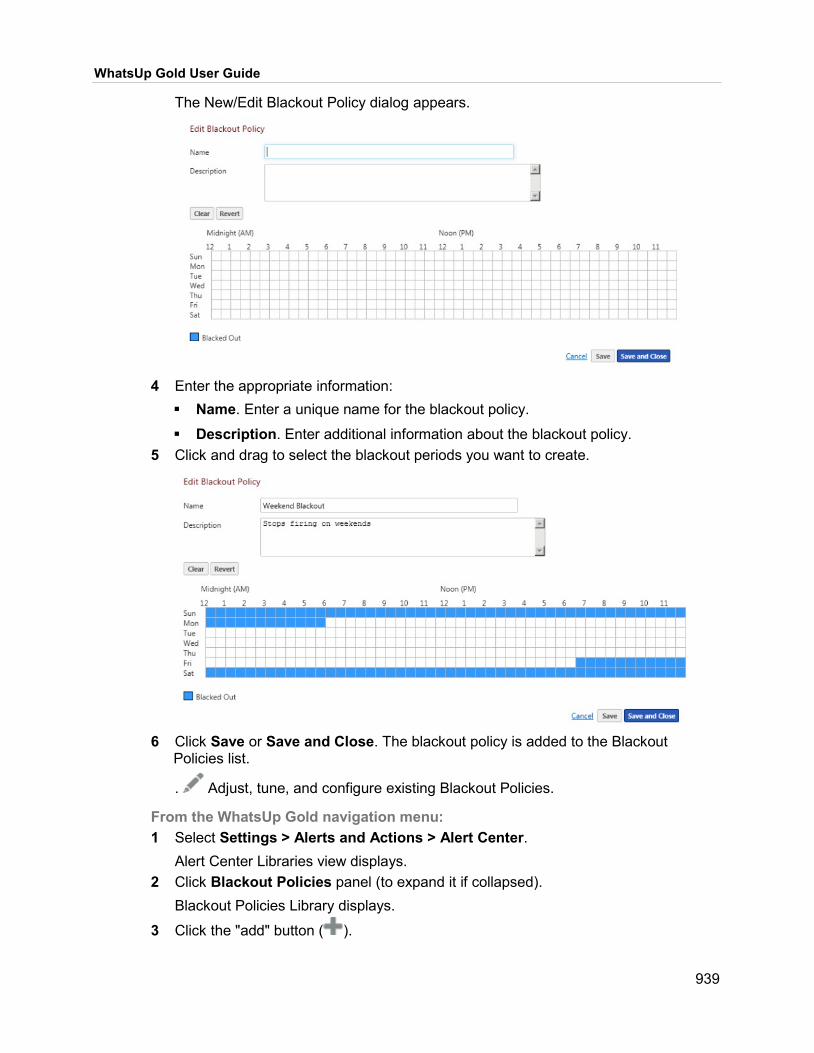
WhatsUp Gold User Guide
939
The New/Edit Blackout Policy dialog appears.
4 Enter the appropriate information: Name. Enter a unique name for the blackout policy.
Description. Enter additional information about the blackout policy. 5 Click and drag to select the blackout periods you want to create.
6 Click Save or Save and Close. The blackout policy is added to the Blackout
Policies list.
. Adjust, tune, and configure existing Blackout Policies.
From the WhatsUp Gold navigation menu: 1 Select Settings > Alerts and Actions > Alert Center.
Alert Center Libraries view displays. 2 Click Blackout Policies panel (to expand it if collapsed).
Blackout Policies Library displays.
3 Click the "add" button ( ).

WhatsUp Gold User Guide
940
The New/Edit Blackout Policy dialog appears.
4 Enter the appropriate information: Name. Enter a unique name for the blackout policy.
Description. Enter additional information about the blackout policy. 5 Click and drag to select the blackout periods you want to create.
6 Click Save or Save and Close. The blackout policy is added to the Blackout
Policies list.
. Create policy cloned from the configuration of existing Blackout Policies.
Clone a notification policy based on an existing policy: 1 Click on a Blackout Policies you want to copy, from the Blackout Policies panel.
2 Click the Copy button, and click OK to create a new Blackout Policies. 3 Save or customize your new Blackout Policies, either: Type in a new value for Name field (or keep the default) and click OK to save to
the Blackout Policies Library.

WhatsUp Gold User Guide
941
Follow the Edit Blackout Policies instructions.
. Remove Blackout Policies from library.
Delete a Blackout Policies: 1 Click an existing Blackout Policies you want to delete from the Blackout Policies
Library panel.
2 Click the Delete button, and then click Yes to confirm the deletion. The Blackout Policies configuration is deleted.
Example: On Call Rotation The following illustrates the scenario where a shared pager or other notification task is blacked out for normal business hours but on call for evenings and weekends.
For the individual or group on-call this includes:
Managing alert notifications continuously on Saturday and Sunday. Managing alert notification for 'second shift' (3:00 pm to 11:00 pm) from Monday
through Friday. Blackout for all other periods (such as normal business hours when most teams
are fully resourced).
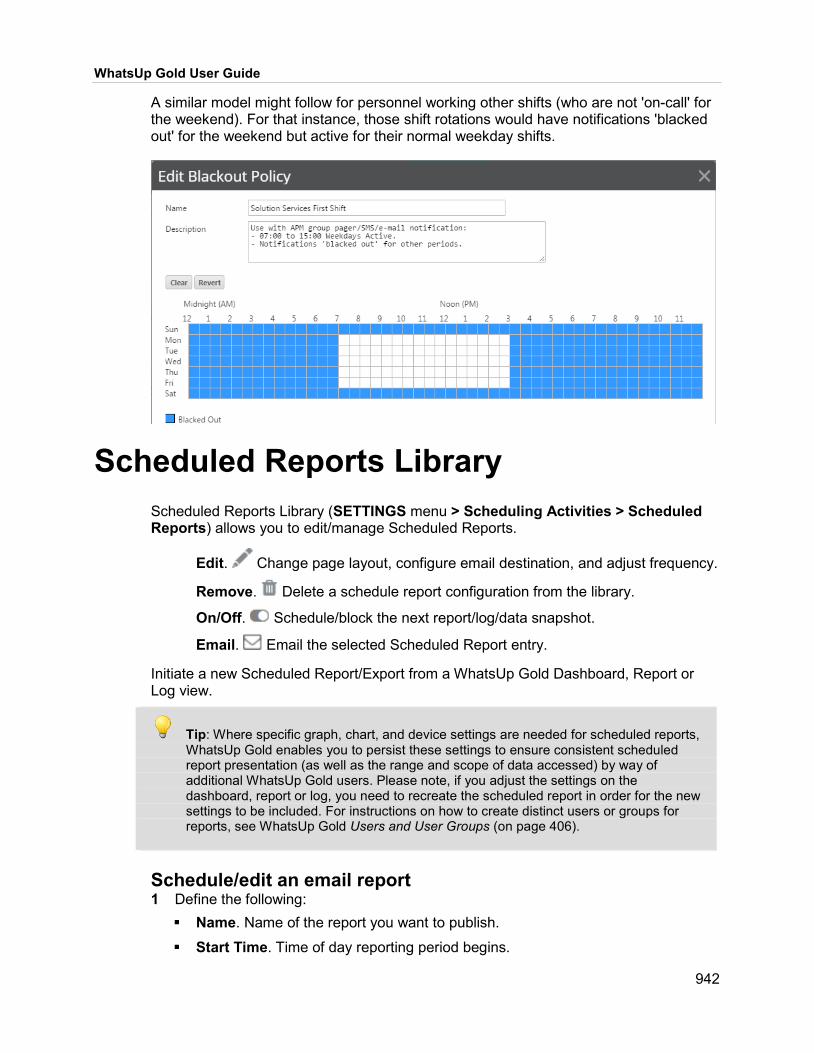
WhatsUp Gold User Guide
942
A similar model might follow for personnel working other shifts (who are not 'on-call' for the weekend). For that instance, those shift rotations would have notifications 'blacked out' for the weekend but active for their normal weekday shifts.
Scheduled Reports Library Scheduled Reports Library (SETTINGS menu > Scheduling Activities > Scheduled Reports) allows you to edit/manage Scheduled Reports.
Edit. Change page layout, configure email destination, and adjust frequency.
Remove. Delete a schedule report configuration from the library.
On/Off. Schedule/block the next report/log/data snapshot.
Email. Email the selected Scheduled Report entry.
Initiate a new Scheduled Report/Export from a WhatsUp Gold Dashboard, Report or Log view.
Tip: Where specific graph, chart, and device settings are needed for scheduled reports, WhatsUp Gold enables you to persist these settings to ensure consistent scheduled report presentation (as well as the range and scope of data accessed) by way of additional WhatsUp Gold users. Please note, if you adjust the settings on the dashboard, report or log, you need to recreate the scheduled report in order for the new settings to be included. For instructions on how to create distinct users or groups for reports, see WhatsUp Gold Users and User Groups (on page 406).
Schedule/edit an email report 1 Define the following: Name. Name of the report you want to publish.
Start Time. Time of day reporting period begins.

WhatsUp Gold User Guide
943
2 Determine the frequency of the report: Daily. Breakdown the report frequency in the order of days. (Every day, every
other day.)
Weekly. Breakdown the report frequency in the order of weeks or days of the week.
Monthly. Apply the report frequency on a monthly schedule.
Custom. Apply the report frequency on a custom schedule. (Number of minutes, hours, days, months or years).
3 Define the Export Options: Export Type. Select PDF, Excel (xml), CSV, or TXT.
Page size. Select page size. (PDF Only)
Page orientation. Select Portrait or Landscape. (PDF Only)
Note: Please note, reports exported to XML, CSV, or TXT format is unformatted raw data so the format can be customized to fit your reporting needs. Also note that reports exported to PDF format are limited to 2000 records.
4 Configure the email details for the report. To. Enter email addresses for the intended recipients. Email addresses should
be separated by a comma.
From. Enter an email address for the report sender.
Subject. Enter a subject for the email message, if required. 5 Configure the SMTP and email account details: SMTP Server. Enter the name of the mail server.
Port. Change the port number, if required. The default value is 25.
Timeout. Change the length of time (in seconds) to wait for a response from the SMTP server for each command Network Performance Monitor issues. If the limit is exceeded, the request will fail.
Use SMTP authentication. Select if the SMTP server requires authentication. If selected, enter a user name and password for authentication purposes.
Use encrypted connection (SSL/TLS). Select if your SMTP sever supports encrypting data over a TLS connection (formerly known as SSL).
6 Click Test Email to confirm the connection information entered is valid and functions as expected.
7 Click OK. The updated scheduled report can be viewed from the Scheduled Reports Library.
System Status and Properties Device Status (on page 417) . Exit to Device Status (on page 417)
dashboard.

WhatsUp Gold User Guide
944
Refresh . Refresh Device Properties (on page 86) data.
Device Management Actions (on page 179) . Troubleshoot/perform management operations.
[Other operations]. Rescan, Copy, Poll, drop to Maintenance Mode.
Tools (on page 181). Gather information and troubleshoot: Traceroute, DNS Lookup, Task Manager, Ping, or check ARP cache of neighboring devices (Address Finder).
Choosing Business Hours Register a Business Hours entry to aggregate and reveal data for those periods relevant to your active monitor, report, or management task.
Register a new entry for the Business Hours Library: 1 From the Business Hours drop down list, choose Business Hours Library. 2 Click Add to create a new Business Hours entry. Otherwise, to clone and re-use
an existing entry, click Copy, select the cloned entry, and then click Edit. The Edit Business Hours dialog displays.
3 Click to select the 1/4 hour intervals and days of the week you want to show data for.
4 Add or edit the Business Hours record name or keep the default. 5 Click Save.
The Business Hours entry is saved to the Business Hours Library.
Define a Date Range From the Date Range drop down selector, you can choose:
A pre-configured date range relative to now (Week to Date, for example). A specific date range relative to now (Last n Days, for example). A custom range that you specify.
Note: For defining measurement intervals that are periodic, such as measurements that occur within specific hours of the day or days of the week, you can create a range using the Business Hours (on page 944) control.

WhatsUp Gold User Guide
945
Enable Virtual Monitoring Event Listeners (VMware)
Start/stop log event collection Enable Virtual Monitoring event collection from the Virtualization tab on the Device Properties (on page 86) ( ) panel of each vCenter server device.
Start/stop Virtual Monitoring log event collection 1 Find the Virtual Monitoring vCenter device My Network Map or the collapsible
device grid.
2 Select it. Device properties panel displays.
3 On the device card, click Device Properties ( ). Device Properties Panel displays.
4 Click on the Virtual Monitoring tab, click on the Enable button and choose the different event categories you want log messages for.
Choose event categories High Availability error events. All HA (High Availability) error events. Select this option to include HA error
events which include the following: DAS Agent Unavailable. Records that the vCenter cannot contact any primary
host in the High Availability (HA) cluster.
DAS Host Failed. Records when a host failure has been detected by VMware High Availability (HA).
Insufficient Failover Resources. Records that the cluster resources are insufficient to satisfy the configured HA failover level
Host DAS Error. Records when there is a HA error on a host.
Not Enough Resources to Start VM. Records when the VMware High Availability (HA) does not find sufficient resources to failover a virtual machine.
VM DAS Update Error. Records that an error occurred when updating the HA agents with the current state of the virtual machine.
VM Failover Failed. Records when a virtual machine failover was unsuccessful.
Virtual machine migration events. All Virtual machine migration events. Select this option to receive the virtual
machine migration events. The events in this category are: Migration. Records the receipt of a migration warning or error.
Migration Error. Records the receipt of a migration error.

WhatsUp Gold User Guide
946
Migration Host Error. Records a migration error that includes the destination host.
Migration Host Warning. Records a migration warning that includes the destination host.
Migration Resource Error. Records a migration error that includes both the destination host and the resource pool.
Migration Resource Warning. Records a migration warning that includes both the destination host and the resource pool.
Migration Warning. Records the receipt of a migration warning.
Vm Being Hot Migrated. Records that a virtual machine is being hot-migrated.
Vm Being Migrated. Records that a virtual machine is being migrated.
Vm Migrated. Records a virtual machine migration.
Drs Vm Migrated. Records a virtual machine migration initiated by Distributed Resource Scheduling (DRS).
Security related events. All security related events. Select this option to receive security related
events. The events in this category are: Bad Username Session. Records a failed user log on.
No Access User. Records a failed user log on due to insufficient access permission.
Other events. Other events. Select this option to select additional events you want to receive. Advanced. Click Advanced to open the event tree. You can expand the tree to
select individual events in each category. 1 After a few moments, open the VMware Event log (on page 825) (ANALYZE menu
> Logs > VMware Event Log) to view log messages. Refine the level of detail and category of event messages as needed.
Add threshold alerting (on page 885) and notifications (on page 260) wrapped in policies (on page 260) for reacting to Virtual Monitoring events (as needed).
Choose event categories High Availability error events. All HA (High Availability) error events. Select this option to include HA error
events which include the following: DAS Agent Unavailable. Records that the vCenter cannot contact any primary
host in the High Availability (HA) cluster.
DAS Host Failed. Records when a host failure has been detected by VMware High Availability (HA).
Insufficient Failover Resources. Records that the cluster resources are insufficient to satisfy the configured HA failover level
WhatsUp Gold User Guide
947
Host DAS Error. Records when there is a HA error on a host.
Not Enough Resources to Start VM. Records when the VMware High Availability (HA) does not find sufficient resources to failover a virtual machine.
VM DAS Update Error. Records that an error occurred when updating the HA agents with the current state of the virtual machine.
VM Failover Failed. Records when a virtual machine failover was unsuccessful.
Virtual machine migration events. All Virtual machine migration events. Select this option to receive the virtual
machine migration events. The events in this category are: Migration. Records the receipt of a migration warning or error.
Migration Error. Records the receipt of a migration error.
Migration Host Error. Records a migration error that includes the destination host.
Migration Host Warning. Records a migration warning that includes the destination host.
Migration Resource Error. Records a migration error that includes both the destination host and the resource pool.
Migration Resource Warning. Records a migration warning that includes both the destination host and the resource pool.
Migration Warning. Records the receipt of a migration warning.
Vm Being Hot Migrated. Records that a virtual machine is being hot-migrated.
Vm Being Migrated. Records that a virtual machine is being migrated.
Vm Migrated. Records a virtual machine migration.
Drs Vm Migrated. Records a virtual machine migration initiated by Distributed Resource Scheduling (DRS).
Security related events. All security related events. Select this option to receive security related
events. The events in this category are: Bad Username Session. Records a failed user log on.
No Access User. Records a failed user log on due to insufficient access permission.
Other events. Other events. Select this option to select additional events you want to receive. Advanced. Click Advanced to open the event tree. You can expand the tree to
select individual events in each category.

WhatsUp Gold User Guide
948
Enable Virtual Monitoring Event Listeners (Hyper-V)
Enable Virtual Monitoring Event Listeners (Hyper-V) listeners are available on Hyper-V Host devices. Event Log Collection is turned off by default.
Enabling Hyper-V event listening is necessary for:
Aggregating Hyper-V-related messages for the Hyper-V Event log (on page 808) view.
Applying Hyper-V Thresholds (on page 883), alerts, and notification policies using the Alert Center libraries (on page 258).
Start/stop log event collection Enable Virtual Monitoring event collection from the Properties panel of each Hyper-V host device.
Start/stop Virtual Monitoring log event collection (Hyper-V) 1 Find the Hyper-V device on My Network (on page 20) Map or the collapsible
device grid.
2 Select it. Device properties card displays.
3 In Device Properties ( ) select the Monitors tab and then select Hyper-V Host Event Log monitor .
4 With Hyper-V Host Event Log monitor selected, Click Enable.
5 Click 'edit' and configure the following: Collection Interval. Interval to check for messages.
Event Severity. Level of detail and severity of the messages listened for.
Hyper-V Event Logs to Collect. Message category. 6 After a few moments, open the Hyper-V Event Log (on page 808) (ANALYZE
menu > Logs > Hyper-V Event Log) to view log messages. Adjust the level of detail and category of message as needed.
Choose event types Hyper-V event types.
Option Description
Hyper-V-Config Relates to virtual machine configuration files. For example, a missing or corrupt virtual machine configuration file generates these types of event messages.

WhatsUp Gold User Guide
949
Hyper-V-EmulatedNic-Admin
Messages related to emulation of the host NIC.
Hyper-V-High-Availability
Denotes actions and changes that happen because of Hyper-V clustering. (Applicable to full versions of Windows Server 2012)
Hyper-V-Hypervisor Hypervisor specific events. For example, a hypervisor fails to start.
Hyper-V-Image-Management-Service-Admin
Information related to virtual hard disk operations.
Hyper-V-Integration-Admin
Integration services events.
Hyper-V-Network-Admin Messages related to the creation of virtual networks.
Hyper-VShared-VHDX Virtual Hard Disk (VHD) messages for Hyper-V in Windows Server 2012 (VHDX).
Hyper-V-SythFc-Admin Messages for virtual Fibre Channel used to connect to virtual SANS.
Hyper-V-SynthNic Virtual network adapter events. For example, event messages for each time a virtual machine with virtual network adapters powers up or fails to power up as the result of a network adapter configuration issue.
Hyper-V-SynthStor Virtual hard disk events that are associated with running virtual machines (storage equivalent of the SynthNic section).
Hyper-V-VID Messages related to the Virtualization Infrastructure Driver (VID).
Hyper-V-VMMS Messages concerning virtual machine management services event files such as partition management, virtual processor management, and memory management.
Hyper-V-VmSwitch-Operational
Host virtual switch messages.
Hyper-V-Worker VM worker process specific events.

WhatsUp Gold User Guide
950
Visualize, Print, Share, and Export Share, export, and save as PDF Most generated Visualize, Print, Share, and Export report data can be printed, shared, and exported when selecting Expand ( ) from the Dashboard Options ( ) menu. After the report has been expanded, select export ( ) to access the following options:
Export to PDF. Generate a PDF file of the report with user-defined page size and orientation.
Export Data. Export Visualize, Print, Share, and Export data (on page 951) and leverage outside of WhatsUp Gold.
Schedule Export. Set a recurring date and time, format, and email destination for report data export (on page 942).
Emailing Reports and Logs You can email dashboard reports, full reports, and logs as email attachments from the Dashboard Menu. After you schedule a data export/e-mail distribution, you can manage/edit it by way of the Scheduled Reports Library (on page 942).
To email a report or log: 1 Open the report, log, or dashboard that contains the report(s) you want to email,
then open Schedule Report.
Logs. Click on Export menu ( ) and select Schedule Export.
Dashboard/Reports. Click on Dashboard Options menu ( ) and select Schedule Export.
Schedule Export dialog displays. 2 Configure the following: Export Type. Select PDF, Excel (xml), CSV, or TXT.
Page size. Select page size. (PDF Only)
Page orientation. Select Portrait or Landscape. (PDF Only) 3 Click Next. 4 Configure the email details for the report. Recipient(s). Enter email addresses for the intended recipients. Email
addresses should be separated by a comma.
From. Enter an email address for the report sender.
Subject. Enter a subject for the email message, if required.
Message body. Enter body text for the email message, if required.

WhatsUp Gold User Guide
951
Alternate host. Enter a different URL to display to the end user in the email, if required. This is used in conjunction with the Include link to report (with current data) option. Using an alternate host is a useful option if users outside of your network need to access the server using a different URL than the default web address of the WhatsUp Gold server.
Include embedded HTML of report in email. Select if you want to display a screen capture of the report embedded in the email, in addition to the report file attachment.
Include link to report (with current data). Select if you want to receive a direct link to the report.
SMTP Server. Enter the name of the mail server.
SMTP port number. Change the port number, if required.
SMTP timeout(s). Change the length of time (in seconds) to wait for a response from the SMTP server for each command WhatsUp Gold issues. If the limit is exceeded, the request will fail.
Use SMTP authentication. Select if the SMTP server requires authentication. If selected, enter a user name and password for authentication purposes.
Use encrypted connection (SSL/TLS). Select if your SMTP sever supports encrypting data over a TLS connection (formerly known as SSL).
5 Click Next. 6 Configure the schedule details for the report. Schedule. Select if you want to set up a specific time frame to send the email.
Name. Enter a name for the schedule. You can manage the scheduled report from the Scheduled Reports Library.
Daily. Select this option if you want to email the report on a specific number of days or every day of the week.
Weekly. Select this option if you want to email the report on specific days of the week or once a week.
Monthly. Select this option if you want to email the report on a specific day of the week or a specific number of times during a month.
Custom. Select this option if you want to email the report during a specific time frame. For example, number of minutes, hours, days, months or years.
7 Click Next. 8 Review the email report summary and click Edit where applicable to make any
necessary changes. 9 Click Finish. The schedule is set and can be viewed from the Scheduled Reports
Library.
Exporting Report Data You can export selected log, dashboard, and report data to a number of common file formats for review and analysis as well as into your favorite analytics and statistical processing tools.

WhatsUp Gold User Guide
952
Export log data 1 Open the log with data you want to export. For example, to open log view for
Performance Monitor Error Log (on page 813): ANALYZE > Logs > Performance Monitor Error Log
2 Click Export ( ), then select Export Data. 3 Select the file format in which you want the data exported, then click OK. 4 Open the downloaded file using a compatible application to display, edit, and
analyze the data.
Export report data 1 Open the dashboard or full-page dashboard report you want to export. For
example, to open full page dashboard report for Ping Response Time (on page 605): ANALYZE > Network > Ping Response Time
2 Click Export ( ) where available for individual reports or dashboards. 3 Select a file format, click OK, and view the downloaded file.
Printing reports and logs Save log, report, and dashboard data to PDF:
Report Row Options. Export to PDF ( ) / Scheduled Reports.
Log Data Export. Logs have an Export to PDF control ( ). Scheduled Reports. Schedule PDFs for email distribution (on page 942).
Share Reports 1 From the Dashboard Actions menu ( ), select Share View .
Share Dashboard dialog displays. 2 Select WhatsUp Gold users that you want to share this view with. 3 Click OK.
Users now have an identical view with the current configuration.
Interface Report Settings Specify threshold and top n: Control Purpose
Show Top n Items Limit items to the samples with the highest values.
Threshold Type Switch between minimum or maximum mode for cutoff values (for displaying either peak or sub peak usage periods, for example).

WhatsUp Gold User Guide
953
Threshold (percent) Control and trim peak values to trim outliers.
Chart and visualize data over time (time series graph) Control Purpose
Display Options Present data as a chart, a table grid, or both.
Chart Type Line/Area. Scatter graph that connects adjacent measurements with straight lines.
Spline/Area Spline. Choose a graph with a smoothed appearance where adjacent samples exhibit a gradual slope.
Chart Options (percent)
Legend, Grid Lines. Include legend and grid lines for readability. Trend Lines. Present data a smoothed average to show trend.
Tip: Trend lines represent a moving average that can be compared with line and area graphs to reveal peak and sub peak intervals, periods of burstiness, latency, and interruption.
Column Sort and Picker Filter and pick by column
Click a report heading and use the following from the drop down list:
Control Purpose
Sort. Sort column in ascending or descending order.
Columns. Pick the columns you want to view. Click a check box to display the column. Clear the check box to hide it.
Group by this field.
Group table into collapsible rows wherever the current column contains identical data ("field") values.
Filters. Provide a keyword to view only rows that contain the keyword for this column.

WhatsUp Gold User Guide
954
Filter Row and Search Filter row data Use full text search to reduce your row data.
Network Traffic Report Settings
Scheduling maintenance Select the day and time you want the device to be placed in maintenance mode, and when you want WhatsUp Gold to restart the polling of the device. You can select multiple days for a single time period. To schedule multiple time periods, you must create another maintenance entry.
Note: When in maintenance mode, device active monitors will not be polled, actions will not be triggered, and logging activity is disabled. To resume polling, actions, and logging, take the device out of maintenance mode.
Network Interfaces This dialog displays all network interfaces currently configured for the selected device. Network Performance Monitor monitors these interfaces and displays the state of the interfaces as the device status.
Click Add to configure a new network interface. Select an interface from the list and click Edit to make changes to the settings
for that interface. Select an interface and click Remove to delete it from the list. Select an interface and click Set default to make the current device the default
interface.
Add/Edit Network Interface This dialog displays allows you to add a new network interface or edit an existing interface.
Configure the following:
Poll using. Select if you want WhatsUp Gold to use the IP address or the Host name (DNS) of the device for polling.

WhatsUp Gold User Guide
955
Host name (DNS). Enter the official network name of the device. The network name must be a name that can be resolved to an IP address.
Address. Enter an IP address.
Browse Active Directory Use the Browse Active Directory dialog (SETTINGS > SYSTEM SETTINGS > External Authentication - Active Directory / LDAP tab) to select the Active Directory (AD) groups from which you want to allow users to log in to WhatsUp Gold.
To select groups from the Browse Active Directory dialog:
Note: Ensure the correct Active Directory server is configured (Domain Controller, port and server type). For more information see Setting LDAP Credentials.
1 From the Active Directory / LDAP tab, click Browse. The Browse Active Directory dialog appears.
2 Enter a valid user name that has access to the LDAP or Active Directory server in the User Name box.
3 Enter the password associated with the user name in the Password box. 4 Press Tab. The list of the most used AD groups appears.
Tip: You can see all of the groups available on the AD server by selecting Show all groups.
5 Select the AD groups you want to map to WhatsUp Gold groups.
Tip: Click Check all to select all of the displayed AD groups. Click Clear all to clear all of the selected AD groups.
6 Click OK to save changes. The Browse Active Directory dialog closes and the selected AD groups appear on the LDAP Credentials dialog in the AD group list.
7 Click OK to save changes.
Test LDAP Credentials Test the credentials you have entered.
To test credentials: 1 Click Test. 2 Enter the appropriate information: User name. Enter a valid user name that has access to the server for which you
are testing credentials.
Password. Enter the password associated with the user name.

WhatsUp Gold User Guide
956
3 Click Test. WhatsUp Gold attempts to connect using the credentials and returns a test success or failure message.
4 Click Close. 5 Click OK to save changes.
Copyright notice ©1991-2018 Ipswitch, Inc. All rights reserved.
This document, as well as the software described in it, is furnished under license and may be used or copied only in accordance with the terms of such license. Except as permitted by such license, no part of this publication may be reproduced, photocopied, stored on a retrieval system, or transmitted, in any form or by any means, electronic, mechanical, recording, or otherwise, without the expressed prior written consent of Ipswitch, Inc.
The content of this document is furnished for informational use only, is subject to change without notice, and should not be construed as a commitment by Ipswitch, Inc. While every effort has been made to assure the accuracy of the information contained herein, Ipswitch, Inc. assumes no responsibility for errors or omissions. Ipswitch, Inc., also assumes no liability for damages resulting from the use of the information contained in this document.
IMail, the IMail logo, WhatsUp, the WhatsUp Gold logo, WS_FTP, the WS_FTP logos, Ipswitch, and the Ipswitch logo are trademarks of Ipswitch, Inc. Portions of Telerik Extensions for ASP.NET MVC ©2002-2012 by Telerik Corporation. All rights reserved. Other products and their brands or company names, are or may be trademarks or registered trademarks, and are the property of their respective companies.
This document was published on Monday, November 05, 2018 at 15:36.