What vibrations tell us about GTPases
14
Biol. Chem. 2014; aop Review Carsten Kötting* and Klaus Gerwert* What vibrations tell us about GTPases Abstract: In this review, we discuss how time-resolved Fourier transform infrared (FTIR) spectroscopy is used to understand how GTP hydrolysis is catalyzed by small GTPases and their cognate GTPase-activating proteins (GAPs). By interaction with small GTPases, GAPs regulate important signal transduction pathways and transport mechanisms in cells. The GTPase reaction terminates signaling and controls transport. Dysfunctions of GTP hydrolysis in these proteins are linked to serious dis- eases including cancer. Using FTIR, we resolved both the intrinsic and GAP-catalyzed GTPase reaction of the small GTPase Ras with high spatiotemporal resolution and atomic detail. This provided detailed insight into the order of events and how the active site is completed for cataly- sis. Comparisons of Ras with other small GTPases revealed conservation and variation in the catalytic mechanisms. The approach was extended to more nearly physiological conditions at a membrane. Interactions of membrane- anchored GTPases and their extraction from the mem- brane are studied using the attenuated total reflection (ATR) technique. Keywords: biomolecular simulations; caged compounds; catalysis; proteins; reaction mechanism; vibrational spectroscopy. DOI 10.1515/hsz-2014-0219 Received June 26, 2014; accepted July 29 , 2014 Introduction: small GTPases Small GTPases are molecular switches that regulate and propagate cellular signals depending on the bound nucleotide GTP or GDP. Comprehensive details regard- ing this class of proteins have been discussed in several excellent reviews (Vetter and Wittinghofer, 2001 ; Wit- tinghofer and Vetter, 2011; Ligeti et al., 2012; Cherfils and Zeghouf, 2013). Figure 1 shows the complete GTPase cycle including the critical reactions and interactions. The switch region conformation depends on the bound nucle- otide species. The switch is in the ‘on’ state or ‘off’ state when GTP or GDP is bound, respectively. In the GTPase reaction, the hydrolysis of GTP to GDP switches the small GTPases off, terminating the interaction with effector proteins. Dysfunction in the ‘switch off’ reaction leads to uncontrolled signaling and is involved in several severe diseases. Therefore, understanding the ‘switch off’ mech- anism is of great interest. This reaction can be monitored using time-resolved FTIR spectroscopy by means of caged GTP [labeled (1) in Figure 1]. In water, GTP hydrolyzes at a rate of 5 × 10 -8 s -1 at 303 K, whereas Ras-bound GTP has a rate of 6.8 × 10 -4 s -1 at 303 K (Kötting and Gerwert, 2004). This rate is still too slow to regulate signal transduction pathways. Therefore, the rate is enhanced by GTPase- activating proteins (GAPs) to 7.8 s -1 at 303 K. GAPs play an important role in the regulation of signal transduction pathways (Phillips et al., 2003). Furthermore, GTPases can interact with guanine exchange factors (GEFs), which induce the ‘switch on’ conformation by exchanging GDP for GTP. The GTP-bound ‘on’ state interacts with down- stream effectors and transduces the signal. Guanine nucleotide dissociation inhibitors (GDIs) can also regulate GTPase signal transduction. Despite the name, GDIs’ main function is soluble complex forma- tion. Many GTPases have lipid anchor post-translational modifications on their C-terminus (e.g., farnesyl, gera- nylgeranyl, and/or palmitoyl), and membrane targeting plays an important role in GTPase regulation and func- tion (Hodges-Loaiza et al., 2011). GDIs can both detach GTPases from or deliver them to the membrane. ATR- FTIR spectroscopy allows us to investigate GTPase effec- tor and GTPase GDI interactions [labeled (2) and (3) in Figure 1]. Structurally, all small GTPases share a common G-domain consisting of five α-helices and a six-stranded β-sheet. GTPases are involved in a large number of cellular signaling and transport mechanisms. They are grouped into five subfamilies. Ras GTPases are mainly involved in *Corresponding authors: Carsten Kötting, Department of Biophysics, Ruhr University Bochum, Universitätsstr. 150, D-44801 Bochum, Germany, e-mail: [email protected]; and Klaus Gerwert: Department of Biophysics, Ruhr University Bochum, Universitätsstr. 150, D-44801 Bochum, Germany, e-mail: [email protected]
-
Upload
independent -
Category
Documents
-
view
1 -
download
0
Transcript of What vibrations tell us about GTPases
Biol. Chem. 2014; aop
Review
Carsten K ö tting * and Klaus Gerwert *
What vibrations tell us about GTPases Abstract: In this review, we discuss how time-resolved
Fourier transform infrared (FTIR) spectroscopy is used
to understand how GTP hydrolysis is catalyzed by small
GTPases and their cognate GTPase-activating proteins
(GAPs). By interaction with small GTPases, GAPs regulate
important signal transduction pathways and transport
mechanisms in cells. The GTPase reaction terminates
signaling and controls transport. Dysfunctions of GTP
hydrolysis in these proteins are linked to serious dis-
eases including cancer. Using FTIR, we resolved both the
intrinsic and GAP-catalyzed GTPase reaction of the small
GTPase Ras with high spatiotemporal resolution and
atomic detail. This provided detailed insight into the order
of events and how the active site is completed for cataly-
sis. Comparisons of Ras with other small GTPases revealed
conservation and variation in the catalytic mechanisms.
The approach was extended to more nearly physiological
conditions at a membrane. Interactions of membrane-
anchored GTPases and their extraction from the mem-
brane are studied using the attenuated total reflection
(ATR) technique.
Keywords: biomolecular simulations; caged compounds;
catalysis; proteins; reaction mechanism; vibrational
spectroscopy.
DOI 10.1515/hsz-2014-0219
Received June 26 , 2014 ; accepted July 29 , 2014
Introduction: small GTPases Small GTPases are molecular switches that regulate
and propagate cellular signals depending on the bound
nucleotide GTP or GDP. Comprehensive details regard-
ing this class of proteins have been discussed in several
excellent reviews ( Vetter and Wittinghofer, 2001 ; Wit-
tinghofer and Vetter, 2011 ; Ligeti et al., 2012 ; Cherfils and
Zeghouf, 2013 ). Figure 1 shows the complete GTPase cycle
including the critical reactions and interactions. The
switch region conformation depends on the bound nucle-
otide species. The switch is in the ‘ on ’ state or ‘ off ’ state
when GTP or GDP is bound, respectively. In the GTPase
reaction, the hydrolysis of GTP to GDP switches the small
GTPases off, terminating the interaction with effector
proteins. Dysfunction in the ‘ switch off ’ reaction leads to
uncontrolled signaling and is involved in several severe
diseases. Therefore, understanding the ‘ switch off ’ mech-
anism is of great interest. This reaction can be monitored
using time-resolved FTIR spectroscopy by means of caged
GTP [labeled (1) in Figure 1 ]. In water, GTP hydrolyzes at
a rate of 5 × 10 -8 s -1 at 303 K, whereas Ras-bound GTP has
a rate of 6.8 × 10 -4 s -1 at 303 K ( K ö tting and Gerwert, 2004 ).
This rate is still too slow to regulate signal transduction
pathways. Therefore, the rate is enhanced by GTPase-
activating proteins (GAPs) to 7.8 s -1 at 303 K. GAPs play an
important role in the regulation of signal transduction
pathways ( Phillips et al., 2003 ). Furthermore, GTPases
can interact with guanine exchange factors (GEFs), which
induce the ‘ switch on ’ conformation by exchanging GDP
for GTP. The GTP-bound ‘ on ’ state interacts with down-
stream effectors and transduces the signal.
Guanine nucleotide dissociation inhibitors (GDIs)
can also regulate GTPase signal transduction. Despite
the name, GDIs ’ main function is soluble complex forma-
tion. Many GTPases have lipid anchor post-translational
modifications on their C-terminus (e.g., farnesyl, gera-
nylgeranyl, and/or palmitoyl), and membrane targeting
plays an important role in GTPase regulation and func-
tion ( Hodges-Loaiza et al., 2011 ). GDIs can both detach
GTPases from or deliver them to the membrane. ATR-
FTIR spectroscopy allows us to investigate GTPase effec-
tor and GTPase GDI interactions [labeled (2) and (3) in
Figure 1 ].
Structurally, all small GTPases share a common
G-domain consisting of five α -helices and a six-stranded
β -sheet. GTPases are involved in a large number of cellular
signaling and transport mechanisms. They are grouped
into five subfamilies. Ras GTPases are mainly involved in
*Corresponding authors: Carsten K ö tting, Department of
Biophysics, Ruhr University Bochum, Universit ä tsstr. 150, D-44801
Bochum, Germany, e-mail: [email protected] ; and
Klaus Gerwert: Department of Biophysics, Ruhr University Bochum,
Universit ä tsstr. 150, D-44801 Bochum, Germany,
e-mail: [email protected]

2 C. K ö tting and K. Gerwert: What vibrations tell us about GTPases
cell growth ( Cox and Der, 2010 ). Rho primarily regulates
the cytoskeleton ( Sit and Manser, 2011 ). Rab ( Stenmark,
2009 ) and Arf ( Khan and M é n é trey, 2013 ) are important
for vesicular transport and Ran ( Jamali et al., 2011 ) for
nuclear transport. Given their critical functions, point
mutations cause serious cellular dysfunction and result in
several diseases, including cancer in case of Ras ( Cox and
Der, 2010 ). For this reason, Ras is the best studied GTPase
and the main focus of our FTIR studies.
FTIR of proteins Time-resolved FTIR difference spectroscopy has been
established as a powerful tool for protein studies. Cur-
rently, there are over 2000 publications each year using
FTIR for protein investigations. The FTIR difference spec-
troscopy approach was introduced by studies on rhodop-
sin by stabilizing an intermediate at low temperatures
( Siebert et al., 1983 ). The implementation of room temper-
ature time-resolved FTIR studies, and most important the
first clear-cut band assignment by site-directed mutagen-
esis in bacteriorhodopsin (bR), allowed deduction of
a detailed molecular reaction mechanism for the first
time for a membrane protein. The bR pump mechanism
was elucidated along with detailed protonation changes
in the Schiff base, Asp85 and Asp 96 ( Gerwert, 1988 ;
Gerwert et al., 1989, 1990 ). The approach was adapted
for chromophore-less GTPase proteins using photolabile
caged compounds to initiate the GTP hydrolysis ( Cepus
et al., 1998 ). Protein FTIR studies have been extensively
reviewed previously ( Gerwert, 1993 ; Barth and Zscherp,
2002 ; K ö tting and Gerwert, 2005a ; Siebert and Hilde-
brandt, 2008 ; Hering and Haris, 2009 ; Ataka et al., 2010 ).
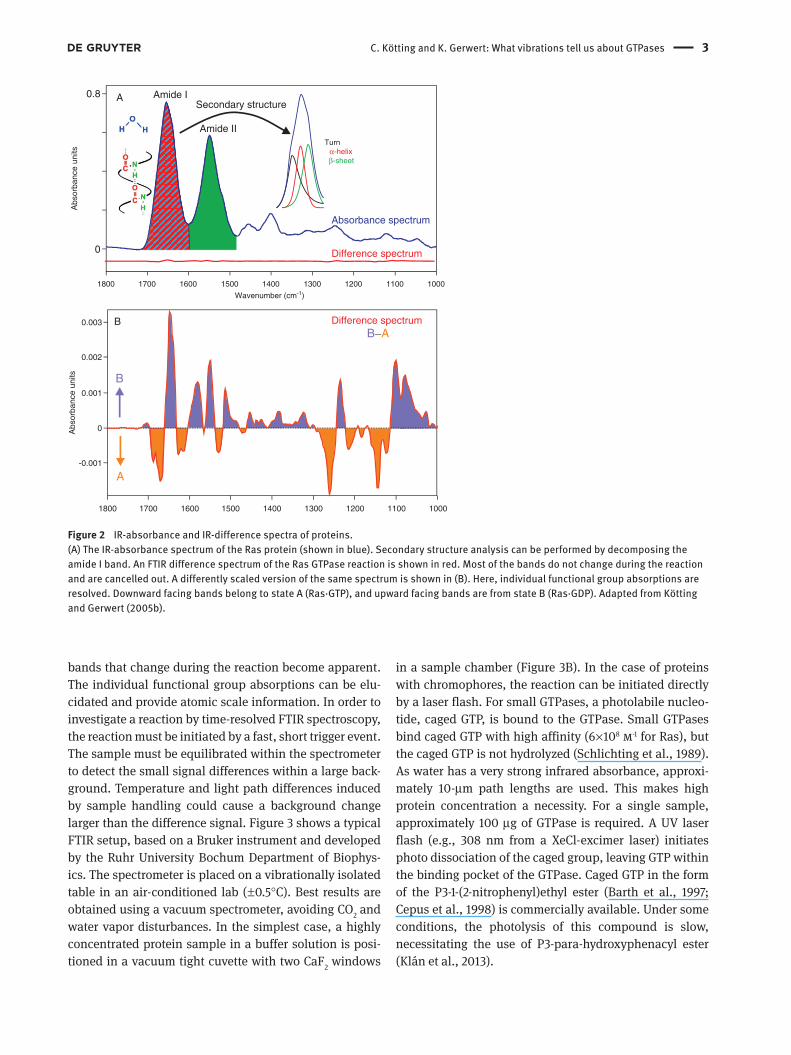
The absorbance spectrum of a protein is dominated by the
amide bond absorptions ( Figure 2 A). The amide I band
(C = O stretching) can be used to determine the protein
secondary structure due to changes in hydrogen bonding
( Dannenberg, 2006 ) and peptide bond torsional angles
( Ham and Cho, 2003 ) leading to band shifts. The sec-
ondary structure motif contribution can be estimated by
decomposition of the overall amide I band ( G ü ldenhaupt
et al., 2008 ; Goormaghtigh et al., 2009 ).
In order to gain information on the protein reaction
mechanism, difference spectroscopy was employed.
Figure 2 B shows the difference spectrum between Ras · GDP
and Ras · GTP. Of the several thousand vibrational modes
present in a protein, most do not change during the reac-
tion and are cancelled out. As a result, the few absorbance
GTPaseoffGTP
GTPaseonGTP
GTP
GDP
Pi
Effector
GEF
GAP
“OFF”
“ ON”
GTPaseoff
cgGTP
hv
2
3
1
GDI
GDI
Effector
cg
GTPaseonGTP
GTPaseoffGDP
GTPaseoffGDP
Figure 1 The GTPase cycles between the ‘ off ’ state (shown in black) and the ‘ on ’ state (shown in blue).
GEF and GAP proteins enhance the molecular switching. FTIR spectroscopy investigations of the GTPase reaction require a caged (cg)-
GTP that releases GTP upon laser exposure. ATR-FTIR spectroscopy allows for the investigation of GTPase effectors or GTPase GDI
interactions.
C. K ö tting and K. Gerwert: What vibrations tell us about GTPases 3
bands that change during the reaction become apparent.
The individual functional group absorptions can be elu-
cidated and provide atomic scale information. In order to
investigate a reaction by time-resolved FTIR spectroscopy,
the reaction must be initiated by a fast, short trigger event.
The sample must be equilibrated within the spectrometer
to detect the small signal differences within a large back-
ground. Temperature and light path differences induced
by sample handling could cause a background change
larger than the difference signal. Figure 3 shows a typical
FTIR setup, based on a Bruker instrument and developed
by the Ruhr University Bochum Department of Biophys-
ics. The spectrometer is placed on a vibrationally isolated
table in an air-conditioned lab ( ± 0.5 ° C). Best results are
obtained using a vacuum spectrometer, avoiding CO 2 and
water vapor disturbances. In the simplest case, a highly
concentrated protein sample in a buffer solution is posi-
tioned in a vacuum tight cuvette with two CaF 2 windows
in a sample chamber ( Figure 3 B). In the case of proteins
with chromophores, the reaction can be initiated directly
by a laser flash. For small GTPases, a photolabile nucleo-
tide, caged GTP, is bound to the GTPase. Small GTPases
bind caged GTP with high affinity (6 × 10 8 m -1 for Ras), but
the caged GTP is not hydrolyzed ( Schlichting et al., 1989 ).
As water has a very strong infrared absorbance, approxi-
mately 10- μ m path lengths are used. This makes high
protein concentration a necessity. For a single sample,
approximately 100 μ g of GTPase is required. A UV laser
flash (e.g., 308 nm from a XeCl-excimer laser) initiates
photo dissociation of the caged group, leaving GTP within
the binding pocket of the GTPase. Caged GTP in the form
of the P3-1-(2-nitrophenyl)ethyl ester ( Barth et al., 1997 ;
Cepus et al., 1998 ) is commercially available. Under some
conditions, the photolysis of this compound is slow,
necessitating the use of P3-para-hydroxyphenacyl ester
( Kl á n et al., 2013 ).
100011001200130014001500160017001800
Wavenumber (cm-1)
100011001200130014001500160017001800
-0.001
0
0.001
0.002
0.003
Abs
orba
nce
units
Difference spectrum
Difference spectrum
0
0.8
Abs
orba
nce
units
A
BB A
A
B
Absorbance spectrum
Turnα-helixβ-sheet
Secondary structureAmide I
Amide II
Figure 2 IR-absorbance and IR-difference spectra of proteins.
(A) The IR-absorbance spectrum of the Ras protein (shown in blue). Secondary structure analysis can be performed by decomposing the
amide I band. An FTIR difference spectrum of the Ras GTPase reaction is shown in red. Most of the bands do not change during the reaction
and are cancelled out. A differently scaled version of the same spectrum is shown in (B). Here, individual functional group absorptions are
resolved. Downward facing bands belong to state A (Ras · GTP), and upward facing bands are from state B (Ras · GDP). Adapted from K ö tting
and Gerwert (2005b) .

4 C. K ö tting and K. Gerwert: What vibrations tell us about GTPases
Another requirement to gain insight into reac-
tion mechanisms is the assignment of the absorbance
bands to specific functional groups within the protein.
These assignments can be performed using site-directed
mutagenesis ( Gerwert et al., 1989 ), isotopically labe-
ling specific protein sites ( Engelhard et al., 1985 ), or
introducing site-specific prosthetic groups ( Gerwert
and Siebert, 1986 ). As most mutations in the interest-
ing region are too invasive, GTPase band assignments
were primarily made using isotopic labeling ( Warsc-
heid et al., 2008 ). Chemical synthesis of GTP with site-
specific 18 O-labeled phosphate allows us to assign all
phosphate stretching modes. Figure 4 shows the PO
stretching mode assignment of the GTP γ -phosphate.
GTP band shifts observed during GTPase binding and
O
CH3
P
O
GDP
O– O–
NO2
O P
O
GDP
O
OH
Sample
O-ringCaF2-windowsSpacergroove
O-ring
or
Globar
DetectorInterferometer
Aperture
UV-laser
Caged-GTP
A
CB
Sample
Figure 3 The experimental setup for time-resolved FTIR measure-
ments of the GTPase reaction.
(A) The FTIR spectrometer with an additional UV-laser directed on
the sample. (B) A transmission cuvette containing highly concen-
trated GTPase in solution is placed in the sample compartment.
(C) A caged nucleotide is bound to the GTPase. The GTP is released
using a UV laser flash, allowing the GTPase reaction to be moni-
tored. In the GTPase reaction, the conformation of the switch region
of the GTPase (shown in blue) is changing. Adapted from K ö tting
et al. (2010) .
1350 1300 1250 1200 1150 1100 1050 9501000
Wavenumber (cm-1)
Δ A
bsor
banc
e
P OH+ 18O–
18O
18O–
18O–
18O–
18O–
O
OGua O
O
P P
O– O–
O– +
νas(γ-PO3)
νas(γ-PO3)
α
α
βγ
β γ
νas(α-PO2)Gua O
O O
P PO
O– O–
O P
RasGDP+Pi
RasGTP
Figure 4 Band assignment by isotopically labeled nucleotide.
The phosphate region of a difference spectrum for the Ras GTPase
reaction is shown in black (also see Figure 2).
Downward facing bands belong to Ras · GTP, and upward facing
bands are from Ras · GDP + P i . The same difference spectrum using
γ - 18 O 3 -labeled GTP is shown in green. The ν
as ( γ -PO
3 )-vibration
absorption shifted upon labeling, whereas the other bands such as
the ν as
( α -PO 2 )-vibration absorption remain unchanged. The released
P i is also labeled, inducing shifts of the 1078 and 990 cm -1 bands.
The calculated ν as
( γ -PO 3 )-vibration normal mode is shown below the
spectrum. Adapted from Gerwert and K ö tting (2010) .
GAP protein interactions reveal the catalytic action of
the protein on the substrate. These are small changes,
but they can be decoded by combining experimental
and theoretical FTIR spectroscopy (discussed in more
detail below). Isotopic labels can be incorporated
during protein expression by using modified M9 media
supplemented with a stable isotope-labeled amino acid
( Warscheid et al., 2008 ). This method is only group spe-
cific, with all the amino acids of a specific type labeled.
However, as the experiment is based on the difference
spectra, and there is often only one labeled amino acid
within the reactive region, a clear assignment is feasi-
ble. In some cases, coupling isotopic labeling with site-
directed mutagenesis is necessary. Figure 5 shows an
example of a protein group assignment (Thr 35) for Ras

C. K ö tting and K. Gerwert: What vibrations tell us about GTPases 5
AΔA
ν (cm-1)
B
Figure 5 Band assignment by isotopically labeled protein.
(A) An FTIR difference spectrum of the Ras ‘ off ’ to ‘ on ’ conforma-
tional change. Downward facing bands belong to the ‘ off ’ state and
upward facing bands are from the ‘ on ’ state. The same difference
spectrum using 13 C 15 N-Thr-labeled Ras is shown in red. The 1689 cm -1
band shifted upon labeling and can be assigned to the carbonyl
stretching vibration of unlabeled Thr35 in the Ras ‘ on ’ state. (B)
A time-resolved FTIR spectrum of the Ras conformational change.
The Thr35 carbonyl group is shown in yellow. In the ‘ off ’ state, the
group is in a hydrophilic environment, whereas it moves to a more
hydrophobic environment in the ‘ on ’ state. This induces an unusual
blueshift of the 1689 cm -1 band. The conformational change can also
be seen with the phosphate band changes, indicated in the time
resolved FTIR spectra. Adapted from K ö tting et al. (2007) .
( K ö tting et al., 2007 ). In the ‘ on ’ state, the Thr35 back-
bone carbonyl group is in an unusual hydrophobic envi-
ronment, leading to a vibrational blueshift to 1689 cm -1 .
Even though all the Thr residues are 13 C 15 N labeled, only
the Thr35 band is observed, whereas the remaining Thr
bands remain unchanged and do not appear in the dif-
ference spectrum.
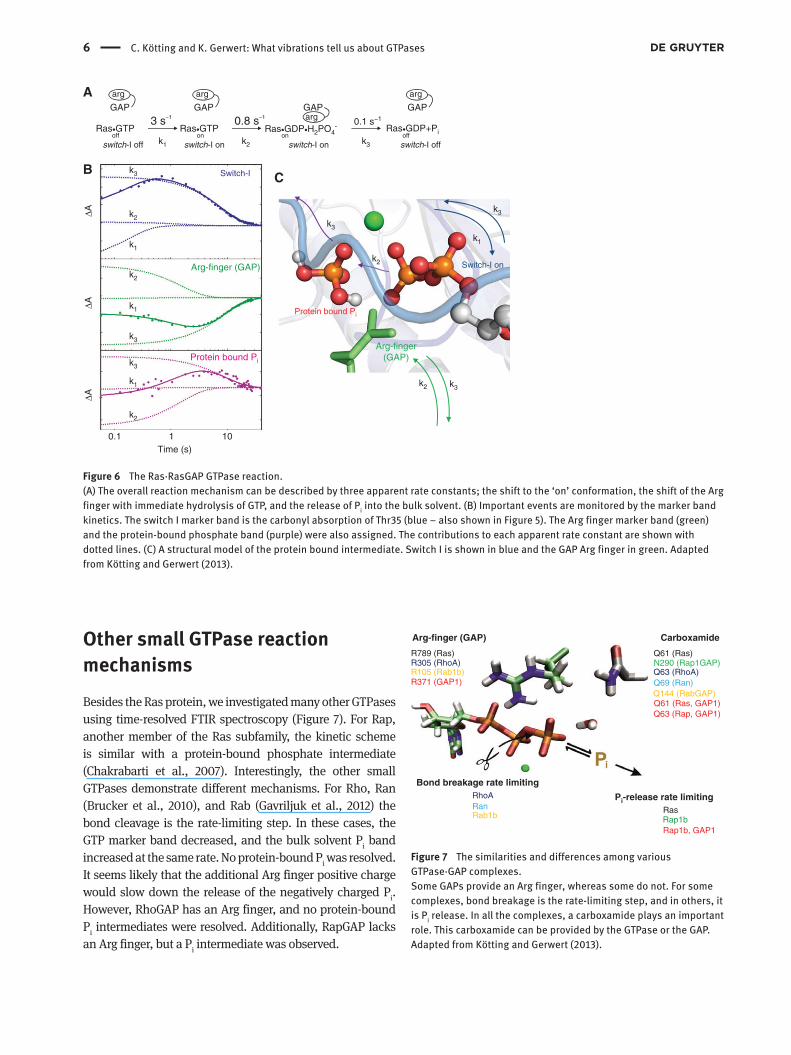
Ras reaction mechanism Once a band is assigned, the time-resolved behavior of the
corresponding residue can be elucidated. For example,
the Thr35 absorbance band was used as a marker band
for the Ras ‘ on ’ state. This absorption shows up when the
switch is in the ‘ on ’ state and disappears when switched
off. Figure 6 shows Thr35 ’ s behavior during the GAP-cat-
alyzed GTPase reaction of Ras. A global kinetic analysis
can be performed to analyze all the absorbance changes
simultaneously ( Hessling et al., 1993 ). The apparent rate
constants and their corresponding amplitude spectra
are revealed. Various marker bands, such as Thr35, the
Arg finger, and isotopically labeled phosphate, can now
be followed over the course of the reaction. For Ras, the
global fit analysis revealed that the absorbance changes
can be described by three exponential functions cor-
responding to three apparent rate constants ( K ö tting
et al., 2006 , 2008 , 2012 ). After Ras off
· cgGTP photolysis,
Ras off
· GTP was formed. The first rate constant (k 1 ) showed
the conformational change toward the ‘ on ’ state through
the Thr35 marker band evolution. During the second
step, described by the second rate constant (k 2 ), no Thr
35 marker band change was observed, and the switch
remained in the ‘ on ’ state. Afterwards, Ras switched off,
producing the final rate constant (k 3 ). The marker band
kinetic data was combined to deduce the order of events
in the reaction mechanism. For example, the Arg finger
marker band is in a hydrophilic environment initially
(green plot in Figure 6 B) and showed no change with
k 1 , but decreased with k
2 , indicating that the Arg finger
moved into the hydrophobic environment of the GTP-
binding pocket ( K ö tting et al., 2008 ). Already with the
same apparent rate, protein-bound phosphate, a product
of GTP hydrolysis, appeared (purple plot in Figure 6 B).
This implies that the bond breakage was much faster
than the Arg finger movement. As soon as the arginine
completes the active site, bond breakage occurs instanta-
neously. During the final step, the phosphate leaves the
protein (purple marker band decreases), the Arg finger
leaves the binding pocket for the hydrophilic environ-
ment (green marker band increases), and the switch
regions shift into the ‘ off ’ conformation (blue marker
band decreases). This P i release from the protein into the
bulk solvent has the slowest rate (k 3 ). Therefore, in Ras,
P i release is the rate-limiting step of the overall reaction
rather than GTP bond cleavage.
6 C. K ö tting and K. Gerwert: What vibrations tell us about GTPases
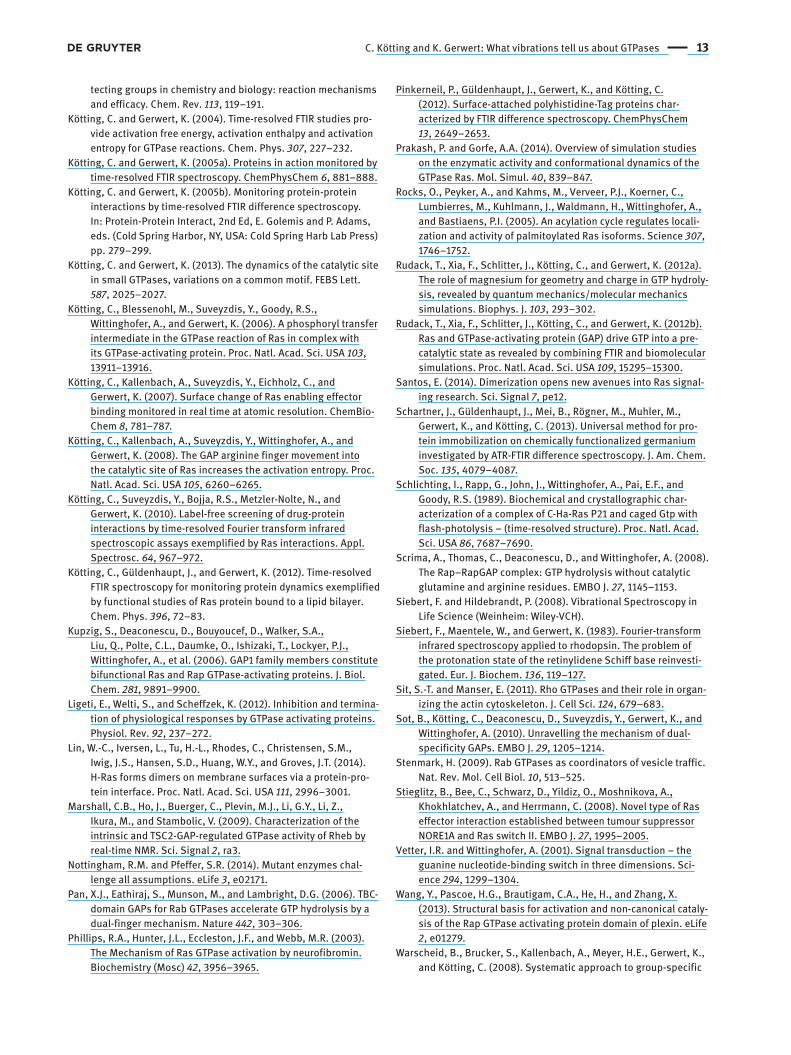
Other small GTPase reaction mechanisms Besides the Ras protein, we investigated many other GTPases
using time-resolved FTIR spectroscopy ( Figure 7 ). For Rap,
another member of the Ras subfamily, the kinetic scheme
is similar with a protein-bound phosphate intermediate
( Chakrabarti et al., 2007 ). Interestingly, the other small
GTPases demonstrate different mechanisms. For Rho, Ran
( Brucker et al., 2010 ), and Rab ( Gavriljuk et al., 2012 ) the
bond cleavage is the rate-limiting step. In these cases, the
GTP marker band decreased, and the bulk solvent P i band
increased at the same rate. No protein-bound P i was resolved.
It seems likely that the additional Arg finger positive charge
would slow down the release of the negatively charged P i .
However, RhoGAP has an Arg finger, and no protein-bound
P i intermediates were resolved. Additionally, RapGAP lacks
an Arg finger, but a P i intermediate was observed.
Arg-finger (GAP)
R789 (Ras)R305 (RhoA)R105 (Rab1b)
Carboxamide
Q61 (Ras)N290 (Rap1GAP)
Q63 (Rap, GAP1)
Q63 (RhoA)Q69 (Ran)Q144 (RabGAP)
Bond breakage rate limiting
Pi-release rate limitingRhoARanRab1b
RasRap1bRap1b, GAP1
Q61 (Ras, GAP1)
R371 (GAP1)
Figure 7 The similarities and differences among various
GTPase · GAP complexes.
Some GAPs provide an Arg finger, whereas some do not. For some
complexes, bond breakage is the rate-limiting step, and in others, it
is P i release. In all the complexes, a carboxamide plays an important
role. This carboxamide can be provided by the GTPase or the GAP.
Adapted from K ö tting and Gerwert (2013) .
Protein bound Pi
Switch-I on
Arg-finger(GAP)
Ras•GTPoff
Ras•GTPon on off
Ras•GDP•H2PO4- Ras•GDP+Pi
k1 k2 k3
GAParg
GAP
arg
GAP
arg
GAP
arg
3 s−1 0.8 s−10.1 s−1
switch-I off switch-I on switch-I on switch-I off
A
BC
k1
k1
k3
k3
k1 k2 k3
k2
k1
k3
k3
k2
0.1 1 10Time (s)
k2ΔAΔA
ΔA
k2
k3
Protein bound Pi
Switch-I
Arg-finger (GAP)
Figure 6 The Ras · RasGAP GTPase reaction.
(A) The overall reaction mechanism can be described by three apparent rate constants; the shift to the ‘ on ’ conformation, the shift of the Arg
finger with immediate hydrolysis of GTP, and the release of P i into the bulk solvent. (B) Important events are monitored by the marker band
kinetics. The switch I marker band is the carbonyl absorption of Thr35 (blue – also shown in Figure 5). The Arg finger marker band (green)
and the protein-bound phosphate band (purple) were also assigned. The contributions to each apparent rate constant are shown with
dotted lines. (C) A structural model of the protein bound intermediate. Switch I is shown in blue and the GAP Arg finger in green. Adapted
from K ö tting and Gerwert (2013) .

C. K ö tting and K. Gerwert: What vibrations tell us about GTPases 7
The one essential catalytic moiety found in all GTPase
GAP combinations is a carboxamide, either from an Asn
or a Gln. Its hypothesized role is to orient a catalytic water
molecule in an optimal position for nucleophilic attack
( Vetter and Wittinghofer, 2001 ). It is surprising that this
task is exclusively performed by a carboxamide and not
by other side chains. It has been speculated that the car-
boxamide structure is necessary to stabilize the transition
state generated by the water attack and has been modeled
computationally ( Grigorenko et al., 2007 ). This catalytic
carboxamide is often a GTPase residue (e.g., Gln61 in Ras),
but in some systems like Rap · RapGAP, the carboxamide is
provided by the GAP ( Scrima et al., 2008 ). The Rap GTPase
can also be catalyzed by a GAP from the GAP1 family
( Kupzig et al., 2006 ). In the latter case, neither Rap nor
GAP1 seems to have a Gln or Asn in the appropriate posi-
tion. Using FTIR experiments, we demonstrated that a Rap
Gln situated two residues away from the usual position
is moved by GAP1 into the catalytic position ( Sot et al.,
2010 ). This was recently confirmed by an X-ray structure
( Wang et al., 2013 ). In GTPase · GAP mutagenesis studies, it
is often difficult to elucidate whether the reduced catalytic
rate of a mutant is due to decreased affinity of GTPase and
GAP or due to the residue ’ s direct involvement in hydroly-
sis. Because FTIR experiments are performed at millimolar
protein concentrations, the effects of decreased interac-
tion affinity are minimized, and residues directly involved
in the catalytic function can be found. For example, FTIR
experiments of Rap1GAP Arg388 mutants show that Rap
GTPase catalysis was unaffected ( Chakrabarti et al.,
2007 ), while other biochemical assays give the impression
that this mutant is nearly inactive ( Daumke et al., 2004 ).
Further, we investigated several Rab · RabGAP systems
( Gavriljuk et al., 2012 ). In many cases, we observed rela-
tively weak GAP catalysis. Surprisingly, many of the
Rab · RabGAP pairs described in the literature showed accel-
eration factors by the GAP far below the usual 10 5 factor
seen in most GTPase · GAP systems ( Frasa et al., 2012 ). We
found that TBC1D20, involved in hepatitic C infection, is
a very effective GAP for Rab1b. One special feature of the
Rab · RabGAP system investigated was a Gln finger provided
by the RabGAP in addition to the Arg finger. This finding
for a natural human Rab · RabGAP pair agrees with a mecha-
nism identified in a hybrid yeast/mouse system ( Pan et al.,
2006 ). The additional Gln finger seems to be unnecessary
as Rab already has an intrinsic Gln. However, this intrinsic
GTPase Gln is replaced by the GAP Gln finger, and only then
can full GAP activity be reached. Mutation of the intrinsic
GTPase Gln does not have a major effect on activity. This
implies that Rab Gln mutants are not suitable as ‘ on ’ state
mutants in cell experiments ( Nottingham and Pfeffer, 2014 ).
ν (cm-1)
B
A
∼
Figure 8 The protein-bound P i intermediate.
(A) The structure of P i bound to the Ras · RasGAP complex obtained
from a combination of FTIR and biomolecular simulations ( Xia
et al., 2012 ). (B) The band positions and thus the structures of the
P i intermediate among different GTPase · GAP complexes vary ( Sot
et al., 2010 ).
The reaction intermediate and catalysis The structure of Ras protein-bound phosphate was cal-
culated in detail by QM/MM simulations ( Figure 8 A) ( Xia
et al., 2012 ). The calculated hydrogen bonding network
showed why Ras was still in the ‘ on ’ state. Two hydrogen
bonds between P i and the Thr35 backbone position switch
I in an orientation similar to the ground state. Hydro-
gen bonds between P i and the GDP along with coulomb
interactions between P i and the Mg 2 + stabilize the inter-
mediate. Interestingly, the corresponding spectra of the
protein-bound intermediates from other GTPases varied
significantly ( Figure 8 B) ( Chakrabarti et al., 2007 ). For
Rap, the asymmetric stretching vibration was redshifted.
Different intermediate band positions were found for both
Ras and Rap catalyzed by the dual GAP1 proteins. Biomo-
lecular dynamics calculations of these states are needed
to explain the observed differences.
Further insights into GTPases intermediate varia-
tions are provided by the thermodynamic parameters. By

8 C. K ö tting and K. Gerwert: What vibrations tell us about GTPases
measuring the reaction rates at different temperatures,
the activation enthalpy and entropy for each reaction
step can be obtained. While the intrinsic GTPase reaction
is normally governed by activation enthalpy ( K ö tting and
Gerwert, 2004 ), the GAP-catalyzed reaction is dominated
by activation entropy ( K ö tting et al., 2008 ). However,
TCS2-GAP-catalyzed RheB was decisively driven by acti-
vation enthalpy ( Marshall et al., 2009 ). These differences
are probably due to different rate-limiting steps. For
reactions where the bond breakage, itself, is rate limit-
ing, enthalpy should play the major role. Conversely, in
processes where the movement of an Arg finger into the
binding pocket or the P i release is the rate-limiting step,
entropy is likely to be important. Overall, it seems that
the reaction mechanisms among the small GTPases are
remarkably different when looked at in detail. These dif-
ferences may facilitate GAP specificity for its cognate
GTPase despite the very similar G-domains that catalyze
the same reaction.
Theoretical infrared spectroscopy The vibrational spectrum is very sensitive with respect
to changes in geometry and charge distribution. For
example, a 0.001- Å change in bond length corresponds
to approximately 1 cm -1 vibrational frequency shift in the
case of phosphates ( Deng et al., 1998 ). In principle, very
small changes can be resolved by a typical FTIR measure-
ment with a 4 cm -1 resolution. However, the vibrational
mode energy is also influenced by geometry changes
other than bond length and coupling with other vibra-
tional modes. Therefore, the geometry cannot be directly
deduced from experimental spectra. It has to be decoded
through biomolecular simulations such as quantum
mechanics/molecular mechanics (QM/MM) algorithms.
With quantum chemical calculations, theoretical vibra-
tional spectra can be generated and compared with
experimental spectra. The comparison of theoretical
with experimental IR spectra is an important measure of
QM/MM simulation quality. For example, the force field
parameters and the interface between QM and MM is often
error prone. The mean band deviation of a calculated
spectrum from an experimental one in a state-of-the-art
QM calculation is about 30 cm -1 ( Jacobsen et al., 2013 ).
This corresponds to a bond length accuracy of approxi-
mately 0.01 Å . To calculate GTPase spectra, we employed
the QM/MM technique. While most of the system was
treated by molecular mechanics, the area of interest was
calculated using quantum mechanics. This correlates
nicely with FTIR difference spectroscopy, where only the
reactive region is seen in the difference spectrum. If the
theoretical and experimental spectra agree, the calcula-
tion results can be analyzed, and the geometry and charge
distribution are obtained.
Our methodology was explained in detail previously
( Rudack et al., 2012a ). Briefly, the QM/MM simulations
were based on an X-ray structural model. Model modifica-
tions were necessary including exchanging the nucleotide
analog with GTP. Next, a classical MD simulation refined
the system closer to the real structure. Then, several simu-
lation snapshots during this simulation were further opti-
mized using QM/MM simulations, and several spectra
were generated. The statistics were used to estimate the
absorbance bandwidth. If, as in our case, experimental
and calculated spectra agree, the geometry and charge
distribution are obtained with very high accuracy.
Catalytically important structural changes usually
occur below typical X-ray structure resolution. For
example, a 0.1- Å change in a C-C single bond corre-
sponds to an energy of 5 kJ/mol. While an X-ray struc-
ture may not be able to accurately observe this change,
they are easily resolved by vibrational spectroscopy. We
calculated the hydrolysis of GTP free in solution, bound
to Ras, and bound to the Ras · GAP complex in order to
understand the catalytic mechanism in detail. As dis-
cussed above, GTP hydrolysis in water is very slow with
a rate of 5 × 10 -8 s -1 at 303 K. The rate increases by 4 – 5
orders of magnitude in Ras and by another 4 – 5 orders of
magnitude in the Ras · GAP complex ( Phillips et al., 2003 ;
K ö tting and Gerwert, 2004 ). The most important findings
are summarized in Figure 9 ( Rudack et al., 2012b ). When
the free GTP in solution was compared with bound GTP
in Ras and Ras · GAP, several observations were made.
In the order from GTP in water via GTP in Ras to GTP
in Ras · GAP (i) The γ -phosphorus atom charge became
more positive facilitating the nucleophilic attack by a
water molecule. At the same time, the oxygen atom that
is accepting a proton did not change its charge (pink
circles in Figure 9 ). (ii) The distance between the β - and
γ -phosphorus atoms increased (pink circles in Figure 9 ).
(iii) The phosphate oxygen atoms moved from a stag-
gered to an eclipsed conformation. This was observed for
the β - γ phosphate in Ras and all three phosphates in the
Ras · GAP complex (orange arrows in Figure 9 ). The Ras
and GAP act like keys in a toy car, winding up a spring.
This drives the GTP conformation and charge distribu-
tion toward the transition state, reducing the energetic
barrier to hydrolysis, exactly as expected for catalysis.

C. K ö tting and K. Gerwert: What vibrations tell us about GTPases 9
GTPase-membrane interactions Most GTPases are posttranslationally modified with lipid
anchors ( Gelb, 1997 ). Membrane tethering and target-
ing plays an important functional and regulatory role
( Henis et al., 2009 ). Historically, most studies, especially
X-ray structures, were performed on anchorless GTPases;
however, in recent years, GTPase membrane interactions
have come into focus ( Gruschus et al., 2014 ). This includes
GDI function ( Cherfils and Zeghouf, 2013 ), lipid anchor
attachment and detachment, and membrane targeting
dynamics.
FTIR spectroscopic investigations of GTPase mem-
brane interactions are feasible using the ATR technique.
In our studies, we used a semisynthetic N-Ras with
two lipid anchors ( Bader et al., 2000 ). Compared to the
natural N-Ras ( Ahearn et al., 2011 ), only two minor
changes were present. First, a maleimido linker was intro-
duced after amino acid 181. This was needed to couple
the recombinant protein to a C-terminal synthetic linker.
Second, the palmitoyl group was replaced by hexade-
cyl to prevent hydrolysis. Cell studies demonstrated that
the semisynthetic N-Ras is a good substitute for natural
N-Ras ( Rocks et al., 2005 ). In the ATR-FTIR experiments,
a model membrane was attached to a germanium crystal
through hydrophilic interactions. N-Ras then bound to the
membrane specifically via its anchor, whereas anchorless
N-Ras did not bind ( G ü ldenhaupt et al., 2008 ). Figure 10 A
shows a schematic of Ras bound to a solid supported
membrane. The immobilized Ras protein can be used for
several biophysical experiments. Figure 10 B shows the
intrinsic GTPase reaction kinetics of membrane-bound
Ras compared with Ras in solution, and Figure 10 C shows
the corresponding difference spectra. Both the rate and
the spectra were very similar, and this demonstrated the
reproducibility of the difference spectra using either the
transmission or ATR technique. The comparison showed
that membrane binding produced no major changes in
the G domain ( K ö tting et al., 2012 ). The only prominent
difference spectra deviation was the disappearance of
the released phosphate band that is observed in a closed
transmission cuvette, but flushed away in a flow-through
ATR cell. These results indicated that the main function
of the lipid modification is to immobilize Ras. Therefore,
reliable results for investigations unrelated to membrane
targeting should be obtainable using artificial anchors.
We also found that polyhistidine tag Ras anchoring was
possible ( Pinkerneil et al., 2012 ; Schartner et al., 2013 ). In
fact, we were able to obtain the same K d for Ras to its effec-
tor, NORE, ( Stieglitz et al., 2008 ) and very similar differ-
ence spectra for Ras off
and Ras on
.
Several biophysical experiments can be performed
using proteins immobilized on an ATR crystal. From these
experiments, an array of additional information can be
obtained. This includes protein-protein interaction inves-
tigations, similar to surface plasmon resonance (SPR),
but with additional detailed chemical information from
FTIR spectroscopy. Difference spectroscopy of reaction
Figure 9 The Ras · RasGAP GTPase catalytic mechanism revealed by FTIR and biomolecular simulations.
The orientations, bond distances, and conformational geometry of pre-hydrolysis GTP are shown for free GTP in water (red), in Ras alone
(blue), and in the Ras · RasGAP complex (green). The reaction is catalyzed by charge shifts that favor nucleophilic attack by a water (orange),
increased β - and γ -phosphate distance, and GTP conformational strain buildup. Adapted from Rudack et al. (2012b) .

10 C. K ö tting and K. Gerwert: What vibrations tell us about GTPases
steps such as ligand exchange can be performed without
caged compounds, as demonstrated with the GTPase
Ras ( Figure 10 C). Finally, using polarized IR beams, the
spatial orientation of the protein relative to the membrane
can be deduced. This experiment was performed on the
Ras protein. In Ras, the helical protein content was in an
upright orientation, perpendicular to the membrane. This
was inconsistent with MD simulations of monomers per-
formed in our lab and others ( Prakash and Gorfe, 2014 ).
1.2
A
B
C
1.0
0.8
0.6
0.4
1690
(T
hr35
)16
70
1630
1530
1410
1193
1172
1263
(α)
1237
(α)
1216
(β)
1101
(β)
1078
1124
(β)11
44(γ
)
1455
1514
155215
81
1648
1616
1565
0.2
-0.2100
1800 1700 1600 1500 1400 1300 1200 1100 1000
1000t (s)
ν (cm-1)
ΔAΔA
10 000
N-Ras (membrane)
RasONGTP
RasOFFGDP
=(6.5±0.1)×10-5s-1
=(5.0±0.1)×10-5s-1
2×10⁻⁴
Pi
*
N-Ras (solution)
100 000
0
N-Ras (membrane)N-Ras (solution) (×0.038)
kLosung
kmembrane
Figure 10 ATR-FTIR investigations of membrane-anchored Ras.
(A) A representation of N-Ras immobilized on a POPC model
membrane. (B) Kinetics and (C) FTIR difference spectra indicate no
significant differences between the GTPase reaction in solution and
at the membrane. Adapted from K ö tting et al. (2012) .
Computation indicated that Ras could only maintain the
upright orientation if it was dimeric ( G ü ldenhaupt et al.,
2012 ). This dimer was confirmed by FRET measurements
( Figure 11 ). Recently, an H-Ras dimer was also found by
other workers ( Lin et al., 2014 ). Ras dimerization was
identified to be a new signal modulation mode, which
opens avenues for a new class of drugs that interfere with
the dimerization interface ( Santos, 2014 ).
Rab-GDI interactions Further GTPase membrane interaction studies were per-
formed on Rab GTPases ( Gavriljuk et al., 2013 ). Figure 12
shows the binding of a singly geranylgeranylated
Rab GTPase to a negatively charged, solid supported
membrane containing a 9:1 molar ratio of 1,2-diole-
oyl-sn-glycero-3-phosphocholine (DOPC) to 1,2-dioleoyl-sn-
glycero-3-phospho-L-serine (DOPS). Next, Rab-free buffer
was circulated in the system until equilibrium between
membrane-bound Rab and Rab in solution was formed.
Figure 11 An N-Ras dimer structure on a solid supported POPC
model membrane based on ATR-FTIR membrane spatial orientation
measurements, MD simulations of membrane-anchored Ras dimers,
and FRET measurements.
Adapted from G ü ldenhaupt et al. (2012) .

C. K ö tting and K. Gerwert: What vibrations tell us about GTPases 11
Then, GDI was added into the system. This triggered fast
Rab detachment from the membrane. Interestingly, this
process was faster than the k off
in the absence of GDI; there-
fore, detachment by GDI is an active process and not just
a removal of unbound Rab as would be expected in the
case of a simple solubilization factor. Without GDI Rab1b
was removed from the membrane much faster than Rab35.
This is due to the Rab35 C-terminal sequence, which is
more polar and charged compared to Rab1b. This ration-
ale was verified by engineering a chimeric Rab1b with
1.0
Rab35_G
Rab1b_GRab1brab35cterm_G
Binding
A
B
Circulation0.8
0.6
0.4
0.2
Nor
mal
ized
am
ide
II ar
ea
0
0 10 20 30
Wash
Wash
+1 μM GDI
40
Time (min)
Figure 12 ATR-FTIR investigations of singly geranylgeranylated Rab
binding and GDI extraction at the membrane.
(A) The C-terminus sequence determines the membrane extraction
rate. This is demonstrated by a chimeric Rab1b with a Rab35 C-ter-
minus that extracts at the same rate as Rab35. (B) The Legionella pneumophila pathogens can hijack Rab function. AnkX phospho-
cholinates Rab preventing membrane extraction. Lem3 restores the
natural Rab extraction rate. Adapted from Gavriljuk et al. (2013) .
a Rab35 C-terminus ( Figure 12 A). The chimeric protein
behaved like Rab35 with respect to the membrane interac-
tion. Additional experiments showed that GDP-bound Rab
is released faster than GTP-bound Rab, in keeping with the
known lower affinity of Rab · GTP than Rab · GDP for GDI
( Wu et al., 2010 ).
Rab interactions with pathogens were also studied.
Rab phosphocholinated by Legionella pneumophila AnkX
is not readily extracted from the membrane by GDI. Rab
dephosphocholination by Lem3 restores fast membrane
extraction.
In all these experiments, it was important to monitor
the amide I band shape to directly observe potential sec-
ondary structure changes. This ensures that the GTPase
maintains its native fold during the experiment. As a
further control, GTPase activity can be evaluated in the
same way as described above for Ras. We showed that Rab
proteins prenylated in the absence of detergent showed
broad amide I absorptions indicating denaturation. These
proteins are also more stably bound in an unspecific
manner. In contrast, prenylation in the presence of deter-
gent, which was subsequently removed, produced suc-
cessfully immobilized, natively folded Rab. Methods other
than FTIR would not have these controls available, which
might produce misleading conclusions.
In summary, the complete molecular reaction mecha-
nism of small GTPases and their interactions was studied
by time-resolved FTIR in combination with X-ray struc-
tural analysis and biomolecular simulation. This approach
was extended to membrane-bound small GTPases, which
allowed additional membrane extraction and delivery
information to be monitored. This provided detailed spati-
otemporal insights into the mechanisms and interactions
of small GTPases at the membrane.
Acknowledgments: We acknowledge the Deutsche
Forschungsgemeinschaft (grant no. SFB 642) for its finan-
cial support. We thank past and present members of the
Bochum GTPase group and our collaborators for all their
contributions and Konstantin Gavriljuk for manuscript
proofreading. Special thanks are given to Roger S. Goody
and Alfred Wittinghofer for an excellent and very fruitful
collaboration over the years.
References Ahearn, I.M., Haigis, K., Bar-Sagi, D., and Philips, M.R. (2011).
Regulating the regulator: post-translational modification of
RAS. Nat. Rev. Mol. Cell Biol. 13 , 39 – 51.

12 C. K ö tting and K. Gerwert: What vibrations tell us about GTPases
Ataka, K., Kottke, T., and Heberle, J. (2010). Thinner, smaller, faster:
IR techniques to probe the functionality of biological and bio-
mimetic systems. Angew. Chem. Int. Ed. 49 , 5416 – 5424.
Bader, B., Kuhn, K., Owen, D.J., Waldmann, H., Wittinghofer, A., and
Kuhlmann, J. (2000). Bioorganic synthesis of lipid-modified
proteins for the study of signal transduction. Nat. Lond. 403 ,
223 – 226.
Barth, A. and Zscherp, C. (2002). What vibrations tell about
proteins. Q. Rev. Biophys. 35 , 369 – 430.
Barth, A., Corrie, E.T.J., Gradwell, M.J., Maeda, Y., M ä ntele, W.,
Meier, T., and D.R. Trentham. (1997). Time-resolved infrared
spectroscopy of intermediates and products from photolysis
of 1-(2-nitrophenyl)ethyl phosphates: reaction of the 2-nitros-
oacetophenone byproduct with Thiols. J. Am. Chem. Soc. 119 ,
4149 – 4159.
Brucker, S., Gerwert, K., and K ö tting, C. (2010). Tyr39 of Ran
preserves the Ran.GTP gradient by inhibiting GTP hydrolysis.
J. Mol. Biol. 401 , 1 – 6.
Cepus, V., Ulbrich, C., Allin, C., Troullier, A., and Gerwert, K. (1998).
Fourier transform infrared photolysis studies of caged com-
pounds. Methods Enzymol. 291 , 223 – 245.
Chakrabarti, P.P., Daumke, O., Suveyzdis, Y., K ö tting, C.,
Gerwert, K., and Wittinghofer, A. (2007). Insight into catalysis
of a unique GTPase reaction by a combined biochemical and
FTIR approach. J. Mol. Biol. 367 , 983 – 995.
Cherfils, J. and Zeghouf, M. (2013). Regulation of Small GTPases by
GEFs, GAPs, and GDIs. Physiol. Rev. 93 , 269 – 309.
Cox, A.D. and Der, C.J. (2010). Ras history – the saga continues.
Small GTPases 1 , 2 – 27.
Dannenberg, J.J. (2006). Enthalpies of hydration of N-methylaceta-
mide by one, two, and three waters and the effect upon the C:O
stretching frequency. An ab initio DFT study. J. Phys. Chem. A
110 , 5798 – 5802.
Daumke, O., Weyand, M., Chakrabarti, P.P., Vetter, I.R., and Witting-
hofer, A. (2004). The GTPase-activating protein Rap1GAP uses a
catalytic asparagine. Nature 429 , 197 – 201.
Deng, H., Wang, J.H., Callender, R., and Ray, W.J. (1998). Relation-
ship between bond stretching frequencies and internal bond-
ing for [O-16(4)]- and [O-18(4)]phosphates in aqueous solution.
J. Phys. Chem. B 102 , 3617 – 3623.
Engelhard, M., Gerwert, K., Hess, B., and Siebert, F. (1985). Light-
driven protonation changes of internal aspartic acids of
bacteriorhodopsin: an investigation of static and time-resolved
infrared difference spectroscopy using [4- 13 C]aspartic acid
labeled purple membrane. Biochemistry (Mosc) 24 , 400 – 407.
Frasa, M.A.M., Koessmeier, K.T., Ahmadian, M.R., and Braga, V.M.M.
(2012). Illuminating the functional and structural repertoire of
human TBC/RABGAPs. Nat. Rev. Mol. Cell Biol. 13 , 67 – 73.
Gavriljuk, K., Gazdag, E.-M., Itzen, A., K ö tting, C., Goody, R.S.,
and Gerwert, K. (2012). Catalytic mechanism of a mammalian
RabRabGAP complex in atomic detail. Proc. Natl. Acad. Sci. USA
109 , 21348 – 21353.
Gavriljuk, K., Itzen, A., Goody, R.S., Gerwert, K., and K ö tting, C. (2013).
Membrane extraction of Rab proteins by GDP dissociation
inhibitor characterized using attenuated total reflection infrared
spectroscopy. Proc. Natl. Acad. Sci. USA 110 , 13380 – 13385.
Gelb, M.H. (1997). Protein prenylation, et cetera – signal transduc-
tion in two dimensions. Science 275 , 1750 – 1750.
Gerwert, K. (1988). Intramolecular protein dynamics study with
time-resolved Fourier-transform IR-difference spectroscopy.
Berichte Bunsen-Ges 92 , 978 – 982.
Gerwert, K. (1993). Molecular reaction mechanisms of proteins as
monitored by time-resolved FTIR spectroscopy. Curr. Opin.
Struct. Biol. i , 769 – 773.
Gerwert, K. and K ö tting, C. (2010). Fourier transform infrared (FTIR)
spectroscopy. Encycl. Life Sci. ( Chichester: John Wiley & Sons,
Ltd.). DOI: 10.1002/9780470015902.a0003112.pub2
Gerwert, K. and Siebert, F. (1986). Evidence for light-induced 13- cis ,
14-s- cis , isomerization in bacteriorhodopsin obtained by FTIR
difference spectroscopy using isotopically labelled retinals.
EMBO J. 5 , 805 – 811.
Gerwert, K., Hess, B., Soppa, J., and Oesterhelt, D. (1989). Role of
aspartate-96 in proton translocation by bacteriorhodopsin.
Proc. Natl. Acad. Sci. USA 86 , 4943 – 4947.
Gerwert, K., Souvignier, G., and Hess, B. (1990). Simultaneous
monitoring of light-induced changes in protein side-group
protonation, chromophore isomerization, and backbone motion
of bacteriorhodopsin by time-resolved Fourier-transform infra-
red spectroscopy. Proc. Natl. Acad. Sci. USA 87 , 9774 – 9778.
Goormaghtigh, E., Gasper, R., Benard, A., Goldsztein, A., and
Raussens, V. (2009). Protein secondary structure content in
solution, films and tissues: redundancy and complementarity
of the information content in circular dichroism, transmission
and ATR FTIR spectra. Biochim. Biophys. Acta 1794 , 1332 – 1343.
Grigorenko, B.L., Nemukhin, A.V., Shadrina, M.S., Topol, I.A., and
Burt, S.K. (2007). Mechanisms of guanosine triphosphate
hydrolysis by Ras and Ras-GAP proteins as rationalized by ab initio QM/MM simulations. Proteins Struct Funct Bioinform 66 ,
456 – 466.
Gruschus, J.M., Byrd, R.A., and Randazzo, P.A. (2014). The impor-
tance of seeing surface (effects). Structure 22 , 363 – 365.
G ü ldenhaupt, J., Adig ü zel, Y., Kuhlmann, J., Waldmann, H., K ö tting,
C., and Gerwert, K. (2008). Secondary structure of lipidated
Ras bound to a lipid bilayer. FEBS J. 275 , 5910 – 5918.
G ü ldenhaupt, J., Rudack, T., Bachler, P., Mann, D., Triola, G.,
Waldmann, H., K ö tting, C., and Gerwert, K. (2012). N-Ras forms
dimers at POPC membranes. Biophys. J. 103 , 1585 – 1593.
Ham, S. and Cho, M. (2003). Amide I modes in the N-methylacet-
amide dimer and glycine dipeptide analog: diagonal force
constants. J. Chem. Phys. 118 , 6915.
Henis, Y.I., Hancock, J.F., and Prior, I.A. (2009). Ras acylation,
compartmentalization and signaling nanoclusters (review).
Mol. Membr. Biol. 26 , 80 – 92.
Hering, J.A. and Haris, P.I. (2009). FTIR Spectroscopy for Analysis of
Protein Secondary Structure (Amsterdam; IOS Press).
Hessling, B., Souvignier, G., and Gerwert, K. (1993). A model-inde-
pendent approach to assigning bacteriorhodopsin ’ s intramo-
lecular reactions to photocycle intermediates. Biophys. J. 65 ,
1929 – 1941.
Hodges-Loaiza, H.B., Parker, L.E., and Cox, A.D. (2011). Prenylation
and Phosphorylation of Ras Superfamily Small GTPases. The
Enzymes (Elsevier: Amsterdam, The Netherlands), pp. 43 – 69.
Jacobsen, R.L., Johnson, R.D., Irikura, K.K., and Kacker, R.N. (2013).
Anharmonic vibrational frequency calculations are not worth-
while for small basis sets. J. Chem. Theory Comput. 9 , 951 – 954.
Jamali, T., Jamali, Y., Mehrbod, M., and Mofrad, M.R.K. (2011).
Nuclear pore complex. Int. Rev. Cell Mol. Biol. 287 , 233 – 286.
Khan, A.R. and M é n é trey, J. (2013). Structural biology of Arf and Rab
GTPases ’ effector recruitment and specificity. Structure 21 ,
1284 – 1297.
Kl á n, P., Š olomek, T., Bochet, C.G., Blanc, A., Givens, R., Rubina, M.,
Popik, V., Kostikov, A., and Wirz, J. (2013). Photoremovable pro-
C. K ö tting and K. Gerwert: What vibrations tell us about GTPases 13
tecting groups in chemistry and biology: reaction mechanisms
and efficacy. Chem. Rev. 113 , 119 – 191.
K ö tting, C. and Gerwert, K. (2004). Time-resolved FTIR studies pro-
vide activation free energy, activation enthalpy and activation
entropy for GTPase reactions. Chem. Phys. 307 , 227 – 232.
K ö tting, C. and Gerwert, K. (2005a). Proteins in action monitored by
time-resolved FTIR spectroscopy. ChemPhysChem 6 , 881 – 888.
K ö tting, C. and Gerwert, K. (2005b). Monitoring protein-protein
interactions by time-resolved FTIR difference spectroscopy.
In: Protein-Protein Interact, 2nd Ed, E. Golemis and P. Adams,
eds. (Cold Spring Harbor, NY, USA: Cold Spring Harb Lab Press)
pp. 279 – 299.
K ö tting, C. and Gerwert, K. (2013). The dynamics of the catalytic site
in small GTPases, variations on a common motif. FEBS Lett.
587 , 2025 – 2027.
K ö tting, C., Blessenohl, M., Suveyzdis, Y., Goody, R.S.,
Wittinghofer, A., and Gerwert, K. (2006). A phosphoryl transfer
intermediate in the GTPase reaction of Ras in complex with
its GTPase-activating protein. Proc. Natl. Acad. Sci. USA 103 ,
13911 – 13916.
K ö tting, C., Kallenbach, A., Suveyzdis, Y., Eichholz, C., and
Gerwert, K. (2007). Surface change of Ras enabling effector
binding monitored in real time at atomic resolution. ChemBio-
Chem 8 , 781 – 787.
K ö tting, C., Kallenbach, A., Suveyzdis, Y., Wittinghofer, A., and
Gerwert, K. (2008). The GAP arginine finger movement into
the catalytic site of Ras increases the activation entropy. Proc.
Natl. Acad. Sci. USA 105 , 6260 – 6265.
K ö tting, C., Suveyzdis, Y., Bojja, R.S., Metzler-Nolte, N., and
Gerwert, K. (2010). Label-free screening of drug-protein
interactions by time-resolved Fourier transform infrared
spectroscopic assays exemplified by Ras interactions. Appl.
Spectrosc. 64 , 967 – 972.
K ö tting, C., G ü ldenhaupt, J., and Gerwert, K. (2012). Time-resolved
FTIR spectroscopy for monitoring protein dynamics exemplified
by functional studies of Ras protein bound to a lipid bilayer.
Chem. Phys. 396 , 72 – 83.
Kupzig, S., Deaconescu, D., Bouyoucef, D., Walker, S.A.,
Liu, Q., Polte, C.L., Daumke, O., Ishizaki, T., Lockyer, P.J.,
Wittinghofer, A., et al. (2006). GAP1 family members constitute
bifunctional Ras and Rap GTPase-activating proteins. J. Biol.
Chem. 281 , 9891 – 9900.
Ligeti, E., Welti, S., and Scheffzek, K. (2012). Inhibition and termina-
tion of physiological responses by GTPase activating proteins.
Physiol. Rev. 92 , 237 – 272.
Lin, W.-C., Iversen, L., Tu, H.-L., Rhodes, C., Christensen, S.M.,
Iwig, J.S., Hansen, S.D., Huang, W.Y., and Groves, J.T. (2014).
H-Ras forms dimers on membrane surfaces via a protein-pro-
tein interface. Proc. Natl. Acad. Sci. USA 111 , 2996 – 3001.
Marshall, C.B., Ho, J., Buerger, C., Plevin, M.J., Li, G.Y., Li, Z.,
Ikura, M., and Stambolic, V. (2009). Characterization of the
intrinsic and TSC2-GAP-regulated GTPase activity of Rheb by
real-time NMR. Sci. Signal 2 , ra3.
Nottingham, R.M. and Pfeffer, S.R. (2014). Mutant enzymes chal-
lenge all assumptions. eLife 3 , e02171.
Pan, X.J., Eathiraj, S., Munson, M., and Lambright, D.G. (2006). TBC-
domain GAPs for Rab GTPases accelerate GTP hydrolysis by a
dual-finger mechanism. Nature 442 , 303 – 306.
Phillips, R.A., Hunter, J.L., Eccleston, J.F., and Webb, M.R. (2003).
The Mechanism of Ras GTPase activation by neurofibromin.
Biochemistry (Mosc) 42 , 3956 – 3965.
Pinkerneil, P., G ü ldenhaupt, J., Gerwert, K., and K ö tting, C.
(2012). Surface-attached polyhistidine-Tag proteins char-
acterized by FTIR difference spectroscopy. ChemPhysChem
13 , 2649 – 2653.
Prakash, P. and Gorfe, A.A. (2014). Overview of simulation studies
on the enzymatic activity and conformational dynamics of the
GTPase Ras. Mol. Simul. 40 , 839 – 847.
Rocks, O., Peyker, A., and Kahms, M., Verveer, P.J., Koerner, C.,
Lumbierres, M., Kuhlmann, J., Waldmann, H., Wittinghofer, A.,
and Bastiaens, P.I. (2005). An acylation cycle regulates locali-
zation and activity of palmitoylated Ras isoforms. Science 307 ,
1746 – 1752.
Rudack, T., Xia, F., Schlitter, J., K ö tting, C., and Gerwert, K. (2012a).
The role of magnesium for geometry and charge in GTP hydroly-
sis, revealed by quantum mechanics/molecular mechanics
simulations. Biophys. J. 103 , 293 – 302.
Rudack, T., Xia, F., Schlitter, J., Kötting, C., and Gerwert, K. (2012b).
Ras and GTPase-activating protein (GAP) drive GTP into a pre-
catalytic state as revealed by combining FTIR and biomolecular
simulations. Proc. Natl. Acad. Sci. USA 109 , 15295 – 15300.
Santos, E. (2014). Dimerization opens new avenues into Ras signal-
ing research. Sci. Signal 7 , pe12.
Schartner, J., G ü ldenhaupt, J., Mei, B., R ö gner, M., Muhler, M.,
Gerwert, K., and K ö tting, C. (2013). Universal method for pro-
tein immobilization on chemically functionalized germanium
investigated by ATR-FTIR difference spectroscopy. J. Am. Chem.
Soc. 135 , 4079 – 4087.
Schlichting, I., Rapp, G., John, J., Wittinghofer, A., Pai, E.F., and
Goody, R.S. (1989). Biochemical and crystallographic char-
acterization of a complex of C-Ha-Ras P21 and caged Gtp with
flash-photolysis – (time-resolved structure). Proc. Natl. Acad.
Sci. USA 86 , 7687 – 7690.
Scrima, A., Thomas, C., Deaconescu, D., and Wittinghofer, A. (2008).
The Rap – RapGAP complex: GTP hydrolysis without catalytic
glutamine and arginine residues. EMBO J. 27 , 1145 – 1153.
Siebert, F. and Hildebrandt, P. (2008). Vibrational Spectroscopy in
Life Science (Weinheim: Wiley-VCH).
Siebert, F., Maentele, W., and Gerwert, K. (1983). Fourier-transform
infrared spectroscopy applied to rhodopsin. The problem of
the protonation state of the retinylidene Schiff base reinvesti-
gated. Eur. J. Biochem. 136 , 119 – 127.
Sit, S.-T. and Manser, E. (2011). Rho GTPases and their role in organ-
izing the actin cytoskeleton. J. Cell Sci. 124 , 679 – 683.
Sot, B., K ö tting, C., Deaconescu, D., Suveyzdis, Y., Gerwert, K., and
Wittinghofer, A. (2010). Unravelling the mechanism of dual-
specificity GAPs. EMBO J. 29 , 1205 – 1214.
Stenmark, H. (2009). Rab GTPases as coordinators of vesicle traffic.
Nat. Rev. Mol. Cell Biol. 10 , 513 – 525.
Stieglitz, B., Bee, C., Schwarz, D., Yildiz, O., Moshnikova, A.,
Khokhlatchev, A., and Herrmann, C. (2008). Novel type of Ras
effector interaction established between tumour suppressor
NORE1A and Ras switch II. EMBO J. 27 , 1995 – 2005.
Vetter, I.R. and Wittinghofer, A. (2001). Signal transduction – the
guanine nucleotide-binding switch in three dimensions. Sci-
ence 294 , 1299 – 1304.
Wang, Y., Pascoe, H.G., Brautigam, C.A., He, H., and Zhang, X.
(2013). Structural basis for activation and non-canonical cataly-
sis of the Rap GTPase activating protein domain of plexin. eLife
2 , e01279.
Warscheid, B., Brucker, S., Kallenbach, A., Meyer, H.E., Gerwert, K.,
and K ö tting, C. (2008). Systematic approach to group-specific

14 C. K ö tting and K. Gerwert: What vibrations tell us about GTPases
isotopic labeling of proteins for vibrational spectroscopy. Vib.
Spectrosc. 48 , 28 – 36.
Wittinghofer, A. and Vetter, I.R. (2011). Structure-function relation-
ships of the G domain, a canonical switch motif. Annu. Rev.
Biochem. 80 , 943 – 971.
Wu, Y.-W., Oesterlin, L.K., Tan, K.-T., Waldmann, H., Alexandrov, K,
and Goody, R.S. (2010). Membrane targeting mechanism of
Rab GTPases elucidated by semisynthetic protein probes. Nat.
Chem. Biol. 6 , 534 – 540.
Xia, F., Rudack, T., Cui, Q., K ö tting, C., and Gerwert, K. (2012).
Detailed structure of the H 2 PO
4 - -guanosine diphosphate
intermediate in Ras-GAP decoded from FTIR experiments by
biomolecular simulations. J. Am. Chem. Soc. 134 ,
20041 – 20044.
Carsten Kötting obtained a PhD in physical organic chemistry from
the chemistry department of Ruhr-University Bochum, Germany
in 1999, working on matrix isolation of organic intermediates.
Afterwards he joined as a Feodor Lynen fellow the Zewail group at
Caltech, were he did femtochemistry of organic intermediates. After
two years he returned to Ruhr-University but joined the biophysics
institute of Klaus Gerwert. He finished his habilitation in chemical
biology working on time resolved FTIR spectroscopy of GTPases in
2009. His current research interests include besides the details of
the reaction mechanisms of GTPases, the extension of vibrational
spectroscopy to larger systems using Raman microscopy and the
development of chemically modified surfaces for protein immobili-
zation on ATR crystals.
Klaus Gerwert is head of the Department of Biophysics at RUB. He is
internationally recognized for his contributions in protein-dynamics
with very high spatiotemporal resolution using a combination of
time-resolved vibrational spectroscopy (FTIR and Raman) and bio-
molecular simulations (QM/MM). He elaborated the role of protein-
bound water molecules in proton-transfer in proteins, especially in
microbial rhodopsins like bacteriorhodopsin and channelrhodop-
sin. Furthermore, he contributed to the detailed understanding of
the catalysis of G-proteins by their respective G-activating proteins
like Ras and Rab. Recently his approach is extended to marker-
free vibrational imaging in cells and tissue for their application
in diagnostics. K. Gerwert graduated in biophysical chemistry
(Freiburg 1985), was research scientist at the Max-Planck-Institute
Dortmund (1986–1989), became Heisenberg-fellow at Scripps, USA,
and MPI Dortmund (1990–1993). Since 1993 he is a full professor
at the Ruhr-University Bochum (chair of biophysics). Since 2004
spokesman of SFB642 and since 2010 of PURE. Since 2009 Max-
Planck fellow at the Max-Planck- CAS Partner-Institute in Shanghai
(2009–2013 as director in a dual appointment). He received several
awards and is a member of the NRW academy of science.