What is the private return to tertiary education?: New evidence from 21 OECD countries
25
Electronic copy available at: http://ssrn.com/abstract=1860961 OECD Journal: Economic Studies Volume 2010 © OECD 2010 1 What is the Private Return to Tertiary Education? New Evidence from 21 OECD Countries by Romina Boarini and Hubert Strauss* This article provides estimates of the private Internal Rates of Return to tertiary education for women and men in 21 OECD countries, for the years between 1991 and 2005. IRR are computed by estimating labour market premia on cross-country comparable individual-level data. Labour market premia are then adjusted for fiscal factors and costs of education. We find that returns to an additional year of tertiary education are on average above 8% and vary in a range from 4 to 15% in the countries and in the period under study. IRR are relatively homogenous across genders. Overall, a slightly increasing trend is observed over time. The article discusses various policy levers for shaping individual incentives to invest in tertiary education and provides some illustrative quantification of the impact of policy changes on those incentives. JEL Classification: I21, I22, I28, J24 Keywords: Investment in tertiary education, returns to education, labour market premia * Boarini: OECD Economics Department (e-mail: [email protected]); Strauss: European Investment Bank (e-mail: [email protected]). The authors would like to thank Jean-Philippe Cotis, Jørgen Elmeskov, Michael Feiner, Giuseppe Nicoletti and Joaquim Oliveira Martins for their comments and inputs. Christine de la Maisonneuve’s statistical assistance is gratefully acknowledged. The views expressed are those of the authors and do not necessarily represent those of the OECD or its member countries.
Transcript of What is the private return to tertiary education?: New evidence from 21 OECD countries
OECD Journal: Economic Studies
Volume 2010
© OECD 2010
What is the Private Return to Tertiary Education?
New Evidence from 21 OECD Countries
byRomina Boarini and Hubert Strauss*
This article provides estimates of the private Internal Rates of Return to tertiaryeducation for women and men in 21 OECD countries, for the years between 1991and 2005. IRR are computed by estimating labour market premia on cross-countrycomparable individual-level data. Labour market premia are then adjusted for fiscalfactors and costs of education. We find that returns to an additional year of tertiaryeducation are on average above 8% and vary in a range from 4 to 15% in thecountries and in the period under study. IRR are relatively homogenous acrossgenders. Overall, a slightly increasing trend is observed over time. The articlediscusses various policy levers for shaping individual incentives to invest in tertiaryeducation and provides some illustrative quantification of the impact of policychanges on those incentives.
JEL Classification: I21, I22, I28, J24
Keywords: Investment in tertiary education, returns to education, labour marketpremia
* Boarini: OECD Economics Department (e-mail: [email protected]); Strauss: European InvestmentBank (e-mail: [email protected]). The authors would like to thank Jean-Philippe Cotis, Jørgen Elmeskov,Michael Feiner, Giuseppe Nicoletti and Joaquim Oliveira Martins for their comments and inputs.Christine de la Maisonneuve’s statistical assistance is gratefully acknowledged. The views expressed arethose of the authors and do not necessarily represent those of the OECD or its member countries.
Electronic copy available at: http://ssrn.com/abstract=1860961
1

WHAT IS THE PRIVATE RETURN TO TERTIARY EDUCATION? NEW EVIDENCE FROM 21 OECD COUNTRIES
Internal rates of return (IRR) to education are a standard measure of the profitability of
additional years of schooling. IRR estimates have increasingly relied on a sound analytical
framework accounting for many different kinds of lifetime economic benefits and costs of
schooling, including, among others, the well-known Mincerian wage premia. This article
builds on such recent developments (de la Fuente and Jimeno, 2005) and on new estimates
of wage premia (Strauss and de la Maisonneuve, 2009) to provide IRR estimates for men
and women in 21 OECD countries covering the time period 1991 to 2005.
The main contribution of this paper is the use of cross-country comparable basic
components of IRR, including labour market premia estimated on individual-level data
sets, fiscal and social benefit parameters based on various OECD tax and benefit models,
and higher education cost estimates from the OECD Education Data Set. The paper focuses
on tertiary education decisions and thus provides IRR estimates specifically referring to an
additional year of schooling beyond the upper-secondary degree.
We find that the cross-country average of the baseline IRR is above 8% in the period
under scrutiny, and essentially varies in a range from 4 to 15%. IRR are relatively
homogenous across genders. Overall, a slightly increasing trend is observed over time. At
the end of the 1990s and in the early 2000s, IRR increased more markedly in Ireland and
Canada, while they started declining in United Kingdom. Labour market premia turn out to
be the main drivers of IRR, often irrespective of education costs. Beyond labour markets,
return to schooling depends (positively) on average tax rates and the share of students’
time worked; and (negatively) on marginal tax rates, study duration and tuition fees.
The article is organised as follows. Section 1 presents the analytical framework and
discusses in detail the assumptions made in computing IRR. Section 2 elaborates on the
construction of the basic components of IRR, namely labour market premia, fiscal and
social benefit parameters and private costs. Section 3 shows estimates of IRR in the
baseline scenario and in a number of alternative scenarios. It compares IRR estimates with
those from previous studies and discusses their interpretation and their limitations.
Section 4 illustrates the sensitivity of IRR by simulating changes in labour market
outcomes and policy parameters. Section 5 concludes.
1. Methodological approaches to computing private returns to schooling
1.1. Education as an investment
According to human capital theory (Becker, 1967) individuals are supposed to
undertake education up to the point where the present value of expected benefits from
additional schooling is equal to that of its direct and indirect costs (i.e. tuition fees and
foregone earnings). Education should increase the productivity of individuals, and more
skilled workers are therefore expected to command higher salaries if labour markets are
perfect and labour is paid at its marginal value.
Against this background, it has often been claimed that schooling decisions are
endogenous and depend on the levels of innate ability, taste for schooling, access to funds
Electronic copy available at: http://ssrn.com/abstract=1860961
OECD JOURNAL: ECONOMIC STUDIES – VOLUME 2010 © OECD 20102

WHAT IS THE PRIVATE RETURN TO TERTIARY EDUCATION? NEW EVIDENCE FROM 21 OECD COUNTRIES
and the possible interaction of all these factors (Card, 1999). While in principle these
factors may raise or lower the incentive to invest in education,1 their net total effect is
bound to be an empirical question; however, many studies find an only slight over-
estimation of the “true” effects of schooling (around 10% of wage premia; Card, 1999).2
Based on these findings, and due to data limitations, this paper does not take into account
ability in estimating returns (unlike, e.g. Vella and Gregory, 1996). We assume the ability
bias to be small and argue that the results are a reasonable approximation of the average
return to schooling, even though they might slightly overestimate this average return if the
schooling decision is endogenous to individual innate abilities. However, our IRR estimates
neglect the earnings dispersion within a given educational level that is due to
heterogeneity in ability, personal discount rates and other unobservable characteristics.
Another criticism of human capital theory is that individuals would not invest in
education to increase their potential productivity, but rather to send a signal of their ability.
In empirical studies signalling effects are, however, found to be rather small (less than 1%;
Harmon et al., 2003). Furthermore, from the perspective of guiding the individual decision
to invest in human capital, the signalling effect is irrelevant, as individuals need a degree
to signal their higher productivity; hence, whether the higher salary results from inherent
ability or received education becomes immaterial. From the point of view of policy makers,
it will, however, make a difference to know whether benefits from additional education
stem from the value added of the education system itself or are partly due to students’
innate abilities.
Another common assumption when computing returns to education is that benefits and
costs are only pecuniary. While research has increasingly argued that education yields broader
advantages to individuals (e.g. social prestige, better health, lower propensity to commit
crimes, etc.; see Grossman, 2005), a sound empirical assessment of these non-pecuniary
advantages is still lacking. In particular, the issue of measurement of these benefits is still
largely debated, especially in the context of cross-country comparative work. For these
reasons, this article takes into account only pecuniary benefits.
Many techniques of computing returns to education exist (see Psacharopoulos and
Patrinos, 1994, Psacharopoulos, 1995, and Heckman et al., 2005, for a review), but the most
common are the discount method and the Mincerian approach. Heckman et al. (2005) have
shown that these two approaches produce similar results under stringent assumptions.3 In
the discount method IRR summarise how profitable it is to undertake an additional year of
schooling on the basis of the relevant stream of benefits and costs associated with it. The
discount method has, however, some limitations since it often relies on average earnings
across educational groups, without further controls for other individual characteristics. By
contrast, the Mincerian approach relies on the econometric estimation of earning
functions, based on individual-level data (see Mincer, 1974, and Harmon et al., 2003, for a
review). While this method has the merit of singling out the part of the earnings variance
that is due to education, it clearly neglects the cost of education, as well as the taxes and
social benefits that workers pay/receive over the life cycle.4
1.2. The analytical framework
This article essentially follows the approach developed in de la Fuente and Jimeno
(2005) in combining the discount method and the estimation of Mincerian wage premia
and other labour market premia from micro-level data (see Boarini and Strauss, 2007, for a
formal presentation of the model).
OECD JOURNAL: ECONOMIC STUDIES – VOLUME 2010 © OECD 2010 3

WHAT IS THE PRIVATE RETURN TO TERTIARY EDUCATION? NEW EVIDENCE FROM 21 OECD COUNTRIES
Agents are assumed to choose the optimal level of schooling by maximising the
present value of lifetime expected after-tax income, net of the direct costs entailed by
education: IRR is indeed the discount rate equating the marginal benefit to the marginal cost
(see Figure 1 for a stylised illustration). The marginal benefit from education can be
decomposed into three components: the net wage premium, defined as the increase in
wages entailed by an additional year of schooling and holding constant the employment
probability; the net employability premium, given by the increase of the employment
probability associated with an additional year of schooling, and holding wage constant;
and the pension premium, i.e. the discounted value of higher retirement benefits due to
higher lifetime labour earnings resulting from an additional year of schooling. The
marginal cost of education is given by two components: the opportunity cost of schooling,
i.e. the foregone earnings and labour-market experience due to continued schooling, and
the direct cost of schooling borne by the agent, essentially given by tuition fees.
In contrast to de la Fuente and Jimeno (2005), the baseline IRR constructed here does
not include the possibility of students’ part-time work, though alternative estimates of IRR
under common assumptions on duration and reward of students’ work are provided
below.5 The other assumptions are in line with de la Fuente and Jimeno (2005): the wage
premium is an increasing and time-invariant function of schooling; the experience
premium is constant across schooling levels (it is supposed to be a function of potential
experience rather than actual years of employment and should grow at a constant rate
over time); the employment probability is an increasing and time-invariant function of
schooling; and individuals receive out-of-work benefits if unemployed and pay taxes on
Figure 1. Individual returns to tertiary education illustrated
Notes: DIRC: Direct costs of tertiary education.OPPC: Opportunity costs of not starting to work after secondary education. + P’: Wage and employability premia associated with tertiary education (net of taxes and benefits).PENS: Retirement premia for tertiary education workers (net of taxes).1. Assuming the same length of working life.2. Assuming partial indexation of pension benefits.
OPPC
DIRC
+ P’ PENS
Realearnings
Retirement age1 End of tertiaryeducation period
Start of working life
Upper-secondary Tertiary
Time
Earnings profile of a worker with a secondary education degree2
Earnings profile of a worker with a tertiary education degree2
OECD JOURNAL: ECONOMIC STUDIES – VOLUME 2010 © OECD 20104

WHAT IS THE PRIVATE RETURN TO TERTIARY EDUCATION? NEW EVIDENCE FROM 21 OECD COUNTRIES
either labour income or unemployment benefits, depending on their labour market status.
Both benefits and taxes are constant over the life cycle but vary with schooling. The length
of the working life is the same across levels of schooling. Some of these assumptions are
relatively strong and have notably been rejected by empirical evidence on national samples
(e.g. time-invariance of schooling premium in the United States; see Heckman et al., 2005).
However, these assumptions had to be made in absence of cross-comparable, sufficiently
long panel data sets.
Moreover, as in de la Fuente and Jimeno (2005), the various IRR ingredients are either
estimated on individual-level data through multivariate regressions (labour market
premia) or drawn from various OECD tax and benefit models. In the latter case, tax and
benefit parameters are those of a representative agent in the economy at 100% of average
earnings (AE).
2. Computation of IRR components
2.1. Estimation of labour market premia: The use of individual-level data
Labour market premia are computed using individual-level data from cross-country
comparable household survey data sets (see Annex 1 in Boarini and Strauss, 2007). This
kind of data allows estimating premia to education through multivariate regressions,
controlling for individual heterogeneity with respect to a number of characteristics. Labour
market premia are estimated country by country and period by period for three
educational attainment levels (less than upper-secondary degree, upper-secondary degree,
tertiary education). Labour market premia are also estimated separately for men and
women.6
2.1.1. Wage and experience premia7
The wage premium on tertiary education and the labour market experience premium
are obtained by regressing the log of gross hourly labour earnings on the level of educational
attainment and on the number of years of labour market experience, as in the standard
Mincerian approach. In the absence of relevant information on actual labour market
experience, regressions make use of years of potential experience, proxied as the difference
between current age and age at labour market entry. In addition, the estimation of wage and
experience premia controls for a number of individual characteristics that potentially affect
earnings but are not directly related to tertiary education. These include gender, marital
status, job tenure, the type of work contract and working in the public versus the private
sector. The estimates also control for the size of the production unit (“plant size”) in which
individuals are employed and over- or under-qualification for the job.8
Regression results of the wage equation are in line with priors for most variables. The
Mincerian coefficient of tertiary education attainment, the gross wage premium, is found
to be 55% on average and to vary widely across countries (between 27 and 92%; see Figure 2
and Strauss and de la Maisonneuve, 2009, for more details).9 Women’s tertiary wage
premia are higher than men’s in 9 of 21 countries, the difference being significant in Poland
and Portugal, and moderate in Canada, Greece, Ireland, Spain and the United Kingdom. By
contrast, male graduates appear to get significantly higher wage returns than their female
counterparts in Australia, Austria, Finland and Italy. The tertiary education wage premium
for men is the highest in Hungary (92%) and the lowest in Spain (27%). For women, wage
premia are highest in Portugal (92%) and lowest in Austria (33%).
OECD JOURNAL: ECONOMIC STUDIES – VOLUME 2010 © OECD 2010 5

WHAT IS THE PRIVATE RETURN TO TERTIARY EDUCATION? NEW EVIDENCE FROM 21 OECD COUNTRIES
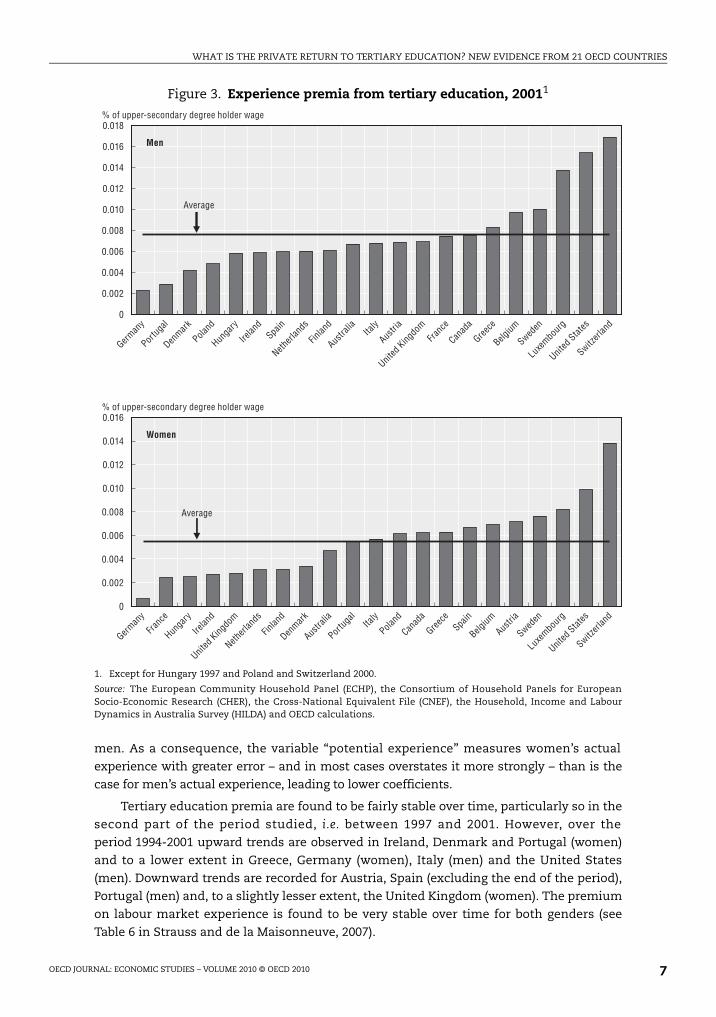
The experience premium per year of accumulated labour market experience also shows
large cross-country variation (Figure 3): it is the lowest in Germany (with the gender mean
slightly above zero) and the highest in Switzerland (with the gender mean at 1.54%). Part of
this variance could be explained by the role played by job tenure (i.e. experience specifically
accumulated within a firm) in some labour markets, suggesting that firm-specific skills are
more strongly rewarded than general labour market skills in these countries. Indeed, the
coefficient of job tenure tends to be high where the experience premium is low, and
vice versa. Finally, the experience premium is lower for women than for men. This might be
partly due to the fact that most women in the sample have less seamless work histories than
Figure 2. Gross wage premia from tertiary education,1 20012
1. Estimates of the increase in gross hourly earnings relative to a worker with a secondary education degree,controlling for individual characteristics other than education attainment.
2. Except for Hungary 1997 and Poland and Switzerland 2000.
Source: The European Community Household Panel (ECHP), the Consortium of Household Panels for EuropeanSocio-Economic Research (CHER), the Cross-National Equivalent File (CNEF), the Household Income and LabourDynamics in Australia Survey (HILDA) and OECD calculations.
100
90
80
70
60
50
40
30
20
10
0
100
90
80
70
60
50
40
30
20
10
0
% of upper-secondary degree holder wage
Spain
Gree
ce
Pola
nd
Belg
ium
Netherl
ands
Austra
lia
Swed
en
German
y
Denmark
Canad
aIta
ly
Finlan
d
Austri
a
Irelan
d
Franc
e
Switzerl
and
United
Kingdo
m
Portug
al
Luxe
mbourg
United
States
Hunga
ry
Men
% of upper-secondary degree holder wage
Aus
tria
Aus
tralia
Swed
en
Belgium Spa
inIta
ly
Denmark
Finlan
d
Netherl
ands
Greece
German
y
Switz
erlan
d
Can
ada
Franc
e
Luxe
mbourg
Irela
nd
United
Kingdo
mPola
nd
Hunga
ry
United
States
Portug
al
Women
OECD JOURNAL: ECONOMIC STUDIES – VOLUME 2010 © OECD 20106
WHAT IS THE PRIVATE RETURN TO TERTIARY EDUCATION? NEW EVIDENCE FROM 21 OECD COUNTRIES
men. As a consequence, the variable “potential experience” measures women’s actual
experience with greater error – and in most cases overstates it more strongly – than is the
case for men’s actual experience, leading to lower coefficients.
Tertiary education premia are found to be fairly stable over time, particularly so in the
second part of the period studied, i.e. between 1997 and 2001. However, over the
period 1994-2001 upward trends are observed in Ireland, Denmark and Portugal (women)
and to a lower extent in Greece, Germany (women), Italy (men) and the United States
(men). Downward trends are recorded for Austria, Spain (excluding the end of the period),
Portugal (men) and, to a slightly lesser extent, the United Kingdom (women). The premium
on labour market experience is found to be very stable over time for both genders (see
Table 6 in Strauss and de la Maisonneuve, 2007).
Figure 3. Experience premia from tertiary education, 20011
1. Except for Hungary 1997 and Poland and Switzerland 2000.
Source: The European Community Household Panel (ECHP), the Consortium of Household Panels for EuropeanSocio-Economic Research (CHER), the Cross-National Equivalent File (CNEF), the Household, Income and LabourDynamics in Australia Survey (HILDA) and OECD calculations.
0.018
0.016
0.014
0.012
0.010
0.008
0.006
0.004
0.002
0
0.016
0.014
0.012
0.010
0.008
0.006
0.004
0.002
0
% of upper-secondary degree holder wage
Average
Average
German
y
Por
tugal
Den
mark
Pola
nd
Hunga
ry
Irelan
d
Spa
in
Netherl
ands
Finlan
d
Austra
lia Italy
Austri
a
United
Kingdo
mFra
nce
Canad
a
Greece
Belgium
Sweden
Luxe
mbourg
United
States
Switzerl
and
Men
% of upper-secondary degree holder wage
Germ
any
Fran
ce
Hun
gary
Irelan
d
United
Kingdo
m
Netherl
ands
Finlan
d
Denmark
Austra
lia
Portug
alIta
ly
Pola
nd
Can
ada
Greece
Spain
Belgium
Austri
a
Sweden
Luxe
mbourg
United
States
Switzerl
and
Women
OECD JOURNAL: ECONOMIC STUDIES – VOLUME 2010 © OECD 2010 7

WHAT IS THE PRIVATE RETURN TO TERTIARY EDUCATION? NEW EVIDENCE FROM 21 OECD COUNTRIES
2.1.2. Employability premia
In addition to wage premia, the benefits of higher education usually include a lower
unemployment probability. To take into account the possible selection bias10 occurring
from the fact that the unemployment probability can be estimated only for labour market
participants, we use a two-step method (Heckman, 1979; Heckman et al., 2005a). The first
step determines the probability of participating in the labour market. The second step
determines the probability of being employed given the probability of participating. The
participation and employment propensities are supposed to be a function of individual
characteristics, such as educational attainment, gender, age (quadratic specification),11
marital status and presence of children in the household (see de la Fuente and Jimeno,
2005, and Ciccone et al., 2006). The participation equation also includes controls for
discouraged-worker effects (experience of long-term unemployment) and regional
dummies for some countries.12
Results of estimations show that participation and employment probabilities are
correlated (i.e. there is indeed selection) only in some countries and in some years.13 The
estimates are in line with expectations for most variables (see Boarini and Strauss, 2007, for
a discussion). Education increases both the probability of participating in the labour market
and that of finding a job. While for most countries one cannot reject the hypothesis that the
impact of education on the employment probability is linear, there are a few exceptions
(e.g. in Finland and the Netherlands, where further upgrading from upper-secondary to
tertiary education increases the employment probability by more than upgrading from
primary to secondary education).
In 2001, the estimated conditional probability of employment for an upper-secondary
degree holder was around 92% for women and 95% for men in most countries. With a
tertiary education degree the employment probability increases on average by around
2 percentage points (Figure 4). The largest premia (i.e. the difference between the estimated
employment probabilities for tertiary and upper-secondary graduates) are found for men in
Italy, Poland and Canada, and for women in Hungary, Finland and Sweden. Small (or even
negative) effects are found for men in Ireland, the Netherlands, Belgium, Switzerland and
France, and for women in Spain, Switzerland, Luxembourg and Italy. Gender differences
are particularly large in Italy and Belgium. Although the employability premia are
estimated on micro-data and carefully isolate the education effect on employment from
other characteristics, they are generally broadly in line with the gaps between aggregate
unemployment rates of upper-secondary and tertiary degree holders.14
Perhaps not surprisingly, the employability premia display stronger cyclical sensitivity
than wage premia.15 They increase rapidly between 1995 and 1997, and fall monotonically
afterward. The fluctuations are particularly marked for Spain and Italy, partly due to
concomitant changes in labour market policies, often targeted at low-skilled workers.
Moreover, the premium tends to decline in a majority of countries – reflecting that
employment prospects improved more strongly for upper-secondary degree holders than for
tertiary degree holders – and becomes more homogenous over time for men and women.
2.2. From the gross labour market premia to the net premium components of IRR
The estimated gross wage premia are adjusted for the effective duration of education,
for the foregone experience premium as well as for average and marginal income tax rates.
Finally, they are expressed as a percentage wage increase per year of tertiary education.16
OECD JOURNAL: ECONOMIC STUDIES – VOLUME 2010 © OECD 20108

WHAT IS THE PRIVATE RETURN TO TERTIARY EDUCATION? NEW EVIDENCE FROM 21 OECD COUNTRIES
The net wage premium per year of tertiary education is quite different from the unadjusted
wage premium both in absolute terms and from a comparative perspective (Figure 5). The
latter is because duration, survival probability and taxation vary widely across the OECD
area. The position of some countries, notably Hungary, Germany and Belgium, worsens
considerably after these adjustments.
Before entering the IRR formula, the employability premia require an adjustment
similar to that made for net wage premia. They are first expressed per year of tertiary
education. Then net employability premia are derived from gross premia. The difference
between gross and net employability premia depends on the out-of-work replacement
Figure 4. Marginal effect of tertiary education on the employment probability,1 20012
1. Increase in probability of employment: tertiary degree holders relative to holders of upper-secondary degrees.2. Except for Hungary 1997 and Poland and Switzerland 2000.
Source: The European Community Household Panel (ECHP), the Consortium of Household Panels for EuropeanSocio-Economic Research (CHER), the Survey of Labour and Income Dynamics (SLID), the Household, Income andLabour Dynamics in Australia Survey (HILDA) and OECD calculations.
7
6
5
4
3
2
1
0
-1
-2
7
6
5
4
3
2
1
0
-2
-1
Percentage point increase
Average
Average
Irelan
d
Netherl
ands
Hunga
ry
Belgium
Switzerl
and
Franc
e
Den
mark
Greece
Luxe
mbourg
Sweden
Spain
Austri
a
United
Kingdo
m
United
States
Austra
lia
German
y
Portug
al
Finlan
d
Canad
a
Poland Ita
ly
Men
Percentage point increase
Spa
in
Switz
erlan
d
Luxe
mbourg Ita
ly
Austri
a
Irelan
d
Denmark
Netherl
ands
United
States
Austra
lia
Portug
al
Germ
any
Fran
ce
Greece
United
Kingdo
mPola
nd
Belgium
Canad
a
Sweden
Finlan
d
Hunga
ry
Women
OECD JOURNAL: ECONOMIC STUDIES – VOLUME 2010 © OECD 2010 9

WHAT IS THE PRIVATE RETURN TO TERTIARY EDUCATION? NEW EVIDENCE FROM 21 OECD COUNTRIES
income and the income tax treatment of replacement income.17 In all countries net
employability premia are much smaller than gross premia in absolute terms, the reason
being the generally small difference between the net take-home pay and out-of-work
replacement income. As a result, the magnitude of the net employability premium is small
compared with that of the other drivers of IRR. In gross terms, employability premia are on
average around ½ per cent whereas, in net terms, they decrease to only 0.1%.
Figure 5. Comparison of gross and net wage premium per year of tertiary education,1 20012
1. Adjusted for survival rates, experience premia, marginal tax rate for employed and unemployed, marginal grossout-of-work replacement rates, probability of unemployment and duration of studies. See Box 1, equation 3 inBoarini and Strauss (2007).
2. Except for Hungary 1997 and Poland and Switzerland 2000.
Source: Gross wage premia and unemployment probability are based on the European Community Household Panel(ECHP), the Consortium of Household Panels for European Socio-Economic Research (CHER), the Cross-NationalEquivalent File (CNEF) and the Household, Income and Labour Dynamics in Australia Survey (HILDA). Survival ratesand duration of studies are from OECD Education at a Glance. Marginal tax rates are from the OECD Taxing Wagesmodel. Replacement rates are from the OECD Benefits and Wages model.
20.0
18.0
16.0
14.0
12.0
10.0
8.0
6.0
4.0
2.0
0
20.0
18.0
16.0
14.0
12.0
10.0
8.0
6.0
0
2.0
4.0
% of upper-secondary degree holder wage
German
y
Hunga
rySpa
in
Belgium
Greece Ita
ly
Swed
en
Netherl
ands
Austri
a
Denmark
Poland
Finlan
d
Canad
a
Franc
e
Luxe
mbourg
Portug
al
Austra
lia
United
Kingdo
m
Switzerl
and
Irelan
d
United
States
Men
% of upper-secondary degree holder wage
Italy
Aus
tria
Germ
any
Sweden
Belgium
Hunga
ry
Denmark
Netherl
ands
Finlan
d
Greece
Spain
Fran
ce
Can
ada
Luxe
mbourg
Austra
lia
Switzerl
and
United
Kingdo
m
Portug
al
Poland
United
States
Irelan
d
Women
Gross wage premia Net wage premia
OECD JOURNAL: ECONOMIC STUDIES – VOLUME 2010 © OECD 201010

WHAT IS THE PRIVATE RETURN TO TERTIARY EDUCATION? NEW EVIDENCE FROM 21 OECD COUNTRIES
2.3. Pension benefits
In computing IRR, pension benefits18 are first adjusted by a tax factor and then
discounted according to a representative market interest ratewhich is a function of labour
productivity growth, the degree of indexation of pension benefits on wages, the length of the
working life and the length of the retirement period. Portugal and Luxembourg display the
highest net pension benefits, as a result of high replacement rates on pension benefits. On
the other side of the spectrum, Finland and Italy are among the countries with the lowest net
pension benefits owing to high taxation of pension benefits. By assumption, net pension
benefits are received from the end of the active life until the expected death of the person so
that differences in life expectancy and retirement age could change the country ranking with
respect to net pension benefits. However, discounting those benefits (due to late occurrence
in life) levels the country differences in the net pension premium on education.
2.4. Direct and indirect costs of education
In most countries, individuals do not bear the whole cost of education because
funding to defray tuition fees and living expenses is publicly provided. This public support
takes the form of either grants or loans (see OECD, 2006). The baseline estimates of direct
costs presented below take into account grants for tuition fees but not for living costs.19
This may imply a downward bias in IRR for Nordic countries, which are most generous in
paying grants and loans for living costs to students.
In practice, direct costs are obtained by combining three indicators: 1) annual total
expenditure on tertiary education per student (including core educational services and
R&D activities) (indicator B1.1 in OECD, 2005b); 2) the share of final expenditure borne by
the private sector; and 3) the proportion of private final expenditure subsidised by the
public sector, which covers only tuition fees (indicator B3.2b in OECD, 2005b). “Net” direct
costs are thus given by the product of the annual total expenditure per student and the
share of the initial expenditure borne by the private sector [given by 2) minus 3)].20 In the
baseline calculation, direct cost figures refer to 2002.
The opportunity cost associated with tertiary education consists of foregone labour
earnings during tertiary studies, including both the wage of an upper-secondary degree
holder and the premium on work experience accumulated while working (rather than
studying). Opportunity costs are calculated as the average of net wages and unemployment
benefits for an individual with upper-secondary attainment participating in the labour
market, weighted by the probabilities of being respectively employed and unemployed.
3. Results for private IRRIncorporating all the elements described above allows computing the baseline internal
rates of return. Results for 2001 are shown in Figure 6. Internal rates of return vary across
countries from 4 to above 14%. The average return (across countries and gender) is 8.5%,
which is lower than previous OECD estimates but substantially higher than current market
real interest rates. The range of returns for women is somewhat wider than for men (from 4
to 14.4% versus 5 to 12%). Low average returns are found (by ascending order) for Italy, Spain,
Sweden, the Netherlands, Germany, Austria, Hungary, Belgium, Greece and Finland. IRR are
moderate in Canada, France, Poland and Denmark. The highest returns are recorded in the
United States, Australia, Luxembourg, Switzerland, the United Kingdom, Portugal and
OECD JOURNAL: ECONOMIC STUDIES – VOLUME 2010 © OECD 2010 11

WHAT IS THE PRIVATE RETURN TO TERTIARY EDUCATION? NEW EVIDENCE FROM 21 OECD COUNTRIES
Ireland. In addition to the baseline, several alternative scenarios were estimated. They are
discussed in detail in Boarini and Strauss (2007). Overall IRR estimates remain close to the
baseline results, though in some cases country ranking varies considerably.
The baseline IRR is computed for the years 1991-2005 (Table 1). The cross-country cross-
period average IRR is found to be slightly above 8% for both men and women, slightly less
than the 8.5% observed in 2001. IRR vary more across countries than over time. Returns are
relatively stable (see Boarini and Strauss, 2007, and Table 2 for a decomposition of the
variance), with the OECD average increasing only slightly between 1994 and 2001 (Figure 7).
The strongest upward trends are observed for Ireland, Portugal and Canada. Conversely, the
United Kingdom displays a downward trend, especially at the end of the observed period.
Figure 6. Estimates of the internal rates of return to tertiary education, 20011
1. Except for Hungary 1997 and Poland and Switzerland 2000.
Source: OECD calculations.
14.0
12.0
10.0
8.0
6.0
4.0
2.0
0
14.0
12.0
10.0
8.0
6.0
0
2.0
4.0
Per cent
Spain
Netherl
ands
Greece Ita
ly
German
y
Hunga
ry
Swed
en
Poland
Belgium
Austri
a
Finlan
d
Canad
a
Franc
e
Denmark
United
States
Luxe
mbourg
Austra
lia
Portug
al
Switzerl
and
United
Kingdo
mIre
land
Men
Per cent
Italy
Aus
tria
Swed
en
Belgium
German
y
Netherl
ands
Spain
Hunga
ry
Finlan
d
Greece
Denmark
Aus
tralia
Fran
ce
United
States
Canad
a
Luxe
mbourg
Switzerl
and
Poland
United
Kingdo
m
Portug
al
Irelan
d
Women
OECD JOURNAL: ECONOMIC STUDIES – VOLUME 2010 © OECD 201012

WHAT IS THE PRIVATE RETURN TO TERTIARY EDUCATION? NEW EVIDENCE FROM 21 OECD COUNTRIES
2005
10.4
9.1
3.1. Discussion of results
An abundant empirical literature exists on IRR. However, methodological differences
in the computation of IRR, as well as relative paucity of cross-country comparative studies,
make it problematic to compare IRR estimates presented here with those from previous
studies. Psacharopoulos and Patrinos (2004) report IRR computed through the discount
method (but not relying on microeconomic estimates of labour market premia) for a huge
Table 1. Estimates of IRRs, various yearsIn per cent
1991 1992 1993 1994 1995 1996 1997 1998 1999 2000 2001 2002 2003 2004
Men
Australia 10.4 10.2 10.1
Austria 8.4 8.3 7.4 7.7 8.3 8.5 7.8
Belgium 5.9 5.9 6.0 6.2 7.3 6.3 6.2 6.9
Canada 7.3 5.9 7.1 7.0 8.7 8.7 8.4
Denmark 5.4 7.0 6.5 6.7 8.1 8.5 8.4 9.6
Finland 8.5 8.7 7.6 8.6 8.8 8.6
France 9.5 9.3 9.4 9.8 10.2 9.3 10.1 9.1
Germany 5.5 5.7 5.5 5.8 6.4 7.3 6.7 6.2
Greece 5.4 5.2 5.6 5.7 4.9 5.8 6.0 6.0
Hungary 7.3 6.4 6.4 5.0 6.8 6.2
Ireland 7.2 8.1 8.5 9.8 9.0 8.8 8.6 11.8
Italy 4.8 4.6 5.3 5.5 6.1 6.0 5.7 6.1
Luxembourg 11.5 10.8 10.0 11.8 11.4 12.2 10.2
Netherlands 6.9 6.9 6.7 5.6 6.3 4.4 5.0 6.0
Poland 7.5 8.7 8.9 6.5
Portugal 11.4 13.8 15.7 13.0 13.7 12.3 13.6 11.2
Spain 5.0 5.4 5.5 4.4 3.9 3.1 2.2 4.9
Sweden 6.4 7.3 7.2 7.0 6.4
Switzerland 12.1 11.3
United Kingdom 12.4 12.2 12.5 12.2 11.6 12.2 11.9 12.1 12.2 11.7 11.8 11.5 10.9 9.9
United States 9.1 9.1 9.4 9.2 9.0 9.9 9.9 10.1 10.7 10.1 10.4
Women
Australia 8.9 10.0 9.9
Austria 9.3 9.5 7.5 6.9 7.1 5.7 5.0
Belgium 4.4 5.1 4.4 5.4 5.5 7.4 6.0 6.4
Canada 7.3 6.6 7.5 7.4 9.5 9.4 9.3
Denmark 5.8 6.4 6.8 5.7 7.9 7.5 7.8 8.7
Finland 6.5 6.1 5.8 6.7 6.4 7.1
France 8.3 8.3 8.4 9.1 9.2 8.6 8.7 9.0
Germany 5.2 6.0 5.3 5.9 5.9 6.5 5.7 6.4
Greece 4.7 4.3 5.2 6.4 7.9 7.2 7.5 8.3
Hungary 5.7 6.3 6.9 6.8 6.7 6.5
Ireland 7.5 8.7 9.4 11.6 9.5 11.0 9.8 14.4
Italy 4.3 4.4 4.2 4.3 4.4 4.5 4.8 4.2
Luxembourg 12.2 10.4 10.1 11.2 10.5 10.9 9.9
Netherlands 5.5 5.9 5.9 4.2 4.9 4.1 4.1 6.5
Poland 9.2 10.3 11.3 11.8
Portugal 10.6 11.3 12.6 11.5 13.3 12.2 15.6 13.3
Spain 6.5 7.0 6.9 6.1 5.0 4.8 4.6 6.5
Sweden 6.2 5.8 4.4 5.2 5.4
Switzerland 10.4 10.1
United Kingdom 12.6 13.9 13.3 12.7 12.7 12.3 12.6 12.8 12.2 11.5 12.3 12.1 10.9 9.9
United States 8.6 8.6 8.9 8.7 8.5 9.0 8.9 9.1 9.4 8.7 9.2
OECD JOURNAL: ECONOMIC STUDIES – VOLUME 2010 © OECD 2010 13

WHAT IS THE PRIVATE RETURN TO TERTIARY EDUCATION? NEW EVIDENCE FROM 21 OECD COUNTRIES
nsion ent rate
1
0
2
0
2
0
0
6
0
4
5
5
4
3
9
5
3
1
8
0
1
6
9
2
4
6
3
0
6
6
2
ntries.
sample of countries (including many non-OECD countries). They find average IRR to higher
education of 11.6% for OECD countries. Blöndal et al. (2002) compute private internal rates
of return to tertiary education at the end of the 1990s for ten countries and estimate higher
returns than this study, varying in the range of 7.5% (Italy) to 18.5% (United Kingdom), with
an average value of 11.6%. De la Fuente and Jimeno (2005), which this paper closely follows,
compute returns for some European countries which range between 4.28% (Sweden) to
above 12% (United Kingdom), with a 15-EU-country average of 8.8% (slightly above our
estimates). Differences relative to results in this study are especially large for Italy, Greece,
Spain and Germany, possibly reflecting different data sources for the estimation of labour
market premia.
Table 2. Variation across countries and over time of the main IRR components
IRRAnnual wage
premia
Annual employability
premia
Employment probability
Marginaltax rate
Averagetax rate
Grossout-of-work
benefits replacement rate
Net pereplacem
Cross-country coefficient of variation
1994 0.31 0.44 0.74 0.07 0.32 0.26 0.34 0.4
1995 0.32 0.41 1.10 0.07 0.29 0.25 0.32 0.4
1996 0.30 0.40 0.91 0.07 0.28 0.24 0.30 0.4
1997 0.29 0.43 0.80 0.07 0.33 0.26 0.30 0.4
1998 0.29 0.39 0.94 0.06 0.26 0.27 0.30 0.4
1999 0.30 0.38 0.70 0.05 0.23 0.25 0.30 0.4
2000 0.33 0.40 1.05 0.05 0.24 0.26 0.30 0.4
2001 0.28 0.35 0.95 0.05 0.25 0.28 0.41 0.4
2002 0.11 0.20 0.32 0.03 0.09 0.03 0.44 0.6
2003 0.10 0.10 0.25 0.01 0.06 0.06 0.45 0.7
Over-time coefficient of variation
Australia 0.04 0.07 0.26 0.01 0.00 0.02 0.19 0.8
Austria 0.15 0.18 2.27 0.01 0.00 0.02 0.17 0.1
Belgium 0.13 0.15 0.83 0.03 0.00 0.02 0.05 0.0
Canada 0.13 0.20 0.24 0.02 0.06 0.03 0.00 0.1
Denmark 0.15 0.18 1.27 0.02 0.01 0.02 0.07 0.0
Finland 0.15 0.14 0.46 0.03 0.03 0.05 0.05 0.3
France 0.05 0.08 0.96 0.05 0.04 0.01 0.01 0.5
Germany 0.08 0.10 0.51 0.02 0.02 0.03 0.01 0.0
Greece 0.18 0.20 0.75 0.08 0.11 0.02 0.28 0.0
Hungary 0.09 0.11 0.69 0.03 0.02 0.09 0.00 0.0
Ireland 0.17 0.20 1.12 0.03 0.19 0.18 0.15 0.0
Italy 0.13 0.11 0.67 0.06 0.01 0.03 0.06 0.1
Luxembourg 0.06 0.09 3.64 0.01 0.03 0.03 0.06 0.1
Netherlands 0.17 0.15 1.86 0.02 0.09 0.08 0.00 0.0
Poland 0.16 0.26 0.39 0.01 0.29 0.34 0.06 0.1
Portugal 0.09 0.12 0.58 0.02 0.01 0.03 0.16 0.1
Spain 0.26 0.21 1.16 0.12 0.03 0.04 0.05 0.0
Sweden 0.15 0.16 0.46 0.03 0.02 0.04 0.00 0.0
Switzerland 0.07 0.10 8.65 0.01 0.02 0.01 0.00 0.0
United Kingdom 0.06 0.09 0.58 0.02 0.01 0.04 0.13 0.0
United States 0.07 0.05 0.21 0.01 0.01 0.01 0.16 0.1
Note: The coefficient of variation across countries is only shown for years where it was possible to compute IRR for at least three cou
OECD JOURNAL: ECONOMIC STUDIES – VOLUME 2010 © OECD 201014

WHAT IS THE PRIVATE RETURN TO TERTIARY EDUCATION? NEW EVIDENCE FROM 21 OECD COUNTRIES
Despite efforts to compute IRR as accurately as possible, some limits of this method
need to be pointed out. First of all, IRR shown above refer to an average individual, so that
they do not reflect heterogeneity in a number of possible dimensions, notably ability,
quality of education received, field of studies and possible liquidity constraints affecting
students. Lacking a distribution of IRR for each of these dimensions, estimates should just
be read as country-average returns for a representative individual.21
A second remark pertains to the general interpretation of IRR and to the possible
explanation of cross-country differences in their levels. IRR depend on many factors and
yet their main component is the wage premium. High wage premia may result from market
forces, possibly reflecting scarcity rents, but also from specific labour market institutions,
for example, country-specific aspects of the collective-bargaining system or of
employment protection legislation. For this reason, IRR (or wage premia) provide only a
very rough proxy of labour productivity of tertiary-educated workers and should rather be
read as a proxy for the average individual’s incentives to undertake tertiary education. The
related question for policymakers is then how to act on these incentives, if the final goal is
to increase tertiary human capital.
Figure 7. Evolution of OECD average IRR between 1994 and 2001
1. Country average is computed on a time unbalanced panel with a minimum of 13 observations.
1994 1995 1996 1997 1998 1999 2000 2001
8.5
8.0
7.5
7.0
6.5
6.0
%
1994 1995 1996 1997 1998 1999 2000 2001
8.5
8.0
7.5
7.0
6.5
6.0
%
Men
Women
OECD JOURNAL: ECONOMIC STUDIES – VOLUME 2010 © OECD 2010 15

WHAT IS THE PRIVATE RETURN TO TERTIARY EDUCATION? NEW EVIDENCE FROM 21 OECD COUNTRIES
ing
4. The impact of policies on IRRTertiary education and broader economic policies may affect the quantity of human
capital accumulation either directly, for instance, by acting on the characteristics of tertiary
education supply, or indirectly, by increasing or decreasing private incentives to invest in
tertiary education (Figure 8). Many policy levers exist for increasing incentives to study.
Labour markets are crucial to shape returns from education investment, as policies
regulating wages and employment protection have a direct bearing on wage and
employment premia. But other framework policies also matter for returns to education, for
instance, product market regulation which has an impact on labour productivity and thus on
IRR (see Oliveira et al., 2007). Tax policies and welfare policies (unemployment and pension
benefits) also matter for incentives to invest in education. Finally, education policies, in
particular those governing financial support to universities and students, determine the
costs sustained by students and thus the incentive to study. This section addresses the
impact of some of these policies on private incentives by analysing how IRR respond to
changes in labour market characteristics and education, social and fiscal policies.
4.1. Main influences on IRR: Policies and labour market outcomes
This part of the sensitivity analysis looks at the elasticity of IRR with respect to their
main drivers, with the objective of assessing to what extent cross-country differences in
IRR depend on cross-country differences in underlying components. Only one component
is changed at a time, holding all the others constant except for obvious cases such as an
increase in study duration, which is assumed to shorten the working life accordingly. All
changes amount to 1 percentage point increases (except for study duration, which is
changed by 1%) and refer to the 2001 baseline results.22
Figure 8. Policies affecting investment in tertiary education and IRR
Investment in Tertiary Education
Returns to education Supply structure Individual financsystems
Labour marketpremia Taxation Social benefits Opportunity costs
Labour marketpolicies
Labour marketpolicies
Labour marketpolicies
Product marketpolicies
Financial systems
Tax policies
Pension systempolicies
Net direct costs
Educationpolicies
Financialsystems
Tax policies
Educationpolicies
OECD JOURNAL: ECONOMIC STUDIES – VOLUME 2010 © OECD 201016

WHAT IS THE PRIVATE RETURN TO TERTIARY EDUCATION? NEW EVIDENCE FROM 21 OECD COUNTRIES
Figure 9 summarises the main results on IRR elasticities. It shows both OECD average
elasticities and the range of elasticities across countries. These results can be summarised
as follows:
● Fiscal policy: A strong progressivity of taxation may be detrimental to incentives to invest in
human capital, as net labour market premia to higher education obviously become less
attractive. Indeed a higher marginal tax rate reduces the net wage premium (elasticity
slightly above 0.12). But the average tax rate matters, too: a higher average income tax rate
tends to increase IRR, mainly via a reduction in opportunity costs, which represent the
bulk of total private costs. Overall, the net effect of a joint increase in average and marginal
tax rates depresses IRR in all countries, suggesting that progressivity of taxation matters
more than the average tax rate for the incentive to study.
● Social policy: An increase in the average unemployment benefit (UB) replacement rate dampens
labour market returns to education (as long as tertiary degree holders have higher
employment probability than upper-secondary degree holders) and slightly increases
the expected opportunity cost of studying. We find the net effect on IRR to be very small,
reflecting the small net employability premia on tertiary education reported above.
● Education policy: Higher tuition costs (as a fraction of gross annual earnings of the average
upper-secondary degree holder) have a direct negative effect on IRR (elasticity around
0.1). A marginal increase in the study duration also reduces the return per year of tertiary
education. However, if students devote a higher share of their time to paid work (share
assumed to be zero in the baseline), this significantly reduces opportunity costs.
● Labour market characteristics: An increase in the gross wage premium on tertiary education
by 1 percentage point increases the private IRR by 0.13 percentage points on average. At
0.07 percentage points, the average increase resulting from a higher employability
premium is smaller, as any increase in net lifetime earnings due to the higher conditional
Figure 9. Sensitivity analysis on the internal rates of return,1 20012
Male-female average
1. All drivers of IRR are changed by 1 percentage point except for study duration that is changed by 1%.2. Except for Hungary 1997 and Poland and Switzerland 2000.
Source: OECD calculations.
22
18
14
10
6
2
-6
-2
-10
-14
-18
-22
AUS
SPAUSA PRT
DNK
IRLDNK
HUN
GBR
IRLDNK
HUN
HUN
HUN ESP
SWE
Change in IRR (basis points)
OECD average Maximum Minimum
Wag
e...
Sha
re of.
..
Ave
rage..
.
Emplo
yabil
ity...
UB re
pl. ra
te
Stud
y...
Dire
ct co
st
Marg
inal...
OECD JOURNAL: ECONOMIC STUDIES – VOLUME 2010 © OECD 2010 17

WHAT IS THE PRIVATE RETURN TO TERTIARY EDUCATION? NEW EVIDENCE FROM 21 OECD COUNTRIES
employment probability of tertiary degree holders is partly undone by the concomitant
loss of unemployment benefits, which are usually taxed at much lower rates than labour
earnings. A non-negligible IRR effect of changes to the gross employability premium is
observed only for countries where the difference between the take-home pay and the net
unemployment benefit is large (e.g. Australia, Austria and Ireland).
Over and above those reported, a number of other parameter changes have been
analysed. In most cases, their IRR effect is very small, such as for the pension benefit
replacement rate, the degree of pension indexation, the length of the working life and the
average experience premium. However, increases in the growth rate of average labour
productivity raise IRR almost one to one and are therefore important for policy makers
concerned with tertiary education incentives.
4.2. The differential impact of labour market characteristics and policies in individual countries
A second round of simulations consists of setting wage and employability premia, as
well as private costs, to the upper end of their respective cross-country distributions so as
to illustrate country-specific effects of policy changes. Conversely, tax rates are set at the
lower end of their cross-country distribution.
4.2.1. Wage premium
Since IRR are most sensitive to gross wage premia, countries with moderate wage
differentiation may gain in terms of tertiary education incentives from allowing for
stronger differentiation. Policies and institutions contribute to compressing the
distribution of gross wages (Katz and Autor, 1999). At the low end of the distribution,
binding minimum wages and strong employment protection legislation (EPL) may grant
workers a higher gross wage than would be warranted by their marginal productivity. At
the high end, corporatist wage bargaining institutions (as measured by union density and
the coverage of employment contracts by collective agreements) usually lead to some
income sharing between high- and low-productivity workers. To illustrate possible gains
from a higher wage premium, the latter is set to two standard deviations above the country
mean.23 With all other parameters remaining unchanged, IRR would increase by between
slightly less than 1 percentage point in Portugal and almost 8 percentage points in
Australia (Figure 10).
Overall, the lower is the initial gross wage premium, the higher the increase in IRR
resulting from the simulation. Aside from this intuitive relationship, the increase in IRR
also depends on the other parameters affecting the net wage premium, notably taxation
and duration of studies, and on private costs. For example, in Ireland, where the marginal
income tax is moderate and study duration is relatively short, the IRR increase would be
stronger than in Germany and Italy, even though the simulated change in the gross wage
premium is smaller. Likewise, the strong IRR increase in Australia mainly reflects short
average study duration. Finally, as a rule, any increase in labour market benefits
(numerator of the IRR calculation) is amplified if total private costs (denominator) are low.
4.2.2. Employability premium
If the employability premium were to be two standard deviations above the cross-
country mean everywhere,24 it would have to rise by 2 percentage points on average. This
is modest compared with the wage-premium changes simulated above. Even with this
OECD JOURNAL: ECONOMIC STUDIES – VOLUME 2010 © OECD 201018
WHAT IS THE PRIVATE RETURN TO TERTIARY EDUCATION? NEW EVIDENCE FROM 21 OECD COUNTRIES
different impact in mind, the resulting average IRR effect (less than 0.2 percentage points)
is extremely small (Figure 11). Changes in IRR would be the highest in Ireland and the
lowest in Poland and Portugal.
Figure 10. Changes in IRR induced by higher gross wage premia,1 20012
Male-female average
1. In this simulation the gross wage premium is set to two standard deviations above the country mean. In Hungaryand the United States, where the wage premium is already higher than the simulated value, IRR would fall.
2. Except for Hungary 1997 and Poland and Switzerland 2000.
Source: OECD calculations.
Figure 11. Changes in IRR induced by higher gross employability premia,1 20012
Male-female average
1. In this simulation the gross wage premium is set to two standard deviations above the country mean. In Polandand in Portugal, where the employability premium is already higher than the simulated value, IRR would fall.
2. Except for Hungary 1997 and Poland and Switzerland 2000.
Source: OECD calculations.
9 60
50
40
30
20
10
0
-10
8
7
6
5
4
3
2
1
0
-1
Austra
lia
Spa
in
Belg
ium
Den
mark
Gree
ce
Sweden
Austri
a
Finlan
d
Switzerl
and
Netherl
ands
Irelan
d
Canad
aIta
ly
German
y
Poland
Franc
e
United
Kingdo
m
Luxe
mbourg
Portug
al
Hunga
ry
United
States
Change in IRR (percentage points) Percentage points
Change in IRR Simulated change in wage premium (r.h.s.)
0.9 5
4
3
2
1
0
0.7
0.6
0.5
0.4
0.3
0.2
0.1
0.0
-0.1
Irelan
d
Greece
Den
mark
Aus
tralia
Aus
tria
Spain
United
Kingdo
m
Hunga
ry
Switzerl
and
German
y
Belgium
United
States Ita
ly
Sweden
Franc
e
Luxe
mbourg
Canad
a
Netherl
ands
Finlan
d
Poland
Portug
al
Change in IRR (percentage points) Percentage points
Change in IRR Simulated change in wage premium (r.h.s.)
OECD JOURNAL: ECONOMIC STUDIES – VOLUME 2010 © OECD 2010 19

WHAT IS THE PRIVATE RETURN TO TERTIARY EDUCATION? NEW EVIDENCE FROM 21 OECD COUNTRIES
4.2.3. Private direct cost
Higher net private costs would reduce IRR if other policy settings did not change at the
same time. Again, the illustrative exercise consists of setting net private costs (as a fraction
of GDP per capita) equal to the mean plus two standard deviations, which happens to be
almost exactly equal to the Australian level but still well below the cost levels applied in the
United States. The simulated increase in private costs is substantial in all countries,
ranging from 10% of GDP per capita in Hungary and Poland to 22.9% in Greece. The fall in
IRR lies between 0.7 percentage points in Poland and slightly more than 3 percentage
points in Denmark (Figure 12).
The effect on IRR of a given increase in the cost-to-income ratio is stronger the lower the
initial level of costs (e.g. Austria, Belgium, Germany and Greece have levels much below the
country mean) and the higher the labour market benefits to education (e.g. above-average
levels for Ireland and the United Kingdom). A low (high) initial level of costs implies a large
(small) simulated change in costs, leading to a strongly (weakly) negative effect on IRR. Yet
the impact on IRR is cushioned somewhat by the fact that countries with low private costs
also tend to have below-average labour market benefits.
4.2.4. Marginal and average income tax rates
As discussed above, the joint effect on IRR of setting marginal and average tax rates on
labour earnings at the lower ends of their respective cross-country distributions is positive.
Here the effects of tax reforms are assessed in two steps. In the first step the marginal tax
rate is set at 20%, while the average tax rate is left unchanged. This leads to substantial IRR
increases (Figure 13). In the second step, average tax rates are also set to the lower end of
the distribution.25 The total IRR effect is positive and ranges from 0.1 percentage point in
Figure 12. Changes in IRR induced by higher direct costs,1 20012
Male-female average
1. Net private costs are set to the country mean plus two standard deviations.2. Except for Hungary 1997 and Poland and Switzerland 2000.
Source: OECD calculations.
0 0
5
10
15
20
25
-0.5
-1.0
-1.5
-2.0
-2.5
-3.0
-3.5
Poland
Hunga
ry
Spa
in
Neth
erlan
ds It
aly
Sweden
Canad
a
Luxe
mbourg
United
Kingdo
m
German
y
Austri
a
Switzerl
and
Belgium
Greece
Franc
e
Finlan
d
Portug
al
Irelan
d
Denmark
Change in IRR (percentage points) Percentage points of GDP per capita
Change in IRR (%) Difference from benchmark (r.h.s.)
OECD JOURNAL: ECONOMIC STUDIES – VOLUME 2010 © OECD 201020
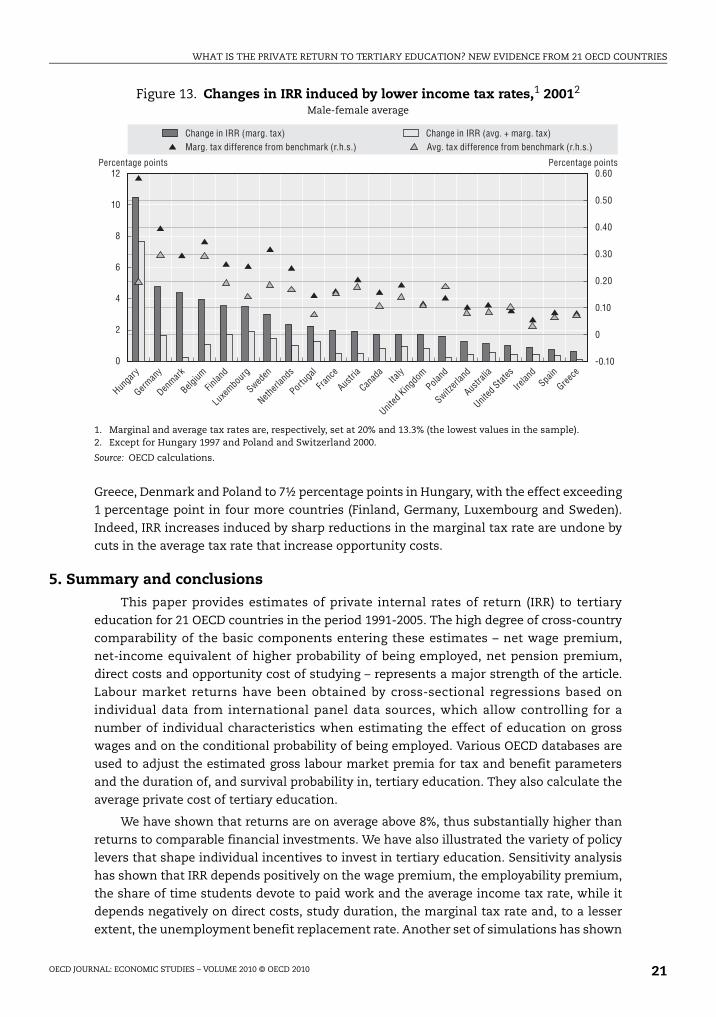
WHAT IS THE PRIVATE RETURN TO TERTIARY EDUCATION? NEW EVIDENCE FROM 21 OECD COUNTRIES
Greece, Denmark and Poland to 7½ percentage points in Hungary, with the effect exceeding
1 percentage point in four more countries (Finland, Germany, Luxembourg and Sweden).
Indeed, IRR increases induced by sharp reductions in the marginal tax rate are undone by
cuts in the average tax rate that increase opportunity costs.
5. Summary and conclusionsThis paper provides estimates of private internal rates of return (IRR) to tertiary
education for 21 OECD countries in the period 1991-2005. The high degree of cross-country
comparability of the basic components entering these estimates – net wage premium,
net-income equivalent of higher probability of being employed, net pension premium,
direct costs and opportunity cost of studying – represents a major strength of the article.
Labour market returns have been obtained by cross-sectional regressions based on
individual data from international panel data sources, which allow controlling for a
number of individual characteristics when estimating the effect of education on gross
wages and on the conditional probability of being employed. Various OECD databases are
used to adjust the estimated gross labour market premia for tax and benefit parameters
and the duration of, and survival probability in, tertiary education. They also calculate the
average private cost of tertiary education.
We have shown that returns are on average above 8%, thus substantially higher than
returns to comparable financial investments. We have also illustrated the variety of policy
levers that shape individual incentives to invest in tertiary education. Sensitivity analysis
has shown that IRR depends positively on the wage premium, the employability premium,
the share of time students devote to paid work and the average income tax rate, while it
depends negatively on direct costs, study duration, the marginal tax rate and, to a lesser
extent, the unemployment benefit replacement rate. Another set of simulations has shown
Figure 13. Changes in IRR induced by lower income tax rates,1 20012
Male-female average
1. Marginal and average tax rates are, respectively, set at 20% and 13.3% (the lowest values in the sample).2. Except for Hungary 1997 and Poland and Switzerland 2000.
Source: OECD calculations.
12 0.60
0.50
0.40
0.30
0.20
0.10
0
-0.10
10
8
6
4
2
0
Hunga
ry
German
y
Den
mark
Belg
ium
Finl
and
Luxe
mbourg
Sweden
Netherl
ands
Portug
al
Franc
e
Austri
a
Canad
aIta
ly
United
Kingdo
mPola
nd
Switzerl
and
Austra
lia
United
States
Irelan
dSpa
in
Greece
Percentage points Percentage points
Change in IRR (marg. tax) Change in IRR (avg. + marg. tax)Marg. tax difference from benchmark (r.h.s.) Avg. tax difference from benchmark (r.h.s.)
OECD JOURNAL: ECONOMIC STUDIES – VOLUME 2010 © OECD 2010 21

WHAT IS THE PRIVATE RETURN TO TERTIARY EDUCATION? NEW EVIDENCE FROM 21 OECD COUNTRIES
that moving the various IRR components to the boundary values of their respective cross-
country distribution would lead to substantial changes in IRR. Policy makers may build on
some of these results to design policies with the objective of stimulating incentives to
invest in tertiary human capital.
However, if the policy targets the volume of investment in tertiary human capital
rather than IRR per se, Oliveira et al. (2007) show that putting in place policies that increase
returns to education is not the only way to go. They find that supply-side factors as well as
financing constraints facing individual students also have an important role in
determining the country-wide level of tertiary human capital investment. Their simulation
results suggest that aligning the input and output flexibility as well as the accountability of
tertiary education institutions on supply conditions observed in the best-performing
countries in the OECD would lead to substantial increases in tertiary graduation rates.
Some of the supply-side policies may also be seen as a necessary condition for the
effectiveness of policies aimed at raising IRR: returns to education may well be substantial
in a given country, but if the education system fails to send a clear signal as to how big
these returns are, the investment in education may not materialise.
Notes
1. The relationship between incentives to invest and innate ability (when all other sources ofindividual heterogeneity are constant) is twofold: on the one hand, innate ability and receivededucation are seen as complements in producing human capital; on the other hand, innate abilityis deemed to be positively correlated with the opportunity cost of studying. Returns to investmentin education for the more able will be, according to these two effects, respectively higher and lowerthan for the average individual. Higher discount rates due to impatience (distaste for schooling) orhigher liquidity constraints will make the option of studying less attractive, for a given rate ofreturn to education. In other words, returns should be higher to attract impatient students orfinancially constrained individuals. When ability and discount rates vary together, theendogeneity bias will be determined by the variance in ability relative to the variance in discountrates, as well as by the covariance of the two. For instance, when ability and discount rates arenegatively correlated (typically through family background), marginal returns to education for themore able and, hence, their optimal level of schooling, are higher than for average individuals.
2. It remains controversial, however, whether the ability bias is rightly captured in these studies.
3. For instance, Blöndal et al. (2002) used the discount method to compute private and social rates ofreturn for ten OECD countries in the 1999-2000 period. Psacharopoulos and Patrinos (1994) collectestimations from different studies based on the discount method encompassing more than80 countries for periods ranging from the mid-1970s to the early 1990s.
4. The discount method and the Mincerian earnings equation differ not only in the extent to whichthey take into account costs of education, taxes and social benefits, but also because of differentunderlying assumptions on the life-cycle earnings profile (see Boarini and Strauss, 2007).
5. This choice is mainly due to the lack of reliable cross-country data on (the actual incidence of)students’ work.
6. Previous empirical studies (Asplund and Pereira, 1999; Blöndal et al., 2002; Harmon et al., 2003; andPsacharopoulos and Patrinos, 2004) and the analysis in this paper show that premia differ acrossgenders.
7. This sub-section draws on Strauss and de la Maisonneuve (2007), where the data sets, the choiceand construction of variables and the econometric specification are discussed in detail. See alsoStrauss and de la Maisonneuve (2009).
8. It can be argued that an increased opportunity to work in a large plant could be an additionalbenefit of undertaking higher education, and thus this variable should not be controlled for.However, Strauss and de la Maisonneuve (2007) show that the correlation coefficient betweeneducational attainment and the plant size is relatively small, suggesting that the possibleassociated endogeneity bias is also small.
OECD JOURNAL: ECONOMIC STUDIES – VOLUME 2010 © OECD 201022

WHAT IS THE PRIVATE RETURN TO TERTIARY EDUCATION? NEW EVIDENCE FROM 21 OECD COUNTRIES
9. It has to be borne in mind that the strong dispersion of wage premia across countries may reflectcountry-specific productivity differences between tertiary and upper-secondary degree holders, andalso other factors, such as different scarcity rents on skilled labour and the degree of labour marketregulation. In Portugal and Hungary high wage premia are more likely to reflect scarcity rents,whereas low degrees of labour market regulation seem to drive premia in the United Kingdom andthe United States.
10. For instance, if only upper-secondary degree holders with good chances of finding a job participatein the labour market, the estimated employment probability of secondary-educated individualswill be biased upward and the employability premium associated with tertiary education will beunderestimated.
11. As for the wage premia, the rationale to control for experience is strong when estimating theemployment probabilities. However, approximating actual experience with potential experiencewould be more problematic in this context because the surveys provide no information onprevious participation spells of currently inactive individuals. For this reason the variable age wasretained instead.
12. Discouraged-worker effects are controlled for by excluding from the sample those individuals who,in any event, would have a very low probability of participating in the labour market. With thisadditional control, the estimates presented here are somewhere between the case where noadjustment is made for the selection bias and the one where all working age individuals areviewed as potential participants in the labour market. The variables of long-term unemploymentand regional dummies are introduced only in estimations for European countries. The case forthese variables has been tested through appropriate likelihood ratio tests. Countries where theregional dummies have a significant impact on the employment probabilities are Germany, Italy,Belgium, Spain, Greece and Austria. The underlying assumption is that workers do not migrate toregions where the probability of finding a job is higher, i.e. the region of residence is exogenous.
13. In countries where the selection bias is found to be non-existent, conditional employmentprobabilities are not significantly different from unconditional probabilities. Though the selectionbias is found only for a subset of countries/years, drawing consistently on two-step estimates evenwhen the selectivity bias is rejected allows for a unified framework warranting comparabilityacross countries and years.
14. Some exceptions include Poland and women in Spain and Greece, where aggregate employabilitygaps are higher than estimates based on microeconomic data.
15. Limited time coverage of some countries (notably Switzerland, Hungary and Poland) might be aproblem in this respect since, overall, the employability premium is found to fluctuatesubstantially over the cycle (see Boarini and Strauss, 2007). However, even large fluctuations in theemployability premium have only a small impact on IRR (see the simulations around theemployment premium in Boarini and Strauss, 2007).
16. See Boarini and Strauss, 2007, for the specific assumptions under these adjustments.
17. Data on average and marginal replacement rates are drawn from the OECD Benefits and Wages model.
18. Gross pension replacement rates are based on the new OECD Pensions model (OECD, 2005a); seeBoarini and Strauss 2007 for details.
19. Due to data limitations, grants for living expenses cannot be computed for all countries and aretherefore not accounted for in the baseline estimates of direct costs. In principle, grants for livingexpenses should be subtracted from private costs of education since upper-secondary degreeholders who go to the labour market also bear living costs without receiving any transfer from thegovernment. However, lacking relevant information for all countries under scrutiny, costs are onlynet of grants earmarked for tuition fees.
20. “Final” expenditure refers to the disbursement, while “initial” expenditure refers to the cost trulysustained by individuals, i.e. adjusted for public subsidies.
21. In principle it would have been possible, at least for labour market premia estimated on micro-data, to get a range of IRR by income decile (notably through quantile regressions). However, fiscalparameters and costs being solely available at aggregate level, the route of quantile regressions hasnot been pursued. Had this been done, it would not have been possible in any event to identify thecauses of heterogeneity (i.e. individual ability versus higher quality of education, or high-rewardingfield of studies) that remain unobservable in the data sets under use.
OECD JOURNAL: ECONOMIC STUDIES – VOLUME 2010 © OECD 2010 23

WHAT IS THE PRIVATE RETURN TO TERTIARY EDUCATION? NEW EVIDENCE FROM 21 OECD COUNTRIES
22. While these changes are numerically the same, they are quite different economically: a1 percentage point increase in the employability premium from, say, 4 to 5 percentage points ismore substantial than an increase in the wage premium from 40 to 41% or a 1% increase in theduration of studies.
23. These levels roughly correspond to the US wage premium for men and to the Hungarian wagepremium for women. Hence, IRR in these two countries barely change in the simulation.
24. Both for men (3.8 percentage points) and for women (5.6 percentage points) the simulatedemployability premium is close to the 2001 levels observed in Finland. Note, however, that these valuesare not simulated for countries where this would move the employment probability for tertiarydegree holders to values greater than one. For countries where the employment probability forupper-secondary degree holders is already above 0.962 for men and 0.944 for women (e.g. Luxembourg,the Netherlands and Switzerland), the simulated marginal effect is not 3.8 percentage points and5.6 percentage points, respectively, but just the margin missing to one (i.e. to full employment oftertiary degree holders).
25. Average and marginal tax rates on replacement income are zero in this simulation to avoidnegative values.
References
Asplund, R. and P. Pereira (1999), Returns to Education in Europe: A Literature Review, ETLA (The ResearchInstitute of the Finnish Economy), Taloustieto Oy.
Becker, G.S. (1967), “Human Capital and the Personal Distribution of Income: An Analytical Approach”,Ann Arbor, Michigan, University of Michigan Press.
Boarini, R. and H. Strauss (2007), “The Private Internal Rates of Return to Tertiary Education: NewEstimates for 21 OECD Countries”, OECD Economics Department Working Papers, No. 591.
Blöndal, S., S. Field and N. Girouard (2002), “Investment in Human Capital through Upper-Secondaryand Tertiary Education”, OECD Economics Studies, Vol. 34 (1), pp. 41-90.
Card, D. (1999), “The Causal Effects of Education on Earnings”, in Ashenfelter, O. and D. Card (eds.),“Handbook of Labour Economics”, Vol. 3, Elsevier.
Ciccone, A., F. Cingano and P. Cipollone (2006), “The Private and Social Return to Schooling in Italy”,Temi di Discussione del Servizio Studi, No. 569, Banca d’Italia.
De la Fuente, A. and J.F. Jimeno (2005), “The Private and Fiscal returns to Schooling and the Effect ofPublic Policies on Private Incentives to Invest in Education: A General Framework and Some Resultsfor the EU”, CESifo Working Paper, No. 1392.
Grossman, M. (2005), “Education and Non-Market Outcomes”, NBER Working Paper, No. 11582.
Harmon, C., H. Oosterbeek and I. Walker (2003), “The Returns to Education: Microeconomics”, Journalof Economic Surveys, Vol. 17(2), pp. 115-155.
Heckman, J. (1979), “Sample Selection Bias as a Specification Error”, Econometrica, Vol. 47 (1), pp. 153-162.
Heckman, J.J., L.J. Lochner and P.E. Todd (2005), “Earnings Functions, Rates of Return, and TreatmentEffects: The Mincer Equation and Beyond”, NBER Working Paper, No. 11544.
Katz, L.F. and D.H. Autor (1999), “Changes in the Wage Structure and Earnings Inequality”, in Handbookof Labor Economics, Vol. 3, edited by O. Ashenfelter and D. Card, pp. 1463-1553.
Mincer, J. (1974), Schooling, Experience and Earnings, National Bureau of Economic Research, New York.
OECD (2005a), Pensions at a Glance, Paris.
OECD (2005b), Education at a Glance, Paris.
OECD (2006), Education at a Glance, Paris.
Oliveira Martins, J., R. Boarini, H. Strauss, C. de la Maisonneuve and C. Saadi, “The Policy Determinantsof the Investment in Tertiary Education”, OECD Economics Department Working Papers, No. 576.
Psacharopoulos, G. and H.A. Patrinos (2004), “Returns to Investment in Education: A Further Update”,Education Economics, Vol. 12 (2).
Psachoroupolos, J. (1995), “The Profitability of Investment in Education: Concepts and Methods”, TheWorld Bank Human Capital Development and Operations Policy Working Paper, No. 63.
OECD JOURNAL: ECONOMIC STUDIES – VOLUME 2010 © OECD 201024

WHAT IS THE PRIVATE RETURN TO TERTIARY EDUCATION? NEW EVIDENCE FROM 21 OECD COUNTRIES
Psacharopoulos, G. (1994), “Returns to Investment in Education: A Global Update”, World Development,Vol. 22 (9), pp. 1325-1343.
Strauss, H. and C. de la Maisonneuve (2007), “The Wage Premium on Tertiary Education: Micro-dataEvidence for 21 OECD Countries”, OECD Economics Department Working Papers, No. 589.
Strauss, H. and C. de la Maisonneuve (2009), “The Wage Premium on Tertiary Education: New Estimatesfor 21 OECD countries”, OECD Journal: Economic Studies, Vol. 2009.
Vella, F. and R.G. Gregory (1996), “Selection Bias and Human Capital Investment: Estimating the Ratesof Return to Education for Young Males”, Labour Economics, Vol. 3, pp. 197-219.
OECD JOURNAL: ECONOMIC STUDIES – VOLUME 2010 © OECD 2010 25