What Is the Outcome of Targeted Tuberculosis Screening Based on Universal Genotyping and Location?
26
What Is the Outcome of Location-based Targeted Tuberculosis Screening Based on Universal Genotyping? Running head: Tuberculosis and GIS Patrick K. Moonan 1,2,4 , Joseph Oppong 3 , Behzad Sahbazian 1,2,6 , Karan P. Singh 2 , Raghbir Sandhu 2 , Gerry Drewyer 1,4 , Terry LaFon 4 , Marco Marruffo 1,2 , Teresa N. Quitugua 5 , Charles Wallace 6 , and Stephen E. Weis 1,2,4,6 From the 1 School of Medicine, 2 School of Public Health, University of North Texas Health Science Center at Fort Worth, Fort Worth, Texas; 3 Department of Geography, University of North Texas, Denton, Texas; 4 Tarrant County Public Health Department, Fort Worth, Texas; 5 Department of Microbiology, University of Texas Health Science Center at San Antonio, San Antonio, Texas; and the 6 Bureau of Tuberculosis Elimination, Texas Department of Health and Human Services, Austin, Texas. Corresponding author: Stephen E. Weis, DO, University of North Texas Health Science Center at Fort Worth, Patient Care Center, 855 Montgomery, Fort Worth, TX, 76107, Telephone: (817) 321-4948, Fax: (817) 321-4920 e-mail: [email protected] Abstract Word Count: 179 Word count: 3,670 Tables: 5 Figures: 1 AJRCCM Articles in Press. Published on May 25, 2006 as doi:10.1164/rccm.200512-1977OC Copyright (C) 2006 by the American Thoracic Society.
-
Upload
leidenuniv -
Category
Documents
-
view
1 -
download
0
Transcript of What Is the Outcome of Targeted Tuberculosis Screening Based on Universal Genotyping and Location?

What Is the Outcome of Location-based Targeted Tuberculosis Screening Based on Universal Genotyping?
Running head: Tuberculosis and GIS Patrick K. Moonan1,2,4, Joseph Oppong3, Behzad Sahbazian1,2,6, Karan P. Singh2, Raghbir Sandhu 2, Gerry Drewyer1,4, Terry LaFon4, Marco Marruffo1,2, Teresa N. Quitugua5, Charles Wallace6, and Stephen E. Weis1,2,4,6 From the 1School of Medicine, 2School of Public Health, University of North Texas Health Science Center at Fort Worth, Fort Worth, Texas; 3Department of Geography, University of North Texas, Denton, Texas; 4Tarrant County Public Health Department, Fort Worth, Texas; 5Department of Microbiology, University of Texas Health Science Center at San Antonio, San Antonio, Texas; and the 6Bureau of Tuberculosis Elimination, Texas Department of Health and Human Services, Austin, Texas. Corresponding author: Stephen E. Weis, DO, University of North Texas Health Science Center at Fort Worth, Patient Care Center, 855 Montgomery, Fort Worth, TX, 76107, Telephone: (817) 321-4948, Fax: (817) 321-4920 e-mail: [email protected] Abstract Word Count: 179 Word count: 3,670 Tables: 5 Figures: 1
AJRCCM Articles in Press. Published on May 25, 2006 as doi:10.1164/rccm.200512-1977OC
Copyright (C) 2006 by the American Thoracic Society.

Abstract
Rationale and Objectives: Identifying and treating persons with latent tuberculosis
infection (LTBI) at high risk for developing tuberculosis is part of current tuberculosis
elimination strategy. There are no specific criteria, other than medical risks, to designate
groups as high-risk for developing tuberculosis. We hypothesized that if location-based
screenings were done in communities where persons with genotypically clustered M.
tuberculosis resided, then persons with LTBI from recent transmission and with
undiagnosed tuberculosis could be identified.
Methods: Location-based tuberculosis screenings were done in partnership with multiple
community-based organizations using resources previously used for other types of
screening.
Main Results: Location-based screenings identified one person with tuberculosis for
every 83 screened and one person with latent tuberculosis infection for every 5 screened.
The yield of this targeted screening program for discovering persons with tuberculosis
and LTBI exceeded what would be expected from non-targeted screening in a county
with a tuberculosis incidence of 5.7 per 100,000 population year.
Conclusions: Genotyping combined with Geographic Information Systems (GIS)
analysis can potentially be used to define high-risk status and to define areas for location-
based tuberculosis-screenings.
Keywords: genotyping, M. tuberculosis, location-based screening

Introduction
For over 40 years screening and treating persons with latent tuberculosis infection
(LTBI) have been important parts of the tuberculosis control strategy in the United States
[1]. Reduction of reported cases of tuberculosis has resulted in the Centers for Disease
Control and Prevention (CDC) altering its national tuberculosis elimination strategy from
universal screening to targeted screening of specific high-risk populations [2]. Consistent
with this change in strategy, the Institute of Medicine recommended developing more
effective methodologies for targeting populations with recently acquired infection for
treatment to limit the spread of tuberculosis [3]. Targeted tuberculosis screening allows
for optimum performance of the tuberculin skin test (TST) used to diagnosis LTBI and is
economically more efficient [3, 4]. Developing targeted testing strategies to identify the
estimated 15 million individuals with LTBI in the United States is one of the current
challenges of the tuberculosis elimination policy [5].
Assessing M. tuberculosis strains within a community by molecular genotyping
may be useful to design intervention strategies [6]. Studies from Europe and the United
States combining molecular surveillance with epidemiologic investigations have shown
that unrecognized transmission of tuberculosis can result in additional tuberculosis cases
[7 - 14]. Some of these studies have suggested that greater than 40% of persons with
tuberculosis were a result of recently acquired infection [8 - 10]. Population-based
molecular epidemiological surveillance combined with Geographic Information Systems
analysis (GIS) can identify discrete geographical areas where on-going tuberculosis
transmission is likely occurring [15]. This suggests genotyping-GIS based analyses can
determine locations where traditional person-orientated contact investigations are not
successfully controlling transmission.
If genotyping-GIS analysis can identify locations where traditional methods of
surveillance are unsuccessful at identifying transmitted tuberculosis then geographically
based screening in those areas could identify persons with previously undiagnosed
tuberculosis and latent tuberculosis infection (LTBI). This paper presents the results of a
targeted geographical tuberculosis screening program with genotyping-GIS analysis
defined boundaries for identifying tuberculosis and LTBI.

Methods
The Tarrant County Health Department (TCHD) coordinated and implemented
the tuberculosis screening program. The TCHD serves the western portion of the Fort
Worth-Dallas metropolitan area in north central Texas and includes a population of
approximately 1.5 million [16]. The TCHD conducts screening of high-risk populations
as part of the required tuberculosis control activities specified by its contract with the
Bureau of Tuberculosis Elimination of the Texas Department of Health and Human
Services. Previously, the screening efforts were based on epidemiological risk factors
and not on geographical risk. Between January 1, 1993 and December 31, 2000 these
screening efforts identified two persons with tuberculosis out of 2,911 persons screened
[17]. The epidemiologic risks of the screened population were unstable housing which
included living in congregate living centers, substance abuse, and low socioeconomic
status [17]. In the current study, tuberculosis screening resources were focused on
location-based targeted screening program implemented in collaboration with local
community-based organizations. These screenings were conducted within Zip codes
previously demonstrated by GIS to have genotypically clustered tuberculosis isolates
consistent with uninterrupted transmission [15]. The methods used to define geographic
and genotypic clustering of M. tuberculosis have been previously described [15, 18, 19].
Briefly, prospectively collected isolates had IS6110-based RFLP and spoligotyping
genotyping performed to identify patients infected with the same strain [18, 19]. Isolates
were defined as genotypically clustered if they had seven or more identical IS6110 band
pattern or if they had identical IS6110 patterns containing six or fewer bands and
identical spoligotypes [15]. GIS analysis demonstrated that spatial distribution of
tuberculosis and of molecular clustering within the county was not homogenous and
displayed a distinct geographical distribution [15]. The average tuberculosis annual
incidence for the county from 1993 to 2000 was 5.9 cases per 100,000. When the
incidence was divided using zip-code boundaries, the average annual incidence in the 3
Zip codes screened was 94, 55, and 32 cases per 100,000 population. Countywide 55%
of the isolates collected during the previous study period were molecularly clustered. In
the 3 screened Zip codes 95 out of 117 (81%) isolates collected were molecularly
clustered [15]. In the current study, we conducted screening in the 3 Zip codes that had

both the highest incidence and molecular clustering of tuberculosis and were contiguous.
The area of these zip codes was 4.62, 5.74, and 5.88 square miles. The analysis was
performed on data collected on persons screened at multiple locations between
September 1, 2002 and December 31, 2004. Screening and treatment were done at the
community-based organizations for patient's convenience, to take advantage of their
client volume and because they were considered to be locations where transmission was
occurring.
The community-based organizations participating in implementation of this
program included: mental health facilities; temporary labor services; job training and
living facilities sponsored by the Veterans Administration; dialysis centers, churches,
community services center, HIV congregate living facility, and several congregate living
facilities sponsored by different faith-based organizations. Persons screened included
those using the services and living within the community. Screened individuals were
identifiable by a county-issued screening identification card. To receive service at these
community-based organizations the clients needed their county-issued screening
identification card. Those without a card were allowed to use services for up to 2 weeks
and were encouraged to attend the next scheduled screening or to go to health
department. Each community-based organization had a screening schedule. The same
locations were used for screening throughout the study and were accessible for persons
with limited transportation and 4 of the locations were less than 1.5 miles apart. After 2
weeks without presenting a screening card clients were no longer allowed access to
services. Most, but not all, of the faith-based organizations participating in the screening
required identification card for entry to their services. The wide overlap of the need for
the community-based organizations services were strong incentive to be screened. Many
of the persons screened used multiple services e.g. employed through the temporary labor
center, received mental health care from mental health facility, washed clothing and used
telephone at community center, ate meals at church and stayed in community-based
organization supported housing.
Each member of the screening team had experience in meeting the needs of
vulnerable populations, and had successfully completed the CDC core TB training
modules [20]. This training includes standardized placement and interpretation of

Mantoux testing (TST), identifying common tuberculosis symptoms, principles of direct
observation of therapy, recognition of medication side effects, and patient follow-up.
The team included public health nurses and physicians; however, the majority of the staff
involved did not have medical licenses. Licensed and bi-lingual staff members were
onsite during each screening.
The screening program included active tuberculosis case finding and testing for
LTBI. Screenings were conducted on-site and included a brief history with
demographics, local employment and residential history, length of time utilizing services
in the target area, the number of facilities utilized in the target area, number of days per
week utilizing services in the targeted area, symptom assessment, TST, chest radiograph,
issuing proof of screening, and creation of a photo-identification card. TST screening was
done with 5-tuberculin unit–strength purified protein derivative. Based on results of the
prior GIS analysis, all area residents were presumed to have TB exposure and TST
reaction greater than or equal to 5 mm induration was defined as positive [21]. Persons
reporting a history of a prior positive TST were not re-tested but underwent all other
aspects of the evaluation. TCHD personnel were available for 5 evening hours Monday
through Friday to evaluate TST results and conduct directly observed therapy (DOT) and
directly observed preventive therapy (DOPT). Persons with symptoms, positive TST or
abnormal radiograph had an additional medical evaluation. The photo-identification card
expired after 12 months. Renewal of the card required another complete evaluation. At
retest an increase in TST induration of 5 mm or greater was defined as positive. Any
person who developed symptoms consistent with tuberculosis prior to the card expiration
date had another complete evaluation. All data were stored in a single database.
Statistical analysis was performed utilizing SPSS 13.0 (SPSS Inc, Chicago, IL).
Logistic regression analyses were performed and the method of maximum likelihood was
used to estimate odds ratios and 95% confidence intervals for all variables. Age was the
only continuous variable. The age variable statistics were analyzed by comparing the
means between groups. A 95% confidence interval for the mean age difference was
calculated by using the normal approximation, and an independent sample two-tailed
student's t-test was used to assess the statistical significance of the mean age difference.
Each eligible tuberculosis patient prospectively enrolled and participated in a structured

interview by S. Weis as part of their routine initial medical evaluation using an interview
tool approved by University of North Texas Health Science Center Institutional Review
Board.
Results
Between September 1, 2002 and December 31, 2004, we conducted 5,672
complete evaluations for 3,645 individuals evaluated at 48 screenings [2,770 (76%)
evaluated at least once; 1,987 (55%) evaluated at least twice; 756 (21%) evaluated at
least three times; 159 (4%), evaluated at least 4 times]. Eight hundred and seventy-five
(24%) had a partial evaluation; consisting of epidemiologic and symptom assessment,
chest radiograph and placement of TST, but did not return to have the skin test read.
Those with partial evaluation did not differ statistically from those with a completed
evaluation based on race (p = 0.61), age (p = 0.55), or gender (p = 0.23).
During the study period, 44 persons (1.2%) were diagnosed with pulmonary
tuberculosis and 681 individuals (18.6%) were diagnosed with LTBI. 1,987 individuals
(54.5%) had repeat evaluation, 104 of them (5.2%) demonstrated tuberculin skin test
conversion (range of increase 13 – 37 mm). Over this period the total number of persons
identified active tuberculosis, LTBI, and TST conversions decreased significantly. The
number of persons identified with tuberculosis decreased from 28.5 cases per 1,000 to 2.4
cases per 1,000 during the 28 months of screening. The number of persons identified
with LTBI decreased during the same period from 300.6 per 1,000 to 18.9 per 1,000
[Table 1].
As screening was mandatory to use the services available at the community-based
organizations we believe the screened population reflects the demographics of the target
population. The screened population was significantly different by age (p = 0.001) [Data
not shown], gender (p < 0.001), and race (p < 0.001) than the overall Tarrant County
population [Table 2]. When compared with the general Tarrant County population, the
screened population was 2.9 times more likely to be male [OR 2.9; 95% CI: 2.7, 3.1] and
5.9 times more likely to be African-American [OR 5.9; 95% CI: 5.6, 6.3]. The majority
of the population screened was between the ages of 35 to 54 years (64.9%) [Figure 1].
The mean age was 43.7 ± 12.9 (SD) for the overall screened population; 46.2 ± 10.3 (SD)

for persons with LTBI; 46.9 ± 10.3 (SD) for persons with TST converting to positive on
subsequent TST; and 51.2 ± 10.5 (SD) for persons with tuberculosis. Individuals with
LTBI differed significantly by age (p < 0.001) from those without LTBI. On average,
those with LTBI were 5.9 years older than those without identified infection (mean
difference 5.9; 95% CI: 4.8, 7.1). Individuals with TST conversion also differed
significantly by age from those who did not convert (p < 0.001). On average, those with
TST converted to positive were 5.4 years older than those who did not (mean difference
5.4; 95% CI: 2.6, 7.9). Finally, tuberculosis cases differed significantly by age from non-
cases (p < 0.001). On average identified cases of TB were 9.4 years older than the study
population (mean difference = 9.4 95% CI = 6.1, 12.3) [Data not shown].
Of the 44 individuals identified as having tuberculosis, 29 (65.9%) had culture
confirmation, 15 (51.7%) of these were smear-positive, and in 15 (34.1%) the diagnosis
was established on clinical characteristics. During the 28 months following the initiation
of the screening program 9 (20%) developed tuberculosis following a normal chest
radiograph. HIV status was available in 43 (97.7%) of the cases; 3 (7.0%) were HIV
seropositive. The majority of the cases were White (56.8%), followed by Black (34.1%).
Male gender (OR: 4.8; 95% CI: 1.4, 24.9); White race (OR: 1.9; 95% CI: 1.0, 3.6) were
the only demographic variables significantly associated with tuberculosis. Self-
identifying as being American Indian appeared to be an important factor for tuberculosis,
however, the association was not statistically significant (OR: 13.9.; 95% CI: 0.3, 118.3)
[Table 3]. Three (7%) of the diagnosed cases self identified as born outside the United
States.
The screening identified 681 (18.6%) individuals with LTBI. Male gender (OR:
2.8; 95% CI: 2.2, 3.6), Black race (OR: 1.7; 95% CI: 1.4, 2.0), and Hispanic (OR: 1.8;
95% CI: 1.4, 2.3) were significantly associated with LTBI. Self-identifying as White race
(OR: 0.4; 95% CI: 0.3, 0.5), was associated with reduced risk [Table 4].
1,987 (54.5%) individuals received at least one follow-up evaluation. Of these
104 (5.2%) developed a positive TST on retest. There were 1,326 person-years of
observations. The overall risk of TST conversion in this targeted community was 8.9 per
100 person-years of exposure. TST conversion rates decreased after the first 14 months
from 14.3 to 2.2 per 100 person-years of exposure over the last 14 months. Being male

(OR: 2.5; 95% CI: 1.4, 4.7) was the only demographic variable significantly associated
with developing a positive TST on retest. Of those with positive TST, Blacks (48.1%)
and Whites (39.4%) had the highest incidence of conversion, however stratified risk
estimates remained non-significant (Blacks: p = 0.724, Whites: p = 0.488) [Table 5].
Discussion
While the currently recommended strategy for tuberculosis elimination based on
the concept of targeted testing and treatment of persons most likely to develop
tuberculosis is ideal, how best to expand this screening beyond groups traditionally
considered at high risk is uncertain. We have used, for the first time, genotyping-GIS
analysis to design and implement a geographical screening program. This geographically
targeted screening identified one person with tuberculosis for every 83 screened and one
person with latent tuberculosis infection for every 5 screened. The yield of this targeted
screening program for discovering persons with tuberculosis, LTBI, and TST converters
far exceeded what would be expected from non-targeted screening in a county with a
tuberculosis incidence of 5.7 per 100,000 population year. These data suggest that
genotyping-GIS analysis can identify high-risk groups for targeted tuberculosis testing
programs.
There is the potential to identify tuberculosis during the evaluation of each TST-
positive individual [2, 21]. Persons with tuberculosis identified through active case
finding are more likely to be asymptomatic than persons passively identified [22]. There
is then, while not the primary purpose, a component of active case finding in every
targeted testing program. Our data on screening based on genotyping-GIS analysis
found a greater yield than many other targeted tuberculosis-testing programs conducted
by other methods and circumstances. A study of the most common form of targeted
testing, contact investigation, conducted in 5 geographically diverse TB programs across
the U.S. found one person with tuberculosis for every 319 screened and one person with
LTBI for every 8 screened [23]. A previous study of tuberculosis contacts from our
community identified one person with tuberculosis for every 222 persons screened and
one person with LTBI per every 5 screened [24]. A screening program of persons
incarcerated in Tarrant County Jail found that screening 3,274 persons was needed to
identify a person with tuberculosis and 108 persons to identify one individual with LTBI
[25]. Other novel efforts targeting screening persons at increased risk who would not
normally be evaluated for tuberculosis were all less successful at identifying tuberculosis
[26-28]. An advantage of screening based on genotyping-GIS analysis is that the entire
community can be surveyed for tuberculosis risk and then screening targeted to the
highest risk locations.
TST conversion is an important indicator for detecting recent transmission. We
found a significant reduction in TST conversion from 14.3 per 100 person-years of
exposure in the first 14 months to 2.2 per 100 person-years of exposure in the last 14
months. This magnitude of reduction is similar to the risk reduction that occurred in a
high-incidence inner city medical centers after full implementation of expanded infection
control measures. TST conversion rates decreased from 5.9 to 1.1 per 100 person-years
worked over 5-year period [29]. It is likely that decreases in transmission are a result of
reduced transmission from active case finding as well as the treatment of tuberculosis and
LTBI. These data demonstrate that screening and treatment of tuberculosis based on
genotyping-GIS analysis can reduce tuberculosis transmission in a community.
Political and managerial challenges are as important impediments to tuberculosis
control as medical challenges [30]. Public concern and political will are critical to
overcoming these barriers [3, 30]. The genotyping-GIS analysis proved to be important in
mobilizing community support for this screening. Several community-based
organizations that previously would not fully cooperate with tuberculosis screening
agreed to make it mandatory for individuals who wished to use their services after
reviewing the molecular surveillance-GIS analysis indicating community transmission.
The community support was crucial to the success of the screening and subsequently to
the treatment program. Universal genotyping-GIS analysis has the potential to be a useful
tool to increase community support and political involvement for tuberculosis control in
other communities.
Persons recently infected with tuberculosis are one of the groups at the highest
risk for developing tuberculosis [31]. In most of the developed world, where relatively
few persons in the community at any one time have tuberculosis, the strategy for
identifying persons most likely to have been recently infected is through investigation of

the contacts of persons with tuberculosis. Currently contact evaluation uses a concentric
circle model that was developed at a time when most contacts occurred within the home
and family [32 – 34]. Molecular cluster analysis of M. tuberculosis isolates conducted in
developed countries have demonstrated transmission links at times and in places not
identified through conventional concentric circle person-based contact investigation [8, 9,
11–14, 35 – 38] . These data have led to the suggestion that contact investigations as
currently designed are insufficient for identifying transmission pathways in multicultural
urban areas of the U.S. and that they need to be updated to be not only person-orientated
but also place-orientated in design [34]. In view of the large number of persons identified
through this targeted screening with LTBI and active tuberculosis, this targeted screening
approach demonstrates that genotyping-GIS analysis can help to delineate transmission
pathways.
There are no specific criteria to designate a group as high-risk for developing
tuberculosis [38]. Determining groups that are at increased risk at a local level requires
public health authorities to develop an epidemiologic profile of persons through
systematic screening for LTBI in their community. With currently available methods for
diagnosing LTBI this would be difficult and expensive to do in each community.
Beginning in 2004, the CDC has sponsored a universal genotyping program for
tuberculosis. This program expands the availability of genotypes for tuberculosis
diagnosed in United States. Isolates are characterized by PCR-based molecular
techniques, using spoligotyping, mycobacterial interspersed repetitive unit (MIRU)
typing [39, 40]. These typing methods can now provide local programs with access to
genotypes of isolates that are relatively easy to interpret and rapid enough that the
information can be used for epidemiological and clinical decision making. The
widespread availability of genotyping could allow for the identification of high-risk
tuberculosis status defined by geography. The genotyping-GIS analysis could be
performed at a local, state or national level. If our results are confirmed then genotyping-
GIS analysis could become a method to rapidly develop and adjust community-screening
programs based on location risk.
An important limitation to potential widespread implementation of these methods
is the need for community-based organizations willing to partner with health authorities

to perform screening. This program was successful because it met the needs of persons
being screened to obtain services and of the community-based organizations that did not
want their members exposed to tuberculosis. Additionally, tuberculosis programs in
communities with smaller populations or lower TB morbidity may not have patient
volume or expertise to do this level of analysis locally and therefore this analysis may
need to be conducted at a state or national level. Universal submission of at least one
isolate per culture-positive case is also needed as selective submission may affect cluster
size and the determination of location-based risk. Additionally, clustering can represent
prevalent community strains and not recently transmitted tuberculosis. It is also possible
that circumstances may exist where geographic clustering could represent recently
transmitted strains that were acquired from a different location. Treatment of LTBI, not
screening, prevents tuberculosis, and for this method to be useful it must be combined
with successful treatment for LTBI. It will be important for these findings to be
duplicated in other communities to ensure that they are generalizable.
Dating back to the pioneering work of John Snow on cholera, disease mapping
has provided important insights into geographic patterns of disease, risk, and mode of
spread [41]. These insights subsequently were used to provide the first practical epidemic
control. We have similarly, through a targeted screening program based on evaluating the
geographic pattern of disease, demonstrated that genotyping-GIS analysis can identify
areas with prevalent undiagnosed tuberculosis and LTBI. While there are many other
associations with the risk of developing tuberculosis, including: socioeconomic status,
country of birth, immunological status, and exposure; genotyping-GIS analysis is an
integrated view of the expression of these risks from the perspective of location and is a
novel approach for defining high-risk status.

Acknowledgements
The team of public health professionals at the Tarrant County Public Health Department
that did the screening: Lisa Adame, John Biboa, Guadalupe Munguia-Bayona, Catalina
Blanco, Stephen Fulmer, Debbie Greever, Nicole Hines, Karen Kardaras, Barbara King,
Douglas Melendy, Coy Mickens, Mack Neal, Nho Nguyen, Thieu Nguyen, Debbi
Roulston, Lee Sewell, Norma Shafer, Louise Slade, Gloria Stevenson, Kelly Taylor, Le
Turk, Rose Young, and Catherine Zimmerman. Also the leadership that made the
screening possible: Elvin Adams, Lou Brewer, Alex Hathaway, and John Suggs. Manuel
Bayona provided direction. Francesca Sanchez provided several critical reviews of the
manuscript.

References
1. American Thoracic Society. Preventive treatment in tuberculosis; a statement by the
Committee on Therapy. American Thoracic Society. Am Rev Respir Dis 1965;91:297–8.
2. Centers for Disease Control and Prevention: Advisory Council for the Elimination of
Tuberculosis (ACET): Tuberculosis elimination revisited: obstacles, opportunities, and a
renewed commitment. MMWR Recomm Rep 1999; 48(RR-9):1-13.
3. Institute of Medicine: Ending Neglect: the elimination of tuberculosis in the United
States. Washington, D.C.: National Academy Press; 2000.
4. Bass JR. The tuberculin test. In Reichman LB, Hershfield ES, eds. Tuberculosis: a
comprehensive international approach. Vol 66. New York: Marcel Dekker 1993:139-148.
5. Bennett DE, Courval JM, Onorato IM, Agerton T, Daugherty-Gibson JM, McQuillan
G, Lewis B, Castro KG. Prevalence of TB infection in the US population, 1999-2000
[abstract]. Program and abstracts, the Annual Meeting of the American Public Health
Association. San Francisco, California, November 15-19, 2003.
6. Castro KG, Jaffe HW. Rationale and methods for the National Tuberculosis
Genotyping and Surveillance Network. Emerg Infect Dis 2002;8:1188-91.
7. van Soolingen D., Borgdorff M.W., de Haas P.E., Sebek M.M., Veen J., Dessens M.,
Kremer K., & van Embden J.D. Molecular epidemiology of tuberculosis
in the Netherlands: a nationwide survey from 1993 through 1997. J Infect Dis 1999;
180:726-736.
8. Small PM, Hopewell PC, Singh SP, Paz A, Parsonnet J, Ruston DC, Schecter GF,
Daley CL, Schoolnik GK: The epidemiology of tuberculosis in San Francisco: a
population-based study using conventional and molecular methods.

N Engl J Med 1994; 330:1703-9.
9. Barnes PF, Yang Z, Preston-Martin S, Pogoda JM, Jones BE, Otaya M, Eisenach KD,
Knowles L, Harvey , Cave MD: Patterns of tuberculosis transmission in central Los
Angeles. JAMA 1997; 278:1159-63.
10. Bauer J, Yang Z, Poulsen S, Andersen AB. Results from 5 years of nationwide DNA
fingerprinting of Mycobacterium tuberculosis complex isolates in a country with a low
incidence of M. tuberculosis infection. J Clin Microbiol 1998; 36(1):305-8.
11. Solsona J, Cayla JA, Verdu E, Estrada MP, Garcia S, Roca D, Miquel B, Coll
P, March F; Cooperative Group for Contact Study of Tuberculosis Patients in
Ciutat Vella. Molecular and conventional epidemiology of tuberculosis in an inner city
district. Int J Tuberc Lung Dis 2001; 5:724-31.
12. Tudo G, Gonzalez J, Gatell JM, Cayla JA, Martinez E, Garcia A, Navarro M,
Soriano E, Jimenez de Anta MT; Tuberculosis Investigation Unit of Barcelona,
Spain. Detection of unsuspected cases of nosocomial transmission of tuberculosis by
use of a molecular typing method. Clin Infect Dis 2001;33:453-9.
13. Solsona J, Cayla JA, Bedia M, Mata C, Claveria J; Grupo de trabajo para
estudio de contactos de Ciutat Vella, Barcelona. Diagnostic efficacy of the study of
contacts of tuberculosis patients in a high prevalence urban area. Rev Clin Esp 2000;
200:412-9.
14. March F, Coll P, Guerrero RA, Busquets E, Cayla JA, Prats G. Predictors of
tuberculosis transmission in prisons: an analysis using conventional and molecular
methods. AIDS 2000;14:525-35.
15. Moonan PK, Bayona M, Quitugua TN, Oppong J, Dunbar D, Jost KC, Burgess G,
Singh KP, Weis SE. Using GIS technology to identify areas of tuberculosis transmission

and incidence. Int J Health Geogr 2004;3:23.
16. U.S. Census Bureau 2000: Metropolitan area population estimates.
[http://www.census.gov/population/estimates/metrocity/ma99.04.txt]
17. Burgess G. Targeted Tuberculosis Screening in Response to a Retrospective
Analysis of Genotyping Data and Geographic Information System Data. [Abstract]
Presented at the Annual Conference of the National Association of County and City
Health Officials, St. Paul, MN July 15, 2004. Available at:
http://archive.naccho.org/modelPractices/Result.asp?PracticeID=108. Accessed
02/23/2006.
18. Kamerbeek JLS, Kolk A, van Agterveld M, van Soolingen D, Kuijper S, Bunschoten
Molhuizen H, Shaw R, Goyal M, van Embden JD: Simultaneous detection and strain
differentiation of Mycobacterium tuberculosis for diagnosis and epidemiology. J.
Clin.Microbiol. 1997, 35:907-914
19. Kremer K, van Soolingen D, Frothingham R, Haas WH, Hermans PW, Martin C,
Palittapongarnpim P, Plikaytis BB, Riley LW, Yakrus MA, Musser JM, van Embden JD:
Comparison of methods based on different molecular epidemiological markers for
typing of Mycobacterium tuberculosis complex strains: interlaboratory study of
discriminatory power and reproducibility. J. Clin. Microbiol 1999, 37;2607-2618
20. Centers for Disease Control and Prevention. Self-Study Modules on Tuberculosis.
Atlanta, GA: DHHS, CDC, Division of Tuberculosis Elimination; 1995 (nos. 1-5) and
1999 (nos. 6-9).
21. American Thoracic Society, CDC. Targeted tuberculin testing and treatment of latent
tuberculosis infection. Am J Respir Crit Care Med 2000;161:S221–47.

22. Monney M, Zellweger JP. Active and passive screening for tuberculosis in Vaud Canton, Switzerland., in Swiss Med Wkly (2005).
23. Reichler MR, Reves R, Bur S, Thompson V, Mangura BT, Ford J, Valway SE,
Onorato IM; Contact Investigation Study Group. Evaluation of investigations conducted
to detect and prevent transmission of tuberculosis. JAMA 2002; 287:991-5.
24. Moonan PK, Marruffo M, Manguia-Bayona G, Sahbazian B, Bayona M, Burgess G,
Weis SE. Tuberculosis: what is the yield of associate investigations in non-BCG-
immunized children with positive tuberculin skin tests? Int J Tuberc Lung Dis. 2005;
9:322-7.
25. Miller TL, Hilsenrath P, Lykens K, McNabb SJ, Moonan PK, Weis SE.Using Cost
and Health Impacts to Prioritize the Targeted Testing of Tuberculosis in the United
States. Ann Epidemiol. 2005 Oct 18; [Epub ahead of print].
26. Kirsch TD, Chanmugam A, Keyl P, Regan LA, Shahan J, Hexter DA, Kelen GD.
Feasibility of and Emergency department –based tuberculosis counseling and screening
program. Acad Emerg Med 1999;6:224-31.
27. Gany FM, Trinh-Shevrin C, Changrani J. Drive-by readings: a creative strategy for
tuberculosis control among immigrants. Am J Pub Health 2005;95:117-119.
28. de Olalla PG, Cayla JA, Mila C., Jansa JM, Badosa I, Ferrer A, Ros M, et al.
Tuberculosis screening among immigrants holding a hunger strike in churches. Int J
Tuberc Lung Dis 2003;7:S412-416.
29. Blumberg HM, Sotir M, Erwin M, Bachman R, Shulman JA. Risk of house staff
tuberculin skin test conversion in an area with a high incidence of tuberculosis. Clin
Infect Dis 1998;27:826-33.
30. Klaudt K. Mobilizing socienty against tuberculosis. In Reichman LB, Hershfield ES,

eds. Tuberculosis: a comprehensive international approach. Vol 144. New York: Marcel
Dekker 2000:843-863.
31. Ferebee SH, Mount F, Comstock GW. The use of chemotherapy as a prophylactic
measure in tuberculosis. Ann NY Acad Sci 1963;106:151-6.
32. Veen J. Microepidemics of tuberculosis: the stone-in-the-pond principle.
Tuber Lung Dis 1992; 73(2):73-6.
33. Etkind S.C. Contact tracing in tuberculosis. In Reichman LB, Hersfield ES
(Eds.) Tuberculosis: a comprehensive approach. Lung Biology in Health and
Disease. Vol. 66 New York, NY: Marcel Dekker (275 – 289), 1993.
34. Weis S. Contact investigations: how do they need to be designed for the 21st
century? Am J Respir Crit Care Med 2002;166(8):1016-7.
35. Barnes P.F., El-Hajj H., Preseton-Martin S., Cave M.D., Jones B.E., Otaya M.,
Pogoda J., & Eisenach K.D. Transmission of tuberculosis among the urban homeless.
JAMA 1996; 275:305 – 307.
36. Šebek M. DNA fingerprinting and contact investigation. Int J Tuberc Lung Dis 2000;
4:S45 – 48.
37. van Soolingen D., Borgdorff M.W., de Haas P.E., Sebek M.M., Veen J., Dessens M.,
Kremer K., & van Embden J.D. Molecular epidemiology of tuberculosis
in the Netherlands: a nationwide survey from 1993 through 1997. J
Infect Dis 1999;180:726 – 736.
38. Nolan C.M. Community-wide implementation of targeted testing for and treatment of
latent tuberculosis infection. Clin Infect Dis 1999;29:880-7.

39. Centers for Disease Control and Prevention. New CDC program for rapid genotyping of Mycobacterium tuberculosis isolates. MMWR Morb Mortal Wkly Rep 2005; 54:47.
40. Cowan LS, Diem L, Monson T, Wand P, Temporado D, Oemig TV, Crawford JT.
Evaluation of a two-step approach for large-scale, prospective genotyping of
Mycobacterium tuberculosis isolates in the United States.
J Clin Microbiol 2005, 43:688-95.
41. Snow J. On the mode of Communication of Chlorea. London: John Churchill 1855.
At http://www.ph.ucla.edu/epi/snow/snowbook.html

Figure Legend
Figure 1. Age distribution of target population and Tarrant County.

Table 1. Detection Yield by Period
Period* M. tb Culture
Positive Clinical TB LTBI Negative
TST Incomplete Evaluation Total
Case Rate/1000
LTBI Rate/1000
1 14 6 211 291 180 702 28.5 300.6 2 5 2 143 304 139 593 11.8 241.1 3 4 3 113 242 126 488 14.4 231.6 4 3 0 103 383 153 642 4.7 160.4 5 1 2 77 249 121 450 6.7 171.1 6 1 2 26 248 70 347 8.5 74.9 7 1 0 8 328 86 423 2.4 18.9 Total 29 15 681† 2,045 875 3,645 12.1 186.9 * Each period duration is 4 months; beginning September, 2002 and ending December, 2004 † Includes persons identified at retest

Table 2. Demographic Characteristics Tested Population Tarrant County* 3,645 1,446,219
Demographic No. (%) No. (%) Odds Ratio 95% CI P value
Sex Male 2,700 74.1 715,878 49.5 2.9 2.7, 3.1 < 0.0001 Female 945 25.9 730,341 50.5 Race/ethnicity Black 1,698 46.6 185,695 12.8 5.9† 5.6, 6.3 < 0.0001 Hispanic 399 10.9 285,484 19.7 White 1,509 41.4 895,788 61.9 Asian 24 0.7 52,642 3.6 American Indian 7 0.2 9,256 0.6 Other Race 8 0.2 17,355 1.2 * U.S. Census, 2002 † When compared to all other races

Table 3. Risk Factors Associated with Tuberculosis Tuberculosis Case
Yes No Odds Ratio
95% Confidence Interval p value
N (%) N (%) Gender Male 41 1.5 2,659 98.5 4.8 1.4 24.9 <0.006* Female 3 0.3 942 99.7 Race Black 15 0.9 1,683 99.1 0.6 0.3 1.1 <0.129 White 25 1.7 1,484 92.3 1.9 1.0 3.6 <0.053 Hispanic 3 0.8 396 99.2 0.6 0.1 1.9 <0.274 Asian 0 - - 24 100 - -† - - - - - - American Indian 1 14.3 6 85.7 13.9 0.3 118.3 <0.082* Other 0 - - 8 100 - -† - - - - - - * Fisher's exact test used with individual cell counts below 5 † Zero cell count

Table 4. Risk Factors Associated with Latent Tuberculosis Infection (LTBI)* † LTBI Yes No
Odds Ratio
95% Confidence Interval p value
N (%) N (%) Gender Male 580 30.0 1,375 70.0 2.8 2.2 3.6 <0.001 Female 101 13.0 670 87.0 Race Black 373 30.3 57 69.7 1.7 1.4 2.0 <0.001
White 194 16.6 973
83.4 0.4 0.3 0.5 <0.001 Hispanic 105 35.5 191 64.5 1.8 1.4 2.3 <0.001 Asian 8 36.4 14 63.6 1.8 0.7 4.5 0.299 American Indian 1 20.0 4 80.0 0.8 0.02 7.6 0.633‡ Other 0 - - 6 100 - -§ - - - - - - * For those with TST read within 72 hours and not identified as tuberculosis cases [n = 2,726] † Includes persons identified at retest ‡ Fisher's exact test used with individual cell counts below 5 § Zero cell count
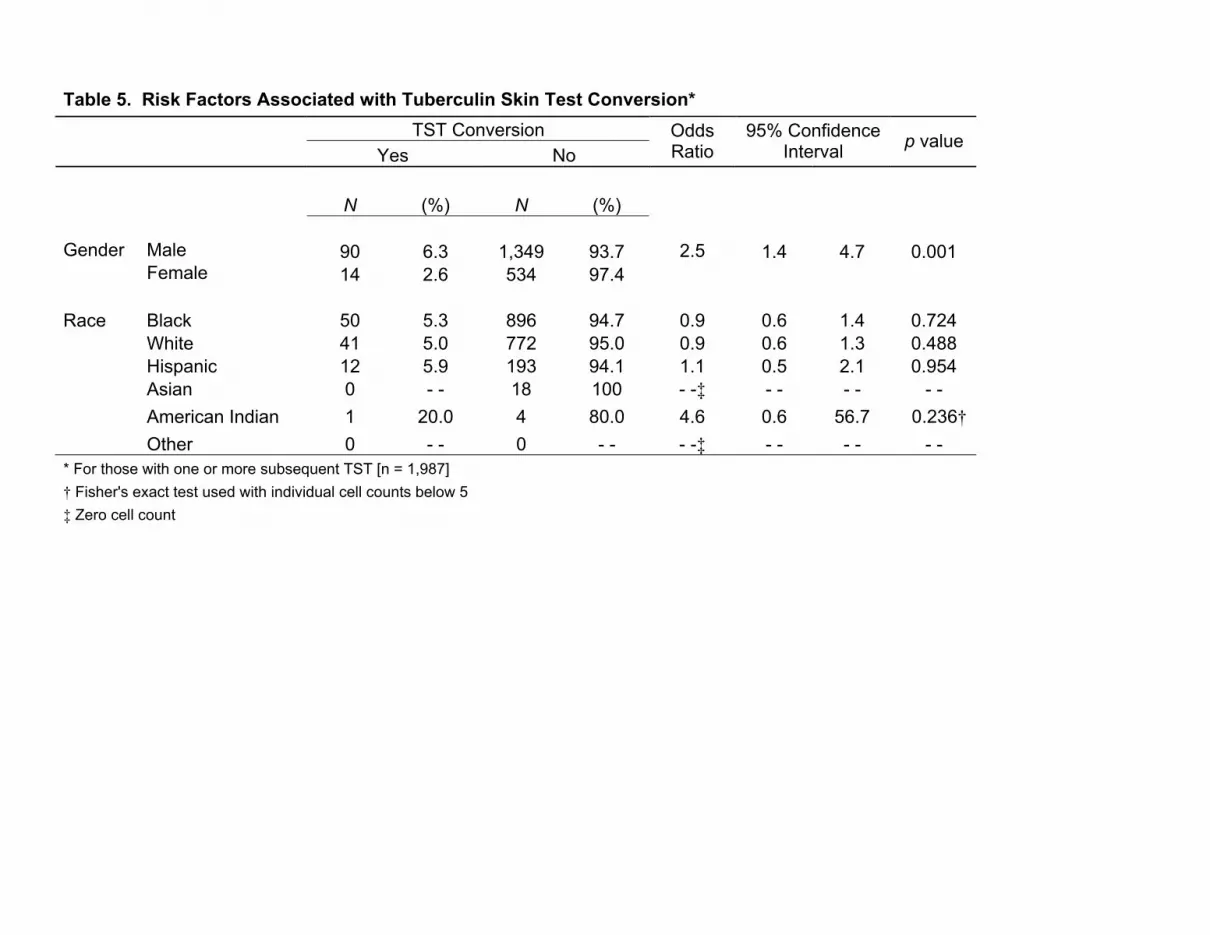
Table 5. Risk Factors Associated with Tuberculin Skin Test Conversion* TST Conversion Yes No
Odds Ratio
95% Confidence Interval p value
N (%) N (%) Gender Male 90 6.3 1,349 93.7 2.5 1.4 4.7 0.001 Female 14 2.6 534 97.4 Race Black 50 5.3 896 94.7 0.9 0.6 1.4 0.724 White 41 5.0 772 95.0 0.9 0.6 1.3 0.488 Hispanic 12 5.9 193 94.1 1.1 0.5 2.1 0.954 Asian 0 - - 18 100 - -‡ - - - - - - American Indian 1 20.0 4 80.0 4.6 0.6 56.7 0.236† Other 0 - - 0 - - - -‡ - - - - - - * For those with one or more subsequent TST [n = 1,987] † Fisher's exact test used with individual cell counts below 5 ‡ Zero cell count

Figure 1
> 7565 to 7460 to 6455 to 5945 to 5435 to 4425 to 3420 to 2415 to 1910 to 145 to 9< 5
Age Group (in years)
50.00
40.00
30.00
20.00
10.00
0.00
Perc
ent o
f Pop
ulat
ion
TST ConvertorsLTBITB CasesTarrant CountyTarget Population