Western Sydney & Aerotropolis Investment Seminar - Austrade
19
NSW ECONOMIC UPDATE Western Sydney & Aerotropolis Investment Seminar September 2019 | Michael Bradley, Corporate & Institutional Banking
-
Upload
khangminh22 -
Category
Documents
-
view
2 -
download
0
Transcript of Western Sydney & Aerotropolis Investment Seminar - Austrade

NSW ECONOMIC UPDATEWestern Sydney & Aerotropolis Investment Seminar
September 2019 | Michael Bradley, Corporate & Institutional Banking

PRESENTATION OVERVIEW
Introduction to National Australia Bank (“NAB”)
NSW economy
NSW infrastructure
Australia Outlook

INTRODUCTION TO NAB

NAB GROUP snapshot
4
customers globally~10 MILLION
employees1~33,000
Established more than
150yearsago
One of Australia and New Zealand’s biggest banking groups and largest institutions, managing relationships with retail, corporate and institutional clients in its core franchise in Australia and internationally.
One of the world’s safest banking groups2, with a strong balance sheet contributing to a AA- credit rating.
GLOBAL FOOTPRINT
150 YEARSIN THE UK
United StatesWholesale banking,
institutional markets, business and treasury
activity
AsiaNetwork of offices in China, HK, Japan,
Singapore, India and Indonesia providing banking services and market products to
corporate and institutional customers
40+ YEARSIN THE USAND ASIA
Seven branches and two representative offices outside Australia & NZ
New ZealandRetail, private, wealth, business, corporate and
institutional and markets via Bank of New Zealand (BNZ)
AustraliaFull service bank across retail,
business, private, corporate and institutional banking, and wealth
A$5.7BNFY18 Group
Cash Earnings3
CORE BUSINESS SEGMENTSSplit across:
Corporate & Institutional Banking
Consumer Banking & Wealth
New Zealand Banking
Business & Private Banking
1. Represents full time equivalent employees as at 30 September 2018 for NAB Group.2. Most recently, NAB ranked 29th in Global Finance magazine’s World’s Safest Banks 2017. Ratings apply to the world’s largest 500 banks by asset size and are
based on the long-term foreign currency ratings issued by Fitch Ratings, Standard & Poor’s and Moody’s Investors Service. (Global Finance magazine, 2017)3. Including restructuring-related costs and customer-related remediation as at 30 September 2018 for NAB Group
United KingdomWholesale banking,
institutional markets, business and treasury
activity

6%
51%23%
20%
Acquisition FinanceInfrastructureEnergyCommodities
A LEADING AUSTRALIAN BANK global capability in specialised finance
~AUD18BN EXPOSURE IN AUSTRALIA, NORTH AMERICA & EUROPE
DIVERSIFICATION ACROSS KEY INDUSTRY SEGMENTS GLOBALLY
NAB PROVIDES SPECIALIST INSIGHT AND TRANSACTION EXPERTISE IN THE STRUCTURING, NEGOTIATION AND EXECUTION OF M&A AND EVENT DRIVEN FINANCING ACROSS A VARIETY OF SECTORS
65%
2%
28%
5%
AustraliaAsiaUKNorth America
Infrastructure Energy Resources and commodities
**Excluding those with resource risk
United StatesNew York based team with
connectivity across North America
Australia & NZAustralia’s no.1 infrastructure
financier* with an active presence in NZ (via BNZ)
AsiaExperience supporting
infrastructure investment in Asian centres
UK & EuropeLondon based team with reach across major European markets
World-class franchise Top 15 in infrastructure finance globally*
Lead Arranger on 58 global infrastructure transactions with combined value of A$5.6b in 2018*
$100b Australian infrastructure commitment, leveraging our global networks and capability
Global reach Global platform, with coverage presence in Australia and NZ (via BNZ) as
well as major financial centres – New York, London, Hong Kong and Singapore
Coverage of global financial sponsors, strategic investors and industrial groups
Supporting key clients expand into new markets and facilitating inbound capital and trade flows
* Source: Inframation5
SPECIALISTS IN CORPORATE BANKING solutions
6
1. Aggregate of the total debt volume (not NAB’s share) in each transaction NAB provided debt finance.
Arranged1 $38.2bn(since 2003)
Committed $8.1bn(since 2003)
$55bn finance commitment to
2025 to help address climate
change and support orderly transition to a
low-carbon economy
#1 arranger of project finance in Australian renewables market
Successfully closed 120+ deals
carbon neutral*
FIRST AUSTRALIAN BANK TO BECOME
LEADING ISSUER & ARRANGER FOR GREEN BONDS IN
Australia^
- 5 10 15 20 25 30 35 40 45
-
5,000
10,000
15,000
20,000
2005 2006 2007 2008 2009 2010 2011 2012 2013 2014 2015 2016 2017 2018 2019
Deb
t ar
ran
ged
(A
$bn
)
Inst
alle
d C
apac
ity
(MW
)
Cumulative Installed Capacity/Debt arranged by NAB for renewable projects
Wind SolarBiomass GeothermalPortfolio LFGCumulative Debt Arranged
* National Carbon Offset Standard (NCOS) Carbon Neutral Program.^ Bloomberg and Climate Bonds Initiative (https://www.climatebonds.net/cbi/pub/data/bonds)
NAB IS COMMITTED TO THE RENEWABLES SECTOR AND HAS MADE A STRONG COMMITMENT TO ADDRESS THE ISSUE OF CLIMATE CHANGE
24-HOUR GLOBAL
operationsLiquidity provider Specialist
salesforce
Digital execution
LEADER IN AUSTRALIA / NZ FOR FX & RATES
FINANCING KEY TRANSPORTATION ASSETSENABLING GLOBAL TRADE
ENERGY LINKED VESSELS
INDUSTRIAL SHIPPING
AUSTRALIA’S #1 CAPITAL MARKETS BANK
#1 Securitisation House of the Year 7th Year in a row (2012, 2013, 2014, 2015, 2016, 2017 & 2018)1
#1 Australian Sustainability Debt House of the Year Only bank to have won the award since inception in 20172
#1 Australian Issuer Offshore Debt House of the Year (2016 & 2017)Only domestic bank to have won this prestigious award2
#1 US Private Placement House of the Year (2018)1
1. KangaNews Awards 2018; 2. KangaNews Awards 2017
FINANCIAL ADVISORYEQUITY CAPITAL MARKETS
DEBT ADVISORY
Real Estate Infrastructure Renewables
Diversified Corporates
Resources

NSW ECONOMIC REVIEW
AUTHORS:Gareth Spence, Senior Economist Tony Kelly, Senior Economist John Sharma, Economist Phin Ziebell, Economist
Photo Mai Thai

Falls in house prices accelerating up until March Qtr(more on this later)
Dwelling construction contracting sharply –apartments weakest
NAB and property industry professionals predict further declines
Business conditions have also fallen, possible stabilisation
Business conditions have eased from highs in 2017/2018
Retail and wholesale weakest
Consumption is being held back by low wage growth
SYDNEY HOUSE PRICES CONTRACTING STEEP DROP IN HOUSEBUILDING APPROVALSDec 2009 = 100
100
110
120
130
140
150
160
170
180
190
Feb-14 Feb-15 Feb-16 Feb-17 Feb-18 Feb-19
Dwellings
Houses
Units
0
5000
10000
15000
20000
25000
1987
1991
1995
1999
2003
2007
2011
2015
2019
ApprovalsCommencements
Number
FIRST, A LITTLE BIT OF NOT SO GOOD NEWS (MARCH QTR)
BUSINESS CONDITIONS DOWN FROM LAST YEAR BUT STABILISED IN MARCH NSW INDUSTRY – CONFIDENCE & CONDITIONS
Index –Mar Qtr’19
-20
-15
-10
-5
0
5
10
15
20
25
30
Ma
r-03
Ma
r-05
Ma
r-07
Ma
r-09
Ma
r-11
Ma
r-13
Ma
r-15
Ma
r-17
Ma
r-19
NSW
AUS
Index, trend
-30-25-20-15-10
-505
10152025 Conditions
Confidence
Sources: ABS; NSW Treasury, NAB Economics

UNEMPLOYMENT FAVOURABLE VS OTHER STATES VERY STRONG INFRASTRUCTURE PIPELINE
0.0
2.0
4.0
6.0
8.0
10.0
12.0
14.0
Other
Water/sewerage
Energy
Transport infrastructure
$Bn
HOWEVER, SUPPORT FOR GROWTH (MARCH QTR)
LOW UNEMPLOYMENT PROVIDES SUPPORT OFFICE MARKET FUNDAMENTALS REMAIN SOUND$000’s, LHS %ge - RHS
4
5
6
7
8
9
10
11
120
50
100
150
200
250
300
350
400
2006 2008 2010 2012 2014 2016 2018
Office approvals Office vacancies (rhs)
2
3
4
5
6
7
8
9
10
2001
2003
2005
2007
2009
2011
2013
2015
2017
2019
NSW
Greater Sydney
Rest of NSW
%ge
Sources: ABS; NSW Treasury, NAB Economics, OECD
Downside cushioned somewhat by a strong labour market
Commercial property looking much better than Residential
Labour market remains robust
Commercial property market in a healthy state
NSW compares favourably
Unemployment lowest of major states
0
2
4
6
8
NSW Vic. Qld SA WA Tas. NT ACT
Feb-18
Feb-19
80
90
100
110
120
130
140
150
160
170
180
2012 2014 2016 2018
NSW
Qld
Vic.Tas.
WASA
NT
ACT
HOUSING STILL UP OVER LONG TERM

NSW INFRASTRUCTURE PIPELINE

11
KEY INFRASTRUCTURE THEMES
PRIVATISATION & ASSET
RECYCLING
TRANSPORT FOCUSED PIPELINE
URBANISATION &
POPULATION GROWTH
EXPANDING INVESTMENT APPETITES
Popu
lati
on
(m)
$’b
20 22 24 26 28 30 32 34 36 38
Low Medium High
Up to 36 m people by
2040
0
5
10
15
20
25
30
35
NSW VIC OtherStates
Sydney Desalination Plant, Macquarie Generation, Port of Newcastle, Land &
Property Information, Endeavour Energy, NSW Ports, Ausgrid, TransGrid,
Westconnex Port of
Melbourne, VIC Land Titles
SA & WA Land Titles
12
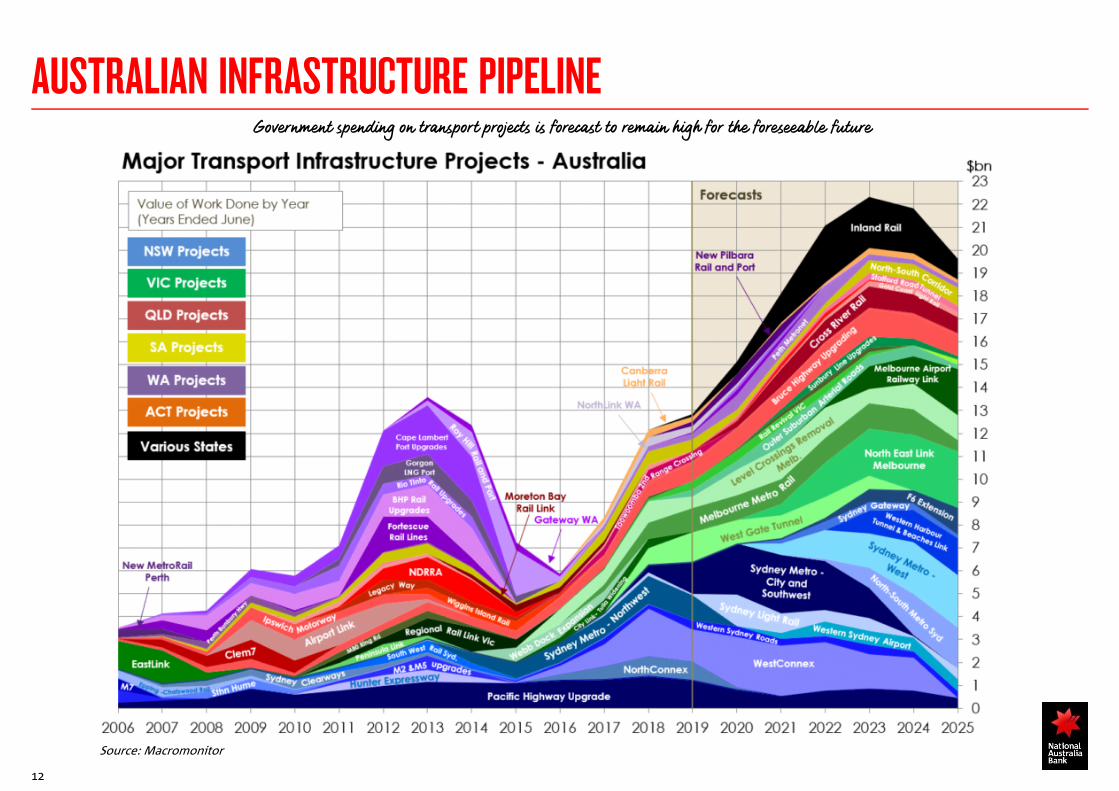
AUSTRALIAN INFRASTRUCTURE PIPELINEGovernment spending on transport projects is forecast to remain high for the foreseeable future
Source: Macromonitor

AUSTRALIA OUTLOOKSynopsis of market commentary from Kieran Davies, NAB Group Economics and Ray Attrill NAB Market Research

INTEREST RATES RBA
Uncertainty around consumer spending
Income in real terms stagnating
Real household wealth falling
Wage growth remains low and forward indicatorspoint to rising unemployment
However:
– Boost to incomes from lower interest rates and taxcuts... and
– House prices stabilising = lower drag on realwealth… but
– These take time to drive a recovery… and
– Global risks persist
Therefore, additional policy stimulus is expected
And, additional 25bp cut to the cash rate from the RBAby November, to 0.75%
Commonwealth focus on generating surplus remains arisk to the fiscal stimulus being forthcoming
Could lead to further rate cuts
Government has plenty of fire power
14
Source: NAB Group Economics, Australian Markets Weekly, 26 August 2019
Australia has significant capacity to use fiscal policy to support the economy
House prices have stabilised since June 2019
Note: Monthly prices were seasonally adjusted by NAB. The estimate for August 2019 is based on daily data for the month to date.
Source: Australian Bureau of Statistics, CoreLogic, National Australia Bank
Source: Australian Bureau of Statistics, Reinhart and Rogoff, Reserve Bank of Australia, various national statistical agencies, National Australia Bank
Significant fall in house prices
Stabilising period preceding growth

FOREIGN EXCHANGE AUD AUD volatility of late all about USD/CNY, though
commodity prices also weakening
RBA will need to do more than cut the Cash Rate to0.5% to further weaken AUD by its own hand
AUD/USD correlation to base metals index
AUD/KRW has sustained position well below 10 yearaverage level
NAB forecast is for this to continue on trend in band of800-825
15
AUD/USD vs. USD/CNY
AUD/USD vs. base metals
10yr average AUDKRW, LHS
Source: NAB Markets Research, Macrobond
Source: National Australia Bank, Macrobond
10yr AUD/KRW vs. USD/KRW
Source: NAB Markets Research, Bloomberg
AUDKRW, LHS
AUDUSD, RHS

FORECASTS FX and IR
16
Source: NAB Group Economics, Australian Markets Weekly, 26 August 2019

KEY CONTACTS

18
KOREA CONTACTS
• Based in Hong Kong, leads Corporate Coverage for NAB’s corporate relationships in Hong Kong and Korea• 14+ years’ banking and finance experience in Australia, Hong Kong, China and Korea• Broad range of experience across a wide range of corporate banking solutions including cross-border M&A, DCM, Markets, Trade
Finance, Cash Management
Michael Bradley, Head of Corporate Coverage, Hong Kong (includes Korea)E: [email protected] M: +852 6468 5540

IMPORTANT notice
19
Disclaimer: National Australia Bank Limited (ABN 12 004 044 937), its related bodies and any officer, employee, agent, adviser or contractor thereof (“NAB”) do not warrant or represent that the information, recommendations, opinions or conclusions contained in this document ("Information") is accurate, reliable, complete or current. The Information has been prepared for dissemination to professional investors for information purposes only and any statements as to past performance do not represent future performance. The Information does not purport to contain all matters relevant to any particular investment or financial instrument and all statements as to future matters are not guaranteed to be accurate. In all cases, anyone proposing to rely on or use the Information should independently verify and check the accuracy, completeness, reliability and suitability of the Information and should obtain independent and specific advice from appropriate professionals or experts. The Information is not intended as an offer or solicitation for the purchase or sale of any financial instrument.
This presentation is for discussion purposes only and may provide indicative terms and conditions which National Australia Bank may submit for credit approval to provide finance. The issue of these materials is not intended in any manner, and should not be interpreted as, representing or creating any offer of financing or the provision of any financial accommodation, or that financing will be available on these or any other terms. Any offer of finance is subject to satisfactory completion of National Australia Bank’s usual due diligence requirements and internal credit and pricing assessment processes. These materials are also provided subject to legal advice, financial modelling and all necessary financing documentation.
To the extent permissible by law, NAB shall not be liable for any errors, omissions, defects or misrepresentations in the Information or for any loss or damage suffered by persons who use or rely on such Information (including by reasons of negligence, negligent misstatement or otherwise). If any law prohibits the exclusion of such liability, NAB limits its liability to the re-supply of the Information, provided that such limitation is permitted by law and is fair and reasonable. NAB, its affiliates and employees may hold a position or act as a price maker in the financial instruments of any issuer discussed within this document or act as an underwriter, placement agent, adviser or lender to such issuer.
The Information is governed by, and is to be construed in accordance with, the laws in force in the State of Victoria, Australia, and any dispute or claim arising from, or in connection with, the Information is subject to the non-exclusive jurisdiction of the courts of that State.
Please be aware that any telephone calls to NAB may be recorded. If you would like more details regarding the privacy of your information at NAB, please visit the NAB website.
The Information contained within this presentation that has been prepared is confidential and must not be disclosed to third parties without NAB’s consent.
© 2019 National Australia Bank Limited ABN 12 004 044 937 AFSL and Australian Credit Licence 230686.