
Were rivers flowing across the Sahara during the last Interglacial? Implications for human migration...
12
Were Rivers Flowing across the Sahara During the Last Interglacial? Implications for Human Migration through Africa Tom J. Coulthard 1 *, Jorge A. Ramirez , Nick Barton , Mike Rogerson , Tim Bru 1 2 1 ¨ cher 3 1 Department of Geography, Environment and Earth Sciences, University of Hull, Hull United Kingdom, 2 Institute of Archaeology, University of Oxford, Oxford, United Kingdom, 3 Max-Planck-Institut fu ¨ r Meteorologie, Hamburg, Germany Abstract Human migration north through Africa is contentious. This paper uses a novel palaeohydrological and hydraulic modelling approach to test the hypothesis that under wetter climates c.100,000 years ago major river systems ran north across the Sahara to the Mediterranean, creating viable migration routes. We confirm that three of these now buried palaeo river systems could have been active at the key time of human migration across the Sahara. Unexpectedly, it is the most western of these three rivers, the Irharhar river, that represents the most likely route for human migration. The Irharhar river flows directly south to north, uniquely linking the mountain areas experiencing monsoon climates at these times to temperate Mediterranean environments where food and resources would have been abundant. The findings have major implications for our understanding of how humans migrated north through Africa, for the first time providing a quantitative perspective on the probabilities that these routes were viable for human habitation at these times. Citation: Coulthard TJ, Ramirez JA, Barton N, Rogerson M, Bru ¨ cher T (2013) Were Rivers Flowing across the Sahara During the Last Interglacial? Implications for Human Migration through Africa. PLoS ONE 8(9): e74834. doi:10.1371/journal.pone.0074834 Editor: Received May 20, 2013; Accepted August 5, 2013; Published September 11, 2013 Copyright: ß 2013 Coulthard et al. This is an open-access article distributed under the terms of the Creative Commons Attribution License, which permits unrestricted use, distribution, and reproduction in any medium, provided the original author and source are credited. Funding: The authors have no support or funding to report. Competing Interests: The authors have declared that no competing interests exist. * E-mail: [email protected] Introduction The role of the Sahara as a geographical filter and launch zone for dispersals of Homo sapiens out of Africa is a controversial topic [1,2,3,4]. At issue is the observation that 130-100,000 years ago there was a marked increase in humidity in the present desert and adjacent regions [5,6,7,8], which coincided with some of the earliest appearances of H. sapiens in both the Sahara and the Levant [9,10,11,12,13,14,15,16]. During MIS 5 (Marine Isotope Stage 5) [17], high insolation in the northern hemisphere caused the African monsoon to assume a position up to 1,000 km north of its location today [18,19,20,21]. Isotopic and geomorphic evidence suggests that rain falling on the north of the Trans-Saharan mountains then flowed towards the Mediterranean [2,22,23], potentially creating migration pathways via a series of ‘green corridors’ [4] and ‘mega lake corridors’ [24] across the Sahara. Dating of human fossils from the Levantine sites of Skhul and Qafzeh imply that early dispersals occurred along the eastern margins of the Sahara prior to ,100 ka [13,14,15], while other craniodental remains show that populations closely resembling those of the Near East were simultaneously present in north western Africa [9,16,18]. Given the combined dating uncertain- ties, many of these fossils and associated archaeological Middle Palaeolithic/Middle Stone Age finds are likely contemporary with the last interglacial period of peak humidity attested in marine cores [20,23] and stalagmites [6,25]. However, supporting evidence for the ‘green corridor’ hypoth- esis remains subjective. Aside from topographic analysis, there has been no quantitative hydrological assessment (i.e. calculation of fluxes and balances of water) that could test whether these freshwater pathways across the Sahara were physically possible during the Eemian (MIS 5e). Surface evidence of fossil river systems and dated lacustrine records show there has been water in the region, but this does not provide an effective quantitative view of when, where, or how much water was present in the wider landscape. Interpretation of the archaeological record is equally subjective, as although the general direction of dispersal (north- ward from sub-Saharan Africa) and its general timing (last interglacial) are clear, these data remain ambiguous between a single trans-Saharan migration with delayed subsequent expan- sion, multiple migrations via a single route or multiple migrations via multiple routes. The existing evidence is not sufficient to conclude whether contiguous ‘Green Corridors’ existed at the right time for migration. In this paper, for the first time, we simulate the balance and fluxes of water across this region. We use simulated precipitation from a state of the art Earth System Model (ESM) simulation of the Eemian (MIS 5e) climate to drive a combined hydrological and hydraulic model to reconstruct past rivers and flood events across 12,000,000 km 2 of North Africa. For the first time, this reveals the seasonal and spatial patterns of Saharan surface palaeohydrology, predicting the presence of distinct river corridors and wetlands [24,26]. Our simulations were carried out with the sole aim of testing the Green Corridor hypothesis; were contiguous corridors following surface water (i.e. rivers) really feasible during MIS 5e? Do all the buried rivers show the same history, or are there spatiotemporal differences? We achieve this by calculating a PLOS ONE | www.plosone.org 1 September 2013 | Volume 8 | Issue 9 | e74834 John P. Hart, New York State Museum, United States of America
Transcript of Were rivers flowing across the Sahara during the last Interglacial? Implications for human migration...

Were Rivers Flowing across the Sahara During the LastInterglacial? Implications for Human Migration throughAfricaTom J. Coulthard1*, Jorge A. Ramirez , Nick Barton , Mike Rogerson , Tim Bru1 2 1 ¨ cher3
1 Department of Geography, Environment and Earth Sciences, University of Hull, Hull United Kingdom, 2 Institute of Archaeology, University of Oxford, Oxford, United
Kingdom, 3 Max-Planck-Institut fur Meteorologie, Hamburg, Germany
Abstract
Human migration north through Africa is contentious. This paper uses a novel palaeohydrological and hydraulic modellingapproach to test the hypothesis that under wetter climates c.100,000 years ago major river systems ran north across theSahara to the Mediterranean, creating viable migration routes. We confirm that three of these now buried palaeo riversystems could have been active at the key time of human migration across the Sahara. Unexpectedly, it is the most westernof these three rivers, the Irharhar river, that represents the most likely route for human migration. The Irharhar river flowsdirectly south to north, uniquely linking the mountain areas experiencing monsoon climates at these times to temperateMediterranean environments where food and resources would have been abundant. The findings have major implicationsfor our understanding of how humans migrated north through Africa, for the first time providing a quantitative perspectiveon the probabilities that these routes were viable for human habitation at these times.
Citation: Coulthard TJ, Ramirez JA, Barton N, Rogerson M, Brucher T (2013) Were Rivers Flowing across the Sahara During the Last Interglacial? Implications forHuman Migration through Africa. PLoS ONE 8(9): e74834. doi:10.1371/journal.pone.0074834
Editor:
Received May 20, 2013; Accepted August 5, 2013; Published September 11, 2013
Copyright: � 2013 Coulthard et al. This is an open-access article distributed under the terms of the Creative Commons Attribution License, which permitsunrestricted use, distribution, and reproduction in any medium, provided the original author and source are credited.
Funding: The authors have no support or funding to report.
Competing Interests: The authors have declared that no competing interests exist.
* E-mail: [email protected]
Introduction
The role of the Sahara as a geographical filter and launch zone
for dispersals of Homo sapiens out of Africa is a controversial topic
[1,2,3,4]. At issue is the observation that 130-100,000 years ago
there was a marked increase in humidity in the present desert and
adjacent regions [5,6,7,8], which coincided with some of the
earliest appearances of H. sapiens in both the Sahara and the
Levant [9,10,11,12,13,14,15,16]. During MIS 5 (Marine Isotope
Stage 5) [17], high insolation in the northern hemisphere caused
the African monsoon to assume a position up to 1,000 km north of
its location today [18,19,20,21]. Isotopic and geomorphic evidence
suggests that rain falling on the north of the Trans-Saharan
mountains then flowed towards the Mediterranean [2,22,23],
potentially creating migration pathways via a series of ‘green
corridors’ [4] and ‘mega lake corridors’ [24] across the Sahara.
Dating of human fossils from the Levantine sites of Skhul and
Qafzeh imply that early dispersals occurred along the eastern
margins of the Sahara prior to ,100 ka [13,14,15], while other
craniodental remains show that populations closely resembling
those of the Near East were simultaneously present in north
western Africa [9,16,18]. Given the combined dating uncertain-
ties, many of these fossils and associated archaeological Middle
Palaeolithic/Middle Stone Age finds are likely contemporary with
the last interglacial period of peak humidity attested in marine
cores [20,23] and stalagmites [6,25].
However, supporting evidence for the ‘green corridor’ hypoth-
esis remains subjective. Aside from topographic analysis, there has
been no quantitative hydrological assessment (i.e. calculation of
fluxes and balances of water) that could test whether these
freshwater pathways across the Sahara were physically possible
during the Eemian (MIS 5e). Surface evidence of fossil river
systems and dated lacustrine records show there has been water in
the region, but this does not provide an effective quantitative view
of when, where, or how much water was present in the wider
landscape. Interpretation of the archaeological record is equally
subjective, as although the general direction of dispersal (north-
ward from sub-Saharan Africa) and its general timing (last
interglacial) are clear, these data remain ambiguous between a
single trans-Saharan migration with delayed subsequent expan-
sion, multiple migrations via a single route or multiple migrations
via multiple routes. The existing evidence is not sufficient to
conclude whether contiguous ‘Green Corridors’ existed at the
right time for migration.
In this paper, for the first time, we simulate the balance and
fluxes of water across this region. We use simulated precipitation
from a state of the art Earth System Model (ESM) simulation of
the Eemian (MIS 5e) climate to drive a combined hydrological and
hydraulic model to reconstruct past rivers and flood events across
12,000,000 km2 of North Africa. For the first time, this reveals the
seasonal and spatial patterns of Saharan surface palaeohydrology,
predicting the presence of distinct river corridors and wetlands
[24,26]. Our simulations were carried out with the sole aim of
testing the Green Corridor hypothesis; were contiguous corridors
following surface water (i.e. rivers) really feasible during MIS 5e?
Do all the buried rivers show the same history, or are there
spatiotemporal differences? We achieve this by calculating a
PLOS ONE | www.plosone.org 1 September 2013 | Volume 8 | Issue 9 | e74834
John P. Hart, New York State Museum, United States of America

probability of surface water routes across the Sahara as a basis for
further investigation.
Methods
Rainfall data of a palaeoclimatic simulation (124–125 ka) are
taken from an experiment with the coupled atmosphere-ocean-sea
ice-biosphere general circulation model (ECHAM5/JSBACH/
MPI-OM) [27].This simulation provides a series of realistic
scenarios in which the African monsoon sits c.700 km further
north than at present [20] (see materials and methods section
‘Generating precipitation data’). The good performance of the
ECHAM5 model is shown by its predictions for pre-industrial
precipitation that can be compared to gauged data (see materials
and methods section ‘Validation and Calibration’). For the period
125–124 ka BP a 25 year snapshot is taken with a sequence of 12
Figure1. Palaeorainfall used to drive the combined numerical model. Yearly average rainfall from a 25 year snapshot of an ESM experimentand catchment area (hatched region) as well as the time series of zonally averaged precipitation for two stripes south of the catchment highlightingthe (i) South-North gradient of rainfall during the wet seasons (June to September) and (ii) the modelled year to year variability of the monsoonsystem. The data is drawn from 12 hourly precipitation data produced during a time-slice experiment [27] of the last Interglacial (MIS 5e, ,124 ka BP)performed by the fully coupled atmosphere-ocean- sea ice-biosphere general circulation model of the Max-Planck-Institute for Meteorology. The ESMconsists of the spectral atmosphere model ECHAM5 [43] including the land surface model JSBACH [44] and a dynamic vegetation module [65]coupled to the general circulation ocean model MPIOM [45]. The model runs for the atmosphere at a truncation T31, which corresponds to ahorizontal resolution of ,300 km in the area under investigation.doi:10.1371/journal.pone.0074834.g001
Rivers across the Sahara and Human Migration
PLOS ONE | www.plosone.org 2 September 2013 | Volume 8 | Issue 9 | e74834

hourly, gridded data (3.75o x 3.75o) across North Africa (Fig. 1).
The northern edge of the MIS 5e monsoon spans the Ahaggar and
Tibesti Mountains that are major topographic features covering a
linear distance of ,2500 km and including Southern Algeria,
Southern Libya and Northern Chad with a maximum elevation of
2500 m. Previous spatial analysis of the regional topography [2]
has shown there are major watersheds that are dry today but
which would drain north from these mountains towards the
Mediterranean. Satellite imagery reveals traces of major river
channels linked to these watersheds, now partially buried under
sand dune deposits [2,22,28]. Using a 1 km resolution digital
elevation model (DEM) based on resampled GMTED 2010
topographic data (vertical accuracy RMSE 26–30 m) [29] the
watersheds draining North from Ahaggar and Tibesti were
delineated (see materials and methods section ‘Issues with the
DEM’), excluding areas draining into the Nile basin to the East
and the Senegal and Niger basins to the west. This area is shown
as the shaded area in Figure 1 and is the focus of this study. The
DEM is therefore based upon the present day topography though
as sea level was up to 20 m higher during the earliest millennia of
MIS 5e when our experiments are set [30], we adjusted the DEM
by subtracting 20 m from all elevations, and redefined the
coastline along newly submerged locations.
Simulated rainfall data at 12 hour resolution were fed into a
hydrological model [31] for each climatic grid cell which
generated surface runoff across the 1 km DEM at 1 min
resolution. Surface runoff was routed across this DEM using a
2d hydrodynamic flow model based on the Lisflood-acc model
[32], (see material and methods section ‘Hydraulic Model’). As our
aim was to test the viability of fluvial corridors, and for model
parsimony, groundwater recharge was not simulated, though we
acknowledge that there is evidence for palaeolakes in the region
that were ground water fed [33] and these lakes could have formed
part of a migratory route [2,26]. A series of 25 year simulations
were carried out with high, medium and low infiltration/
evaporation rates (1.5, 3 and 6 m yr21) [34,35,36] and for every
model time step water was also removed from grid cells to account
for evaporation and infiltration. Hydrological model outputs were
plotted as probabilities of surface water being present at a location
varying between 0 and 1. These were determined by recording
daily outputs of water depths and summing over a 25 year
simulation period the number of days where water depths greater
than 0.1 m were present. The use of 1 km grid cells imposes
limitations as all river channels must be a minimum of 1 km wide
resulting in excessive channel width/depth ratios under lower flow
conditions. This, along with no groundwater recharge, leads to an
underestimation of cell flow depths and thus a poorer drainage
network connectivity/delineation as well as an over estimate of
water loss from infiltration/evaporation due to too large water
surface/channel bed areas. This conservative model configuration
gives us a far higher confidence in our results as it reduces the
possibility of overestimating inundation timing and extents.
Figure 2. Simulated probability of surface water during the last interglacial. This figure details Archaeological sites, and an annualprobability that a location has surface water. The archaeological data are derived from a number of sources (including [42,66,67,68]. The findspots arecharacterised by Aterian and Middle Stone Age artefacts such as bifacial foliates and stemmed Aterian points and/or typical ‘Mousterian’ points, sidescrapers and Levallois technology. Most are represented by surface scatters but where stratified examples exist these can be shown by dating (OSLand U-series techniques) and geomorphological setting to belong within MIS 5e [41,42].doi:10.1371/journal.pone.0074834.g002
Rivers across the Sahara and Human Migration
PLOS ONE | www.plosone.org 3 September 2013 | Volume 8 | Issue 9 | e74834

Additional shorter runs were used to test model sensitivity to
altering hydrology and rainfall rates and to demonstrate the
model’s validity. Further validation of the palaeohydrology
modelling method is provided in materials and methods section
‘‘Validation and Calibration’’.
Results
Figure 2 demonstrates the existence of a series of extensive
ephemeral and perennial river systems draining North from the
Ahaggar and Tibesti mountains across the Sahara to the
Mediterranean during the period 125–124 ka BP. Some channels
Figure 3. Seasonal flow of surface water across the Sahara during the last interglacial. Monthly probability of surface water being presentfor (a) August, (b) September, (c) October and (d) November. These illustrate the hydrodynamics of the system simulated by the large scale 2dhydraulic model that routes a flood wave of water north across the desert from the mountains.doi:10.1371/journal.pone.0074834.g003
Rivers across the Sahara and Human Migration
PLOS ONE | www.plosone.org 4 September 2013 | Volume 8 | Issue 9 | e74834

dissipate in the desert, but some converge forming three main
systems; in the West the Irharhar river draining into the Chott
Melrir basin, and to the East two larger systems named the Sahabi
and the Kufrah (Fig. 2). As the rainfall is associated with the
monsoon, flow is highly seasonal and the Irharhar river is
ephemeral, flowing for ,3 months. The Sahabi and Kufrah
systems are close to perennial, due to larger contributing areas in
the catchment headwaters located in the monsoon belt (Fig. 1).
Figure 3 demonstrates the seasonality of flow in all three systems
with precipitation in August taking over two months to reach the
coast or near-coastal lake systems. The distinct climatic zoning
(Fig. 1) means all three rivers are allogenic, losing water along their
length with little or no hydrological contribution once they leave
the mountains/uplands. In addition to rivers, the simulations
predict massive lagoons and wetlands in NE Libya some of which
are extensive (.70,000 km2). These are also fed from the Jebel
Akhdar in Cyrenaica, which also received higher rainfall during
this period. There are smaller lakes forming in Tunisia and Algeria
due to water supplied via the Irharhar river system.
Figure 2 and 3 present results from the conservative medium
evaporation/infiltration scenarios, and are based on all 25 years of
simulated hydrology - as rainfall within the ESM varies year to
year. Simulations with higher evaporation/infiltration rates (6 m
yr21) gave the same drainage network but with lower probabilities.
Simulations giving rise to wetter (1.5 m yr 21 evaporation/
infiltration) conditions increased the longevity of a channel’s
wetness but did not introduce any new major water courses, nor
significantly increase the wetted area or size of any lake systems.
Discussion
This study provides the first strong quantitative evidence for the
presence of three major river systems flowing across the Sahara
during MIS 5e. We simulated three river systems that are now
largely buried by dune systems, but when flowing would have
provided fertile habitats for flora and fauna in proximity to the
channels [22]. Notably, the Sahabi and Kufrah would be major
river systems with monsoon discharges significantly in excess of
2500 m3 s21 and an extensive system of anabranches and
wetlands. In the Libyan Kalanschiou region, the green corridor
would have been 100 km wide, substantial and largely perennial.
This reconstruction is highly compatible with evidence of
widespread palaeosols deposited on the margins of this system
during the less pronounced Holocene humid period [22]. Here we
have simulated one wet phase, but this research strongly supports
the occurrence of similar ‘Green Saharas’ recorded in the marine
[37] and terrestrial [26] archive.
Our simulation results quantitatively confirm previous hypoth-
eses of these rivers shown in geomorphic and geochemical data
[2,4,22,23,24]. For example, the radio-isotopic composition of the
water identified in the Ionian Sea [4,38] indicates that it was
precipitated in the basaltic trans-Saharan range in Southern Libya
as shown by our results. Runoff flowing rapidly to the coast, in a
manner highly comparable to our simulated runoff waves, is
shown by the light oxygen isotopic composition of the water
flowing into the Mediterranean at this time [20]. Furthermore, the
river systems that our research simulates are consistent with the
well-preserved drainage network that has been identified in these
regions by fieldwork and from satellite imagery [22,24]. Overall,
our confirmation that these hypotheses are physically realistic
allows us to move on to questions of how and when the rivers
operated, rather than their existence.
Figure 4. Combined model structure. Schematic of how the modelling sections combine to provide hydrological reconstructions of North Africasurface water.doi:10.1371/journal.pone.0074834.g004
Figure 5. Gridding of observered and ESM simulated precip-itation. DEM of the Nile, upstream from Aswan, showing grid ofdifferent observed rainfall values (a) and grid of pre-industrial ESMprecipitation values (b).doi:10.1371/journal.pone.0074834.g005
Rivers across the Sahara and Human Migration
PLOS ONE | www.plosone.org 5 September 2013 | Volume 8 | Issue 9 | e74834
Whilst we cannot state for certain that humans migrated
alongside these rivers, the shape of the drainage systems indicate
that anyone moving from south to north from a 2000 km wide
region in the mountains would be funnelled into three clear routes.
There is also a clear geographical split, with a 2000 km gap
between the destinations of Irharhar and the combined Sahabi
and Kufrah systems.
Despite being ephemeral, the Irharhar river corridor could be
the most suitable for dispersal of hominids beyond the Sahara.
Uniquely, the Irharhar extends from humid to humid climes -
ranging from the monsoonal Ahaggar and Tibesti region to the
North Western Mediterranean climate zone that also received
substantial winter rainfall (Fig. 1). High humidity in the destination
region during the last interglacial is confirmed by the presence of
significant water near the Chott Melrir basin [39]. Whilst the more
extensive Sahabi and Kufrah also traverse the Sahara, their
downstream limits remain within the arid/semi-arid regions [40].
Support for the significance of the Irharhar river corridor is
provided by the high number of Middle Stone Age archaeological
sites concentrated in the western region (Fig. 2). Many of these
locations contain Levallois lithic artefacts with Aterian affinities
that on comparative grounds can be plausibly dated to the last
Interglacial [41,42]. It is highly likely given the existing artefact
distributions that humans migrated northwards from the relatively
humid Trans-Saharan mountainous zones to the Maghrebian
Mediterranean biome (Fig. 2). The loose clustering of sites along
our simulated Irharhar river and associated channels implies this
as a preferred route of dispersal. Furthermore, as the simulations
are driven by present day topography, if the dune systems in this
region were removed or reconfigured the Irharhar could flow
further to the West. In contrast, the eastern region has a surprising
lack of archaeological evidence despite the extensive simulated
palaeo-river courses. It is likely that further surveys in this area will
provide substantial evidence of Middle Stone Age activity,
especially in the areas of buried palaeochannels. However,
continued absence of this critical evidence of human migration
would confirm our suggestion that a key factor in the western
distribution of sites was the attractiveness of the richer Mediter-
ranean-type environments of the Maghreb, which would have
promoted permanent settlement in the region and further transit
in both directions along the Irharhar river corridor.
Conclusions
For the first time, our simulations demonstrate that Saharan
‘‘Humid Corridors’’ were highly likely during the last interglacial
strongly re-affirming the viability of these routes as migratory
corridors for early hominids. This research provides an unprec-
edented means of developing new hypotheses for past human,
faunal and floral activity in this region and for validating the
performance of palaeo climate simulations.
Materials and Methods
Overview of methodology for simulating surface palaeohydrology in North Africa
This section describes the numerical modelling procedure and
set up for simulating the palaeohydrology of North Africa. The
methodology follows the structure outlined in Figure 4 with three
numerical models working together: The Earth System Model
(ESM) develops precipitation patterns that are then used as an
input for catchment hydrological modelling and finally a
hydrodynamic flow model to simulate patterns of surface
inundation. Each section from this will be discussed in the
following sections along with sections detailing calibration and
testing of the model, and preparation of the DEM.
Generating precipitation data from the ESM: Modelconfiguration and experimental setup
The ESM used in this study is the Max Planck Institute coupled
atmosphere/ocean general circulation model. It consists of the
spectral atmospheric component ECHAM5 [43] running at
truncation T31 (approximately 3.756) and a vertical resolution
of 19 levels up to 10 hPa. The underlying land component
includes a dynamical land surface scheme (JSBACH, [44]) running
on the same grid. The Ocean model MPI-OM [45] operates at
resolution GR30 (app. 36) with 40 vertical levels (30 levels within
the top 2000 m). A dynamic-thermodynamic Hibler-type model
simulates sea-ice [46]. The coupling between atmosphere and
ocean is done by OASIS [47] on a daily basis without any flux
correction [48] which leads to a more realistic heat transport in the
ocean than flux-corrected models. Momentum, heat, and fresh-
water fluxes are transferred from the atmosphere to the ocean,
while sea surface temperature, sea ice thickness and fraction, snow
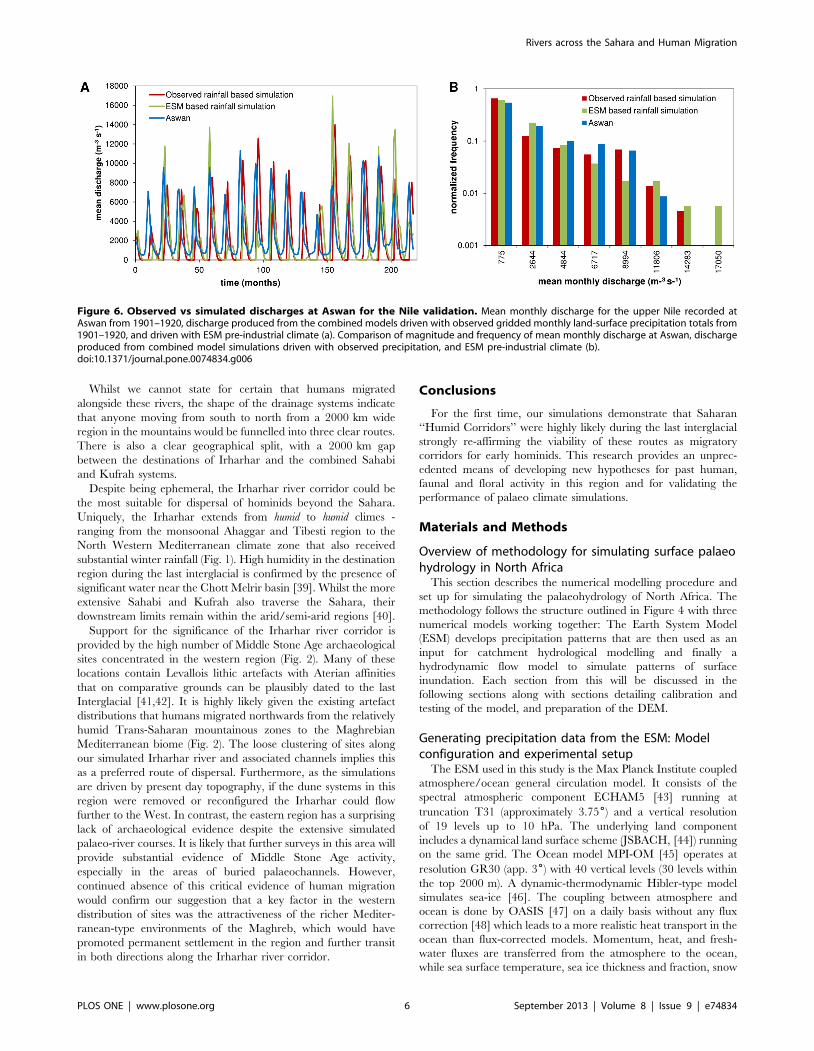
Figure 6. Observed vs simulated discharges at Aswan for the Nile validation. Mean monthly discharge for the upper Nile recorded atAswan from 1901–1920, discharge produced from the combined models driven with observed gridded monthly land-surface precipitation totals from1901–1920, and driven with ESM pre-industrial climate (a). Comparison of magnitude and frequency of mean monthly discharge at Aswan, dischargeproduced from combined model simulations driven with observed precipitation, and ESM pre-industrial climate (b).doi:10.1371/journal.pone.0074834.g006
Rivers across the Sahara and Human Migration
PLOS ONE | www.plosone.org 6 September 2013 | Volume 8 | Issue 9 | e74834

cover on sea ice, and surface velocities are returned from the ocean
to the atmosphere. Freshwater fluxes from land to the ocean are
calculated by a simple river run-off scheme [49,50].
The integration time step of ECHAM5 at a resolution of T31 is
20 min, MPI-OM has a time step of 2.4h at GR30 resolution. For
the atmospheric component of the ESM, six hourly values are
written out during the simulation. 12 hr sums of precipitation
(convective plus large scale precipitation and snow fall) are the
underlying data used in our investigation.
Results out of two different transient experiments based on the
same model version are used in this study: a transient simulation of
MIS 5e (125 ka BP) and a transient simulation starting at 6 ka BP
until pre industrial climate [27,51]. Both simulations follow the
same spin-up procedure to create starting conditions for the
experiment. By integrating the control run (assumed to be in
equilibrium with pre-industrial boundary conditions) for a further
2500 model years the orbital parameters are changed accordingly
[52]. Our investigation is based on MIS 5e data after a further
1000 years of integration (125 ka BP conditions) and for
preindustrial climate the last 50 years of the 6000 yr transient
simulation are taken (0 ka BP). All experiments do not vary
atmospheric greenhouse gases and are prescribed as constant
(CO2 to 280 ppm, CH4 to 700 ppb, N2O to 265 ppb).
Hydrological model: TOPMODELThe precipitation output from the ESM (section above) is used
to drive the hydrological model. This is a modification of
TOPMODEL [31] and is used to generate a combined surface
and sub-surface discharge (Qtot ) for all cells. This is calculated
according to equation 1, where T is the time step (in seconds), r the
rainfall rate (in m21hr21) and m is a parameter that controls the
rise and fall of the soil moisture store (jt ) that is calculated from the
value of jt in the previous iteration (jt{1 ). m can be derived from
the recession curve of the flood hydrograph [53].
Qtot~m
Tlog
r{jtð Þzjt exprT
m
� �
r
0BB@
1CCA
jt~r
r{jt{1
jt{1exp
0{rð ÞTm
� �z1
� �� �ð1Þ
Figure 7. Pre-industrial precipitation patterns from the MPI-ESM. Yearly average rainfall from a 50 year snapshot of the MPI-ESM experimentof pre-industrial climate, (280 ppm CO2 out of a transient simulation).doi:10.1371/journal.pone.0074834.g007
Rivers across the Sahara and Human Migration
PLOS ONE | www.plosone.org 7 September 2013 | Volume 8 | Issue 9 | e74834

If there is no precipitation (r = 0) then equation 2 is used.
Qtot~m
Tlog 1z
jtT
m
� �� �
jt~jt{1
1zjt{1T
m
� � ð2Þ
Equations 1 and 2 are calculated for each Digital Elevation
Model (DEM) cell (1 km resolution) within the larger cells that
contain the precipitation data from the ESM. This provides a Qtot
for every cell within the study area – that varies according to the
precipitation amount falling within that cell. Qtot is then converted
into a flow depth and then routed according to the hydraulic
model outlined below.
Hydraulic model: The LISFLOOD-FP flow modelLISFLOOD-FP is a one dimensional inertial model that is
applied in the x and y directions to simulate two dimensional flow
over a raster grid. The method is first order in space and explicit in
time, but uses a semi implicit treatment for the friction term to aid
stability (See [32]) To calculate the flow (Q) between cells equation
3 [32] is used:
Figure 8. Comparison between observed and ESM simulated rainfall for pre-industrial scenario. Comparison between observed rainfall(maps on left) and pre-industrial ESM (maps on right). ESM cells overlaying the upper Nile catchment were selected and mean monthly totals werecalculated for a 50 year time series. Mean monthly totals for observed rainfall cells were calculated for cells of the catchment from the time period1901–1920. To resolve differences in spatial resolution between both datasets, (Figure 5a,b), the centroids of observed and ESM data were chosen tointerpolate mean monthly rainfall using a spline technique, at 10,000 m resolution.doi:10.1371/journal.pone.0074834.g008
Rivers across the Sahara and Human Migration
PLOS ONE | www.plosone.org 8 September 2013 | Volume 8 | Issue 9 | e74834

Q~q{ghflowDt
D hzzð ÞDx
1zghflowDtn2qt=h10=3flow
ð3Þ
Here q is the flux between cells from the previous iteration
(m2s21), g is acceleration due to gravity (ms21), n is Manning’s
roughness coefficient (m1/3s21), h is depth (m), z is elevation (m),
hflow is the maximum depth of flow between cells, x is the grid cell
width (m), t is time (s) and i and j are cell co-ordinates. Having
established the discharge across all four boundaries of a cell, the
cell water depth (h) is updated using equation 4:
Dhi,j
Dt{
Qi{1,jx {Qi,j
x zQi,j{1y {Qi,j
y
Dx2ð4Þ
The final part of the LISFLOOD-FP formulation is the time
step (t) that is controlled by the shallow water CFL condition as
equation (3) is a true shallow water model:
Dtmax~aDxffiffiffiffiffi
ghp ð5Þ
Where a is a coefficient typically defined between 0.3 and 0.7
[32]. This term is required to maintain numerical stability in all
circumstances. As equation 3 demonstrates this is strongly
influenced by the grid cell size and the water depth.
LISFLOOD-FP has been extensively tested and compared to
other flow models in benchmarking studies [54], and the stability
of the original [32] numerical solution at low friction (n , 0.03)
has been substantially improved by [32,54,55]. The new version of
the model used in this analysis is capable of simulating flow depths
and velocities within 10% of a range of industry full shallow water
codes [54]. The advantage of using LISFLOOD-FP compared to
an explicit full shallow water model is that it is considerably faster
and consumes less computation power. Lisflood-FP has also been
used to simulate inundation extent, water depth, and, wave
propagation for very large rivers including the Amazon [56], Niger
[57], and Ob [58]. In this study, the TOPMODEL hydrological
and LISFLOOD-FP hydraulic model are combined within the
CAESAR-Lisflood model framework [59].To account for water
losses, water depths are subtracted from each grid cell every
simulated day according to a combined evaporation/infiltration
rate. This parameter is applied globally even though evaporation
and in particular infiltration will vary spatially and across different
regions modelled here. However, as this study aims to test a
hypothesis rather than generate precise volumes of water
delivered, we feel it is important to use (overly high) pessimistic
evaporation/infiltration rates to avoid ‘‘positive errors’’ (e.g. river
reaches coast) arising from application of an incorrect infiltration
in a specific, remote and therefore poorly known location. In this
way, we can be confident that surface water was likely to be at least
as widespread as our model outputs show, and ‘‘false positive’’
responses from the model are suppressed.
Validation and Calibration of surface palaeo hydrologymodels
Validating this modelling approach was important for two
reasons; firstly, to show that the combined hydrological/hydraulic
model was performing correctly; and secondly to evaluate the
performance of the ESM by checking outputs from pre-industrial
ESM simulations. This could be carried out by comparing
simulated to measured river flow records on a catchment driven
by measured (rain gauge) and simulated (ESM) precipitation data.
Figure 9. SRTM DEM data voids in the study area. Areas of STRM voids within the study area, showing insets used in Figure 10.doi:10.1371/journal.pone.0074834.g009
Rivers across the Sahara and Human Migration
PLOS ONE | www.plosone.org 9 September 2013 | Volume 8 | Issue 9 | e74834

However, it was difficult to find a river system of suitable size
and similar climate that contained a gauged record of both rainfall
and discharge in order to validate and calibrate the model. We
chose to validate and calibrate the combined models on the upper
Nile before the construction of the main dams (1900–1920). For
this period monthly rainfall gridded across the basin [60], and
discharge data (at Aswan) were available [61]. The Nile has its
hydrological idiosyncraticies – and despite most of its discharge
originating from the Blue Nile, it still represents a very large
seasonal river that flows across a substantial dry area involving
significant water losses.
A 1 km DEM was created by resampling and conditioning the
GMTED 2010 DEM product (for more discussion see the material
and methods section ‘issues with DEM’) and the measured
monthly rainfall totals for the 68 grid cells were used as the input
to the hydrological model (Figure 5a). Simulations were performed
both using precipitation input from an instrumental (rain gauge)
dataset (monthly totals) and also using the pre-industrial output of
MPI-ESM (12 hour totals). Monthly discharges were then
recorded and compared to the gauged record at Aswan. The
evaporation/infiltration term (section 3 above) was used to
calibrate model outputs and a value of 0.015 m day was found
to give the best fit to the observed data. This is shown in Figure 6a
by the red line, where blue corresponds to the gauged record. It is
worth noting that some uncertainty surrounds the gauged record
as it is based on release and fill records at the first Aswan dam [61].
Using the calibrated evaporation/infiltration term, the hydro-
logical/hydraulic model was run using rainfall data from the ESM
for a pre-industrial scenario (Figure 7). Outputs from this
simulation are shown by the green line in Figure 6a. Clearly we
cannot expect as good a match as from the recorded rainfall data –
as the ESM simulated rainfall will not have the same patterns of
wetter or drier years etc. Therefore, to provide a more meaningful
validation we have plotted a histogram of monthly discharges for
both simulations and the observed data (Figure 6b). This shows an
excellent match between the discharges recorded at Aswan and
simulated discharges using observed rainfall (x2 = 48, p = 1) and
ESM rainfall (x2 = 48, p = 0.06), giving us a high degree of
confidence in the performance of both the ESM and the
hydrological/hydraulic models. Further comparison between the
ESM and observed rainfall record is shown in Figure 8. The ability
of the ESM to predict pre-industrial distributions of precipitation is
clearly demonstrated.
We emphasise that differences do occur under low flow
scenarios between the simulated and observed data. This reflects
the conservative nature of the model described above, which
Figure 10. Erroneously filled voids in STRM data. Elevation values from void filled SRTM v4 and GMTED 2010 data. Examples of large errors inelevation values are circled.doi:10.1371/journal.pone.0074834.g010
Rivers across the Sahara and Human Migration
PLOS ONE | www.plosone.org 10 September 2013 | Volume 8 | Issue 9 | e74834

results in rivers that should have very low flow being represented
as dry. From the perspective of freshwater routing across North
Africa these differences are negligible; almost all of the freshwater
transport occurs during the flood phase which we resolve
extremely well. Resolution of this ‘‘low flow’’ issue would require
simulation of groundwater recharge, and given that we already
simulate the annual flux values very well this is considered beyond
the scope of this study.
Issues with the DEMTo represent the surface within our model, we first considered
the 90 m resolution SRTM v1 elevation data. However, the
catchment modelled in this study has a far from complete coverage
from the SRTM with 7% of the catchment area occupied by voids
where no data were collected (Figure 9). Efforts have been made to
fill these voids with auxiliary elevation data [62] to produce a
finished elevation data product (SRTM v3 or v4) that is widely
available for download. These SRTM v3/v4 data were used in
previous studies delineating possible drainage patterns in North
Africa [2,26]. However, we chose not to use these data as the
auxiliary data used to fill voids in SRTM v3/v4 for North Africa
has considerable limitations. Post processed SRTM v3 or v4 data
contains large vertical errors (+/–160 m) where voids have been
filled [63], rendering it unacceptable for use within a flow model.
This error is sufficiently pronounced to be apparent through a
visual inspection of the SRTM v4 DEM, where patches of
elevation discontinuities are apparent when compared to sur-
rounding elevations (Figure 10). Clearly erroneous, such major
discontinuities can have a major impact on the basic flow
accumulation analysis used to delineate stream networks – let
alone more sophisticated hydraulic modelling methods we use
here.
For this reason, we decided that the SRTM v3 or v4 data were
unsuitable as we required a representation of the topography that
was not interrupted by erroneous void filling. An alternative to the
SRTM v3 or v4 data is the Global Multi-resolution Terrain
Elevation Data 2010, [29] that where available uses SRTM data,
and augments this with SPOT 5 Reference3D elevations to fill
voids in the SRTM. GMTED 2010 represents a significant
improvement over previous efforts to fill voids in SRTM data
because the vertical error of the SPOT 5 Reference3D data is +/–
10 m [64] (an order of magnitude smaller than SRTM v3 or v4).
The difference this makes is apparent by comparing the GMTED
2010 to the SRTM v4 in Figure 10. The huge artefacts in the
DEM that are present in the SRTM v4, with a maximum area of
3300 km2, are not present in the GMTED 2010 data.
Therefore, for this study we used the GMTED 2010 (250 m
spatial resolution) data that was re-sampled to 1000 m and stored
as float elevation values. The resulting DEM was filled and large
sinks representing natural depression were preserved in the DEM.
(e.g. Qattara Depression). A drainage network was calculated
using a D8 flow routing algorithm and a 1 m wide, 1 m deep
drainage network was burned into the DEM, to reflect sub-grid
scale river channel networks known to exist throughout the region
[28]. To account for a higher sea level at 125 ka BP, we adjust the
DEM by subtracting 20 m from all elevations, and redefined the
coastline along newly submerged locations.
Author Contributions
Conceived and designed the experiments: TC MR JR. Performed the
experiments: TC JR. Analyzed the data: JR TC MR NB TB. Contributed
reagents/materials/analysis tools: TC JR NB MR TB. Wrote the paper:
TC JR NB MR TB.
References
1. Castaneda IS, Mulitza S, Schefuss E, dos Santos RAL, Damste JSS, et al. (2009)
Wet phases in the Sahara/Sahel region and human migration patterns in North
Africa. Proceedings of the National Academy of Sciences of the United States of
America 106: 20159–20163.
2. Drake NA, Blench RM, Armitage SJ, Bristow CS, White KH (2011) Ancient
watercourses and biogeography of the Sahara explain the peopling of the desert.
Proceedings of the National Academy of Sciences of the United States of
America 108: 458–462.
3. Lahr MM, Foley R (1994) Multiple dispersals and modern human origins.
Evolutionary Anthropology 3: 48–60.
4. Osborne A, Vance D, Rohling E, Barton N, Rogerson M, et al. (2008) A humid
corridor across the Sahara for the migration of early modern humans out of
Africa 120,000 years ago. Proceedings of the National Academy of Sciences of
the United States of America 105: 16444–16447.
5. Bar-Matthews M, Ayalon A, Gilmour M, Matthews A, Hawkesworth CJ (2003)
Sea-land oxygen isotopic relationships from planktonic foraminifera and
speleothems in the Eastern Mediterranean region and their implication for
paleorainfall during interglacial intervals. Geochimica et Cosmochimica Acta
67: 3181–3199.
6. Burns SJ, Fleitmann D, Matter A, Neff U, Mangini A (2001) Speleothem
evidence from Oman for continental pluvial events during interglacial periods.
Geology 29: 623–626.
7. Smith JR, Giegengack R, Schwarcz HP (2004) Constraints on Pleistocene
pluvial climates through stable-isotope analysis of fossil-spring tufas and
associated gastropods, Kharga Oasis, Egypt. Palaeogeography Palaeoclimatol-
ogy Palaeoecology 206: 157–175.
8. Tzedakis PC, Frogley MR, Heaton THE (2003) Last Interglacial conditions in
southern Europe: evidence from Ioannina, northwest Greece. Global and
Planetary Change 36: 157–170.
9. Bailey SE, Hublin JJ (2007) Do Qafzeh and Skhul represent the ancestors of
Upper Paleolithic modern humans? A dental perspective. American Journal of
Physical Anthropology: 67–67.
10. Crevecoeur I, Rougier H, Grine F, Froment A (2009) Modern human cranial
diversity in the late Pleistocene of Africa and Eurasia: Evidence from Nazlet
Khater, Pestera cu Oase, and Hofmeyr. American Journal of Physical
Anthropology 140: 347–358.
11. DeMenocal PB (1995) Plio-Pleistocene African climate. Science 270: 53.
12. Forster P (2004) Ice Ages and the mitochondrial DNA chronology of human
dispersals: a review. Philosophical Transactions of the Royal Society of London
Series B-Biological Sciences 359: 255–264.
13. Grun R, Stringer CB (1991) Electron-spin-resonance dating and the evolution of
modern humans. Archaeometry 33: 153–199.
14. Shea JJ, Bar-Yosef O (2005) Who were the Skhul/Qafzeh people? An
archaeological perspectiveon Eurasia’s oldest modern humans. Journal of the
Israel Prehistoric Society 35: 451–468.
15. Valladas H, Reyss JL, Joron JL, Valladas G, Baryosef O, et al. (1988) Thermo-
luminescence dating of Mousterian Proto-Cro-Magnon remains from Israel and
the origin of modern man. Nature 331: 614–616.
16. Harvati K, Hublin J-J, Gunz P (2010) Evolution of middle-late Pleistocene
human cranio-facial form: A 3-D approach. Journal of Human Evolution 59:
445–464.
17. Ziegler M, Tuenter E, Lourens LJ (2010) The precession phase of the boreal
summer monsoon as viewed from the eastern Mediterranean (ODP Site 968).
Quaternary Science Reviews 29: 1481–1490.
18. Balter M (2011) Was North Africa the launch pad for modern human
migrations? Science 331: 20–23.
19. Liu Z, Wang Y, Gallimore R, Gasse F, Johnson T, et al. (2007) Simulating the
transient evolution and abrupt change of Northern Africa atmosphere-ocean-
terrestrial ecosystem in the Holocene. Quaternary Science Reviews 26: 1818–
1837.
20. Rohling EJ, Cane TR, Cooke S, Sprovieri M, Bouloubassi I, et al. (2002) African
monsoon variability during the previous interglacial maximum. Earth and
Planetary Science Letters 202: 61–75.
21. Tuenter E, Weber SL, Hilgen FJ, Lourens LJ (2003) The response of the African
summer monsoon to remote and local forcing due to precession and obliquity.
Global and Planetary Change 36: 219–235.
22. Pachur H-J, Altmann N (2006) Die Ostsahara in Spatquartar. Berlin: Springer
Verlag. 662 p.
23. Revel M, Ducassou E, Grousset FE, Bernasconi SM, Migeon S, et al. (2010)
100,000 years of African monsoon variability recorded in sediments of the Nile
margin. Quaternary Science Reviews 29: 1342–1362.
24. Pachur H-J, Rottinger F (1997) Evidence for a large extended paleolake in the
Eastern Sahara as revealed by spaceborne radar lab images. Remote Sensing of
the Environment 61: 437–440.
Rivers across the Sahara and Human Migration
PLOS ONE | www.plosone.org 11 September 2013 | Volume 8 | Issue 9 | e74834
25. Bar-Matthews M, Ayalon A, Kaufman A, Wasserburg GJ (1999) The Eastern
Mediterranean paleoclimate as a reflection of regional events: Soreq cave, Israel.Earth and Planetary Science Letters 166: 85–95.
26. Drake N, El-Hawat A, Turner P, Armitage S, Salem M, et al. (2008)
Palaeohydrology of the Fazzan Basin and surrounding regions: the last 7 millionyears. Palaeogeography, Palaeoclimatology, Palaeoecology 263: 131–145.
27. Fischer N, Jungclaus J (2010) Effects of orbital forcing on atmosphere and oceanheat transports in Holocene and Eemian climate simulations with a
comprehensive Earth system model. Climate of the Past 6: 155–168.
28. Pachur HJ, Kropelin S (1987) Wadi Howar: Paleoclimatic evidence from anextinct river system in the southeastern Sahara. Science 237: 298–299.
29. Danielson JJ, Gesch DB (2011) Global Multi-resolution Terrain Elevation Data2010 (GMTED2010). U.S. Geological Survey 26 p.
30. Rohling EJ, Grant K, Hemleben C, Siddall M, Hoogakker BAA, et al. (2008)High rates of sea-level rise during the last interglacial period. Nature Geoscience
1: 38–42.
31. Beven KJ, Kirkby MJ (1979) A physically based, variable contributing areamodel of basin hydrology. Hydrological Sciences Bulletin 24: 43–69.
32. Bates PD, Horritt MS, Fewtrell TJ (2010) Simple inertial formulation of theshallow water equations for efficient two-dimensional flood inundation
modelling. Journal of Hydrology 387: 33–45.
33. Gasse F (2002) Diatom-inferred salinity and carbonate oxygen isotopes inHolocene waterbodies of the western Sahara and Sahel (Africa). Quaternary
Science Reviews 21: 737–767.34. Abdelsalam MG, Youssef AM, Arafat SM, Alfarhan M (2008) Rise and demise
of the New Lakes of Sahara. Geosphere 4: 375–386.35. Bastawesy MA, Khalaf FI, Arafat SM (2008) The use of remote sensing and GIS
for the estimation of water loss from Tushka lakes, southwestern desert, Egypt.
Journal of African Earth Sciences 52: 73–80.36. Zammouri M, Feki H (2005) Managing releases from small upland reservoirs for
downstream recharge in semi-arid basins (Northeast of Tunisia). Journal ofHydrology 314: 125–138.
37. Larrasoana JC, Roberts AP, Rohling EJ (2008) Magnetic susceptibility of eastern
Mediterranean marine sediments as a proxy for Saharan dust supply? MarineGeology 254: 224–229.
38. Osborne AH, Marino G, Vance D, Rohling EJ (2010) Eastern Mediterraneansurface water Nd during Eemian sapropel S5: monitoring northerly (mid-
latitude) versus southerly (sub-tropical) freshwater contributions. QuaternaryScience Reviews 29: 2473–2483.
39. Causse C, Ghaleb B, Chkir N, Zouari K, Ben-Ouezdou H, et al. (2003)
Humidity changes in southern Tunisia during the Late Pleistocene inferred fromU-Th dating of mollusc shells. Applied Geochemistry 18: 1691–1703.
40. Kutzbach J, Liu X, Liu Z, Chen G (2008) Simulation of the evolutionaryresponse of global summer monsoons to orbital forcing over the past 280,000
years. Climate Dynamics 30: 567–579.
41. Barton RNE, Bouzouggar A, Collcutt S, Schwenninger J-L, Clark-Balzan L(2009) OSL dating of the Aterian levels at Dar es-Soltan I (Rabat, Morocco) and
implications for the dispersal of modern Homo sapiens. Quaternary ScienceReviews 28: 1914–1931.
42. Kleindienst MR, Smith JR, Adelsberger KA (2009) The Kharga OasisPrehistory Project (KOPP), 2008 Field Season: Part 1. Geoarchaeology and
Pleistocene Prehistory Nyame Akuma 71: 18–30.
43. Roeckner E, Bauml G, Bonaventura L, Brokopf R, Esch M, et al. (2003) Theatmospheric general circulation model ECHAM5. Part I: Model description.
HamburgGermany: Max Planck Institute for Meteorology, available from MPIfor Meteorology. 127 p.
44. Raddatz TJ, Reick CH, Knorr W, Kattge J, Roeckner E, et al. (2007) Will the
tropical land biosphere dominate the climate-carbon cycle feedback during thetwenty-first century? Climate Dynamics 29: 565–574.
45. Marsland SJ, Haak H, Jungclaus JH, Latif M, Roske F (2003) The Max-Planck-Institute global ocean/sea ice model with orthogonal curvilinear coordinates.
Ocean Modelling 5: 91–127.
46. Hibler W (1979) A dynamic thermodynamic sea ice model. Journal of Physical
Oceanography 9: 815–846.
47. Valcke S, Caubel A, Declat D, Terray L (2003) OASIS Ocean Atmosphere Sea
Ice Soil user guide. TR/GMGC/03/69 TR/GMGC/03/69. 85 p.
48. Jungclaus J, Keenlyside N, Botzet M, Haak H, Luo JJ, et al. (2006) Ocean
circulation and tropical variability in the coupled model ECHAM5/MPI-OM.
Journal of Climate 19: 3952–3972.
49. Hagemann S, Dumenil L (1998) Comparison of two global wetlands datasets
using a global hydrological discharge model. Hydrology and Earth System
Sciences.
50. Hagemann S, Gates LD (2003) Improving a subgrid runoff parameterization
scheme for climate models by the use of high resolution data derived from
satellite observations. Climate Dynamics 21: 349–359.
51. Fischer N, Jungclaus JH (2011) Evolution of the seasonal temperature cycle in a
transient Holocene simulation: Orbital forcing and sea-ice. Climate of the Past 7:
1139–1148.
52. Berger AL (1978) Long-term variations of daily insolation and Quaternary
climatic changes. Journal of the Atmospheric Sciences 35: 2362–2367.
53. Beven K (1997) TOPMODEL: a critique. Hydrological Processes 11: 1069–
1085.
54. Neal J, Schumann G, Fewtrell T, Budimir M, Bates P, et al. (2011) Evaluating a
new LISFLOOD-FP formulation with data from the summer 2007 floods in
Tewkesbury, UK. Journal of Flood Risk Management 4: 88–95.
55. de Almeida GAM, Bates P, Freer JE, Souvignet M (2012) Improving the stability
of a simple formulation of the shallow water equations for 2-D flood modeling.
Water Resources Research 48.
56. Wilson M, Bates P, Alsdorf D, Forsberg B, Horritt M, et al. (2007) Modeling
large-scale inundation of Amazonian seasonally flooded wetlands. Geophysical
Research Letters 34.
57. Neal J, Schumann G, Bates P (2012) A subgrid channel model for simulating
river hydraulics and floodplain inundation over large and data sparse areas.
Water Resources Research 48.
58. Biancamaria S, Bates PD, Boone A, Mognard NM (2009) Large-scale coupled
hydrologic and hydraulic modelling of the Ob river in Siberia. Journal of
Hydrology 379: 136–150.
59. Coulthard T, Neal JC, Bates PD, Ramirez J, de Almeida GAM (in press)
Integrating the LISFLOOD-FP 2D hydrodynamic model with the CAESAR
model: Implications for modelling landscape evolution. Earth Surface Processes
and Landforms
60. Rudolf B, Becker A, Schneider U, Meyer-Christoffer A, Ziese M (2010) GPCC
Status Report December 2010. GPCC, December.
61. Vorosmarty C, Fekete B, Tucker B (1996) River discharge database, version 1.0
(RivDIS v1. 0). UNESCO, Paris.
62. Reuter HI, Nelson A, Jarvis A (2007) An evaluation of void-filling interpolation
methods for SRTM data. International Journal of Geographical Information
Science 21: 983–1008.
63. Miliaresis GC, Argialas DP (1999) Segmentation of physiographic features from
the global digital elevation model/GTOPO30. Computers & Geosciences 25:
715–728.
64. (2011) Reference 3D product description version 6.1.
65. Brovkin V, Raddatz T, Reick CH, Claussen M, Gayler V (2009) Global
biogeophysical interactions between forest and climate. Geophysical Research
Letters 36.
66. Balout L (1955) Prehistoire de l’Afrique du Nord. Paris.
67. Bouzouggar A, Barton RNE (2012) The identity and timing of the Aterian in
Morocco. In: Hublin JJ, McPherron S, editors. Modern origins: A North African
perspective. Dordrecht: Springer. pp. 93–105.
68. Garcea EAA (2010) The spread of Aterian peoples in North Africa. In: Garcea
EAA, editor. South-Eastern Mediterranean peoples between 130,000 and
10,000 years ago Oxford: Oxbow Books. pp. 37–53.
Rivers across the Sahara and Human Migration
PLOS ONE | www.plosone.org 12 September 2013 | Volume 8 | Issue 9 | e74834