Related changes in biodiversity, insolation and climate in the Atlantic rainforest since the last...
13
Related changes in biodiversity, insolation and climate in the Atlantic rainforest since the last interglacial Marie-Pierre Ledru a, ⁎, Philippe Mourguiart b , Claudio Riccomini c a IRD UR 032 « GREAT ICE » Apartado Postal 17.12.857 Quito, Ecuador b IRD 213 rue La Fayette 75010 Paris, France c University of São Paulo Departamento de Geociências, rua do Lago 562, 0508-900 São Paulo, Brazil abstract article info Article history: Received 3 April 2008 Received in revised form 6 October 2008 Accepted 12 October 2008 Keywords: Atlantic rainforest Precession Glacial Interglacial Biodiversity Tropics The long-term Colônia record is located in the Atlantic rainforest domain in Brazil (23°52′S 46°42′20″W 900 m a.s.l.). The 780 cm long core CO3 provides a coverage of a complete interglacial/glacial cycle for the first time in a neotropical rainforest. Information on the behavior of tropical climates compared to global changes in temperatures indicates specific climate responses in terms of precipitation at these latitudes. Winter extratropical circulation was very active during the last interglacial and most of the glacial. Floristic composition of the rainforest changed several times in each phase of expansion, twice during the interglacial, and three times during glacial episodes. Araucaria was well developed in the area of São Paulo until the beginning of the first dry phase of the glacial at ca. 50,000 yr B.P. Changes in insolation controlled the expansion of the rainforest and the tropical hydrological cycle as evidenced by a strong precession signal. However precession had no impact on regional climatic features. The two interglacials (MIS 5e and Holocene) showed completely different patterns attesting to the continuous evolution of the forest. The biodiversity index (Shannon–Wiener Index) remained high during both the interglacial and glacial attesting to the permanence of small patches of rainforest refugia during drier phases. The lowest Shannon-Wiener Indexes were recorded between 23,000 and 12,000 yr B.P. and 40,000 and 30,000 yr B.P. and characterize two marked phases of stress for the rainforest. © 2008 Elsevier B.V. All rights reserved. 1. Introduction Global climate fluctuations, and more particularly glacial/inter- glacial cycles, have major consequences for the distribution of living organisms (Bennett, 1997; Hewitt, 2000). Genetic analysis has already highlighted colonization, refugia, and a mixture of broad spatial scale populations based on their DNA structure (Davis and Shaw, 2001; Petit et al., 2002). However, without a time scale, regional evolution, rates of change, and climate controls cannot be satisfactorily characterized. Low latitude rainforests have the great- est biodiversity, but are also being rapidly deforested and are thus in danger of disappearing before we have had time to study both their richness and their behavior during climate changes. How can their regeneration and conservation be ensured if we do not know how rainforests reacted to global climatic changes in the past? Only well dated paleorecords can provide such information (Willis et al., 2007). The term “biodiversity hotspot” refers to a region with a great diversity based on levels of richness, complementary endemism and, according to Myers et al. (2000), a region where at least 70% of the original cover has been lost. The Atlantic rainforest in Brazil is one of these hotspots and is seriously threatened – while 20% of the Amazon forest has been destroyed and over 93% of the Atlantic rainforest has already disappeared (Joly et al., 1999; Oliveira Filho and Fontes, 2000; Ledru et al., 2007). A wide range of temperature and topography contributes to the immense variety of plants and animals found in the Atlantic rainforest. Today 130 million people or 70% of the total Brazilian population live in an area that was formerly totally covered by this rainforest. After 500 years of intensive deforestation and associated agriculture (mainly coffee and banana), only small isolated patches of forest remain today. Will global warming shift remaining rainforest to another latitude and threaten another fragile ecosystem as predicted in the Andes with the uplift of the vegetation gradient to paramos (Bush, 2002)? How did the Atlantic rainforest react to increases in temperature in the past? Available pollen records from the Atlantic rainforest cover the late Quaternary. In the southern part of Brazil between 25° and 23°S, the Atlantic rainforest expanded from the last glacial period only during the past 7000 years and was not recorded during the preceding 15,000 years (Behling, 1997; Behling et al., 1997), while in central Brazil the Salitre pollen record (19°S 46°46′W) attests to different phases of expansion, one before the Last Glacial Maximum (LGM), and another between ca. 15,000 and 12,000 yr B.P. indicated by the Palaeogeography, Palaeoclimatology, Palaeoecology 271 (2009) 140–152 ⁎ Corresponding author. Fax: +593 2 250 4020. E-mail address: [email protected] (M.-P. Ledru). 0031-0182/$ – see front matter © 2008 Elsevier B.V. All rights reserved. doi:10.1016/j.palaeo.2008.10.008 Contents lists available at ScienceDirect Palaeogeography, Palaeoclimatology, Palaeoecology journal homepage: www.elsevier.com/locate/palaeo
Transcript of Related changes in biodiversity, insolation and climate in the Atlantic rainforest since the last...

Palaeogeography, Palaeoclimatology, Palaeoecology 271 (2009) 140–152
Contents lists available at ScienceDirect
Palaeogeography, Palaeoclimatology, Palaeoecology
j ourna l homepage: www.e lsev ie r.com/ locate /pa laeo
Related changes in biodiversity, insolation and climate in the Atlantic rainforest sincethe last interglacial
Marie-Pierre Ledru a,⁎, Philippe Mourguiart b, Claudio Riccomini c
a IRD UR 032 « GREAT ICE » Apartado Postal 17.12.857 Quito, Ecuadorb IRD 213 rue La Fayette 75010 Paris, Francec University of São Paulo Departamento de Geociências, rua do Lago 562, 0508-900 São Paulo, Brazil
⁎ Corresponding author. Fax: +593 2 250 4020.E-mail address: [email protected] (M.-P. Led
0031-0182/$ – see front matter © 2008 Elsevier B.V. Aldoi:10.1016/j.palaeo.2008.10.008
a b s t r a c t
a r t i c l e i n f oArticle history:
The long-term Colônia reco Received 3 April 2008Received in revised form 6 October 2008Accepted 12 October 2008Keywords:Atlantic rainforestPrecessionGlacialInterglacialBiodiversityTropics
rd is located in the Atlantic rainforest domain in Brazil (23°52′S 46°42′20″W900 m a.s.l.). The 780 cm long core CO3 provides a coverage of a complete interglacial/glacial cycle for thefirst time in a neotropical rainforest. Information on the behavior of tropical climates compared to globalchanges in temperatures indicates specific climate responses in terms of precipitation at these latitudes.Winter extratropical circulation was very active during the last interglacial and most of the glacial. Floristiccomposition of the rainforest changed several times in each phase of expansion, twice during the interglacial,and three times during glacial episodes. Araucaria was well developed in the area of São Paulo until thebeginning of the first dry phase of the glacial at ca. 50,000 yr B.P. Changes in insolation controlled theexpansion of the rainforest and the tropical hydrological cycle as evidenced by a strong precession signal.However precession had no impact on regional climatic features. The two interglacials (MIS 5e and Holocene)showed completely different patterns attesting to the continuous evolution of the forest. The biodiversityindex (Shannon–Wiener Index) remained high during both the interglacial and glacial attesting to thepermanence of small patches of rainforest refugia during drier phases. The lowest Shannon-Wiener Indexeswere recorded between 23,000 and 12,000 yr B.P. and 40,000 and 30,000 yr B.P. and characterize twomarked phases of stress for the rainforest.
© 2008 Elsevier B.V. All rights reserved.
1. Introduction
Global climate fluctuations, and more particularly glacial/inter-glacial cycles, have major consequences for the distribution of livingorganisms (Bennett, 1997; Hewitt, 2000). Genetic analysis hasalready highlighted colonization, refugia, and a mixture of broadspatial scale populations based on their DNA structure (Davis andShaw, 2001; Petit et al., 2002). However, without a time scale,regional evolution, rates of change, and climate controls cannot besatisfactorily characterized. Low latitude rainforests have the great-est biodiversity, but are also being rapidly deforested and are thus indanger of disappearing before we have had time to study both theirrichness and their behavior during climate changes. How can theirregeneration and conservation be ensured if we do not know howrainforests reacted to global climatic changes in the past? Only welldated paleorecords can provide such information (Willis et al., 2007).The term “biodiversity hotspot” refers to a region with a greatdiversity based on levels of richness, complementary endemism and,according to Myers et al. (2000), a region where at least 70% of the
ru).
l rights reserved.
original cover has been lost. The Atlantic rainforest in Brazil is one ofthese hotspots and is seriously threatened – while 20% of theAmazon forest has been destroyed and over 93% of the Atlanticrainforest has already disappeared (Joly et al., 1999; Oliveira Filhoand Fontes, 2000; Ledru et al., 2007). A wide range of temperatureand topography contributes to the immense variety of plants andanimals found in the Atlantic rainforest. Today 130 million people or70% of the total Brazilian population live in an area that was formerlytotally covered by this rainforest. After 500 years of intensivedeforestation and associated agriculture (mainly coffee and banana),only small isolated patches of forest remain today. Will globalwarming shift remaining rainforest to another latitude and threatenanother fragile ecosystem as predicted in the Andes with the uplift ofthe vegetation gradient to paramos (Bush, 2002)? How did theAtlantic rainforest react to increases in temperature in the past?Available pollen records from the Atlantic rainforest cover the lateQuaternary. In the southern part of Brazil between 25° and 23°S, theAtlantic rainforest expanded from the last glacial period only duringthe past 7000 years and was not recorded during the preceding15,000 years (Behling, 1997; Behling et al., 1997), while in centralBrazil the Salitre pollen record (19°S 46°46′W) attests to differentphases of expansion, one before the Last Glacial Maximum (LGM),and another between ca. 15,000 and 12,000 yr B.P. indicated by the

141M.-P. Ledru et al. / Palaeogeography, Palaeoclimatology, Palaeoecology 271 (2009) 140–152
presence of Araucaria (Ledru et al., 1996). These results suggest that itis important to take latitudinal and regional effects into considera-tion when interpreting broad scale changes in the distribution andcomposition of the Atlantic rainforest (Ledru et al., 2007). Here wepresent a long-term environmental record located within theAtlantic rainforest domain, in the Colônia crater, São Paulo, Brazil.This is the first South American long-term record that traces theevolution of a neotropical rainforest over a complete glacial/interglacial cycle.
2. Modern settings
2.1. Colônia crater
Colônia is a probable impact crater 3.6 km in diameter filled with450 m of mainly organic Neogene and Quaternary sediments, locatedwithin the city of São Paulo (23°52′S, 46°42′20″W, 900 m a.s.l.)(Riccomini et al., 1991). Its location near the Atlantic Ocean and in theSerra do Mar mountain range, only a few kilometers from theshoreline, means the vegetation is highly sensitive to changes in sealevel and temperature. The 780 cm long core CO3 was drilled in thepeat in the central part of the crater using a Martin vibra corer (Martinet al., 1995; Ledru et al., 2005).
Fig. 1. Map showing the seasonal atmospheric circulation that controls the distribution of raand austral summer (southernmost), austral summer circulation of the SASM, year-round noColônia crater (23°S). In the bottom corner the climatic diagram of the city of São Paulo.
2.2. Climate
Today the climate features of the Colônia region are characterizedby a mean annual precipitation of 1700 mm and a mean wintertemperature of ~15 °C (Fig. 1). The short (two-month) dry seasonwitharound 50 mm precipitation, is attenuated by frequent cloud coverand drizzle brought by maritime winds. Seasonal climate is controlledby the position of the Inter Tropical Convergence Zone or meteor-ological equator that divides the year into a rainy (austral summer)and a dry season (austral winter). The position of the South AtlanticConvergence Zone (SACZ) also controls seasonal moisture at thislatitude (Carvalho et al., 2004). During the austral summer, when theITCZ is dislocated to the south and the SACZ is located at 20°S±3°,moisture transported by the trade winds from the equatorial Atlantictowards the Amazon basin, named the South American SummerMonsoon (SASM) (Gan et al., 2004). These trade winds are channeledto the south-east by the Andean Cordillera where they are incorpo-rated into the SACZ (Lenters and Cook, 1999; Pezza and Ambrizzi,2003). The absence of the SACZ induces severe droughts in the area.During thewinter season, the ITCZmoves to its northernmost position~10°N and the dry season begins. However, the winter dry season isoften attenuated by extratropical circulation and the presence of theSACZ; polar air incursions regularly reach theses latitudes in winter
infall at the latitude of São Paulo: positions of the ITCZ in austral winter (northernmost)rthernshifts of polar advections and mean localization of the SACZ, with location of the

142 M.-P. Ledru et al. / Palaeogeography, Palaeoclimatology, Palaeoecology 271 (2009) 140–152
(Leroux,1998; Garreaud, 2000) andwhen theymeet the tropical moistair of the SACZ, high rainfall occurs during winter (June–August) in theColônia region (Fig. 1) (Marengo et al., 1997).
2.3. Vegetation
The Atlantic rainforest vegetation is broadly distributed andencompasses a large number of biomes that depend on the year-round distribution of precipitation and the range of mean annualtemperatures (Oliveira Filho and Fontes, 2000; Oliveira Filho et al.,2006). Today the Araucaria forest is located mainly farther south, ca.300 km from Colônia, where permanent rainfall and drizzle and lowtemperatures enable it to develop fully. Semideciduous forest, in theColônia region, is associated with a short dry season and a meanannual temperature of ca. 15 °C. Other patches of Atlantic rainforest,e.g. in northeastern Brazil, are maintained as refugia under favorableedaphic or atmospheric moisture (Ledru et al., 2007).
A botanical survey was carried out in the region of Colônia (Garciaand Pirani, 2005). Among the local plants identified in the peat bogsinside the crater were Sphagnum, Baccharis sp. (Asteraceae), Tibou-china sp (Melastomataceae), Eriocaulon sp (Eriocaulaceae), Utriculariasp (Lentibulariaceae), Hyptis sp. (Lamiaceae), Cuphea sp. (Lythraceae),Xyris sp. (Xyridaceae), Drosera sp. (Droseraceae) and the tree fernCyathea (Cyatheaceae). In the Atlantic rainforest, on themargins of thecrater, the main tree taxa identified were Myrtaceae with 12 genera,Myrsine sp. (Myrsinaceae), Alchornea sp. (Euphorbiaceae), Podocarpus
Fig. 2. Synthetic pollen diagram of the Colônia core CO3. The 21most common selected taxa arepresented along a depth scale.
sellowii (Podocarpaceae), Daphnopsis sp. (Thymeleaceae), Hedyosmumsp. (Chloranthaceae), Drymis winteri (Winteraceae), Rubiaceae with 16genera, the palms Bactris sp., Euterpe sp. and Geonoma sp., andepiphytes of the Bromeliaceae and Orchidaceae families.
According to our field observations, the region of São Paulo can beclassified as « degraded Araucaria forest » as only single individuals ofAraucaria angustifolia (Bert.) Kuntze were found in shadowy ravines.Podocarpus sellowii Klotzsch ex Endl., another tropical conifer, isseldom found in this area although we observed this conifer growingin a recently planted Eucalyptus forest.
3. Methods
3.1. Lithology of core CO3
We distinguished three different sedimentological units. Betweena depth of 760 and 450 cm was black and extremely compacted peat,between 450 and 355 cm the organic layer was very sandy, and from355 cm to the surface the sediment was characterized by a pure blackvery moist peat (Fig. 2).
3.2. Pollen analysis
The core was sampled for pollen analysis at 2-cm intervals. Pollensamples were prepared following standard treatment (Faegri andIversen, 1989) and mounted on microscope slides in silicon oil. Pollen
re expressed as percentages of the total pollen sum that excludes aquatics and ferns, and
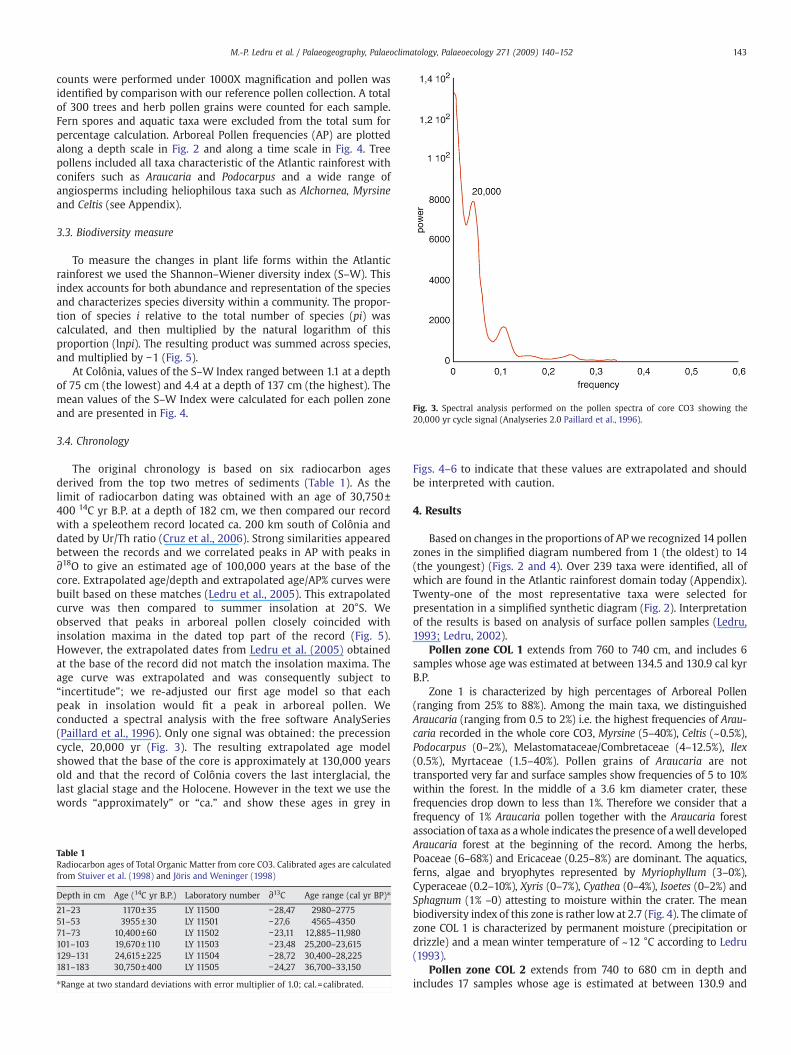
Fig. 3. Spectral analysis performed on the pollen spectra of core CO3 showing the20,000 yr cycle signal (Analyseries 2.0 Paillard et al., 1996).
143M.-P. Ledru et al. / Palaeogeography, Palaeoclimatology, Palaeoecology 271 (2009) 140–152
counts were performed under 1000X magnification and pollen wasidentified by comparison with our reference pollen collection. A totalof 300 trees and herb pollen grains were counted for each sample.Fern spores and aquatic taxa were excluded from the total sum forpercentage calculation. Arboreal Pollen frequencies (AP) are plottedalong a depth scale in Fig. 2 and along a time scale in Fig. 4. Treepollens included all taxa characteristic of the Atlantic rainforest withconifers such as Araucaria and Podocarpus and a wide range ofangiosperms including heliophilous taxa such as Alchornea, Myrsineand Celtis (see Appendix).
3.3. Biodiversity measure
To measure the changes in plant life forms within the Atlanticrainforest we used the Shannon–Wiener diversity index (S–W). Thisindex accounts for both abundance and representation of the speciesand characterizes species diversity within a community. The propor-tion of species i relative to the total number of species (pi) wascalculated, and then multiplied by the natural logarithm of thisproportion (lnpi). The resulting product was summed across species,and multiplied by −1 (Fig. 5).
At Colônia, values of the S–W Index ranged between 1.1 at a depthof 75 cm (the lowest) and 4.4 at a depth of 137 cm (the highest). Themean values of the S–W Index were calculated for each pollen zoneand are presented in Fig. 4.
3.4. Chronology
The original chronology is based on six radiocarbon agesderived from the top two metres of sediments (Table 1). As thelimit of radiocarbon dating was obtained with an age of 30,750±400 14C yr B.P. at a depth of 182 cm, we then compared our recordwith a speleothem record located ca. 200 km south of Colônia anddated by Ur/Th ratio (Cruz et al., 2006). Strong similarities appearedbetween the records and we correlated peaks in AP with peaks in∂18O to give an estimated age of 100,000 years at the base of thecore. Extrapolated age/depth and extrapolated age/AP% curves werebuilt based on these matches (Ledru et al., 2005). This extrapolatedcurve was then compared to summer insolation at 20°S. Weobserved that peaks in arboreal pollen closely coincided withinsolation maxima in the dated top part of the record (Fig. 5).However, the extrapolated dates from Ledru et al. (2005) obtainedat the base of the record did not match the insolation maxima. Theage curve was extrapolated and was consequently subject to“incertitude”; we re-adjusted our first age model so that eachpeak in insolation would fit a peak in arboreal pollen. Weconducted a spectral analysis with the free software AnalySeries(Paillard et al., 1996). Only one signal was obtained: the precessioncycle, 20,000 yr (Fig. 3). The resulting extrapolated age modelshowed that the base of the core is approximately at 130,000 yearsold and that the record of Colônia covers the last interglacial, thelast glacial stage and the Holocene. However in the text we use thewords “approximately” or “ca.” and show these ages in grey in
Table 1Radiocarbon ages of Total Organic Matter from core CO3. Calibrated ages are calculatedfrom Stuiver et al. (1998) and Jöris and Weninger (1998)
Depth in cm Age (14C yr B.P.) Laboratory number ∂13C Age range (cal yr BP)⁎
21–23 1170±35 LY 11500 −28,47 2980–277551–53 3955±30 LY 11501 −27,6 4565–435071–73 10,400±60 LY 11502 −23,11 12,885–11,980101–103 19,670±110 LY 11503 −23,48 25,200–23,615129–131 24,615±225 LY 11504 −28,72 30,400–28,225181–183 30,750±400 LY 11505 −24,27 36,700–33,150
⁎Range at two standard deviations with error multiplier of 1.0; cal.=calibrated.
Figs. 4–6 to indicate that these values are extrapolated and shouldbe interpreted with caution.
4. Results
Based on changes in the proportions of AP we recognized 14 pollenzones in the simplified diagram numbered from 1 (the oldest) to 14(the youngest) (Figs. 2 and 4). Over 239 taxa were identified, all ofwhich are found in the Atlantic rainforest domain today (Appendix).Twenty-one of the most representative taxa were selected forpresentation in a simplified synthetic diagram (Fig. 2). Interpretationof the results is based on analysis of surface pollen samples (Ledru,1993; Ledru, 2002).
Pollen zone COL 1 extends from 760 to 740 cm, and includes 6samples whose age was estimated at between 134.5 and 130.9 cal kyrB.P.
Zone 1 is characterized by high percentages of Arboreal Pollen(ranging from 25% to 88%). Among the main taxa, we distinguishedAraucaria (ranging from 0.5 to 2%) i.e. the highest frequencies of Arau-caria recorded in the whole core CO3, Myrsine (5–40%), Celtis (~0.5%),Podocarpus (0–2%), Melastomataceae/Combretaceae (4–12.5%), Ilex(0.5%), Myrtaceae (1.5–40%). Pollen grains of Araucaria are nottransported very far and surface samples show frequencies of 5 to 10%within the forest. In the middle of a 3.6 km diameter crater, thesefrequencies drop down to less than 1%. Therefore we consider that afrequency of 1% Araucaria pollen together with the Araucaria forestassociation of taxa as awhole indicates the presence of awell developedAraucaria forest at the beginning of the record. Among the herbs,Poaceae (6–68%) and Ericaceae (0.25–8%) are dominant. The aquatics,ferns, algae and bryophytes represented by Myriophyllum (3–0%),Cyperaceae (0.2–10%), Xyris (0–7%), Cyathea (0–4%), Isoetes (0–2%) andSphagnum (1% –0) attesting to moisture within the crater. The meanbiodiversity index of this zone is rather low at 2.7 (Fig. 4). The climate ofzone COL 1 is characterized by permanent moisture (precipitation ordrizzle) and a mean winter temperature of ~12 °C according to Ledru(1993).
Pollen zone COL 2 extends from 740 to 680 cm in depth andincludes 17 samples whose age is estimated at between 130.9 and

Fig. 4. Changes in tree pollen frequencies of core CO3 represented along a time scale. For a description of the pollen zones see the text. The mean value of the Shannon–Wiener indexis shown for each pollen zone. Ages shown in grey are extrapolated and should therefore be interpreted with caution.
144 M.-P. Ledru et al. / Palaeogeography, Palaeoclimatology, Palaeoecology 271 (2009) 140–152
120.5 cal kyr B.P. This zone is characterized by high percentages of APranging from 96% to 21% with a peak of 81–82%, Flacourtiaceae sp. at adepth of 718–720 cm and, in general, the dominance of Flacourtiaceaesp. between 726 and 707 cm. Among the other tree taxa, Melastoma-taceae/Combretaceae (0.5–48%),Myrsine (2–64%), Myrtaceae (2–20%),Podocarpus (0–3%), Weinmannia (0–0.3%) Alchornea (0–5%), Celtis (0–3%), Hedyosmum (0–0.3%), Ilex (1–16%) are observed. We noted aprogressive increase in the herb Asteraceae tubuliflorae (0.2–12%)along with a progressive decrease in Poaceae (0–59%). Ericaceae (0–6%), the aquatics Myriophyllum (0–0.3%), Cyperaceae (0–18%) andXyris (0–10%), ferns and bryophytes Cyathea (0–N100%), Isoetes (0–9%), Sphagnum (0–2%) and algae Botryococcus (0–1%) were recorded.The mean S–W Index increases to 3.2 characterizing high species andbiodiversity richness. The forest was still present although itscomposition had changed. Araucaria trees disappeared in favour of amoist tropical forest with a floristic composition similar to the one weobserved today around the crater. The only anomaly is the highfrequencies of Flacourtiaceae spp. for which we do not have anymodern analogs. The abundantly represented tree fern Cyatheaprobably extended to the middle of the crater as it does today.
Pollen zone COL 3 extends from 678 to 600 cm in depth, andincludes 22 samples with an estimated age of between 120 and106.4 cal kyr B.P. This zone is characterized by a decrease in AP (from90% to 47%) and the absence of Flacourtiaceae compared with theprevious pollen zone. The peak of 90% at a depth of 680 cm is due tohigh frequencies of the Myrsine, Myrtaceae and Melastomataceae/Combretaceae association. Among the tree taxa were observed Arau-caria (1–0%), Alchornea (0–1.7%), Celtis (0.5–7%), Hedyosmum (0–1.4%),Ilex (0–35%), Melastomataceae/Combretaceae (3–26%), Myrsine (4–31%), Myrtaceae (4–43%) and Podocarpus (0–8.6%). The herbsAsteraceae tubuliflorae (3–19%), Ericaceae (0–6%) and Poaceae (0–40%) were observed. Aquatics Myriophyllum (0–0.2%), Cyperaceae (0–13%), Xyris (0–6%), ferns and bryophytes Cyathea (155–11%), Isoetes(0–93%), Sphagnum (0–13%), and algae Botryococcus (0–0.4%) are alsowell represented. The mean biodiversity index (S–W) is the same as inthe previous zone at 3.2. This pollen association characterizes atropical forest with Araucaria trees on the margins and tree ferns inthe crater. This type of forest is adapted to a cold and moist climatewith permanent moisture.
Pollen zone COL 4 extends from 595 to 572 cm in depth andincludes 8 samples with an estimated age of between 105.5 and
98.5 cal kyr B.P. This zone is characterized by an increase in AP (77–90%) mainly composed of the second and final increase in thefrequency of Flacourtiaceae (7–35%). Other dominant tree taxa wereIlex (3.5–11.5%), Myrsine (7.5–22%), Myrtaceae (6.5–34%) and Mela-stomataceae/Combretaceae (1–19.5%). Araucaria (0.3–0%), Alchornea(0–0.7%), Celtis (0–1.5%), Hedyosmum (0–0.3%), Podocarpus (0–0.6%),Weinmannia (0–1%) are the other tree taxa represented. Asteraceaetubuliflorae (5–10%), Ericaceae (0–1.5%), Poaceae (1.5–7%), Cyperaceae(0–8%), Xyris (0–1.5%), Cyathea (0–9%), Isoetes (0–1%), Sphagnum (0–0.3%), Botryococcus (0–0.7%) are also observed. Themean S–W Index ishigher than in the previous zone at 3.5. Araucaria forest was wellrepresented although there is a change in the frequencies of herbs andlocal taxa. This change could be attributed to a change in soil moisturelevels.
Pollen zone COL 5 extends from 565 to 505 cm in depth andincludes 19 samples with an estimated age of between 98 and 89 calkyr B.P. This zone is characterized by a decrease in AP (80–39%) but anincrease in Podocarpus (2–58%), and the presence of Ilex (2–22%),Melastomataceae/Combretaceae (2–35%), Myrsine (5–52%), and Ar-aucaria (0.9–0%); concomitantly a progressive increase in Poaceae (3–50%) is observed.
Other associated taxa are Alchornea (0–0.2%), Celtis (0–2%), He-dyosmum (0–0.4%), Myrtaceae (2–27%), Weinmannia (0–0.5%),Asteraceae tubuliflorae (2–21%) Ericaceae (0–4%), Myriophyllum(0–1%), Cyperaceae (0.3–20%), Xyris (0.2–6%), Cyathea (1–66%),Isoetes (0–9%), Sphagnum (0–5%), Botryococcus (0–2.5%). The meanS–W Index was still high at 3.5, i.e the same value as in theprevious zone. The decrease in moisture rates observed at the endof the previous pollen zone is indicated by a peak in Podocarpusand the marked decrease in the herbs Poaceae and Asteraceae atthe beginning of this zone. However the tendancy reversed in themiddle of this zone with marked increases in Cyathea and Myrsine.The marked decrease in the frequency of heliophilous taxa(Alchornea, Hedyosmum, Celtis) that started in the previous zonecontinued.
Pollen zone COL 6 extends from 501 to 460 cm in depth andincludes 14 samples with an estimated age of between 89 and 81.8 calkyr B.P. This zone is characterized by an increase in AP (20–74%) withhigh frequencies of Myriophyllum (0–17%), and the presence ofMelastomataceae/Combretaceae (0–53%), Myrsine (3–37%) and Poa-ceae (8–61%).

Fig. 5. Changes in a) insolation at 20°S during the austral summer (February) (Berger and Loutre, 1991), b) temperatures of Antarctica (EPICA, 2004), c) tree cover and d) biodiversity(Shannon–Wiener index) of the rainforest at Colônia São Paulo, Brazil. Ages shown in grey are extrapolated and should therefore be interpreted with caution.
145M.-P. Ledru et al. / Palaeogeography, Palaeoclimatology, Palaeoecology 271 (2009) 140–152
Other associated taxa are Araucaria (0.3–0%), Alchornea (0–0.7%),Celtis (0.3–2%), Hedyosmum (0–0.3%), Ilex (0–3.6%), Myrtaceae (0–9%), Podocarpus (0–2%), Weinmannia (0–0.4%), Asteraceae tubuliflorae(1–16%), Ericaceae (0–20%), Cyperaceae (1–52%), Xyris (0–3.5%),Cyathea (0–5%), Isoetes (0–9%), Sphagnum (0–18%), Botryococcus (0–3%). Although changes in the frequencies of AP are observed in COL 4,5 and 6, the biodiversity index is stable and high at 3.5.
The sediment in the crater changed toward that deposited in ashallow lake under cooler temperatures and/or less evapotranspira-tion as attested by the presence of Myriophyllum. The Araucaria forestwas no longer represented and the forest is characterized by thedominance of pioneer taxa such as Melastomataceae/Combretaceae
and Myrsine. Today these taxa grow on the margins of the Andeanforest at 3700 m asl. in Bolivia where they form sparse shrubs on thetransition to the puna or in Brazil where different species grow eitheras trees or shrubs in Atlantic rainforest or Cerrado domains. Thesepollen spectra attest to a degradation of the rainforest that grewaround the flooded crater.
Pollen zone COL 7 extends from 456 to 316 cm in depth andincludes 42 samples with an estimated age of between 81 and 56.5 calkyr B.P. This zone is characterized by a decrease in AP (47 to 17%),although a single peak of tree pollen taxa of 96% is observed at a depthof 328 cm composed of 17% Ilex (32%)Melastomataceae/Combretaceae(3%), Myrsine (14%), Myrtaceae (3%), Symplocos (3%), Podocarpus

Fig. 6. Changes in floristic composition of the Atlantic rainforest: examples of Myrsine/Weinmannia (a) and Araucaria (b), where pollen frequencies are expressed along a time scale.Ages shown in grey are extrapolated and should therefore be interpreted with caution.
146 M.-P. Ledru et al. / Palaeogeography, Palaeoclimatology, Palaeoecology 271 (2009) 140–152
(13%), Weinmannia (14%). Other associated taxa are Araucaria (0,.8–0%), Alchornea (0–1.5%), Celtis (0–1.7%), Hedyosmum (0–1%), Ilex (0–17%), Melastomataceae/Combretaceae (1–32%), Myrsine (0–13%),Myrtaceae (0–14%), Podocarpus (0–10%), Weinmannia (0–14%), Aster-aceae tubuliflorae (6–61%), Ericaceae (0.3–7%), Poaceae (26–66%),Myriophyllum (0–1.4%), Cyperaceae (0–18%), Xyris (0.2–3%), Cyathea(0–7%), Isoetes (2–19%), Sphagnum (0.3–13%) and Botryococcus (0–46%). The biodiversity index is high at 3.6 attesting to the permanenceof rainforest flora in the area during a forest regression phase. Thedegradation of the rainforest that started in the previous zonecontinues. The pollen association suggests an open landscape withsome trees or shrubs including Araucaria near springs. Myriophyllumwas replaced by Botryococcus and sandwas deposited in the sediment,as the shallow lake was still present in the crater at the time, probablyseasonally. At the beginning of this pollen zoneWeinmannia started toincrease while Myrsine almost disappeared. It is difficult to infer to aclimatic change to explain the interplay between these two taxa asthey both characterize moist forested environments and grow in theAraucaria forest, the Atlantic rainforest, and the Andean forest. Onetaxon (Weinmannia) appears to have taken over the niche of anothertaxon, Myrsine, due to some marked change in environmentalconditions (Fig. 6). The peak in tree pollen taxa at 328 cm, ca. 58 kyrB.P., corresponds to the abrupt development of the moist tropicalforest due to warmer temperatures that lasted a short period.Moisture rates remained high as indicated by the algae and theAraucaria.
Pollen zone COL 8 extends from 312 to 227 cm in depth andincludes 26 samples with an estimated age of between 55.8 and40.9 cal kyr B.P. This zone is characterized by an increase in AP (30 to81%) with conspicuous Celtis (0–10%), Podocarpus (1–9%), and Al-chornea (0–13%). Ilex (2–14%), Araucaria (0.5–0%), Ericaceae (0–34%),Xyris (0–22%) and Cyperaceae (0–93%) are also well represented. He-
dyosmum (0–0.8%), Melastomataceae/Combretaceae (3–51%), Myrsine(0–8%), Myrtaceae (1–14%), Weinmannia (0–30%), Asteraceae tubuli-florae (1–17%), Poaceae (7–53%), Myriophyllum (0–18%), Cyathea (0–10%), Isoetes (0–18%), Sphagnum (0–1.5%), Botryococcus (0–0.4%) arealso recorded. This pollen zone characterizes the re-expansion of thetropical forest, although the mean S–W Index of this zone is not verydifferent from that of the previous zone at 3.7. Re-expansion of theforest was facilitated by the permanence of all the rainforest species inthe area. Soil moisture decreased and there was the development of aXyris-Cyperaceae herb field. Moisture was probably atmospheric andwas able to maintain a dense cloud forest around the crater.Temperatures were cool as indicated by the presence of Araucaria.
Within this pollen zone, many abrupt brief changes in forestcomposition were observed. The progression of Celtis to Podocarpus andWeinmannia, and, among the non-arboreal pollen, from Myriophyllum–
Cyperaceae–Xyris–Ericaceae–Poaceae for the local taxa, attest to gradualchanges.
Pollen zone COL 9 extends from 223 to 144 cm in depth andincludes 22 samples with an estimated age of between 40.2 to28.8 cal kyr B.P. This zone is characterized by a decrease in AP (5–29%) and the dominance of Poaceae (38–74%) and Asteraceaetubuliflorae (4–22%). The other taxa observed are Alchornea (0–0.2%), Celtis (0–1%), Hedyosmum (0–1%), Ilex (0–11%), Melastoma-taceae/Combretaceae (1–3%), Myrsine (0–2%), Myrtaceae (0–3%),Podocarpus (0–1%), Weinmannia (0–9%), Ericaceae (0–3%), Cyper-aceae (0–3%), Xyris (0–3%), Cyathea (0–75%), Isoetes (0–26%),Sphagnum (0–8%), Botryococcus (0–0.2%). This pollen zone displaysthe lowest frequencies of arboreal pollen of the record with thedisappearance of Araucaria, which never recovered from thisdrastic climatic change. The mean S–W Index of this zone is verylow at 2.4 indicating the stress to which the rainforest is subjectedduring this episode. An abrupt brief increase in moisture is

147M.-P. Ledru et al. / Palaeogeography, Palaeoclimatology, Palaeoecology 271 (2009) 140–152
recorded at ca. 39 kyr B.P. Arboreal taxa were probably maintainedas sparse shrubs growing near springs. The vegetation wasdominated by Poaceae and Asteraceae tubuliflorae. The climatewas dry with cool temperatures.
Pollen zone COL 10 extends from 142 to 113 cm in depth andincludes 12 samples with an estimated age of between 28.5 and23.5 cal kyr B.P. This zone is characterized by a sharp increase in AP(50–89%). High frequencies of Hedyosmum (1–20%), Podocarpus (0.3–17%) andWeinmannia (2–36%) characterized this pollen zone as do thepresence of Ilex (2–11%), Melastomataceae/Combretaceae (3–12%),Myrsine (2–9%), Myrtaceae (6–55%). Also observed were Alchornea(0.3–3%), Celtis (0–1%), Asteraceae tubuliflorae (4–9%), Ericaceae (0–0.9%), Poaceae (1–29%), Cyperaceae (0–2%), Xyris (0–4%), Cyathea (1–14%), Isoetes (0–4%), Sphagnum (0–7%), Botryococcus (0–0.2%). Themean S–W Index of this zone increases sharply to reach 3.8, thehighest value of the whole record.
This pollen zone marks the development of a tropical cloud forestunder cool temperatures as attested by the presence of Hedyosmum, ataxon that today grows at the top of the serras in central Brazil, and at2500 m asl. in the cloud forest of the eastern Andean Cordillera. Thecrater was entirely covered with forest as shown by the fact that non-arboreal pollen taxa were completely absent from this zone. Climatewas moist with no dry season but with a permanent supply ofmoisture.
Pollen zone COL 11 extends from 108 to 68 cm in depth andincludes 15 samples with an estimated age of between 23 and 9.9 calkyr B.P. This zone is characterized by a decrease in AP (3–27%) andbetween a depth of between 90 and 95 cm a limited increase in Ar-aucaria (up to 0.3%), Celtis (0–2%) and Melastomataceae/Combreta-ceae (0.4–7%) between ca. 18 and 16 kyr B.P. at the end of theglaciation. Alchornea (0–6%), Hedyosmum (0–0.1%), Ilex (0–4%), Myr-sine (0.7–4%), Myrtaceae (0–6%), Podocarpus (0–3%), Weinmannia (0–6%) were also represented as trees, Asteraceae tubuliflorae (0–17%),Ericaceae (0–3%), Poaceae (46–85%) among the herbs, the aquaticsCyperaceae (0–11%), Xyris (0.3–5%), ferns and bryophytes Cyathea (0–12%), Isoetes (0–9%), Sphagnum (0–40%) and algae Botryococcus (0–3%). The mean S–W Index of this zone, 2.3, is the lowest of the wholepollen record attesting to extremely low biodiversity. This pollen zoneincludes the LGM, the Late Glacial and the beginning of the Holocene.The differences in sedimentation rates can be attributed to erosiveconditions during the LGM and the beginning of the Holocene. Thefirst change was a global climatic change; the second was due to theprecession signal which was strong at these latitudes and wascharacterized by strong erosive climatic conditions and reduction inthe tropical forest at different latitudes (Ledru et al., 1998a,b). Thehigher moisture rates that led to an increase in the frequency of Ar-aucaria can be attributed to an abrupt shift in moisture rates duringthe deglaciation.
Pollen zone COL 12 extends from 64 to 50 cm in depth andincludes 6 samples and with an estimated age of between 9 and6.6 cal kyr B.P. This zone is characterized by an increase in AP (34–74%) related to the dominance of Alchornea (3–7%), Melastomata-ceae/Combretaceae (6–13%), Myrtaceae (1–18%), Ilex (1–31%) andWeinmannia (2.5–15.5%) with the presence of Asteraceae tubuli-florae (8–22%), Ericaceae (2–8%), Isoetes (13–83%), Sphagnum (16–114%) and Botryococcus (0–0.5%). Celtis (0–1%), Hedyosmum (0–0.5%), Myrsine (1.6–5%), Poaceae (3–30%), Myriophyllum (0–0.3%,)Cyperaceae (0–3%), Xyris (0–0.5%), Cyathea (0–9%) are recorded atlow frequencies. The mean S–W Index increases abruptly to 3.4attesting to the fact that the forest was fully developed. Dominanceof heliophilous taxa and the beginning of the formation of aSphagnum peat bog are other features that define this ecologicalzone. This pollen association suggests a seasonal climate with asummer precipitation regime and dry winters.
Pollen zone COL 13 extends from 48 to 30 cm in depth and isrepresented by 7 samples with an estimated age of between 6.2 and
3.7 cal kyr B.P. This zone is characterized by a decrease in AP (39–54%),Alchornea (1–8.5%), Melastomataceae/Combretaceae (4–16%), Aster-aceae tubuliflorae (11–32%), Ericaceae (2–12%), Isoetes (28–144%) andSphagnum (9.5–64%). Also recorded but at low frequencies are Celtis(0–1%), Hedyosmum (0–0.3%), Ilex (2–22%), Myrsine (0.3–4.5%),Myrtaceae (1–7%), Podocarpus (0–1%), Weinmannia (1–11%), Poaceae(5–28%), Cyperaceae (0–3%), Xyris (0–1%), Cyathea (0–1.5%). Thebiodiversity index remains high at 3.2. This mid-Holocene decreasein arboreal pollen in favor of Asteraceae tubuliflorae attests to the factthat the climate was much drier at this time.
PollenzoneCOL14 extends from27 to 1 cm indepth and includes 11sampleswith anestimated age of 3.5 cal kyr B.P. to the present. This zoneis characterized by an increase in AP (44–89%) associated with thefollowing taxa: Alchornea (1–7%), Celtis (0–2.5%), Ilex (3–68%), andWeinmannia (2–28%) and local plants: Isoetes (0–251%) and Sphagnum(0–5%).Hedyosmum (0–0.7%), Melastomataceae/Combretaceae (1–26%),Myrsine (1–8%), Myrtaceae (1–8.5%), Podocarpus (0–1%), Asteraceaetubuliflorae (9–28%), Ericaceae (0–3%), Poaceae (0.5–29%), Cyperaceae(0–7%), Xyris (0–0.7%), Cyathea (0–6%), Botryococcus (0–3.5%) are alsorecordedwithin this zone. Themodern forestwas fully developed at thistime with all indicator taxa of the cloud forest. The mean S–W Index ishigh at 3.1 although within the pollen zone it fluctuates between 1.4and 4.2.
5. Changes in forest extent and floristic composition
Studies of low latitude lake (Baker et al., 2001) and speleothem(Cruz et al., 2005) records previously showed that precession cyclescontrol changes in solar radiation and variability in the tropicalhydrological cycle. The Colônia pollen record shows that thedevelopment of the tropical forest was moisture dependant andcontrolled by changes in insolation over a 20,000-year cycle withmaximum forest expansion and long wet periods occurring whensummer insolation was highest. However, within these moistepisodes, changing floristic composition was apparently neitherrelated to insolation nor to atmospheric CO2 concentrations (Barnolaet al., 1987) or temperature (Dansgaard et al., 1993; EPICA, 2004), butrather had different regional causes that differenciated the tropicalclimate and circulation from those at higher latitudes (Fig. 5).
5.1. The last interglacial
The last interglacial interval is represented byMarine Isotope Stage(MIS) 5e, a period of low global ice volume and high sea level. In thenorthern hemisphere, where it was first described, it is characterizedby awarm interval arbitrarily dated between ~130,000 and 116,000 yrB.P. (Kukla et al., 2002). This interval has not been yet documented inother paleoenvironmental studies of the region and only rarely withinterrestrial pollen records in the tropics of the southern hemisphere(Kershaw, 1978; Kershaw and Whitlock, 2000). Fluctuations inarboreal pollen frequencies were observed, and two pollen zones(COL 1 and 2) described the floristic composition of the interglacialrainforest. The first part of the interglacial was characterized by thepresence of the southern conifer Araucaria between approximately134.5 and 130.9 cal kyr B.P. and a low biodiversity index that increasedin the next ecological zone. In the second part, Araucaria is notrecorded and another taxon is observed, Flacourtiaceae sp., betweenapproximately 130.9 and 120.5 cal kyr B.P. No modern analogs for theassemblage with Flacourtiaceae sp. have been found so far. Araucariaattests to a winter precipitation regime in the area at this time,induced by extratropical circulation (Ledru, 1993). Rainfall and drizzleare caused by the meeting of the polar air masses with moist air fromthe Atlantic. This climatic feature changed in the second half of theinterglacial as Araucariawas no longer observed (Fig. 6). These resultsare in good agreement with paleoclimatic interpretations based onisotopic analysis of speleothems. High values of ∂18O in Santana cave,

148 M.-P. Ledru et al. / Palaeogeography, Palaeoclimatology, Palaeoecology 271 (2009) 140–152
24°31′51″S 48°43′36″W 1000 m asl., ca. 200 km south of the Colôniacrater, indicate an extratropical regime with rainfall occuring mainlyin winter at this time (Cruz et al., 2006). However, the presence of thetree Araucaria and of a dense rainforest at Colônia during theinterglacial provides evidence for the occurrence of both winter andsummer precipitation regimes in the area. The change frominterglacial to glacial times does not appear to have had any impacton the vegetation diversity (Figs. 4 and 5).
5.2. The last glacial stage
The last glacial stage started at approximately 116,000 yr B.P. withan episode named MIS 5d, and ended 12,000 years ago with the onsetof the present interglacial, the Holocene. Major fluctuations in forestexpansion and composition were observed throughout this intervaland nine pollen zones (COL 3 to COL 12) have been defined. Therainforest expanded three times, each time showing a differentfloristic composition. The beginning of the glacial was characterizedby a slight decrease in tree pollen frequencies, a considerable increasein the frequency of Podocarpus, a conifer indicator of a cool and moistclimate, and a high biodiversity index attesting to the permanence of adense tropical forest in this region. In pollen zone COL 3, between ca.120 and 106.4 cal kyr B.P., we observed a very similar association oftaxa to that in the modern Araucaria forest with abundant tree ferns(Cyathea) in the crater attesting to awinter precipitation regime in thearea. The first glacial expansion of the rainforest occurred betweenapproximately 105.5 and 101.5 cal kyr B.P. when Araucaria andFlacourtiaceae sp. were recorded together although discontinuously.Low summer insolation values could explain this change in environ-ment. The second glacial expansion of the rainforest was observedbetween approximately 55.8 and 40.9 cal kyr B.P. Here again, thefloristic composition was very similar to that observed during theinterglacial. The continuous presence of Araucaria shows that thewinter precipitation regime was still active in this region at this time(Fig. 6).
The third rainforest expansion occurred between 30 and 23 cal kyrB.P. and was characterized by different floristic assemblages thanthose previously described, this time with Hedyosmum-Podocarpus-Weinmannia. Today Hedyosmum grows in the coastal moist Atlanticforest up to latitude 30°S and in the Andes up to 2500 m asl., in galleryforests of the cerrado, and in the Araucaria forest. The presence ofWeinmannia excludes the possibility of a cerrado-type landscapeand climate. Conversely, the Hedyosmum-Podocarpus-Weinmanniaassociation observed in this glacial rainforest argues in favor of coldtemperatures and therefore of a cold rainforest.
During the last glacial stage, two major rainforest regressionswere observed. Between ca. 40 and 30 kyr and between 23 and12 kyr, the biodiversity index abruptly decreased and the rainforestwas replaced by open vegetation dominated by Poaceae. The raretrees observed during these phases were pioneer and heliophilousspecies such as Melastomataceae/Combretaceae and Celtis. Lack ofmoisture may explain this drastic change in environment. Fewpollen data were recovered for the time period 23–12 kyr B.P. insoutheastern Brazil. Where the LGM has been recorded, stronghiatuses in sedimentation are evident due to dry and erosiveclimatic conditions (Ledru et al., 1998a). Problems in sedimentdeposition between 23 and 12 kyr B.P. (Behling and Negrelle, 2001),or age inversions (Behling et al., 2002), are rarely discussedalthough they attest to dry LGM and Late Glacial climaticconditions at this latitude. The development of a pre-LGM Atlanticrainforest has already been characterized at Salitre (19°S) (Ledruet al., 1996) and in the GeoB 3202-1 (21°37′S) marine record(Behling et al., 2002) although it was, for both records, poorly datedand not commented on the marine record.
The whole Atlantic forest did not survive these dry episodes butprobably survived as patches in protected areas around the crater.
These « refugia » of rainforest enabled its regeneration when theclimate again became more favorable. Another rainforest regressionwas observed after the beginning of the glacial, between ca. 100 and56 kyr (Pollen zones COL 5-6-7), although this time the regressionwasless drastic than the two other times. At this time the rainforest wasprogressively reduced to shrubs and a shallow lake formed in thecrater. However biodiversity remained high during the same period,indicating that permanent moisture was able to maintain biodiverserefugia without stressing the floristic associations.
At approximately 80 kyr a change was observed in insolationamplitude (Berger and Loutre, 1991). This change in energy induced achange in the floristic composition of the forest. Two taxa appeared toreact to the change in insolation:Myrsinewhich was abundant before80 kyr decreased or disappeared from the Colônia record whileWeinmannia started to increase. The expansion of Weinmannia in thisregion is still underway even though trees are seldom observed in thearea (Fig. 6).
During this interval, precipitation appears to have been thelimiting factor in the development of the rainforest. As cold indicatortaxa such as Araucaria, Podocarpus, Weinmannia were consistentlywell represented, the major changes in the environment that resultedin a drier landscape when the forest disappeared are attributed todrier climatic conditions, due to either a northward shift of theextratropical precipitation regime or a switch off in the SASMmechanism and/or a decrease in the amplitude of the ITCZ seasonalshift.
Paleoenvironmental reconstruction of core CO3 showed that theAraucaria forest was present during the last 130,000 years untilapproximately 50,000 years B.P. with a short re-expansion during thelate glacial at ca. 17,000 yr B.P. Araucaria is a conifer relict from theGondwana when cool and moist climatic conditions were favorablefor its development (Enright and Hill, 1995; Kershaw and Wagstaff,2001). When the South American continent progressively shiftednorthward to reach tropical latitudes, the climate became progres-sively warmer and Araucaria became less widespread in SouthAmerica. Today two species can be found in South America asopposed to 17 in Australasia, and none in Africa. However, duringglacial intervals when temperatures decreased in the Tropics, theseconifers also had to face major dry episodes. Araucaria was welldeveloped during the last interglacial and during the moistestepisodes of the last glaciation, but the last dry glacial phase preventedthis species from a new interglacial re-expansion in the region of SãoPaulo.
5.3. The Holocene
The Holocene started 12,000 years ago and represents our presentinterglacial. The precession signal is characterized by low summerinsolation and has a major impact on the ecosystems of this area(Ledru et al., 1998b). Full development of the rainforest was observedafter 9000 yr B.P. with a floristic composition similar to that of today.In the same way as during the previous rainforest expansion, duringthe glacial between 30 and 23 kyr B.P., Weinmanniawas recorded andincreased progressively throughout the period (Fig. 6) but both Po-docarpus and Hedyosmum disappeared, attesting to warmer tempera-tures in the region. Twomain forest regressions were characterized bythe invasion of open vegetation. The first regression in the mid-Holocene, between 6000 and 4000 yr B.P., was characterized by amajor reduction in the tree cover and a low mean S–W Index (Fig. 4).The second regressionwas observed during the past millenium. Theseregressions are in good agreement with global climate changes.Moisture rates progressively decreased between ca. 9000 and 6000 yrB.P. at these latitudes. Migrations of populations (Schmitz et al., 1989),extinction of the megafauna (Vivo and Carmignotto, 2004), sterilearcheological layers in Central Brazil (Araujo et al., 2005), low lakelevels, e.g. Lake Titicaca (Argollo and Mourguiart, 2000), all attest to

149M.-P. Ledru et al. / Palaeogeography, Palaeoclimatology, Palaeoecology 271 (2009) 140–152
drastic changes in environmental conditions. Observations of the lastmillenium revealed the interplay of climatic and anthropic impacts ontropical landscapes are still not easy to distinguish from one another(Crowley, 2000; Jomelli et al., 2008).
Although the forest expanded during the warm last interglacial,the same is not true for the last glacial where the two rainforestexpansions were not linked to a global change in temperature (Jouzelet al., 1994; Petit et al., 1999; Johnsen et al., 2001) (Fig. 5). The regionalincrease in moisture rates during these periods probably resulted infeedback effects of ocean–atmosphere interactions and also affectedtropical seasonality.
6. Conclusions
The Colônia pollen record shows a strong precession signal(~20,000 yr) providing evidence that changes in insolation are themain climatic factors driving rainforest expansion and contraction inthe southern tropics. Tropical rainforest responds very rapidly to anincrease in precipitation and/or to a change in seasonality. However,changes in the origin of precipitation, extratropical winter versusSASM summer precipitations do not match the precession cycle.When superimposed on the precession and on glacial cycles,regional effects of ocean–atmosphere forcings on tropical continen-tal climate can be observed. For instance the beginning of theHolocene was characterized by the presence of the Atlantic rain-forest responding to a summer precipitation regime, while theprevious rainforest, 20,000 years previously, was the result of bothwinter and summer precipitation regimes that distributed thehumidity all year round. Clouds and drizzle were probably veryabundant between 30 and 23,000 years B.P. These convectivepatterns can be explained by a specific temperature gradientbetween the poles and the equator in both hemispheres regulatedby the amount of ice in the Antarctic and in Greenland (Thompsonet al., 2005). Thewinter extratropical precipitation regimewas activeuntil ca. 50,000 years B.P. as attested by the presence of the australconifer Araucaria. In addition, the floristic composition of the forestwas never the same during the precession cycles attesting todifferent climatic conditions in the crater at these times, andinferring the regional influence of the northern hemisphere/south-ern hemisphere on tropical hydrology.
Here, we show for the first time in the tropics that changes in theamplitude of insolation have a major impact on the composition of theforest. At ca. 80 kyr B.P.Myrsinewas abruptly replaced byWeinmanniainferring specific physiological characteristics of these species thatenabled such a clear response. This result needs to be furtherinvestigated before deciding which species will be capable ofregenerating the rainforest in the future.
Moreover, the insolation cycle or glacial/interglacial cycle does notappear to impact on biological diversity which remained high in theColônia crater both in the interglacial and the glacial. Instead, thebiodiversity rates of the rainforest probably responded rapidly andabruptly to drastic changes in moisture rates (Fig. 4). Because of thevariety of climates and elevations, thousands of plant and animalspecies could not occur anywhere but here. The Colônia pollen recordshows that this great biodiversity was challenged several times in thepast and that there were at least two drastic reductions in speciesduring the past 130,000 years. Also marked differences between thisarea and the climatic patterns at higher northern and southernlatitudes, e.g. high humidity during the glacial interval and an aridlate glacial, imply patterns of climate evolution that are specific tosome tropical environments. However, this study emphasizes theneed for other independent regional dating controls to improve ourchronology. The challenge facing us now is to core the next 440 m ofpeat that filled the Colônia crater and to review the previous glacial/interglacial cycles to cover the very-long-term evolution of a tropicalrainforest.
Acknowledgements
This research benefited from a CNPq (Brazil)-IRD (France) conven-tion.We thank BrunoTurcq for coring at Colônia in 1989with aMartinvibra corer; MPL thanks her colleagues at the Geociências andBiociências Departments of the University of São Paulo, Brazil, fortheir interest, encouragements and discussions on Brazilian botanyand landscapes; the team of « Paléoenvironnements » at ISEM,Montpellier, France, for making this research possible and thepublication of these results, and more particularly Denis-DidierRousseau for undertaking the spectral analysis and for helpfuldiscussions on interglacials and long records. We thank PeterKershaw, Keith Bennett and Hermann Behling for their constructivereviews.
Appendix A. List of all the taxa identified in the pollen record ofColônia core CO3
Arboreal PollenAraucaria (Araucariaceae)Aegiphila (Verbenaceae)Alchornea (Euphorbiaceae)Alnus (Betulaceae)Anacardium (Anacardiaceae)Andira (Fabaceae)AnnonaceaeApocynaceaeApeiba (Tiliaceae)Apuleia (Caesalpiniaceae)Arecaceae C1Arrabidea (Bignoniaceae)Aspidosperma (Apocynaceae)Astronium (Anacardiaceae)Banara (Flacourtiaceae)Bauhinia (Fabaceae)Belangera (Cunoniaceae)Bertiera (Rubiaceae)Brosinum (Moraceae)CaesalpiniaceaeCassia (Fabaceae)Cecropia (Cecropiaceae)Cedrela (Meliaceae)Celtis (Ulmaceae)Chamaesyce (Euphorbiaceae)Cissampelos (Menispermaceae)Clethra (Clethraceae)Clusia (Clusiaceae)Cochlospermum (Cochlospermaceae)Copaifera (Caesalpiniaceae)Cordia (Boraginaceae)Coussapoa (Moraceae)Coutarea (Rubiaceae)Croton (Euphorbiaceae)Crudia (Caesalpiniaceae)Cupania (Sapindaceae)Cybianthus (Myrsinaceae)Cybistax (Bignoniaceae)Dalbergia (Fabaceae)Daphnopsis (Thymeleaceae)Desmodium (Fabaceae)Dialium (Caesalpiniaceae)Didymopanax (Araliaceae)DilleniaceaeDinizia type (Mimosaceae)Diospyros (Ebenaceae)Doliocarpus (Dilleniaceae)

150 M.-P. Ledru et al. / Palaeogeography, Palaeoclimatology, Palaeoecology 271 (2009) 140–152
Dorstenia (Moraceae)Drimys (Winteraceae)Erythroxylum (Erythroxylaceae)Eschweleira (Lecythidaceae)Euphorbia (Euphorbiaceae)FabaceaeFagara (Rutaceae)Ficus (Moraceae)FlacourtiaceaeFlacourtiaceae C4P4Fusaea (Annonaceae)Gallesia (Phytolaccaceae)Geoffrea type (Fabaceae)Guapira (Nyctaginaceae)Guettarda (Rubiaceae)Gouania type (Rubiaceae)Hancornia (Apocynaceae)Hedyosmum (Chloranthaceae)Heliotropium (Boraginaceae)Heteropteris (Malpighiaceae)HumiriaceaeHyeronima (Euphorbiaceae)Hymenea (Caesalpiniaceae)Ilex (Aquifoliaceae)Jacaranda (Bignoniaceae)Laplacea (Theaceae)Licania (Chrysobalanaceae)LinaceaeLithraea (Anacardiaceae)LoranthaceaeMabea (Euphorbiaceae)Machaerium (Fabaceae)Mandevilla (Apocynaceae)Maprounea (Euphorbiaceae)Marcgravia (Marcgraviaceae)Matayba (Sapindaceae)Maytenus (Celastraceae)Melastomataceae/CombretaceaeMelastomataceae/Combretaceae reticuléMelastomataceae b20Meliaceae/SapotaceaeMenispermaceaeMimosaceae (4de)MimosaceaeMimosa scabrella typeMinquartia (Olacaceae)Moraceae P2Myrica (Myricaceae)Myroxylon (Fabaceae)Myrsine (Myrsinaceae)MyrtaceaeNectandra (Lauraceae)Norantea (Marcgraviaceae)Nothofagus (Fagaceae)NyctaginaceaeOuratea (Ochnaceae)Patagonula (Boraginaceae)Paullinia (Sapindaceae)Phyllantus (Euphorbiaceae)Pisonia (Nyctaginaceae)Plenckia (Celastraceae)Podocarpus (Podocarpaceae)Poiretia (Fabaceae)Posoqueria (Rubiaceae)Pouteria (Sapotaceae)Protium (Proteaceae)
Pseudobombax (Bombacaceae)Psidium (Myrtaceae)Psychotria (Rubiaceae)Qualea (Vochysiaceae)RhamnaceaeRoupala (Proteaceae)Sapium (Euphorbiaceae)Schizolobium (Caesalpiniaceae)Sebastiana (Euphorbiaceae)Senna (Caesalpiniaceae)Serjania (Sapindaceae)Simarouba (Simaroubaceae)Solanum (Solanaceae)Styrax (Styracaceae)Symplocos-type reticulateSymplocos (Symplocaceae)Tabebuia (Bignoniaceae)Talisia (Sapindaceae)Tapirira (Anacardiaceae)Terstroemia (Theaceae)Thumbergia (Acanthaceae)TiliaceaeTontelea (Hippocrateaceae)Tournefortia (Boraginaceae)Trema (Ulmaceae)Trichilia (Meliaceae)Vantanea (Humiriaceae)VerbenaceaeVismia (Clusiaceae)Weinmannia (Cunoniaceae)Xylopia (Annonaceae)Xylosma (Flacourtiaceae)Zornia (Fabaceae)
Non Arboreal PollenAcalypha (Euphorbiaceae)Alternanthera (Amaranthaceae)Amaryllis (Amaryllidaceae)Apiaceae b20AraceaeArtemisia (Asteraceae)Asteraceae ligulifloraeAsteraceae tubulifloraeBegonia (Begoniaceae)Borreria (Rubiaceae)Satureja (Lamiaceae)BromeliaceaeCaryophyllaceaeCayaponia (Cucurbitaceae)ChenopodiaceaeCleome (Cleomaceae)CommelinaceaeCoussoureaCucurbitaceaeCuphea (Lythraceae)EricacaceaeEriocaulon (Eriocaulaceae)Eryngium (Apiaceae)Evolvulus (Convolvulaceae)Fuchsia (Onagraceae)Gomphrena (Amaranthaceae)Hyptis (Lamiaceae)Justicia (Acanthaceae)LamiaceaeLoranthaceaeMalvaceae

151M.-P. Ledru et al. / Palaeogeography, Palaeoclimatology, Palaeoecology 271 (2009) 140–152
Mikania (Asteraceae)Philodendron (Araceae)Piper (Piperaceae)Polygala (Polygalaceae)Puya-type (Bromeliaceae)PoaceaePolygonum (Polygonaceae)Struthantus (Loranthaceae)Trixis (Asteraceae)
Aquatics and terrestrial influenced by water levelAlismataceaeCabombaCyperaceaeDrosera (Droseraceae)IridaceaeJuncaceaeLentibularia (Lentibulariaceae)MyriophyllumNymphoidesOnagraceaeTypha (Typhaceae)UrticalesXyris (Xyridaceae)AnthocerosIsoetesSphagnum
Ferns and bryophytesCyathea type 1Cyathea type 2Cyathea type 3Cyathea esquaquensisCyathea ref. 296 Hooghiemstra 1984Cyathea horrida (vdH)DicksoniaEphedraGrammitesJamesonia-typeLophosoriaLycopodiumMeeseaMonoleteMougeotiaOphioglossumPolypodiumSelaginellaSchizeaceaeTheliptirysTrichomanesTrilete
AlgaeBotryococcusCoelostrumPediastrumZygnema
Varia meaning unidentified taxa: 10 types
References
Araujo, A.G.M., Neves, W.A., Pilo, L.B., Atui, J.P.V., 2005. Holocene dryness and humanoccupation in Brazil during the “Archaic Gap”. Quaternary Research 64, 298–307.
Argollo, J., Mourguiart, P., 2000. Late Quaternary climate history of the BolivianAltiplano. Quaternary International 72, 37–51.
Baker, P.A., et al., 2001. Tropical climate changes at millenial and orbital timescales onthe Bolivian Altiplano. Nature 409, 698–701.
Barnola, J.M., Raynaud, D., Korotkevich, Y.S., Lorius, C., 1987. Vostok ice core provides160,000-year record of atmospheric CO2. Nature 329, 408–414.
Behling, H., 1997. Late Quaternary vegetation, climate and fire history from the tropicalmountain region ofMorro de Itapeva, SE Brazil. Palaeogeography PalaeoclimatologyPalaeoecology 129, 407–422.
Behling, H., Negrelle, R.R.B., 2001. Late Quaternary tropical rain forest and climatedynamics from the Atlantic lowland in southern Brazil. Quaternary Research 56,383–389.
Behling, H., Negrelle, R.R.B., Colinvaux, P.A., 1997. Modern pollen rain data from thetropical Atlantic rain forest, Reserva Volta Velha, South Brazil. Review ofPalaeobotany and Palynology 97, 287–299.
Behling, H., Arz, H.W., Pätzold, J.,Wefer, G., 2002. Late Quaternary vegetational and climatedynamics in southeastern Brazil, inferences frommarine core GeoB 3229-2 and GeoB3202-1. Palaeogeography, Palaeoclimatology, Palaeoecology 179, 227–243.
Bennett, K.D., 1997. Evolution and ecology. The pace of life. Cambridge studies inecology. University Press, Cambridge. 241 pp.
Berger, A., Loutre, M.F., 1991. Insolation values for the climate of the last 10 million ofyears. Quaternary Science Reviews 10, 297–317.
Bush, M., 2002. Distributional change and conservation on the Andean flank: apalaeoecological perspective. Global Ecology and Biogeography 11, 463–473.
Carvalho, L.M.V., Jones, C., Liebmann, B., 2004. The South Atlantic Convergence Zone:intensity, form, persistence, and relationships with intraseasonal to interanualactivity and extreme rainfall. Journal of Climate 17, 88–108.
Crowley, T.J., 2000. Causes of climate change over the past 1000 years. Science 289,270–276.
Cruz, F.W.J., Burns, S.J., Karmann, I., Sharp, W.D., Vuille, M., Cardoso, A.O., Ferrari, J.A.,Silva Dias, P.L., Viana, O.J., 2005. Insolation-driven changes in atmosphericcirculation over the past 116,000 years in subtropical Brazil. Nature 434, 63–66.
Cruz, F.W.J., Burns, S.J., Karmann, I., Sharp, W.D., Vuille, M., Ferrari, J.A., 2006. Astalagmite record of changes in atmospheric circulation and soil processes in theBrazilian subTropics during the Late Pleistocene. Quaternary Science Reviews 25(1–2), 2749–2761.
Dansgaard,W., Johnsen, S.J., Clausen, H.B., Dahljensen, D.S., Gundestrup, N., Hammer, C.U.,Hviberg, C.S., Steffensen, J.R., Sveinbjörnsdottir, A.E., Jouzel, J., Bond, G., 1993. Evidencefor general instability of past climate from a 250-kyr ice core record. Nature 364,218–220.
Davis, M.B., Shaw, R.G., 2001. Range shifts and adaptative responses to Quaternaryclimate change. Science 292 (5517), 673–679.
Enright, N.J., Hill, R.S., 1995. Ecology of the Southern Conifers. Melbourne UniversityPress. 342 pp.
EPICA, c.m., 2004. Eight glacial cycles from an Antarctic ice core. Nature 429, 623–628.Faegri, K., Iversen, J., 1989. Textbook of Pollen Analysis. J. Wiley & Sons, Chichester, U.K.
328 pp.Gan, M.A., Kousky, V.E., Ropelewski, C.F., 2004. The South American monsoon
circulation and its relationship to rainfall over West-Central Brazil. Journal ofClimate 17, 47–66.
Garcia, R.J.F., Pirani, J.R., 2005. Analise floristica, ecologica e fitigeografica do NucleoCurucutu, Parque estadual da Serra do Mar (São Paulo), com ênfase nos camposjunto à crista da Serra do Mar Hoehnea 32 (1), 1–48.
Garreaud, R.D., 2000. Cold air incursions over subtropical South America: meanstructure and dynamics. Monthly Weather Review 128, 2544–2559.
Hewitt, G.E., 2000. The genetic legacy of the Quaternary ice ages. Nature 405, 907–913.Johnsen, S.J., Dahl-Jensen, D., Gundestrup, N., Steffensen, J.P., Clausen, H.B., Miller, H.,
Masson-Delmotte, V., Sveinbjörnsdottir, A.E., White, J., 2001. Oxygen isotope andpalaeotemperature records from six Greenland ice-core stations: Camp Century,Dye-3, GRIP, GISP2, Renland and NorthGRIP. Journal of Quaternary Science 16 (4),299–307.
Joly, C.A., Aidar, M.P.M., Klink, C.A., Mcgrath, D.G., Moreira, A.G., Moutinho, P., Nepstad,D.C., Oliveira, A.A., Pott, A., Rodal, M.J.N., Sampaio, E.V.S.B., 1999. Evolution of theBrazilian phytogeography classification systems: implications for biodiversityconservation. Ciência e Cultura 51 (5/6), 331–348.
Jomelli, V., Argollo, J., Brunstein, D., Favier, V., Hoffmann, G., Ledru, M.P., Sicart, J.E., 2008.Multiproxy analysis of climate variability for the last millennium in the tropicalAndes. In Recent improvements in climate research. Nova Science.
Jöris, O., Weninger, B., 1998. Extension of the 14C calibration curve to ca. 40,000 cal BCby synchronizing Greenland 18O/16O ice core records and North Atlanticforaminifera profiles: a comparison with U/Th coral data. Radiocarbon 40 (1),495–504.
Jouzel, J., Lorius, C., Johnsen, S.J., Grootes, P.M., 1994. Climate instabilities: Greenlandand Antarctic records. Compte Rendus de l'Académie des Sciences de Paris 319 (II),65–77.
Kershaw, A.P., 1978. Record of last interglacial-glacial cycle from NortheasternQueensland. Nature 272, 159–161.
Kershaw, A.P., Wagstaff, B., 2001. The southern conifer family Araucariaceae: history,status and value for paleoenvironmental reconstruction. Annual Review of Ecologyand Systematics 32, 397–414.
Kershaw, A.P., Whitlock, C., 2000. Palaeoecological records of the last glacial–interglacial cycle: patterns and causes of change. Palaeogeography, Palaeclimatol-ogy, Palaeoecology 155, 1–5.
Kukla, G.J., Bender,M.L., Beaulieu, J.L.D., Bond, G., Broecker,W.S., Cleveringa, P., Gavin, J.E.,Herbert, T.D., Imbrie, J., Jouzel, J., Keigwin, L.D., Knudsen, K.L.,Mcmanus, J.F.,Merkt, J.,Muhs, D.R., Müller, H., Poore, R.Z., Porter, S.C., Seret, G., Shackleton, N.J., Turner, C.,Tzedakis, P.C., Winograd, I.J., 2002. Last interglacial climates. Quaternary Research58, 2–13.

152 M.-P. Ledru et al. / Palaeogeography, Palaeoclimatology, Palaeoecology 271 (2009) 140–152
Ledru, M.P., 1993. Late Quaternary environmental and climatic changes in Central Brazil.Quaternary Research 39, 90–98.
Ledru, M.P., 2002. Late Quaternary history and evolution of the cerrados as revealed bypalynological records. In: Oliveira, P.S., Marquis, R.J. (Eds.), The cerrados of Brazil:Ecology and natural history of a neotropical savanna. Columbia University Press,New York USA, pp. 33–52.
Ledru, M.P., Soares Braga, P.I., Soubiès, F., Fournier, M., Martin, L., Suguio, K., Turcq, B.,1996. The last 50,000 years in the Neotropics (Southern Brazil): evolution ofvegetation and climate. Palaeogeography, Palaeoclimatology, Palaeoecology 123,239–257.
Ledru, M.P., Bertaux, J., Sifeddine, A., Suguio, K., 1998a. Absence of Last Glacial Maximumrecords in lowland tropical forests. Quaternary Research 49, 233–237.
Ledru, M.P., Salgado-Labouriau, M.L., Lorscheitter, M.L., 1998b. Vegetation dynamics insouthern and central Brazil during the last 10,000 yr B.P. Review of Palaeobotanyand Palynology 99, 131–142.
Ledru, M.P., Rousseau, D.D., Cruz, J.F.W., Karmann, I., Riccomini, C., Martin, L., 2005.Paleoclimate changes during the last 100 ka from a record in the Brazilian atlanticrainforest region and interhemispheric comparison. Quaternary Research 64,444–450.
Ledru, M.P., Salatino, M.L.F., Ceccantini, G.T., Salatino, A., Pinheiro, F., Pintaud, J.C., 2007.Regional assessment of the impact of climatic change on the distribution of atropical conifer in the lowlands South America. Diversity and Distributions 13 (6),761–771.
Lenters, J.D., Cook, K.H., 1999. Summertime precipitation variability over SouthAmerica: role of the Large-Scale circulation. Monthly Weather Review 127,409–431.
Leroux, M., 1998. Dynamic Analysis of Weather and Climate. Wiley, London. 365 pp.Marengo, J.A., Cornejo, A., Satyamurty, P., Nobre, C., Sea, W., 1997. Cold surges in tropical
and extratropical South America: the strong event in June 1994. Monthly WeatherReview 125, 2759–2786.
Martin, L., Flexor, J.M., Suguio, K., 1995. Vibrotestemunhador leve: construção, utilizaçãoe potencialidades. Revista de l'Instituto de Geociências São Paulo 16 (1/2), 59–66.
Myers, N., Mittermeier, R.A., Mittermeier, C.G., Fonseca, G.A.B.D., Kent, J., 2000.Biodiversity hotspots for conservation priorities. Nature 403, 853–858.
Oliveira Filho, A.T., Fontes, M.A.L., 2000. Patterns of floristic differentiation amongAtlantic forest in south-eastern Brazil, and the influence of climate. Biotropica 32(4b), 793–810.
Oliveira Filho, A.T., Jarenkow, J.A., Nogueira Rodal, M.J., 2006. Floristic relationships ofseasonally dry forests of Eastern South America based on tree species distribution
patterns. In: Pennington, T., Lewis, G.P., Ratter, J.A. (Eds.), Neotropical Savannas andDry forests: Plant diversity, Biogeography, and Conservation. Taylor & Francis, BocaRaton FL, USA, pp. 159–192.
Paillard, D., Labeyrie, L., Yiou, P., 1996. Macintosh program performs time-seriesanalysis. Eos, Transactions, American Geophysical Union 77, 379.
Petit, J.R., Jouzel, J., Raynaud, D., Barkov, N.I., Barnola, J.M., Basile, I., Bender, M.L.,Chappellaz, J., Davis, M.E., Delaygue, G., Delmotte, M., Kotlyakov, V.M., Legrand, M.,Lipenkov, V.Y., Lorius, C., Pépin, L., Ritz, C., Saltzman, E., Stievenard,M.,1999. Climateand atmospheric history of the past 420,000 years from the Vostock ice core,Antarctica. Nature 399, 429–436.
Petit, R.J., Brewer, S., Bordacs, S., Burg, K., Cheddadi, R., Coart, E., Cottrell, J., Csaikl, U.M., VanDam, B., Deans, J.D., Espinel, S., Fineschi, S., Finkeldey, R., Glaz, I., Goicoechea, P.G.,Jensen, J.S., Kôonig, A.O., Lowe, A.J., Madsen, S.F., Matyas, G., Munro, R.C., Popescu, F.,Slade, D., Tabbener, H., De Vries, S.G.M., Ziegenhagen, B., De Beaulieu, J.L., Kremer, A.,2002. Identification of refugia and post-glacial colonisation routes of European whiteoaks based on chloroplast DNA and fossil pollen evidence. Forest Ecology andManagement 156, 49–74.
Pezza, A.B., Ambrizzi, T., 2003. Variability of Southern Hemisphere cyclone andanticyclone behavior: further analysis. Journal of Climate 16, 1075–1083.
Riccomini, C., Turcq, B., Martin, L., Moreira, M.Z., Lorscheitter, M.L., 1991. The Colôniaastrobleme, Brasil. Revista do Instituto de Geociências, São Paulo 12 (1/2), 87–94.
Schmitz, P.I., Barbosa, A.S., Jacobus, A.L., Barberi, M., 1989. Arqueologia nos cerrados doBrasil Central – Serranópolis I –, Pesquisas. Antropologia, vol. 44. Instituto Anchietade Pesquisas, São Leopoldo, p. 208.
Stuiver, M., Reimer, P.J., Bard, E., Beck, J.W., Burr, G.S., Hughen, K.A., Kromer, B.,Mccormac, F.G., Van Der Plicht, J., 1998. INTCAL 98 Radiocarbonage calibration24,000–0 cal BP. Radiocarbon 40, 1127–1151.
Thompson, L.G., Davis, M.E., Mosley-Thompson, E., Lin, P.N., Henderson, K.A., Mashiotta,T.A., 2005. Tropical ice core records: evidence for asynchronous glaciation onMilankovitch timescales. Journal of Quaternary Science 20 (7–8), 723–733.
Vivo, M.D., Carmignotto, A.P., 2004. Holocene vegetation change and the mammmalfaunas of South America and Africa. Journal of Biogeography 31, 943–957.
Willis, K.J., Araujo, M.B., Bennett, K.D., Figueroa-Rangel, B., Froyd, C.A., Myers, N., 2007.How can a knowledge of the past help to conserve the future? Biodiversityconservation and the relevance of long-term ecological studies. PhilosophicalTransactions of the Royal Society of London. B 362, 175–186.