Isotopic constraints on glacial/interglacial changes in the oceanic nitrogen budget
ARTICLE IN PRESS
0277-3791/$ - se
doi:10.1016/j.qu
�CorrespondE-mail addr
Quaternary Science Reviews 26 (2007) 793–807
Rockglacier activity during the Last Glacial–Interglacial transitionand Holocene spring snowmelting
Øyvind Paaschea,�, Svein Olaf Dahla,b, Reidar Løvliec, Jostein Bakkea,b, Atle Nesjea,c
aBjerknes Centre for Climate Research, Allegt. 55, N-5007, Bergen, NorwaybDepartment of Geography, University of Bergen, Fosswinckelsgt. 6, N-5020, Bergen, Norway
cDepartment of Earth Science, University of Bergen, Allegt. 41, N-5007 Bergen, Norway
Received 7 November 2005; received in revised form 15 November 2006; accepted 16 November 2006
Abstract
The environmental history of a talus-derived rockglacier located in northern Norway has been reconstructed through the Last
Glacial–Interglacial transition based on two cores retrieved from an adjacent lake. The methods used to quantify sedimentary properties
include rock magnetism, grain size analyses, loss-on-ignition (LOI) and bulk density, which when combined has enabled an unmixing of
the various sediment components and their corresponding sources. Rockglaciers signify mean annual air temperatures (MAAT) of �4 1C
or colder, but little is known about their dynamical response to changing thermal regimes. We document here for the first time that a
permafrost regime did exist in northern Norway during the lateglacial period, and that it required a lowering equivalent of at least 7 1C
compared to present-day MAAT. The lake sediments suggest that the rockglacier existed prior to the local deglaciation of the
Fennoscandian Ice Sheet (414 800 cal yr BP), and continued its expansion until the end of the Younger Dryas whereupon it became
fossil. The cool climate of the lateglacial was intersected by brief warming spells that caused a systematic release of sedimentladen
meltwater from the rockglacier. During the Holocene the minerogenic influx to the lake was driven by spring snowmelting, which are
related to the magnitude of winter precipitation. Three phases are recognised: (1) 9800–6500 cal yr BP when wet winters prevailed, (2)
6500–4000 cal yr BP with dry winters, and (3) the last 4000 cal yr BP with a return to wetter winters.
r 2006 Elsevier Ltd. All rights reserved.
1. Introduction
Rapid degrading permafrost followed by thaw subsi-dence represents a major challenge for policy makers in thecoming century, a process that is escalating in the Arcticregion (Overpeck et al., 1997; Moritz et al., 2002;Christensen et al., 2004; Smol et al., 2005). But suchlarge-scale climate adjustments are not new, although fordifferent reasons, and complementary analogues do exist inthe lateglacial–Holocene record. During the lateglacialperiod, widespread areas above (i.e. nunataks) and outsidethe margins of the Fennoscandian Ice Sheet (FIS) wereprobably subjected to permafrost conditions (MAAT of�4 1C or colder), which most likely started to melt veryrapidly at the onset of the Holocene as it did in northern
e front matter r 2006 Elsevier Ltd. All rights reserved.
ascirev.2006.11.017
ing author. Tel.: +4755 583297; fax: +47 55 589803.
ess: [email protected] (Ø. Paasche).
Siberia (see for instance Smith et al., 2004). Unfortunately,such scenarios have been difficult to observe in the Arcticdue to the scarcity of relevant sites and suitable proxies.Lakes are one of the few robust terrestrial archives foundin the Arctic that can record continuous environmentalchange over longer time periods (104 yrs) (e.g. Bradleyet al., 1996), and is therefore well-suited for trackingsedimentary changes associated with degrading permafrostregimes.The connection between rockglaciers and lake sediments
has only briefly been investigated (Zielinski, 1989) andcurrent knowledge of how active rockglaciers interact withclimate are primarily based on modern observations (seeHumlum, 1997, 1998a). Talus-derived rockglaciers (re-ferred to as rockglaciers hereafter) are unambiguousindicators of permafrost conditions (e.g. Barsch, 1996)and contain an inner body of ice that is carpeted bysheltering rocks. During summer heat penetrates the rockysurface and melts parts of the ice. Water-output from
ARTICLE IN PRESSØ. Paasche et al. / Quaternary Science Reviews 26 (2007) 793–807794
active rockglaciers are probably manifested throughsubsurface water currents, flowing along the upper icesurface in addition to subsurface discharge/seepage(Giardino et al., 1992) before joining downstream riversand/or enter lakes. The source for such exit water ismost likely balanced between melting of the rockglacier’sinternal ice body, groundwater seepage and additionalrunoff from the catchment. Monitoring rockglacierrunoff shows that peak discharges tend to co-vary withmaximum air temperature during the summer season(Berger et al., 2005), demonstrating a close couplingbetween rockglacier activity and climate. A prevailingwarmer climate will create disequilibrium between meltingand refreezing and the rockglacier will lose its internal icemass and eventually become fossil. Since it is mainly theMAAT that constrain rockglacier activity they maycomplement traditional summer temperature proxies (pol-len, chironomides, plant macrofossils and so on) withadditional paleoclimatic information (Haeberli, 1985;Humlum, 1998b; Sailer and Kerschner, 1999; Frauenfelderand Kaab, 2000).
Rockglaciers are lobe or tongue shaped landforms withsteep front sides and near flat plateaus that typicallycontinue into one or several parent talus sheets or cones(Wahrhaftig and Cox, 1957). The surface texture is usuallydominated by angular material of varying size, which insome cases make up transverse ridges. The internal flowpatterns of rockglaciers are complex with differential flow-line trajectories along multiple shear planes that concen-trate horizontal movement (Arenson et al., 2002). Thepresence of sediments and fluid water may affect shearstress (i.e. deformation) within the main ice body that canmake up between 30% and 70% of the overall rockglaciervolume (e.g. Barsch, 1996).
Grain size analysis of sediments recovered from drillingrockglaciers shows a predominant mixture of sand andsilt (Barsch et al., 1979; Arenson et al., 2002), whereasmeasures of sediment load in meltwater discharge froman Austrian rockglacier shows that during maximumdischarge of 300 l s�1 the sediment load is close to 1 g l�1
(Krainer and Mostler, 2002). Discharge from rockglaciersis related to both total size and ice-volume and is knownto vary from 1 to 100 lmin�1 (e.g. Giardino et al., 1992),but higher volumes have also been observed (Gardnerand Bajewsky, 1987; Krainer and Mostler, 2002). Theparent talus from which rockglaciers evolve constrainsthe sediment supply and production that is available forlater reworking and meltwater transport. The sedimenttexture of taluses reflects local bedrock and most likelyclimate-related processes such as frequency of snowavalanches, debris flows, precipitation and temperature(Rapp, 1960; Ballantyne and Harris, 1994). Analyses ofrelict taluses in Scotland show that almost 30% of theweighted material is composed of sediments being o2mm(Salt and Ballantyne, 1997; Hinchliffe et al., 1998)suggesting that fine grained sediments are available forentrainment by meltwater.
Geophysical methods have successfully revealed impor-tant aspects of the internal structure of rockglaciers (e.g.Isaksen et al., 2000), but knowledge of how they interactwith changing climate conditions are poor due to few andshort instrumental records. In this study, two cores withsediments partly originating from a rockglacier have beenretrieved from Trollvatnet, a small lake in northernNorway. This setting has enabled the unique possibilityto observe how these landforms react to changing climateconditions during periods with assumed permafrost, as wellas the transition from a glacial to an interglacial climate.The Holocene sequence following the rockglacier fossilisa-tion reveals a promising record of spring snowmelting,which seems to be closely related to the amount of winterprecipitation.
2. Site and bedrock
The study site is located in northern Lyngen, northernNorway (691380N, 191530E) on a north–south stretchingpeninsula with Ullsfjorden to the west and Lyngenfjordento the east (Fig. 1). Alpine peaks, empty cirques andtemperate glaciers dominate the landscape together withintersecting valleys with relict rockglaciers, moraines andlarge talus cones. The mean annual air temperature is2.8 1C (Aune, 1993), whereas the mean annual precipitationis between 700 and 900mm (Førland, 1993). The presentclimate may hence be defined as being semi-maritime whererelatively cold and wet winters is balanced by mildsummers. Polythermal plateau glaciers located in themountains of southern Lyngen at 1800–1600m altitude(Gordon et al., 1988) suggest a current local permafrostboundary in the vicinity of 1500m.The upper western flank of the study area is dominated
by gabbroic rocks that originate from layered opholites,while the lower flank is made up of different metasedi-mentary groups, typically with intrusions of quartzite andmica schist. Two bands of conglomeratic calciferous micaschist and conglomeratic quartzite runs right throughTrollvatnet, whereas the taluses above the lake’s westernside consists of gabbro intersected by thin layers ofperiodite (Zwaan et al., 1998).
3. Previous work and deglaciation history
The basic morphological characteristics of the Trollvat-net rockglacier have previously been mapped and itwas classified as an inactive/relict ‘valley-wall’ complex(Maclean, 1991). The rockglacier is positioned outside twoestablished stages of the FIS in northern Norway, knownas ‘Skarpnes’ (Older Dryas) �14 200 cal yr BP and ‘Trom-sø-Lyngen’ (Younger Dryas) �12 500 cal yr BP (e.g.Andersen, 1968; Plassen and Vorren, 2003) (Fig. 1). Recentwork document that most of the lower parts of northernLyngen was deglaciated by the Bølling Interstade (Bakkeet al., 2005) suggesting that large areas were ice free by theonset of the lateglacial. The physiographic setting of the
ARTICLE IN PRESS
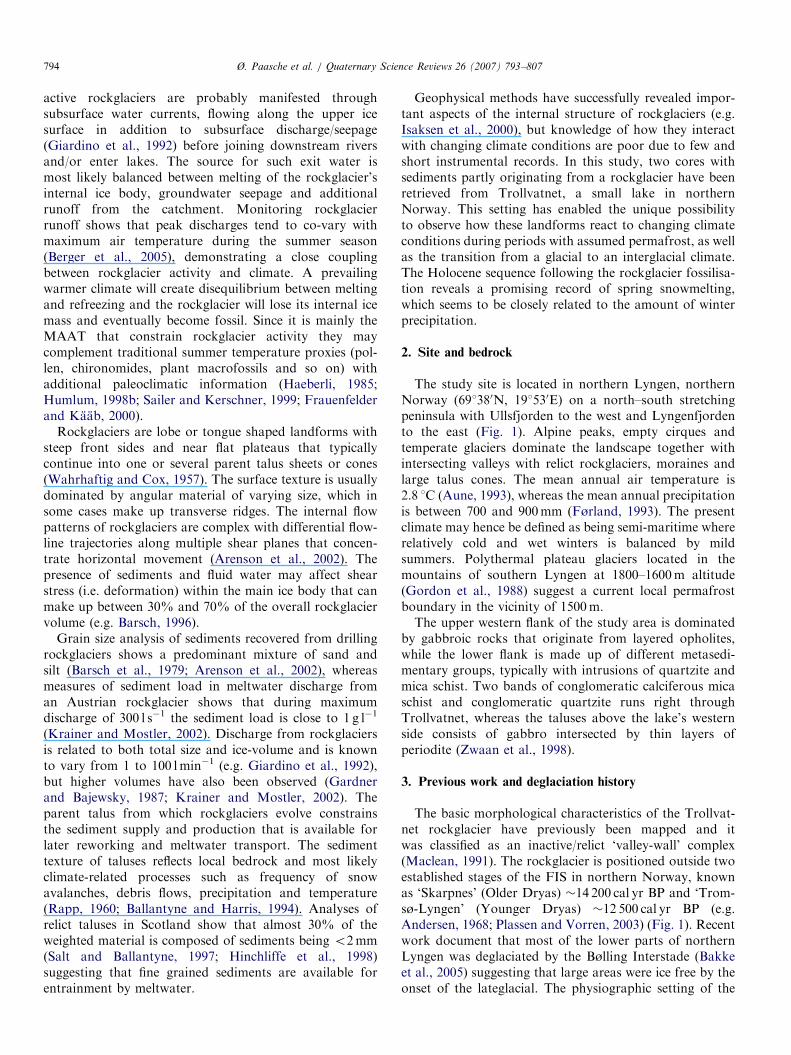
Fig. 1. The overview map on the left-hand side shows the ice margins during the lateglacial in northern Norway (and in more detail on the right-hand side)
represented by two prominent stages known as Skarpnes (�14 200 cal yrBP) and Tromsø-Lyngen (�12 500 cal yr BP), as suggested by Holms and
Andersen, 1964; Andersen, 1968; Vorren and Elvsborg, 1979; Fimreite et al., 2002; and unpublished data of the authors. The map on the right-hand side
shows that lake Trollvatnet and the investigated rockglacier lie just outside these two ice margins. The contour interval is 20m (grey lines) between 0 and
200m altitude and 100m between 200 and 1400m altitude.
Ø. Paasche et al. / Quaternary Science Reviews 26 (2007) 793–807 795
low-relief landscape (o150m altitude) where Trollvatnetand Fiskvatnet are located suggests that whenever a glacieroccupied Ullsfjorden, meltwater was rerouted northwards(Fig. 1). This has been shown to be the case for theSkarpnes event, but not during the Tromsø-Lyngen stage(Paasche et al., 2004).
4. Methods
4.1. Coring and mapping
A piston corer (110mm) (Nesje, 1992) operated froma mobile raft was used to retrieve two near 6m longcores from Lake Trollvatnet (92m altitude) during thesummer of 2000. The bathymetric map of the lake is basedon 8 transects made with continuous echo-soundingmeasurements (Fig. 2). The two cores (referred to as T-1and T-2 hereafter) are taken some 100m apart withinthe deepest part of the basin. Grain size analyses, mag-netic susceptibility, loss-on-ignition (LOI) and bulkdensity was performed on core T-1, whereas standardrock magnetic parameters was obtained from core T-2.Material for radiocarbon dating was collected fromboth cores. Because the lowermost three metres of both
cores were disturbed during transport they were notsampled for any parameters. A Garmin GPS withbuild-in altimeter was used for the purpose of fieldmapping in combination with aerial photo interpretation(scale 1: 40,000).
4.2. Grain size distribution
Grain size analyses were performed with 1 cm resolutionfor intervals between 0–127 and 240–266 cm depth, andwith 0.5 cm resolution for 266.5–271.5 and 127.5–239.5 cmdepth (n ¼ 380). All samples were wet sieved for theo63 mm fraction, mixed with a 0.05% calgon (sodiumhexametaphosphate) dispersing solution and left to homo-genise and deflocculate for 412 h before analysed. Con-sidering that some material was lost during the sieving, andthat the samples initially were wet when weighted, the finalsample concentration is probably somewhat lower than�40 gL�1 or 4% by volume. Subsequently, all sampleswere measured for grain sizes 65–1.5mm on a Sedigraph5100, being the optimal size range for this instrument (e.g.McCave and Syvitski, 1991). All statistical processing ofthe raw grain size data were analysed with GRADISTAT(Blott and Pye, 2001).
ARTICLE IN PRESS
100 m
10 m
9 m
8 m
7 m
6 m
5 m
4 m
3 m
2 m
1 m
<1 m
TrollvatnetCoring sites
Rock
gla
cier
fro
nt
Outflow
Inflow
T-1
T-2
N
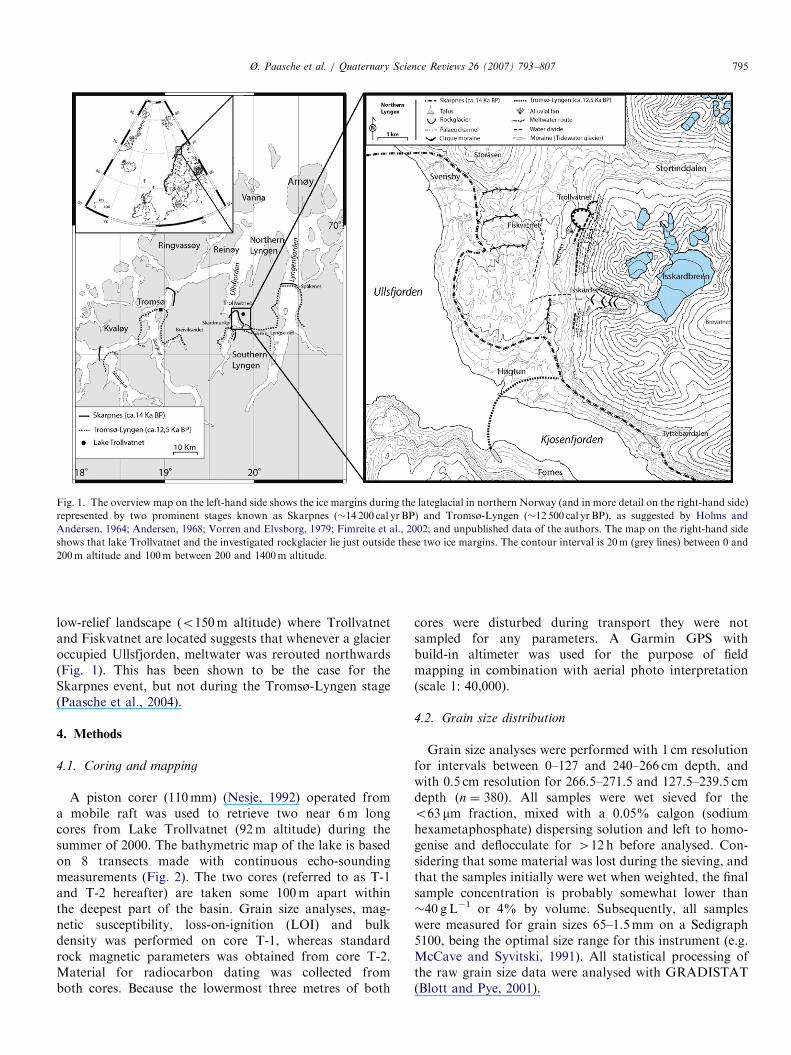
Fig. 2. Shows the simple bathymetry of lake Trollvatnet, the coring sites
(black stares) and the position of the front lobe of the rockglacier as well
as the inflow and outflow. The area surrounding Trollvatnet include steep
taluses, mountain ravines and barren bedrock. The mountain ravines high
above the taluses store snowfields that discharge meltwater throughout the
summer, relocating material within the talus and eventually bringing the
finest fractions down to the lake.
Ø. Paasche et al. / Quaternary Science Reviews 26 (2007) 793–807796
4.3. Organic matter and radiocarbon dating
LOI was obtained by extracting 1 cm3 of material with aplastic syringe at 0.5 cm interval. The samples were driedovernight at 105 1C before heated in a furnace to 550 1C for1 h. LOI determined after heating to 550 1C gives anapproximation of the total organic matter and is, if dividedby a constant (2.1), indicative of the organic carbon presentin the sample (Dean, 1974). Bulk density values arecalculated based on the aforementioned approach.
Plant macrofossils used for radiocarbon dating wereidentified, washed and purified with distilled water beforedried overnight and stored in airtight glasses. The bulksamples were dried overnight at 100 1C and put in airtightplastic bags. Beta Analytic Inc. and the Poznan Radio-carbon Laboratory carried out the radiocarbon dating. Alldates have been converted to calendar years using CALIB4.1 (Stuiver et al., 1998).
4.4. Magnetic parameters
Material used for magnetic analyses on core T-2 wassampled with cubic plastic boxes (2� 2� 1.6 cm3) for every1 cm throughout the core (n ¼ 250). Initial magnetic
susceptibility (c) was determined on a KLY-2 inductionbridge (sensitivity: 4� 10�8 SI) on both wet and freeze-dried samples. The wet samples were corrected for thediamagnetic effect of water (�0.9� 10�8m3 kg�1). Fre-quency-dependant susceptibility was measured on aBartington MS2B dual-frequency sensor. Anhystereticremanent magnetisation (ARM) was imposed with a0.1mT DC field and a 100mT AC-field in a 2G af-demagnetiser, whereas remanent coercivity was obtainedby imposing selected samples to progressively highermagnetic fields. A solenoid was used to 175mT succeededby a pulse magnetiser (Redcliffe, maximum field 4.2 T).Imposed remanent magnetisation was measured either on aDigico spinner (noise level: 5� 10�7Am�1) or a 3-axesCryogenic magnetometer (CCL 350/450, noise level3� 10�8Am�1). Magnetic susceptibility was also mea-sured on split cores from both T-1 and T-2 using aBartington equipped with a MS2E surface sensor. More-over, susceptibility on T-1 was measured on plastic bags forevery 0.5 cm at the KLY-2 induction bridge with theexception of the dated intervals.
5. Results
5.1. Field mapping
The rockglacier above Trollvatnet is recognised by aseries of diagnostic features typical for such a landform(Fig. 3). A concentric, steep front (35–401) delimits thelobe-shaped terminus (30–40m high) that consists of largeinterlocked angular clasts overlying finer fractions asevident from exposures after minor fallouts. The lobeplateau is 600m long and 500m wide with a low meansurface slope angle (o51), and transverse ridges lyingperpendicular to the general surface flow direction. Theouter five ridges are crammed together, whereas the innerridges are deflected or broken. The ridges are characterizedby differentiated sorting. Circular depressions of severalmetres in both diameter and depth are present; the largestis located on the inner part of the lobe plateau. The parentcoalescing talus cones show a profound fall sorting whichcauses the largest boulders to form a rim that runs along itslower part. The exact boundary between the inner plateauand the talus foot is therefore somewhat unclear. Perennialsnowdrift accumulations are located in the mountain aboveTrollvatnet at some 1000m altitude, and produce melt-water that enters the lake throughout the summer. Severalof the adjacent cones inhabit distinct debris flow levees. Asmaller rockglacier has partly been built onto and into theTrollvatnet rockglacier, and a third more immature rock-glacier has formed on top of the northern side of thesecond complex.
5.2. Core stratigraphy and intervariability
Visual interpretation of the two cores (T-1 and T-2)suggests that the lower three metres of the near 6-m long
ARTICLE IN PRESS
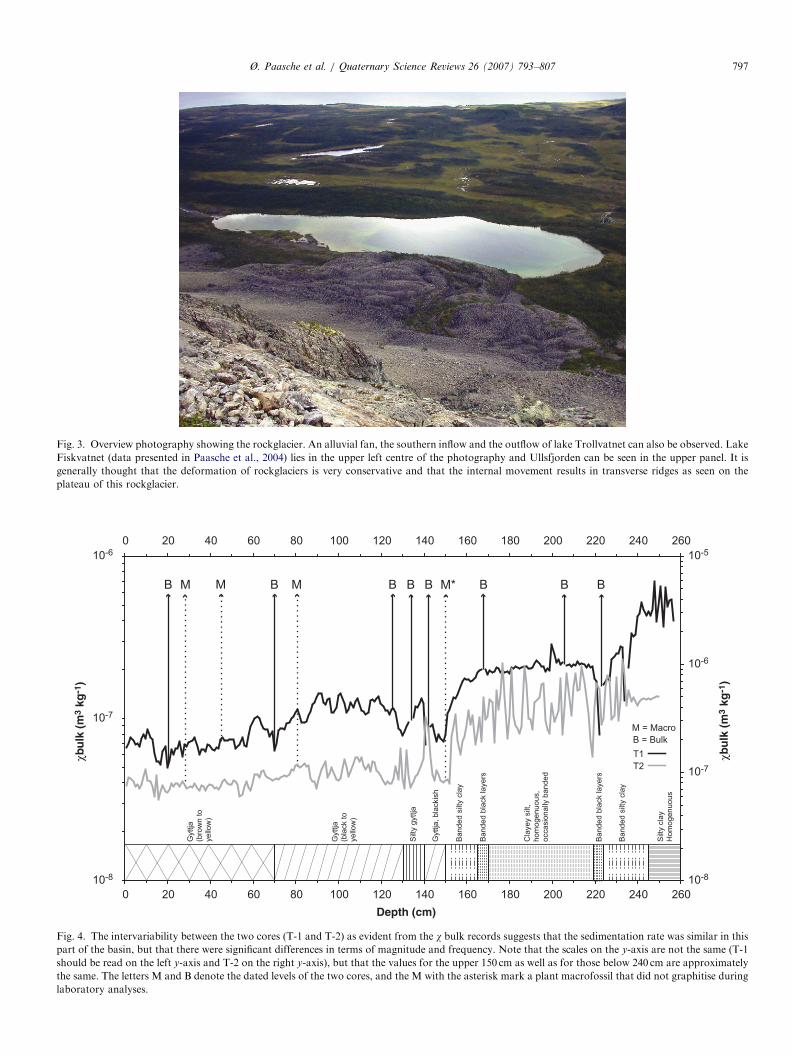
Fig. 3. Overview photography showing the rockglacier. An alluvial fan, the southern inflow and the outflow of lake Trollvatnet can also be observed. Lake
Fiskvatnet (data presented in Paasche et al., 2004) lies in the upper left centre of the photography and Ullsfjorden can be seen in the upper panel. It is
generally thought that the deformation of rockglaciers is very conservative and that the internal movement results in transverse ridges as seen on the
plateau of this rockglacier.
Gyttja
(bro
wn to
yello
w)
Gyttja
(bla
ck to
yello
w)
Silt
y g
yttja
Banded s
ilty c
lay
Banded s
ilty c
lay
Silt
y c
lay
Hom
ogenuous
Banded b
lack layers
Banded b
lack layers
Gyttja
, bla
ckis
h
Cla
yey s
ilt,
hom
ogenuous,
occasio
nally
banded
BBBBBBBB M M M M*
B = Bulk
M = Macro
10-8
10-7
10-6
0 20 40 60 80 100 120 140 160 180 200 220 240 260
Depth (cm)
10-8
10-7
10-6
10-5
0 20 40 60 80 100 120 140 160 180 200 220 240 260
T1
T2
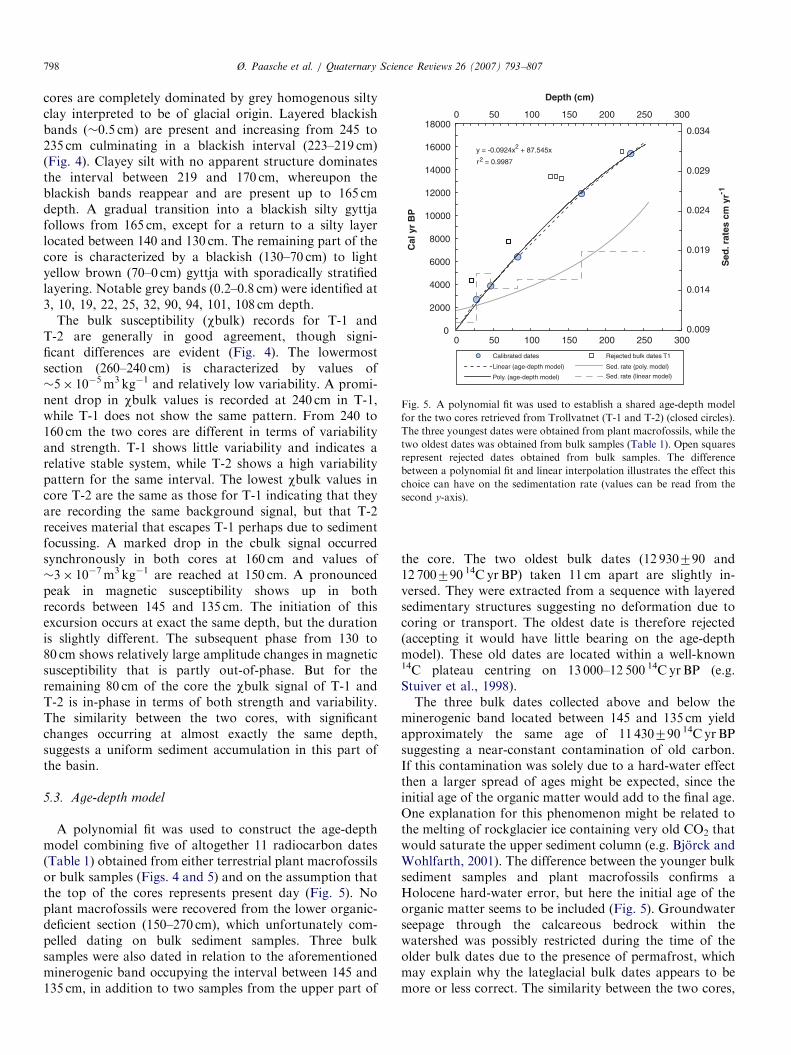
Fig. 4. The intervariability between the two cores (T-1 and T-2) as evident from the w bulk records suggests that the sedimentation rate was similar in this
part of the basin, but that there were significant differences in terms of magnitude and frequency. Note that the scales on the y-axis are not the same (T-1
should be read on the left y-axis and T-2 on the right y-axis), but that the values for the upper 150 cm as well as for those below 240 cm are approximately
the same. The letters M and B denote the dated levels of the two cores, and the M with the asterisk mark a plant macrofossil that did not graphitise during
laboratory analyses.
Ø. Paasche et al. / Quaternary Science Reviews 26 (2007) 793–807 797
ARTICLE IN PRESS
y = -0.0924x2 + 87.545x
r2 = 0.9987
0
2000
4000
6000
8000
10000
12000
14000
16000
18000
0 50 100 150 200 250 300
Depth (cm)
Cal
yr
BP
0.009
0.014
0.019
0.024
0.029
0.034
0 50 100 150 200 250 300
Calibrated dates Rejected bulk dates T1
Linear (age-depth model) Sed. rate (poly. model)
Poly. (age-depth model)
Sed
. rat
es c
m y
r- 1
Sed. rate (linear model)
Fig. 5. A polynomial fit was used to establish a shared age-depth model
for the two cores retrieved from Trollvatnet (T-1 and T-2) (closed circles).
The three youngest dates were obtained from plant macrofossils, while the
two oldest dates was obtained from bulk samples (Table 1). Open squares
represent rejected dates obtained from bulk samples. The difference
between a polynomial fit and linear interpolation illustrates the effect this
choice can have on the sedimentation rate (values can be read from the
second y-axis).
Ø. Paasche et al. / Quaternary Science Reviews 26 (2007) 793–807798
cores are completely dominated by grey homogenous siltyclay interpreted to be of glacial origin. Layered blackishbands (�0.5 cm) are present and increasing from 245 to235 cm culminating in a blackish interval (223–219 cm)(Fig. 4). Clayey silt with no apparent structure dominatesthe interval between 219 and 170 cm, whereupon theblackish bands reappear and are present up to 165 cmdepth. A gradual transition into a blackish silty gyttjafollows from 165 cm, except for a return to a silty layerlocated between 140 and 130 cm. The remaining part of thecore is characterized by a blackish (130–70 cm) to lightyellow brown (70–0 cm) gyttja with sporadically stratifiedlayering. Notable grey bands (0.2–0.8 cm) were identified at3, 10, 19, 22, 25, 32, 90, 94, 101, 108 cm depth.
The bulk susceptibility (wbulk) records for T-1 andT-2 are generally in good agreement, though signi-ficant differences are evident (Fig. 4). The lowermostsection (260–240 cm) is characterized by values of�5� 10�5m3 kg�1 and relatively low variability. A promi-nent drop in wbulk values is recorded at 240 cm in T-1,while T-1 does not show the same pattern. From 240 to160 cm the two cores are different in terms of variabilityand strength. T-1 shows little variability and indicates arelative stable system, while T-2 shows a high variabilitypattern for the same interval. The lowest wbulk values incore T-2 are the same as those for T-1 indicating that theyare recording the same background signal, but that T-2receives material that escapes T-1 perhaps due to sedimentfocussing. A marked drop in the cbulk signal occurredsynchronously in both cores at 160 cm and values of�3� 10�7m3 kg�1 are reached at 150 cm. A pronouncedpeak in magnetic susceptibility shows up in bothrecords between 145 and 135 cm. The initiation of thisexcursion occurs at exact the same depth, but the durationis slightly different. The subsequent phase from 130 to80 cm shows relatively large amplitude changes in magneticsusceptibility that is partly out-of-phase. But for theremaining 80 cm of the core the wbulk signal of T-1 andT-2 is in-phase in terms of both strength and variability.The similarity between the two cores, with significantchanges occurring at almost exactly the same depth,suggests a uniform sediment accumulation in this part ofthe basin.
5.3. Age-depth model
A polynomial fit was used to construct the age-depthmodel combining five of altogether 11 radiocarbon dates(Table 1) obtained from either terrestrial plant macrofossilsor bulk samples (Figs. 4 and 5) and on the assumption thatthe top of the cores represents present day (Fig. 5). Noplant macrofossils were recovered from the lower organic-deficient section (150–270 cm), which unfortunately com-pelled dating on bulk sediment samples. Three bulksamples were also dated in relation to the aforementionedminerogenic band occupying the interval between 145 and135 cm, in addition to two samples from the upper part of
the core. The two oldest bulk dates (12 930790 and12 700790 14C yrBP) taken 11 cm apart are slightly in-versed. They were extracted from a sequence with layeredsedimentary structures suggesting no deformation due tocoring or transport. The oldest date is therefore rejected(accepting it would have little bearing on the age-depthmodel). These old dates are located within a well-known14C plateau centring on 13 000–12 500 14C yrBP (e.g.Stuiver et al., 1998).The three bulk dates collected above and below the
minerogenic band located between 145 and 135 cm yieldapproximately the same age of 11 430790 14C yr BPsuggesting a near-constant contamination of old carbon.If this contamination was solely due to a hard-water effectthen a larger spread of ages might be expected, since theinitial age of the organic matter would add to the final age.One explanation for this phenomenon might be related tothe melting of rockglacier ice containing very old CO2 thatwould saturate the upper sediment column (e.g. Bjorck andWohlfarth, 2001). The difference between the younger bulksediment samples and plant macrofossils confirms aHolocene hard-water error, but here the initial age of theorganic matter seems to be included (Fig. 5). Groundwaterseepage through the calcareous bedrock within thewatershed was possibly restricted during the time of theolder bulk dates due to the presence of permafrost, whichmay explain why the lateglacial bulk dates appears to bemore or less correct. The similarity between the two cores,
ARTICLE IN PRESS
MOP-2
MOP-1
10 -8 10 -7 10 -6
17000
16000
15000
14000
13000
12000
11000
10000
9000
8000
7000
6000
5000
4000
3000
2000
1000
0
0.4 0.6 0.8 1
0 0.04 0.08 0.12 0.16 0 5 10 15 20 25
2 1.6 1.2 0.8 0.4 0
0
20
40
60
80
100
120
140
160
180
200
220
240
Bulk density (g/cm3)IRM100mT
/IRM3T
χARM (m3 kg-1)
χbulk (m3 kg-1) σSIRM (Am3 kg-1) σARM/σSIRM LOI 550 oC (%)
De
pth
(cm
)
Ca
l yr
BP
10 -510 -610 -710 -8
10 -210 -310 -410 -5 10 -1
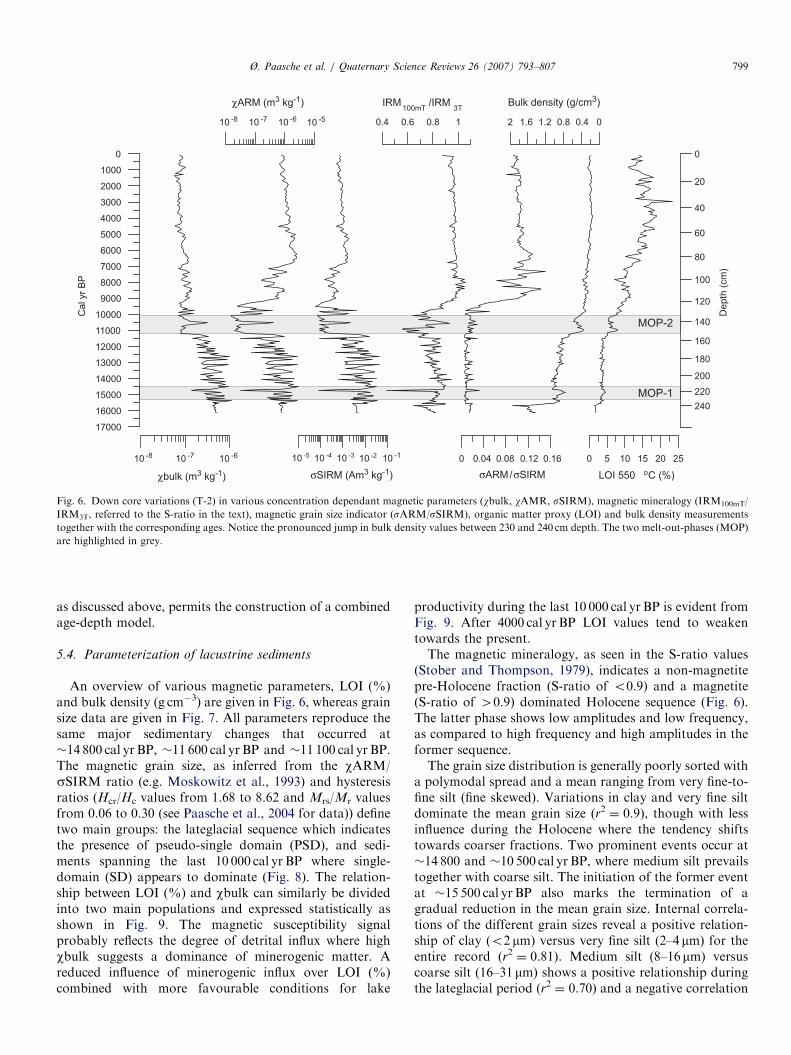
Fig. 6. Down core variations (T-2) in various concentration dependant magnetic parameters (wbulk, wAMR, sSIRM), magnetic mineralogy (IRM100mT/
IRM3T, referred to the S-ratio in the text), magnetic grain size indicator (sARM/sSIRM), organic matter proxy (LOI) and bulk density measurements
together with the corresponding ages. Notice the pronounced jump in bulk density values between 230 and 240 cm depth. The two melt-out-phases (MOP)
are highlighted in grey.
Ø. Paasche et al. / Quaternary Science Reviews 26 (2007) 793–807 799
as discussed above, permits the construction of a combinedage-depth model.
5.4. Parameterization of lacustrine sediments
An overview of various magnetic parameters, LOI (%)and bulk density (g cm�3) are given in Fig. 6, whereas grainsize data are given in Fig. 7. All parameters reproduce thesame major sedimentary changes that occurred at�14 800 cal yr BP, �11 600 cal yr BP and �11 100 cal yr BP.The magnetic grain size, as inferred from the wARM/sSIRM ratio (e.g. Moskowitz et al., 1993) and hysteresisratios (Hcr/Hc values from 1.68 to 8.62 and Mrs/Mr valuesfrom 0.06 to 0.30 (see Paasche et al., 2004 for data)) definetwo main groups: the lateglacial sequence which indicatesthe presence of pseudo-single domain (PSD), and sedi-ments spanning the last 10 000 cal yr BP where single-domain (SD) appears to dominate (Fig. 8). The relation-ship between LOI (%) and wbulk can similarly be dividedinto two main populations and expressed statistically asshown in Fig. 9. The magnetic susceptibility signalprobably reflects the degree of detrital influx where highwbulk suggests a dominance of minerogenic matter. Areduced influence of minerogenic influx over LOI (%)combined with more favourable conditions for lake
productivity during the last 10 000 cal yr BP is evident fromFig. 9. After 4000 cal yr BP LOI values tend to weakentowards the present.The magnetic mineralogy, as seen in the S-ratio values
(Stober and Thompson, 1979), indicates a non-magnetitepre-Holocene fraction (S-ratio of o0.9) and a magnetite(S-ratio of 40.9) dominated Holocene sequence (Fig. 6).The latter phase shows low amplitudes and low frequency,as compared to high frequency and high amplitudes in theformer sequence.The grain size distribution is generally poorly sorted with
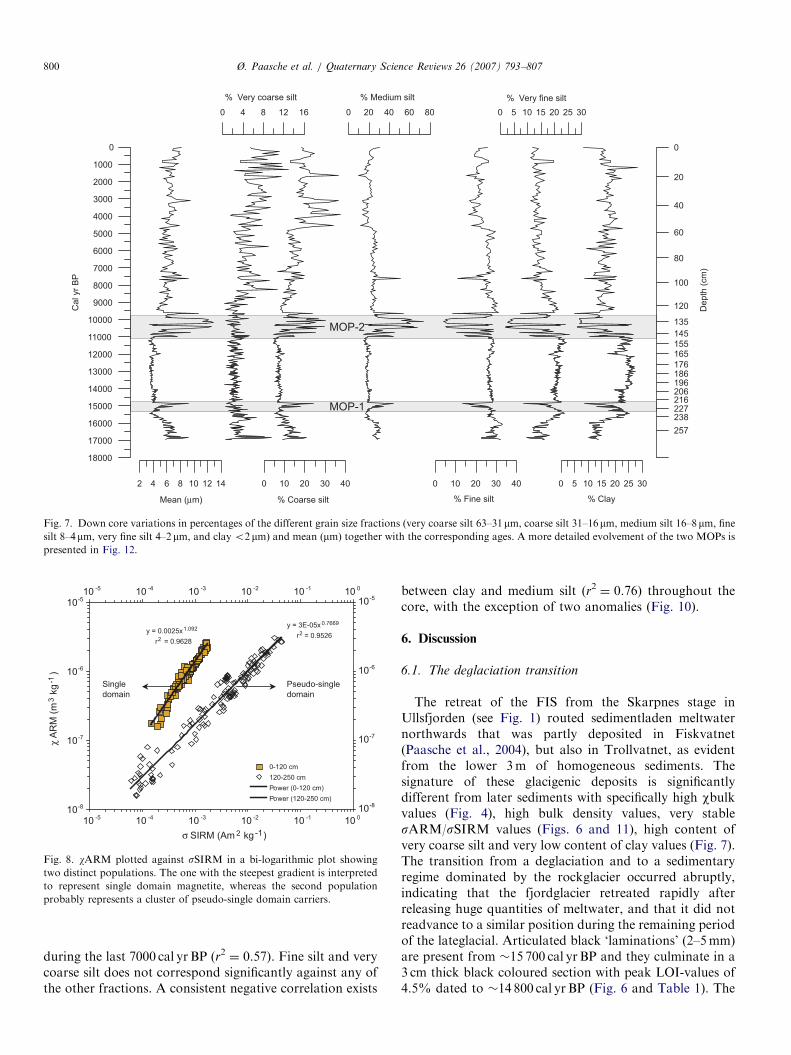
a polymodal spread and a mean ranging from very fine-to-fine silt (fine skewed). Variations in clay and very fine siltdominate the mean grain size (r2 ¼ 0.9), though with lessinfluence during the Holocene where the tendency shiftstowards coarser fractions. Two prominent events occur at�14 800 and �10 500 cal yr BP, where medium silt prevailstogether with coarse silt. The initiation of the former eventat �15 500 cal yr BP also marks the termination of agradual reduction in the mean grain size. Internal correla-tions of the different grain sizes reveal a positive relation-ship of clay (o2 mm) versus very fine silt (2–4 mm) for theentire record (r2 ¼ 0.81). Medium silt (8–16 mm) versuscoarse silt (16–31 mm) shows a positive relationship duringthe lateglacial period (r2 ¼ 0.70) and a negative correlation
ARTICLE IN PRESS
MOP-2
MOP-1
2 4 6 8 10 12 14
18000
17000
16000
15000
14000
13000
12000
11000
10000
9000
8000
7000
6000
5000
4000
3000
2000
1000
0
0 4 8 12 16
0 10 20 30 40
0 20 40 60 80
0 10 20 30 40
0 5 10 15 20 25 30
0 5 10 15 20 25 30
0
20
40
60
80
100
120
135
145
155165
176186196206216227238
257
% Very coarse silt % Medium silt % Very fine silt
% Clay% Fine silt% Coarse siltMean (μm)
Depth
(cm
)
Cal yr
BP
Fig. 7. Down core variations in percentages of the different grain size fractions (very coarse silt 63–31mm, coarse silt 31–16mm, medium silt 16–8mm, fine
silt 8–4mm, very fine silt 4–2mm, and clay o2 mm) and mean (mm) together with the corresponding ages. A more detailed evolvement of the two MOPs is
presented in Fig. 12.
y = 0.0025x1.092
r2 = 0.9628
y = 3E-05x 0.7669
r2 = 0.9526
10-8
10-7
10-6
10-5
10 -5 10 -4 10 -3 10 -2 10 -1 10 0
σ SIRM (Am 2 kg-1)
χA
RM
(m
3 k
g-1
)
0-120 cm
120-250 cm
Power (0-120 cm)
Power (120-250 cm)
Single
domain
Pseudo-single
domain
10-8
10-7
10-6
10-510 -5 10 -4 10 -3 10 -2 10 -1 10 0
Fig. 8. wARM plotted against sSIRM in a bi-logarithmic plot showing
two distinct populations. The one with the steepest gradient is interpreted
to represent single domain magnetite, whereas the second population
probably represents a cluster of pseudo-single domain carriers.
Ø. Paasche et al. / Quaternary Science Reviews 26 (2007) 793–807800
during the last 7000 cal yr BP (r2 ¼ 0.57). Fine silt and verycoarse silt does not correspond significantly against any ofthe other fractions. A consistent negative correlation exists
between clay and medium silt (r2 ¼ 0.76) throughout thecore, with the exception of two anomalies (Fig. 10).
6. Discussion
6.1. The deglaciation transition
The retreat of the FIS from the Skarpnes stage inUllsfjorden (see Fig. 1) routed sedimentladen meltwaternorthwards that was partly deposited in Fiskvatnet(Paasche et al., 2004), but also in Trollvatnet, as evidentfrom the lower 3m of homogeneous sediments. Thesignature of these glacigenic deposits is significantlydifferent from later sediments with specifically high wbulkvalues (Fig. 4), high bulk density values, very stablesARM/sSIRM values (Figs. 6 and 11), high content ofvery coarse silt and very low content of clay values (Fig. 7).The transition from a deglaciation and to a sedimentaryregime dominated by the rockglacier occurred abruptly,indicating that the fjordglacier retreated rapidly afterreleasing huge quantities of meltwater, and that it did notreadvance to a similar position during the remaining periodof the lateglacial. Articulated black ‘laminations’ (2–5mm)are present from �15 700 cal yr BP and they culminate in a3 cm thick black coloured section with peak LOI-values of4.5% dated to �14 800 cal yr BP (Fig. 6 and Table 1). The
ARTICLE IN PRESS
y = 0.0002x-0.6777
r 2 = 0.6471
y = 2E-05x -0.7738
r2 = 0.85
0
5
10
15
20
25
10-8
10-7
10-6
χbulk (m3 kg-1)
LO
I (%
)
0
5
10
15
20
25
LOI:125-260 cm
LOI:0-125 cm
Power (L OI:125-260 cm)
Power (L OI:0-125 cm)
Lateglacial
Holocene
10-8
10-7
10-6
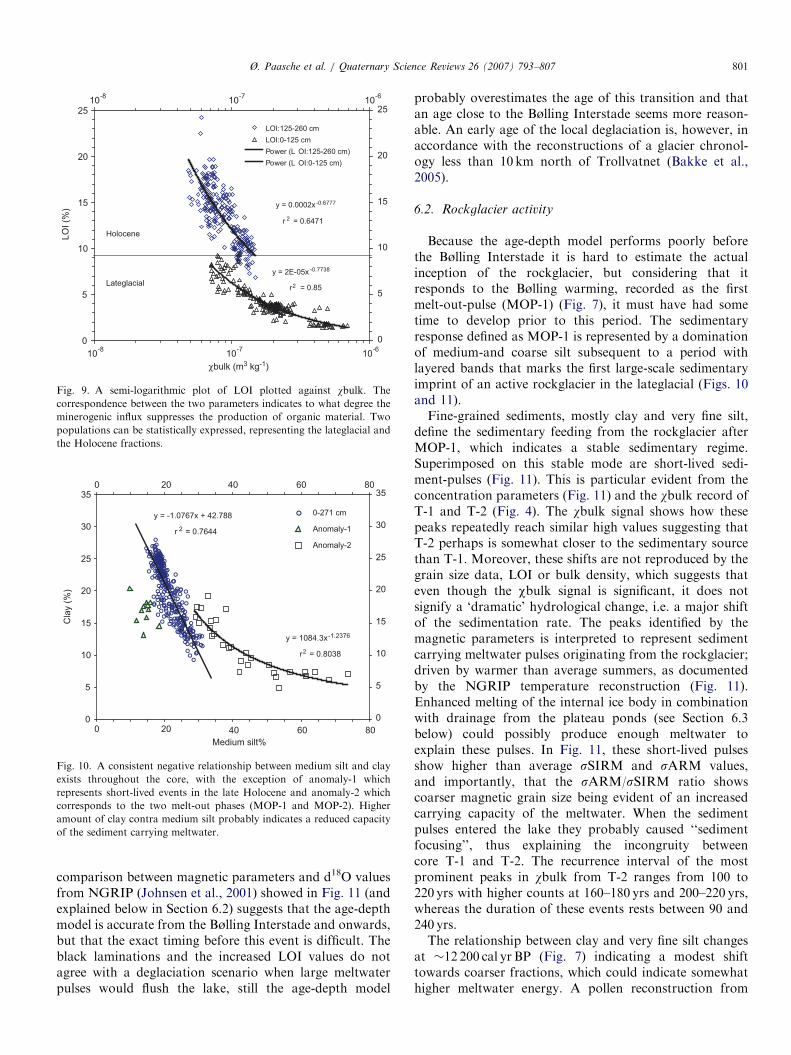
Fig. 9. A semi-logarithmic plot of LOI plotted against wbulk. The
correspondence between the two parameters indicates to what degree the
minerogenic influx suppresses the production of organic material. Two
populations can be statistically expressed, representing the lateglacial and
the Holocene fractions.
y = 1084.3x-1.2376
r2 = 0.8038
y = -1.0767x + 42.788
r 2 = 0.7644
0
5
10
15
20
25
30
35
40 60 80
Medium silt%
Cla
y (
%)
0
5
10
15
20
25
30
350 20
0 20
40 60 80
0-271 cm
Anomaly-1
Anomaly-2
Fig. 10. A consistent negative relationship between medium silt and clay
exists throughout the core, with the exception of anomaly-1 which
represents short-lived events in the late Holocene and anomaly-2 which
corresponds to the two melt-out phases (MOP-1 and MOP-2). Higher
amount of clay contra medium silt probably indicates a reduced capacity
of the sediment carrying meltwater.
Ø. Paasche et al. / Quaternary Science Reviews 26 (2007) 793–807 801
comparison between magnetic parameters and d18O valuesfrom NGRIP (Johnsen et al., 2001) showed in Fig. 11 (andexplained below in Section 6.2) suggests that the age-depthmodel is accurate from the Bølling Interstade and onwards,but that the exact timing before this event is difficult. Theblack laminations and the increased LOI values do notagree with a deglaciation scenario when large meltwaterpulses would flush the lake, still the age-depth model
probably overestimates the age of this transition and thatan age close to the Bølling Interstade seems more reason-able. An early age of the local deglaciation is, however, inaccordance with the reconstructions of a glacier chronol-ogy less than 10 km north of Trollvatnet (Bakke et al.,2005).
6.2. Rockglacier activity
Because the age-depth model performs poorly beforethe Bølling Interstade it is hard to estimate the actualinception of the rockglacier, but considering that itresponds to the Bølling warming, recorded as the firstmelt-out-pulse (MOP-1) (Fig. 7), it must have had sometime to develop prior to this period. The sedimentaryresponse defined as MOP-1 is represented by a dominationof medium-and coarse silt subsequent to a period withlayered bands that marks the first large-scale sedimentaryimprint of an active rockglacier in the lateglacial (Figs. 10and 11).Fine-grained sediments, mostly clay and very fine silt,
define the sedimentary feeding from the rockglacier afterMOP-1, which indicates a stable sedimentary regime.Superimposed on this stable mode are short-lived sedi-ment-pulses (Fig. 11). This is particular evident from theconcentration parameters (Fig. 11) and the wbulk record ofT-1 and T-2 (Fig. 4). The wbulk signal shows how thesepeaks repeatedly reach similar high values suggesting thatT-2 perhaps is somewhat closer to the sedimentary sourcethan T-1. Moreover, these shifts are not reproduced by thegrain size data, LOI or bulk density, which suggests thateven though the wbulk signal is significant, it does notsignify a ‘dramatic’ hydrological change, i.e. a major shiftof the sedimentation rate. The peaks identified by themagnetic parameters is interpreted to represent sedimentcarrying meltwater pulses originating from the rockglacier;driven by warmer than average summers, as documentedby the NGRIP temperature reconstruction (Fig. 11).Enhanced melting of the internal ice body in combinationwith drainage from the plateau ponds (see Section 6.3below) could possibly produce enough meltwater toexplain these pulses. In Fig. 11, these short-lived pulsesshow higher than average sSIRM and sARM values,and importantly, that the sARM/sSIRM ratio showscoarser magnetic grain size being evident of an increasedcarrying capacity of the meltwater. When the sedimentpulses entered the lake they probably caused ‘‘sedimentfocusing’’, thus explaining the incongruity betweencore T-1 and T-2. The recurrence interval of the mostprominent peaks in wbulk from T-2 ranges from 100 to220 yrs with higher counts at 160–180 yrs and 200–220 yrs,whereas the duration of these events rests between 90 and240 yrs.The relationship between clay and very fine silt changes
at �12 200 cal yr BP (Fig. 7) indicating a modest shifttowards coarser fractions, which could indicate somewhathigher meltwater energy. A pollen reconstruction from
ARTICLE IN PRESS
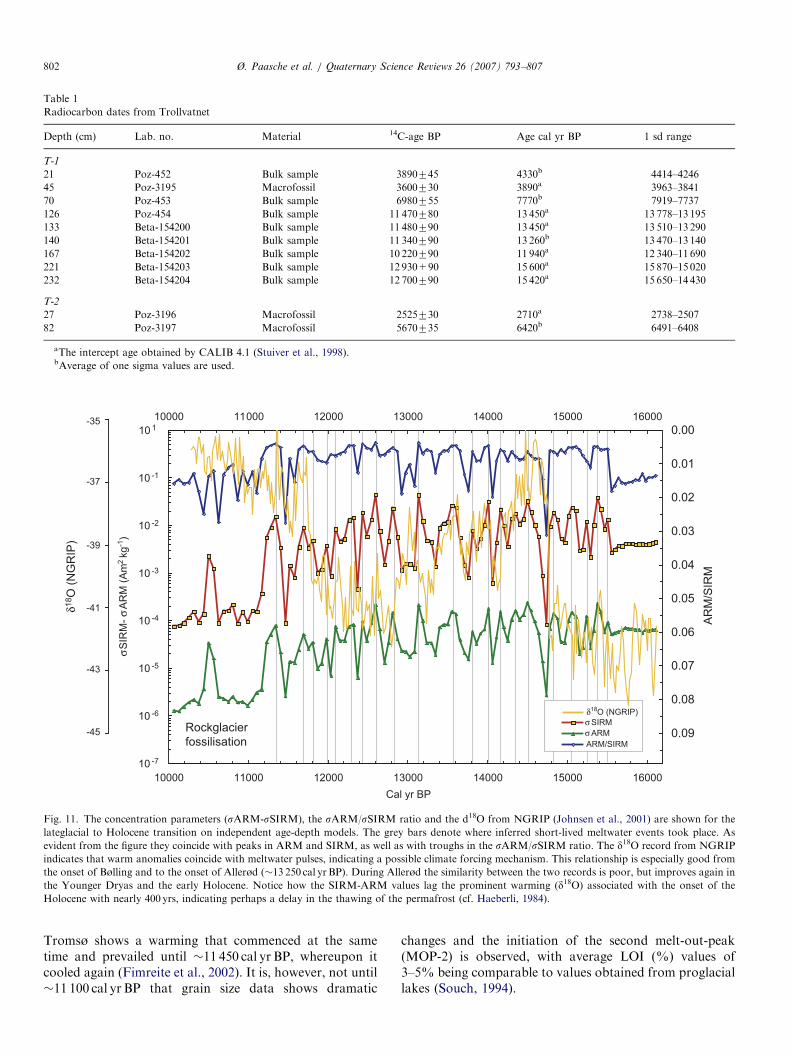
Table 1
Radiocarbon dates from Trollvatnet
Depth (cm) Lab. no. Material 14C-age BP Age cal yr BP 1 sd range
T-1
21 Poz-452 Bulk sample 3890745 4330b 4414–4246
45 Poz-3195 Macrofossil 3600730 3890a 3963–3841
70 Poz-453 Bulk sample 6980755 7770b 7919–7737
126 Poz-454 Bulk sample 11 470780 13 450a 13 778–13 195
133 Beta-154200 Bulk sample 11 480790 13 450a 13 510–13 290
140 Beta-154201 Bulk sample 11 340790 13 260b 13 470–13 140
167 Beta-154202 Bulk sample 10 220790 11 940a 12 340–11 690
221 Beta-154203 Bulk sample 12 930+90 15 600a 15 870–15 020
232 Beta-154204 Bulk sample 12 700790 15 420a 15 650–14 430
T-2
27 Poz-3196 Macrofossil 2525730 2710a 2738–2507
82 Poz-3197 Macrofossil 5670735 6420b 6491–6408
aThe intercept age obtained by CALIB 4.1 (Stuiver et al., 1998).bAverage of one sigma values are used.
Rockglacier
fossilisation
10 -7
10 -6
10 -5
10 -4
10 -3
10 -2
10 -1
10 1
10000 11000 12000 13000 14000 15000 16000
Cal yr BP
σS
IRM
- σA
RM
(A
m
kg
-1)
2
0.00
0.01
0.02
0.03
0.04
0.05
0.06
0.07
0.08
0.09
10000 11000 12000 13000 14000 15000 16000
AR
M/S
IRM
σ SIRM
σ ARM
ARM/SIRM
δ18O
(N
GR
IP)
δ18O (NGRIP)
-45
-43
-41
-39
-37
-35
Fig. 11. The concentration parameters (sARM-sSIRM), the sARM/sSIRM ratio and the d18O from NGRIP (Johnsen et al., 2001) are shown for the
lateglacial to Holocene transition on independent age-depth models. The grey bars denote where inferred short-lived meltwater events took place. As
evident from the figure they coincide with peaks in ARM and SIRM, as well as with troughs in the sARM/sSIRM ratio. The d18O record from NGRIP
indicates that warm anomalies coincide with meltwater pulses, indicating a possible climate forcing mechanism. This relationship is especially good from
the onset of Bølling and to the onset of Allerød (�13 250 cal yrBP). During Allerød the similarity between the two records is poor, but improves again in
the Younger Dryas and the early Holocene. Notice how the SIRM-ARM values lag the prominent warming (d18O) associated with the onset of the
Holocene with nearly 400 yrs, indicating perhaps a delay in the thawing of the permafrost (cf. Haeberli, 1984).
Ø. Paasche et al. / Quaternary Science Reviews 26 (2007) 793–807802
Tromsø shows a warming that commenced at the sametime and prevailed until �11 450 cal yr BP, whereupon itcooled again (Fimreite et al., 2002). It is, however, not until�11 100 cal yr BP that grain size data shows dramatic
changes and the initiation of the second melt-out-peak(MOP-2) is observed, with average LOI (%) values of3–5% being comparable to values obtained from proglaciallakes (Souch, 1994).
ARTICLE IN PRESSØ. Paasche et al. / Quaternary Science Reviews 26 (2007) 793–807 803
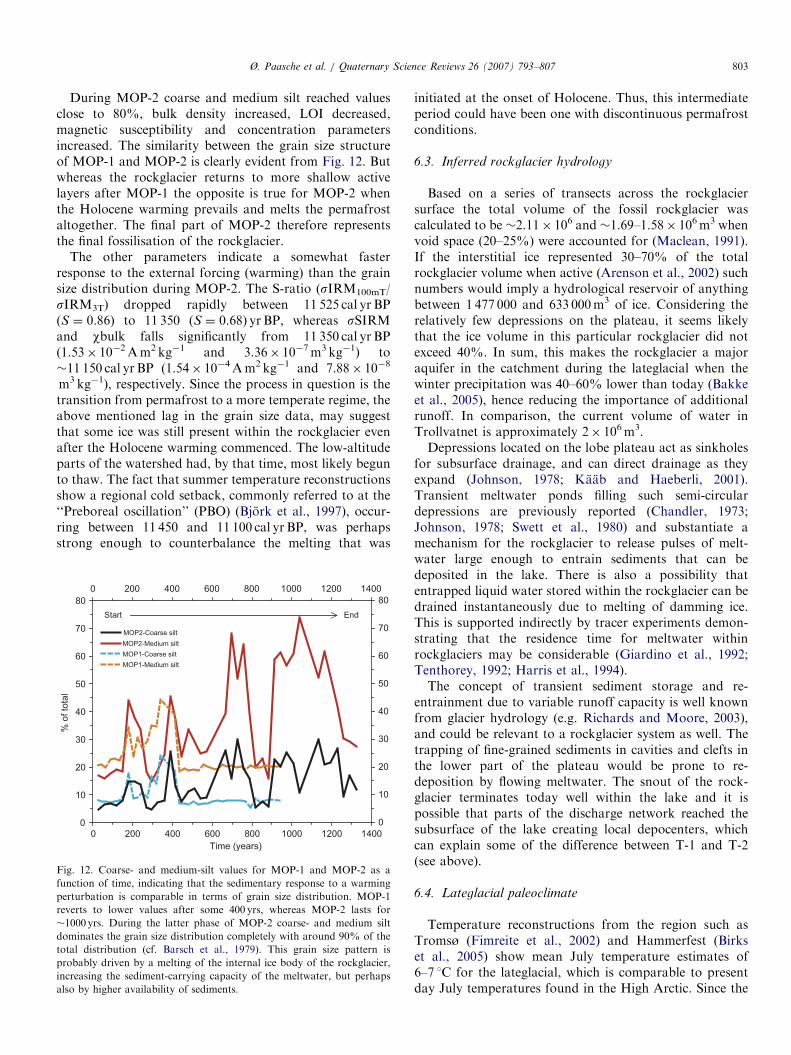
During MOP-2 coarse and medium silt reached valuesclose to 80%, bulk density increased, LOI decreased,magnetic susceptibility and concentration parametersincreased. The similarity between the grain size structureof MOP-1 and MOP-2 is clearly evident from Fig. 12. Butwhereas the rockglacier returns to more shallow activelayers after MOP-1 the opposite is true for MOP-2 whenthe Holocene warming prevails and melts the permafrostaltogether. The final part of MOP-2 therefore representsthe final fossilisation of the rockglacier.
The other parameters indicate a somewhat fasterresponse to the external forcing (warming) than the grainsize distribution during MOP-2. The S-ratio (sIRM100mT/sIRM3T) dropped rapidly between 11 525 cal yr BP(S ¼ 0.86) to 11 350 (S ¼ 0.68) yr BP, whereas sSIRMand wbulk falls significantly from 11 350 cal yr BP(1.53� 10�2Am2 kg�1 and 3.36� 10�7m3 kg�1) to�11 150 cal yr BP (1.54� 10�4Am2 kg�1 and 7.88� 10�8
m3 kg�1), respectively. Since the process in question is thetransition from permafrost to a more temperate regime, theabove mentioned lag in the grain size data, may suggestthat some ice was still present within the rockglacier evenafter the Holocene warming commenced. The low-altitudeparts of the watershed had, by that time, most likely begunto thaw. The fact that summer temperature reconstructionsshow a regional cold setback, commonly referred to at the‘‘Preboreal oscillation’’ (PBO) (Bjork et al., 1997), occur-ring between 11 450 and 11 100 cal yr BP, was perhapsstrong enough to counterbalance the melting that was
0
10
20
30
40
50
60
70
80
0 200 400 600 800 1000 1200 1400
Time (years)
% o
f to
tal
0
10
20
30
40
50
60
70
80
0 200 400 600 800 1000 1200 1400
MOP2-Medium silt
MOP1-Coarse silt
MOP1-Medium silt
MOP2-Coarse silt
Start End
Fig. 12. Coarse- and medium-silt values for MOP-1 and MOP-2 as a
function of time, indicating that the sedimentary response to a warming
perturbation is comparable in terms of grain size distribution. MOP-1
reverts to lower values after some 400 yrs, whereas MOP-2 lasts for
�1000 yrs. During the latter phase of MOP-2 coarse- and medium silt
dominates the grain size distribution completely with around 90% of the
total distribution (cf. Barsch et al., 1979). This grain size pattern is
probably driven by a melting of the internal ice body of the rockglacier,
increasing the sediment-carrying capacity of the meltwater, but perhaps
also by higher availability of sediments.
initiated at the onset of Holocene. Thus, this intermediateperiod could have been one with discontinuous permafrostconditions.
6.3. Inferred rockglacier hydrology
Based on a series of transects across the rockglaciersurface the total volume of the fossil rockglacier wascalculated to be �2.11� 106 and�1.69–1.58� 106m3 whenvoid space (20–25%) were accounted for (Maclean, 1991).If the interstitial ice represented 30–70% of the totalrockglacier volume when active (Arenson et al., 2002) suchnumbers would imply a hydrological reservoir of anythingbetween 1 477 000 and 633 000m3 of ice. Considering therelatively few depressions on the plateau, it seems likelythat the ice volume in this particular rockglacier did notexceed 40%. In sum, this makes the rockglacier a majoraquifer in the catchment during the lateglacial when thewinter precipitation was 40–60% lower than today (Bakkeet al., 2005), hence reducing the importance of additionalrunoff. In comparison, the current volume of water inTrollvatnet is approximately 2� 106m3.Depressions located on the lobe plateau act as sinkholes
for subsurface drainage, and can direct drainage as theyexpand (Johnson, 1978; Kaab and Haeberli, 2001).Transient meltwater ponds filling such semi-circulardepressions are previously reported (Chandler, 1973;Johnson, 1978; Swett et al., 1980) and substantiate amechanism for the rockglacier to release pulses of melt-water large enough to entrain sediments that can bedeposited in the lake. There is also a possibility thatentrapped liquid water stored within the rockglacier can bedrained instantaneously due to melting of damming ice.This is supported indirectly by tracer experiments demon-strating that the residence time for meltwater withinrockglaciers may be considerable (Giardino et al., 1992;Tenthorey, 1992; Harris et al., 1994).The concept of transient sediment storage and re-
entrainment due to variable runoff capacity is well knownfrom glacier hydrology (e.g. Richards and Moore, 2003),and could be relevant to a rockglacier system as well. Thetrapping of fine-grained sediments in cavities and clefts inthe lower part of the plateau would be prone to re-deposition by flowing meltwater. The snout of the rock-glacier terminates today well within the lake and it ispossible that parts of the discharge network reached thesubsurface of the lake creating local depocenters, whichcan explain some of the difference between T-1 and T-2(see above).
6.4. Lateglacial paleoclimate
Temperature reconstructions from the region such asTromsø (Fimreite et al., 2002) and Hammerfest (Birkset al., 2005) show mean July temperature estimates of6–7 1C for the lateglacial, which is comparable to presentday July temperatures found in the High Arctic. Since the
ARTICLE IN PRESSØ. Paasche et al. / Quaternary Science Reviews 26 (2007) 793–807804
rockglacier lies only some 20m above the maximumlateglacial sea level the permafrost boundary must havebeen nearly 1400m lower than today in order to ensure anactive rockglacier. Using an environmental lapse rate of0.6 1C/100m (see Lie et al., 2003) such a lowering wouldhave caused an �8 1C depression of the MAAT. Subtract-ing the present day MAAT of 2.8 1C this would produce alateglacial MAAT of �5 1C, which is in accordance withthe regional summer temperature reconstructions (Fimreiteet al., 2002; Birks et al., 2005). Such cool temperaturessuggest that most of the local glaciers, having equilibrium-line-altitudes (ELAs) around 400m or lower (Bakke et al.,2005) probably were polythermal during this period. Asimilar altitudinal difference between polythermal glaciersand rockglaciers has also been documented for westernGreenland (Humlum, 1988).
6.5. Holocene spring snowmelting and winter precipitation
During Holocene, when the rockglacier no longerinfluenced the sedimentary budget of the lake, thecompeting magnetic carriers in Trollvatnet were probablyof biogenic (internal lake production) and terrigenous(detrital influx) origin (Fig. 8). The presence of bacterialmagnetite over the last 10 000 cal yr BP seems to be in linewith evidence for SD magnetite (see also Paasche et al.,
0
50
100
150
200
250
0 2000 4000 6000
Cal yr BP
Win
ter
pre
cip
ita
tio
n (
%)
0 2000 4000 6000
Winter precipitation
Snowmelting
Wet winters (WW) Dry winters (DW)
ARM/SIRM
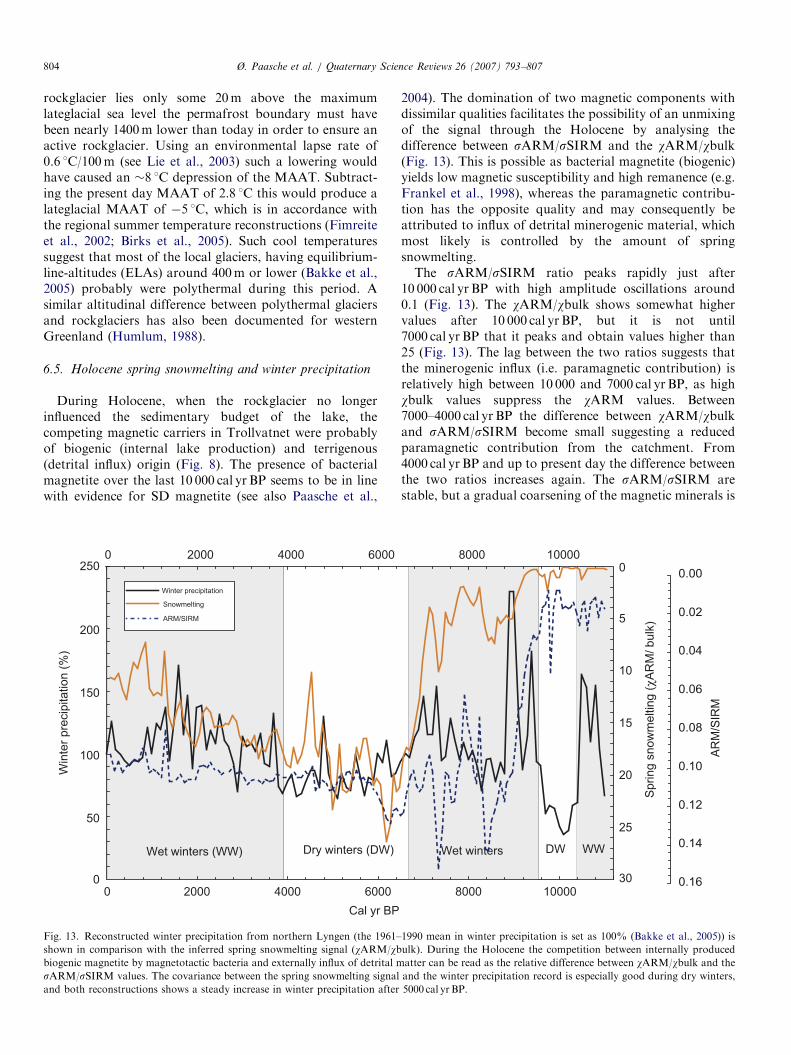
Fig. 13. Reconstructed winter precipitation from northern Lyngen (the 1961–
shown in comparison with the inferred spring snowmelting signal (wARM/wbbiogenic magnetite by magnetotactic bacteria and externally influx of detrital m
sARM/sSIRM values. The covariance between the spring snowmelting signal
and both reconstructions shows a steady increase in winter precipitation after
2004). The domination of two magnetic components withdissimilar qualities facilitates the possibility of an unmixingof the signal through the Holocene by analysing thedifference between sARM/sSIRM and the wARM/wbulk(Fig. 13). This is possible as bacterial magnetite (biogenic)yields low magnetic susceptibility and high remanence (e.g.Frankel et al., 1998), whereas the paramagnetic contribu-tion has the opposite quality and may consequently beattributed to influx of detrital minerogenic material, whichmost likely is controlled by the amount of springsnowmelting.The sARM/sSIRM ratio peaks rapidly just after
10 000 cal yr BP with high amplitude oscillations around0.1 (Fig. 13). The wARM/wbulk shows somewhat highervalues after 10 000 cal yr BP, but it is not until7000 cal yr BP that it peaks and obtain values higher than25 (Fig. 13). The lag between the two ratios suggests thatthe minerogenic influx (i.e. paramagnetic contribution) isrelatively high between 10 000 and 7000 cal yr BP, as highwbulk values suppress the wARM values. Between7000–4000 cal yr BP the difference between wARM/wbulkand sARM/sSIRM become small suggesting a reducedparamagnetic contribution from the catchment. From4000 cal yr BP and up to present day the difference betweenthe two ratios increases again. The sARM/sSIRM arestable, but a gradual coarsening of the magnetic minerals is
8000 10000
0
5
10
15
20
25
30
8000 10000
Sp
rin
g s
no
wm
eltin
g (
χAR
M/ b
ulk
)
Wet winters DW WW
0.00
0.02
0.04
0.06
0.08
0.10
0.12
0.14
0.16
AR
M/S
IRM
1990 mean in winter precipitation is set as 100% (Bakke et al., 2005)) is
ulk). During the Holocene the competition between internally produced
atter can be read as the relative difference between wARM/wbulk and the
and the winter precipitation record is especially good during dry winters,
5000 cal yrBP.
ARTICLE IN PRESSØ. Paasche et al. / Quaternary Science Reviews 26 (2007) 793–807 805
evident. The wARM/wbulk values become lower andsuggest an increase in influx of minerogenic material fromthe catchment, especially after 2000 cal yr BP. Comparingthe inferred Holocene spring snowmelting with thereconstructed winter precipitation from northern Lyngen(Bakke et al., 2005) it seems that the two is positivelycorrelated—particularly after 7000 cal yr BP (Fig. 13).
7. Conclusions
1.
A multi-proxy approach has for the first time been ableto connect rockglacier activity to suspended sedimentsretrieved from an adjacent lake. The sediment recordconsisting of two near 6m long piston cores demon-strate how the rockglacier has interacted with changingclimate conditions in northern Norway throughout thelateglacial period before becoming fossil at the onset ofthe Holocene. The sedimentary signature originatingfrom the talus-derived rockglacier is significantly differ-ent from the glacigenic sediments flushing the lakeduring the deglaciation of the FIS, and also from thesediments that dominate the Holocene record. Thetransition from deglaciation to a rockglacier sedimen-tary regime occurs sometime before Bølling Interstade(14 800 cal yr BP), but the age-depth control is poor inthis part of the record. A sedimentladen melt-water-pulse (MOP-1) dominated by coarse to medium silt isreleased from the rockglacier in response to the Bøllingwarming, and marks the first robust sedimentary signalfrom the rockglacier.2.
Between 14 800 and 11 100 cal yr BP the rockglaciersteadily releases suspended sediments and two sedimen-tary modes are observed: (1) a stable regime defined bythe dominance of fine grained sediments (clay to finesilt), and (2) a high-frequent, high-amplitude regimebeing superimposed on the former system. These twosystems are particularly evident in the rock magneticparameters, where peak values of SIRM-ARM andmagnetic susceptibility denotes periods with coarsermagnetic grains. The fact that the physical grain sizedata do not pick up this signal indicates that no majorchange in the sedimentation rate was associated withthese brief pulses. The recurrence interval of these eventsranges from 100 to 220 yrs with an approximatelysimilar duration.3.
The frequent pulses punctuating the stable sedimentarymode provides evidence for rockglacier interaction withclimate through release of meltwater that can transportsuspended sediments. This occurred whenever therewere warmer summers than average causing a moreintense melting of the internal ice body and henceimproving the sediment entrainment. Additional meltingof snowbanks in the catchment and draining oftemporary meltwater ponds coexisting on the plateauof the rockglacier may have strengthened this signal. Ifthe meltwater from the rockglacier was released assubsurface currents, as documented in modern systems,it could explain the observed sediment focussing inTrollvatnet.
4.
The close covariance between warm summers, as seenfrom the d18O reconstruction of lateglacial temperaturesin the NGRIP core, and the corresponding meltwaterpulses released from the rockglacier is particularlyevident between the Bølling warming and the onset ofAllerød, as well as during the late Younger Dryas. Thisyields strong support to the notion that rockglaciers arecapable to interact with climate during cool permafrostconditions. It also corroborates the age-depth modelduring a period when dating is most difficult.5.
The pronounced temperature increase following theonset of the Holocene causes the rockglacier to becomefossil and it remains so up to the present. The details ofthis process are recorded in MOP-2 when medium tocoarse silt almost completely dominates the grain sizedata. The initiation of MOP-2 lags the onset of theHolocene with nearly 500 yrs as observed in most of theparameters and its duration is perhaps somewhatshorter than the grain size data indicate. The pro-nounced similarity between MOP-1 and MOP-2 under-scores that the warming perturbation of the Bøllingreached northern Norway, though returning to a coolclimate after 300–400 yrs.6.
The interval between the two MOPs (14 800–11 600 cal yr BP) was probably dominated by permafrostconditions with MAATs fluctuating around �4 1C.Compared to the present-day climate of Lyngen thiswould require a lowering of at least 7 1C (cf. Frauen-felder et al., 2001). This corresponds to a lowering of thepermafrost boundary with �1400m, which is in goodagreement with the assumed MAAT of �4 1C, but alsowith the mean summer temperature estimates of 6–7 1C(Fimreite et al., 2002; Birks et al., 2005). With apermafrost boundary close to sea level during thelateglacial it is suggested that most of the local glaciersprobably were polythermal during this period. Eventhough the thermal prerequisites for a permafrostregime ceased to exist with the onset of the Holoceneit seems that a period of discontinuous permafrostprevailed until�11 100 cal yr BP, which can be explainedby the Preboreal cooling (PBO) lasting from 11 450 to11 100 cal yr BP. The final thawing of the permafrost inthe lower areas of northern Lyngen commenced rapidlyafter the PBO and is in-line with the early Holocenethermal optimum observed for the sub-arctic region(Kaufman et al., 2004; Smith et al., 2004; Paasche et al.,2004).7.
During the Holocene detrital influx was most likelytransported to the lake with the spring snowmelting,which is related to the amount of winter precipitation,and complemented by later melting of high-lyingperennial snowfields. By using the wARM/wbulk versusthe sARM/sSIRM the paramagnetic contribution fromthe catchment has been isolated from internal produc-tion of magnetic carriers. The reconstruction of the
ARTICLE IN PRESSØ. Paasche et al. / Quaternary Science Reviews 26 (2007) 793–807806
spring snowmelting shows that wet winters prevailed inthe early Holocene (9800–6500 cal yr BP), followed by aperiod (6500–4000 cal yr BP) with a somewhat drierclimate, whereas the last 4000 yrs shows a return towetter winters.
Acknowledgment
ØP would like to thank Joachim Riis Simonsen forassistance in field, Dr. Wenche Eide for picking macro-fossils and Dr. Øyvind Lie for introducing the Sedi-graph5100. The paper benefited heavily from discussionwith NORPEC members as well as from MAPECS forummeetings, and also from insight offered by Dr. Ann Hirtand Prof. Ole Humlum. Finally, we would like to thank thereviewers Wilfred Haeberli and Brian Whalley for helpfuland constructive comments. This work was supported byNORPEC, an NFR funded Strategic University Pro-gramme (SUP) at the University of Bergen, which waschaired by Prof. J.B.H. Birks. This is publication No. A153 of the Bjerknes Centre for Climate Research.
References
Andersen, B.G., 1968. Glacial Geology of Western Troms, North
Norway, Norwegian Geological Survey, vol. 256, 160pp.
Arenson, L., Hoelzle, M., Springman, S., 2002. Borehole deformation
measurements and internal structure of some rock glaciers in Switzer-
land. Permafrost and Periglacial Processes 13, 117–135.
Aune, B., 1993. Air temperature normal, 1961–1990. Report 2, The
Norwegian Meteorological Institute.
Bakke, J., Dahl, S.O., Paasche, Ø., Løvlie, R., Nesje, A., 2005. Glacier
fluctuations, equilibrium-line altitudes and paleoclimate in Lyngen,
northern Norway, during the Lateglacial and Holocene. The Holocene
15, 518–540.
Ballantyne, C.K., Harris, C., 1994. The Periglaciation of Great Britain.
Cambridge University Press, Cambridge.
Barsch, D., 1996. Rock glaciers. Indicators for the Present and the Former
Geoecology in High Mountain Environments. Springer, Berlin, p. 331.
Barsch, D., Fierz, H., Haeberli, W., 1979. Shallow core drilling and
borehole measurements in permafrost of an active rock glacier near the
Grubengletscher, Wallis, Swiss Alps. Arctic, Antarctitc and Alpine
Research 11, 215–228.
Berger, J., Krainer, K., Mostler, W., 2005. Dynamics of active rock glacier
(Otzel Alps, Austria). Quaternary Research 62, 233–242.
Birks, H.H., Kiltgaard Kristensen, D.K., Dokken, T.M., Andersson, C.,
2005. Explanatory comparisons of quantitative temperature estimates
over the last deglaciation in Norway and the Norwegian Sea. In:
Drange, H., Dokken, T.M., Furevik, T., Gerdes, R., Berger, W. (Eds.),
The Nordic Seas; An Integrated Perspective; Oceanography, Climatol-
ogy, Biogeochemistry, and Modeling. Geophysical Monograph, vol.
158. AGU, Washington, DC, pp. 341–355.
Bjork, S., Rundgren, M., Ingolfsson, O., Funder, S., 1997. The Preboreal
oscillation around the Nordic Seas: terrestrial and lacustrine responses.
Journal of Quaternary Science 12, 455–465.
Bjorck, S., Wohlfarth, B., 2001. 14C chronostratigraphic techniques in
paleolimnology. In: Last, W.M., Smol, J.P. (Eds.), Tracking Environ-
mental Change Using Lake Sediments, Basin Analysis, Coring, and
Chronological Techniques, vol. 1. Kluwer Academic Publishers,
Dordrecht, pp. 205–245.
Blott, S., Pye, K., 2001. Gradistat: a grain size distribution and statistics
package for the analysis of unconsolidated sediments. Earth Surface
Processes and Landforms 26, 1237–1248.
Bradley, R.S., Retelle, M.J., Ludlam, S.D., Hardy, D.R., Zolitschka, B.,
Lamoureux, S.F., Douglas, M.S.V., 1996. The Taconite Inlet Lake
Project: a systems approach to paleoclimatic reconstruction. Journal of
Paleolimnology 16, 97–110.
Chandler, R.J., 1973. The inclination of talus, arctic talus terraces, and
other slopes composed of granular materials. The Journal of Geology
81, 1–14.
Christensen, T.R., Johansson, T., Akermann, H.J., Mastepanov, M.,
2004. Thawing sub-arctic permafrost: effects on vegetation and
methane emissions. Geophysical Research Letters 31, L04501.
Dean, W.E., 1974. Determination of carbonate and organic matter in
calcareous sediments and sedimentary rocks by rocks by loss on
ignition: comparison with other methods. Journal of Sedimentary
Petrology 44, 242–248.
Fimreite, S., Vorren, K-D., Vorren, T., 2002. Vegetation, climate and ice-
front oscillations in the Tromsø area, northern Norway during the
Allerød and Younger Dryas. Boreas 30, 89–100.
Frankel, R.B., Zhang, J-P., Bazylinski, D.A., 1998. Single magnetic
domains in magnetotactic bacteria. Journal of Geophysical Research
103, 30601–30604.
Frauenfelder, R., Kaab, A., 2000. Towards a paleoclimatic model of rock-
glacier formation in the Swiss Alps. Annals of Glaciology 31, 281–286.
Frauenfelder, R., Haeberli, W., Hoelzle, M., Maisch, M., 2001. Using relic
rockglaciers in GIS-based modelling to reconstruct Younger Dryas
permafrost distribution patterns in the Err-Julier area, Swiss Alps.
Norsk geografisk Tidsskrift 55, 195–202.
Førland, J., 1993. Precipitation Normal (1961–1990). Report 39, The
Norwegian Meteorological Institute.
Gardner, J.S., Bajewsky, I., 1987. Hilda rock glacier stream discharge and
sediment load characteristics, Sunwapta Pass area, Canadian Rocky
Mountains. In: Giardino, J.R., Shroder, J.F., Vitek, J.D. (Eds.), Rock
glaciers. London, pp. 161–174.
Giardino, R.J., Vitek, J.D., DeMorett, J.L., 1992. A model of water
movement in rock glaciers and associated water characteristics. In:
Dixon, J.C., Abrahams, A.D. (Eds.), Periglacial Geomorphology.
Wiley, Chichester, pp. 159–184.
Gordon, J.E., Darling, W.G., Whalley, W.B., Gellatly, A.F., 1988.
dD–d18O relationships and the thermal history of basal ice near the
margins of two glaciers in Lyngen, north Norway. Journal of
Glaciology 34, 265–268.
Johnson, P.G., 1978. Rock glacier types and their drainage systems,
Grizzely Creek, Yukon Territory. Canadian Journal of Earth Science
15, 1496–1507.
Johnsen, S.J., Dahl-Jensen, D., Gundestrup, N., Steffensen, J.P., Clausen,
H.B., Miller, H., Masson-Delmotte, V., Sveinbjornsdottir, White, J.,
2001. Oxygen isotope and paleotemperature records from six Green-
land ice-core stations: Camp Century, Dye-3, GRIP, GISP2, Renland
and NorthGrip. Journal of Quaternary Science 16, 299–307.
Haeberli, W., 1984. Geothermal effects of 18 ka BP ice conditions in the
Swiss plateau. Annals of Glaciology 5, 56–60.
Haeberli, W., 1985. Creep of Mountain Permafrost: Internal structure and
flow of alpine rock glaciers. Mitteleilungen der Versuchsanstalt fur
Wasserbau, Hydrologie und Glaziologie Nr. 77, Zurich.
Harris, S.A., Blumstengel, W.K., Cook, D., Krouse, R.H., Whitley, G.,
1994. Comparison of the water drainage from an active near-slope
rock glacier and glacier, St. Elias mountains, Yukon Territory.
Erdkunde 48, 81–91.
Hinchliffe, S., Ballantyne, C.K., Walden, J., 1998. The structure and
sedimentology of relict talus, Trotternish, Northern Skye, Scotland.
Earth Surface Processes and Landforms 23, 545–560.
Holms, G.W., Andersen, B.G., 1964. Glacial chronology of Ullsfjorden,
Northern Norway. US Geological Survey, Professional Paper 475D,
159–163.
Humlum, O., 1988. Rock glacier appearance level and rock glacier
initiation line altitude: a methodological approach to the study of rock
glaciers. Arctic and Alpine Research 20, 160–178.
Humlum, O., 1997. Active layer thermal regime at three rock glaciers in
Greenland. Permafrost and Periglacial Processes 8, 383–408.
ARTICLE IN PRESSØ. Paasche et al. / Quaternary Science Reviews 26 (2007) 793–807 807
Humlum, O., 1998a. The climatic significance of Rock Glaciers.
Permafrost and Periglacial Processes 9, 375–395.
Humlum, O., 1998b. Rock glaciers on the Faeroe Islands, the north
Atlantic. Journal of Quaternary Science 13, 293–307.
Isaksen, K., Ødegard, R.S., Eiken, T., Sollid, J.L., 2000. Composition, flow
and development of two tongue-shaped rock glaciers in the Permafrost
of Svalbard. Permafrost and Periglacial Processes 11, 241–257.
Kaufman, D.S., et al., 2004. Holocene thermal maximum in the western
Arctic (0–180 1W). Quaternary Science Reviews 23, 529–560.
Kaab, A., Haeberli, W., 2001. Evolution of a High-mountain Thermo-
karst Lake in the Swiss Alps. Arctic, Antarctic, and Alpine Research
33, 385–390.
Krainer, K., Mostler, W., 2002. Hydrology of Active Rock Glaciers:
examples from the Austrian Alps. Arctic, Antarctic and Alpine
Research 34, 142–149.
Lie, Ø., Dahl, S.O., Nesje, A., 2003. Theoretical equilibrium-line altitudes
and glacier buildup sensitivity in southern Norway based on
meteorological data in a geographical information system. The
Holocene 13, 373–380.
Maclean, A.F., 1991. The formation of valley-wall rock glaciers. Ph.D.
Thesis, University of St. Andrews, Scotland, Unpublished.
McCave, I.N., Syvitski, J.P.M., 1991. Principles and methods of geological
particle size analysis. In: Syvitski, J.P.M. (Ed.), Principles, Methods,
And Application of Particle Size Analysis. Cambridge University
Press, Cambridge, pp. 3–21.
Moritz, R.E., Bitz, C.M., Steig, E.J., 2002. Dynamics of recent climate
change in the Arctic. Science 297, 1497–1502.
Moskowitz, B.M., Frankel, R., Bazylinski, D.A., 1993. Rock magnetic
criteria for the detection of biogenic magnetite. Earth and Planetary
Science Letters 120, 283–300.
Nesje, A., 1992. A piston corer for lacustrine and marine sediments. Arctic
and Alpine Research 24, 257–259.
Overpeck, J., Hughen, K., Hardy, D., Bradley, D., Case, R., Douglas, M.,
Finney, B., Gajewski, K., Jacoby, G., Jennings, A., Lamoureux, S.,
Lasca, A., MacDonald, G., Moore, J., Retelle, M., Smith, S., Wolfe,
A., Zielinski, G., 1997. Arctic environmental changes of the last four
centuries. Science 278, 1251–1256.
Paasche, Ø., Løvlie, R., Dahl, S.O., Bakke, J., Nesje, A., 2004. Bacterial
magnetite in lake sediments: Late Glacial to Holocene climate and
sedimentary changes in Northern Norway. Earth and Planetary
Science Letters 223, 319–333.
Plassen, L., Vorren, T.O., 2003. Sedimentary processes and the environ-
ment during deglaciation of a fjord basin in Ullsfjorden, North
Norway. Norwegian Journal of Geology 83, 23–36.
Rapp, A., 1960. Talus slopes and mountain walls at Tempelfjorden,
Spitsbergen: a geomorphological study of the denudation of slopes in
an arctic locality. Norsk Polarinstitutt Skrifter 119, 96pp.
Richards, G., Moore, R.D., 2003. Suspended sediment dynamics in a
steep, glacier-fed mountain stream, Place Creek, Canada. Hydrological
Processes 17, 1733–1753.
Sailer, R., Kerschner, H., 1999. Equilibrium-line altitudes and rock
glaciers during the Younger Dryas cooling event, Ferwall group,
western Tyrol, Austria. Annals of Glaciology 28, 141–145.
Salt, K.E., Ballantyne, C.K., 1997. The structure and sedimentology of
relict talus, Knockan, Assynt, N.W. Scotland. Scottish Geographical
Magazine 113, 82–89.
Smith, L.C., MacDonald, G.M., Velichko, A.A., Beilman, D.W.,
Borisova, O.K., Frey, K.E., Krementski, K.V., Sheng, Y., 2004.
Siberian Peatlands a Net Carbon Sink and Global Methane Source
Since the Early Holocene. Science 303, 353–356.
Smol, J.P., et al., 2005. Climate-driven regime shifts in the biological
communities of arctic lakes. Proceedings of the National Academy of
Sciences 22, 4397–4402.
Souch, C., 1994. A methodology to interpret downvalley lake sediments as
recorders of neoglacial activity: Coast Mountains, British Columbia,
Canada. Geografiska Annaler 3, 169–185.
Stober, J.C., Thompson, R., 1979. Magnetic remanence acquisition in
Finnish lake sediments. Geophysical Journal of the Royal Astronom-
ical Society 57, 727–739.
Stuiver, M., Reimer, P.J., Bard, E., Beck, J.W., Burr, G.S., Hughen, K.A.,
Kromer, B., McCormac, F.G., v.d. Plicht, J., Spurk, M., 1998. IntCal
98 Radiocarbon Age Calibration, 24000-0 cal BP. Radiocarbon 40,
1041–1083.
Swett, K., Hambrey, M.J., Johnson, B., 1980. Rock glaciers in Northern
Spitsbergen. Journal of Geology 88, 475–482.
Tenthorey, G., 1992. Perennial Neves and the Hydrology of rock glaciers.
Permafrost and Periglacial Processes 3, 247–252.
Vorren, T.O., Elvsborg, A., 1979. Late Weichselian deglaciation and
paleoenvironment of the shelf and costal areas of Troms, Northern
Norway—a review. Boreas 8, 247–253.
Wahrhaftig, C., Cox, A., 1957. Rock glaciers in the Alaska Range.
Bulletin of the Geological Society of America 70, 383–436.
Zielinski, G.A., 1989. Lacustrine Sediment Evidence Opposing
Holocene rock glacier activity in the Tempel Lake Valley, Wind River
Range, Wyoming, USA Arctic. Antarctic and Alpine Research 21,
22–33.
Zwaan, K.B., Fareth, E., Grogan, P.W., 1998. Geological Map of
Norway, Tromsø, 1: 250.000. Norwegian Geological Survey.
Copyright © 2022 FDOKUMEN