Soluble and insoluble lithium dust in the EPICA DomeC ice core—Implications for changes of the...
12
Soluble and insoluble lithium dust in the EPICA DomeC ice core—Implications for changes of the East Antarctic dust provenance during the recent glacial–interglacial transition Marie-Louise Siggaard-Andersen a,b, ⁎ , Paolo Gabrielli c,d , Jørgen Peder Steffensen b , Trine Strømfeldt b , Carlo Barbante c , Claude Boutron d , Hubertus Fischer a , Heinz Miller a a Alfred Wegener Institute for Marine and Polar Research, Columbusstrasse, 27568 Bremerhaven, Germany b Ice and Climate, Niels Bohr Institute, University of Copenhagen, Juliane Mariesvej 30, 2100 Kbh Ø, Denmark c Department of Environmental Sciences, University of Venice, Ca’ Foscari, I-30123 Venice, Italy d Laboratoire de Glaciologie et Geophysique de l’ Environnement (UMR CNRS-UJF 5183), 54 rue Moliere, Domaine Universitaire, BP 96, 38402 Saint Martin d’ Heres cedex, France Received 21 September 2005; received in revised form 6 March 2007; accepted 11 March 2007 Editor: G.D. Price Available online 16 March 2007 Abstract Continental dust impurities in Antarctic ice provide information on climate changes in the dust source areas and on past atmospheric circulation. We investigated records of dust species from the last 45 ka in the East Antarctic EPICA DomeC (EDC) ice core with special emphasis on the lithium (Li) content of dust. We obtained two complementary Li-records using a new Ion Chromatography (IC) technique in line with Inductively Coupled Plasma-Sector Field Mass Spectroscopy (ICP-SFMS). Concentrations of soluble Li (Li + ) were obtained using IC, while total concentrations of Li (Li T ) were obtained using ICP-SFMS, providing an ideal opportunity to investigate the soluble and insoluble chemistry of Li in East Antarctic dust over the last glacial– interglacial transition. The records show that changes in the solubility of Li are associated with climatic changes. For the late glacial period and the Antarctic Cold Reversal (ACR) a large fraction, up to 75%, of the Li T content is present as insoluble minerals whereas for the Holocene period it seems that Li is present mainly as soluble salts (Li + ). We compared the concentrations of Li + with the concentrations of Ca 2+ and the mass and size characteristics of the dust, which were obtained using Coulter Counting (CC). Furthermore we compared the concentrations of Li T with the concentrations of Ba T . Our analysis suggests that the changes in solubility of Li along the EDC ice core are related to changes in compositions of the dust minerals. During the late glacial period, changes in the dust composition is characteristic of variations in the strength of the atmospheric circulation, while changes over the last glacial–interglacial transition are indicative of a change in the major dust source areas. The dust characteristics for the glacial and the Holocene periods indicate two different dust types. The glacial dust type partly disappeared after the ACR, while the Holocene dust type appeared significantly after around 16 ka BP and became dominant after the ACR. The relative increase in the Holocene dust type at the glacial–interglacial transition could be due to changed conditions in the potential source area or to changed patterns of atmospheric circulation, resulting in enhanced transport from a source area that was different from the glacial source areas. © 2007 Elsevier B.V. All rights reserved. Keywords: lithium; EPICA; Antarctica; eolian dust; last transition; climate Earth and Planetary Science Letters 258 (2007) 32 – 43 www.elsevier.com/locate/epsl ⁎ Corresponding author. Niels Bohr Institute, Juliane Mariesvej 30, 2100 Copenhagen Ø, Denmark. Tel.: +45 35320561; fax: +45 3536 5357. E-mail address: [email protected] (M.-L. Siggaard-Andersen). 0012-821X/$ - see front matter © 2007 Elsevier B.V. All rights reserved. doi:10.1016/j.epsl.2007.03.013
Transcript of Soluble and insoluble lithium dust in the EPICA DomeC ice core—Implications for changes of the...

etters 258 (2007) 32–43www.elsevier.com/locate/epsl
Earth and Planetary Science L
Soluble and insoluble lithium dust in the EPICA DomeCice core—Implications for changes of the East Antarctic dustprovenance during the recent glacial–interglacial transition
Marie-Louise Siggaard-Andersen a,b,⁎, Paolo Gabrielli c,d, Jørgen Peder Steffensen b,Trine Strømfeldt b, Carlo Barbante c, Claude Boutron d, Hubertus Fischer a, Heinz Miller a
a Alfred Wegener Institute for Marine and Polar Research, Columbusstrasse, 27568 Bremerhaven, Germanyb Ice and Climate, Niels Bohr Institute, University of Copenhagen, Juliane Mariesvej 30, 2100 Kbh Ø, Denmark
c Department of Environmental Sciences, University of Venice, Ca’ Foscari, I-30123 Venice, Italyd Laboratoire de Glaciologie et Geophysique de l’ Environnement (UMR CNRS-UJF 5183), 54 rue Moliere, Domaine Universitaire, BP 96, 38402
Saint Martin d’ Heres cedex, France
Received 21 September 2005; received in revised form 6 March 2007; accepted 11 March 2007
Available onli
Editor: G.D. Pricene 16 March 2007
Abstract
Continental dust impurities in Antarctic ice provide information on climate changes in the dust source areas and on pastatmospheric circulation. We investigated records of dust species from the last 45 ka in the East Antarctic EPICA DomeC (EDC) icecore with special emphasis on the lithium (Li) content of dust. We obtained two complementary Li-records using a new IonChromatography (IC) technique in line with Inductively Coupled Plasma-Sector Field Mass Spectroscopy (ICP-SFMS).Concentrations of soluble Li (Li+) were obtained using IC, while total concentrations of Li (LiT) were obtained using ICP-SFMS,providing an ideal opportunity to investigate the soluble and insoluble chemistry of Li in East Antarctic dust over the last glacial–interglacial transition. The records show that changes in the solubility of Li are associated with climatic changes. For the late glacialperiod and the Antarctic Cold Reversal (ACR) a large fraction, up to 75%, of the LiT content is present as insoluble minerals whereasfor the Holocene period it seems that Li is present mainly as soluble salts (Li+). We compared the concentrations of Li+ with theconcentrations of Ca2+ and the mass and size characteristics of the dust, which were obtained using Coulter Counting (CC).Furthermore we compared the concentrations of LiT with the concentrations of BaT . Our analysis suggests that the changes insolubility of Li along the EDC ice core are related to changes in compositions of the dust minerals. During the late glacial period,changes in the dust composition is characteristic of variations in the strength of the atmospheric circulation, while changes over thelast glacial–interglacial transition are indicative of a change in the major dust source areas. The dust characteristics for the glacial andthe Holocene periods indicate two different dust types. The glacial dust type partly disappeared after the ACR, while the Holocenedust type appeared significantly after around 16 ka BP and became dominant after the ACR. The relative increase in the Holocenedust type at the glacial–interglacial transition could be due to changed conditions in the potential source area or to changed patterns ofatmospheric circulation, resulting in enhanced transport from a source area that was different from the glacial source areas.© 2007 Elsevier B.V. All rights reserved.
Keywords: lithium; EPICA; Antarctica; eolian dust; last transition; climate
⁎ Corresponding author. Niels Bohr Institute, Juliane Mariesvej 30, 2100 Copenhagen Ø, Denmark. Tel.: +45 35320561; fax: +45 3536 5357.E-mail address: [email protected] (M.-L. Siggaard-Andersen).
0012-821X/$ - see front matter © 2007 Elsevier B.V. All rights reserved.doi:10.1016/j.epsl.2007.03.013

33M.-L. Siggaard-Andersen et al. / Earth and Planetary Science Letters 258 (2007) 32–43
1. Introduction
Aeolian dust deposits contain important informationon past atmospheric dust transport and on dustmobilization in the source areas. In particular, dustdeposited onto the East Antarctic Plateau represents atracer for long range atmospheric dust transport overthe Southern Ocean, which is believed to play acentral role in the global CO2 budget through fertil-ization with iron rich dust and the consequent uptake ofatmospheric CO2 by the ocean [1]. Detailed analysis ofdust impurities in East Antarctic ice cores has beenperformed in order to obtain information on theirconcentrations and size characteristics [2,3], mineralogy[4], element composition [5], and isotope composition[6]. Many new high resolution records of dust specieshave been obtained from the recently recovered EPICADome C (EDC) ice core [7], providing an ideal databaseto investigate, in detail, temporal changes in EastAntarctic dust. Isotope analyses (Nd and Sr) of glacialdust from East Antarctic ice cores have identifiedPatagonia (Argentina) as the main glacial dust sourcearea, with possible additional contributions from SouthAfrica or Australia [6,8]. Recent analyses on EastAntarctic ice cores are confirming a Patagonian originfor dust during glacial times [9], while for interglacialperiods other source locations, such as Eastern Australiain particular, may have contributed to a more importantextent [10].
Dust concentrations in the EDC ice core decreased bya factor of 50 from 790 pbb (parts per billion) at the LastGlacial Maximum (LGM) to 15 pbb during theHolocene period [3]. In general, concentrations of dustspecies in polar ice cores have decreased during warmperiods, partly due to weakened transport [11], andpartly to decreased dust mobilization in the source areaas a result of locally increased humidity and vegetationcover [12]. Also changes in particle size characteristicsare associated with climate changes and in particular tochanges in conditions for long range atmospherictransport. For instance, in Greenland ice cores, particlesize distribution modes (size modes in the following) aresmall during warm periods when atmospheric transportbecomes less vigorous [13]. However, a contrastingincrease in the particle size mode at the transition fromthe Last Glacial Maximum (LGM) to the Holocene wasobserved in the EDC ice core [3] and was explained asan effect of more favorable conditions for transport ofdust to East Antarctica in the Holocene compared to theLGM [14]. This hypothesis was recently supported bythe identification in the EDC ice core of possible inputsof volcanic Ir and Pt from coastal Antarctic areas exclu-
sively during warm periods [15]. Other contradictionsabout atmospheric transport from Patagonia to EastAntarctica during the LGM have resulted from atmo-sphere coupled general circulation model simulations[16] and back trajectory analysis [17], leaving manyopen questions about changes in the southern hemi-spheric dust cycle during the last glacial–interglacialtransition.
Here we present a detailed investigation of thechemical and physical properties of the EDC dustmaterial over the last 45 ka with a special emphasis onLi, which has peculiar geochemical properties andtherefore can provide new information for a betterunderstanding of the changes in the dust cycle duringthe last glacial–interglacial transition. Li exists in theenvironment at trace concentrations, with an averageabundance in the upper crust of 22 ppm (parts permillion) [18]. In addition, Li is relatively insoluble inwater, and fits poorly into most mineral structures,which is why pure Li minerals are rare, however theycan be found for example in Western Australia, whereLi-minerals (pegmatite) are mined. On the other hand,the solubility of Li increases largely with increasingtemperature, why Li can be very mobile during rock–water interactions and tends to accumulate in claysediments, or in evaporite deposits. For instance, the saltlakes of the Bolivian Altiplano constitute a majordeposit of Li-salts.
Concentrations of total Li (LiT) were previouslymeasured in the East Antarctic Vostok ice core [19].Low concentrations in the order of a few pg g−1 werefound during interglacial periods and high concentra-tions (between 40 and 100 pg g−1) during glacialperiods. Based on enriched amounts of Li compared toother crustal species they concluded that the atmo-spheric cycle of Li was influenced by sources other thansoil dust during warmer periods, or alternatively thesechanges in Li amounts during warm periods were in partlinked with changes in the dust source areas, or physicalsoil conditions (variations in humidity), or transportprocesses (gravitational settling) between glacial andinterglacial periods.
Using a new Ion Chromatography (IC) technique[20], we obtained the first Antarctic record of soluble Li(Li+) from the EDC ice core. A complementary record ofthe total amount of Li (soluble plus insoluble, LiT) wasobtained using Inductively Coupled Plasma-Sector FieldMass Spectrometry (ICP-SFMS) [19]. A comparison ofthe two Li records offers an ideal opportunity toinvestigate soluble and insoluble behavior of Li inAntarctic ice. Complementary analysis of Ca+, BaT, dustmass and size characteristics were performed. Herebywe

34 M.-L. Siggaard-Andersen et al. / Earth and Planetary Science Letters 258 (2007) 32–43
obtained information on changes in the Li enrichmentfactor and how these changes are related to changes indust composition, which could help with the under-standing of possible changes in weathering in the dustsource area, changes in location of the dust source andchanged conditions for transport.
2. Data and experimental methods
2.1. IC analysis of Li+ and Ca2+
Ion Chromatography (IC) was used for simultaneousanalysis of a variety of simple soluble ions such as SO4
2−,NO3
−, Ca2+ and Na+ [21]. Using a new IC technique [20]Li+ was detected in addition to the other ions.
From the top 588 m of the EDC ice core, 55 cm longstrips for IC analysis were cut in the field and distributedbetween 5 European laboratories, where the strips weremanually decontaminated, using microtome knives, andcut into 2.5 or 5 cm sub-samples before they were meltedand analyzed. For the depth interval from 588 m to788 m, samples for IC analysis were collected fromcontamination free excess melt water during continuousflow analysis [21]. The sample depth interval for thesesamples varies roughly between 10 cm and 50 cmdepending on the amount of excess melt water from theflow analysis. In this work we present concentrations ofLi+ and Ca2+ in 1448 samples from the top 788 m of theEDC ice core, measured at the Department of Geophy-sics, University of Copenhagen, where the new ICtechnique was developed for the detection of Li+ in traceamounts. This record represents discontinuous 55 cmsections of the core. The amount of data from the top200m of the ice core are limited due to lack of analyses inthis part. Based on repeated measurements of standardsolutions, the precision of the Li+ concentrations wasfound to be better than 10% for the whole range ofmeasured Li+ concentrations. The analytical detectionlimit for Li+ was around 1 pg g−1 (10−12 g per g of ice).Process blanks for IC measurements were made from arod of frozen ultrapure water, which were manuallydecontaminated with a microtome knife. A small amountof lithium was detected in all these blanks— on average1 pg g−1, probably due to contamination from the plastictube in which the ice rod was frozen. The amount of Lidetected in the process blanks was, however, muchlower than the glacial concentrations and were suffi-ciently low enough to have no affect on the significanceof the relatively low interglacial Li concentrations. TheIC Ca2+ record [22] was measured in parallel with a highresolution Ca2+ record obtained by Continuous FlowAnalysis [23].
2.2. Coulter Counting of insoluble particles
Coulter Counting (CC) was used to estimate dustmass concentrations and highly resolved particle sizecharacteristics as some IC samples from the top 588 mof the ice core had a sufficiently large volume to beanalyzed this way. Between 4 and 6 samples from eachsample bag, adding up to 222 samples, were analyzedfor particle characteristics. Dust masses were evaluatedbased on the assumption that the particles are sphericalwith a mass density of 2.7 g cm− 3. The majoruncertainty in particle counting is due to the fact thatparticles in a liquid suspension are not homogeneouslydistributed, and they have a tendency to settle by gravity.However, repeated sample particle counting showed inmost cases to have reproducibility better than ±15%.The CC data presented here were measured in parallelwith the EDC dust data presented in [3]. The two datasets are mutually consistent.
2.3. Analysis of LiT and BaT concentrations
Inductively Coupled Plasma-Sector Field MassSpectrometry (ICP-SFMS) was used for simultaneousanalyses of a variety of trace elements. In the top 788 mof the EDC ice core 46 samples were analyzed usingICP-SFMS (the data are reported in [24]). For theseanalyses discrete 55 cm sample strips were decontami-nated in ultra-clean environments at the Laboratoire deGlaciologie et Géophysique de l’Environnement, Gre-noble, France. From each strip two adjacent sampleswith a length of about 20 cm were obtained. From eachsample a 5 ml aliquot was analyzed for trace elements atthe Department of Environmental Science, University ofVenice, Italy [5,24,25]. The detection limit for ICP-SFMS was 1 pg g−1 which was sufficient for quan-tification of LiT in the EDC ice core.
3. Results
3.1. The Li+ and LiT records
Both Li records (Li+ and LiT) in the EDC ice corefollow climate changes with high concentrations duringcold periods and low concentrations during warmperiods (Fig. 1). In the Holocene, the concentrations ofLi+ seem to exceed the concentrations of LiT, which maybe a result of analytical imprecision since concentrationsin these samples are very low at around a few pg g−1,which is close to the detection limit of 1 pg g−1 for bothanalytical techniques. Both Li concentrations showvariations in line with changes in dust concentrations.

Fig. 1. (A) on the left axis (reversed for comparisons) is the EDC ice core record of Deuterium (δD) over the last 45 ka from [36]. On the right axis isshown actual dust mass concentrations analyzed using CC on excess IC sample volumes from the top 588 m of the ice core. The records are shown onthe EDC-1 age scale [31], which was recommended for the time period of the last 45 ka until most recently, where the EDC-3 age scale [37] has beenestablished. The differences between the EDC-1 and EDC-3 age scales are small and the use of EDC-1 has no effect on the discussions of this paper.The δD curve indicates East Antarctic temperature variations over the Holocene period and the later part of the last glacial, including the Last GlacialMaximum (LGM) at 20–25 ka BP and the Antarctic warming event, A1, around 38 ka BP. Also the Antarctic warming, A2, around 45 ka BP is seenin the right most part of the curve. The last transition in East Antarctica is characterized by a warming trend between 19 ka BP and 11 ka BP, whichwas interrupted by the Antarctic Cold Reversal (ACR) 14–12.5 ka BP. (B) The two Li records obtained by, respectively, IC (grey lines; the black linewith open triangles indicate the bag median values) and ICP-SFMS (black squares; the solid black line indicate the bag mean values) analysis areshown on a logarithmic axis. Bag-means and bag-medians represent respectively mean and median values over 55 cm ice core strips.
35M.-L. Siggaard-Andersen et al. / Earth and Planetary Science Letters 258 (2007) 32–43
At the LGM the concentrations of Li+ and LiT are ∼25and ∼100 pg g−1, respectively. The concentrations ofLiT in the EDC ice core are very similar to previouslydetermined LiT concentrations of about 1–100 pg g−1
in the East Antarctic Vostok ice core [19].Insoluble trace elements in Antarctic ice are mainly
related to insoluble mineral dust impurities [19], whilesoluble species are mainly of marine origin. However,certain fractions of soluble species are dissolved orleached from dust minerals. The sea salt contributions tothe amounts of different soluble species are convention-ally estimated on the basis of the sea water ratio of thetarget analyte to Na+ [26]. The Li+/Na+ mass ratio in seawater is 1.8×10⁻⁵ [27] which is more than 10 timeslower than the average Li+/Na+ mass ratio of 2.1×10⁻⁴
measured in the EDC ice core. We therefore canconsider Li+ as well as insoluble Li in the EDC icecore to be essentially mineral dust species. Thevariations in relative amounts of the two species
therefore reflect changes in solubility of Li from mineraldust. A comparison of the two Li records shows that thesoluble fraction of the Li content changes significantlyalong the record. For the glacial period a major fractionof the Li is insoluble whereas for the Holocene, it seemsthat all of the Li is soluble.
In the upper part of the record, Li+ shows highspikes of up to 100 pg g−1. A closer inspection of thedata shows that the changes in frequency andmagnitude of the spikes are related to changes insample time interval. Furthermore, the peak concentra-tions of the spikes in the Holocene samples exceed thepeak concentrations in the glacial samples. From theseobservations, suggesting that the spikes are absent inLGM due to the low sample resolution, it is unlikelythat the spikes are artefacts introduced during samplingand analysis. Although it is difficult to explain theoccurrence of high spikes in the Holocene part of therecord, we believe they represent impurities in the ice;
36 M.-L. Siggaard-Andersen et al. / Earth and Planetary Science Letters 258 (2007) 32–43
not an artefact introduced during sampling or measure-ments. In fact, the sample time intervals for themanually cut IC samples are 1–2 yr for the Holoceneand 4.0–4.5 yr for the glacial period. For the ICP-SFMS samples, the sample time intervals weresignificantly longer, 6–8 yr for the Holocene and 15–18 yr for the glacial period. This, together with themuch smaller number of samples measured using ICP-SFMS could be a reason why the spikes do not appearin the ICP-SFMS record. The spikes in the Li+ recordmay be reflecting particular geochemical properties ofLi either in the dust source region or in the ice matrix.Changing humidity in local areas at the dust sourcecould result in short-term exposures of lake sedimentsor evaporates highly enriched in Li. Another possibilitycould be short-term occurrences of changed windtrajectories carrying Li enriched dust from a differentsource location; for example, the area of BoliviaAltiplano, South America, at 20 °S, where great saltplanes contain evaporite with extremely high amountsof Li. Alternatively, the Li+ spikes could be a result ofspecial properties of Li+ in the ice matrix. Li+ may havethe ability to migrate very fast in the ice, due to itssmall ion radius, and to accumulate at locationsfavorable for Li. However, no observations so far cansupport this hypothesis. High-resolution chemicalanalyses of ice samples, using e.g. an ICP-MStechnique, may potentially shed more light on thesource to the Li-spikes.
3.2. Dust composition
Aerosol dust is rather inhomogeneous, consisting ofparticles of a wide size range (0.1–10 μm in diameter)representing a variety of mineral types, characteristic fora particular dust source area. The clay minerals arerelatively small, while quartz grains are relatively large.Fractionation of mineral dust during long-range atmo-spheric transport is a well-known phenomenon (e.g.[28,29]). Dust size and mineral characteristics aremodified over time in the atmosphere due to differentatmospheric life-times for different fractions of theaerosol particles. In a moving air parcel the concentra-tions C=C(t) for an aerosol species with atmosphericlife-time τ, can be expressed as a function of time, t [30]:
C ¼ C0d exp½�ðt � t0Þd s�1� ð1Þ
or equivalently:
ln½C� ¼ ln½C0� � ðt � t0Þd s�1 ð2Þ
where C0 is the air concentration of the species at anearlier time t0. For two different species A and B weobtain from Eq. (2)
ln CA½ � ¼ sBsA
d ln CB½ � þ const: ð3Þ
and further for the ratio between the two species:
ln CA=CB½ � ¼ sBsA
� 1
� �d ln CB½ � þ const: ð4Þ
Assuming that a major climate influence on airconcentrations are changes in transport time, it followsfrom Eq. (4) that the logarithm of the ratio between twospecies A and B has a linear relationship withlogarithmic concentrations of species B. For the relativecomparison purpose in the following, we make theassumption that air concentrations of aerosol species arewell represented by ice concentrations. Hereby we areneglecting possible effects on concentrations fromvarying snow accumulation rates. In fact, these varia-tions are small, a factor of∼2 between the LGM and theHolocene [31], compared to variations in dust concen-trations, which are a factor of 50 between the LGM andthe Holocene [3], and in Li+ concentrations, which varyby a factor of 10 between the LGM and the Holocene.Furthermore we did not correct for the sea saltcontributions of the different species, which in case ofCa2+ is not a negligible amount: 24%±10% for theHolocene, and 8%±2% for the glacial period, calculatedusing the Na+ concentrations as a sea salt proxy, howeverthis does not affect our results.
Deviations from a linear relationship betweenlogarithmic ice concentrations signifies influences onair concentrations other than transport time. Fig. 2Ashows the relationship between logarithmic Li+/Ca2+
ratios and Ca2+ concentrations. During the glacialperiod the Li+/Ca2+ ratios are nearly constant at around3×10−4, which is similar to the Li/Ca mass ratio in theupper continental crust [18]. In contrast, during theHolocene there is no correlation between the Li+/Ca2+
ratio and Ca2+ and the relative concentrations of Li+ aremarkedly higher, with Li+/Ca2+ ratios of up to 10−2,which can be explained in two different ways, as anenrichment of Li in the Holocene dust, or as an acidityeffect, enhancing the solubility of Li.
In order to investigate variations in the relative LiTamounts in the dust, we use here the concentration ofBaT as a continental tracer. In order to assess theimportance of the rock and soil dust contribution for Liwe calculated crustal enrichment factors (EFc) for eachdepth. An EFc is defined as the concentration ratio of a
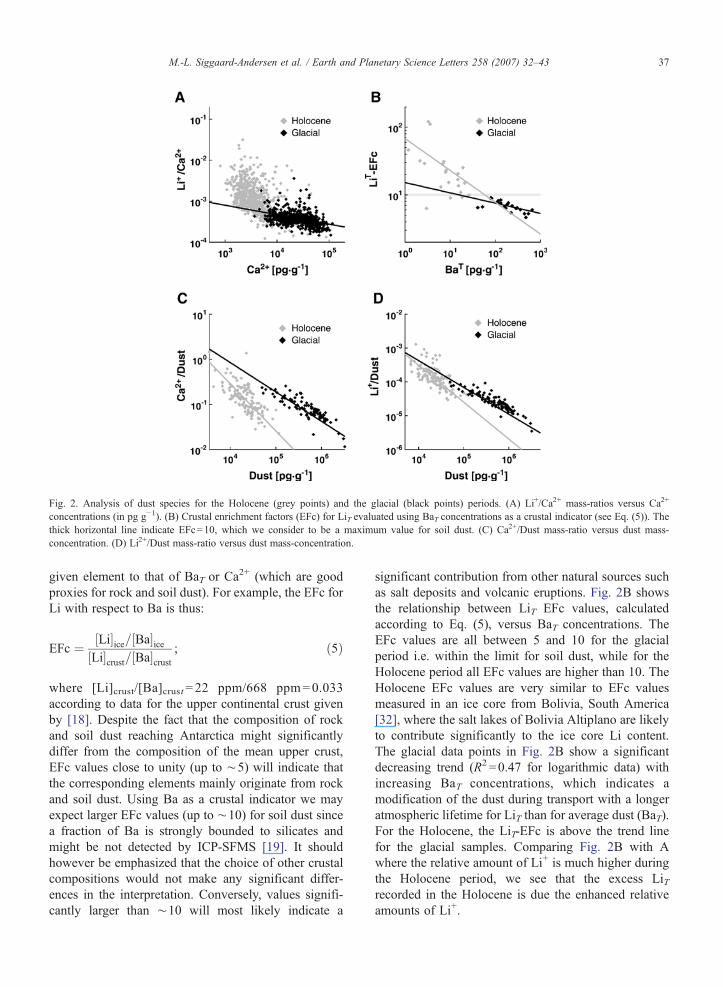
Fig. 2. Analysis of dust species for the Holocene (grey points) and the glacial (black points) periods. (A) Li+/Ca2+ mass-ratios versus Ca2+
concentrations (in pg g−1). (B) Crustal enrichment factors (EFc) for LiT evaluated using BaT concentrations as a crustal indicator (see Eq. (5)). Thethick horizontal line indicate EFc=10, which we consider to be a maximum value for soil dust. (C) Ca2+/Dust mass-ratio versus dust mass-concentration. (D) Li2+/Dust mass-ratio versus dust mass-concentration.
37M.-L. Siggaard-Andersen et al. / Earth and Planetary Science Letters 258 (2007) 32–43
given element to that of BaT or Ca2+ (which are good
proxies for rock and soil dust). For example, the EFc forLi with respect to Ba is thus:
EFc ¼ ½Li�ice=½Ba�ice½Li�crust=½Ba�crust
; ð5Þ
where [Li]crust/[Ba]crust=22 ppm/668 ppm=0.033according to data for the upper continental crust givenby [18]. Despite the fact that the composition of rockand soil dust reaching Antarctica might significantlydiffer from the composition of the mean upper crust,EFc values close to unity (up to ∼5) will indicate thatthe corresponding elements mainly originate from rockand soil dust. Using Ba as a crustal indicator we mayexpect larger EFc values (up to ∼10) for soil dust sincea fraction of Ba is strongly bounded to silicates andmight be not detected by ICP-SFMS [19]. It shouldhowever be emphasized that the choice of other crustalcompositions would not make any significant differ-ences in the interpretation. Conversely, values signifi-cantly larger than ∼10 will most likely indicate a
significant contribution from other natural sources suchas salt deposits and volcanic eruptions. Fig. 2B showsthe relationship between LiT EFc values, calculatedaccording to Eq. (5), versus BaT concentrations. TheEFc values are all between 5 and 10 for the glacialperiod i.e. within the limit for soil dust, while for theHolocene period all EFc values are higher than 10. TheHolocene EFc values are very similar to EFc valuesmeasured in an ice core from Bolivia, South America[32], where the salt lakes of Bolivia Altiplano are likelyto contribute significantly to the ice core Li content.The glacial data points in Fig. 2B show a significantdecreasing trend (R2 =0.47 for logarithmic data) withincreasing BaT concentrations, which indicates amodification of the dust during transport with a longeratmospheric lifetime for LiT than for average dust (BaT).For the Holocene, the LiT-EFc is above the trend linefor the glacial samples. Comparing Fig. 2B with Awhere the relative amount of Li+ is much higher duringthe Holocene period, we see that the excess LiTrecorded in the Holocene is due the enhanced relativeamounts of Li+.
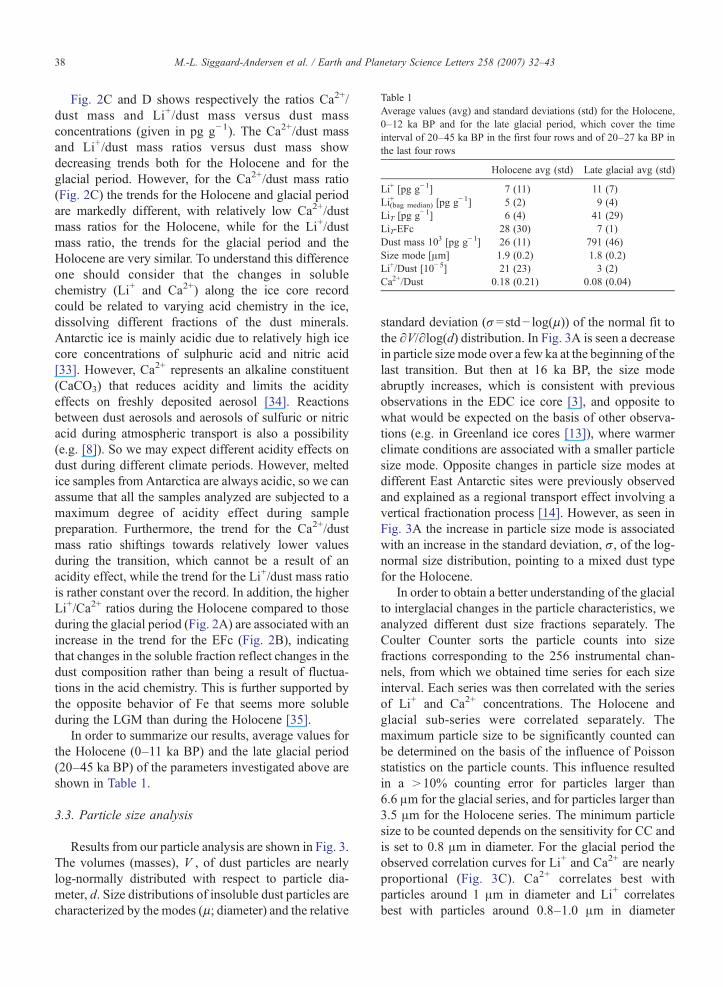
Table 1Average values (avg) and standard deviations (std) for the Holocene,0–12 ka BP and for the late glacial period, which cover the timeinterval of 20–45 ka BP in the first four rows and of 20–27 ka BP inthe last four rows
Holocene avg (std) Late glacial avg (std)
Li+ [pg g−1] 7 (11) 11 (7)Li(bag median)
+ [pg g−1] 5 (2) 9 (4)LiT [pg g−1] 6 (4) 41 (29)LiT-EFc 28 (30) 7 (1)Dust mass 103 [pg g−1] 26 (11) 791 (46)Size mode [μm] 1.9 (0.2) 1.8 (0.2)Li+/Dust [10−5] 21 (23) 3 (2)Ca2+/Dust 0.18 (0.21) 0.08 (0.04)
38 M.-L. Siggaard-Andersen et al. / Earth and Planetary Science Letters 258 (2007) 32–43
Fig. 2C and D shows respectively the ratios Ca2+/dust mass and Li+/dust mass versus dust massconcentrations (given in pg g−1). The Ca2+/dust massand Li+/dust mass ratios versus dust mass showdecreasing trends both for the Holocene and for theglacial period. However, for the Ca2+/dust mass ratio(Fig. 2C) the trends for the Holocene and glacial periodare markedly different, with relatively low Ca2+/dustmass ratios for the Holocene, while for the Li+/dustmass ratio, the trends for the glacial period and theHolocene are very similar. To understand this differenceone should consider that the changes in solublechemistry (Li+ and Ca2+) along the ice core recordcould be related to varying acid chemistry in the ice,dissolving different fractions of the dust minerals.Antarctic ice is mainly acidic due to relatively high icecore concentrations of sulphuric acid and nitric acid[33]. However, Ca2+ represents an alkaline constituent(CaCO3) that reduces acidity and limits the acidityeffects on freshly deposited aerosol [34]. Reactionsbetween dust aerosols and aerosols of sulfuric or nitricacid during atmospheric transport is also a possibility(e.g. [8]). So we may expect different acidity effects ondust during different climate periods. However, meltedice samples from Antarctica are always acidic, so we canassume that all the samples analyzed are subjected to amaximum degree of acidity effect during samplepreparation. Furthermore, the trend for the Ca2+/dustmass ratio shiftings towards relatively lower valuesduring the transition, which cannot be a result of anacidity effect, while the trend for the Li+/dust mass ratiois rather constant over the record. In addition, the higherLi+/Ca2+ ratios during the Holocene compared to thoseduring the glacial period (Fig. 2A) are associated with anincrease in the trend for the EFc (Fig. 2B), indicatingthat changes in the soluble fraction reflect changes in thedust composition rather than being a result of fluctua-tions in the acid chemistry. This is further supported bythe opposite behavior of Fe that seems more solubleduring the LGM than during the Holocene [35].
In order to summarize our results, average values forthe Holocene (0–11 ka BP) and the late glacial period(20–45 ka BP) of the parameters investigated above areshown in Table 1.
3.3. Particle size analysis
Results from our particle analysis are shown in Fig. 3.The volumes (masses), V , of dust particles are nearlylog-normally distributed with respect to particle dia-meter, d. Size distributions of insoluble dust particles arecharacterized by the modes (μ; diameter) and the relative
standard deviation (σ=std− log(μ)) of the normal fit tothe ∂V/∂log(d) distribution. In Fig. 3A is seen a decreasein particle size mode over a few ka at the beginning of thelast transition. But then at 16 ka BP, the size modeabruptly increases, which is consistent with previousobservations in the EDC ice core [3], and opposite towhat would be expected on the basis of other observa-tions (e.g. in Greenland ice cores [13]), where warmerclimate conditions are associated with a smaller particlesize mode. Opposite changes in particle size modes atdifferent East Antarctic sites were previously observedand explained as a regional transport effect involving avertical fractionation process [14]. However, as seen inFig. 3A the increase in particle size mode is associatedwith an increase in the standard deviation, σ, of the log-normal size distribution, pointing to a mixed dust typefor the Holocene.
In order to obtain a better understanding of the glacialto interglacial changes in the particle characteristics, weanalyzed different dust size fractions separately. TheCoulter Counter sorts the particle counts into sizefractions corresponding to the 256 instrumental chan-nels, from which we obtained time series for each sizeinterval. Each series was then correlated with the seriesof Li+ and Ca2+ concentrations. The Holocene andglacial sub-series were correlated separately. Themaximum particle size to be significantly counted canbe determined on the basis of the influence of Poissonstatistics on the particle counts. This influence resultedin a >10% counting error for particles larger than6.6 μm for the glacial series, and for particles larger than3.5 μm for the Holocene series. The minimum particlesize to be counted depends on the sensitivity for CC andis set to 0.8 μm in diameter. For the glacial period theobserved correlation curves for Li+ and Ca2+ are nearlyproportional (Fig. 3C). Ca2+ correlates best withparticles around 1 μm in diameter and Li+ correlatesbest with particles around 0.8–1.0 μm in diameter
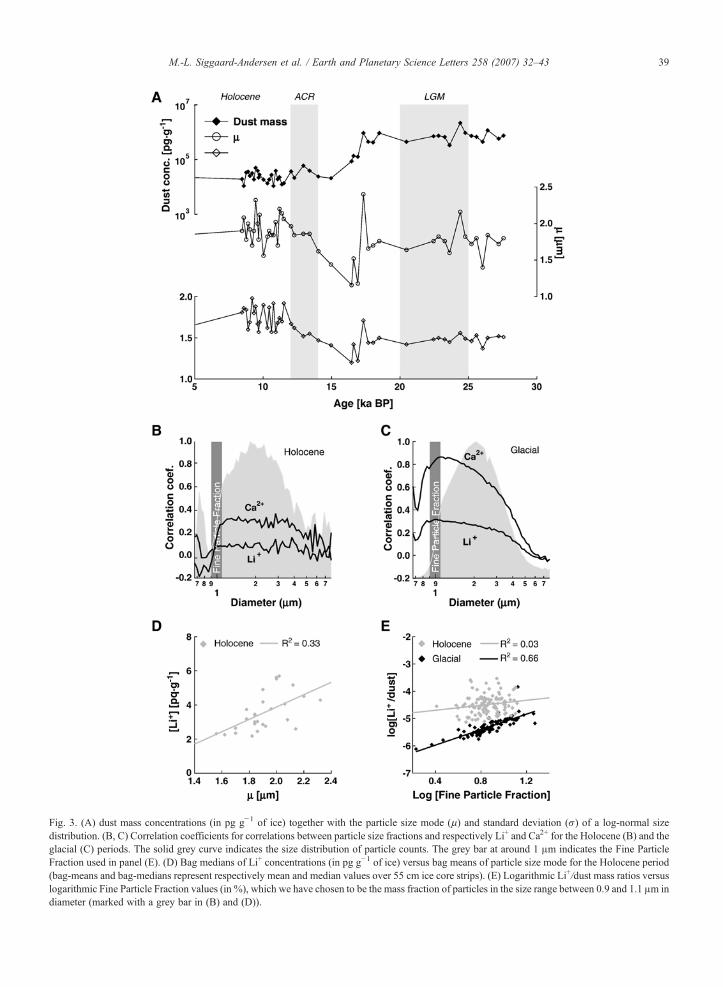
Fig. 3. (A) dust mass concentrations (in pg g−1 of ice) together with the particle size mode (μ) and standard deviation (σ) of a log-normal sizedistribution. (B, C) Correlation coefficients for correlations between particle size fractions and respectively Li+ and Ca2+ for the Holocene (B) and theglacial (C) periods. The solid grey curve indicates the size distribution of particle counts. The grey bar at around 1 μm indicates the Fine ParticleFraction used in panel (E). (D) Bag medians of Li+ concentrations (in pg g−1 of ice) versus bag means of particle size mode for the Holocene period(bag-means and bag-medians represent respectively mean and median values over 55 cm ice core strips). (E) Logarithmic Li+/dust mass ratios versuslogarithmic Fine Particle Fraction values (in %), which we have chosen to be the mass fraction of particles in the size range between 0.9 and 1.1 μm indiameter (marked with a grey bar in (B) and (D)).
39M.-L. Siggaard-Andersen et al. / Earth and Planetary Science Letters 258 (2007) 32–43

40 M.-L. Siggaard-Andersen et al. / Earth and Planetary Science Letters 258 (2007) 32–43
indicating that Li+ and Ca2+ are both mainly related tothe very small particles that usually are dominated byclay minerals [28]. For the Holocene series (Fig. 3B)correlations are limited because of less accuracy in thelow concentration range both for particle counts and forIC measurements. However, using bag-medians (med-ian sample value for a 55 cm ice core depth interval) forLi+ concentrations and bag-averages (mean samplevalue for a 55-cm ice core depth interval) for particlecharacteristics, there seems to be a significant increasingtrend for Li+ concentrations with increasing size modefor the Holocene (Fig. 3D), suggesting that Li+ in thisperiod is associated with larger particles. A relationshipwith very small particles for Li+ during the glacialperiod is further confirmed by the increasing trend of theLi+/dust mass ratio against the mass fraction of particlesin the 0.9–1.1 μm diameter size fraction (Fig. 3E). Ca2+
has a similar relationship with the 0.9–1.1 μm sizefraction (not shown) during the glacial period. Thisinvestigation shows that the Li enrichment in the EDCice core during the Holocene is associated with anabruptly and marked change in the behavior of the dustmaterial at the last transition, indicating a major changein the composition of terrestrial dust.
4. Discussion
4.1. Changes in dust composition during the lateglacial period
Changes in dust concentrations during the late glacialperiod in the EDC ice core (e.g. during the Antarcticwarming A1 (Fig. 1)) has been explained in previouspapers by changes in dust mobilization at the source[3,23]. However, the linear relationships betweenlogarithmic concentrations of different dust species,for the period from 45 ka BP and around 16 ka BP (Fig.2), indicate that the chemical and size characteristics ofthe dust to a large part is affected by modificationsduring transport, associated with changing airconcen-trations. From our results, variations in dust concentra-tions during the late glacial period are therefore to asignificant part resulting from changes in the strength ofatmospheric circulation, pointing to a more efficienttransport of dust to East Antarctica during the LGM thanduring A1.
4.2. Glacial–interglacial contrasts
While the changes in dust composition between 45and 16 ka BP shows systematic behavior which can beexplained as an effect of changing transport times,
probably combined with systematic climate changes inthe dust source area, the changes at around 16 ka BPneed a different explanation. A major decrease in sourceemission [23] and a vertical fractionation process locally[14] are previously proposed hypotheses, which may besupported by some of the observations that were donefrom the present analysis; for instance the Ca2+/dustmass ratios in the Holocene are similar to thecorresponding glacial ratios although concentrations inthe ice core are much lower during the Holocene (Fig.2C). This could indicate that transport modifications ofthe dust characteristics are similar during the glacial andthe Holocene. However, other observations are notconsistent with those hypotheses. The most striking oneis the glacial–interglacial change in behavior of Li+,which for the glacial part is related to the small sizedparticle fraction, while in the Holocene part, increasedLi+ concentrations are associated with a large particlesize mode (Fig. 3D and E). This contrast indicates amarked change in mineral composition of the dust at thelast transition. In the glacial period, Li seems to berelated to clay minerals that generally consist of veryfine particles that can leach soluble species to naturalwaters, while in the Holocene dust, Li seems to bemostly soluble, suggesting that Li in that period isassociated with other minerals, from evaporate deposits,for instance. Based on our studies on the dust in theEDC ice core we suggest that the Holocene and theglacial dust respectively represent two different dustmaterials probably related to different source areas. Theobservation of relatively weak correlations between dustspecies during the Holocene (Fig. 2) points to a mixedcomposition of different dust materials during theHolocene. This is further supported by the observationof an increased standard deviation of particle sizesduring the Holocene (Fig. 3A).
According to the relationships in the glacial periodbetween different dust species (Fig. 2A–D), we havematched the amplitudes of four different records onlogarithmic scales (Fig. 4). Between 45 ka BP and 16 kaBP the curves are lying on top of each other, illustrating arelationship between the species according to Eq. (3).After approximately 16 ka BP, the curves start to divergeand from the end of the transition they are completelyseparate in the plot, illustrating the change in dustcharacteristics. While a Patagonian provenance of theglacial dust has been well documented (e.g. [14]), theHolocene dust may be characteristic for an additionaldust source that, if present, was not important during theglacial period. Considering that the size characteristicschange abruptly at around 16 ka BP while the decreasingtrend in concentrations is constant, we suggest that the
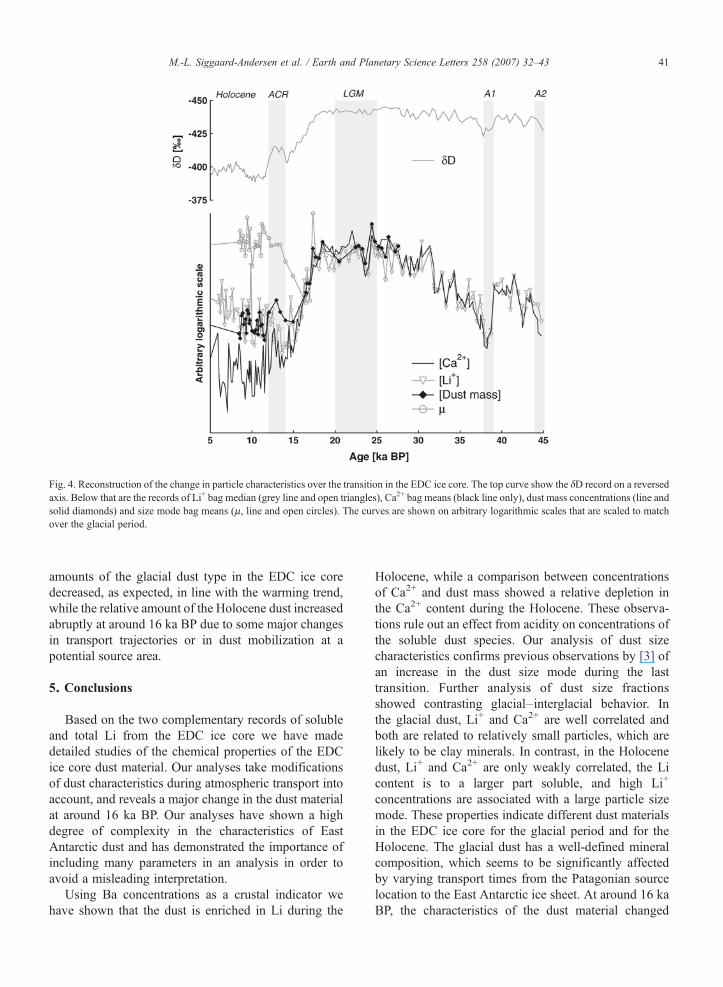
Fig. 4. Reconstruction of the change in particle characteristics over the transition in the EDC ice core. The top curve show the δD record on a reversedaxis. Below that are the records of Li+ bag median (grey line and open triangles), Ca2+ bag means (black line only), dust mass concentrations (line andsolid diamonds) and size mode bag means (μ, line and open circles). The curves are shown on arbitrary logarithmic scales that are scaled to matchover the glacial period.
41M.-L. Siggaard-Andersen et al. / Earth and Planetary Science Letters 258 (2007) 32–43
amounts of the glacial dust type in the EDC ice coredecreased, as expected, in line with the warming trend,while the relative amount of the Holocene dust increasedabruptly at around 16 ka BP due to some major changesin transport trajectories or in dust mobilization at apotential source area.
5. Conclusions
Based on the two complementary records of solubleand total Li from the EDC ice core we have madedetailed studies of the chemical properties of the EDCice core dust material. Our analyses take modificationsof dust characteristics during atmospheric transport intoaccount, and reveals a major change in the dust materialat around 16 ka BP. Our analyses have shown a highdegree of complexity in the characteristics of EastAntarctic dust and has demonstrated the importance ofincluding many parameters in an analysis in order toavoid a misleading interpretation.
Using Ba concentrations as a crustal indicator wehave shown that the dust is enriched in Li during the
Holocene, while a comparison between concentrationsof Ca2+ and dust mass showed a relative depletion inthe Ca2+ content during the Holocene. These observa-tions rule out an effect from acidity on concentrations ofthe soluble dust species. Our analysis of dust sizecharacteristics confirms previous observations by [3] ofan increase in the dust size mode during the lasttransition. Further analysis of dust size fractionsshowed contrasting glacial–interglacial behavior. Inthe glacial dust, Li+ and Ca2+ are well correlated andboth are related to relatively small particles, which arelikely to be clay minerals. In contrast, in the Holocenedust, Li+ and Ca2+ are only weakly correlated, the Licontent is to a larger part soluble, and high Li+
concentrations are associated with a large particle sizemode. These properties indicate different dust materialsin the EDC ice core for the glacial period and for theHolocene. The glacial dust has a well-defined mineralcomposition, which seems to be significantly affectedby varying transport times from the Patagonian sourcelocation to the East Antarctic ice sheet. At around 16 kaBP, the characteristics of the dust material changed
42 M.-L. Siggaard-Andersen et al. / Earth and Planetary Science Letters 258 (2007) 32–43
abruptly probably due to a change in the main sourcelocation.
Based on our analysis of the EDC ice core dust, wepropose here that the glacial dust material partlydisappeared from the air mass above Dome C by theend of the Antarctic Cold Reversal; possibly due to aweakened transport from Patagonia as the climatebecame warmer, while a different dust material wasintroduced to Dome C around 16 ka BP being inaddition to the glacial dust material during the AntarcticCold Reversal. The Holocene dust seems to be mixedbetween different dust types, probably representingdifferent source areas. Future studies on transport of dustto East Antarctica might focus on the changes in themajor dust source, occurring at around 16 ka BP, inorder to understand whether they are related to enhanceddust mobilization in a potential dust source area or to achange in the atmospheric flow pattern for EastAntarctic dust.
Acknowledgement
This work is a contribution to the European Projectfor Ice Coring in Antarctica (EPICA), a joint EuropeanScience Foundation/European Commission scientificprogramme, funded by the EU (EPICA-MIS) and bynational contributions from Belgium, Denmark, France,Germany, Italy, the Netherlands, Norway, Sweden,Switzerland and the United Kingdom. The main logisticsupport was provided by IPEV and PNRA (at Dome C)and AWI (at Dronning Maud Land). This is EPICApublication no. 168. The authors would like to thank Dr.Warren Cairns for useful comments to the manuscriptand Niels Kjr for his assistance in the dust analyses.
Appendix A. Supplementary data
Supplementary data associated with this article canbe found, in the online version, at doi:10.1016/j.epsl.2007.03.013.
References
[1] A.J. Watson, D.C. Bakker, A.J. Ridgwell, P.W. Boyd, C.S. Law,Effect of iron supply on Southern Ocean CO2 uptake andimplications for glacial atmospheric CO2, Nature 407 (6805)(2000) 730–733.
[2] J. Petit, J. Jouzel, D. Raynaud, N. Barkov, J.-M. Barnola,I. Basile, M. Bender, J. Chappellaz, M. Davis, G. Delaygue,M. Delmotte, V. Katlyakov, M. Legrand, V. Lipenkov, C. Lorius,L. Pépin, C. Ritz, E. Saltzman, M. Stievenard, Climate andatmospheric history of the past 420,000 years from the Vostok icecore, Antarctica, Nature 399 (6735) (1999) 429–436.
[3] B. Delmonte, J. Petit, V. Maggi, Glacial to Holocene implicationsof the new 27000-year dust record from the EPICA Dome C(East Antarctica) ice core, Clim. Dyn. 18 (8) (2002) 647–660,doi:10.1007/s00382-001-0193-9.
[4] A. Gaudichel, M. De Angelis, S. Joussaume, J.R. Petit, Y.S.Korotkevitch, V.N. Petrov, Comments on the origin of dust in EastAntarctica for present and ice age conditions, J. Atmos. Chem.14 (1–4) (1992) 129–142.
[5] P. Gabrielli, A. Varga, C. Barbante, C. Boutron, G. Cozzi,V. Gaspari, F. Planchon, W. Cairns, S. Hong, C. Ferrari,G. Capodaglio, Determination of Ir and Pt down to the sub-femtogram per gram level in polar ice by ICP-SFMS usingpreconcentration and a desolvation system, J. Anal. At. Spectrom.19 (7) (2004) 831–837.
[6] F.E. Grousset, P.E. Biscaye, M. Revel, J.-R. Petit, K. Pye,S. Joussaume, J. Jouzel, Antarctic (Dome C) ice-core dust at18 k.y. B.P.: Isotopic constraints on origins, Earth Planet. Sci.Lett. 111 (1) (1992) 175–182.
[7] EPICA community members, Eight glacial cycles from anAntarctic ice core, Nature 429 (6992) 623–628.
[8] I. Basile, F. Grousset, M. Revel, J. Petit, P. Biscaye, N. Barkov,Patagonian origin of glacial dust deposited in east Antarctica(Vostok and dome c) during glacial stages 2, 4 and 6, EarthPlanet. Sci. Lett. 146 (3–4) (1997) 573–589.
[9] B. Delmonte, I. Basile-Doelsch, J.-R. Petit, V. Maggi, M. Revel-Rolland, A. Michard, E. Jagoutz, F. Grousset, Comparing theEPICA and Vostok dust records during the last 220,000 years:stratigraphic correlation and provenance in glacial periods, EarthSci. Rev. 66 (2004) 63–87.
[10] M. Revel-Rolland, P. De Deckker, B. Delmonte, P. Hesse, J.W.Magee, I. Basile-Doelsch, F. Grousset, D. Bosch, EasternAustralia: a possible source of dust in east Antarctica interglacialice, Earth Planet. Sci. Lett. 249 (1–2) (2006) 1–13.
[11] J.-R. Petit, M. Briat, A. Royer, Ice age aerosol content from EastAntarctic ice core samples and past wind strength, Nature 293(5831) (1981) 391–394.
[12] I. Tegen, S. Harrison, K. Kohfeld, I.C. Prentice, M. Coe, M.Heimann, Impact of vegetation and preferential source areas onglobal dust aerosol: results from a model study, J. Geophys. Res.107 (D21) (2002) AAC14.1–AAC14.27, ISSN: 0148–0227.
[13] U. Ruth, D. Wagenbach, J.P. Steffensen, M. Bigler, Continuousrecord of microparticle concentration and size distribution inthe central Greenland NGRIP ice core during the last glacialperiod, J. Geophys. Res. 108 (D3) (2003) 4098, doi:10.1029/2002JD002376.
[14] B. Delmonte, J.R. Petit, K.K. Andersen, I. Basile-Doelsch, V.Maggi, V.Y. Lipenkov, Dust size evidence for opposite regionalatmospheric circulation changes over East Antarctica during thelast climatic transition, Clim. Dyn. 23 (3–4) (2004) 427–438.
[15] P. Gabrielli, J.M.C. Plane, C.F. Boutron, S. Hong, G. Cozzi,P. Crutzen, P. Cescon, C. Ferrari, J.R. Petit, V.Y. Lipenkov,C. Barbante, A climatic control on the accretion of meteoric andsuper-chondritic iridium-platinum to the Antarctic ice cap, EarthPlanet. Sc. Lett.
[16] G. Krinner, C. Genthon, Tropospheric transport of continentaltracers towards Antarctica under varying climatic conditions,Tellus, B 55 (1) (2003) 54–70.
[17] D.J. Lunt, P.J. Valdes, Dust transport to Dome C, Antarctica, atthe last glacial maximum and present day, Geophys. Res. Lett. 28(2001) 295–298.
[18] K. Wedepohl, The composition of the continental crust,Geochim. Cosmochim. Acta 59 (7) (1995) 1217–1232.

43M.-L. Siggaard-Andersen et al. / Earth and Planetary Science Letters 258 (2007) 32–43
[19] P. Gabrielli, F.A.M. Planchon, S. Hong, K.H. Lee, S.D. Hur,C. Barbante, C.P. Ferrari, J.R. Petit, V.Y. Lipenkov, P. Cescon,C.F. Boutron, Trace elements in Vostok Antarctic ice duringthe last four climatic cycles [rapid communication], EarthPlanet. Sci. Lett. 234 (2005) 249–259.
[20] M.-L. Siggaard-Andersen, J.P. Steffensen, H. Fischer, Lithium inGreenland ice cores measured by ion chromatography, Ann.Glaciol. 35 (2002) 243–249.
[21] G. Littot, R. Mulvaney, R. Röthlisberger, R. Udisti, E.W. Wolff,E. Castellano, M. de Angelis, M. Hansson, S. Sommer, J.P.Steffensen, Comparison of analytical methods used for measur-ing major ions in the EPICA Dome C (Antarctica) ice core, Ann.Glaciol. 35 (2002) 299–305.
[22] E. Wolff, H. Fischer, F. Fundel, U. Ruth, B. Twarloh, G. Littot,R. Mulvaney, R. Röthlisberger, M.d. Angelis, C. Boutron, M.Hansson, U. Jonsell, M. Hutterli, F. Lambert, P. Kaufmann,B. Stauffer, T. Stocker, J.P. Steffensen, M. Bigler, M. Siggaard-Andersen, R. Udisti, S. Becagli, E. Castellano, M. Severi,D. Wagenbach, C. Barbante, P. Gabrielli, V. Gaspari, SouthernOcean sea-ice extent, productivity and iron flux over the past eightglacial cycles, Nature 440 (7083) (2006) 491–496.
[23] R. Röthlisberger, R. Mulvaney, E.W. Wolff, M.A. Hutterli,M. Bigler, S. Sommer, J. Jouzel, Dust and sea salt variability incentral East Antarctica (Dome C) over the last 45 kyrs and itsimplications for southern high-latitude climate, Geophys. Res.Lett. 29 (20) (2002) 1963, doi:10.1029/2002GL015186.
[24] P. Gabrielli, C. Barbante, C. Boutron, G. Cozzi, V. Gaspari, F.Planchon, C. Ferrari, C. Turetta, S. Hong, P. Cescon, Variationsin atmospheric trace elements in Dome C (East Antarctica) iceover the last two climatic cycles, Atmos. Environ. 39 (2005)6420–6429.
[25] F.A. Planchon, C.F. Boutron, C. Barbante, E.W. Wolff, G. Cozzi,V. Gaspari, C.P. Ferrari, P. Cescon, Ultrasensitive determinationof heavy metals at the sub-picogram per gram level in ultracleanAntarctic snow samples by inductively coupled plasma sectorfield mass spectrometry, Anal. Chim. Acta 450 (1–2) (2001)193–205.
[26] M. Legrand, P.A. Mayewski, Glaciochemistry of polar ice cores:A review, Rev. Geophys. 35 (1997) 219–243.
[27] H. Holland, The Chemical Evolution of the Atmosphere andOceans, Princeton Univ. Press, Princeton, NJ, 1984.
[28] E. Arnold, J. Merrill, M. Leinen, J. King, The effect of sourcearea and atmospheric transport on mineral aerosol collected overthe North Pacific Ocean, Glob. Planet. Change 18 (3–4) (1998)137–159.
[29] L. Johnson, Particle-size fractionation of eolian dusts duringtransport and sampling, Mar. Geol. 21 (1976) M17–M21.
[30] M. Hansson, Are changes in atmospheric cleansing responsiblefor observed variations of impurity concentrations in ice cores?Ann. Glaciol. 21 (1995) 219–224.
[31] J. Schwander, J. Jouzel, C.U. Hammer, J.-R. Petit, R. Udisti,E. Wolff, A tentative chronology for the EPICA Dome Concordiaice core, Geophys. Res. Lett. 28 (22) (2001) 4243–4246.
[32] A. Correia, R. Freydier, R.J. Delmas, J.C. Simes, J.-D. Taupin,B. Dupr, P. Artaxo, Trace elements in South America aerosolduring 20th century inferred from a Nevado Illimani ice core,Eastern Bolivian Andes (6350 m asl), Atmos. Chem. Phys. 3 (5)(2003) 1337–1352.
[33] M. Legrand, C. Lorius, N. Barkov, V. Petrov, Vostok (Antarctica)ice core: atmospheric chemistry changes over the last climaticcycle (16,000 years), Atmos. Environ. 22 (2) (1988) 317–331.
[34] R. Röthlisberger, R. Mulvaney, E.W. Wolff, M.A. Hutterli, M.Bigler, M.d. Angelis, M.E. Hansson, J.P. Steffensen, R. Udisti,Limited dechlorination of sea-salt aerosols during the last glacialperiod: Evidence from the European Project for Ice Coring inAntarctica (EPICA) Dome C ice core, J. Geophys. Res. 108(D16) (2003) 4526, doi:10.1029/2003JD003604.
[35] V. Gaspari, C. Barbante, G. Cozzi, P. Cescon, C. Boutron,P. Gabrielli, G. Capodaglio, C. Ferrari, J. Petit, B. Delmonte,Atmospheric iron over the last deglaciation: Climatic implica-tions, Geophys. Res. Lett. 33.
[36] B. Stenni, V. Masson-Delmotte, S. Johnsen, J. Jouzel, A.Longinelli, E. Monnin, R. Röthlisberger, E. Selmo, An oceaniccold reversal during the last deglaciation, Science 293 (2001)2074–2077.
[37] F. Parrenin, J.-M. Barnola, J. Beer, T. Blunier, E. Castellano,J. Chappellaz, G. Dreyfus, H. Fischer, S. Fujita, J. Jouzel,K. Kawamura, B. Lemieux, L. Loulergue, V. Masson-Delmotte, B. Narcisi, J.-R. Petit, G. Raisbeck, D. Raynaud,U. Ruth, J. Schwander, M. Severi, R. Spahni, J.P. Steffensen,A. Svensson, R. Udisti, C. Waelbroeck, E. Wolff, The EDC3chronology for the EPICA Dome C ice core, Clim. Past Discuss.