Unmanned Aerial Systems for Monitoring Trace Tropospheric ...
Upload
independentCategory
view
0download
0
Atmos. Chem. Phys., 14, 6813–6834, 2014www.atmos-chem-phys.net/14/6813/2014/doi:10.5194/acp-14-6813-2014© Author(s) 2014. CC Attribution 3.0 License.
Effects of dust aerosols on tropospheric chemistry during a typicalpre-monsoon season dust storm in northern India
R. Kumar 1,2, M. C. Barth 2, S. Madronich2, M. Naja3, G. R. Carmichael4, G. G. Pfister2, C. Knote2, G. P. Brasseur1,5,N. Ojha3, and T. Sarangi3
1Advanced Study Program, National Center for Atmospheric Research, Boulder, CO, USA2Atmospheric Chemistry Division, National Center for Atmospheric Research, Boulder, CO, USA3Aryabhatta Research Institute of Observational Sciences, Nainital, India4Center for Global and Regional Environmental Research, University of Iowa, Iowa City, IA 52242, USA5Climate Service Center, Helmholtz-Zentrum Geesthacht, Hamburg, Germany
Correspondence to:R. Kumar ([email protected])
Received: 25 October 2013 – Published in Atmos. Chem. Phys. Discuss.: 14 January 2014Revised: 23 April 2014 – Accepted: 22 May 2014 – Published: 4 July 2014
Abstract. This study examines the effect of a typicalpre-monsoon season dust storm on tropospheric chemistrythrough a case study in northern India. Dust can alter pho-tolysis rates by scattering and absorbing solar radiation andprovide surface area for heterogeneous reactions. We usethe Weather Research and Forecasting model coupled withChemistry (WRF-Chem) to simulate the dust storm that oc-curred during 17–22 April 2010 and investigate the contri-bution of different processes on mixing ratios of several keytrace gases including ozone, nitrogen oxides, hydrogen ox-ides, methanol, acetic acid and formaldehyde. We revisedthe Fast Troposphere Ultraviolet Visible (F-TUV) photol-ysis scheme to include effects of dust aerosols on photol-ysis rates in a manner consistent with the calculations ofaerosol optical properties for feedback to the meteorologyradiation schemes. In addition, we added 12 heterogeneousreactions on the dust surface, for which 6 reactions haverelative-humidity-dependent reactive uptake coefficients (γ ).The inclusion of these processes in WRF-Chem is foundto reduce the difference between observed and modeled O3from 16± 9 to 2± 8 ppbv and that in NOy from 2129± 1425to 372± 1225 pptv compared to measurements at the high-altitude site Nainital in the central Himalayas, and reduce bi-ases by up to 30 % in tropospheric column NO2 comparedto OMI retrievals. The simulated dust storm acted as a sinkfor all the trace gases examined here and significantly per-turbed their spatial and vertical distributions. The reductionsin these gases are estimated as 5–100 %, and more than 80 %
of this reduction was due to heterogeneous chemistry. TheRH dependence ofγ is also found to have substantial impacton the distribution of trace gases, with changes of up to 20–25 % in O3 and HO2, 50 % in H2O2 and 100 % in HNO3.A set of sensitivity analyses revealed that dust aging couldchange H2O2 and CH3COOH levels by up to 50 % but has arelatively small impact on other gases.
1 Introduction
Dust aerosols have gained considerable attention in the re-cent years not only because they constitute a major fractionof the particulate matter in the troposphere but also becausethey have important implications for air quality, visibility, theearth’s radiation budget (e.g., Haywood and Boucher, 2000;Seinfeld et al., 2004), biogeochemistry (e.g., Jickells et al.,2005), hydrological cycles (e.g., Miller et al., 2004; Zhao etal., 2011), and atmospheric chemistry (e.g., Dentener et al.,1996; Wang et al., 2012). The significance of dust aerosolsfor atmospheric chemistry has been manifested through sev-eral experimental (e.g., Goodman et al., 2000; Underwoodet al., 2001; Li et al., 2006; Preszler Prince et al., 2007;Wagner et al., 2008; Cwiertny et al., 2008; Pradhan et al.,2010; Crowley et al., 2010; Chen et al., 2011; Bedjanian etal., 2013a, b) and modeling studies (e.g., Zhang et al., 1994;Dentener et al., 1996; Zhang and Carmichael, 1999; Tang etal., 2004; Martin et al., 2003; Bauer et al., 2004; Tie et al.,
Published by Copernicus Publications on behalf of the European Geosciences Union.
6814 R. Kumar et al.: Dust aerosols and tropospheric chemistry
2005; Hodzic et al., 2006; Zhu et al., 2010; Wang et al., 2012)during the past 2 decades.
Dust aerosols can influence atmospheric chemistry by af-fecting the photolysis rate coefficients through interactionwith incoming solar radiation and by providing surface areafor heterogeneous chemistry and deposition of different tracegases. It has been suggested that mineral dust aerosols areresponsible for 5–20 % reduction in photolysis rate coeffi-cients of ozone (O3) and nitrogen dioxide (NO2) throughoutthe Northern Hemisphere (e.g., Martin et al., 2003; Tie et al.,2005; Ying et al., 2011). These changes in photolysis ratecoefficients then decrease the annual mean global concentra-tion of hydroxyl radical (OH) by 9 %, which in turn leadsto increases in the concentrations of several volatile organiccompounds (Martin et al., 2003). Heterogeneous reactionson dust surfaces generally reduce the concentration of keyatmospheric trace gases such as O3, nitrogen oxides, sulfuroxides and hydrogen oxides, but the amount of reported re-duction in these gases varies widely, indicating that heteroge-neous chemistry on dust surfaces is still not well understood.For example, the decreases in surface O3 are reported as 5–40 % by different studies (Zhang et al., 1994; Dentener et al.,1996; Zhang and Carmichael, 1999; Tang et al., 2004; Baueret al., 2004; Zhu et al., 2010; Wang et al., 2012). Likewise,the decreases for sulfur dioxide (SO2), nitrogen oxides andhydrogen oxides are reported as 10–50, 16–100 and 11–59 %respectively.
Even though this study is focused on the impact of het-erogeneous processes on dust surfaces on the troposphericchemistry in northern India, it is worth mentioning other im-plications of heterogeneous chemistry here. The heteroge-neous uptake of trace gases can potentially affect the physio-chemical properties of dust aerosols and enhance their abilityto act as cloud condensation nuclei (CCN). Dust particles aregenerally hydrophobic when they are emitted but become hy-groscopic as they travel in the atmosphere and become coatedwith nitrate, sulfate and organics (e.g., Levin et al., 1996;Kelly et al., 2007; Hatch et al., 2008). The coating processwill also modify the distributions of dust as well as sulfateand nitrate aerosols, which in turn will increase the scatter-ing of solar radiation by aerosols. The increase in size of dustparticles due to coating will increase the probability of theirremoval from the atmosphere, and such coated particles willexperience less long-range transport.
Box and regional modeling studies have focused mostlyon heterogeneous chemistry on East Asian and Saharan dustaerosols, whereas there have been no such studies over thenorthern Indian region where dust storms occur frequentlyduring the pre-monsoon (March, April, May; MAM) season(e.g., Prasad and Singh, 2007; Hegde et al., 2007). Globalmodeling studies have suggested that heterogeneous chem-istry on dust aerosols can reduce surface O3 in northern In-dia by 4–10 % (e.g., Dentener et al., 1996; Bauer et al., 2004).However, there has been a considerable improvement in ourunderstanding of heterogeneous chemistry on dust aerosols
since these global modeling studies were conducted. A majoradvancement has been the demonstration of relative humidity(RH) dependence of the reactive uptake coefficient for sev-eral species such as O3 (Cwiertny et al., 2008), HNO3 (Liuet al., 2008), OH (Bedjanian et al., 2013a), HO2 (Bedjanianet al., 2013b), SO2 (Preszler Prince et al., 2007) and H2O2(Pradhan et al., 2010). The renoxification process (Eq. 1),which was ignored in those global modeling studies, is alsoincluded here. In this process, the uptake of gas-phase HNO3by dust particles is followed by release of gas-phase NOx(both NO and NO2) in the presence of broadband radiation(e.g., Chen et al., 2011).
HNO3 (g) + DustNO−
3 (p),hν−→ NOx (g), (1)
where (g) and (p) represent the species in gas and particlephase respectively. Therefore, it is essential to reassess theimportance of dust aerosols for tropospheric chemistry innorthern India by taking into account these recent advance-ments.
In light of the above conditions, this manuscript examinesthe effects of dust aerosols on the distribution of many keytrace gases including O3, nitrogen oxides, hydrogen oxides,methanol, acetic acid and formaldehyde by incorporatingthe updated information on heterogeneous reactive uptake oftrace gases in MOZCART chemical mechanism of WeatherResearch and Forecasting model coupled with Chemistry(WRF-Chem). We also revise the Fast Troposphere Ultra-violet Visible (F-TUV) scheme to include effects of dustaerosols on photolysis rates. This extended configuration ofWRF-Chem is then used to simulate the impact of a typicalpre-monsoon season dust storm on the regional troposphericchemistry in northern India. This dust storm occurred during17–22 April 2010 in northern India. A detailed analysis ofthe evolution of this dust storm, dust emissions and their ef-fect on local to regional-scale aerosol optical properties andradiation budget is presented in a companion paper (Kumaret al., 2014).
We begin by describing the WRF-Chem configurationand implementation of effect of dust aerosols on photolysisrates and heterogeneous chemistry on dust surfaces. We nextbriefly describe the observations used to evaluate the WRF-Chem trace gas results. In the Results section, we show theimportance of dust effects on tropospheric gas chemistry bycomparing the model results with observations. Sensitivitysimulations are used to discuss the contributions of differ-ent processes and evaluate the uncertainties in the represen-tation of heterogeneous chemistry. We conclude that hetero-geneous chemistry mostly, partly dust-modified photolysisrates, improves the agreement between model results and ob-servations, and that these processes lead to a reduction in O3,H2O2, and HNO3.
Atmos. Chem. Phys., 14, 6813–6834, 2014 www.atmos-chem-phys.net/14/6813/2014/

R. Kumar et al.: Dust aerosols and tropospheric chemistry 6815
2 The WRF-Chem model
The Weather Research and Forecasting Model version 3.4.1(Skamarock et al., 2008) coupled with Chemistry (Grell etal., 2005; Fast et al., 2006) is used here to simulate thedistribution of trace species. The simulation domain has120× 90× 51 grid points in (x, y, z) direction with a gridspacing of 30× 30 km2 extending in the vertical up to 10 hPa.The static geographical fields, such as terrain height, vegeta-tion fraction, soil properties and land use, etc., are interpo-lated from 10 min (∼ 19 km) United States Geological Sur-vey (USGS) data to the model domain by using the WRFpreprocessing system (WPS). The initial and lateral bound-ary conditions for the meteorological fields are obtained fromthe National Center for Environmental Predictions (NCEP)Final Analysis (FNL) fields available every 6 h at a spatialresolution of 1◦ × 1◦. The resolved scale cloud physics isrepresented by the Thompson microphysics scheme (Thomp-son et al., 2004), and subgrid-scale effects of convective andshallow clouds are parameterized according to the Kain–Fritsch convective scheme (Kain, 2004). The short- and long-wave radiative processes in the atmosphere are representedby the Rapid Radiative Transfer Model (RRTM) (Mlaweret al., 1997). For surface processes, the model setup usesthe NOAH Land Surface model (Chen and Dudhia, 2001)and MM5 similarity scheme (Beljaars, 1994). The verticalsubgrid-scale fluxes due to eddy transport in the planetaryboundary layer (PBL) and the free troposphere are param-eterized according to the Yonsei University (YSU) bound-ary layer scheme (Hong et al., 2006). Four-dimensional dataassimilation (FDDA) is applied to limit model errors in thesimulated meteorological fields (Lo et al., 2008).
Gas-phase chemistry is represented by the Model forOzone and Related chemical Tracers, version 4 (MOZART-4, Emmons et al., 2010), and aerosol processes by the GO-CART bulk aerosol scheme (Chin et al., 2002; Pfister etal., 2011). The GOCART model simulates five major tro-pospheric aerosol types including sulfate, organic carbon,black carbon, dust and sea salt, assuming externally mixedaerosols. The GOCART model does not have an aerosol ther-modynamics module. The emissions of sea salt (four sizebins) and dust aerosols (five size bins) are calculated onlinewithin the model. The dust emission scheme is based on Gi-noux et al. (2001) and calculates size-resolved dust emissionsonline in five size bins ranging from 0.73 to 8.0 µm (effectiveradius) using the following equation:
Fp =
{CSspu2
10m (u10m− ut) if u10m > ut
0 otherwise, (2a)
whereFp (kg m−2 s−1) represents the emission flux for sizebinp, C is an empirical proportionality constant (kg m−5 s2),S is the source function representing the fraction of alluviumavailable for wind erosion,sp is the fraction of each size classof dust in the emission,u10m (m s−1) is the horizontal wind
speed at 10 m above the surface andut is the threshold ve-locity (m s−1) below which dust emission does not occur andis a function of particle size and density, air density and sur-face moisture. In principle,S should be based on observa-tions of alluvium in the model domain, but such observationsdo not exist. Therefore,S is obtained by comparing eleva-tion of each grid cell with its surrounding hydrological basinspread over an area of 10◦
× 10◦. Thus,S does not providethe exact amount of alluvium present, but it provides infor-mation about the most probable locations of sediments. Themap ofS is then compared with vegetation map derived fromAdvanced Very High Resolution Radiometer (AVHRR) data(DeFries and Townshend, 1994), and only the bare soil sur-faces are considered as possible dust sources. In WRF-Chem,the source function is provided as an input static geographi-cal field through the WRF preprocessing system (WPS). Thethreshold wind velocityut is estimated as
ut =
{A
√(ρp−ρa)g8p
ρa∞ otherwise
(1.2+ 0.2 log10w
), if w < 0.5,
(2b)
whereA = 6.5 is a dimensionless parameter,w is the surfacewetness (0.001–1),8p is the particle diameter,g is the ac-celeration of gravity, andρa andρp are the air and particledensity respectively. More information about estimation ofS
andut can be obtained from Ginoux et al. (2001).The tuning factor C does not have any physical
meaning. Its default value was proposed initially as1× 10−9 kg m−5 s2 (Ginoux et al., 2001), but we have setit to 2.2× 10⁻⁸ kg m−5 s2 as the latter value led to a goodagreement between model and Aerosol Robotic Network(AERONET) measured aerosol optical depth and Angströmexponent at seven sites in the model domain (Kumar et al.,2014). A factor of magnitude difference in the value ofC
results partly from the use of analysis nudging (FDDA) inthis study as nudging leads to lower wind speeds. A sensitiv-ity experiment showed that similar dust emissions could beobtained with aC value of 9× 10⁻⁹ kg m−5 s2 without ap-plying analysis nudging. However, we chose to use analysisnudging as the model configuration with analysis nudging isfound to better reproduce the variations in observed aerosoloptical properties as compared to one without analysis nudg-ing (not shown).
Anthropogenic emissions of CO, NOx, SO2, NH3, OCand BC and non-methane volatile organic compounds(NMVOCs) are taken from the MACCity emission inventory(Granier et al., 2011) and emissions for PM2.5 and PM10 aretaken from the Intercontinental Chemical Transport Experi-ment – Phase B (INTEX-B) inventory (Zhang et al., 2009).Daily varying emissions of trace species from biomass burn-ing are taken from the Fire Inventory from NCAR version1 (FINN v1) (Wiedinmyer et al., 2011) and distributed ver-tically in the model following the online plume-rise module(Freitas et al., 2007). Note that FINN v1 accounts only for
www.atmos-chem-phys.net/14/6813/2014/ Atmos. Chem. Phys., 14, 6813–6834, 2014

6816 R. Kumar et al.: Dust aerosols and tropospheric chemistry
open biomass burning, and the residential biomass burning isincluded in anthropogenic emissions. Biogenic emissions oftrace species from terrestrial ecosystems are calculated on-line using the Model of Emissions of Gases and Aerosolsfrom Nature (MEGAN) version 2.04 (Guenther et al., 2006).The aerosols are allowed to provide feedback to the radiationscheme in the simulations but through direct effects only. Thesimulations start on 10 April 2010 at 00:00 GMT and end on25 April 2010 at 18:00 GMT. The first 3 days of the modeloutput are removed from the analysis to allow the model tospin up.
2.1 Effect of aerosols on photolysis rates in WRF-Chem
In this study, we use the Fast-Troposphere Ultraviolet Visible(F-TUV) scheme to calculate photolysis rates for the MOZ-CART chemical mechanism. The F-TUV scheme is a sim-plified version of the National Center for Atmospheric Re-search’s (NCAR) TUV model (Madronich and Weller, 1990)and is designed to reduce the computational costs associatedwith TUV (Tie et al., 2005). The F-TUV model utilizes thesame physical processes as the TUV model except that thenumber of wavelengths in the TUV spectra (121–750 nm)was reduced from 140 to 17, making it eight times faster thanthe TUV model. The differences in the calculated photolysisrate coefficients between the TUV and F-TUV model are re-ported to be less than 5 % (Tie et al., 2005).
To include the effect of aerosols on photolysis rates, theF-TUV photolysis scheme in WRF-Chem calculates opticalproperties (optical depth, single scattering albedo and asym-metry parameter) for black carbon, organic carbon, sulfateand sea-salt aerosols, and passes them to a two-stream ra-diative transfer module where they interact with radiationto affect photolysis rate coefficients. These optical proper-ties are also calculated in the aerosol optical driver of WRF-Chem and are used for feedback of aerosols on the meteo-rology radiation schemes. Here, we make use of the opticaldriver calculated aerosol optical properties in F-TUV photol-ysis scheme to be consistent between the effects of aerosolson radiation and photolysis rate coefficients. This couplingautomatically accounts for the effect of dust aerosols on pho-tolysis rates in WRF-Chem, which was missing in the orig-inal F-TUV scheme. Further details regarding the couplingof the optical driver to the F-TUV photolysis scheme can befound in the supplementary material.
2.2 Heterogeneous chemistry on dust surface inWRF-Chem
This study also extends the ability of the MOZCART chem-ical mechanism of WRF-Chem to simulate heterogeneouschemistry on the surface of dust particles by including 12heterogeneous reactions listed in Table 1. The uptake of thesegases on dust particles is assumed to be irreversible (Zhangand Carmichael, 1999) and does not add to the aerosol mass
in the model because the GOCART model does not have athermodynamics module. However, recent laboratory exper-iments have shown that the uptake of HNO3 (Chen et al.,2011) is associated with release of gas-phase NOx, and up-take of OH (Bedjanian et al., 2013a) and HO2 (Bedjanianet al., 2013b) are associated with the release of gas-phaseH2O2. The production of these gas-phase species from het-erogeneous chemistry is taken into account in this study. Theproduction of NOx from HNO3 uptake is observed only inthe presence of broadband irradiation with a yield of about50 % (Chen et al., 2011), and thus the reaction of HNO3 isset to yield 0.5 NO2 during daytime in this study. This yieldof 0.5 results from the assumption that all HNO3 moleculesreacting with dust particles adsorb to the surface, but HNO3has been observed to be lost irreversibly when reacting withCaCO3 and adsorb to the surface when reacting with otherminerals (e.g., Al2O3, Fe2O3, and TiO2) (Grassian, 2002).For Indian dust particles, the abundance of CaCO3 is esti-mated to be about 20 % (Peterson, 1968). If we assume thatHNO3 will react with the remaining 80 % of the minerals ad-sorbing to the surface, the yield should be 0.4. However, ourassumption of a yield of 0.5 should not affect the model re-sults significantly here as it is shown later (Sect. 4.3) that therenoxification process leads only to a small change in NOxvalues. The yields for H2O2 from reactions of OH and HO2with dust particles are reported to be 5 % (Bedjanian et al.,2013a) and 10 % (Bedjanian et al., 2013b) respectively andare set accordingly. These numbers differ from previous stud-ies, which have assumed a 100 % conversion of HO2 and 0 %conversion of OH into H2O2 (e.g., Zhu et al., 2010; Wang etal., 2012).
The pseudo-first-order reaction rate coefficient (s−1) forthe loss of a gas-phase speciesg due to heterogeneous uptakeby dust particles is calculated following Heikes and Thomp-son (1983) as
kg =
∑5
i=1
4πriDgV Ni
1+ Kn[χ + 4(1− γ )/3γ ], (3)
wherei = 1, 5 represents five dust size bins used by the GO-CART model,ri andNi represents the effective radius (cm)and number density (particles cm−3) of particles in size bini, V is the ventilation coefficient and taken as unity, andDgrepresents the gas-phase molecular diffusion coefficient ofgas moleculeg (cm2 s−1) and is calculated following Jacob-son (2005) as
Dg =5
16ρaAd2g
√(ma+ mg
mg
)RT ma
2π, (4)
whereρa is atmospheric mass density (g cm−3), A is the Avo-gadro number (6.022× 10²³ molecules mol−1), dg is the col-lision diameter (cm) of gas moleculeg, R is the universal gasconstant (8.31451× 10⁷ g cm2 s−2 mol−1 K−1), T is the ab-solute temperature (K), andma (g mol−1) andmg (g mol−1)
Atmos. Chem. Phys., 14, 6813–6834, 2014 www.atmos-chem-phys.net/14/6813/2014/
R. Kumar et al.: Dust aerosols and tropospheric chemistry 6817
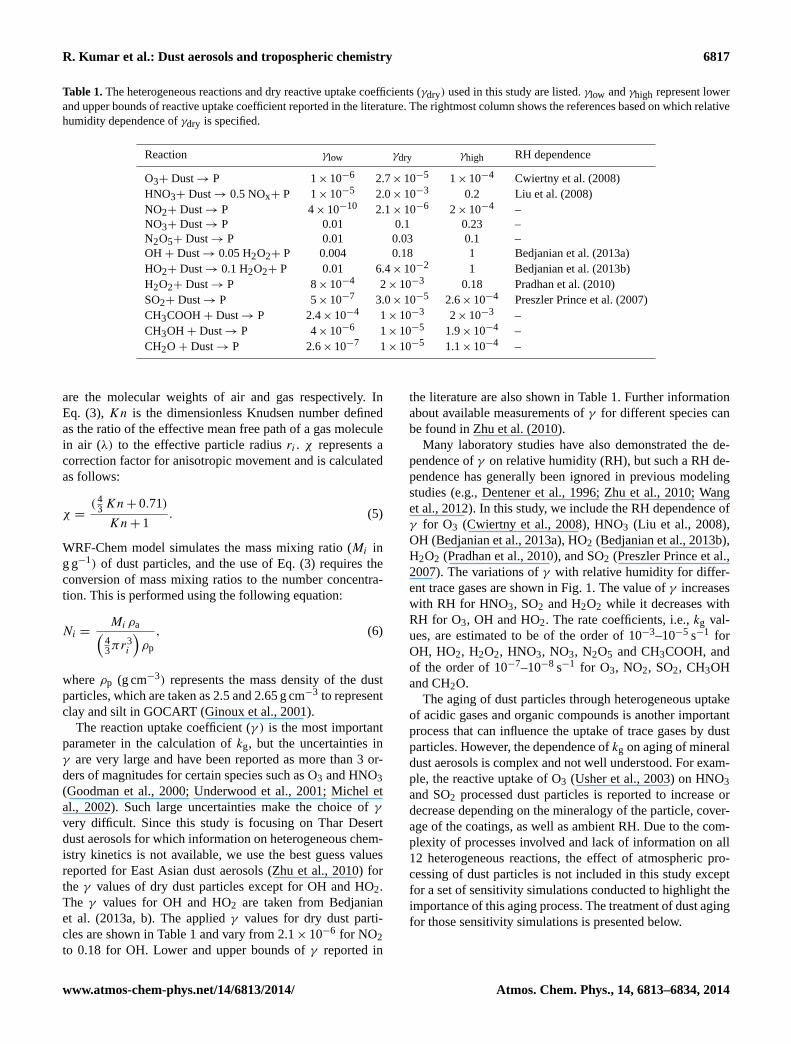
Table 1.The heterogeneous reactions and dry reactive uptake coefficients (γdry) used in this study are listed.γlow andγhigh represent lowerand upper bounds of reactive uptake coefficient reported in the literature. The rightmost column shows the references based on which relativehumidity dependence ofγdry is specified.
Reaction γlow γdry γhigh RH dependence
O3+ Dust→ P 1× 10⁻⁶ 2.7× 10⁻⁵ 1× 10⁻⁴ Cwiertny et al. (2008)HNO3+ Dust→ 0.5 NOx+ P 1× 10⁻⁵ 2.0× 10⁻³ 0.2 Liu et al. (2008)NO2+ Dust→ P 4× 10⁻¹⁰ 2.1× 10⁻⁶ 2× 10⁻⁴ –NO3+ Dust→ P 0.01 0.1 0.23 –N2O5+ Dust→ P 0.01 0.03 0.1 –OH + Dust→ 0.05 H2O2+ P 0.004 0.18 1 Bedjanian et al. (2013a)HO2+ Dust→ 0.1 H2O2+ P 0.01 6.4× 10⁻² 1 Bedjanian et al. (2013b)H2O2+ Dust→ P 8× 10⁻⁴ 2× 10⁻³ 0.18 Pradhan et al. (2010)SO2+ Dust→ P 5× 10⁻⁷ 3.0× 10⁻⁵ 2.6× 10⁻⁴ Preszler Prince et al. (2007)CH3COOH+ Dust→ P 2.4× 10⁻⁴ 1× 10⁻³ 2× 10⁻³ –CH3OH + Dust→ P 4× 10⁻⁶ 1× 10⁻⁵ 1.9× 10⁻⁴ –CH2O + Dust→ P 2.6× 10⁻⁷ 1× 10⁻⁵ 1.1× 10⁻⁴ –
are the molecular weights of air and gas respectively. InEq. (3),Kn is the dimensionless Knudsen number definedas the ratio of the effective mean free path of a gas moleculein air (λ) to the effective particle radiusri . χ represents acorrection factor for anisotropic movement and is calculatedas follows:
χ =(4
3 Kn + 0.71)
Kn + 1. (5)
WRF-Chem model simulates the mass mixing ratio (Mi ing g−1) of dust particles, and the use of Eq. (3) requires theconversion of mass mixing ratios to the number concentra-tion. This is performed using the following equation:
Ni =Mi ρa(
43πr3
i
)ρp
, (6)
whereρp (g cm−3) represents the mass density of the dustparticles, which are taken as 2.5 and 2.65 g cm−3 to representclay and silt in GOCART (Ginoux et al., 2001).
The reaction uptake coefficient (γ ) is the most importantparameter in the calculation ofkg, but the uncertainties inγ are very large and have been reported as more than 3 or-ders of magnitudes for certain species such as O3 and HNO3(Goodman et al., 2000; Underwood et al., 2001; Michel etal., 2002). Such large uncertainties make the choice ofγ
very difficult. Since this study is focusing on Thar Desertdust aerosols for which information on heterogeneous chem-istry kinetics is not available, we use the best guess valuesreported for East Asian dust aerosols (Zhu et al., 2010) forthe γ values of dry dust particles except for OH and HO2.The γ values for OH and HO2 are taken from Bedjanianet al. (2013a, b). The appliedγ values for dry dust parti-cles are shown in Table 1 and vary from 2.1× 10⁻⁶ for NO2to 0.18 for OH. Lower and upper bounds ofγ reported in
the literature are also shown in Table 1. Further informationabout available measurements ofγ for different species canbe found in Zhu et al. (2010).
Many laboratory studies have also demonstrated the de-pendence ofγ on relative humidity (RH), but such a RH de-pendence has generally been ignored in previous modelingstudies (e.g., Dentener et al., 1996; Zhu et al., 2010; Wanget al., 2012). In this study, we include the RH dependence ofγ for O3 (Cwiertny et al., 2008), HNO3 (Liu et al., 2008),OH (Bedjanian et al., 2013a), HO2 (Bedjanian et al., 2013b),H2O2 (Pradhan et al., 2010), and SO2 (Preszler Prince et al.,2007). The variations ofγ with relative humidity for differ-ent trace gases are shown in Fig. 1. The value ofγ increaseswith RH for HNO3, SO2 and H2O2 while it decreases withRH for O3, OH and HO2. The rate coefficients, i.e.,kg val-ues, are estimated to be of the order of 10−3–10−5 s−1 forOH, HO2, H2O2, HNO3, NO3, N2O5 and CH3COOH, andof the order of 10−7–10−8 s−1 for O3, NO2, SO2, CH3OHand CH2O.
The aging of dust particles through heterogeneous uptakeof acidic gases and organic compounds is another importantprocess that can influence the uptake of trace gases by dustparticles. However, the dependence ofkg on aging of mineraldust aerosols is complex and not well understood. For exam-ple, the reactive uptake of O3 (Usher et al., 2003) on HNO3and SO2 processed dust particles is reported to increase ordecrease depending on the mineralogy of the particle, cover-age of the coatings, as well as ambient RH. Due to the com-plexity of processes involved and lack of information on all12 heterogeneous reactions, the effect of atmospheric pro-cessing of dust particles is not included in this study exceptfor a set of sensitivity simulations conducted to highlight theimportance of this aging process. The treatment of dust agingfor those sensitivity simulations is presented below.
www.atmos-chem-phys.net/14/6813/2014/ Atmos. Chem. Phys., 14, 6813–6834, 2014

6818 R. Kumar et al.: Dust aerosols and tropospheric chemistry
Figure 1. The relative humidity dependence of reactive uptake co-efficient (γ ) for O3, HNO3, OH, HO2, H2O2 and SO2 used in thisstudy.
2.3 Atmospheric aging/processing of dust particles
Laboratory experiments have shown that reactive uptake ofO3 decreases by about 70 % on dust particles processed withHNO3 (leading to nitrate coating) while it increases by about33 % on dust particles processed with SO2 as O3 reactswith surface-bound sulfites/bisulfites to form sulfate (Usheret al., 2003). We have made an attempt here to simulate thesechanges in dust reactivity and quantify their impact on sur-face O3. The simulation of these changes requires partition-ing of fresh and aged dust particles and is done using thefollowing procedure: in addition to total dust, two artificialdust tracers called “fresh_dust” and “aged_dust” are intro-duced into the model to keep track of fresh and aged dustparticles. These tracers are included for all five size bins, andthus we have a total of 10 tracers in the model. All these trac-ers undergo the same transport and deposition processes asthe original dust tracers.
The emissions of fresh dust particles are set equal to theemissions of total dust while the emissions of aged dust par-ticles are set to zero. The initial and boundary conditionsfor fresh dust particles are set equal to those for total dustwhile those for aged dust particles are set to zero becausethe MOZART-4 output used for providing initial and bound-ary conditions does not include such a classification. The as-sumption that all dust particles entering into the model do-main are fresh may introduce some uncertainty in the modelresults. However, such an uncertainty is anticipated to have asmall contribution in the case presented here, as two modelruns with and without including the regional dust emissionsshowed that most of the dust loading over the model domaincame from emissions within the model domain during 17–22April 2010.
The number concentration (particles cm−3) of aged (Na,i ,i = 1, 5 represent five size bins) and fresh (Nf,i) dust par-ticles is updated every time step as follows for each gasg
considered: first, the number of molecules of gasg needed tocompletely coat one dust particle of a given size with a mono-layer (nml,g,i) is calculated as the ratio of surface area of thedust particle to the surface area occupied by a gas molecule.Second, the total number of gas molecules ofg that can po-tentially adsorb to dust particles (npot,g,i) is calculated bymultiplying kg (s−1) estimated in Eq. (3) with gas concen-tration (molecules cm−3) and time step (180 s in this case).The rationpot,g,i /nml,g,i then provides the number concentra-tion increment1Na,g,i of dust particles that could have aged(i.e., been completely coated with a monolayer of gas) duringthis time step. The sum of the increments1Na,g,i due to allgases considered in coating gives the total increment in agedparticles1Na,i . 1Na,i is then subtracted from the numberconcentration of fresh dust particlesNf,i and added accord-ingly to the number concentration of aged particlesNa,i .
The reactions of HNO3, NO2, NO3 and N2O5 with dustparticles are assumed to coat dust particles with nitrate andthat of SO2 is assumed to coat them with sulfate. All gasesare given equal probability to react with dust particles, and incase the number concentration of fresh dust particles is lim-iting, then1Na,i >Nf,i , which would lead to negative num-ber concentrations ofNf,i . To overcome this problem,Na,iandNf,i are set toNf,i and zero respectively. This approachleads to mass conservation of tracers, and the sum of freshand aged dust particle concentrations is always equal to thetotal dust number concentration. Both fresh and coated dustparticles then react separately with trace gases.
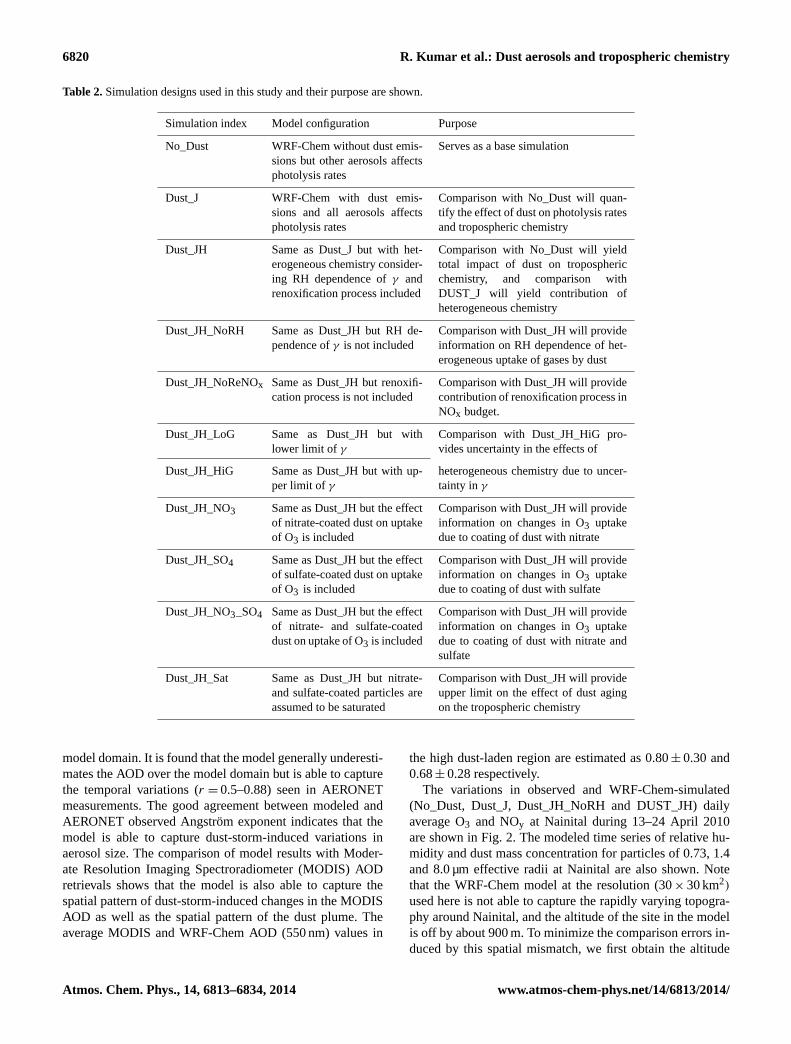
2.4 Simulations conducted
Eleven simulations were conducted (Table 2) to examine theimpact of the dust storm on tropospheric chemistry. No_Dustserves as a base simulation in which heterogeneous chem-istry on dust surfaces and the effect of dust on photolysisrates are not included. Dust_J simulation includes the effectof dust aerosols on photolysis rates, while Dust_JH simula-tion is same as Dust_J but with addition of heterogeneouschemistry on dust surface taking into account the RH depen-dence ofγ and renoxification process. Dust_JH_NoRH sim-ulation is same as Dust_JH except that it does not include theRH dependence ofγ . In Dust_JH_NoReNOx, the release ofgas-phase NO2 associated with uptake of HNO3 is excludedin order to assess the importance of the renoxification pro-cess. Dust_JH_LoG and Dust_JH_HiG simulations are con-ducted with lower and upper bounds ofγ reported in theliterature in order to provide an estimate of the uncertaintyin heterogeneous chemistry induced changes in troposphericchemistry due to the uncertainty inγ . Dust_JH_NO3 andDust_JH_SO4 simulations are designed to examine the influ-ences of dust coated with nitrate and sulfate separately on theuptake of O3. In these simulations, the uptake coefficientγ
for aged dust particles is reduced by 70 % in Dust_JH_NO3and is increased by 33 % in Dust_JH_SO4 (Usher et al.,2003). Dust particles are coated with both sulfate and nitrate
Atmos. Chem. Phys., 14, 6813–6834, 2014 www.atmos-chem-phys.net/14/6813/2014/

R. Kumar et al.: Dust aerosols and tropospheric chemistry 6819
in Dust_JH_NO3_SO4 to examine the combined effect of ni-trate and sulfate coating on O3 uptake. In this simulation,three reactions of O3 are included: with fresh dust particles,dust particles coated with nitrate and dust particles coatedwith sulfate. The originalγ value is used for reaction withfresh dust particles, while the originalγ value is reduced by70 % for reaction with dust particles coated with nitrate andis increased by 33 % for reaction with dust particles coatedwith sulfate. Dust_JH_Sat is a hypothetical simulation wherewe assume that the presence of a nitrate or sulfate monolayeron the dust particle would saturate the dust particles and de-activate them for further catalytic uptake of O3, OH, HO2,H2O2, CH3COOH, CH3OH and HCHO, but the coating isassumed to have no effect on the uptake of HNO3, NO2,NO3, N2O5 and SO2. This comparison of Dust_JH_Sat withDust_JH and Dust_J would provide bounds of the heteroge-neous chemistry induced changes in tropospheric chemistry.
3 Observation data sets
3.1 Surface observations
This study uses surface O3 and NOy (sum of nitrogen ox-ides) observations made at the high-altitude site Nainital(79.45◦ E, 29.36◦ N, 1958 m a.m.s.l.) located in the centralHimalayas. The observation site is bounded by high- alti-tude (2–5 km) mountains in the north and east directions andopens to the Indo-Gangetic Plain region in the south andwest directions. There are no major anthropogenic sourcesnear Nainital, and thus the observations at this site are en-visaged to be representative of northern India (Kumar et al.,2010). Further details regarding the orography, vegetationcover, meteorological and chemical characteristics of Naini-tal can be found elsewhere (e.g., Sagar et al., 2004; Pant etal., 2006; Kumar et al., 2010; Sarangi et al., 2014). Ozonemeasurements are made using a standard ultraviolet absorp-tion based instrument, and NOy measurements are made witha chemiluminescence-based instrument. More details aboutthe measurement setup, operating principle, accuracy, detec-tion limits and calibration procedure are discussed elsewhere(e.g., Kumar et al., 2010; Sarangi et al., 2014). The modelresults are also compared with Aerosol Robotic Network(AERONET) measurements at seven sites in the model do-main. Further details of AERONET and these observationssites can be found in Kumar et al. (2014).
3.2 Ozone Monitoring Instrument (OMI)
The Ozone Monitoring Instrument (OMI), aboard NASA’sEarth Observing System (EOS) Aura satellite, measures theradiation backscattered by the earth’s atmosphere and sur-face over the 0.27–0.5 µm wavelength range with a spatialresolution of about 13 km× 24 km at nadir in normal oper-ational mode. These measured radiances are used for dailyglobal retrievals of several trace species, such as O3, NO2,
BrO, SO2, CH2O and aerosols. However, we do not useOMI O3 and SO2 retrievals because of their low sensitivityin the lower troposphere, which is the region of interest inthis study. We find that OMI SO2 retrievals are very noisy asaverage OMI-retrieved SO2 planetary boundary layer (PBL)column amount values (0.5–1.0 DU) are smaller than the re-ported standard deviation of the noise (1.5 DU). Here, we useLevel-2 tropospheric column NO2 data sets made availableby KNMI (Royal Netherlands Meteorological Institute) asthey provide access to the averaging kernel and a priori pro-files, which are needed to make a proper comparison betweenmodel profiles and satellite retrievals (e.g., Emmons et al.,2004). More details on the algorithm used to retrieve the tro-pospheric column NO2 abundances at KNMI are describedby Bucsela et al. (2006). These OMI NO2 retrievals werefound to correlate well with aircraft measurements madeduring the INTEX-B campaign (Boersma et al., 2008) andMAX-DOAS ground-based measurements (Kramer et al.,2008) but are also suggested to be biased positively by about0–30 %, irrespective of season (e.g., Boersma et al., 2009a;Zhou et al., 2009).
To compare WRF-Chem results with OMI, the best qualityOMI retrievals are used by reducing influence of clouds onOMI retrievals through selection of pixels with cloud fractionless than 0.3 and removing unreliable retrievals associatedwith a tropospheric column flag of greater than 0 (Boersmaet al., 2009b). The nighttime pixels from OMI are also ex-cluded for the comparison. These best quality retrievals areco-located in space and time with model output. The co-located WRF-Chem profiles are then transformed using theaveraging kernel and a priori profiles used in the satellite re-trievals to obtain a model profile that OMI would measurefor the modeled state of the atmosphere in the absence ofother errors. More details about the method of model–OMIdata co-location and convolution of model profiles with av-eraging kernel and a priori files can be found in Kumar etal. (2012).
4 Results and discussion
4.1 Model evaluation
Dust storms in northern India are characterized by largeincrease in aerosol optical depth (AOD) (> 50 %) and de-crease inα (> 70 %) (Dey et al., 2004; Prasad and Singh,2007). Both of these features were observed during this duststorm indicating that this was a typical pre-monsoon sea-son dust storm (see Kumar et al., 2014) and can be con-sidered as representative of dust storms in northern India.Kumar et al. (2014) also present a detailed evaluation ofsimulated aerosol optical properties, and here we present asummary. The simulated AOD, Angström exponent and sin-gle scattering albedo are compared against Aerosol RoboticNetwork (AERONET) measurements at seven sites in the
www.atmos-chem-phys.net/14/6813/2014/ Atmos. Chem. Phys., 14, 6813–6834, 2014
6820 R. Kumar et al.: Dust aerosols and tropospheric chemistry
Table 2.Simulation designs used in this study and their purpose are shown.
Simulation index Model configuration Purpose
No_Dust WRF-Chem without dust emis-sions but other aerosols affectsphotolysis rates
Serves as a base simulation
Dust_J WRF-Chem with dust emis-sions and all aerosols affectsphotolysis rates
Comparison with No_Dust will quan-tify the effect of dust on photolysis ratesand tropospheric chemistry
Dust_JH Same as Dust_J but with het-erogeneous chemistry consider-ing RH dependence ofγ andrenoxification process included
Comparison with No_Dust will yieldtotal impact of dust on troposphericchemistry, and comparison withDUST_J will yield contribution ofheterogeneous chemistry
Dust_JH_NoRH Same as Dust_JH but RH de-pendence ofγ is not included
Comparison with Dust_JH will provideinformation on RH dependence of het-erogeneous uptake of gases by dust
Dust_JH_NoReNOx Same as Dust_JH but renoxifi-cation process is not included
Comparison with Dust_JH will providecontribution of renoxification process inNOx budget.
Dust_JH_LoG Same as Dust_JH but withlower limit of γ
Comparison with Dust_JH_HiG pro-vides uncertainty in the effects of
Dust_JH_HiG Same as Dust_JH but with up-per limit of γ
heterogeneous chemistry due to uncer-tainty inγ
Dust_JH_NO3 Same as Dust_JH but the effectof nitrate-coated dust on uptakeof O3 is included
Comparison with Dust_JH will provideinformation on changes in O3 uptakedue to coating of dust with nitrate
Dust_JH_SO4 Same as Dust_JH but the effectof sulfate-coated dust on uptakeof O3 is included
Comparison with Dust_JH will provideinformation on changes in O3 uptakedue to coating of dust with sulfate
Dust_JH_NO3_SO4 Same as Dust_JH but the effectof nitrate- and sulfate-coateddust on uptake of O3 is included
Comparison with Dust_JH will provideinformation on changes in O3 uptakedue to coating of dust with nitrate andsulfate
Dust_JH_Sat Same as Dust_JH but nitrate-and sulfate-coated particles areassumed to be saturated
Comparison with Dust_JH will provideupper limit on the effect of dust agingon the tropospheric chemistry
model domain. It is found that the model generally underesti-mates the AOD over the model domain but is able to capturethe temporal variations (r = 0.5–0.88) seen in AERONETmeasurements. The good agreement between modeled andAERONET observed Angström exponent indicates that themodel is able to capture dust-storm-induced variations inaerosol size. The comparison of model results with Moder-ate Resolution Imaging Spectroradiometer (MODIS) AODretrievals shows that the model is also able to capture thespatial pattern of dust-storm-induced changes in the MODISAOD as well as the spatial pattern of the dust plume. Theaverage MODIS and WRF-Chem AOD (550 nm) values in
the high dust-laden region are estimated as 0.80± 0.30 and0.68± 0.28 respectively.
The variations in observed and WRF-Chem-simulated(No_Dust, Dust_J, Dust_JH_NoRH and DUST_JH) dailyaverage O3 and NOy at Nainital during 13–24 April 2010are shown in Fig. 2. The modeled time series of relative hu-midity and dust mass concentration for particles of 0.73, 1.4and 8.0 µm effective radii at Nainital are also shown. Notethat the WRF-Chem model at the resolution (30× 30 km2)
used here is not able to capture the rapidly varying topogra-phy around Nainital, and the altitude of the site in the modelis off by about 900 m. To minimize the comparison errors in-duced by this spatial mismatch, we first obtain the altitude
Atmos. Chem. Phys., 14, 6813–6834, 2014 www.atmos-chem-phys.net/14/6813/2014/

R. Kumar et al.: Dust aerosols and tropospheric chemistry 6821
Figure 2. Variations in observed and WRF-Chem-simulated(No_Dust, Dust_JH_NoRH, Dust_J and Dust_JH) daily average O3(top panel) and NOy (middle panel) at Nainital during 13–24 April2010. WRF-Chem-simulated daily average mass concentration ofdust particles of 0.73, 1.4 and 8.0 µm effective radii and relative hu-midity at Nainital are also shown. The vertical bars represent stan-dard deviation in the average values.
profile of model results at Nainital by bi-linearly interpolat-ing model output at each model level to the location of Naini-tal (79.45◦ E, 29.36◦ N) and then linearly interpolate the re-sulting altitude profile to the height of Nainital (1958 m).Dust mass concentrations started increasing at Nainital on17 April 2010, reached a maximum during 20–22 April anddecreased thereafter. The mass concentrations of 8.0 µm par-ticles remain close to zero even during the dust storm becausethese particles do not travel far from the source regions due totheir higher deposition velocities resulting in dry deposition.
The observed O3 mixing ratios show a decrease duringthe dust storm period (17–22 April 2010), while observedNOy mixing ratios show an increase during 17–18 April2010 and a decrease thereafter. Analysis of back-air trajec-tories arriving at Nainital (not shown) showed that the in-crease in NOy levels at Nainital during 17–18 April wasassociated with passage of low-altitude air masses over theIndo-Gangetic Plain region before arriving at Nainital, while
air masses on previous days (15–16 April) passed over rel-atively cleaner regions to the north and west at higher alti-tudes. The WRF-Chem model without incorporating the ef-fects of dust aerosols (No_Dust) does not capture the ob-served decrease in O3 and NOy levels at Nainital. Includ-ing effects of dust on photolysis rates (Dust_J) induces aslight decrease (about 2 ppbv) in modeled O3 levels, butmodeled values are still significantly higher than the obser-vations. The introduction of heterogeneous chemistry with-out including RH dependence ofγ (Dust_JH_NoRH) in themodel leads to the observed decreases in O3 and NOy, butcompared to measurements we find too strong of decreasesin O3 levels and slightly higher NOy levels than the ob-servations at Nainital during the peak of dust storm, i.e.,20–22 April 2010. The inclusion of heterogeneous chem-istry with RH dependence ofγ (Dust_JH) leads to the bestagreement between WRF-Chem-simulated and observed O3and NOy values at Nainital. The WRF-Chem-simulated av-erage O3 values at Nainital in Dust_JH and No_Dust con-figurations during 17–22 April 2010 are estimated to be58± 5 ppbv and 73± 6 ppbv respectively as compared to theaverage observed value of 56± 10 ppbv. The correspondingWRF-Chem NOy average values at Nainital are estimated as1189± 751 pptv and 2945± 876 pptv, respectively, as com-pared to the average observed value of 843± 887 pptv. Thus,including the effects of dust aerosols in WRF-Chem reducesthe difference between average modeled and observed O3from 16± 9 to 2± 8 ppbv and that in NOy from 2102± 1425to 346± 1225 pptv respectively.
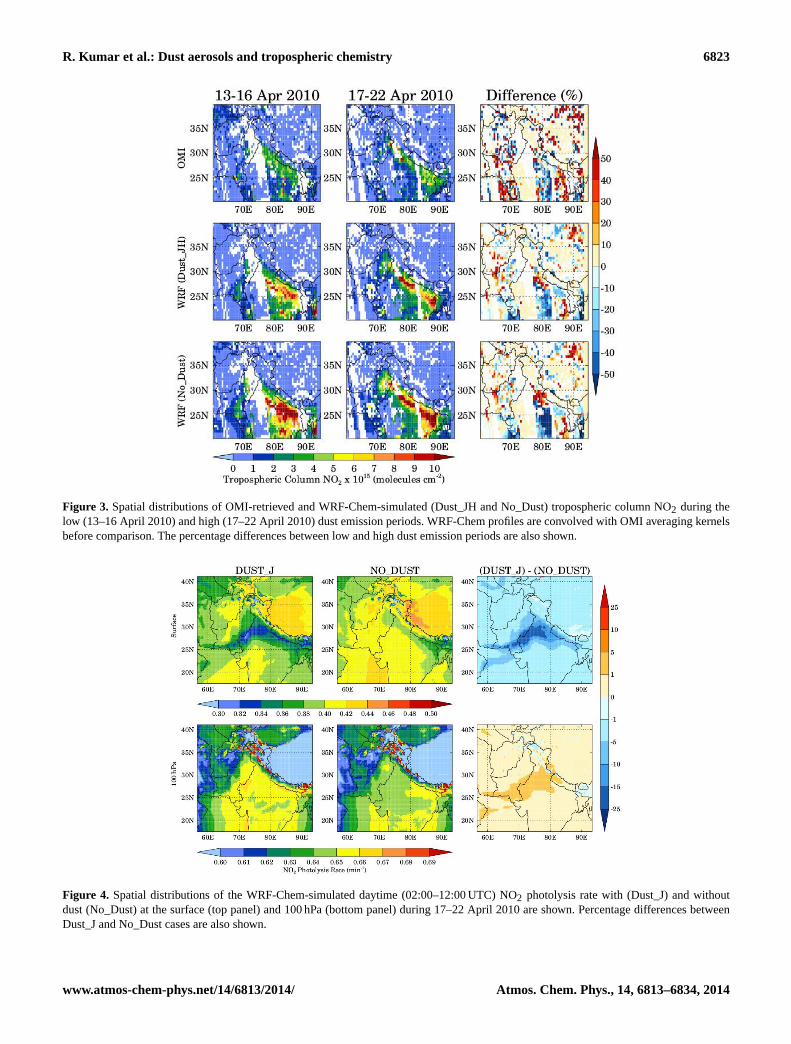
The spatial distributions of average OMI-retrieved andWRF-Chem-simulated (Dust_JH and No_Dust) troposphericcolumn NO2 during 13–16 April 2010 and 17–22 April2010 are shown in Fig. 3. The percentage differences intropospheric column NO2 between high and low dust emis-sion periods are also shown for both OMI and WRF-Chem.Both the model and satellite data show similar spatialdistributions with the highest values along the Indo-GangeticPlain region during both low and high dust emission periods,but WRF-Chem generally overestimates the OMI retrievalswhich is consistent with previous studies over the Indianregion (Kumar et al., 2012; Ghude et al., 2013). However, thecomparison between Dust_JH and No_Dust configurationsof WRF-Chem shows that the inclusion of effects of dustaerosols improves the model performance and reduces themodel bias with respect to OMI retrievals by up to 30 %especially in the Indo-Gangetic Plain region. The remainingbias in the model could be due to uncertainties in NOx emis-sion estimates in this region. The percentage difference plotsshow that the WRF-Chem model is able to capture severalfeatures of changes in OMI-retrieved spatial distributionof tropospheric column NO2 between high and low dustemission periods. The domain-averaged OMI and WRF-Chem (Dust_JH) tropospheric column NO2 values over thegeographical region (70–80◦ E, 25–30◦ E) of maximum duststorm impact during low dust emission period are estimated
www.atmos-chem-phys.net/14/6813/2014/ Atmos. Chem. Phys., 14, 6813–6834, 2014

6822 R. Kumar et al.: Dust aerosols and tropospheric chemistry
as (2.35± 1.43)× 1015 and (3.95± 2.43)× 1015 moleculescm−2 respectively, and during high dust emissionperiod are estimated as (2.01± 1.37)× 1015 and(3.41± 2.80)× 1015 molecules cm−2 respectively. Thereduction in tropospheric column NO2 during high dustemission period in both OMI and WRF-Chem indicates thatthe dust storm acted as a sink for NO2.
4.2 Impact of dust storm on photolysis rate coefficients
The impact of the dust storm on photolysis rates is exam-ined by comparing the daytime (07:30–17:30 IST or 02:00–12:00 UTC) NO2 photolysis rate coefficients calculated bythe WRF-Chem model with Dust_J and No_Dust configu-rations (Fig. 4). NO2 photolysis rates at the surface show astrong relationship with aerosol loading and are lowest overthe Indo-Gangetic Plain region, which is where the anthro-pogenic emissions are stronger than those over other partsof the model domain. The inclusion of dust aerosols en-hances the spatial heterogeneity of NO2 photolysis rate anddecreases it by 5–25 % over the Thar Desert and westernIndo-Gangetic Plain region. The photolysis rate coefficientsof other trace gases such as O3, HNO3, H2O2, CH2O andN2O5 at the surface exhibit similar features (not shown) withdecreases of the same order of magnitude. The magnitudeof change in photolysis rates decreases with altitude andchanges sign from negative to positive near 4 km because ofthe increase in actinic flux due to scattering of incoming so-lar radiation by dust aerosol layers underneath. The spatialstructure of changes in photolysis rates at 100 hPa is similarto that at the surface with the largest increases (1–5 %) overthe Thar Desert and western Indo-Gangetic Plain region.
4.3 Impact of dust storm on trace gases at the surface
To determine the impact of the dust storm on surface com-position, average surface mixing ratios of O3, SO2, NOx,HNO3 and H2O2 in the DUST_JH, which is the simulationthat compared best with observations at Nainital, and theNo_Dust simulation are compared for the dust event timeperiod of 17–22 April 2010 (Fig. 5). Surface O3 shows asimilar spatial distribution in both runs with the lowest val-ues over the Arabian Sea and the highest values over theeastern Indo-Gangetic Plain region. However, the dust stormclearly leads to a reduction in O3 mixing ratios by 3–14 ppbv(5–25 %) over the Thar Desert and western Indo-GangeticPlain region. The spatial distribution of reductions in O3 mix-ing ratios is consistent with the distribution of dust over themodel domain, and the amount of reduction is comparableto those reported by previous studies in dust source regions(e.g., Dentener et al., 1996; Tang et al., 2004; Pozzoli et al.,2008; Wang et al., 2012).
Sulfur dioxide and NOx mixing ratios are highest alongthe Indo-Gangetic Plain region due to higher emissions inthis region (Fig. 5). Changes in SO2 mixing ratios show a
mixed response to heterogeneous chemistry with a decreaseof 0.1–0.2 ppbv (8–10 %) over the Thar Desert region andan increase of 0.2–0.5 ppbv (2–6 %) over the eastern Indo-Gangetic Plain region. This is because the heterogeneouschemistry reduces SO2 through reaction with dust particleswhile increases it through reduction of OH mixing ratios(SO2+ OH→ sulfate). The sign of the changes in SO2 isthus determined by competition between these two reactions.In general, NOx mixing ratios show a reduction of up to0.5 ppbv (< 10 %) along the Indo-Gangetic Plain region and0.2–0.3 ppbv (10–20 %) over the Thar Desert due to uptakeof NO2 by dust particles. The changes in NO2 are also de-termined by the competition between the reactions of NO2with dust and OH where the former tends to decrease NO2while the latter tends to increase NO2 due to reduced OH.The reduction in NOx is in contrast with the results of Wanget al. (2012), who reported an increase in NOx in the dustsource region and attributed the increase to the renoxifica-tion process. Our study differs because Wang et al. (2012)assumed that renoxification process is active all the time,whereas this process is active only during daytime in our sim-ulations. To quantify the contribution of renoxification pro-cess in the NOx budget, we compared the NOx distributionssimulated by Dust_JH and Dust_JH_NoReNOx configura-tions. The comparison (not shown) showed that the renox-ification process does increase NOx mixing ratios, but themagnitude of this increase (0.1–0.2 ppbv) is likely less thanthe reduction due to heterogeneous chemistry.
The spatial distributions of HNO3 and H2O2 (Fig. 5) arelargely modified by the dust storm with reduction of up to2 ppbv (∼ 99 %), because these species are highly reactivewith dust particles (Table 1). The large reduction in H2O2mixing ratio estimated here is also in contrast with the resultsof Wang et al. (2012), who estimated an increase in H2O2.Wang et al. (2012) assumed a 100 % yield for the conversionof HO2 into H2O2 through heterogeneous uptake, while weassume a yield of 10 % following recent work by Bedjanianet al. (2013b). Mixing ratios of NO3, N2O5 and CH3COOHalso show large reductions by Dust_JH with the highest de-crease reaching up to 0.1 ppbv (∼ 98 %), 0.46 ppbv (∼ 99 %)and 0.45 ppbv (∼ 96 %) respectively. The uptake of HO2 bydust particles leads to a maximum reduction of about 3.5 pptv(∼ 40 %) over the Thar Desert region, which is much lessthan those reported previously (e.g., Bian and Zender, 2003;Wang et al., 2012) and is attributed to a lowerγ value used inour study (< 0.064 vs. 0.1). The maximum reduction in OH,CH2O and CH3OH is estimated to be about 40, 21 and 5 %,respectively.
The above discussion includes both the role of heteroge-neous chemistry in changing the distribution of trace gasesand dust-modified photolysis rate coefficients. The individ-ual contributions of heterogeneous chemistry and perturba-tion in photolysis rate coefficients to the total difference indistributions of trace gases at the surface are estimated bycomparing differences between simulations (Fig. 6). More
Atmos. Chem. Phys., 14, 6813–6834, 2014 www.atmos-chem-phys.net/14/6813/2014/
R. Kumar et al.: Dust aerosols and tropospheric chemistry 6823
Figure 3. Spatial distributions of OMI-retrieved and WRF-Chem-simulated (Dust_JH and No_Dust) tropospheric column NO2 during thelow (13–16 April 2010) and high (17–22 April 2010) dust emission periods. WRF-Chem profiles are convolved with OMI averaging kernelsbefore comparison. The percentage differences between low and high dust emission periods are also shown.
Figure 4. Spatial distributions of the WRF-Chem-simulated daytime (02:00–12:00 UTC) NO2 photolysis rate with (Dust_J) and withoutdust (No_Dust) at the surface (top panel) and 100 hPa (bottom panel) during 17–22 April 2010 are shown. Percentage differences betweenDust_J and No_Dust cases are also shown.
www.atmos-chem-phys.net/14/6813/2014/ Atmos. Chem. Phys., 14, 6813–6834, 2014

6824 R. Kumar et al.: Dust aerosols and tropospheric chemistry
Figure 5. Spatial distributions of average surface O3, SO2, NOx, HNO3 and H2O2 mixing ratios simulated by WRF-Chem with Dust_JHand No_Dust configuration during 17–22 April 2010. The absolute difference between the two configurations is also shown. All values arein ppbv.
than 80 % of the changes in distribution of these trace gasesare explained by the heterogeneous chemistry. The changesin surface O3 induced by dust-modified photolysis rate coef-ficients are within±1–3 ppbv and are driven by the complexresponse of O3 to decreases in photolysis rate coefficients.A decrease in the photolysis rate coefficients leads to slower
photochemical processing in general and thus decreased O3production.
Mixing ratios of surface SO2 and NOx show an increaseof up to 0.1 ppbv due to reduction in photolysis rate coef-ficients. The increase in NOx and SO2 is associated witha decrease in OH mixing ratios as reaction with OH is themain loss process for both NOx and SO2. The decrease in O3
Atmos. Chem. Phys., 14, 6813–6834, 2014 www.atmos-chem-phys.net/14/6813/2014/

R. Kumar et al.: Dust aerosols and tropospheric chemistry 6825
Figure 6.Spatial distributions of absolute difference in average O3, SO2, NOx, HNO3 and H2O2 between Dust_JH and No_Dust (left panel),Dust_J and No_Dust representing the contribution of photolysis to total difference (middle panel), and Dust_JH and Dust_J representing thecontribution of heterogeneous chemistry to total differences (right panel). All values are in ppbv and for the surface layer of the model.
photolysis rate coefficient leads to a decrease of up to 30 %in OH (O3+ hν → O1D + O2, producing OH through reac-tion of O1D with water vapor) mixing ratios. Mixing ratiosof surface HNO3 and H2O2 also show a small decrease ofup to 0.4 and 0.6 ppbv in the Dust_J configuration relative tothe No_Dust configuration. HNO3 is produced mainly by thereaction of OH with NO2, but the rate of change of HNO3 isdominated by changes in OH as the reduction in OH (up to30 %) is larger than that in NO2 (up to 5 %). The reduction
in H2O2 is also associated with reduction in OH and HO2mixing ratios. Since OH is the major oxidizing agent in thetroposphere, a decrease in OH also leads to a decrease in theoxidizing capacity of the atmosphere and a consequent in-crease of up to 5–10 % in several trace gases such as CO,alkanes and alkenes at the surface.
www.atmos-chem-phys.net/14/6813/2014/ Atmos. Chem. Phys., 14, 6813–6834, 2014

6826 R. Kumar et al.: Dust aerosols and tropospheric chemistry
Figure 7. Vertical profiles of percentage total difference (red lines) in average O3, NOx, HNO3, OH and BIGALK between Dust_JH andNo_Dust configuration over the geographical region (70–80◦ E, 25–30◦ N) of maximum dust influence. The contributions of heterogeneouschemistry (green lines) and photolysis (blue lines) to the total percentage difference are also shown. The vertical profiles of dust mass mixingratios for particles of 1.4 µm effective radius and relative humidity are also shown to help interpretation.
4.4 Impact of dust storm on vertical distribution oftrace gases
In addition to changes in surface mixing ratios, vertical distri-butions of trace gases are modified by the dust storm via het-erogeneous chemistry and dust-modified photolysis rates. Byaveraging over the region of maximum dust influence (70–80◦ E, 25–30◦ N) for each simulation, the percentage differ-ences between Dust_JH and No_Dust giving the total differ-ence, Dust_J and No_Dust giving the contribution of modi-fied photolysis rates, and Dust_JH and Dust_J giving the con-tribution from heterogeneous chemistry are found. Profiles ofO3, NOx, HNO3, OH and BIGALK are shown in Fig. 7. BI-GALK represents alkanes with four or more carbon atomsin the MOZCART chemical mechanism and is shown to il-lustrate the dust-storm-induced changes in volatile organiccompounds.
The changes in all the trace gases due to heterogeneouschemistry are much larger than those due to perturbations inphotolysis rate coefficients, and are significant below 8 km,which is consistent with the vertical distribution of dust par-ticles (Fig. 7). All gases except BIGALK show a net reduc-tion because of the larger changes induced by the heteroge-neous chemistry. The reduction in OH due to decrease in O3photolysis rate coefficient leads to a small increase of 1–4 %
in NOx. The reaction with OH is the only loss process forBIGALK, and therefore BIGALK shows an increase due toboth heterogeneous chemistry and perturbation in photolysisrates as both of these processes lead to a decrease in OH.The highest net decreases in O3, NOx, HNO3 and OH are es-timated as∼ 16, ∼ 26, ∼ 91 and∼ 30 % respectively whilethe highest net increase in BIGALK is estimated as∼ 26 %.The vertical distributions of changes in NO3, N2O5, H2O2and CH3COOH are similar to those in HNO3, and the high-est net reduction reaches 80–90 %.
4.5 Importance of RH dependence of reactive uptakecoefficients (γ )
The uptake of trace gases by dust aerosols also dependsupon the relative humidity as reactive uptake coefficientshave a large variation with RH. The effect of relative humid-ity on the rate constantskO3 andkHNO3 at the surface overthe model domain during 17–22 April 2010 is illustrated inFig. 8, where model runs with and without RH dependenceof γ are compared. The spatial distributions of average massconcentration for dust particles of 1.4 µm effective radius andrelative humidity are also shown to help the interpretation.RH is less than 20 % over most of the Indian region and is70–90 % over the oceanic regions. As expected, the spatialdistributions of bothkO3 andkHNO3 in both configurations are
Atmos. Chem. Phys., 14, 6813–6834, 2014 www.atmos-chem-phys.net/14/6813/2014/

R. Kumar et al.: Dust aerosols and tropospheric chemistry 6827
Figure 8. Spatial distributions of average mass concentration fordust particles of 1.4 µm effective radius, relative humidity andpseudo-first-order rate coefficients for heterogeneous uptake ofO3 (kO3) and HNO3 (kHNO3) by dust particles in Dust_JH andDust_JH_NoRH configurations during 17–22 April 2010.
nearly identical to the distribution of dust mass concentra-tions with the highest values in the dust source regions. Therate constant decreases for O3 while it increases for HNO3 by1–2 orders of magnitude after inclusion of RH dependence ofγ . The rate coefficients for other gases show a similar spatialdistribution.
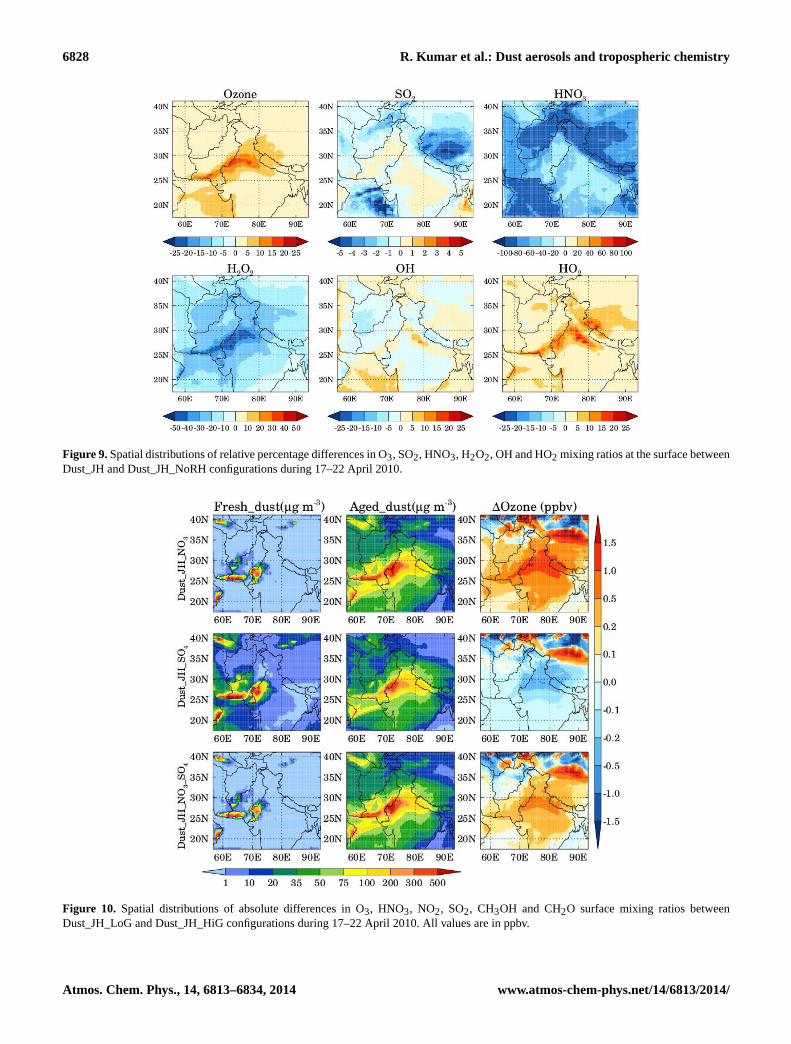
The effect of RH-induced changes in the rate constantson heterogeneous uptake of O3, SO2, HNO3, H2O2, OHand HO2 is illustrated by showing the relative percentagedifferences in the distribution of these gases in the lowestmodel layer between the model runs with and without RHdependence ofγ (Fig. 9). Surface O3 and HO2 show an in-crease when RH effects onγ are included becauseγ forthese gases decreases with RH. In contrast, HNO3 and H2O2uptake coefficients increase when RH effects are accountedfor, resulting in a decrease in HNO3 and H2O2 mixing ra-
tios. The changes in O3, HO2 and H2O2 reach up to 20, 25and 50 %, respectively, over the Thar Desert and the west-ern Indo-Gangetic Plain region. The percentage changes inHNO3 reach up to 100 % and are higher over the oceanicregions (RH > 45 %) than the inland regions because of theorder of magnitude increase ofγ for HNO3 when RH in-creases above 40 %. Surface SO2 and OH show a mixed re-sponse with increase over some parts of the model domainand decrease over the others. The changes in SO2 and OHare within±10 %. The changes in SO2 are determined bythe competition between the reactions of SO2 with dust par-ticles and OH. The heterogeneous reaction of SO2 tries toreduce SO2 due to increase inγ with RH while that with OHwould decrease (increase) SO2 if OH increases (decreases).The magnitudes of these RH-induced changes in trace gasesare comparable to those induced by heterogeneous chemistry(reported in Sect. 4.3). This suggests that consideration ofRH-dependentγ values in heterogeneous chemistry calcu-lations is as important as is the accurate simulation of dustmass concentrations.
4.6 Effect of uncertainty in reactive uptakecoefficient (γ )
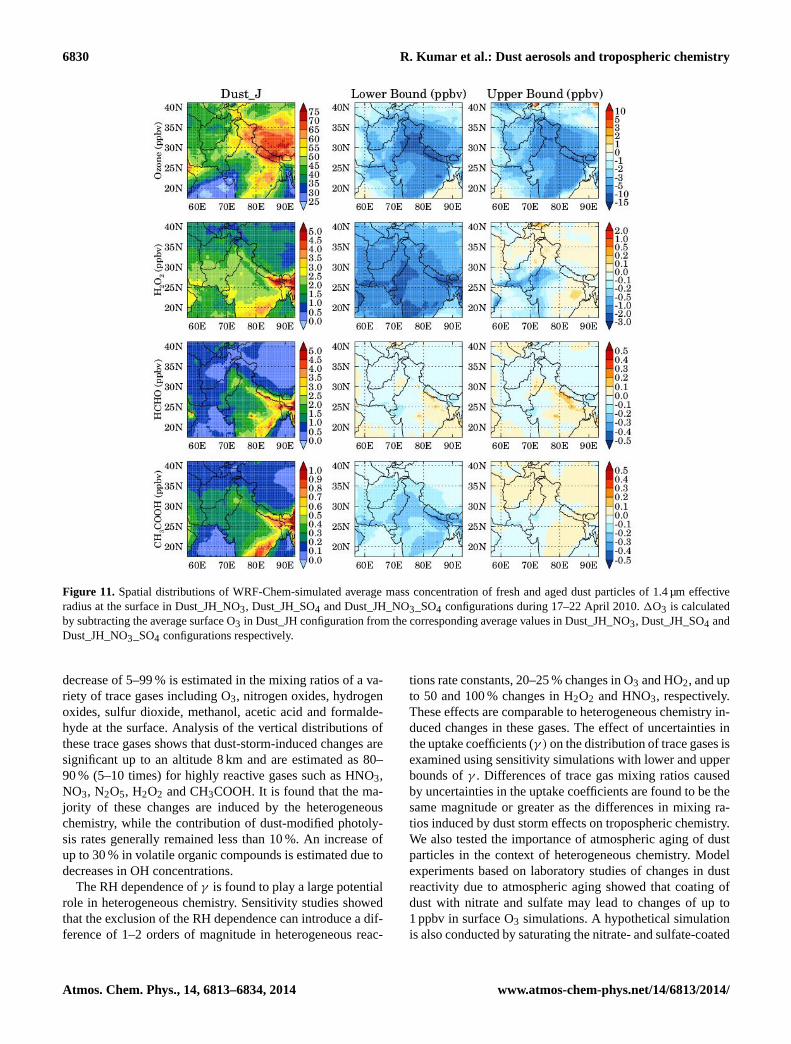
The effect of uncertainty in reactive uptake coefficient (γ )
on heterogeneous chemistry induced changes in the tropo-spheric chemistry is illustrated in Fig. 10, where modelruns with lower (Dust_JH_LoG) and upper (Dust_JH_HiG)bounds ofγ are compared in the lowest model layer. It isclear that uncertainty inγ can lead to significant uncertaintyin heterogeneous chemistry induced changes in all gases.Surface O3 mixing ratios have uncertainties of up to 8–11 ppbv (25–30 %), while other gases have uncertainties ofup to 1–1.5 ppbv (30–100 %), except SO2 and NO2, whichshow uncertainties of up to 3 ppbv (30–70 %) at some lo-cations. A comparison of these uncertainties with the to-tal change induced by dust storm in these gases (Fig. 5and Sect. 4.3) reveals that uncertainties in O3, HNO3, NO3,N2O5, OH, HO2, H2O2, and CH3COOH due to the uptakevalues have magnitudes similar to the total changes inducedby dust aerosols, while those in NO2, SO2 and CH3OH areeven greater than the total changes induced by dust storm.These results highlight the importance and necessity of ac-curate measurements of reactive uptake coefficients.
4.7 Impact of dust aging
The aging of dust particles through heterogeneous uptakeof gases can modify the dust reactivity towards trace gases.We have made an attempt to simulate changes in the dustreactivity and uptake of trace gases due to nitrate and sul-fate coating, and the results are presented in this section. Thespatial distributions of WRF-Chem-simulated average massconcentration of fresh and aged dust particles of 1.4 µm ef-fective radius at the surface in Dust_JH_NO3, Dust_JH_SO4
www.atmos-chem-phys.net/14/6813/2014/ Atmos. Chem. Phys., 14, 6813–6834, 2014
6828 R. Kumar et al.: Dust aerosols and tropospheric chemistry
Figure 9.Spatial distributions of relative percentage differences in O3, SO2, HNO3, H2O2, OH and HO2 mixing ratios at the surface betweenDust_JH and Dust_JH_NoRH configurations during 17–22 April 2010.
Figure 10. Spatial distributions of absolute differences in O3, HNO3, NO2, SO2, CH3OH and CH2O surface mixing ratios betweenDust_JH_LoG and Dust_JH_HiG configurations during 17–22 April 2010. All values are in ppbv.
Atmos. Chem. Phys., 14, 6813–6834, 2014 www.atmos-chem-phys.net/14/6813/2014/

R. Kumar et al.: Dust aerosols and tropospheric chemistry 6829
and Dust_JH_NO3_SO4 configurations during 17–22 April2010 are shown in Fig. 11. In general, fresh dust particlesare seen mostly in and near the source regions because alldust particles are emitted as fresh particles and have muchsmaller concentrations than the aged dust particles particu-larly outside the dust source regions. Among all the gasesproviding nitrate coating on dust particles, the HNO3 uptakemakes the highest contribution to the concentration of agedparticles due to its higher mixing ratios and strong increasein its reactivity towards the dust surface with relative humid-ity. For example, if there are 10 fresh dust particles cm−3
of effective radius 0.73 µm, then the uptake of HNO3, NO2,NO3 and N2O5 leads to about 2.5 aged dust particles cm−3
in one time step (180 s) at RH= 0, and HNO3 and NO3 eachprovide about 1 dust particle. However, the number concen-tration of aged dust particles formed due to HNO3 uptakeincreases to about 7 particles cm−3 per time step as RH in-creases to 20–40 %. The uptake of SO2 also increases withincrease in relative humidity, but the SO2 contribution to theaged particles is much less than that of HNO3 due to lowerSO2γ values. The decrease in O3γ values for nitrate-coateddust particles leads to an enhancement of 1–2 ppbv in surfaceO3 over the Thar Desert and western Indo-Gangetic Plain re-gion relative to uncoated dust particles (Fig. 11) while in-crease in O3 γ values for sulfate-coated dust particles leadsto a reduction of 0.5–1 ppbv over these regions. Since nitratecoating leads to a larger fraction of aged particles than thesulfate coating, surface O3 mixing ratios show an overall en-hancement of up to 1 ppbv over the regions of high dust load-ings when both sulfate- and nitrate-coated dust particles areallowed to react with O3 in the model.
The presence of a nitrate or sulfate monolayer on the dustparticle might saturate the dust particles and deactivate themfor further catalytic uptake of other gases. In order to exam-ine the effect of such a coating on the uptake of O3, H2O2,HCHO and CH3COOH, lower and upper bounds of heteroge-neous chemistry reaction rates induced changes in the surfacemixing ratios of these gases are calculated (Fig. 12). Lowerand upper bounds for each gas are calculated by subtractingtheir average values in Dust_J configuration from those inDust_JH and Dust_JH_Sat configurations respectively. Ab-solute mixing ratios of these gases in Dust_J configuration,in which dust aerosols affected photolysis rates only, are alsoshown to provide an idea of the modification in base levelsof these gases due to heterogeneous chemistry. As expected,the saturation of dust particles decreases the magnitude of re-duction caused by heterogeneous chemistry for all the gasesby 5–50 %. The amount of maximum reduction in surfaceO3 changed from 20–25 % to 15–20 % when saturation ef-fects are accounted for. The saturation of dust particles hasa larger impact on the distribution of H2O2 and CH3COOHas maximum reduction in both of these gases decreased to20–40 % (as compared to 70–90 % for unsaturated dust par-ticles) over the Thar Desert and dust source regions. Bothof these gases show a small increase of 0.1–0.2 ppbv (less
than 10 %) outside the source regions for the case of saturateddust particles. The maximum reduction in HO2 and OH (notshown) also changes from 20–40 % in Dust_JH to 5–20 %in Dust_JH_Sat. Some changes can also be discerned in thedistribution of HCHO and CH3OH (not shown), but they arewithin ±5 %.
5 Summary
The effects of a typical pre-monsoon season dust storm ontropospheric chemistry are analyzed for a case study in north-ern India, using the Weather Research and Forecasting modelcoupled with Chemistry (WRF-Chem), which is further de-veloped to enhance its ability to simulate tropospheric chem-istry in the presence of dust particles. The changes made tothe model are specific to the MOZCART setup. Two majorupdates are included in this study: firstly, the F-TUV photol-ysis scheme of the model is updated to include the effect ofdust aerosols on photolysis rates and to achieve consistencybetween the methods through which aerosols affect the me-teorology and photolysis rates in the model. Secondly, a newscheme consisting of 12 heterogeneous reactions is includedto simulate heterogeneous chemistry on the surface of dustparticles. The relative humidity dependence of uptake coef-ficients, which was ignored in most previous studies, is usedfor six of the heterogeneous reactions.
The extended configuration of WRF-Chem is applied toa typical pre-monsoon season dust storm that occurred innorthern India during 17–22 April 2010. The model repro-duced the spatial and temporal distribution of dust plumesand aerosol optical properties (Kumar et al., 2014). The sim-ulations are evaluated against surface O3 and NOy observa-tions at a high-altitude (1958 m) measurement station in theHimalayan region (Nainital), and the model is found to cap-ture the observed decrease in O3 and NOy during the duststorm only after the inclusion of the effects of dust on pho-tolysis rates and heterogeneous chemistry. Average observedand modeled O3 values at Nainital during 17–22 April 2010are estimated to be 56± 10 and 58± 5 ppbv respectively, andthe corresponding NOy values are estimated to be 843± 887and 1189± 751 pptv respectively. The extended configura-tion of the model also reduced biases in tropospheric columnNO2 by up to 30 % compared to OMI retrievals and cap-tured the general features of the dust-storm-induced changesin the spatial distribution of OMI-retrieved tropospheric col-umn NO2.
Several sensitivity simulations are conducted to investigatethe contribution of different processes on mixing ratios ofseveral key trace gases including ozone, nitrogen oxides, hy-drogen oxides, methanol, acetic acid and formaldehyde. Thedust storm leads to a decrease of 5–25 % in photolysis ratecoefficients of O3, NO2 and other trace gases at the surfaceand an increase of 1–5 % above 4 km. It is found to have asignificant impact on the regional tropospheric chemistry: a
www.atmos-chem-phys.net/14/6813/2014/ Atmos. Chem. Phys., 14, 6813–6834, 2014
6830 R. Kumar et al.: Dust aerosols and tropospheric chemistry
Figure 11. Spatial distributions of WRF-Chem-simulated average mass concentration of fresh and aged dust particles of 1.4 µm effectiveradius at the surface in Dust_JH_NO3, Dust_JH_SO4 and Dust_JH_NO3_SO4 configurations during 17–22 April 2010.1O3 is calculatedby subtracting the average surface O3 in Dust_JH configuration from the corresponding average values in Dust_JH_NO3, Dust_JH_SO4 andDust_JH_NO3_SO4 configurations respectively.
decrease of 5–99 % is estimated in the mixing ratios of a va-riety of trace gases including O3, nitrogen oxides, hydrogenoxides, sulfur dioxide, methanol, acetic acid and formalde-hyde at the surface. Analysis of the vertical distributions ofthese trace gases shows that dust-storm-induced changes aresignificant up to an altitude 8 km and are estimated as 80–90 % (5–10 times) for highly reactive gases such as HNO3,NO3, N2O5, H2O2 and CH3COOH. It is found that the ma-jority of these changes are induced by the heterogeneouschemistry, while the contribution of dust-modified photoly-sis rates generally remained less than 10 %. An increase ofup to 30 % in volatile organic compounds is estimated due todecreases in OH concentrations.
The RH dependence ofγ is found to play a large potentialrole in heterogeneous chemistry. Sensitivity studies showedthat the exclusion of the RH dependence can introduce a dif-ference of 1–2 orders of magnitude in heterogeneous reac-
tions rate constants, 20–25 % changes in O3 and HO2, and upto 50 and 100 % changes in H2O2 and HNO3, respectively.These effects are comparable to heterogeneous chemistry in-duced changes in these gases. The effect of uncertainties inthe uptake coefficients (γ ) on the distribution of trace gases isexamined using sensitivity simulations with lower and upperbounds ofγ . Differences of trace gas mixing ratios causedby uncertainties in the uptake coefficients are found to be thesame magnitude or greater as the differences in mixing ra-tios induced by dust storm effects on tropospheric chemistry.We also tested the importance of atmospheric aging of dustparticles in the context of heterogeneous chemistry. Modelexperiments based on laboratory studies of changes in dustreactivity due to atmospheric aging showed that coating ofdust with nitrate and sulfate may lead to changes of up to1 ppbv in surface O3 simulations. A hypothetical simulationis also conducted by saturating the nitrate- and sulfate-coated
Atmos. Chem. Phys., 14, 6813–6834, 2014 www.atmos-chem-phys.net/14/6813/2014/

R. Kumar et al.: Dust aerosols and tropospheric chemistry 6831
dust particles for uptake of O3, HO2, OH, H2O2, CH3COOH,CH3OH and HCHO. The saturation of dust particles is foundto have a larger impact on the distributions of H2O2 andCH3COOH but a relatively small impact on other gases.
This study clearly shows that the pre-monsoon season duststorm can potentially affect the regional tropospheric chem-istry in northern India. However, the implications of the het-erogeneous uptake of trace gases on aerosol size distribu-tions and their feedbacks on the radiation budget and cloudi-ness are not examined here. Dust particles coated with ni-trate/sulfate may interact differently with radiation as com-pared to uncoated dust particles and can increase or decreasecloudiness depending upon their size distribution. Both ofthese processes will have important implications for the di-rect aerosol radiative forcing and the elevated heat pump(EHP) hypothesis (Lau et al., 2006), which proposed thatthe absorption of solar radiation by dust and black car-bon aerosols along the southern slopes of Himalayas mod-ulates the meridional temperature gradient and leads to anearly onset of Indian summer monsoon. The heterogeneouschemistry scheme implemented in the MOZCART chemi-cal mechanism here can be easily extended to a more de-tailed aerosol module (e.g., MOSAIC) of WRF-Chem, whichwould allow studies on the implications of heterogeneouschemistry for aerosols and their interaction with radiation,clouds, and the Asian monsoon, including the role of aerosolaging on aerosol and trace gas distributions.
Nevertheless, this study demonstrates that the effects ofdust aerosols through heterogeneous chemistry and pertur-bation in photolysis rates should be included in atmosphericchemistry transport models, especially for simulating airquality in northern India. Although this study analyzed atypical dust storm in northern India, but more such studiesshould be conducted in future to lend further confidence inthese results. At the same time, it is also imperative to im-prove the accuracy and precision of the reactive uptake co-efficients, their dependence on relative humidity and atmo-spheric processing of dust particles. In addition, extensiveefforts must be made to conduct co-located measurementsof O3 and related gases, along with physical and chemicalproperties of dust aerosols in northern India, especially dur-ing the dust storm season, to gain insights into the effectsof dust aerosols on tropospheric chemistry and provide moredata for model evaluation.
The Supplement related to this article is available onlineat doi:10.5194/acp-14-6813-2014-supplement.
Acknowledgements.We thank L. Emmons and C. Wiedin-myer for their constructive suggestions on the manuscript. Thedata sets of initial and boundary conditions for meteorologicalfields were made available by the NCAR research data archive(http://rda.ucar.edu/datasets/ds083.2/). The data sets for initialand boundary conditions for chemical fields, biogenic emissions,biomass burning emissions, and programs used to process thesedata sets were made available by the NCAR Atmospheric Chem-istry Division (http://www.acd.ucar.edu/wrf-chem/). We thankthe OMI science team at KNMI for providing tropospheric NO2retrievals. The National Center for Atmospheric Research issupported by the National Science Foundation. Observations atNainital are supported by ISRO-ATCTM project. Comments fromthe two reviewers are greatly appreciated.
Edited by: H. Tost
References
Bauer, S. E., Balkanski, Y., Schulz, M., Hauglustaine, D. A., andDentener, F.: Global modeling of heterogeneous chemistry onmineral aerosol surfaces: Influence on tropospheric ozone chem-istry and comparison to observations, J. Geophys. Res., 109,D02304, doi:10.1029/2003JD003868, 2004.
Bedjanian, Y., Romanias, M. N., and El Zein, A.: Interaction of OHRadicals with Arizona Test Dust: Uptake and Products, J. Phys.Chem. A, 117, 393–400, doi:10.1021/jp311235h, 2013a.
Bedjanian, Y., Romanias, M. N., and El Zein, A.: Uptake of HO2radicals on Arizona test dust surface, Atmos. Chem. Phys. Dis-cuss., 13, 8873–8900, doi:10.5194/acpd-13-8873-2013, 2013b.
Beljaars, A. C. M.: The parameterization of surface fluxes in large-scale models under free convection, Q. J. Roy. Meteor. Soc., 121,255–270, 1994.
Bian, H. and Zender, C. S.: Mineral dust and global troposphericchemistry: Relative roles of photolysis and heterogeneous up-take, J. Geophys. Res., 108, 4672, doi:10.1029/2002JD003143,2003.
Boersma, K. F., Jacob, D. J., Bucsela, E. J., Perring, A. E., Dirksen,R., vander A, R. J., Yantosca, R. M., Park, R. J., Wenig, M. O.,Bertram, T. H., and Cohen, R. C.: Validation of OMI troposphericNO2 observations during INTEX-B and application to constrainNOx emissions over the eastern United States and Mexico, At-mos. Environ., 42, 4480–4497, 2008.
Boersma, K. F., Jacob, D. J., Trainic, M., Rudich, Y., DeSmedt, I.,Dirksen, R., and Eskes, H. J.: Validation of urban NO2 concen-trations and their diurnal and seasonal variations observed fromthe SCIAMACHY and OMI sensors using in situ surface mea-surements in Israeli cities, Atmos. Chem. Phys., 9, 3867–3879,doi:10.5194/acp-9-3867-2009, 2009a.
Boersma, K. F., Dirksen, R. J., Veefkind, J. P., Eskes, H. J., and vander A, R. J.: Dutch OMI NO2 (DOMINO) data product, HE5data file user manual,http://www.temis.nl/docs/OMINO2HE51.0.2.pdf, 2009b.
Bucsela, E. J., Celarier, E. A., Wenig, M. O., Gleason, J. F.,Veefkind, J. P., Boersma, K. F., and Brinksma, E. J.: Algorithmfor NO2 vertical column retrieval from the ozone monitoring in-strument, IEEE T. Geosci. Remote, 44, 1245–1258, 2006.
Chen, F. and Dudhia, J.: Coupling and advanced land surface hy-drology model with the Penn State-NCAR MM5 modelingsys-
www.atmos-chem-phys.net/14/6813/2014/ Atmos. Chem. Phys., 14, 6813–6834, 2014

6832 R. Kumar et al.: Dust aerosols and tropospheric chemistry
tem, Part I: Model implementation and sensitivity, Mon. WeatherRev., 129, 569–585, 2001.
Chen, H., Navea, J. G., Young, M. A., and Grassian, V.H.: Heteroge-neous Photochemistry of Trace Atmospheric Gases with Compo-nents of Mineral Dust Aerosol, J. Phys. Chem. A, 115, 490–499,2011.
Chin, M., Ginoux, P., Kinne, S., Holben, B. N., Duncan, B. N., Mar-tin, R. V., Logan, J. A., Higurashi, A., and Nakajima, T.: Tropo-spheric aerosol optical thickness from the GOCART model andcomparisons with satellite and sunphotometer measurements, J.Atmos. Sci., 59, 461–483, 2002.
Crowley, J. N., Ammann, M., Cox, R. A., Hynes, R. G., Jenkin,M. E., Mellouki, A., Rossi, M. J., Troe, J., and Wallington, T. J.:Evaluated kinetic and photochemical data for atmospheric chem-istry: Volume V – heterogeneous reactions on solid substrates,Atmos. Chem. Phys., 10, 9059–9223, doi:10.5194/acp-10-9059-2010, 2010.
Cwiertny, D. M., Young, M. A., and Grassian, V. H.: Chemistry andphotochemistry of mineral dust aerosol, Annu. Rev. Phys. Chem.,59, 27–51, doi:10.1146/annurev.physchem.59.032607.093630,2008.
DeFries, R. S. and Townshend, J. R. G.: NDVI-derived land coverclassification at a global scale, Int. J. Remote Sens., 15, 3567–3586, 1994.
Dentener, F. J., Carmichael, G. R. , Zhang, Y., Lelieveld, J., andCrutzen, P. J.: Role of mineral aerosol as a reactive surface in theglobal troposphere, J. Geophys. Res, 101, 22869–22889, 1996.
Dey, S., Tripathi, S. N., Singh, R. P., and Holben, B. N.:Influence of dust storms on aerosol opticalproperties overthe Indo-Gangetic basin, J. Geophys. Res., 109, D20211,doi:10.1029/2004JD004924, 2004.
Emmons, L. K., Deeter, M. N., Gille, J. C., Edwards, D. P., At-tié, J.-L., Warner, J., Ziskin, D., Francis, G., Khattatov, B.,Yudin, V., Lamarque, J.-F., Ho, S.-P., Mao, D., Chen, J. S.,Drummond, J., Novelli, P., Sachse, G., Coffey, M. T., Hanni-gan, J. W., Gerbig, C., Kawakami, S., Kondo, Y., Takegawa, N.,Schlager, H., Baehr, J., and Ziereis, H.: Validation of Measure-ments of Pollution in the Troposphere (MOPITT) CO retrievalswith aircraft in situ profiles, J. Geophys. Res., 109, D03309,doi:10.1029/2003JD004101, 2004.
Emmons, L. K., Walters, S., Hess, P. G., Lamarque, J.-F., Pfister,G. G., Fillmore, D., Granier, C., Guenther, A., Kinnison, D.,Laepple, T., Orlando, J., Tie, X., Tyndall, G., Wiedinmyer, C.,Baughcum, S. L., and Kloster, S.: Description and evaluation ofthe Model for Ozone and Related chemical Tracers, version 4(MOZART-4), Geosci. Model Dev., 3, 43–67, doi:10.5194/gmd-3-43-2010, 2010.
Fast, J. D, Gustafson Jr., W. I., Easter, R. C., Zaveri, R. A., Barnard,J. C., Chapman, E. G., and Grell, G. A.: Evolution of ozone,particulates, and aerosol direct forcing in an urban area usinganew fully-coupled meteorology, chemistry, and aerosol model,J. Geophys. Res., 111, D21305, doi:10.1029/2005JD006721,2006.
Freitas, S. R., Longo, K. M., Chatfield, R., Latham, D., Silva Dias,M. A. F., Andreae, M. O., Prins, E., Santos, J. C., Gielow, R., andCarvalho Jr., J. A.: Including the sub-grid scale plume rise of veg-etation fires in low resolution atmospheric transport models, At-mos. Chem. Phys., 7, 3385–3398, doi:10.5194/acp-7-3385-2007,2007.
Ghude, S. D., Pfister, G. G., Jena, C., van der A, R. J., Em-mons, L. K., and Kumar, R.: Satellite constraints of nitrogenoxide (NOx) emissions from India based on OMI observationsand WRF-Chem simulations, Geophys. Res. Lett., 40, 423–428,doi:10.029/2012GL053926, 2013.
Ginoux, P., Chin, M., Tegen, I., Prospero, J. M., Holben, B.,Dubovik, O., and Lin, S. J.: Sources and distributions of dustaerosols simulated with the GOCART model, J. Geophys. Res.-Atmos., 106, 20255–20273, 2001.
Goodman, A. L., Underwood, G. M., and Grassian, V. H.: A labora-tory study of the heterogeneous reaction of nitric acid on calciumcarbonate particles, J. Geophys. Res., 105, 29053–29064, 2000.
Granier, C. Bessagnet, B., Bond, T., D’Angiola, A., van der Gon,H. G., Frost, G. J., Heil, A., Kaiser, J. W., Kinne, S., Klimont,Z., Kloster, S., Lamarque, J.-F., Liousse, C., Masui, T., Meleux,F., Mieville, A., Ohara, T., Raut, J.-C., Riahi, K., Schultz, M.G., Smith, S. J., Thompson, A., van Aardenne, J., van der Werf,G. R., and van Vuuren, D. P.: Evolution of anthropogenic andbiomass burning emissions of air pollutants at global and re-gional scales during the 1980–2010 period, Clim. Change, 109,163–190, doi:10.1007/s10584-011-0154-1, 2011.
Grassian, V. H.: Chemical reactions of nitrogen oxides on the sur-face of oxide, carbonate, soot, and mineral dust particles: im-plications for the chemical balance of the troposphere, J. Phys.Chem. A, 106, 860–877, doi:10.1021/jp012139h, 2002.
Grell, G. A., Peckham, S. E., Schmitz, R., McKeen, S. A., Frost, G.,Skamarock, W. C., and Eder, B.: Fully coupled “online” chem-istry within the WRF model, Atmos. Environ., 39, 6957–6975,2005.
Guenther, A., Karl, T., Harley, P., Wiedinmyer, C., Palmer, P. I.,and Geron, C.: Estimates of global terrestrial isoprene emissionsusing MEGAN (Model of Emissions of Gases and Aerosols fromNature), Atmos. Chem. Phys., 6, 3181–3210, doi:10.5194/acp-6-3181-2006, 2006.
Hatch, D. C., Gierlus, K. M., Schuttlefeld, J. D., and Grassian, V.H.: Water adsorption and cloud condensation nuclei activity ofcalcite and calcite coated with model humic and fulvic acids, At-mos. Environ., 42, 5672–5684, 2008.
Haywood, J. and Boucher, O.: Estimates of the direct and indi-rect radiative forcing due to tropospheric aerosols: a review, Rev.Geophys., 38, 513–543, 2000.
Hegde, P., Pant, P., Naja, M., Dumka, U. C., and Sagar, R.:South Asian dust episode in June 2006: Aerosol observationsin the central Himalayas, Geophys. Res. Lett., 34, L23802,doi:10.1029/2007GL030692, 2007.
Heikes, B. G. and Thompson, A. M.: Effects of heterogeneous pro-cesses on NO3, HONO and HNO3 chemistry in the troposphere,J. Geophys. Res., 88, 10883–10895, 1983.
Hodzic, A., Bessagnet, B., and Vautard, R.: A model evaluation ofcoarse-mode nitrate heterogeneous formation on dust particles,Atmos. Environ., 40, 4158–4171, 2006.
Hong, S.–Y., Yign N., and Dudhia, J.: A new vertical diffusion pack-age with an explicit treatment of entrainment processes, Mon.Weather Rev., 134, 2318–2341, 2006.
Jacobson, M. Z.: Fundamentals of Atmospheric Modeling, 2ndEdn., Cambridge University Press, New York, 2005.
Jickells, T. D., An, Z. S., Andersen , K. K., Baker, A. R., Bergametti,G., Brooks, N., Cao, J. J., Boyd, P. W., Duce, R. A., Hunter, K.A., Kawahata, H., Kubilay, N., laRoche, J., Liss, P. S., Mahowald,
Atmos. Chem. Phys., 14, 6813–6834, 2014 www.atmos-chem-phys.net/14/6813/2014/

R. Kumar et al.: Dust aerosols and tropospheric chemistry 6833
N., Prospero, J. M., Ridgwell, A. J., Tegen, I., and Torres, R.:Global iron connections between desert dust, ocean biogeochem-istry and climate, Science, 308, 67–71, 2005.
Kain, J. S.: The Kain-Fritsch convective parameterization: An up-date, J. Appl. Meteorol., 43, 170–181, 2004.
Kelly, J. T., Chuang, C. C., and Anthony, S. W.: Influence of dustcomposition on cloud droplet formation, Atmos. Environ., 41,2904–2904, 2007.
Kramer, L. J., Leigh, R., Remedios, J. J., and Monks, P. S.: Com-parison of OMI and ground-based in situ and MAX-DOAS mea-surements of tropospheric nitrogen dioxide in an urban area, J.Geophys. Res., 113, D16S39, doi:10.1029/2007JD009168, 2008.
Kumar, R., Naja, M., Venkataramani, S., and Wild, O.: Vari-ations in surface ozone at Nainital, a high altitude sitein the Central Himalayas, J. Geophys. Res., 115, D16302,doi:10.1029/2009JD013715, 2010.
Kumar, R., Naja, M., Pfister, G. G., Barth, M. C., Wiedinmyer,C., and Brasseur, G. P.: Simulations over South Asia using theWeather Research and Forecasting model with Chemistry (WRF-Chem): chemistry evaluation and initial results, Geosci. ModelDev., 5, 619–648, doi:10.5194/gmd-5-619-2012, 2012.
Kumar, R., Barth, M. C., Pfister, G. G., Naja, M., and Brasseur,G. P.: WRF-Chem simulations of a typical pre-monsoon duststorm in northern India: influences on aerosol optical proper-ties and radiation budget, Atmos. Chem. Phys., 14, 2431–2446,doi:10.5194/acp-14-2431-2014, 2014.
Lau, K. M., Kim, M. K., and Kim, K. M.: Asian summer monsoonanomalies induced by aerosol direct forcing: The role of the Ti-betan Plateau, Clim. Dynam., 26, 855–864, doi:10.1007/s00382-006-0114-z, 2006.
Levin, Z., Ganor, E., and Gladstein, V.: The effects of desert parti-cles coated with sulfate on rain formation in the eastern Mediter-ranean, J. Appl. Meteorol., 35, 1511–1523, 1996.
Li, L., Chen, Z. M., Zhang, Y. H., Zhu, T., Li, J. L., and Ding, J.: Ki-netics and mechanism of heterogeneous oxidation of sulfur diox-ide by ozone on surface of calcium carbonate, Atmos. Chem.Phys., 6, 2453–2464, doi:10.5194/acp-6-2453-2006, 2006.
Liu, Y., Gibson, E. R., Cain, J. P., Wang, H., Grassian, V. H., andLaskin, A: Kinetic Study of Heterogeneous Reactions of CaCO3Particles with HNO3 as a Function of Relative Humidity Us-ing Single Particle Analysis, J. Phys. Chem. A, 112, 1561–1571,2008.
Lo, J. C.-F., Yang, Z.-L., and Pielke Sr., R. A.: Assessment ofthree dynamical climate downscaling methods using the WeatherResearchand Forecasting (WRF) model, J. Geophys. Res., 113,D09112, doi:10.1029/2007JD009216, 2008.
Madronich, S. and Weller, G.: Numerical integration errors in calcu-lated tropospheric photodissociation rate coefficients, J. Atmos.Chem., 10, 289–300, 1990.
Martin, R. V., Jacob, D. J., Yantosca, R. M., Chin, M., and Ginoux,P.: Global and regional decreases in tropospheric oxidants fromphotochemical effects of aerosols, J. Geophys. Res., 108, 4097,doi:10.1029/2002JD002622, 2003.
Michel, A. E., Usher, C. R., and Grassian, V. H., Heterogeneousand catalytic uptake of ozone on mineral oxides and dusts:A Knudsen cell investigation, Geophys. Res. Lett., 29, 1665,doi:10.1029/2002GL014896, 2002.
Miller, R. L., Tegen, I., and Perlwitz, J.: Surface radiative forcingby soil dust aerosols and the hydrologic cycle, J. Geophys. Res.,109, D04203, doi:10.1029/2003JD004085, 2004.
Mlawer, E. J., Taubman, S., Brown, P., Iacono, M., and Clough, S.:Radiative transfer for inhomogenous atmosphere: RRTM, aval-idated correlated-k model for the long-wave, J. Geophys. Res.,102, 16663–16682, doi:10.1029/97JD00237, 1997.
Pant, P., Hegde, P., Dumka, U. C., Satheesh, S. K., Moorthy, K.K., Saha, A., and Srivastava, M . K.: Aerosol characteristicsat a high-altitude location in central Himalayas: Optical prop-erties and radiative forcing, J. Geophys. Res., 111, D17206,doi:10.1029/2005JD006768, 2006.
Peterson, J. T.: Measurements of atmospheric aerosols and infraredradiation over northwest India and their interrelationship, Ph. D.thesis, 165pp., Dep. Of Meteorol., Univ. of Wisconsin, Madison,Wisconsin, 1968.
Pfister, G. G., Parrish, D. D., Worden, H., Emmons, L. K., Edwards,D. P., Wiedinmyer, C., Diskin, G. S., Huey, G., Oltmans, S. J.,Thouret, V., Weinheimer, A., and Wisthaler, A.: Characterizingsummertime chemical boundary conditions for airmasses enter-ing the US West Coast, Atmos. Chem. Phys., 11, 1769–1790,doi:10.5194/acp-11-1769-2011, 2011.
Pozzoli, L., Bey, I., Rast, S., Schultz, M. G., Stier, P.,and Feichter, J.: Trace gas and aerosol interactions in thefully coupled model of aerosol-chemistry-climate ECHAM5-HAMMOZ: 1. Model description and insights from the spring2001 TRACE-P experiment, J. Geophys. Res., 113, D07308,doi:10.1029/2007JD009007, 2008.
Pradhan, M., Kyriakou, G., Archibald, A. T., Papageorgiou, A. C.,Kalberer, M., and Lambert, R. M.: Heterogeneous uptake ofgaseous hydrogen peroxide by Gobi and Saharan dust aerosols:a potential missing sink for H2O2 in the troposphere, Atmos.Chem. Phys., 10, 7127–7136, doi:10.5194/acp-10-7127-2010,2010.
Prasad, A. K. and Singh, R. P.: Changes in aerosol parameters dur-ing major dust storm events (2001–2005) over the Indo-GangeticPlains using AERONET and MODIS data, J. Geophys. Res., 112,D09208, doi:10.1029/2006JD007778, 2007.
Preszler Prince, A., Kleiber, P., Grassian, V. H., and Young, M. A.:Heterogeneous interactions of calcite aerosol with sulfur diox-ide and sulfur dioxide nitric acid mixtures, Phys. Chem. Chem.Phys., 9, 3432–3439, 2007.
Sagar, R., Kumar, B., Dumka, U. C., Moorthy, K. K., and Pant, P.:Characteristics of aerosol optical depths over Manora Peak: Ahigh-altitude station in the central Himalayas, J. Geophys. Res.,109, D06207, doi:10.1029/2003JD003954, 2004.
Sarangi, T., Naja, M., Ojha, N., Kumar, R., Lal, S., Venkataramani,S., Kumar, A., Sagar, R., and Chandola, H. C.: First simultaneousmeasurements of ozone, CO and NOy at a high altitude regionalrepresentative site in the central Himalayas, J. Geophys. Res.-Atmos., 119, 1592–1611, doi:10.1002/2013JD020631, 2014.
Seinfeld, J. H., Carmichael, G., Arimoto, R., Conant, W. C., Brech-tel, F. J., Bates, T. S., Cahill, T. A., Clarke, A. D., Doherty, S. J.,Flatau, F. J., Huebert, B. J., Kim, J., Markowicz, K. M., Quinn,P. K., Russell, L. M., Russell, P. B., Shimizu, A., Y., Song, C.H., TanShag, Y., Uno, I., Vogelmann, A. M., Weber, R. J., Woo,J., and Zhang, X. Y.: ACE-ASIA, Regional climatic and atmo-spheric chemical effects of Asian dust and pollution, B. Am. Me-teorol. Soc., 85, 367–380, 2004.
www.atmos-chem-phys.net/14/6813/2014/ Atmos. Chem. Phys., 14, 6813–6834, 2014

6834 R. Kumar et al.: Dust aerosols and tropospheric chemistry
Skamarock, W. C., Klemp, J. B., Dudhia, J., Gill, D. O., Barker,D. M., Wang, W., and Powers, J. G.: A description of the ad-vancedresearch WRF version 2, NCAR Tech. Note, NCAR/TN-468+STR, Natl. Cent. for Atmos. Res., Boulder, Colo, availableat: http://wrf-model.org/wrfadmin/publications.php(last access:30 June 2014), 2008.
Tang, Y., Carmichael, G. R., Kurata, G., Uno, I.,Weber, R. J., Song,C.-H., Guttikunda, S. K., Woo, J.-H., Streets, D. G., Wei, C.,Clarke, A. D., Huebert, B., and Anderson, T. L.: Impacts of duston regional tropospheric chemistry during the ACE-Asia exper-iment: A model study with observations, J. Geophys. Res., 109,D19S21, doi:10.1029/2003JD003806, 2004.
Thompson, G., Rasmussen, R. M., and Manning, K.: Explicit fore-casts of winter precipitation using an improved bulk micro-physicsscheme, Part I: Description and sensitivity analysis, Mon.Weather Rev., 132, 519–542, 2004.
Tie, X., Madronich, S., Walters, S., Edwards, D. P., Ginoux, P., Ma-howald, N., Zhang, R., Lou, C., and Brasseur, G.: Assessment ofthe global impact of aerosols on tropospheric oxidants, J. Geo-phys. Res., 110, D03204, doi:10.1029/2004JD005359, 2005.
Underwood, G. M., Song, C. H., Phadnis, M., Carmichael, G. R.,and Grassian, V. H.: Heterogeneous reactions of NO2 and HNO3on oxides and mineral dust: a combined laboratory and modelingstudy, J. Geophys. Res., 106, 18055–18066, 2001.
Usher, C. R., Michel, A. E., Stec, D., and Grassian,V. H.: Laboratory Studies of Ozone Uptake on Pro-cessed Mineral Dust, Atmos. Environ., 37, 5337–5347,doi:10.1016/j.atmosenv.2003.09.014, 2003.
Wagner, C., Hanisch, F., Holmes, N., de Coninck, H., Schuster, G.,and Crowley, J. N.: The interaction of N2O5 with mineral dust:aerosol flow tube and Knudsen reactor studies, Atmos. Chem.Phys., 8, 91–109, doi:10.5194/acp-8-91-2008, 2008.
Wang, K., Zhang, Y., Nenes, A., and Fountoukis, C.: Implementa-tion of dust emission and chemistry into the Community Mul-tiscale Air Quality modeling system and initial application toan Asian dust storm episode, Atmos. Chem. Phys., 12, 10209–10237, doi:10.5194/acp-12-10209-2012, 2012.
Wiedinmyer, C., Akagi, S. K., Yokelson, R. J., Emmons, L. K., Al-Saadi, J. A., Orlando, J. J., and Soja, A. J.: The Fire INventoryfrom NCAR (FINN): a high resolution global model to estimatethe emissions from open burning, Geosci. Model Dev., 4, 625–641, doi:10.5194/gmd-4-625-2011, 2011.
Ying, Z., Tie, X., Madronich, S., Li, G., and Massie, S.: Simulationof regional dust and its effect on photochemistry in the MexicoCity area during MILAGRO experiment, Atmos. Environ., 45,2549–2558, 2011.
Zhang, Q., Streets, D. G., Carmichael, G. R., He, K. B., Huo, H.,Kannari, A., Klimont, Z., Park, I. S., Reddy, S., Fu, J. S., Chen,D., Duan, L., Lei, Y., Wang, L. T., and Yao, Z. L.: Asian emis-sions in 2006 for the NASA INTEX-B mission, Atmos. Chem.Phys., 9, 5131–5153, doi:10.5194/acp-9-5131-2009, 2009.
Zhang, Y. and Carmichael, G. R.: The role of mineral aerosol intropospheric chemistry in East Asia – a model study, J. Appl.Meteorol., 38, 353–366, 1999.
Zhang, Y., Sunwoo, Y., Kotamarthi, V., and Carmichael, G. R.: Pho-tochemical oxidant processes in the presence of dust: An evalua-tion of the impact of dust on particulate nitrate and ozone forma-tion, J. Appl. Meteorol., 33, 813–824, 1994.
Zhao, C., Liu, X., Ruby Leung, L., and Hagos, S.: Radiative impactof mineral dust on monsoon precipitation variability over WestAfrica, Atmos. Chem. Phys., 11, 1879–1893, doi:10.5194/acp-11-1879-2011, 2011.
Zhou, Y., Brunner, D., Boersma, K. F., Dirksen, R., and Wang, P.:An improved tropospheric NO2 retrieval for OMI observationsin the vicinity of mountainous terrain, Atmos. Meas. Tech., 2,401–416, doi:10.5194/amt-2-401-2009, 2009.
Zhu, S., Butler, T., Sander, R., Ma, J., and Lawrence, M. G.: Impactof dust on tropospheric chemistry over polluted regions: a casestudy of the Beijing megacity, Atmos. Chem. Phys., 10, 3855–3873, doi:10.5194/acp-10-3855-2010, 2010.
Atmos. Chem. Phys., 14, 6813–6834, 2014 www.atmos-chem-phys.net/14/6813/2014/
Copyright © 2022 FDOKUMEN