Isotopic constraints on glacial/interglacial changes in the oceanic nitrogen budget
25
Isotopic constraints on glacial/interglacial changes in the oceanic nitrogen budget Curtis Deutsch, 1,2 Daniel M. Sigman, 3 Robert C. Thunell, 4 Anna Nele Meckler, 5 and Gerald H. Haug 6 Received 18 November 2003; revised 17 May 2004; accepted 16 July 2004; published 28 October 2004. [1] We investigate the response of the 15 N/ 14 N of oceanic nitrate to glacial/interglacial changes in the N budget, using a geochemical box model of the oceanic N cycle that includes N 2 fixation and denitrification in the sediments and suboxic water column. This model allows us to quantify the isotopic response of different oceanic nitrate pools to deglacial increases in water column and sedimentary denitrification, given a range of possible feedbacks between nitrate concentration and N 2 fixation/denitrification. This response is compared to the available paleoceanographic data, which suggest an early deglacial maximum in nitrate 15 N/ 14 N in suboxic zones and no significant glacial- to-late Holocene change in global ocean nitrate 15 N/ 14 N. Consistent with the work of Brandes and Devol [2002], we find that the steady state 15 N/ 14 N of oceanic nitrate is controlled primarily by the fraction of total denitrification that occurs in the water column. Therefore a deglacial peak in the ratio of water column-to-sediment denitrification, caused by either a strong feedback between water column denitrification and the N reservoir or by an increase in sediment denitrification due to sea level rise, can explain the observed deglacial 15 N/ 14 N maximum in sediments underlying water column denitrification zones. The total denitrification rate and the mean ocean nitrate concentration are also important determinants of steady state nitrate 15 N/ 14 N. For this reason, modeling a realistic deglacial 15 N/ 14 N maximum further requires that the combined negative feedbacks from N 2 fixation and denitrification are relatively strong, and N losses are relatively small. Our results suggest that the glacial oceanic N inventory was at most 30% greater than today’s and probably less than 10% greater. INDEX TERMS: 4267 Oceanography: General: Paleoceanography; 4805 Oceanography: Biological and Chemical: Biogeochemical cycles (1615); 4845 Oceanography: Biological and Chemical: Nutrients and nutrient cycling; 4870 Oceanography: Biological and Chemical: Stable isotopes; KEYWORDS: feedback, nitrogen isotopes, paleoceanography Citation: Deutsch, C., D. M. Sigman, R. C. Thunell, A. N. Meckler, and G. H. Haug (2004), Isotopic constraints on glacial/ interglacial changes in the oceanic nitrogen budget, Global Biogeochem. Cycles, 18, GB4012, doi:10.1029/2003GB002189. 1. Introduction [2] The nitrogen cycle plays a central role in the biogeo- chemistry of the ocean. As an essential nutrient, biologically available (or ‘‘fixed’’) N has the potential to limit biological productivity over large regions of the ocean. Changes in the N cycle are of growing interest in research at the interface between climate and biogeochemistry. Several lines of evidence now point to important influences of climate change on the N budget [Altabet et al., 1995; Ganeshram et al., 1995; Karl et al., 1997], and hypotheses have been put forward for indirect influences of the marine N budget on climate [Altabet et al., 2002; Falkowski, 1997; Ganeshram et al., 2000; McElroy , 1983; Suthhof et al., 2001]. A change in the oceanic inventory of fixed N (which is dominated by nitrate, NO 3 ) would be expected to impact the biological carbon pump in the low-latitude ocean, where the major nutrients (nitrate and phosphate) limit productivity. As a result, an increase in the N inventory during the last ice age has been offered as a possible cause for lower glacial atmospheric pCO 2 [McElroy , 1983]. [3] The magnitude of sources and sinks of fixed N in the modern ocean are probably not known to better than a factor of 2. Nevertheless, it is now believed that the residence time of oceanic N is roughly 2–3 kyr [Brandes and Devol, 2002; Gruber and Sarmiento, 1997], which is short in the context of glacial/interglacial climate change, such that conceivable imbalances could cause large changes in the GLOBAL BIOGEOCHEMICAL CYCLES, VOL. 18, GB4012, doi:10.1029/2003GB002189, 2004 1 Program in Atmospheric and Oceanic Sciences, Princeton University, Princeton, New Jersey, USA. 2 Now at Program on Climate Change, University of Washington, Seattle, Washington, USA. 3 Department of Geosciences, Princeton University, Princeton, New Jersey, USA. 4 Department of Geological Sciences, University of South Carolina, Columbia, South Carolina, USA. 5 Geological Institute, Zurich, Switzerland. 6 Geoforschungszentrum Potsdam, Potsdam, Germany. Copyright 2004 by the American Geophysical Union. 0886-6236/04/2003GB002189$12.00 GB4012 1 of 22
-
Upload
independent -
Category
Documents
-
view
3 -
download
0
Transcript of Isotopic constraints on glacial/interglacial changes in the oceanic nitrogen budget
Isotopic constraints on glacial/interglacial changes in the oceanic
nitrogen budget
Curtis Deutsch,1,2 Daniel M. Sigman,3 Robert C. Thunell,4 Anna Nele Meckler,5
and Gerald H. Haug6
Received 18 November 2003; revised 17 May 2004; accepted 16 July 2004; published 28 October 2004.
[1] We investigate the response of the 15N/14N of oceanic nitrate to glacial/interglacialchanges in the N budget, using a geochemical box model of the oceanic N cycle thatincludes N2 fixation and denitrification in the sediments and suboxic water column. Thismodel allows us to quantify the isotopic response of different oceanic nitrate pools todeglacial increases in water column and sedimentary denitrification, given a range ofpossible feedbacks between nitrate concentration and N2 fixation/denitrification.This response is compared to the available paleoceanographic data, which suggest anearly deglacial maximum in nitrate 15N/14N in suboxic zones and no significant glacial-to-late Holocene change in global ocean nitrate 15N/14N. Consistent with the work ofBrandes and Devol [2002], we find that the steady state 15N/14N of oceanic nitrate iscontrolled primarily by the fraction of total denitrification that occurs in the water column.Therefore a deglacial peak in the ratio of water column-to-sediment denitrification, causedby either a strong feedback between water column denitrification and the N reservoir or byan increase in sediment denitrification due to sea level rise, can explain the observeddeglacial 15N/14N maximum in sediments underlying water column denitrificationzones. The total denitrification rate and the mean ocean nitrate concentration are alsoimportant determinants of steady state nitrate 15N/14N. For this reason, modeling a realisticdeglacial 15N/14N maximum further requires that the combined negative feedbacks fromN2 fixation and denitrification are relatively strong, and N losses are relatively small.Our results suggest that the glacial oceanic N inventory was at most 30% greater thantoday’s and probably less than 10% greater. INDEX TERMS: 4267 Oceanography: General:
Paleoceanography; 4805 Oceanography: Biological and Chemical: Biogeochemical cycles (1615); 4845
Oceanography: Biological and Chemical: Nutrients and nutrient cycling; 4870 Oceanography: Biological and
Chemical: Stable isotopes; KEYWORDS: feedback, nitrogen isotopes, paleoceanography
Citation: Deutsch, C., D. M. Sigman, R. C. Thunell, A. N. Meckler, and G. H. Haug (2004), Isotopic constraints on glacial/
interglacial changes in the oceanic nitrogen budget, Global Biogeochem. Cycles, 18, GB4012, doi:10.1029/2003GB002189.
1. Introduction
[2] The nitrogen cycle plays a central role in the biogeo-chemistry of the ocean. As an essential nutrient, biologicallyavailable (or ‘‘fixed’’) N has the potential to limit biologicalproductivity over large regions of the ocean. Changes inthe N cycle are of growing interest in research at theinterface between climate and biogeochemistry. Several
lines of evidence now point to important influences ofclimate change on the N budget [Altabet et al., 1995;Ganeshram et al., 1995; Karl et al., 1997], and hypotheseshave been put forward for indirect influences of the marineN budget on climate [Altabet et al., 2002; Falkowski, 1997;Ganeshram et al., 2000; McElroy, 1983; Suthhof et al.,2001]. A change in the oceanic inventory of fixed N (whichis dominated by nitrate, NO3
�) would be expected to impactthe biological carbon pump in the low-latitude ocean,where the major nutrients (nitrate and phosphate) limitproductivity. As a result, an increase in the N inventoryduring the last ice age has been offered as a possible causefor lower glacial atmospheric pCO2 [McElroy, 1983].[3] The magnitude of sources and sinks of fixed N in the
modern ocean are probably not known to better than a factorof 2. Nevertheless, it is now believed that the residencetime of oceanic N is roughly 2–3 kyr [Brandes and Devol,2002; Gruber and Sarmiento, 1997], which is short in thecontext of glacial/interglacial climate change, such thatconceivable imbalances could cause large changes in the
GLOBAL BIOGEOCHEMICAL CYCLES, VOL. 18, GB4012, doi:10.1029/2003GB002189, 2004
1Program in Atmospheric and Oceanic Sciences, Princeton University,Princeton, New Jersey, USA.
2Now at Program on Climate Change, University of Washington,Seattle, Washington, USA.
3Department of Geosciences, Princeton University, Princeton, NewJersey, USA.
4Department of Geological Sciences, University of South Carolina,Columbia, South Carolina, USA.
5Geological Institute, Zurich, Switzerland.6Geoforschungszentrum Potsdam, Potsdam, Germany.
Copyright 2004 by the American Geophysical Union.0886-6236/04/2003GB002189$12.00
GB4012 1 of 22
oceanic inventory of N on a timescale comparable toglacial/interglacial transitions (less than 10 kyr).[4] Because the dominant sources and sinks in the N
budget influence the 15N/14N of oceanic nitrate in distinctways, the 15N/14N of organic N preserved in sediments offersthe potential to reconstruct past changes in the N budget.While N isotope paleoceanography is in its infancy and thereare few sediment 15N/14N records away from denitrificationzones, there are several adequately robust observations thatwe use to guide this study. First, sediment 15N/14N isobserved to increase upon deglaciation in regions of modernwater column denitrification, suggesting that denitrificationin the thermocline of these regions increased at the end of thelast ice age [Altabet et al., 2002; Ganeshram et al., 2000].Second, many of these same sediment records include asubsequent decrease in sediment 15N/14N through the earlyHolocene, with the amplitude of this decrease being similarto or smaller than the initial 15N/14N increase upon deglaci-ation (Figure 1). Third, records distant from denitrification
zones suggest no significant change in sediment 15N/14Nfrom Last Glacial Maximum to late Holocene, suggestingthat mean ocean nitrate 15N/14N has not changed signifi-cantly between these two climate states [Kienast, 2000].Fourth, and least certain, some of the records outsidedenitrification zones also suggest a deglacial/early Holocene15N/14N maximum that is reminiscent of the deglacialmaximum observed in the denitrification regions but ofsmaller amplitude [Holmes et al., 1997; Kienast, 2000].[5] The first of these observations provides clear evidence
for significant climate-associated changes in the fixed Nbudget. Specifically, the deglacial increase in 15N/14N oforganic N in sediments underlying the ocean’s major sub-oxic zones imply that the rate and/or extent of water columndenitrification (an 15N-enriching process) was reduced dur-ing glacial periods [Altabet et al., 1995; Ganeshram et al.,1995]. The deglacial increase in water column denitrifica-tion was driven by a climate-related increase in the intensityand/or extent of thermocline suboxia [Keigwin and Jones,
Figure 1. Downcore records of bulk sediment d15N from the eastern North Pacific (Gulf ofTehuantepec, Mexican margin [Thunell and Kepple, 2004]; Gulf of California [Pride et al., 1999]; andSanta Barbara Basin [Emmer and Thunell, 2000]). Intervals of sediment lamination are indicated with agray bar for each record. The Mexican margin and the Gulf of California are regions of active watercolumn denitrification today, whereas the waters overlying the Santa Barbara Basin are influenced by thenorthward advection (in the California Undercurrent) of the denitrification signal from the south (nitrated15N (solid circles) and N* (open squares) shown in inset [Altabet et al., 1999; Sigman et al., 2003]). Seecolor version of this figure at back of this issue.
GB4012 DEUTSCH ET AL.: GLACIAL/INTERGLACIAL NITROGEN BUDGET
2 of 22
GB4012
1990; Kennett and Ingram, 1995]. Other climate-associatedchanges in the N budget have also been proposed.Christensen [1994] argued that sedimentary denitrificationwas lower during glacial periods due to the reduced area ofthe continental shelf, where most sedimentary denitrifica-tion is thought to occur. Finally, Falkowski [1997] andBroecker and Henderson [1998] have proposed that thehigher glacial dust flux recorded in ice cores relieved ironlimitation of N2 fixing cyanobacteria, thereby increasingglacial N2 fixation and adding to the N imbalance resultingfrom denitrification changes.[6] Each of these potential climate-forced changes in the
N budget would contribute to a cycle of oceanic nitratedepletion during interglacials and nitrate accumulationduring ice ages. Even if only water column denitrificationchanges during glacial cycles, the ocean would still undergolarge changes in N inventory. A deglacial increase inwater column denitrification of 60% (�40 TgN/yr), withall other fluxes remaining constant since the Last GlacialMaximum, would have removed 60 � 104 TgN, equivalentto the modern oceanic nitrate inventory, over the ensuing15 kyr. Furthermore, if sedimentary denitrification alsoincreased and/or N2 fixation decreased into the Holocene[Christensen, 1994; Falkowski, 1997], then the N depletionwould have been even faster.[7] Glacial/interglacial swings in N inventory of these
magnitudes would have dramatic impacts on oceanic pro-ductivity. Simple box models of the ocean suggest that
changes in nutrient inventory cause roughly proportionalchanges in subtropical and tropical ocean productivity[Broecker, 1982a, 1982b; Broecker and Peng, 1987; Sigmanet al., 1998]. Yet, the geologic record provides no evidenceof dramatic peaks or drops in global ocean productivity overglacial/interglacial cycles, or on longer periods [Blunier etal., 2002]. Instead, the evidence suggests that the fertility ofthe ocean has been remarkably stable over thousands andmillions of years (reviewed by Sigman and Haug [2003]).[8] One way to reconcile the inferred climatically induced
N budget perturbations with the apparent stability of oce-anic productivity is to invoke the presence of negativefeedbacks that regulate the N budget. Two such feedbackshave been proposed, one involving N2 fixation [Ganeshramet al., 2002; Haug et al., 1998; Redfield et al., 1963;Tyrrell, 1999], and the other involving denitrification[Codispoti, 1989; Toggweiler and Carson, 1995]. The N2
fixation feedback hinges on a relationship between the[NO3
�]:[PO43�] ratio of the ocean and the competitive
advantage of N2 fixing organisms [Redfield et al., 1963;Tyrrell, 1999] (Figure 2). When N becomes depleted relativeto P, the nutrient supply to the euphotic zone will lead to moreN limitation. Organisms capable of using the excess P byfixing their own N would be expected to find an expandedecological niche, and inputs of newly fixed Nwould increase,raising the N inventory. As the ocean’s N and P approach theratio needed by phytoplankton, the energetically costlyprocess of N2 fixation would be discouraged since N supplywould be sufficient to use the available P.[9] Feedbacks involving N sinks may also help to regulate
the N inventory (Figure 2). For example, an increase in thenitrate reservoir would lead to an increase in the export oforganic matter (assuming a flexible C:P ratio). This wouldcause an expansion of thermocline suboxia and therefore anincrease in water column denitrification, which would workagainst the climatically forced increase in the nitrate reser-voir. While sedimentary denitrification is not strongly cou-pled to suboxia in bottom waters [Devol, 1991], one wouldalso expect it to increase with increasing export productionand organic matter flux to sediments [Christensen et al.,1987]. Thus sedimentary denitrification offers an additionalnegative feedback, although one might expect the strength ofthe sediment-related feedback to be somewhat weaker. Thepotential for glacial/interglacial changes in the N inventorydepends on the combined strength of these negative feed-backs in their response to climate forcing of the N cycle.[10] Different N budget feedbacks may be competitive, if
not mutually exclusive. The more effectively any source/sink term counteracts perturbations to the N inventory, thesmaller will be the effective perturbation to which othersource/sink terms respond. For example, the N deficitsgenerated by a deglacial increase in denitrification mightbe rapidly and completely compensated by an increase in N2
fixation. If the N:P ratio of export production remainsunchanged as a result, there will be no change in the fluxof organic N through the suboxic layer, and the denitrifica-tion feedback would be irrelevant. On the other hand, if N2
fixation responds only weakly to the N deficit, exportproduction will decrease, and a denitrification feedback willbe the dominant mechanism for stabilizing the N reservoir.
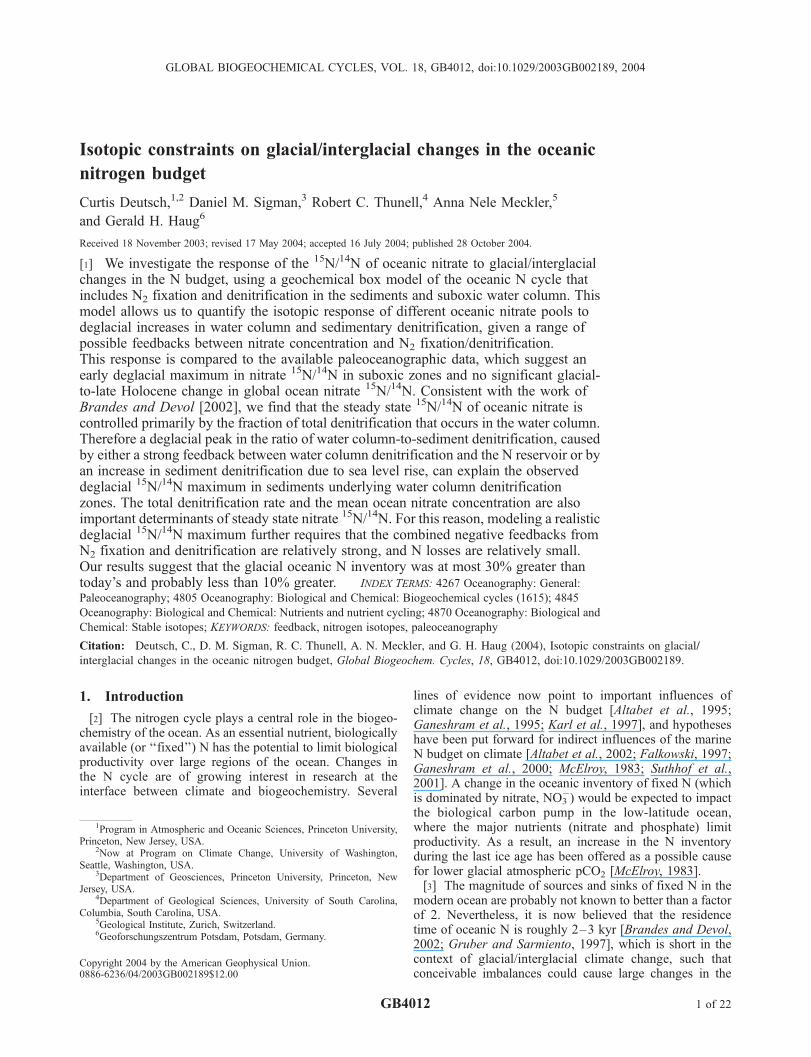
Figure 2. Schematic of previously hypothesized N budgetfeedbacks. Perturbations to the N inventory could beregulated through feedbacks by either denitrification (e.g.,changes in the preformed nitrate concentration of thethermocline causing changes in low-latitude productivity,which affects the extent of suboxia and therefore denitri-fication) or N2 fixation (changes in N inventory causingchanges in the N:P of the nutrient supply to the surfaceocean, which affects the competitive advantage of N2 fixingorganisms and therefore N2 fixation). The denitrificationnegative feedback loop also works for benthic denitrifica-tion, which is not very sensitive to bottom water [O2] but issensitive to sediment nitrification rates and thus to theproductivity-driven flux of organic matter to the sediments.Each step in the feedback mechanism involves a directproportionality (arrow with plus sign) or an inverseproportionality (arrow with minus sign), but the sum ofthe processes in each case constitutes a negative feedback.
GB4012 DEUTSCH ET AL.: GLACIAL/INTERGLACIAL NITROGEN BUDGET
3 of 22
GB4012
[11] The sensitivities of different feedbacks will combinewith the strength of climate forcings to determine thechange in each of the N budget fluxes. Since the dominantsources and sinks of oceanic fixed N all have differentisotope effects, one might expect both the forcings and thefeedbacks to be reflected in sediment N isotope records.The observations summarized above provide a basis forassessing the importance of forcing and feedback processesin N budget changes.[12] Here we develop and apply a box model of the ocean
N cycle designed to capture the processes most relevant tothe isotopic composition of subsurface nitrate, the largestpool of fixed N in the ocean. We begin by exploring thefactors that control the steady state 15N/14N ratio of nitrate.We then perform a series of simulations in which we assumea given deglacial forcing of the N cycle, specifically, astepwise increase in water column denitrification upondeglaciation [Altabet et al., 1995; Ganeshram et al., 1995]and a more gradual deglacial increase in sediment denitri-fication that is paced by sea level rise [Christensen, 1994;Bard et al., 1990]. These simulations include previouslyproposed feedbacks on the N budget, which are assessed bycomparison with sediment 15N/14N records. This model isone step toward integrating these interactions in a way thatallows us to test various hypotheses against the constraintsprovided by paleoceanographic data.
2. Model
[13] In this section, we develop a box model that repre-sents, in a simplified manner, the relevant processes in themarine nitrogen cycle: N2 fixation, sediment denitrification,water column denitrification, the tropical/subtropical bio-logical pump, and water mass transport and mixing. We usethe model to identify the factors that control the steady stateisotopic composition of oceanic nitrate. The nitrate supplyto the surface is fully consumed in most of the low-latitudeocean, so the 15N/14N of the sinking flux typically reflectsthat of the subsurface nitrate [Altabet, 1988; Altabet et al.,1999; Thunell et al., 2004].
2.1. Considerations
[14] A first approximation to the steady state mean oceannitrate 15N/14N ratio can be understood by considering ahomogeneous nitrate pool influenced by N2 fixation anddenitrification. At steady state, N2 fixation (F ) must balancewater column denitrification (W ) plus sedimentary (orbenthic) denitrification (B). N2 fixation supplies new fixedN from the large reservoir of atmospheric N2 with littlefractionation [Carpenter et al., 1997], so we set the 15Nsource toRa�F, whereRa is the
15N/14N ratio of atmosphericN2. This must balance the loss of 15N by water column andsedimentary denitrification, (15N/14N) � (abB + awW ),where the a’s are their respective fractionation factors.[15] Water column denitrification expresses a strong pref-
erence for 14N (we assume aw = 0.975) [Barford et al.,1999], leaving behind 15N-enriched nitrate [Altabet et al.,1999; Liu and Kaplan, 1989; Sigman et al., 2003; Voss etal., 2001; Brandes et al., 1998]. In contrast, sedimentarydenitrification is thought to occur with little apparentisotopic fractionation (ab = 1), due to the effects of pore-
water diffusion [Brandes and Devol, 1997; Sigman andCasciotti, 2001]. The steady state isotopic balance can besolved (with F = W + B) for the 15N/14N ratio
15N=14N ¼ Ra � ab 1� fwð Þ þ awfwð Þ;
where the fraction of total denitrification occurring in thewater column is denoted fw ( fw = W/(W + B)) [Brandes andDevol, 2002]. Thus the steady state 15N/14N ratio (or d15N,defined as d15N = ((15N/14N)sample/(
15N/14N)reference � 1) �1000%, where the reference is atmospheric N2) of ahomogeneous ocean with N sinks of different fractionationsdepends only on the relative magnitude of those sinks ( fw)and their fractionation factors. If a given N2 fixation sourceis balanced predominantly by water column denitrification( fw! 1), 14N will be preferentially removed from the ocean,giving a high d15N for mean ocean nitrate. On the other hand,if most of the denitrification occurs in sediments ( fw ! 0)with little fractionation, the d15N ratio of the nitrate loss willbe closer to that of mean ocean nitrate, so the d15N of oceanicnitrate will be low (approaching the input ratio, Ra).[16] Brandes and Devol [2002] have compiled a N
isotope budget for the Holocene ocean. They estimate thatadditional N sources from atmospheric deposition and riverstogether are isotopically similar to N2 fixation, while theadditional sink due to organic N burial is isotopicallysimilar to mean ocean nitrate (and in this way similar tosediment denitrification). Therefore these additional smallerbudget terms do not significantly alter the conclusion basedon N2 fixation and denitrification alone that fw is thedominant control on mean ocean nitrate d15N.[17] However, this homogeneous model of the mean d15N
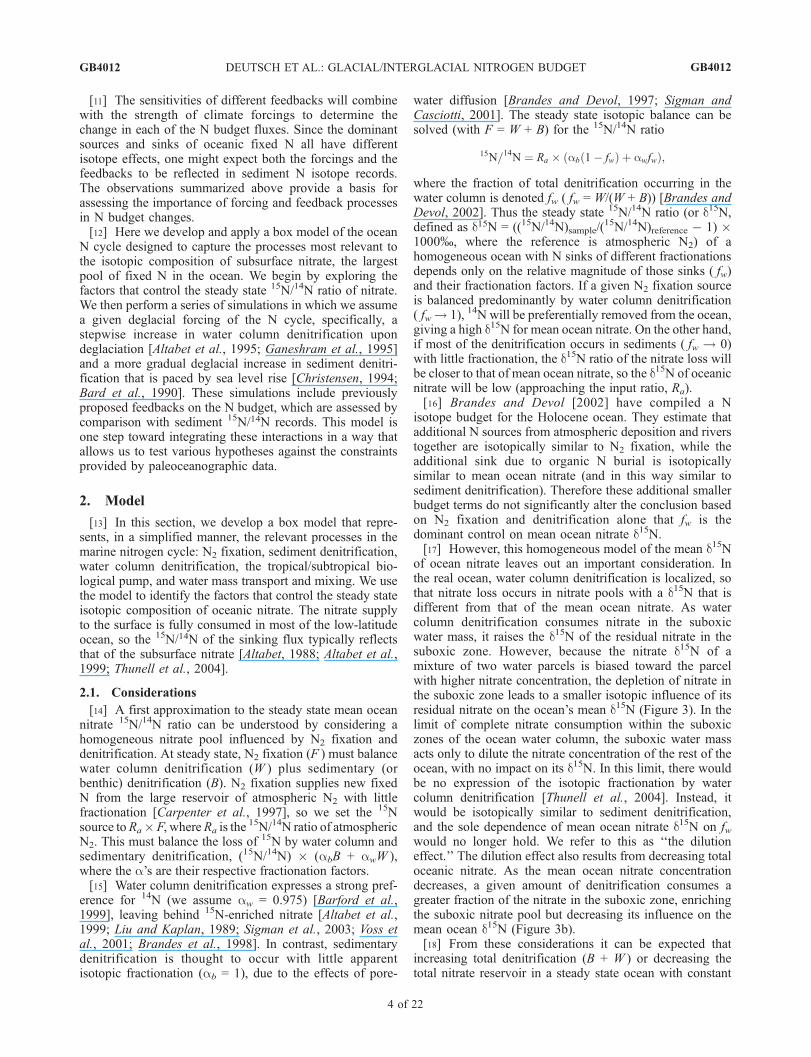
of ocean nitrate leaves out an important consideration. Inthe real ocean, water column denitrification is localized, sothat nitrate loss occurs in nitrate pools with a d15N that isdifferent from that of the mean ocean nitrate. As watercolumn denitrification consumes nitrate in the suboxicwater mass, it raises the d15N of the residual nitrate in thesuboxic zone. However, because the nitrate d15N of amixture of two water parcels is biased toward the parcelwith higher nitrate concentration, the depletion of nitrate inthe suboxic zone leads to a smaller isotopic influence of itsresidual nitrate on the ocean’s mean d15N (Figure 3). In thelimit of complete nitrate consumption within the suboxiczones of the ocean water column, the suboxic water massacts only to dilute the nitrate concentration of the rest of theocean, with no impact on its d15N. In this limit, there wouldbe no expression of the isotopic fractionation by watercolumn denitrification [Thunell et al., 2004]. Instead, itwould be isotopically similar to sediment denitrification,and the sole dependence of mean ocean nitrate d15N on fwwould no longer hold. We refer to this as ‘‘the dilutioneffect.’’ The dilution effect also results from decreasing totaloceanic nitrate. As the mean ocean nitrate concentrationdecreases, a given amount of denitrification consumes agreater fraction of the nitrate in the suboxic zone, enrichingthe suboxic nitrate pool but decreasing its influence on themean ocean d15N (Figure 3b).[18] From these considerations it can be expected that
increasing total denitrification (B + W ) or decreasing thetotal nitrate reservoir in a steady state ocean with constant
GB4012 DEUTSCH ET AL.: GLACIAL/INTERGLACIAL NITROGEN BUDGET
4 of 22
GB4012
fw will increase the d15N of the suboxic zone while decreas-ing the d15N of the mean ocean nitrate pool. That is, for agiven fw, increased fractional nitrate consumption in thesuboxic zone leads to greater nitrate 15N-enrichment in thatzone while reducing the 15N-enrichment of mean oceannitrate (Figure 3). In order to make reliable use of sedimentrecords from both oxic and suboxic regions of the ocean, wetherefore require a model that accounts for this spatialstructure.
2.2. Model Structure
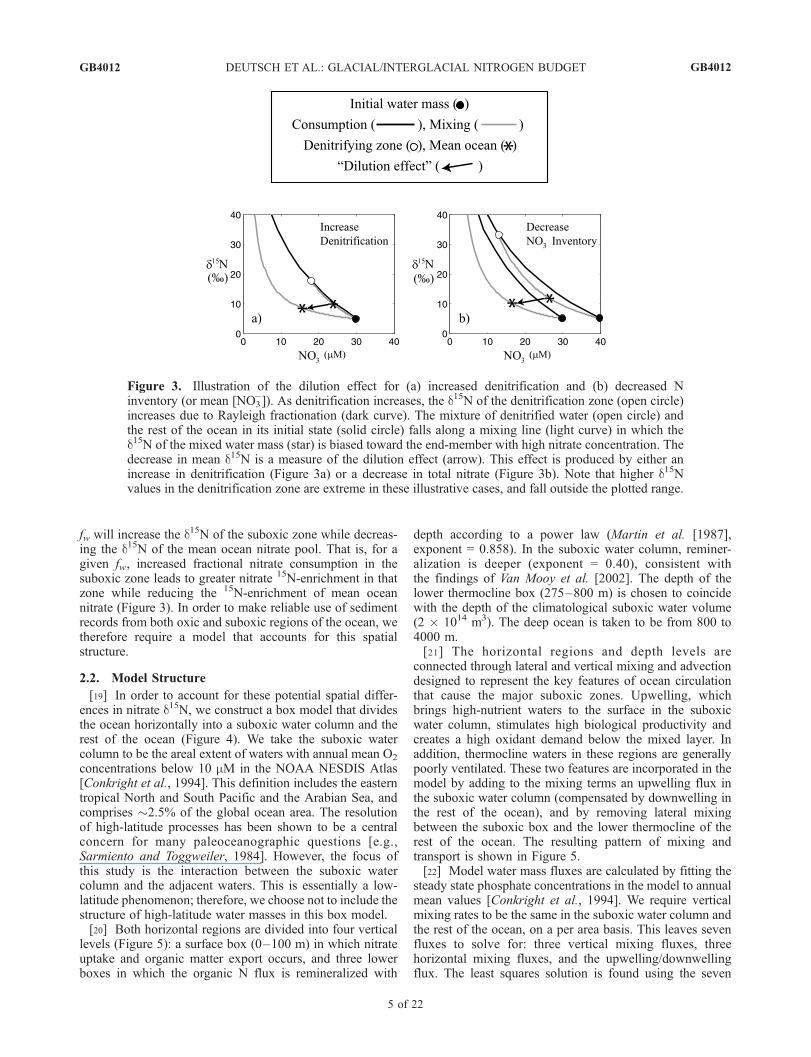
[19] In order to account for these potential spatial differ-ences in nitrate d15N, we construct a box model that dividesthe ocean horizontally into a suboxic water column and therest of the ocean (Figure 4). We take the suboxic watercolumn to be the areal extent of waters with annual mean O2
concentrations below 10 mM in the NOAA NESDIS Atlas[Conkright et al., 1994]. This definition includes the easterntropical North and South Pacific and the Arabian Sea, andcomprises �2.5% of the global ocean area. The resolutionof high-latitude processes has been shown to be a centralconcern for many paleoceanographic questions [e.g.,Sarmiento and Toggweiler, 1984]. However, the focus ofthis study is the interaction between the suboxic watercolumn and the adjacent waters. This is essentially a low-latitude phenomenon; therefore, we choose not to include thestructure of high-latitude water masses in this box model.[20] Both horizontal regions are divided into four vertical
levels (Figure 5): a surface box (0–100 m) in which nitrateuptake and organic matter export occurs, and three lowerboxes in which the organic N flux is remineralized with
depth according to a power law (Martin et al. [1987],exponent = 0.858). In the suboxic water column, reminer-alization is deeper (exponent = 0.40), consistent withthe findings of Van Mooy et al. [2002]. The depth of thelower thermocline box (275–800 m) is chosen to coincidewith the depth of the climatological suboxic water volume(2 � 1014 m3). The deep ocean is taken to be from 800 to4000 m.[21] The horizontal regions and depth levels are
connected through lateral and vertical mixing and advectiondesigned to represent the key features of ocean circulationthat cause the major suboxic zones. Upwelling, whichbrings high-nutrient waters to the surface in the suboxicwater column, stimulates high biological productivity andcreates a high oxidant demand below the mixed layer. Inaddition, thermocline waters in these regions are generallypoorly ventilated. These two features are incorporated in themodel by adding to the mixing terms an upwelling flux inthe suboxic water column (compensated by downwelling inthe rest of the ocean), and by removing lateral mixingbetween the suboxic box and the lower thermocline of therest of the ocean. The resulting pattern of mixing andtransport is shown in Figure 5.[22] Model water mass fluxes are calculated by fitting the
steady state phosphate concentrations in the model to annualmean values [Conkright et al., 1994]. We require verticalmixing rates to be the same in the suboxic water column andthe rest of the ocean, on a per area basis. This leaves sevenfluxes to solve for: three vertical mixing fluxes, threehorizontal mixing fluxes, and the upwelling/downwellingflux. The least squares solution is found using the seven
Figure 3. Illustration of the dilution effect for (a) increased denitrification and (b) decreased Ninventory (or mean [NO3
�]). As denitrification increases, the d15N of the denitrification zone (open circle)increases due to Rayleigh fractionation (dark curve). The mixture of denitrified water (open circle) andthe rest of the ocean in its initial state (solid circle) falls along a mixing line (light curve) in which thed15N of the mixed water mass (star) is biased toward the end-member with high nitrate concentration. Thedecrease in mean d15N is a measure of the dilution effect (arrow). This effect is produced by either anincrease in denitrification (Figure 3a) or a decrease in total nitrate (Figure 3b). Note that higher d15Nvalues in the denitrification zone are extreme in these illustrative cases, and fall outside the plotted range.
GB4012 DEUTSCH ET AL.: GLACIAL/INTERGLACIAL NITROGEN BUDGET
5 of 22
GB4012
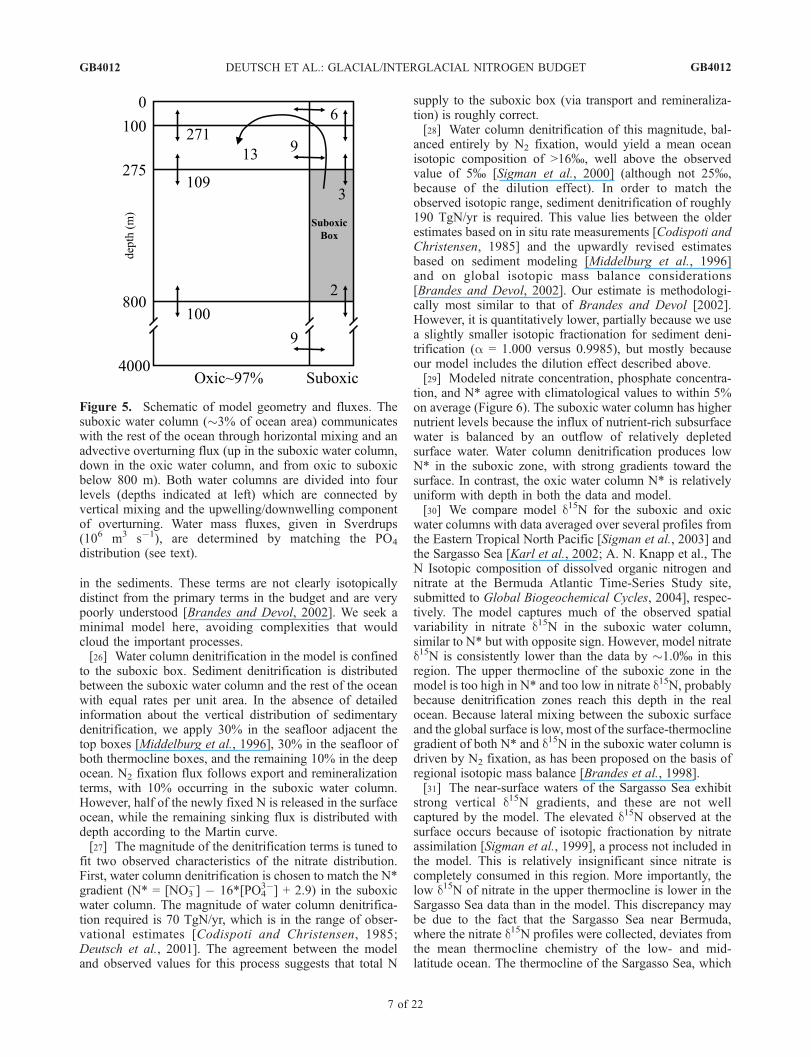
linearly independent box conservation equations (the eighthis not independent since it can be derived from total massconservation).[23] Export production is specified in the inverse solution.
On the basis of GCM results, we specify a global organicmatter export of 10 GtC/yr, with �10% occurring in thesuboxic water column (about 4 times the areal mean exportflux). The resulting vertical and horizontal mixing are highin near-surface waters, decreasing with depth (Figure 5). Aswith most box models, the magnitude of subsurface verticalmixing required to sustain a realistic export flux is quitehigh [Matsumoto et al., 2002]. We could have choseninstead to require more realistic (lower) mixing and trans-port fluxes, at the expense of a realistic export flux. Thischoice changes only the absolute magnitudes of massfluxes, not their relative magnitudes. We chose to have arealistic export flux because this will determine the absolutevalues of the N source/sink terms, which we wish tocompare with other estimates.[24] On the basis of these mass fluxes, the forward model
can be written as a set of equations for N (nitrate), P(phosphate), and 15N (15N-labelled nitrate). In the ith box,
dPi=dt ¼ �Prod Pið Þ þ Remin Pið Þ þ Circ Pið Þ;
dNi=dt ¼ �Prod Nið Þ þ Remin Nið Þ þ Circ Nið Þ þ Fi �Wi � Bi;
d15Ni=dt ¼ �Prod 15Ni
� �þ Remin 15Ni
� �þ Circ 15Ni
� �þ af RaFi
� awRiWi � abRiBi;
where ‘‘Prod’’ is the uptake of each component bybiological production, ‘‘Remin’’ is the release of eachcomponent by organic matter remineralization, and ‘‘Circ’’is the redistribution of each component due to oceancirculation. The sources and sinks of fixed N are denoted F(N2 fixation), W (water column denitrification), and B(sediment, or ‘‘benthic,’’ denitrification). The corresponding15N terms are multiplied by the 15N/14N ratio (R) of thesource pool, as well as the isotope fractionation factors, a.We assume that N2 fixation adds nitrate with the 15N/14Nratio of air (Ra) without fractionation (af = 1.0) [Carpenteret al., 1997]. In each box, denitrification removes nitratewith the local isotope ratio (Ri) modified by no isotopefractionation in the sediments (ab = 1) [Brandes and Devol,1997] and 25% in the water column (aw = 0.975) [Barfordet al., 1999]. In the forward model, export production iscalculated by restoring surface phosphate concentrationtoward annual mean observations. Production and reminer-alization fluxes of nitrate are calculated as 16 timesphosphate fluxes.[25] We neglect smaller terms in the N budget, such as
atmospheric and riverine sources and the sink due to burial
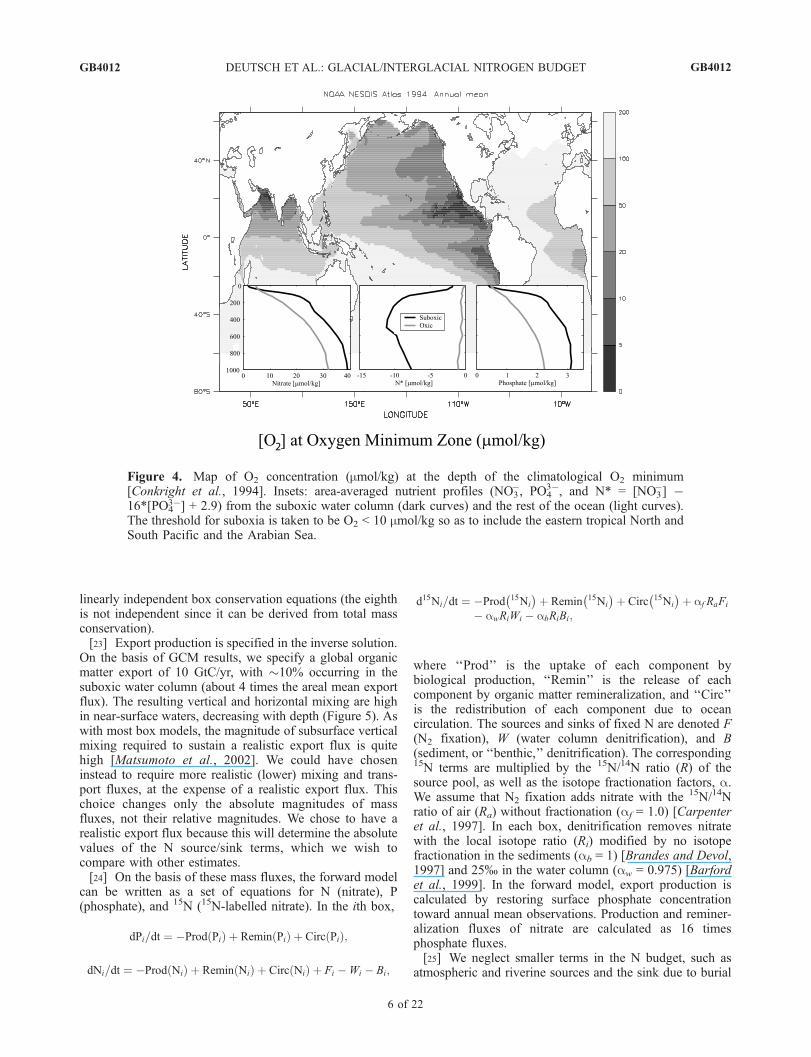
Figure 4. Map of O2 concentration (mmol/kg) at the depth of the climatological O2 minimum[Conkright et al., 1994]. Insets: area-averaged nutrient profiles (NO3
�, PO43�, and N* = [NO3
�] �16*[PO4
3�] + 2.9) from the suboxic water column (dark curves) and the rest of the ocean (light curves).The threshold for suboxia is taken to be O2 < 10 mmol/kg so as to include the eastern tropical North andSouth Pacific and the Arabian Sea.
GB4012 DEUTSCH ET AL.: GLACIAL/INTERGLACIAL NITROGEN BUDGET
6 of 22
GB4012
in the sediments. These terms are not clearly isotopicallydistinct from the primary terms in the budget and are verypoorly understood [Brandes and Devol, 2002]. We seek aminimal model here, avoiding complexities that wouldcloud the important processes.[26] Water column denitrification in the model is confined
to the suboxic box. Sediment denitrification is distributedbetween the suboxic water column and the rest of the oceanwith equal rates per unit area. In the absence of detailedinformation about the vertical distribution of sedimentarydenitrification, we apply 30% in the seafloor adjacent thetop boxes [Middelburg et al., 1996], 30% in the seafloor ofboth thermocline boxes, and the remaining 10% in the deepocean. N2 fixation flux follows export and remineralizationterms, with 10% occurring in the suboxic water column.However, half of the newly fixed N is released in the surfaceocean, while the remaining sinking flux is distributed withdepth according to the Martin curve.[27] The magnitude of the denitrification terms is tuned to
fit two observed characteristics of the nitrate distribution.First, water column denitrification is chosen to match the N*gradient (N* = [NO3
�] � 16*[PO43�] + 2.9) in the suboxic
water column. The magnitude of water column denitrifica-tion required is 70 TgN/yr, which is in the range of obser-vational estimates [Codispoti and Christensen, 1985;Deutsch et al., 2001]. The agreement between the modeland observed values for this process suggests that total N
supply to the suboxic box (via transport and remineraliza-tion) is roughly correct.[28] Water column denitrification of this magnitude, bal-
anced entirely by N2 fixation, would yield a mean oceanisotopic composition of >16%, well above the observedvalue of 5% [Sigman et al., 2000] (although not 25%,because of the dilution effect). In order to match theobserved isotopic range, sediment denitrification of roughly190 TgN/yr is required. This value lies between the olderestimates based on in situ rate measurements [Codispoti andChristensen, 1985] and the upwardly revised estimatesbased on sediment modeling [Middelburg et al., 1996]and on global isotopic mass balance considerations[Brandes and Devol, 2002]. Our estimate is methodologi-cally most similar to that of Brandes and Devol [2002].However, it is quantitatively lower, partially because we usea slightly smaller isotopic fractionation for sediment deni-trification (a = 1.000 versus 0.9985), but mostly becauseour model includes the dilution effect described above.[29] Modeled nitrate concentration, phosphate concentra-
tion, and N* agree with climatological values to within 5%on average (Figure 6). The suboxic water column has highernutrient levels because the influx of nutrient-rich subsurfacewater is balanced by an outflow of relatively depletedsurface water. Water column denitrification produces lowN* in the suboxic zone, with strong gradients toward thesurface. In contrast, the oxic water column N* is relativelyuniform with depth in both the data and model.[30] We compare model d15N for the suboxic and oxic
water columns with data averaged over several profiles fromthe Eastern Tropical North Pacific [Sigman et al., 2003] andthe Sargasso Sea [Karl et al., 2002; A. N. Knapp et al., TheN Isotopic composition of dissolved organic nitrogen andnitrate at the Bermuda Atlantic Time-Series Study site,submitted to Global Biogeochemical Cycles, 2004], respec-tively. The model captures much of the observed spatialvariability in nitrate d15N in the suboxic water column,similar to N* but with opposite sign. However, model nitrated15N is consistently lower than the data by �1.0% in thisregion. The upper thermocline of the suboxic zone in themodel is too high in N* and too low in nitrate d15N, probablybecause denitrification zones reach this depth in the realocean. Because lateral mixing between the suboxic surfaceand the global surface is low, most of the surface-thermoclinegradient of both N* and d15N in the suboxic water column isdriven by N2 fixation, as has been proposed on the basis ofregional isotopic mass balance [Brandes et al., 1998].[31] The near-surface waters of the Sargasso Sea exhibit
strong vertical d15N gradients, and these are not wellcaptured by the model. The elevated d15N observed at thesurface occurs because of isotopic fractionation by nitrateassimilation [Sigman et al., 1999], a process not included inthe model. This is relatively insignificant since nitrate iscompletely consumed in this region. More importantly, thelow d15N of nitrate in the upper thermocline is lower in theSargasso Sea data than in the model. This discrepancy maybe due to the fact that the Sargasso Sea near Bermuda,where the nitrate d15N profiles were collected, deviates fromthe mean thermocline chemistry of the low- and mid-latitude ocean. The thermocline of the Sargasso Sea, which
Figure 5. Schematic of model geometry and fluxes. Thesuboxic water column (�3% of ocean area) communicateswith the rest of the ocean through horizontal mixing and anadvective overturning flux (up in the suboxic water column,down in the oxic water column, and from oxic to suboxicbelow 800 m). Both water columns are divided into fourlevels (depths indicated at left) which are connected byvertical mixing and the upwelling/downwelling componentof overturning. Water mass fluxes, given in Sverdrups(106 m3 s�1), are determined by matching the PO4
distribution (see text).
GB4012 DEUTSCH ET AL.: GLACIAL/INTERGLACIAL NITROGEN BUDGET
7 of 22
GB4012
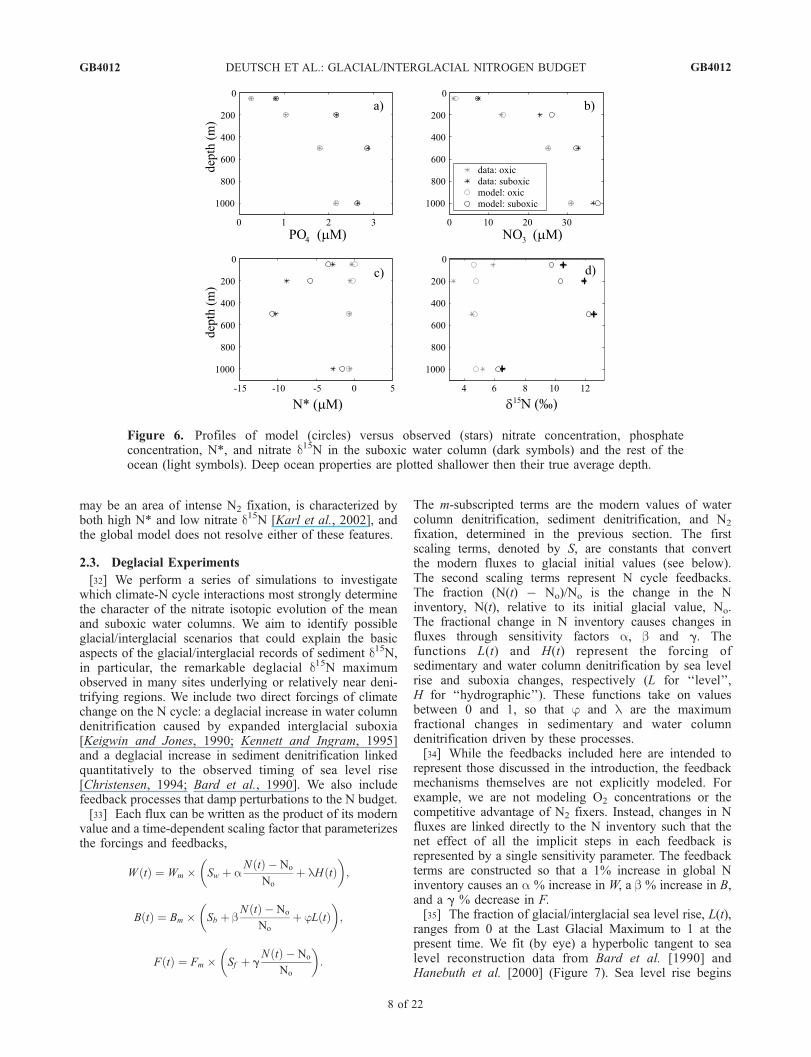
may be an area of intense N2 fixation, is characterized byboth high N* and low nitrate d15N [Karl et al., 2002], andthe global model does not resolve either of these features.
2.3. Deglacial Experiments
[32] We perform a series of simulations to investigatewhich climate-N cycle interactions most strongly determinethe character of the nitrate isotopic evolution of the meanand suboxic water columns. We aim to identify possibleglacial/interglacial scenarios that could explain the basicaspects of the glacial/interglacial records of sediment d15N,in particular, the remarkable deglacial d15N maximumobserved in many sites underlying or relatively near deni-trifying regions. We include two direct forcings of climatechange on the N cycle: a deglacial increase in water columndenitrification caused by expanded interglacial suboxia[Keigwin and Jones, 1990; Kennett and Ingram, 1995]and a deglacial increase in sediment denitrification linkedquantitatively to the observed timing of sea level rise[Christensen, 1994; Bard et al., 1990]. We also includefeedback processes that damp perturbations to the N budget.[33] Each flux can be written as the product of its modern
value and a time-dependent scaling factor that parameterizesthe forcings and feedbacks,
W tð Þ ¼ Wm � Sw þ aN tð Þ � No
No
þ lH tð Þ� �
;
B tð Þ ¼ Bm � Sb þ bN tð Þ � No
No
þ jL tð Þ� �
;
F tð Þ ¼ Fm � Sf þ gN tð Þ � No
No
� �:
The m-subscripted terms are the modern values of watercolumn denitrification, sediment denitrification, and N2
fixation, determined in the previous section. The firstscaling terms, denoted by S, are constants that convertthe modern fluxes to glacial initial values (see below).The second scaling terms represent N cycle feedbacks.The fraction (N(t) � No)/No is the change in the Ninventory, N(t), relative to its initial glacial value, No.The fractional change in N inventory causes changes influxes through sensitivity factors a, b and g. Thefunctions L(t) and H(t) represent the forcing ofsedimentary and water column denitrification by sea levelrise and suboxia changes, respectively (L for ‘‘level’’,H for ‘‘hydrographic’’). These functions take on valuesbetween 0 and 1, so that j and l are the maximumfractional changes in sedimentary and water columndenitrification driven by these processes.[34] While the feedbacks included here are intended to
represent those discussed in the introduction, the feedbackmechanisms themselves are not explicitly modeled. Forexample, we are not modeling O2 concentrations or thecompetitive advantage of N2 fixers. Instead, changes in Nfluxes are linked directly to the N inventory such that thenet effect of all the implicit steps in each feedback isrepresented by a single sensitivity parameter. The feedbackterms are constructed so that a 1% increase in global Ninventory causes an a % increase in W, a b % increase in B,and a g % decrease in F.[35] The fraction of glacial/interglacial sea level rise, L(t),
ranges from 0 at the Last Glacial Maximum to 1 at thepresent time. We fit (by eye) a hyperbolic tangent to sealevel reconstruction data from Bard et al. [1990] andHanebuth et al. [2000] (Figure 7). Sea level rise begins
Figure 6. Profiles of model (circles) versus observed (stars) nitrate concentration, phosphateconcentration, N*, and nitrate d15N in the suboxic water column (dark symbols) and the rest of theocean (light symbols). Deep ocean properties are plotted shallower then their true average depth.
GB4012 DEUTSCH ET AL.: GLACIAL/INTERGLACIAL NITROGEN BUDGET
8 of 22
GB4012
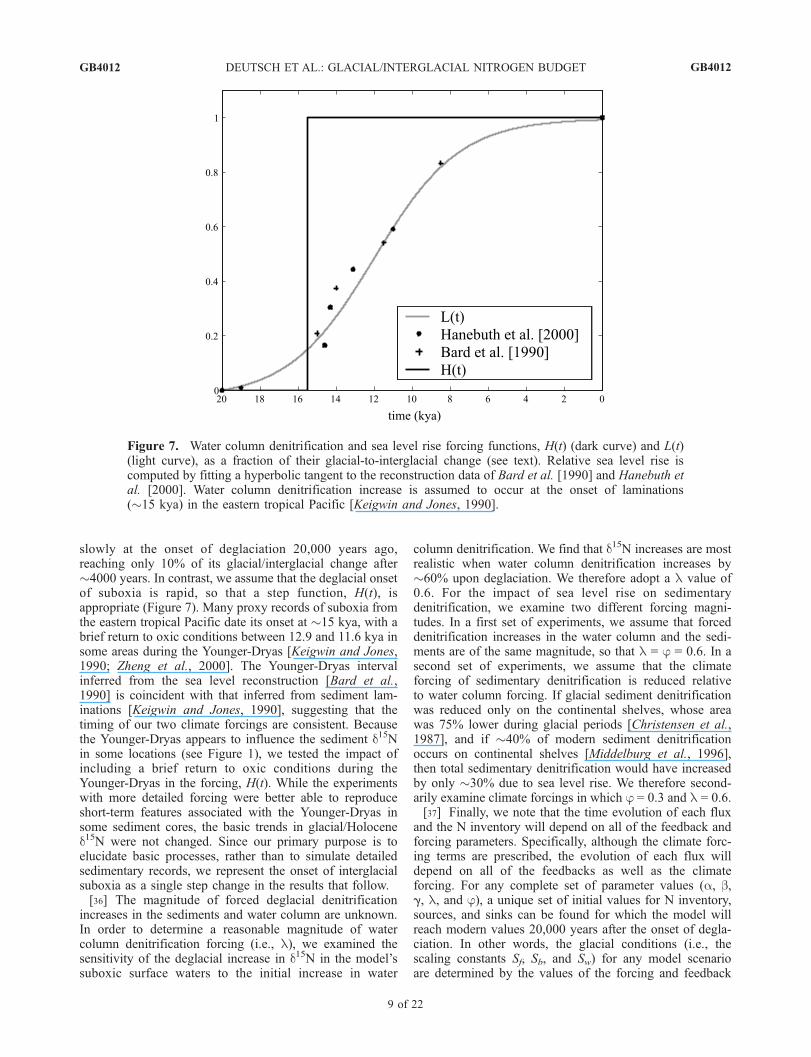
slowly at the onset of deglaciation 20,000 years ago,reaching only 10% of its glacial/interglacial change after�4000 years. In contrast, we assume that the deglacial onsetof suboxia is rapid, so that a step function, H(t), isappropriate (Figure 7). Many proxy records of suboxia fromthe eastern tropical Pacific date its onset at �15 kya, with abrief return to oxic conditions between 12.9 and 11.6 kya insome areas during the Younger-Dryas [Keigwin and Jones,1990; Zheng et al., 2000]. The Younger-Dryas intervalinferred from the sea level reconstruction [Bard et al.,1990] is coincident with that inferred from sediment lam-inations [Keigwin and Jones, 1990], suggesting that thetiming of our two climate forcings are consistent. Becausethe Younger-Dryas appears to influence the sediment d15Nin some locations (see Figure 1), we tested the impact ofincluding a brief return to oxic conditions during theYounger-Dryas in the forcing, H(t). While the experimentswith more detailed forcing were better able to reproduceshort-term features associated with the Younger-Dryas insome sediment cores, the basic trends in glacial/Holocened15N were not changed. Since our primary purpose is toelucidate basic processes, rather than to simulate detailedsedimentary records, we represent the onset of interglacialsuboxia as a single step change in the results that follow.[36] The magnitude of forced deglacial denitrification
increases in the sediments and water column are unknown.In order to determine a reasonable magnitude of watercolumn denitrification forcing (i.e., l), we examined thesensitivity of the deglacial increase in d15N in the model’ssuboxic surface waters to the initial increase in water
column denitrification. We find that d15N increases are mostrealistic when water column denitrification increases by�60% upon deglaciation. We therefore adopt a l value of0.6. For the impact of sea level rise on sedimentarydenitrification, we examine two different forcing magni-tudes. In a first set of experiments, we assume that forceddenitrification increases in the water column and the sedi-ments are of the same magnitude, so that l = j = 0.6. In asecond set of experiments, we assume that the climateforcing of sedimentary denitrification is reduced relativeto water column forcing. If glacial sediment denitrificationwas reduced only on the continental shelves, whose areawas 75% lower during glacial periods [Christensen et al.,1987], and if �40% of modern sediment denitrificationoccurs on continental shelves [Middelburg et al., 1996],then total sedimentary denitrification would have increasedby only �30% due to sea level rise. We therefore second-arily examine climate forcings in which j = 0.3 and l = 0.6.[37] Finally, we note that the time evolution of each flux
and the N inventory will depend on all of the feedback andforcing parameters. Specifically, although the climate forc-ing terms are prescribed, the evolution of each flux willdepend on all of the feedbacks as well as the climateforcing. For any complete set of parameter values (a, b,g, l, and j), a unique set of initial values for N inventory,sources, and sinks can be found for which the model willreach modern values 20,000 years after the onset of degla-ciation. In other words, the glacial conditions (i.e., thescaling constants Sf, Sb, and Sw) for any model scenarioare determined by the values of the forcing and feedback
Figure 7. Water column denitrification and sea level rise forcing functions, H(t) (dark curve) and L(t)(light curve), as a fraction of their glacial-to-interglacial change (see text). Relative sea level rise iscomputed by fitting a hyperbolic tangent to the reconstruction data of Bard et al. [1990] and Hanebuth etal. [2000]. Water column denitrification increase is assumed to occur at the onset of laminations(�15 kya) in the eastern tropical Pacific [Keigwin and Jones, 1990].
GB4012 DEUTSCH ET AL.: GLACIAL/INTERGLACIAL NITROGEN BUDGET
9 of 22
GB4012
parameters. We perform simulations of the glacial/intergla-cial transition for all combinations of sensitivity parameterswith values 0 (no feedback), 1 (weak feedback), and 9(strong feedback).
3. Results
3.1. Controls on Ocean Nitrate D15N at Steady State
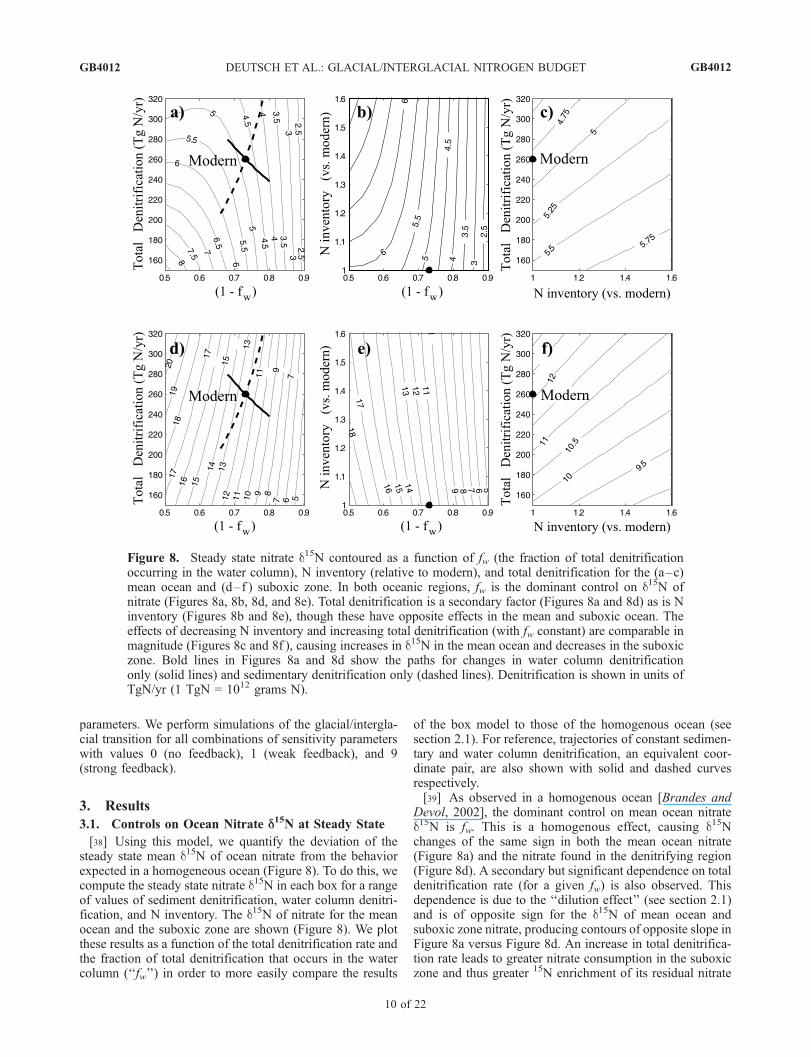
[38] Using this model, we quantify the deviation of thesteady state mean d15N of ocean nitrate from the behaviorexpected in a homogeneous ocean (Figure 8). To do this, wecompute the steady state nitrate d15N in each box for a rangeof values of sediment denitrification, water column denitri-fication, and N inventory. The d15N of nitrate for the meanocean and the suboxic zone are shown (Figure 8). We plotthese results as a function of the total denitrification rate andthe fraction of total denitrification that occurs in the watercolumn (‘‘fw’’) in order to more easily compare the results
of the box model to those of the homogenous ocean (seesection 2.1). For reference, trajectories of constant sedimen-tary and water column denitrification, an equivalent coor-dinate pair, are also shown with solid and dashed curvesrespectively.[39] As observed in a homogenous ocean [Brandes and
Devol, 2002], the dominant control on mean ocean nitrated15N is fw. This is a homogenous effect, causing d15Nchanges of the same sign in both the mean ocean nitrate(Figure 8a) and the nitrate found in the denitrifying region(Figure 8d). A secondary but significant dependence on totaldenitrification rate (for a given fw) is also observed. Thisdependence is due to the ‘‘dilution effect’’ (see section 2.1)and is of opposite sign for the d15N of mean ocean andsuboxic zone nitrate, producing contours of opposite slope inFigure 8a versus Figure 8d. An increase in total denitrifica-tion rate leads to greater nitrate consumption in the suboxiczone and thus greater 15N enrichment of its residual nitrate
Figure 8. Steady state nitrate d15N contoured as a function of fw (the fraction of total denitrificationoccurring in the water column), N inventory (relative to modern), and total denitrification for the (a–c)mean ocean and (d–f ) suboxic zone. In both oceanic regions, fw is the dominant control on d15N ofnitrate (Figures 8a, 8b, 8d, and 8e). Total denitrification is a secondary factor (Figures 8a and 8d) as is Ninventory (Figures 8b and 8e), though these have opposite effects in the mean and suboxic ocean. Theeffects of decreasing N inventory and increasing total denitrification (with fw constant) are comparable inmagnitude (Figures 8c and 8f ), causing increases in d15N in the mean ocean and decreases in the suboxiczone. Bold lines in Figures 8a and 8d show the paths for changes in water column denitrificationonly (solid lines) and sedimentary denitrification only (dashed lines). Denitrification is shown in units ofTgN/yr (1 TgN = 1012 grams N).
GB4012 DEUTSCH ET AL.: GLACIAL/INTERGLACIAL NITROGEN BUDGET
10 of 22
GB4012
(Figure 8d). However, the higher degree of nitrate consump-tion in the suboxic zone means that the nitrate mixing out ofthat region has less impact on the mean ocean nitrate d15N, sothat increasing the denitrification rate (in steady state) causesa decrease in mean ocean nitrate d15N (Figure 8a). The effectof increasing water column denitrification alone can be seenby following the (solid) line of constant sedimentary deni-trification toward the upper left. As water column denitrifi-cation increases, the d15N of mean ocean nitrate alsoincreases, due to the 15N enrichment. However, since thesuboxic zone nitrate consumption is greater at higher watercolumn denitrification rates, the dilution effect becomesstronger, and further increases in water column denitrifica-tion eventually begin to lower the mean ocean nitrate d15N.[40] There is a related secondary dependence on the mean
ocean nitrate, again due to the dilution effect. With morenitrate in the ocean, a given denitrification rate consumes asmaller fraction of the nitrate that is transported into thesuboxic region, leading to less 15N enrichment of suboxiczone nitrate (Figure 8e). In the mean ocean, however, thiscauses the suboxic zone nitrate to make a greater contribu-tion, so that mean ocean nitrate d15N is higher for a largernitrate reservoir, approaching the solution for a homogenousocean (Figure 8b). Nitrate inventory and total denitrificationchanges of the same relative magnitude elicit the dilutioneffect nearly equally (Figure 8c).[41] While the influence of the dilution effect on mean
ocean d15N is modest compared to fw, the dilution effect hastwo important implications. First, equilibrium changes in Ninventory and/or total denitrification flux (with fw constant)of �50% are capable of causing changes in the d15N of thesuboxic zone and mean ocean nitrate of >2% and >0.5%,respectively (Figures 8c and 8f ). Isotopic changes of thesemagnitudes are significant in comparison to observedchanges, so that the dilution effect should be accountedfor when considering glacial/interglacial changes in the Nbudget. For example, a glacial ocean with the same averagenitrate d15N as the modern ocean [Kienast, 2000] but witha 30% higher mean nitrate and a 30% lower total denitri-fication rate would require a 10% lower fw .[42] Second, for a given magnitude of water column
denitrification, small changes in fw (when fw < 0.5) implylarge changes in sedimentary denitrification (Figure 8a,dashed line). In the homogeneous approximation, a meanocean d15N of 5% implies that 80% of denitrification occursin the water column. The dilution effect reduces this valueonly slightly, to �70%, but the accompanying change insedimentary denitrification is large, �90 TgN/yr. Thisexplains why our estimate for sedimentary denitrificationis lower than that of Brandes and Devol [2002].
3.2. Deglaciation Experiments
[43] In the deglacial experiments, the transient evolutionof nitrate d15N has two components. The first componentarises from changes in the steady state isotopic composition.As the factors that control the steady state isotopic compo-sition change, the d15N of the ocean changes in response.According to the steady state theory, this will occur bychanging (1) the ratio of water column to sediment denitri-fication (‘‘fw’’), (2) the size of the oceanic nitrate reservoir,
or (3) the total denitrification rate (see section 3.1). Giventhe dominance of fw in governing the steady state d15N ofnitrate, it can be expected that a transient deglacial maxi-mum in fw will tend to produce a deglacial d15N maximum.The forcing adopted here, which includes a delay betweenincreased water column denitrification (an fw increase) andthe bulk of sea level rise (an fw decrease), contributes to anfw maximum, and is therefore an important driver of a d15Nmaximum. However, the full isotopic response is alsodetermined by the strength of the feedbacks, through boththeir ability to modify the evolution of fw and their influenceon changes in total nitrate and denitrification (i.e., thedilution effect).[44] Second, d15N changes are also caused by imbalances
in the N budget. N2 fixation adds nitrate with a low 15N/14Nratio, so that an excess of this source causes mean oceannitrate d15N to decrease, while an excess of denitrificationpreferentially consumes 14N, raising the mean ocean nitrated15N. The deglaciation scenarios presented here all involvetemporary imbalances in the N budget, in which deglacialclimate forcing induces an excess of denitrification that issubsequently compensated by an increase in N2 fixation,and/or a decrease in denitrification. While these temporaryN budget imbalances contribute to isotopic changes, theevolution of mean ocean and suboxic nitrate d15N in each ofthese experiments can be understood largely on the basis ofthe factors controlling the steady state isotopic composition.[45] For each scenario, an overall feedback strength may
be defined as a weighted sum of the feedback sensitivities(aW + bB + gF ). For a given forcing of the N budget, theglacial-to-interglacial nitrate loss depends on the overallfeedback strength. The greater the overall feedback strengthin the experiment, the smaller the deglacial decrease in thenitrate reservoir. Since changes in the nitrate reservoir areone of the factors controlling steady state nitrate d15N, wedivide our results into scenarios with weak and strongoverall feedback strengths.3.2.1. Deglacial Experiments With Equal Forcingsand Weak Feedbacks[46] Figure 9 includes five scenarios with equal denitrifi-
cation forcings (f = l = 0.6), and weak overall feedbackstrength. In each scenario, each feedback is either inopera-tive, with a sensitivity parameter (a, b, or g) of 0, or weaklyoperative with a sensitivity parameter of 1. The simulationsinclude one scenario with all feedbacks weakly operativea = b = g = 1), three scenarios with two feedbacks on andone feedback off, and a fifth scenario with N2 fixationfeedback only (a = b = 0, g = 1).[47] In scenarios with a water column denitrification
feedback, the water column denitrification rate decreasesfrom its maximum at the onset of deglaciation but remainsabove its glacial level through the Holocene (Figure 9c).The difference in water column denitrification between theglacial and Holocene periods depends on the strength ofthe water column denitrification feedback compared to thestrength of the other feedbacks. When there is no feedbackon water column denitrification, there is no decrease inthis flux following the deglacial rise, and the glacial/Holocene difference is largest (equal to the imposed60% forcing). When the water column denitrification feed-
GB4012 DEUTSCH ET AL.: GLACIAL/INTERGLACIAL NITROGEN BUDGET
11 of 22
GB4012
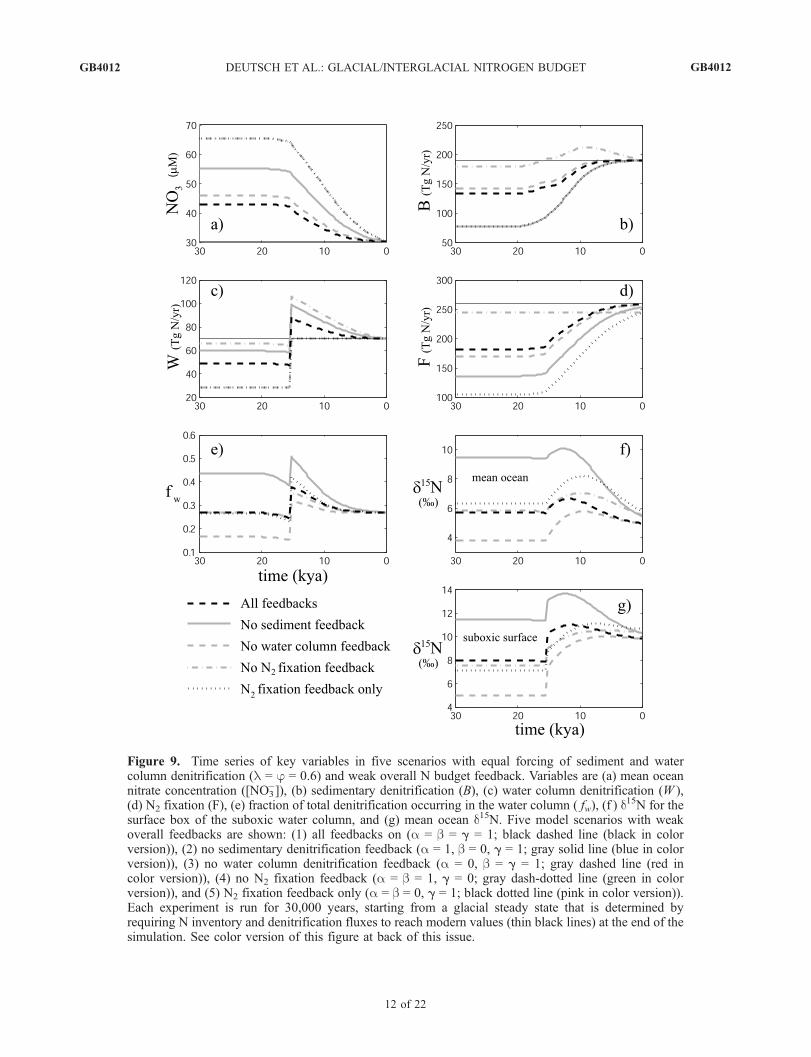
Figure 9. Time series of key variables in five scenarios with equal forcing of sediment and watercolumn denitrification (l = j = 0.6) and weak overall N budget feedback. Variables are (a) mean oceannitrate concentration ([NO3
�]), (b) sedimentary denitrification (B), (c) water column denitrification (W ),(d) N2 fixation (F), (e) fraction of total denitrification occurring in the water column ( fw), (f ) d
15N for thesurface box of the suboxic water column, and (g) mean ocean d15N. Five model scenarios with weakoverall feedbacks are shown: (1) all feedbacks on (a = b = g = 1; black dashed line (black in colorversion)), (2) no sedimentary denitrification feedback (a = 1, b = 0, g = 1; gray solid line (blue in colorversion)), (3) no water column denitrification feedback (a = 0, b = g = 1; gray dashed line (red incolor version)), (4) no N2 fixation feedback (a = b = 1, g = 0; gray dash-dotted line (green in colorversion)), and (5) N2 fixation feedback only (a = b = 0, g = 1; black dotted line (pink in color version)).Each experiment is run for 30,000 years, starting from a glacial steady state that is determined byrequiring N inventory and denitrification fluxes to reach modern values (thin black lines) at the end of thesimulation. See color version of this figure at back of this issue.
GB4012 DEUTSCH ET AL.: GLACIAL/INTERGLACIAL NITROGEN BUDGET
12 of 22
GB4012
back is operative, but overall feedback is weak (no N2
fixation feedback), the decrease in water column denitrifica-tion following deglaciation must be relatively large in orderto stabilize the rapidly decreasing N inventory, and theglacial/Holocene difference is small. N2 fixation increasessteadily, except where the N2 fixation feedback is inoperative(Figure 9d). The increase is most pronounced where theN2 fixation feedback alone responds to the deglacial denitri-fication forcing, leading to the largest glacial/Holocenedifference in this flux.[48] Sediment denitrification shows more complex behav-
ior (Figure 9b). In all cases, there is an initial increase due tosea level rise. For a brief period following the forcedincrease in water column denitrification (�15 kya), thesediment denitrification feedback balances the impact ofsea level rise, and sediment denitrification stabilizes.When there is no N2 fixation response, nitrate losses arestrongly compensated by the denitrification feedbacks,causing both denitrification terms to decrease graduallyduring the Holocene. In this case, the imposed (sea level-paced) sediment denitrification increase is roughly balancedby the sediment denitrification feedback, and the imposeddeglacial increase in water column denitrification is roughlybalanced by its feedback, so that both denitrification fluxesreturn to approximately glacial levels.[49] All experiments show deglacial 15N enrichments
throughout the ocean due to the increase of water columndenitrification (Figures 9f and 9g). The rise in nitrate d15N isstrongest in the suboxic box (4–6%, not shown), decreas-ing away from the denitrifying zone. Increases in suboxiczone nitrate d15N are communicated by vertical mixing andupwelling to the surface of the suboxic water column(Figure 9g), where they would be recorded by the formationand sinking of organic matter to the sediments [Altabet etal., 1999]. Increases in d15N in the surface waters of thesuboxic water column (hereafter ‘‘suboxic surface’’) rangefrom 2 to 5% among the scenarios, with the largestincreases occurring where the overall feedback is weakest(denitrification feedbacks or N2 fixation feedback only).[50] Subsequent to the deglacial d15N rise, all scenarios
also reveal a decline in nitrate d15N throughout the oceanbeginning in the late deglacial or early Holocene. Theamplitude of this decrease varies considerably among thescenarios. The largest decreases in suboxic surface d15Noccur in the scenario without sediment denitrification feed-back (>3%) or when all feedbacks are operative (>1%).The remaining scenarios show minor decreases (<0.5%).The case without sediment denitrification feedback under-goes the strongest deglacial decrease in the fraction of watercolumn denitrification. It also exhibits the largest decreasein suboxic and mean ocean nitrate d15N. Similarly, thescenario without water column denitrification feedbackhas the smallest decline in both fw and nitrate d15N. Whenall feedbacks are operative, the fw and d15N curves liebetween these two extremes. The relative magnitude anddirection of nitrate d15N change in these three scenarios canbe understood simply by considering the evolution of fw.[51] However, the remaining two scenarios, one with the
N2 fixation feedback only and the other with denitrificationfeedbacks only, have very similar fw curves to the case with
all feedbacks, and yet the suboxic d15N time series for thesescenarios differ significantly. In these cases, the Holocened15N decrease in the surface waters of the suboxic watercolumn is very slight (0.1–0.3%), beginning 7–8 kya,whereas in the case with all feedbacks operative, there isa stronger d15N decline (>1%) beginning earlier (�12 kya).The similarity between the fw curves in these scenariosindicates that the significant isotopic differences betweenthem cannot be accounted for by fw alone.[52] The two scenarios which include feedbacks in either
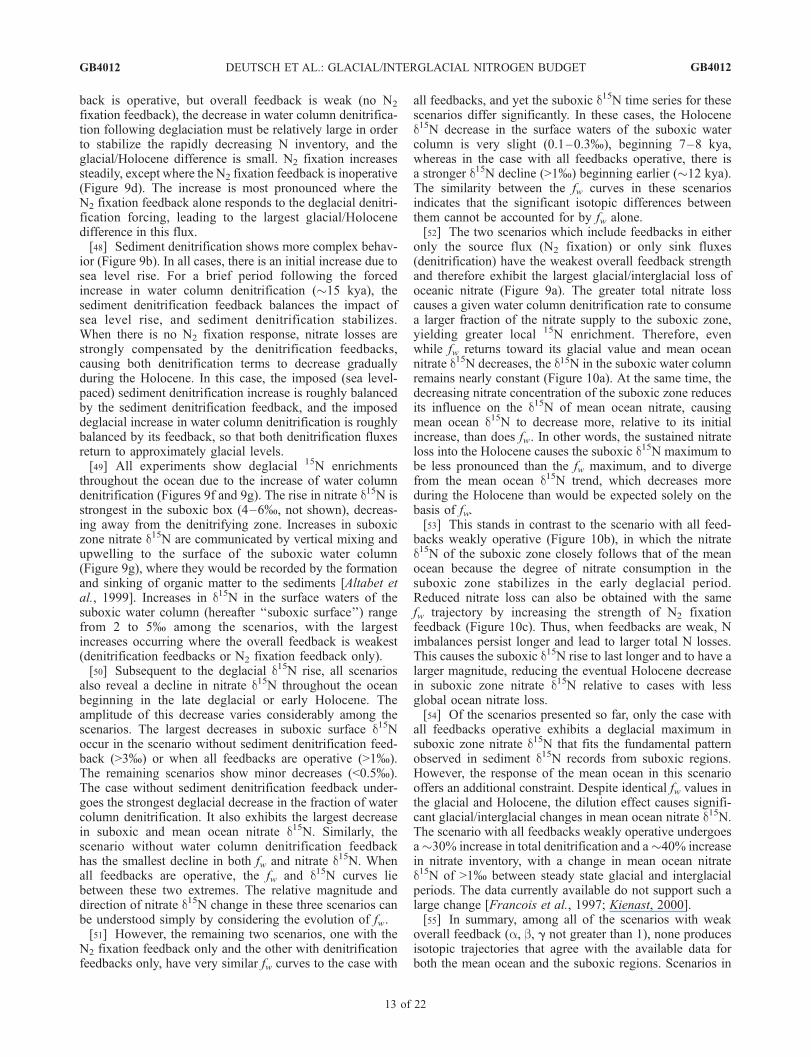
only the source flux (N2 fixation) or only sink fluxes(denitrification) have the weakest overall feedback strengthand therefore exhibit the largest glacial/interglacial loss ofoceanic nitrate (Figure 9a). The greater total nitrate losscauses a given water column denitrification rate to consumea larger fraction of the nitrate supply to the suboxic zone,yielding greater local 15N enrichment. Therefore, evenwhile fw returns toward its glacial value and mean oceannitrate d15N decreases, the d15N in the suboxic water columnremains nearly constant (Figure 10a). At the same time, thedecreasing nitrate concentration of the suboxic zone reducesits influence on the d15N of mean ocean nitrate, causingmean ocean d15N to decrease more, relative to its initialincrease, than does fw. In other words, the sustained nitrateloss into the Holocene causes the suboxic d15N maximum tobe less pronounced than the fw maximum, and to divergefrom the mean ocean d15N trend, which decreases moreduring the Holocene than would be expected solely on thebasis of fw.[53] This stands in contrast to the scenario with all feed-
backs weakly operative (Figure 10b), in which the nitrated15N of the suboxic zone closely follows that of the meanocean because the degree of nitrate consumption in thesuboxic zone stabilizes in the early deglacial period.Reduced nitrate loss can also be obtained with the samefw trajectory by increasing the strength of N2 fixationfeedback (Figure 10c). Thus, when feedbacks are weak, Nimbalances persist longer and lead to larger total N losses.This causes the suboxic d15N rise to last longer and to have alarger magnitude, reducing the eventual Holocene decreasein suboxic zone nitrate d15N relative to cases with lessglobal ocean nitrate loss.[54] Of the scenarios presented so far, only the case with
all feedbacks operative exhibits a deglacial maximum insuboxic zone nitrate d15N that fits the fundamental patternobserved in sediment d15N records from suboxic regions.However, the response of the mean ocean in this scenariooffers an additional constraint. Despite identical fw values inthe glacial and Holocene, the dilution effect causes signifi-cant glacial/interglacial changes in mean ocean nitrate d15N.The scenario with all feedbacks weakly operative undergoesa�30% increase in total denitrification and a�40% increasein nitrate inventory, with a change in mean ocean nitrated15N of >1% between steady state glacial and interglacialperiods. The data currently available do not support such alarge change [Francois et al., 1997; Kienast, 2000].[55] In summary, among all of the scenarios with weak
overall feedback (a, b, g not greater than 1), none producesisotopic trajectories that agree with the available data forboth the mean ocean and the suboxic regions. Scenarios in
GB4012 DEUTSCH ET AL.: GLACIAL/INTERGLACIAL NITROGEN BUDGET
13 of 22
GB4012
which the sensitivities of the sediment and water columndenitrification feedbacks differ, exhibit significant glacial/interglacial differences in fw , causing decreases in suboxiczone and mean ocean d15N that are too large or too smallrelative to observations. When the sediment denitrificationfeedback is off, lower interglacial fw produces too large aHolocene decrease in nitrate d15N. When the water columndenitrification feedback is off, the Holocene fw decrease issmall, resulting in too little d15N decrease. In the scenariosin which both denitrification sensitivities are the same, fwreturns to its glacial value, but because overall feedback isweak, the continued loss of nitrate during the Holocenereduces the degree of Holocene nitrate d15N decline in thesuboxic zone and/or causes too large a decrease in meanocean nitrate d15N through the dilution effect. Thus thescenarios presented above fail to reproduce the basic char-acter of observed d15N trends either because glacial/inter-glacial fw changes are too large, or because the dilutioneffect is too strong due to weak feedbacks.3.2.2. Deglacial Experiments With Equal Forcings andStrong Feedbacks[56] Given the failure of deglacial scenarios with weak
overall feedback, we examine three scenarios with stronger
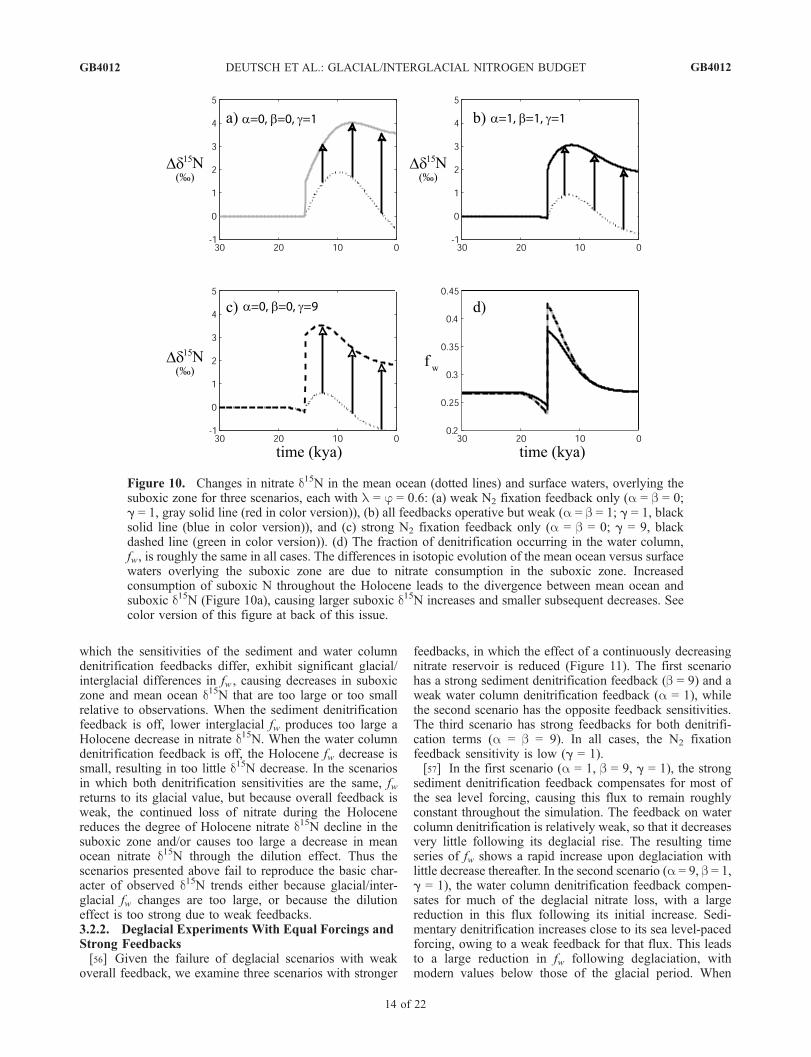
feedbacks, in which the effect of a continuously decreasingnitrate reservoir is reduced (Figure 11). The first scenariohas a strong sediment denitrification feedback (b = 9) and aweak water column denitrification feedback (a = 1), whilethe second scenario has the opposite feedback sensitivities.The third scenario has strong feedbacks for both denitrifi-cation terms (a = b = 9). In all cases, the N2 fixationfeedback sensitivity is low (g = 1).[57] In the first scenario (a = 1, b = 9, g = 1), the strong
sediment denitrification feedback compensates for most ofthe sea level forcing, causing this flux to remain roughlyconstant throughout the simulation. The feedback on watercolumn denitrification is relatively weak, so that it decreasesvery little following its deglacial rise. The resulting timeseries of fw shows a rapid increase upon deglaciation withlittle decrease thereafter. In the second scenario (a = 9, b = 1,g = 1), the water column denitrification feedback compen-sates for much of the deglacial nitrate loss, with a largereduction in this flux following its initial increase. Sedi-mentary denitrification increases close to its sea level-pacedforcing, owing to a weak feedback for that flux. This leadsto a large reduction in fw following deglaciation, withmodern values below those of the glacial period. When
Figure 10. Changes in nitrate d15N in the mean ocean (dotted lines) and surface waters, overlying thesuboxic zone for three scenarios, each with l = j = 0.6: (a) weak N2 fixation feedback only (a = b = 0;g = 1, gray solid line (red in color version)), (b) all feedbacks operative but weak (a = b = 1; g = 1, blacksolid line (blue in color version)), and (c) strong N2 fixation feedback only (a = b = 0; g = 9, blackdashed line (green in color version)). (d) The fraction of denitrification occurring in the water column,fw, is roughly the same in all cases. The differences in isotopic evolution of the mean ocean versus surfacewaters overlying the suboxic zone are due to nitrate consumption in the suboxic zone. Increasedconsumption of suboxic N throughout the Holocene leads to the divergence between mean ocean andsuboxic d15N (Figure 10a), causing larger suboxic d15N increases and smaller subsequent decreases. Seecolor version of this figure at back of this issue.
GB4012 DEUTSCH ET AL.: GLACIAL/INTERGLACIAL NITROGEN BUDGET
14 of 22
GB4012
both denitrification sensitivities are comparably strong (a =9, b = 9, g = 1), the N fluxes and inventories lie betweenthese two extreme cases.[58] The evolution of nitrate d15N in these scenarios
closely resembles the time history of the fraction of deni-trification occurring in the water column. In the firstscenario, this leads to a nearly monotonic increase in nitrated15N in both the mean ocean and suboxic water columns. Inthe second case, both regions show large 15N depletions intothe Holocene, with interglacial nitrate d15N below theglacial values. While the suboxic zone shows a significantd15N maximum, the mean ocean does not. The fw and nitrated15N time series of the third case lie between these twoextremes. The close correspondence between fw and nitrated15N in the scenarios with strong feedback shows thatthe isotopic history primarily reflects changes in the watercolumn fraction of denitrification. This is because, in all
three of these scenarios, glacial/interglacial changes in thenitrate inventory and in total denitrification rate are rela-tively minor.3.2.3. Deglacial Experiments With Unequal Forcings[59] We now investigate the impact of reduced climate
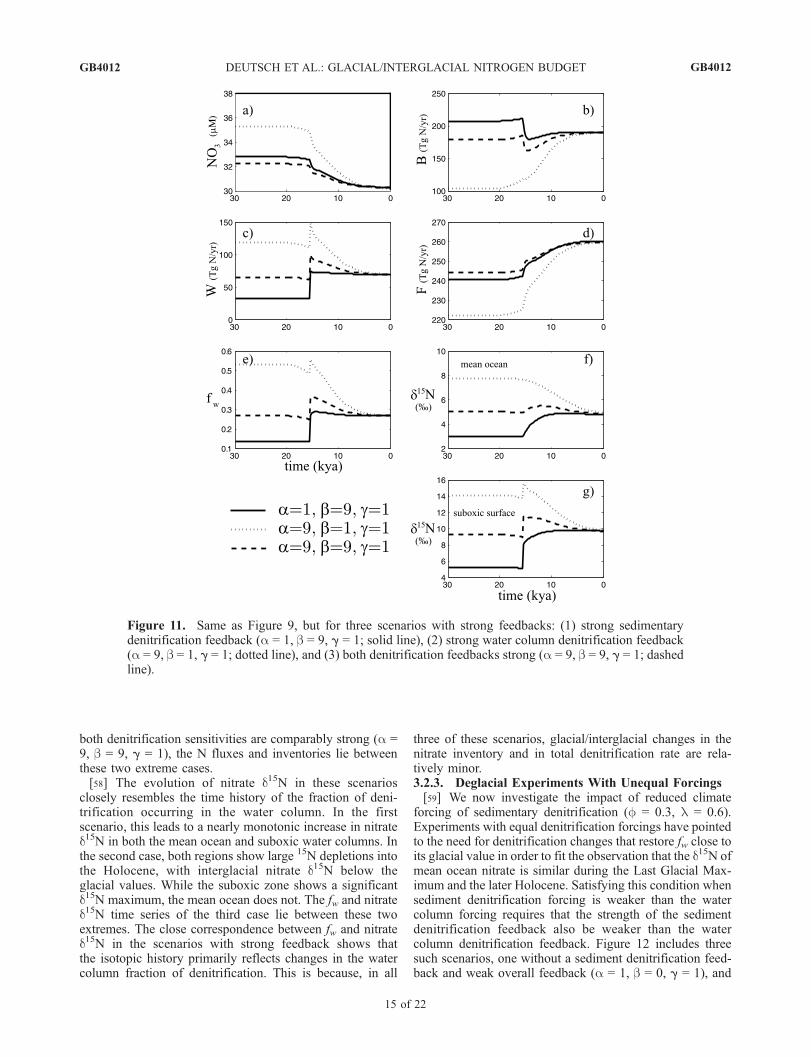
forcing of sedimentary denitrification (f = 0.3, l = 0.6).Experiments with equal denitrification forcings have pointedto the need for denitrification changes that restore fw close toits glacial value in order to fit the observation that the d15N ofmean ocean nitrate is similar during the Last Glacial Max-imum and the later Holocene. Satisfying this condition whensediment denitrification forcing is weaker than the watercolumn forcing requires that the strength of the sedimentdenitrification feedback also be weaker than the watercolumn denitrification feedback. Figure 12 includes threesuch scenarios, one without a sediment denitrification feed-back and weak overall feedback (a = 1, b = 0, g = 1), and
Figure 11. Same as Figure 9, but for three scenarios with strong feedbacks: (1) strong sedimentarydenitrification feedback (a = 1, b = 9, g = 1; solid line), (2) strong water column denitrification feedback(a = 9, b = 1, g = 1; dotted line), and (3) both denitrification feedbacks strong (a = 9, b = 9, g = 1; dashedline).
GB4012 DEUTSCH ET AL.: GLACIAL/INTERGLACIAL NITROGEN BUDGET
15 of 22
GB4012
two with weak sediment denitrification feedback but strongoverall feedback (a = 9, b = 1, g = 1, and a = 9, b = 1, g = 9).[60] In the case with weak overall feedback, a relatively
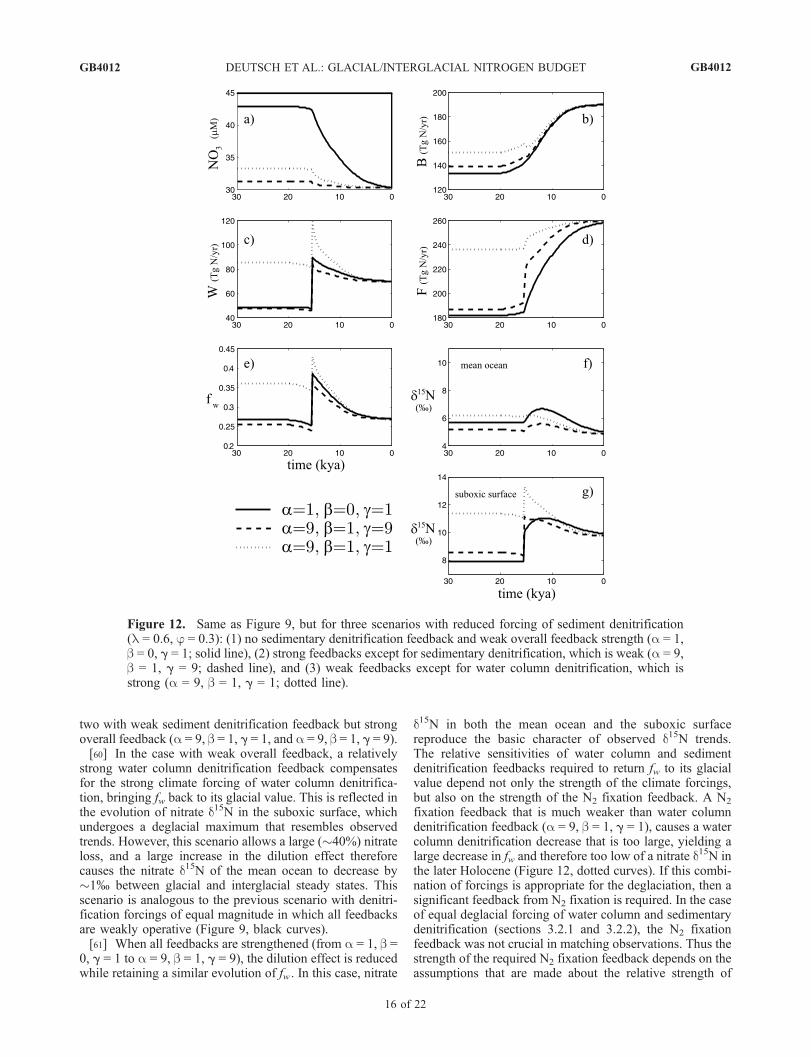
strong water column denitrification feedback compensatesfor the strong climate forcing of water column denitrifica-tion, bringing fw back to its glacial value. This is reflected inthe evolution of nitrate d15N in the suboxic surface, whichundergoes a deglacial maximum that resembles observedtrends. However, this scenario allows a large (�40%) nitrateloss, and a large increase in the dilution effect thereforecauses the nitrate d15N of the mean ocean to decrease by�1% between glacial and interglacial steady states. Thisscenario is analogous to the previous scenario with denitri-fication forcings of equal magnitude in which all feedbacksare weakly operative (Figure 9, black curves).[61] When all feedbacks are strengthened (from a = 1, b =
0, g = 1 to a = 9, b = 1, g = 9), the dilution effect is reducedwhile retaining a similar evolution of fw . In this case, nitrate
d15N in both the mean ocean and the suboxic surfacereproduce the basic character of observed d15N trends.The relative sensitivities of water column and sedimentdenitrification feedbacks required to return fw to its glacialvalue depend not only the strength of the climate forcings,but also on the strength of the N2 fixation feedback. A N2
fixation feedback that is much weaker than water columndenitrification feedback (a = 9, b = 1, g = 1), causes a watercolumn denitrification decrease that is too large, yielding alarge decrease in fw and therefore too low of a nitrate d15N inthe later Holocene (Figure 12, dotted curves). If this combi-nation of forcings is appropriate for the deglaciation, then asignificant feedback from N2 fixation is required. In the caseof equal deglacial forcing of water column and sedimentarydenitrification (sections 3.2.1 and 3.2.2), the N2 fixationfeedback was not crucial in matching observations. Thus thestrength of the required N2 fixation feedback depends on theassumptions that are made about the relative strength of
Figure 12. Same as Figure 9, but for three scenarios with reduced forcing of sediment denitrification(l = 0.6, j = 0.3): (1) no sedimentary denitrification feedback and weak overall feedback strength (a = 1,b = 0, g = 1; solid line), (2) strong feedbacks except for sedimentary denitrification, which is weak (a = 9,b = 1, g = 9; dashed line), and (3) weak feedbacks except for water column denitrification, which isstrong (a = 9, b = 1, g = 1; dotted line).
GB4012 DEUTSCH ET AL.: GLACIAL/INTERGLACIAL NITROGEN BUDGET
16 of 22
GB4012

the deglacial forcings on water column and sedimentarydenitrification.3.2.4. Categorizing Responses in Terms of Forcing andFeedback Strength[62] The salient features of the observed d15N records
from sediment cores underlying the major suboxic zones ofthe modern ocean can be characterized by their deglaciald15N rise and Holocene d15N decrease. We estimate theseparameters for a variety of published sediment cores, bysubtracting average glacial and interglacial d15N valuesfrom the deglacial maximum. These parameters are plottedagainst each other in Figures 13a and Figures 13c, togetherwith values from all model simulations. In most of thesediment cores, roughly half of the deglacial d15N rise iscompensated by Holocene decreases. One core from theGulf of California [Pride et al., 1999] shows an exception-ally large Holocene d15N decrease (Figure 1).[63] Among model simulations with equal forcings for
water column and sedimentary denitrification and withstrong overall feedback (Figure 13a), we can group theresults into three categories. In the first group (top left) arethose scenarios in which the sensitivity of water columndenitrification feedback is much greater than that forsediment denitrification (a b). In these cases, sea levelrise results in a large increase in sediment denitrification,while the strong feedback on denitrification in the watercolumn restores that flux toward glacial values followingthe initial deglacial rise. The combination of these effectscauses a large Holocene decrease in fw, with a consequentnet glacial-to-interglacial decrease in the nitrate d15N ofboth the global ocean and suboxic water column. A secondcluster of scenarios shares the opposite relative denitrifica-tion sensitivities (a b). In these cases, the strongsedimentary denitrification feedback counteracts sea levelrise, while the weak feedback for water column denitrifica-tion does little to reduce that flux following the forceddeglacial increase. This results in step-like increases in fw,with similarly evolving nitrate d15N in both the mean oceanand suboxic water column.[64] The final cluster of model results is most similar to
the available data, with Holocene decreases in d15N roughlyhalf the magnitude of the deglacial rise. Results of this typeare found in scenarios in which the sensitivities of both
denitrification feedbacks are of similar strength (a � b).Because denitrification forcings are equal in these scenarios,their feedback sensitivities must also be equal in order toprevent changes in water column denitrification from beingmuch larger or much smaller than changes in sedimentdenitrification. Similarly, when the deglacial forcing ofsediment denitrification is less than the water column deni-trification forcing, the sensitivity of its feedback must also bereduced in order to satisfy data constraints (Figure 13c). Thisset of experiments further requires a strong N2 fixationfeedback, which competes with water column denitrificationfeedback, preventing water column denitrification fromdecreasing too strongly following its deglacial rise.[65] Also shown in Figures 13a and 13c are the scenarios
with weak overall feedback. In each set of experiments, onlyone scenario with weak overall feedback is consistent withthe data constraints for suboxic surface d15N. However, eachof these scenarios (a = b = g = 1when denitrification forcingsare equal, and a = 1, b = 0, g = 1 when sediment denitrifi-cation forcing is reduced) violates the data constraint of nosignificant glacial-to-interglacial change in the d15N of nitratein the mean ocean, due to the dilution effect (Figures 13band 13d). It is therefore not possible to produce realisticisotope signals in an ocean with weak feedbacks. This meansthat isotope constraints on N cycle variations across theglacial/interglacial transition require an N budget that istightly regulated by feedbacks either through N2 fixation,denitrification or both. None of the scenarios we examinedwith a N inventory change exceeding 30% was able toproduce isotope trends consistent with the observations inboth the mean ocean and the suboxic surface. We believe it isunlikely that any scenarios with N inventory changes greaterthan 20% will be able to satisfy these constraints. Among thescenarios that best matched the sedimentary data, the max-imum magnitude of N inventory changes is less than 10%.[66] There are several independent indications in the
geologic record for the existence of a water column deni-trification feedback. First, a number of sediment coresfrom the open eastern North Pacific margin indicate a returnto bioturbation following a laminated deglacial interval.Ganeshram and Pedersen [1998] and Pride et al. [1999]have observed that cores from the Mexican margin at depthsof 800–1000 m contain bioturbated sediments beginning
Figure 13. Deglacial d15N increase (maximum minus glacial) versus Holocene d15N decrease (maximum minus modern)in (a, c) the surface of the suboxic water column and (b, d) the mean ocean from model simulations (open circles) withequal denitrification forcings (l = j = 0.6; Figures 13a and 13b) and with reduced sediment denitrification forcing (l = 0.6j = 0.3; Figures 13c and 13d). Stars represent values estimated from published sediment cores: 893A [Emmer and Thunell,2000]; NH15P, 1017E, NH22P [Ganeshram et al., 2000]; JPC56 [Pride et al., 1999]; Arabian Sea [Suthhof et al., 2001],and Mexican Margin [Thunell and Kepple, 2004]. Lines indicate fraction of deglacial d15N increase that is subsequentlycompensated by a deglacial-to-Holocene decrease: 100% (solid line) or 50% and 25% (dashed lines). Model points areidentified according to their sensitivity values with the order abg (e.g., 910 refers to the experiment with a = 9, b = 1, g = 0).Clusters of experiments with strong overall feedbacks are grouped by ovals: (1) water column denitrification sensitivitymuch larger than sediment denitrification sensitivity (a b, black oval), (2) sediment denitrification sensitivity muchlarger than water column denitrification sensitivity (b a, light gray oval), and (3) both denitrification sensitivities on par,i.e., either both weak/off or both strong (a � b, medium gray oval). For each cluster, a representative trajectory of d15N inthe suboxic surface is shown (insets, Figure 13a) using corresponding gray shade. Experiments with weak overallsensitivity are also shown. The sloping gray oval (Figure 13b) indicates mean ocean changes that appear most likely givencurrent sediment d15N records representative of the mean ocean [Holmes et al., 1997; Kienast, 2000; N. Meckler,unpublished data].
GB4012 DEUTSCH ET AL.: GLACIAL/INTERGLACIAL NITROGEN BUDGET
17 of 22
GB4012

Figure 13
GB4012 DEUTSCH ET AL.: GLACIAL/INTERGLACIAL NITROGEN BUDGET
18 of 22
GB4012
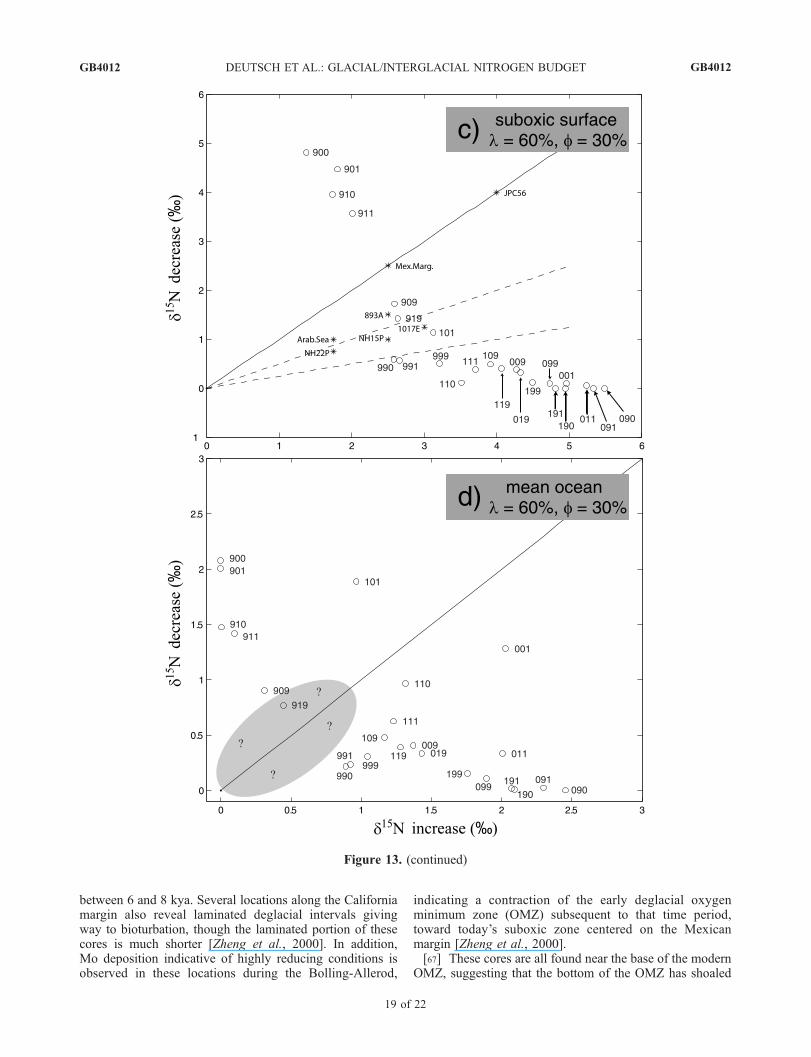
between 6 and 8 kya. Several locations along the Californiamargin also reveal laminated deglacial intervals givingway to bioturbation, though the laminated portion of thesecores is much shorter [Zheng et al., 2000]. In addition,Mo deposition indicative of highly reducing conditions isobserved in these locations during the Bolling-Allerod,
indicating a contraction of the early deglacial oxygenminimum zone (OMZ) subsequent to that time period,toward today’s suboxic zone centered on the Mexicanmargin [Zheng et al., 2000].[67] These cores are all found near the base of the modern
OMZ, suggesting that the bottom of the OMZ has shoaled
Figure 13. (continued)
GB4012 DEUTSCH ET AL.: GLACIAL/INTERGLACIAL NITROGEN BUDGET
19 of 22
GB4012

in the Holocene. Further evidence for a shoaling of the baseof the OMZ comes from Cannariato and Kennett [1999],who conclude, on the basis of foraminiferal assemblages,that the depth of the suboxic layer in the Gulf of Californiacontracted following a deglacial expansion. The combina-tion of these records supports a scenario in whichthe suboxic zone receded following its deglacial apex,horizontally and/or vertically. While a causal role forventilation changes cannot be ruled out, these observationswould indeed be expected from the denitrification feedbackdescribed above. That is, increased denitrification at the endof the last ice age would have reduced the nitrate inventory,globally and locally, leading to lower export production andthus higher subsurface [O2].[68] Finally, it is likely to be difficult to reconstruct glacial/
interglacial forcing of denitrification fluxes, especially forthe sediments. However, for a given deglacial forcing ofwater column and sedimentary denitrification, the transientbehavior of N isotopes provides a constraint on the relativesensitivity of denitrification feedbacks. If denitrificationforcing in the water column and sediments are of equalmagnitude, their feedback sensitivities must also be similar,whereas a stronger climate-forced increase in water columndenitrification requires that this flux also have a strongerfeedback. That is, a mechanistic understanding of the Nbudget feedbacks parameterized here would make it possibleto reconstruct the deglacial forcing on denitrification fluxes.
4. Conclusions
[69] As more high-resolution sediment records of sedi-ment d15N have become available, new features can be seenacross a wide variety of oceanic regions. One of these is alate deglacial/early Holocene decrease in the d15N of surfacenitrate in the suboxic water column. This decrease, whichfollows the well-known deglacial d15N rise in these regions[Altabet et al., 1995; Ganeshram et al., 1995], results in atransient deglacial maximum of suboxic nitrate d15N. Whilethe mean d15N of nitrate appears to be similar in the glacialand interglacial ocean [Kienast, 2000], recent sedimentaryrecords suggest that the whole ocean may exhibit a peak ind15N upon deglaciation, but with smaller amplitude [Holmeset al., 1997; Kienast, 2000].[70] Because the fraction of total denitrification occurring
in the water column, fw , is the dominant control on thesteady state d15N of ocean nitrate [Brandes and Devol,2002], producing a deglacial d15N maximum requiresdeglacial N budget changes that involve a transient maxi-mum in fw. An initial increase in fw can be explained by aclimate-forced increase in water column denitrificationupon deglaciation [Altabet et al., 1995; Ganeshram et al.,1995]. A subsequent fw decrease could occur through alagged increase in sediment denitrification due to sea levelrise, and may be strengthened through a negative feedbackbetween denitrification and the declining ocean N inventory,if that feedback is stronger in the water column than in thesediments. The similarity of mean ocean nitrate d15N inglacial and interglacial periods implies that the net effect ofdeglacial climate forcing and internal feedbacks tends torestore the glacial partitioning of denitrification between the
water column and sediments. The decrease in fw during thelate deglacial/Holocene was therefore comparable to itsearly deglacial increase.[71] The size of the nitrate inventory and the total deni-
trification rate are secondary but significant factors deter-mining the steady state ocean nitrate d15N. As the nitrateinventory decreases and/or the total denitrification rateincreases (with constant fw), the degree of nitrate consump-tion in the suboxic zone increases. This elevated consump-tion of suboxic zone nitrate causes its d15N to increase dueto isotopic fractionation, but causes mean ocean nitrate d15Nto decrease, due to the reduced influence of the residualsuboxic nitrate on the rest of the ocean. Glacial/interglacialchanges in the ocean nitrate inventory and the total denitri-fication rate therefore cause the evolution of nitrate d15N inthe mean ocean and the suboxic zone to deviate in oppositedirections from the trends that would be expected on thebasis of fw alone. When nitrate losses are large, a significantsuboxic d15N maximum during deglaciation can only occurwith a very pronounced maximum in fw; that is, when latedeglacial/Holocene fw decrease is as large or larger than theearly deglacial increase. However, a large fw decrease,combined with a large nitrate loss, results in a largeglacial-to-interglacial decline in mean ocean d15N due tothe dilution effect, which is not supported by currentsedimentary records. For this reason, it is not possible tosimultaneously satisfy data constraints from the mean oceanand the suboxic water column when N losses are large.[72] Satisfying data constraints from both the suboxic zone
and the mean ocean therefore requires (1) that fw returntoward its glacial value and (2) that glacial-to-interglacialtotal nitrate losses are relatively small. These two require-ments, in turn, place constraints on the strength of the variousfeedbacks. First, limiting the oceanic loss of nitrate requiresstrong feedbacks by either N2 fixation or denitrification.Whether we can distinguish between strong N2 fixationfeedback and strong denitrification feedback as the sourceof N budget regulation on the basis of N isotopic constraintsdepends on the deglacial forcing on denitrification, which isnot well known. However, there are other geologic indica-tions that a water column denitrification feedback may havebeen operative since the Last Glacial Maximum.[73] Second, the relative sensitivities of water column and
sediment denitrification feedbacks must be proportional totheir relative climate forcing. If both denitrification forcingsare of similar magnitude, their feedbacks must also be ofsimilar strength in order to reduce fw back toward, but notbeyond, its glacial level. Thus, if deglacial forcing of watercolumn denitrification was stronger than the forcing ofsediment denitrification, its feedback must also be stronger.Since sediment denitrification is controlled primarily by theflux of organic carbon to the sediments, rather than by theoxygenation of the overlying water, a relatively weakfeedback for sedimentary denitrification seems sensible.This suggests, in turn, that the deglacial forcing on watercolumn denitrification was proportionally greater than thaton sedimentary denitrification.[74] Finally, these results have important implications for
theories of glacial/interglacial atmospheric CO2 changes thatrely on changes in oceanic nutrient inventory. Our results
GB4012 DEUTSCH ET AL.: GLACIAL/INTERGLACIAL NITROGEN BUDGET
20 of 22
GB4012
suggest that in order to reproduce isotope trends across thelast deglacial transition, N inventory changes should not havebeen larger than 30%, and they are likely to have been muchsmaller. The impact on atmospheric CO2 of a change innutrient reservoir of this magnitude depends significantlyon the model used. In box models [e.g., Sarmiento andToggweiler, 1984], atmospheric CO2 is less sensitive tolow-latitude productivity changes than high latitudes,whereas general circulation models are more sensitive tolow-latitude perturbations [Broecker et al., 1999].[75] Using a box model with an intermediate sensitivity,
Sigman et al. [1998] find that increased low-latitude pro-ductivity resulting from an increase in nutrient reservoirof 30% produces a pCO2 reduction of 34 ppm if CaCO3
effects are neglected. If transient and equilibrium constraintson the calcite lysocline are included, the pCO2 change is17–45 ppm, depending on assumptions about CaCO3
production [Sigman et al., 1998]. Thus it appears thatglacial N reservoir increases allowed by the constraintsimposed by the sedimentary d15N cannot account for thedominant part of the observed 80–90 ppm glacial decreasein atmospheric CO2.
[76] Acknowledgments. C. D. was supported by NASA Headquar-ters under an Earth System Science Fellowship grant NGT5-30356. D. M.S. was supported by NSF grants OCE-9981479, OCE-0136449, and DEB-0083566 (to Simon Levin), and by British Petroleum and Ford MotorCompany through the Princeton Carbon Mitigation Initiative. We thankJorge Sarmiento for improving the manuscript through his careful readingand thoughtful comments.
ReferencesAltabet, M. A. (1988), Variations in nitrogen isotopic composition betweensinking and suspended particles: Implications for nitrogen cycling andparticle transformation in the open ocean, Deep Sea Res., Part I, 35,535–554.
Altabet, M. A., R. Francois, D. W. Murray, and W. L. Prell (1995), Climate-related variations in denitrification in the Arabian Sea from sediment15N/14N ratios, Nature, 373, 506–509.
Altabet, M. A., C. Pilskaln, R. Thunell, C. Pride, D. Sigman, F. Chavez, andR. Francois (1999), The nitrogen isotope biogeochemistry of sinkingparticles from the margin of the eastern North Pacific, Deep Sea Res.,Part I, 46, 655–679.
Altabet, M. A., M. J. Higginson, and D. W. Murray (2002), The effect ofmillennial-scale changes in Arabian Sea denitrification on atmosphericCO2, Nature, 415, 159–162.
Bard, E., B. Hamelin, R. G. Fairbanks, and A. Zindler (1990), Calibra-tion of the C-14 timescale over the past 30,000 years using mass-spectrometric U-Th ages from Barbados corals, Nature, 345, 405–410.
Barford, C. C., J. P. Montoya, M. A. Altabet, and R. Mitchell (1999),Steady-state nitrogen isotope effects of N2 and N2O production inParacoccus denitrificans, Appl. Environ. Microbiol., 65, 989–994.
Blunier, T., B. Barnett, M. L. Bender, and M. B. Hendricks (2002), Biolo-gical oxygen productivity during the last 60,000 years from triple oxygenisotope measurements, Global Biogeochem. Cycles, 16(3), 1029,doi:10.1029/2001GB001460.
Brandes, J. A., and A. H. Devol (1997), Isotopic fractionation of oxygenand nitrogen in coastal marine sediments, Geochim. Cosmochim. Acta,61, 1793–1801.
Brandes, J. A., and A. H. Devol (2002), A global marine fixed nitrogenisotopic budget: Implications for Holocene nitrogen cycling, GlobalBiogeochem. Cycles, 16(4), 1120, doi:10.1029/2001GB001856.
Brandes, J. A., A. H. Devol, T. Yoshinari, D. A. Jayakumar, and S. W. A.Naqvi (1998), Isotopic composition of nitrate in the central Arabian Seaand eastern tropical North Pacific: A tracer for mixing and nitrogencycles, Limnol. Oceanogr., 43, 1680–1689.
Broecker, W. S. (1982a), Glacial to interglacial changes in ocean chemistry,Prog. Oceanogr., 2, 151–197.
Broecker, W. S. (1982b), Ocean chemistry during glacial time, Geochim.Cosmochim. Acta, 46, 1689–1706.
Broecker, W. S., and G. M. Henderson (1998), The sequence of eventssurrounding Termination II and their implications for the cause ofglacial-interglacial CO2 changes, Paleoceanography, 13, 352–364.
Broecker, W. S., and T.-H. Peng (1987), The role of CaCO3 compensationin the glacial to interglacial atmospheric CO2 change, Global Biogeo-chem. Cycles, 1, 15–29.
Broecker, W. S., J. Lynch-Stieglitz, D. Archer, M. Hofmann, E. Maier-Reimer, O. Marchal, T. Stocker, and N. Gruber (1999), How strong isthe Harvardton-Bear constraint?, Global Biogeochem. Cycles, 13, 817–820.
Cannariato, K. G., and J. P. Kennett (1999), Climatically related millennial-scale fluctuations in strength of California margin oxygen-minimum zoneduring the past 60 k.y., Geology, 27, 975–978.
Carpenter, E., H. Harvey, B. Fry, and D. Capone (1997), Biogeochemicaltracers of the marine cyanobacterium Trichodesmium, Deep Sea Res.,Part I, 44, 27–38.
Christensen, J. P. (1994), Carbon export from continental shelves, denitri-fication and atmospheric carbon dioxide, Cont. Shelf Res., 14, 547–576.
Christensen, J. P., J. W. Murray, A. H. Devol, and L. A. Codispoti (1987),Denitrification in continental shelf sediments has major impact on theoceanic nitrogen budget, Global Biogeochem. Cycles, 1, 97–116.
Codispoti, L. A. (1989), Phosphorus vs. nitrogen limitation of new andexport production, in Productivity of the Ocean: Past and Present, editedby W. H. Berger, V. S. Smetacek, and G. Wefer, pp. 377–394, JohnWiley, Hoboken, N. J.
Codispoti, L. A., and J. P. Christensen (1985), Nitrification, denitrification,and nitrous oxide cycling in the eastern tropical Pacific Ocean, Mar.Chem., 16, 277–300.
Conkright, M., S. Levitus, and T. Boyer (1994), World Ocean Atlas 1994,vol. 1. Nutrients, NOAA Atlas NESDIS 1, 16 pp., Natl. Oceanic andAtmos. Admin., Silver Spring, Md.
Deutsch, C., N. Gruber, R. M. Key, J. L. Sarmiento, and A. Ganaschaud(2001), Denitrification and N2 fixation in the Pacific Ocean, GlobalBiogeochem. Cycles, 15, 483–506.
Devol, A. H. (1991), Direct measurement of nitrogen gas fluxes fromcontinental shelf sediments, Nature, 349, 319–321.
Emmer, E., and R. C. Thunell (2000), Nitrogen isotope variations in SantaBarbara Basin sediments: Implications for denitrification in the easterntropical North Pacific during the last 50,000 years, Paleoceanography,15, 377–387.
Falkowski, P. G. (1997), Evolution of the nitrogen cycle and its influenceon the biological sequestration of CO2 in the ocean, Nature, 387, 272–275.
Francois, R. F., M. A. Altabet, E.-F. Yu, D. M. Sigman, M. P. Bacon,M. Frank, G. Bohrmann, G. Bareille, and L. D. Labeyrie (1997), Watercolumn stratification in the Southern Ocean contributed to the loweringof glacial atmospheric CO2, Nature, 389, 929–935.
Ganeshram, R. S., and T. F. Pedersen (1998), Glacial-interglacial variabilityin upwelling and bioproductivity off northwest Mexico: Implications forquaternary paleoclimate, Paleoceanography, 13, 634–645.
Ganeshram, R. S., T. F. Pedersen, S. E. Calvert, and J. W. Murray (1995),Large changes in oceanic nutrient inventories from glacial to interglacialperiods, Nature, 376, 755–758.
Ganeshram, R. S., T. F. Pedersen, S. E. Calvert, G. W. McNeill, and M. R.Fontugne (2000), Glacial-interglacial variability in denitrification in theworld’s oceans: Causes and consequences, Paleoceanography, 15, 361–376.
Ganeshram, R. S., T. F. Pedersen, S. E. Calvert, and R. Francois (2002),Reduced nitrogen fixation in the glacial ocean inferred from changes inmarine nitrogen and phosphorus inventories, Nature, 415, 156–159.
Gruber, N., and J. L. Sarmiento (1997), Global patterns of marine nitrogenfixation and denitrification, Global Biogeochem. Cycles, 11, 235–266.
Hanebuth, T., K. Stattegger, and P. M. Grootes (2000), Rapid flooding ofthe Sunda Shelf: A late-glacial sea-level record, Science, 288, 1033–1035.
Haug, G. H., T. F. Pedersen, D. M. Sigman, S. E. Calvert, B. Nielsen,and L. C. Peterson (1998), Glacial/interglacial variations in productivityand nitrogen fixation in the Cariaco Basin during the last 550 ka,Paleoceanography, 13, 427–432.
Holmes, M. E., R. R. Schneider, P. J. Muller, M. Segl, and G. Wefer (1997),Reconstruction of past nutrient utilization in the eastern Angola Basinbased on sedimentary 15N/14N ratios, Paleoceanography, 12, 604–614.
Karl, D., R. Letelier, L. Tupas, J. Dore, J. Christian, and D. Hebel (1997),The role of nitrogen fixation in biogeochemical cycling in the subtropicalNorth Pacific Ocean, Nature, 388, 533–538.
Karl, D., A. Michaels, B. Bergman, D. Capone, E. Carpenter, R. Letelier,F. Lipschultz, H. Paerl, D. Sigman, and L. Stal (2002), Dinitrogenfixation in the world’s oceans, Biogeochemistry, 57/58, 47–98.
GB4012 DEUTSCH ET AL.: GLACIAL/INTERGLACIAL NITROGEN BUDGET
21 of 22
GB4012
Keigwin, L. D., and G. A. Jones (1990), Deglacial climatic oscillations inthe Gulf of California, Paleoceanography, 5, 1009–1023.
Kennett, J. P., and B. L. Ingram (1995), A 20,000-year record of oceancirculation and climate change from the Santa Barbara basin, Nature,377, 510–514.
Kienast, M. (2000), Unchanged nitrogen isotopic composition of organicmatter in the South China Sea during the last climatic cycle: Globalimplications, Paleoceanography, 15, 244–253.
Liu, K.-K., and I. R. Kaplan (1989), The eastern tropical Pacific as a sourceof 15N-enriched nitrate in seawater off southern California, Limnol.Oceanogr., 34, 820–830.
Martin, J. H., G. A. Knauer, D. M. Karl, and W. W. Broenkow (1987),VERTEX: Carbon cycling in the northeast Pacific, Deep Sea Res., 34,267–285.
Matsumoto, K., J. L. Sarmiento, and M. A. Brzezinski (2002), Silicic acidleakage from the Southern Ocean as a possible mechanism for explainingglacial atmospheric pCO2, Global Biogeochem. Cycles, 16(3), 1031,doi:10.1029/2001GB001442.
McElroy, M. B. (1983), Marine biological controls on atmospheric CO2 andclimate, Nature, 302, 328–329.
Middelburg, J. J., K. Soetaert, P. M. J. Herman, and C. H. R. Heip (1996),Denitrification in marine sediments: A model study, Global Biogeochem.Cycles, 10, 661–673.
Pride, C., R. Thunell, D. Sigman, L. Keigwin, M. Altabet, and E. Tappa(1999), Nitrogen isotopic variations in the Gulf of California since thelast deglaciation: Response to global climate change, Paleoceanography,14, 397–409.
Redfield, A. C., B. H. Ketchum, and F. A. Richards (1963), The influenceof organisms on the composition of seawater, in The Sea, vol. 2, edited byM. N. Hill, pp. 26–77, Wiley-Intersci., Hoboken, N. J.
Sarmiento, J. L., and J. R. Toggweiler (1984), A new model for the role ofthe oceans in determining atmospheric pCO2, Nature, 308, 621–624.
Sigman, D. M., and K. L. Casciotti (2001), Nitrogen isotopes in the ocean,in Encyclopedia of Ocean Sciences, edited by J. H. Steele, K. K.Turekian, and S. A. Thorpe, pp. 1884–1894, Academic, San Diego,Calif.
Sigman, D. M., and G. H. Haug (2003), Biological pump in the past, inTreatise On Geochemistry, edited by H. D. Holland, K. K. Turekian, andH. Elderfield, pp. 491–528, Elsevier Sci., New York.
Sigman, D. M., D. C. McCorkle, and W. R. Martin (1998), The calcitelysocline as a constraint on glacial/interglacial low-latitude productionchanges, Global Biogeochem. Cycles, 12, 409–427.
Sigman, D. M., M. A. Altabet, R. Francois, D. C. McCorkle, and G. Fischer(1999), The d15N of nitrate in the Southern Ocean: Consumption ofnitrate in surface waters, Global Biogeochem. Cycles, 13, 1149–1166.
Sigman, D. M., M. A. Altabet, D. C. McCorkle, R. Francois, and G. Fischer(2000), The d15N of nitrate in the Southern Ocean: Nitrogen cycling andcirculation in the ocean interior, J. Geophys. Res., 105, 19,599–19,614.
Sigman, D. M., R. Robinson, A. N. Knapp, A. van Geen, D. C. McCorkle,J. A. Brandes, and R. C. Thunell (2003), Distinguishing between watercolumn and sedimentary denitrification in the Santa Barbara Basin usingthe stable isotopes of nitrate, Geochem. Geophys. Geosyst., 4, 1040,doi:10.1029/2002GC000384.
Suthhof, A., V. Ittekkot, and B. Gaye-Haake (2001), Millennial-scale os-cillation of denitrification intensity in the Arabian Sea during the lateQuaternary and its potential influence on atmospheric N2O and globalclimate, Global Biogeochem. Cycles, 15, 637–649.
Thunell, R. C., and A. Kepple (2004), Glacial-Holocene d15N record fromthe Gulf of Tehuantepec, Mexico: Implications for denitrification in theeastern equatorial Pacific and changes in atmospheric N2O, GlobalBiogeochem. Cycles, 18, GB1001, doi:10.1029/2002GB002028.
Thunell, R. C., D. M. Sigman, F. Muller-Karger, Y. Astor, and R. Varela(2004), Nitrogen isotope dynamics of the Cariaco Basin, Venezuela,Global Biogeochem. Cycles, 18, GB3001, doi:10.1029/2003GB002185.
Toggweiler, J. R., and S. Carson (1995), What are the upwelling systemscontributing to the ocean’s carbon and nutrient budgets?, in Upwellingin the Ocean: Modern Processes and Ancient Records, edited by C. P.Summerhayes et al., John Wiley, Hoboken, N. J.
Tyrrell, T. (1999), The relative influences of nitrogen and phosphorus onoceanic primary production, Nature, 400, 525–531.
Van Mooy, B. A. S., R. G. Keil, and A. H. Devol (2002), Impact of suboxiaon sinking particulate organic carbon: Enhanced carbon flux and prefer-ential degradation of amino acids via denitrification, Geochim. Cosmo-chim. Acta, 66, 457–465.
Voss, M., J. W. Dippner, and J. P. Montoya (2001), Nitrogen isotopepatterns in the oxygen-deficient waters of the eastern tropical NorthPacific Ocean, Deep Sea Res., Part I, 48, 1905–1921.
Zheng, Y., R. F. Anderson, A. van Geen, and J. Kuwabara (2000), Authi-genic molybdenum formation in marine sediments: A link to pore watersulfide in the Santa Barbara Basin, Geochim. Cosmochim. Acta, 64,4165–4178.
�������������������������C. Deutsch, Program on Climate Change, University of Washington, 407
OSB, Box 357940, Seattle, WA 98195-7940, USA. ([email protected])G. H. Haug, Geoforschungszentrum Potsdam, Telegrafenberg, D-14473
Potsdam, Germany. ([email protected])A. N. Meckler, Geological Institute, ETH Zentrum, Sonneggstrasse 5,
Ch-8092 Zurich, Switzerland. ([email protected])D. M. Sigman, Department of Geosciences, Princeton University, Guyot
Hall, Princeton, NJ 08544, USA. ([email protected])R. C. Thunell, Department of Geological Sciences, University of South
Carolina, Columbia, SC 29208, USA. ([email protected])
GB4012 DEUTSCH ET AL.: GLACIAL/INTERGLACIAL NITROGEN BUDGET
22 of 22
GB4012
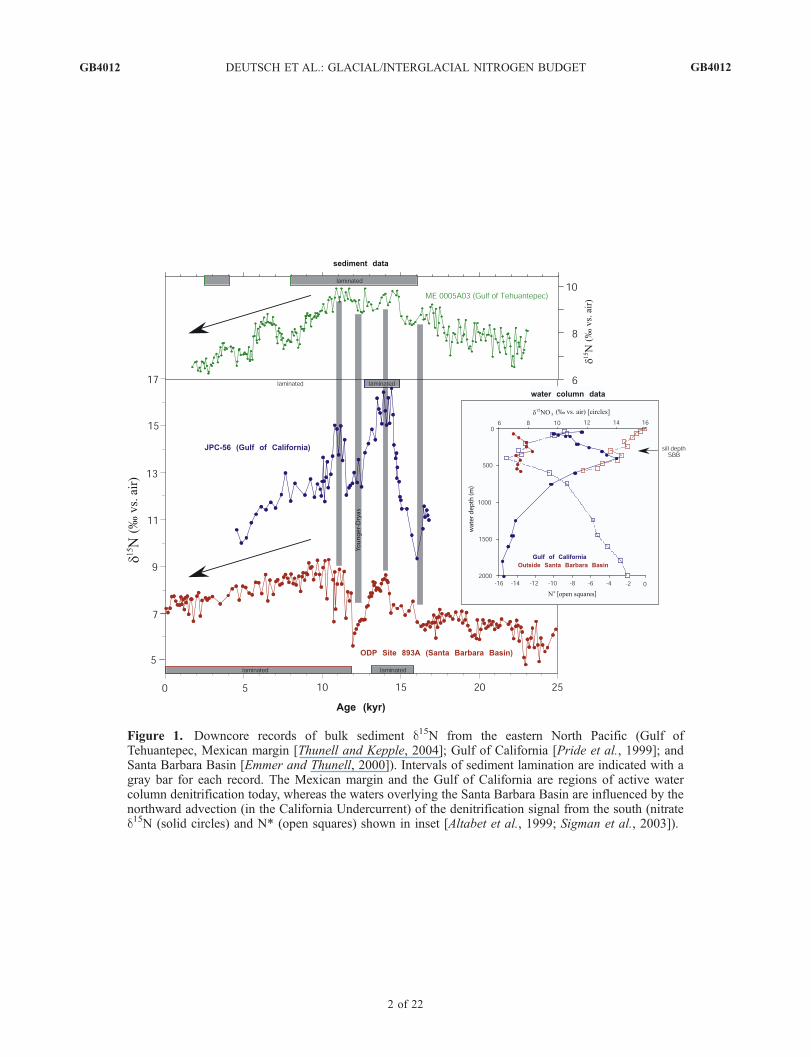
Figure 1. Downcore records of bulk sediment d15N from the eastern North Pacific (Gulf ofTehuantepec, Mexican margin [Thunell and Kepple, 2004]; Gulf of California [Pride et al., 1999]; andSanta Barbara Basin [Emmer and Thunell, 2000]). Intervals of sediment lamination are indicated with agray bar for each record. The Mexican margin and the Gulf of California are regions of active watercolumn denitrification today, whereas the waters overlying the Santa Barbara Basin are influenced by thenorthward advection (in the California Undercurrent) of the denitrification signal from the south (nitrated15N (solid circles) and N* (open squares) shown in inset [Altabet et al., 1999; Sigman et al., 2003]).
GB4012 DEUTSCH ET AL.: GLACIAL/INTERGLACIAL NITROGEN BUDGET GB4012
2 of 22
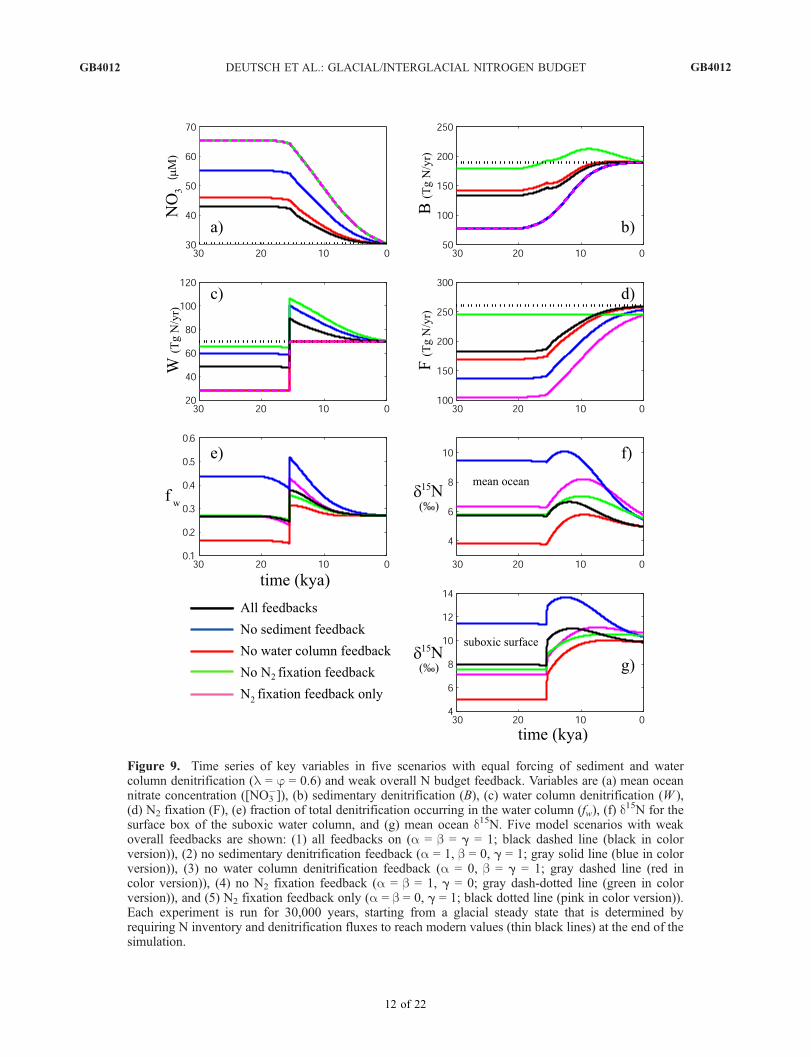
Figure 9. Time series of key variables in five scenarios with equal forcing of sediment and watercolumn denitrification (l = j = 0.6) and weak overall N budget feedback. Variables are (a) mean oceannitrate concentration ([NO3
�]), (b) sedimentary denitrification (B), (c) water column denitrification (W ),(d) N2 fixation (F), (e) fraction of total denitrification occurring in the water column (fw), (f) d
15N for thesurface box of the suboxic water column, and (g) mean ocean d15N. Five model scenarios with weakoverall feedbacks are shown: (1) all feedbacks on (a = b = g = 1; black dashed line (black in colorversion)), (2) no sedimentary denitrification feedback (a = 1, b = 0, g = 1; gray solid line (blue in colorversion)), (3) no water column denitrification feedback (a = 0, b = g = 1; gray dashed line (red incolor version)), (4) no N2 fixation feedback (a = b = 1, g = 0; gray dash-dotted line (green in colorversion)), and (5) N2 fixation feedback only (a = b = 0, g = 1; black dotted line (pink in color version)).Each experiment is run for 30,000 years, starting from a glacial steady state that is determined byrequiring N inventory and denitrification fluxes to reach modern values (thin black lines) at the end of thesimulation.
GB4012 DEUTSCH ET AL.: GLACIAL/INTERGLACIAL NITROGEN BUDGET GB4012
12 of 22

Figure 10. Changes in nitrate d15N in the mean ocean (dotted lines) and surface waters, overlying thesuboxic zone for three scenarios, each with l = j = 0.6: (a) weak N2 fixation feedback only (a = b = 0;g = 1, gray solid line (red in color version)), (b) all feedbacks operative but weak (a = b = 1; g = 1, blacksolid line (blue in color version)), and (c) strong N2 fixation feedback only (a = b = 0; g = 9, blackdashed line (green in color version)). (d) The fraction of denitrification occurring in the water column, fw,is roughly the same in all cases. The differences in isotopic evolution of the mean ocean versus surfacewaters overlying the suboxic zone are due to nitrate consumption in the suboxic zone. Increasedconsumption of suboxic N throughout the Holocene leads to the divergence between mean ocean andsuboxic d15N (Figure 10a), causing larger suboxic d15N increases and smaller subsequent decreases.
GB4012 DEUTSCH ET AL.: GLACIAL/INTERGLACIAL NITROGEN BUDGET GB4012
14 of 22