Late glacial and Holocene palaeocurrents around Rockall Bank, NE Atlantic Ocean
16
PALEOCEANOGRAPHY, VOL. 10, NO. 3, PAGES611-626,JUNE 1995 Late glacial and Holocene palaeocurrents around Rockall Bank, NE Atlantic Ocean B. Manighetti and I.N. McCave Department of Earth Sciences, University of Cambridge, Cambridge, England Abstract. Coresamples andhydrographic data from 50 ø to 60øNand 15 ø to 25øWin the Northeast Atlantic Ocean areused to study changes in current activity fromthelast glacial to present. We establish a newmethod to distinguish between theeffects of changing bottom current speed and varying size input by drawing upon sediment flux data and detailed grain size analysis. Changes in current speexl are recorded by the mean size of thesortable (coarse) noncarbonate silt component, which increases withcurrent vigor by winnowing awayof fines. Our method involves the definition of an idealsortable silt "input function", recorded at a site accumulating unmodified pelagic flux only.The ideal profile is then compared withrecords from other sites to determine thehistory of current speed at a range of water depths. The upper surface of Southern Source Water(SSW)probably shoaled during theglacial, asindicated by the covariation of sortable siltrecords fromsites presently covered by SSW and Lower North Atlantic Deep Water (LNADW). Thedata suggest that production of LNADW was suppressed during theglacial, increased following thelast glacial maximum, anddeclined at thestart of Termination 1A. A second pulse of production occurred immediately before theYounger Dryas event. Intermediate waters weregenerally faster-flowing during theglacial andmayhave expanded their depth domain, such that a single glacial intermediate water mass covered depths from 1100 to more than 2000 m. Introduction The conveyorbelt system of the North Atlantic Drift and the compensating deepreturn of bottomwater in the form of North Atlantic Deep Water produced in the Norwegian and Greenland Seasexercise an important influence upon regional climate via the transport of heat from low to high latitudes [e.g. Broecker and Denton, 1989]. Changes in the vigor of deep water production have been linked to major climatic events such as the YoungerDryas [e.g. Broecker et al., 1988]. Reorganizations of the nutrient content of intermediate and deep waters as proposedby Boyle and Keigwin [1987] to accountfor the glacial-interglacial difference in atmospheric CO 2 can alsobe relatedto changes in the pattern of oceanic circulation [Boyle, 1988; Bertram et al., this issue; Beveridge et al., this issue]. In this study, we usecores from the Northeast Atlanticin an attemptto determine the velocity of bottom currentflow at a range of waterdepths. We assume thatbottom current flow has the effect of size-sorting sediment during events of resuspension and ensuing deposition, [McCave et al., this issue]. Texturalparameters have been used by many workers to studybottomwater circulation both in the modemocean[e.g. Van Andel, 1973;Blaeserand Ledbetter, 1982;Bulfinch et al., 1982; Haskell and Johnson, 1993] and in palaeoceanographic investigations [e.g. Huang and Watkins,1977;Ledbetter and Copyright 1995 by the American Geophysical Union. Paper number 94PA03059. 0883- 8305/95/94PA-03059510.00 Ellwood, 1980; Ledbetter and Balsam, 1985; Johnson et al., 1988; Turnau and Ledbetter,1989; Wang and McCave, 1990; Haskell et al., 1991]. The property mostcommonly employed (particularly by Ledbetter and coworkers)is the mean size of the detrital silt fraction. Becauseof the sensitivity of grain size to processes not directly linked to bottom circulation (e.g., turbidity currents) and to regional and temporal variability in sedimentsourcecharacteristics, the technique has been generallylimited to areaswhere bottom circulation dominates sediment distribution, such as the Blake Outer Ridgein the axisof the Western Boundary Undercurrent [e.g. Haskell et al., 1991]. Core sites in the area studied here have alsobeen subject to variableinput as a resultof accumulation of ice-rafted detritus during glacial periods. The difficulty, therefore, is to distinguish the relatively minor grain size changes due to bottom currentactivity from the very large, unpredictable changes in input flux and size spectxum. This problem is approached here through the identification of the varying characteristics of the input flux over the time period of interest at sites not influenced by strong bottom currents. Departures from this "standard" pattern at sites in the pathof deep currents may then be related to fluctuating current velocity at differentdepths. Methods and Materials Core material for this study was collected during the Biogeochemical Ocean Flux Study (BOFS) cruiseDiscovery 184 in 1989, in the northeast Atlantic [McCave, 1989] (Figure 1). Particle size analysiswas carried out at 2-4 cm intervals on sub-samples from kasten cores cut into 1 cm 611
-
Upload
independent -
Category
Documents
-
view
0 -
download
0
Transcript of Late glacial and Holocene palaeocurrents around Rockall Bank, NE Atlantic Ocean

PALEOCEANOGRAPHY, VOL. 10, NO. 3, PAGES 611-626, JUNE 1995
Late glacial and Holocene palaeocurrents around Rockall Bank, NE Atlantic Ocean
B. Manighetti and I.N. McCave Department of Earth Sciences, University of Cambridge, Cambridge, England
Abstract. Core samples and hydrographic data from 50 ø to 60øN and 15 ø to 25øW in the Northeast Atlantic Ocean are used to study changes in current activity from the last glacial to present. We establish a new method to distinguish between the effects of changing bottom current speed and varying size input by drawing upon sediment flux data and detailed grain size analysis. Changes in current speexl are recorded by the mean size of the sortable (coarse) noncarbonate silt component, which increases with current vigor by winnowing away of fines. Our method involves the definition of an ideal sortable silt "input function", recorded at a site accumulating unmodified pelagic flux only. The ideal profile is then compared with records from other sites to determine the history of current speed at a range of water depths. The upper surface of Southern Source Water (SSW) probably shoaled during the glacial, as indicated by the covariation of sortable silt records from sites presently covered by SSW and Lower North Atlantic Deep Water (LNADW). The data suggest that production of LNADW was suppressed during the glacial, increased following the last glacial maximum, and declined at the start of Termination 1A. A second pulse of production occurred immediately before the Younger Dryas event. Intermediate waters were generally faster-flowing during the glacial and may have expanded their depth domain, such that a single glacial intermediate water mass covered depths from 1100 to more than 2000 m.
Introduction
The conveyor belt system of the North Atlantic Drift and the compensating deep return of bottom water in the form of North Atlantic Deep Water produced in the Norwegian and Greenland Seas exercise an important influence upon regional climate via the transport of heat from low to high latitudes [e.g. Broecker and Denton, 1989]. Changes in the vigor of deep water production have been linked to major climatic events such as the Younger Dryas [e.g. Broecker et al., 1988]. Reorganizations of the nutrient content of intermediate and deep waters as proposed by Boyle and Keigwin [1987] to account for the glacial-interglacial difference in atmospheric CO 2 can also be related to changes in the pattern of oceanic circulation [Boyle, 1988; Bertram et al., this issue; Beveridge et al., this issue].
In this study, we use cores from the Northeast Atlantic in an attempt to determine the velocity of bottom current flow at a range of water depths. We assume that bottom current flow has the effect of size-sorting sediment during events of resuspension and ensuing deposition, [McCave et al., this issue]. Textural parameters have been used by many workers to study bottom water circulation both in the modem ocean [e.g. Van Andel, 1973; Blaeser and Ledbetter, 1982; Bulfinch et al., 1982; Haskell and Johnson, 1993] and in palaeoceanographic investigations [e.g. Huang and Watkins, 1977; Ledbetter and
Copyright 1995 by the American Geophysical Union.
Paper number 94PA03059. 0883- 8305/95/94PA-03059510.00
Ellwood, 1980; Ledbetter and Balsam, 1985; Johnson et al., 1988; Turnau and Ledbetter, 1989; Wang and McCave, 1990; Haskell et al., 1991]. The property most commonly employed (particularly by Ledbetter and coworkers) is the mean size of the detrital silt fraction. Because of the sensitivity of grain size to processes not directly linked to bottom circulation (e.g., turbidity currents) and to regional and temporal variability in sediment source characteristics, the technique has been generally limited to areas where bottom circulation dominates sediment distribution, such as the Blake Outer
Ridge in the axis of the Western Boundary Undercurrent [e.g. Haskell et al., 1991]. Core sites in the area studied here have also been subject to variable input as a result of accumulation of ice-rafted detritus during glacial periods. The difficulty, therefore, is to distinguish the relatively minor grain size changes due to bottom current activity from the very large, unpredictable changes in input flux and size spectxum. This problem is approached here through the identification of the varying characteristics of the input flux over the time period of interest at sites not influenced by strong bottom currents. Departures from this "standard" pattern at sites in the path of deep currents may then be related to fluctuating current velocity at different depths.
Methods and Materials
Core material for this study was collected during the Biogeochemical Ocean Flux Study (BOFS) cruise Discovery 184 in 1989, in the northeast Atlantic [McCave, 1989] (Figure 1). Particle size analysis was carried out at 2-4 cm intervals on sub-samples from kasten cores cut into 1 cm
611
612 MANIGHETII AND MCCAVE: LATE GLACIAL AND HOLOCENE PALAEOCURRENTS
65"
agaaaaaaaa LNADW Current
ß ' SSW Current
.... LSW Current
ß Core sites
! '• ! Iceland
55'
)rTh
Atlantic
Ocean
./
mm• m
ß • E. Thulean •ise • •'-•. 5K•
•'J Porcupine • • Plain
35 ß 30 ß 25' 20 •
!
!
Great
Britain ..
-.
t 15- 10 ø 5" o"
Figure 1. Location of the BOFS core sites, in relation to the deep circulation pattern in the northeast Atlantic. LNADW also enters the eastern Atlantic basin between Scotland and the Faeroe Islands (Wyville Thompson Ridge), and at certain times may spill over into the Rockall Trough. (Information from McCartney, [1992], Lonsdale and Hollister, [1979], and Dickson et al. [1985]).
slices. The samples were split by wet sieving at 63 I.tm, and the particle size distribution of the <63 I.tm fraction was determined using a Micromeritics SediGraph 5000ET analyzer. Details of the procedure and the computer interface used in processing of the raw data are given by Jones et al. [1988].
Age models for the BOFS cores were constructed by AMS inc dating of foram samples from core 5K, and correlation to the rest of the suite via oxygen and carbon isotopes, (carried out at Godwin Laboratory, Cambridge), magnetic susceptibility, carbonate content, ash peaks and x- radiographic characteristics [Manighetti et al., this issue]. Ages in this work are reported as calendar years, calibrated from 14C years using the marine data sets of Stuiver and Braziunas [1993] and Bard et al. [1993], with the program Calib 3.0 [Stuiver and geimer, 1993]. For samples with •4C- based ages greater than 18,760, a constant offset model of plus 3182 years for calend•r years is assumed.
Core Location and Hydrography
The BOFS benthic sampling program was centered on a north-south transect along 20øW, with core sites in depth transects from 1100 to more than 4500 m deep. The study includes cores from the Hatton Drift and Hatton-Rockall
Basin, down the slopes of the Rockall Bank to the South Rockall Gap, and across to the East Thulean Rise (Figure 1). CTD data from 14 deep casts across the area enable recognition of the principal water masses at deep to intermediate levels, based upon the potential temperature (0) and salinity characteristics of North Atlantic water masses [Harvey, 1982] (Figure 2).
The densest water in the BOFS area is found in the
South Rockall Gap, with a potential temperature below 2.5øC but less saline than waters immediately above. It also has a high silica concentration [Lunel, 1990], suggestive of

MANIGHETTI AND MCCAVE: LATE GLACIAL AND HOLOCENE PALAEOCURRENTS
295 300 302 303 304 305 i i i I I 0
1000 SAIW •<•'•)
(>35.2)
•<•4.9) L S W 2000
/k D ..:.:::' •^• I-, 1"I :.::::iii½::" 3000 (•34 95} ...v..
BANK
4ooo .-..':':':'::'•?•:k•[ 50•N 51'•N 52ON 53•N 54•N 551N
613
318 320 314/321 317 312 311 323 ,
I'"_ "t/X ' _ .. & %X[ (>35.2)
1000
C L S.w ••.'-':••ij i:' •l•r•• • (<34.9) ff ,4.:i•:iiii!::' _ ROCKAL• 2000 '" BASIN
:::::.:.::::.... -•v A D ,e,
3000 [ S. ICELAND MAURY BASIN CHANNEL
ß
' 9 • 23ow 22'•W 21ø•W 20 l'w 1 W 18øW 172W
Figure 2. (a) Cross section roughly south-north, from the East Thulean Rise across the South Rockall Gap to the slopes of Rockall Bank, showing the position of BOFS core sites 5K-11K. The water column is divided to show the different water masses, with end-member salinities given in brackets. Sense of flow is shown by circled crosses (flow "into the page") and dots (flow "out of the page"). Data from Manighetti [1993]. (b) Cross section roughly WNW-ESE from Gardar Drift across the South Iceland Basin to Hatton Bank, showing the location of BOFS core sites 14K and 17K. Water masses and sense of flow are marked as described for Fig, ure 2a.
southern origin, and is believed to be modified Antarctic Bottom Water (AABW), also referred to as "Eastern Basin Bottom Water" (EBBW) [Harvey and Theodorou, 1986], or "Lower Deep Water" [McCartney, 1992]. By the time this southern source deep water reaches the eastern basin of the Atlantic, it still maintains the higher nutrients and lower salinity and oxygen characteristic of its origin, but has entrained warmer water and its temperature is well above the
1.8øC accepted as the maximum for AABW. We therefore adopt the term "Southern Source Water" (SSW) in referring to it.
SSW forms part of the continuation of the deep current flowing northward along the European continental margin [Dickson and Kidd, 1986] which is deflected to the west by the Hatton-Rockall Plateau [Lonsdale and Hollister, 1979; McCave et al., 1980]. The current also includes a cold water mass characterized by a salinity maximum at roughly

614 MANIGHETTI AND MCCAVE: LATE GLACIAL AND HOLOCENE PALAEOCURRENTS
3000 m, indicative of Lower North Atlantic Deep Water (LNADW, Figure 2). This water mass may include water which has recirculated east of the Mid-Atlantic Ridge [Schmitz and McCartney, 1993] together with water which overflowed deep sills into the eastern Atlantic basin through fracture zones in the south [Metcalf et al., 1964], and possibly a contribution from waters intermittently overflowing the Wyville Thompson Ridge into the Rockall Trough [Jones et al., 1970, Dickson and Kidd, 1986].
Labrador Sea Water (LSW) or Upper North Atlantic Deep Water (UNADW, lmbrie et al. [1992]) is found above LNADW at intermediate levels (1-2 km) and is characterized by low salinity and temperature [Worthington and Wright, 1970]. LSW moves south and east from source, spreading across the Atlantic and recirculating north and south [McCartney, 1992]. At a similar level, a small core of more saline water is found in
CTD cast 304 (Figure 2), and may be a remnant of Mediterranean Outflow Water [Harvey, 1982]. At shallower levels in the west of the area, Sub-Arctic Intermediate Water (SAIW) occurs as a moderately fresh but cool mass centered on approximately 500 m, and to the east, Eastern North Atlantic Water (ENAW) is warmer and more saline at the same depth. The subsurface boundary separating these two is the polar front [Harvey, 1982].
Defining an Input Function
3.5
2.5
1 ,
0,
I I
[] average glacial clay flux
- [] average glacial fine silt flux -
;:i:i_:_:i:i:i:i_:_•:i:i:i:i:}i:i:i:i:i:i:i:}}i:• [] average glacial coarse silt flux •-z_-_:__________• ....... _
..........................
..........................
=========================== :zzz-_-zz-:--_-_--_--_-•czz-_--_--_--_--_-•-_--_--_-• ....................................................
..........................
..........................
m _
.................................................. ...................................................
................................................... ...................................................
................................................... ...................................................
................................................... ...................................................
:::::::::::::::::::::::::::::::::::::::::::::::::::: ::::::::::::::::::::::::::::::::::::::::::::::::::: ":':':':':':':':':':':':':':':':':':':':':':':':': ':':':':':':':':':i:':;:':':':':':':':':i:':i:':':' ..................................................
I I
5K 6K 7K
Core
Figure 3.' Average glacial flux of noncarbonate sediment in different size classes to cores 5K, 6K and 7K from the East
Thulean Rise. Core 7K appears to have lost much of its fine material to downslope locations such as core 5K. Core 6K is unaffected by either loss of fines or accumulation of excess, due to its topographic position on a gentle local high. The average glacial flux of noncarbonate sand is constant at all sites, reflecting the lack of mobility of this fraction.
Topography and Input
The cores from the East Thulean Rise (5K, 6K and 7K) are located well away from the axes of major currents, and so the size characteristics of the sediment should reflect the pelagic flux in the area. The rise is separated from the Rockall Plateau by the South Rockall Gap, and from the continental shelf by the Porcupine Abyssal Plain (Figure 1), such that the cores are isolated from potential changes in size input of continental detritus due to sea level fluctuation. However, they differ quite markedly in sedimentation rate (2.1-5.2 cm ka '1 average between the last glacial maximum (LGM) and present), and in the size distribution of their material, as shown below. This is a direct result of the local topography, and illustrates the variability of burial flux over a small area unaffected by currents. Core 7K is on the exposed crest of the rise, whereas 5K is situated in a hollow at the base of slopes to the north and east. The glacial noncarbonate flux at cores 5K and 7K appears to differ in opposite respects (5K high and 7K low in fines), as if the high flux at 5K is a result of accumulation of material winnowed off places such as 7K (Figure 3). The coarse fraction is much less variable than the fines, suggesting that it is not mass movements which cause the redistribution, but
rather a process affecting only the fines. Core 6K is from an intermediate topographic position on a gentle local high, and the observed flux is roughly intermediate between that of 5K and 7K. It is unlikely to be subject to either extensive winnowing or focusing of sediment, and is therefore the best recorder of average unmodified input flux.
The similarity between the average Holocene carbonate flux values in core 6K [Manighetti and McCave, this issue] and the water column flux in sediment traps [Honjo and Manganini, 1993; Newton et al., 1995] supports the
suggestion that this core site accumulates a sediment sequence unmodified by either bottom currents or topographic focusing. It can therefore be used as a "standard" pelagic site to define the characteristics of the input flux over the BOFS area.
The Coarse Fraction
First we must evaluate our input function of fluxes across the BOFS area. The flux of noncarbonate sand (>63 !xm) is suitable as an indicator of ice-rafted flux, since this fraction is too coarse to be influenced by moderate currents (speeds less than -20 cm s'l), and is largely unaffected by topographic focussing (Figure 3). The glacial noncarbonate sand flux at the southernmost sites (5K, 6K, 8K) is extremely similar whether in a drift location or a pelagic setting, and at depths from 2800 to over 4000 metres (Figure 4). Up the slopes of Rockall Bank (9K, 10K, 11K), the flux declines considerably, but maintains a broadly similar distribution in time. This suggests that the more northerly sites are simply receiving less of the same ice-rafted material that accumulates further
south.
The shallow sites on the northwest slope of Hatton Bank and the Hatton-Rockall Basin (14K and 17K) have a history of coarse noncarbonate flux very similar to that of 9, 10 and 11K, with glacial values in the region of 0.4 gcm '2 ka 'l and Holocene values of under 0.2 gcm '2 ka 'l, although several hundred kilometers further north. In contrast to the more
southerly sites, they lack the spikes of the "Heinrich events" [Broecker et al., 1992] at 18 and 25.5 ka (calibrated years). Overall, the pattern of delivery of ice-rafted input is remarkably constant at all sites, although the magnitude of

MANIGHE• AND MCCAVE: LATE GLACIAL AND HOLOCENE PALAEOCURRENTS 615
Coarse Non-Carbonate Flux (g/cm2/ka)
1.5 2 0 0.5 1 1.5 2 0 0 0.25 0.5 0.75 1 I I I I I I I ß
6K 9K 5K
0 0.5 1
0 •
5
Cal 1 Age
(ka) 2O
25
3O •2865m
i
0.5 1 1.5 2 I I
8K
4045m
i
3268m i i
Cal
1
Age
(ka) 2O
25
3O
0.25 0.5 0.75 I
10K
0 0.25 0.5 0.75 1 I I I
11K
,
2777m ,•2oo4m I i i i
0.25 0.5 0.75 1 I I
14K
1750m
0 0.25 0.5 0.75 I I I
17K
• 1150m i i
Figure 4. Flux of coarse noncarbonate sediment (>63 gm) over the past 30 ka at BOFS core locations. Note the strong similarity between the records from the East Thulean Rise (5K and 6K) and the nearby deep drift location in the South Rockall Gap (8K). At cores 9K, 10K and 11K, from the slopes of Rockall Bank, the absolute values are lower than at 5K, 6K and 8K, but the pattern of variation through time is very similar. At sites from the northwest slope of Hatton Bank and the Hatton-Rockall Trough, (14K and 17K), the main difference compared to more southerly sites is the lack of pronounced Heinrich peaks at 18 ka.
the flux declines from south to north, as observed before
[Ruddiman, 1977; Grousset et al., 1993]. Since even the least mobile constituents of the flux vary in magnitude between sites, it may be impossible to define an input function in terms of grams of sediment per ka in different size classes which is directly applicable in all areas. It is possible, however, to set out the expected relative changes downcore in the different fractions, so that deviations due to current
sorting can be recognized. Input of the coarsest material varies consistently, and since ice transported detritus is characteristically unsorted, it is likely that the input flux of finer material by ice rafting also varies proportionately. The next step is to examine the downcore pattern of size characteristics of the flux and determine whether it is similar
at all sites.
Grain size variation in time and between sites may result from differences in input such as those associated with the presence of Heinrich layers. Productivity changes are another potential source of variability. Carbonate flux data [Manighetti and McCave, this issue] suggests that coccolith production was reduced during the glacial, and foraminiferal species abundance also varies significantly over this period in core 5K [Manighetti et al., this issue]. The difference in water depth of the BOFS sites also means that some sites are affected by dissolution to a greater extent than others. In order to eliminate variability resulting from productivity and dissolution effects, the grain size analysis was carried out on the noncarbonate fraction. The biogenic silica content of the BOFS cores is under 1%, and so the noncarbonate fraction
therefore approximates the "terrigenous" flux.
616 MANIGHETFI AND MCCAVE: LATE GLACIAL AND HOLOCENE PALAEOCURRENTS
Silt Percentage
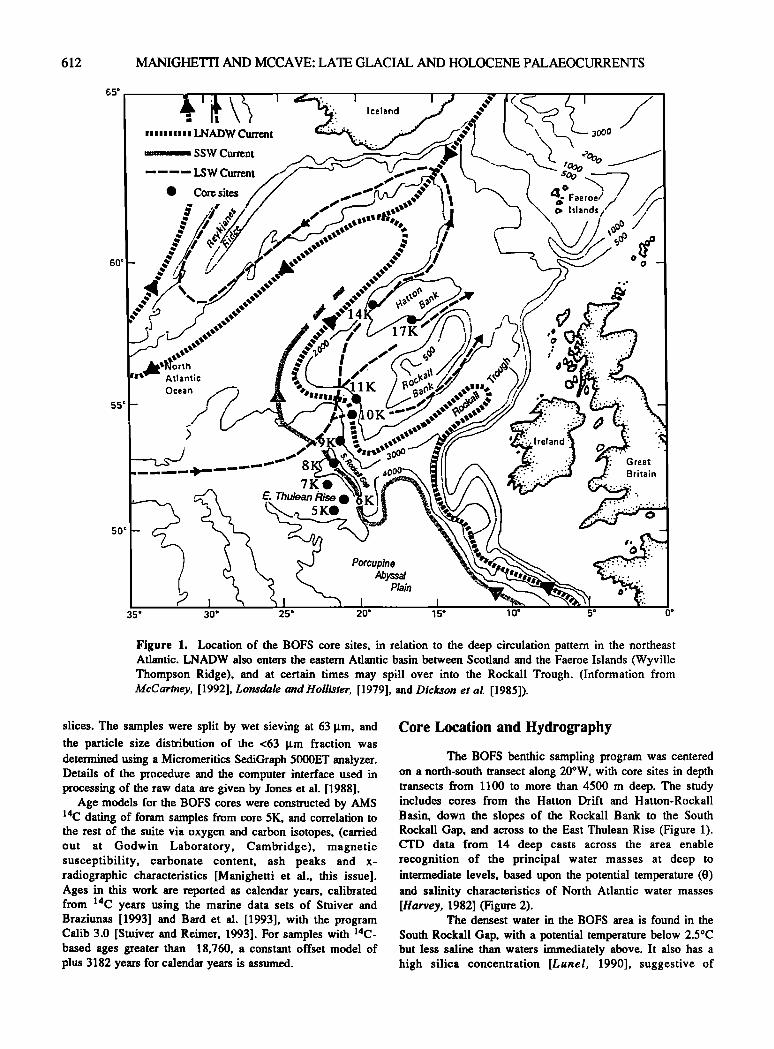
Since the coarse fraction is not moved by moderate currents, we must look at the <63 [xm fraction to detect signs of current modfication. We can only define a useful standard "input function" if the size characteristics of the fine fraction input flux remain intact even after topographic focusing, such that a similar downcore pattern is observed at all sites not size-sorted by currents. It is possible that cores from sites of strong bottom currents will have much of their very fine material removed, leaving behind sediment with a high percentage of silt. Silt percentages for a selection of the BOFS cores vary in a similar fashion between glacial and interglacial times (Figure 5). The magnitude of the glacial- interglacial gradient varies between cores, but all records indicate a higher glacial silt percentage. If this parameter is indeed sensitive to current velocity as well as input, then our data suggest that no major fluctuations took place in the current regime over this period. It seems likely, however, that the silt percentage of a sample will be governed primarily by input, and small changes due to winnowing may be completely swamped by input-related changes in flux.
The Fine Silt Fraction
Looking more closely at the fine noncarbonate component of the sediment, we might detect signs of current activity in the behaviour of the fine silt fraction (2-10 •m). The flux of this fraction varies quite markedly between cores, from well under 0.2 gcm '2 ka 'l in core 11K to around 1 gcm '2 ka 'l in the glacial at core 8K (Figure 6). The mean size, however, is remarkably constant in all the cores despite the large differences in flux, averaging about 3.6 Ixm during the glacial (Figure 7). The lack of variation in the mean size of this fraction could be interpreted as evidence for constant bottom current speed over the past 30 ka. It is more likely, though, that neither the silt percentage nor the fine silt mean are good
recorders of bottom current fluctuation, and that both record a
more or less constant size input, providing further evidence that the grainsize characteristics of the vertical flux are constant across the BOFS area.
To understand why the fine silt fraction does not seem to be recording differences in current velocity between the core sites, in spite of evidence for present day current activity around the margins of Rockall Bank, we must consider the nature of marine sediment. McCave et al. [this issue] present evidence that fine silt in hemipelagic sediments such as those from the BOFS cores acts cohesively after deposition and forms aggregates in suspension, preventing sorting on the basis of primary particle size from taking place. It consequently fails to record moderate changes in current velocity which may be capable of eroding larger particles.
Since a large percentage of the total sediment is in the fine silt and clay range, grain size parameters which include these fractions (such as silt percentage or mean size of the fine fraction) will probably not record changing current velocity unless the change is very large: subtle Variations will be swamped by a high population of frees. The similarity of the coarse fraction flux at all sites supports the idea that movement of terrigenous sand by bottom currents in the BOFS area is not significant, and therefore the clearest record of bottom current activity is likely to be found in the medium to coarse noncarbonate silt fraction (10-63 [xm), called "sortable silt" by McCave et al. [this issue]
The Record of Bottom Current Activity
The Percentage of Sortable Silt
Grain size parameters examined so far (Figures 4-7) show a general trend of high glacial and lower interglacial values. The percentage of sortable silt behaves in a similar manner (Figure 8), with the main variation between sites being in the glacial-
% Non-Carbonate Silt (2-631•rn)
20
0 ß
5-
10-
25-
3O
40 60 80 20 I I
5K
3547m
40 40 40 60 80 I I I
60 80 20 I
6K
2865m
i
40 60 80 20 I I
8K
4045m
i i
60 80 20 I
10K
2777m
17K
1756m
Figure 5. Noncarbonate silt percentage (2-63 [xm) through time for a selection of the BOFS cores. Although the magnitude of glacial-interglacial variation is greater in some cores than others, all show higher silt during the glacial.

MANIGHETI'I AND MCCAVE: LATE GLACIAL AND HOLOCENE PALAEOCURRENTS 617
Fine Silt Flux (g/crn2/ka)
o
o ß
5
O 15-
20-
25-
30
0.4 0.8 1.2 0 I I
6K
E. Thulean Rise
0.4 0.8 1.2 0 I I
IlK
S. Rockall Gap
i i
0.4 0.8 1.2 0 i i
gK
Slopes of Rockall
I I
0.4 0.8 1.2 0 I I
11K
Slopes of Rockall
i i
0.4 0.8 i i
17K
Rockall Basin
Figure 6. Flux of fine noncarbonate silt (2-10 I. tm) in BOFS cores over the past 30 ka. Flux varies markedly between cores, reflecting different sedimenlation rates.
interglacial gradient. Clearly, though, the percentage of any fraction is dependent upon the amount of other material, and therefore a more sensitive parameter is likely to be the mean size of the sortable silt fraction.
The Mean Size of the Sortable Silt Component Material in the 10-63 I. tm fraction is fine enough to be
influenced by currents of moderate strength, while being generally above the threshold of cohesive behavior [McCave et al., this issue]. The mean size of this fraction reflects the vigor of bottom currents acting at the time of deposition, increasing with current speed as the finer non-cohesive silt is winnowed away. The mean size of the sortable silt fraction at
core 6K is plotted for the past 30 ka (Figure 9), and the smoothed record is compared with those of other cores. The profile at core 6K is very similar to that of 5K, as expected in view of their proximity, and the fact that both are considered to be unaffected by currents. Sortable silt at 5K is slightly finer (by about 1 I. tm) than that at 6K during the glacial, and this may indicate that absolute values vary with topography and only the pattern of variation can be compared between sites.
Core 9K is remarkably similar to 6K, although it was collected from the slopes of Rockall rather than the East Thulean Rise. The absolute values were slightly higher in the glacial than 6K, but the pattern is almost identical. This
Fine Non-Carbonate Silt Mean (2-101•n)
3 3.4
0 ß I
5-
10-
25-
30 •
3.8 4.2 3 3.4 3.8 4.23 3.4 3.8 4.23 3.4 3.8 4.23 3.4 3.8 4.2 I I I I I I I I I ß
6K 8K 9K 11K
I
Figure 7. Mean size of the fine noncarbonate silt fraction (2-10 I. tm) over the past 30 ka. Despite marked differences in flux (Figure. 6), the mean remains fairly constant between cores, averaging about 3.6 •m during the glacial.

618 MANIGHE• AND MCCAVE: LATE GLACIAL AND HOLOCENE PALAEOCLTRRENTS
%Sortable Silt (10-631•'n)
0 8 16
i • •5K lO
15
20
25
3Ol , ,
24 0 8 16 I I
6K
24 0 8 16 I I
8K
24 0 8 16 24 0 I I
i i
8 16 24
I I
_
_
i
Figure 8. Percentage of sortable silt (10-63 !xm) in BOFS cores over the past 30 ka. A similar pattern of high glacial and lower interglacial values is observed in all cores, resembling that of other grain size parameters (Figures 4-7). The absolute values reflect the abundance of other size components, and are largely dependent upon topography.
indicates that the site of core 9K has experienced very little change in flow speed over the past 30 ka. By contrast, the 8K record, presently under SSW, shows features which are not apparent in any of the other size parameters examined so far, with a prominent low in mean between 28 and 22 ka, and then a marked high until 18 ka. A second low occurred between 17.5 and 15 ka.
The sortable silt mean record for core 10K also shows very pronounced differences from the 6K input time trend (Figure 9). At Termination 1A, the mean dropped dramatically to a minimum during the Bolling-Allerod. A brief, sharp increase then occurred, lasting until the start of the Younger Dryas, followed by another sharp drop until Termination lB. At core 11K, the record shows distinctly higher glacial and lower Holocene sortable silt means. There is also a period of higher silt mean extending from the Younger Dryas through to the end of Termination lB. The profiles for 14K and 17K show a silt mean lower than 6K at all times since 30 ka B.P. Core 14K
has a roughly constant offset from 6K until the Younger Dryas, when the mean rises to a maximum around Termination lB. At the end of lB, the mean falls off to give Holocene values considerably lower than 6K. At 17K, the early stage 2 mean is almost equal to 6K, but declines steadily from Termination 1A to lB, remaining constant but very low in the Holocene. Caution must be exercised in the interpretation of these records, since the cores are from rather shallower water, quite a long way north of 6K and the Rockall slope cores, so that the primary flux probably differs from the standard 6K input function in absolute terms. Nevertheless the temporal pattern of variation of coarse noncarbonate material, silt percentage, fine silt flux and mean of the fine silt fraction are all sufficiently similar to the slope cores that comparisons can be made with some confidence.
Difference From the Input Function
The importance of the data presented so far lies in the relative changes in silt mean recorded under different bottom current regimes, rather than in the absolute values at any particular site. Several distinct events can be distinguished in records of sortable silt mean plotted as differences from the input function, that is, from the smoothed 6K profile. (Figure 10). Records from 8K and 10K show a prominent peak between the LGM and start of Termination 1A, and a sharp decline to a minimum near the end of Termination 1A. An
abrupt increase occurred during the Allerod warming, especially pronounced in 10K, until the the beginning of the Younger Dryas. The mean then decreased again to a minimum in the late Younger Dryas, particularly in 10K, before picking up again during Termination lB. Core 9K shows very little difference from the input function throughout the last 30 ka, except for a slightly increased (by 1-2 !xm) mean size between the LGM and Termination 1A. This may be because it is situated in a local hollow, in the lee of a tail of the Feni Drift, and thus is shielded from currents turning northwest around the Rockall Bank by the presence of the drift.
By plotting deviation from the input function, it becomes apparent that core 11K, from the slopes of Rockall, has a strikingly similar record to 17K, and also resembles 14K (Figure 10). All three rise from a low at the LGM to a peak just before the start of Termination 1 A, most pronounced in 11K and 17K. Cores 11K and 14K both show low silt mean in mid-
Termination 1A, and rise to highs during late Younger Dryas. All three cores also show a dramatic fall (of 4-5 !xm) in silt
mean during the early Holocene. This is encouraging, since 11K is from significantly further south than 17K, much closer to the location of 10K. If the variations were mainly a result

MANIGHE• AND MCCAVE' LATE GLACIAL AND HOLOCENE PALAEOCURRENTS 619
Sortable Silt Mean (10-631am)
28
.lB
YD
, B-A
1A
LGM
27 15
Figure 9. Mean size of the sortable silt fraction (10-63 I. tm noncarbonate) over the past 30 ka. The record for 6K is smoothed with a three-point moving average, and the resulting profile is plotted with each of the other core records to show deviation from a standard (non current-affected) input. Cores 5K and 9K are remarkably similar in mean size to 6K, but 8K shows a marked difference between the LGM and the Younger Dryas. Striking differences are also evident in the profile of core 10K, compared with other cores from the slopes of Rockall Bank (e.g., 9K and 11K). These differences are believed to be attributable to bottom currents. Cores 14K and 17K, from the northern part of the area, are strongly negative with respect to the 6K profile, but this may be partly due to the difference in size distribution of the input further north. lB, Termination lB; YD, Younger Dryas; B-A, Bolling-Allerod; 1A, Termination 1A; LGM, last glacial maximum.
of geographic control of the input flux, then 11K should resemble 10K rather than 17K. It appears that the absolute value of the sortable silt mean may indeed have a broad geographic control, since the core top value of sortable silt mean at 11K is similar to 10K, and markedly different from 14K and 17K. However, the similarity between 11K and 10K does not extend downcore into glacial times, indicating that they were subject to different flow regimes, and experienced size sorting under the influence of different bottom currents.
Discussion: Evidence for Changing Ocean Circulation Patterns
Interpreting the Grain Size Records
The apparent covariation of the sortable silt mean from the present SSW-influenced and NADW-influenced core sites (8K and 10K) suggests a strong link between the velocity of the
620 MANIGHETTI AND MCCAVE: LATE GLACIAL AND HOLOCENE PALAEOCURRENTS
Deviation (IJ.m) from 6K
-4 -2 0 2 4 6 4 -2 0 2 4 6 -8 -6 -4 -2 0 2
o ! ' ' ' • • I I • ; I I
9K 10K
s 3268m 2777m
•o lB
• ....................................................................................... •* .f B-A
...................................... ß :• .......................................................... LGM
-6 -4 -2 0
0
5-
20-
25-
30
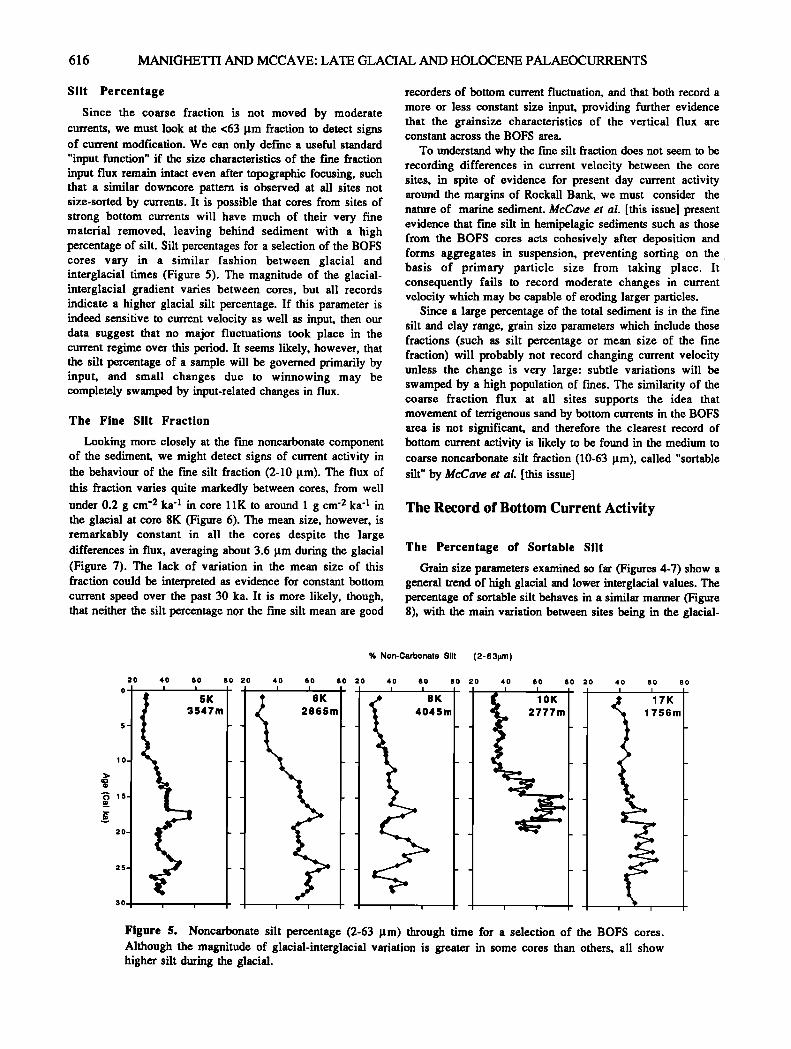
Figure 10. Sortable silt mean in BOFS cores expressed as deviation, in micrometres, from the 6K input function. The 6K record was three-point smoothed with a 1:1:1 moving average, and other core data is smoothed with a 1:2:1 average. Prominent peaks and troughs discussed in the text are marked with dots. Note the strong similarity between the profiles for 8K and 10K during the glacial, and the covariation of shallower water records IlK, 14K and 17K up to Termination 1A.
two water masses. Alternatively, the similarity could arise from changes in the depth domain of either water mass, such that both sites experienced the same current regime. There are two main possibilities: (1) low supply of SSW to the eastern North Atlantic or (2) A rise in the SSW-LNADW interface because of a decline in LNADW flux, perhaps accompanied by an increase in SSW flux.
If AABW produced during glacial times was denser than at the present day, perhaps due to more extensive sea-ice freezing yielding higher salinity [Zahn and Mix, 1991], then it may have been unable to penetrate as readily into the eastern basin of the Atlantic across the sill depth of 3750 m, and perhaps did not contribute to the flow at core 8K at all. In this case, the 8K record would be similar to 10K because both
are recording the flow of LNADW. The depleted •jlac signature observed in glacial deep Atlantic benthic foraminifera [e.g.
Duplessy et al., 1988] would then need to be explained by aging of this semi-stagnant NADW, producing characteristics similar to present day SSW. However, semi-stagnant water would not produce the bursts of speed recorded in the silt mean data (Figure 9).
The second explanation for the covariation of the two records could be a volume effect, which would not require any change in AABW production rate or density characteristics. If production of LNADW in the North Atlantic declined during the glacial, then the upper surface of SSW would probably have risen. The speed of SSW flow would then also have varied as a consequence of changing its volume. If NADW production dropped and SSW volume increased, its flow speed must also have declined unless it was being produced at a faster rate. Oppo and Lehman [1993] calculated that equal parts of southern source water and NADW entered the eastern basin
MANIGHETYI AND MCCAVE: LATE GLACIAL AND HOLOCENE PALAEOCURRENTS 621
during the last glaciation, as opposed to the proportion of 1:4 today, whereas Beveridge et al. [this issue] suggest the glacial SSW: NADW ratio was as high as 3:1. This could be achieved by raising the depth of the upper surface of SSW in the western basin, without necessarily increasing its advection rate, though this would increase the residence time.
A further link between NADW production and SSW velocity may arise from Crowley's [1992] argument that southern hemisphere mean temperature declines as a result of high NADW production, in contrast to the view of Weyl [1968]. Upwelling of relatively warm NADW around Antarctica provides heat and salt, promoting seasonal ice melting, but another, more important negative feedback is also believed to operate. In order to conserve volume, the southward export of NADW across the equator is accompanied by import of an equivalent volume of much warmer water from the shallow layers of the South Atlantic (Antarctic Intermediate Water, AAIW). The southern hemisphere loses heat as a result of this exchange, which could promote sea ice formation at high latitudes. Increased sea ice freezing in the Antarctic around the LGM was proposed by Zahn and Mix [1991] to account for the observation that benthic foraminiferal fi180 is 0.1-0.2%o
lower in Atlantic bottom waters (SSW, >4 km) than in deep waters (NADW, 2-4 km). Although increased sea-ice production does not necessarily imply higher relative density, this might be the result, and an increase in the velocity of deep thermohaline currents could be a consequence. In such a case, SSW velocity would be directly correlated with NADW production.
The two deep water records from 8K and 10K do not indicate a consistently low current velocity during the last glacial, but clearly show a strong pulse in activity between the LGM and early Termination 1A (Figure 10). If SSW velocity and NADW production truly varied sympathetically, then these results indicate a low NADW production during stage 2, followed by an abrupt increase starting around the last glacial maximum. An early resumption of NADW production may therefore have accelerated deglaciation at a time of gradually rising summer insolation in the northern hemisphere. The cause of the change in circulation mode just before the termination is unclear, but increasing summer insolation may have brought about changes in the evaporation-precipitation balance and caused a melting of sea ice in the Nordic Seas [Broecker et al., 1985]. Although having little effect on sea level and oxygen isotope records, this may have had a considerable effect upon the wind field, allowing warm Atlantic water to be driven northward, and supplying the salt that increases convection [Imbrie et al. 1992]. The apparent "switch-off" after the start of Termination 1A might be explained by the effect of meltwater in surface layers preventing attainment of sufficiently low densities for deep waters to form. The influx of large volumes of meltwater from drifting icebergs during Heinrich event 1 (around 18 ka) may have been the trigger for cessation of production.
The rapid, sharp pulse of increased current speed implied by the sortable silt mean data during the Allerod warming may also be a response to changes in the balance of the precipitation-evaporation cycle during the deglaciation. However, the record at 10K indicates that recovery was short- lived, and a second sharp fall in speed took place at the start of
the Younger Dryas. It may be that the amelioration of temperatures during the Bolling-Allerod led to enhanced meltwater influx to the northern Atlantic, which slowed down
deep water production again and pushed the system briefly back into the glacial mode [Broecker et al., 1985].
McCartney /1992] and Schmitz and McCartney [1993] have suggested that at present there is a cyclonic recirculating gyre of water colder than 4øC, with a transport of 5Sv, lying south of Rockall Bank and east of the Mid-Atlantic Ridge below about 1000 m depth. The flow through South Rockall Gap of SSW and LNADW is part of this gyre, and a further possibility for coherent fluctuations in inferred flow speed at sites 8K and 10K is that they represent changes in the intensity of this recirculation. However, there are at present no suggestions as to how this gyre is driven, and we do not know whether it would have remained in its present location during the glacial with the Polar Front to the south.
The variation in the speed of bottom currents at intermediate water sites (14K and 17K) may be explained by changes in the production rate and depth domain of intermediate waters through the last glacial to Holocene. Although 11K is at present dose to the top of LNADW (Figure 2), the strong similarity to the silt mean records of 14K and 17K indicates that the southwest slopes of Rockall Bank at 2000 m depth were also dominated by intermediate waters during the glacial. The source of this water is, however, unclear. Cores 11K, 14K and 17K behave similarly during the glacial through to the end of Termination 1A (Figure 10), suggesting that a single glacial intermediate water mass covered depths from 1100 to over 2000 m in the eastern North Atlantic. In general, flow speeds were greater during the glacial than in the Holocene, probably in response to enhanced production.
Modem day ENAW is only present south of the polar front [Harvey, 1982] and is replaced by SAIW in more northerly locations. Movement of the position of the polar front over the last glacial is documented by the occurrence of polar faunal assemblages and low calculated sea surface temperatures in cores from as far south as Portugal [Ruddiman et al., 1977; Bard et al., 1987]. It seems likely, therefore, that a water mass similar to modem S AIW bathed the Hatton-Rockall area during the glacial, but it may also have included waters formed at different sites. Clay mineral evidence for a current across the Wyville-Thompson Ridge and down the Rockall Trough (the "Feni Glacial Current", Zimmerman, [1982]) indicates that intermediate water was probably being produced in the Norwegian Sea during the glacial. This is supported by Veum et al. [1992] who identify a rapid surface-to-deep transfer of isotopic signals, and infer from depleted benthic fi180 that deep water formation took place in the Norwegian Sea via a mechanism strongly influenced by sea ice freezing. We will follow Duplessy et al. [1988] and Oppo and Lehman [1993] who use the term "Glacial North Atlantic Intermediate Water"
(GNAIW) for mid-depth waters in the NE Atlantic of uncertain origin.
The site of 14K (1756 m) is at present influenced by Labrador Sea Water (LSW), involved in a cyclonic recirculation around the eastern and northern margins of the sub-polar basins in the Deep Northern Boundary Current (DNBC) [McCartney, 1992]. During periods of low DNBC
622 MANIGHETFI AND MCCAVE: LATE GLACIAL AND HOLOCENE PALAEOCURRENTS
activity, LSW may have been replaced in its depth domain by other "GNAIW", explaining the similarity in sortable silt records between 14K, 11K and 17K. Decoupling of the record at 17K from 14 and 11K after Termination 1A may indicate that GNAIW production declined, or that LSW production increased, such that GNAIW was restricted to depths above 1700 m. Core 11K and 14K show a rise in current speed to a maximum during the Younger Dryas, while at 17K there is a slight decline. It is noteworthy that the maximum production of GNAIW occurs at the end of cold periods, just before Terminations 1A and lB (Figure 10). Around Termination lB, however, all three sites experience a rapid drop in current speed to minimum values between 2000 and 5000B.P.. In more recent times, it seems that intermediate water production has increased slightly.
Geochemical Evidence for Ocean Circulation
The variations in current speed implied by the sortable silt mean data must be examined in the light of other evidence for changing circulation patterns in the ocean over the last glacial cycle. Boyle and Keigwin [1982, 1985, 1987] demonstrated that Holocene benthic foraminifera from the
North Atlantic show a nearly uniform Cd/Ca ratio with depth, whereas glacial foraminifera had a much higher Cd/Ca ratio. By contrast, intermediate depths show a marked depletion in Cd, suggesting a more vigorous production of intermediate waters at the expense of deep waters during the last glacial [Boyle and Keigwin, 1987]. This reconstruction is supported by the 13C/12C ratio in benthic foraminiferal tests, used as a tracer for water mass distribution in past oceans [e.g. Curry and Lobmann, 1983; Oppo and Fairbanks, 1987; Duplessy et al., 1988; Imbrie et al., 1992]. Benthic carbon isotopic and Cd/Ca data on BOFS cores 5K and 17K [Bertram et al, this issue] are consistent with these findings.
Recent measurements of 813C on benthic foraminifera from
the Southern Ocean [Charles and Fairbanks, 1992] show that elevated •J•3C values occurred during a period from the LGM to the start of Termination 1A, declining to a minimum during the Termination, in a sequence similar to that observed in the silt mean data. However, the same data show that nutrient-
poor water was reaching the Southern Ocean during the Younger Dryas, while grain size data suggest a slow down of LNADW production. Lehman and Keigwin [1992a, b] used benthie •j•so, Cd/Ca and faunal records from cores in the Norwegian Sea and the Bermuda Rise to document changes in LNADW production, and their conclusions are consistent with our explanation for the decoupling of 11K and 14K grain size records from that of 17K following Termination 1A, due to expansion of LSW.
Current Variability in the Western North Atlantic
The grainsize data from the eastern North Atlantic show that deep water circulation has fluctuated markedly over the last glacial to present. Such variation is also likely to be recorded in other locations where sedimentation is influenced
by major currents. Haskell et al. [1991] examined the history of noncarbonate silt size variation in sediments from the
Blake-Bahama Outer Ridge (BBOR, 29ø-31øN, 73ø-75øW) and their results make an interesting comparison with this work.
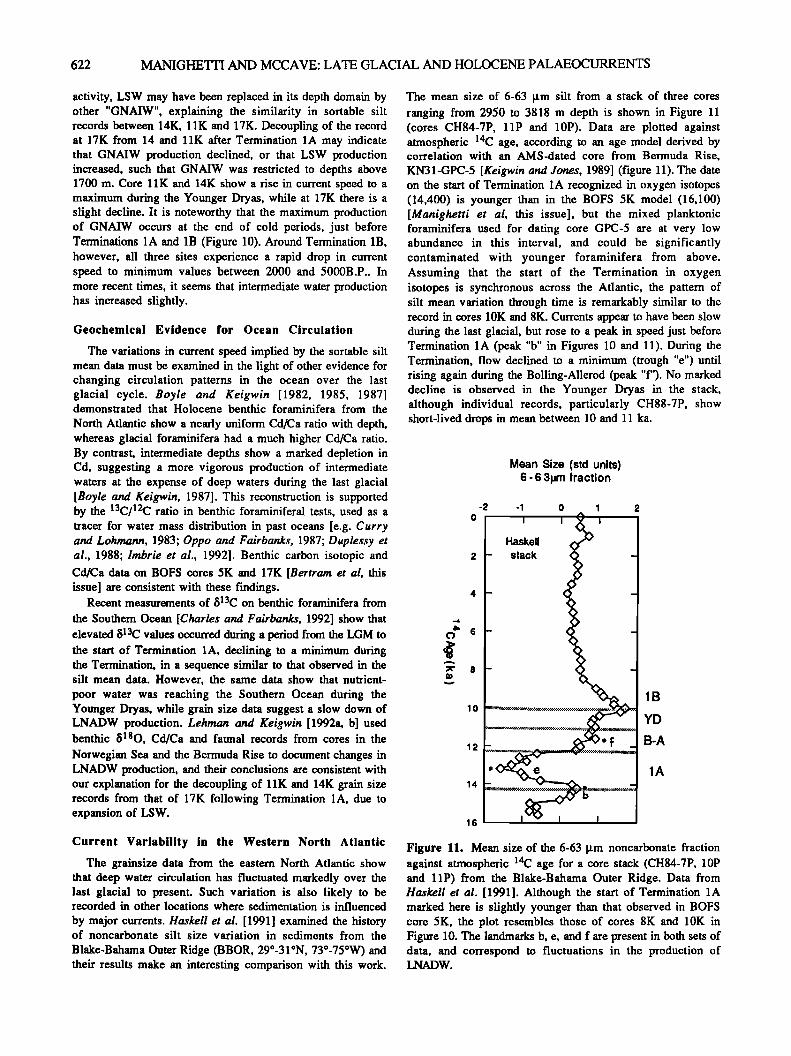
The mean size of 6-63 gm silt from a stack of three cores ranging from 2950 to 3818 m depth is shown in Figure 11 (cores CH84-7P, lip and 10P). Data are plotted against atmospheric •4C age, according to an age model derived by correlation with an AMS-dated core from Bermuda Rise,
KN31-GPC-5 [Keigwin and Jones, 1989] (figure 11). The date on the start of Termination 1A recognized in oxygen isotopes (14,400) is younger than in the BOFS 5K model (16,100) [Manighetti et al, this issue], but the mixed planktonic foraminifera used for dating core GPC-5 are at very low abundance in this interval, and could be significantly contaminated with younger foraminifera from above. Assuming that the start of the Termination in oxygen isotopes is synchronous across the Atlantic, the pattern of silt mean variation through time is remarkably similar to the record in cores 10K and 8K. Currents appear to have been slow during the last glacial, but rose to a peak in speed just before Termination 1A (peak "b" in Figures 10 and 11). During the Termination, flow declined to a minimum (trough "e") until rising again during the Bolling-Allerod (peak "f"). No marked decline is observed in the Younger Dryas in the stack, although individual records, particularly CH88-7P, show short-lived drops in mean between 10 and 11 ka.
Mean Size (std units) 6 - 6 3wn fraction
lO
12
14
16
-2 -1 0 I 2
I I •1 Haskell •
- stack
•.•.•;`.•;-;•;•;v•;•;•;•:-;•;•;•;•;•;-•;v;•nn.•;•;-;-;•;•;<•;•.:• ..:..x.:.-.q.•..:.:•:.:.:.:.:•.:
lB
YD
B-A
1A
Figure 11. Mean size of the 6-63 •tm noncarbonate fraction against atmospheric •4C age for a core stack (CH84-7P, 10P and liP) from the Blake-Bahama Outer Ridge. Data from Haskell et al. [1991]. Although the start of Termination 1A marked here is slightly younger than that observed in BOFS core 5K, the plot resembles those of cores 8K and 10K in Figure 10. The landmarks b, e, and f are present in both sets of data, and correspond to fluctuations in the production of LNADW.
MANIGHE• AND MCCAVE: LATE GLACIAL AND HOLOCENE PALAEOCURRENTS 623
624 MANIGHE• AND MCCAVE: LATE GLACIAL AND HOLOCENE PALAEOCURRENTS
At 3000-4000 m, the BBOR is presently bathed in LNADW, flowing south from source, with no significant SSW component. Yet current speed variations at BOFS site 8K in SSW show a very similar pattern, suggesting that SSW is responding to changes in NADW, rather than driving them. The ocean-wide occurrence of the grain size fluctuations is clear evidence for current-control, rather than provenance changes or sorting by internal waves.
Conclusions
Grain size data on the noncarbonate silt fraction, combined
with flux information can be used to study palaeocurrent fluctuations in the sedimentary record, provided that an input function can be defined. The most efficient recorder of
fluctuating current velocity is the mean size of the sortable silt fraction (10-63 gm), which is small enough to be influenced by currents of moderate strength, but large enough to be above the threshold of cohesive behavior.
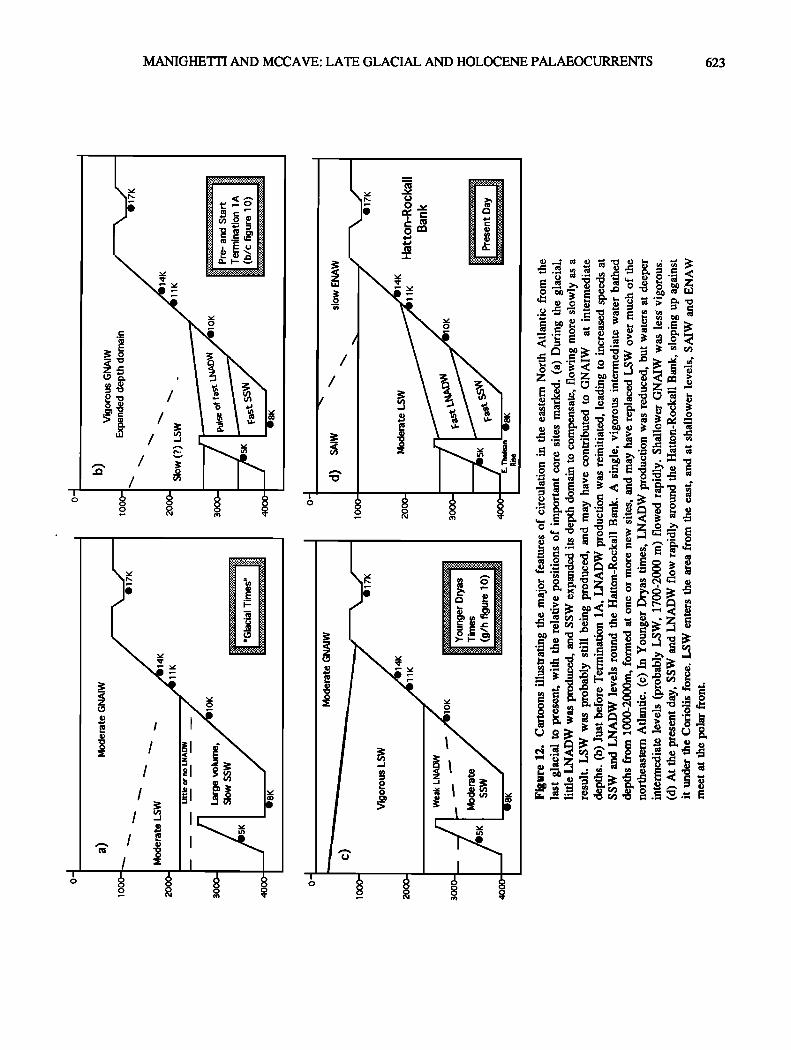
The sortable silt mean from cores in the BOFS area
demonstrates changes in the current velocity of bottom waters at different depths through the last glacial to present, probably related to variations in the production rate and depth domain of different water masses (Figure 12). Levels of the eastern basin which are today bathed in Lower North Atlantic Deep Water were under Southern Source Water during the glacial, as indicated by the cov ariance of silt mean data from the deepest core (SK, presently under SSW) and a core at 2800 m from the slopes of Rockall Bank (10K, presently under LNADW). We think that fluctuations in the flow velocity of SSW through the South Rockall Gap correspond to fluctuations in the production of LNADW, because of a decline in SSW velocity which would accompany an increase in the available volume of its flow during times of low NADW production.
The changes recorded by the sortable silt mean at core sims 8K and 10K suggest that NADW production was low during the last glacial until after the glacial maximum (insolation minimum), in agreement with isotope data. Reduction of sea ice cover in the Nordic Seas then led to an increase in LNADW
production, which eventually caused a major deglacial retreat of ice sheets at Termination 1A, raising sea level and decreasing the b180 value of seawater. The influx of meltwater led to a temporary halt in dense, LNADW production during the termination, for the duration of the first main meltwater
pulse (MWPla of Fairbanks [1989]). At the same time, however, less dense waters were overflowing the Wyville- Thompson Ridge into the Rockall Trough, forming GNAIW. LSW was also being formed by vigorous open ocean convection in response to strong winds. Rapidly ameliorating temperatures during the Bolling-Allerod warm period increased evaporation sufficiently to reinitiate LNADW production in the Nordic Seas, yielding increased deep water flow speeds and causing widespread melting. The melting acted to suppress production once more, deep flow speeds declined, and the Younger Dryas cold period began.
Close similarities between the new data presented here and silt mean records from the Blake-Bahama Outer Ridge [Haskell et al., 1991] indicate that fluctuations in grainsize at the BOFS sites are due to important, ocean-wide changes in the
flow of deep waters, and not to local source effects. This correlation also renders it unlikely that internal waves area a significant factor in the grain size story. The covariance between SSW-records from the Eastern Atlantic and LNADW
on the BBOR suggests that SSW speed varies in response to LNADW production.
Intermediate water cores from the BOFS area indicate that
currents were more vigorous in the glacial than during the Holocene. Covariation of the silt mean records from 1100, 1750 and 2000 m until Termination 1A suggests either that a single water mass covered the entire depth range (GNAIW), or that flow rates in different strata of intermediate water varied
in a similar fashion. We suggest that intermediate water from a variety of sources, including the Norwegian Sea, replaced present-day ENAW over the Hatton-Rockall Bank during the glacial, and reached levels as deep as 2000 m. Following Termination 1A, decoupling of the records at 2000 and 1750m from that at 1150 m indicates that independent sources of intermediate water were important. At depths of around 2000 m, current speed picked up to a maximum in the Younger Dryas, suggesting that LSW formation may have been particularly vigorous during this time. The speed of intermediate water flow declined sharply at all depths following Termination lB, but has risen again slightly over the last 2000 years
In conclusion, this study has shown that simple sedimentological parameters may be used to indicate relative flow speeds in the past. They provide a source of evidence for palaeocirculation changes which is absolutely independent of the other isotopic and chemical indicators of circulation. It is reassuring that these data can be interpreted to show patterns of circulation similar to those inferred from isotopes and chemical tracers, but it is still a source of concern that neither method discriminates satisfactorily between the several hypotheses for changing water mass configurations.
Acknowledglnents. We would like to thank Gillian Foreman for her continued help in the laboratory, and Eric Browne and Dave Martel for assistance with computing. This work has benefitted from discussions with Neil Beveridge, and from reviews by T.C. Johnson and E. Thomas. Barbara Manighetti gratefully acknowledges Clare College, the Board of Graduate Studies and the Department of Earth Sciences, University of Cambridge for their financial support. The work was made possible by NERC grant GST/02/436. BOFS publication #203.
References
Bard, E., M. Amold, R. G. Fairbanks and B. Hamelin, 230Th-234U and 14C ages obtained by mass spectrometry on corals, Radiocarbon, 35, 191-199, 1993.
Bard, E., M. Arnold, P. Maurice, J. Duprat, J. Moyes and J-C. Duplessy, Retreat velocity of the North Atlantic Polar Front during the last deglaciation determined by 14C accelerator mass spectrometry, Nature, 328, 791-794, 1987.
Bertram C.J, H. Elderfield, N.J. Shackleton, and J.A. MacDonald, Cadmium/calcium and carbon isotope reconstructions of the glacial northeast Atlantic Ocean, Paleoceanography, this issue.
Beveridge, N. A. S., H. Elderfield and N.J. Shackleton, Deep thermohaline circulation in the low qatitude Atlantic during the last glacial, Paleoceanography, this issue.
Blaeser, C. R. and M. T. Ledbetter, Deep sea bottom currents differentiated from texture of underlying sediment, J. Sedirnentol. Petrol., 52, 755-768, 1982.

MANIGI-IE• AND MCCAVE: LATE GLACIAL AND HOLOCENE PALAEOCURRENTS 625
Boyle, E. A., Vertical oceanic nutrient fractionation and glacial- interglacial CO 2 cycles, Nature, 331, 55-56, 1988.
Boyle, E. A. and L. D. Keigwin, Deep circulation of the North Atlantic over the last 200 000 years: Geochemical evidence, Science, 218, 784-787, 1982.
Boyle, E. A. and L. Keigwin, Comparison of Atlantic and Pacific palcochemical records for the last 250,000 years: Changes in deep ocean circulation and chenical inventories, Earth Planet. Sci. Lett., 76, 135-150, 1985.
Boyle, E. A. and L. Keigwin, North Atlantic thermohaline circulation during the past 20,000 years linked to high-latitiude surface temperatures, Nature,. 330, 35-40, 1987.
Broecker, W., and G. H. Denton, The role of ocean-atmosphere reorganisations in glacial cycles, Geochim. Cosmochim. Acta, 53, 2465-2501, 1989.
Broecker, W., G. Bond, M. Klas, E. Clark and J. McManus, Origin of the northern Atlantic's Heinrich events, Clim. Dyn., 6, 265-273, 1992.
Broecker, W. S., D. M. Peteet and D. Rind, Does the ocean-atmosphere have more than one stable mode of operation? Nature, 315, 21-25, 1985.
Broecker, W. S., M. Andtee, W. Wolfli, H. Oeschger, G. Bonani, J. Kennett and D. Peteet, The chronology of the last deglaciation: Implications to the cause of the Younger Dryas event, Paleoceanography, 3, 1-19, 1988.
Buffinch, D. L., M. T. Ledbetter, B. B. Ellwood and W. Balsam, High velocity core of the western boundary undercurrent at the base of the U.S. continental rise, Science, 215, 970-973, 1981.
Charles, C. D. and R. G. Fairbanks, Evidence from Southern Ocean
sediments for the effect of North Atlantic Deep Water on climate, Nature, 355, 416-419, 1992.
Crowley, T. J., North Atlantic Deep Water cools the southern hemisphere, Paleoceanography, 7, 489-498, 1992.
Curry, W. and G. P. Lohmann, Reduced advection into the Atlantic Ocean deep eastern basins during the last glaciation maximum, Nature, 306, 577-580, 1983.
Dickson, R. R. and R. B. Kidd, Deep circulation in the southern Rockall Trough - The oceanographic setting of site 610, Initial Rep. Deep Sea Drilling Program, 94, 1061-1074, 1986.
Dickson, R. R., W. J. Gould, T. J. Muller and C. Maillard, Estimates of the mean circulation in the deep (>2000 m) layer of the eastern North Ariantic, Progr. Oceanogr., 14, 103-127, 1985.
Duplessy, J. C., N.J. Shackleton, R. G. Fairbanks, L. D. Labeyrie, D. Oppo and N. Kallel, Deep water source variations during the last climatic cycle and their impact on the global deep water circulation. Paleoceanography, 3, 343-360, 1988.
Fairbanks, R. G., A 17,000 year glacio-eustatic sea level record: Influence of glacial melting rates on the Younger Dryas event and deep ocean circulation, Nature, 342, 637-642, 1989.
Grousset, F.E., L. Labeyrie, J. A. Sinko, M. Cremer, G. Bond, J. Duprat, E. Cortijo and S. Huon, Patterns of ice-rafted detritus in the glacial North Atantic (40-55øN), Paleoceanography, 8, 175-192, 1993.
Harvey, J., 0-S relationships and water masses in the eastern North Atlantic, Deep Sea Res., Part A, 29, 1021-1033, 1982.
Harvey, J. G. and A. Theodorou, The circulation of Norwegian Sea overflow water in the eastern North Atlantic, Oceanol. Acta, 9, 393- 402, 1986.
Haskell, B. J., T. C. Johnson and W. J. Showers, Fluctuation in deep western North Atlantic circulation on the Blake Outer Ridge during the last deglaciation, Paleoceanography, 6, 21-31,1991.
Haskell, B.J., and T.C. Johnson, Surface sediment response to deepwater circulation on the Blake Outer Ridge, western North Atlantic: Paleoceanographic implications. Sediment. Geol, 82, 133- 144, 1993.
Honjo, S. and S. J. Manganini, Annual biogenic particle fluxes to the interior of the North Atlantic Ocean; studied at 34øN 21øW and 48øN 21øW, Deep Sea Res., 40, 587-607, 1993.
Huang, T. C. and N. D. Watkins, Contrast between the Brunhes and Matuyama sedimentary records of bottom water activity in the South Pacific, Mar. Geol., 23, 113-132, 1977.
Imbrie, J., et al., On the structure and origin of major glaciation cycles 1: Linear responses to Milankovitch forcing. Paleoceanography, 7, 701-738, 1992.
Johnson, T. C., E. L. Lynch, W. J. Showers and N. C. Palczuk, Pleistocene fluctuations in the western boundary undercurrent on the Blake Outer Ridge, Paleoceanography. 3, 191-207, 1988.
Jones, E. J. W., M. Ewing, J. I. Ewing and S. L. Ettreim, Influence of Norwegian Sea Overflow Water on sedimentation in the northern North Atlantic and Labrador Sea, J. Geophys. Res., 75, 1655-1680, 1970.
Jones, K. P. N., I. N. McCave and P. D. Patel, A computer-interfaced sedigraph for modal size analysis of fine-grained sediment, Sedimentology, 35, 163-172, 1988.
Keigwin, L. D. and G. A. Jones, Glacial-Holocene stratigraphy, chronology, and paleoceanographic observations on some North Atlantic sediment drifts. Deep Sea Res., 36, 845-867, 1989.
Keigwin, L. D., G. A. Jones and S. J. Lehman, Deglacial meltwater discharge, North Atlantic deep circulation and abrupt climate change. J. Geophy. Res., 96, 16,811-16,826, 1991.
Ledbetter, M. and W. L. Balsam, Paleoceanography of the deep western boundary undercurrent on the North American continental margin for the past 25,000 years, Geology, 13, 181-184, 1985.
Ledbeuer, M. T. and B. B. Ellwood, Spatial and temporal changes in bottom water velocity and direction from analysis of particle size and alignment in deep sea sediments, Mar. Geol., 38, 245-261, 1980.
Lehman, S. J. and L. D. Keigwin, Sudden changes in North Atlantic circulation during the last deglaciation, Nature, 356, 757-762, 1992a.
Lehman, S. J. and L. D. Keigwin, Deep circulation revisited, Nature, 358, 197-198, 1992b.
Lonsdale, P. and C. D. Hollister, A near-bottom traverse of Rockall Trough: Hydrographic and geologic inferences, Oceanol. Acta, 2, 91-105, 1979.
Lunel, T., Trace metal concentrations and isotopes as tracers of oceanic processses, Ph.D. thesis, Univ. of Cambridge, Cambridge, England, 1990.
Manighetti, B. and I. N. McCave, Depositional fluxes, palaeoproductivity and ice rafting in the NE Atlantic over the last 30ka, Paleoceanography, this issue.
Manighetti, B., M. Maslin, I. N. McCave and N.J. Shackleton, Chronology for climate change: Developing age models for the Biogeochemical Ocean Flux Study cores, Paleoceanography, this issue.
McCartney, M. S., Recirculating components to the deep boundary current of the northern North Atlantic, Progr. Oceanogr., 29, 283- 383, 1992.
McCave, I. N., Leg 3, Benthic Studies, of the Biogeochemical Ocean Flux Study between 47øN and 60øN along 20øW in the northeast Atlantic Ocean, cruise report, RRS Discovery 184, Univ. of Cambridge, Cambridge, England, 1989.
McCave, I. N., Erosion, transport and deposition of fine grained marine sediments, in, Fine-Grained Sediments: Deep Water Processes and Facies, Geol. Soc. London. Spec. Publ. 15, 35-69, 1984.
McCave, I. N., P.F. Lonsdale, C. D. Hollister and W. D. Gardner, Sediment transport over the Hauon and Gardar contouritc drifts, J. Sediment. Petrol., 50, 1049-1062, 1980.
McCave, I. N., B. Manigheui and S.C. Robinson, Sortable silt and fine sediment size/composition slicing: Parameters for palaeocurrent speed and palaeoceanography, Paleoceanograohy, this issue.
Metcaff, W. G., C. Hezeen and M. C. Stalcup, The sill depth of the Mid-Atlantic Ridge in the equatorial region, Deep Sea Res., 11, 1- 10, 1964.
Newton, P.P., R. S. Lainpitt, T. D. Jickells, P. King, and C. Boufle, Temporal and mesoscale vaiogenic particle fluxes in the context of

626 MANIGHETFI AND MCCAVE: LATE GLACIAL AND HOLOCENE PALAEOCURRENTS
the JGOFS northeast Atlantic process studies at 47øN 20øW (1989- 1990) Deep Sea Res., in press, 1995.
Oppo, D. and S. Lehman, Mid-depth circulation of the sub-polar North Atlantic during the last glacial maximum, Science, 259, 1148-1152, 1993.
Oppo, D. and R. G. Fairbanks, Variability in the deep and intermediate water circulation of the Atlantic Ocean during the past 25,000 years: Northern hemisphere modulation of the Southern Ocean, Earth Planet. Sci. Left., 86, 1-15, 1987.
Ruddiman, W. F., Late Quaternary deposition of ice-rafted sand in the subpolar North Atlantic Oat 40 ø to 65øN), Geol. Soc. Am. Bull., 88, 1913-1827, 1977.
Ruddiman, W. F., C. D. Sancema and A. Mcintyre, Glacial/Interglacial response rate of subpolar North Atlantic waters to climatic change: The record in oceanic sediments, Philos. Trans. R. Soc. London, Ser. B, 280, 119-142, 1977.
Schmitz, W. J. and M. S. McCatracy, On the North Atlantic Circulation, Rev. Geophys., 31, 29-49, 1993.
Shackleton, N.J., J.-C. Duplessy, M. Arnold, P. Maurice, M. A. Hall and J. Cartlidge, Radiocarbon age of last glacial Pacific deep water, Nature, 335, 708-711, 1988.
Stuiver, M. and P. J. Reimer, Extended 14C data base and revised calib 3.0 14C age calibration program, Radiocarbon, 35, 215-230, 1993.
Stuiver, M. and T. F. Braziunas, Modelling atmospheric 14C influences and 14C ages of marine samples back to 10,000 BC, Radiocarbon, 35, 137-189, 1993.
Tumau, R. and M. T. Ledbetter, Deep circulation changes in the South Atlantic Ocean: Response to initiation of northern hemisphere glaciation, Paleoceanography, 4, 565-583, 1989.
Van Andel, T. H., Texture and dispersal of sediments in the Panama Basin, J. Geol., 81,434-457, 1973.
Veum, T., E. Jansen, M. Arnold, I. Beyer and J.-C. Duplessy, Water mass exchange between the North Atlantic and the Norwegian Sea during the past 28,000 years, Nature, 356, 783-785, 1992.
Wang, H. and I. N. McCave, Distinguishing climatic and current effects in mid-Pleistocene sediments of Hatton and Gardar Drifts, NE Atlantic, J. Geol. Soc. London, 147, 373-383, 1990.
Weyl, P. K., The role of the oceans in climatic change: A theory of the ice ages, Meteorol. Monogr., 8, 37-62, 1968.
Worthington, L. V. and W. R. Wright, North Atlantic ocean atlas of potential temperature and salinity in the deep water including temperature, salinity and oxygen profiles from the Erika Dan cruise of 1962, Woods Hole Oceanogr. Instit. Atlas Series, 2, 24pp and 58 plates, 1970.
Zahn, R. and A. C. Mix, Benthic foraminiferal •5180 in the ocean's temperature salinity density field: Contraints on ice age thermohaline circulation, Paleoceanography, 6, 1-20, 1991.
Zimmerman, H. B, Fine-grained sediment distribution in the Late Pleistocene/Holocene North Atlantic, Bull. Inst. Geol. Bassin Aquitaine, 31,337-357, 1982.
B. Manighetti and I. N. McCave, Department of Earth Sciences, University of Cambridge, Downing Street, Cambridge, CB2 3EQ, England. (e-mail [email protected])
(Received December 21, 1993; revised June 30, 1994; accepted November 16, 1994.)