Weight reduction modulates expression of genes involved in extracellular matrix and cell death: the...
12
ORIGINAL ARTICLE Weight reduction modulates expression of genes involved in extracellular matrix and cell death: the GENOBIN study M Kolehmainen 1 , T Salopuro 1 , US Schwab 1,2 , J Keka ¨la ¨inen 3 , P Kallio 1 , DE Laaksonen 2,4 , L Pulkkinen 1 , VI Lindi 1 , K Sivenius 1 , U Mager 1 , N Siitonen 1 , L Niskanen 2 , H Gylling 1,2 , R Rauramaa 5,6 and M Uusitupa 1 1 School of Public Health and Clinical Nutrition, Clinical Nutrition and Food and Health Research Center, University of Kuopio, Kuopio, Finland; 2 Institute of Clinical Medicine, Internal Medicine, Kuopio University Hospital, Kuopio, Finland; 3 Department of Computer Science, University of Kuopio, Kuopio, Finland; 4 Institute of Biomedicine, Physiology, University of Kuopio, Kuopio, Finland; 5 Kuopio Research Institute of Exercise Medicine, University of Kuopio, Kuopio, Finland and 6 Institute of Clinical Medicine, Clinical Physiology, Kuopio University Hospital, Kuopio, Finland Objective: Lifestyle and genetic factors interact in the development of obesity and the metabolic syndrome. The molecular mechanisms underlying the beneficial dietary modifications are, however, unclear. We aimed to examine the effect of the long- term moderate weight reduction on gene expression in adipose tissue (AT) and to identify genes and gene clusters responsive to treatment and thereby likely contributing to the development of the metabolic syndrome. Design: Randomized controlled and individualized weight reduction intervention. Subjects: Forty-six subjects with impaired fasting glycemia or impaired glucose tolerance and features of metabolic syndrome, aged 6077 years were randomized either to a weight reduction (WR) (n ¼ 28) or a control (n ¼ 18) group lasting for 33 weeks. Measurements: Oral and intravenous glucose tolerance tests and subcutaneous AT biopsies were performed before and after the intervention. Gene expression of AT was studied using microarray technology in subgroups of WR (with weight reduction X5%, n ¼ 9) and control group (n ¼ 10). The results were confirmed using quantitative PCR. Results: In the WR group, glucose metabolism improved. Moreover, an inverse correlation between the change in S I and the change in body weight was found (r ¼0.44, P ¼ 0.026). Downregulation of gene expression (Po0.01) involving gene ontology groups of extracellular matrix and cell death was seen. Such changes did not occur in the control group. The tenomodulin-gene was one of the most downregulated genes (39716%, Po0.0001). Moreover, its expression correlated with insulin sensitivity (r ¼0.34, P ¼ 0.005) before the intervention and with body adiposity both before (r ¼ 0.42, P ¼ 0.007) and after (r ¼ 0.30, P ¼ 0.056) the intervention. Conclusion: Genes regulating the extracellular matrix and cell death showed a strong downregulation after long-term weight reduction. This likely reflects a new stable state at the molecular level in AT. Further studies are warranted to elucidate the mechanisms of these genetic factors. International Journal of Obesity (2008) 32, 292–303; doi:10.1038/sj.ijo.0803718; published online 11 September 2007 Keywords: insulin resistance; weight reduction; adipose tissue; gene-expression profile; extracellular matrix Introduction Lifestyle and genetic factors interact in the development of obesity, the metabolic syndrome and progression to type 2 diabetes (T2DM). 1 These interactions are likely to be reflected in gene expression. The metabolic syndrome, characterized by central obesity, insulin resistance and abnormal glucose metabolism, 2 dyslipidemia and hypertension, predisposes to cardiovascular diseases 3 and T2DM. 4,5 Besides insulin resistance, T2DM is preceded by impaired first-phase insulin secretion, which is an inherent feature of impaired fasting glycemia and impaired glucose tolerance. 6–8 Weight loss and beneficial dietary changes have been shown to decrease insulin resistance and prevent T2DM in Received 29 March 2007; revised 5 July 2007; accepted 5 August 2007; published online 11 September 2007 Correspondence: Dr M Kolehmainen, School of Public Health and Clinical Nutrition, Clinical Nutrition and Food and Health Research Center, University of Kuopio, Yliopistonranta 1, PO Box 1627, FIN-70211 Kuopio, Finland. E-mail: [email protected] International Journal of Obesity (2008) 32, 292–303 & 2008 Nature Publishing Group All rights reserved 0307-0565/08 $30.00 www.nature.com/ijo
-
Upload
independent -
Category
Documents
-
view
4 -
download
0
Transcript of Weight reduction modulates expression of genes involved in extracellular matrix and cell death: the...

ORIGINAL ARTICLE
Weight reduction modulates expression of genesinvolved in extracellular matrix and cell death:the GENOBIN study
M Kolehmainen1, T Salopuro1, US Schwab1,2, J Kekalainen3, P Kallio1, DE Laaksonen2,4,L Pulkkinen1, VI Lindi1, K Sivenius1, U Mager1, N Siitonen1, L Niskanen2, H Gylling1,2,R Rauramaa5,6 and M Uusitupa1
1School of Public Health and Clinical Nutrition, Clinical Nutrition and Food and Health Research Center, University ofKuopio, Kuopio, Finland; 2Institute of Clinical Medicine, Internal Medicine, Kuopio University Hospital, Kuopio, Finland;3Department of Computer Science, University of Kuopio, Kuopio, Finland; 4Institute of Biomedicine, Physiology, University ofKuopio, Kuopio, Finland; 5Kuopio Research Institute of Exercise Medicine, University of Kuopio, Kuopio, Finland and6Institute of Clinical Medicine, Clinical Physiology, Kuopio University Hospital, Kuopio, Finland
Objective: Lifestyle and genetic factors interact in the development of obesity and the metabolic syndrome. The molecularmechanisms underlying the beneficial dietary modifications are, however, unclear. We aimed to examine the effect of the long-term moderate weight reduction on gene expression in adipose tissue (AT) and to identify genes and gene clusters responsive totreatment and thereby likely contributing to the development of the metabolic syndrome.Design: Randomized controlled and individualized weight reduction intervention.Subjects: Forty-six subjects with impaired fasting glycemia or impaired glucose tolerance and features of metabolic syndrome,aged 6077 years were randomized either to a weight reduction (WR) (n¼ 28) or a control (n¼18) group lasting for 33 weeks.Measurements: Oral and intravenous glucose tolerance tests and subcutaneous AT biopsies were performed before and afterthe intervention. Gene expression of AT was studied using microarray technology in subgroups of WR (with weight reductionX5%, n¼9) and control group (n¼10). The results were confirmed using quantitative PCR.Results: In the WR group, glucose metabolism improved. Moreover, an inverse correlation between the change in SI and thechange in body weight was found (r¼�0.44, P¼0.026). Downregulation of gene expression (Po0.01) involving geneontology groups of extracellular matrix and cell death was seen. Such changes did not occur in the control group. Thetenomodulin-gene was one of the most downregulated genes (�39716%, Po0.0001). Moreover, its expression correlatedwith insulin sensitivity (r¼�0.34, P¼0.005) before the intervention and with body adiposity both before (r¼0.42, P¼0.007)and after (r¼ 0.30, P¼0.056) the intervention.Conclusion: Genes regulating the extracellular matrix and cell death showed a strong downregulation after long-term weightreduction. This likely reflects a new stable state at the molecular level in AT. Further studies are warranted to elucidate themechanisms of these genetic factors.
International Journal of Obesity (2008) 32, 292–303; doi:10.1038/sj.ijo.0803718; published online 11 September 2007
Keywords: insulin resistance; weight reduction; adipose tissue; gene-expression profile; extracellular matrix
Introduction
Lifestyle and genetic factors interact in the development of
obesity, the metabolic syndrome and progression to type 2
diabetes (T2DM).1 These interactions are likely to be
reflected in gene expression. The metabolic syndrome,
characterized by central obesity, insulin resistance
and abnormal glucose metabolism,2 dyslipidemia and
hypertension, predisposes to cardiovascular diseases3 and
T2DM.4,5 Besides insulin resistance, T2DM is preceded by
impaired first-phase insulin secretion, which is an inherent
feature of impaired fasting glycemia and impaired glucose
tolerance.6–8
Weight loss and beneficial dietary changes have been
shown to decrease insulin resistance and prevent T2DM inReceived 29 March 2007; revised 5 July 2007; accepted 5 August 2007;
published online 11 September 2007
Correspondence: Dr M Kolehmainen, School of Public Health and Clinical
Nutrition, Clinical Nutrition and Food and Health Research Center, University
of Kuopio, Yliopistonranta 1, PO Box 1627, FIN-70211 Kuopio, Finland.
E-mail: [email protected]
International Journal of Obesity (2008) 32, 292–303& 2008 Nature Publishing Group All rights reserved 0307-0565/08 $30.00
www.nature.com/ijo

overweight and obese individuals with impaired glucose
tolerance,6,9–11 but the effect of these interventions on
genome-wide gene expression is largely unknown. Several
cross-sectional studies have shown that expression of
individual genes in adipose tissue (AT) differs between obese
and lean subjects.12–14 AT secretes numerous active agents
that contribute to fat storage and distribution, lipolysis,
inflammation and insulin resistance, typical processes,
which are involved in the pathogenesis of metabolic
syndrome, T2DM and cardiovascular diseases.15–18 Weight
reduction induces changes in the expression of various genes
in AT.19–23 A few studies have applied microarray technolo-
gies to study gene expression in AT of massively obese
subjects either in comparison to lean subjects cross-section-
ally24,25 or after short-term weight reduction.26,27 These
studies have demonstrated downregulation in the expression
of genes involved in inflammation and desaturation of fatty
acids.26,27
In the present work, we studied the effect of long-term
weight reduction on gene expression in AT of overweight or
obese individuals with impaired fasting glycemia or impaired
glucose tolerance and other features of the metabolic
syndrome. We aimed to examine the effect of the long-term
moderate weight reduction on gene expression in AT and to
identify genes and gene clusters responsive to treatment and
thereby likely contributing to the development of the
metabolic syndrome.
Methods
Study design
Altogether 46 overweight or obese (BMI 28–40 kg m�2)
subjects aged 40–70 years were recruited to the study. The
subjects had impaired fasting glycemia (fasting plasma
glucose concentration 5.6–7.0 mmol l�1) or impaired glucose
tolerance (2-h plasma glucose concentration 7.8–11.0
mmol l�1) and at least two other features of the metabolic
syndrome according to the Adult Treatment Panel III
criteria28 as modified by the AHA:29 waist circumference
4102 cm (males)/488 cm (females), fasting serum triacyl-
glycerol concentration X1.7 mmol l�1, fasting serum HDL-
cholesterol o1.0 mmol l�1 (males)/o1.3 mmol l�1 (females),
blood pressure X130/80 mm Hg. Subjects were randomized
to a weight reduction (WR) (n¼28) or a control group
(n¼18). The subjects were randomized at the Department of
Clinical Nutrition (n¼6 and 7, respectively) and at Kuopio
Research Institute of Exercise Medicine (n¼22 and 11,
respectively). Subjects were matched for age, gender, BMI
and status of glucose metabolism. The duration of the study
varied between 32 and 38 weeks, the mean duration being
33.371.1 weeks.
At screening, the health status and medical history of the
subjects were examined by an interview. Laboratory exam-
inations included measurements of the liver, kidney and
thyroid function. All subjects kept a 4-day food record at
baseline. At baseline and at the end of the intervention, the
subjects underwent an oral glucose tolerance test (OGTT),
frequently sampled intravenous glucose tolerance test
(FSIGT), blood pressure measurement, anthropometric mea-
surements (body weight, height, body composition (Bioelec-
trical impedance by STA/BIA Body Composition Analyzer,
Akern Bioresearch Srl, Florence, Italy), waist circumference),
AT biopsy and the following biochemical measurements:
serum total and lipoprotein lipids, serum-free fatty acids and
leptin (see Table 1). Blood pressure was measured twice on
the right arm. The systolic and diastolic blood pressure was
calculated as an average of the two measurements.
Weight reduction program
The subjects underwent a 12-week intensive weight reduc-
tion program. The minimum aim for the study, weeks 12–33
was to maintain the achieved weight loss. A clinical
nutritionist gave detailed individual counseling based on
an interview and 4-day food records kept by the subjects,
aiming to decrease energy intake. The subjects kept 4-day
food records two times during the intensive period and two
times during weeks 20–32. After the 12-week program, the
Table 1 Baseline characteristics of the subjects
Weight reduction
(n¼28)
Control
(n¼ 18)
Gender (M/F) 12/16 8/10
Age (years) 5977 6177
Weight (kg) 92.8715.1 87.978.3
Body mass index (kg m�2) 32.973.2 32.472.5
Blood pressure (mm Hg)
Systolic 137717 137712
Diastolic 90710 87710
Waist circumference (cm) 10879 10577
Lean body mass (kg) 58.1712.0 55.179.6
Body fat mass (kg) 34.778.9 32.976.7
Body fat (%) 3877 3878
Plasma glucose (mmol l�1)
0 min 6.470.5 6.570.4
30 min 9.871.5 10.071.2
120 min 6.972.0 8.072.4
SI ((mU l�1)�1�min�1)a 2.3171.38 2.4370.79
AIR ((mU l�1)�1�min�1)a 5.0474.04 4.6075.0
Serum cholesterol (mmol l�1) 5.271.0 5.571.1
VLDL cholesterol (mmol l�1) 0.5170.27 0.5970.30
LDL cholesterol (mmol l�1) 3.4170.89 3.6270.92
HDL cholesterol (mmol l�1) 1.2470.21 1.2670.17
Serum triacylglycerol (mmol l�1) 1.5170.63 1.7870.64
Adipocyte cell size (pl) 7187362 6347318
Serum leptin (ng ml�1) 20.5711.3 20.4712.6
No. of smokers (regular/occasional) 1/1 3/2
Abbreviations: HDL, high-density lipoprotein; LDL, low-density lipoprotein;
VLDL, very low-density lipoprotein. Mean7s.d. Groups did not differ between
each other based on general linear model for univariate analysis. aSI¼ insulin
sensitivity index, AIR¼ acute insulin response.
Weight reduction and gene expression in ATM Kolehmainen et al
293
International Journal of Obesity

subjects met the clinical nutritionist for checking the food
records. During this visit they also had a possibility to discuss
possible difficulties they had in maintaining the weight.
Subjects were asked to maintain their habitual level of
physical exercise. Physical activity was monitored by a
questionnaire at the beginning and the weeks 12 and 33 of
the study.
Control group
The subjects in the control group were advised to continue
their normal lifestyle during the study, and to keep their diet
and exercise habits unchanged.
Glucose tolerance tests
A 2-h OGTT was performed with 75 g of glucose. Blood
samples for plasma glucose and serum insulin concentra-
tions were drawn at 0, 30 and 120 min. The FSIGT was
performed according to the Minimal Model method
as described previously.30 Insulin sensitivity index (SI),
glucose effectiveness (SG) or acute phase insulin response to
glucose (AIR) were calculated by the MINMOD Millennium
software.31
Biochemical analyses
Biochemical analyses were performed in the Clinical Labora-
tory Centre of the Kuopio University Hospital and in the
Clinical Unit of the University of Kuopio. Plasma glucose
concentration was analyzed by the hexokinase method
(Thermo Clinical Labsystems, Vantaa, Finland). Insulin was
determined by chemiluminescence sandwich method (ACS,
Bayer A/S, Tarrytown, NY, USA). VLDL, LDL and HDL were
separated by ultracentrifugation (Beckman Optima L-90 K).
The concentrations of total and lipoprotein cholesterol and
total triacylglycerol were analyzed with a Kone Pro Clinical
Chemistry Analyzer (Thermo Clinical Labsystems, Konelab,
Espoo, Finland) using enzymatic methods (Roche Diagnos-
tics, Mannheim, Germany). Concentration of serum-free
fatty acids was measured by a turbidometric analyzer (Kone
Ltd, Espoo, Finland). Commercial radioimmunoassay kit
was used for the analysis of serum leptin concentration
(Linco Research Inc., St Louis, MO, USA).
Adipose tissue biopsy
After an overnight fast, AT samples for RNA extraction and
cell size measurements were taken by needle biopsy from
subcutaneous abdominal AT under local anesthesia (lido-
caine 10 mg ml�1 without adrenaline). AT samples for the
mRNA extraction were washed two times with PBS, treated
with RNA later according to the instructions provided by the
manufacturer (Ambion, Austin, TX, USA), and stored in
�80 1C until RNA extraction.
Part of the sample was taken for the cell size measurement.
After washing, adipocytes were incubated in the presence of
collagenase (0.5 mg ml�1) under constant shaking at 2 Hz
and 37 1C in buffer containing 125 mmol l�1 NaCl,
5 mmol l�1 KCl, 1 mmol l�1 CaCl2, 2.5 mmol l�1 MgCl2,
1 mmol l�1 KH2PO4, 4 mmol l�1 glucose, 2% bovine serum
albumin and 25 mmol l�1 Tris at pH 7.4 as described
earlier.32,33 After 60 min, cells were filtered through a nylon
cloth and washed three times with the same buffer without
collagenase. Direct microscopic determination of the adipo-
cyte diameter was performed by placing an aliquot of cell
suspension on the Burker chamber and examining with a
light microscope (Olympus CH-2). The diameters of 100–200
cells were estimated. The median of diameters was used for
the calculation of fat cell volume.
RNA extraction
Total RNA from fat tissue was extracted using the TRIzol
method followed by further purification with RNeasy Mini
Kit columns according to the instructions provided by the
manufacturers’ (Invitrogen, Carlsbad, CA, USA and Qiagen,
Valencia, CA, USA). The RNA concentration and the A260/
A280 ratio was measured using the NanoDrop spectrophoto-
meter (NanoDrop Technologies, Wilmington, DE, USA), an
acceptable ratio being 1.9–2.1.
Microarray probe preparation
The subjects were chosen for microarray experiments with
the following criteria: 10 subjects from the WR group
(n¼28), who had the most pronounced weight reduction
during the intervention and 10 subjects from the control
group (n¼18) with the most stable body weight during the
study. Owing to technical problems in hybridization in one
of the microarray chips, the samples from one of the subjects
had to be excluded. Thus, the final number of subjects in the
WR group was nine.
Synthesis of biotin-labeled cRNA, hybridization to DNA
microarrays (HG-U133 Plus 2.0 GeneChip) and detection of
hybridized cRNA were performed as recommended by the
manufacturer (Affymetrix Inc., Santa Clara, CA, USA).
Array data extraction and analysis
The arrays were scanned using HP GeneArray Scanner 3000
(Affymetrix Inc.). Primary data extraction was performed
with Affymetrix GeneChip Operating Software. The software
produces a one-cell intensity file that contains probe-level
intensities for each chip. In the WR group one of the
microarray chips was damaged during procedures, and
consequently this subject was excluded from the analyses.
The detection calls were calculated using the Affymetrix
detection algorithm (Affymetrix, Statistical algorithms de-
scription document, 2002). Microarray data analysis was
performed with dChip (www.dchip.org) software. All chips
were normalized by using Invariant Set Normalization.34
Model-Based Expression indexes35 were calculated to
Weight reduction and gene expression in ATM Kolehmainen et al
294
International Journal of Obesity
summarize expression levels. A perfect match/mis-match
difference model was used in Model-Based Expression
indexes calculation, and outlier detection and correction
was applied. After preprocessing steps, only genes that were
called ‘Present’ in more than 50 percent of the replicates in at
least one of the two time points were selected for further
analysis. Differentially expressed genes were identified by
using paired t-test with Po0.01 producing slightly different
false discovery rate-values for the WR and control group.
Differential expression of genes was examined within the
groups. The set of differentially expressed genes was
clustered with dChip’s hierarchical clustering function.
Before clustering, redundant probe sets were removed.
Correlation was used as distance metric and the centroid-
linkage method was applied. Finally, the differentially
expressed genes were grouped by their Gene Ontology
annotations.
Quantitative real-time PCR analysis of gene expression
Quantitative real-time PCR (QPCR) was used for the
confirmation of microarray gene-expression results. QPCR
analyses were performed with TaqMan chemistry-based
assays according to the instructions by the manufacturer
by using ABI Prism 7500 analyzer (Applied Biosystems). The
analysis for the relative quantity of a specific gene before and
after the intervention in 27 subjects of the WR group and
in 18 subjects of the control group was done in triplets.
A standard curve with points 0.025, 0.075, 0.3, 0.9 and
1.8 ng ml�1 of cDNA, respectively and calibrator at a con-
centration of 0.3 ng ml�1 was used on every plate. Relative
quantity was analyzed using ABI Prism 7500 SDS software.
Quantities on each plate were first corrected by the calibrator
on the plate. The ratio of the amount per plate to the
corresponding values of endogenous control was then
calculated. The endogenous control was chosen using
Human Endogenous Control Kit (Applied Biosystems).
Among 11 possible candidates, cyclophilin A1 was chosen
as the best candidate using cDNA synthesized from isolated
human AT RNA.
Statistical analyses of the clinical data
The clinical data were analyzed using the SPSS software for
Windows version 11.5.1 (SPSS Inc., Chicago, IL, USA). Data
are given as mean7s.d., unless otherwise indicated. The
normality of distributions of the study variables was tested
with the Kolmogorov–Smirnov test with Lilliefors’ signifi-
cance correction. Logarithmic transformation was used to
achieve normal distribution whenever needed (indicated in
tables and/or figures). General Linear Model (GLM) for
univariate analysis was used to test the difference in the
baseline characteristics and in the changes among the
groups. GLM for repeated measures was used for analyzing
the interaction of time and group for each variable.
Adjustments for age, gender and baseline body weight was
performed, when appropriate. Paired samples T-test was used
for comparing the baseline and endpoint measurements
within the study group. Correlation analyses were done
using Pearson’s method. Partial correlation analysis with
adjustment for weight at baseline and gender was used when
appropriate. For the clinical and biochemical measurements
Po0.05 was considered as statistically significant.
Ethical considerations
The study was in accordance with the standards of the
Helsinki Declaration. The Ethics Committee of the District
Hospital Region of Northern Savo and Kuopio University
Hospital approved the study plan. All participants gave their
written informed consent.
We certify that all applicable institutional and govern-
mental regulations concerning the ethical use of human
volunteers were followed during this study.
Results
Clinical and metabolic characteristics
The WR and control groups did not differ in any of the
clinical variables at baseline (Table 1). The 33-week inter-
vention decreased the measures of body adiposity and fat
distribution (Table 2) as well as fasting concentrations of
plasma glucose and serum leptin in the WR group. The
differences in the changes of anthropometric measures
between the groups during the intervention were significant
(Table 2). No significant differences in the changes in blood
pressure, percent of body fat, concentrations of plasma
glucose, serum insulin, serum total and lipoprotein lipids,
SI, SG or acute phase insulin response to glucose were seen
between the groups. The dietary data of the groups are
shown in Table 3. Dietary fat intake decreased as aimed at in
the WR group. Fiber intake maintained at the level before the
intervention in spite of the slight, although non-significant
decrease in energy intake in the WR group, whereas fiber
content of the diet clearly decreased in the control group.
In the WR group with some improvement in SI, the change
in SI correlated inversely with the change in body weight
after adjustment for baseline body weight (r¼�0.44,
P¼0.026). When combining the groups a similar, although
lower correlation was found (r¼�0.23, P¼0.057).
Weight reduction group
To select subjects for microarray analyses, the WR group was
initially divided into those who lost X5% of their body
weight (n¼11, Group 1) and those who lost o5% (n¼17,
Group 2) (Figure 1, Table 4). Finally, nine (4 males/5 females)
subjects from the Group 1 were included in the microarray
analyses. They lost more weight than the rest of the WR
group (7.872.9 vs 3.373.3%, P¼0.002). They also had
significant increase in SI and decrease in fasting serum
insulin and in 2-h glucose concentrations, along with
Weight reduction and gene expression in ATM Kolehmainen et al
295
International Journal of Obesity

improvements in measures of body adiposity when com-
pared to those selected for microarray analysis from the
control group (n¼10; 4 men/6 women) (Table 4).
Changes in gene expression in adipose tissue duringthe intervention
The expression of 105 genes (false discovery rate of 13.3% for
the list of genes) in the WR group changed after the long-
term moderate weight reduction program (Table 5). The
expression of 82% (86/105) of genes was downregulated in
the WR group. Overall, the changes were modest, with fold
changes ranging from 0.67 to 1.68. The genes were then
analyzed for the cluster formation according to the Gene
Ontology (GO) biological process categories (Table 5). Gene
Ontology clusters for biological processes were assessed for
enrichment of genes into each cluster with Po0.001.
Altogether seven Gene Ontology biological process clusters
were found. These clusters were associated with the function
of the extracellular matrix (ECM) and cell death. The
expression of 62 genes changed in the control group (false
discovery rate of 12.9% for the list of genes) and no clusters
were formed (Supplementary Information). None of the
genes were the same as in the WR group.
To confirm the microarray analysis, seven genes showing
either up- or downregulation in the microarray analysis
were tested by QPCR analyses (Figure 2). The QPCR analysis
confirms and extends the data obtained by microarray for
the whole population. In the WR group, significant down-
regulation was observed by QPCR with genes encoding
tenomodulin-gene (TNMD) (�39716%, Po0.0001),
ADAM12 (�15718%, P¼0.023) and CCND2 (�24728%,
P¼0.040) (Table 6). Also the other genes confirmed by
QPCR showed up- or downregulation as in microarray
analyses (Table 6), but statistical significance was not reached
in the QPCR analyses due to large inter-individual variation.
In the control group, there were no significant changes in
the genes confirmed by QPCR, except in PDGFRL (27735%,
P¼0.011).
One of the genes that showed most pronounced change
during the intervention was the X-chromosomal TNMD
gene. The transcript levels of the TNMD in AT in women
before and after the intervention were about two times as
high as in men (in women before the intervention
125745 AU, 99742 AU and after the intervention
110763 AU, 95732 AU for the WR and control group,
respectively; in men 77732 AU, 51721 AU and 59727 AU,
53720 AU for the WR and control group, respectively;
P¼0.014�0.005 for gender difference within the group).
This is in an agreement with the fact that the TNMD
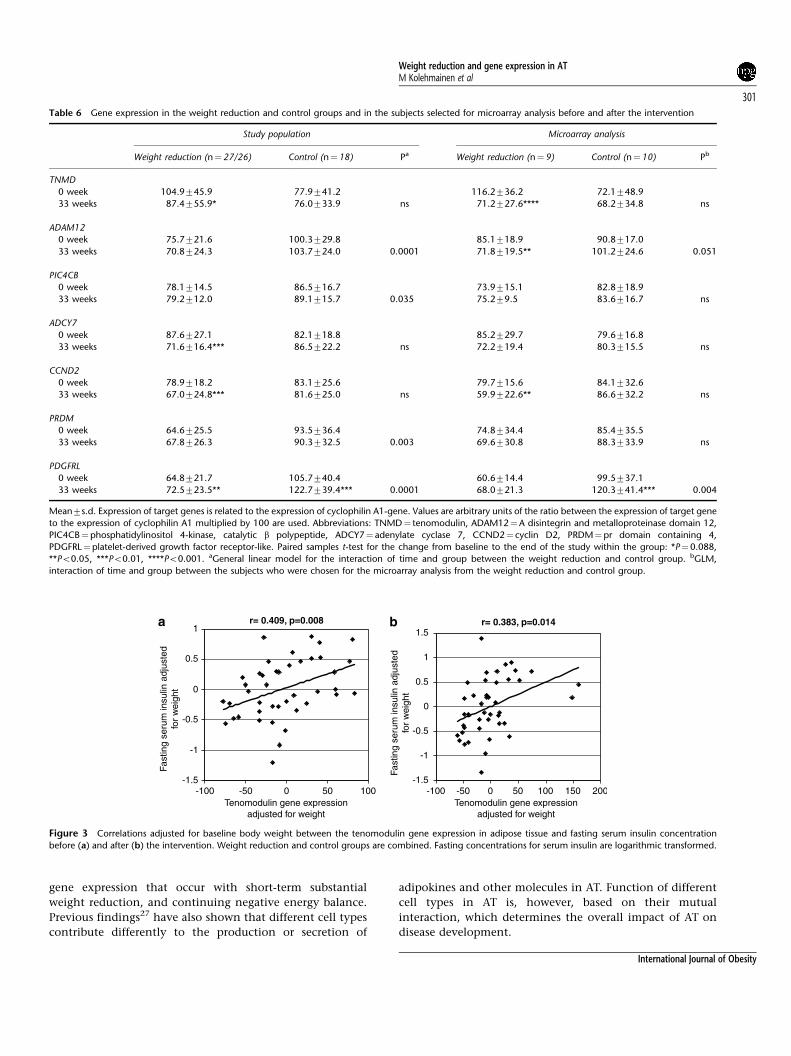
gene is located in the X-chromosome. Interestingly, the
TNMD expression level correlated significantly with fasting
serum insulin (Figure 3) adjusted for baseline body weight,
when the WR and control groups were combined.
When correlation was adjusted for both gender and baseline
body weight, association remained for fasting serum insulin
before (r¼0.38, P¼0.014) and after (r¼0.29, P¼0.066) the
intervention. TNMD expression correlated also with SI
(r¼�0.39, P¼0.012) before the intervention as well as
body fat mass and with lean body mass both before (r¼0.42,
P¼0.007; r¼�0.42, P¼0.007, respectively) and after
the intervention (r¼0.30, P¼0.056; r¼�0.33, P¼0.037,
respectively).
Discussion
In the present study, we examined the effect of long-term
moderate weight reduction on the gene expression in AT of
overweight or obese subjects with the features of metabolic
syndrome. Of the 105 genes responding to weight reduction,
most were downregulated. The major gene clusters that were
downregulated are involved in the function of the ECM and
cell death.
Table 2 Changes in clinical characteristics during the intervention in the study groups.
Weight reduction (n¼28) Control (n¼18) Pa
Body weight (kg) �4.6 (�6.1 to �3.1)** �0.2 (�1.0 to 0.6) 0.0002
Body mass index (kg m�2) �1.62 (�2.15 to �1.10)** �0.09 (�0.36 to 0.18) 0.0002
Waist circumference (cm) �3.6 (�4.9 to �2.3)** 0.6 (�0.5 to 1.7) 0.0001
Lean body mass (kg) �1.6 (�2.6 to �0.5)* 0.3 (�0.3 to 1.0) 0.025
Body fat mass (kg) �3.0 (�4.2 to �1.8)** �0.5 (�1.1 to 0.1) 0.009
Body fat (%) �1.5 (�2.5 to �0.6)* �0.6 (�1.1 to 0.0) ns
Fasting plasma glucose (mmol l�1) �0.3 (�0.49 to �0.15)** �0.26 (�0.55 to 0.02) ns
Fasting serum insulin (pmol l�1) �4.4 (�16.0 to 7.1) 4.1 (�7.1 to 15.2) ns
SI ((mU l�1)�1�min�1)b 0.24 (�0.05 to 0.53) �0.01 (�0.46 to 0.44) ns
AIR ((mU l�1)�1�min�1)b �0.11 (�0.85 to 0.63) 0.48 (�0.57 to 1.52) ns
SG (min�1� 102)b �0.05 (�0.22 to 0.13) 0.12 (�0.23 to 0.47) ns
Fasting serum leptin (ng ml�1) �3.18 (�4.93 to �1.43)* �0.51 (�1.73 to 0.72) 0.050
Adipocyte cell size (pl) 28.0 (�182 to 238) 106.5 (�52 to 265) 0.039
Abbreviation: CI, confidence interval. D (95% CI) Paired samples t-test for the change from baseline to the end of the study within the group: *Po0.01, **Po0.001.aGeneral linear model for univariate analysis for the differences between the groups corrected with age, gender and weight at baseline. bSI¼ insulin sensitivity index,
AIR¼ acute insulin response, SG¼glucose effectiveness index.
Weight reduction and gene expression in ATM Kolehmainen et al
296
International Journal of Obesity

As expected, in the present study, successful weight
reduction resulted in an improvement in glucose and insulin
metabolism and in measures of body adipocity. The
improvement of SI was related to the degree of weight
reduction. Individual genetic patterns also modify the effect
of lifestyle factors on clinical and biochemical parameters,
which explain the large inter-individual variation that was
also seen in the present study. Such variation may compli-
cate attempts to find patterns in gene expression resulting
from dietary or other lifestyle changes,36 especially in studies
investigating outpatient clinic like programs. In the present
study, we, therefore, focused on the changes in gene
expression within the WR group after a moderate weight
reduction. For gene-expression studies, we selected those
subjects who responded best to weight reduction program.
Weight loss and a reduction in fat mass decreased the
expression of genes associated with the ECM in subcuta-
neous AT. Recent studies implicate that the ECM is involved
in inflammation,37 angiogenesis38 and in the development
of cardiovascular dysfunction in the metabolic syndrome
and T2DM.39,40 The ECM contributes to cell–matrix inter-
actions, and in the context of the metabolic syndrome, is
characterized by abnormal glucose and lipid metabolism and
inflammation in adipose and other tissues, the capability of
the ECM to adapt to potentially toxic signals may be of
importance for maintaining healthy homeostasis.39 Since AT
consists also of connective tissue, it is expected that the ECM
components participate in remodeling and function of AT
through cell–matrix interactions. It has been shown that, in
addition to the ECM remodeling, matrix metalloproteinases
and their inhibitors (MMP/TIMP system) regulate proteolytic
events and adipogenesis during obesity-mediated fat mass
development.41 In addition, increased formation of the ECM
constituents has been found in the white AT of rats, which
were exposed to early-life under-nutrition and subsequently
developed visceral obesity.42 Transcription of the ECM
constituents has recently been shown to be regulated by
insulin in 3T3-L1 adipocytes.43 In accordance with our study,
long-term energy restriction has suppressed genes associated
with the ECM in mice.37
Weight reduction also decreased the expression of genes
involved in terminal differentiation of fat cells, that is cell
Table 3 Intake of energy, energy nutrients, cholesterol, fiber and calcium
from the diet
Weight reduction (n¼28) Control (n¼18) Pa
Energy (kJ)
0 week 720272285 758971783
12 weeks 651671690 742671944
32 weeks 671771458 775271974 Ns
Protein (E%)
0 week 18.173.1 17.872.8
32 weeks 19.974.0 17.774.0 Ns
Fat (E%)
0 week 33.076.1 31.378.3
32 weeks 30.576.0* 32.874.9 0.051
SFA (E%)b
0 week 12.373.4 11.973.5
32 weeks 11.073.1 12.072.6 ns
MUFA (E%)b
0 week 11.172.4 10.173.3
32 weeks 10.372.4 11.672.2 0.013
PUFA (E%)b
0 week 5.971.6 5.371.6
32 weeks 5.771.7 5.371.2 ns
Carbohydrates (E%)
0 week 46.276.6 47.478.3
32 weeks 46.576.6 45.678.4 ns
Cholesterol (mg)
0 week 227798 2357108
32 weeks 2337114 2507131 ns
Fiber (g)
0 week 23.078.5 24.776.2
32 weeks 21.377.7 19.776.7** ns
Calcium (mg)
0 week 9707383 11337399
32 weeks 10597356 10947477 ns
Paired samples t-test for the change from baseline to the end of the study
within the group: *Po0.05, **Po0.01. Mean7s.d. aGeneral linear model for
repeated measures analysis for the differences between the groups during the
intervention. bSFA¼ saturated fatty acids, MUFA¼mono-unsaturated fatty
acids, PUFA¼poly-unsaturated fatty acids.
60
65
70
75
80
85
90
95
100
105
Bo
dy
wei
gh
t (k
g)
33 wk12 wk0 wk
Anthropometry Fasting bloodsamplesFSIGT OGTT Adipose tissue sample 4-day food record
Anthropometry Fasting bloodsamples 4-day food record
Anthropometry Fasting bloodsamples FSIGT OGTT Adipose tissue sample 4-day food record
20 wk
Anthropometry
Figure 1 The weight loss (kg) in the weight reduction group divided to
those who lost X5% ~ and to those who lost o5% ’ of their original weight
and in the control group m (mean7s.e.m.) with the measurements done in
the main study visits. FSIGT¼ frequently sampled intravenous glucose
tolerance test, OGTT¼oral glucose tolerance test. The visit on week 20 was
not included in the program of the control group, and thus, this point has
been calculated as a mean of body weight measured at weeks 12 and 33.
Weight reduction and gene expression in ATM Kolehmainen et al
297
International Journal of Obesity

death. AT apoptosis has not been extensively studied, but
loss of weight involves both decrease in adipocyte cell size
and the number of adipocytes.44 Cell number can decrease
by the reduction in the rate of production of new adipocytes
or by apoptosis.45 However, there are reports from animal
studies showing that short-term food restriction alone might
not cause apoptosis.46,47 In our study, the subjects were
examined in the phase of weight maintenance, which
naturally may decrease the apoptotic activity in the tissue.
AT apoptosis has also been linked to inflammation and
especially to the effects of increased TNF-a levels in the AT.48
The decrease in mRNA expression of TNF receptor super-
family observed in the present study might indicate the post
inflammation state in weight maintenance. This is in line
with the decrease found in the high-mobility group box 1-
gene mRNA expression as well as the monocyte to macro-
phage differentiation-associated gene mRNA expression.
Both of these genes have been suggested to be proinflamma-
tory factors,49 which may promote inflammatory effects on
the tissue level and promote insulin resistance in their part.
Interestingly, we found a strong downregulation of the
TNMD gene (fold change 0.67) along with weight reduction.
Moreover, the expression of TNMD was associated with
several characteristics of the metabolic syndrome. Tenomo-
dulin has been suggested to mediate antiangiogenic activity,
and its C-terminal extracellular domain modulates endothe-
lial cell proliferation50–52 indicating that it also might have a
role in the function of ECM. It is also involved in collagen
fibril maturation.53 To our knowledge, this is the first study
to show a link between TNMD and characteristics of
metabolic syndrome including insulin resistance, but the
mechanisms by which tenomodulin may be involved in
insulin sensitivity remains to be elucidated. Weight reduc-
tion has downregulated the expression of TNMD also in
healthy obese subjects.26 Recently, our studies have shown
an association between the TNMD genetic variation and
measures of obesity and the risk of T2DM.54
In a few short-term studies dramatic weight reduction has
produced downregulation in the gene expression of inflam-
mation factors,27 and genes related to desaturation of fatty
acids in AT.26 In cross-sectional studies comparing obese and
lean subjects, upregulation of inflammation-related genes in
Table 4 Changes in clinical characteristics by the degree of weight loss (%) in the weight reduction group and in the subjects selected for the microarray analysis
Weight reduction Microarray analysis
Weight loss X5%,
Group 1 (n¼11)
Weight loss o5%,
Group 2 (n¼17)
Pa Weight reduction (n¼9) Control (n¼10) Pb
Body weight (kg) �8.2 (�10.4 to �6.1) �2.2 (�3.2 to �1.2) 0.0004 �7.7 (�10.2 to �5.1) 0.3 (�0.5 to 1.1) 0.0002
Body mass index (kg m�2) �2.9 (�3.6 to �2.2) �0.7 (�1.1 to �0.4) 0.0006 �2.7 (�3.5 to �1.9) 0.1 (�0.2 to 0.4) 0.0001
Waist circumference (cm) �6.2 (�8.3 to �4.2) �1.9 (�3.1 to �0.8) 0.0003 �5.7 (�8.5 to �2.9) 0.9 (�1.1 to 2.9) 0.003
Lean body mass (kg) �2.8 (�5.3 to �0.4) �0.7 (�1.5 to 0.04) 0.067 �2.4 (�3.9 to �0.8) 0.3 (�0.8 to 1.4) 0.038
Body fat mass (kg) �5.3 (�7.4 to �3.3) �1.5 (�2.6 to �0.4) 0.001 �5.3 (�7.3 to �3.3) 0.01 (�0.8 to 0.8) 0.0007
Body fat (%) �2.7 (�4.7 to �0.8) �0.7 (�1.7 to 0.2) 0.041 �2.6 (�4.4 to �0.9) �0.2 (�1.1 to 0.7) 0.003
Fasting plasma glucose (mmol l�1) �0.3 (�0.61 to 0.01) �0.3 (�0.56 to �0.11) ns �0.25 (�0.58 to 0.08) �0.08 (�0.54 to 0.38) ns
2h-plasma glucose (mmol l�1) �1.77 (�3.56 to 0.02) �0.39 (�1.15 to 0.36) 0.072 �1.04 (�2.25 to 0.16) 0.52 (�1.07 to 2.11) 0.068
Fasting serum insulin (pmol l�1) �19.3 (�38.8 to 0.18) 4.3 (�9.7 to 18.4) 0.032 �17.6 (�39.3 to 4.08) 3.53 (�11.2 to 18.3) 0.003
SI ((mU l�1)�1�min�1)c 0.51 (�0.13 to 1.14) 0.07 (�0.23 to 0.38) 0.037 0.56 (�0.12 to 1.24) �0.11 (�0.94 to 0.72) 0.093
SG (min�1�102)c �0.05 (�0.44 to 0.35) �0.05 (�0.24 to 0.14) ns �0.08 (�0.54 to 0.38) 0.12 (�0.40 to 0.63) ns
AIR ((mU l�1)�1�min�1)c �0.96 (�2.33 to 0.41) 0.37 (�0.52 to 1.25) ns �1.03 (�2.93 to 0.87) �0.09 (�1.78 to 1.60) 0.099
Fasting serum leptin (ng ml�1) �5.68 (�9.37 to �2.0) �1.56 (�3.06 to �0.06) 0.013 �6.06 (�10.47 to �1.66) �0.37 (�2.38 to 1.63) 0.005
Adipocyte cell size (pl) 41 (�287 to 369) 19 (�287 to 325) ns 134 (�263 to 531) 106 (�99 to 311) ns
D (95 % CI). aGeneral linear model for univariate analysis for the differences between Groups 1 and 2 corrected with age, gender and weight at baseline. bGeneral
linear model for univariate analysis for the differences between the subjects selected for the microarray analysis from the weight reduction and control groups
corrected with age, gender and weight at baseline. cSI¼ insulin sensitivity index, AIR¼ acute insulin response, SG¼glucose effectiveness index.
0
0.2
0.4
0.6
0.8
1
1.2
TN
DM
AD
AM
12
PIC
4CB
AD
CY
7
CC
ND
2
PR
DM
4
PD
GF
RL
Fol
d ch
ange
s (in
tens
ity a
fter/
inte
nsity
bef
ore)
Figure 2 The fold changes using quantitative real-time PCR (black bars) and
microarray (white bars) analysis in subjects whose adipose tissue samples were
chosen for microarray analysis from the weight reduction group (n¼9).
TNMD¼ tenomodulin, ADAM12¼A disintegrin metalloproteinase domain
12, PIC4CB¼phosphatidylinositol 4-kinase, catalytic b polypeptide, ADCY7¼adenylate cyclase 7, CCND2¼ cyclin D2, PRDM4¼pr domain containing 4,
PDGFRL¼platelet-derived growth factor receptor-like.
Weight reduction and gene expression in ATM Kolehmainen et al
298
International Journal of Obesity

Table 5 Up- or downregulated genes in the subjects selected for microarray analysis from the weight reduction group
Gene Gene
symbol
Accession
number
Weight reduction group Paired
P-value
Control groupFold change (range)a Fold change (range)/NS
Extracellular matrix
Lysyl oxidase LOX NM_002317 0.85 (0.73–1.00) 0.007 1.09 (0.87–1.37)
Osteonectin SPARC AL575922 0.91 (0.84–1.04) 0.007 1.01 (0.91–1.11)
Microfibrillar-associated protein 5 MFAP5 AW665892 0.78 (0.64–1.03) 0.004 1.00 (0.76–1.54)
AW665892 0.79 (0.60–0.99) 0.005 1.00 (0.80–1.51)
Lysyl oxidase LOX L16895 0.83 (0.71–0.95) 0.003 1.09 (0.87–1.32)
Collagen, type V, a 1 COL5A1 CA430162 0.76 (0.62–0.89) 0.001 absent
Collagen, type I, a 1 COL1A1 BE221212 1.23 (0.96–1.57) 0.004 1.06 (0.84–1.72)
Osteoglycin (osteoinductive factor, mimecan) OGN NM_014057 1.43 (0.92–2.91) 0.007 1.14 (0.65–1.73)
Cell death
Notch homolog 2 NOTCH2 AA291203 0.92 (0.83–0.99) 0.003 0.99 (0.80–1.11)
NOTCH2 AU158495 0.93 (0.88–0.99) 0.008 0.98 (0.83–1.17)
High-mobility group box 1 HMGB1 NM_002128 0.92 (0.86–1.01) 0.005 1.02 (0.96–1.15)
B-cell translocation gene 1, antiproliferative BTG1 AL535380 0.91 (0.83–0.98) 0.005 1.00 (0.83–1.09)
Prostaglandin E receptor 3 (subtype EP3) PTGER3 AL031429 0.81 (0.66–0.98) 0.003 1.02 (0.80–1.52)
Tumor necrosis factor receptor superfamily, member 25 TNFRSF25 NM_003790 0.79 (0.51–1.03) 0.007 1.06 (0.82–1.26)
PERP, TP53 apoptosis effector PERP AJ251830 0.81 (0.71–1.07) 0.006 0.95 (0.79–1.13)
Rac/Cdc42 guanine nucleotide exchange factor 6 ARHGEF6 D25304 0.82 (0.75–0.90) 0.000 0.97 (0.86–1.08)
Adhesion molecule with Ig-like domain 2 AMIGO2 AC004010 0.75 (0.59–0.92) 0.000 1.05 (0.77–1.38)
Monocyte to macrophage differentiation-associated MMD AW104453 1.28 (1.04–1.73) 0.006 1.08 (0.74–1.83)
BCL2-like 11 (apoptosis facilitator) BCL2L11 NM_138626 1.10 (1.01–1.17) 0.008 0.96 (0.80–1.11)
Others
Cyclin D2 CCND2 NM_001759 0.84 (0.67–0.97) 0.003 0.98 (0.82–1.14)
CCND2 AW026491 0.69 (0.55–1.00) 0.006 1.07 (0.60–2.15)
Androgen receptor AR M73069 0.81 (0.61–1.02) 0.007 1.03 (0.74–1.28)
Integrin, b 5 ITGB5 AL048423 0.83 (0.66–0.94) 0.001 1.01 (0.86–1.33)
NM_002213 0.85 (0.70–1.08) 0.005 1.00 (0.87–1.21)
Ubiquitin carboxyl-terminal esterase L1 UCHL1 NM_004181 0.82 (0.71–1.00) 0.001 1.04 (0.87–1.16)
Procollagen-lysine, 2-oxoglutarate 5-dioxygenase 2 PLOD2 AI754404 0.83 (0.71–1.05) 0.002 1.02 (0.87–1.32)
HMBA-inducible HIS1 NM_006460 0.84 (0.67–1.05) 0.009 1.04 (0.84–1.29)
Adenylate cyclase 7 ADCY7 NM_001114 0.84 (0.68–1.01) 0.004 1.00 (0.88–1.14)
Neuronatin NNAT NM_005386 0.69 (0.60–0.98) 0.006 0.98 (0.64–1.36)
Cyclin-dependent kinase 8 R59697 0.87 (0.74–0.98) 0.010 0.97 (0.88–1.17)
SH3 domain binding glutamic acid-rich protein SH3BGR NM_007341 0.86 (0.71–1.05) 0.010 1.04 (0.69–1.37)
Platelet-derived growth factor receptor-like PDGFRL NM_006207 1.22 (1.00–1.56) 0.005 1.15 (0.92–1.50)
Phosphatidylinositol 4-kinase, catalytic, b polypeptide PIC4CB NM_002651 1.13 (1.04–1.27) 0.003 1.02 (0.82–1.16)
Colony stimulating factor 2 receptor, a, low-affinity CSF2RA NM_006140 0.83 (0.72–0.99) 0.006 0.98 (0.59–1.68)
RAB2, member RAS oncogene family RAB2 AI743756 0.88 (0.73–1.04) 0.010 0.99 (0.91–1.18)
RNA binding motif protein 25 RBM25 BE466128 0.85 (0.76–0.99) 0.010 0.98 (0.82–1.14)
ATPase, class II, type 9A ATP9A AB014511 0.90 (0.79–1.03) 0.009 0.98 (0.84–1.10)
PTPRF interacting protein, binding protein 2 PPFIBP2 AI692180 0.81 (0.68–1.07) 0.005 1.00 (0.82–1.55)
A disintegrin and metalloproteinase domain 22 ADAM22 AW242701 0.74 (0.54–0.95) 0.008 0.89 (0.54–1.15)
Phosphatidylinositol glycan, class B PIGB AU144243 0.86 (0.80–1.03) 0.005 1.08 (0.93–1.23)
Ferritin, heavy polypeptide 1 FTH1 AA083483 0.87 (0.73–1.03) 0.006 1.00 (0.84–1.31)
Phosphodiesterase 3B, cGMP-inhibited PDE3B NM_000753 0.88 (0.78–1.06) 0.009 0.98 (0.80–1.07)
Tyrosine 3-monooxygenase/tryptophan 5-monooxygenase
activation protein, b polypeptide
YWHAB NM_014052 0.94 (0.85–0.98) 0.010 1.00 (0.90–1.14)
UPF3 regulator of nonsense transcripts homolog B UPF3B NM_023010 0.85 (0.72–1.00) 0.007 1.01 (0.86–1.15)
Inter-a inhibitor H5 ITIH5 NM_030569 0.86 (0.79–0.99) 0.008 0.99 (0.93–1.08)
Tenomodulin TNMD NM_022144 0.67 (0.44–1.08) 0.000 1.06 (0.62–1.95)
Receptor-interacting factor 1 RIF1 NM_018372 0.81 (0.67–1.04) 0.007 0.96 (0.84–1.16)
Solute carrier family 7, member 10 SLC7A10 NM_017965 1.68 (0.49–2.27) 0.006 1.05 (0.79–1.37)
PHD finger protein 10 PHF10 BF431618 0.91 (0.86–1.00) 0.004 0.99 (0.89–1.20)
AER61 glycosyltransferase AER61 AK023140 0.88 (0.72–0.98) 0.007 1.06 (0.82–1.31)
AP1 g subunit binding protein 1 AP1GBP1 AI472320 0.90 (0.81–0.99) 0.009 0.97 (0.86–1.16)
Mouse mammary Tumor virus receptor homolog 1 MTVR1 AF052151 1.12 (0.92–1.29) 0.008 0.96 (0.87–1.04)
Zinc-finger protein 337 ZNF337 AL049942 1.24 (0.98–1.56) 0.007 1.07 (0.86–1.33)
Glucocorticoid modulatory element binding protein 2 GMEB2 AA045183 1.13 (1.00–1.28) 0.009 0.96 (0.88–1.05)
PR domain containing 4 PRDM4 W22625 1.15 (1.02–1.30) 0.002 1.01 (0.94–1.14)
Abhydrolase domain containing 2 ABHD2 AI832249 0.73 (0.61–0.87) 0.003 0.93 (0.67–1.33)
Shwachman–Bodian–Diamond syndrome SBDS AK001779 0.93 (0.82–1.00) 0.008 0.98 (0.90–1.09)
Myo-inositol monophosphatase A3 BF674724 0.84 (0.61–0.97) 0.007 1.04 (0.95–1.17)
SM-11044 binding protein SMBP BE621524 0.89 (0.77–1.01) 0.009 0.95 (0.86–1.05)
Weight reduction and gene expression in ATM Kolehmainen et al
299
International Journal of Obesity

AT was found in the obese subjects.25 Compared with
previous studies, our study was long-term, with a follow-up
lasting more than 8 months. In addition, the intervention
was moderate, resulting in weight loss of about 8%. The
long-term moderate weight reduction allows adaptation and
compensatory effects to take place. It might, therefore, not
be surprising that we detected changes in different gene
clusters than what has been reported previously. Our
findings are more likely to describe stable long-term changes
in AT at the molecular level after the acute changes in the
Table 5 (continued)
Gene Gene
symbol
Accession
number
Weight reduction group Paired
P-value
Control groupFold change (range)a Fold change (range)/NS
Transcription factor Dp-2 (E2F dimerization partner 2) TFDP2 AI569747 0.92 (0.88–1.04) 0.006 0.96 (0.76–1.12)
Cartilage-associated protein CRTAP AW024741 0.86 (0.77–0.94) 0.001 1.03 (0.83–1.17)
Sorting nexin-associated Golgi protein 1 SNAG1 AU146771 0.87 (0.79–0.99) 0.002 1.01 (0.86–1.29)
Small EDRK-rich factor 2 SERINC4 AI092931 0.87 (0.78–1.02) 0.006 1.04 (0.89–1.20)
A disintegrin and metalloproteinase domain 12 ADAM12 AA147933 0.81 (0.66–1.04) 0.004 1.16 (0.81–1.75)
Exportin, tRNA XPOT AW242820 0.86 (0.77–0.95) 0.002 1.02 (0.94–1.15)
Chloride intracellular channel 6 CLIC6 AI638295 0.77 (0.52–0.94) 0.003 0.97 (0.81–1.18)
Phosphatase and actin regulator 3 PHACTR3 AL357503 0.68 (0.12–0.97) 0.003 0.85 (0.48–1.08)
Acyl-Coenzyme A oxidase 1, palmitoyl ACOX1 BF435852 0.77 (0.66–0.87) 0.000 0.99 (0.68–1.16)
Dihydrolipoamide dehydrogenase (E3 component of pyruvate
dehydrogenase complex, 2-oxo-glutarate complex,
branched chain keto acid dehydrogenase complex)
DLD BF212846 0.88 (0.79–0.94) 0.007 1.01 (0.81–1.16)
NMDA receptor-regulated gene 2 NARG2 BE780502 1.16 (1.04–1.31) 0.004 1.02 (0.89–1.15)
ATP synthase, H+ transporting, mitochondrial F0 complex,
subunit s (factor B)
ATP5S AI308101 0.81 (0.69–0.99) 0.005 1.08 (0.92–1.29)
Developmentally regulated RNA-binding protein 1 DRB1 AW451271 1.24 (1.09–1.50) 0.007 1.07 (0.78–1.70)
Pleckstrin homology domain containing, family H member 2 PLEKHH2 AI217992 0.78 (0.57–0.94) 0.009 0.96 (0.65–1.54)
Translocation protein 1 TLOC1 NM_153039 0.85 (0.75–0.99) 0.003 1.04 (0.94–1.21)
BCL2-like 11 (apoptosis facilitator) BCL2L11 NM_138626 1.10 (1.01–1.17) 0.008 0.96 (0.80–1.11)
Inter-a (globulin) inhibitor H5 ITIH5 NM_032817 0.81 (0.71–0.91) 0.006 1.01 (0.88–1.25)
Methionine sulfoxide reductase B3 isoform 1 MSRB3 BC040053 0.84 (0.66–0.98) 0.006 1.03 (0.82–1.26)
Unknown
KIAA 1102 protein AK027231 0.82 (0.59–1.00) 0.004 1.09 (0.86–1.37)
AK026815 0.80 (0.63–1.06) 0.002 1.02 (0.91–1.23)
AB029025 0.78 (0.68–1.00) 0.003 1.05 (0.86–1.31)
KIAA1908 protein BC036405 0.84 (0.63–0.96) 0.010 1.04 (0.67–1.30)
FLJ20031 BF726849 0.79 (0.48–0.98) 0.005 1.06 (0.59–1.63)
KIAA0934 N42910 0.87 (0.67–1.01) 0.009 1.00 (0.79–1.25)
BC027461.1 BC027461 1.20 (0.98–1.46) 0.006 0.94 (0.63–1.38)
BE674583 BE674583 0.73 (0.53–0.92) 0.005 0.91 (0.55–1.19)
Chromosome 18 open reading frame 4 AK021539 0.80 (0.54–0.94) 0.006 1.11 (0.86–1.65)
FLJ31842 (transmembrane protein 56) AI004375 0.81 (0.62–1.04) 0.004 1.05 (0.92–1.30)
KIAA1430 AA868380 0.82 (0.58–0.98) 0.005 1.07 (0.87–1.41)
KIAA1295 BG054798 1.20 (1.01–1.41) 0.001 1.01 (0.74–1.30)
MRNA full-length insert cDNA clone EUROIMAGE 138904 AI081590 0.86 (0.77–0.94) 0.005 1.11 (0.84–1.24)
AW024350¼ tumor protein, translationally-controlled AW024350 0.84 (0.69–1.01) 0.008 0.94 (0.80–1.14)
LOC285831 AA775731 0.81 (0.71–0.90) 0.002 1.09 (0.96–1.36)
FLJ36031 AA191741 0.88 (0.76–1.02) 0.007 1.11 (0.99–1.26)
AI150000 AI150000 0.86 (0.74–0.99) 0.004 0.98 (0.89–1.12)
Chromosome 16 open reading frame 9 AI688331 0.89 (0.80–0.96) 0.004 1.01 (0.89–1.22)
LOC253827 AL048386 0.87 (0.80–1.01) 0.006 1.07 (0.87–1.26)
Chromosome 10 open reading frame 45 AL136885 0.83 (0.69–0.90) 0.001 1.03 (0.92–1.15)
FLJ11151 NM_018340 0.81 (0.63–1.07) 0.008 0.90 (0.67–1.59)
AI669379 AI669379 1.14 (0.97–1.29) 0.006 1.05 (0.80–1.60)
Z82202 Z82202 1.18 (1.02–1.47) 0.005 1.02 (0.75–1.27)
Similar to 60S ribosomal protein L29 AL008627 1.25 (1.10–1.45) 0.002 1.04 (0.86–1.28)
KIAA0934 N31807 0.88 (0.78–1.01) 0.005 0.97 (0.81–1.28)
Chromosome 10 open reading frame 56 AA131324 0.92 (0.86–1.01) 0.003 0.94 (0.81–1.06)
AW576195 AW576195 0.84 (0.68–0.96) 0.002 1.08 (0.90–1.18)
Similar to FKSG27 AK096168 1.18 (1.00–1.30) 0.002 0.96 (0.80–1.17)
Fold changes (non-significant) of the genes are given also in the control group. Mean(range). aValues are fold changes: intensity of gene expressed after experiment
divided by the intensity at baseline. Genes confirmed by QPCR are marked in bold. The comparisons were made within the groups, paired sample t-test with 100
permutations.
Weight reduction and gene expression in ATM Kolehmainen et al
300
International Journal of Obesity
gene expression that occur with short-term substantial
weight reduction, and continuing negative energy balance.
Previous findings27 have also shown that different cell types
contribute differently to the production or secretion of
adipokines and other molecules in AT. Function of different
cell types in AT is, however, based on their mutual
interaction, which determines the overall impact of AT on
disease development.
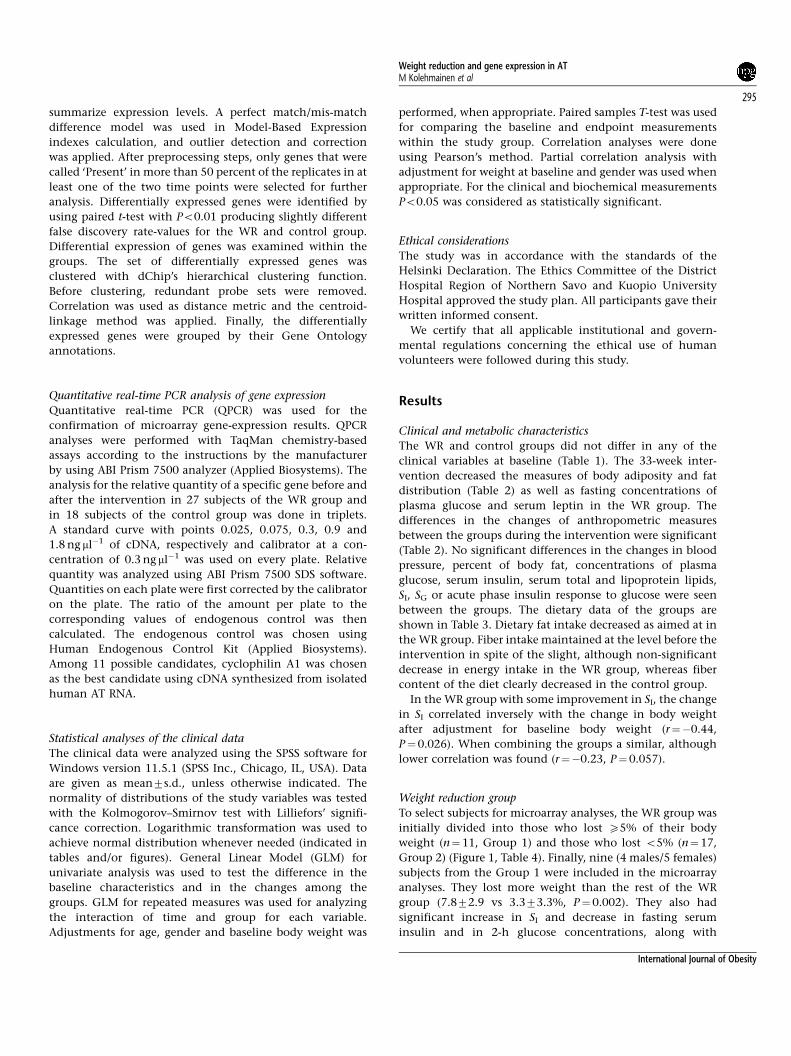
Table 6 Gene expression in the weight reduction and control groups and in the subjects selected for microarray analysis before and after the intervention
Study population Microarray analysis
Weight reduction (n¼27/26) Control (n¼18) Pa Weight reduction (n¼9) Control (n¼10) Pb
TNMD
0 week 104.9745.9 77.9741.2 116.2736.2 72.1748.9
33 weeks 87.4755.9* 76.0733.9 ns 71.2727.6**** 68.2734.8 ns
ADAM12
0 week 75.7721.6 100.3729.8 85.1718.9 90.8717.0
33 weeks 70.8724.3 103.7724.0 0.0001 71.8719.5** 101.2724.6 0.051
PIC4CB
0 week 78.1714.5 86.5716.7 73.9715.1 82.8718.9
33 weeks 79.2712.0 89.1715.7 0.035 75.279.5 83.6716.7 ns
ADCY7
0 week 87.6727.1 82.1718.8 85.2729.7 79.6716.8
33 weeks 71.6716.4*** 86.5722.2 ns 72.2719.4 80.3715.5 ns
CCND2
0 week 78.9718.2 83.1725.6 79.7715.6 84.1732.6
33 weeks 67.0724.8*** 81.6725.0 ns 59.9722.6** 86.6732.2 ns
PRDM
0 week 64.6725.5 93.5736.4 74.8734.4 85.4735.5
33 weeks 67.8726.3 90.3732.5 0.003 69.6730.8 88.3733.9 ns
PDGFRL
0 week 64.8721.7 105.7740.4 60.6714.4 99.5737.1
33 weeks 72.5723.5** 122.7739.4*** 0.0001 68.0721.3 120.3741.4*** 0.004
Mean7s.d. Expression of target genes is related to the expression of cyclophilin A1-gene. Values are arbitrary units of the ratio between the expression of target gene
to the expression of cyclophilin A1 multiplied by 100 are used. Abbreviations: TNMD¼ tenomodulin, ADAM12¼A disintegrin and metalloproteinase domain 12,
PIC4CB¼phosphatidylinositol 4-kinase, catalytic b polypeptide, ADCY7¼ adenylate cyclase 7, CCND2¼ cyclin D2, PRDM¼pr domain containing 4,
PDGFRL¼platelet-derived growth factor receptor-like. Paired samples t-test for the change from baseline to the end of the study within the group: *P¼ 0.088,
**Po0.05, ***Po0.01, ****Po0.001. aGeneral linear model for the interaction of time and group between the weight reduction and control group. bGLM,
interaction of time and group between the subjects who were chosen for the microarray analysis from the weight reduction and control group.
-1.5
-1
-0.5
0
0.5
1
-1.5
-1
-0.5
0
0.5
1
1.5
-100 -50 0 50 100 150 200-100 -50 0 50 100Tenomodulin gene expression
adjusted for weightTenomodulin gene expression
adjusted for weight
Fast
ing
seru
m in
sulin
adj
uste
dfo
r w
eigh
t
Fast
ing
seru
m in
sulin
adj
uste
dfo
r w
eigh
t
a br= 0.409, p=0.008 r= 0.383, p=0.014
Figure 3 Correlations adjusted for baseline body weight between the tenomodulin gene expression in adipose tissue and fasting serum insulin concentration
before (a) and after (b) the intervention. Weight reduction and control groups are combined. Fasting concentrations for serum insulin are logarithmic transformed.
Weight reduction and gene expression in ATM Kolehmainen et al
301
International Journal of Obesity

Long-term moderate weight reduction and reduction of fat
mass altered the gene expression of subcutaneous AT in
humans. Genes involved in the function of the ECM and
terminal differentiation of adipocytesFcell death showed a
strong downregulation after weight reduction. This likely
reflects a new stable state at the molecular level in AT.
Further studies are warranted to elucidate the mechanisms of
these genetic factors in human pathogenesis of insulin
resistance and T2DM.
Acknowledgements
This work has been financially supported by grants from
Sigrid Juselius Foundation, the Academy of Finland (no.
209445; no. 211497), EVO funding (no. 5179, 5198), the
Ministry of Education in Finland (no. 125/722/2003) and the
Finnish Foundation for Diabetes Research.
The Genobin-study group is grateful for the valuable
discussion and comments concerning the data analysis with
Professor Sander Kersten from Wageningen University and
Research Centre. The study group appreciates the excellent
technical assistance of Minna Kiuttu, Kaija Kettunen,
Tuomas Onnukka, Erja Kinnunen, Ulla Tuovinen and Tuula
Turunen.
References
1 Uusitupa M. Gene-diet interaction in relation to the preventionof obesity and type 2 diabetes: evidence from the FinnishDiabetes Prevention Study. Nutr Metab Cardiovasc Dis 2005; 15:225–233.
2 Eckel RH, Grundy SM, Zimmet PZ. The metabolic syndrome.Lancet 2005; 365: 1415–1428.
3 Moller DE, Kaufman KD. Metabolic syndrome: a clinical andmolecular perspective. Annu Rev Med 2005; 56: 45–62.
4 Laaksonen DE, Lakka HM, Niskanen LK, Kaplan GA, Salonen JT,Lakka TA. Metabolic syndrome and development of diabetesmellitus: application and validation of recently suggested defini-tions of the metabolic syndrome in a prospective cohort study.Am J Epidemiol 2002; 156: 1070–1077.
5 Laaksonen DE, Niskanen L, Lakka HM, Lakka TA, Uusitupa M.Epidemiology and treatment of the metabolic syndrome.Ann Med 2004; 36: 332–346.
6 Uusitupa M, Lindi V, Louheranta A, Salopuro T, Lindstrom J,Tuomilehto J, Finnish Diabetes Prevention Study Group. Long-term improvement in insulin sensitivity by changing lifestyles ofpeople with impaired glucose tolerance: 4-year results from theFinnish Diabetes Prevention Study. Diabetes 2003; 52: 2532–2538.
7 Kahn SE. The relative contributions of insulin resistance andbeta-cell dysfunction to the pathophysiology of Type 2 diabetes.Diabetologia 2003; 46: 3–19.
8 Osei K, Rhinesmith S, Gaillard T, Schuster D. Impaired insulinsensitivity, insulin secretion, and glucose effectiveness predictfuture development of impaired glucose tolerance and type 2diabetes in pre-diabetic African Americans: implications forprimary diabetes prevention. Diabetes Care 2004; 27: 1439–1446.
9 Tuomilehto J, Lindstrom J, Eriksson JG, Valle TT, Hamalainen H,Ilanne-Parikka P et al. Prevention of type 2 diabetes mellitus bychanges in lifestyle among subjects with impaired glucosetolerance. N Engl J Med 2001; 344: 1343–1350.
10 Knowler WC, Barrett-Connor E, Fowler SE, Hamman RF, LachinJM, Walker EA et al. Reduction in the incidence of type 2 diabeteswith lifestyle intervention or metformin. N Engl J Med 2002; 346:393–403.
11 Pan XR, Li GW, Hu YH, Wang JX, Yang WY, An ZX et al. Effects ofdiet and exercise in preventing NIDDM in people with impairedglucose tolerance. The Da Qing IGT and Diabetes Study. DiabetesCare 1997; 20: 537–544.
12 Kloting N, Berndt J, Kralisch S, Kovacs P, Fasshauer M, Schon MRet al. Vaspin gene expression in human adipose tissue: associationwith obesity and type 2 diabetes. Biochem Biophys Res Commun2006; 339: 430–436.
13 Marrades MP, Milagro FI, Martinez JA, Moreno-Aliaga MJ.Differential expression of aquaporin 7 in adipose tissue of leanand obese high fat consumers. Biochem Biophys Res Commun 2006;339: 785–789.
14 Nordstrom EA, Ryden M, Backlund EC, Dahlman I, Kaaman M,Blomqvist L et al. A human-specific role of cell death-inducingDFFA (DNA fragmentation factor-alpha)-like effector A (CIDEA)in adipocyte lipolysis and obesity. Diabetes 2005; 54: 1726–1734.
15 Large V, Arner P. Regulation of lipolysis in humans. Pathophy-siological modulation in obesity, diabetes, and hyperlipidaemia.Diabetes Metab 1998; 24: 409–418.
16 Bastard JP, Maachi M, Lagathu C, Kim MJ, Caron M, Vidal H et al.Recent advances in the relationship between obesity, inflamma-tion, and insulin resistance. Eur Cytokine Netw 2006; 17: 4–12.
17 Trayhurn P, Bing C, Wood IS. Adipose tissue and adipokinesFenergy regulation from the human perspective. J Nutr 2006; 136:1935S–1939S.
18 Matsuzawa Y. The metabolic syndrome and adipocytokines. FEBSLett 2006; 580: 2917–2921.
19 Viguerie N, Vidal H, Arner P, Holst C, Verdich C, Avizou S et al.Adipose tissue gene expression in obese subjects during low-fatand high-fat hypocaloric diets. Diabetologia 2005; 48: 123–131.
20 Arvidsson E, Viguerie N, Andersson I, Verdich C, Langin D, ArnerP. Effects of different hypocaloric diets on protein secretion fromadipose tissue of obese women. Diabetes 2004; 53: 1966–1971.
21 Cancello R, Henegar C, Viguerie N, Taleb S, Poitou C, Rouault Cet al. Reduction of macrophage infiltration and chemoattractantgene expression changes in white adipose tissue of morbidlyobese subjects after surgery-induced weight loss. Diabetes 2005;54: 2277–2286.
22 Rasmussen M, Belza A, Almdal T, Toubro S, Bratholm P, Astrup Aet al. Change in beta1-adrenergic receptor protein concentrationin adipose tissue correlates with diet-induced weight loss. Clin Sci(London) 2005; 108: 323–329.
23 Kolehmainen M, Vidal H, Alhava E, Uusitupa MI. Sterolregulatory element binding protein 1c (SREBP-1c) expression inhuman obesity. Obes Res 2001; 9: 706–712.
24 Gomez-Ambrosi J, Catalan V, Diez-Caballero A, Martinez-CruzLA, Gil MJ, Garcia-Foncillas J et al. Gene expression profileof omental adipose tissue in human obesity. FASEB J 2004; 18:215–217.
25 Lee YH, Nair S, Rousseau E, Allison DB, Page GP, Tataranni PAet al. Microarray profiling of isolated abdominal subcutaneousadipocytes from obese vs non-obese Pima Indians: increasedexpression of inflammation-related genes. Diabetologia 2005; 48:1776–1783.
26 Dahlman I, Linder K, Arvidsson Nordstrom E, Andersson I, LidenJ, Verdich C et al. Changes in adipose tissue gene expression withenergy-restricted diets in obese women. Am J Clin Nutr 2005; 81:1275–1285.
27 Clement K, Viguerie N, Poitou C, Carette C, Pelloux V, Curat CAet al. Weight loss regulates inflammation-related genes in whiteadipose tissue of obese subjects. FASEB J 2004; 18: 1657–1669.
28 Expert Panel on Detection, Evaluation and Treatment of HighBlood Cholesterol in Adults. Executive Summary of The ThirdReport of The National Cholesterol Education Program (NCEP)expert panel on detection, evaluation, and treatment of high
Weight reduction and gene expression in ATM Kolehmainen et al
302
International Journal of Obesity

blood cholesterol in adults (Adult treatment panel III). JAMA2001; 285: 2486–2497.
29 Grundy SM, Cleeman JI, Daniels SR, Donato KA, Eckel RH,Franklin BA et al. Diagnosis and management of the metabolicsyndrome: an American Heart Association/National Heart, Lung,and Blood Institute scientific statement. Curr Opin Cardiol 2006;21: 1–6.
30 Sarkkinen E, Schwab U, Niskanen L, Hannuksela M, SavolainenM, Kervinen K et al. The effects of monounsaturated-fat enricheddiet and polyunsaturated-fat enriched diet on lipid and glucosemetabolism in subjects with impaired glucose tolerance. Eur J ClinNutr 1996; 50: 592–598.
31 Boston RC, Stefanovski D, Moate PJ, Sumner AE, Watanabe RM,Bergman RN. MINMOD Millennium: a computer program tocalculate glucose effectiveness and insulin sensitivity from thefrequently sampled intravenous glucose tolerance test. DiabetesTechnol Ther 2003; 5: 1003–1015.
32 Ohisalo JJ, Kaartinen JM, Ranta S, Mustajoki P, Hreniuk SP,LaNoue KF et al. Weight loss normalizes the inhibitory effect ofN6-(phenylisopropyl)adenosine on lipolysis in fat cells ofmassively obese human subjects. Clin Sci (London) 1992; 83:589–592.
33 Rodbell M. Metabolism of isolated fat cells. I. Effects of hormoneson glucose metabolism and lipolysis. J Biol Chem 1964; 239:375–380.
34 Li C, Hung Wong W. Model-based analysis of oligonucleotide arrays:model validation, design issues and standard error application.Genome Biol 2001; 2: research0032.1–research0032.11, Publishedonline 3 August 2001.
35 Li C, Hung Wong W. Model-based analysis of oligonucleotidearrays: expression index computation and outlier detection. ProcNatl Acad Sci 2001; 98: 31–36.
36 Kaput J, Rodriguez RL. Nutritional genomics: the next frontier inthe postgenomic era. Physiol Genomics 2004; 16: 166–177.
37 Higami Y, Barger JL, Page GP, Allison DB, Smith SR, Prolla TA et al.Energy restriction lowers the expression of genes linked toinflammation, the cytoskeleton, the extracellular matrix, andangiogenesis in mouse adipose tissue. J Nutr 2006; 136: 343–352.
38 Martin A, Komada MR, Sane DC. Abnormal angiogenesis indiabetes mellitus. Med Res Rev 2003; 23: 117–145.
39 Hayden MR, Sowers JR, Tyagi SC. The central role of vascularextracellular matrix and basement membrane remodeling inmetabolic syndrome and type 2 diabetes: the matrix preloaded.Cardiovasc Diabetol 2005; 4: 9–29.
40 Vaziri ND, Xu ZG, Shahkarami A, Huang KT, Rodriguez-Iturbe B,Natarajan R. Role of AT-1 receptor in regulation of vascular MCP-1, IL-6, PAI-1, MAP kinase, and matrix expressions in obesity.Kidney Int 2005; 68: 2787–2793.
41 Chavey C, Mari B, Monthouel MN, Bonnafous S, Anglard P,Van Obberghen E et al. Matrix metalloproteinases are differen-
tially expressed in adipose tissue during obesity and modulateadipocyte differentiation. J Biol Chem 2003; 278: 11888–11896.
42 Guan H, Arany E, van Beek JP, Chamson-Reig A, Thyssen S, HillDJ et al. Adipose tissue gene expression profiling reveals distinctmolecular pathways that define visceral adiposity in offspring ofmaternal protein-restricted rats. Am J Physiol Endocrinol Metab2005; 288: E663–E673.
43 Wang P, Keijer J, Bunschoten A, Bouwman F, Renes J, Mariman E.Insulin modulates the secretion of proteins from mature 3T3-L1adipocytes: a role for transcriptional regulation of processing.Diabetologia 2006; 49: 2453–2462.
44 Prins JB, O’Rahilly S. Regulation of adipose cell number in man.Clin Sci 1997; 92: 3–11.
45 Prins JB, Walker NI, Winterford CM, Cameron DP. Humanadipocyte apoptosis occurs in malignancy. Biochem and BiophysRes Commun 1994; 205: 625–630.
46 Ishiko O, Sumi T, Yoshida H, Hyun Y, Ogita S. Comparison ofexpression of apoptosis regulatory proteins in the adipose tissueof tumor-bearing and diet-restricted rabbits. Internatl JMol Med2001; 8: 543–547.
47 Yang MU, Presta E, Bjorntorp P. Refeeding after fasting inrats: effects of duration of starvation and refeeding on foodefficiency in diet-induced obesity. Am J Clin Nutr 1990; 51:970–978.
48 Prins JB, Niesler CU, Winterford CM, Bright NM, Siddle K,O’Rahilly S et al. Tumor necrosis factor-a induces apoptosis ofhuman adipose cells. Diabetes 1997; 46: 1939–1944.
49 Ulloa L, Messmer D. High-mobility group box 1 (HMGB1)protein: friend and foe. Cytokine Growth Factor Rev 2006; 17:189–201.
50 Shukunami C, Oshima Y, Hiraki Y. Molecular cloning oftenomodulin, a novel chondromodulin-I related gene. BiochemBiophys Res Commun 2001; 280: 1323–1327.
51 Oshima Y, Shukunami C, Honda J, Nishida K, Tashiro F,Miyazaki J et al. Expression and localization of tenomodulin, atransmembrane type chondromodulin-I-related angiogenesisinhibitor, in mouse eyes. Invest Ophthalmol Vis Sci 2003; 44:1814–1823.
52 Oshima Y, Sato K, Tashiro F, Miyazaki J, Nishida K, Hiraki Y et al.Anti-angiogenic action of the C-terminal domain of tenomodulinthat shares homology with chondromodulin-I. J Cell Sci 2004;117: 2731–2744.
53 Docheva D, Hunziker EB, Fassler R, Brandau O. Tenomodulin isnecessary for tenocyte proliferation and tendon maturation. MolCell Biol 2005; 25: 699–705.
54 Tolppanen AM, Pulkkinen L, Kolehmainen M, Schwab U,Lindstrom J, Tuomilehto J, et al., for the Finnish DiabetesPrevention Study Group. Tenomodulin gene variations associatewith adiposity and risk of diabetesFthe DPS study. Obesity 2007;15: 1082–1088.
Supplementary Information accompanies the paper on International Journal of Obesity website (http://www.nature.com/ijo)
Weight reduction and gene expression in ATM Kolehmainen et al
303
International Journal of Obesity