Entrepreneurship Education: Panacea to Poverty Alleviation and Human Capital Development.

Weight change in middle adulthood and breast cancer risk inthe EPIC-PANACEA study
Marleen J. Emaus1, Carla H. van Gils1, Marije F. Bakker1, Charlotte N. Steins Bisschop1, Evelyn M. Monninkhof1,
H. Bas Bueno-de-Mesquita2,3,4, No�emie Travier5, Tina Landsvig Berentzen6, Kim Overvad7, Anne Tj�nneland8,
Isabelle Romieu9, Sabina Rinaldi9, Veronique Chajes9, Marc J. Gunter4, Francoise Clavel-Chapelon10,11,12,
Guy Fagherazzi10,11,12, Sylvie Mesrine10,11,12, Jenny Chang-Claude13, Rudolf Kaaks13, Heiner Boeing14,
Krasimira Aleksandrova14, Antonia Trichopoulou15,16, Androniki Naska15,16, Philippos Orfanos15,16, Domenico Palli17,
Claudia Agnoli18, Rosario Tumino19, Paolo Vineis4,20, Amalia Mattiello21, Tonje Braaten22, Kristin Benjaminsen Borch22,
Eiliv Lund22, Virginia Men�endez23, Mar�ıa-Jos�e S�anchez24,25, Carmen Navarro25,26,27, Aurelio Barricarte25,28, Pilar Amiano29,
Malin Sund30, Anne Andersson31, Signe Borgquist32,33, Asa Olsson34, Kay-Tee Khaw35, Nick Wareham35,36,
Ruth C. Travis37, Elio Riboli4, Petra H.M. Peeters1,4 and Anne M. May1
1 Julius Center for Health Sciences and Primary Care, University Medical Center Utrecht, Utrecht, the Netherlands2 National Institute for Public Health and the Environment (RIVM), Bilthoven, The Netherlands3 Department of Gastroenterology and Hepatology, University Medical Center, Utrecht, the Netherlands4 Department of Epidemiology and Biostatistics, School of Public Health, Imperial College London, London, United Kingdom5 Unit of Nutrition, Environment and Cancer, Cancer Epidemiology Research Programme, Catalan Institute of Oncology, Barcelona, Spain6 Institute of Preventive Medicine, Bispebjerg and Frederiksberg Hospitals—A part of Copenhagen University Hospital, The Capital Region, Copenhagen,
Denmark7 Department of Public Health, Section for Epidemiology, Aarhus University, Aarhus, Denmark8 The Danish Cancer Society, Institute of Cancer Epidemiology, Copenhagen, Denmark9 International Agency for Research on Cancer (IARC-WHO), Lyon, France10 Inserm, Centre for research in Epidemiology and Population Health (CESP), U1018, Nutrition, Hormones and Women’s Health team, F-94805, Villejuif,
France11 Univ Paris Sud, UMRS 1018, F-94805, Villejuif, France12 IGR, F-94805, Villejuif, France13 German Cancer Research Center (DKFZ), Heidelberg, Germany14 Department of Epidemiology, German Institute of Human Nutrition Potsdam-Rehbr€ucke, Nuthetal, Germany15 Department of Hygiene, Epidemiology and Medical Statistics, WHO Collaborating Center for Food and Nutrition Policies, University of Athens Medical
School, Athens, Greece
Key words: breast cancer, adult weight gain, menopausal status, estrogen receptor, progesterone receptor
Abbreviations: EPIC: European Prospective Investigation into Cancer and Nutrition; ER: estrogen receptor; HRT: hormone replacement
therapy; PANACEA: Physical Activity, Nutrition, Alcohol, Cessation of smoking, Eating out of home And obesity; PR: progesterone
receptor
Additional Supporting Information may be found in the online version of this article.
Grant sponsor: Netherlands Organisation for Health Research and Development (to MJE); Grant number: ZONMW-200320002-UMCU;
Grant sponsor: Public Health Programme of the European Union (to The EPIC-PANACEA project); Grant number: 2005328; Grant
sponsor: “Europe Against Cancer Programme” of the European Commission (SANCO); Grant sponsor: French League against Cancer
(LNCC); National Institute for Health and Medical Research (INSERM), France; Mutuelle Generale de l’Education Nationale (MGEN),
France; 3M Co, France; Gustave Roussy Institute (IGR), France; General Councils of France; German Cancer Aid; German Cancer Research
Centre; German Federal Ministry of Education and Research; Danish Cancer Society; Health Research Fund (FIS) of the Spanish Ministry of
Health; Grant number: Exp P10710130; Grant sponsor: Regional Governments of Andaluc�ıa, Asturias, Basque Country, Murcia, Navarra;
Grant number: 6236; Grant sponsor: Catalan Institute of Oncology, La Caixa (Spain); Grant number: BM 06-130, RTICC-RD06/0020;
Grant sponsors: Cancer Research, United Kingdom; Medical Research Council, United Kingdom; the Hellenic Health Foundation, Greece;
Italian Association for Research on Cancer; Grant sponsors: Italian National Research Council; Fondazione-Istituto Banco Napoli, Italy;
Compagnia di San Paolo; Dutch Ministry of Public Health, Welfare and Sports; Dutch Prevention Funds; LK Research Funds; Dutch ZON
(Zorg Onderzoek Nederland); World Cancer Research Fund; Statistics Netherlands, The Netherlands; Swedish Cancer Society; Swedish
Scientific Council; Regional Government of Skane, Sweden; Nordforsk Centre of Excellence programme in Food, Nutrition and Health
(Helga), Norway
DOI: 10.1002/ijc.28926
History: Received 13 Jan 2014; Accepted 20 Mar 2014; Online 26 Apr 2014
Correspondence to: Anne M. May, Julius Center for Health Sciences and Primary Care, University Medical Center Utrecht, Heidelberglaan
100, 3584 CX, the Netherlands, Tel.: 131-88-755-1132, Fax: 131-88-755-5480, E-mail: [email protected]
Epidemiology
Int. J. Cancer: 00, 00–00 (2014) VC 2014 UICC
International Journal of Cancer
IJC

16 Hellenic Health Foundation, Athens, Greece17 Molecular and Nutritional Epidemiology Unit, Cancer Research and Prevention Institute—ISPO, Florence, Italy18 Epidemiology and Prevention Unit, Fondazione IRCCS Istituto Nazionale dei Tumori, Milano, Italy19 Cancer Registry and Histopathology Unit, "Civile M.P. Arezzo" Hospital, ASP Ragusa, Italy20 HuGeF Foundation, Torino, Italy21 Dipartimento Di Medicina Clinica E Chirurgia Federico II University, Naples, Italy22 Department of Community Medicine, University of Troms�, Troms�, Norway23 Public Health Directorate, Asturias, Spain24 Andalusian School of Public Health, Granada, Spain25 CIBER de Epidemiolog�ıa y Salud P�ublica (CIBERESP), Barcelona, Spain26 Department of Epidemiology, Murcia Regional Health Council, Murcia, Spain27 Department of Health and Social Sciences, Universidad de Murcia, Murcia, Spain28 Navarre Public Health Institute, Pamplona, Spain29 Public Health Division of Gipuzkoa, San Sebastian, Spain30 Department of Surgical and Perioperative Sciences/Surgery, Umea University, Umea, Sweden31 Department of radiation sciences, oncology, Umea University, Umea, Sweden32 Division of Oncology, Department of Clinical Sciences, Lund University, Lund, Sweden33 Department of Oncology, Skane University Hospital, Lund, Sweden34 Department of Surgery, Lund University, Skane University Hospital, Malm€o, Sweden35 University of Cambridge, Cambridge, United Kingdom36 MRC Epidemiology Unit, Cambridge, United Kingdom37 Cancer Epidemiology Unit, University of Oxford, Oxford, United Kingdom
Long-term weight gain (i.e., weight gain since age 20) has been related to higher risk of postmenopausal breast cancer, but a
lower risk of premenopausal breast cancer. The effect of weight change in middle adulthood is unclear. We investigated the
association between weight change in middle adulthood (i.e., women aged 40–50 years) and the risk of breast cancer before
and after the age of 50. We included female participants of the European Prospective Investigation into Cancer and Nutrition
cohort, with information on anthropometric measures at recruitment and after a median follow-up of 4.3 years. Annual weight
change was categorized using quintiles taking quintile 2 and 3 as the reference category (20.44 to 0.36 kg/year). Multivari-
able Cox proportional hazards regression analysis was used to examine the association. 205,723 women were included and
4,663 incident breast cancer cases were diagnosed during a median follow-up of 7.5 years (from second weight assessment
onward). High weight gain (Q5: 0.83–4.98 kg/year) was related to a slightly, but significantly higher breast cancer risk
(HRQ5_versus_Q2/3: 1.09, 95% CI: 1.0121.18). The association was more pronounced for breast cancer diagnosed before or at
age 50 (HRQ5_versus_Q2/3: 1.37, 95% CI: 1.0221.85). Weight loss was not associated with breast cancer risk. There was no evi-
dence for heterogeneity by hormone receptor status. In conclusion, high weight gain in middle adulthood increases the risk of
breast cancer. The association seems to be more pronounced for breast cancer diagnosed before or at age 50. Our results
illustrate the importance of avoiding weight gain in middle adulthood.
Based on the results of cohort1–11 and case–control stud-ies,12–17 the World Cancer Research Fund states that long-term adult weight gain (i.e., recalled weight gain since age20) increases the risk of postmenopausal breast cancer andgrades this relation as “probable”.18
Most studies investigated the association between long-term weight gain and breast cancer risk without a focus on a
particular period in life. Only two cohort studies have exam-ined prospective changes in weight in middle adulthood aswell (i.e., weight change since menopause,4 and between age45–55 and after age 555). Although both studies showed anincreased postmenopausal breast cancer risk for long-termweight gain (defined as weight gain since age 184 and sinceage 255), the results for weight gain in middle adulthood
What’s new?
This is one of the first studies that investigated the effect of prospectively measured weight change in middle adulthood in
relation to breast cancer. We used data from the EPIC-PANACEA study which is a large multicenter cohort study. Although it is
well known that BMI protects against premenopausal breast cancer, this study found evidence that weight gain in middle
adulthood increases breast cancer risk, especially breast cancer diagnosed before or at age 50.
Epidemiology
2 Weight change in middle adulthood
Int. J. Cancer: 00, 00–00 (2014) VC 2014 UICC

varied from no association5 to a slightly increased risk ofpostmenopausal breast cancer.4 A third study investigated theassociation between weight change before (<45 years),between (�45 and <55 years) and after menopause (�55years) and the risk of postmenopausal breast cancer.19 Thisprospective study observed an increased risk for postmeno-pausal breast cancer in relation to weight gain before andaround menopause.
In line with these findings, one would expect that theassociation of weight loss and breast cancer is in the oppositedirection of the association of weight gain and breast cancer.However, previous studies did not provide sufficient evidencefor this hypothesis.1,3,12,16,17,20
The effect of weight change has been proposed to bemodified by BMI15 and the use of postmenopausal hormonereplacement therapy (HRT).4,6–8,11 Studies suggest that therelationship is more pronounced or only present in leanerwomen and non-HRT users.
In the European Prospective Investigation into Cancerand Nutrition (EPIC), the association between weight changesince age 20 until EPIC recruitment and breast cancer riskhas been investigated showing a higher breast cancer risk inpostmenopausal non-current HRT users only.6 Here, we eval-uated the association between weight change in middle adult-hood (i.e., after recruitment into the cohort, when themajority of participants was between 46 and 58 years old)and the occurrence of primary invasive breast cancer diag-nosed before and after the age of 50 years. For this, we usedata from the European Prospective Investigation into Cancerand Nutrition-Physical Activity, Nutrition, Alcohol, Cessationof smoking, Eating out of home And obesity (EPIC-PANA-CEA) study, which is a subcohort of EPIC that includes allparticipants with repeated assessment of anthropometry.21,22
We further investigated whether associations differ by thetiming of weight change, i.e., occurring either in the periodbefore, around or after the age of 50 years, or by hormonereceptor status of the breast tumors. Potential effect modifica-tion by BMI and use of HRT at recruitment was explored aswell.
Material and MethodsSubjects
The EPIC study is an on-going multi-center prospectivecohort study designed to investigate the relation betweennutrition and cancer occurrence. The design of EPIC isdescribed in detail elsewhere.23 The cohort consists of 23 cen-ters in ten European countries (i.e., Denmark, France, Ger-many, Greece, Italy, Netherlands, Norway, Spain, Sweden andUnited Kingdom). From 1992–2000, more than 500,000 indi-viduals aged between 25 and 70 years were recruited in tenEuropean countries. All participants gave written or oralinformed consent. The study was approved by the Interna-tional Agency for Research on Cancer ethical review commit-tee and by local ethical committees at the participatingcenters.
The EPIC-PANACEA study is a subcohort of EPIC whererepeated data of anthropometry are available, and is origi-nally designed to investigate determinants of obesity andweight changes in Europe.21,22
For EPIC-PANACEA, 147,103 participants were excludedaccording to the PANACEA exclusion criteria, i.e., missingdietary and non-dietary questionnaires, in the top or bottom1% of the ratio of energy intake to energy requirement (esti-mated from age, sex, and body weight and height), pregnantwomen, missing weight at recruitment or extreme anthropo-metric values (i.e., height <1.3 m, BMI <16 kg/m2, waist cir-cumference >160 cm and waist circumference <60 cm incombination with BMI >25 kg/m2), missing follow-up weight(this included the cohorts of Turin and Ragusa (both Italy)and parts of cohorts from Norway and Naples (Italy)) or par-ticipants with a weight change of �5 or >5 kg/year over sev-eral years.
For the present study, we further excluded male partici-pants (N 5 91,390) and women without any follow-upinformation after the second weight assessment, or womenwith (prevalent or incident) cancer other than non-mela-noma skin cancers before the second weight assessment (N5 45,404). Furthermore, women with a breast cancer insitu diagnosis after the second weight assessment, or withmissing information on breast cancer occurrence or onbreast cancer behavior were excluded (N 5 697). Partici-pants of the centers Norway and Umeå (Sweden) wereexcluded (N 5 31,131), because in these centers differentquestionnaires were used to assess physical activity. Thefinal study population comprised 205,723 women fromnine countries.
Assessment of anthropometric measures and weight
change
At recruitment, anthropometry was assessed by trained staffusing a standard examination protocol which has beendescribed in detail.24 Weight was measured to the nearest0.1 kg and height was measured without shoes, to the near-est 0.1, 0.5 or 1.0 cm depending on the study center. Themeasurements were corrected to account for protocol differ-ences between centers.24 The centers in Oxford (UnitedKingdom) and France collected self-reported weight andheight.
The second weight assessment took place after amedian follow-up of 4.3 years (IQR: 3.525.4 years), andwas conducted through self-report in all centers, with theexception of Cambridge (United Kingdom) and Doetin-chem (Netherlands) where weight was measured bytrained staff.
To account for differences in follow-up time between firstand second weight assessment (varying from 2 to 11 years),annual weight change was calculated by dividing absoluteweight change by follow-up time between two weightassessments.
Epidemiology
Emaus et al. 3
Int. J. Cancer: 00, 00–00 (2014) VC 2014 UICC

Assessment of end point
The outcome of interest was first incident of primary invasivebreast cancer diagnosed after the second weight assessment(Fig. 1), identified through population cancer registries or byactive follow-up. The active follow-up procedure used a com-bination of methods including health insurance records, can-cer and pathology registries, and active follow-up throughstudy participants and their next-of-kin. Cancer incidencedata were classified according to the International Classifica-tion of Disease, 10th Revision. Breast cancer was defined asC50. Censoring dates for each center were establisheddepending on the dates at which cancer registries were con-sidered complete. In case of active follow-up, the end offollow-up was the last known contact, date of diagnosis, ordate of death, whichever came first. Loss to follow-up was3.7%. Information on hormone receptor status was providedby each center based on pathology reports and was routinelyavailable for tumors diagnosed after 1997–2006, dependingon center.
Potential confounders
Information on potential confounders was obtained from thestandardized health and lifestyle and food frequency ques-tionnaires at recruitment.23
Statistical analysis
Annual weight change was categorized according to quintilesusing quintile 2 and 3 as the reference category (i.e., stableweight, range 20.44 to 0.36 kg/year). In the current litera-ture, no standard criteria of stable weight are available, but aweight change of 62 kg over approximately 5 years has beenused as reference before.4,5,8 Cox proportional hazards mod-
els were used to estimate adjusted hazard ratios and 95%confidence intervals of primary invasive breast cancer inci-dences for each weight change category. Attained age wasused as the underlying time variable. All analyses were strati-fied by study center and age at second weight assessment toreduce violations of the proportional hazards assumption.The proportional hazard assumption was tested by examiningthe relationship between scaled Schoenfeld residuals andtime,25 and found not to be violated.
The models were adjusted for several lifestyle characteris-tics collected at recruitment: BMI (kg/m2, continuous), smok-ing status and intensity (never, former and quitted >20 yearsago, former and quitted 11–20 years ago, former and quitted�10 years ago, current and pipe/cigar smoking, current and1–15 cigarettes/day, current and 16–25 cigarettes/day, currentand >26 cigarettes a day), alcohol user (yes/no), alcohol con-sumption (g/day, continuous), educational level (none, pri-mary school, technical/professional school, secondary schooland university degree), physical activity (inactive, moderatelyinactive, moderately active and active),26 age at menarche(never, <12, 12–14 and >14 years), use of oral contraceptives(never, past and current), age at first full term pregnancy(nulliparous, �20, >20 and �25, >25 and �30 and >30years), menopausal status (premenopausal, perimenopausal/unknown and postmenopausal), HRT use (never, past andcurrent), energy intake (kcal/day, continuous), as well as timeperiod between the two weight assessments (years, continu-ous). Missing covariate values were imputed using multipleimputation (m 5 5).27
Since pre- and postmenopausal breast cancers are oftenconsidered as different disease entities, separate Cox modelswere fitted.28 As data on menopausal status at diagnosis werelacking, age at time of breast cancer diagnosis (�50 versus
Figure 1. Overview of EPIC-PANACEA (N 5 205,723). *For EPIC-PANACEA, 147,103 participants were excluded according to the PANACEA
exclusion criteria, i.e., missing dietary and non-dietary questionnaires, in the top or bottom 1% of the ratio of energy intake to energy
requirement (estimated from age, sex and body weight and height), pregnant women, missing weight at recruitment or extreme anthropo-
metric values, missing follow-up weight or participants with a weight change of �5 or >5 kg/year over several years. For the present study,
we further excluded male participants (N 5 91,390). Additionally, women without any follow-up information after the second weight assess-
ment, or women with (prevalent or incident) cancer other than non-melanoma skin cancer before the second weight assessment were
excluded (N 5 45,404). Furthermore, women with a breast cancer in situ diagnosis after the second weight assessment, or with missing
information on breast cancer occurrence or on breast cancer behavior were excluded (N 5 697). Participants of the centers Norway and
Umea (Sweden) were excluded (N 5 31,131). 205,723 study participants remained.
Epidemiology
4 Weight change in middle adulthood
Int. J. Cancer: 00, 00–00 (2014) VC 2014 UICC

Table 1. Characteristics of female EPIC-PANCEA participants according to annual weight change in quintiles (N 5 205,723)
Q1:loss
Q2 and Q3:reference
Q4:moderate gain
Q5:high gain
N 41,146 82,288 41,135 41,154
Annual weight change
Range (kg/year) 24.99;20.44
20.44;0.36
0.36; 0.83 0.83; 4.98
Range per 5 years (kg/5 year) 224.95;22.20
22.20;1.80
1.80; 4.15 4.15; 24.90
Mean (kg/year) (SD) 21.20 (0.8) 0.01 (0.2) 0.59 (0.1) 1.55 (0.7)
Characteristics at recruitment
Mean (SD)
Age (year) 52.7 (9.5) 52.4 (9.3) 51.6 (9.2) 50.5 (9.4)
Age at menarche (year)1 13.1 (1.6) 13.1 (1.5) 13.1 (1.5) 13.0 (1.5)
Age at first full termpregnancy (year)2
24.9 (4.3) 25.2 (4.2) 25.0 (4.2) 24.9 (4.3)
Weight (kg) 70.3 (12.7) 63.1 (10.3) 62.8 (10.2) 65.5 (11.2)
BMI (kg/m2) 27.0 (5.0) 24.2 (4.0) 24.1 (3.9) 24.8 (4.1)
Height (cm) 161.5 (6.8) 161.5 (6.5) 161.8 (6.4) 162.5 (6.5)
Alcohol use, median(IQR) (g/day)
3.6 (0.4–11.8) 5.1 (0.8–12.6) 4.9 (0.8–12.4) 4.2 (0.6–11.9)
Daily energy intake(kcal/day)
1,945 (534) 1,955 (529) 1,968 (534) 1,934 (556)
Weight at age 20 (kg)3 58.3 (8.6) 56.0 (7.4) 56.0 (7.6) 57.8 (8.5)
N (%)4
Smoking status
Never 59.1 61.1 61.4 57.2
Past 22.3 21.7 21.4 22.4
Current 17.3 15.4 15.1 17.6
Alcohol user
Yes 79.2 85.3 85.6 84.0
No 20.8 14.7 14.4 16.0
Physical activity
Inactive 27.3 21.6 20.6 21.7
Moderately inactive 34.9 36.6 36.8 35.7
Moderately active 21.7 24.9 26.3 25.5
Active 15.3 15.9 15.2 15.6
Education
None 11.0 4.9 4.2 4.6
Primary school 26.9 23.0 21.3 20.0
Technology school 20.9 18.5 17.2 18.0
Secondary school 17.4 24.1 27.3 27.5
Longer education 19.8 25.2 25.9 25.3
Parity
Nulliparous 13.9 14.0 13.8 14.9
Parous 83.7 83.7 83.9 81.6
Oral contraceptive use
Never 44.7 43.0 40.0 35.6
Epidemiology
Emaus et al. 5
Int. J. Cancer: 00, 00–00 (2014) VC 2014 UICC

>50 years) was used as a proxy (median age at menopausewithin this cohort was 50 years). For the analyses of womendiagnosed before or at the age of 50 years, we includedwomen who were pre- or perimenopausal at recruitment andwere aged below 50 years at second weight assessment. Entrytime was age at second weight assessment and exit time wastime of diagnosis of breast cancer as the first tumor, or turn-ing 50 years, death, emigration, loss to follow-up or end offollow-up, whichever came first. For the analyses of breastcancer diagnosed after age 50, we included women who werepostmenopausal at recruitment as well as women who werepre- or perimenopausal at recruitment and were older than50 years at the end of follow-up. Entry time was age at sec-ond weight assessment. For women who were pre- or peri-menopausal at recruitment and who were younger than 50
years at second weight assessment, 50 years was the entrytime. Exit time was time of diagnosis of breast cancer as thefirst tumor, death, emigration, loss to follow-up or end offollow-up, whichever came first.29
Tests for linear trend (Ptrend) were performed using themedians of the weight change distributions within the quin-tiles, modeled as a continuous variable.
We assessed whether timing of weight change (age at sec-ond weight assessment �50 years and >50 years), BMI (�25and >25 kg/m2) and HRT use at recruitment (never and ever)modified the associations between quintiles of annual weightchange and breast cancer risk (HRT analyses restricted to themodels for risk of breast cancer diagnosed after age 50). Wecompared the differences in the Akaike’s information criterionsof models with and without interaction terms to chi-square
Table 1. Characteristics of female EPIC-PANCEA participants according to annual weight change in quintiles (N 5 205,723) (Continued)
Q1:loss
Q2 and Q3:reference
Q4:moderate gain
Q5:high gain
Oral contraceptive use
Past 49.8 50.0 51.8 54.7
Current 3.5 4.4 5.0 5.6
Menopausal status
Pre 30.3 30.9 33.3 36.2
Peri 15.7 17.2 19.3 21.3
Post 54.1 52.0 47.4 42.5
HRT use
Never 67.9 68.3 68.6 69.8
Past 8.2 8.3 8.0 7.6
Current 16.2 17.5 17.3 16.5
Characteristics at second weight assessment
Mean (SD)
Age (year) 56.7 (9.9) 57.6 (9.5) 56.6 (9.3) 54.8 (9.3)
Weight (kg) 65.6 (11.8) 63.1 (10.3) 65.8 (10.4) 72.1 (12.3)
BMI (kg/m2) 25.2 (4.6) 24.2 (4.0) 25.2 (4.0) 27.3 (4.6)
Time between twoweight assessments,median (IQR), year
3.8 (3.0–5.2) 4.9 (3.7–5.7) 4.4 (3.7–5.5) 3.8 (3.3–5.1)
Time between second weightassessment and end follow-up,median (IQR), year
7.9 (6.1–9.2) 7.1 (4.8–8.2) 7.6 (5.4–8.2) 7.8 (6.1–8.2)
Incident breast cancer cases after second weight assessment
Total N 941 1,753 935 1,034
ER1PR1 (%) 36.1 36.6 39.9 39.1
ER1PR2 (%) 9.6 12.7 13.7 11.0
ER2PR1 (%) 1.7 1.4 2.0 0.7
ER2PR2 (%) 9.1 9.3 8.9 10.1
1Including only menstruating women.2Including only parous women.3Percentage missing: 62.1.4Numbers within each weight change category do not always add up to 100% due to missing values.
Epidemiology
6 Weight change in middle adulthood
Int. J. Cancer: 00, 00–00 (2014) VC 2014 UICC

Tab
le2
.H
aza
rdra
tio
sa
nd
95
%co
nfi
de
nce
inte
rva
lsfo
rb
rea
stca
nce
rin
rela
tio
nto
an
nu
al
we
igh
tch
an
ge
(in
qu
inti
les)
1
Q1
Loss
[24
.99
;20
.44
kg
/ye
ar]
,H
R(9
5%
CI)
Q2
&Q
3R
efe
r-e
nce
[20
.44
;0.3
6k
g/y
ea
r],
HR
(95
%C
I)
Q4
Mo
de
rate
ga
in[0
.36
;0.8
3k
g/
yea
r],
HR
(95
%C
I)
Q5
Hig
hg
ain
[0.8
3;4
.98
kg
/ye
ar]
,H
R(9
5%
CI)
ptr
en
d
Tota
lst
ud
yp
op
ula
tio
nN
(pe
rso
n-y
ea
rs)
41
,14
6(2
99
,53
5)
82
,28
8(5
28
,68
8)
41
,13
5(2
75
,47
1)
41
,15
4(2
92
,84
0)
Ca
ses
(ha
zard
rate
,p
er
10
00
py)
94
1(3
.1)
1,7
53
(3.3
)9
35
(3.4
)1
,03
4(3
.5)
Me
dia
na
nn
ua
lw
eig
ht
cha
ng
e(I
QR
)2
0.9
3(2
1.4
8;
20
.63
)0
.00
(20
.16
;0
.20
)0
.56
(0.4
8;
0.7
0)
1.3
3(1
.06
;1
.83
)
Mo
de
l1
21
.05
(0.9
7–
1.1
4)
1.0
01
.02
(0.9
4–
1.1
0)
1.1
0(1
.02
–1
.19
)0
.23
Mo
de
l2
31
.03
(0.9
5–
1.1
2)
1.0
01
.02
(0.9
4–
1.1
0)
1.0
9(1
.01
–1
.18
)0
.15
Me
no
pa
usa
lst
atu
sa
tfi
rst
we
igh
ta
sse
ssm
en
t
Ag
ea
tse
con
dw
eig
ht
ass
ess
me
nt
Ag
ea
tb
rea
stca
nce
rd
iag
no
sis
Pre
�5
0ye
ars
�5
0ye
ars
N(p
ers
on
-ye
ars
)9
,05
0(4
5,2
43
)1
5,9
29
(64
,19
7)
8,7
06
(33
,23
1)
10
,29
4(4
3,4
71
)
Ca
ses
(ha
zard
rate
,p
er
10
00
py)
58
(1.3
)1
00
(1.6
)4
3(1
.3)
82
(1.9
)
Me
dia
na
nn
ua
lw
eig
ht
cha
ng
e(I
QR
)2
1.0
0(2
1.6
4;
20
.66
)0
.00
(20
.16
;0
.22
)0
.56
(0.4
9;
0.7
2)
1.3
5(1
.07
;1
.89
)
Mo
de
l1
20
.84
(0.6
0–
1.1
7)
1.0
00
.83
(0.5
8–
1.2
0)
1.2
9(0
.96
–1
.73
)0
.02
Mo
de
l2
40
.87
(0.6
1–
1.2
3)
1.0
00
.85
(0.5
9–
1.2
2)
1.3
7(1
.02
–1
.85
)0
.02
Pre
�5
0ye
ars
>5
0ye
ars
N(p
ers
on
-ye
ars
)5
,94
2(2
7,2
81
)1
0,0
33
(47
,46
4)
5,5
22
(26
,54
1)
6,1
73
(26
,59
9)
Ca
ses
(ha
zard
rate
,p
er
10
00
py)
83
(3.0
)1
28
(2.7
)8
1(3
.1)
10
1(3
.8)
Me
dia
na
nn
ua
lw
eig
ht
cha
ng
e(I
QR
)2
1.0
0(2
1.6
4;
20
.66
)0
.00
(20
.16
;0
.22
)0
.56
(0.4
9;
0.7
2)
1.3
5(1
.07
;1
.89
)
Mo
de
l1
21
.30
(0.9
8–
1.7
4)
1.0
01
.09
(0.8
2–
1.4
4)
1.2
6(0
.97
–1
.63
)0
.89
Mo
de
l2
41
.30
(0.9
7–
1.7
6)
1.0
01
.09
(0.8
3–
1.4
4)
1.2
7(0
.97
–1
.65
)0
.85
Pre
>5
0ye
ars
>5
0ye
ars
N(p
ers
on
-ye
ars
)3
,40
4(2
3,7
26
)9
,47
1(4
8,7
52
)4
,99
0(2
7,1
68
)4
,59
3(2
9,4
33
)
Ca
ses
(ha
zard
rate
,p
er
10
00
py)
64
(2.7
)1
46
(3.0
)8
9(3
.3)
95
(3.2
)
Me
dia
na
nn
ua
lw
eig
ht
cha
ng
e(I
QR
)2
0.8
7(2
1.4
4;
20
.61
)0
.00
(20
.13
;0
.21
)0
.55
(0.4
7;
0.6
9)
1.2
9(1
.05
;1
.75
)
Mo
de
l1
21
.03
(0.7
6–
1.4
0)
1.0
01
.05
(0.8
1–
1.3
7)
1.0
8(0
.83
–1
.41
)0
.68
Mo
de
l2
41
.02
(0.7
5–
1.4
0)
1.0
01
.05
(0.8
1–
1.3
8)
1.0
8(0
.82
–1
.42
)0
.65
Epidemiology
Emaus et al. 7
Int. J. Cancer: 00, 00–00 (2014) VC 2014 UICC

statistics with the degrees of freedom equal to the difference inthe number of degrees of freedom between the two models.
Heterogeneity of the association according to hormonereceptor status was assessed using a data-augmentationmethod described by Lunn and McNeil.30 We used a log likeli-hood ratio test to compare the model with and without inter-action terms between the annual weight change variable andbreast cancer subtype (estrogen receptor (ER)1versusER2; pro-gesterone receptor (PR)1versusPR2; ER1PR1versusER2PR2).Women who developed the competing breast cancer subtypewere censored at the time of occurrence.
To reduce the chance of reverse causation by preclinicaldisease, the analyses were repeated excluding the first twoyears of follow-up. Analyses were also repeated excludingwomen with a chronic disease at recruitment (myocardialinfarction, diabetes or stroke; N 5 5,755).
The EPIC-PANACEA population is a selection of EPICparticipants surviving the second weight measurement, onaverage 5 years from recruitment. To see whether thisaffected the results of our study, we reanalyzed the relation-ship between BMI at recruitment and breast cancer risk, andcompared the results to findings from the total EPIC cohort,published previously.31
Two-tailed p values <0.05 were considered as statisticallysignificant. The statistical analyses were performed usingRStudio version 0.97.173 and SAS version 9.2.
ResultsIn total, 205,723 women were included in the study: 32.3%premenopausal, 18.1% perimenopausal/unknown and 49.6%postmenopausal at recruitment. The mean age was 51.9 years(SD: 9.4 years) at recruitment. The mean annual weightchange was 0.19 kg/year (SD: 1.03 kg/year) and the mediantime period between first and second weight assessment was4.3 years (IQR: 3.525.4 years). During a median follow-up of7.5 years (IQR: 5.628.2 years) after the second weight assess-ment, 4,663 primary invasive breast cancer cases occurred ofwhich 302 cases were diagnosed before the age of 50 years.In total, 1,396,538 person-years were observed.
Table 1 shows the characteristics at recruitment stratifiedby the annual weight change quintiles. In our study popula-tion, BMI at recruitment was not statistically significantlyassociated with breast cancer diagnosed before or at age 50(HR: 0.87, 95% CI: 0.56–1.34; Supporting Information Table1). A significant positive association with breast cancer diag-nosed after 50 was observed (HR: 1.24, 95% CI: 1.07–1.43)among never HRT users. These estimates are in line withthose previously reported for total EPIC cohort.31
Table 2 shows that high weight gain was related to a slightly,but significantly higher breast cancer risk (HRQ5_versus_Q2/3: 1.09,95% CI: 1.0121.18). Weight loss was not associated with breastcancer risk (HRQ1_versus_Q2/3: 1.03, 95% CI: 0.9521.12). Stratifiedanalysis showed that the relation between high weight gain andbreast cancer was more pronounced for breast cancer diagnosedbefore or at age 50 (HRQ5_versus_Q2/3: 1.37, 95% CI: 1.0221.85).Ta
ble
2.
Ha
zard
rati
os
an
d9
5%
con
fid
en
cein
terv
als
for
bre
ast
can
cer
inre
lati
on
toa
nn
ua
lw
eig
ht
cha
ng
e(i
nq
uin
tile
s)(C
on
tin
ue
d)
Q1
Loss
[24
.99
;20
.44
kg
/ye
ar]
,H
R(9
5%
CI)
Q2
&Q
3R
efe
r-e
nce
[20
.44
;0.3
6k
g/y
ea
r],
HR
(95
%C
I)
Q4
Mo
de
rate
ga
in[0
.36
;0.8
3k
g/
yea
r],
HR
(95
%C
I)
Q5
Hig
hg
ain
[0.8
3;4
.98
kg
/ye
ar]
,H
R(9
5%
CI)
ptr
en
d
Po
stP
ost
Po
stN
(pe
rso
n-y
ea
rs)
22
,25
0(1
55
,36
7)
42
,76
9(2
72
,18
1)
19
,49
2(1
32
,28
4)
17
,49
5(1
25
,65
5)
Ca
ses
(ha
zard
rate
,p
er
10
00
py)
56
1(3
.6)
1,0
19
(3.7
)5
02
(3.8
)5
10
(4.1
)
Me
dia
na
nn
ua
lw
eig
ht
cha
ng
e(I
QR
)2
0.9
1(2
1.4
2;
20
.63
)0
.00
(20
.18
;0
.19
)0
.56
(0.4
7;
0.7
0)
1.3
1(1
.06
;1
.77
)
Mo
de
l1
21
.05
(0.9
4–
1.1
7)
1.0
01
.01
(0.9
1–
1.1
3)
1.0
9(0
.98
–1
.22
)0
.53
Mo
de
l2
41
.01
(0.9
1–
1.1
3)
1.0
01
.01
(0.9
0–
1.1
2)
1.0
7(0
.96
–1
.20
)0
.36
1W
om
en
wh
ow
ere
pe
rim
en
op
au
sal
at
recr
uit
me
nt
we
ree
xclu
de
din
this
an
aly
sis.
2S
tra
tifi
ed
by
cen
ter
an
da
ge
at
seco
nd
we
igh
ta
sse
ssm
en
t.3S
tra
tifi
ed
by
cen
ter
an
da
ge
at
seco
nd
we
igh
ta
sse
ssm
en
t,a
dju
ste
dfo
rB
MI
at
recr
uit
me
nt
(co
nt)
,sm
ok
ing
sta
tus
an
din
ten
sity
(ca
t),
alc
oh
ol
use
r(y
es/
no
),a
lco
ho
lco
nsu
mp
tio
n(c
on
t),
ed
uca
tio
n(c
at)
,p
hys
ica
la
ctiv
ity
(ca
t),
ag
ea
tm
en
arc
he
(ca
t),
ag
ea
tfi
rst
full
-te
rmp
reg
na
ncy
(ca
t),
use
of
ora
lco
ntr
ace
pti
ves
(ca
t),
me
no
pa
usa
lst
atu
s(c
at)
,H
RT
use
(ca
t),
en
erg
yin
tak
e(c
on
t)a
nd
tim
eb
etw
ee
ntw
ow
eig
ht
ass
ess
me
nts
(co
nt)
.4A
sm
od
el3
bu
tw
ith
ou
ta
dju
stm
en
tfo
rm
en
op
au
sal
sta
tus.
Epidemiology
8 Weight change in middle adulthood
Int. J. Cancer: 00, 00–00 (2014) VC 2014 UICC

No evidence was found for an association between high post-menopausal weight gain and postmenopausal breast cancer risk(HRQ5_versus_Q2/3: 1.07, 95% CI: 0.9621.20). Timing of weightchange (i.e., before or at age 50 versus after age 50) did notmodify the association (Pinteraction 5 0.17).
Since routine recording of hormone receptor status wasimplemented several years after the start of the EPIC study, thisinformation was mainly available for breast cancers thatoccurred later in the follow-up, consequently mostly postmeno-
pausal breast cancers. Hence, the analysis by hormone receptorstatus was only performed for breast cancer diagnosed after 50years (Table 3). The results suggest no differential effects on hor-mone receptor defined breast cancer risk (Pheterogeneity: ER1versus
ER2 5 0.85; Pheterogeneity: PR1versus PR2 5 0.87; Pheterogeneity:ER1PR1versus ER2PR2 5 0.75).
HRT use at recruitment did not modify the associationbetween weight change and breast cancer diagnosed after age50 (Pinteraction 5 0.21, Table 4). The association between high
Table 3. Hazard ratios and 95% confidence intervals for breast cancer diagnosed after age 50 in relation to annual weight change (in quin-tiles), stratified by hormone receptor status1
Study population
Q1 loss[24.99;20.44 kg/year],HR (95% CI)
Q2 and Q3 reference[20.44;0.36 kg/year],HR (95% CI)
Q4 moderate gain[0.36;0.83 kg/year],HR (95% CI)
Q5 high gain[0.83;4.98 kg/year],HR (95% CI) p trend
N (person-years) 38,003 (252,426) 76,347 (462,550) 37,932 (241,226) 37,007 (247,825)
Median annual weightchange (IQR)
20.92 (21.47; 20.63) 0.00 (20.16; 0.20) 0.56 (0.48; 0.71) 1.33 (1.06; 1.82)
ER1
Cases (hazard rate,per 1000 py)
502 (2.0) 982 (2.1) 553 (2.3) 587 (2.4)
Model 12 1.06 (0.95–1.18) 1.00 1.05 (0.95–1.17) 1.08 (0.98–1.20) 0.50
Model 23 1.05 (0.93–1.17) 1.00 1.06 (0.95–1.18) 1.08 (0.97–1.20) 0.41
ER2
Cases (hazard rate,per 1000 py)
102 (0.4) 192 (0.4) 109 (0.5) 112 (0.5)
Model 12 1.09 (0.85–1.40) 1.00 1.05 (0.83–1.33) 1.04 (0.82–1.32) 0.88
Model 23 1.12 (0.87–1.45) 1.00 1.06 (0.83–1.34) 1.06 (0.84–1.35) 0.85
PR1
Cases (hazard rate,per 1000 py)
327 (1.3) 632 (1.4) 376 (1.6) 385 (1.6)
Model 12 1.07 (0.93–1.23) 1.00 1.09 (0.96–1.24) 1.08 (0.95–1.23) 0.54
Model 23 1.04 (0.90–1.19) 1.00 1.09 (0.96–1.24) 1.07 (0.94–1.22) 0.46
PR2
Cases (hazard rate,per 1000 py)
168 (0.7) 363 (0.8) 206 (0.9) 206 (0.8)
Model 12 1.00 (0.83–1.21) 1.00 1.05 (0.88–1.24) 1.03 (0.86–1.22) 0.72
Model 23 1.04 (0.86–1.26) 1.00 1.06 (0.89–1.26) 1.06 (0.89–1.27) 0.68
ER1PR1
Cases (hazard rate,per 1000 py)
314 (1.2) 611 (1.3) 357 (1.5) 377 (1.5)
Model 12 1.05 (0.91–1.21) 1.00 1.07 (0.94–1.23) 1.10 (0.97–1.26) 0.34
Model 23 1.02 (0.88–1.18) 1.00 1.07 (0.94–1.22) 1.08 (0.95–1.24) 0.28
ER2PR2
Cases (hazard rate,per 1000 py)
82 (0.3) 150 (0.3) 78 (0.3) 94 (0.4)
Model 12 1.11 (0.84–1.46) 1.00 0.97 (0.74–1.28) 1.15 (0.89–1.50) 0.77
Model 23 1.13 (0.85–1.51) 1.00 0.97 (0.74–1.28) 1.17 (0.90–1.53) 0.80
1Only breast cancer cases of which information on hormone receptor status was available were included (percentage missing is 39.1%).2Stratified by center and age at second weight assessment.3Stratified by center and age at second weight assessment, adjusted for BMI at recruitment (cont), smoking status and intensity (cat), alcohol user(yes/no), alcohol consumption (cont), education (cat), physical activity (cat), age at menarche (cat), age at first full term pregnancy (cat), use of oralcontraceptives (cat), HRT use (cat), energy intake (cont) and time between two weight assessments (cont).
Epidemiology
Emaus et al. 9
Int. J. Cancer: 00, 00–00 (2014) VC 2014 UICC
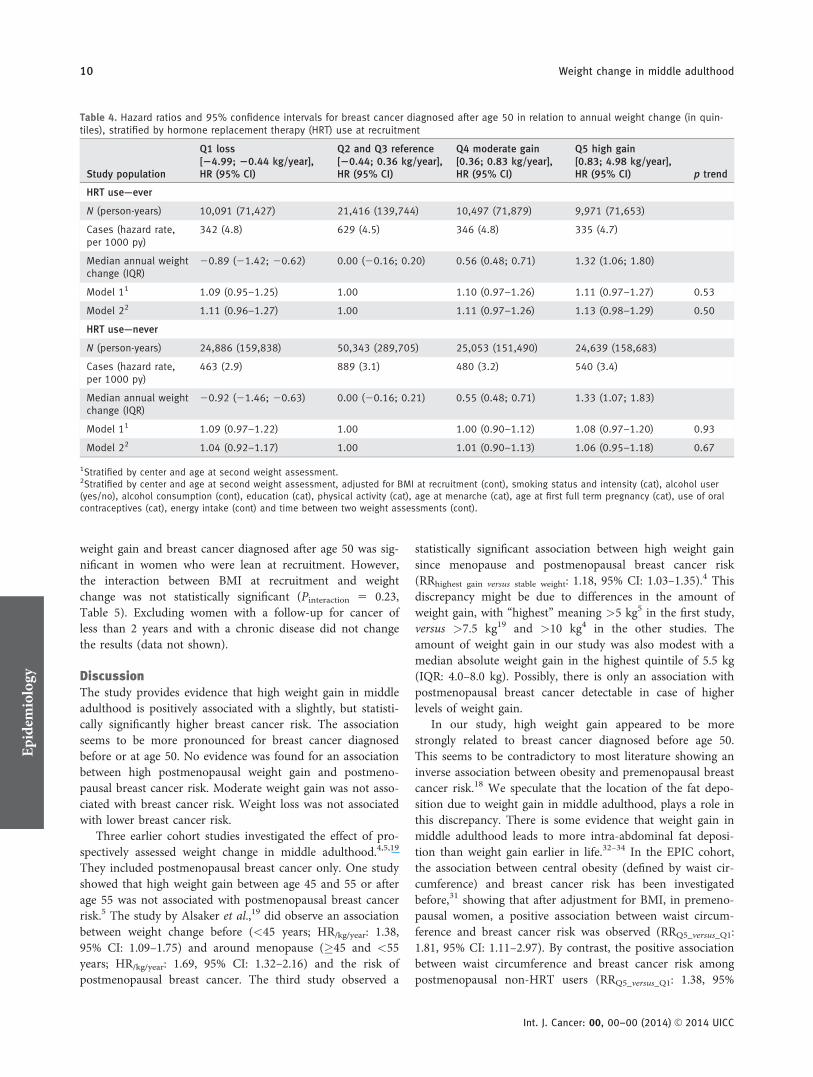
weight gain and breast cancer diagnosed after age 50 was sig-nificant in women who were lean at recruitment. However,the interaction between BMI at recruitment and weightchange was not statistically significant (Pinteraction 5 0.23,Table 5). Excluding women with a follow-up for cancer ofless than 2 years and with a chronic disease did not changethe results (data not shown).
DiscussionThe study provides evidence that high weight gain in middleadulthood is positively associated with a slightly, but statisti-cally significantly higher breast cancer risk. The associationseems to be more pronounced for breast cancer diagnosedbefore or at age 50. No evidence was found for an associationbetween high postmenopausal weight gain and postmeno-pausal breast cancer risk. Moderate weight gain was not asso-ciated with breast cancer risk. Weight loss was not associatedwith lower breast cancer risk.
Three earlier cohort studies investigated the effect of pro-spectively assessed weight change in middle adulthood.4,5,19
They included postmenopausal breast cancer only. One studyshowed that high weight gain between age 45 and 55 or afterage 55 was not associated with postmenopausal breast cancerrisk.5 The study by Alsaker et al.,19 did observe an associationbetween weight change before (<45 years; HR/kg/year: 1.38,95% CI: 1.09–1.75) and around menopause (�45 and <55years; HR/kg/year: 1.69, 95% CI: 1.32–2.16) and the risk ofpostmenopausal breast cancer. The third study observed a
statistically significant association between high weight gainsince menopause and postmenopausal breast cancer risk(RRhighest gain versus stable weight: 1.18, 95% CI: 1.03–1.35).4 Thisdiscrepancy might be due to differences in the amount ofweight gain, with “highest” meaning >5 kg5 in the first study,versus >7.5 kg19 and >10 kg4 in the other studies. Theamount of weight gain in our study was also modest with amedian absolute weight gain in the highest quintile of 5.5 kg(IQR: 4.0–8.0 kg). Possibly, there is only an association withpostmenopausal breast cancer detectable in case of higherlevels of weight gain.
In our study, high weight gain appeared to be morestrongly related to breast cancer diagnosed before age 50.This seems to be contradictory to most literature showing aninverse association between obesity and premenopausal breastcancer risk.18 We speculate that the location of the fat depo-sition due to weight gain in middle adulthood, plays a role inthis discrepancy. There is some evidence that weight gain inmiddle adulthood leads to more intra-abdominal fat deposi-tion than weight gain earlier in life.32–34 In the EPIC cohort,the association between central obesity (defined by waist cir-cumference) and breast cancer risk has been investigatedbefore,31 showing that after adjustment for BMI, in premeno-pausal women, a positive association between waist circum-ference and breast cancer risk was observed (RRQ5_versus_Q1:1.81, 95% CI: 1.11–2.97). By contrast, the positive associationbetween waist circumference and breast cancer risk amongpostmenopausal non-HRT users (RRQ5_versus_Q1: 1.38, 95%
Table 4. Hazard ratios and 95% confidence intervals for breast cancer diagnosed after age 50 in relation to annual weight change (in quin-tiles), stratified by hormone replacement therapy (HRT) use at recruitment
Study population
Q1 loss[24.99; 20.44 kg/year],HR (95% CI)
Q2 and Q3 reference[20.44; 0.36 kg/year],HR (95% CI)
Q4 moderate gain[0.36; 0.83 kg/year],HR (95% CI)
Q5 high gain[0.83; 4.98 kg/year],HR (95% CI) p trend
HRT use—ever
N (person-years) 10,091 (71,427) 21,416 (139,744) 10,497 (71,879) 9,971 (71,653)
Cases (hazard rate,per 1000 py)
342 (4.8) 629 (4.5) 346 (4.8) 335 (4.7)
Median annual weightchange (IQR)
20.89 (21.42; 20.62) 0.00 (20.16; 0.20) 0.56 (0.48; 0.71) 1.32 (1.06; 1.80)
Model 11 1.09 (0.95–1.25) 1.00 1.10 (0.97–1.26) 1.11 (0.97–1.27) 0.53
Model 22 1.11 (0.96–1.27) 1.00 1.11 (0.97–1.26) 1.13 (0.98–1.29) 0.50
HRT use—never
N (person-years) 24,886 (159,838) 50,343 (289,705) 25,053 (151,490) 24,639 (158,683)
Cases (hazard rate,per 1000 py)
463 (2.9) 889 (3.1) 480 (3.2) 540 (3.4)
Median annual weightchange (IQR)
20.92 (21.46; 20.63) 0.00 (20.16; 0.21) 0.55 (0.48; 0.71) 1.33 (1.07; 1.83)
Model 11 1.09 (0.97–1.22) 1.00 1.00 (0.90–1.12) 1.08 (0.97–1.20) 0.93
Model 22 1.04 (0.92–1.17) 1.00 1.01 (0.90–1.13) 1.06 (0.95–1.18) 0.67
1Stratified by center and age at second weight assessment.2Stratified by center and age at second weight assessment, adjusted for BMI at recruitment (cont), smoking status and intensity (cat), alcohol user(yes/no), alcohol consumption (cont), education (cat), physical activity (cat), age at menarche (cat), age at first full term pregnancy (cat), use of oralcontraceptives (cat), energy intake (cont) and time between two weight assessments (cont).
Epidemiology
10 Weight change in middle adulthood
Int. J. Cancer: 00, 00–00 (2014) VC 2014 UICC

CI: 1.09–1.74) diminished after adjustment for BMI(RRQ5_versus_Q1: 1.21, 95% CI: 0.87–1.67). These findings sug-gest that central obesity, independent of overall adiposity, ispositively associated with premenopausal breast cancer risk,but not with postmenopausal breast cancer risk. The sameconclusion was drawn in a systematic literature review per-formed by the World Cancer Research Fund.18 There is evi-dence for these findings on a hormonal level as well.Previous studies showed an association between central obe-
sity and insulin resistance.35 Higher premenopausal breastcancer risk was reported for women with insulin resistance36
or high circulatory levels of insulin-like growth factor 1.35 Ifwe assume no association between central obesity and post-menopausal breast cancer risk and that postmenopausalweight gain is merely a gain in intra-abdominal obesity (i.e.,central obesity), this could explain our null results for weightgain and breast cancer diagnosed after age 50. Possibly, incase of very high weight gain in middle adulthood, fat is not
Table 5. Hazard ratios and 95% confidence intervals for breast cancer (diagnosed �50 versus >50 years) in relation to annual weight change(in quintiles), stratified by BMI at recruitment
Study population
Q1 loss[24.99; 20.44 kg/year],HR (95% CI)
Q2 and Q3 reference[20.44; 0.36 kg/year],HR (95% CI)
Q4 moderate gain[0.36; 0.83 kg/year],HR (95% CI)
Q5 high gain[0.83; 4.98 kg/year],HR (95% CI) p Trend
Breast cancer diagnosed �50 years
BMI �25 kg/m2
N (person-years) 4,959 (23,886) 13,384 (50,778) 7,476 (26,889) 7,688 (30,338)
Cases (hazard rate,per 1000 py)
37 (1.5) 88 (1.7) 35 (1.3) 58 (1.9)
Median annual weightchange (IQR)
20.82 (21.31; 20.59) 0.00 (20.13; 0.23) 0.56 (0.50; 0.72) 1.33 (1.07; 1.83)
Model 11 0.88 (0.59–1.32) 1.00 0.74 (0.50–1.10) 1.17 (0.83–1.63) 0.32
Model 22 0.90 (0.60–1.35) 1.00 0.74 (0.50–1.10) 1.23 (0.87–1.72) 0.25
BMI >25 kg/m2
N (person-years) 4,871 (23,214) 3,693 (15,329) 1,903 (7,338) 3,558 (14,647)
Cases (hazard rate,per 1000 py)
24 (1.0) 19 (1.2) 12 (1.6) 25 (1.7)
Median annual weightchange (IQR)
21.24 (22.02; 20.78) 0.00 (20.21; 0.17) 0.58 (0.49; 0.71) 1.51 (1.14; 2.14)
Model 11 0.85 (0.46–1.57) 1.00 1.16 (0.56–2.43) 1.36 (0.74–2.52) 0.11
Model 22 0.84 (0.45–1.57) 1.00 1.20 (0.57–2.53) 1.42 (0.76–2.65) 0.08
Breast cancer diagnosed >50 years
BMI �25 kg/m2
N (person-years) 14,734 (96,492) 49,174 (303,477) 25,198 (163,958) 21,416 (144,092)
Cases (hazard rate,per 1000 py)
382 (4.0) 1,123 (3.7) 623 (3.8) 586 (4.1)
Median annual weightchange (IQR)
20.79 (21.17; 20.56) 0.00 (20.12; 0.22) 0.55 (0.49; 0.71) 1.30 (1.06; 1.73)
Model 11 1.08 (0.96–1.21) 1.00 1.03 (0.94–1.14) 1.13 (1.02–1.25) 0.21
Model 22 1.06 (0.94–1.19) 1.00 1.03 (0.93–1.14) 1.12 (1.01–1.24) 0.18
BMI >25 kg/m2
N (person-years) 23,255 (155,009) 27,148 (158,115) 12,719 (76,763) 15,580 (103,009)
Cases (hazard rate,per 1000 py)
496 (3.2) 521 (3.3) 265 (3.5) 365 (3.5)
Median annual weightchange (IQR)
21.06 (21.68; 20.69) 0.00 (20.21; 0.17) 0.56 (0.47; 0.70) 1.36 (1.07; 1.89)
Model 11 1.04 (0.92–1.19) 1.00 1.02 (0.88–1.18) 1.05 (0.91–1.20) 0.98
Model 22 1.02 (0.90–1.16) 1.00 1.02 (0.88–1.18) 1.03 (0.90–1.19) 0.88
1Stratified by center and age at second weight assessment.2Stratified by center and age at second weight assessment, adjusted for BMI at recruitment (cont), smoking status and intensity (cat), alcohol user(yes/no), alcohol consumption (cont), education (cat), physical activity (cat), age at menarche (cat), age at first full term pregnancy (cat), use of oralcontraceptives (cat), HRT use (cat), energy intake (cont) and time between two weight assessments (cont).
Epidemiology
Emaus et al. 11
Int. J. Cancer: 00, 00–00 (2014) VC 2014 UICC

only deposited in central regions of the body, but in periph-eral regions as well and thus increasing postmenopausalbreast cancer risk.35 Unfortunately, we could not provideadditional evidence on this hypothesis, because data on waistcircumference at second assessment is missing in most EPICcenters.
Our study could not provide evidence for differential effectsof weight change on breast cancer subtypes specified by hor-mone receptor status. We could only study this for breast can-cer cases diagnosed after age 50 and not in breast cancer casesdiagnosed before age 50, where we found strongest evidencefor an effect of weight gain. In contrast to our results, Eliassenet al.,4 did observe a stronger association between high weightgain since menopause and postmenopausal ER1PR1 breastcancer (Pheterogeneity: ER1PR1_versus_ER2PR2 5 0.02), but inthat study the level of weight gain was considerably higher(i.e., weight gain >10 kg).
Our study and most of the studies on weight change inmiddle adulthood found no significant association betweenweight loss and breast cancer risk.4,8,16,17,20 From this, how-ever, we cannot conclude, that weight loss in middle adulthooddoes not decrease breast cancer risk. Losing weight, particu-larly in elderly, might represent loss of lean mass. Besides that,weight loss could also be caused by underlying medical condi-tions. This heterogeneity in causes of weight loss could haveblurred the true association. Several intervention trials showedthat intentional weight loss significantly decreases endogenoussex hormone levels as well as insulin levels, known as breastcancer risk factors, whereas it increases sex hormone-bindingglobulin levels.37–39 To investigate to what extent reverse cau-sation might have affected our results, we repeated our analy-ses restricted to women with a follow-up of at least 2 years.
Our results remained unchanged, also after excluding womenwith a chronic disease at recruitment.
A limitation of the present study was that the secondweight assessment was mainly self-reported, which couldhave caused misclassification of the weight change. Since aprospective cohort design was used, we assume the misclassi-fication to be non-differential, i.e., not related to breast can-cer occurrence. It may be expected that especially overweightwomen underreport their weight leading to an underestima-tion of their weight gain and an overestimation of theirweight loss.40,41 This may have led to an underestimation ofthe association between the highest weight gain category andbreast cancer risk, and also the relation between weight lossand breast cancer risk. Furthermore, data on menopausal sta-tus were only available at recruitment and not at time ofdiagnosis. Using age as proxy for menopausal status at diag-nosis might have caused misclassification. Information onconfounding factors was only available at recruitment, andwe cannot exclude that changes in for example, alcohol con-sumption or physical activity, may partly explain the resultsobserved. HRT use at recruitment was dichotomized in theeffect modification analysis (ever versus never). As a conse-quence, a potential differential effect of current HRT use onthe association between weight change and breast cancer riskmight have been obscured. Strengths of our study are its pro-spective study design, large sample size and availability ofextensive information about many possible confoundingfactors.
In conclusion, high weight gain in middle adulthoodincreases the risk of breast cancer. The association seems tobe more pronounced for breast cancer diagnosed before or atage 50. Our results illustrate the importance of avoidingweight gain in middle adulthood.
References
1. Huang Z, Hankinson SE, Colditz GA, et al. Dualeffects of weight and weight gain on breast cancerrisk. JAMA 1997;278:1407–11.
2. Barnes-Josiah D, Potter JD, Sellers TA, et al.Early body size and subsequent weight gain aspredictors of breast cancer incidence (Iowa,United States). Cancer Causes Control 1995;6:112–8.
3. Harvie M, Howell A, Vierkant RA, et al. Associa-tion of gain and loss of weight before and aftermenopause with risk of postmenopausal breastcancer in the Iowa women’s health study. CancerEpidemiol Biomarkers Prev 2005;14:656–61.
4. Eliassen AH, Colditz GA, Rosner B, et al. Adultweight change and risk of postmenopausal breastcancer. JAMA 2006;296:193–201.
5. Radimer KL, Ballard-Barbash R, Miller JS, et al.Weight change and the risk of late-onset breastcancer in the original Framingham cohort. NutrCancer 2004;49:7–13.
6. Lahmann PH, Schulz M, Hoffmann K, et al.Long-term weight change and breast cancer risk:the European prospective investigation into can-cer and nutrition (EPIC). Br J Cancer 2005;93:582–9.
7. Feigelson HS, Jonas CR, Teras LR, et al. Weightgain, body mass index, hormone replacementtherapy, and postmenopausal breast cancer in alarge prospective study. Cancer Epidemiol Bio-markers Prev 2004;13:220–4.
8. Ahn J, Schatzkin A, Lacey JV Jr, et al. Adiposity,adult weight change, and postmenopausal breastcancer risk. Arch Intern Med 2007;167:2091–102.
9. Morimoto LM, White E, Chen Z, et al. Obesity,body size, and risk of postmenopausal breast can-cer: the Women’s Health Initiative (UnitedStates). Cancer Causes Control 2002;13:741–51.
10. Tehard B, Lahmann PH, Riboli E, et al. Anthrop-ometry, breast cancer and menopausal status: useof repeated measurements over 10 years offollow-up-results of the French E3N women’scohort study. Int J Cancer 2004;111:264–9.
11. Krishnan K, Bassett JK, MacInnis RJ, et al. Asso-ciations between weight in early adulthood,change in weight, and breast cancer risk in post-menopausal women. Cancer Epidemiol Bio-markers Prev 2013;22:1409–16.
12. Brinton LA, Swanson CA. Height and weight atvarious ages and risk of breast cancer. Ann Epide-miol 1992;2:597–609.
13. Friedenreich CM, Courneya KS, Bryant HE.Case–control study of anthropometric measuresand breast cancer risk. Int J Cancer 2002;99:445–52.
14. Magnusson C, Baron J, Persson I, et al. Body sizein different periods of life and breast cancer riskin post-menopausal women. Int J Cancer 1998;76:29–34.
15. Wenten M, Gilliland FD, Baumgartner K, et al.Associations of weight, weight change, and bodymass with breast cancer risk in Hispanic andnon-Hispanic white women. Ann Epidemiol 2002;12:435–4.
16. Eng SM, Gammon MD, Terry MB, et al. Bodysize changes in relation to postmenopausal breastcancer among women on Long Island, New York.Am J Epidemiol 2005;162:229–37.
17. Trentham-Dietz A, Newcomb PA, Egan KM,et al. Weight change and risk of postmenopausalbreast cancer (United States). Cancer Causes Con-trol 2000;11:533–42.
18. Imperial College London. WCRF/AICRSystematic Literature Review Continuous UpdateReport The Associations between Food, Nutrition
Epidemiology
12 Weight change in middle adulthood
Int. J. Cancer: 00, 00–00 (2014) VC 2014 UICC

and Physical Activity and the Risk of BreastCancer London, 2008.
19. Alsaker MD, Janszky I, Opdahl S, et al. Weightchange in adulthood and risk of postmenopausalbreast cancer: the HUNT study of Norway. Br JCancer 2013;109:1310–7.
20. Ziegler RG, Hoover RN, Nomura AM, et al. Rela-tive weight, weight change, height, and breastcancer risk in Asian-American women. J NatlCancer Inst 1996;88:650–60.
21. May AM, Adema LE, Romaguera D, et al. Deter-minants of non-response to a second assessmentof lifestyle factors and body weight in the EPIC-PANACEA study. BMC Med Res Methodol 2012;12:148.
22. Besson H, Ekelund U, Luan J, et al. A cross-sectional analysis of physical activity and obesityindicators in European participants of the EPIC-PANACEA study. Int J Obes 2009;33:497–506.
23. Riboli E, Hunt KJ, Slimani N, et al. EuropeanProspective Investigation into Cancer and Nutri-tion (EPIC): study populations and data collec-tion. Public Health Nutr 2002;5:1113–24.
24. Haftenberger M, Lahmann PH, Panico S, et al.Overweight, obesity and fat distribution in 50- to64-year-old participants in the European Prospec-tive Investigation into Cancer and Nutrition(EPIC). Public Health Nutr 2002;5:1147–62.
25. Grambsch PM, Therneau TM. Proportional haz-ards tests and diagnostics based on weightedresiduals. Biometrika 1994;81:515–26.
26. Wareham NJ, Jakes RW, Rennie KL, et al. Valid-ity and repeatability of a simple index derived
from the short physical activity questionnaireused in the European Prospective Investigationinto Cancer and Nutrition (EPIC) study. PublicHealth Nutr 2003;6:407–13.
27. Rubin DB. Multiple Imputation for Nonresponsein Surveys. New York: J. Wiley & Sons, 1987.
28. Buckland G, Travier N, Cottet V, et al. Adher-ence to the mediterranean diet and risk of breastcancer in the European prospective investigationinto cancer and nutrition cohort study. Int J Can-cer 2013;132:2918–27.
29. Buckland G, Travier N, Cottet V, et al. Adher-ence to the Mediterranean diet and risk of breastcancer in the European prospective investigationinto cancer and nutrition cohort study. Int J Can-cer 2013;132:2918–27.
30. Lunn M, McNeil D. Applying Cox regression tocompeting risks. Biometrics 1995;51:524–32.
31. Lahmann PH, Hoffmann K, Allen N, et al. Bodysize and breast cancer risk: findings from the Euro-pean Prospective Investigation into Cancer AndNutrition (EPIC). Int J Cancer 2004;111:762–71.
32. Douchi T, Yamamoto S, Yoshimitsu N, et al. Rel-ative contribution of aging and menopause tochanges in lean and fat mass in segmentalregions. Maturitas 2002;42:301–6.
33. Seidell JC, Oosterlee A, Deurenberg P, et al.Abdominal fat depots measured with computedtomography: effects of degree of obesity, sex, andage. Eur J Clin Nutr 1988;42:805–15.
34. Lemieux S, Prud’homme D, Bouchard C, et al. Asingle threshold value of waist girth identifiesnormal-weight and overweight subjects with
excess visceral adipose tissue. Am J Clin Nutr1996;64:685–93.
35. Harvie M, Hooper L, Howell AH. Central obesityand breast cancer risk: a systematic review. ObesRev 2003;4:157–73.
36. Muti P, Quattrin T, Grant BJ, et al. Fasting glu-cose is a risk factor for breast cancer: a prospec-tive study. Cancer Epidemiol Biomarkers Prev2002;11:1361–8.
37. Monninkhof EM, Velthuis MJ, Peeters PH, et al.Effect of exercise on postmenopausal sexhormone levels and role of body fat: arandomized controlled trial. J Clin Oncol 2009;27:4492–9.
38. Campbell KL, Foster-Schubert KE, Alfano CM,et al. Reduced-calorie dietary weight loss, exer-cise, and sex hormones in postmenopausalwomen: randomized controlled trial. J Clin Oncol2012;30:2314–26.
39. McTiernan A, Tworoger SS, Ulrich CM, et al.Effect of exercise on serum estrogens in post-menopausal women: a 12-month randomizedclinical trial. Cancer Res 2004;64:2923–8.
40. Connor GS, Tremblay M, Moher D, et al. A com-parison of direct vs. self-report measures forassessing height, weight and body mass index: asystematic review. Obes Rev 2007;8:307–26.
41. May AM, Barnes DR, Forouhi NG, et al. Predic-tion of measured weight from self-reportedweight was not improved after stratification bybody mass index. Obesity 2013;21:E137–E142.
Epidemiology
Emaus et al. 13
Int. J. Cancer: 00, 00–00 (2014) VC 2014 UICC
Copyright © 2022 FDOKUMEN