und Meeresforschung, Bericht Nr. 731 - EPIC
59
The Expedition PS116 of the Research Vessel POLARSTERN to the Atlantic Ocean in 2018 Edited by Claudia Hanfland and Bjela König with contributions of the participants Berichte zur Polar- und Meeresforschung Reports on Polar and Marine Research 731 2019
-
Upload
khangminh22 -
Category
Documents
-
view
4 -
download
0
Transcript of und Meeresforschung, Bericht Nr. 731 - EPIC

The Expedition PS116 of the Research Vessel POLARSTERN to the Atlantic Ocean in 2018
Edited by
Claudia Hanfland and Bjela König with contributions of the participants
Berichte zur Polar- und Meeresforschung
Reports on Polar and Marine Research
7312019

Die Berichte zur Polar- und Meeresforschung werden vom Alfred-Wegener-Institut, Helmholtz-Zentrum für Polar- und Meeresforschung (AWI) in Bremerhaven, Deutschland, in Fortsetzung der vormaligen Berichte zur Polarforschung herausgegeben. Sie erscheinen in unregelmäßiger Abfolge.
Die Berichte zur Polar- und Meeresforschung ent-halten Darstellungen und Ergebnisse der vom AWI selbst oder mit seiner Unterstützung durchgeführten Forschungsarbeiten in den Polargebieten und in den Meeren.Die Publikationen umfassen Expeditionsberichte der vom AWI betriebenen Schiffe, Flugzeuge und Statio-nen, Forschungsergebnisse (inkl. Dissertationen) des Instituts und des Archivs für deutsche Polarforschung, sowie Abstracts und Proceedings von nationalen und internationalen Tagungen und Workshops des AWI.Die Beiträge geben nicht notwendigerweise die Auf-fassung des AWI wider.
The Reports on Polar and Marine Research are issued by the Alfred Wegener Institute, Helmholtz Centre for Polar and Marine Research (AWI) in Bremerhaven, Germany, succeeding the former Reports on Polar Research. They are published at irregular intervals.
The Reports on Polar and Marine Research contain presentations and results of research activities in polar regions and in the seas either carried out by the AWI or with its support.
Publications comprise expedition reports of the ships, aircrafts, and stations operated by the AWI, research results (incl. dissertations) of the Institute and the Archiv für deutsche Polarforschung, as well as abstracts and proceedings of national and international conferences and workshops of the AWI.The papers contained in the Reports do not necessarily reflect the opinion of the AWI.
Herausgeber Dr. Horst Bornemann
Redaktionelle Bearbeitung und Layout Birgit Reimann
Editor Dr. Horst Bornemann
Editorial editing and layout Birgit Reimann
Alfred-Wegener-Institut Helmholtz-Zentrum für Polar- und Meeresforschung Am Handelshafen 12 27570 BremerhavenGermany
www.awi.dewww.reports.awi.de
Titel: Fächerecholotdaten mariner Dünen in der Straße von Dover (Blick von der englischen Küste Richtung Frankreich). Die asymmetrische Form, welche die Dünen entlang der Strömung entwickeln, ist deutlich sicht-bar. Das Hintergrundraster basiert auf GEBCO-Daten. Abbildung zusammengestellt von Niels Fuchs, AWI.
Cover: Multibeam echosounding data of marine dunes in the Strait of Dover (view from the English coast towards France). The asymmetric shape that dunes develop along the current is clearly visible. Background
grid based on GEBCO data. Figure compiled by Niels Fuchs, AWI.
Alfred-Wegener-Institut Helmholtz-Zentrum für Polar- und Meeresforschung Am Handelshafen 12 27570 BremerhavenGermany
www.awi.dewww.reports.awi.de
Der Erstautor bzw. herausgebende Autor eines Ban-des der Berichte zur Polar- und Meeresforschung versichert, dass er über alle Rechte am Werk verfügt und überträgt sämtliche Rechte auch im Namen sei-ner Koautoren an das AWI. Ein einfaches Nutzungs-recht verbleibt, wenn nicht anders angegeben, beim Autor (bei den Autoren). Das AWI beansprucht die Publikation der eingereichten Manuskripte über sein Repositorium ePIC (electronic Publication Information Center, s. Innenseite am Rückdeckel) mit optionalem print-on-demand.
The first or editing author of an issue of Reports on Polar and Marine Research ensures that he possesses all rights of the opus, and transfers all rights to the AWI, including those associated with the co-authors. The non-exclusive right of use (einfaches Nutzungsrecht) remains with the author unless stated otherwise. The AWI reserves the right to publish the submitted articles in its repository ePIC (electronic Publication Information Center, see inside page of verso) with the option to "print-on-demand".

Please cite or link this publication using the identifiershttp://hdl.handle.net/10013/epic.aeecd4cd-da53-4460-b93b-1bfda0ddef13 and https://doi.org/10.2312/BzPM_0731_2019
ISSN 1866-3192
The Expedition PS116of the Research Vessel POLARSTERNto the Atlantic Ocean in 2018
Edited byClaudia Hanfland and Bjela Königwith contributions of the participants

PS116
11 November 2018 - 11 December 2018
Bremerhaven - Cape Town
Chief ScientistsClaudia Hanfland
Bjela König
CoordinatorRainer Knust

1
Contents
1. Überblick und Fahrtverlauf 2
2. Weather Conditions During PS116 7
3. Echosounding Training Course (POLMAR-TRAIN) 9
4. Plankton-eDNA 15
5. Atmospheric Gaseous Ammonia and Particulate Ammonium and their Stable N - Isotopes and the Diversity of Air-Borne Microorganisms Along a Transect Across the Atlantic Ocean 21
6. Atmospheric Measurements of Aerosols and Clouds with a Mobile Sea Facility OCEANET 27
7. Data Acquisition of a Combined Neutron Monitor and Muon Telescope on Board Polarstern 31
8. System-Testing of a Combined Launch and Recovery System (Lars) and Depressor with Underwater Pulley for Towed Vehicles and Other Measuring Systems 34
9. ARGO-Float Deployment 35
10. Logistics and Safety 38
11. Data Centre Activities During PS116 41
APPENDIXA.1 Teilnehmende Institute / Participating Institutions 45
A.2 Fahrtteilnehmer / Cruise Participants 47
A.3 Schiffsbesatzung / Ship’s Crew 49
A. 4 Stationsliste / Station List 52

2
1. ÜBERBLICK UND FAHRTVERLAUFClaudia Hanfland, Bjela König AWI
Polarstern verließ den Heimathafen Bremerhaven für die Expedition PS116 am 11.11.2018 mit dem Mittagshochwasser. Aufgrund umfangreicher vorangegangener Werftarbeiten, hatte sich die Abfahrt um einen Tag verzögert. An Bord gingen 43 Besatzungsmitglieder, 45 Teilnehmende aus Wissenschaft und Logistik sowie zwei Meteorologen des Deutschen Wetterdienstes.
Die wissenschaftlichen Aktivitäten während PS116 umfassten folgende Tätigkeiten: Ausbildung von Nachwuchswissenschaftlern in Hydro-Akustik (auf dem Abschnitt Bremerhaven – Las Palmas), atmosphärische en-route Messungen und Wasserbeprobungen sowie Arbeiten der Logistik und des Rechenzentrums.
Die wissenschaftlichen Vorhaben im Einzelnen:
• POLMAR-TRAIN: Ausbildung von Masterstudenten der Universität Bremen, Fachbereich Geowissenschaften, und Doktoranden des AWI in geophysikalischen Methoden an den Echoloten; organisiert durch die Graduiertenschule POLMAR am AWI
• Plankton-Genomik: Bestimmung von Planktonvergesellschaftungen entlang eines meridionalen Schnittes durch den Atlantik mittels Taxonomie und DNA-Barcoding
• OCEANET: atmosphärische Messungen (physikalische Parameter, Aerosole) mittels Fernerkundung und LIDAR-Technik, Validierung des ESA Satelliten Aeolus wenn mit Fahrtroute kompatibel, durchgeführt von TROPOS (Leipzig)
• COSMIC-RAYS: Messung kosmischer Strahlung entlang eines meridionalen Schnittes durch den Atlantik (durchgeführt vom DESY Zeuthen)
• NISAAA: Ermittlung der Stickstoffisotopenzusammensetzung über dem Atlantik in Ammonium und Ammoniak
• Test eines Schleppsystem-Depressors
• Ermittlung von Prozessabläufen unter dem Blickwinkel der Arbeitssicherheit an Bord
• Installation von Software und Hardware-Komponenten in Vorbereitung auf das Driftexperiment MOSAiC
•
Bis zum Zwischenstopp in Las Palmas wurden auf insgesamt vier kleinen Stationen Planktonproben mit dem Handnetz gezogen sowie Temperatur- und Salzprofile der Wassersäule aufgezeichnet – letzteres als Voraussetzung für eine ordnungsgemäße Kalibration der Lotsysteme. Das Hauptaugenmerk dieses Abschnitts lag auf dem studentischen Training.

3
1. Überblick und Fahrtverlauf
In Las Palmas gingen alle Teilnehmer und Dozenten des POLMAR-TRAIN Kurses sowie sechs weitere Wissenschaftler von Bord. Es stiegen sieben neue Kolleginnen und Kollegen auf, außerdem wechselte die Fahrtleitung.
Zur Weiterfahrt von Las Palmas nach Kapstadt, die am 22.11.2018 begann, waren fünf verschiedene wissenschaftliche Teams an Bord. Die Aufnahme bathymetrischer Daten wurde durch eine Studentin der Universität Bremen weitergeführt, die auf dem Abschnitt von Bremerhaven bis Las Palmas im Rahmen des POLMAR-TRAIN Trainingsprogramms mit einer Gruppe zum Echosounding-Training an Bord gekommen war. Zur Erfassung neuer bathymetrischer Daten wurde die Route von Polarstern während der Fahrt mehrfach leicht angepasst, um nicht auf alten, bereits vermessenen Tracks zu fahren. Parallel dazu wurden mehrere Profile mit der „underway“-CTD gefahren. Die Route wurde ebenfalls durch die erforderlichen Schnittpunkte mit Satellitenumlaufbahnen bestimmt, an denen das TROPOS-Institut Radiosonden steigen ließ, um die von einem neuen Satelliten gelieferten Daten abgleichen und bewerten zu können. Zusätzlich erfolgten durch das TROPOS-Institut Messungen mit einem LIDAR und weiteren Photosensoren. Durch das DESY wurden während der gesamten Fahrt Myonenmessungen zur Ermittlung der kosmischen Strahlen durchgeführt. Laufende Planktonbeprobungen erfolgten mit Hilfe des Seewassersystems und über regelmäßigen Einsatz des Handnetzes. Ständige Aerosol- und Luftkomponentenmessungen der Atmosphäre vor allem zur Ermittlung der Ammoniumwerte wurden ebenfalls betrieben. Zudem fanden während der gesamten Reise Routinearbeiten des DWD in der Bordwetterwarte statt.
Neben den genannten en-route Messungen führte die AWI-Logistik den Test eines Depressors durch, der zukünftig für das sichere Schleppen von Messgeräten unter dem Eis sorgen soll. Ziel ist es, den Schleppdraht direkt im Heckwasser dicht hinter dem Schiff zu stabilisieren und auch während der Fahrt halten zu können, damit dieser nicht mit den sich hinter dem Schiff wieder zusammenschiebenden Eisschollen in Kontakt kommen kann. Ein Schlepptest wurde bei verschiedenen Drahtlängen und Geschwindigkeiten mit dem Depressor und angehängtem Dummy mit Treibanker durchgeführt. Ein weiterer Schlepptest erfolgte unter Überwachung durch das GAPS, wieder bei verschiedenen Geschwindigkeiten und diversen Kursänderungen. Auf Grund der stabilen Lage des Depressors und guter Ergebnisse waren keine weiteren Tests erforderlich. Dank temporär abflauender Winde und geringerem Schwell war es möglich, einen ROV-Test vom Zodiac sowie direkt vom Arbeitsdeck aus durchzuführen. Für das Bundesamt für Seeschifffahrt und Hydrographie wurden fünf ARGO-Floats an vorgegebenen Positionen ausgesetzt.
Zur logistischen Vorbereitung des MOSAiC-Projekts waren drei AWI-Mitarbeiter an Bord, die im Dialog mit Schiffsführung und einzelnen Besatzungsmitgliedern Konzepte für Beladung, Datenmanagement und Sicherheit erarbeitet haben.
Die Fahrt endete am 11.12.2018 in Kapstadt, Südafrika.

4
PS116
Abb. 1: Fahrtroute der Polarstern-Expedition PS116. Siehe https://doi.pangaea.de/10.1594/PANGAEA.897872 für eine Darstellung des master tracks in
Verbindung mit der Stationsliste für PS116.
Fig. 1: Cruise track of Polarstern expedition PS116. See https://doi.pangaea.de/10.1594/PANGAEA.897872 to display the master track in conjunction with
the list of stations for PS116.
5
SUMMARY AND ITINERARYPolarstern left its port of registry, Bremerhaven, for expedition PS116 on 11 November 2019 at high tide. Due to extensive renovation works at the dockyard, the departure was delayed by one day. In total, 43 crew members, 45 members from science and logistics and two employees from Germany’s National Meteorological Service went on board.
Scientific activities during PS116 comprised three different field of activities: training of early career scientists in the operation of the echosounding system of Polarstern (Leg Bremerhaven – Las Palmas only), scientific en-route measurements and sampling, and activities and maintenance of logistics and IT department.
In detail, the scientific activities during PS116 comprised the following work packages:
• POLMAR-TRAIN: Education and training of Master students of the University of Bremen, Department of Geosciences, and doctoral candidates from AWI, in geophysical methods in the echosounding systems (multibeam echosounder Atlas Hydrosweep DS3 and sediment echosounder Parasound P70)
• Plankton genomics: Determination of plankton communities along a longitudinal gradient across the Atlantic Ocean by means of taxonomy and DNA-metabarcoding
• OCEANET: Atmospheric measurements (physical parametres, aerosols) by means of remote sensing and LIDAR technique. Validation of ESA satellite Aeolus by ground-comparison profiles, ship-track permitting.
• COSMIC-RAYS: Determination of cosmic rays along a longitudinal gradient across the Atlantic Ocean
• NISAAA: Determination of the isotopic composition of nitrogen in ammonium and ammonia over the Atlantic Ocean
• Testing of a depressor system
• Identification of working processes in view of the development of a comprehensive safety concept for scientific work on board
• Installation of software and hardware components in preparation for the drift experiment MOSAiC
Four stations were carried out until the intermediate port call at Las Palmas, consisting of handnet deployment for plankton collection and registration of vertical temperature and salinity profiles if the water column. The latter was necessary for calibration of the echosounding systems. The main focus between Bremerhaven and Las Palmas was the student training on the Hydrosweep DS3 and the sediment echosounder Parasound P70.
After arrival in Las Palmas, all but one participant form the student training, all lecturers and six more scientists left Polarstern. Seven new scientists joined the leg, which also included a change in the cruise chief scientist.

6
PS116
There were five different scientific teams on board of Polarstern for the cruise from Las Palmas to Cape Town. The collection of bathymetric data was carried out by one student from the University of Bremen, who embarked in Bremerhaven together with a group of students from the POLMAR training programme who carried out echo sounding training until Las Palmas. To collect new bathymetric data, the track from Las Palmas to Cape Town was constantly adjusted to avoid sailing on previous tracks. Measurements with the underway-CTD were carried out additionally. Another aspect for route and speed changes during the cruise was the required meeting with a track from a new satellite. By releasing a radio sonde at the intersection the TROPOS team intended to gain information regarding the accuracy of the satellites measured data. There was a total of four meetings with this satellite. TROPOS also carried out measurements with a LIDAR and photo sensors. Muon measurements were carried out by a scientist from DESY to determine cosmic rays. Under way sampling of plankton by means of the sea water system and regular use of the hand net was carried out. Aerosol and air components of the atmosphere were constantly measured to determine ammonium data. Routine works of the DWD regarding weather were done all the way from Las Palmas to Cape Town.
Besides these under-way measurements the AWI logistics team carried out a test of a „Depressor“, which is intended for towing measuring instruments below the ice without putting the wire in jeopardy of being damaged by the ice that is closing behind the vessel while moving through the ice. Towing trials with different wire lengths and at different speeds were done with a dummy attached to the „Depressor”. Another test was done while observing the movements of the „Depressor“ with the GAPS. Due to stable performance of the „Depressor“ during course and speed changes no further tests were necessary. Because of reduced wind speed and decreasing wave heights, a ROV could be tested in the ocean. It was operated from the zodiac and directly from working deck. Another task was the deployment of five ARGO-Floats from BSH on given positions.
For planning and coordination reasons regarding the upcoming MOSAiC project three AWI employees worked on concepts for cargo storage, safety and data management together with the ship’s crew.
End of the cruise was in Cape Town on 11 of December.
7
2. WEATHER CONDITIONS DURING PS116Manno Peters DWD
An intensive low northwest of Ireland was the dominant feature at the departure from Bremerhaven on 11 November 2018, 13 UTC. It was accompanied by southerly winds with Bft 5, broken clouds, some showers and temperatures at about 12 degrees. On 12 November Polarstern experienced more showers and Bft 6 at times at the sea area Thames in combination with a trough. The sea was building from 1.5 to 3 m. At night there were some thunderstorms with gusts of storm force. On 13 November the weather calmed down and the southwesterly winds decreased to Bft 5. Nevertheless the swell did not subside noticeable at the western exit of the English Channel. On 14 November southerly winds Bft 5 with sea 2 m were dominating while crossing the Bay of Biscay. The southeasterly winds decreased to Bft 4 in the vicinity of a secondary low west of Portugal. At the same time, storm lows over the northern Atlantic produced swell of 3.5 m. The cold front of such a low was crossing us north of the Canary Islands on 17 November leading to southwesterly winds Bft 7 and rain. Behind the cold front there were showers and the wind was veering to northwest decreasing to Bft 5. The swell was building about 5 m in the night to the 18 November. The longwave swell did not scare Polarstern much, but on the Canary Islands several near coastal damages were reported caused by the high waves. While arriving at Las Palmas on 18 November at 09 UTC, wind speed and swell decreased only a little. (Fig. 2.1).
Polarstern departed in direction to Cape Town on 22 November at 09:30 UTC. The cold front of a small scale low northeast of the Canary Island caused rain. The northerly winds only blew weakly. Further on there were northwesterly winds with Bft 5 to 6 at the edge of on extensive high south of the Azores. From 23 November we experienced the classical northeasterly trade winds accompanied by a low amount of cumulus clouds and temperatures slowly rising up to 25 degrees. In these days an intensive dust outbreak was observed originating from the Sahara and the Sahel. The force of the trade winds decreased off the coast of Guinea during the night to 26 November and the Intertropical Convergence Zone (ITCZ) was reached with light and variable winds. Several showers were observed at the southern edge of the surface position of the ITCZ on 27 and 28 of November. In this area temperatures about 28 degrees and a relative humidity of 80 % were measured. At the same time the southwesterly winds strengthened up to Bft 4 to 5. From 29 November onwards Polarstern was crossing the zone of the trade winds at the edge of the extensive high over the southern Atlantic. There, steady wind forces, low cumulus and stratocumulus clouds underneath a marked inversion were prevailing while the temperatures were decreasing a little. At first locally showers occurred, later on there was drizzle at some times. While approaching the African continent the cloud layer became thinner by 5 December. A low south of South Africa was moving eastwards on 6 and 7 December, causing southwesterly winds with a wind minimum of Bft 2 to 3. The southeasterly trades continued with Bft 5 by 8 December. The southerly winds decreased a little until the arrival at Cape Town in the morning of 11 December.

8
PS116
Fig. 2.1: Meteorological parameters during PS116 from 11 November 00 UTC to 11 December 2018 06 UTC (x-axis): (a) Wind speed in [m/s], (b) wind direction in [°C], (c) significant wave height in [m]
(windsea fraction in red).
Fig. 2.2: Meteorological parameters during PS116 from 11 November 00 UTC to 11 December 2018 06 UTC (x-axis). Temperatures in [°C]: water (blue), air (red).

9
3. ECHOSOUNDING TRAINING COURSE (POLMAR-TRAIN)
Frank Niessen, Jan Erik Arndt, Simon Dreutter, Catalina Gebhardt, Johann Philipp Klages, Gerhard Kuhn (not on board), Claudia Hanfland
AWI
Grant-No. AWI_PS116_00
ObjectivesPOLMAR-TRAIN 2018 is a student-training course that was jointly run by the AWI-based Helmholtz Graduate School for Polar and Marine Research (POLMAR) and the University of Bremen. The purpose is to provide master students and doctoral candidates from the field of geosciences with a hands-on training in operating the hull-mounted echosounding systems of Polarstern (Teledyne multibeam echosounder HYDROSWEEP DS3 and sediment echosounder PARASOUND P70). Parallel to the practical training, the aim is to promote peer-learning by combining master students (beginners and advanced stage) and doctoral candidates / scientists in this course. In addition, we provide knowledge and literature about the near-surface marine geology along the south western and north western continental margin of Europe and Africa, respectively. Thus, the objectives of the work at sea are threefold:
(i) learn to operate the systems during shifts,
(ii) store, process and interpret the sub-bottom and bathymetric data and,
(iii) put the hydro-acoustic results into a broader regional perspective in order to understand the geology along the cruise track.
POLMAR-TRAIN is part of the programme “Master of Sciences Marine Geosciences” at the University of Bremen as well as of the scientific programme of POLMAR. Both programmes involve ship-based field-work for students and doctoral candidates. In addition, we take the opportunity to train participants of forthcoming marine expeditions in hydro-acoustic operation. The training is carried out by five lecturers affiliated with both the University of Bremen and AWI.
Work at sea
Educational Aspects
Twelve students from the University of Bremen, eight doctoral candidates, one scientist and one technician from AWI (Potsdam and Bremerhaven, respectively), participated in the training. Study topics of the participants include geology, geophysics, biological aqua culture, functional ecology, periglacial soil science, satellite remote sensing, environmental physics, sea-ice physics and chemical technology.
The course started with a theoretical introduction into the physics and techniques of echosounding and how to operate sounding systems, followed by a general introduction into the geology along the continental margins from the English Channel to the Canary Islands. Afterwards,

10
PS116
students were introduced to hard and software and started going on watches (generally 4 hours each) in pairs of two each for both systems HYDROSWEEP and PARASOUND.
In groups of two to four, participants took over responsibilities for, in total, six regional areas of specific geological/geophysical characteristics along the cruise track to Las Palmas. These include:
• The English Channel from east of Dover to the Armorican Shelf edge
• The western Armorican Shelf and the slope/basin of the northern Bay of Biscay
• The area of and around the Galicia Bank
• The area west of major submarine canyons off northern Portugal
• The area of the boundary between the African and Eurasian plates
• The Agadir submarine canyon complex
The participants learned to interpret submarine geomorphological structures from bathymetric images, sediment echographs combined with information from the literature including seismic-profiles. With regard to multibeam-bathymetric data, participants were introduced to data acquisition, data processing, and visualization with different kind of profiling and GIS mapping software. For processing of PARASOUND data, the use of different software packages was applied including data conversion to SEG-Y. IHSTM Kingdom® software was introduced in order to let the participants combine information from bathymetric maps (GEBCO and/or HYDROSWEEP), Polarstern track lines and PARASOUND sub-bottom profiles (Fig. 3.1). In addition to data acquired during PS116, participants had access to both HYDROSWEEP and PARASOUND data from the following previous cruises: PS88, PS97 and PS105. Where ever possible, the track lines of cruise PS116 and previous cruises were placed with a small displacement to each other so that a slightly larger coverage of the sea floor is achieved for mapping. Exact repetition of sub-bottom results is avoided whenever possible.
Fig. 3.1: Example of using IHSTM Kingdom® software to interactively combine PARASOUND track data visualized on bathymetric maps with sub-bottom profiles.

11
3. Echosounding Training Course (POLMAR-TRAIN)
Technical AspectsOn the way from Bremerhaven to Las Palmas HYDROSWEEP recording started in the North Sea on 11.11.2018 at 18:51 UTC and ended on 18.11.2018 at 08:35 close to the island of Gran Canaria. PARASOUND recording was started on 12.11.2018 at 09:02 UTC east of the Strait of Dover and ended on 18.11.2018 at 09:02 UTC close to the Island of Gran Canaria. No system crashes occurred. The operational settings of PARASOUND transmissions are summarized in Table 3.1. During the entire cruise, we had avoided external depth control of PARASOUND by HYDROSWEEP because problems using this control were reported from PS98 (Kuhn et al. 2018). The problems are caused by PARASOUND noise interfering with HYDROSWEEP center beam sounding. This noise leads to irregular false depth determination by HYDROSWEEP. When imported as external depth into PARASOUND this can result in incorrect pulse-rate settings leading to data gaps at the sea floor. During PS116, along the continental slope from the Armorican Shelf into the abyssal plain of the Bay of Biscay, the operational mode of pulsing was changed from Single Pulse (SP) to Quasi-Equidistant (QED) operation. With this change the PHF frequency was increased from 18 to 19.25 kHz and the SLF frequency was decreased from 4 to 3.5 kHz. While this had no or only subtle effects on sub-bottom results, the noise interference by PARASOUND in the central beam of HYDROSWEEP was reduced significantly at higher than 18 kHz PHF PARASOUND pulsing frequencies.
Using Software PARASTORE PHF and SLF profiles were visualized online. PHF and SLF data were stored in ASD and PS3 (frequency carrier/lat.long.) formats. In addition, auxiliary data (navigation and PARASOUND settings) were stored in one-minute intervals. “Printing” of SLF data was performed using a PDF-creator of the operator PC via PNG output formats stored on disc.
Preliminary results
Educational ResultsThe concept of combining undergraduates and postgraduates in this training proved to be a successful approach. Next to guidance and discussion with the team of lecturers, peer-learning was an important factor for the success of this training concept.
The combination of theoretical background, practical work on the hydroacoustic systems (including troubleshooting), discussion of published data and student presentations was the right combination for a thorough and comprehensive training in echosounding techniques. However, the time available during PS116 was extremely short, because Polarstern left Bremerhaven one day later than scheduled (due to delayed ship-yard work). Also, the ship speed during the transect was relatively high, so that Las Palmas was already reached after seven days, whereas earlier training cruises had eight to ten days available for education for this part of the leg. Moreover, it is harder to run the echosounding systems at ship speeds well above 10 kn (average about 13 kn during PS116) compared to normal transit speeds of 10.5 kn.
All participants gave a 15 min presentation on their Bachelor, Master or PhD projects, which, in parts, included their previous experiences with hydro-acoustic data. In addition, at the end of the cruise, the groups responsible for the six regions along the cruise track (English Channel to Agadir Canyon as listed above) gave a 15-to-20-minute presentation each, in which they presented PARASOUND and HYDROSWEEP results obtained during PS116, PS105 (and/or during PS97/PS88 along parallel course tracks) in the context of the regional geology published elsewhere (provided to the students on board). In this way a very good overview was compiled about the characteristics of the geology of the continental margins. This includes understanding how the results documented by Polarstern hydroacoustic data support or extend the state-of-

12
PS116
the-art knowledge. This combination turned out to be very effective for both motivating the students to acquire hydroacoustic data and developing interpretation skills. By using data from previous cruises, the different groups were able to work simultaneously without waiting for their area to be surveyed. It was straight forward to fit in interesting results, which were recorded during PS116. Reports were written by students who needed marking for their contributions.
Tab. 3.1. Settings of ATLAS HYDROMAP CONTROL for operating PARASOUND during cruise PS116Used Settings Selected Options Selected Ranges
Mode of Operation P-SBP/SBES, shallow and deep-sea settings
PHF, SLF
Frequency PHF 19.25 kHz (QED), 18 kHz (SP) SLF 3.5 kHz (QED), 4 kHz (SP)Pulse Length No. of Periods 2 (Continuous Wave)
4 (Chirp) Length 0.5 ms (Continuous Wave)
1.14 ms (Chirp)Transmission Source Transmission Power 100% Transmission Voltage 159 V
Beam Width Automatic (4.5°)Beam Steering none Mode of Transmisson Single Pulse (SP) Auto according to water depth Quasi-Equidistant (QED) Interval 1200-2250 msPulse Types Continuous Wave
Frequency modulated (chirp) Above 800 m of water depthBelow 800 m of water depth
Pulse Shape Rectangular Receiver Output Sample Rate (OSR) 12.2 kHz Band Width (Chirp) PHF: 2 kHz, SLF: 4 kHz
Pulse Resolution (Chirp) PHF: 0.369 m, SLF: 0.184 mAmplification TVG Automatic, Shift: 40 dB
Reception Shading none System Depth Source Fix Min/Max Depth Limit ATLAS PARASOUND PHF ATLAS HYDROSWEEP SLF
(for very short periods only)Water Velocity C-Mean Manual 1500 m/s C-Keel System C-keelData Recording PHF 100 m above Sediment SLF 200 m Penetration
Technical ProblemsDuring the PARASOUND online operation, two problems occurred:
(1) While passing along the English Channel the ship’s motion (heave, roll and pitch) increased steadily due to increasing influence of the sea state in the eastern Atlantic Ocean. Thus, the motion reached levels visible in PARASOUND data displays (PHF and SLF) in echogram windows for no, or incomplete, motion compensation. After contacting Teledyne in Bremen

13
3. Echosounding Training Course (POLMAR-TRAIN)
this problem was fixed via remote access to the PARASOUND system via satellite connection and full motion compensation was accomplished thereafter. Nonetheless, PARASOUND PHF and SLF data suffered from a strong overprint by ship’s motion starting about at 12.11.2018 at 21:45 UTC until 13.11.2018 at 07:55 UTC. These uncorrected data sets were also stored on the ship’s data base and transferred to the AWI data base on land eventually accessible through PANGAEA
(2) After entering deep water areas first along the slope of the northern continental slope of the Bay of Biscay, the transmission mode was switched to Quasi-Equal-Distant operation (QED, Tab. 1). Below a water depth of approximately 4,800 m (and similar over other abyssal plains thereafter) there was a strong increase in noise recorded in PHF data in the water column about 100 m above the sea floor. A somehow similar problem was noted during PS110 and described in the cruise report (Niessen 2019). During PS116 we observed two different
types of noise above or below the echoes from the sedimentary record: (i) “clouds” of noise over some time along the track with single amplitudes almost as high as the sea floor reflections, and (ii), distinct “bands” of strong noise restricted to parts of single traces (or seismograms) re-occurring in regular lateral time intervals (Fig. 3.2). According to Niessen (2019) the first type of noise is from the uppermost water column (reflection from boundaries of water layers with different temperature, salinity and biota down to 500 m below sea level) and being picked up from near sea-floor echoes of a previous pulse reflected back to the transducer plate at the same time. The origin of the second type of noise is unknown. These noise problems were noted as critical for the sounding operation as they may cause faulty depth determination as long as the PHF signal is used as depth control of PARASOUND. Wrong depths result in incorrect calculation of sounding rates of QED pulses leading to gaps in recorded data from the uppermost sediments. During operation the problem can be overcome by decreasing the desired number of pulses in the water column and/or by increasing the minimum time interval between pulses in HYDROMAP Control. During PS116 and at water depth between 4,000 and 5,500 m, practical values turned out to be 3 pulses or time intervals as long as 2,300 ms. This is by far beyond the
Fig. 3.2: PHF echogram window examples with noise described in text (a: distinct “bands” of noise, b: “clouds” of noise, c: resulting gaps due to faulty
depth determination while using PHF for depth control).
Time-window code: yyyymmddT(ime)hhmm-hhmm (UTC), black or white bars at bottom mark lateral
distance of 1 km each.

14
PS116
lateral resolution capabilities, which the system allows in general for operating at these depths. Whether or not a technical solution can be provided to improve the system is left to negotiations with the manufacturer after the cruise.
Data managementHydroacoustic data (multibeam and sediment echosounder) collected during the expedition were copied to the Polarstern data base. From there the data will be transferred to the data mass storage at AWI Bremerhaven. Finally, the data will be stored and linked to the PANGAEA data repository at AWI. Furthermore, the data will be provided to international mapping projects and included in regional data compilations such as the Nippon Foundation-GEBCO (General Bathymetric Chart of the Oceans) Seabed 2030 Project.
References
Niessen F (2019) The Expedition PS110 of the Research Vessel POLARSTERN from Bremerhaven to Cape Town in 2017/18. Berichte zur Polar- und Meeresforschung = Reports on polar and marine research, Bremerhaven, Alfred Wegener Institute for Polar and Marine Research, in prep.
Kuhn G et al. (2018) Echosounding Training Cruise (POLMAR-TRAIN 2016). In: Pospichal B (Edit.) The Expedition PS98 of the Research Vessel POLARSTERN to the Atlantic Ocean in 2016. Berichte zur Polar- und Meeresforschung = Reports on polar and marine research, Bremerhaven, Alfred Wegener Institute for Polar and Marine Research, 720, 33-37.
15
4. PLANKTON-E DNA Eva Garcia-Vazquez1, Johannes Rick2 Alba Ardura1 (not on board)
1Uni Oviedo, Spain2AWI
Grant-No. AWI_PS116_00
Objectives The scientific aims of the project are:
• To identify and quantify the taxonomic and functional changes of plankton communities in a large latitudinal transect along the Atlantic Ocean from Bremerhaven to Cape Town using water samples and a combined approach of visual taxonomy and DNA metabarcoding.
• To develop and validate a simplified method for inventory of relevant species from environmental DNA and Next Generation Sequencing (NGS) using water samples of small volume.
• To assess the association between environmental parameters and plankton species important for fisheries, principally preys of commercial fish.
Work at seaWater samples were taken at 22 geographical positions evenly distributed along the cruise track: before, after and one crossing the equator. Polarstern has an underway system for pumping water from outside the vessel into the laboratories through a pipe. The tap connecting with the membrane pump, with the water take at 6 m depth, was running constantly along the travel. Each day, different volumes of water were concentrated through filters of different mesh, following the scheme presented next:
1: Filter 0.2 μm pore. Between 4 and 10 L. Coded and stored in absolute ethanol for further DNA metabarcoding in University of Oviedo laboratory.
2: Filter 46 μm mesh. Between 200 and 500 L, concentrated in circa 200 ml volume. It was split in two aliquots. One was filtered through 0.2 μm membrane and stored in ethanol for metabarcoding; the other was photographed under the microscope (several drops), and stored in formaldehyde for morphological identification.
3: Filter 250 μm mesh. Between 500 and 1,000 L, concentrated in circa 100 ml volume. Split in two aliquots that followed the same processing as in the previous case.
4: Samples were taken overboard with a manual plankton net of 20 μm mesh, approximately 200 L of volume concentrated in three replicates of 50 ml. They were aliquoted for filtering through 0.2 μm membrane and storing in ethanol for metabarcoding, and for morphological analysis, photographs under the microscope fixed in formaldehyde.

16
PS116
Onboard, samples 2 to 4 were visually analyzed with the microscope, and individuals were sorted for visual identification of the species using taxonomic guides, then stored in absolute ethanol for further DNA barcoding in University of Oviedo.
Water samples (two samples of 5 ml) were taken each day and stored at -20°C for further analysis of nutrients and other chemical parameters in AWI.
Metabarcoding (University of Oviedo), Barcoding (University of Oviedo) and complete visual identification (AWI) will be carried out at the home laboratories within one year after the cruise.
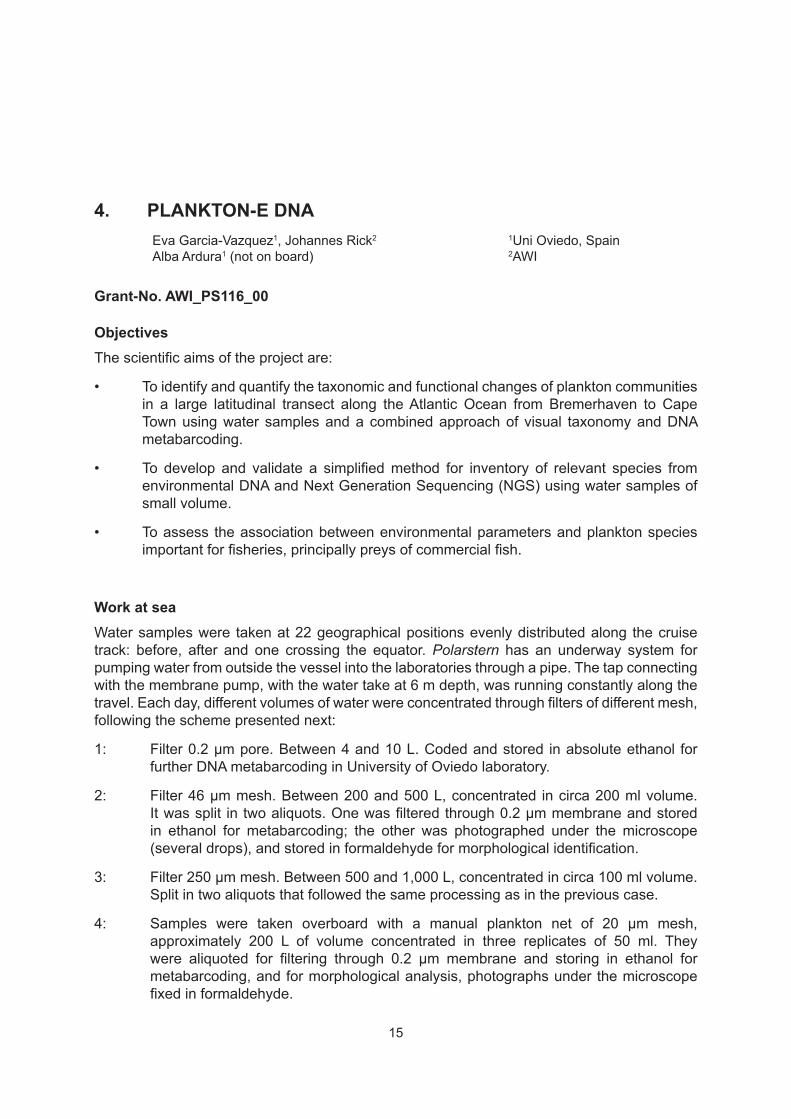
Preliminary and expected results Pictures of individuals of some species found in this study are presented in Fig. 4.1, with examples of phytoplankton from the North Sea and the Bay of Biscay (Fig. 4.2). As expected, the species composition was not the same at different latitudes.
Fig. 4.1: Photograph taken onboard Polarstern of an individual of the diatom species Odontella sinensis sampled from the North Sea
Fig. 4.2: Photograph taken onboard Polarstern of an individual of the diatom species Corethron criophilum sampled from the Bay of Biscay

17
4. Plankton-eDNA
DNA Barcoding (COI, 18S, RBCL and/or 16S rRNA genes as Barcodes) will be used for species ascertainment from individual samples. This way sequences associated to individual vouchers will be available. NGS Metabarcoding as in Borrell et al. (2017a,b) will serve for describing the plankton community. The Illumina platform (or Ion Torrent) will be employed.
The association between environmental parameters and plankton diversity, function and key species will be modelled and the model tested and validated using state of the art bioinformatics procedures.
The present study will contribute to understanding the crucial functional features of plankton communities across a long latitudinal trans-equatorial transect, and how they are influenced by environmental conditions. The use of NGS methodology for inventorying higher eukaryotes of interest for fisheries sustainability from plankton communities, at the large geographical and latitudinal scale proposed in this study, has never been published to date, and will compare to other large expeditions such as Tara Oceans.
Knowing the composition of planktonic communities is essential for both fundamental and applied purposes. On one hand, the community composition serves to understand how an ecosystem functions, based on the trophic levels and life history of the species assemblages (e.g. Thompson et al. 2015). The equilibrium of plankton communities is delicate. Zooplankton grazes on phytoplankton, and the community equilibrium is affected by their respective abundance and other factors such as pollution and nutrients (Jang et al. 2008). At the same time, the nutrients balance (for example N/P) is governed by the composition of plankton communities (Weber & Deutsch 2010). The balance phytoplankton-zooplankton and their particular species composition, as well as harmful algal blooms, are related with environmental factors including extreme climatic events such as hurricanes (Fuentes et al. 2010), and are expected to change across latitudes (Richardson 2008). Expectations are that diversity is greater near the Equator and decreases as latitude increases (e.g. Roy et al. 1998, Hillebrand 2004; Fuhrman et al. 2008). Some insights about transequatorial community variation, in particular of pelagic ichthyoplankton, have been achieved from the Polarstern (Ardura et al. 2016). In that study, the latitudinal pattern of diversity did not exhibit the expected temperate-tropical cline, reflecting instead a decline in low-oxygen zones (Ardura et al. 2016) and showing again the importance of environmental conditions for shaping plankton communities.
On the other hand, plankton analysis is crucial in fisheries sciences. Many commercial fish species have planktonic larvae, but they are so largely unknown that they have been called the “missing biomass” (e.g. Johnson et al. 2011). They feed on other (sometimes the same) plankton species, and are an important part of the trophic chain (e.g., Bulman et al. 2002; Walker et al. 2002). They are especially sensitive to climate change and other environmental alterations (e.g. Boeing & Duffy- Anderson 2008), likely related to alterations in the trophic chain and in particular in their preys, like copepods (e.g. Beaugrand et al. 2003). Larvae of important commercial species such as hakes feed on copepods (e.g. Morote et al. 2011). Copepod diversity exhibits a latitudinal cline associated with temperature (Rombouts et al. 2009), but there are evidences of zooplankton decline in tropical Atlantic waters (e.g. Piontkovski & Castellani 2009), and this can put at risk fisheries sustainability. More large-scale studies are necessary on ichthyoplankton communities and especially on their main preys at tropical latitudes.
Studying plankton communities from conventional methodology is laborious. It requires sampling large volumes of water, concentrating the plankton through filtration, sorting the individuals visually under the microscope, and classifying them taxonomically, sometimes with the help of DNA for species identification and quantification. For example, Ardura et al. (2016) have shown

18
PS116
that DNA Barcoding is a promising methodology for ichthyoplankton inventory, and Fuentes et al. (2008) have applied RT-PCR for quantifying toxic algae, but new developments are still needed for application in large-scale routine surveys. The new methods of high throughput sequencing i.e. Next Generation Sequencing (NGS) on environmental DNA can help in species detection and inventory as has been proven for Polarstern ballast water (Zaiko et al. 2015a, b; Ardura et al. 2015), open waters (Zaiko et al. 2015b), estuaries (Borrell et al. 2017a) and others. These methods are very sensitive, and even relatively scarce species can be successfully detected from small water volumes – as small as 3 L, see for example inventories of port species from water in Borrell et al. (2017b). They are employed, for prokaryotes and some specific taxonomic groups like ciliates, in large oceanic expeditions like Tara Oceans (e.g. Sunagawa et al. 2015; Gimmler et al. 2016), but have been less applied for whole eukaryotic communities and almost nothing for targeting fish preys, to our knowledge. If these methods are adequately developed and independently validated for specific applications, they could be used for example for locating species of interest for fisheries like preys of commercial fish species, determining the functional equilibrium of planktonic communities (from the trophic level of the different species inventoried), and other applications.
Preliminary work conducted in Polarstern PS102 (2016) consisted of sampling water overboard using a 15-L bucket every day, filtered 1.5 L through 0.2 μm mesh filters and stored the filter in ethanol. We have performed DNA extraction from the filters when returning in Oviedo home laboratory. Despite very small water volume, sufficient DNA quantity was extracted from the filters for conducting further NGS employing universal primers for COI (zooplankton) and RBCL (phytoplankton). Sequences obtained in different days allowed a robust identification of several species of phytoplankton using strict thresholds in bioinformatics pipelines that were different in samples taken at different latitudes, as expected. The baseline obtained was very modest because the DNA concentration was low in the samples of such small volume. That previous experiment served to set up the minimum volume to be filtrated in 4 L. As seen above, in the present study in PS116 the volumes employed were much larger.
Predicted results are:
1. Sufficient DNA for a good coverage of the biodiversity with saturation curves reaching the plateau, will be obtained for all the samples.
2. According to 1) and other results of the research team, the results obtained from visual identification and metabarcoding will be largely coherent; individual barcodes will help to improve the genetic assignation and to enrich the reference databases.
3. As in Ardura et al. (2016), latitudinal variation in plankton diversity will exhibit lows in the low-oxygen zones.
4. Nursery zones for commercially important fish will be identified from the plankton communities obtained along the transect.
Data managementAt least two peer-reviewed and SCI-indexed scientific publications are expected from this study. The samples will be stored at the University of Oviedo and AWI, available for the scientific community. DNA sequences will be released in public databases within one year after the end of the cruise.
19
4. Plankton-eDNA
References
Ardura A, Zaiko A, Martinez JL, Borrell YJ, Garcia-Vazquez E (2015) Environmental DNA evidence of transfer of North Sea molluscs across tropical waters. Journal of Molluscan Studies, doi: 10.1093/mollus/eyv022.
Ardura A, Morote E, Kochzius M, Garcia-Vazquez E (2016) Diversity of planktonic fish larvae along a latitudinal gradient in the Eastern Atlantic Ocean estimated through DNA barcodes. PeerJ, 4, e2438.
Beaugrand G, Brander KM, Souissi JALS, Reid PC (2003) Plankton effect on cod recruitment in the North Sea. Nature, 426, 661-664.
Boeing WJ, Duffy-Anderson JT (2008) Ichthyoplankton dynamics and biodiversity in the Gulf of Alaska: responses to environmental change. Ecological Indicators, 8, 292–302.
Borrell YJ, Miralles L, Martinez-Marques A, Semeraro A, Arias A, Carleos CE, Garcia-Vazquez E (2017a) Metabarcoding and post-sampling strategies to discover non-indigenous species: A case study in the estuaries of the central south Bay of Biscay. Journal for Nature Conservation, https://doi.org/10.1016/j.jnc.2017.07.002.
Borrell YJ, Miralles L, Do Huu H, Mohammed-Geba K, Garcia-Vazquez E (2017b) DNA in a bottle – Rapid metabarcoding survey for early alerts of invasive species in ports. PLOS One, 10.1371/journal.pone.0183347.
Bulman CM, He X, Koslow JA (2002) Trophic ecology of the mid-slope demersal fish community off southern Tasmania, Australia. Marine and Freshwater Research, 53(1), 59–72.
Fuentes S, Rick J, Scherp P, Chistoserdov A, Noel J (2008) Development of Real-Time PCR assays for the detection of Cylindrospermopsis raciborskii, Proceedings of the 12th International Conference on Harmful Algae, p. 397.
Fuentes S, Rick J, Hasenstein K (2010) Occurrence of a Cylindrospermopsis bloom in Louisiana. Journal of Great Lakes Research, 36 (3), 458-464.
Fuhrman JA et al (2008) A Latitudinal Diversity Gradient in Planktonic Marine Bacteria. Proceedings of the National Academy of Sciences USA, 105(22), 7774–7778.
Gimmler A et al (2016) The Tara Oceans voyage reveals global diversity and distribution patterns of marine planktonic ciliates. Scientific Reports, 6, 33555.
Hillebrand H (2004) Strength, slope and variability of marine latitudinal gradients. Marine Ecology Progress Series, 273, 251–267.
Jang SRJ, Baglama J, Rick J (2008) Plankton-toxin interaction with a variable input nutrient. Journal of Biological Dynamics, 2, 14-30.
Johnson CL et al (2011) Biodiversity and ecosystem function in the Gulf of Maine: pattern and role of Zooplankton and Pelagic Nekton. PLoS ONE, 6(1), e16491.
Morote E et al. (2011) Feeding selectivity in larvae of the European hake (Merluccius merluccius) in relation to ontogeny and visual capabilities. Marine Biology, 158, 1349–1361.
Piontkovski SA, Castellani C (2009) Long-term declining trend of zooplankton biomass in the Tropical Atlantic. Hydrobiologia, 632, 365–370.
Richardson AJ (2008) In hot water: zooplankton and climate change. ICES Journal of Marine Science, 65, 279–295.
Rombouts I et al. (2009) Global latitudinal variations in marine copepod diversity and environmental factors. Proceedings of the Royal Society B: Biological Sciences, 276(1670), 3053–3062.

20
PS116
Roy K, Jablonski D, Valentine JW, Rosenberg G (1998) Marine latitudinal diversity gradients: Tests of causal hypotheses. Proceedings of the National Academy of Science USA, 95, 3699–3702.
Sunagawa S. et al. (2015) Structure and function of the global ocean microbiome. Science, 348, DOI: 10.1126/science.1261359.
Thompson PL, Davies TJ, Gonzalez A (2015) Ecosystem functions across trophic levels are linked to functional and phylogenetic diversity. PLoS ONE, 10(2), e0117595.
Walker WA, Mead JG, Brownell RL. (2002) Diets of Baird’s beaked whales, Berardius bairdii, in the southern Sea of Okhotsk and off the Pacific coast of Honshu, Japan. Marine Mammal Science, 18, 902–919.
Weber TS, Deutsch C (2010) Ocean nutrient ratios governed by plankton biogeography. Nature, 467, 550–554.
Zaiko A, Martinez JL, Schmidt-Petersen J, Ribicic D, Samuiloviene A, Garcia- Vazquez E (2015a) Metabarcoding approach for the ballast water surveillance - an advantageous solution or an awkward challenge? Marine Pollution Bulletin, 92, 25-34.
Zaiko A, Samulioviene A, Ardura A, Garcia-Vazquez E (2015b) Metabarcoding approach for nonindigenous species surveillance in marine coastal waters. Marine Pollution Bulletin, 10, 53-59.

21
5. ATMOSPHERIC GASEOUS AMMONIA AND PARTICULATE AMMONIUM AND THEIR STABLE N - ISOTOPES AND THE DIVERSITY OF AIR-BORNE MICROORGANISMS ALONG A TRANSECT ACROSS THE ATLANTIC OCEANFlorian Heimsch1, Diana Boy2, Ulrich Hartmann1 (not on board), Gode Gravenhorst1 (not on board)
1Uni Göttingen2Uni Hannover
Grant-No. AWI_PS116_00
ObjectivesThe overall aim of our project is to sample atmospheric air across a large-scale transect from Germany to Cape Town, South Africa, on the Atlantic Ocean. We want to characterize the concentrations of Ammonia (NH3)- and Ammonium (NH4
+) -containing aerosols and gas components in their regional distribution as well as their sources and sinks in the Atlantic and the background pattern of the ratios of their stable isotopes δ15N / 14N in size separated particles. The isotope ratios of 34S / 32S in airborne non – sea salt particulate sulphate will be determined, too, since SO4
2- is often the counter ion of NH4+ in atmospheric samples. Additionally, we
also sample bioaerosols like bacteria, fungi and algae to learn about the composition of their communities and their origin.
Gaseous Ammonia & Ammonium
Ammonia gas (NH3) is - besides mineral dust and amines - the main alkaline compound in the atmosphere and takes part in acid – base reactions. It is the source of ammonium (NH4
+) in atmospheric particles, droplets and ice cores. Ammonia is emitted into the atmosphere on a global scale mainly by volatilisation from liquid cattle waste, when urea is decomposed (e.g. Boettger et al. 1980; Lenhard and Gravenhorst 1980; Dentener and Crutzen 1994). In the marine atmosphere NH3 could have its source in the surface water with high values of temperature and pH (Bell 2006). In special situations at marine sites bird colonies can accumulate huge amounts of wastes emitting NH3. Gaseous NH3- concentrations in maritime background areas are in the range of 5 - 50 ng N / m3. The concentrations of gaseous NH3 and particulate NH4
+ drop by about one order of magnitude from the open ocean to the sea ice covered ocean (Ibrom et al. 1991).
Maritime airborne ammonium is mainly found in the nucleation and accumulation mode, whereas nitrate is found in the coarse mode (e.g. Junge 1963; Gravenhorst 1975; Gravenhorst 1978; Gravenhorst et al. 1998; Schaefer et al. 1993; Sievering et al. 1999; Hillamo et al. 1998). Therefore, ammonium and nitrate over the ocean are not found in the same particle size range and cannot be present as ammonium-nitrate. Airborne NH4
+ and N Non Sea Salt Sulfate (NSSS) in remote areas are often closely associated in particle size and concentration. They frequently show molar ratios between 1 and 2, indicating NH4HSO4 and (NH4)2SO4 mixtures (Gravenhorst 1978). However, NH3 and DMS fluxes over the Atlantic did not show any correlation (Bell 2006). Gaseous ammonia probably reacts with newly formed acidic sulphur aggregates. A sea- salt contribution as a primary (NH4)2SO4 aerosol is not realistic, since the weight ratio of Na/NH4 is on the order of > 10 +6 in sea water, but only of the order of 1-10 in
22
PS116
airborne particles. A pure reaction of existing acidic sulphate and alkaline ammonia seems to be more likely for a correlation of sulphate and ammonium in aerosols (Gravenhorst 1975; Beilke and Gravenhorst 1978; Johnson et al. 2008). It is still a question of where NH4
+ in atmospheric samples comes from.
∂ 15N ratios of ammonia and ammonium in the atmosphere
Determination of ∂ 15N-NH4+ and ∂ 15N-NH3 isotope ratios in atmospheric samples is very rare. A
generalized interpretation of the ∂ 15N values is proposed here: NH3-source material (manure, urine, faces) have a high ∂ 15N value in a range of about + 0‰, compared to gaseous NH3 in the atmosphere of about -20 ‰). The fractionation during volatilisation of NH3 is very large, about up to 30 ‰. The particulate ammonium in the atmosphere has a high ∂ 15N value similar to the ∂ 15N value of the source material. The rain ∂ 15N-NH4
+ value seems to fall between ∂ 15N values for gaseous airborne NH3 and for particulate airborne NH4
+. Rain ∂ 15N values seem to be the result, that airborne particulate NH4
+ has heavy ∂ 15N values and gaseous NH3 light values. When entering the cloud base they will be incorporated into cloud droplets and subsequent into rain drops (Gravenhorst 1983). ∂ 15N values in rain could develop as weighted means of ∂ 15N values of NH3 gas and of NH4
+ particles in the updraft at cloud base.
Relatively high ∂ 15N-NH4+ -ratios associated with heavy ∂15N values in Atlantic aerosol
samples were attributed to continental NH3-sources. They suggested that low aerosol NH4+
concentrations with light isotope ∂ 15 N-NH4+ values should indicate a marine NH3 source.
Work at seaGaseous NH3 and particulate NH4
+ in the lower atmosphere was sampled on the latitudinal transects of Polarstern PS116 from Bremerhaven to Cape Town. Generally, all sampling was carried out only when the horizontal relative wind came from about ± 80 degrees against the ship’s course to avoid sampling of ship´s emissions. The backward trajectories of the air masses reaching Polarstern will be taken from DWD analysis and synoptic charts on board (Fig. 5.2).
For NH3- and NH4
+ concentration and ∂ 15N-NH3 and ∂ 15N-NH4+ isotope measurements the
NH4+ and NH3-gas molecules were accumulated on filter pack systems (90 mm diameter).
The filter pack system consists of 4 stages with one teflon-membrane filter on the first stage to collect particles followed by three membrane filters acidified with citric acid to absorb ammonia in its gas phase (Fig. 5.1). Six individual stand-alone systems (filter pack, gas pump, gas meter, wind direction controller and an impactor) were installed on the deck above the bridge. If the relative wind was blowing from about ± 100 degrees against the ship’s course a further filter pack system could be installed at the aft. The filters will be stored in 50 ml PE bottles at temperatures slightly above freezing point, to avoid cell brake up. The third NH3 absorption filters in the filter packs will serve as blank values. Depending on the NH4
+ mass found on each NH4
+ -particle filter and on each NH3 ammonia filter the solutions of filters will be bulked or kept individually and used for NH4-N - and NH3-N isotope analyses on land.
A high – volume impactor sampler (approx. 70 m3 h-1) with 5 stages will collect size – fractionated airborne particles (Marple and Willeke 1976) which we use also for isotope analyses for the different particle size ranges. Each stage of the impactor (10 µm to > 0.1 µm radius) is covered with a teflon foil and a teflon membrane filter (filter Ø = 20 cm, particle r < 0.1 µm radius) that serves as back-up. The impactor is installed in the container on the monkey deck above the bridge and controlled by a wind vane. The direction of the intake opening is fixed with respect to the ship’s axis. The aerosol filters will be stored in 50 ml PE bottles at temperature slightly above freezing point to prevent lysis of microbiological cells.

23
Atmospheric Gaseous Ammonia and Particulate Ammonium
Some of the filter pack systems will be equipped in the first stage with glass-fiber membranes to collect air-borne microbes. The filters have been pre-sterilized at home prior to the sampling at 400°C overnight in an oven to burn all contaminating organic material. We want to detect biodiversity and community structures of air-borne microbes above the Atlantic Ocean and how these structures change from North to South along the transect. Additionally, we investigate whether these microbes are of marine or terrestrial origin by using Hysplit backward trajectory models of the National Oceanic and Atmospheric Administration (NOAA 2018). Possible correlations concerning microbial biodiversity and the distance to the continents as well as the origin of air masses might reveal whether the air represents just a means of transportation or a real microbial habitat. The determination of the species level occurs on extracted 16S DNA, thus, in order to avoid contamination the extraction will be carried out at home in sterile environment and the samples onboard will be stored at -80 C and on dry ice upon return
Preliminary resultsMeasurements were constantly taken during PS116, except during stops when relative wind direction or speed did not meet requirements and samples could have been contaminated by ship´s emissions. The weather respectively the relative wind direction was optimal throughout great parts of the cruise, i.e. the wind met almost constantly the front of the vessel. Only for
Fig. 5.1: (a) tubes gathering and leading the airflow into the impaktor; (b) impaktor inside the container; (c) four filter pack systems.
5.1.a) 5.1.b)
5.1.c)

24
PS116
the first three days after docking in Las Palmas the wind blew from the aft and sampling had to be stopped on the monkey deck. Therefore two filter pack systems with pumps and gas meters were installed in the aft of the working deck for sampling. After 2 days the wind direction changed again, but the filter packs remained on the working deck for further sampling. The collected samples might serve as positive control of our sampling systems since, presumably, particles of the ship´s emissions were collected on these filters. A thick brown layer of particles was observed which is not present on the sampled filters on the monkey deck.
Fig. 5.2 a and b: Examples of daily ordered backward trajectories from the National Oceanic and Atmospheric Administration (NOAA) of air masses for 72 hours in three different altitudes (50 m,
500m, and 1000 m asl) from November 27 (a; left) and December 1 (b; right).
In total, ten measurements of the size-fractionizing impactor have been carried out with a total volume of 11336.5 m3 of pumped air, resulting in the collection of 50 samples (40 sliced teflon foil filters and 10 cellulose back-up filters).
The collection of gaseous Ammonia and particulate Ammonium have been carried out nine times with a total volume of roughly 11.9 x 10⁶ m3 of pumped air. 300 cellulose filters, 20 glass-fibre filters and 60 teflon filters for aerosols were collected throughout the cruise.
Atmospheric air samples were collected on a daily basis on the monkey deck as well as in the pCO2 device where the air is in equilibrium with the collected sea water. These samples will be investigated toward the isotope ratio of δ13C and δ15N.
-18 -17 -16 -15 -14 -13 -12
1
2
3
4
5
76 78 80 82 84
78
06 0011/27
18 12 06 0011/26
18 12 06 0011/25
18 12 06 0011/24
18
NOAA HYSPLIT MODEL Backward trajectories ending at 1200 UTC 27 Nov 18
GDAS Meteorological Data
Sour
ceat
4
.35
N
15.5
8 W
REL
HU
MID
Job ID: 156217 Job Start: Wed Nov 28 10:57:33 UTC 2018Source 1 lat.: 4.349350 lon.: -15.579083 hgts: 50, 500, 1000 m AGL
Trajectory Direction: Backward Duration: 24 hrsVertical Motion Calculation Method: Model Vertical VelocityMeteorology: 0000Z 22 Nov 2018 - GDAS1
-4 -2 0 2 4 6
-20
-18
-16
-14
-12
77 79 81 83 85
83
12 06 0012/03
18 12 06 0012/02
18 12 06 0012/01
18 12 06 0011/30
NOAA HYSPLIT MODEL Backward trajectories ending at 1700 UTC 03 Dec 18
GDAS Meteorological Data
Sour
ceat
13
.47
S
1.16
WR
ELH
UM
ID
Job ID: 177300 Job Start: Tue Dec 4 10:27:04 UTC 2018Source 1 lat.: -13.469220 lon.: -1.161400 hgts: 50, 500, 1000 m AGL
Trajectory Direction: Backward Duration: 24 hrsVertical Motion Calculation Method: Model Vertical VelocityMeteorology: 0000Z 1 Dec 2018 - GDAS1

25
Atmospheric Gaseous Ammonia and Particulate Ammonium
Tab. 5.1: Overview of the sampling success
Sampling date air volume type of sampling
system start end m3
Filter pack 13.11.2018 13.11.2018 negative controls
13.11.2018 13.11.2018 negative controls
14.11.2018 17.11.2018 1.2 x 10⁶ sampling with 8 filter pack systems
15.11.2018 15.11.2018 negative control on working deck
15.11.2018 15.11.2018 negative controls
15.11.2018 17.11.2018 220.269 sampling with 8 filter pack systems
24.11.2018 29.11.2018 402.786 sampling with 4 filter pack systems on working deck
26.11.2018 30.11.2018 0.4 x 10⁶ sampling with 4 filter pack systems
30.11.2018 05.12.2018 10.4 x 10⁶ sampling with 8 filter pack systems
05.12.2018 09.12.2018 ~10 x 106 sampling with 8 filter pack systems
Impactor 13.11.2018 13.11.2018 39.4 impactor leaked
14.11.2018 17.11.2018 -5176.2 connection between pump and gas meter leaked
26.11.2018 30.11.2018 -2268.7 realized that gas meter counts backwards, although it is connected correctly
30.11.2018 03.12.2018 -1962.7 Pump is misspoled, hence corrected
03.12.2018 04.12.2018 2113.7
04.12.2018 05.12.2018 2085.4
05.12.2018 07.12.2018 2783.8 several stops, therefore longer sampling
07.12.2018 08.12.2018 1797.5
08.12.2018 09.12.2018 ~2000
Data managementData processing will be carried out after the wet-chemical measurements of the samples. However, this will take several months, since the samples remain onboard in storage upon return of the vessel to Bremerhaven in July 2019. As soon as the data is available it can be requested and used by other cruise participants.

26
PS116
ReferencesBell Th (2006) Dimethylsulfide and ammonia in remote marine regions – an Atlantic Meriodinal Transect
study. Diss. Univ. East Anglia.
Beilke S, Gravenhorst G (1978) Heterogeneous SO2-oxidation in the droplet phase. Atmospheric Environment 12, 231-239.
Dentener FJ, Crutzen P (1994) A three-dimensional model of the global ammonia cycle, J. Atm. Chem., 4, 331-369.
Gravenhorst G (1975) The sulphate component in aerosol samples over the North Atlantic Meteor-Forschungsergebnisse, Reihe B, No. 10, page 22-31.
Gravenhorst G (1978) Maritime sulfate over the north Atlantic. Atmospheric environment, Vol 12, page 707-713.
Gravenhorst G (1983) Der Einfluss von Wolken und Niederschlag auf die vertikale Verteilung atmosphärischer Spurenstoffe in einem eindimensionalen reaktionskinetischem Modell. Berichte des Instituts für Meteorologie und Geophysik, Nr. 52.
Gravenhorst et al. (1998) Inorganic nitrogen in marin aerosol, Proc. Aerosols in Science, Medicine , and Technology, 7th Conf. GAF, Duesseldorf, 183-187.
Hillamo R. et al. (1998) Mass size distribution and precursor gas concentrations of major inorganic ions in Antarctic aerosols. Intern. J. Env. Analytical Chem. 71, 3 - 4, 353 – 372.
Ibrom A, Qi L, Cai Y, Bredemeier M, Gravenhorst G (1991) Reaktive Stickstoffkomponenten über dem Nordatlantik. Abschlussbericht, DFG Az. Gr 738/6-1.
Johnson MT et al. (2008) Field observations of the ocean-atmosphere exchange of ammonia: Fundamental importance of temperature as revealed by a comparison of high and low latitudes, Global Biogeochemical Cycles, 22, 1.
Junge Ch (1963) Air Chemistry and Radioactivity. Ac. Press, New York and London.
Marple VA, Willeke K (1976) Impactor design. Atmospheric Environment, 10, 891-896.
Schaefer P, Kreilein H, Mueller M, Gravenhorst G (1993) Cycling of inorganic nitrogen compounds between atmosphere and ocean in tropical areas off South East Asia SCOPE/UNEP Heft 76, 19-36.
Sievering H et al. (1999) O3 oxidation of SO2 in sea salt aerosol water: Size distribution of non-sea-salt Sulphur during the First Aerosol Characterization Experiment (ACE 1). J. Geophys. Res. 104, NO D 17, 21707-21717.

27
6. ATMOSPHERIC MEASUREMENTS OF AEROSOLS AND CLOUDS WITH A MOBILE SEA FACILITY OCEANETAndreas Macke (not on board)1, Ronny Engelmann (not on board)1, Hartwig Deneke 1(not on board), Karsten Hanbuch1, Alina Herzog1, Nils Küchler2, Kevin Ohneiser1
1TROPOS2Uni Köln
Grant-No. AWI_PS116_00
ObjectivesThe OCEANET-ATMOSPHERE project gathers and delivers valuable atmospheric measurement datasets over the oceans – in regions of the world that are not easily accessible. For the last 8 years, a container-based platform has been operated regularly on board of Polarstern to obtain measurements and contrast atmospheric processes between the anthropogenic polluted northern hemisphere and the rather pristine southern hemisphere.
The OCEANET container contains several remote-sensing instruments. The primary instrument is a semi-autonomous multiwavelength polarization Raman-LIDAR developed at TROPOS. It is capable to measure backscattering coefficient profiles at three wavelengths (1,064 nm, 532 nn and 355 nm), the extinction coefficient, depolarization ratio at two wavelengths as well as the water-vapor mixing ratio.
Aerosol particle optical properties can be determined directly and serve as input for height-resolved inversion methods to estimate the main microphysical properties (e.g. size distribution) at any measured height. Thus, lofted free-tropospheric aerosol layers can be characterized separately from the marine boundary layer. Typical known free-tropospheric aerosols are anthropogenic emissions from North America, dust from the Saharan region or smoke from biomass burning in Central Africa. These aerosols are lifted up above land and are transported over the Atlantic Ocean for several days. During this transport aerosols influence the radiation budget of the Earth. Thus, the height-resolved information as derived from LIDAR is a crucial input for radiative transfer calculations to determine the direct aerosol radiative effect more precisely. In addition, the height-resolved measurements offer the opportunity to determine the extent of simultaneously occurring clouds, as well as the cloud’s thermodynamic state of phase (liquid or solid) to investigate aerosol-cloud interactions and to determine the aerosol indirect radiative effect.
The second major instrument is a microwave radiometer (MWR, type: HATPRO) measuring brightness temperatures in the microwave region and using absorption bands of water vapor and oxygen, as well as the liquid water continuum to retrieve the integrated water vapor (IWV), temperature profiles up to 10 km altitude, and the liquid water path (LWP). In combination with the variability of the downward radiative quantities these time series make it possible to observe small scale atmospheric structures and cloud inhomogeneity.

28
PS116
A prototype of an automated motion stabilized sun photometer (type: CIMEL CE318-T) was tested during PS113. For PS116 this prototype was upgraded with new hardware as well as improved software. Here the functionality and stability of this platform was tested. Due to its nine channels it will offer the opportunity to apply more sophisticated retrievals, motion-corrected scanning capabilities and an anti-sea spray system.
Additionally, a scalable automatic weather station (SCAWS) from the DWD measures standard parameters such as temperature, pressure, humidity, and radiation (solar and infrared) on a 1-s time basis.
Four hand-held sun photometers (3x Type Microtops, 1x Type Calitoo) delivered additional data regarding the Aerosol Optical Thickness (AOD) of the atmosphere. The objective was to compare the performance of the two TROPOS instruments and the one instrument of University of university of Lille with one calibrated instrument from NASA as well as measurement of the AOD. In addition, the data of the CIMEL mounted on the container is used as reference.
Polarstern was also used to validate the recently launched European Space Agency (ESA) LIDAR-satellite Aeolus. Therefore, the ship was navigated into the overpass flight path of the satellite so that measurements taken by the remote sensing equipment on board can be compared to the satellite derived data.
Work at seaThe instrument set-up and initial calibration started call to port at Bremerhaven on 9 November and was finished on 10 November. The container was located on the helicopter deck (Fig. 6.1). All the observations were taken en-route and did not depend on any station time, though the ships speed was adjusted to match the Aeolus flight path. Regular maintenance procedures included daily cleaning of the radiation sensors and the All-Sky-Camera dome. The LIDAR windows were also cleaned on a regular basis depending on sea-spray or dust contamination. At high sun elevations the LIDAR system had to be turned off manually to protect the optical photomultipliers. All sensory data was monitored constantly to ensure high quality data.
Fig. 6.1: Location of the OCEANET container on the helideck

29
6. Atmospheric Measurements of Aerosols and Clouds with a Mobile Sea Facility OCEANET
Additionally, atmospheric data were taken manually and regularly using the Microtops and Calitoo instruments when sky condition were clear.
Expected and preliminary resultsMeasurements were constantly taken during PS116, except the stay in Las Palmas harbour and within the 200 miles area around South Africa due to governmental restrictions of Spain and South Africa.
Please refer to the cruise weather report for information on the weather and therefore measurement conditions throughout the transfer,
A first measurement example is shown in Fig 6.2. It is a very important and interesting time period as there is a large amount of Saharan dust as well as different types of clouds. On 23 November many low clouds (Cumulus and Stratus) between 1 and 3 km height appeared. From the low depolarization ratio but high backscatter signal it can be concluded that it is pure liquid water clouds. On 25 November the ground distance of the clouds increased, cirrus and altostratus clouds were observed. As an indicator, the higher depolarization ratio shows that those clouds were ice containing (mixed phase) clouds. Later, between the 25 and 27 November, a Saharan dust layer occurred reaching heights from close to the surface and up to 4 km. In the same time, photometer measurements were conducted during cloud free situations measuring a large amount of Saharan dust aerosols too.
The cruise from Bremerhaven to Cape Town is a suitable route in order to study the influence of different types of aerosols in different climate zones on ice forming in cloud. Future studies concerning all the data will focus on clouds and aerosols, as an example the amount of clouds containing ice in dependence on the temperature and the aerosol type.
Fig. 6.2: Measurement example of lidar measurement from 23 to 27 November on Polarstern (top: backscatter signal, bottom: depolarization ratio).

30
PS116
Additional radiosondes were launched when necessary in order to obtain wind information for the validation of the recently launched ESA satellite Aeolus. For the German initiative EVAA (Experimental Validation and Assimilation of Aeolus observations), responsible for the validation of wind and aerosol products of Aeolus, the cruise was a unique opportunity to obtain ground-based remote sensing data across the Atlantic Ocean. During the cruise four fitting overpasses of Aeolus within 60 km to the satellites ground track and two additional overpasses with distances over 100 km were reached.
The microwave radiometer was calibrated with a high-precision blackbody target providing measurement accuracies of 0.5 K and better, and a very low noise level enabling the observation of small scale variations of IWV and LWP of +- 0.5 g m-2 and +- 0.1 g m-2. A preliminary check of the calibration was performed by observing the calibration scenes. All channels showed the expected scene temperatures for a period of several minutes.
Fig. 6.3 shows time series of IWV, LWP, and 0 °C and -11 °C isoline altitudes obtained by the MWR for 23 to 27 November. The increase of the isolines‘ heights in the beginning of the measurement period indicates the crossing of the Ferell-Hadley cell boundary, which is also reflected by an increasing IWV.
The results obtained from LIDAR data correspond well with the data of the MWR. The LWP shows the presence of clouds with LWP up to 0.5 kg m-2 between 23 and 25 November. The presence of ice on the 25th is supported by the height of the -11°C isoline that is located around 6 km altitude. The Saharan dust period was associated low LWP values due to the absence of low clouds. However, the LWP was above zero coinciding with the presence of high clouds indicating the presence of liquid in these clouds.
Fig. 6.3: Integrated water vapour (top), heights of 0°C and -11°C isolines (middle) and liquid water path (bottom) retrieved by the MWR.
Data managementAll data processing will be carried out at TROPOS in Leipzig. The primary address for the data access should therefore be TROPOS but as soon as the data are available they can be used by other cruise participants after request. Additionally, it is foreseen to upload the quality checked data to the PANGAEA repository. However, this data processing and upload procedure might take a few months.

31
7. DATA ACQUISITION OF A COMBINED NEUTRON MONITOR AND MUON TELESCOPE ON BOARD POLARSTERN Bernd Heber1 (not on board), Michael Walter2 (not on board), Juliana Stachurska2
1Uni Kiel 2DESY
Grant-No. AWI_PS116_00
ObjectivesTo study the variation of the cosmic neutron and muon spectra in dependence on a large latitude range (Winkler 2010), to study the dependence of the cosmic ray flux on solar activity (Heber 2013) and the Earth magnetosphere (Matthiä et al. 2013). The latitudinal modulation of the count rate is a measure of the detector sensitivity (Caballero-Lopez and Moraal 2012, see also Mishev et al. 2013). Previous trips have shown that the sensitivity of the mini-neutron monitor is good, but needed to be improved on in case of the muon telescope. Therefore, the new muon telescope (Haungs et al. 2014) was installed in 2017, the software of which needed to be updated to enable a for-pressure and for-temperature correction of the count rate in a timely manner.
Work at seaThere is a mini-neutron monitor as well as a muon telescope installed on board of the Polarstern, that measure the fluxes of these secondary particles produced in cosmic ray interactions in the atmosphere.
The intensity of galactic cosmic rays entering the atmosphere is modulated by solar activity and the Cut-Off rigidity (Galsdorf 2014). As the cut-off rigidity rises from 3 GV at Bremerhaven up to 15 GV in equatorial regions before decreasing again to 5 GV at Cape Town, data taken onboard the Polarstern during the Atlantic passage can help us to better understand the rigidity spectrum of Ground Level Enhancements. Both detectors monitor the particle fluxes over a long time period, and can measure the modulation of the count rates as a function of the solar cycle.
The muon and neutron count rate also depends on meteorological parameters, such as air pressure and temperature. Therefore, the data taken needs to be corrected (see Röntgen 2013), making a precise knowledge of the conditions at the time of data taking important. Transfer of the weather data from the meteorological station on board and transfer of the ship position data to the notebook running the muon telescope had been established and the incoming weather and ship position data reduced and combined with the data taken by the muon telescope. Further, a new device was installed which measures the pressure and temperature close to the muon telescope and mini-neutron monitor. Also here, the data is reduced on-site and combined with the previously mentioned measurements. The pressure and temperature readout and reduction has been automatized in a similar manner to the muon data taking and reduction and the data transfer from the Polarstern to DESY updated accordingly. Now, both detectors are expected to work fully autonomously. Pre-analysis of the data taken confirms data quality and stability.
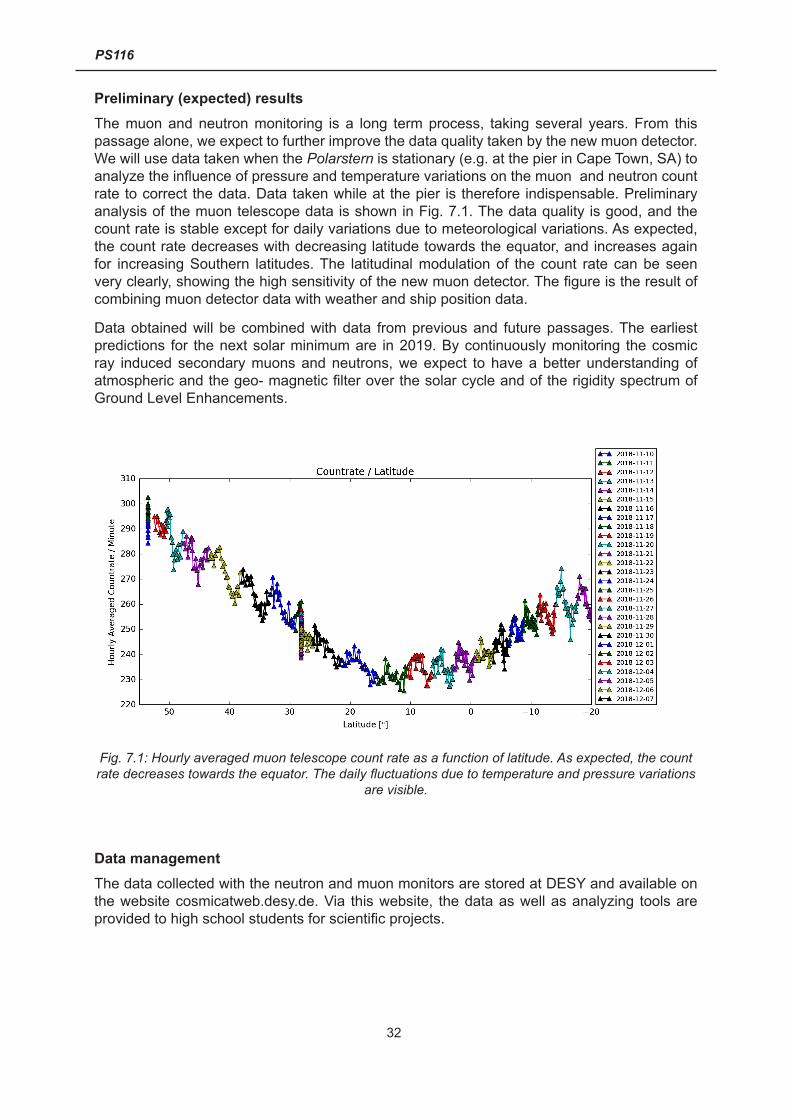
32
PS116
Preliminary (expected) resultsThe muon and neutron monitoring is a long term process, taking several years. From this passage alone, we expect to further improve the data quality taken by the new muon detector. We will use data taken when the Polarstern is stationary (e.g. at the pier in Cape Town, SA) to analyze the influence of pressure and temperature variations on the muon and neutron count rate to correct the data. Data taken while at the pier is therefore indispensable. Preliminary analysis of the muon telescope data is shown in Fig. 7.1. The data quality is good, and the count rate is stable except for daily variations due to meteorological variations. As expected, the count rate decreases with decreasing latitude towards the equator, and increases again for increasing Southern latitudes. The latitudinal modulation of the count rate can be seen very clearly, showing the high sensitivity of the new muon detector. The figure is the result of combining muon detector data with weather and ship position data.
Data obtained will be combined with data from previous and future passages. The earliest predictions for the next solar minimum are in 2019. By continuously monitoring the cosmic ray induced secondary muons and neutrons, we expect to have a better understanding of atmospheric and the geo- magnetic filter over the solar cycle and of the rigidity spectrum of Ground Level Enhancements.
Fig. 7.1: Hourly averaged muon telescope count rate as a function of latitude. As expected, the count rate decreases towards the equator. The daily fluctuations due to temperature and pressure variations
are visible.
Data managementThe data collected with the neutron and muon monitors are stored at DESY and available on the website cosmicatweb.desy.de. Via this website, the data as well as analyzing tools are provided to high school students for scientific projects.

33
7. Data Acquisition of a Combined Neutron Monitor and Muon Telescope on Board Polarstern
References
Caballero-Lopez RA & Moraal H (2012) Cosmic-ray yield and response functions in the atmosphere. Journal of Geophysical Research (Space Physics), 117(A), 12103.
Galsdorf D (2014) Cutoff-Steifigkeiten und Asymptotische Richtungen sowie ihre Parameter. Kiel.
Haungs A, Karg T, Kleifges M & Nahnhauer R (2014) Introducing TAXI: A Transportable Array for eXtremely large area Instrumentation studies. To be submitted.
Heber B (2013) Cosmic Rays Through the Solar Hale Cycle. Insights from Ulysses. Space Science Reviews, 176, 265–278.
Matthiä D et al. (2013) 10Be Production in the Atmosphere by Galactic Cosmic Rays. Space Science Reviews, 176, 333–342.
Mishev AL, Usoskin IG & Kovaltsov GA (2013) Neutron monitor yield function: New improved computations. Journal of Geophysical Research (Space Physics), 118(6), 2783–2788.
Röntgen M (2013) Datenaufbereitung, -analyse und barometrische Kalibration eines mobilen Neutronenmonitors. Kiel: Christian-Albrechts-Universität zu Kiel.
Winkler B (2010) Richtungsverteilung und asymptotische Richtung der kosmischen Strahlung. Kiel.
34
8. SYSTEM-TESTING OF A COMBINED LAUNCH AND RECOVERY SYSTEM (LARS) AND DEPRESSOR WITH UNDERWATER PULLEY FOR TOWED VEHICLES AND OTHER MEASURING SYSTEMS Sören Krägefsky1, Johannes Lemburg1 (not on board), Christoph Otto2 (not on board), Vincent Abel1, Levy Hoffmann1
1AWI2Uni Rostock
Grant-No. AWI_PS116_00
Objectives Polar life depends on the production of micro algae, which is closely coupled to sea ice dynamics. Accordingly, this coupling is also shown by the behaviour and distribution of polar animals.
Quasi synoptic measurements of physical, chemical and biological parameters underneath the sea ice are vital to gain fundamental insight and understanding of processes in the polar regions.
These measurements need a synergistic integration of different sensors. Due to the high carrier capacity, permanent power supply (long operating time) and data communication abilities (high resolution measurements) via the towing cable, towed vehicles are particularly suited for the measuring task. In ice-covered areas, however, towed devices are in danger to be damaged and ruptured by the sea ice. Deployment of towed systems in these areas needs special deployments methods and deployment apparatus.
A combined launch and recovery system (LARS) and depressor with underwater pulley is under development, allowing secure deployment of towed undulating vehicles and other towed measuring systems. During the cruise, sea trials were performed to test the behaviour of the LARS/depressor and its impact on the flight performance of a towed system, giving information needed for further improvement of the LARS/Depressor.
Work at sea The LARS/Depressor system was deployed with help of the A-Frame of Polarstern. During the tests a dummy simulating a towed sensor platform was used. Forces and flight behaviour were measured and recorded. Tests of the flight behaviour were performed at different towing speeds (1,5 - 4 kn) at two stations for about 3.5 hours in total.
Preliminary (expected) results Tests show a stable flight behaviour of the LARS/Depressor without negative impact on the flight behaviour of the towed vehicle. The system allows secure routing of the towing cable from the A-Frame down the ice free close vicinity of the ship, redirected by the pulley of the depressor to the towed vehicle underneath the ice.
Data management
Data recorded during the test only serves improvement of the system under development.

35
9. ARGO-FLOAT DEPLOYMENT Sören Krägefsky1, Anja Schneehorst2 (not on board), Simon Tewes2 (not on board), Vincent Abel1, Levy Hoffmann1
1AWI2BSH
Grant-No. AWI_PS116_00
Objectives The main objective of the Argo programme is to provide a quantitative description of the evolving state of the upper 2,000 m of the ocean by collecting profiles of temperature and salinity from the surface to 2,000 m. Argo data is used for initialization of ocean and coupled (ocean atmosphere) forecast models, data assimilation and dynamical model testing. It has been demonstrated that the assimilation of Argo data in the models improved weather and climate forecast. Profiling float data have an enormous range of applications. The more distinctive categories for Argo data use are: educational uses, operational uses and research uses.
Work at sea Argo floats were deployed at five different positions along the cruise track of the ship from Bremerhaven to Cape Town at positions (3°N; 14.5°W), (0°; 12°W), (3°S;-10°W),(6°S;-8°W) and (9°S;5°W), respectively. Pre-deployment tests were performed. All floats were deployed successfully.
Preliminary (expected) results Argo floats will deliver profiles of temperature and salinity measurements in the upper 2,000 m of the water column while drifting. Data will be used among others for assimilation in weather and climate forecast models.
Data management Data will be made available by Argo for educational, operational and research use.

36
10. LOGISTICS AND SAFETYVerena Mohaupt, Bjela König AWI
Grant-No. AWI_PS116_00
Objectives Two members of the AWI Logistics department joined Polarstern on the way from Las Palmas to Cape Town to get to know the existing processes on board regarding research work. Main goal is the development of a standardized safety concept for the MOSAiC project and expeditions in general.
Work at sea
The main work was the observation of all research related processes on board and development of a wording for the expedition handbook. Further logistic resources, constraints and possibilities on board have been explored in order to give best advice to the MOSAiC teams and to coordinate the storage, lab and workspace distribution.
Preliminary (expected) results Expedition handbook, containing all requirements and necessary information for cruise leaders, co-leaders and participants.
Data management There was no data acquisition for scientific outcomes.
37
11. DATA CENTRE ACTIVITIES DURING PS116 Stephan Frickenhaus, Roland Koppe, Jörg Matthes, Tilman Dinter, Peter Gerchow, Antonia Immerz
AWI
Grant-No. AWI_PS116_00
Objectives Setup and test of IT-infrastructure components (hardware and software) handling the dataflow during the MOSAiC expedition 09/2019 – 09/2010. Components realize registration, storage, display and linkage of (meta) data obtained from sampling and measurement events.
Work at sea The team of computer specialists installed and integrated software and hardware components of the O2A (Observation to Archive) framework into the Polarstern IT-infrastructure in preparation for the MOSAiC drift experiment. Preliminary tests with incoming data during ship movements were performed. The MCS (MOSAiC Central Storage) was configured and tested during this cruise. Preparations were made to connect the DShip-System to the Sensor-Metadata-Information System. A marketplace to configure on the fly virtual machines is part of the new IT-system to support analysis of scientific data during MOSAiC. An offline repository was initialised containing software packages and operating system distributions available during the MOSAiC expedition. Data were analysed with scripts using provided software packages to test the accessibility of measurement data and compatibility and coverage of repository. Transfer rates for satellite data products from AWI to Polarstern were evaluated. Representation of these products and test cases for different file formats were implemented on the Mapviewer-System for navigation and scientific purposes. Devices available in DSHIP were registered in the Sensor-Metadata-Information System. The compatibility of both systems was evaluated. The IT-infrastructure was discussed and analysed with IT-personel and nautical staff on board Polarstern.
Preliminary results Detailed tests of the installed infrastructure need to be performed prior to MOSAiC. Training of crew members in the concepts and usage of the newly installed infrastructure is crucial to enable smooth workflows on board.
Data management Data recorded during installation of IT-infrastructure only serves for setup and test of the system under real conditions.

38
APPENDIX A.1 PARTICIPATING INSTITUTIONS A.2 CRUISE PARTICIPANTS A.3 SHIP’S CREW A.4 STATION LIST

39
A.1 TEILNEHMENDE INSTITUTE / PARTICIPATING INSTITUTIONS
Address
AWI Alfred-Wegener-Institut Helmholtz-Zentrum für Polar- und Meeresforschung Postfach 120161 27515 Bremerhaven Germany
BSH Bundesamt für Seeschifffahrt und Hydrographie Bernhard-Nocht-Straße 78 20359 Hamburg Germany
DESY Deutsches Elektronen-Synchrotron Platanenallee 6 15738 Zeuthen Germany
DWD Deutscher Wetterdienst Geschäftsbereich Wettervorhersage Seeschifffahrtsberatung Bernhard-Nocht-Str. 76 20359 Hamburg Germany
HU Berlin Humboldt Universität Berlin Unter den Linden 6 10099 Berlin Germany
TROPOS Leibniz-Institut für Troposphärenforschung Permoserstr. 15 04318 Leipzig Germany
Uni Bremen Universität Bremen Fachbereich Geowissenschaften Klagenfurter Str. 2-4 28359 Bremen Germany

40
PS116
Address
Uni Göttingen Georg-August Universität Göttingen Abteilung Bioklimatologie Büsgenweg 2 37077 Göttingen Germany
Uni Hannover Leibniz Universität Hannover Institut für Bodenkunde Herrenhäuser Str. 2 30167 Hannover Germany
Uni Kiel Christian-Albrechts-Universität zu Kiel Institut für Experimentelle und Angewandte Physik Leibnizstr. 19 24118 Kiel Germany
Uni Köln Universität Köln Institut für Geophysik und Meteorologie Pohligstraße 3 50969 Köln Germany
Uni Oviedo Unidersidad de Oviedo Facultad de Medicina C/ Julian Claveria s/n 33006 Oviedo Spain
Uni Rostock Universität Rostock Oskar-Kellner-Institut Justus-von-Liebig-Weg 2 18059 Rostock Spain

41
A.2 FAHRTTEILNEHMER / CRUISE PARTICIPANTS
No. Name /Last name
Vorname / First name
Institut /Institution
Beruf / Profession
Fachrichtung /Scientific Field
1§ Abel Vincent AWI Technician Engineering Sc.
2* Aladesanmi Taiwo Uni Bremen Student Geophysics
3* Anhaus Philipp AWI PhD Student Physics
4* Arndt Jan-Erik AWI Scientist Geophysics
5* Beamish Alison AWI Scientist Biology
6 Boy Diana Uni Hannover Student Geosciences
7* Brand Marc Uni Bremen Student Geosciences
8* Diekstall Denise AWI Technician Geology
9* Dinter Tilman AWI Scientist Physics
10* Dreutter Simon AWI Technician Geophysics
11* Fahmy Ahmed Uni Bremen Student Geology
12* Farag Mohamed Uni Bremen Student Geophysics
13* Frickenhaus Stephan AWI Scientist Mathematics
14* Fuchs Niels AWI PhD Student Meteorology
15 Garcia-Vazquez Eva Uni Oviedo, ES Scientist Biology
16* Gebhardt Catalina AWI Scientist Geophysics
17* Geils Jonah Uni Bremen Student Geophysics
18* Gerchow Peter AWI Engineer Logistics
19* Hamelberg Tim Freelancer Photographer Public Outreach
20§ Hanbuch Karsten TROPOS Engineer Engineering Sc.
21* Hanfland Claudia AWI Scientist Geology
22 Heimsch Florian Uni Göttingen PhD student Geosciences
23 Hempelt Juliane DWD Technician Meteorology
24 Herzog Alina TROPOS Student Meteorology
25§ Hoffmann Levy AWI Student Engineering Sc.
26* Hossain Akil AWI PhD Student Physics
27§ Immerz Antonia AWI Scientist Logistics
28* Klages Johann AWI Scientist Geology
29§ König Bjela AWI Engineer Logistics
30* Koppe Roland AWI Scientist Engineering Sc.
31§ Krägefsky Sören AWI Scientist Logistics

42
PS116
No. Name /Last name
Vorname / First name
Institut /Institution
Beruf / Profession
Fachrichtung /Scientific Field
32 Küchler Nils Uni Köln PhD Student Meteorology
33* Lamping Nele AWI PhD Student Geology
34* Leng Yue Uni Bremen Student Geophysics
35* Martinez Mariano AWI PhD Student Biology
36* Mattes Jörg AWI Engineer Engineering Sc.
37§ Mohaupt Verena AWI Scientist Logistics
38* Niessen Frank AWI Scientist Geophysics
39 Ohneiser Kevin TROPOS Student Meteorology
40 Pavlak Johanna Uni Bremen Student Geophysics
41 Peters Manno DWD Scientist Meteorology
42* Reuter Runa Uni Bremen Student Geology
43* Rick Johannes AWI Scientist Biology
44* Schwamborn Georg AWI Scientist Geology
45* Sierra Lombera Uni Bremen Student Geophysics
46* Soliman Abdelrahman Uni Bremen Student Geophysics
47* Spotowitz Lisa AWI PhD Student Biology
48 Stachurska Juliana DESY PhD Student Physics
49* Stein Christian HU Berlin Photographer Public Outreach
50 Teufel Hannelore Observer Logistics
51* Unger-Moreno Katharina Uni Bremen Student Geosciences
52* Vorrath Elena AWI PhD Student Geology
53* Zubkova Aleksandra Uni Bremen Student Geology
(*) disembarkation in Las Palmas(§) boarding in Las Palmas
43
A.3 SCHIFFSBESATZUNG / SHIP’S CREW
Bremerhaven - Las Palmas (and the same crew as below)Name Rank
1 Wunderlich, Thomas Master2 Langhinrichs, Moritz Chiefmate
Las Palmas - Cape TownName Rank
1 Langhinrichs, Moritz Master2 Spielke, Steffen Chiefmate3 Kentges, Felix 1st Mate4 Fischer, Tibor 2nd Mate5 Neumann, Ralph Peter 2nd Mate6 Ziemann, Olaf Hermann Aug. Chief7 Grafe, Jens 2nd Eng.8 Haack, Michael Detlev 2nd Eng.9 Krinfeld, Oleksandr 2nd Eng.10 Redmer, Jens E-Eng.11 Hofmann, Walter Jörg Chief ELO12 Ganter, Armin ELO13 Himmel, Frank ELO14 Hüttebräucker, Olaf ELO15 Nasis, llias ELO16 Rudde-Teufel, Claus Friedrich Ships doc17 Loidl, Reiner Bosun18 Reise, Lutz Carpen19 Brück, Sebastian MP Rat.20 Klee, Philipp MP Rat.21 Möller, Falko MP Rat.22 Neubauer, Werner MP Rat.23 Bäcker, Andreas AB24 Hans, Stefan AB25 Wende, Uwe AB26 Preußner, Jörg Storek27 Gebhardt, Norman MP Rat28 Luckhardt, Arne MP Rat29 Plehn, Markus MP Rat30 Rhau, Lars-Peter MP Rat31 Schwarz, Uwe MP Rat

44
PS116
Name Rank32 Schnieder, Sven Cook33 Möller, Wolfgang Hans Cooksm.34 Silinski, Frank Cooksm.35 Czyborra, Bärbel Chief Stew.36 Wöckener, Martina Nurse37 Chen, Dansheng 2nd Stew.38 Dibenau, Torsten 2nd Stew.39 Nagel, Jens 2nd Stew.40 Silinski, Carmen 2nd Stew.41 Sun, Yong Sheng 2nd Stew.42 Ruan, Hui Guang Laundrym.43 Kreutzmann, Lennart Apprent.44 Peper, Sven Apprent.

46
A. 4 STATIONSLISTE / STATION LISTStation Date Time Latitude Longitude Depth
[m]Gear Action Comment
PS116_0_Underway-1
2018-11-11 13:31 53,56852 8,55365 2,9 WST profile start
Start after Bhv. WST is being operated permanently and hence does not require termination. WST station no will be issued and attributed automatically to ecvery new cruise by DShip, and hence does not require a „Profile End“
PS116_0_Underway-1
2018-11-22 10:41 27,98520 -15,26823 933 WST profile start
Start after Las Palmas
PS116_0_Underway-2
2018-11-18 07:14 28,17156 -15,27161 1850 ADCP_150 profile end
profile start on 12.11., not clear why it is not recorded
PS116_0_Underway-2
2018-11-22 10:47 27,96192 -15,26710 854 ADCP_150 profile start
Start after Las Palmas
PS116_0_Underway-2
2018-12-10 06:24 -31,98267 14,67369 NA ADCP_150 profile end
End before Cape Town
PS116_0_Underway-3
2018-11-12 12:48 51,85359 2,53582 31,4 FBOX profile start
Start after Bhv
PS116_0_Underway-3
2018-11-18 07:14 28,17156 -15,27161 1850 FBOX profile end
End before Las Palmas
PS116_0_Underway-3
2018-11-22 10:55 27,92877 -15,26814 735 FBOX profile start
Start after Las Palmas
PS116_0_Underway-3
2018-12-10 06:25 -31,98372 14,67572 NA FBOX profile end
End before Cape Town
PS116_0_Underway-4
2018-11-11 13:34 53,57011 8,55345 2 MAG profile start
PS116_0_Underway-4
2018-11-12 08:11 52,91880 3,24378 22,3 MAG profile end
PS116_0_Underway-5
2018-11-12 12:48 51,85359 2,53582 31,4 PCO2_GO profile start
Start after Bhv
PS116_0_Underway-5
2018-11-18 07:14 28,17156 -15,27161 1850 PCO2_GO profile end
End before Las Palmas
PS116_0_Underway-5
2018-11-22 10:55 27,92877 -15,26814 735 PCO2_GO profile start
Start after Las Palmas
PS116_0_Underway-5
2018-12-10 06:25 -31,98399 14,67625 NA PCO2_GO profile end
End before Cape Town
PS116_0_Underway-6
2018-11-12 12:48 51,85359 2,53582 31,4 PCO2_SUB
profile start
Start after Bhv
PS116_0_Underway-6
2018-11-18 07:14 28,17156 -15,27161 1850 PCO2_SUB
profile end
End before Las Palmas
PS116_0_Underway-6
2018-11-22 10:55 27,92877 -15,26814 735 PCO2_SUB
profile start
Start after Las Palmas
PS116_0_Underway-6
2018-12-10 06:26 -31,98561 14,67947 NA PCO2_SUB
profile end
End before Cape Town

47
A. 4 Stationsliste / Station List
Station Date Time Latitude Longitude Depth [m]
Gear Action Comment
PS116_0_Underway-7
2018-11-12 15:38 51,37169 1,87807 31,2 TSG_KEEL profile start
Start after Bhv
PS116_0_Underway-7
2018-11-18 07:14 28,17156 -15,27161 1850 TSG_KEEL profile end
End before Las Palmas
PS116_0_Underway-7
2018-11-22 13:02 27,57724 -15,57443 544 TSG_KEEL profile start
Start after Las Palmas
PS116_0_Underway-7
2018-11-23 09:21 24,86636 -20,14804 3965 TSG_KEEL profile end
terminated due to maintenance
PS116_0_Underway-7
2018-11-23 14:23 23,62776 -20,35618 4010 TSG_KEEL profile start
Start after maintenance
PS116_0_Underway-7
2018-12-10 06:24 -31,98304 14,67440 NA TSG_KEEL profile end
End before Cape Town
PS116_0_Underway-8
2018-11-12 15:38 51,37169 1,87807 31,2 TSG_KEEL_2
profile start
Start after Bhv
PS116_0_Underway-8
2018-11-18 07:14 28,17156 -15,27161 1850 TSG_KEEL_2
profile end
End before Las Palmas
PS116_0_Underway-8
2018-11-22 13:02 27,57724 -15,57443 544 TSG_KEEL_2
profile start
Start after Las Palmas
PS116_0_Underway-8
2018-11-23 09:21 24,86636 -20,14804 3965 TSG_KEEL_2
profile end
terminated due to maintenance
PS116_0_Underway-8
2018-11-23 14:23 23,62776 -20,35618 4010 TSG_KEEL_2
profile start
Start after maintenance
PS116_0_Underway-8
2018-12-10 06:25 -31,98347 14,67524 NA TSG_KEEL_2
profile end
End before Cape Town
PS116_0_Underway-9
2018-11-12 08:34 52,83501 3,18496 19,4 GRAV profile end
restart as Underway-11
PS116_0_Underway-10
2018-11-11 13:33 53,56977 8,55350 2,1 HVAIR profile start
PS116_0_Underway-10
2018-11-12 08:11 52,91815 3,24334 22,4 HVAIR profile end
PS116_0_Underway-11
2018-11-12 09:07 52,71072 3,11772 20,2 GRAV profile start
Start after Bhv
PS116_0_Underway-11
2018-11-18 07:14 28,17156 -15,27161 1850 GRAV profile end
End before Las Palmas
PS116_0_Underway-11
2018-11-22 10:41 27,98520 -15,26823 933 GRAV profile start
Start after Las Palmas
PS116_0_Underway-11
2018-12-10 06:27 -31,98611 14,68050 NA GRAV profile end
End before Cape Town
PS116_0_Underway-12
2018-11-12 09:07 52,71072 3,11772 20,2 MAG profile start
Start after Bhv
PS116_0_Underway-12
2018-11-18 07:14 28,17156 -15,27161 1850 MAG profile end
End before Las Palmas
PS116_0_Underway-12
2018-11-22 10:41 27,98520 -15,26823 933 MAG profile start
Start after Las Palmas
PS116_0_Underway-12
2018-12-10 06:27 -31,98648 14,68125 NA MAG profile end
End before Cape Town
48
PS116
Station Date Time Latitude Longitude Depth [m]
Gear Action Comment
PS116_0_Underway-13
2018-11-12 09:07 52,71072 3,11772 20,2 HVAIR profile start
Start after Bhv
PS116_0_Underway-13
2018-11-18 07:14 28,17156 -15,27161 1850 HVAIR profile end
End before Las Palmas
PS116_0_Underway-13
2018-11-22 10:41 27,98520 -15,26823 933 HVAIR profile start
Start after Las Palmas
PS116_0_Underway-13
2018-12-10 06:26 -31,98582 14,67992 NA HVAIR profile end
End before Cape Town
PS116_0_Underway-14
2018-11-11 15:15 53,64566 8,41744 11,6 OCEANET station start
PS116_0_Underway-14
2018-11-11 15:15 53,64566 8,41744 11,6 OCEANET profile start
Start after Bhv
PS116_0_Underway-14
2018-11-12 08:30 52,85208 3,19619 18,1 OCEANET profile end
End before Las Palmas
PS116_0_Underway-14
2018-11-12 09:30 52,62284 3,08746 23,5 OCEANET profile start
Start after Las Palmas
PS116_0_Underway-14
2018-11-18 07:14 28,17156 -15,27161 1850 OCEANET profile end
terminated due to maintenance
PS116_0_Underway-14
2018-11-22 10:41 27,98520 -15,26823 933 OCEANET profile start
Start after maintenance
PS116_0_Underway-14
2018-12-10 06:26 -31,98502 14,67827 NA OCEANET profile end
End before Cape Town
PS116_0_Underway-14
2018-12-10 06:27 -31,98673 14,68179 NA OCEANET station end
PS116_0_Underway-15
2018-11-12 09:30 52,62284 3,08746 23,5 HS station start
Start after Bhv
PS116_0_Underway-15
2018-11-12 09:30 52,62284 3,08746 23,5 HS profile start
PS116_0_Underway-15
2018-11-18 07:14 28,17156 -15,27161 1850 HS profile end
End before Las Palmas
PS116_0_Underway-15
2018-11-22 14:52 27,34770 -16,00213 504 HS profile start
Start after Las Palmas
PS116_0_Underway-15
2018-12-09 19:14 -31,18179 12,99930 3370 HS profile end
End before Cape Town
PS116_0_Underway-15
2018-12-09 19:14 -31,18199 12,99933 3370 HS station end
PS116_0_Underway-16
2018-11-12 09:30 52,62284 3,08746 23,5 PS station start
PS116_0_Underway-16
2018-11-12 09:30 52,62284 3,08746 23,5 PS profile start
Start after Bhv
PS116_0_Underway-16
2018-11-18 07:14 28,17156 -15,27161 1850 PS profile end
End before Las Palmas
PS116_0_Underway-16
2018-11-22 14:51 27,34888 -16,00013 506 PS profile start
Start after Las Palmas
PS116_0_Underway-16
2018-12-09 19:14 -31,18113 12,99916 3381 PS profile end
End before Cape Town

49
A. 4 Stationsliste / Station List
Station Date Time Latitude Longitude Depth [m]
Gear Action Comment
PS116_0_Underway-16
2018-12-09 19:14 -31,18121 12,99917 3385 PS station end
PS116_0_Underway-17
2018-11-22 10:43 27,97949 -15,26776 1002 SVP profile start
PS116_0_Underway-17
2018-12-10 06:24 -31,98212 14,67265 NA SVP profile end
PS116_1-1 2018-11-14 06:42 46,21892 -7,96379 4776 HN station start
PS116_1-1 2018-11-14 06:48 46,21961 -7,96395 4778 HN station end
PS116_1-2 2018-11-14 06:49 46,21968 -7,96397 4778 SVP station start
PS116_1-2 2018-11-14 07:49 46,21935 -7,96416 4776 SVP at depth
PS116_1-2 2018-11-14 08:56 46,21941 -7,96426 4777 SVP station end
PS116_2-1 2018-11-15 14:00 40,19829 -11,74080 5161 UCTD station start
PS116_2-1 2018-11-15 14:20 40,13236 -11,76283 5161 UCTD station end
PS116_3-1 2018-11-16 11:04 35,67430 -13,14440 4876 UAV station start
PS116_3-1 2018-11-16 11:08 35,67581 -13,14411 4872 UAV station end
PS116_3-2 2018-11-16 11:09 35,67596 -13,14403 4875 HN station start
PS116_3-2 2018-11-16 11:11 35,67644 -13,14364 4878 HN station end
PS116_3-3 2018-11-16 11:13 35,67669 -13,14344 4874 UCTD station start
PS116_3-3 2018-11-16 11:23 35,67823 -13,14180 4870 UCTD station end
PS116_4-1 2018-11-17 09:07 31,80204 -14,22775 4291 HN station start
PS116_4-1 2018-11-17 09:09 31,80189 -14,22743 4292 HN station end
PS116_4-2 2018-11-17 09:10 31,80205 -14,22720 4294 UCTD station start
PS116_4-2 2018-11-17 09:26 31,79922 -14,22610 4287 UCTD station end
PS116_5-1 2018-11-18 09:26 28,12620 -15,35431 709 UAV station start
PS116_5-1 2018-11-18 09:41 28,12607 -15,35439 708 UAV station end
PS116_6-1 2018-11-27 21:51 2,99962 -14,49986 4715 FLOAT station start

50
PS116
Station Date Time Latitude Longitude Depth [m]
Gear Action Comment
PS116_6-1 2018-11-27 21:51 2,99957 -14,49982 4715 FLOAT station end
PS116_6-2 2018-11-27 21:56 2,99679 -14,49967 4750 HN station start
PS116_6-2 2018-11-27 21:56 2,99661 -14,49967 4881 HN station start
Start twice
PS116_6-2 2018-11-27 21:56 2,99633 -14,49966 4822 HN station end
3x Handnet in a row
PS116_6-2 2018-11-27 21:57 2,99562 -14,49959 4750 HN station start
PS116_6-2 2018-11-27 21:58 2,99509 -14,49947 4743 HN station end
PS116_6-2 2018-11-27 21:59 2,99437 -14,49922 4750 HN station start
PS116_6-2 2018-11-27 22:00 2,99367 -14,49886 4750 HN station end
PS116_6-3 2018-11-27 22:04 2,99051 -14,49576 4718 UCTD station start
PS116_6-3 2018-11-27 22:20 2,97353 -14,48173 4748 UCTD station end
PS116_7-1 2018-11-28 19:15 -0,00057 -11,99893 3986 FLOAT station start
PS116_7-1 2018-11-28 19:16 -0,00117 -11,99879 3980 FLOAT station end
PS116_8-1 2018-11-29 13:14 -2,74555 -10,27572 3697 LARS-D station start
PS116_8-1 2018-11-29 14:20 -2,79327 -10,25143 3544 LARS-D station end
PS116_9-1 2018-11-29 16:48 -2,99889 -9,99995 3882 FLOAT station start
PS116_9-1 2018-11-29 16:49 -2,99959 -9,99955 3917 FLOAT station end
PS116_9-2 2018-11-29 16:50 -3,00025 -9,99941 3929 HN station start
3x Handnet in a row
PS116_9-2 2018-11-29 16:51 -3,00060 -9,99941 3935 HN station end
PS116_9-2 2018-11-29 16:52 -3,00112 -9,99948 3931 HN station start
PS116_9-2 2018-11-29 16:53 -3,00148 -9,99958 3947 HN station end
PS116_9-2 2018-11-29 16:54 -3,00202 -9,99976 3939 HN station start
PS116_9-2 2018-11-29 16:55 -3,00258 -9,99986 3944 HN station end
PS116_9-3 2018-11-29 16:57 -3,00466 -9,99871 3996 UCTD station start

51
A. 4 Stationsliste / Station List
Station Date Time Latitude Longitude Depth [m]
Gear Action Comment
PS116_9-3 2018-11-29 17:08 -3,01749 -9,99058 4113 UCTD station end
PS116_10-1 2018-11-30 11:46 -5,24116 -8,50680 3972 LARS-D station start
PS116_10-1 2018-11-30 15:36 -5,44718 -8,35187 3845 LARS-D station end
PS116_11-1 2018-11-30 20:23 -6,00052 -7,99949 4398 FLOAT station start
PS116_11-1 2018-11-30 20:23 -6,00056 -7,99947 4395 FLOAT station end
PS116_11-2 2018-11-30 20:25 -6,00268 -7,99894 4349 HN station start
3x Handnet in a row
PS116_11-2 2018-11-30 20:26 -6,00325 -7,99888 4402 HN station end
PS116_11-2 2018-11-30 20:27 -6,00366 -7,99885 4411 HN station start
PS116_11-2 2018-11-30 20:27 -6,00389 -7,99885 4410 HN station end
PS116_11-2 2018-11-30 20:28 -6,00425 -7,99886 4402 HN station start
PS116_11-2 2018-11-30 20:28 -6,00452 -7,99888 4404 HN station end
PS116_11-3 2018-11-30 20:35 -6,00943 -7,99730 4409 UCTD station start
PS116_11-3 2018-11-30 20:47 -6,02091 -7,98354 4705 UCTD station end
PS116_12-1 2018-12-02 01:48 -8,99627 -5,00380 4487 FLOAT station start
PS116_12-1 2018-12-02 01:49 -8,99644 -5,00366 4472 FLOAT station end
PS116_13-1 2018-12-03 15:00 -13,31997 -1,45411 5616 HN station start
4x Handnet in a row
PS116_13-1 2018-12-03 15:01 -13,32045 -1,45374 5623 HN station end
PS116_13-1 2018-12-03 15:01 -13,32073 -1,45355 5619 HN station start
PS116_13-1 2018-12-03 15:02 -13,32103 -1,45336 5626 HN station end
PS116_13-1 2018-12-03 15:02 -13,32140 -1,45315 5636 HN station start
PS116_13-1 2018-12-03 15:03 -13,32180 -1,45299 5629 HN station end
PS116_13-1 2018-12-03 15:06 -13,32470 -1,45204 5684 HN station start
PS116_13-1 2018-12-03 15:07 -13,32584 -1,45147 5710 HN station end

52
PS116
Station Date Time Latitude Longitude Depth [m]
Gear Action Comment
PS116_13-2 2018-12-03 15:09 -13,32826 -1,45005 5721 UCTD station start
PS116_13-2 2018-12-03 15:20 -13,34177 -1,44211 5771 UCTD station end
PS116_14-1 2018-12-05 15:00 -19,96985 4,45101 5409 HN station start
3x Handnet in a row
PS116_14-1 2018-12-05 15:02 -19,97133 4,45173 5412 HN station end
PS116_14-1 2018-12-05 15:02 -19,97165 4,45188 5413 HN station start
PS116_14-1 2018-12-05 15:03 -19,97221 4,45214 5412 HN station end
PS116_14-1 2018-12-05 15:03 -19,97252 4,45229 5411 HN station start
PS116_14-1 2018-12-05 15:04 -19,97283 4,45242 5410 HN station end
PS116_14-2 2018-12-05 15:06 -19,97436 4,45317 5413 UCTD station start
PS116_14-2 2018-12-05 15:16 -19,98550 4,46228 5410 UCTD station end
PS116_15-1 2018-12-06 08:14 -22,49226 6,47644 2551 ROV station start
ROV 3x deployed under varying conditions
PS116_15-1 2018-12-06 10:02 -22,49031 6,46622 2542 ROV station end
PS116_16-1 2018-12-06 13:09 -22,63460 6,84821 1146 ROV station start
PS116_16-1 2018-12-06 13:47 -22,63373 6,84612 1115 ROV station end
PS116_16-1 2018-12-06 13:51 -22,63341 6,84592 1149 ROV station start
PS116_16-1 2018-12-06 14:16 -22,62987 6,84458 1166 ROV station end
PS116_17-1 2018-12-07 08:23 -24,37544 7,96409 4734 HN station start
3x Handnet in a row
PS116_17-1 2018-12-07 08:24 -24,37589 7,96321 4733 HN station end
PS116_17-1 2018-12-07 08:25 -24,37616 7,96274 4737 HN station start
PS116_17-1 2018-12-07 08:26 -24,37644 7,96226 4734 HN station end
PS116_17-1 2018-12-07 08:26 -24,37673 7,96180 4735 HN station start
PS116_17-1 2018-12-07 08:27 -24,37700 7,96138 4739 HN station end
PS116_17-2 2018-12-07 08:33 -24,38118 7,96356 4735 UCTD station start

53
A. 4 Stationsliste / Station List
Station Date Time Latitude Longitude Depth [m]
Gear Action Comment
PS116_17-2 2018-12-07 08:45 -24,39127 7,97675 4732 UCTD station end
PS116_18-1 2018-12-08 08:31 -26,90178 9,78274 4816 HN station start
3x Handnet in a row
PS116_18-1 2018-12-08 08:32 -26,90216 9,78244 4812 HN station end
PS116_18-1 2018-12-08 08:32 -26,90230 9,78230 4813 HN station start
PS116_18-1 2018-12-08 08:33 -26,90249 9,78206 4814 HN station end
PS116_18-1 2018-12-08 08:33 -26,90270 9,78179 4926 HN station start
PS116_18-1 2018-12-08 08:34 -26,90320 9,78106 4814 HN station end
PS116_18-2 2018-12-08 08:39 -26,90710 9,78171 4814 UCTD station start
PS116_18-2 2018-12-08 08:50 -26,91537 9,79418 4814 UCTD station end
PS116_19-1 2018-12-09 08:30 -29,82008 11,93110 3960 HN station start
Start twice
PS116_19-1 2018-12-09 08:30 -29,82031 11,93066 3961 HN station start
3x Handnet in a row
PS116_19-1 2018-12-09 08:31 -29,82063 11,92999 3959 HN station end
PS116_19-1 2018-12-09 08:31 -29,82080 11,92965 3957 HN station start
PS116_19-1 2018-12-09 08:32 -29,82107 11,92905 3960 HN station end
PS116_19-1 2018-12-09 08:32 -29,82127 11,92861 3962 HN station start
PS116_19-1 2018-12-09 08:33 -29,82158 11,92792 3957 HN station end
PS116_19-2 2018-12-09 08:40 -29,82585 11,92922 3960 UCTD station start
PS116_19-2 2018-12-09 08:49 -29,83045 11,94096 3956 UCTD station end
last station before Cape Town
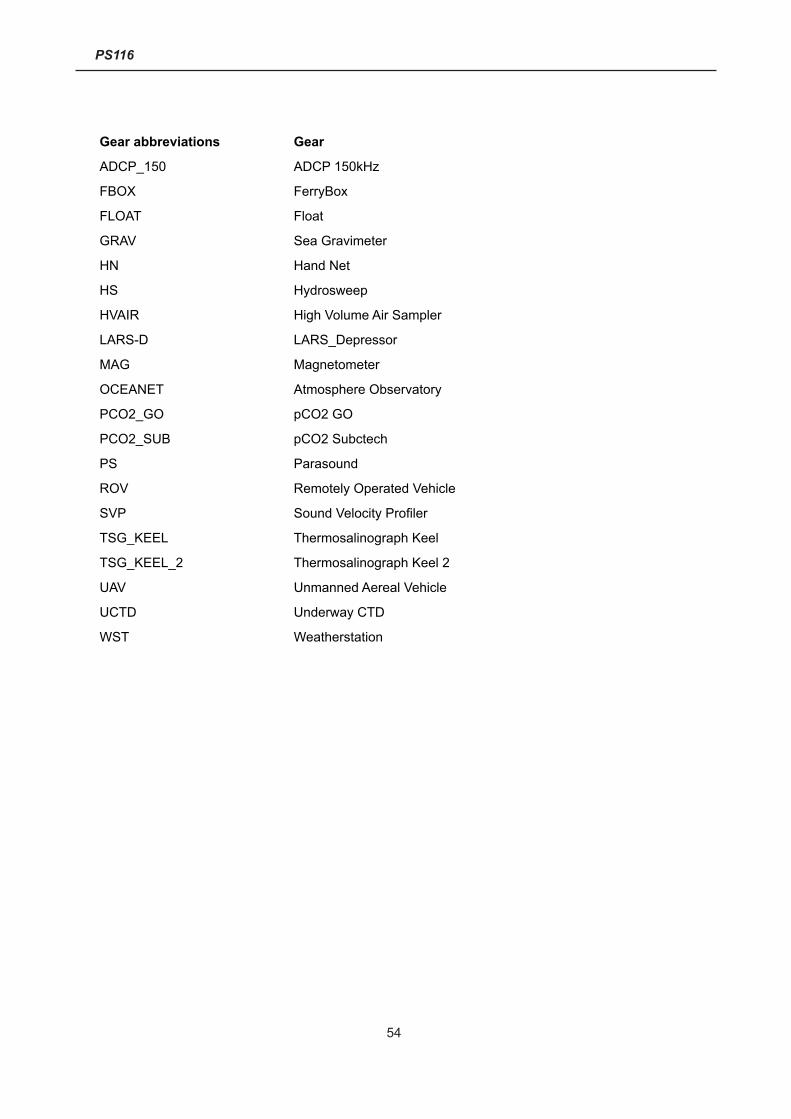
54
PS116
Gear abbreviations Gear
ADCP_150 ADCP 150kHz
FBOX FerryBox
FLOAT Float
GRAV Sea Gravimeter
HN Hand Net
HS Hydrosweep
HVAIR High Volume Air Sampler
LARS-D LARS_Depressor
MAG Magnetometer
OCEANET Atmosphere Observatory
PCO2_GO pCO2 GO
PCO2_SUB pCO2 Subctech
PS Parasound
ROV Remotely Operated Vehicle
SVP Sound Velocity Profiler
TSG_KEEL Thermosalinograph Keel
TSG_KEEL_2 Thermosalinograph Keel 2
UAV Unmanned Aereal Vehicle
UCTD Underway CTD
WST Weatherstation
731 (2019) The Expedition PS116 of the Research Vessel POLARSTERN to the Atlantic Ocean in 2018, edited by Claudia Hanfland and Bjela König
730 (2019) The Expedition PS110 of the Research Vessel POLARSTERN to the Atlantic Ocean in 2017/2018, edited by Frank Niessen
729 (2019) The Expedition SO261 of the Research Vessel SONNE to the Atacama Trench in the Pa-cific Ocean in 2018, edited by Frank Wenzhöfer
728 (2019) The Expedition PS115/2 of the Research Vessel POLARSTERN to the Arctic Ocean in 2018, edited by Ruediger Stein
727 (2019) The Expedition PS115/1 of the Research Vessel POLARSTERN to the Greenland Sea and Wandel Sea in 2018, edited by Volkmar Damm
726 (2019) The Expedition PS108 of the Research Vessel POLARSTERN to the Fram Strait and the AWI-HAUSGARTEN in 2017, edited by Frank Wenzhöfer
725 (2018) Russian-German Cooperation: Expeditions to Siberia in 2017, edited by Jens Strauss, Julia Boike, Dmitry Yu. Bolshiyanov, Mikhail N. Grigoriev, Hassan El-Hajj, Anne Morgenstern, Pier Paul Overduin, Annegret Udke
724 (2018) The Expedition PS113 of the Research Vessel POLARSTERN to the Atlantic Ocean in 2018, edited by Volker Strass
723 (2018) The Expedition PS114 of the Research Vessel POLARSTERN to the Fram Strait in 2018, edited by Wilken-Jon von Appen
722 (2018) The Expedition PS112 of the Research Vessel POLARSTERN to the Antarctic Peninsula Region in 2018, edited by Bettina Meyer and Wiebke Weßels
721 (2018) Alfred Wegener im 1. Weltkrieg. Ein Polarforscher und die „Urkatastrophe des 20. Jahrhunderts“, by Christian R. Salewski
Die Berichte zur Polar- und Meeresforschung (ISSN 1866-3192) werden beginnend mit dem Band 569 (2008) als Open-Access-Publikation herausgegeben. Ein Verzeichnis aller Bände ein-schließlich der Druckausgaben (ISSN 1618-3193, Band 377-568, von 2000 bis 2008) sowie der früheren Berichte zur Polarforschung (ISSN 0176-5027, Band 1-376, von 1981 bis 2000) befindet sich im electronic Publication Informa-tion Center (ePIC) des Alfred-Wegener-Instituts, Helmholtz-Zentrum für Polar- und Meeresfor-schung (AWI); see http://epic.awi.de. Durch Aus-wahl “Reports on Polar- and Marine Research“ (via “browse”/”type”) wird eine Liste der Publi-kationen, sortiert nach Bandnummer, innerhalb der absteigenden chronologischen Reihenfol-ge der Jahrgänge mit Verweis auf das jeweilige pdf-Symbol zum Herunterladen angezeigt.
Zuletzt erschienene Ausgaben:
The Reports on Polar and Marine Research (ISSN 1866-3192) are available as open access publications since 2008. A table of all volumes in-cluding the printed issues (ISSN 1618-3193, Vol. 377-568, from 2000 until 2008), as well as the earlier Reports on Polar Research (ISSN 0176-5027, Vol. 1-376, from 1981 until 2000) is pro-vided by the electronic Publication Information Center (ePIC) of the Alfred Wegener Institute, Helmholtz Centre for Polar and Marine Research (AWI); see URL http://epic.awi.de. To generate a list of all Reports, use the URL http://epic.awi.de and select “browse”/ ”type” to browse ”Reports on Polar and Marine Research”. A chronological list in declining order will be presented, and pdf-icons displayed for downloading.
Recently published issues:

BREMERHAVEN
Am Handelshafen 12 27570 BremerhavenTelefon 0471 4831-0Telefax 0471 4831-1149www.awi.de