Web-oriented GIS system for monitoring, conservation and law enforcement of the Brazilian Amazon
11
RESEARCH ARTICLE Web-oriented GIS system for monitoring, conservation and law enforcement of the Brazilian Amazon Carlos Moreira Souza Jr. & Kátia Pereira & Victor Lins & Sanae Haiashy & Daniel Souza Received: 1 June 2009 / Accepted: 25 September 2009 / Published online: 1 December 2009 # Springer-Verlag 2009 Abstract A web GIS (WGIS) system for the Brazilian Amazon, named ImazonGeo and based on open source and public domain data, is presented. ImazonGeo was built following three principles. First, the system is based on Spatial Data Infrastructure architecture and web interface built using free software and public domain data. Second, we went beyond visualization of maps and spatial queries by providing information obtained with spatial analysis models. To do that, we designed a database that stores the results of previously defined spatial analyses and developed customized reports and query tools to facilitate fast access of information by end-users. Finally, the system is application-oriented in the areas of forest monitoring, conservation and forest law enforcement, meaning that it aims to contribute to support the protection of Brazilian Amazon forests. We illustrate these principles by presenting ImazonGeo’ s technology, architecture, content and tools. Moreover, we present two successful cases to demonstrate how the system is being used. We conclude the paper discussing the challenges and potential solutions to turning our WGIS-SDI system into an internet hub of geo- information about the Brazilian Amazon. Keywords Amazon . Conservation . Monitoring . Spatial data infrastructure . Web GIS Introduction The Brazilian Amazon rainforests, hereafter referred to as the Amazon, covers an area of 4.1 millions square kilometers, harboring 40% of the global tropical forests with rich biodiversity of plants and animals, and a vast array of environmental services and natural resources (Foley et al. 2007). This region has been threatened by deforestation and selective logging over the past 50 years. Currently, about 20 percent, i.e. 800 thousand square kilometers (Inpe 2009), of the original Amazon rainforests have been converted to cattle ranching, large scale mechanized agriculture, small scale slash-and-burn agricul- ture, tree plantations and other forms of land use (Laurance et al. 2004), (Fearnside 2005). Moreover, selective logging and forest fires have impoverished these forests by reducing carbon stocks, causing local tree species extinction and decreasing animal biodiversity by hunting (Asner et al. 2005; Nepstad et al. 1999, Peres et al. 2006). The pattern of economic and human development has been well docu- mented, showing slight improvement after the deforestation process followed by a decline a few decades later with the depletion of forest resources. This pattern follows a boom- and-bust cycle and has been demonstrated in the scientific literature (Schneider et al. 2002). A large amount of spatial and aspatial information on human footprint, biodiversity, infrastructure and socioeco- nomic and biophysical variables (i.e., soil and forest types, biomass, rainforest, topography, among others) is available for the Amazon region from different sources. For example, the National Research Space Agency (Inpe – Instituto Nacional de Pesquisas Espaciais) provides spatially ex- plicit deforestation polygons for the Brazilian Amazon on an annual basis (Inpe 2009) and on fire hot spots. Socioeconomic information on commodity prices, demog- Communicated by: H.A. Babaie SI: Spatial data infrastructures for the Amazon: a first step towards a Global Forest Information System C. M. Souza Jr. (*) : K. Pereira : V. Lins : S. Haiashy : D. Souza Instituto do Homem e Meio Ambiente da Amazônia – Imazon, Caixa Postal 5101, Belém, PA, 66613-397 Brasil e-mail: [email protected] Earth Sci Inform (2009) 2:205–215 DOI 10.1007/s12145-009-0035-6
-
Upload
independent -
Category
Documents
-
view
2 -
download
0
Transcript of Web-oriented GIS system for monitoring, conservation and law enforcement of the Brazilian Amazon

RESEARCH ARTICLE
Web-oriented GIS system for monitoring, conservationand law enforcement of the Brazilian Amazon
Carlos Moreira Souza Jr. & Kátia Pereira & Victor Lins &
Sanae Haiashy & Daniel Souza
Received: 1 June 2009 /Accepted: 25 September 2009 /Published online: 1 December 2009# Springer-Verlag 2009
Abstract A web GIS (WGIS) system for the BrazilianAmazon, named ImazonGeo and based on open source andpublic domain data, is presented. ImazonGeo was builtfollowing three principles. First, the system is based onSpatial Data Infrastructure architecture and web interfacebuilt using free software and public domain data. Second,we went beyond visualization of maps and spatial queriesby providing information obtained with spatial analysismodels. To do that, we designed a database that stores theresults of previously defined spatial analyses and developedcustomized reports and query tools to facilitate fast accessof information by end-users. Finally, the system isapplication-oriented in the areas of forest monitoring,conservation and forest law enforcement, meaning that itaims to contribute to support the protection of BrazilianAmazon forests. We illustrate these principles by presentingImazonGeo’s technology, architecture, content and tools.Moreover, we present two successful cases to demonstratehow the system is being used. We conclude the paperdiscussing the challenges and potential solutions to turningour WGIS-SDI system into an internet hub of geo-information about the Brazilian Amazon.
Keywords Amazon . Conservation .Monitoring .
Spatial data infrastructure .Web GIS
Introduction
The Brazilian Amazon rainforests, hereafter referred to asthe Amazon, covers an area of 4.1 millions squarekilometers, harboring 40% of the global tropical forestswith rich biodiversity of plants and animals, and a vastarray of environmental services and natural resources(Foley et al. 2007). This region has been threatened bydeforestation and selective logging over the past 50 years.Currently, about 20 percent, i.e. 800 thousand squarekilometers (Inpe 2009), of the original Amazon rainforestshave been converted to cattle ranching, large scalemechanized agriculture, small scale slash-and-burn agricul-ture, tree plantations and other forms of land use (Lauranceet al. 2004), (Fearnside 2005). Moreover, selective loggingand forest fires have impoverished these forests by reducingcarbon stocks, causing local tree species extinction anddecreasing animal biodiversity by hunting (Asner et al.2005; Nepstad et al. 1999, Peres et al. 2006). The pattern ofeconomic and human development has been well docu-mented, showing slight improvement after the deforestationprocess followed by a decline a few decades later with thedepletion of forest resources. This pattern follows a boom-and-bust cycle and has been demonstrated in the scientificliterature (Schneider et al. 2002).
A large amount of spatial and aspatial information onhuman footprint, biodiversity, infrastructure and socioeco-nomic and biophysical variables (i.e., soil and forest types,biomass, rainforest, topography, among others) is availablefor the Amazon region from different sources. For example,the National Research Space Agency (Inpe – InstitutoNacional de Pesquisas Espaciais) provides spatially ex-plicit deforestation polygons for the Brazilian Amazon onan annual basis (Inpe 2009) and on fire hot spots.Socioeconomic information on commodity prices, demog-
Communicated by: H.A. Babaie
SI: Spatial data infrastructures for the Amazon: a first step towards aGlobal Forest Information System
C. M. Souza Jr. (*) :K. Pereira :V. Lins : S. Haiashy :D. SouzaInstituto do Homem e Meio Ambiente da Amazônia – Imazon,Caixa Postal 5101,Belém, PA, 66613-397 Brasile-mail: [email protected]
Earth Sci Inform (2009) 2:205–215DOI 10.1007/s12145-009-0035-6

raphy, population growth, gross internal revenue, amongothers, and thematic maps (i.e., vegetation, soil) areavailable from the Brazilian Geography and StatisticsInstitute (IBGE—Instituto Brasileiro de Geografia e Esta-tística). Additionally, several data layers and satelliteimagery data sets are available through Web Map Server(WMS) from different sources (i.e., NASA, Google, amongothers)
These types of spatial and attribute information de-scribed above has been used as a basis for formulating andanalyzing environmental and socioeconomic polices for theAmazon region, such as the impact of building new roads(Laurance et al. 2001; Fearnside 2002); evaluating theeffectiveness of protect areas for conservation of biodiver-sity (Rylands and Brandon 2005; Reid and De Sousa 2005),controlling deforestation by integrating rural propertyboundary and deforestation data layers (Fearnside 2003),zoning areas for sustainable forestry (Verissimo et al. 1998;Verissimo et al. 2002) and modeling future deforestationtrends in the region (Laurance et al. 2001; Soares-Filho etal. 2006). Geographic Information Systems (GIS) have hada crucial role in combining and analyzing information forthese socioeconomic and environmental applications. Theability to organize and access large databases and analyzeand report results of spatial and attribute queries haspositioned GIS as one of the key technologies forunderstanding the status and predicting the fate of theBrazilian Amazon.
More recently, Web-based Geographic Information Sys-tems (WGIS) have become available to facilitate access todigital maps and spatial model results. This represents atremendous step in democratizing access to geographicinformation among different users. WGIS systems for theBrazilian Amazon have spread rapidly on the internet withmost of them focused on visualization of database contentsand attribute query results. Existing WGIS systems for thisregion lack tools for spatial analysis—using different datasources—and quick access to reports containing maps,graphs, text and tabular information. However, there arechallenges to implementing such WGIS tools. First, theWGIS database and metadata must be updated frequently tomake it relevant to end-users interested in monitoring andconversation applications. For example, information on fireand deforestation alerts exists in a daily and monthly basis,respectively, making database update a requirement. Sec-ond, end-users require results of spatial analysis such asdefining deforestation hot spots in protected areas, munic-ipalities, and other geographic units. This type of applica-tion requires performing spatial analysis on-the-fly whichimposes a high demand for internet server to deliver thequery results. Third, there is the requirement to understanduser needs about the information necessary to support their
applications. Therefore, developing a WGIS requires adetailed survey about the demand for spatial informationamong several group of users working on monitoring andconservation fields. Finally, WGIS must be easy-to-use byend-users which usually do not possess background on GISand spatial analysis. For example, some users just need toreceive a deforestation alert report with the location of theevent and ancillary information to access the area. This typeof task must be performed by providing only an e-mailaddress to receive the alert report.
The advent of Spatial Data Infrastructure (SDI) shedlights on how to overcome these challenges. Wikipedia,another powerful tool for democratizing information,defines SDI as ‘… a framework of spatial data, metadata,users and tools that are interactively connected in order touse spatial data in an efficient and flexible way’. (Groot1997) highlights the main purpose of SDI as being toreduce user effort, time and financial resources needed toaccess and use geographic information. In this paper, wepresent a WGIS system developed for the BrazilianAmazon region, named ImazonGeo (www.imazongeo.org.br), whose aim is to go beyond visualization of static datalayers by focusing on user needs for application inmonitoring, environmental law enforcement, conservationand in increasing transparency of governmental informa-tion. To demonstrate how ImazonGeo works, we firstpresent ImazonGeo SDI architecture, database, technologyand tools to facilitate access to information resulting fromspatial analysis. Next, we demonstrate ImazonGeo’sstrengths with two examples of applications: i) monitoringdeforestation and fires; ii) law enforcement of ProtectedAreas. Finally, we conclude this paper with a discussion offuture developments of ImazonGeo and our strategy forengaging end-users to effectively take advantage of thisSDI WGIS system.
ImazonGeo SDI
ImazonGeo SDI is made up of five components: i) Geo-information; ii) Technology; iii) Interface; iv) Tools, and v)User applications (Fig. 1). These components are integratedto respond to three specific objectives of the system. First,develop a robust database to facilitate access to relevantinformation the Brazilian Amazon and of results ofcomplex spatial analysis. Second, develop an affordablesystem based on public domain geo-information databasesand software technologies. Third, provide relevant applica-tions, based on simple and intuitive tools, to supportmonitoring and conservation of the Brazilian Amazonforests. The system components and presented in detailbelow.
206 Earth Sci Inform (2009) 2:205–215

Geo-information
The core component of ImazonGeo is its geo-informationdatabase, which is made up of the main database and thirdparty databases (Fig. 1). The data layers and attributes ofImazonGeo come from different sources and were carefullyselected to enable reporting of human pressure (i.e.,deforestation, fires, socioeconomic drivers and infrastruc-ture) for states, municipalities, Protected Areas and Agrar-ian settlement spatial units or polygons. There are twoclasses of third party databases. The first are thosedatabases accessed only by WMS requests, and includebackground layers such as satellite imagery, topography,and basic cartographic information (i.e., roads, cities, rivers,among others). The second class of third party databasesprovides geo-information to be stored and organized intothe main database of ImazonGeo. The main database wasorganized into six information categories: political, infra-structure, socioeconomic, human pressure, protected areasand biophysical, which are described in detail below(Table 1). We also make reference to the source of thesedata layers and attribute data, and to their associatedmetadata when available.
The political maps available in the main database are thestate and municipal seats and boundaries (IBGE, Table 1).Each state and municipality has a unique identifier (ID) thatallows them to be unequivocally located and to perform map
algebra with a variety of maps stored into the main database.Additionally, the political ID of these polygons is used tolink them to their corresponding socioeconomic information.
The Protected Areas category is composed of maps offederal and state Conservation Units and Indigenous Lands.Users can identify any protected areas by name, type, stateand municipality, and access attribute information on thedate of creation, the tenure status, the size of the areadeclared in the decree of creation and calculated byImazonGeo using GIS tools. The main source of maps forthe Protected Areas is ISA (Instituto Socioambiental) aBrazilian non-governmental organization dedicated tokeeping information about indigenous lands and territoriesof Brazil updated (Table 1). We have also complementedthe maps of protected areas, particularly at the state level,and compiled all the official documents about creation ofthe Protected Areas using different sources from federal andstate agencies (Table 1). The total amount of land in theBrazilian Amazon in the Protected Areas category encom-passes 42% of the Brazilian Amazon. We have also includedthe Military Areas, which account for less than 1.0% of theBrazilian Amazon territory in this category of maps.
Private lands located outside the boundaries of ProtectedAreas belong to the Land Tenure information categorymade up of African-Brazilian lands, agrarian reformsettlements and privately owned lands. The informationon private properties is available only for a small portion of
Fig. 1 ImazonGeo web portal spatial data infrastructure is composed of geo-information, technology, web interface, tools and applications. TheSDI diagram shows how these components are made and how they integrate with each other
Earth Sci Inform (2009) 2:205–215 207

the Brazilian Amazon. For this reason, we have notincluded this map information in ImazonGeo (Table 1).
The Infrastructure information available in the databaseincludes roads, ports and airports. Road maps come fromIBGE which includes the so-called official roads, and fromour research group, which hand-digitized roads built byloggers, gold miners and land speculators (Brandão andSouza 2006). The total unofficial road network addsanother 300 thousand kilometers and is intimately linkedto deforestation and logging, outperforming the length ofofficial roads threefold. We have also included maps ofports, airports, dams, power line grid and gas pipelineswithin the Infrastructure geo-information category (Table 1).
The Biophysical category includes information onRivers, Vegetation types, the boundary of the AmazonBiome and topography. This category of maps can groweasily but we decided to initially maintain only the keyinformation for the current applications available intoImazonGeo (Table 1).
There are several socioeconomic information and mapscurrently available in ImazonGeo. We have prioritizedmaps and socioeconomic indicators that are highly corre-lated with deforestation (Ewers et al. 2008). The mapsinclude cattle ranching centers, as represented by slaugh-terhouse locations, logging centers and mining operationsand reserves. Socioeconomic attribute information bymunicipalities and states is also available within thiscategory, including GDP (Gross Domestic Product), popu-lation size, and human development indicator (Table 1).
The final geo-information category is e Human Pressure.This category is represented by maps of deforestation andactive fire hot spots from different sources. Users ofImazonGeo have three sources of deforestation maps.Prodes and Deter are from Inpe and SAD from Imazon.Prodes is based on the interpretation of Landsat images(pixels size of 30 m) and is available in digital map formatfor 2000 through 2008 on an annual basis. Deter (Sistemade Detecção de Desmatamento em Tempo Real) provides
Table 1 Geo-information content of ImazonGeo by category; types of data layers point to the source and web location
Geo-information Category Data Layer Scale Source http
Political Boundary Municipality 1:1000.000 IBGE ftp://geoftp.ibge.gov.br/../mapas/malhas_digitais
Municipal Seat 1:1000.000 IBGE ftp://geoftp.ibge.gov.br/../mapas/
States 1:1000.000
State capital 1:1000.000
Protected Areas Federal Conservation Units 1:1000.000 Isa www.socioambiental.org
State Conservation Units 1:1000.000 Imazon www.imazon.org.br
Indigenous Lands 1:1000.000
Military Areas 1:1000.000
Land Tenure African Brazilian Lands 1:1000.000 IBGE ftp://geoftp.ibge.gov.br/../mapas/
Agrarian reform settlements 1:250.000 INCRA www.incra.gov.br/portal/
Infrastructure Roads 1:50.000 Imazon www.imazon.org.br
Ports 1:1000.000 IBGE ftp://geoftp.ibge.gov.br/../mapas/
Airports 1:1000.000
Dams 1:1000.000
Biophysical Rivers 1:1000.000 IBGE ftp://geoftp.ibge.gov.br/../mapas/
Vegetation
Amazon Biome 1:2500.000 WWF http://www.wwf.org.br/index.cfm
Topography – Google Physical Google available in the API OpenLayers
Socioeconomic Slaughter Houses 1:1000.000 Imazon v2.imazongeo.org.br/doc/downloads.htm
Logging Centers 1:1000.000
Mining operations 1:1000.000 DNPM http://www.dnpm.gov.br/
Municipal information – IBGE www.ibge.gov.br/cidadesat/
States information – IBGE www.ibge.gov.br/estadosat/
Mining reserves 1:1000.000 IBGE ftp://geoftp.ibge.gov.br/../mapas/
Human Pressure Deforestation – Prodes 1:100.000 INPE www.obt.inpe.br/prodes/index.html
Deforestation – Deter 1:500.000 INPE www.obt.inpe.br/deter/
Deforestation – SAD 1:500.000 Imazon v2.imazongeo.org.br/doc/downloads.htm
Fire hotspots 1:1000.000 INPE sigma.cptec.inpe.br/queimadas/
208 Earth Sci Inform (2009) 2:205–215

deforestation polygons based on Modis (Moderate Resolu-tion Imaging Spectroradiometer; pixel size of 250 m) on amonthly basis. SAD (Sistema de Alerta de Desmatamento)also based on Modis, but using a different algorithm,detects deforestation on a monthly basis as well (Souza etal. 2009). Regarding active fires, ImazonGeo collects andorganizes in its database nineteen sources of informationobtained from different remote sensing satellites andprocessed by other groups (GOES, NOAA, Terra, Aqua,and Meteosat). Because these fire maps are updated ona daily basis, a computer software robot was built toaccess the repositories of these maps, download andorganize them into our geo-database. The robot is asimple script program that accesses database throughhttp (hypertext transfer protocol), fetches the data to ourserver and organize them in our database and performpre-defined spatial analysis.
Technology
The ImazonGeo logical infrastructure is made up ofvarious open source technologies that were integrated indeveloping the system (Fig. 1). Storage and managementof geospatial information is done with the PostgreSQLsoftware—that functions as an Object-Relational DatabaseManagement System (ORDBMS)—and its postGIS exten-sion that allows the use and storage of map and imageobjects. We also utilized MapServer to visualize maps andimages stored in the database on the web. MapServer isalso a free software and serves as a developmentenvironment for constructing spatial applications on theinternet. Regarding hardware technology, ImazonGeodatabase runs in a server with a quad core processor. Tomake the access of spatial queries faster, we saved resultsin cache what requires large amount of disk space to storethese results.
The ImazonGeo web interface was essentially writtenwith PHP dynamic language due to its speed andportability. We also used AJAX (Asynchronous JavascriptAnd XML) techniques, making use of technologies such asJavascript and XML provided by most internet browsers, tomake pages in the system more interactive with the user,utilizing asynchronous information requests.
As the front-end for ImazonGeo, we used the opensource JavaScript library called OpenLayers, a tool forexhibiting spatial data on web pages. OpenLayers has anAPI (Application Programming Interface) for constructingweb-based applications. Openlayers is utilized for exhibit-ing maps and images from the ImazonGeo databaseaccessed using MapServer. It also allows maps to be loadedfrom other data sources such as Web Map Service, WebFeature Service, Google Maps and others. For example, onImazonGeo as a background we used the Google satellite
images and location labels from ImazonGeo WMS GoogleHybrid. The user may use other layers available onImazonGeo as background.
Internet Access service via web browsers is done withthe Apache web page server, which is the most successfulfree web server, besides being one of the most used onesaround the world. ImazonGeo also provides access toshapefiles for downloading information processed byImazon. We also make available for download socioeco-nomic information from states and municipalities in theBrazilian Amazon from 1990 to 2007 (IBGE, Table 1),present in reports on states and municipalities.
Interface
Access to ImazonGeo resources may be done in twoways: through a web browser, or via GIS software withresources for a WMS (MapServer) connection or with apostgreSQL database. In the first access modality, webbrowser, the user of the system has available all of thetools that the system offers. In the second form ofaccess, via WMS or connection with the database, it ispossible to access the ImazonGeo database with GISsoftware that enable that type of connection, allowingthe user to do analysis or consult spatial data in anotherarchitecture with the information available in thepostgreSQL database.
Tools
ImazonGeo user interaction is facilitated by easy-to-usetools that allow visualizing, querying, conducting spatialanalysis and reporting the results. These tools can beaccessed through menus, fields, markers, pop-ups, buttons,layer selections and hyperlinks (Fig. 2). There are fourmajor environment areas in the website. In the upper rightposition users have access to hyperlinks to provideinformation about ImazonGeo, galleries of maps, down-loads of maps, links to data providers and to the Imazonwebsite. Below the hyperlinks follow menus to access mapsof human pressure and results of spatial analysis andapplications (Fig. 2).
All types of maps can be visualized in the map viewarea, directly below the menu area (Fig. 2). There users willfind tools to pan, zoom and get attribute information ongeographic features. On the right of the map view there aretwo areas containing information that users have accessedthrough menus. The top area has table fields that allowusers to refine spatial attribute queries. At the bottom, userscan find different objects such as geographic markers, textobjects with results of local queries, and legends of mapsaccessed through the main menu, among other types ofobjects.
Earth Sci Inform (2009) 2:205–215 209
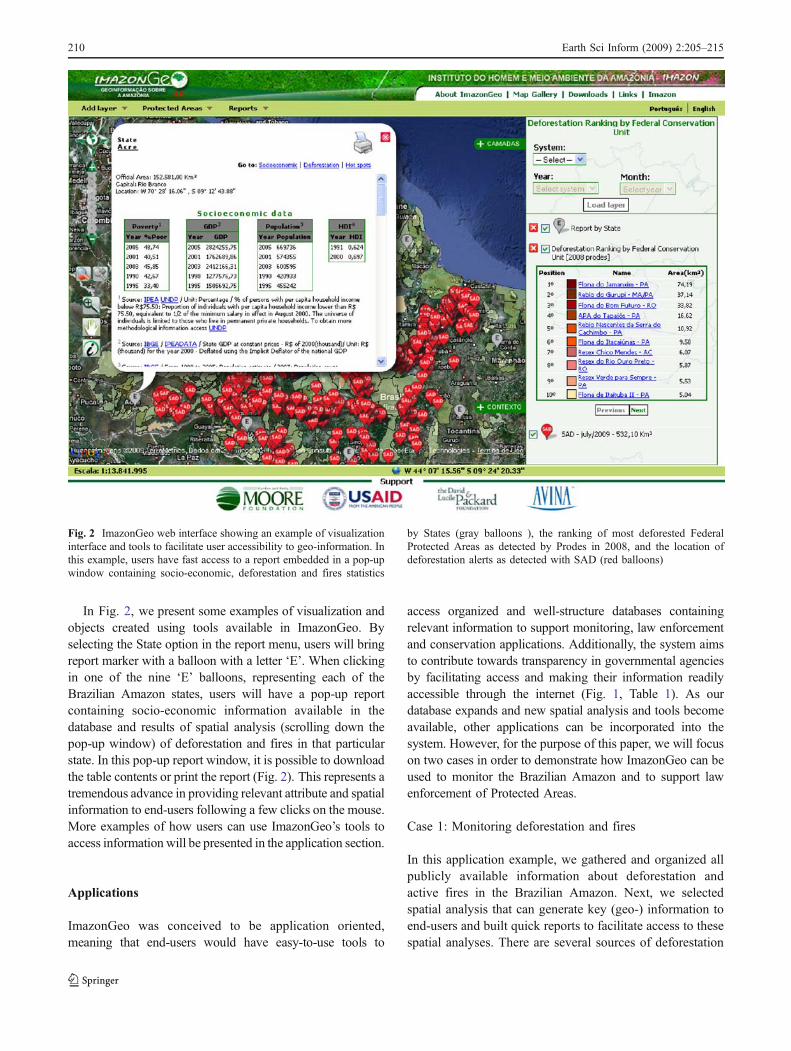
In Fig. 2, we present some examples of visualization andobjects created using tools available in ImazonGeo. Byselecting the State option in the report menu, users will bringreport marker with a balloon with a letter ‘E’. When clickingin one of the nine ‘E’ balloons, representing each of theBrazilian Amazon states, users will have a pop-up reportcontaining socio-economic information available in thedatabase and results of spatial analysis (scrolling down thepop-up window) of deforestation and fires in that particularstate. In this pop-up report window, it is possible to downloadthe table contents or print the report (Fig. 2). This represents atremendous advance in providing relevant attribute and spatialinformation to end-users following a few clicks on the mouse.More examples of how users can use ImazonGeo’s tools toaccess information will be presented in the application section.
Applications
ImazonGeo was conceived to be application oriented,meaning that end-users would have easy-to-use tools to
access organized and well-structure databases containingrelevant information to support monitoring, law enforcementand conservation applications. Additionally, the system aimsto contribute towards transparency in governmental agenciesby facilitating access and making their information readilyaccessible through the internet (Fig. 1, Table 1). As ourdatabase expands and new spatial analysis and tools becomeavailable, other applications can be incorporated into thesystem. However, for the purpose of this paper, we will focuson two cases in order to demonstrate how ImazonGeo can beused to monitor the Brazilian Amazon and to support lawenforcement of Protected Areas.
Case 1: Monitoring deforestation and fires
In this application example, we gathered and organized allpublicly available information about deforestation andactive fires in the Brazilian Amazon. Next, we selectedspatial analysis that can generate key (geo-) information toend-users and built quick reports to facilitate access to thesespatial analyses. There are several sources of deforestation
Fig. 2 ImazonGeo web interface showing an example of visualizationinterface and tools to facilitate user accessibility to geo-information. Inthis example, users have fast access to a report embedded in a pop-upwindow containing socio-economic, deforestation and fires statistics
by States (gray balloons ), the ranking of most deforested FederalProtected Areas as detected by Prodes in 2008, and the location ofdeforestation alerts as detected with SAD (red balloons)
210 Earth Sci Inform (2009) 2:205–215

and fire maps for the Brazilian Amazon. For the later, weinclude maps produced by the National Space ResearchInstitute of Brazil (Inpe), which produces annual (Prodes @http://www.obt.inpe.br/prodes/) and monthly (Deter @http://www.obt.inpe.br/deter/index.html) deforestation mapsand statistics. Additionally, we included monthly defores-tation information generated by Imazon through its Defor-estation Alert System (SAD) (Souza et al. 2009). For firemaps, we included 19 ‘hot pixel’ products derived fromdifferent remote sensors and institutes (Table 1).
Several types of information are available at ImazonGeoto users interested in monitoring deforestation in the Brazil-ian Amazon. One example is the map of deforested areasgenerated by each source of information (i.e., Prodes, Deteror SAD). Having these types of map information easilyavailable through the internet represents a major step towardsunderstanding human pressure by deforestation on theBrazilian Amazon. However, end-users are mostly interestedin statistics and maps obtained by combining deforestationmaps with other types of maps. For this reason, wedeveloped three types of spatial analysis and tools to supplythis type of user demand. The first one is the deforestationranking, which can be obtained by state, municipality, ruralsettlement, indigenous lands, and state and federal conser-vation units. Figure 3 has results of this spatial analysisshowing a map of the top ten most deforested municipalitiesin the Amazon as detected by SAD in October 2004. Userscan choose to show the ten next most deforested municipal-ities by clicking the ‘next’ bottom below the map legend.Additionally, all of the deforestation locations detected bySAD in this period are marked with balloons in the mapview area. The second type of spatial analysis of deforesta-tion is the classification of deforestation by size of the areadeforested per state, municipality, rural settlement, indige-nous lands, and state and federal conservation units. The lastone is the list of the largest deforested areas in the Amazonregion (by source of information). These two types of geo-information can be useful in supporting field operations toenforce environmental law in this region (Fig. 3).
Regarding monitoring of active fires, users can alsogenerate maps, ranking and classification by the number offires per state, municipality, rural settlement, indigenouslands, and state and federal conservation units. All publicsources of active fire information for the Brazilian Amazonregion are available in ImazonGeo. Figure 3 shows thelocation of active fires as detected by Terra-Modis.Likewise deforestation, statistics and reports of fires areavailable to support monitoring operations in this region.
Case 2: forest law enforcement of protected areas
In the Amazon, the slow implementation of Protected Areasand the low effectiveness in applying the environmental
crimes law leave such areas vulnerable to the advance ofdeforestation and predatory logging. This results from delaysin detecting illegal deforestation and the lack of materialevidence to characterize this type of environmental crime. Toovercome those problems, we have developed a partnershipwith the Brazilian federal environmental agency (Ibama) andpublic prosecution offices which allowed us to implement aweb application to enable timely monitoring of illegaldeforestation and fires in Protected Areas in the Amazon.
Monthly monitoring of deforestation in the ProtectedAreas is done using SAD developed by Imazon. Thissystem uses images from the MODIS sensor (ModerateResolution Imaging Spectroradiometer), which has thecapacity to automatically detect deforestation incrementsgreater than 10 hectares monthly. After detection, thedeforestation areas (polygons) are transferred to Imazon-Geo. In the ImazonGeo intranet environment, the defores-tation polygons in Protected Areas are audited andvalidated using higher spatial resolution satellite images(Landsat at 30 m pixel size and CBERS with 20 m). Thisprocedure is necessary for unequivocal confirmation ofillegal deforestation detected by SAD, which can informbringing of administrative and court proceedings by theFederal Public Prosecution Service in the State of Pará(MPF-PA), a partner institution in this project. Next, thevalidated deforestation polygons are incorporated intorepresentations that are official documents forwarded tothe MPF-PA (Fig. 4). Each representation has summarizedinformation about the name and type of Protected Areadeforested, date of creation, municipality, state and locationand estimate of the deforested areas, together with satelliteimages utilized in detection and validation.
From August 2007 to December 2008, 389 squareskilometers were deforested in Protected Areas in squarekilometers Pará. Of those, 182 square kilometers wereforwarded to the MPF in the form of representations (n=145) distributed in 21 Federal Protected Areas. Deforesta-tion with representation occurred in nine Indigenous Lands,Nine Sustainable Conservation Units and three FullProtection Conservation Units. The majority of deforesta-tion was concentrated in the “Terra do Meio” region andnear the BR-163 highway, which are areas where thedeforestation frontier is expanding (Fig. 3).
Based on the representations, the MPF began severalactions to combat deforestation in federal Protected Areas inPará. After one year, the great majority (82%) of casesforwarded to the MPF are still in the investigation phase. Theobjective of that phase is to gather sufficient proof to proposeactions at both the civil and the criminal levels. To do that,information is surveyed by the MPF itself or through otheragencies such as IBAMA/ICMBio, FUNAI and FederalPolice. In the other 18% of cases of representations ofdeforestation information had not been forwarded as of
Earth Sci Inform (2009) 2:205–215 211

December 2008. That is because those representation hadbeen sent to MPF in October and November 2008, and therewas not enough time for the MPF to generate informationregarding them. That information on proceedings with theMPF-PA is fed back into the ImazonGeo database so that wecan monitor those proceedings. But it is only made availableto the public in general with authorization from the MPF-PAso as not to interfere with investigations.
Cases of illegal deforestation in Protected Areas that arealready being judged are available on ImazonGeo foraccess by the general public. Up to now, the cases availableare the ones being judged by Ibama (Federal EnvironmentalAgency). The general public can access maps ranking theproceedings in Protected Areas, the classification ofProtected Areas by amount of the fine in Reals, as well asinformation about the period when the proceeding began.Users may also access the Ibama website to obtain detailedinformation about the proceedings (Fig. 4).
Discussion and conclusions
Our society is facing a new era of access to data andinformation with the advent of Web 2.0 (e.g., Dayton and
Thacker 2008; Hardey 2008; Tang and Waters 2005, amongothers). Access to geographic information has also beenfacilitated using the new technologies embedded in Web2.0 and has gained rapid dissemination through WGISsystems on the internet (Su et al. 2000; Athanasis et al.2009). As a result, WGIS has become an essential tool forSDI in many countries (e.g., Maguire and Longley 2005;Koshkarev et al. 2008); Beaumont et al. 2005; Rao et al.2002). WGIS and SDI applications are broad, ranging frommanaging and planning of conservation reserves (Rao et al.2002), to exploring biodiversity (Flemons et al. 2007),decision support (Karnatak et al. 2007), public health(Maclachlan et al. 2007; Moreno-Sanchez et al. 2006) andeducation (Lo et al. 2009), among many others.
In this paper, we present a new WGIS system for theBrazilian Amazon built to support forest monitoring, envi-ronmental law enforcement, conservation, and contribute toincreasing transparency of governmental information, policiesand actions to stop illegal deforestation and forest degradationin the region. ImazonGeo integrates and organizes data andinformation—in the format of maps and attributes—fromseveral sources in a large database. This allow us generatemaps, statistics and reports based on relevant spatial analysesfor end users interested in these applications.
Fig. 3 ImazonGeo geo-information to support user application in monitoring deforestation and fires
212 Earth Sci Inform (2009) 2:205–215

Initial surveys of current and potential users show that theinformation provided by ImazonGeo is relevant and useful totheir work. Users come from different organizations,including federal, state and municipal government agencies,NGOs, journalists, researchers, students and individuals.Most users are interested in the deforestation and fire alerts,reports, and data download. Since the launch of ImazonGeoin May 2007, the WGIS system had more than 19,000accesses and more than 7,000 downloads of maps and tables.From April 2008 through April 2009, the Forest Transpar-ency Bulletin, one of the ImazonGeo customized reportsbased on our deforestation alert systems and spatial analysis,had 8,394 downloads. Another indirect measure of impact isthe number of articles in media vehicles (newspaper, internet,TV and radio) based on SAD and spatial analysis ofdeforestation pressure in the Amazon region, resulting in527 articles published. A further positive impact of Imazon-Geo was the number of illegal deforestation alerts inProtected Areas that turned into official enforcement caseswith the Public Prosecution Office of Pará State, described indetail above as a successful case.
Response to ImazonGeo is positive but we are far frombeing a hub of geospatial information for the Amazonregion. Our strategy to increase access to ImazonGeo is
multifaceted. First, we are building geo-wiki interfaces toallow users to input data and provide feedback to oursystem. So far, we have couple of geo-wiki tools. One isoperational, consisting in the intranet interface to monitorthe enforcement of actions against illegal deforestation. Theother is publicly open and will allow internet users tosupport enforcement against illegal deforestation in Pro-tected Areas of the Brazilian Amazon. While the first onehas a limited number of users because of its restrictedaccess, the second has a broader access and the potential toattracted millions of users.
The second strategy to increase user access to Imazon-Geo is to provide short tutorials to use the tools and accessinformation (i.e., maps, alerts, reports, statistics) anddownload them using the system. Even though we builteasy-to-use tools and abstracted spatial analysis, byprocessing offline and storing results in the database, endusers with no prior knowledge of GIS are overwhelmedwhen they try to use the system. Our experience shows thatcapacity-building is required to make users more comfort-able using GIS tools on the web and understanding the websystem content. Besides tutorials, we will develop shorttraining and workshops targeting specific audiences todemonstrate ImazonGeo tools and applications.
Fig. 4 ImazonGeo application to support enforcement against illegal deforestation in Protected Areas
Earth Sci Inform (2009) 2:205–215 213

The third strategy to engage users is to expand theinformation content of and develop new applications toImazonGeo. As an example of new applications, we arecurrently developing carbon emission models from defor-estation and forest degradation to provide information oncarbon dioxide emissions associated with deforestation inthe Brazilian Amazon. Following the current applicationmodels of ImazonGeo, the carbon emission results will bestored in the database and access to the results (throughmaps, statistics, reports, etc.) will be customized to fastaccess information.
The last strategy will focus on the development of geo-wiki interfaces to ImazonGeo and mash-ups with virtualcommunity web systems. Currently, we have been devel-oping a simple geo-wiki interface to ImazonGeo that willallow users to enforcement against illegal deforestation inProtected Areas of the Brazilian Amazon. Users will beable to identify cases of illegal deforestation that are beingjudged, send requests, as protests, to prioritize cases withthe environmental agencies and courts, monitor the lengthof the proceedings, and receive alerts about the status of theprocess. We hope that this type of geo-wiki tool can engagecivil society in order to accelerate the cases and bringpositive pressure on the enforcement system to properlypunish violators. This is important, because the applicationof enforcement law represents the major bottleneck tostopping illegal deforestation in the Brazilian Amazon(Brito and Barreto 2009). We have also been exploringmush-up applications with other web systems and integra-tion of our system with mobile phone applications. Forexample, individuals could support conservation andprotections of forest reserves by paying monthly fees andbeing able to monitor the status of the reserve using mobilephone.
In summary, there is no doubt that SDI and WGIStechnology is mature enough to be used to supportprotection of rainforests through monitoring, conservationand law enforcement applications. Furthermore, the websystems developed with these technologies, including thosewith geo-information, are accessible to hundreds ofmillions of people. Engaging millions of people to protectrainforest through WGIS systems will require easy-to-usetools, education through tutorials, geo-wiki tools to makeusers part of the process, and geo-systems developers awareof users’ needs and limitations, in order to provide reliableinformation.
Acknowledgement We are very thankful to the Foundations thatsupport the work presented in this paper. ImazonGeo WGIS-SDI websystem was developed with support from the Avina Foundation. Dataand information content developed by Imazon, such as SADdeforestation alerts, have been supported by the David and LucilePackard Foundation. And the ImazonGeo applications to monitor andenforce illegal deforestation in Protected Areas have been funded by
the Betty and Gordon Moore Foundation. We also would like to thankElton Rodrigues and Christopher Barber for their programmingcontributions during the initial stages of ImazonGeo. Finally,anonymous reviewers provided valuable comments to improve thismanuscript to which we are very grateful.
References
Asner GP, Knapp DE, Broadbent EN, Oliveira PJC, Keller M, SilvaJN (2005) Selective logging in the Brazilian Amazon. Science310(5747):480–482
Athanasis N, Kalabokidis K, Vaitis M, Soulakellis N (2009) Towardsa semantics-based approach in the development of geographicportals. Comput Geosci 35(2):301–308
Beaumont P, Longley PA, Maguire DJ (2005) Geographic informationportals: a UK perspective. Comput Environ Urban Syst 29(1):49–69
Brandão AO, Souza CM Jr (2006) Mapping unofficial roads withLandsat images: a new tool to improve the monitoring of theBrazilian Amazon rainforest. Int J Remote Sens 27:177–189
Brito B, Barreto P (2009) Os riscos e os princípios para aregularização fundiária na Amazônia. O Estado da Amazônia.Belém, Brazil: 4
Dayton D, Thacker C (2008) Using web 2.0 to democratize theinformation economy in qualitative research. Professional Com-munication Conference, 2008. IPCC 2008. IEEE International
Ewers RM, Laurence WF, Souza CM Jr (2008) Temporal fluctuationsin Amazonian deforestation rates. Environ Conserv 35:303–310
Fearnside PM (2002) Avanca Brasil: environmental and socialconsequences of Brazil’s planned infrastructure in Amazonia.Environ Manage 30(6):735–747
Fearnside PM (2003) Deforestation control in Mato Grosso: a newmodel for slowing the loss of Brazil’s Amazon forest. Ambio 32(5):343–345
Fearnside PM (2005) Deforestation in Brazilian Amazonia: history,rates, and consequences. Conserv Biol 19(3):680–688
Flemons P, Guralnick R, Krieger J, Ranipeta A, Neufeld D (2007)A web-based GIS tool for exploring the world’s biodiversity:the global biodiversity information facility mapping andanalysis portal application (GBIF-MAPA). Ecol Inform 2(1):49–60
Foley JA, Asner GP, Costa MH, Coe MT, DeFries R, Gibbs HK,Howard EA, Olson S, Patz J, Ramankutty N, Snyder P (2007)Amazonia revealed: forest degradation and loss of ecosystemgoods and services in the Amazon Basin. Front Ecol Environ 5(1):25–32
Groot R (1997) Spatial data infrastructure (SDI) for sustainable landmanagement. ITC J 3(4):287–294
Hardey M (2008) Public health and Web 2.0. J R Soc Promot Health128(4):181–189
Inpe (2009) Projeto PRODES: Monitoramento da Floresta AmazônicaBrasileira por Satélite. São José dos Campos, Instituto Nacionalde Pesquisas Espaciais
Karnatak H, Saran S, Bhatia K, Roy P (2007) Multicriteria spatialdecision analysis in web GIS environment. GeoInformatica 11(4):407–429
Koshkarev AV, Antipov AN, Batuyev AR, Yermoshin VV, KarakinVP (2008) Geo-portals as part of spatial data infrastructures:Russian Academy-supported resources and geoservices. GeogrNat Resour 29(1):18–27
Laurance WF, Cochrane MA, Bergen S, Fearnside PM, Delamonica P,Barber C, D'Angelo S, Fernandes T (2001) The future of theBrazilian Amazon. Science (Washington DC) 291(5503):438–439
214 Earth Sci Inform (2009) 2:205–215

Laurance WF, Albernaz AKM, Fearnside PM, Vasconcelos HL,Ferreira LV (2004) Deforestation in Amazonia. Science 304(5674):1109
Lo JJ, Chang CJ, Tu HH, Yeh SW (2009) Applying GIS to develop aweb-based spatial-person-temporal history educational system.Comput Educ 53(1):155–168
Maclachlan JC, Jerrett M, Abernathy T, Sears M, Bunch MJ (2007)Mapping health on the internet: a new tool for environmentaljustice and public health research. Health & Place 13(1):72–86
Maguire DJ, Longley PA (2005) The emergence of geoportals andtheir role in spatial data infrastructures. Comput Environ UrbanSyst 29(1):3–14
Moreno-Sanchez R, Hayden M, Janes C, Anderson G (2006) A web-based multimedia spatial information system to document Aedesaegypti breeding sites and dengue fever risk along the US–Mexico border”. Health & Place 12(4):715–727
Nepstad DC, Varissimo A, Alencar A, Nobre C, Lima E, Lefebvre P,Schlesinger P, Potter C, Moutinho P, Mendoza E, Cochrane M,Brooks V (1999) Large-scale impoverishment of Amazonianforests by logging and fire. Nature 398(6727):505–8
Peres CA, Barlow J, Laurance WF (2006) Detecting anthropogenicdisturbance in tropical forests. Trends Ecol Evol 21(5):227–229
Rao M, Pandey A, Ahuja AK, Ramamurthy VS, Kasturirangan K(2002) National spatial data infrastructure—coming together ofGIS and EO in India. Acta Astronaut 51(1–9):527–535
Reid J, De Sousa WC (2005) Infrastructure and conservation policy inBrazil. Conserv Biol 19(3):740–746
Rylands AB, Brandon K (2005) Brazilian protected area. Conserv Biol19(3):612–618
Schneider R, Arima E, VerissimoA, Souza CM Jr, Barreto P (2002)Sustainable Amazon: Limitations and Opportunities for RuralDevelopment. Environment Series. W. Bank. Washington DC,USA, World Bank: 50
Soares-Filho BS, Nepstad DC, Curran LM, Cerqueira GC, Garcia RA,Ramos CA, Voll E, McDonald A, Lefebvre P, Schlesinger P(2006) Modelling conservation in the Amazon basin. 440(7083):520–523
Souza CM Jr, Hayashi S, Verissimo A (2009) Near real-timedeforestation detection for enforcement of forest reserves inMato Grosso. Land Governance in Support of the MillenniumDevelopment Goals: Responding to New Challenges, Washing-ton DC, USA, World Bank
Su Y, Slottow J, Mozes A (2000) Distributing proprietary geographicdata on the World Wide Web UCLA GIS database and mapserver. Comput Geosci 26(7):741–749
Tang KX, Waters NM (2005) The internet, GIS and publicparticipation in transportation planning. Prog Plann 64(1):7–62
Verissimo A, Souza Junior CM, Stone S, Uhl C (1998) Zoning oftimber extraction in the Brazilian Amazon. Conserv Biol 12(1):128–136
Verissimo A, Cochrane MA, Souza C, Salomão R (2002) Priorityareas for establishing national forests in the Brazilian Amazon.Conservation Ecology 6(1): 4. [online] URL: http://www.consecol.org/vol6/iss1/art4/
Earth Sci Inform (2009) 2:205–215 215