Weak Links in the BEE Chain? Procurement, Skills and ...
27
Weak Links in the BEE Chain? Procurement, Skills and Employment Equity in the Metals and Engineering Industries Grace Mohamed and Simon Roberts The Birchwood Hotel and Conference Centre Johannesburg, South Africa Accelerated and Shared Growth in South Africa: Determinants, Constraints and Opportunities 18 - 20 October 2006 Conference organised with support from the EU
-
Upload
khangminh22 -
Category
Documents
-
view
1 -
download
0
Transcript of Weak Links in the BEE Chain? Procurement, Skills and ...
Weak Links in the BEE Chain? Procurement, Skillsand Employment Equity in the Metals
and Engineering Industries
Grace Mohamed and Simon Roberts
The Birchwood Hotel and Conference CentreJohannesburg, South Africa
Accelerated and Shared Growth in South Africa:Determinants, Constraints and Opportunities
18 - 20 October 2006
Conference organised withsupport from the EU
1
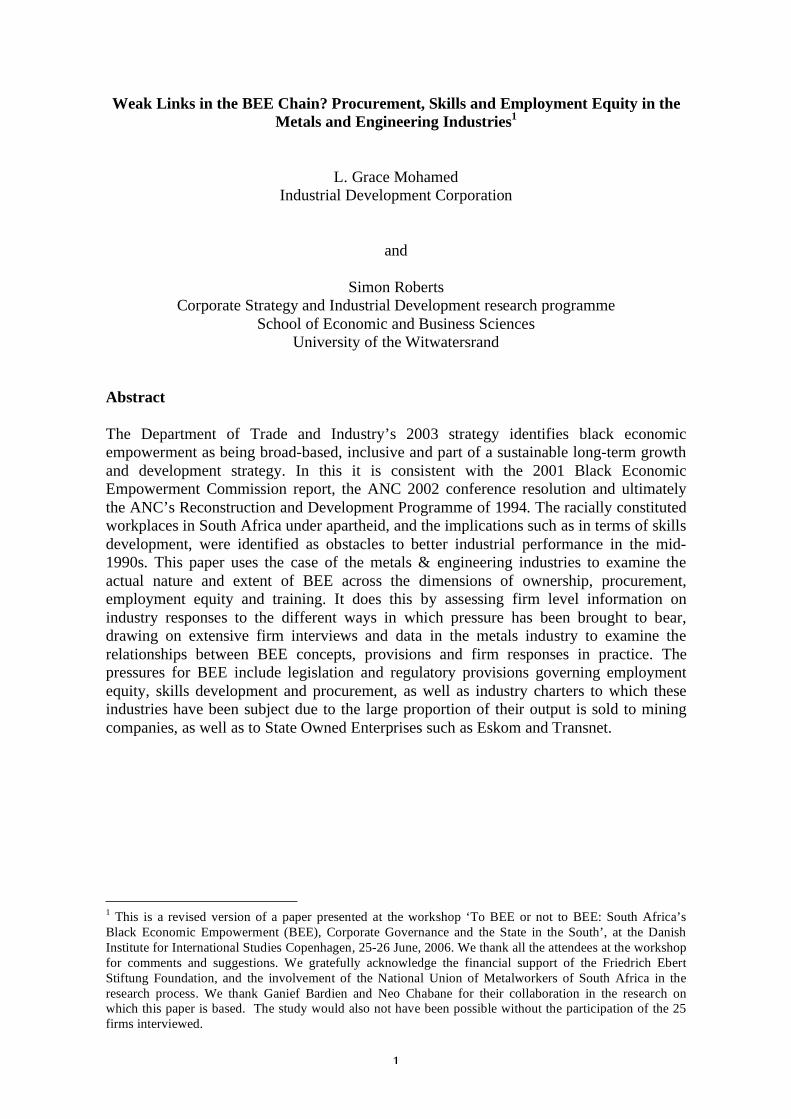
Weak Links in the BEE Chain? Procurement, Skills and Employment Equity in theMetals and Engineering Industries1
L. Grace MohamedIndustrial Development Corporation
and
Simon RobertsCorporate Strategy and Industrial Development research programme
School of Economic and Business SciencesUniversity of the Witwatersrand
Abstract
The Department of Trade and Industry’s 2003 strategy identifies black economicempowerment as being broad-based, inclusive and part of a sustainable long-term growthand development strategy. In this it is consistent with the 2001 Black EconomicEmpowerment Commission report, the ANC 2002 conference resolution and ultimatelythe ANC’s Reconstruction and Development Programme of 1994. The racially constitutedworkplaces in South Africa under apartheid, and the implications such as in terms of skillsdevelopment, were identified as obstacles to better industrial performance in the mid-1990s. This paper uses the case of the metals & engineering industries to examine theactual nature and extent of BEE across the dimensions of ownership, procurement,employment equity and training. It does this by assessing firm level information onindustry responses to the different ways in which pressure has been brought to bear,drawing on extensive firm interviews and data in the metals industry to examine therelationships between BEE concepts, provisions and firm responses in practice. Thepressures for BEE include legislation and regulatory provisions governing employmentequity, skills development and procurement, as well as industry charters to which theseindustries have been subject due to the large proportion of their output is sold to miningcompanies, as well as to State Owned Enterprises such as Eskom and Transnet.
1 This is a revised version of a paper presented at the workshop ‘To BEE or not to BEE: South Africa’sBlack Economic Empowerment (BEE), Corporate Governance and the State in the South’, at the DanishInstitute for International Studies Copenhagen, 25-26 June, 2006. We thank all the attendees at the workshopfor comments and suggestions. We gratefully acknowledge the financial support of the Friedrich EbertStiftung Foundation, and the involvement of the National Union of Metalworkers of South Africa in theresearch process. We thank Ganief Bardien and Neo Chabane for their collaboration in the research onwhich this paper is based. The study would also not have been possible without the participation of the 25firms interviewed.

2
1. Introduction
The metals and engineering industries make up a sizeable portion of manufacturingactivities in the South African economy.2 In many respects, these industries were at theheart of the apartheid industrial model, as they developed to supply products for mining,energy, infrastructure and defence (see Fine and Rustomjee, 1996). In addition, theindustries include those, such as steel manufacturing, with important downstream linkagesfrom minerals and energy. Large firms, including multinational engineering andautomotive firms, dominate the landscape in terms of ownership, market power andemployment (FRIDGE, 2003).
Most of the economic rents derived from the value-added activities in these sectors flow toforeign owners and white households, reflecting the dominance of large firms, theownership in them and the profile of employees.3 Black people are almost entirely limitedto semi- and unskilled labour (FRIDGE, 2003). And, as in other more labour-intensivesectors, black workers have born the brunt of job losses in the face of increased globalcompetition, corporate restructuring and the rationalisation efforts of state owned entities.
At the same time, successive ANC governments have promoted black economicempowerment since winning the first democratic election in 1994. These measures haveincluded procurement, employment equity and skills development legislation, as well asCharters for the Mining and Liquid Fuels industries. More recently, government hasdeveloped a Broad-Based Black Economic Empowerment strategy and related Act.
These provisions have major implications for the metals and engineering industries.Leaving aside auto manufacturing, the key local markets for metals and engineering firmsremain the infrastructure State Owned Enterprises (such as Eskom and Transnet inelectricity and transport respectively), local government, mining and liquid fuels. Thismeans that BEE provisions acting on these major markets impact on the metals andengineering industries, especially through procurement measures.
In addition, increased training and widening the pool of employees who could bepromoted through breaking down the apartheid ‘colour bar’ was viewed as key toachieving higher productivity and sustained manufacturing growth (Joffe et al., 1995).Apartheid era authoritarian workplace regimes and rigid hierarchies along racial linesseriously impeded communication and problem-solving in factories (Webster and vonHoldt, 2005; von Holdt, 2003; Joffe et al., 1995). A capital-intensive growth path underapartheid also reflected the interests of relatively better educated white workers in thesecapital-intensive sectors, as well as in state-owned enterprises and non-traded activities.The apartheid ‘colour bar’ on the promotion of black workers therefore compounded thetrade and industrial policies advantaging the targeted capital-intensive activities andimpeding the growth of broader-based manufacturing (Seekings and Nattrass, 2006).Artisan skills developed by black workers were not necessarily recognised by employersand even when training was provided it was job-specific and did not lay the basis forcareer advancement or mobility (MERG, 1993; Joffe et al., 1995) Skills development and
2 Taken to include basic iron & steel, basic non-ferrous metals, metal products, machinery & equipment,electrical machinery, auto and other transport equipment, these industries accounted for 33 per cent ofmanufacturing value-added and 35 per cent of employment in 2005.3 See Machaka and Roberts (2003) and Roberts (2005) for the skewed development of these industries inSouth Africa.
3
employment equity can therefore be viewed as part of the whole package of measures, inthe interests of improved industrial growth and development.
Despite being at the heart of South African industry there has been no specificempowerment charter or provisions for the metals and engineering industries. BEE alsotends to be discussed merely in terms of ownership of major companies and there is littleresearch which assesses the state of black economic empowerment at the firm or industrylevel, despite there clearly being different pressures, such as those associated withdifferent markets. The study addresses issues of procurement, employment equity andskills development, rather than ownership and equity alone.
The remainder of this section describes the methodology employed and the problemsexperienced during the study, followed by a brief discussion of definitions ofempowerment. Section two then examines the drivers of BEE in the metal sector. Sectionthree gives a descriptive analysis of the interview findings. Section four draws together theanalysis of the patterns observed and the influence of different empowerment measures.
Methodology
Data was collected for 25 firms through interviews using a structured questionnaire. Inaddition, interviews were held with industry associations. The firm questionnaire coveredinformation on: firm background; ownership; markets and products; procurement;employment equity and skills development; the BEE policy of the firm; the challenges andobstacles BEE represents to the firm; and corporate social responsibility initiativesundertaken by the firm. Minor modifications were made to the questionnaire after initialpilot interviews.
All of the firms considered were unionised and located in Gauteng Province, based on alist provided by the National Union of Metalworkers of South Africa, who were co-sponsors of the study.4 The firms were also selected on the basis that they are considered“designated employers” in terms of the Employment Equity Act No. 55 of 1998. In termsof the Employment Equity Act a “designated employer” means:
a. A person who employs 50 or more employees;b. A person who employs fewer than 50 employees but has a total annual
turnover that is equal to or above the applicable annual turnover of a smallbusiness in terms of the Schedule 4 of this Act;
Letters requesting firm participation were generally addressed to management in thehuman resources and procurement functions in the firms, including the designated seniormanager(s) assigned to drive employment equity in terms of the Employment Equity Actand the skills development facilitator(s) appointed in terms of Skills Development Act No97 of 1998. Following intensive follow-up, of the 147 firms contacted 25 agreed toparticipate. Firms were in general fairly evasive about participation. BEE is clearly stillviewed as a contentious issue by most firms, and regarded as an issue that only senior toexecutive management levels are qualified to deal with.5
4 The trade union did not select the firms, however, but provided a list of firms in the Gauteng region whichwere organised by the union. The union is by far the largest in the metals and engineering industries and isan affiliate of the Congress of South African Trade Unions.5 Inquiries were often passed around a firm with, in general, decision-making being deferred to the mostsenior level.
4
Firms also cited the lack of clarity and uncertainty from government about BEE for notparticipating in the study. During the study government released yet another set ofempowerment regulations, the so-called “codes of good practice”. Some firms wantedtime to study these first before considering participation in the study. This could also beseen as a diversionary tactic by firms to avoid participation in the study.
Institutions associated with the motor manufacturing industry pointed out that theirmembers with multinational links are awaiting “codes of good practice” for multinationalsfrom government. However, a large proportion of the 25 firms investigated weremultinationals.
We broadly conclude, however, that the set of firms studied represent firms that are moreprogressive in their approach to black economic empowerment.
In addition to the firm interviews, the Employment Equity Act of 1998 compels alldesignated employers to submit employment equity reports. A designated employer thatemploys fewer than 150 employees must:
a. Submit its first report to the Director-General within 12 months after thecommencement of this Act or, if later, within 12 months after the date onwhich that employer became a designated employer; and
b. Thereafter, submit a report to the Director-General once every two years, onthe first working day of October.
A designated employer that employs 150 or more employees must:a. Submit its first report to the Director-General within six months after the
commencement of this Act or, if later, within six months after the date onwhich that employer became a designated employer; and
b. Thereafter, submit a report to the Director-General once every year on the firstworking day of October.
In terms of the legislation these reports are considered public documents; and for anominal fee are available from the Department of Labour (DoL). Firms have, however,not always complied. The DoL publishes a yearly registry of all the firms that submit EEreports timeously.6 The DoL captures all the EE reports submitted for a particular yearbefore December of that year, which means if a company submits its EE reports afterDecember they will not be on the registry and, once compiled in December, the list is notupdated. This means if a company’s name does not appear on the registry for a year theymight have submitted their report later than December or they did not comply withlegislation. For some of the firms that are used in the paper that did submit EE reports,there are queries on the legitimacy and accuracy of the data reported. An improvement insubmissions of EE reports since 2002 can however be observed. A greater number offirms complied with EE regulations in 2004 compared to 2002 in terms of on-timesubmission. Of the 25 firms studied here, employment data for 2002 and 2004 could onlybe assessed for 13 firms. Training data was only available for seven firms in 2002, andhence we only evaluate the data for 2004 (when it was available for 18 firms).
With regard to skills development, in terms of the Regulations to the Skills DevelopmentAct No 97 of 1998 an employer in consultation with the workforce must appoint at least
6 Firms are expected to submit depending on their size before or on the 1st of October of each year.

5
one skills development facilitator (SDF). Besides acting as an advisor to the employerregarding employee skills development, the skills development facilitator is alsoresponsible for assisting the employer with drawing up Workplace Skills Plans (WSPs).
In order for a firm to claim back the Skills Development Levy, it has to developWorkplace Skills Plans; these plans are submitted to the relevant Sector Education andTraining Authority (SETA) in the form of a grant application. It is unclear if thesedocuments are considered public documents. However, the grant application forms drawnup by the metals and engineering industries training authority (MERSETA) requires aworker representative to sign the application forms. This signature by the workerrepresentative(s) implies an approval of the Workplace Skills Plan. But, most shopstewards complained that they are rarely consulted on the drawing up of these. Some shopstewards alleged that the very first time they see the workplace skills plans are when theyare presented to them for signature. This amounts to firms asking shop stewards to rubber-stamp WSPs without proper consultation as required by the Act. Of equal concern is thefact that most shop stewards did not have any copies of the documents they wererequested to sign. During the whole study only two firms supplied copies of the WSPsthey have submitted to MERSETA. For this reason it was decided to make use of SectionE on skills development of the Employment Equity reports for the purposes of skillsanalysis.
Interviews were also held with trade union shop stewards. The interviews provided acheck on the information being provided by firm management on actual steps taken. Italso emerged that employers largely do not consult shop stewards about the employmentequity and skills development plans despite the stated provisions in the Acts to do so.
Understanding and defining black economic empowerment
Despite the high profile of black economic empowerment in South Africa there is stillgreat uncertainty and ambiguity as to what BEE entails and what it means to beempowered. It is important therefore to be clear about how BEE is defined. Is economicempowerment about the removal of barriers to advancement? Is it the ability to exerciseeconomic freedom and/or access educational and skills development opportunities?
Development and empowerment can both be argued to be processes of expanding thefreedoms and opportunities that people enjoy. Empowerment can be defined as a processof enhancing feelings for self-efficacy among organizational members by identifyingconditions that foster powerlessness and removing them through formal organizationalpractices (Conger and Kanungo, 1988). Friedman (1992) sees empowerment as analternative development path that places emphasis on the improvement in the conditionsof the lives of, and the livelihood of, an excluded majority. He believes in empowermentas an aim to humanize the system that has shut out the majority with the long-term goal oftransforming society and the structures of power.
The Reconstruction and Development Programme clearly identified focused BlackEconomic Empowerment policies as necessary to deracialise business ownership andcontrol and to ensure effective participation of black people and women in the mainstreameconomy. It included special emphasis on tendering procedures, training and non-discrimination (see Ponte et al., 2006). Black economic empowerment has also beenidentified in government’s industrial policy as a key objective, while DTI’s Broad BasedBlack Economic Empowerment strategy and the Act of 2003 also place BEE at the centre
6
of government’s policies for industry. Black economic empowerment is an integrated andcoherent socio-economic process that directly contributes to the economic transformationof South Africa and brings about significant increases in the numbers of black people thatmanage, own and control the country’s economy, as well as significant decreases inincome inequalities (Department of Trade and Industry 2005).
A broad definition of BEE is also consistent with the Black Economic Commission(BEECom) established in 1997. The Commission was, amongst other things, tasked withsetting guidelines for monitoring the implementation of the national BEE strategy,assessing obstacles thereof, and defining black economic empowerment. The BEEComrefers to demand-side and supply-side strategies of the colonial government. The demand-side refers to the saturation of the white consumer market, while the supply-side refers tolabour costs not adapting to skill shortages due to the ‘colour bar’ on advancement ofblack workers and the dependence on imported machinery. It emphasises that strategies ofempowerment should have responses that target both demand-side and supply-sideaspects. The Commission defined BEE as a comprehensive strategy that seeks to allowaccess to productive assets and ensure that those assets are indeed productive (BEECom,2001). It further aims to promote opportunities for blacks and increase their levels ofparticipation in the ownership, management and control of economic activities.
As a tool for empowerment, BEE as described by the Commission focuses on the creationof jobs, rural development, urban renewal, poverty alleviation, land ownership, skills andmanagement development, education, meaningful ownership, and access to finances forhouseholds for the purposes of conducting business. This list is extensive, however, forour purposes it is only necessary to highlight the importance of skills, employment equityand the security and quality of employment. This can be contrasted with a narrowdefinition of BEE usually associated with the development of a class of black capitalists.
Employment is at the heart of the effective participation in the economy by the majority(see Sen, 1984 and 1999). Moreover, it depends on the incomes earned, and the nature andsecurity of that employment. A major focus of our research is thus the extent to whichprovisions with regard to procurement, ownership, skills development and employmentequity have indeed altered firm decision-making and the employment outcomes observed.As noted above, improved training and the greater mobility of black workers had alsobeen identified as key to overcoming apartheid obstacles to more extensive manufacturingdevelopment beyond a narrow set of relatively capital-intensive sectors (Joffe et al., 1995).
Sen (1999) identified five means towards achieving freedom (political freedoms,economic facilities, social opportunities, transparency guarantees and protectivesecurities). The most relevant instruments of freedom for this paper refer to the ability ofpeople to access economic resources for the purpose of consumption, production orexchange (economic facility) and the arrangements society makes for education and healthcare to substantially free individuals to live improved lives (social opportunities). Bettereducation and training have a positive association with higher earning and henceeconomic freedom. Therefore, development requires the removal of major sources of“unfreedoms” such as poor economic opportunities, the lack of skills development and theopportunity to actively participate in the labour market. Elsewhere Sen highlightsemployment as one of three main ways to achieve redistribution of assets (Sen, 1983).The other two are an equity plan, where individuals are entitled to a share of thecommodity, and the usage of subsidies to make it cheaper to access targeted goods.

7
Sen’s stance on entitlements and the need to distribute them to those that aredisadvantaged embodies the rationale under the concept of broad-based empowerment. Itrecognises the need to constructively address constraints such as the low participation inthe labour market that was constructed through the structured exclusion of black peoplefrom economic power that began in the late 1800s with the first colonialist dispossessionof the land, continued throughout the 20th century with the first Mines and Works Act of1911, Land Act of 1913 and the subsequent Apartheid laws enacted after 1948.
The legacy of apartheid has left a huge divide in the South African economy, where thewhite minority still effectively has economic power while the black majority remains poorand subordinate. The empowerment of black people as envisaged by empowermentlegislation is therefore a necessary step toward redressing the legacy of apartheid andputting the country on a sustainable growth path. Empowerment seeks to address theapartheid legacy through BEE codes and legislation that aim to address equitableemployment opportunities, skills development, procurement from black enterprises, equitytransfer as well as providing incentives for the creation of a black entrepreneurial class.The outcomes of such legislation and other steps depend largely on the responses ofprivate businesses.
2. The impetus for BEE in the metals and engineering industries
In addition to the skills development and employment equity legislation that apply to allindustry, the metals and engineering industries have specifically been impacted by theMining and Liquid Fuels charters, and the Preferential Procurement Policy FrameworkAct of 2000. This is particularly the case for firms for which the mining and liquid fuelssectors, and government and SOEs, are important markets. While metals and engineeringindustries were central to the apartheid industrial development model, these industrieshave therefore also been some of the first to face direct pressures for change. However,these industries have also been subject to far reaching pressures for restructuring underliberalisation of the economy.
We briefly summarise the main provisions of these charters and legislation beforemapping out the major patterns under restructuring.
Charter for the South African Petroleum and Liquid Fuels Industry, 2000
• Capacity building: Improve and build skills in collaboration with SETAs.• Private Sector Procurement: Adopt supportive procurement policies to facilitate and
leverage the growth of the companies of Historically Disadvantaged South Africans(HDSAs).
• Public Sector Procurement: Government will through its tendering processes giveeffect to supportive procurement policies towards HDSA.
• Refining capacity: Making capacity available to HDSA companies through tollrefining agreements, and including HDSA companies as joint venture partners in anyexpansions or upgrades.

8
The Mining Charter, 2002
• Human Resource Development: Provide scholarships to promote mining relatededucational advancement, offer every employee the opportunity to becomefunctionally numerate and literate, and develop systems through which empoweredgroups can be mentored.
• Employment Equity: 40 percent HDSA participation in management within five yearsof the inception of the charter; focus training on HDSA; 10 percent participation ofwomen in the mining industry within 5 years.
• Procurement: Give HDSA preferred supplier status; commit to progressively procuringfrom HDSA; reflect the genuine value added by the HDSA; and encourage currentsuppliers to form partnerships with HDSA.
• Financing mechanism: assist HDSA in securing finance.• Beneficiation: Identify the current levels of beneficiation and indicate the extent to
which these can be grown.
Preferential Procurement Policy Framework Act of 2000
The act provides for preferences in the procurement of government and state-woenedenterprises in favour of Historically Disadvantaged Individuals (HDIs) and small, mediumand micro enterprises (SMMEs). According to the evaluation system for tenders,preferences are applicable to all tenders, irrespective of the amount. An 80/20-pointsystem is applicable for tenders up to R500 000, while a 90/10 point system is applicablefor tenders above R500 000. For the former, the 80 focuses on prices differences betweenbidders and 20 points are awarded based on the empowerment characteristics of the tenderand for achieving specified Reconstruction and Development Programme (RDP) goals.For tenders with a value above R500 000 a maximum of 10 points can be scored forempowerment characteristics and for achieving specified RDP goals. These goals caninclude the promotion of SMMEs, promotion of enterprises located in a specific province,region, municipality or rural areas, the empowerment of the work force through skillsdevelopment and the upliftment of communities. The Minister of Finance is mandatedwith the implementation and monitoring of the procurement system.
Since 1996 a maximum of 11.1 per cent preference has been allowed for HDIs whotendered for building and construction contracts administered by the Department of PublicWorks, while a maximum of 13.6 per cent preference was allowed for equity ownershipby HDIs and women for contracts with a value up to R2 million. No preferences wereallowed for contracts above R2 million.
Employment Equity Act of 1998
The primary aim of the Act is to promote and achieve equity in the workplace, byencouraging equality of opportunity across all workers and through affirmative actionstipulation. The Act applies to all employers, workers and job applicants, with theexception of the National Defence Force, National Intelligence Agency and the SouthAfrican Secret Service.
Chapter 3 of the Act deals specifically with addressing equitable employment in theworkplace through affirmative action measures. The requirements for affirmative actionapply to:

9
• employers with 50 or more workers, or whose annual income is more than theamount specified in Schedule 4 of the Act;
• municipalities;• organs of State;• employers ordered to comply by a bargaining council agreement; and• any employer who volunteers to comply.
Affirmative action measures are measures intended to ensure that suitably qualifiedemployees from designated groups are equitably represented in all occupational categoriesand levels of the workforce.
A designated employer must conduct an analysis of employment policies, practices,procedures, and working environment so as to identify employment barriers that adverselyaffect members of designated groups. The analysis must also include the development of aworkforce profile to determine to what extent designated groups are under-represented inthe workplace.
A designated employer must prepare and implement a plan to achieve employment equity,which must:
• have objectives for each year of the plan;• include affirmative action measures;• have numerical goals for achieving equitable representation;• have a timetable for each year;• have internal monitoring and evaluation procedures, including internal dispute
resolution mechanisms; and• identify persons, including senior managers, to monitor and implement the plan.
In terms of reporting, an employer who employs fewer than 150 employees is expected tosubmit its first report to the DoL within 12 months after the commencement of the Act,and thereafter every 2 years on the first working day of October. An employer whoemployers 150 or more employees, must submit its first report 6 months after thecommencement of the Act, and thereafter every year on the first working day of October.
In addition the act requires of employers to assign one or more senior managers to ensureimplementation and monitoring of the employment equity plan and firms must makeavailable necessary resources for this purpose.
Skills Development Act of 1998 and the Skills Development Levies Act of 1999
The principal aims of the Skills Development Act are to:• provide an institutional framework to develop and implement national, sector and
workplace strategies to develop and improve the skills of the South Africanworkforce;
• integrate those strategies within the National Qualifications Frameworkcontemplated in the South African Qualifications Authority Act, 1995;
• provide for learnerships that lead to recognised occupational qualifications;• provide for the financing of skills development by means of a levy-grant scheme
and a National Skills Fund;• provide for and regulate employment services; and• provide for matters connected therewith.

10
The objectives specifically identify improving the employment prospects of personspreviously disadvantaged by unfair discrimination and to redress those disadvantagesthrough training and education, and ensuring the quality of education and training in andfor the workplace.
These objectives can be met through:(a) the establishment of an institutional and financial framework comprising of theNational Skills Authority, the National Skills Fund, the skills development levy-grant scheme as contemplated in the Skills Development Levies Act, SectorEducation and Training Authorities (SETAs), labour centres, and the SkillsDevelopment Planning Unit.(b) Encouraging partnerships between the public and private sectors of theeconomy to provide education and training in and for the workplace.(c) Co-operating with the South African Qualifications Authority.
The Skills Development Levies Act applies to all employers except the public service,religious or charity organisations, public entities that get more than 80% of their moneyfrom Parliament, and employers whose total pay to all their workers is less than R250 000per year and who do not have to register according to the Income Tax Act
The Act requires employers to pay a skills development levy from the 1 April 2000 at arate of 0.5 percent of the leviable amount7 and from the 1 April 2001 at a rate of 1 percentof the leviable amount. An employer must pay the levy not later than seven days after theend of each month to the relevant Sector Education Training Authority (SETA) in whichthe employer falls, who will pay the levies collected over to the Commissioner of theSouth African Revenue Services. All the levies, interest and penalties collected by theCommissioner must be paid to the National Revenue Fund. 20 percent of the levies,interest and penalties paid to the Commissioner is allocated to the National Skills Fundand the remaining 80 percent is allocated back to the SETA after the Director General issatisfied that the SETA complies with the Skills Development Act
Liberalisation and industry restructuring
The provisions for BEE, including skills development, have been implemented over aperiod of major industry restructuring as the South African economy was liberalised(Roberts, 2005). Many sub-sectors within metals and engineering have performed poorlyin terms of output (value added), while almost all have shed labour (Figures 1 and 2).However, motor vehicles and basic iron & steel have performed relatively better in termsof output.
Figure 1. Value-added in metals and engineering industries
7 The total amount of remuneration paid or payable by an employer to its employees during any month andexcludes any amount paid to any person for pension, payable to a learner in terms of a contract ofemployment as defined in the Skills Development Act.

11
0
2000
4000
6000
8000
10000
12000
14000
16000
18000
1994 1995 1996 1997 1998 1999 2000 2001 2002 2003 2004 2005
Rm
n,co
nsta
nt20
00pr
ices
Basic iron &steelBasic non-ferrous metalsMetal productsMachinery&equipmentElectrical machineryMotor vehicles,partsOther transportequipment
Source: Quantec
The employment losses have been significant, with only some recovery of employment inrecent years, particularly in metal products and machinery & equipment (Figure 2). Theretrenchments in manufacturing have largely been of low skilled workers, withliberalisation being biased towards the demand for capital and high skilled labour(Edwards, 2005).8
Figure 2. Employment in metals and engineering industries
0
20000
40000
60000
80000
100000
120000
1994 1995 1996 1997 1998 1999 2000 2001 2002 2003 2004 2005
Basic iron &steelBasic non-ferrous metalsMetal productsMachinery&equipmentElectrical machineryMotor vehicles,partsOther transportequipment
Source: Quantec
Employment in motor vehicles & parts has been relatively stable, coupled with strongoutput growth, indicating very substantial improvements in productivity. Other sectors
8 When examining semi and unskilled workers it is found that tariff liberalization negatively affected thedemand for these workers the most (mandating a decline wages of 47 per cent in semi and unskilledmanufacturing jobs) (Edwards, 2005: 24). By comparison liberalization was found to benefit capital andskilled workers.

12
have experienced restructuring and job losses with relatively poor output performance(with the exception of basic iron & steel). Overall, this suggests substantial restructuringhas been undertaken in response to the challenges of liberalisation, including makingsubstantial improvements to labour productivity. To understand whether and how this hasrelated to addressing the apartheid legacy in employment and training, and firm responsesto the government interventions described above, we examine a set of firms in the metalsand engineering industries.
3. The reality of empowerment – firm responses to the aspirations andregulations
After a brief overview of the firms studied, we assess the research results in terms ofownership, procurement, employment equity, and skills and training.
Overview
The majority of the firms interviewed were categorised as large (having more than 250employees). The remaining eight firms are of medium size, having between 50 and 250employees. At the time the interviews were conducted the firms interviewed employed atotal of 36 350 workers. Eight of the firms were in the auto sector (including componentsand tyre manufacture) while two firms are state-owned enterprises. (See Appendix Table 1for a summary of the information from respondent firms.)
The firms include both local and foreign owned firms. Six have significant ownershipstakes held by black empowerment entities, but none is majority black-owned. Themarkets served cover a broad spectrum, including firms supplying SOEs and the miningand liquid fuels industries.
Ownership
In considering ownership, thirteen firms were hundred percent locally-owned while ninewere entirely foreign owned, with the remainder having a mix of foreign and localownership. This reflects the high levels of internationalisation, especially in the autosector, where both assemblers and first tier component manufacturers are generally part ofmultinational groupings. In other sub-sectors of metals and engineering South Africanfirms have strong international linkages, which include, but extend beyond, ownership(see also Walker, 2005). These linkages reflect the importance of technology in machinery& equipment and in manufacturing of components with high specifications.
Only six firms were black empowered9 and only one firm is listed on the JohannesburgStock Exchange. The firms considered to be black empowered were mostly influenced bytheir relationship with industry empowerment charters (for example, the mining andpetroleum charters) or by the Preferential Procurement Act and sales to government and/orState Owned Enterprises (SOEs). However, for one firm the BEE ownership wasmotivated by the need to source input supplies (of scrap metal) from SOEs.
In four cases the sales of black equity were designed to just reach the 25.1 per cent targetfor being ‘empowered’. However, this includes a firm for which reaching the target
9 At least 25.1% owned by black persons, this includes Africans, Indians and Coloureds.

13
required an owner identified as being ‘black influenced’ to be added-in (to increase theexisting 20 per cent black ownership).10
In addition, the black ownership in the firms studied does not include the major emergingblack conglomerates such as Mvelaphanda, Safika, Shanduka, ARM and Kagiso. The BEEownership consists of a mixture of employee ownership schemes and smaller BEE groups.
When we examine the composition of the company boards it is clear that, even with six ofthe 25 firms being black empowered, the boards overwhelmingly remain dominated bywhite males (Figure 3). As expected, in the black empowered firms there is a greaterrepresentation of black men and women, but in these firms, white males still account for47 per cent of board members, white females account for 23 per cent, with just 24 per centbeing black males and only 6 per cent black females. In short, even in black empoweredfirms the boards are entirely unrepresentative.
Figure 3. Participation at board level by race and gender, all firms studied, 2005
WhiteMale76%
WhiteFemale9%
BlackMale12%
Black female3%
As might be expected, black people and women in general are very poorly represented onthe local boards of foreign owned companies. Just 9 per cent of board members are blackmales and there are no black females at all.
Procurement and demand-side pressures
Nine firms interviewed directly supply significant proportions of output to SOEs and/orgovernment. Seven firms supply directly to the mining sector and six to the petroleumsector, both of which have existing empowerment regulations set by legislation.
10 The significantly black influenced owner also cites receiving an ‘A rating’ from Empowerdex in theirBEE credentials.
14
Interestingly foreign-owned firms are more likely to sell to SOEs and the mining andpetroleum sectors than locally-owned firms. This is due to foreign firms dominating thecapital equipment and technology input markets in South Africa. Four of the six blackempowered firms that were interviewed have direct relationships with industries that aregoverned by BEE charters.
Five of the firms supply more than 60 percent of their output to one firm. Two of thesesupply auto assemblers, one supplies Telkom, one supplies an electrical equipmentmanufacturer and one is an SOE. Here the customer could leverage its bargaining powerto discipline a supplier to adhere to certain practices and provisions, that is, BEElegislation or regulations. This depends on the balance of power between the supplier andthe buyer. For example, in one case a firm indicated that preferential procurement has noimpact because it is a monopoly supplier.
This is reflected in a more widely observed pattern. Very few firms that supply togovernment departments, state-owned enterprises, or the mining and petroleum sectors,were negatively affected or lost business contracts to their competitors because of non-compliance to BEE standards. Only two firms reported losing contracts to empoweredcompetitors – one case in the auto sector and one in mining/construction.
The weak impact from procurement is particularly the case with foreign-owned firms,because there is ambiguity as to how current BEE legislation relates to them. In addition,firms that supply highly technical inputs are shielded from BEE imperatives sincecompetitive pressures are severely limited. However, an equipment manufacturer didcomplain about losing market share to local firms importing cheaper equipment. Inaddition, there is one case of a firm (not identified as empowered) establishing anempowerment subsidiary for the sole purpose of dealing with government.
Notwithstanding the very limited moves so far, there is apparently increasing pressure onfirms to report their BEE status. For example firms supplying the construction industrysector indicated that the industry charter that is currently under consideration would forcethem to address black economic empowerment.
Where there are no charters endorsed or no codes of good practice published, as is the casefor multinational corporations, firms appear to adopt a wait and see approach rather thanproactively engage in issues of empowerment, including employment equity and skillsdevelopment.
Procurement of firms studied
In the case of the inputs of goods and services purchased by the firms themselves, therehas been a move to buy from BEE firms, especially in the case of services. Twelve firmsinterviewed source more than 20 percent of their support services from BEE firms whileseven firms purchase more than 20 percent of technical and material inputs from BEEfirms (Figure 4). One firm identified using Empowerdex to rate possible suppliers,although this firm was not immediately sensitive to procurement concerns in the form of acharter or SOE/government procurement.

15
Figure 4. Proportion of support services and technical input source from BEE firms
0
2
4
6
8
10
12
14
16
0% < 20% 20-60% > 60%Proportion sourced from BEE firms
No.
of f
irms
Support servicesTechnical and material input
In general, BEE firms supply the non-essential support services such as security,gardening, catering and cleaning. In the case of technical and material inputs thosesourced from BEE firms tend to be basic materials such as scrap metal inputs for afoundry. Firms reported that in the metals sector there are simply no independent BEEfirms that have the capabilities to do the research, design and engineering of intermediateand final goods.11 In a rare case where a motor component producer managed to source atechnical part from a BEE firm, the changed specification of the part requested by theOEM was found to be beyond the scope and capabilities of the BEE supplier. Thecomponent manufacturer had no choice but to source the part elsewhere from a non – BEEfirm.
Of the firms interviewed four have outsourced their support services to former employees.Although the outsourcing of non-core activities to former employees from designatedgroups could aid black enterprise development, in certain instances firms conduct theseactivities to undermine the existing employer-employee relationship. In one case a firm isoperating covertly within the confines of another firm. In another case a firm continuouslyout-sources activities to a former employee (not from a designated group) to the detrimentof its own workers.
The ambiguity and problems in what is identified as ‘empowered’ is immediately evidentwhen the products sourced is probed further. The three firms claiming to source in excessof 60 per cent of technical/material inputs from BEE firms all rest their claims on incorrector dubious grounds. One is in fact sourcing from Mittal Steel. Mittal is apparentlyclaimed as an empowered supplier on the grounds of ethnicity, with no reference to theimpact of apartheid. The second firm is sourcing from BHP-Billiton, and incorrectlyrecording it as empowered. The third sources its products from Trident Steel, part of theAveng industrial grouping, formerly part of the Anglovaal conglomerate and nowcontrolled by institutional investors. In other words, these respondents either mistakenly orwilfully mis-represented their own purchases. Given that these are large firms and that
11 This is similar to observations in Chabane (2006).

16
procurement is an important part of DTI’s planned scorecard, this raises important doubtsabout its implementation.
Notwithstanding these important caveats, there is little difference between foreigncompanies and local companies in sourcing services and/or inputs from BEE suppliers.For foreign-owned firms the impact of the Preferential Procurement Act, and the miningand petroleum charters, were reported as key considerations given the importance of theSOE, mining and petroleum markets for these firms. Procurement was viewed as a way topresent a BEE image where ownership could not change. Alternatively, there is simplebusiness sense in sourcing services from BEE firms, as these are activities with low entrybarriers that are outsourced to reduce costs.
Of the firms interviewed large firms were more likely to source more than 20 percent oftheir support services from black businesses compared to medium size firms (Figure 5).But, there was no such difference in the sourcing of inputs, with medium firms just aslikely to source significant proportions from BEE firms as large firms are.
Figure 5. Proportion of support services sourced by firm size
0
1
2
3
4
5
6
0% < 20% 20-60% > 60%
Proportion sourced from BEE firms
No.
of f
irms
MeduimLarge
Surprisingly, the two SOEs captured in the study were not doing very well in sourcinginputs from BEE firms despite being governed by the Preferential Procurement Act.Reasons given include the unavailability of competent BEE firms to supply highlytechnical inputs. Black empowered firms seem to fare much better in sourcing technicalinput from other black empowered supplier firms, but this appears from investigation to beas much to do with (mis)representation of the credentials of the suppliers. Firms with a25.1 per cent or more black shareholding are sensitive about their empowerment profile asone of their competitive characteristics and seek also to maximise the apparent purchasesthey themselves make from BEE firms.

17
In general for the firms interviewed, procurement decisions are usually made by aprocurement executive, financial executive, and chief executive or managing director.These decisions are largely implemented by mid to junior level managers and buyers. Inmedium firms an owner-manager usually implements and makes the procurementdecisions. In most of the firms interviewed procurement decision-makers were whitemales. Only in three of the firms interviewed were the procurement decision-makersblack.
Seven of the firms interviewed indicated that a procurement or transformation committeemakes procurement decisions taking BEE into consideration. Of these firms, two are state-owned enterprises and three are considered black empowered. A further one of the firmsis a multinational, which has relatively progressive BEE policies. For example, it has adedicated unit that focuses exclusively on BEE issues in the workplace. In other words,even the large locally-owned firms (which are not empowered in terms of ownership) donot have such structures for their own procurement. The exception is a wholly-ownedfamily business with a dedicated management committee responsible for procurementissues, comprising one white male and three blacks, including a shop steward.
Most of the firms thought that price, quality and technological capability were the definingprocurement trends of the past decade. Only a few firms highlighted the importance ofBEE. In selecting potential suppliers most firms consider price and quality the mostimportant followed by technological capability. Eleven firms rated price as the mostimportant criteria while three applied an equal weighting to price and quality. Five firmsrated quality as most important.
Price becomes less important where more technical products and related activities aresourced. Firms indicated that having an accreditation to an international quality system,for example, International Standards Organisation, is important for continued business.This is so, particularly when supplying to Original Equipment Manufacturers (OEMs).These accreditation requirements by firms to potential suppliers act as a barrier to entryfor start-up BEE firms. For some firms affected by industry charters and the PreferentialProcurement Act, BEE is increasingly becoming a consideration with their customers.Future procurement decisions will definitely be informed by compliance to BEElegislation. Many firms thought that quality, ability to deliver and technological know-how will still supersede any BEE conditions.
Most firms interviewed consider the ownership component of BEE as the most importantcriteria in considering the BEE status of a supplier. With the exception of a few largefirms most firms consider checking the BEE status of their suppliers as a cost issue andclaim not have the resources to conduct comprehensive BEE audits.
Supplier development programmes are potentially important if BEE procurement is to bepart of a broader network of competitive suppliers. In this regard, over half of the firmsstudied did have supplier development programmes. The firms thus clearly recognise theimportance of their supplier network in their own performance. But, as highlighted above,this is not generally associated with developing black businesses. BEE procurement isgenerally limited to services, where barriers to entry are low and firms can easily competeon their BEE credentials in addition to other characteristics, while offering an outsourcingoption that lowers the costs of the service at the expense of lower wages and increasedinsecurity on the part of those employed in these activities. Procurement relationships

18
have not, from the sample of firms studied, been part of enabling the growth of black-owned small and medium firms.
Employment equity
In terms of the Employment Equity Act all the firms interviewed were designatedemployers. Despite having more than 600 employees and being a large supplier to localgovernment, one of the firms interviewed has never submitted an employment equityreport since the legislation was introduced. In one case a firm has reduced its employmentfrom over 1000 employees to less than 150 employees, which alters the firm’s filingresponsibilities in terms of the Act. In an opposite scenario a firm has almost doubled itsemployment from 36 employees to 69, which also had implications for its filingresponsibilities.
Figure 6 provides an overview of the employment profile from 2002 to 2004 for the firmsstudied with data available. African males are the largest single group, due (as illustratedbelow) to their share in semi and unskilled categories. The share of African females, whilelow, has increased over the period, although again this is due to changes in the unskilledcategory.
Figure 6. Employment profile of firms for 2002, 2004
0
2000
4000
6000
8000
10000
12000
14000
16000
18000
20000
2002 2004
Num
ber
ofem
ploy
ees
Black femaleBlack maleWhite femaleWhite male
Of the firms interviewed fourteen reported having employment equity committees orforums tasked with the implementation, monitoring and evaluation of employment equityplans. The committees generally have representation from management, labour and otherdesignated groups identified in the Act. Usually, the human resource manager or directorchairs such meetings. The remaining firms reported that the CEO, plant manager or humanresource manager does the implementation, monitoring and evaluation of employmentequity plans.

19
Interestingly of the firms interviewed most of the human resource managers were blackmales. This could be due to various reasons: including that black managers will better beable to ‘deal with’ issues of industrial relations, employment equity, and BEE. Anotherreason could be that being appointed to human resources has no real influence on theoperational decision-making structure of the firm, and so is where firms choose to appointblack managers.
Not surprisingly an observation of the study was that black managers were more likely torespond positively to participate in the study.
Management level
In this historically male dominated sector, female representation is very poor across thedifferent occupation levels. White males still dominate the decision-making structures ofthe firms in the metals sector with very insignificant black representation. In totalmanagement12 white males constitute close to eighty percent, followed by black males(below twenty percent) and overall female representation at about 10 percent (Figure 7).Black female representation in management positions remains incredibly low. Theproportions are almost identical for local and foreign owned firms.
Figure 7. Management profile, average across firms
0%
20%
40%
60%
80%
100%
2002 2004 2002 2004 2002 2004 2002 2004
Total management Top management Senior management Middle management
Black femaleBlack MaleWhite FemaleWhite Male
When management is disaggregated further it becomes evident that at top managementblack representation has in fact been declining over the period, with black malerepresentation falling to 10 per cent in 2004. Black representation is hardly higher atsenior management level, typically functional managers with significant decision-making
12 Total management consist of the top three occupational levels as reported in the Employment EquityReports. The EE Act requires that firms listed on the JSE change the demographics of their top management(directorship level). This however could not be assessed for the firms taking part in the study because, ashighlighted previously, only one of the interviewed firms was listed on the JSE.

20
powers. Clearly very little has been done to employ previously disadvantaged individualsin decision-making positions during the period being studied.
The effective exclusion of black people from decision-making in firms was confirmed inthe interviews. And, despite the desire of the legislature for a genuine process ofempowerment, at least one of the local firms interviewed openly admitted to using theirblack female director as a front in securing contracts with government departments.
Only at middle management level has the proportion of white males declined slightly(although remaining overwhelmingly the largest). Here their positions appear to have beentaken by white females.13
Technical level
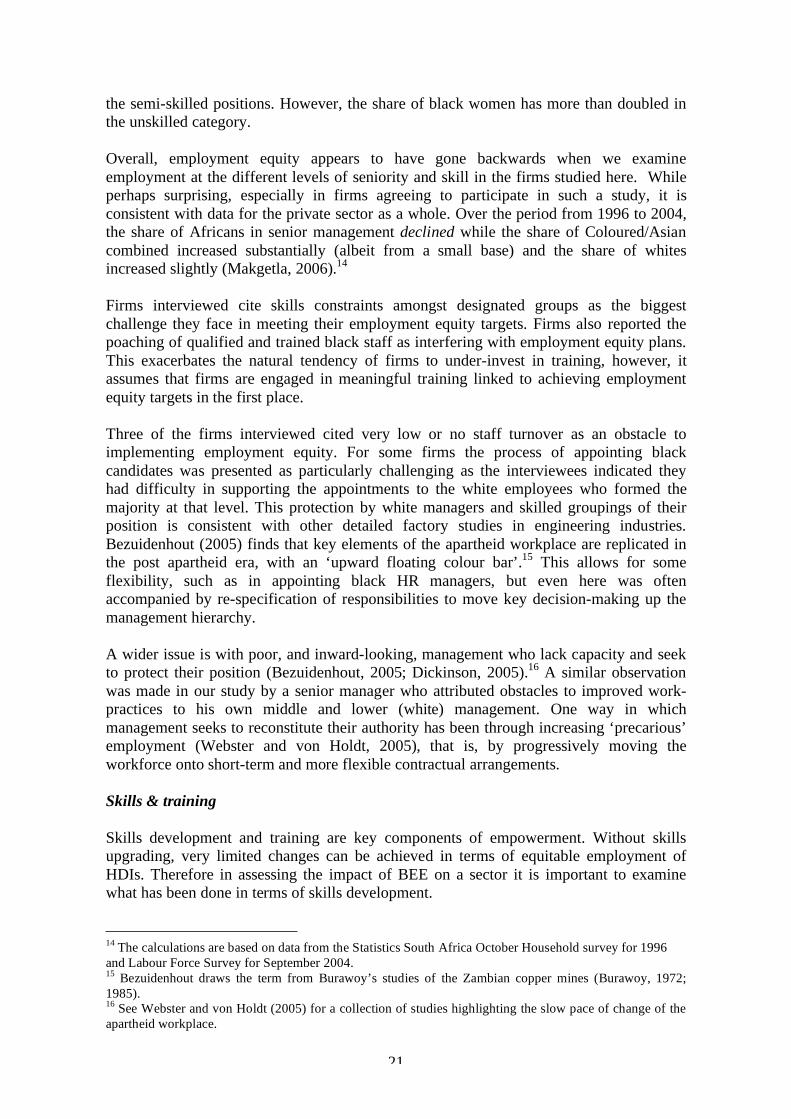
At the level of skilled professionals, white males slightly outnumber black males (Figure8). The relative significance of whites at this level is expected given the historicaleducational advantages afforded to whites under apartheid’s job reservation laws. Inaddition, the share of black technically skilled employees has seen a decline from 2002 to2004, with an increase in the share of white females.
Figure 8. Profile from skilled to unskilled, average across firms
0%
20%
40%
60%
80%
100%
2002 2004 2002 2004 2002 2004
Skilled professional Semi-skilled Unskilled
Black femaleBlack MaleWhite FemaleWhite Male
Foreign owned firms are more representative at this level than locally owned firms.Foreign owned firms had an average of 52 per cent black employees in skilledprofessional positions in 2004, compared to just 36 per cent for locally owned firms.
Not surprisingly, black males have the greatest representation among the semi- tounskilled level given the legacy of apartheid. There has been little change since 2002 in
13 Although specifically this change is largely due to one firm doubling the number of white femalesreported in middle management from 50 in 2003 to 107 in 2004.
21
the semi-skilled positions. However, the share of black women has more than doubled inthe unskilled category.
Overall, employment equity appears to have gone backwards when we examineemployment at the different levels of seniority and skill in the firms studied here. Whileperhaps surprising, especially in firms agreeing to participate in such a study, it isconsistent with data for the private sector as a whole. Over the period from 1996 to 2004,the share of Africans in senior management declined while the share of Coloured/Asiancombined increased substantially (albeit from a small base) and the share of whitesincreased slightly (Makgetla, 2006).14
Firms interviewed cite skills constraints amongst designated groups as the biggestchallenge they face in meeting their employment equity targets. Firms also reported thepoaching of qualified and trained black staff as interfering with employment equity plans.This exacerbates the natural tendency of firms to under-invest in training, however, itassumes that firms are engaged in meaningful training linked to achieving employmentequity targets in the first place.
Three of the firms interviewed cited very low or no staff turnover as an obstacle toimplementing employment equity. For some firms the process of appointing blackcandidates was presented as particularly challenging as the interviewees indicated theyhad difficulty in supporting the appointments to the white employees who formed themajority at that level. This protection by white managers and skilled groupings of theirposition is consistent with other detailed factory studies in engineering industries.Bezuidenhout (2005) finds that key elements of the apartheid workplace are replicated inthe post apartheid era, with an ‘upward floating colour bar’.15 This allows for someflexibility, such as in appointing black HR managers, but even here was oftenaccompanied by re-specification of responsibilities to move key decision-making up themanagement hierarchy.
A wider issue is with poor, and inward-looking, management who lack capacity and seekto protect their position (Bezuidenhout, 2005; Dickinson, 2005).16 A similar observationwas made in our study by a senior manager who attributed obstacles to improved work-practices to his own middle and lower (white) management. One way in whichmanagement seeks to reconstitute their authority has been through increasing ‘precarious’employment (Webster and von Holdt, 2005), that is, by progressively moving theworkforce onto short-term and more flexible contractual arrangements.
Skills & training
Skills development and training are key components of empowerment. Without skillsupgrading, very limited changes can be achieved in terms of equitable employment ofHDIs. Therefore in assessing the impact of BEE on a sector it is important to examinewhat has been done in terms of skills development.
14 The calculations are based on data from the Statistics South Africa October Household survey for 1996and Labour Force Survey for September 2004.15 Bezuidenhout draws the term from Burawoy’s studies of the Zambian copper mines (Burawoy, 1972;1985).16 See Webster and von Holdt (2005) for a collection of studies highlighting the slow pace of change of theapartheid workplace.

22
As indicated under the methodology section, training could only be assessed based oninformation available from 18 firms in 2004. This restricted examining who is beingtrained in terms of race and gender and at what occupational categories. In addition to theinconsistency of reporting employment and training data, section E of the EE report thatreflects training data does not take into account the fact that one individual may receivemultiple training opportunities. For example, an operator on the factory floor couldreceive some artisan-related training, adult basic education, and health and safety training,but is counted as three persons who received training.
Despite these severe data constraints, limited conclusions can be drawn from the trainingdata for 2004 obtained from 18 firms. The numbers trained in 2004 were equivalent to 48per cent of all employees in the firms studied. The averages differ somewhat by race. Theaverage by race and gender show that black men received more training in 2004, at 77percent, followed by white males and black females (61 percent). On average whitefemales received the least amount of training.
Of the six firms that are black empowered, training information for 2004 was onlyavailable for three of them. It is interesting to note that in two of the black empoweredfirms training opportunities were more available to white employees than blackemployees. And, in the remaining BEE firm white males received multiple trainingopportunities compared to blacks. This seems to suggest that, despite black ownership,very little has been done to filter empowerment through to the workplace in terms ofproviding training opportunities, confirming the narrow perspective in implementing BEEadopted by firms.
Inferences on the type of training that blacks received can be drawn from the face to faceinterviews that were carried out. In one instance, the HR manager (white female) made itvery clear that training for the predominantly black factory workers is restricted to theirdaily operations. She made an example of the union requesting training in basic computerskills / literacy but said the firm refused because it is not a competency required for theirjob on the factory floor and that the firms will not train a forklift driver how to use acomputer because he does not need to know this. In another instance the HR manager(white male) indicated that the firm had two black workers, whom they took throughtechnikon training and management courses but as soon as they reached the level of juniormanagement were poached by other firms that doubled their salaries. This has led toreluctance to train black workers in especially fields such as engineering and related skills.A large equipment manufacturer who spends about one percent of its payroll on trainingindicated that less than five percent of training budget is spent on HDIs because themajority of them are the low end of the organisational structure and the kind of trainingprogrammes that they are put on are most in–house and not expensive. The white maleworkers, however, because they are mainly in the middle and upper level of theorganisational chart, are sent for more advanced and thus more expensive training.
Twelve firms interviewed have not appointed a skills development facilitator despite itbeing a requirement of the Skills Development Act. At least one firm cited the outsourcingof their human resources function as a reason for not appointing a skills developmentfacilitator. In some firms the human resource manager performs the skills developmentfunction. Others reported that the training manager was tasked with this function.

23
4. Weak links? Empowerment in practice
The study presents a sobering picture. Indeed it can be argued that far from links in broad-based black economic empowerment being strong or weak, they appear almost non-existent. This must be set against the obvious point that skills development andemployment equity are integral to addressing the far-reaching legacy of apartheid inindustry and in setting a broader-based economic growth and development trajectory.
The metals and engineering industries were chosen due to the purchase of direct andindirect ‘levers’, in the form of SOE and government procurement and the variouscharters, on firms. The operation of these levers is meant to be linked to broad-basedaspects of empowerment. In addition, the fact that these firms are unionised would suggestadditional pressure acting on them to implement skills development and employmentequity given the provisions in the legislation for organised labour to be consulted.However, here also the findings are that the links are weak or non-existent aside fromlimited evidence that it has been a factor in firms being ‘empowered’ in terms of equity.Unsurprisingly, important suppliers to government, mines and SOEs ignore the pressureswhere they have bargaining power in the supply relationship. The effectiveness ofprocurement as a lever requires rivalry between firms on BEE criteria, and forimplementation to be properly monitored.
In the firms’ own procurement spend a picture of BEE as a managing of perceptions andpublic relations emerges. Important suppliers identified as being empowered turned outnot to be so, again raising questions about the effective measurement and monitoring ofperformance on BEE criteria. Sourcing of services from BEE firms appears to coincidewith the trend to outsourcing and contracting of non-essential services such as cleaningand catering, which also has the effect of weakening the bargaining power of (mainly)black labour. Conversely, supplier development programmes are widespread, but notlinked to developing a wider supplier base with greater black participation.
Our findings on employment equity reveal almost no substantive improvement, and blackrepresentation at top management has declined notwithstanding a marginal increase in theproportion of black females. At the skilled professional and semi-skilled levels there hasalso been a decline in the proportion of black employees. This is almost entirely due to asubstantial increase in the proportion of white females, suggesting that firms have soughtto increase the representation of those classified as historically disadvantaged through thepromotion of white females.17 Only at the unskilled level has black representationincreased, driven by an increased share of black females. This is the level at whichgreatest moves have been made towards using labour contracting arrangements, meaningmore precarious employment. Such arrangements, while being used by firms to reducelabour costs, also militate against investment in training.
In terms of skills development, black males appear to have a higher probability of havingreceived training than other groups. But, on closer inspection, this related mainly toelementary training, carried out on-the-job, such as health and safety. This represents acontinuation of the patterns observed under apartheid, noted above (Joffe et al., 1995;MERG, 1993). And, there was no evidence of a link between employment equity andtraining. Furthermore, the black empowered firms (defined in terms of ownership) are nomore likely to be progressive in these terms. Also of significance are the findings of
17 This interpretation was confirmed by a senior representative of the main industry association.

24
simple non-compliance with the employment equity and skills development legislation ina large number of cases.
These patterns are all the more concerning given that skills have been highlighted onceagain as one of the most important challenges for the government’s recently adoptedAccelerated and Shared Growth Initiative for South Africa (ASGISA). Investing intraining was also strongly related to better firm performance in recent research onindustrial development (Machaka and Roberts, 2006; CSID, 2005).
This all raises the complex underlying question as to why have firms have responded inthis way. One answer lies in the intense pressures for industry restructuring which firmsin this sector have been subject to. The firm strategies are generally consistent with firmsadopting a defensive approach to liberalisation, maintaining the hierarchical andauthoritarian management structures while seeking to cut costs (as also found by thecontributors to Webster and von Holdt, 2005). The substantial employment reductions inthe sector described at the outset is also consistent with a relatively weak bargainingposition for trade unions on concrete issues of empowerment and transformation in theworkplace. An important caveat, however, is that the results represent the broad patternsacross the firms studied, and there is some diversity within the group.
Another set of explanations relate to the fact that, notwithstanding the raft of legislation,government attention with regard to empowerment has perhaps been more focused onownership, and particularly ownership in the commanding heights of minerals andresources. And, attention in the running of State Owned Enterprises has been largelyfocused on their corporatisation and privatisation. While this has gone along withchanging the senior management of these SOEs to ensure it is more representative, it doesnot follow that the new management necessarily has strong incentives to leverage theirprocurement power for BEE when their own performance is being monitored based on thesimple bottom line.

25
References
BEE Commission (2001) Black Economic Empowerment Commission Report. Johannesburg:Skotaville Press.
Bezuidenhout, A. (2005) ‘Post-colonial Workplace Regimes in the Engineering Industryin South Africa’, in Webster and von Holdt (eds.)
Burawoy, M. (1972) The Colour of Class on the Copper Mines: From AfricanAdvancement to Zambianization, Lusaka: Institute for African Studies.
Burawoy, M. (1985) The Politics of Production, London: Verso.
Chabane, N. (2006) ‘Private procurement and the development of Black SMMEs inEkurhuleni’, in Roberts, S. (ed.) Sustainable Manufacturing? The case of South Africa,Cape Town: Juta Press.
Chabane, N., Goldstein, A. and S. Roberts (2006) ‘The changing face and strategies of bigbusiness in South Africa: more than a decade of political democracy’, Industrial andCorporate Change, 15(3): 549-578.
Conger; J.A. and Kanungo, R.N., 1988, ‘The Empowerment Process: Integrating Theoryand Practice”, The Academy of Management Review, 13, (3): 471-482.
CSID (2005) ‘Firm Performance, Training and Skills Development – Results fromEkurhuleni Survey 2004’ A report prepared for the Department of Labour.
Dickinson, D. (2005) ‘Beyond Marshmallow Mountain: Workplace Change in the NewSouth Africa’, in Webster and von Holdt (eds.)
Edwards, L. (2005) ‘Trade Liberalisation and Labour Demand in South Africa during the1990s’, Strategies and Analysis for Growth and Access (SAGA) Working Paper October2005.
Fine, B. & Rustomjee, Z. (1996) The political economy of South Africa - from minerals-energy complex to industrialisation. London: Hurst.
Friedmann. J, 1992 ‘Empowerment: The Politics of Alternative Development’, Cambridge,Blackwell Publishers
FRIDGE (Fund for Research into Industrial Development Growth and Equity), (2003)Study to facilitate the formulation of an Integrated Strategy for the Retention and Creationof Employment in the South African Metals and Engineering Sector. Sandton: IndustrialDevelopment Corporation
Joffe, A., D. Kaplan, R. Kaplinsky and D. Lewis (1995) Improving ManufacturingPerformance in South Africa: The Report of the Industrial Strategy Project, Cape Town:UCT Press.
Machaka, J. and S. Roberts (2006) ‘Addressing the apartheid industrial legacy: localeconomic development and industrial policy in South Africa – the case of Ekurhuleni’ in

26
Roberts, S. (ed.) Sustainable Manufacturing? The case of South Africa, Cape Town: JutaPress.
Machaka, J. and S. Roberts (2003) ‘The DTI’s new ‘Integrated Manufacturing Strategy?Comparative industrial performance, linkages and technology’, South African Journal ofEconomics, 71(4), 679-704.
Makgetla, N. (2006) ‘BEE and Class Formation’, New Agenda 22: 47-58.
MERG (Macroeconomic Research Group) (1993) Making Democracy Work: A Frameworkfor Macroeconomic Policy in South Africa, Cape Town: Centre for Development Studies.
Ponte, S., S. Roberts, L. van Sittert (2006) ‘Understanding Black EconomicEmpowerment (BEE) in South Africa’, paper presented at workshop ‘To BEE or not toBEE? South Africa’s ‘Black Economic Empowerment’ (BEE), Corporate Governance andthe State in the South’, Danish Institute for International StudiesCopenhagen, 26-27 June, 2006.
Roberts, S. (2005) ‘Industrial development and industrial policy in South Africa – a tenyear review’, presented at Conference on South African Economic Policy UnderDemocracy – A Ten Year Review, Stellenbosch, 28 & 29 October 2005.
Seekings, J. and N. Nattrass (2006) Class, Race, and Inequality in South Africa.Scottsville: University of KwaZulu-Natal Press.
Sen A. (1983) Poverty and Famines: An Essay on Entitlement, and Deprivation. Oxford:Oxford University Press.
Sen, A. (1984) Resources, Values and Development. Oxford: Blackwell
Sen. A. (1999) Development as Freedom. Oxford: Oxford University Press.
Walker, M. (2005) ‘Unpacking the Nature of Demand and Supply Relationships in theMining Capital Goods and Services Cluster: The Case of PGMs’, Paper presented at theTrade and Industrial Policy Strategies 2005 Annual Forum – Johannesburg.
Webster, E. and K. von Holdt (eds.) Beyond the apartheid workplace: studies intransition. Scottsville: University of KwaZulu-Natal Press.
Von Holdt, K. (2003) Transition from Below: Forging Trade Unionism and WorkplaceChange in South Africa. Pietermaritzburg: University of Natal Press.