weak links in the seismic load path of unreinforcei
386
lÉ-tr- () AN INVESTIGATION OF THE WEAK LINKS IN THE SEISMIC LOAD PATH OF UNREINFORCEI) MASONRY BUILDINGS Kevin Thomas Doherty B.E. Hons (Civil) The University of Adelaide A thesis submitted to the Faculty of Engineering at The University of Adelaide for the Degree of Doctor of Philosophy Department of Civil and Environmental Engineering, 'n"'ïi;Äi[ff#""'o' May 2000
-
Upload
khangminh22 -
Category
Documents
-
view
2 -
download
0
Transcript of weak links in the seismic load path of unreinforcei
lÉ-tr- ()
AN INVESTIGATION OF THEWEAK LINKS IN THE SEISMIC
LOAD PATH OF UNREINFORCEI)MASONRY BUILDINGS
Kevin Thomas DohertyB.E. Hons (Civil) The University of Adelaide
A thesis submitted to the Faculty of Engineering at The University of Adelaide for theDegree of Doctor of Philosophy
Department of Civil and Environmental Engineering,
'n"'ïi;Äi[ff#""'o'
May 2000

Amendments To Thesis'An Investigation of the Weak Links in the Seismic Load Path of Unreinforced
Masonry Buildings'
A1 Replace on Page 53, Figure 4.2.1the text 'Rigid Frame Fixed to LaboratoryStrong Floor'' with 'Stationary Reference Datum'.
A2 Insert the following regression coefficients to the figures indicated
Figure4.4.3 R=0.999Figure 4.4.4 R=0.996Figure4.4.5 R=0.997Figure4.4.6 R=0.998Figure4.4.7 R=0.999Figure 4.4.8R=0.988
The regression coefficient R for the plots indicate a very good correlation of thetest data with a straight line.
A3 Insert the following paragraph as a new second paragraph on page 106:Under the assumption adopted of unreinforced masonry building systems havingstiff shear waìl and diaphragms the restrained translation of floors providing equalinput motions at the base on top of wall specimens is appropriate. This is not thecase however where floor diaphragms are flexible such as those constructed oftimber. Where this is the case the response of the floor diaphragm may govern thewall response with possibly quite different inputs at the base and top of the wall.Here a different dynamic stability problem than that being investigated in thecurrent research project may develop as it is possible that the walls will not crackat mid-height but will rock about their base after a crack forms at the base bed -
joint. Consequently these systems will have a much lower frequency thari thaf ofthe individual wall panel.
A4 Insert the following paragraph as a new third paragraph on page 219:The following points summarise the salient findings of the bending tests:. Confirmation of mid-height cracking and dynamic stability problems. Damping associated with the rocking walls was determined and generally
found to be of the order of 5Vo. Rayleigh Damping was found to bestapproximate the damping by combining both stiffness and mass proportionaldamping components. Increases in damping where found at high and lowfrequencies,
. The force displacement relationship for URM walls cracked at mid height wasassessed via push tests. Here the variation in the force displacementrelationship with wall slenderness, boundary conditions, precompression anddegradation due to rocking cycles where determined. A tri-linear approximationof the force displacement relationship was proposed to best approximate the truerelationship with empirically derived points to define the initial stiffness andplateau for various levels of wall degradation.
. The effective resonant frequency associated with the frequency for maximumdisplacement amplification was determined for URM walls cracked at mid
height for various slenderness, boundary conditions, precompression anddegradation due to rocking cycles.
Both displacement and acceleration responses were recorded for wallssubjected to transient, impulse and free vibration for later comparison withan al ytically derived response.
a
A5 Insert the following paragraph as the final paragraph on page220:Since the current research project has focussed on the one-way bending ofunreinforced masonry walls to now take jnto account the two-way bending actionwhich is often observed in seismic failure modes further research is required.Further as the assumption of the restrained translation of floors providing equalinput motions at the base on top of wall specimens appropriate for unreinforcedmasonry building systems having stiff shear wall and diaphragms has beenadopted fulther research is requiled to take into account flexible floor diaphragmsand shear walls.
A6 Typographical errors:page9,line l4page l6,1ine 6page 43,line 3page 47,line 8
page 49,line l1page 51, titlepage 221, I 0'r' CitationThroughout document
replace'earthquake' with'earthquakes'replace 'Masonry' with 'masonry'replace 'Section 0' with 'Section 2.4'replace 'Chapter 0' with 'Chaprter 4'replace 'f6"' with 'f¿'replace'Connection' with'Connections'replace'P.D.' with'D.P.'replace 'Nigel Priestly' with 'Nigel Pliestley'
A7 Insert the following paragraph as the final paragraph on page 47.Along with variations in local material properties the wide variety of testconfigurations discussed above may also be responsible for the wide scatter ofreported results. In particular in-plane tests are seen to be particularly sensitive tovariation in test configuration. Typically an average shear stress along the frictionplane is used to determine the friction coefficient. Accordingly where three highbrick plisms have been used for in plane testing the average shear stress and thusfrictional coefficient determined may be significantly effected by the endconditions and the moment induced at the friction plane. By adopting wallets withmultiple brick lengths the effect of the end conditions and the variation in normalstresses over the friction plane is reduced.
Insert the following paragraph as the final paragraph on page 54.The results of the in plane tests presented in Figures 4.4.6to 4.4.8 show a
regression coefficient of near unity thus indicating a very good linear correlation.Although in plane tests are always difficult due to the nature of pure shear tests thegood linear correlation indicates the assumption of a uniform shear stress for thederivation of the average friction coefficient is appropriate. In reality, due to theheight of the lead weights a lever arm and thus overturning moment exists so thata triangular stress profile is likely. Here the increase in frictional resistance at theend subject to the increased vertical stress is offset by the decrease at the opposite
end. As a result the average frictional resistance is unaffected and thus thederivation of the average frictional resistance remains appropriate.
Due to the length of the four brick wallets any end effects are also not apparent inthis test series.
A8 Add to Section 3.3.2last paragraph on page 42: Expected differential movementsassociated with tirne dependant behaviour of URM walls including concreteshrinkage or clay masonry expansion are generally in the order of around 3mm permeter run of wall. This is dependant on ¡nany factors as has been brieflydiscussed.
Tests associated with the time dependant movement of URM connectionscontaining DPC have recently been undertaken at the University of Newcastle,New South Wales, Australia. These tests have highlighted that under shrinkagecreep the frictional resistance force appears to be less than under dynamic loading.Consequently, the connections have been observed to slip undel the timedependant forces but are less likely to slip under dynamic loading.
A9 Insert the following paragraph as the final paragraph on page 49:It is widely recognised that vertical accelerations associatecl with seismic loadingmay effectively reduce the gravitational force at the friction interface of DPCconnections. As a result, the frictional resistance and thus the shear resistivecapacity of the connection is also reduced. The SAA Masonry Code takes thisreduction into account in the derivation of the frictional resistance in Equation3.4.1 by the application of the 0.9 factor applied to the gravitiational force. Theshear friction strength of the shear section under earthquake actions is thus definedby
Vt" = 0.9 G,c k,
410 Page 55, last paragraph replace 'Although these four specimen tests were carriedout at only one value of vertical compressive stress (0.164MPa) both in-plane andout-of-plane shaking were examined so that a total of eight tests were undertaken.''With 'Since each of the four standard and centered connection specimen wheretested at only one value of vertical compressive stress (0.164MPa) a total of eighttests were undertaken.'
Page 57, first paragraph replace 'The slip joint tests were performed over a rangeof three normal compression stresses being 0.04, 0.18 and 0.33 MPa conductedonly in the in-plane direction.'With 'The slip joint tests were performed over arange of three normal compression stresses being 0.04, 0.I 8 and 0.33 MPaconducted both in the in-plane and out-of-plane directions.'
All It is noted that the term 'overburden' used throughout the document may be morecommonly referred to as 'Pre-compression'.
Ã12 It is noted that in Section 6.3.1 the Characteristic bond strength should have beencalculated taking into account the specimen size. Also the standard deviation

values reported being based on three tests are relatively meaningless however areprovided as indicative for the quality of masonry.
413 Page 115 second paragraph replace 'The brickwork modulus was then calculatedfor each specimen as the chold modulus between 57o and 33Vo of the ultimatebrickwork compressive strength, f',n.' with 'The brickwork modulus was thencalculated for each specimen as the chord modulus associated with the linearportion of developed stress - strain curve.'
Page 115 last paragraph replace 'Table Ç3.2 presents a summary of the modulustest results ranging from 3,300 MPa to 16,000 MPa for the l lOmm specimens and6,'/00 MPa to 9,800 MPa for the 50mm specimens. While the results variedsignificantly the modulus values were typically found to be relatively high asexpected of modern masonry.' With 'Table 6.3.2 presents a summary of themodulus test results ranging from 4,000 MPa to 10,000 MPa for the l10mmspecimens and 5,000 MPa to 8,000 MPa for the 50mm specimens. It is suspectedthat the large apparent variation in the brickwork modulus is due toinconsistencies in the preparation of the five brick prisms. Here any slighteccentricity of construction causes non uniform loading of he prism so that themodulus calculation in some cases may have been slightly modified. The modulusresults attained however are provided typically the results are quite high as wouldbe expected of modern masonry.'
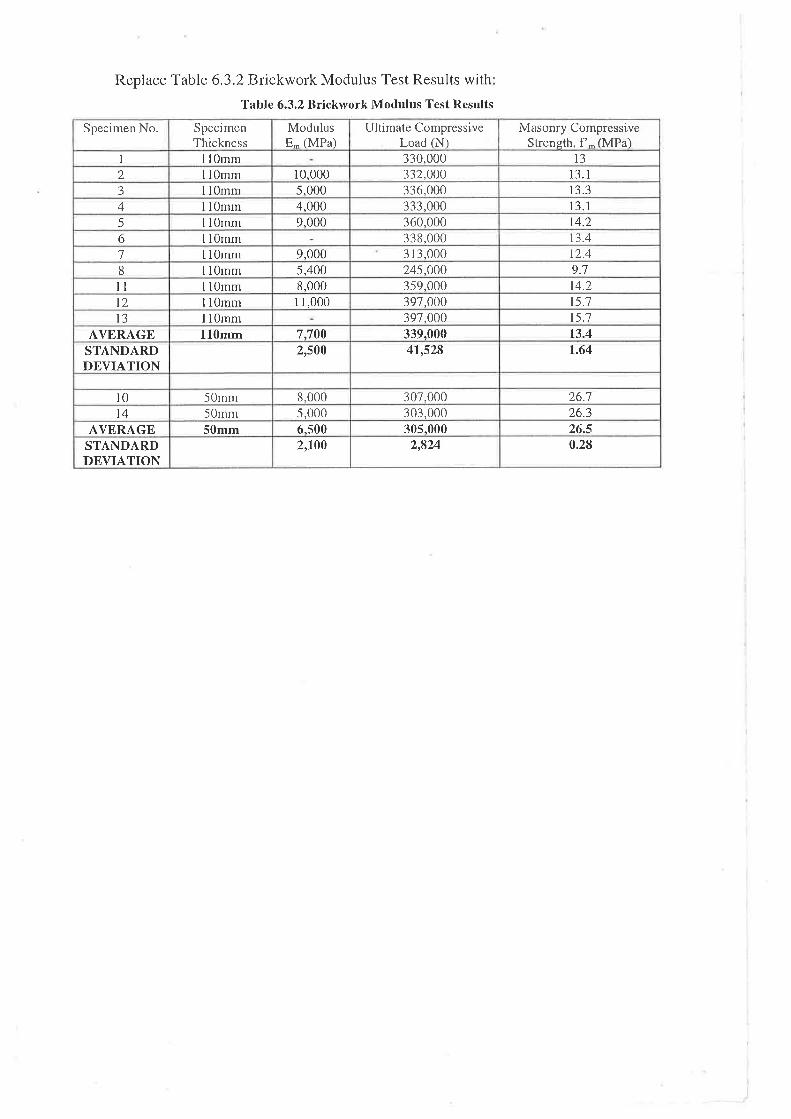
Replace Table 6.3.2Brickwork Modulus Test Results withTable 6.3.2 Brickwork Modulus Test Results
Specimen No. SpecimenThickness
ModulusE- (MPa)
Ultimate CompressiveLoad (N)
Masonry Compressi.veStrength, f'- (MPa)
l lOmm 330.000 13
2 l1Omm 10,000 332,000 13.1J l1Omm 5.000 336,000 13.34 I .l 0rnrn 4,000 333,000 13.1
5 llOmm 9,000 360,000 t4.26 llOmm 338,000 \3.41 l1Omm 9,000 313,000 t2.48 l10lnm 5,400 245,000 9.1t1 l1Omm 8,000 359,000 14.2t2 l1Omrn I 1,000 397,000 15.113 I lOlnm 397,000 15.1
AVERAGE 11Omm 7,700 339,000 13.4STANDARDDEVIATION
2,500 47,528 1.64
l0 50mm 8,000 307.000 26.114 50mm 5,000 303,000 26.3
AVERAGE 50mm 6.s00 305.000 26.5STANDARDDEVIATION
2,Loo 2,824 0.28

TABLE OF CONTENTS
TABLE OF CONTENTS ................
LIST OF FIGURES
LIST OF TABLES
ABSTRACT v
DECLARATION
ACKNOWLEDGMENT
1. INTRODUCTION.. 1
1.1. Study Objectives and Key Outcomes
l.2.Brief Outline of Report
2. EARTHQUAKES AND UNREINFORCED MASONRY
2. 1. lntroduction..........
2.2. Ausr: alian Seismicity ............
2.3.IJRM Building Stock in Australia
2.4. IJRM Vulnerability in Moderate Seismicity Regions .................2.4.l.Fa1ture Modes of URM Elements (Related to Seismic Load Path)...2.4.2.Review of the Seismic Performance of URM Buildings
ll
vr
xrl
..20
..212.4.3.Common URM Element Failure Modes2.4.4.'Weak Link' URM Failure Modes ........
3. 1. Introduction..........
3.2. General Friction Review3.2.1. Coulomb Friction Behaviour .........,
3.2.1.1. Classically Behaving Materials
.25
.29
2.5.'Capacity' Design for Improved Seismic Response
2.6 Overall Project Aim.....
3. DPC CONNECTIONS IN IJRM CONSTRUCTION..... ......34
3l32
34
3535
l1
37
TABLE OF CONTENTS
3.2.1.2. Polymers
3.3. LJRM Connection: Previous Research3.3.1. Plain-Masonry Joint Shear3.3.2. Serviceability Requirements ........3.3.3. Positive Anchorage.............3.3.4. Shea¡ Resistance of URM Connection Containing DPC Membrane....
3.4. Australian Code Provision: URM Connections ............
3.5.Implication of the Dynamic Friction Coefficient
3.6. Specific Research Focus
4. DYNAMIC SHEAR CAPACITY TF^STS ON TJRM CONNECTIONCONTAINING DAMP PROOF COTJRSE MEM8RAN8.............
4.1. Introduction...
4.2. Dynarmc Shear Tests..........4.2.1. Instrumentation4.2,2. D amp-Proof Course Membrane and Materials ................4.2.3 . Dynamic Test Methodolo gy....................4.2.4. DPC Connection Tests ................4.2.5. Slip Joint Connection Tests...................
4.3. Results Formulation and Data Analysis.......4.3.l.Data Filtering4 .3 .2. Dynamic Friction Coefficient Representative Calculation4.3.3. Theoretical Check
4.4.Dynamic Test Results .......4.4.l.DPC Connection Dynamic Test Results .........4.4.2. Slip Joint Connection Dynamic Test Results..4.4.3. Comparison of Dynamic with Static and Quasi-Static Test Results .....
4.5. Summary and Conclusion: Implication for Design.
5.2. Fundamentals of Out-of-Plane URM WalI Behaviour.......5. 2. I . Post-cracked Force-Disp lace ment (F-A) Relationship5.2.2. Boundary Condition Impact on Force-Displacement Relationship..5 .2.3 . Un-cracked Force-Displacement Relationship ................
5.2.3.L. Low Applied Overburden Force5.2.3.2. High Applied Overburden Force
5.3. Previous Research: Experimental Studies5.3.1. Static Tests .........5.3.2. Dynamic Tests...
5. STABILITY OF SIMPLY SUPPORTED IJRM lryALLS SUBJECTED TOTRANSIENT OUT.OF-PLANE FORCES. ............69
5.1. Introduction
37
.........,....38
..............38'......,,.....41....,,,.......43
,...,...44
...,,...48
........50
........50
5758596l62626467
68
..70
.69
lll
TABLE OF CONTENTS
5.4. Critical Review of Current Analysis Methodologies5.4. 1 . Quasi-Static Analysis Procedures5 .4.2. Dynamic Analysis Procedures ...............
5.5. Specific Research Focus
6.2. General Test Set Up6.2.1. Test Specimens6.2.2.Test Rig.....6.2.3. Instrumentation .....
7. 1. Introduction............
.92
.97
6. OUT-OF.PLANE SHAKE TABLE TESTING OF SIMPLY SUPPORTED IJRMwaLLS .............102
101
102
111rt2lt4tt7tt7119tt912072r124737142143t45149153r53160
6. I . Introduction..........
........... 103
........... 103
...........105,.......... 109
6.3. Material Tests...6.3.1. Bond Wrench .........6.3.2. Modulus of Elasticity......6.3.3. Mortar Compressive Strength ...............
6.4. Out-of-Plane Testing of Simply Supported URM Walls.........6.4.l.Data Filter....6.4.2. U n-cracked Natural Frequency of Vibration
6.4.2.1. Comparison with Simple Elastic Beam Theory............6.4.3. Specimen Lateral Capacity Analysis6.4.4. Harmonic Excitation Tests6.4.5. Static Push Tests6.4.6. Free Vibration Tests .........
6.4.6.1. Non-linear Frequency - Mid-Height Displacement Relationship6.4.6.2. Non-linear Dynamic Force- Mid-Height Displacement Relationship.....6.4.6.3 . Non-linea¡ Damping-Frequency Relationship ................
6.4.7 . Transient Excitation Tests...6.4.7.1. Pulse Tests6.4.7 .2. Real Earthquake Excitation Tests
7. NON.LII\EAR TIME IIISTORY ANALYSIS D8V8LOPMENT.......................163
7 .2.Brief Description of Basic Linear SDOF System ............164
7.3. Negative Stiffness System Modelled as a Basic Linear SDOF System....... .........167
7.4. Rigid Simply Supported Object Rocking Response About Mid-height - DynamicEquation of Motion.. ......... 169
7.5. Semi-rigid URM Loadbea¡ing Wall Dynamic Equation of Motion .....................174
7.6. Modelling of Non-Linear Damping............ ... 180
7.7.Event Based Time-Stepping 4na1ysis................ ............... 183
1V

TABLE OF CONTENTS
7.8. Comparison of Experimental and Analytical Results ..... 184
8. LTNEARTSED DTSPLACEMENT-BASED (DB) ANALYSTS ...........188
8. I . Linearised DB Analysis Methodology.........
8.2. Proposed Linearised DB Analysis....8.2. I . Derivation of Characteristic SDOF' Substitute Stucture' Stiffness8.2.2. Simply Supported llRM Walls Modelled as a SDOF Oscillaror..
8.2.2.1. Modelled Displacement Capacity8.2.2.2. Modelled Damping Appropriate During Rocking Response
8.3. Effectiveness of the Linearised DB 4na1ysis...............8.3.1. Effective Resonant Frequency of Simply Supported URM Walls8.3.2. Linearised DB Analysis8.3.3. THA for Various Transient Excitation8.3.4. Comparison of Predictive Model Results...............
8.4. Conclusion ..205
9. STTMMARY AND CONCLUSIONS 218
REFERENCES
APPENDIX (A): Band Pass Filter Program FortranTT Code
APPENDIX (B): Representative DPC Connection Test Results
APPENDIX (D): Rigid F-Â - Various Boundary Conditions
APPENDIX (E): Material Test Resulrs
APPENDIX (F): Simply Supported Wall Test Results
APPENDIX (Itr): Non-linea¡ Time History Analysis Experimental Confirmation........339
188
190192194194195
195197199200202
APPENDIX (C): Representative Slip Joint Connecrion Test Results.............................251
221
241
247
25s
261
275
APPENDIX (G): Non-linear Time History Analysis ROV/MANRY - ForhanTT Code3lg
v
LIST OF FIGURES
Figure 1.1.1 Depiction of Damage During the 62 AD Earthquake in Pompeii... 2
Fi gure 2.2.1 Aastralia's Tectonic l-ocation................. 11
Figure 2.3 .1 lnternal Partition'Wall' Cornice' Connection Detail....... 18
Figure 2.3.2 URM Cavity Wall to Roof Truss Connection Detail (Inner L¡adbearing)...18
Figure 2.3.3 LJRM Cavity Wall to Roof Truss Connection Detail (Outer Loadbearing)..19
Figure 2.3.4 tlRM Wall to Inter Story Floor Slab DPC Connection Detail.......................19
Figure 2.3.5 IJRM Wall to Ground Floor Slab DPC Connection Detail............................19
Figure 2.4.1 Seismic [,oad Path for Unreinforced Masonry Building.... .........21
Figure 2.4.2Parapet Failure, Tighes Hill Campus, Newcastle Technical College ............22
Figure 2.4.3 Masonry Damage During 1997 labalpar, India Earthquake .......24
Figure 2.4.4Damage to URM Building, Tangshan, China, 1976........... .........29
Figure 3.1.1 Types of URM Connection Containing DPC Membranes.............................35
Figure 3.2.1Diagrammatic Representation: Frictional Resistance vs Applied Shear.......38
Figure 3.3.1 Shear Failure Hypothesis .41
Figure 3.3.2 Results of Typical Quasi-static on DPC Connection .47
Figure 4.2.1 Schematic URM Connection Containing DPC Dynamic Test Set-up ..........53
Figure 4.2.2Test Specimen Free Body Diagram: DPC Connection during Sliding.........55
Figure 4.2.3 Dynamic Test Set-up for Standa¡d/Centered DPC Connection.....................56
Figure 4.2.4Photograph of Standard DPC Connection Set up - In-plane.........................56
Figure 4.2.5 SchematicDiagram of Dynamic Test Set-up For Slip Joint Connection......57
Figure 4.3.1 Dominant Response Acceleration Frequencies................. ...........58
Figure 4.3.2Parabolic Sided Band Pass Filter - Bandwidth
Figure 4.3.3 Relative Connection Displacements
Figure 4.3.4 Response Acceleration above Slip Interface during Slipping.....
Figure 4.3.5 Hysteresis Behaviour after Slip showing Maximum Shear Resistive Force.60
.59
.60
.60
V1
LIST OF FIGURES
Figure 4.4.1 Graphical Results Summary for Standard DPC Connection Tests.......... ......62
Figure 4.4.2 Grapbical Results Summary for Centered DPC Connection Tests.......... ......63
Figure 4.4.3 Out-of-plane Slip Joint - I Layer of Standard Alcor .. 65
Figure 4.4.4 Out-of-plane Slip Joint Test - 2Layers of Standard Alcor............................65
Figure 4.4.5 Out-of-plane Slip Joint Test - 2Layers of Greased Galvanised Steel..........
Figure 4.4.6Ln-plane Slip Joint Test Results - I Layer of Standard Alcor.Figure 4.4.7 ln-plane Slip Joint Test Results -2Layers of Standa¡d AlcorFigure 4.4.8 In-plane Slip Joint Test Results -2[-ayers of Greased Galvanised Steel
Figure 5.1.1 Out-of-plane \ilall Failure during Loma Prieta Earthquake, 1989................70
Figure 5.2. 1 Real Semi-rigid Non-linear Force-Displacement Relationship
Figure 5 .2.2 P ost-cr acked Frequency-Displace ment Relationship ... ....
Figure 5.2.3Un-cracked F-À for Low Applied Overburden Sftess URM Wall 82
65
66
66
66
74
78
5.2.4Un-cracked F-À for High Applied Overburden Stress URM Wa11................83
5.3.1 Comparison of Yokel Study with Simple Rigid Body Theory......................85
5.3.2 Typical Lateral Failure of Brick V/all .......... .............85
5.3.3 Comparison of West etal1973 Tests with Simple Rigid Body Theory.......87
5.3.4 Top of Parapet Wall Disp. Correlated to Table Velocity and Acceleration..gl5.3.5 Top of Parapet Wall Disp. Conelated to Table Disp........... ........91
5.4.1 Quasi-Static Linear Elastic Design Methodology............... .........94
Fi gure 5 .4.2 Expenmental and An alytical F-AComp ari son
Figure 5.4.3 Compa¡ison of Analysis Predictions....... 99
Figure 6.2.1 Standard Three Hole Extruded Clay Brick (110mm)
Figure 6.2.2 Constuction of URM Wall Panels ...................
Figure 6.2.3Top 'Cornice' Support Connection
Figure 6.2.4 Out-of-plane Test Rig
Figure 6.2.5 Overburden Rig............
Figure 6.2.6Top Vertical Reaction - Overburden Test RigFigure 6.2.7 Out-of-plane Wall Test Instrumentation Locations ...................
Figure 6.3.1 Bond Wrench Apparatus Dimensions (1lOmm Brick)..............
Figure
Figure
Figure
Figure
Figure
Figure
Figure
96
104
105
106
707
107
108
109
vl1
Figure 6.3.2 Bond Wrench Test Set Up
113
113

LIST OF FIGURES
Figure 6.3.3 Five Brick Prism at Ultimate Compressive Load 115
Figure 6.4.1Un-cracked Natural Frequency of Vibration 50mm Non-loadbearing Wall120
Figure 6.4.2 Cunent Available Analysis Comparison - 11Omm Thick WaII.......... .......I22
Figure 6.4.3 Current Available Analysis Comparison - 110mm Thick WaII.......... .......122
Figure 6.4.4Un-cracked Non-loadbearing URM Wall Ha¡monic Excitation Test ........129
Figure 6.4.5 Pre-cracked Non-loadbearing URM Wall Harmonic Excitation Test........ 130
Figure 6.4.6 Un-cracked Non-loadbearing URM Wall Harmonic Excitation Test ........134
Figure 6.4.7 Un-cracked Non-loadbearing URM V/all - First Cracking........................ 135
Figure 6.4.8 Un-cracked Non-loadbearing URM Wall - First Rocking 135
137Figure 6.4.9 Static Push Test
Figure 6.4.10 Comparison of 11Omm Specimen Static Push F-A with Analytical......... 139
Figure 6.4.11Comparison of 50mm Specimen Static Push F-A with Anal¡ical........... 140
Figure 6.4.12 Mid-height Rotation Joint Condition............ ........l4lFigure 6.4.13 Free Vibration Calculation............ ....143Figure 6.4.14 50mm Specimen Frequency vs Average Cycle Mid-Height Disp............144
Figure 6.4.15 110mm Specimen Frequency vs Average Cycle Mid-Height Disp. ........145
Figure 6.4.t6 50mm Wall Dynamic F-A Relationships (Various Overburden)..............147
Figure 6.4.17 110mm Wall Dynamic F-Â Relationship................ ................147
Figure 6.4.18 50mm Wall Compa¡ison of Static and Dynamic F-Â Relationships........ 148
Figure 6.4.19 110mm Wall Comparison of Static and Dynamic F-A Relationship........ 149
Figure 6.4.20 50mm Wall Non-linear ( vs Frequency (Various Overburden)............... 150
Figure 6.4.2150mm Wall Non-linear Cs¡,op/ùI" vs Frequency (Various Overburden) . 151
Figure 6.4.22 Non-loadbearing 11Omm Wall Non-linear ( vs Frequency............... ......I52
Figure 6.4.23 Nonloadbearing 50mm and 110mm'Wall Csr,oe/lVl, vs Frequency ........152
Figure 6.4.24 0.5H2 Normalized Gaussian Displacement Pulse Input....
Fi gure 6.4.25 Correspondin g Acce leration Input.
Figure 6.4.26 Effective Resonant Frequency (By Wall Thickness and Overburden) .... 159
r54154
Figure 7 .2.t Basic Linear SDOF System.............. 165
Figure 7.3.1 Negative Stiffness F-Â Relationship 167
Figure 7.4.1 Non-loadbearing Simply Supported Object at Rocking at Mid-height...... 171
Figure 7.5.1 Tri-tinear 'Semi-rigid' Non-linear F-Â Relationship Approximation........ 175
vlll

LIST OF FIGURES
Figure 7.5.2Tri-ltnear F-A Approximation for Va¡ious V/all Degradation
Figure 7.5.3 Analytical vs Experimental F-A- 11Omm, No Overburden...........
Figure 7.5.4 Analytical vs Experimental F-Â- 50mm, No Overburden...........
Figure 7.5.5 Analytical vs Experimental F-A- 50mm, 0.07MPa Overburden
Figure 7.5.6 Analytical vs Experimental F-Â- 50mm, 0.15MPa Overburden
Figure 7.6.1 Experimental I vs Rayleigh 6 - 50mm \ù/all, No Applied overburden.....
Figure 7 .6.2 lterative Damping 182
Figure 7.7.1 'Pseudo Static' F-A relationship 183
Figure 7.8.1 Comparison of Analytical and Experimental Pulse Test Results ............... 185
Figure 7.8.2 THA and Experimental Peak Pulse Mid-height Disp. Response................ 186
Figure 7.8.3 Comparison of Analytical and Experimental Earthquake Test Results ..... 187
Figure 8.1.1 Linearised DB Analysis for Elastic Perfectly Plastic System..................... 189
Figure 8.2.1 Typical Elastic Displacement Response Spectrum ................... 191
Figure 8.2.2Linearised DB Analysis Characteristic Stiffness, IÇ6
176
178
179
179
779
181
193
251
252
Figure 8.3.1Gaussian Pulse: 3.3m Tall, 110mm Thick, Moderate Degradation THA ... 198
Figure 8.3.2 Relative ElCent¡o Earthquake Elastic Response Specftum (3Vo damping) 200Figure 8.3.3 THA ElCentro Earthquake: 1.5m Tall, Moderate Degradation.......... ........201Figure 8.3.4 ElCentro Earthquake: 3.3m Tall, Moderate Degradation............................ 201
Figure 8.3.5 ElCentro Earthquake: 4.0m Tall, Moderate Degradation............................202
Figure 8.3.6 Comparison of DB Analysis and THA Ultimate Instability Prediction .....203Figure 8.3.7 R*(1) vs THA Ultimate Instability Prediction. ......204Figure 8.3.8 'Quasi-static' Rigid Body vs THA Ultimate Instability Prediction...........205
APPENDICIES
Figure B 1 - Standard DPC Connection One Layer of Standard 41cor...........................247
Figure B 2 - Standard DPC Connection One Layer of Super 41cor......... ....248Figure B 3 - Standard DPC Connection One Layer of Polyflash ................ ....................249
Figure B 4 - Standard DPC Connection One Layer of Dry-Cor (Embossed Potythene) 250
Figure C 1- Slip Joint Two layers of Standard Alcor .......Figure C 2- Slip Joint One layer of Standa¡d 41cor..........
lx
LIST OF FIGURES
Figure C 3- Slip Joint Two layers of Greased Galvanised Steel..........
Figure C 4- Slip Joint One layer of Embossed Polythene (Dry-Cor)
253
254
281
282
282
283
284
285
286
287
288
Figure D 1 - Concrete Slab with DPC Connection Above........ 255
Figure D 2 - Rigid F-Â Relationship- Top Vertical Reaction at læeward Face.............257
Figure D 3 - Timber Top Plate Above............ 258
Figure D 4 - Rigid F-Â Relationship- Top Vertical Reaction at Centerline ................ ...260
Figure E 1 - Bond Vy'rench Calibration Plot 110mm Brick Specimen Bond Wrench....26l
Figure E 2- Bond Wrench Calibration Plot 50mm Brick Specimen Bond'Wrench.......26l
Figure F 1- Static Push Test - Un-cracked, 11Omm, No Overburden .........275
Figure F 2- Static Push Test - Un-cracked, 11Omm, 0.15MPa Overburden ..................275
FigureF3-StaticPushTest-Cracked, 11Omm, 0.l5MPaOverburden ....,276
Figure F 4- Static Push Test - Cracked, 50mm, No Overburden ........... ......276
Figure F 5 - Static Push Test - Un-cracked, 50mm, 0.075MPa Overburden ..................277
Figure F 6- Static Push Test - Cracked, 50mm, 0.075 Overburden .............277
Figure F 7- Static Push Test - Cracked, 11Omm, No Overburden ........... ....278
Figure F 8 - Static Push Test - Un-cracked, 110mm, 0.15MPa Overburden ..................278
Figure F 9 - Static Push Test - UN-cracked, 11Omm, No Overburden........... ................279
Figure F 10- Static Push Test - Cracked, 110mm, No Overburden 279
Figure F 11- Static Push Test - Un-cracked, 1lOmm, No Overburden........................... 280
Figure F 12- Static Push Test (Hysteretic) - Cracked, 110mm, No Overburden ........... 280
Figure F 13- September9S Specimen 13 - Resonant Energy l¡ss Per Cycle
Figure F 14 - Static Push Test - Un-cracked, 11Omm, No Overburden..........
Figure F 15 - Static Push Test - Cracked, 50mm, 0.15MPa Overburden.......
Figure F 16 - Release Test (1) - 50mm, No Overburden...........
Figure F 17 - Release Test (2) - 50mm, No Overburden...........
Figure F 18 - Release Test (3) - 50mm, 0.075MPa Overburden
Figure F 19 - Release Test (4) - 11Omm, No Overburden...........
Figure F 20 - Release Test (5) - 110mm, No Overburden
Figure F 2l - Release Test (6) - 110mm, No Ove¡burden.....................
x
LIST OF FIGURES
Figure F 22 - 0.5H2 Half Sine Displacement Pulse, 50mm, No Overburden ........... ......289Figure F 23- 7.0HzHalf Sine Displacement Pulse, 50mm, No Overburden............. .....29O
Figure F 24 - 2.OHzHalf Sine Displacement Pulse, 50mm, No Overburden ........... ......291Figure F 25 - 0.5H2 Half Sine Displacement Pulse, 50mm, 0.075MPa Overburden .....292Figure F 26- 1.0H2 Half Sine Displacement Pulse, 50mm, 0.075MPa Overburden .....293Figure F 27 - Z.OHz Half Sine Displacement Pulse, 50mm, 0.075MPa Overburden .....294Figure F 28- 3.OHz Half Sine Displacement Pulse, 50mm, 0.075MPa Overburden ....295Figure F 29- 0.5}l2 Half Sine Displacement Pulse, 50mm, 0.l5MPa Overburden ........296Figure F 30- 1.0H2 Half Sine Displacement Pulse, 50mm, 0.15MPa Overburden........297
Figure F 31 - 2.0}J.2 Half Sine Displacement Pulse, 50nim, 0.15MPa Overburden .......298Figure F 32- 2.OHz Half Sine Displacement Pulse, 50mm, 0.15MPa Overburden ........299Figure F 33- 1.0H2 Half Sine Displacement Pulse, 110mm, No Overburden ................ 300
Figure F 34- l.0Hz Half Sine Displacement Pulse, 11Omm, No Overburden ................ 301
Figure F 35- 2.0}{2 Half Sine Displacement Pulse, 11Omm, No Overburden ........... .....302Figure F 36- 1.0H2 Gaussian Displacement Pulse, 11Omm, No Overburden................. 303
FigureF3T-l.O}lzGaussianDisplacementPulse, 110mm,NoOverburden.................304
Figure F 38- 1.0H2 Gaussian Displacement Pulse, 11Omm, No Overburden................. 305
Figure F 39- 1.0H2 Gaussian Displacement Pulse, 11Omm, No Overburden................. 306
Figure F 40- 0.5H2 Gaussian Displacement Pulse, 11Omm, No Overburden........... .....307Figure F 4l- 0.5H2 Gaussian Displacement Pulse, 11Omm, No Overburden................. 308
Figure F 42- 0.5}{2 Gaussian Displacement Pulse, I 10mm, No Overburden................. 309
Figure F 43- Transient Excitation Test - 66VoF,lcenfto, 11Omm, No Overburden........ 310
Figure F 44 - Transient Excitation Test - l00Vo Nahanni, I 10mm, No Overburden...... 31 1
Figure F 45- Transient Excitation Test - 200Vo Nahanni, 1 10mm, No Overburden.......3l2Figure F 46 - Transient Excitation Test - 300Vo Nahanni, 110mm, No Overburden......3l3Figure F 47 - Transient Excitation Test - 400Vo Nahanni, I 10mm, No Overburden...... 3 14
Figure F 48 - Transient Excitation Test - 66VoElCentro, 11Omm, No Overburden...... 315
Figure F 49- Transient Excitation Test - 66Vo Pacoima Dam, 110mm, No Overburden3l6Figure F 50- Transient Excitation Test - 80Vo Pacoima Dam, 1 10mm, No Overburd en3l7FigureF5l -TransientExcitationTest- lÙOVo PacoimaDam, llOmm,NoOverburden
xl
318

LIST OF TABLES
Table 3.3.1 DPC Connection Static Friction Coefficient Summary (Page 1994)..............46
Table 3.3.2 Slip Joint Connection Static Friction Coefficient Summary (Page 1994)......46
Table 4.2.lDPC Membrane Test Specimens
Table 4.4.1 Results Summary for Standard DPC Connection Tests...
Table 4.4.2 Results Summary for Centered DPC Connection Tests ..........
Table 4.4.3 Standard DPC Connection Friction Coefficient Comparison
Table 4.4.4 Slip Joint Connection Friction Coefficient Comparison
Table 6.3.1 Bond \ürench Test Results Summary
Table 6.3.2 Brickwork Modulus Test Results
Table 6.4.1 Experimental Phase Test Program
Table 6.4.2 Analysis of Test Specimen
Table 6.4.3 llOmm'Wall, Non-loadbearing - Harmonic Excitation Test Results.......
Table 6.4.411Omm Wall, 0.15MPa - Harmonic Excitation Test Results.............
Table 6.4.5 Result Summary of Static Push Tests
.54
.62
.63
.67
.67
Table 5.2.1 Rigid Bi-Linear F-A Relationship - Various Boundary Conditions 80
Table 6.2. 1 Out-of-plane'Wall Test Instrumentation Description 110
tt4116
118
124
t3r
Table
Table
Table
Table
Table
Table
6.4.6 Summary of Release Test Results
6.4.7 Summary of Key Pulse Test Results (50mm Walls)........
6.4.8 Summary of Key Pulse Test Results (110mm Walls)........
6 .4.9 Earthquake Excitation Descripti on
ó.4.10 Summary of Key Earthquake Excitation Test Results (50mm Walls)
6.4.71Summary of Key Earthquake Excitation Test Results (110mm Walls
Table 7.5.1 Dehning Displacements of the Tri-linea¡ F-A Approximation
......136
...... 138
......t43
...... 155
......157
...... 161
......162
) ....162
xll
t76
LIST OF TABLES
Table 8.4.1 ElCentro Analysis Comparison: 1.5m Height WallTable 8.4.2 ElCentro Analysis Comparison: 3.3m Height WallTable 8.4.3 ElCentro Analysis Comparison: 4.0m Height WallTable 8.4.4Taft Analysis Comparison: 1.5m Height V/aII........
Table 8.4.5 Taft Analysis Comparison: 3.3m Height V/all........Table 8.4.6 Taft Analysis Comparison: 4.0m Height WaII........
Table 8.4.7 Pacoima Dam Analysis Comparison: 1.5m Height WallTable 8.4.8 Pacoima Dam Analysis Comparison: 3.3m Height V/allTable 8.4.9 Pacoima Dam Analysis Comparison: 4.0m Height Wall .......Table 8.4.10 Nahanni Analysis Comparison: 1.5m Height Wa1I...............
Table 8.4.11 Nahanni Analysis Comparison: 3.3m Height WaII...............
Table 8.4.12 Nahanni Analysis Comparison: 4.0m Height WaII...............
206
207
....208
....209
....210
,...211
....212
....213
....274
....215
216
217
xllt
ABSTRACT
A large proportion of domestic and low rise building stock in Australia is of unreinforced
masonry (URM) construction and has not been designed to resist earthquake loads.
Previous researchers have identifred that under current Australian design conditions the
two predominant weak links in the seismic load path for URM buildings are the shear
connections between the walls and floor or roof and out-of-plane wall flexure.
This report documents the experimental and analytical research undertaken at The
University of Adelaide aimed at providing the fundamental tools required to successfully
avoid the identified brittle 'weak link' failures in the design of new and the assessment ofexisting URM buildings. This was achieved for the DPC connections through an
extensive series of shaking table tests, which provided realistic data on the dynamic
capacity of these connections. For the out-of-plane failure of walls in the upper stories of
URM buildings, an extensive series of shaking table tests was used to develop a botter
understanding of the physical processes governing the collapse behaviour. Following this
realistic anal¡ical models were developed to provide accurate and reliable assessment of
actual wall capacities. Since these were necessarily complex, a further refinement was
undertaken to produce a more simplistic but rational analysis procedure for practical
applications based on the 'Displacement-based' failure criteria.
xlv


DECLARATION
This thesis contains no material which has been accepted for the award of any otherdegree or diploma in any university or other tertiary institution and, to the best of myknowledge and belief, contains no material previously published or written by anotherperson, except where due reference is made in the text.
I give consent to this copy of my thesis, when deposited in the University Library, beingmade available for loan or photocopying.
Kevin Thomas Doherty Dare '2a lS lo-
xv

ACKNOWLEDGMENT
I would firstly like to recognise the contributions made throughout the duration of this
project by Associate Professor Mike Griffith of The University of Adelaide as his
foresight and direction \Mas largely responsible for the conception and success of this
project. I am also indebted to my collaborative researchers, Dr. Nelson Lam and Dr. John
V/ilson of The University of Melbourne for valuable research meetings, ideas and
discussions. I would also like to acknowledge the exceptional technical assistance
provided by the Laboratory staff at the Chapman Structural Testing Laboratory at The
University of Adelaide under the supervision of Mr. Greg Atkins.
Funding for this project was provided through an Australian Research Council grant as
well as a University of Adelaide Postgraduate Scholarship Award for which I am
appreciative.
I would also like to express my sincerest appreciation to my Mother and Father, Joan and
Lindsay Doherty for their guidance and encouragement throughout both my under- and
post-graduate careers. My Father, whom also being a structural engineer has spent many
nights discussing with me issues related to structural and earthquake engineering
providing me with motivation to succeed in my professional endeavors. Finally,I would
like to acknowledge the contribution of my Fiancée Tammie. For her endless tolerance
and support I am eternally indebted. The supports of these exceptional people have
provided me with the inspiration and resolve to undertake this project for which I am
extremely grateful.
XVI

I.. INTRODUCTION
From the time of earliest civilisation, the use of masonry has provided a successful
building technique. Examples of early stone masonry construction can be found dating as
far back as c. 9000 BC in Israel and to the better known pyramids of Egypt constructed
around c. 2800 - 2000 BC. Later, along with the emergent Roman Empire in around 700
BC, the use of masonry became widespread. Notable cities were established and
developed throughout the colony comprising elaborate masonry palaces, churches,
bridges and aqueducts. Over the centuries significant advancements have been made in
the processes of masoffy construction and to this day world cities have substantial
building stock comprised of unreinforced masonry (LJRM).
The main characteristics of masoffy that have enabled it to endure as a building medium
through the ages are both the simplicity of laying stones or bricks on top of one another
and the ready availability of materials and labour. Aesthetically, masoffy is available in
a vast array of colour and texture. Due to the small modular size of bricks and blocks it is
also extremely versatile in application in that it can be used to form a great variety of
shapes and sizes of walls, piers, arches, domes or chimneys. Furthermore masonry's
exceptional fire resistance prompted Charles II to insist that all buildings built after the
1666 Great Fire of t¡ndon be constructed of brick or stone. Durability, sound insulation
and thermal mass are other advantageous characteristics of masonry construction.
In contrast, from its very foundation, the intrinsic drawback of masonry construction has
been its poor seismic performance. While recent earthquakes have heightened modern
awareness of this problem (Benuska 1990, Page 1990, Somers 1994, Pham 1995,
Bruneau 1996, Spence 1999, Alcocer 1999,Pujol 1999) it is also evident that the problem
existed even from the early days of the Roman Empire (Dobbins 1994). One remarkable
example was the city of Pompeii. l,ocated near the Bay of Naples in ltaly, Pompeii,
1
CHAPTER ( I ) - Introduction
having been incorporated as a Roman Colony in 808C, had an estimated population ofbetween 8,000 and 12,000 people. It is believed that the final years of the city wereframed by two natural disasters. The first \ryas a devastating earthquake in 62 AD whichcaused considerable damage to the city's masonry infrastructure requiring large scale
rebuilding. The second, a cataclysmic eruption of Mount Versuvius 17 years later,
desfroyed Pompeii and the neighboring city of Herculaneum. The eruption of 79 AD issignificant here as the resulting ash layer preserved much of the evidence of theearthquake damage that would have otherwise been obscured had Pompeii endured
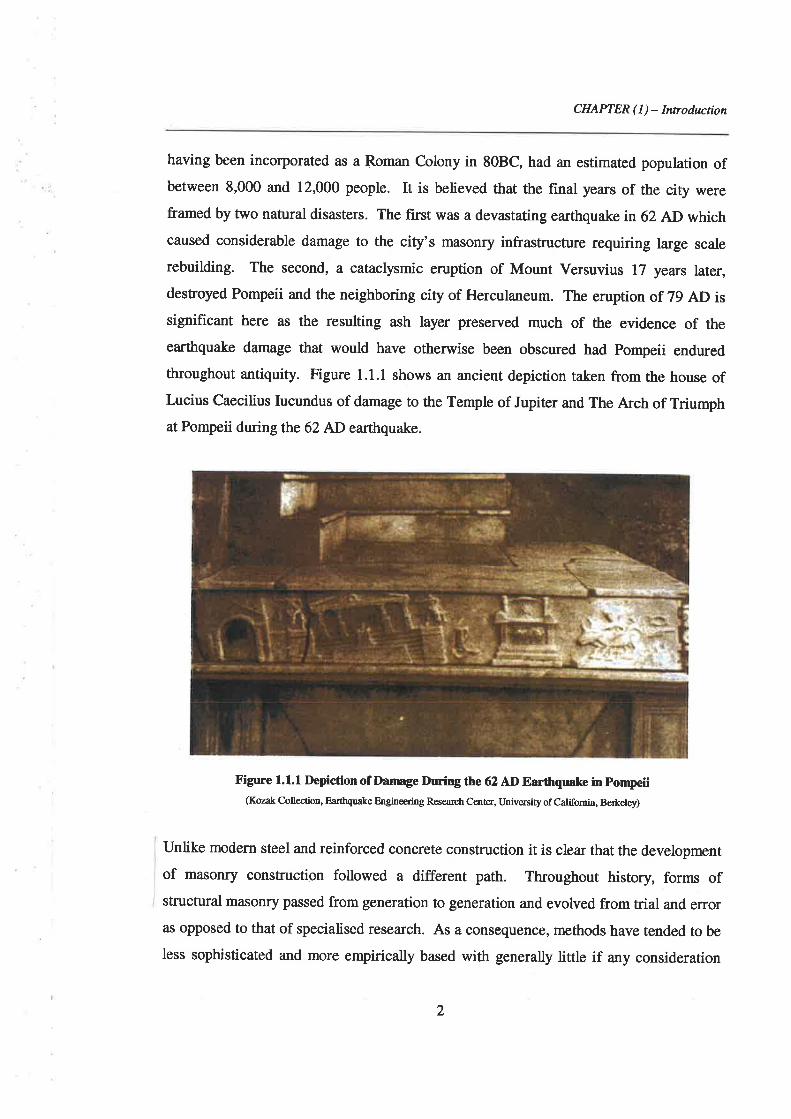
throughout antiquity. Figure 1.1.1 shows an ancient depiction taken from the house ofLucius Caecilius Iucundus of damage to the Temple of Jupiter and The Arch of Triumphat Pompeii during the 62 AD earthquake.
Figure 1.1.1 Depiction of Damage During the 62 AD Earthquake in pompeü(Kozak Collection, Earthquake Engineering Research Center, University of Califomia, Berkeley)
Unlike modern steel and reinforced concrete construction it is clear that the development
of masonry construction followed a different path. Throughout history, forms ofstructural masonry passed from generation to generation and evolved from trial and erroras opposed to that of specialised research. As a consequence, methods have tended to be
less sophisticated and more empirically based with generally little if any consideration
2
CHAPTER (l) - Intoduction
given to seismic action until comparatively recently. These buildings have thus tended to
be at greater seismic risk than comparable new buildings. This is not only because they
have not been designed for seismic loading requirements but also because they are less
capable of dissipating energy through large inelastic deformations during an earthquake.
Historically this has resulted in an abundance of seismically induced catastrophic
masonry failures often with a high loss of life. For example 50 years ago it was
customary to support floors on stone or masonry corbels. During an earthquake the floor
and walls would vibrate typically eventuating in the floor slipping from the corbel and
collapsing dramatically.
In response to the observed damage to un-engineered or poorly constructed buildings,
public prejudice developed against the use of structural URM. A consequence has been
its disappearance from modern construction in regions of high seismicity with a
respective increase in the popularity of steel and concrete construction. Owing to this
shift in focus comparatively little research has been undertaken on the ultimate dynamic
behaviour of URM construction.
Although the performance of URM buildings when subjected to earthquake excitation
has typically been poor there is also signif,rcant evidence suggesting that these buildings
do not necessarily perform poorly in areas of low to moderate seismicity (Scrivener 1993,
Tomazevic and lùy'eiss 1994, Abrams 1995). This was highlighted in 1989 in Australia by
the Mr5.6 Newcastle eafthquake. Here it was reported (Melchers 1990, Griffith 1991,
Page 1992, Murphy 1993) that while older masonry buildings, typically in poor condition
and not having been designed with any consideration to lateral loading, suffered
significant damage, many other masonry buildings performed well suffering only minor
or no damage at all. These findings have placed an increased pressure on engineers in
regions of low to moderate seismicity to continue taking advantage of the significant
beneficial characteristics of masonry construction by designing and detailing URM
buildings to perform adequately during an earthquake.
3
CHAPTER ( I ) - Introduction
The current URM research focus is therefore twofold. Firstly, there is a need torationalise the design of new URM buildings for regions of low to moderate seismicity.
This involves the identification of weaknesses in masonry construction practices and
correlating these to observed catastrophic failures. Consequent development and
implementation of design guidelines would then prevent future occurrences of similarbrittle failures occurring in newly designed structures.
Secondly, there is a need to assess the seismic vulnerability of the large numbers of URMbuilding stock of unknown quality and condition in cities around the world. These
structures were generally constructed prior to mandatory earthquake design requirements
and due to the sporadic nature of earthquake loading many remain untested against
seismic action. Earthquakes have repeatedly impressed the need to review the seismic
adequacy of existing masonry buildings. As a recent example historically significantstructures in Italy, having stood for hundreds of years, have failed dramatically under
seismic loading. These failures clearly illustrate the potential risk in assuming age-old
structures will last forever and the possible physical and social consequence of inaction.With these constant reminders owners are now recognising that they must reconcile thepotential for structural retrofitting with the level of seismic risk.
The distinction is drawn between the development of analysis and design procedures fornew and existing buildings since for the design of a new building a ceftain degree ofconservatism may impose only a minor economic penalty. In contrast, the same degree
of conservatism for the review of an existing structure may impose substantial economicpenalty and hence cross the line of being economically viable to seismically retrofit.Should the imposed economic penalty be deemed too great historically or socially
significant structures could be lost.
The research challenge therefore lay in establishing a better understanding of the physical
processes governing the collapse behaviour thus permitting the development of realistic,
accurate assessment methodologies for the determination of the dynamic capacity ofURM buildings and their constituent components.
4
CHAPTER ( 1 ) - Introduction
1.1. Study Objectives and Key Outcomes
The specific focus of the current research project was an investigation of the brittle 'weak
links' in the seismic load path for Australian URM buildings under earthquake loading.
As is discussed in more detail in Chapter (2) the 'weak links' are evident through the
review of damage surveillance documentation and have been confirmed through an
analytical study (Klopp 1998) as:
( 1) The limited force capacity of connections between floors and walls, in particular the
friction dependent connections containing damp proof course (DPC) membranes and
(2) the out-of-plane failure of walls in the upper stories of URM buildings.
The primary intention of the cunent project \Mas therefore to provide the fundamental
tools required to successfully avoid the identified brittle 'weak link' failures in the design
of new and the assessment of existing tlRM buildings. This was achieved for the DPC
connections through an extensive series of shaking table tests, which provided realistic
data on the dynamic capacity of these connections. For the out-of-plane failure of walls
in the upper stories of URM buildings, an extensive series of shaking table tests was used
to develop a better understanding of the physical processes governing the collapse
behaviour. Following this realistic analytical models were developed to provide accurate
and reliable assessment of actual wall capacities. Since these were necessarily complex,
a further refinement was undertaken to produce a more simplistic but rational analysis
procedure for practical applications. To encourage the ready introduction and acceptance
into the real design environment, where optimisation of design output is often the driving
force, it was necessary that the simplihed procedure be formulated through easily
understood and familiar concepts while still encompassing the essential ingredients of the
dynamic behaviour.
Since a building's structural capacity is related to its weakest link, by avoiding the
identif,red brittle 'weak link' failure modes the overall effective structural capacity and
thus seismic performance will improve. An additional beneht is that with a better
5
CHAPTER ( I ) - Introduction
understanding of the physical process governing the dynamic collapse behaviour,
designers will more readily be able to adopt the desirable 'Capacity' type design
approach discussed further in Chapter (2). Where this enables more ductile failure modes
to be activated, the structure's effective capacity and energy dissipating characteristics
will be further enhanced.
Although specifically related to Australian construction practices and conditions, it isexpected that these research outcomes are sufficiently general so that they will be easily
extrapolated to other regions of similar seismicity and construction techniques.
1.2. Brief Outline of Report
To set the overall scene a general overview of earthquakes and URM is presented inChapter (2) where the basic aspects of seismicity and URM performance, both
internationally and in Australia are covered. Following this, a brief review of the
development of seismic design criteria and URM construction practices in Australia are
presented as these dictate the standard of the existing URM buitding stock. This includes
the results of a survey performed as part of the current research project to catalogue
typical URM wall connections and levels of applied overburden stress based on
Australian masonry construction. A review of the vulnerability of LJRM failure modes
from reconnaissance documentation is then presented to conñrm the typical weak linkURM failure patterns in areas of moderate intensity shaking.
Chapters (3) and (4) are devoted to the shear capacity of URM connections containing
DPC membranes being, the first of the previously identified weak links. Chapter (3)
commences with a general description of connections containing DPC membranes. Aspecihc literature survey covering previous experimental and related work is then
presented. Chapter (3) concludes with the specific research requirement to be undertaken
within the scope of this project being the experimental dete¡mination of dynamic frictiondata for DPC connections typically used in Australian masonry construction.
6
CHAPTER ( I ) - Introduction
Chapter (4) presents the results of a series of dynamic friction tests for DPC connections.
Here the experimentally determined dynamic friction coefficients ¿re compared with
static test results (Page 1995, Griffith et al 1998) for connections of the same
configuration and concludes with recommendations on the suitability of current codified
friction coefficients.
Chapters (5) to (8) are devoted to the out-of-plane failure of walls in the upper stories of
URM buildings being the second of the weak links to be investigated. This is specifically
related to the dynamic stability of simply supported tlRM walls subjected to transient
out-of-plane forces.
Chapter (5) introduces the physical considerations that must be assessed for out-of-plane
analysis including boundary conditions and dynamic stabilising effects. Following this a
specific literature review is presented which hightights key aspects of previous related
experimental and analytical work. Further to the literature review a critical assessment of
currently available analysis and design methodologies for face-loaded URM walls under
one-way bending action subjected to transient excitations is presented. Here it is found
that the existing methods have serious limitations for the realistic prediction of the
ultimate dynamic wall capacity.
In Chapter (6) the key results of an extensive series of static push and shaking table tests
on simply supported face loaded LJRM walls are presented. Here the results of static,
impulse and free vibration tests are used to examine the non-linear force-displacement (F-
Â), frequency-displacement (fA) and damping characteristics of URM walls. Harmonic
and transient excitations are also used to examine the dynamic response at various
excitation frequency and amplitude content and for later confirmation of the
comprehensive analytical model.
Chapter (7) describes the development of a comprehensive analytical model for the semi-
rigid rocking response of post cracked URM walls subjected to out-of-plane forces. The
computer software ROWMANRY, developed as part of the current research project to
7
CHAPTER (l) - Introduction
the highly non-linear time-history analysis (THA), is also presented. Results ofexperimental work as described in Chapter (6) are then used to calibrate and confirm the
accuracy of the analytical results.
In Chapter (8) a rational simplistic displacement-based (DB) analysis procedure is
presented for the prediction of the ultimate capacity of face loaded URM walls. A briefdescription of the displacement-based design methodology is provided and followed by
key aspects as it is applied to rocking URM walls. In order to confirm the effectiveness
of the linearised DB analysis, comparisons with experimental and comprehensive TFIA
results are presented. Similar comparisons are also made with currently available
ultimate analysis methodologies where it is concluded that the linea¡ised DBmethodology provides the most effective estimate of ultimate wall capacity.
Chapter (9) summarises the results of the study, highlighting key outcomes, design
recommendations and future research requirements.
8
2. EARTHQUAKES AND UNREINFORCEI)
MASONRY
2.1. Introduction
Earthquakes pose a substantial threat to life with an average fatality rate this century of
around 10,000 deaths per year (McCue t992). Damage to unreinforced masonry (uRM)
buildings and elements is a ubiquitous aspect of many earthquakes and as such URM has
a poor seismic performance record throughout the world. It has been reported (Scrivener
1993), however, that the poor overall public perception of URM can generally be
attributed to media reports not mentioning typical causes of the failures such as:
- buildings not designed to any engineering code, let alone an earthquake code;
- poorly constructed of adobe, mud brick or weak clay bricks with weak mortar of
mud or earth or with insufficient cement; and
- un-connected structural elements often with heavy roofs
In many instances the damage level has been enormous with masonry littering streets and
in larger earthquakes the complete collapse of URM buildings. This severe damage has
often been responsible for a non-commensurable loss of life and injury during
earthquake, which is both unacceptable and unnecessary. The spectacular nature of the
damage has therefore tended to obscure the satisfactory performance of many other URM
buildings in earthquakes. This is supported by research (Griffrth 1991, Page 1992,
Schrivener 1993, Tomazevic and \ileiss 1994, Abrarns 1995) indicating that URM
buildings can satisfactorily withstand moderate levels of ground shaking if designed,
detailed and constructed with consideration to seismic loading.
This Chapter provides a general overview of the seismicity, URM construction and
seismic performance in Australia. Aspects which are applicable for Australian conditions
are clarified and vulnerable weak links in URM buildings designed to current practices
9
CHAPTER (2) - Earthquakes and Unreinforced Masonry
are identified. To quantify the performance of IJRM buildings in areas of moderate
seismicity, a summary of observed damage patterns for Australian and relevant
international earthquakes is presented. This section concludes with the specific research
focus to be addressed within the scope of this report.
2.2. A¡ustralian Seismicity
While it is possible for an earthquake to occur at any location their occurrence frequency
is unevenly distributed over the earth. The majority of earthquakes are found to occur
along relatively narrow continuous belts at the convergent boundaries of the major crustal
plates. Here, inter-plate earthquakes contribute more than 90Vo of the earth's release ofseismic energy (Bolt 1996) with the remaining released as interior or intra-plate type
events. Further, approximately 75Vo of the total energy release is believed to occur along
the edges of the Pacific ocean, where the thinner Pacific plate is being forced beneath the
thicker continental crust (BGS 1999). This is demonstrated in active inter-plate regions
such as Japan, California or Papua New Guinea where the major plates interact at
velocities of up to 100 mm/year. As a consequence, it can take only tens to hundreds ofyears for sufficient strain energy to build culminating in the release of a large magnitude
earthquake. In contrast, for an intra-plate region it may take hundreds of thousands ofyears for similar levels of compressive stress and strain energy to develop. Thus, due to
the paucity of records this type of event is far more difficult to forecast.
The long return period of major earthquakes and the absence of interim perceptible
seismic activity in intra-plate regions has led to these areas being referred to as being oflow seismicity or low seismic risk. A common misconception follows that this infers
weak ground motion while the reality is that strong ground motion can still occur but less
frequently. In probabilistic terms there is a much reduced likelihood of intra-plate strong
ground motion occurring at a particular time and place than inter-plate. This aspect
substantially impacts on building code provisions where the design basis event isprescribed in probabilistic terms, rather than on maximum earthquake potential. Thus for
l0

CHAPTER (2) - Earthquakes and Unreinforced Masonry
intra-plate regions the design event magnitude will be smaller than for inter-plate regions
(Somerville et al 1998).
The ea¡liest earthquake reported in Australia was in June 1788 at Port Jackson (Sydney)
where the First Fleet settlers were shaken by a strong local earthquake lasting for not
more than two or three seconds. Since this time small earthquakes have been reported
under most of the major Australian cities (AGSO 1999).
The Australian continent lies whoþ within the Indo-Australian tectonic plate (refer
Figure 2.2.1) and as such is only subjected to intra-plate earthquakes. The closest
Australian city to an active plate boundary is Darwin, which is regularly but lightly
shaken by earthquakes along the subducting Java Trench in the Banda Sea.
Pacific Plate
Convergent plateboundaryInter-Plate RegionDirection of
crustal plaæmovement --+
\\Indo-Ausüalia Plate v
High Seismicity ZonesSeparating major crustalplaæs
Antårctic Plate
Since earthquakes only occur in the earth's outer crust where rocks a¡e cold enough to be
brittle, in Australia, earthquakes typically only occur to a depth of a¡ound 20km (Gibson
i
Figure 2.2.1 Australia's Tectonic Location
Ausüalia
11
CHAPTER (2) - Eanhquakes ønd Unreinforced Masonry
1990). This limitation constrains the vertical fault dimension so that for the release of alarge amount of strain energy the rupture would need to be very long. By practically
limiting the fault length to around 100km the maximum magnitude of earthquake that
could be realistically expected in Australia is around Ms 7.5. This assumption is
supported by studies of prehistoric Australian fault scarps where no scarp longer than
45km has yet been found (Denham 1992). It is therefore not unreasonable to argue that a
maximum credible earthquake of this magnitude be adopted for earthquake risk inAustralia.
Over the relatively short-recorded seismic history in Australia the largest known
earthquake occurred in 1906 off of the Northwest Coast of the continent with an
estimated magnitude of 7.2. On land the 1941 Meeberrie earthquake, which was felt over
most of Western Australia, appears to have been the largest having a magnitude ofapproximately 7 (Denham 1992).
In 1968 a magnitude 6.9 earthquake devastated the Western Australian agricultural
township of Meckering. Here although no people died, 85 dwellings were severely
damaged being predominantly of unreinforced masonry construction. Later, in 1954,
Adelaide was subjected to a damaging magnitude 5.5 earthquake. Here again there were
no fatalities however over 30,000 dwellings sustained damage (hish 1992) costing at the
time in excess of 4 million pounds or $91m in 1995 dollars (AGSO 1999). More
recently, in 1988, a magnitude 6.8 earthquake having a 35km fault length and maximum
surface displacement of 2.0m (AGSO 1999) struck Tennant Creek in the Northern
Territory of Australia. Fortunately due to the remoteness of the area there was only
moderate damage caused.
By far the most devastating and expensive, although not the largest seismic event inAustralia's brief recorded history, was the 1989 Newcastle earthquake. Despite by world
standards being only a moderate magnitude 5.6 the earthquake caused massive damage to
both property and infrastructure with damage estimates of over a billion dollars at the
time of the earthquake (Melchers 1990, Blong 1992). It is also the only earthquake in
t2
CHAPTER (2) - Earthquakes qnd Unreinforced Masonry
recorded Australian history to have been responsible for the loss of life with thirteen
people killed and over one hundred injured. Furthermore, it was only the fortunate
timing of the event that saved many more from being killed or injured (Melchers 1990).
Attributed to the vastness of the Australian continent it has been fortunate that previous
large magnitude Australian earthquakes have occurred far from populated centers causing
only relatively low-level property damage. With an ever-increasing population density
and aging building stock the potential for earthquake disaster in Australia is becoming a
far greater threat to our society so that earthquake hazud must now be fully considered in
risk assessment scenarios. To further place the seismic risk of Australian cities into
perspective it has been reported (Blong 1993) that a design magnitude event, i.e. a 500
year return period earthquake, in Melbourne or Sydney could result in more than 500
deaths and $8 billion dollars worth of damage to domestic construction alone.
2.3. URM Building Stock in Australia
Due to Australia's modest level of seismicity and the many advantageous characteristics
of masonry, the use of URM as a building medium in Australia has been widely
embraced. The majority of Australian URM building stock is of either or
commercial low-rise construction although some taller buildings, up have
been constructed. For housing, masonry is often used as a veneer although with older
homes in the 'Western states cavity wall construction is more prevalent. Single skin
grouted or partially grouted masonry is also popular in the north of Australia (Page
1995). V/ith a large proportion of LJRM building stock comprising single occupancy
housing, multiple occupancy residence (three to four storey 'walk up' flats) and low rise
commercial buildings, URM is prevalent in the inner suburban areas of Australian cities.
In these areas the population densities are often the highest and combined with the
relative older age of the URM building stock the potential seismic vulnerability of these
areas is appreciable.
7
t3

CHAPTER (2) - Earthquakes and Unreinforced Masonry
The historical development and implementation of the Australian Earthquake Loading
Code provides an insight into the current thinking in AustraHa on the seismic
vulnerability of existing URM building stock. As highlighted in Section 2.2, even though
there had been a number of Australian earthquakes greater in magnitude 5.0, the firstAustralian Earthquake Code, AS2l2l, was not published until 1979 as a response to the
1968 Meckering earthquake. Due to the lack of prior Australian strong ground motion
and research, this standard was based largely on requirements in the 1977 Structural
Engineers Association of California (SEAOC) Code and the 1976 Uniform Building
Code (UBC). After its release AS2l2l was seldom used and with the seismic zone map
having most of the country located in 'zone 0', which did not require seismic loading to
be considered, very few buildings were designed for earthquake loading. In fact, only the
South Australian and Commonwealth Governments actually used the code and in some
states with seismic design requirements these were ignored as they were not gazetted by
state authorities. It is possible that the misconception that design for wind also provided
for earthquakes led to this oversight.
With an increased understanding of earthquakes, 452121 was due for revision in 1989
when the Newcastle earthquake struck giving impetus and point to the deliberation. The
revised standard was again adapted from codes developed by Ameerican institutions such
as the Applied Technology Council (ATC), The National Hazatd Reduction Program
(NEHRP) and SEAOC before being incorporated into the Australian Loading Code in1993 as the SAA Earthquake Loading Code, 4S1170.4-1993. This, the current standard,
ensures that for every building constructed in Australia a minimum consideration is given
to seismic loading. The level required varies in sophistication from simple detailing to
comprehensive dynamic analysis depending on structural category and regularity. For
masonry the general detailing provisions are referenced from the respective material
standard being the SAA Masonry Code, 453700-1998. As a consequence of the recent
development of earthquake codes almost all of Australia's existing URM building stock
was constructed in the absence of mandatory earthquake design requirements.
t4
CHAPTER (2) - Earthquakes ønd Unreinforced Masonry
Unlike other popular methods, masonry construction is labour intensive in nature and
consequently quality is particularly sensitive to workmanship. Paradoxically, unlike more
modern construction methods, masonry is often not subjected to a high degree of quality
control due largely to its traditional background. For these reasons finished product
quality has been highly variable and is often not indicative of the designer's assumptions.
For URM buildings having relatively low levels of overburden stress a critical property
of masonry is the bond between brick units and mortar known as the flexural tensile
strength. This is also possibly the most variable and sensitive property to workmanship
with variations of 30Vo to 35Vo found to be not unusual. The factors influencing bond
strength have been well-documented (Taylor-Firth 1990, Van den Boon 1994, DeVitis
1995,Lawrence 1995, Page 1998) and include the suction of the masonry units, the water
retention of the mortar, the morta¡ ingredients, the use of additives and the method of
laying.
A recent study (Nawar 1994) which documented current masonry construction practices
on building sites in Sydney identified large gaps between the designers intent and actual
practices. Here it was found that over 50Vo of the sites inspected had serious omissions
capable of compromising the long-term performance of the masonry. In a second study
(Zsembery 1995) the measurement of flexural bond strength at 19 sites in the Melbourne
area was undertaken where a significant va¡iation in the results was also found.
The 1989 Newcastle earthquake highlighted the vulnerability of non seismicaþ designed
buildings with a significant proportion of the damage attributed to the lack of
consideration to ea¡thquake loading and inadequate standards of URM design, detailing
and construction (Melchers 1990, Page 7992). An additional finding was that the real
masonry quality was much lower than would have been expected (Page 1992). In many
cases damage surveillance reported that in what appeared to be sound outer masomy
skins, problems such as inadequately frlled bed and perpend joints and inadequate tying
or support of one or both of the skins was evident. In older structures poor maintenance
and wall tie corrosion also played a significant role in exacerbating the damage. The
15
CHAPTER (2) - Earthquakes and Unreinforced Masonry
presence of weak lime mortars is also thought to have been responsible for a highproportion of the billion dolla¡s worth of damage during the Newcastle earthquake. Itfollowed that the resistance of the effectively pre-cracked LJRM walls was left to relysolely on stabilising gravity effects.
While deficiencies associated with poor workmanship and maintenance are the
responsibility of the Masonry industry as a whole, their existence and consequent
influence on structural durability and ductility must be recognised. As the Newcastle
situation is not unique in Australia it must be assumed that the same scen¿rio of non-
seismically designed buildings in poorly maintained condition, constructed of poor
quality materials and concentrated in inner suburban areas where population densities are
greatest exist in other Australian cities.
In recognition of the need to strengthen existing buildings with an assessed inadequate
seismic resistance the voluntary code 'strengthening of Existing Buildings forEarthquakes',453826-1998, has recently been released in Australia. This requires the
designer to consider the same philosophical approach as 4S1170.4-1993 by establishing
clear load paths for the transmission of vertical and lateral loads. Many existing masonry
structures would be economically infeasible to upgrade to a capacity able to withstand the
full loads specihed in AS1l7O.4-1993. 453826-1998 therefore specifies lower th¡eshold
values for retrofitting structures based on the buildings use classification being either
33Vo or 66Vo of the full A51170.4-1993 specihed loads. In the absence of realistic
dynamic anaþsis methodologies the rationale here is that with the long return period oflarge magnitude earthquakes, a greater degree of risk is acceptable in existing buildingsthan that allowed in the design and construction of new buildings.
In the ideal situation structural engineers retained to investigate the seismic resistance ofa URM building would have at their disposal tools enabling them to prepare a realistic,
neither unduly conservative nor permissive, statement of the seismic resistive capacity ofboth structural and architectural components. Since the traditional design methodologies
inherently provide conservative assessment of the seismic vulnerability of a URM
t6

CHAPTER (2) - Earthquakes and Unreinforced Masonry
building, adoption of these techniques may lead to the possibility of incorrectly labeling a
seismically adequate building as unsafe. In contrast overestimating the dynamic capacity
of elements to resist damaging cycles of seismic excitation could lead to a false and
dangerous sense of security. In this context, the benefit of developing better tools to
accurately determine the seismic resistance capacity of URM buildings and components
is apparent.
The first stage of the current research project was to survey and catalogue URM
connection details and overburden stress levels typical of Australian masonry
construction. Figures 2.3.1 to 2.3.5 show construction drawings of the most
predominantly used URM connections.
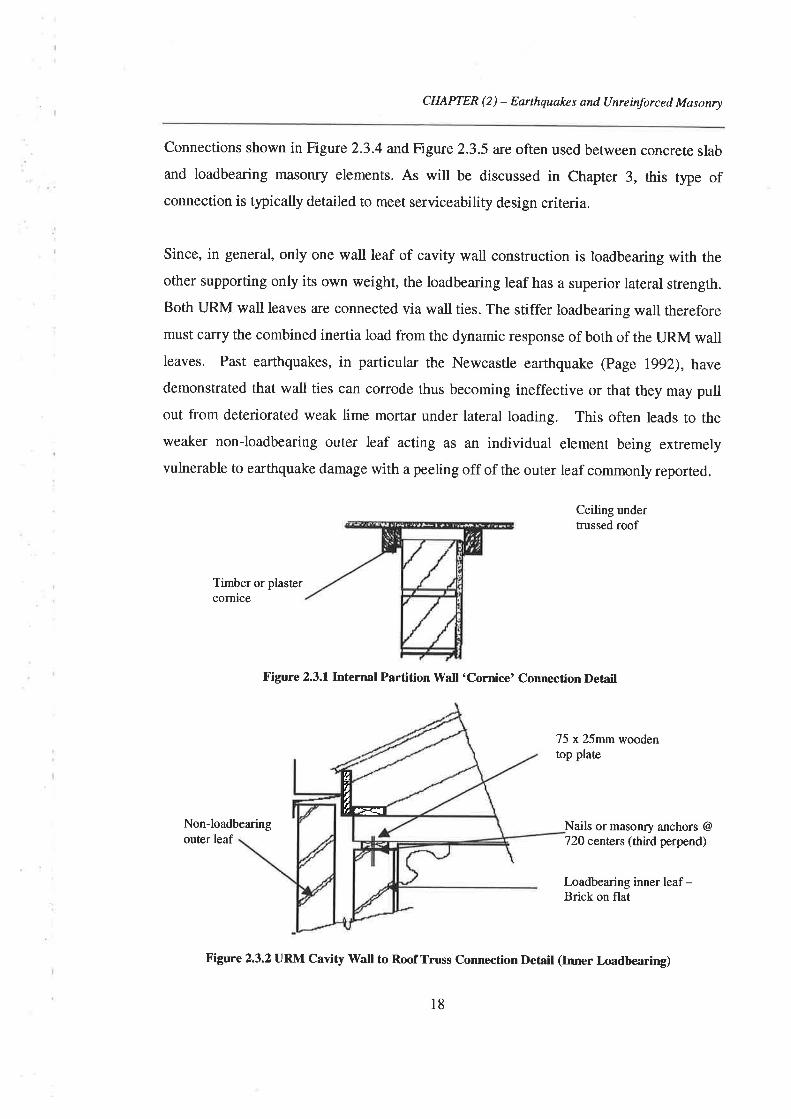
Figure 2.3.1 shows a 'cornice' type connection frequently used for internal non-
loadbearing URM partition walls. Often return walls are not incorporated into the
internal partition walls so that one-way bending predominates. Since the cornice
connection provides only horizontal restraint, the wall acts as a propped cantilever under
face loading.
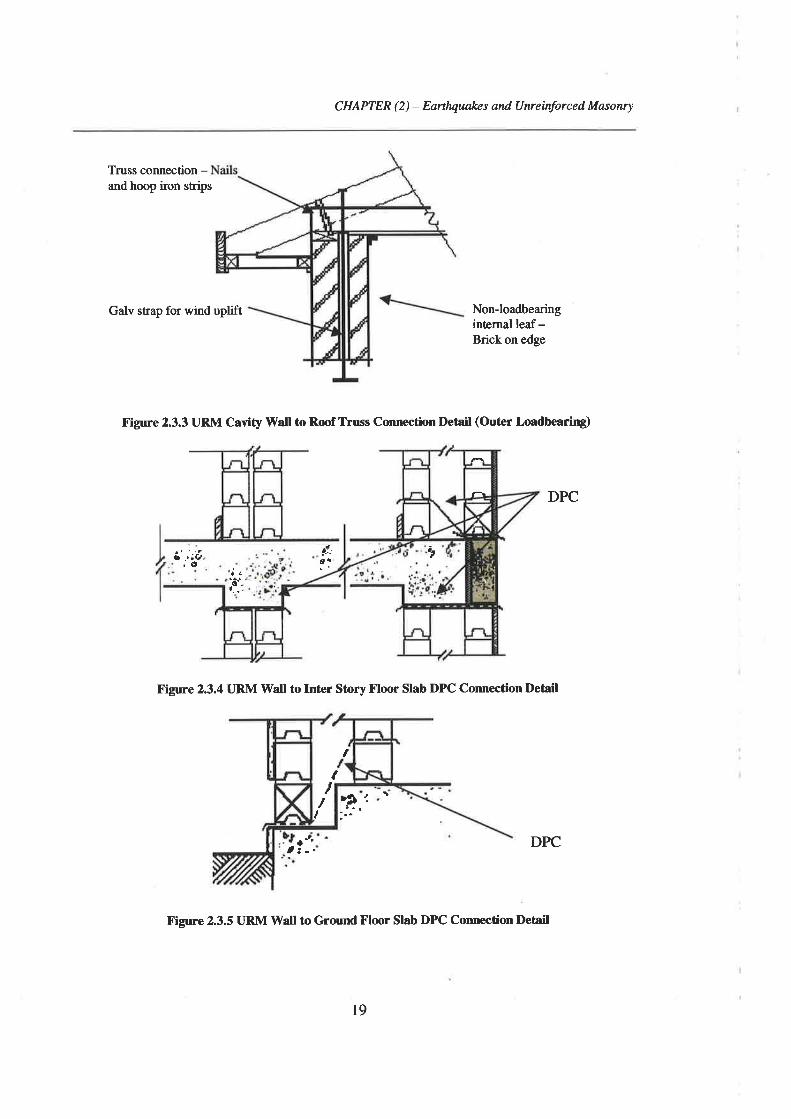
Figure 2.3.2 and Figure 2.3.3 show conìmon connection details used in cavity wall
construction. V/here both brick leaves are laid on flat, the roof truss is typically
supported on the internal loadbearing leaf using a 'wooden top plate'. Alternatively,
often for economy of material use, the external leaf is laid brick on flat but the internal
leaf is brick on edge. In this case the internal leaf is unsuitable for roof support and the
roof truss is supported on the outer loadbearing leaf. For either case nails or masonry
anchors are used to fix the top plate to the tlRM wall providing a positive connection to
resist horizontal shearing forces. Light gauge steel trusses and wall plates are now also
used as an alternative to timber. To resist wind uplift a galvanised strap is typically
detailed being fixed to the roof truss and hooked around a support bar in the wall
approximately l.2mbelow the top (Figure 2.3.3).
t7
CHAPTER (2) - Earthquøkes and Unreinforced Masonry
Connections sholvn in Figure 2.3.4 andFigure 2.3.5 are often used between concrete slab
and loadbearing masonry elements. As will be discussed in Chapter 3, this type ofconnection is typically detailed to meet serviceability design criteria.
Since, in general, only one wall leaf of cavity wall construction is loadbearing with the
other supporting only its own weight, the loadbearing leaf has a superior lateral strength.
Both URM wall leaves are connected via wall ties. The stiffer loadbearing wall therefore
must carry the combined inertia load from the dynamic response of both of the URM wallleaves. Past earthquakes, in particular the Newcastle earthquake (Page 1992), havedemonstrated that wall ties can corrode thus becoming ineffective or that they may pullout from deteriorated weak lime mortar under lateral loading. This often leads to the
weaker non-loadbearing outer leaf acting as an individual element being extremely
vulnerable to earthquake damage with a peeling off of the outer leaf commonly reported.
Ceiling undertrussed roof
Timber or plastercornice
Figure 2.3.1 Internal Partition Wall 'Cornice' Connection Detail
75 x25mmwoodentop plate
Non-loadbearing Nails or masonry anchors @outer leaf 720 centers (third perpend)
f-oadbearing inner leaf -Brick on flat
Figure 2.3.2 URM Cavity Wall to Roof Truss Connection Detail (Inner Loadbearing)
g
Þ;Ër
18
CHAPTER ( 2 ) - Earthquake s and Unr e info rc e d M as onry
Truss connection -and hoop iron strips
Galv strap for wind uplift Non-loadbearinginternal leaf -Brick on edge
Figure 2.3.3 URM Cavity \üall to Roof Truss Connection Detail (Outcr Loadbearing)
DPC
a ..;f,,,û
Figure 2.3.4 URM Wall to Inter Story Floor Slab DPC Connection Detail
ItDs{;.'
I
DPC
¡;-';. ró'.
l, r.
I
Figure 2.3.5 URM Wall to Ground Floor Slab DPC Connection lÞtail
I-a]at
-r
t9

CHAPTER (2) - Earthquakes anà Unreinforced Møsonry
A second outcome of this survey was the determination of typical levels of overburden
stress in Australia. This involved the analysis of numerous existing two to four story tallLJRM buildings. Structural configurations included cavity and veneer URM consüuction,
concrete slab and timber floor diaphragms and both light gauge galvanised and heavy
tiled roof diaphragms. The conclusion of this survey was that overburden stress typicallyranged from 0.4MPa in the lower stories reducing to less than 0.1MPa in the upper
stories.
2.4. URM Vulnerability in Moderate Seismicity Regions
2.4.1. Failure Modes of LIRM Elements (Related to Seismic Load Path)
While the earthquake ground motion itself does not constitute a direct threat to life safety
the subsequent failure of man made structures does. During an earthquake a building is
subjected to a series of random ground displacements. As the structure reacts to these
displacements inertial forces are induced. The structural response to these inertia forces
is dependent on the natural frequencies and inherent damping of the building, and itscomponents, which themselves are dependent on the structural mass and stiffness.
To assist in illustrating elemental failure modes within a URM building it is pertinent to
describe the path that seismic input energy follows (Priestly 1985, Bruneau 1994, Calvi et
al 1996) as is shown in Figure 2.4.I. When subjected to seismic ground motion, the
foundation transmits seismic energy to the stiffest elements of the LJRM building beirrg
the in-plane sûuctural walls. The response of the shear walls, which itself is dependent
on height, stiffrress and overburden stress excite the floor diaphragm, through the wall tofloor connection, with a motion that has now been filtered by the shear wall. Followingthis the floor diaphragm response excites the out-of-pl¿¡1s vvalls, through the wall to floorconnection, such that its dynamic characteristics directly influence the severity of the out-
of-plane wall excitation. The input excitation at the top of the face-loaded walls need
therefore not necessarily be in phase or even of the same magnitude as the bottom.
20

CHAPTER (2) - Eatthqual<es and Unreinforced Masonry
Floor diaphragm responseamplifies accelerations andtransmits load to out-of-plane
Shakingmotion \ Parapet wall
walls
In-plane shear wallsresponse filærs theground motion andtransmits to floordiaphragms e
Earthquake Excitation atfootings
.<-Out-of-plane wall
Figure 2.4.1 Seismic Load Path for Unreinforced Masonry Building
2.42. Review of the Seismic Performance of URM Buildings
As has been discussed in Section 2.2 the most damaging and therefore relevant
earthquake in Australia's recorded history was the 1989 Newcastle earthquake, Mr 5.6.
The earthquake intensity in outer Newcastle has been assessed at MM6.0Cí.5 (McCue
1990, Melchers 1990) while for inner Newcastle areas the general level of damage was
consistent with an intensity of MM7.0t0.5. Mean soft soil amplification factors of 3+1
are therefore considered indicative for the inner areas of Newcastle.
In reviewing damage patterns in Newcastle (Bubb 1990, Donaldson 1990, toke 1990,
Pederson 1990, Melchers 1990, Jordan et al 1990, Page 1990:1992, Griffith 1991,
Welhelm 1998) it is apparent that timber housing performed best followed by brick
veneer construction and that cavity brick construction was worst affected. It is noted
however that the latter mainly consisted of older buildings, many at least 60 years old,
and with significant structural deterioration. With few exceptions modern buildings
2-
II
III).-ì
2l
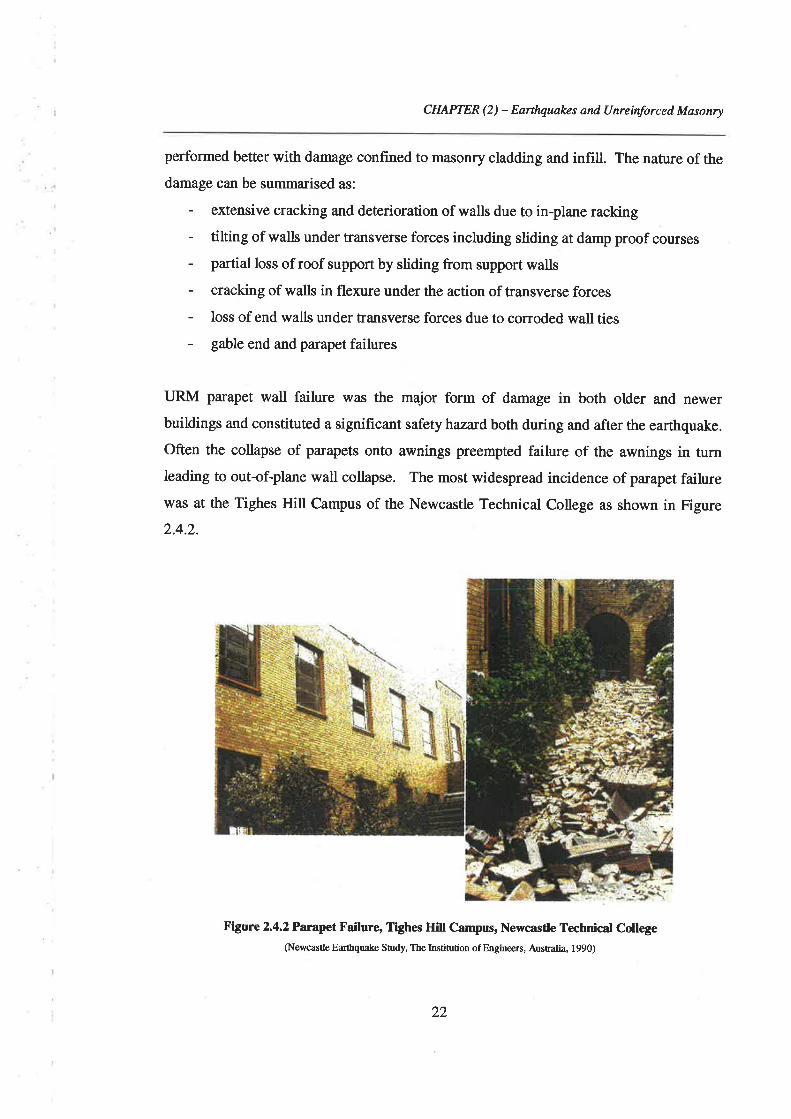
CHAPTER (2) - Earthquakes and Unreinforced Masonry
performed better with damage conflned to masonry cladding and infill. The nature of the
damage can be summarised as:
- extensive cracking and deterioration of walls due to in-plane racking
- tilting of walls under transverse forces including sliding at damp proof courses
- partial loss of roof support by sliding from support walls
- cracking of walls in flexure under the action of transverse forces
- loss of end walls under transverse forces due to corroded wall ties
- gable end and parapet failures
LJRM parapet wall failure was the major form of damage in both older and newer
buildings and constituted a signif,rcant safety hazard both during and after the earthquake.
Often the collapse of parapets onto awnings preempted failure of the awnings in turnleading to out-of-plane wall collapse. The most widespread incidence of parapet failurewas at the Tighes Hill Campus of the Newcastle Technical College as shown in Figure
2.4.2.
Figure 2.4.2Panpet Failure, Tighes Hill Campus, Newcastle Technical College(Newcastle Earthqu.ake Study, The Institution of Etrgineers, Ar¡stralia, 1990)
22
CHAPTER (2) - Earthquakcs and Unreinforced Masonry
A study (Murphy & Stewa¡t 1993) of 651 Government buildings damaged during the
earthquake at 300 different locations found that parapets on buildings founded on
alluvium soil appear to have been the most haza¡dous with 55Vo of these incurring
hazardous damage as opposed to l77o on non-alluvium. This then suggested that the
amplified gtound motion on the soft alluvium \ryas substantial enough to cause the parapet
walls to become unstable. In contrast, on non-alluvium soil areas where there was less
ground motion amplification the parapets were less prone to becoming unstable, although
base cracking of parapets was still observed.
The Australian experience of IJRM performing poorly in earthquakes is not unique.
However, care must be taken when reviewing overseas URM research papers as the
lessons learnt from their experience is typically determined from different standards of
URM construction. Often the type of masonry construction and materials being referred
to bear little resemblance to materials and practices used in Australia. For example, after
both the 1997 labalpar, India, Ms 6.0, and 1999 Mexico, Ms 6.7, earthquakes, the
collapse and severe damage to URM housing was reported (Jain et al 1997, Alcocer
1999). The implication for poor URM performance is apparent. \With poor quality
materials such as burnt brick in mud mortar and very weak adobe masonry being the
predominantly used building materials, these bear little resemblance to materials used'in
Australia and as such few lessons can be learnt. Figure 2.4.3 gives an indication of the
typical quality of masonry in the Jabalpar earthquake.
Similar examples can be made of Greek (Fardis 1995) and Italian (Spence et al 1999)
earthquakes where damage to URM buildings often dating as far back as the middle ages
are being reported.
23
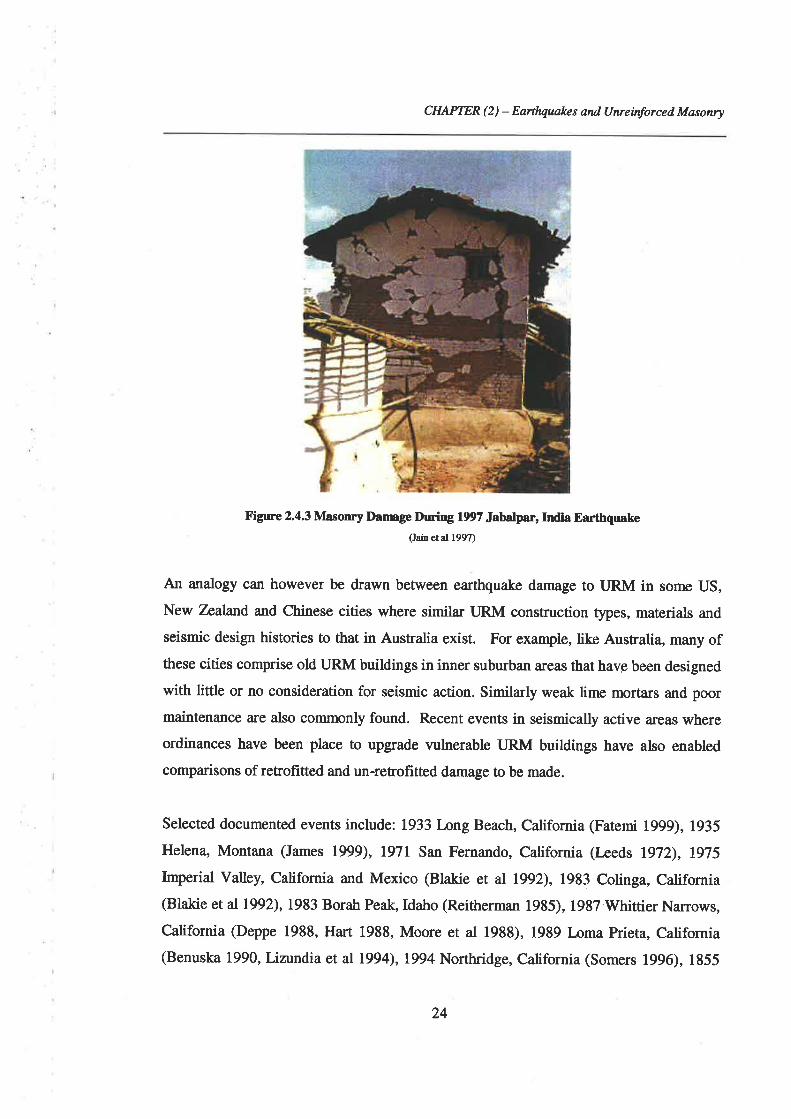
CHAPTER (2) - Eørthqualces and Unreinforced Masonry
Figure 2.4.3 lldasonry Darmge During 1997 Jabalpar, India Earthquake(Jain er at 1997)
An analogy can however be drawn between earthquake damage to URM in some US,
New Zealand and Chinese cities where simila¡ LJRM construction types, materials and
seismic design histories to that in Australia exist. For example, like Ausfialia, many ofthese cities comprise old LJRM buildings in inner suburban areas that havg been designed
with Iittle or no consideration for seismic action. Similarly weak lime mortars and poor
maintenance are also commonly found. Recent events in seismically active a¡eas where
ordinances have been place to upgrade vulnerable URM buildings have also enabled
comparisons of reEofitted and un-reftofitted damage to be made.
Selected documented events include: 1933 long Beach, California (Fatemi t999),1935Helena, Montana (James 1999), 1971 San Fernando, California (Iæeds lg72), 1975
Imperial Valley, California and Mexico (Blakie et al 1992), 1983 Colinga, California(Blakie et al1992),1983 Borah Peak, Idaho (Reitherman 1985), 1987 Whittier Narrows,
California (Deppe 1988, Hart 1988, Moore et al 1988), 1989 l¡ma Prieta, California(Benuska 1990, Lizundia et al1994),1994 Northridge, California (Somers 1996), 1855
24
CHAPTER (2) - Earthquakes and Unreinforced Masonry
and 1942 Wairarapa, Central New Zealand (Grapes & Downes 1997, Blakie et al 1992),
1931 Hawke's Bay, East Coast New Zealand (Blakie et all992),1990 Weber, East Coast
New Zealand (Blakie etal7992),Tangshan, China, 1976 (Yuxian1979).
2.43. Common tlRM Element Failure Modes
Blakie et al1992 has presented URM damage data relevant for MM6 to MM8 intensities
as could be expected for regions of moderate seismicity although some examples of high
intensity shaking to MM10 are also included. At MM7 no URM buildings were reported
to collapse as compared with 87o to 45Vo at MM8. Similarly, around 70Vo had only slight
or no damage at MM7, dropping to 20Vo at MM8. Where retrof,rt o¡dinances had been
undertaken URM performance was acceptable with mostly only low level damage. At
MM10 severe damage was reported for URM buildings with as many as 75Vo of multi-
storey brick buildings collapsing. Here current retrofit methods were found to be
insufficient to prevent failures.
The following paragraphs provide a brief description and review of common failure
modes for URM buildings which have been more prevalent during past earthquakes.
Anchorage failures'. Anchorage is an important factor as it enables seismic load to pass
between walls and the floor or roof diaphragm. In many URM buildings diaphragm
joists and beams rest on LJRM walls, sometimes on special corbels although mostþ these
are recessed into the wall. Without effective anchorage face loaded exterior walls behave
as cantilevets over the total building height thus increasing the risk of face loaded wall
failure which may in turn precipitate total collapse. Global structural failure may also
occur by slippage of joists and beams from their supports. Where floor diaphragms are
positively connected to URM walls these anchors may rupture at the connection points
leading to the condition of 'lack of anchorage' as described above.
Anchorage failure has been the most frequent cause of wall and gable collapse in
mode¡ate earthquakes however this has often been ¡elated to deteriorated or poor quality
lime mortar.
25
CHAPTER (2) - Earthquakes an¿ Unreinforced Møsonry
Diaphragm flexibility and strengrå: No instance of complete diaphragm failure wasreported for any moderate intensity earthquake although the flexibility of the floor and
roof diaphragm has been suggested as a possible cause of wall damage. A particular case
is unsecured gable wall ends, which are extremely vulnerable through impact with the
roof structure.
As the floor diaphragm response directly excites the out-of-plane walls it is critical to the
URM building seismic response. In an attempt to mitigate the effect that diaphragmresponse has on the dynamic behaviour of URM buildings, research has been undertaken
in the United States (ABK 1984). Here fourteen different diaphragms were tested toobtain information on their in-plane static and dynamic, linear and non-linear properties.
Eleven of the diaphragms tested were of wood construction and the remaining of steel
decking either filled with concrete or not. Results showed that strong diaphragmsproduced large amplifications of up to 3 to 4 times the input accelerations in the elastic
range essentially behaving as 2Vo damped oscillators. Flexible diaphragms were found to
have highly non-linear flexible behaviou¡ with typical amplifications in the order of 2 to2.25.
Out-of-plane wallfailur¿s: When suff,rcient anchorage exists between the diaphragms and
walls, out-of-plane wall behaviour is as a one storey high panel dynamically excited at
either end. These panels themselves are susceptible to out-of-plane bending failure and
while in-plane failure does not always endanger the gravity load carrying capabilities ofthe structure out-of-plane failure does. As amplihcation of the ground motion increases
with building height, face loaded walls in the upper stories of URM buildings tend to be
at the highest risk of failure. Parapet wall failures are also prone to flexural failure due tothe lack of masonry tensile strength.
In moderate magnitude earthquakes cracking of walls loaded in the out-of-plane directionis common. For MM7 intensity shaking there appear to have been very few instances
where pure simply supported out-of-plane collapse occurred where walls were adequately
supported at the top and bottom. For MM8 intensity areas out-of-plane wall collapse was
26
CHAPTER (2) - Earthquakes and Unreinforced Masonry
a more prevalent cause of URM damage. Although many of these failures would have
been instigated by anchorage problems it is possible that a number resulted from
excessive out-of-plane displacements at the mid-height of the wall spanning between the
diaphragms. At MM10 intensity shaking out-of-plane wall failure was reported as
profuse, In some instances, adequately supported out-of-plane walls have survived even
this intensity shaking. It was also found that buildings with concrete floors had a lower
percentage of damage attributed to increased overburden stress.
Interior partition walls: As generally these walls are only one wythe thick and typically
have no overburden other than their own self weight they have been particularly
vulnerable even in moderate intensity shaking.
Parapet wall failure: Parapet collapse has been reported in all reviewed earthquakes. For
moderate intensity shaking these typically have been responsible for most loss of life.
In-Plane WaIl Failures: As seismic load passes through the structural shear wall, in-plane
failure may occur if the inertial bending or shear forces induced exceeds the wall
capacity. Over the past ten or so years a substantial quantity of experimental and
analytical research into in-plane ultimate behavioral properties of URM walls has been
reported (König et al 1988, Abrams 1992, Tercelj et al 1992, Pdtrsenjad et al t994,
Magenes et al 1995, Jankulovski et al 1995, Gambarotta et al1995, Lafuente et al1995,
Romano et al 1995, Anthoine et al 1995, Zhuge et al 1996). In reviewing this
documentation a wide variety of behaviour, which depends on the wall height to length
ratio, the applied load and the mechanical properties of the materials constituting the
brickwork can be found.
With different combinations of parameters three failure mechanisms have been identified.
These include (1) rocking/flexural mechanism, (2) shear-sliding mechanism and (3) shear
cracking mechanism typified by double diagonal (X) cracking. The first two failure
modes are considered to be favourable as they are capable of significant energy
dissipation without compromising the gravity load carrying capacity thus providing an
27
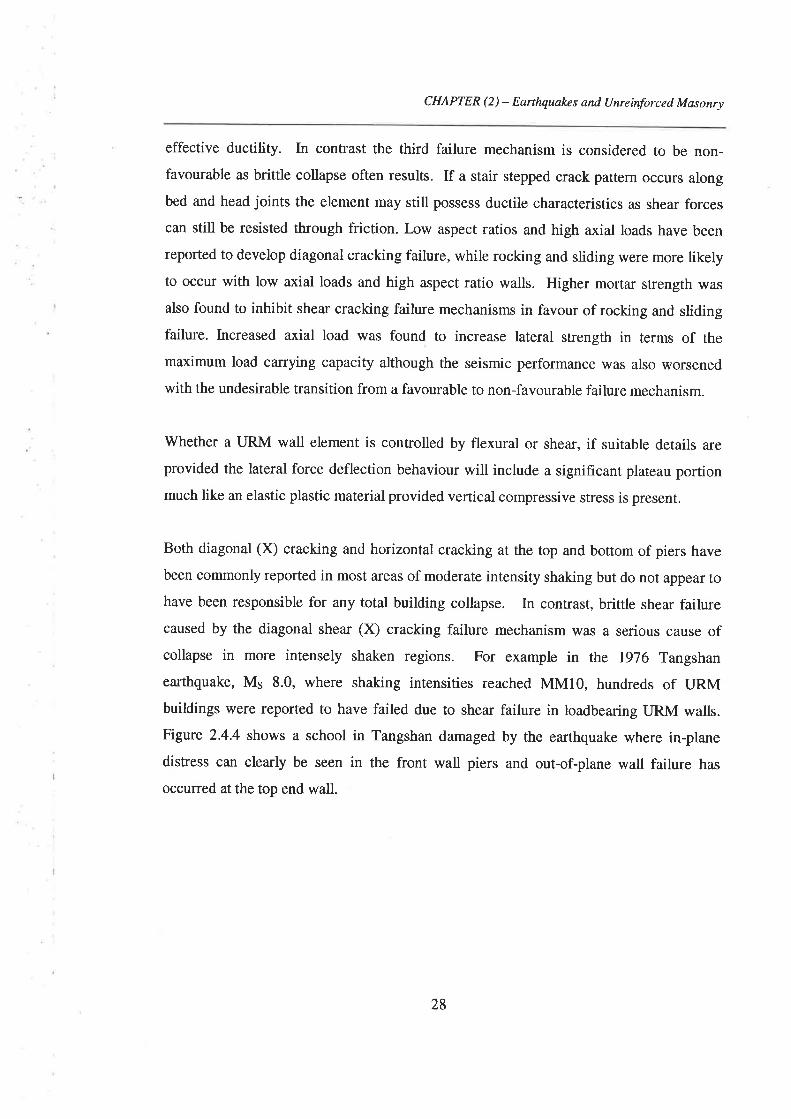
CHAPTER (2) - Earthquakes and Unreinforced Masonry
effective ductility. In contrast the third failure mechanism is considered to be non-favourable as brittle collapse often results. If a stair stepped crack pattern occurs along
bed and head joints the element may still possess ductile characteristics as shear forces
can still be resisted through friction. [,ow aspect ratios and high axial loads have been
reported to develop diagonal cracking failure, while rocking and sliding were more likelyto occur with low axial loads and high aspect ¡atio walls. Higher mortar strength was
also found to inhibit shear cracking failure mechanisms in favour of rocking and slidingfailure. lncreased axial load was found to increase lateral strength in terms of the
maximum load carrying capacity although the seismic performance lvas also worsened
with the undesirable transition from a favourable to non-favourable failure mechanism.
Whether a URM wall element is controlled by flexural or shear, if suitable details are
provided the lateral force deflection behaviour will include a significant plateau portionmuch like an elastic plastic material provided vertical compressive stress is present.
Both diagonal (X) cracking and horizontal cracking at the top and bottom of piers have
been commonly reported in most areas of moderate intensity shaking but do not appear tohave been responsible for any total building collapse. In contrast, brittle shear failurecaused by the diagonal shear (X) cracking failure mechanism was a serious cause ofcollapse in more intensely shaken regions. For example in the 1976 Tangshan
earthquake, M5 8.0, where shaking intensities reached MM10, hundreds of URMbuildings were reported to have failed due to shear failure in loadbearing URM walls.
Figure 2.4.4 shows a school in Tangshan damaged by the earthquake where in-plane
distress can clearly be seen in the front wall piers and out-of-plane wall failure has
occurred at the top end wall.
28
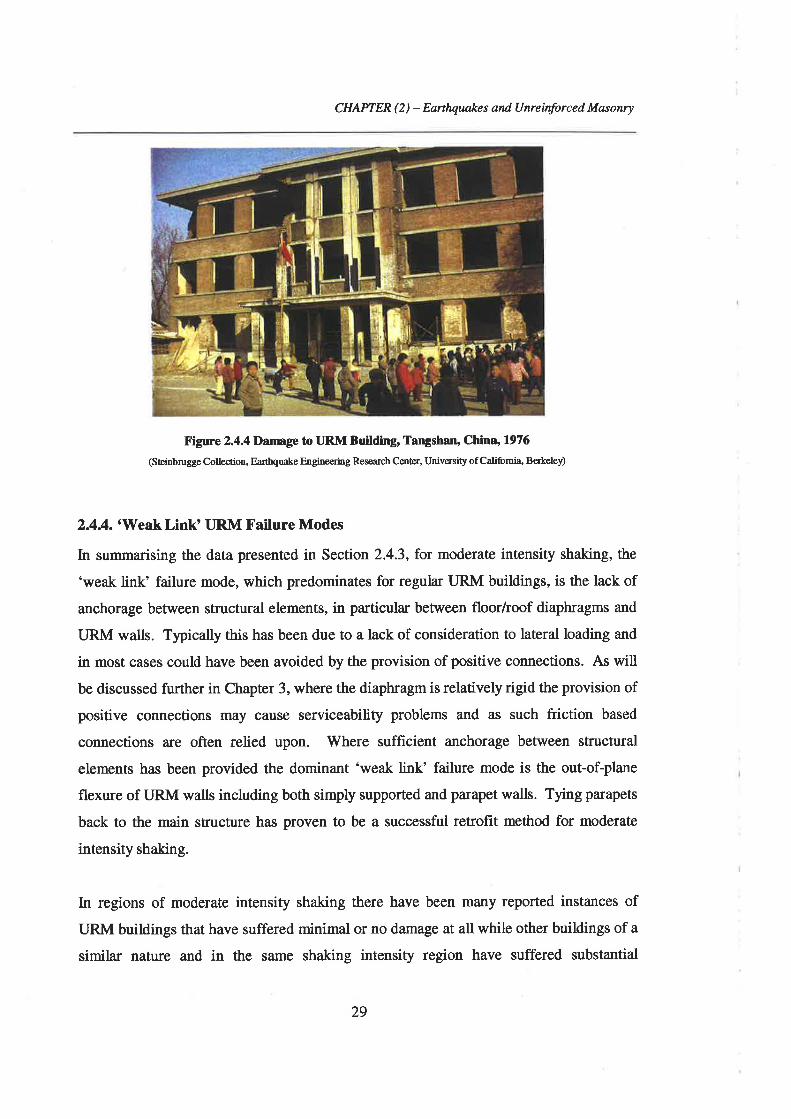
CHAPTER (2) - Earthquakcs and Unreinforced Møsonry
Figure 2.4.4Darage to IIRM Building, Tangshan' China' 1976
(Steinbrugge Colleclion, Eartþuake Engineering Research Center, University of Califomia Be¡keley)
z.4A.'Weak LinK LIRM Failure Modes
In summarising the data presented in Section 2.4.3, for moderate intensity shaking, the
'weak link' failure mode, which predominates for regular LJRM buildings, is the lack of
anchorage between structural elements, in particular between floor/roof diaphragms and
URM walls. Typically this has been due to a lack of consideration to lateral loading and
in most cases could have been avoided by the provision of positive connections. As will
be discussed funher in Chapter 3, where the diaphragm is relatively rigid the provision of
positive connections may cause serviceability problems and as such friction based
connections are often relied upon. 'Where sufficient anchorage between structural
elements has been provided the dominant 'weak link' failure mode is the out-of-plane
flexure of URM walls including both simply supported and parapet walls. Tytng patapets
back to the main structure has proven to be a successful retrofit method for moderate
intensity shaking.
In regions of moderate intensity shaking there have been many reported instances of
URM buildings that have suffered minimal or no damage at all while other buildings of a
simila¡ nature and in the same shaking intensity region have suffered substantial
29
CHAPTER (2) - Earthquakcs and. Unreinforced Masonry
structural damage. It is therefore clear that provided the 'weak link' failure modes can be
avoided URM can be relied upon to behave adequately during moderate earthquakes.
Clearly for areas where the probability of stronger intensity shaking is deemed
sufficiently high LJRM construction is not appropriate with the logical alternatives being
more ductile methods such as reinforced masonry, reinforced concrete or steel
construction.
Analytical resea¡ch by Klopp 1998 has also identified 'weak link' URM failure modes.
This involved the analysis of eleven existing LJRM buildings in Adelaide using the
response spectrum method and equivalent static force requirements of ASl 170.4-1993.
As a results Klopp reported that the two most likely failure modes for Australian URMconstruction are:
(I ) The limited force capacity of connections betvveen floors and walls. Klopp reported
that the code guidelines for connection force capacities benveen the floors and walls ofLJRM buildings were found to be insufficient being significantly smaller than the
requirement determined by elastic response spectrum analysis to ASI170.4-I993.Despite this Klopp also reported that typical forms of positive connection could generally
easily meet the earthquake shearing forces induced. Of more concern were connections
containing a DPC membrane often found in URM-concrete slab buildings, which rely on
friction to transfer horizontal forces. In comparing the calculated connection shear force
demand under the AS1170.4-1993 design earthquake, friction coefficients of a¡ound 0.3
to 0.4 were required. These values are of about the same magnitude as static frictioncoeff,rcients reported by Page 1994,1995 for connections containing DPC membranes
commonly used in Australian masoffy construction. This suggests that friction mightsufficientþ transfer the shearing forces although this assumes that the full static frictionalresistance can be relied upon. This assumption therefore warrants further investigation.
(2) The out-of-plane bending failure of walls of URM buildings. Klopp found that hveout of the eleven LJRM buildings analysed under the A51770.4-1993 earthquake had
bending stresses greater than the simply supported elastic bending capacity of the wall.
30
CHAPTER (2) - Earthquakes and Unreinforced Masonry
Current design practice in Australia would thus indicate failure. As will be discussed in
Chapter 5, however, the resulting cracked condition may not constitute failure or collapse
as a reserve dynamic capacity may exist. An additional factor was reported that the stress
was more likely to exceed capacity in the upper stories of URM buildings where
excitation amplification is a maximum and beneficial overburden stress is at a minimum.
2.5.'Capacity' Design for Improved Seismic Response
\ühen considering the preservation of life the most important design criterion is the
Ultimate Limit State. In Australia only the Ultimate Limit State is considered. Here
relatively large inelastic deformations must be accommodated without significant loss of
lateral force resistance or the integrity of the structure to support gravity loads. Although
non-repairable residual plastic deformations may occur the principal aim is to ensure that
collapse is avoided.
The 'Capacity' design strategy has been defined (Paulay 1997) as "In structures so
designed for earthquake resistance, distinct elements of the prinnry lateral forceresisting system are chosen and suitably designed and detailed for energy dissipation
under severe imposed deþrmations. All other elements are then to be protected against
actions that could cause failure by providing them with strength greater than that
corresponding to the mnximum feasible strength in the potential plastic regions." In
theory the application of the 'Capacity' design principal leads to a benign and tolerant
inelastic response with a high degree of protection against the collapse of structures
subjected to severe earthquakes.
For framed reinforced concrete structures the 'Capacity' design methodology can be
followed by detailing plastic hinge locations in beam elements ¡ather than in columns.
Thus, at the Ultimate Limit State a ductile inelastic sway mechanism having strong
energy dissipative qualities is formed without the creation of a failure mechanism. In a
similar fashion for a URM building the 'Capacity' design methodology can be followed
31
CHAPTER (2) - Earthquakes and Unreinforced Masonry
by the selection of a suitably ductile mechanism capable of dissipating seismic energy
without damaging other structural elements due to severe deformations.
As has been discussed in Section 2.4.3 with the correct selection of URM in-plane wallgeometry a failure mode capable of inelastic deformation and seismic energy dissipation
suitable for 'Capacity' design is possible. Other less desirable failure modes such as out-
of-plane bending and anchorage failure must then be protected against. Clearly if the
'Capacity' design principals are to be used effectively for URM it is important that
realistic assessment of dynamic capacity of these failure modes is possible.
2.6 Overall Project AimAs a result of this literature suryey the research aim to be addressed within the scope ofthis report has been determined as providing designers with appropriate tools to avoid the
brittle 'weak link' failure modes in the design of new and the assessment of existing
URM buildings being:
( 1 ) The limited force capacity of connections between floors and walls, in particular the
friction dependent connections containing damp proof course (DPC) membranes and
(2) the out-of-planefailure of walls in the upper stories of URM buildings
The first aim was achieved for the DPC connections through an extensive series ofshaking table tests, which provided realistic data on the connections' dynamic capacity.
The second aim was achieved by an extensive series of shaking table tests used todevelop a better understanding of the physical processes governing the collapse
behaviour of face loaded URM walls. From this improved understanding realistic
analytical models were developed to provide an accurate and reliable assessment ofactual capacity. As these were complex, by necessity, a further rehnement was toproduce a simplistic rational analysis procedure for practical applications.
32

CHAPTER (2) - Earthquakes and Unreinforced Masonry
Once these 'weak links' have been avoided with adequate seismic load paths developed,
carefully designed, detailed and constructed, regular URM buildings have repeatedly
shown that they will behave adequately during moderate intensity earthquakes. Further,
this allows the 'capacity' design methodology to be more effectively undertaken resulting
in an increased effective ductility for URM buildings to be realized.
JJ

3. DPC CONNBCTIONS IN URM
CONSTRUCTION
3.L. Introduction
In general, masonry buildings are constructed utilising a vast array of flashings, damp
proof course (DPC) membranes and construction joints aimed at ensuring satisfactory
serviceability performance. As highlighted in Section 2.3 for Australian unreinforced
masonry (tlRM) construction, connections between a concrete slab and masonry wall are
commonly detailed containing DPC membrane.
Typically, DPC membranes used for URM connections are flexible, manufactured from
either embossed polythene or a light gauge aluminium and covered with polythene or
bitumen. Normal practice is either to incorporate the membrane laid directly adjacent to
the slab with a single mortar layer placed between the membrane and brick or to place it
one to two brick courses up from the slab. This configuration is referred to as a standard
DPC connection. Alternatively, the membrane may also be sandwiched between two
mortar layers although not often used in practice as it is labour intensive. This is referred
to as a centered DPC connection. Finally, in some circumstances no mortar is used with
the membrane laid directly between the brick and slab or brick and brick. For these
connections two layers of DPC membrane are often used back to back. This is referred to
as a slip joint connection. Figure 3.1.1 provides a representation of the above three
connection configurations.
In masonry construction, connections containing a DPC membrane are generally detailed
to fulfil the dual serviceability role of providing an impervious barrier to moisture
movement while acting as a plane of separation between structural elements. The latter
role prevents distress of the connected elements by limiting the transfer of forces and
34
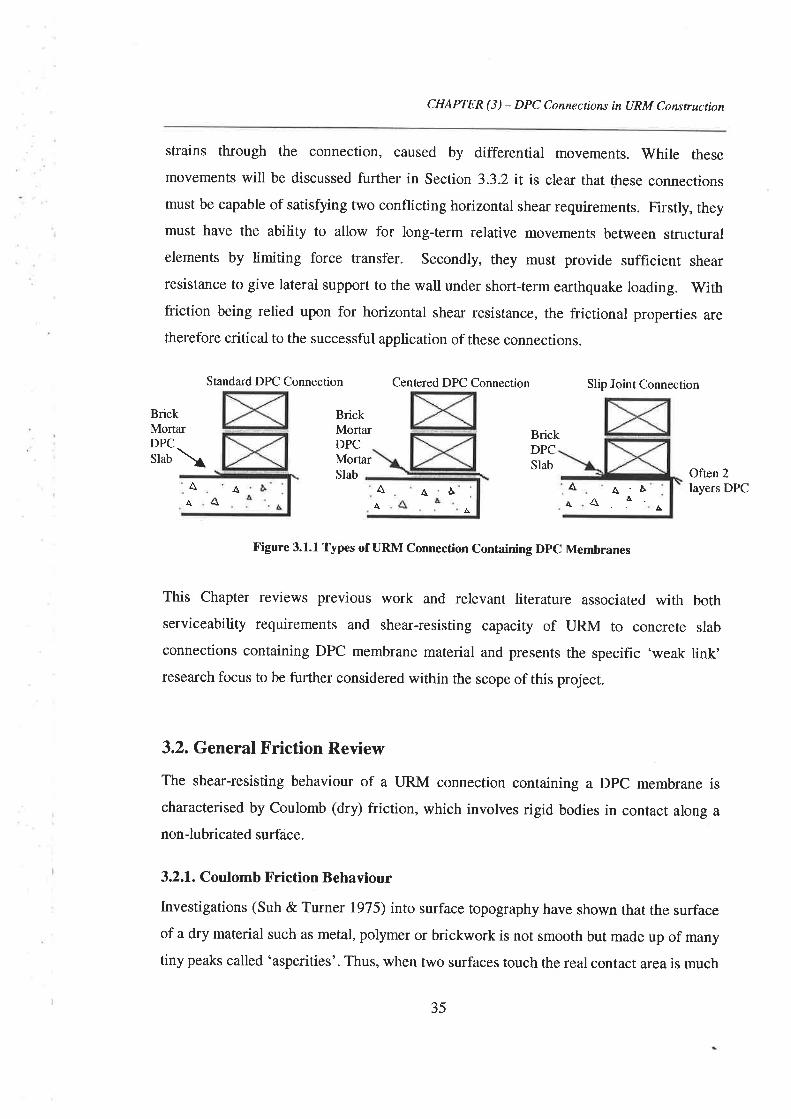
CHAPTER (3) - DPC Connections in URM Construction
strains through the connection, caused by differential movements. While these
movements will be discussed further in Section 3.3.2 it is clear that these connections
must be capable of satisfying two conflicting horizontal shear requirements. Firstly, theymust have the ability to allow for long-term relative movements between structural
elements by limiting force transfer. Secondly, they must provide sufficient shear
resistance to give lateral support to the wall under short-term earthquake loading. Withfriction being relied upon for horizontal shear resistance, the frictional properties are
therefore critical to the successful application of these connections.
Standard DPC Connection Centered DPC Connection Slip Joint Connection
BrickMortarDPCSlab \
BrickMortarDPCMort¿¡Slab
BrickDPCSlab Often2
layers DPCÀAÀA
A4
AÀ
À
Figure 3.1.1 Types of URM Connection Containing DpC Membranes
This Chapter reviews previous work and relevant literature associated with bothserviceability requirements and shear-resisting capacity of URM to concrete slab
connections containing DPC membrane material and presents the specific 'weak link'research focus to be further considered within the scope of this project.
3.2. General Friction Review
The shear-resisting behaviour of a URM connection containing a DPC membrane is
characterised by Coulomb (dry) friction, which involves rigid bodies in contact along a
non-lubricated surface.
3.2.1. Coulomb Friction Behaviour
Investigations (Suh & Turner 1975) into surface topography have shown that the surface
of a dry material such as metal, polymer or brickwork is not smooth but made up of many
tiny peaks called 'asperities'. Thus, when two surfaces touch the real contact area is much
35
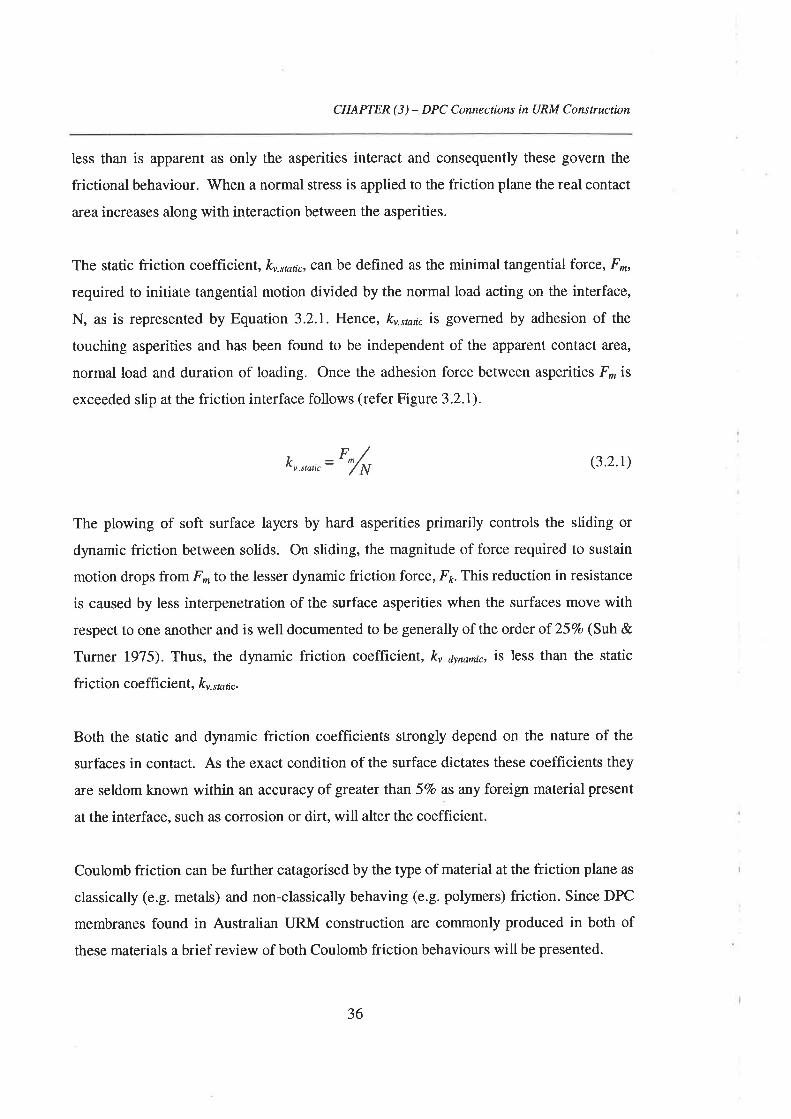
CHAPTER (3) - DPC Connections in URM Construction
less than is apparent as only the asperities interact and consequently these govern the
frictional behaviour. When a normal stress is applied to the friction plane the real contact
area increases along with interaction between the asperities.
The static friction coefficient, kv.st¿tic, can be defined as the minimal tangential foÍce, F^,
required to initiate tangential motion divided by the normal load acting on the interface,
N, as is represented by Equation 3.2.1. Hencl, kv.stotic is governed by adhesion of the
touching asperities and has been found to be independent of the apparent contact area,
normal load and duration of loading. Once the adhesion force between asperities F. isexceeded slip at the friction interface follows (refer Figure 3.2.1).
(3.2.1)
The plowing of soft surface layers by hard asperities primarily controls the sliding or
dynamic friction between solids. On sliding, the magnitude of force required to sustain
motion drops from F, to the lesser dynamic friction force, Fr. This reduction in resistance
is caused by less interpenetration of the surface asperities when the surfaces move with
respect to one another and is well documented to be generally of the order of 25Vo (Suh &.
Turner 1975). Thus, the dynamic friction coefficient, kv dynamic, is less than the static
friction coefficient, kv.sta¡c.
Both the static and dynamic friction coefficients strongly depend on the nature of the
surfaces in contact. As the exact condition of the surface dictates these coefhcients they
are seldom known within an accuracy of greater than 5Vo as any foreign material present
at the interface, such as corrosion or dirt, will alter the coefficient.
Coulomb friction can be further catagorised by the type of material at the friction plane as
classically (e.g. metals) and non-classically behaving (e.g. polymers) friction. Since DPC
membranes found in Australian URM construction are cornmonly produced in both of
these materials a brief review of both Coulomb friction behaviours will be presented.
kv.statíc='/*
36
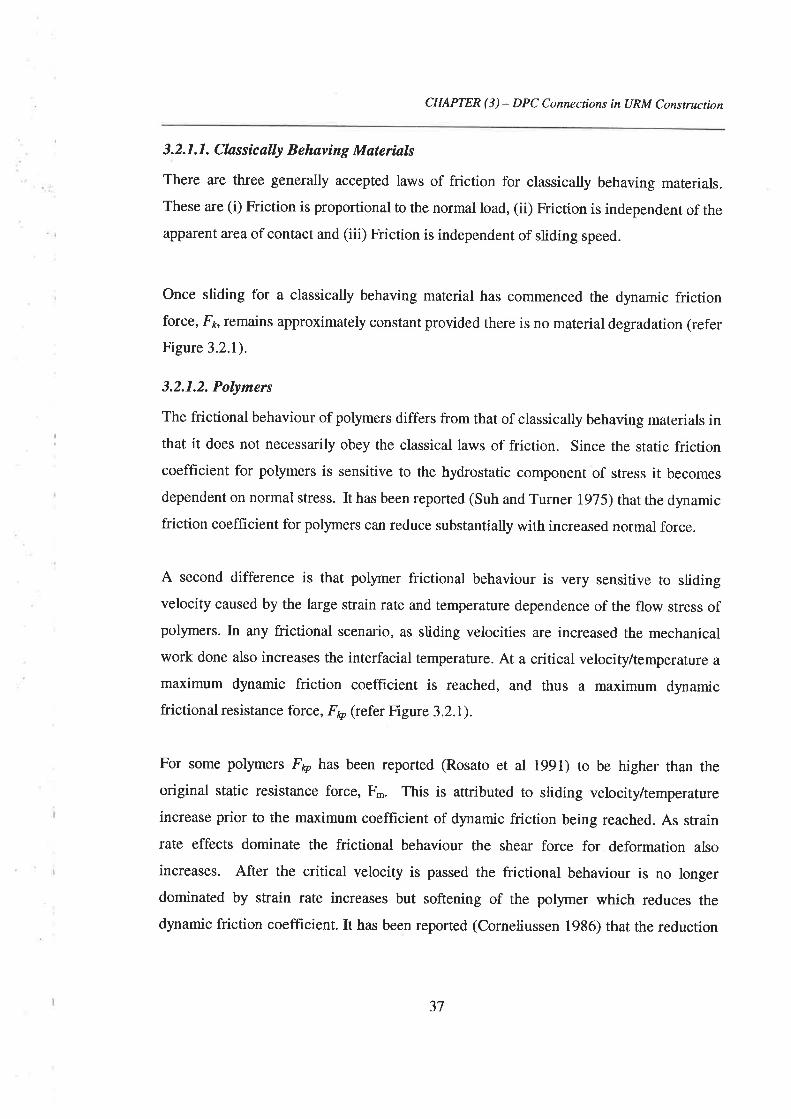
CHAPTER (3) - DPC Connections in URM Construction
3.2. I J. Clas sic ally B ehaving Materíals
There are three generally accepted laws of friction for classically behaving materials.
These are (i) Friction is proportional to the normal load, (ii) Friction is independent of the
apparent area of contact and (iii) Friction is independent of sliding speed.
Once sliding for a classically behaving material has commenced the dynamic frictionforce, F¿, remains approximately constant provided there is no material degradation (refer
Figure 3.2.1).
3.2.1.2. Polymers
The frictional behaviour of polymers differs from that of classically behaving materials inthat it does not necessarily obey the classical laws of friction. Since the static frictioncoefficient for polymers is sensitive to the hydrostatic component of stress it becomes
dependent on normal stress. It has been reported (Suh and Turner 1975) that the dynamicfriction coefficient for polymers can reduce substantially with increased normal force.
A second difference is that polymer frictional behaviour is very sensitive to slidingvelocity caused by the large strain rate and temperature dependence of the flow stress ofpolymers. In any frictional scenario, as sliding velocities are increased the mechanical
work done also increases the interfacial temperature. At a critical velocity/temperature a
maximum dynamic friction coefhcient is reached, and thus a maximum dynamicfrictional resistance force, F q (refer Figure 3.2.1).
For some polymers Fp bas been reported (Rosato et al 1991) to be higher than the
original static resistance force, F.. This is attributed to sliding velocity/temperature
increase prior to the maximum coefhcient of dynamic friction being reached. As strain
rate effects dominate the frictional behaviour the shear force for deformation also
increases. After the critical velocity is passed the frictional behaviour is no longer
dominated by strain rate increases but softening of the polymer which reduces the
dynamic friction coefficient. It has been reported (Corneliussen 1986) that the reduction
37
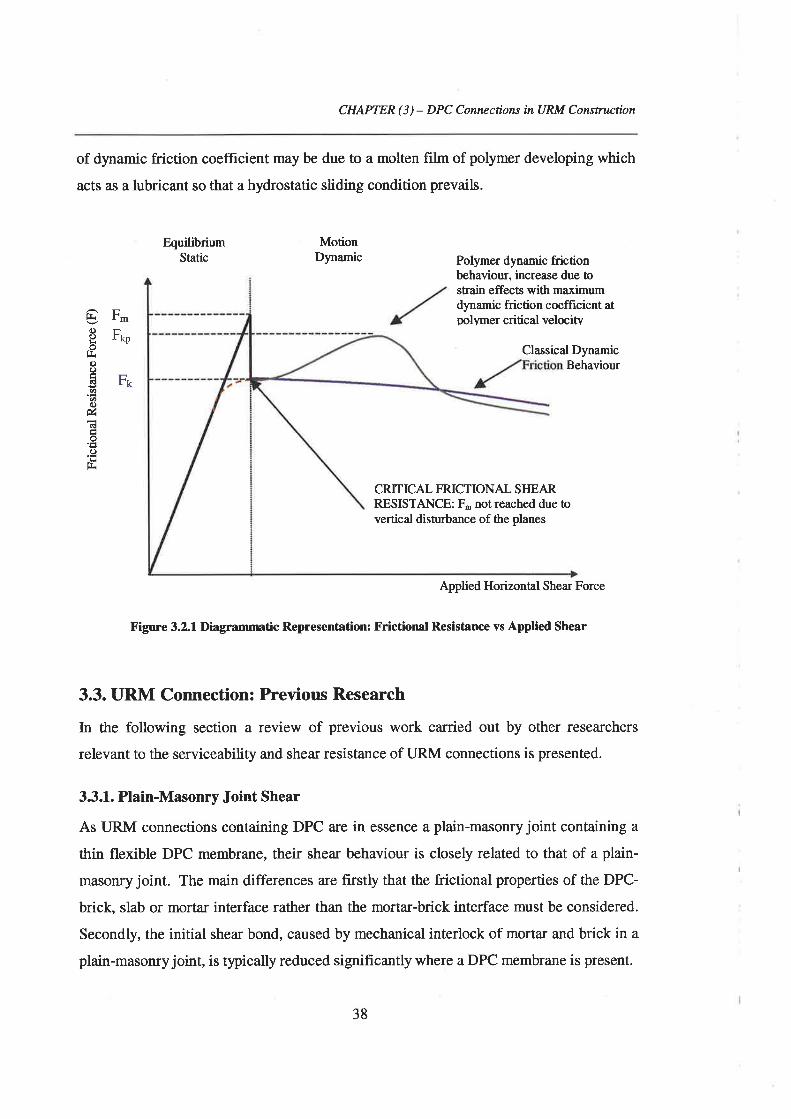
CHAPTER (3) - DPC Connections in URM Construction
of dynamic friction coefficient may be due to a molten film of polymer developing which
acts as a lubricant so that a hydrostatic sliding condition prevails.
EquilibriumStatic
MotionDynamic
F-Frp
Fr
t¡r(l)okof¡ro9søac)úCdÉo'É()tli
Polymer dynanic frictionbehaviour, increase due tostrain effects with maximumdynamic friction coefficient atpolymer critical velociw
Classical DynamicBehaviour
CRJTICAL FRICTIONAL SIIEARRESISTANCE: F. notreached due ûo
vertical disturbance of the planes
Applied Horizontal Shear Force
Figure 3.2.1 Diagrammatic Representation: Frictional Resistance vs Applied Shear
3.3. URM Connection: Previous Research
In the following section a review of previous work carried out by other researchers
relevant to the serviceability and shear resistance of URM connections is presented.
33.1. Plain-Masonry Joint Shear
As URM connections containing DPC are in essence a plain-masoffy joint containing a
thin flexible DPC membrane, thefu shear behaviour is closely related to that of a plain-
masomy joint. The main differences are frrstly that the frictional properties of the DPC-
brick, slab or mortar interface rather than the mortar-brick interface must be considered.
Secondly, the initial shear bond, caused by mechanical interlock of mortar and brick in a
plain-masonry joint, is typically reduced significantly where a DPC membrane is present.
38
CHAPTER ( 3 ) - D PC Conne uions in U RM Construction
Previous investigators have shown that when an increasing normal compressive stress is
applied to brickwork, the horizontal shear strength at a plain-masonry joint increases
linearly with compressive stress up to a limiting compressive stress. The widely accepted
explanation for this is that the strength of the joint is derived from a combination of initialshea¡ bond and Coulomb friction between the brick and the mortat. Consequentþ, the
relationship between ultimate shear strengh, G, and normal compressive stress, o", isoften expressed by a Coulomb type relationship, such as that shown in Equation 3.3.1
where to is the initial shea¡ bond and p is the friction coefficient of the brick-mortar
interface.
Íu=To* FC" (3.3.1)
Hendry and Sinha, 1981 have reported on a series of tests carried out on full-scale and
model shear walls built of wire cut bricks in l:V¿:3lime mortar. It was found that the
shear resistance for this type of brickwork was well represented by the Coulomb type
relationship shown in Equation 3.3.2urp to a normal compressive stress level of 2MPa.
t,=03+0.5o" (3.3.2)
Similar results using different brick and mortar combinations have also been reported
(Stafford Smith & Carter 1971, Riddington &Ghazali 1990, Magenes & Ca\vi 1992,
seisun etal1994, Mullins & o'conner 1995). Although ro (0.1 to 1.19) and ¡r (0.4 to
1.33) have varied signif,rcantly with the type of materials tested, a similar Coulomb type
relationship has been obtained for low levels of normal compressive stress.
While the linear Coulomb relationship has been consistently reported for relatively lowIevels of normal compressive stress the above resea¡ch has also indicated that the rate ofincrease in shear strength reduces at higher normal compressive stresses. Where this is
the case the value of p appears to decrease with increasing normal compressive stress.
The level at which this reduction begins has generally been reported to be a¡ound 2MPa
39
CHAPTER (3) - DPC Connections in URM Construction
although this is dependent on the quality of masonry construction and materials
considered.
Although initially it was proposed that an average value of ¡r could be assumed over all
normal compressive stress ranges this was questioned as it did not realistically model the
true shear behaviour at higher over burden stresses. In recognition of this Riddington
and Ghazzali (1990) proposed a hypothesis for the shear failure of plain
Here, simila¡ to the original findings of Hendry and Sinha (1981) and
postulated that below a normal compressive strsss of around 2MPa,
initiated by joint slip as predicted by a typical Coulomb relationship. Above this the
shear failure mechanism is governed by tensile failure within the mortar and finally at
very high compressive stress the compression failure of the brickwork becomes the
dominant factor. An experimental investigation was also reported (Riddington & Ghazali
1990) confirming the plain-masonry shear failure hypothesis as represented in Figure
3.3.t.
Also shown in Figure 3.1.1, the plain-masomy joint failure hypothesis (Riddington &Ghazah 1990) can be related to URM connections containing DPC membrane. Since for
these connections both the initial shear bond and friction coefficient may be reduced as
compared with a plain-masonry joint, the intersection of the DPC joint slip and mortar
tensile failure lines will occur at a higher normal compressive stress. For the range of
normal compressive stress commonly found in Australian masonry construction, as
described Section 2.3 it is therefore unlikely that a mortar tensile failure mechanism
would dominate under horizontal load but rather a joint slip mechanism (refer Figure
3.3.1).
n lô.'.
the was
1S
.t,1
'.t*rY
, l,t"Q trüd\l ,il
\"Ì tl
\ ''- v
I
\,¿l' \'f 'r.t'
\"
\,r f'u
-l 40
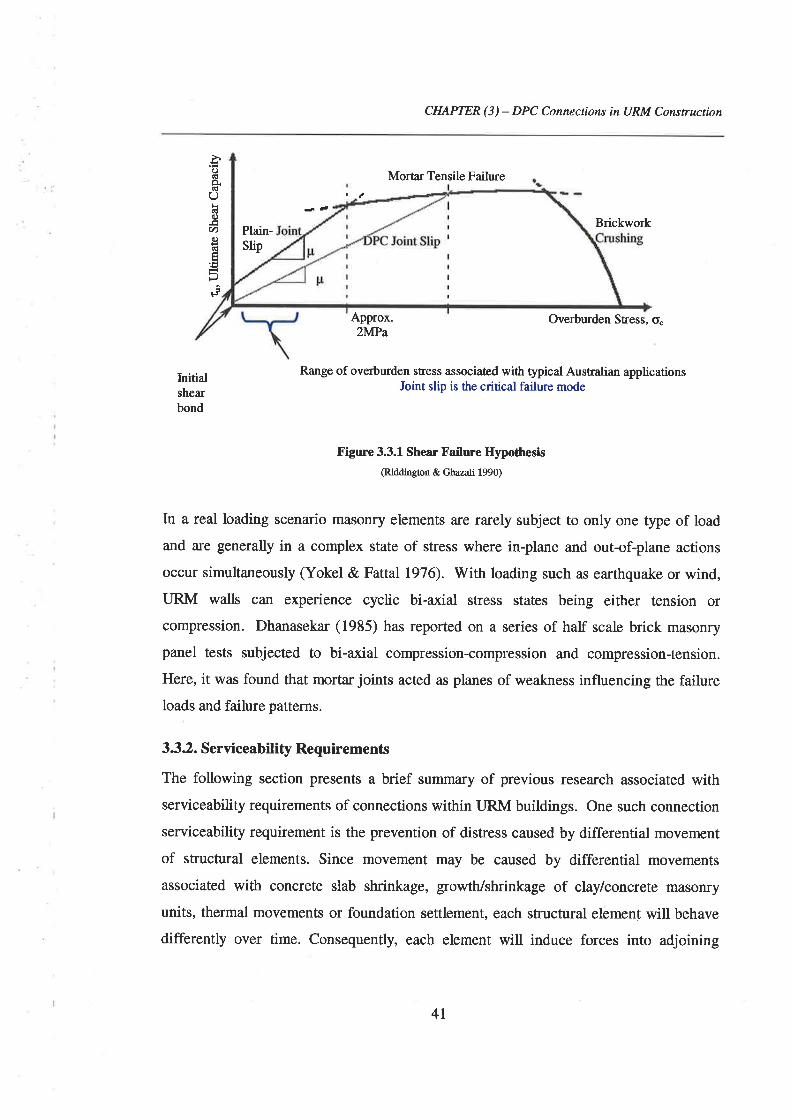
CHAPTER (3) - DPC Connections in URM Construction
Plain-Slip
oçto.ñt
L)kñl(l)
U)()c!E
at:¡
Morar Tensile Failure
Initialshearbond
Brickwork
Approx.2MPa
Overburden SEess, o.
Range of overburden stress associated with typical Australian applicationsJoint slip is the critical failure mode
Figure 3.3.1 She¡r Failure Hypothesis(Riddington & Ghazali 1990)
In a real loading scen¿rio masonry elements are rarely subject to only one type of load
and are generally in a complex state of stress where in-plane and out-of-plane actions
occur simultaneously (Yokel & Fattal 1976). rüith loading such as earthquake or wind,
URM walls can experience cyclic bi-axial stress states being either tension or
compression. Dhanasekar (1985) has reported on a series of half scale brick masonry
panel tests subjected to bi-axial compression-compression and compression-tension.
Here, it was found that morta¡ joints acted as planes of weakness influencing the failure
loads and failure patterns.
3 3 2. Serviceability Requirements
The following section presents a brief summary of previous research associated withserviceability requirements of connections within URM buildings. One such connection
serviceability requirement is the prevention of distress caused by differential movement
of structural elements. Since movement may be caused by differential movements
associated with concrete slab shrinkage, growth/shrinkage of claylconcrete masoffy
units, thermal movements or foundation settlement, each structural element will behave
differently over time. Consequently, each element will induce forces into adjoining
4l

CHAPTER (3) - DPC Connections in URM Construction
elements. Where the induced force is in shear its magnitude is limited by the shear
capacity of the connection joining the structural elements.
It is well documented that concrete, whether it constitutes masonry units or floor slab
undergoes shrinkage and creep with time. In contrast the time dependent behaviour of
clay masonry is not as well documented and is complicated by the composite nature of
the material. It has however been reported (Beard et al 1969) that the time dependent
movement of brickwork is caused by one or a combination of thermal movement,
moisture movement, chemical expansion or deformation under load. Further research
(Beard et al1969, Cole & læwis I974,Wyatt 1976) has reported on studies associated
with the movement of brickwork. In general, findings were that all of the walls expanded
horizontally and vertically with time and the rate of expansion was maximum during the
early life of the wall and decreased with time.^(- T tp J r'Ln !
It is therefore clear that there is a conflict between the time dependent behaviour of
concrete and clay constructed structural elements. As mentioned in Section 3.1, URM
connections containing DPC are typically detailed to fulfil a dual serviceability role, one
of which is that the shear resistive capacity is sufficiently low to allow the differential
movement between structural elements. Research (Beard et al 1969) has been carried out
to determine if this is actually the case as the magnitude of force transmitted by the
differential movement is difficult to ascertain. Here the movement of brickwork above
and below a lead cored bituminous standard DPC connection at the base of an actual
building was measured. It was found that the lack of shear restraint offered allowed the
brickwork above the connection to move.
Although not directly related to seismic loading another important aspect of URM
building serviceability is the movement of footings supporting masonry walls. Research
(Page & Kleenman 1994) has been undertaken to establish parameters influencing wall
behaviour under such actions. Here, provided the walls had sufficient strength to resist
cracking they were found to bridge the movement of the flexible footings. [n practice
42
( t\'
CHAPTER (3) - DPC Connections in URM Construction
masonry walls often do not have sufficient strength to resist cracking and are commonly
observed to crack under deformations permitted by flexible footing movement.
3.33. Positive Anchorage
As highlighted in S lack of anchorage of masonry walls to floor and roofdiaphragms contributed separation and non-uniform vibration of walls in areas ofmoderate intensity shaking. This was less prevalent, however, with concrete slab
diaphragms, which provided a higher normal compressive stress and increased frictionalresistance than in LJRM buildings with flexible timber diaphragms. Conversely,
anchorage through positive connection of concrete slab and URM wall is more likely tocreate a serviceability conflict due to differential movement whereas this is less likelywith the more flexible timber diaphragms.
In order to assess the vulnerabilify of non-anchored timber diaphragms a non-linear
dynamic analysis able to model the friction and impact characteristics of wood joistbearing on a brick wall has been developed (Jones & Cross 1993). Using this model
comparisons were made with the dynamic response of a retrofitted building in Gilroy,California having a well anchored timber floor diaphragm which survived the M. 7.1
[,oma Prieta (1989) earthquake. While entire city blocks were demolished in nearby
Santa C¡uz and another LJRM building, a Town Hall, two blocks south was severely
damaged the Gilroy building sustained very little damage despite roof accelerations of0.799. As a result of the analysis it was found that the structural response remained
elastic provided the diaphragms and wall were connected. If, however, the joist to wallconnections were disconnected the response of the structure moved into the inelastic
range. In the latter case two possible failure mechanisms were identified as (1) collapse
of the wall in out-of-plane bending and (2) when joists moved sufficiently to cause them
to fall from the wall.
Tomazevic et al (1995) have also reported on a series of shaking table tests completed
with V¿ - scale, 2 storey masonry and stone houses having both unconnected timber joists
supporting a concrete slab and connected timber joists also supporting a concrete slab. It
43
CHAPTER (i) - DPC Connections in URM Construction
was found that freely supported wooden floors did not prevent separation of the walls and
severe out-of-plane vibration of the wall was noted. Where horizontal steel ties were
provided separation of the walls was prevented with ultimate collapse caused by shear
failure of the walls in the first story. The input energy needed to cause collapse of the
model building with connected timber joists was over two times greater than the case of
the model without ties. It was concluded that separation of wall can be prevented by
either anchoring wooden floor joists into the wall using steel ties or replacing wooden
floors with reinforced concrete slabs.
Buccino and Vitiello (1995) have reported on an experimental investigation on three
types of anchorage to assess their pull out resistance. The experiments showed that the
shape of the anchorage and quality of the brickwork had a great influence on the
resistance to pull out ofthe anchorage.
ì'- ¡rlì'-L "" l" .''6''"'' .;'' "J' 4 :
3.3.4. Shear Resistance of URM Connection Containing DPC Membrane
Since the frictional resistance properties of connections containing a DPC membrane íue
specific to the particular membrane used overseas research data is not strictly applicable
for Australian URM construction. This being the case a brief review will be presented
for overseas research where applicable with more focus placed on Australian resea¡ch.
As part of a study of the long term differential movement resistance of DPC connections
British researchers (Beard et al1969) first highlighted the need for an understanding of
the frictional resistance of DPC connections. Here it was highlighted that the shear
resistance was significantly less than for a plain-masonry joint. This was confi¡med by a
further experimental study (Hodgkinson & West 1982) which reported on shear tests to
determine the shear resistance of British DPC materials.
Experimental investigations (McGinley & Borchelt 1990:1991) have also been
undertaken to evaluate static friction coefficients for eight connections containing a DPC
membrane commonly found in the United States. Both in-plane and out-of-plane loading
M

CHAPTER (3) - DPC Connections in URM Construction
directions were investigated with both concrete and steel supports. For standard DpCconnections on a concrete slab, static friction coefficients were found to vary from 0.19 to
0.5. Simila¡ results were reported for steel supports however a significant reduction was
noted with the presence of a coating such as galvanising or paint. While it is generally
accepted that rougher slip plane surfaces produce higher coefficients offriction this study
indicated that both the stiffness of the support material on either side of the membrane as
well as the DPC membrane had a significant effect on the friction behaviour. For a given
roughness of DPC material, stiffer membranes produced higher friction coefficients and
are more likely affected by the properties of the supports. In contrast, for a more flexibleDPC the properties of the membrane tended to dominate the frictional behaviour. The in-plane and out-of-plane behaviour was also found to vary significantly which was
attributed to the differing surface texture of the brickwork in either direction.
Static friction tests on a series of three-brick high prisms with up to 0.9MPa normal
compressive stress have also been reported (Suter & Ibrahim 1992) for DPC materials
commonly available in North America. The significance of these tests is that it was hrstrecognised that the location of the DPC membrane within the mortar joint has an effect
on the frictional behaviour. As such, standard DPC, centered DPC and slip jointconnections were tested. Static friction coefficients were found to range from 0.1 for slipjoint connections to 0.6 for the centered DPC connections.
To establish the frictional characteristics of connections containing DPC membranes
directly applicable to Australian masonry construction a comprehensive series of static
tests (Page 1994:1995) has been reported. The membrane t)pes selected were chosen on
the basis of advice from industry to obtain a reasonable representation of common
construction practice in Australia. Here both two and th¡ee-brick long specimens laid inrunning bond with standard DPC, centered DPC and slip joint connection configurations
were tested. Both in-plane and out-of-plane tests were carried out with normal
compressive stress ranging up to l.5MPa. For the range of compressive stress considered
a Coulomb friction relationship was used to describe the shear resistive behaviour. Thus,
tests were performed at various normal compressive sffess and a linear regression of the
45
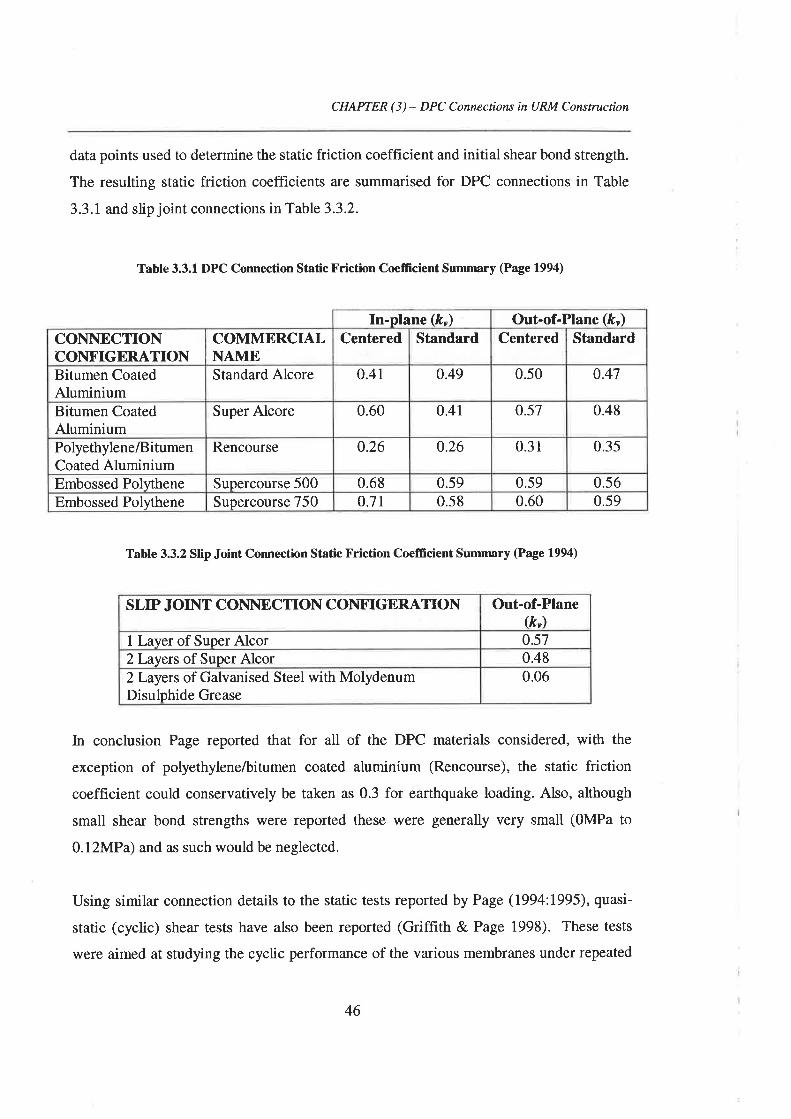
CHAPTER ( 3 ) - DPC Conne ctions ín URM Construction
data points used to determine the static friction coefficient and initial shear bond strength.
The resulting static friction coefficients are summarised for DPC connections in Table
3.3.1 and slip joint connections in Table 3.3.2.
Table 3.3.1 DPC Connection Static Friction Coefficient Sumnury (Page 1994)
Table 3.3.2 Slip Joint Connection Static Friction Coeffcient Summary (Page 1994)
SLIP JOINT CONNECTION CONFIGERATION Out-of-Plane(k")
1 Layer of Super Alcor 0.572Layers of Super Alcor 0.482Layers of Galvanised Steel with MolydenumDisulphide Grease
0.06
In conclusion Page reported that for all of the DPC materials considered, with the
exception of poþthylene/bitumen coated aluminium (Rencourse), the static friction
coefficient could conservatively be taken as 0.3 for earthquake loading. Also, although
small shear bond strengths were reported these were generally very small (OMPa to
0.12MPa) and as such would be neglected.
Using similar connection details to the static tests reported by Page (1994:1995), quasi-
static (cyclic) shear tests have also been reported (Griffith & Page 1998). These tests
were aimed at studying the cychc performance of the various membranes under repeated
In-plane 0c,) Out-of-Plane (/s")
CONNECTIONCONFIGERATION
COMMERCIALNAME
Centered Standard Centered Standard
Bitumen CoatedAluminium
Standard Alcore 0.41 0.49 0.50 0.47
Bitumen CoatedAluminium
Super Alcore 0.60 0.41 0.57 0.48
Poþthylene/BitumenCoated Aluminium
Rencourse 0.26 0.26 0.31 0.35
Embossed Polythene Supercourse 500 0.68 0.59 0.59 0.56Embossed Pol¡hene SupercourseT5O o.7l 0.58 0.60 0.59
46
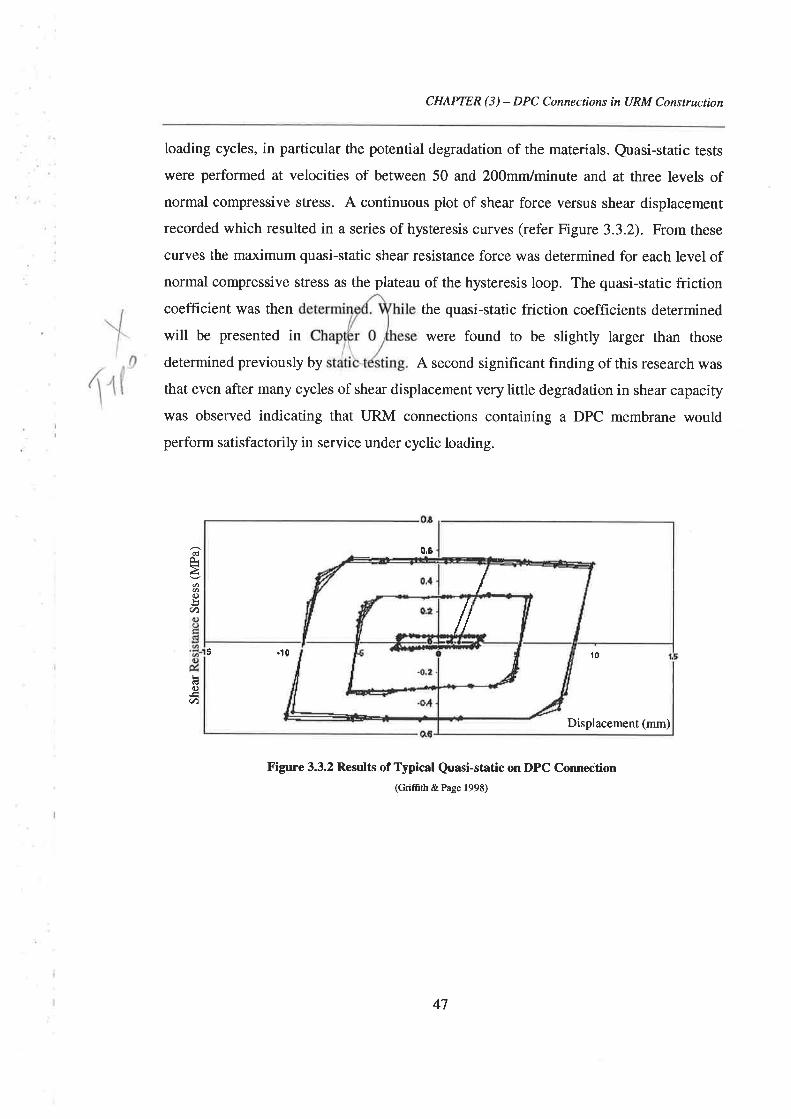
CHAPTER (3) - DPC Connections in URM Construction
loading cycles, in particular the potential degradation of the materials. Quasi-static tests
were performed at velocities of between 50 and 2OOmm/minute and at three levels ofnormal compressive stress. A continuous plot of shear force versus shear displacement
recorded which resulted in a series of hysteresis curves (refer Figure 3.3.2). From these
curves the maximum quasi-static shear resistance force was determined for each level ofnormal compressive stress as the plateau of the hysteresis loop. The quasi-static frictioncoefficient was then the quasi-static friction coefficients determined
were found to be slightly larger than thosewill be presented in
determined previously by A second significant finding of this research was
that even after many cycles of shear displacement very little degradation in shear capacity
was observed indicating that tlRM connections containing a DPC membrane would
perform satisfactorily in service under cyclic loading.
0,ôCËô-àØc)tsv)
3 .10
Figure 3.3.2 Results of Typical Quasi-static on DPC Connection(Griffith & Page 1998)
þ()U)
/IDisplacement (mm)
t0
47
CHAPTER (3) - DPC Connections in URM Construction
3.4. Australian Code Provision: UII,M Connections
The 'SAA Earthquake toading Code', 451170.4-1993 requires connections to be
capable of transmitting a horizontal force of lO(aS) kN/m where ¿ is the acceleration
coefficient and S the site factor. To illustrate this requirement, for a firm soil site in
Adelaide, a = O.lE and S = 1.0. Thus, in this case, connections must be capable of
transmitting a force of lkN/m. Research (Klopp 1996) has indicated that this
requirement may be inadequate being as little as 1/13ù of the required shear capacity for
a two-storey URM building when subjected to the design magnitude earthquake. Despite
this, it was also reported that most typical forms of positive connection would still be
suff,rcient.
As discussed in Section 3.3.3, the positive connection of a concrete diaphragm to a
masonry wall may produce a serviceability problem so that URM connections containing
DPC are often used. Klopp (1996) therefore also compared the calculated confection
shear capacity with experimentally determined (Page 1994:1995) static shear resistance
of connection containing DPC membrane. In general he found that the frictional
resistance capacity was adequate.
Consequently, although friction is generally not recommended as a method of
transferring horizontal loads the 4S1170.4-1993 amendment No.l OCTOBER 1994, now
allows friction to be relied upon at connections containing DPC membrane within
loadbearing masonry construction. The shear resistance capacity however must still be
determined in accordance with the 'SAA Masonry Code',453700-1998 as:
48

CHAPTER (3) - DPC Connections in URM Construction
(3.4.r)
= the earthquake induced design shearforce
= the shear bond strength of the shear section
= Qf'^rA¿*
= the shearfriction strength of the shear section under earthquake actions
= 0.9 kuf¿, A¿n
= the capacity reductionfactor
= the characteristic shear strength of masonry
= the bedded area
- friction cofficient
= the design compressive stress on the bed joint for earthquake actions
= Gr/A¿n
= the gravity load
volv.+vr.
where V¿
vo
Vt"
0
l'^,A¿n
k"
fa
Gs
The first term in Equation 3.4.1 represents the basic shear bond strength and the second
the frictional component of the capacity. For a plane containing a DPC membrane the
shear bond strength is usually negligible as the membrane is generally placed directlyonto brick. The shear capacity of the joint is therefore almost solely a function of frictionand thus on the friction coefficient, k, and the design compressive stress at the frictionplane,f¿.
Importantly, it must be recognised that the currently recommended friction coefficients
are based upon static friction coefficients for URM connections containing DPC
membrane. Confirmation was therefore required to determine if these will be indicative
of the dynamic friction coefficient under true dynamic excitation.
49
CHAPTER (3) - DPC Connections in URM Construction
3.5. Implication of the Dynamic Friction Coefficient
In any seismic event it is well recognised that both horizontal and vertical accelerations
occur. For example Glogau (1974) reported that vertical acceleration as large as two
thirds of the horizontal were recorded during the l9ll San Fernando earthquake. It istherefore possible that with vertical disturbances at the slip interface of a connection
containing a DPC membrane that the maximum static peak tangential force, Fr, may not
be reached as the adhesion between the asperities may already be reduced or broken. Ifthis were the case the critical resistance to shear would then be governed by the lower
dynamic friction force, F¡, and thus dynamic coefficient of friction , kv dynamíc.
As can be seen in Figure 3.2.I the frictional behaviour of the polymer up to the static
frictional resistance force is similar to that of a classical behaving material. Although for
polymers it is possible for the dynamic shea¡ resistance to peak at a critical velocity this
value could not be relied upon due to the unpredictability of earthquake excitation. For
the above reasons it would therefore non-conservative to assume a maximum frictional
resistance force of either F^ or it is possible that the critical resistance to shear
would come from the lower force, F¡.(n4I
3.6. Specific Research Focus
While both static and quasi-static testing has provided data on initial shear bond, static
friction coefficients and the potential degradation of the materials, realistic dynamic
testing is required to quantify the influence of dynamic loading on the frictional
resistance of connections containing DPC membranes. The specific focus of the current
research project related to the DPC connection 'weak link' has therefore been the
undertaking of dynamic testing for the provision of information regarding the true
dynamic behaviour of connections containing DPC membranes commonly found in
Australian masonry construction. This experimental testing phase is presented in Chapter
4 where recommendations are made on the applicability of assuming static or quasi-static
friction coefficients for the seismic design of connections containing DPC membranes.
f År,
50

4. DYNAMIC SHEAR CAPACITYTESTS
ON URM CONNBCTION CONTAINING
DAMP PROOF COURSE MEMBRANE
4.1. Introduction
As highlighted in Chapter 3, concern that the shear capacity of connections containing
DPC membrane under true dynamic loading will be less than under static loading have
led to a series of dynamic shear tests being undertaken. The tests described in this
Chapter were therefore aimed at determining values of dynamic friction coefficients for
connections containing DPC membrane commonly used in Australian masonry
construction.
4.2. Dynamic Shear Tests
Dynamic shear tests were conducted on clay brick masonry connections containing a
variety of DPC membrane material on the eafthquake simulator at the Chapman
Structural Testing Laboratory, University of Adelaide. These have included standard
DPC, centered DPC and slip joint connection conhgurations and considered both in-plane
and out-of-plane shaking. The main advantages of dynamic testing, as opposed to quasi-
static testing, are firstly that true inertial loading can be generated in contrast to
displacement-controlled testing. Secondly, a frequency of loading more representative of
the frequencies normally associated with earthquake induced loading can be applied.
Since dynamic tests are generally more expensive than quasi-static tests, these were used
as 'spot checks' to determine to what extent the quasi-statically determined friction
5l
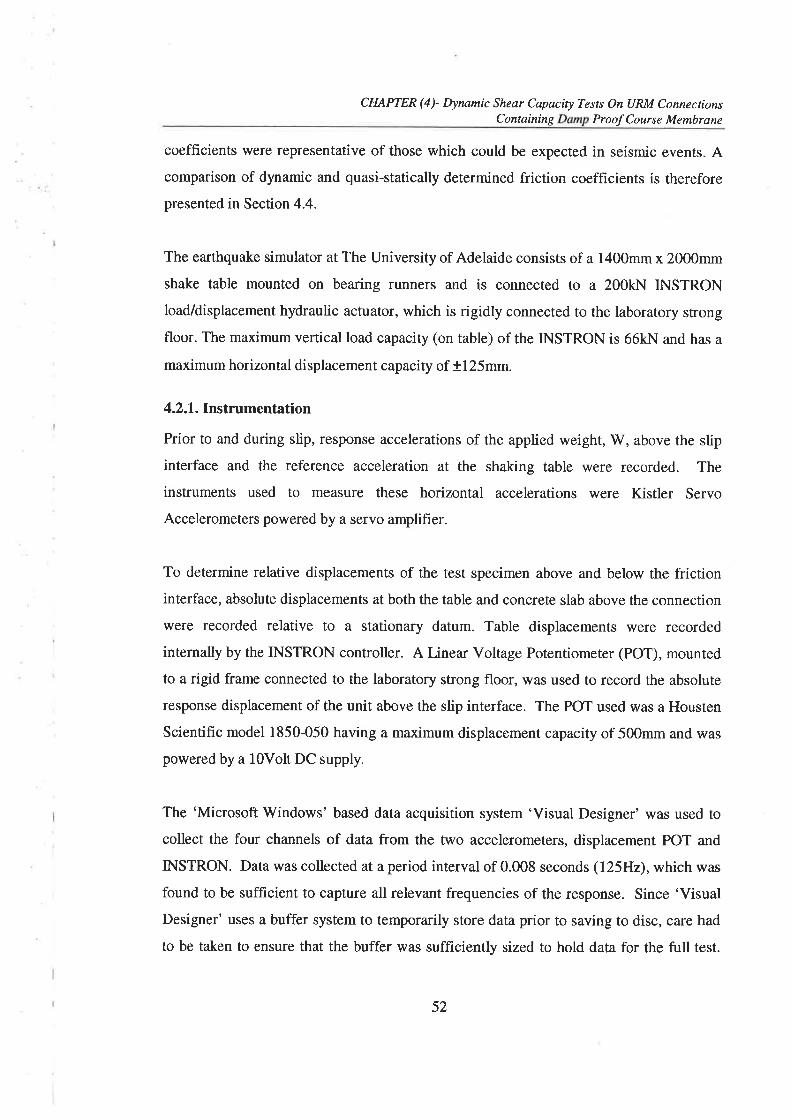
CHAPTER (4)- þnamic Shear Capaciry Tests On URM ConnectionsContaining Proof Course Membrane
coefficients were representative of those which could be expected in seismic events. Acomparison of dynamic and quasi-statically determined friction coefficients is therefore
presented in Section 4.4.
The earthquake simulator at The University of Adelaide consists of a 1400mm x 2000mm
shake table mounted on bearing runners and is connected to a 200kN INSTRON
load/displacement hydraulic actuator, which is rigidly connected to the laboratory strong
floor. The maximum vertical load capacity (on table) of the INSTRON is 66kN and has a
maximum horizontal displacement capacity of +125mm.
4.2.1. Instrumentation
Prior to and during slip, response accelerations of the applied weight, W, above the slip
interface and the reference acceleration at the shaking table were recorded. The
instruments used to measure these horizontal accelerations were Kistler Servo
Accelerometers powered by a servo amplifier.
To determine relative displacements of the test specimen above and below the frictioninterface, absolute displacements at both the table and concrete slab above the connection
were recorded relative to a stationary datum. Table displacements were recorded
internally by the INSTRON controller. A Linea¡ Voltage Potentiometer (POT), mounted
to a rigid frame connected to the laboratory strong floor, was used to record the absolute
response displacement of the unit above the slip interface. The POT used was a Housten
Scientihc model 1850-050 having a maximum displacement capacity of 500mm and was
powered by a lOVolt DC supply.
The 'Microsoft Windows' based data acquisition system 'Visual Designer' was used to
collect the four channels of data from the two accelerometers, displacement POT and
INSTRON. Data was collected at a period interval of 0.008 seconds (l25Hz), which was
found to be sufficient to capture all relevant frequencies of the response. Since 'Visual
Designer' uses a buffer system to temporarily store data prior to saving to disc, care had
to be taken to ensure that the buffer was sufficiently sized to hold data for the full test.
52

CHAPTER (4)- Dynamic Shear Capacity Tests On URM ConnectionsContøining Damp Proof Course Metnbrane
The overall test set up, location of instrumentation and data acquisition is shown
schematically in Figure 4.2.1.
Test specimenRigid frame fixed ûo
laboratory stong floor
Displacement(POT) Accelerometer
INSTRONHydraulic
Accelerometer
INSTRON conhol panel Data acquisition
Figure 4.2.1 Schenratic URM Connection Containing DPC Dynamic Test Set-up
4.22. Damp-Proof Course Membrane and Materials
For the various dynamic connection shear tests undertaken, four different types of DPC
membrane were tested, having been selected to match as closely as possible materials
used in previous quasi-static tests (Griffith & Page 1998). A brief description of each
DPC material tested is given in Table 4.2.1.
It should be noted that both the Polyflash and Dry-Cor membrane were not identical to
the products used in quasi-static tests. Although the membranes were produced from
similar materials they had a different commercial name and the thickness varied slightly.
Despite this it was expected that their frictional behaviour would be similar.
lrrarÂ"*F ^rfu-
Shaking table
ooo ooo
53

CHAPTER (4)- þnamic Shear Capacity Tests On (JRM ConnectionsContaining Damp Proof Course Mernbrane
T able 4.2.1 DFC Membrane Test Specinrens
Bricks used to construct the connections were standard 'Red' 3 hole extruded clay bricks.
These had the nominal dimensions 230x110x76mm. Mortar was bucket batched using a
l:1:6 cement:lime:sand mix where water was added by the tradesman to achieve a
reasonable workability. Including sand absorbed moisture this typically resulted in a
total batch water content of approximately 23Vo. Associated material tests includingmortar compressive strength and masonry modulus will be described later in Chapter 6.
4.23. Dynamic Test Methodology
As shown in Figure 4.2.2 a concrete slab of dimensions 1000 x 1400 x 100mm was used
to support lead ingots above the connection to be tested thus providing a total normal
weight, W, at the friction interface. By varying the number of lead ingots the normal
compressive force at the friction interface, N (=W), could be varied enabling dynamic
shear tests to be carried out at various levels of normal compressive stress.
While an earthquake event comprises a wide range of frequencies, dominant frequencies
of around 2-5Hz arsnot uncommon. For all the dynamic tests reported here inertial loads
were induced across the friction interface by applying a represent ative ZHz sinusoidal
displacement motion to the earthquake platform. The amplitude of the motion was
gradually increased until slipping occurred at the connection. Once slip occurred, the
dynamic inertia force, Fi, was determined as, Fi -'W x a.¡0, where â5¡p wôs the slidingresponse acceleration sustained by the mass above the friction interface. Since the weightwas already in motion it was assumed that initial shear bond was not relevant so that the
entire resistance force was due to friction. Therefore, for horizontal equilibrium,equating the inertia force with the dynamic frictional resistance force, F* the dynamic
CommercialName Description Nominal Thickness
Standard Alcor Bitumen Coated Aluminium 950 pmm
Super Alcor Bitumen Coated Aluminium 1550 ¡rmmPolyflash Polyethylene/ Bitumen Coated Aluminium 650 pmm
Dry-Cor Embossed Polythene Plastic 850 pmm
54
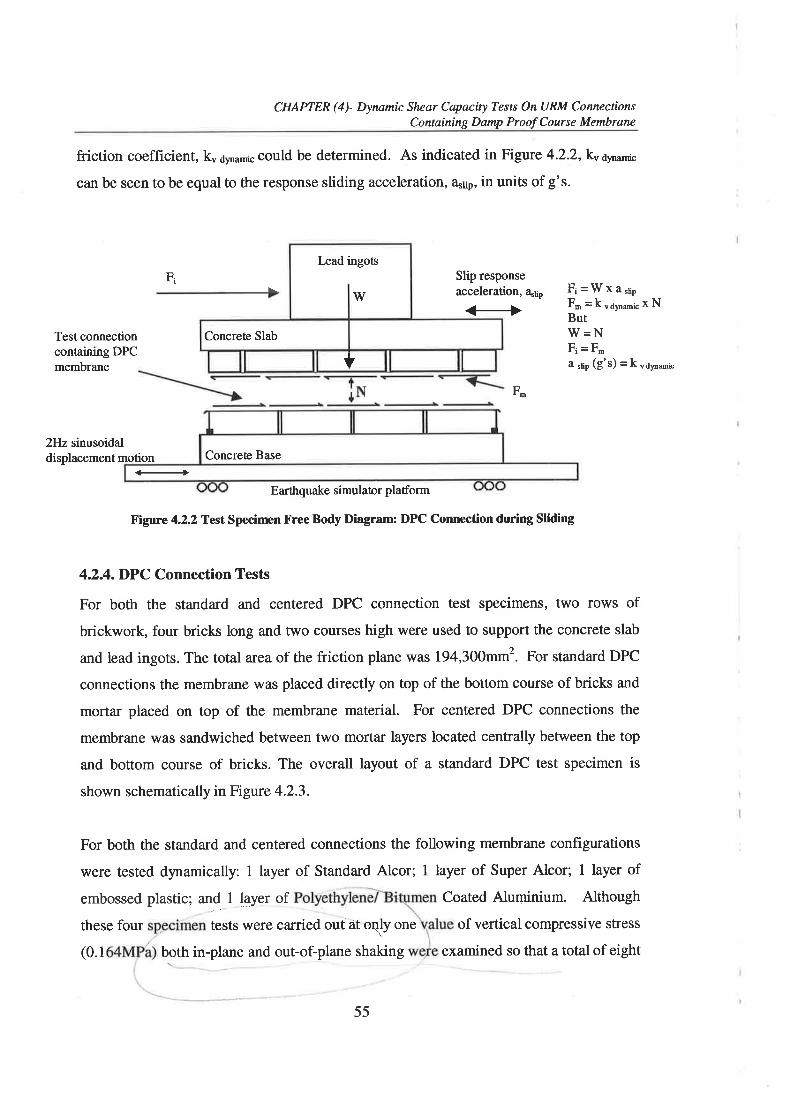
CHAPTER (4)- þnarnic Sheør Capa.ciry Tests On URM Conn¿ctionsContaining Danp Proof Course Membrane
friction coef|lcient, ku¿you-i"could be determined. As indicated in Figure 4.2.2, kv<lræamic
can be seen to be equal to the response sliding acceleration, rkup, in units of g's.
Rkad ingots
V/
Concrete Slab
t
Sþ responseacceleration, 4¡n Fr=Ìüxa'þ
F.=ku¿t*¡xNButW=NFi=Fa .Iip (8's) = k
"¿yo*t
Test connectioncontaining DPCmembrane
F-
2Hz sinusoidaldisplacement motion
Earthquake simulator pladorm
Figure 4.2.2 Test Specimen Free Body Diagram: DPC Connection durirry Sliding
4.2.4. DPC Connection Tests
For both the standard and centered DPC connection test specimens, two rolvs of
brickwork, four bricks long and two courses high were used to support the concrete slab
and lead ingots. The total area of the friction plane was 194,300mm2. For standard DPC
connections the membrane was placed directly on top of the bottom course of bricks and
mortar placed on top of the membrane material. For centered DPC connections the
membrane was sandwiched between two mortar layers located centrally between the top
and bottom course of bricks. The overall layout of a standard DPC test specimen is
shown schematically in Figure 4.2.3.
For both the standard and centered connections the following membrane conf,igurations
were tested dynamically: I layer of Standard Alcor; 1 layer of Super Alcor; I layer of
embossed plastic; attd ,1 layer of Coated Aluminium. Although
these four tests were ca.rried out at oqy one of vertical compressive sffess
both in-plane and out-of-plane shaking
I
Concrete Base
(0.1
55
examined so that a total of eight
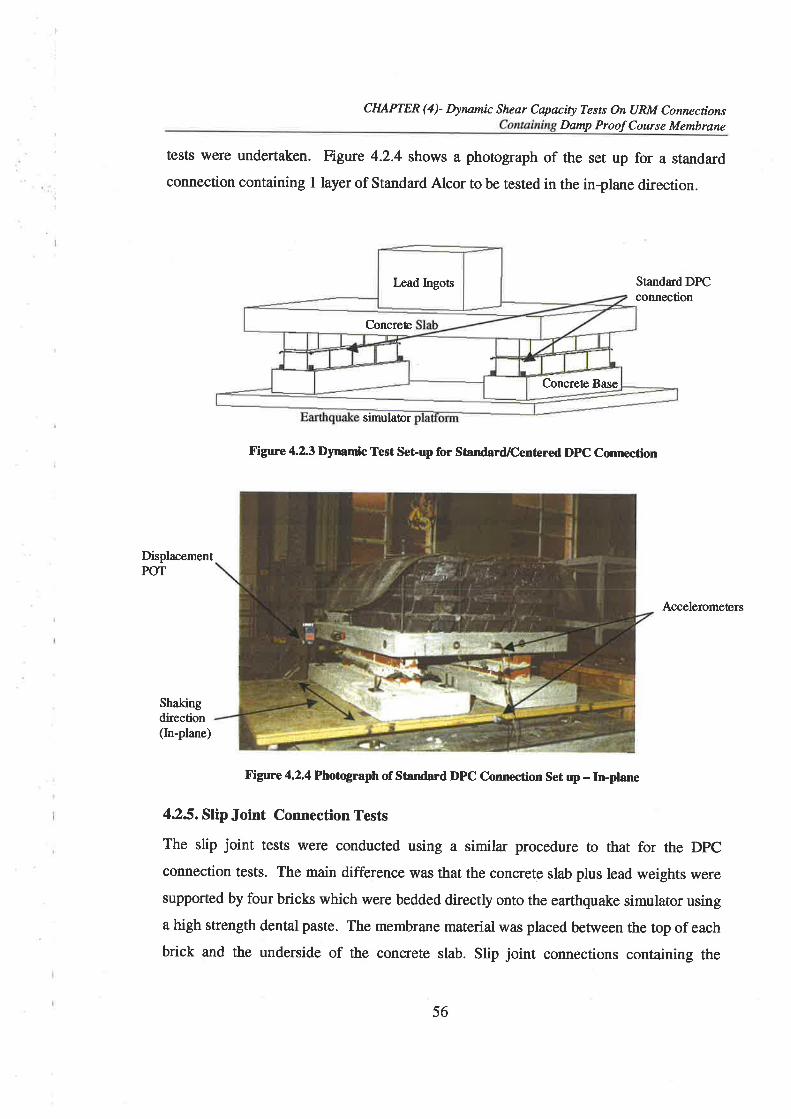
CHAPTER (4)- þnamic Shcør Capøcity Tests On URM ConnectionsDanp Proof Course Membrane
tests were undertaken. Figure 4.2.4 shows a photograph of the set up for a standatd
connection containing I layer of Standard Alcor to be tested in the in-plane direction.
Standard DPCconnection
simulator
Figure 4.2.3 Dynam¡c Test Set-up for Standard/Centered DpC Connection
Displacement
Accelerometers
Shakingdirection(h-plane)
Figure 4.2.4 Photograph of Standard DPC Connection Set up - In-plarrc
425. Slip Joint Connection Tests
The slip joint tests were conducted using a similar procedure to that for the DPC
connection tests. The main difference \ryas that the concrete slab plus lead weights were
supported by four bricks which were bedded directly onto the earthquake simulator using
a high strength dental paste. The membrane material was placed between the top of each
brick and the underside of the concrete slab. Slip joint connections containing the
POT
Iæad Ingots
Concrete
Concrete Base
56
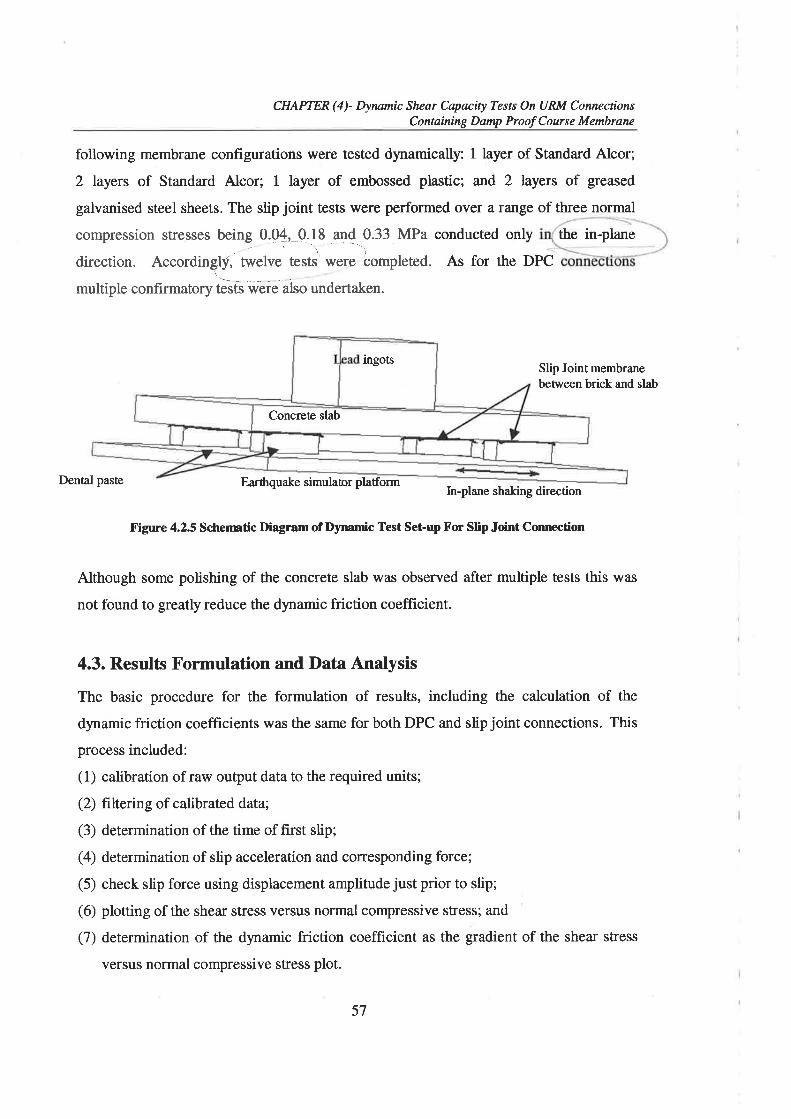
CHAPTER (4)- þnanic Shear Capaciry Tests On URM ConnectionsContaining Damp Proof Course Membran¿
following membrane conflgurations were tested dynamically: 1 layer of Standard Alcor;
2 layers of Standard Alcor; 1 layer of embossed plastic; and 2 layers of greased
galvanised steel sheets. The slip joint tests rr¡vere performed over a range of three normal
compression stresses being 9,q4,_Q.J8 an{_0.33 MPa.\
direction. According,.ly, twelve tests' \ryere'bompleted.'\- -,multiple conf,rrmatory tests were also undertaken.
conducted only the in-plane
As for the DPC
Slip Jointmembranebetween brick and slab
Dental paste Earthquake simulator pladormIn-plane shaking direction
Figure 4.2.5 Schemtic Diagram of Dynamic Test Set-up For Slip Joint Connection
Although some polishing of the concrete slab was observed after multiple tests this was
not found to greatly reduce the dynamic friction coefficient.
4.3. Results Formulation and Data Analysis
The basic procedure for the formulation of results, including the calculation of the
dynamic friction coefficients was the same for both DPC and slip joint connections. This
process included:
(1) calibration of raw output data to the required units;
(2) filtering of calibrated data;
(3) determination of the time of first slip;
(4) determination of slip acceleration and corresponding force;
(5) check slip force using displacement amplitude just prior to slip;
(6) plotting of the shear stress versus normal compressive stress; and
(7) determination of the dynamic friction coefficient as the gradient of the shear stress
versus normal compressive stress plot.
ingots
Concrete slab
57

CHAPTER Ø)- Dynanic Shear Capaciry Tests On URM ConnectionsContaining Proof Course Membrane
43.1. Data Filtering
Since a zlfz sinusoidal displacement motion was input to the earthquake platform onlyfrequencies near this were considered to be relevant to the response. Figure 4.3.1 shows a
typical Fast Fourier Transform (FFT) of response acceleration data where the 2Hz
frequency amplitude is clearly dominant. In order to remove irrelevant noise frequencies
from the raw data a Fortran 77 band-pass filter program was specif,rcally developed forthese tests (the code is included in Appendix (A)).
Figure 4.3.1 Dominant Response Acceleration Frequencies
Extensive testing of this filter was undertaken to determine the most suitable band-pass
shape and provide an indication of the accuracy of the filter. It was found that a parabolic
sided band-pass filter gave the best results although the hrst and last second of data was
found to be slightly corrupted and as such were discarded. Although the filter program
allows any band-pass range to be set to best encompass the relevant frequencies full pass
was considered between 1.5 and2.5Hz reducing to zero at 0.5H2 and3.SHzrespectively(refer Figure 4.3.2).
I
J .I^
350
300
250
2N
150
100
50
0
o€e
?clcgq?eqqgeqcqqqqeeqocto{h\oræo\O ÈÈÊÊcl
tr'requency (Fz)
58

CHAPTER (4)- þnatnic Shzør Capøcity Tests On URM ConncctionsContaining Danp Proof Course Membrane
1.2
zrõ? o.a
é o.uF<
4. o.¿I
?, o,0
N or¡so
FREQIIENCY (Hz)o o N
r \I \I \I \/
Figure 4.3.2 Parabolic Sided Band Pass Filter - Bandlvidth
4.3 2. Dynamic Friction Coefficient Represent¿tive Calculation
The following Section provides a representative calculation of the dynamic friction
coefficient. Here a slip joint configuration with two layers of Standa¡d Alcor (refer Table
4.2.1), subjected to in-plane shaking with a normal overburden stress of 0.18MPa
(N=17.8kN) is used to illustrate the result formulation procedure.
Figure 4.3.3 shows the absolute displacement response of both the connection above and
below the slip interface relative to the stationary datum. Prior to 24.5 seconds both the
top and bottom units behave as one as the input table sinusoidal displacement motion is
gradually increased. At 24.5 seconds the connection's shea¡ resistive capacity is
exceeded and slip occurs. From this time on the frictional resistive force is proportional
to the dynamic friction coefficient, ku.¿vou-i". Since this is slightly less than the static
friction coefficient there is a respective decrease in the sinusoidal response displacement
amplitude that the unit above the connection can sustain during sliding. The response
accelerations of the unit above the interface are recorded as is shown in Figure 4.3.4.
Here a maximum of 0.469 is observed. The dynamic friction coeff,rcient is then
determined directly from the slip acceleration as 0.46. From the acceleration response
data, hysteresis behaviour can also be developed as shown in Figure 4.3.5. The
maximum dynamic frictional resistive force can be determined as the top and bottom
plateau of each hysteresis loop as 7.7kN.
59
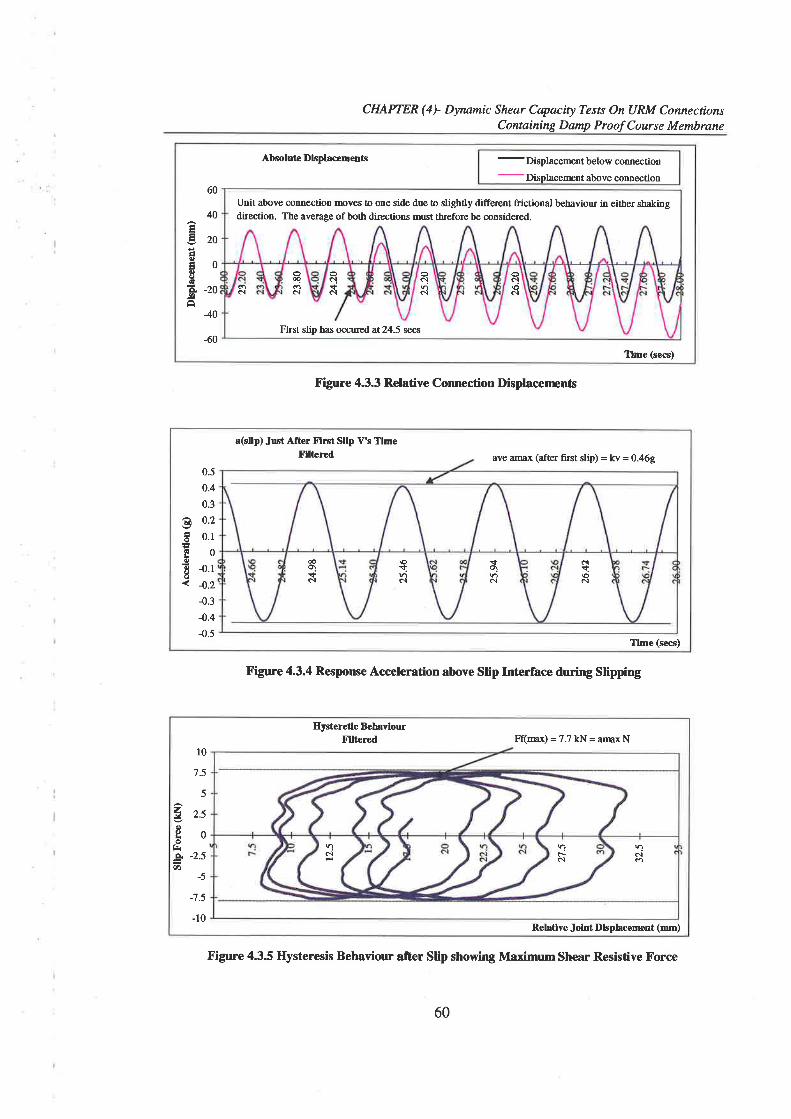
CHAPTER (4)- þrnmic Shear Capaciry Tests On URM ConnectionsContaining Danp Proof Course Membrane
Absolutc Dlsplacements
- Displacement belotÃ, connection
- Displacemøt above connection
60
40
E 'rnÈËoogcÊ -20Ê
40
-60Tlrne (secs)
Unit above connection moves to one side due ø slightly different frictional behaviou¡ in eiiber shakingdi¡ection. The average of botb directions must th¡efo¡e be considered.
ocmô¡
First slip hls 6çPuI€d at 24.5 s€cs
ôl
oc!{cìdeì
oô!\od
a(sllp) Just Aftor Xìrst Sllp V's TlmeFllûercd ave alnax (after first slip) = kv = 0.469
e6oogg
0.5
0.4
0.3
0.2
0.1
0
-0.1
-0.2
-0.3
-0.4
-0.5Tlme (secs)
çqa.¡
æqçN\oac¡
(ìa\oN
Figure 4.3.3 Relative Connection Displacenrcnts
Figure 4.3.4 Response Acceleration above Slip Interface during Slipping
Figure 4.3.5 llysteresis Behavior¡r after Slip showing Maximum Shear Resistive Force
Hystereüc BehavlourFllte¡ed Ff(max) = 7.7 kN = amx N
z.¡a
oo
f¡rÊ
(t)
l07.5
5
2.5
0
-2.5
-5
:7.5
-10Reladve Jolnt Dbplacemcnt (mm)
ne.¡
q)t-N
nN
60

CHAPTER (4)- þnamic Shear Capacity Tests On URM ConnectionsContaining Darnp Proof Course Membrane
4.33. Theoretical Check
To check that recorded accelerations were of the correct order the following calculation
was undertaken for all tests.
The steady-state displacement response of a single degree of freedom system (SDOÐ
subjected to harmonic loading is of the form:
u(t;=Asin(CIt-0)where u(t) = displacement response
A = Displacement amplitude
6 = Angular frequency =2ftf/= Frequency
0 = Phase angle
(4.3.1)
By integrating and double integrating this both the velocity v(t), and acceleration a(t)
response can be determined respectively as:
v(t) = -A sin (ot - e) (4.3.2)
a(t) = -Aõ2 sin (õt - 0) (4.3.3)
The maximum acceleration therefore occurs when sin(õt - e) = I and is given as:
âunx = l-eot l= l-Nzrrn'l Ø3.4)
For the case of a 2Hz sinusoidal response, the maximum acceleration is related to the
amplitude of the displacement response by:
Írnax= l-n4ù'l =157.94 1mm/s2)
For the example in Section 4.3.2, A at slip = 28.5mm implies
ârnx = 157.9 x28.5t(9.81x 10³) = 0.46 g
This agrees thereby confirming that the acceleration data (and hence friction coeff,rcients)
were consistent.
6t
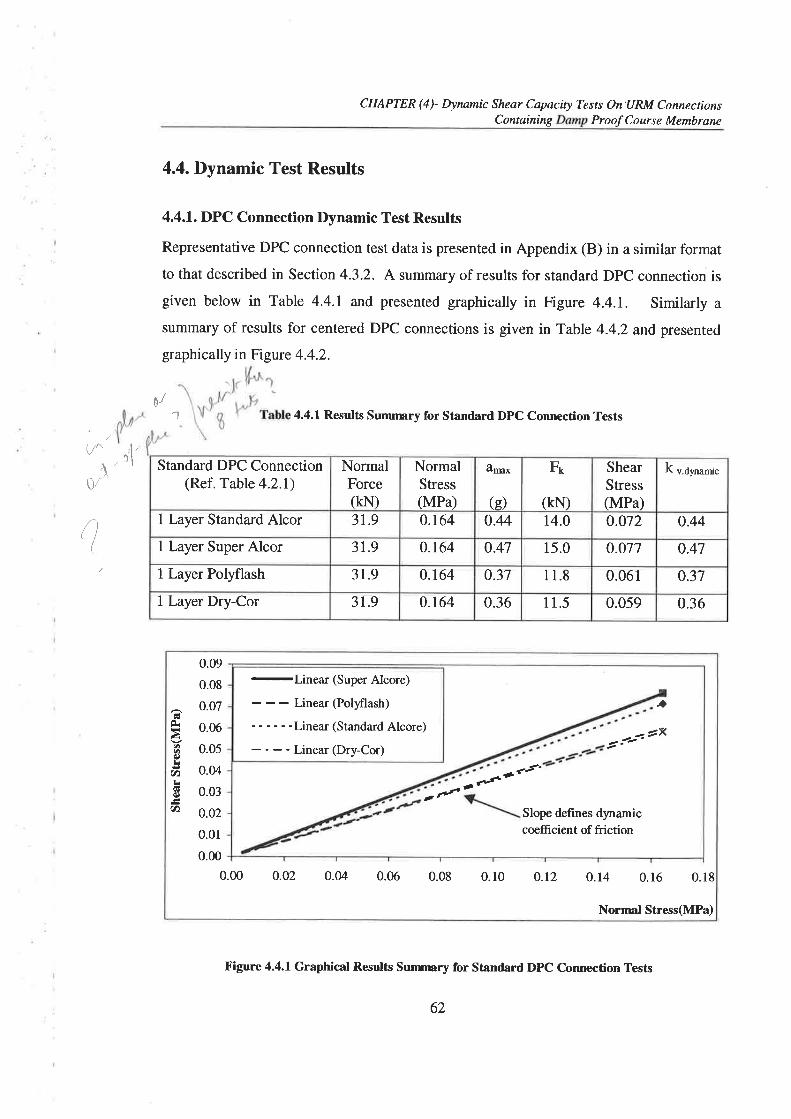
/
CHAPTER (4)- þnamic Shear Capacity Tests On'URM ConnectionsContaining Proof Course Membrane
4.4. Dynamic Test Results
4.4.1. DPC Connection Dynamic Test Results
Representative DPC connection test data is presented in Appendix (B) in a similar format
to that described in Section 4.3.2. A summary of results for standard DPC connection is
given below in Table 4.4.1 and presented graphically in Figure 4.4.1. Similarly a
summary of results for centered DPC connections is given in Table 4.4.2 and presented
graphically in Figure 4.4.2.
4.4.1 Results Sumrmry for Standard DPC Connection Tests
Figure 4.4.1 Graphical Results Sumrnary for Standard DPC Connection Tests
1
(/'a\
0/
/^\LI
(
'1 Standard DPC Connection(Ref. Table 4.2.1)
NormalForce(kN)
NormalStress(MPa)
flma*
(g)
FL
(kN)
ShearStress(MPa)
k v.dynamic
1 Layer Standard Alcor 31.9 0.164 0.44 14.0 0.072 0.44
1 Layer Super Alco¡ 31.9 0.164 0.47 15.0 0.077 o.4l1 Layer Polyflash 3r.9 0.764 0.37 1 1.8 0.061 o.37
I Layer Dry-Cor 31.9 0.164 0.36 .511 0.059 0.36
-Linear
(Super Alcore)
Linea¡ (Polyflash)
- - - - - -Linear (Standa¡d Alcore)
Linear (Dry-Cor)=l(
a
-
tfJ
Slope defines dynamiccoeffrcient of friction
clÈÀøoq)L
(t)¡rco)
v)
0.09
0.08
0.07
0.06
0.05
0.ù1
0.03
0.02
0.01
0.00
0.00 0.02 0.04 0.06 0.08 0.10 0.12 0.14 0.16 0.18
Normal Stress(MPa)
62
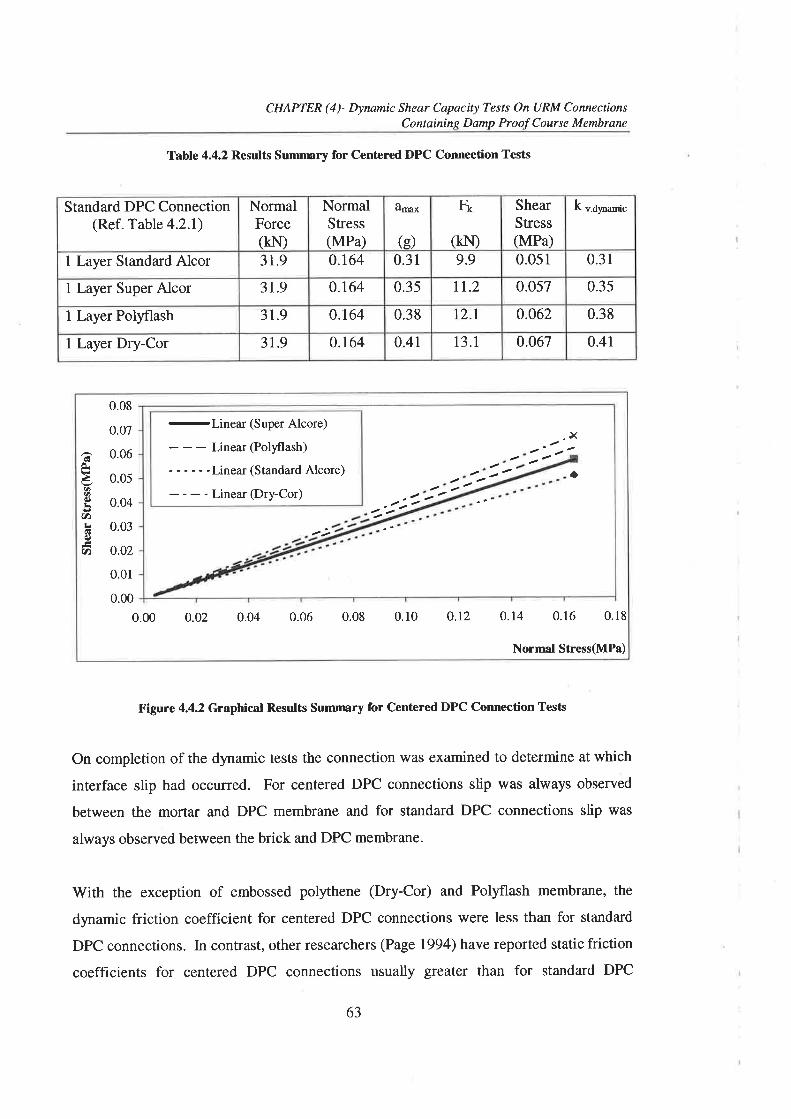
CHAPTER (4)- Dynnmic Shear Capaciry Tests On URM ConnectionsContaining Damp Proof Course Membrane
Standard DPC Connection(Ref. Table 4.2.1)
NormalForce(kN)
NormalStress(MPa)
ânnx
(e)
Fr
(kN)
ShearStress(MPa)
k v.dFamic
1 Layer Standard Alcor 3t.9 0.164 0.31 9.9 0.05r 0.31
1 Layer Super Alcor 3r.9 0.164 0.35 tt.2 0.057 0.35
1 Layer Polyflash 31.9 0.164 0.38 t2.t 0.062 0.38
1 Layer Dry-Cor 3r.9 0.t64 0.41 13.1 0.067 0.41
Table 4.4.2 Results Sunmnry for Centered DPC Connection Tests
Figure 4.4.2 Graphical Results Sumrmry for Centered DPC Connection Tests
On completion of the dynamic tests the connection was examined to determine at which
interface slip had occurred. For centered DPC connections slip was always observed
between the mortar and DPC membrane and for standard DPC connections slip was
always observed between the brick and DPC membrane.
rüith the exception of embossed polythene (Dry-Cor) and Polyflash membrane, the
dynamic friction coefficient for centered DPC connections \Mere less than for standard
DPC connections. In contrast, other researchers (Page 1994) have reported static friction
coefficients for centered DPC connections usually greater than for standard DPC
îÈ¿6øc)
U)¡r6lO
(t)
0.08
0.07
0.06
0.05
0.04
0.03
0.02
0.01
0.00
0.00 0.o2 0.04 0.06 0.08 0.10 0.12 0.14 0.16 0.18
Normal Stress(MPa)
-Linear
(Super Alcore)
Linea¡ (Polyftash)
- - - - - -Linear (Standard Alcore)
Linea¡ (Dry-Cor)a
X
63
CHAPTER (4)- þrumic Shear Capaciry Tests On URM ConnectionsContaining Damp Proof Course Membrane
connections. This difference is attributed to a high dependency on workmanship, as any
irregularity in the mortar bed below the membrane will significantly impact on the
frictional properties of a centered DPC connection. As such, comparison of the frictionalbehaviour of these connections, with other researcher's results, is difficult.
As mentioned in Section 3.3.4 previous resea¡chers have found that for a given roughness
of flashing material, stiffer DPC membranes produce higher coefficients of friction and
are more likely to be affected by the properties of the support. The dynamic test results
imply that the mortar-DPC sliding plane of the centered DPC connection provided less
frictional resistance than the brick-DPC sliding plane of the standard DPC connection.
This indicates that the stiffness of the support mate¡ial on either side of the membrane
had a significant effect on the friction behaviour for the relatively stiffer Alcormembranes. Further the Polyflash and embossed polythene, which were less stiff,frictional properties did not appear to be as greatly effected by the properties of the
supports but were dominated by the behaviour of the DPC membrane.
4.42. Slip Joint Connection Dynamic Test Results
Representative DPC connection test data is presented in Appendix (C) in a similar format
to that described in Section 4.3.2. Results of dynamic stip joint shear tests at various
levels of normal compressive are presented in Figure 4.4.3 to Figure 4.4.5 for out-
of-plane loading and Figure 4.4.8 for in-plane loading. The dynamic\as the gradient of the-lirea¡-regression line. Thefriction coefficient,
embossed plastic (Dry-Cor) slip joint connection shear test was only completed at one
level of normal compressive stress (0.33MPa) where the dynamic friction coefficient was
0.41. Comparison of the in-plane and out-of plane plots indicated that no significant
difference was apparent in the dynamic friction coefficient obtained for the two loading
directions. This is attributed to there being no distinct difference in the roughness of the
brick fo¡ the two directions. Consequently no further distinction will be made with regard
to loading direction.
1IìI
2.4.1
64
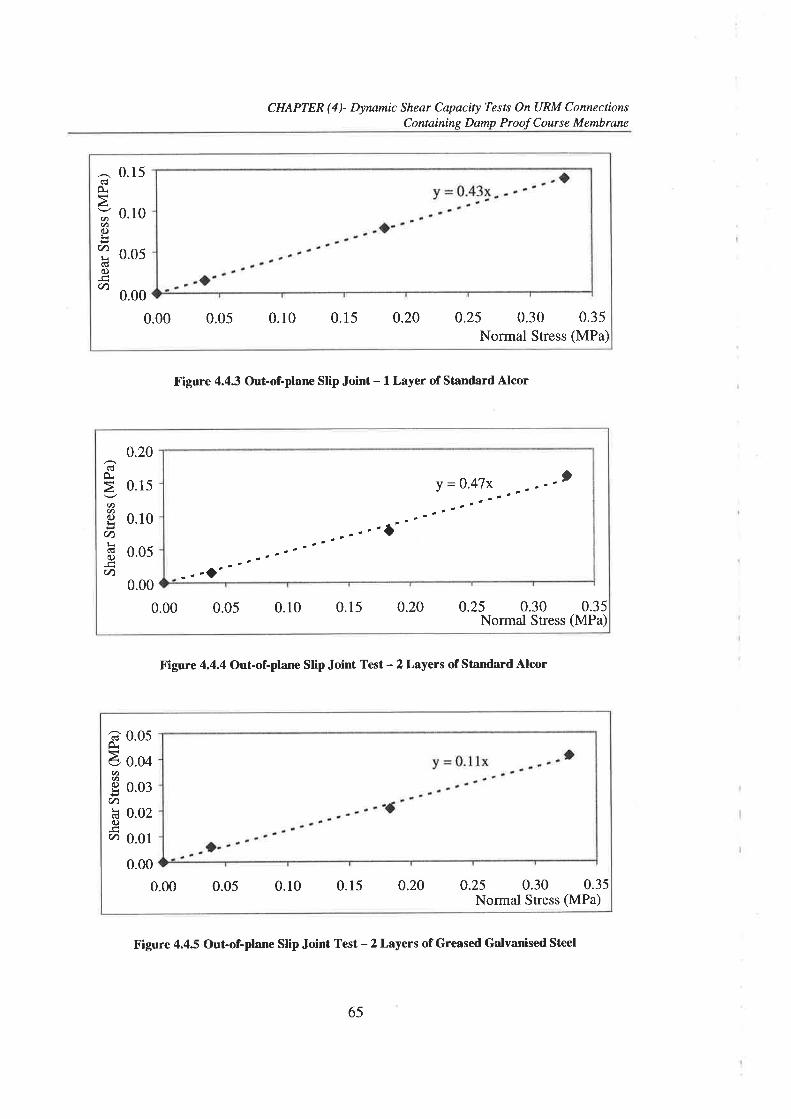
CHAPTER (4)- Dynamic Shear Capacity Tests On URM ConnectionsContaining Damp Proof Course Membrane
(dê.àØ.t)c)k€
V)L(Úo)
V)
0.15
0.10
0 .05
0.00
0.00 0.05 0.10 0.15 0.20 0.25 0.30 0.35Normal Stress (MPa)
Figure 4.4.3 Out-of-plane Slip Joint - l Layer of Standard Alcor
Figure 4.4.4 Out-of-plane Slip Joint Test - 2 Layers of Standard Alcor
Figure 4.4.5 Out-of-plane Slip Joint Test - 2 Layers of Greased Galvanised Steel
0.20(nÀàØ.t)o)t<
V)li
o(t)
0.
0.
1 5
01
0 .05
0.00
0.00 0.05 0.10 0.15 0.20 0.25 0.30 0.35Normal Stress (MPa)
v =0.47x )
e 0.05Àe o.o4ØØg 0.03
(t)E 0.02C)
Ø 0.01
0.000.00 0.0s 0.10 0.15 0.20 o.25 0.30 0.35
Normal Stress (MPa)
65
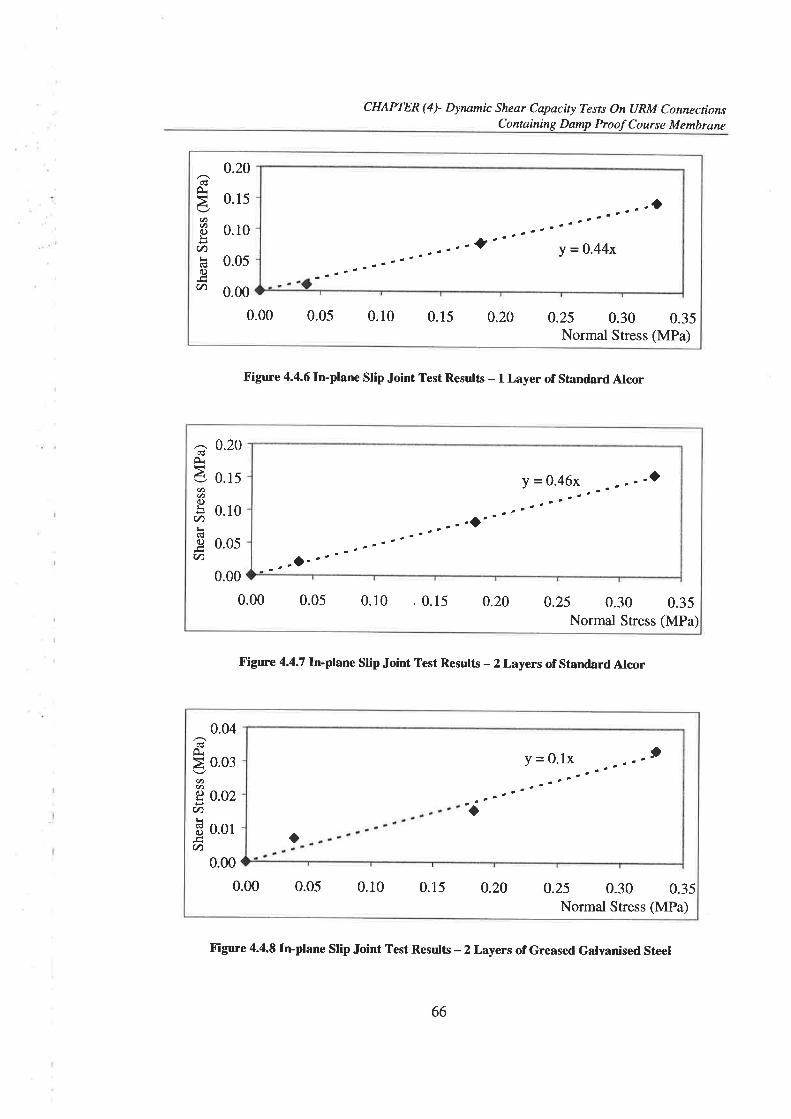
CHAPTER (41 þnatnic Shear Capacity Tests On URM ConnectionsContaining Damp Proof Course Membrane
0.20(!ô-
ØE 0.10LV)þ 0.0so)u) o.oo
0.00 0.0s 0.10 0.15 0.20 0.25 0.30 0.3sNormal Stress (MPa)
1ù'' Y =o'44x
Figure 4.4.6 In-plane Slip Joint Test Resr¡lts - 1 Layer of Standard Alcor
Figure 4.4.7 In-plane Slip Joint Test Results - 2 Layers of Standard Alcor
Figure 4.4.8 In-plane Slip Joint Test Resr¡lts - 2 Layers of Greased Galvanised Steel
CÚÀl<rÀ.t).t)(l)È
U)¡rclo)
v)
0.
0.
0.
20
I 5
0I
0.05
0.00
0.00 0.05 0.10 . 0.15 0.20 0.25 0.30 0.35Normal Stress (MPa)
C€lJiàØØ6)È
U)L(Éc)
v)
0.04
0.03
0.02
0.01
0.00
0.00 0.05 0.10 0.15 0.20 0.25 0.30 0.35Normal Stress (MPa)
Y = 0'lx
a
)
o
66
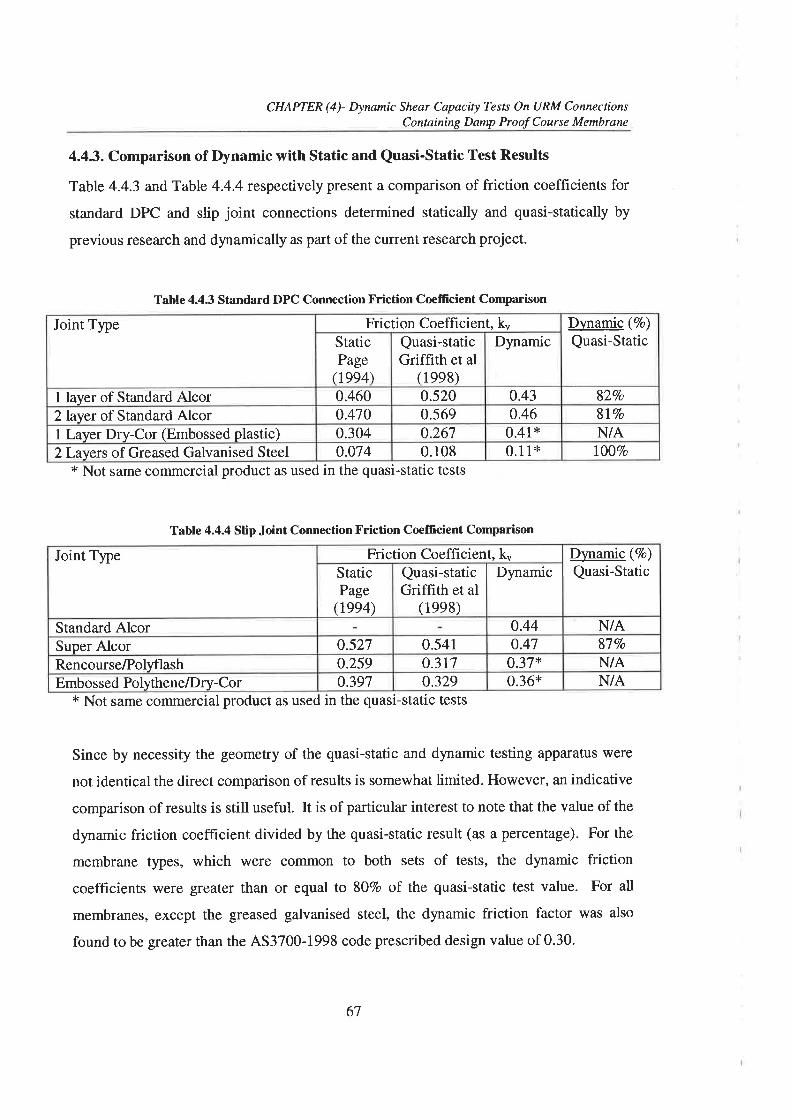
CHAPTER (4)- þnamíc Shear Capaciry Tests On URM ConnectionsContøining Damp Proof Course Membrane
4.43. Comparison of Dynamic with Static and Quasi-Static Test Results
Table 4.4.3 and Table 4.4.4 respectively present a comparison of friction coefficients for
standard DPC and slip joint connections determined statically and quasi-statically by
previous research and dynamically as part of the current resea¡ch project.
Table 4.4.3 Standard DPC Connection Friction Coefficient Comparison
* Not same commercial product as used in the quasi-static tests
Table 4.4.4 Slip Joint Connection Friction Coeffcient Comparison
* Not same conìmercial product as used in the quasi-static tests
Since by necessity the geometry of the quasi-static and dynamic testing apparatus were
not identical the direct comparison of results is somewhat limited. However, an indicative
comparison of results is still useful. It is of particular interest to note that the value of the
dynamic friction coefficient divided by the quasi-static result (as a percentage). For the
membrane qrpes, which \ilere coflìmon to both sets of tests, the dynamic friction
coefficients were greater than or equal to 80Vo of the quasi-static test value. For all
membranes, except the greased galvanised steel, the dynamic friction factor was also
found to be greater than the 453700-1998 code prescribed design value of 0.30.
Joint Type Friction Coefhcient, ku Dynamic (%)Quasi-StaticStatic
Page/1994)
Quasi-staticGriffith et al
(1998)
Dynamic
1 layer of Standard Alcor 0.460 0.520 0.43 827o
2layer of Standard Alcor 0.470 0.569 0.46 817o
I Layer Dry-Cor (Embossed plastic) 0.304 o.267 0.41* N/A2Layerc of Greased Galvanised Steel 0.074 0.108 0.11* lOOTo
Joint Type Friction Coefficient, k,, Dynamic (7o)
Quasi-StaticStaticPage
(tee4)
Quasi-staticGriffith et al
(1ee8)
Dynamic
Standard Alcor 0.44 N/ASuper Alcor o.527 0.541 0.47 87Vo
Rencourse/Polyflash 0.259 0.3r7 o.37* N/AEmbossed Polythene/Dry-Cor o.397 0.329 0.36* N/A
67

CHAPTER (4)- þnamic Shear Capacity Tests On URM ConnectionsContaining Damp Proof Course Membrane
4.5. Summary and Conclusion: ImplÍcation for Design
The results of dynamic shake table tests on DPC and slip joint connections which are
typically used in unreinforced masonry construction in Australia have been presented.
The main purpose of these tests was to evaluate the connection performance underdynamic loading in order to assess their seismic integrity. Dynamic friction coefficientsdetermined from these tests were then compared with qtrasi-static friction coefficientsdetermined by previous research (Griffith et al 1998) to assess to what extent the quasi-
statically determined friction coefficients represented those which could be expected inseismic events. Here it was found that the dynamic friction coefficients were not more
than 20Vo less than those determined quasi-statically. Further, with the exception ofgreased galvanised sheets no connection had a friction coefficient less than the 453700-1998 code prescribed design value of 0.3. Additionally the observed 'seismic strengthcapacity' of the connections considered were greater than the 'seismic load demand'calculated by Klopp for most of the eleven buildings he analysed.
68
5. STABILITY OF SIMPLY SUPPORTED
URM WALLS SUBJECTED TO
TRANSIENT OUT-OF.PLANE FORCES
5.1. Introduction
(Paulay & Priestþ 1992) have described the response of masonry walls to out-of-plane
seismic excitation as:
" one of the most complex and ill-un-derstood areas of seismic a nalysis"
Traditionally designers have perceived URM as a brittle form of construction, and thus
considered it particularly sensitive to peak ground accelerations. In contrast, recent
research has shown that dynamically loaded IIRM walls may sustain accelerations well
exceeding their elastic capabilities (ABK 1985, Bariola 1990, Lam 1995). This apparent
anomaly points to our lack of understanding of the true collapse behaviour of URM
walls.
The complexity arises from the fact that the response can be highly non-linear as the
behaviour is largely governed by stability mechanisms rather than material failure. Not
surprisingly, when compared with other areas of structural and earthquake engineering,
the current knowledge of the out-of-plane behaviour of masonry walls to seismic loading
is sparse.
Figure 5.1.1 shows a fypical outof-plane wall failure in the upper story of a URM
building during the 1989 Loma Prieta, California earthquake.
69
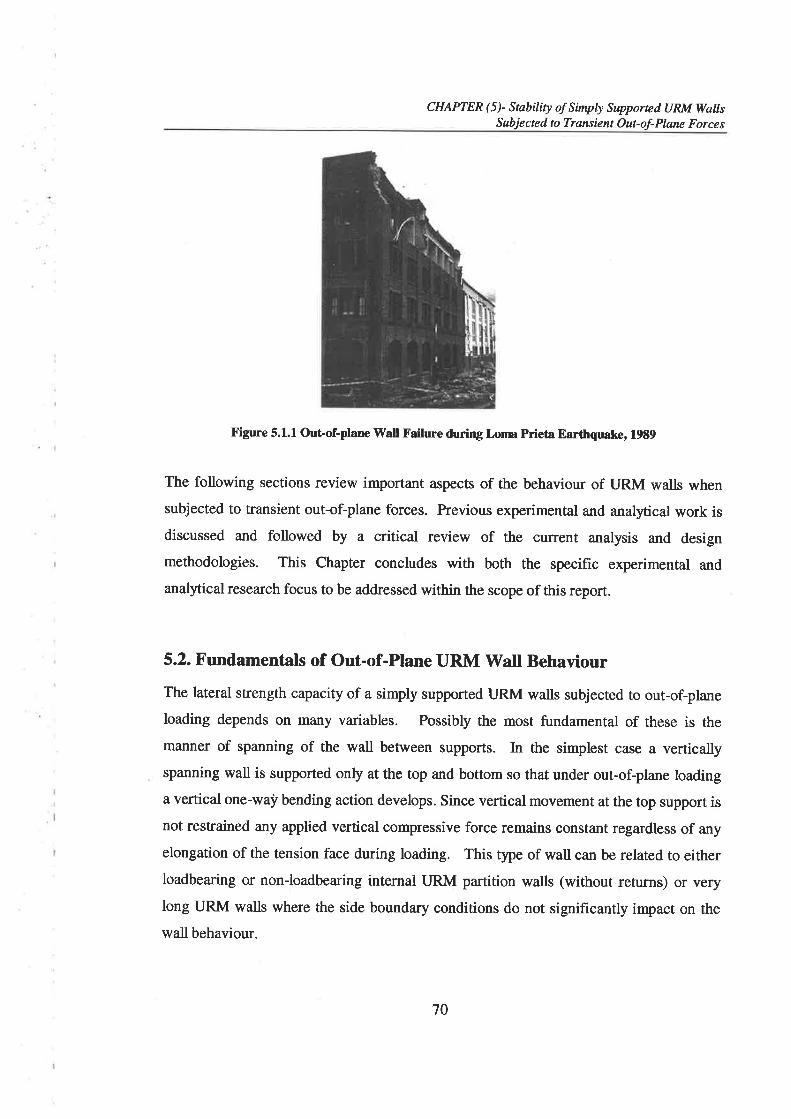
CHAPTER (5)- Stability of Simply Supported URM WaIIsSubjected to Transient Out-of-Pløne Forces
Figure 5.1.1 Out-of-plane Wall Failure during Lonra Prieta Earthquake, 1989
The following sections review important rispects of the behaviour of URM walls when
subjected to transient out-of-plane forces. Previous experimental and analytical work isdiscussed and followed by a critical review of the current analysis and designmethodologies. This Chapter concludes with both the specific experimental and
analytical resea¡ch focus to be addressed within the scope of this report.
5.2. Fundamentåls of Out-of-Plane URM Walt Behaviour
The lateral strength capacity of a simply supported URM walls s,uþjscted to out-of-plane
loading depends on many variables. Possibly the most fundamental of these is the
manner of spanning of the wall between supports. In the simplest case a verticallyspanning wall is supported only at the top and bottom so that under out-of-plane loading
a vertical one-waj'bending action develops. Since vertical movement at the top support is
not restrained any applied vertical compressive force remains constant regardless of any
elongation of the tension face during loading. This type of wall can be related to eitherloadbearing or non-loadbearing internal LIRM partition walls (without returns) or verylong URM walls where the side boundary conditions do not significantþ impact on the
wall behaviour.
70

CHAPTER (5)- Stability of Simply Supported URM WalkSubjected to Transient Out-of-Plane Forces
When return walls or engaged piers are more closely spaced, the wall's response to out-
of-plane loading becomes more complicated, consisting of combined vertical and
horizontal bending. These walls are therefore referred to as two-way spanning walls and
tend to have an increased lateral force resistance capacity over that of a simila¡ sized but
one-way spanning wall. Further complications arise since brickwork is strongly
anistropic, i.e. behaving differently in orthogonal directions. Depending on the number
and nature of supported edges, various cracking patterns are also possible, thus affecting
the lateral resistive capacity of the wall. Over the past 30 years a number of static testing
programs have been completed on the two-way bending of URM wall panels (Baker
1973, Hendry 7973, West et al1973:1977, Lawrence 1975:1994, DeVerkey et al 1986,
Drysdale et al 1988) resulting in several static analysis techniques. The most recent of
these is the Virtual Work Method (Lawrence 1998) where internal and external work are
equated. Due to the complexity of the problem, however, as yet no static analysis
methodology has been readily evolved into a dynamic analysis procedure.
7 Another category of URM wall commonly found in Australia is the full infill panel whereti
a masonry wall is constructed within a framed construction without gaps. In this case,
under lateral load, elongation of the tension face due to bending can not occur without
inducing a large compressive force from the surrounding frame, which acts as a rigid
abutment. This results in an arching behaviour where the vertical compressive force
increases with mid-height displacement. On further increasing lateral load the vertical
compressive forces become suff,rciently large to crumble the brickwork at vertical
reaction points. This material failure permits further displacement of the wall as its
length is reduced until ultimately instability occurs. However, a lateral strength capacity
typically much greater than one or two-way bending walls is realised. As the wall's
ultimate behaviour is dominated by progressive damage and material failure, a 'quasi-
static' analysis is often used to assess the peak lateral capacity of these walls. Various
researchers have addressed the out-of-plane behaviour of this type of wall resulting in
static arching analysis procedures (Baker 1978, Hendry 1981, Abrams et al 1996). In
Australia many inhll panels are constructed with a gap at the top, filled with mastic or
7l

CHAPTER (5)- Støbiliry of Simply SupportedURM WaltsSubjected to Transient Out-of-Plane Forces
sealant, and a gap at the sides with special connectors to allow for brick expansion. Thistype of wall is therefore a special case of two-way spanning wall.
As a first stage in the development of a method that may also be applicable as acomponent of the more complicated dynamic two-way behaviour, an understanding ofthe physical process underlying one-way dynamic action must first be developed.
Consequently, the fundamental focus of the current research project has been the
experimental and analytical evaluation of the dynamic behaviour of one-way bending
URM walls.
For the one-way bending failure of URM walls there are three key contributingphenomenon; (1) tension cracking of the masonry, (2) compression crushing of the
masomy at the vertical reactions (including mid-height) and (3) ultimate instabitiry of the
wall. Unless the walls have very high compressive axial loading, crushing is rarelysignificant. Since in Australia overburden stresses are generally relatively low, localcrushing at vertical ¡eactions is not a major problem. Hence, cracking and instability ofthe wall typically dominate the ultimate behaviour.
Another distinguishing aspect of URM walls subjected to out-of-plane forces is whether
the loading is a gradual monotonically increasing static load, or a more rapid and
reversible dynamic load. This distinction is drawn as 'dynamic stability' concepts,
discussed further in Section 5.3.2, contribute to the walls lateral force resistive capacity.
When a one-way spanning wall is dynamically loaded in the out-of-plane direction an
inertia load is induced into the masonry wall. Prior to cracking, the wall essentially acts
elastically where deformations are relatively small and hence do not significantly impact
on the distribution of inertia force. The accelerations felt by the wall can therefore be
obtained by averaging the input accelerations at the top and base of the wall. Should the
applied accelerations exceed the elastic capacity of the wall, cracks will form at locations
of maximum moment i.e. the top and base support and near the mid-height of the wall. Ifthe top and base crack occur first the theoretical position of the span crack will be
72
CHAPTER ( 5 )- Stability of S imply Supp orte d URM WøllsSubjected to Transient Out-of-Plarc Forces
determined by the relative value of the induced moment at these locations. These
moments can be related to the eccentricity of the vertical reaction forces and are therefore
dependent on the connections forming the boundary conditions. Typically, the crack
occurs near the mid-height of the wall as the bending moment diagram in this region is
usually reasonably flat, generally only varying by 1l7o from the mid-height to the three
quarter height of the wall (Phipps 1994). Practically, the crack will only appear at a
mortar joint and will therefore depend on the relative weakness of individual mortar
joints in the region ofpeak stress.
As was discussed in Section 2.3, the 1989 Newcastle earthquake highlighted that the
condition of both new and existing LJRM building stock is generally unknown with poor
maintenance and workmanship common place. Further, many existing URM buildings
are already cracked due to low strength mortar, settlement of footings, or temperature and
moisture changes. Past earthquakes and/or accidental damage may also have previously
induced cracking. Despite this many severely cracked masonry buildings are often still
standing after earthquakes and have been able to resist strong aftershocks. Following
these observations it is pertinent to examine the post-cracked seismic resistance of simply
supported tlRM walls.
5.2.1,. Post-cracked Force-Displacernent (F-^) Relationship
Once cracking occurs three joints are formed at the top, mid-height and base of the wall,
such that the portions of the wall above and below the mid-height crack act as free
rocking bodies' __j
The non-linea¡ F-Â relationship of a face loaded IJRM wall results f¡om the complex
interaction of gravity restoring moments, the movement of vertical reactions with mid-
height displacement and P-Â overturning moments. A coÍImon simplification is toapproximate the two free bodies as rigid thus having an infinite material stiffness as
shown in Figure 5.2.1. I-ateral load is initially resisted by gravity restoring moments due
to self-weight and applied overburden loads with the vertical reactions at the three joints
acting at the extreme compressive faces of the wall. This initial rigid resistance is termed
73
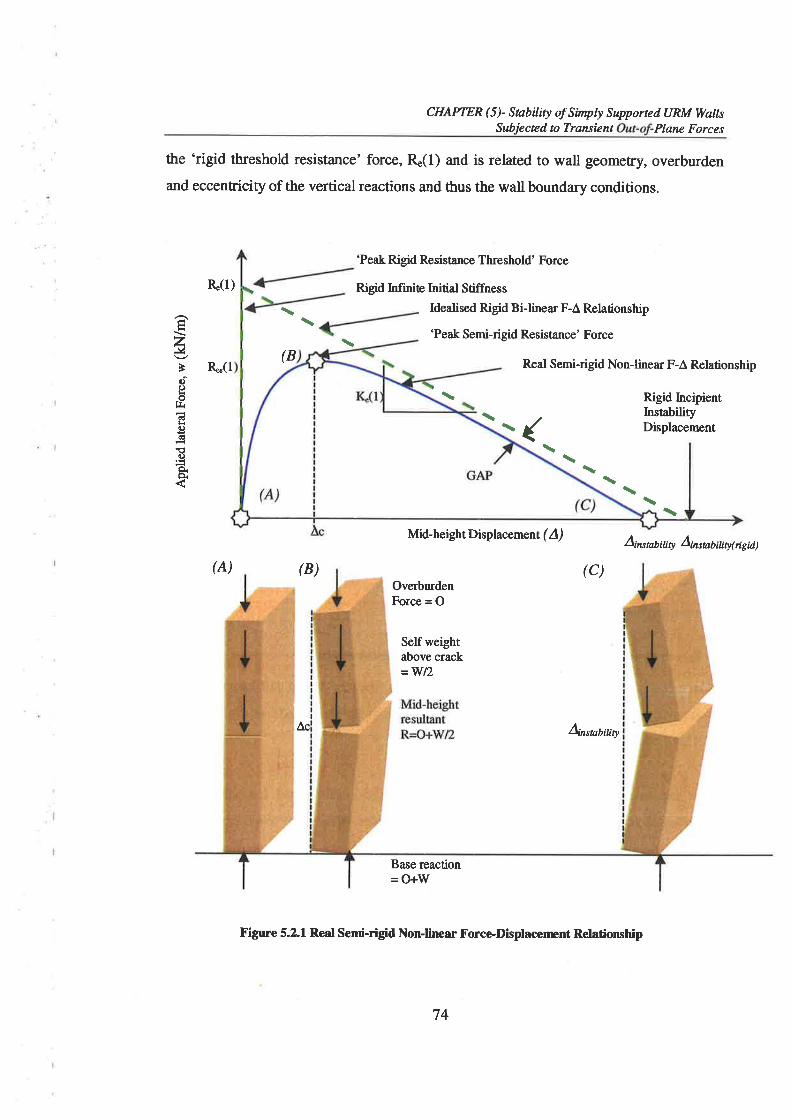
CHAPTER (5)- Stability of Sinply Supported URM WøttsSubjected to Transient PI¿ne Forces
the 'rigid threshold resistance' force, R"(l) and is related to wall geometry, overburden
and eccentricity of the vertical reactions and thus the wall boundary conditions.
R"(l)
R*(1
(A)
'Peak Rigid Resistance Threshold' Force
Rigid Infinite Initial Stiffness
Idealised Rigid Bi-linear F-Â Relationship
'Peak Semi-rigid Resistance' Force
(BReal Semi-rigid Non-linear F-Â Relationship
\Rigid IncipientInstabiliryDisplacement
Mid-height Displacement ( A) \rr, ¡o6 ¡¡¡y &rs ubìatyiígid )
(B) (c)OverburdenForce = O
Self weightabove crack='ttrI12
Base reaction=O+W
Figure 5.2.1 Reat Semi-rigid Non-linear X'orceDisplaccnænt Relationship
\
\\\\(
\\
\\
zJ¿
Èqtoof¡i3HE€€oÞ.È
\ \ \
Âc A¡or¡o6¡Y.¡y
74
CHAPTER (5)- Stability of Simply Supported URM WøllsSubjected to Transient Out-of-Plane Forces
When the lateral force exceeds R*(l), a mid-height displacement occurs, permitted by the
rigid rotation at the three joints. P-À effects then reduce the gravity restoring moments as
the resultant of the vertical forces above the mid-height crack moves toward the wall's
back compressive face. With further displacement P-À effects continue to reduce the
lateral resistance of the wall creating a negative stiffness arm, Ç(1), of the bi-linear F-A
relationship (refer Figure 5.2.1). \ilhen the vertical force resultant above the mid-height
crack moves outside of the wall thickness the resistance to overturning is reduced to zero.
The displacement at which this occurs is termed the 'rigid instability displacement',
Ainstabilitfrigid).
For a real URM wall, the brickwork comprising the two free bodies does not have an
infinite stiffness and as such does not behave completely as assumed by the idealised
rigid body theory. Instead the real semi-rigid F-À relationship for the rocking system is
more complicated and non-linear than that of the idealised bi-linear rigid F-A
relationship.
More realistically, in the vertical position prior to lateral load being applied, all vertical
reactions act along the centerline of the wall. Consequently, any applied lateral load will
cause a mid-height displacement to occur. This then forces the vertical reactions at the
joints to move towards the extreme compressive faces of the wall, thus increasing the
gravitational restoring moment lever arm (refer Figure 5.2.1 (A)). The rate at which the
reactions move is proportional to the rate of loading and modulus of the brickwork. On
further displacement the lateral resistance continues to increase due to the movement of
the vertical reactions increasing the gravity restoring moments at a greater rate than the
reduction caused by the P-A effects. At a critical displacement, ^",
when the stabilising
effect of these two opposing actions equalize the peak 'semi-rigid resistance th¡eshold'
force, R*(l), is realised (refer Figure 5.2.1 (B)). The higher the modulus of brickwork
the closer the scenario is to that of the rigid assumption. As a result the closer the critical
displacement will occur to the vertical position and the higher the relative value of 'semi-
rigid resistance threshold' force. Beyond ^c
the non-linear relationship approaches the bi-
linear rigid relationship as the vertical reactions are forced into the extreme compressive
75
CHAPTER (5)- Stability of Simply Supported URM WallsSubjected to Transient Out-of-Plane Forces
zones. The curves do not converge, however, due to the finite compressive stress block
at the vertical reactions (refer gap Figure 5.2.1). The larger the overburden and the lower
the brickwork modulus the larger the gap.
For a static lateral load scenario, beyond the 'threshold resistance', regardless of whether
rigid or semi-rigid behaviour is considered, survival of the rocking wall is dependent on
the removal or reduction of the static load. Here the wall is said to be in 'unstable
equilibrium'. At any displacement, prior to the instability displacement being reached, ifthe load is statically removed the wall unloading F-A relationship will trace back the
loading relationship to the vertical position.
As the wall mid-height is displaced its potential energy (PE) is increased with the raising
of the wall's center of gravity to a maximum at the incipient instability displacement.
Thus, in a dynamic lateral load scenario, survival of a wall beyond the 'threshold limit' isdependent on whether or not the inertia force has sufficient energy to overcome the
increased potential energy (PE) so as to further increase the displacement to incipient
instability. This energy requirement can be related to the kinetic energy (KE) or velocity
of the rocking wall as it passes the static vertical alignment plus any additional input
energy that may occur within the failure half cycle. If insufficient energy is available and
instability does not take place, the PE which is a maximum at the peak half cycle
displacement, is converted back to KE by the gravitational restoring moments. As such,
the wall's F-A relationship will trace back the loading relationship forming a naffo\¡/
hysteresis loop due to energy losses in joint rotation. As the wall again passes the static
vertical alignment the KE is at a maximum (since the velocity is a maximum) and PE is
zeÍo. Again, KE is converted to PE with displacement in the opposite direction. This
exchange ofenergy continues as free vibration until energy losses reduce the total system
energy to zero. At this time the wall has returned to the vertical position. Provided the
three joints have not degraded through impact or joint dislocation on re-loading, the wall
will have a similar F-A relationship and dynamic behaviour.
76
CHAPTER (5)- Snbiliry of Simply Supported URM WølIsSubjected to Trønsient Out-of-Plane Forces
Since the non-linear F-A relationship also largely governs the frequencydisplacement (/-
A) relationship of a rocking wall system, this is also highly non-linear. The non-linearity
can be illustrated by a comparison of secant stiffness at low and high levels of
displacement amplitude. Here the secant stiffness is associated with the effective
average half cycle secant stiffness. At low displacement amplitude ^{-,
the secant
stiffness K¡, is substantially larger than at large displacement amplitude Ân, where the
secant stiffness is Ks (refer Figure 5.2.2). Since the secant stiffness is directly
proportional to the square of the haH cycle natural frequency it can be shown that the
frequency at low displacement amplitude is relatively large and reduces to zero at the
incipient instability displacement. Figure 5.2.2 also shows a schematicf relationship.
The schematic/-A relationship shown in Figure 5.2.2 is somewhat idealised as it is ra¡e
for frequencies nea¡ to the incipient instability displacement to occur so that a lower
frequencies limit, fi.¡t, is often observed. V/hile it is theoretically possible for
frequencies below/¡¡6¡ to occur they are unlikely as the system becomes unstable at these
displacements for reasons described below.
As already discussed the F-A relationship of URM walls are highly non-linear and as a
consequence the responses have no unique natural or resonant frequency. It has however
been shown that URM walls undergo larger displacement amplification at certain forcing
frequencies. This indicates that they have a unique effective resonant frequency being
related to the forcing frequency associated with the largest displacement amplification in
a simila¡ fashion to the natural frequency of an elastic system. For the non-linea¡ rocking
URM wall systems, the maximum displacement amplification will result when the
applied forcing frequency is derived from the average secant stiffness of the half cycle
under consideration. Thus, for the critical case where the maximum half cycle
displacement reaches the incipient instability displacement, Âinsrablity, the associated
effective resonant frequency,,f"n is related to the average incremental secant stiffness,
Ku,,", determined from the vertical to incipient instability displacements (refer Figure
s.2.2).
77
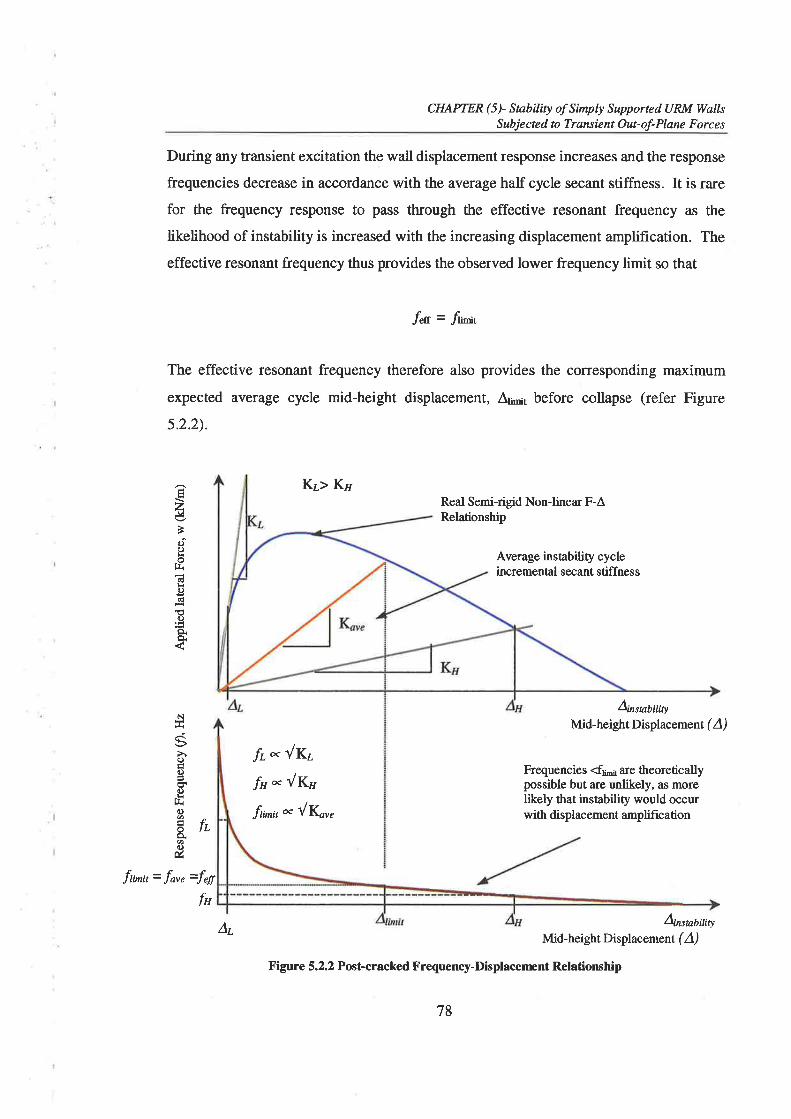
CHAPTER (5)- Stabiliry of Simply Supported URM WallsSubjected to Transient Out-of-Plane Forces
During any transient excitation the wall displacement response increases and the response
frequencies decrease in accordance with the average half cycle secant stiffness. It is rare
for the frequency response to pass through the effective resonant frequency as the
likelihood of instability is increased with the increasing displacement amplification. The
effective resonant frequency thus provides the observed lower frequency limit so that
r _rJetr - Jlimit
The effective resonant frequency therefore also provides the corresponding maximum
expected average cycle mid-height displacement, Âr¡-¡t before collapse (refer Figure
s.2.2).
K¿> KøReal Semi-rigid Non-linea¡ F-ÂRelationship
Average instability cycleincremental secant stiffness
A¡nstabitity
Mid-height Displacement (Á)
f" * lK"f, * {K,rt¡n¡, n lr*"
fi¡75¡aþ¡¡¡¡y
Mid-height Displacement (/)Figure 5.2.2 Post-cracked Frequency-Displacenænt Relatioruhip
\zJlÈdooq.
Ec.)ctEc)
o.o.
N
6(.)
t)-øgf¡.q)2rólLÀøc)ú
Frequencies d¡¡¡ are theoreticallypossible but a¡e unlikely, as morelikely that instability would occurwith displacement amplification
=fefr
fn
_1- Javelm¿,
Ar
78
CHAPTER(5)- Stability of Simply SupportedURM WallsSubjected to Trønsient Out-of-Plane Forces
5.2.2. Boundary Condition Impact on Force-Displacement Relationship
The types of wall support comprising the wall boundary conditions are an important
aspect that must be considered when assessing out-of-plane URM wall behaviour. To
some extent these determine the moment induced into the wall under lateral loading in
relation to the eccentricity of the vertical reaction forces at the joints. Typical
connections used in Australian masonry construction, such as DPC and 'timber top plate'
connections, have been reviewed in Section2.3.
In URM wall construction, connections to concrete footing beams and floor slabs
containing DPC membrane at the top and base wall supports are commonly used to meet
serviceability criteria. Consequently, at large mid-height displacements the vertical
reactions at the top, middle and base supports will all have been forced to the extreme
compressive faces of the wall. Thus, in comparison with other boundary conditions,
which do not force the vertical reactions to the wall edge, this scenario provides the
greatest 'rigid resistance threshold' force, R"(1), due to the larger overburden force lever
arm providing a maximum restoring moment. In Appendix (D) a generic calculation of
the bi-linear F-A relationship is presented for the concrete slab support at the top and
bottom connections. The generic defining terms Re(l), Ke(1) and Ai,'rauiuty (rieid) of the
rigid bi-linear F-A shown in Figure 5.2.2 arc summarised in Table 5.2.1 for these
boundary conditions as rigid loadbearing simply supported: top and base vertical
reactions at the leeward face (LBSSLL).
A second conìmon URM wall support, which is used in single storey URM dwellings, is
the connection of the timber roof truss to the masonry wall via a 'timber top plate' where
the wall base is set on a concrete slab and DPC connection. As the 'timber top plate' and
truss generally provide little rotational support even at large mid-height displacements the
top vertical reaction remains near the centerline of the wall, while the middle and base are
forced to the extreme compressive faces. With a reduced overburden force lever arm,
compared with the concrete slab above case, the 'rigid resistance threshold' force, R.(1),
is also respectively reduced. In Appendix (D) a generic calculation of the bi-linear F-A
relationship is presented for 'timber top plate' above and concrete slab below boundary
79
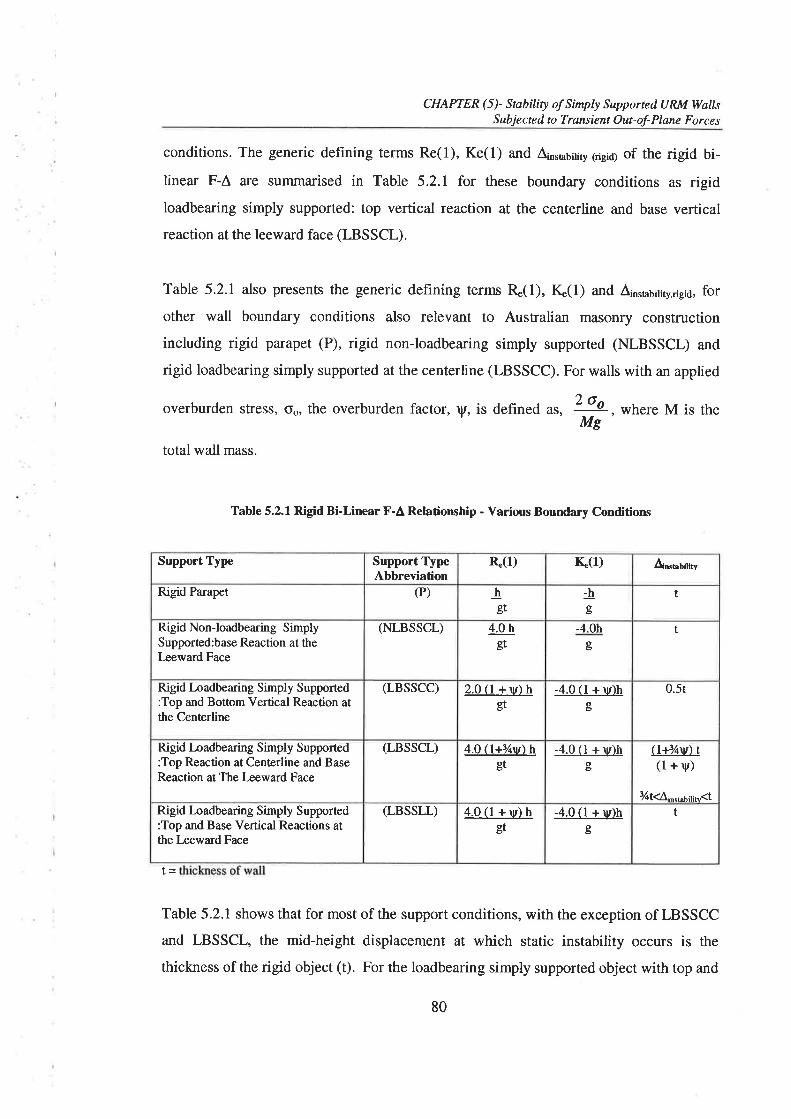
CHAPTER (5)- Stability of Simply SupportedURM WaltsSubjected to Transient Out-of-Plane Forces
conditions. The generic defining terms Re(l), Ke(l) ând ¡os¡¿6¡ty (rigid) of the rigid bi-
linear F-Â are sunìmarised in Table 5.2.1 for these boundary conditions as rigidloadbearing simply supported: top vertical reaction at the centerline and base vertical
reaction at the leeward face (LBSSCL).
Table 5.2.1 also presents the generic def,rning terms &(1), &(1) and A¡r¡u5i¡¡r.¡g¡¿, for
other wall boundary conditions also relevant to Australian masonry construction
including rigid parapet (P), rigid non-loadbearing simply supported (NLBSSCL) and
rigid loadbearing simply supported at the centerline (LBSSCC). For walls with an applied
overburden stress, oo, the overburden factor, y, is defined as, +, where M is theMs
total wall mass.
Table 5.2.1 Rigid Bi-Linear F-À Relationship - Various Boundary Conditions
[=
Table 5.2.1 shows that for most of the support conditions, with the exception of LBSSCC
and LBSSCL, the mid-height displacement at which static instability occurs is the
thickness of the rigid object (t). For the loadbearing simply supported object with top and
Support Type Support TypeAbbreviation
&(1) K(1) A^øUilitv
Rigid Parapet (P) hgt
-hûb
t
Rigid Non-loadbearing SimplySupporæd:base Reaction at theI-eeward Face
(NLBSSCL) 4.0 hgt
-4.0hob
t
Rigid Loadbearing Simply Supported:Top and Bottom Vertical Reaction atthe Centerline
(LBSSCC) 2.0(1+v)hgt
-4.0 (l + v)hoÞ
0.5t
Rigid Loadbearing Simply Supported:Top Reaction at Centerline and BaseReaction at The læewa¡d Face
(LBSSCL) 4.0 (l+7¿\¡) hgt
-4.0 (l + V)hob
%t(¡"s¡,¡x,(t
(l#/tv\ t(l+v)
Rigid hadbearing Simply Supported:Top and Base Vertical Reactions atthe Leeward Face
(LBSSLL) 4.0(l +v)hgt
-4.0 (l + v)ho
t
80
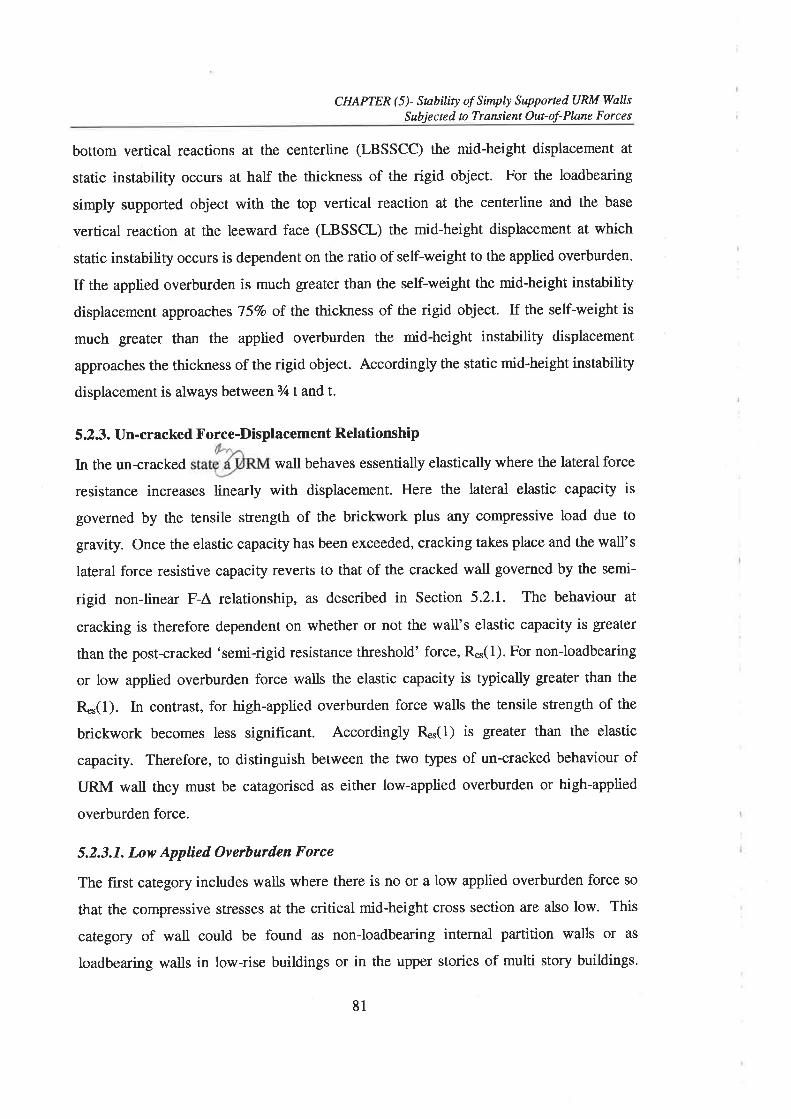
CHAPTER(5)- Snbiliry of Simply SupportedURM WallsSubjected to Transient Out-of-Plane Forces
bottom vertical reactions at the centerline (LBSSCC) the mid-height displacement at
static instability occurs at half the thickness of the rigid object. For the loadbearing
simply supported object with the top vertical reaction at the centerline and the base
vertical reaction at the leeward face (LBSSCL) the mid-height displacement at which
static instability occurs is dependent on the ratio of self-weight to the applied overburden.
If the applied overburden is much greater than the seH-weight the mid-height instability
displacement approaches 75Vo of the thickness of the rigid object. If the self-weight is
much greater than the applied overburden the mid-height instability displacement
approaches the thickness of the rigid object. Accordingly the static mid-height instability
displacement is always between 3/r t and t.
5.23. Un-cracked Force-Displacement Relationship
In the un-cracked wall behaves essentially elastically where the lateral force
resistance increases linearly with displacement. Here the lateral elastic capacity is
governed by the tensile strength of the brickwork plus any compressive load due to
gravity. Once the elastic capacity has been exceeded, cracking takes place and the wall's
lateral force resistive capacity reverts to that of the cracked wall governed by the semi-
rigid non-linear F-Â relationship, as described in Section 5.2.1. The behaviour at
cracking is therefore dependent on whether or not the wall's elastic capacity is gteater
than the post-cracked 'semi-rigid resistance threshold' force, zu(l).For non-loadbearing
or low apptied overburden force walls the elastic capacity is typically greater than the
&,(1). In contrast, for high-applied overburden force walls the tensile strength of the
brickwork becomes less significant. Accordingly zu(1) is greater than the elastic
capacity. Therefore, to distinguish between the two types of un-cracked behaviour of
URM wall they must be catagorised as either low-applied overburden or high-applied
overburden force.
5.2.3.1. Low Applieil Overburden Force
The first category includes walls where there is no or a low applied overburden force so
that the compressive stresses at the critical mid-height cross section are also low. This
category of wall could be found as non-loadbearing internal partition walls or as
loadbearing walls in low-rise buildings or in the upper stories of multi story buildings.
81
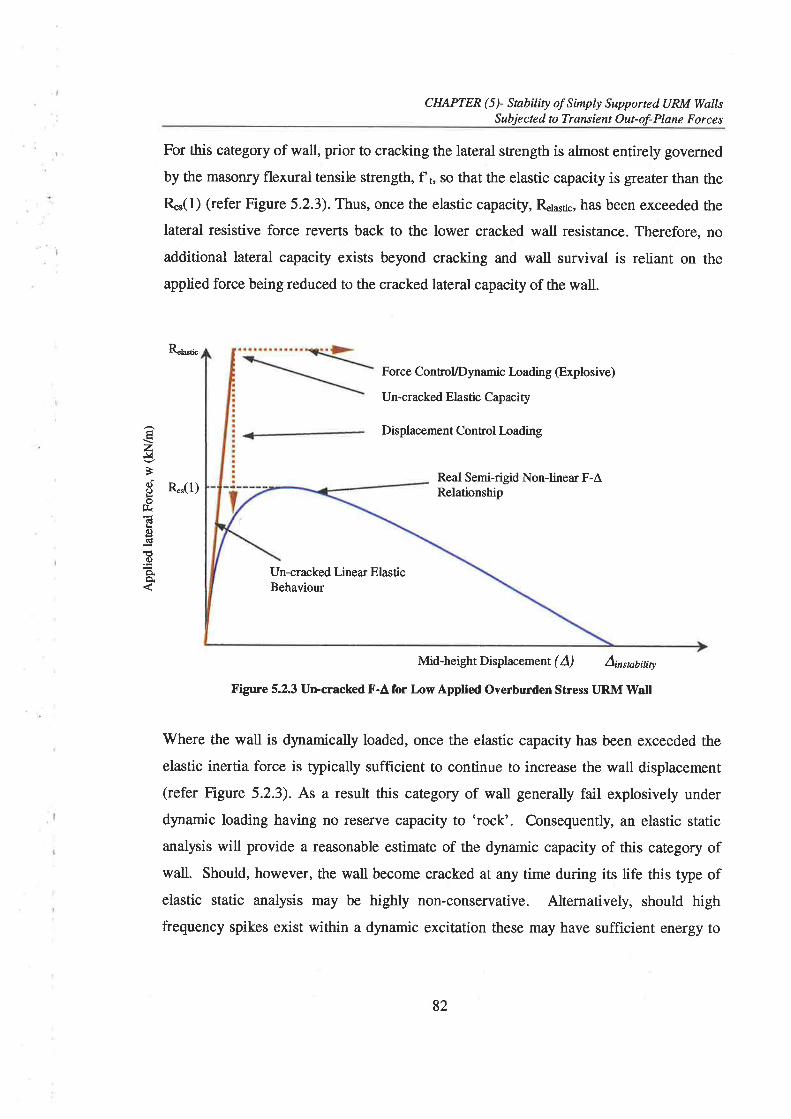
Á\zJ¿
Èd()kÕ
tG!c)(ú
E()ÈÞr
CHAPTER (5)- Stability of Simply Supported URM WailsSubjected to Transient Out-of-Plane Forces
For this category of wall, prior to cracking the lateral strength is almost entirely governed
by the masomy flexural tensile strength, fl1, so that the elastic capacity is greater than the
R*(1) (refer Figure 5.2.3). Thus, once the elastic capacity, &ur,i", has been exceeded the
lateral resistive force reverts back to the lower cracked wall resistance. Therefore, no
additional lateral capacity exists beyond cracking and wall survival is reliant on the
applied force being reduced to the cracked lateral capacity of the wall.
&u",i"
Force ControUDynamic I-oading @xplosive)
Un-cracked Elastic Capacity
Displacement Conrol Loading
zu(l)Real Semi-rigid Non-linear F-ÂRelationship
Mid-heightDisplacement (/) A¡nsøbirity
Figure 5.23 Urrcracked F-A for Low Applied Overburden Stress URM Vl¡all
Where the wall is dynamically loaded, once the elastic capacity has been exceeded the
elastic inertia force is typically sufficient to continue to increase the wall displacement
(refer Figure 5.2.3). As a result this category of wall generally fail explosively under
dynamic loading having no reserve capacity to 'rock'. Consequently, an elastic static
analysis will provide a reasonable estimate of the dynamic capacity of this category ofwall. Should, however, the wall become cracked at any time during its life this type ofelastic static analysis may be highly non-conservative. Alternatively, should high
frequency spikes exist within a dynamic excitation these may have sufficient energy to
Un-cracked Linea¡ ElasticBehaviour
82

CHAPTER(5)- Stability of Simply SupportedURM WallsSubjected to Transient Out-of-Plone Forces
crack a wall prematurely such that the maximum elastic capacity may not be realised and
the elastic static analysis methodology would again be non-conservative.
5.2.3.2. High þplied Overburden Force
The second category of wall is generally found two or more stories below roof level or in
upper concrete slab-URM wall construction. Here, where the applied overburden force is
larger, compressive stresses at the critical mid-height cross section are correspondingly
higher. In this case the benefit provided by the tensile capacity of the briclorork is
outweighed by the additional gravity restoring moment resulting from an increased lever
arm, as vertical reactions move towards the extreme compressive faces of the wall with
increased displacement. Accordingly, cracking of the wall does not alter the wall's
ultimate lateral capacity (refer
Figure 5.2.4). Typically, for a dynamic load scena¡io when the elastic capacity is
exceeded the elastic inertia force will not be sufficient to then exceed the 'semi-rigid
resistance threshold' force. Therefore, this category of wall behaves similarly to a pre-
cracked wall where a reserye capacity due to rocking and 'dynamic stability' concepts
must be considered.
z&Fc)ooI¡rGko)Cd
€6)
o.È
R*(1)
&u",i"
Real Semi-rigid Non-linear F-ÂRelationship
Mid-heightDisplacement(/) Ainsøb¿iry
Figure 5.2.4 Ur¡crackedF-Â for lligh Apptied Overburden Stress URM Wall
Un-cracked Linear Elas[cBehaviour
Force/DynamicConrol loading
DisplacementConrol I-oading
83

CHAPTER (5)- Snbility of Simply Supported UFJttI WallsSubjected to Trqnsient Out-of-Plane Forces
5.3. Previous Research: Experimental Studies
Over the past 30 years or so there have been various experimental studies carried out on
both the static and dynamic out-of-plane behaviour of face loaded URM walls. Since
ea¡lier research was predominantly concerned with the effect of wind loading these
studies mainly considered static loading. More recently, however, the research focus has
been placed on seismic loading so that experimental studies have largely involved
dynamic loading. The following section provides a brief review of previous works
carried out by other researchers relevant to the one-way bending of face loaded LJRM
wall panels.
53.1. Static Tests
In the early L970's the U.S. Building Research Division of the National Bureau ofStandards (now the National Institute of Science and Technology, NIST) undertook an
extensive experimental study (Yokel et al 1971) on the static one-way out-of-plane
bending behaviour of masonry wall panels. In total 192 tests were completed including
both single leaf unreinforced brick and concrete block, cavity wall and reinforced
masonry. For each type of construction, specimens were subjected to a static vertical
compressive load, applied as a point load at the centerline of the top of the wall, followed
by a gradually increasing lateral pressure exerted by an inflated air bag. The boundary
condition at the base wall support was a steel channel with a fiberboard sheet adjacent to
the wall specimen. Boundary conditions were therefore representative of 'timber top
plate' above and concrete slab below.
Specimens with both low and high levels of appted overburden force were tested. Atlow levels it was found that the maximum lateral strength occurred prior to cracking and
that this was related to the tensile strength of the masomy. In contrast, at higher levels ofapplied overburden force additional wall capacity was found after cracking. The reasons
for this have been discussed in Section 5.2.3. For walls with moderate levels ofoverburden force applied, a comparison with simple rigid body theory was found to be
consistent. Above lMPa overburden stress, however, the continuity began to drop away,
as crushing of the brickwork at vertical reactions became apparent (refer Figure 5.3.1).
84
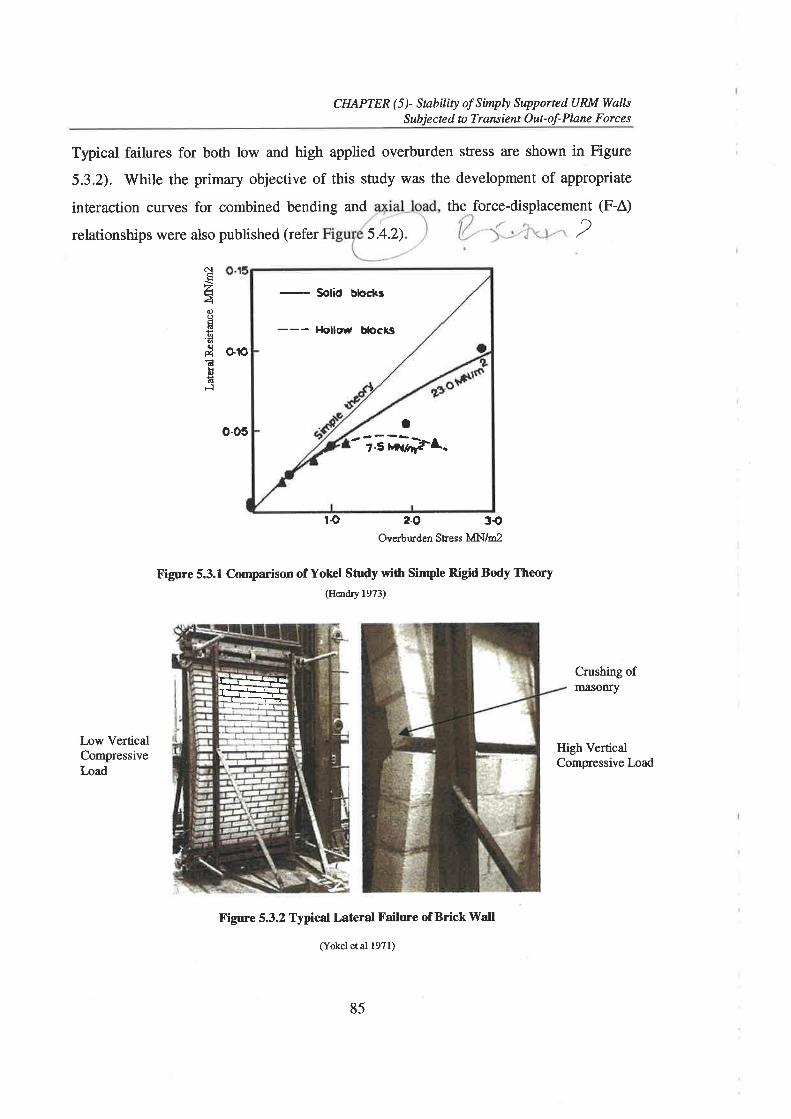
CHAPTER (5)- Snbility of Simply Supported URM WallsSubjected to Trutsient Out-of-Planc Forces
Typical failures for both low and high applied overburden stress are shown in Figure
5.3.2). \ühile the primary objective of this study was the development of appropriate
interaction curves for combined bending and the force-displacement (F-A)
relationships were also published (refer 2
o-05
r.o 2.A 30Overbwden Sress MN/m2
Figure 5.3.1 Comparison of Yokel Sûrdy with Simple Rigid Body Theory(Hødry 1973)
Crushing ofmasonry
o10
(\ËgooÉ.2aÉñoñÈ
Low VerticalCompressiveLoad
High VerticalCompressive Load
Figure 5.3.2 Typical Latcral Failure of Brick l{all
cYokel et al l97l)
5.4.2)
--- Hollow Uocl(s-
Sot-rd Þkrçhs
a--tGil,Þ\
-iffi-]___l+__i_L_-Ì.HJ_- : ;---TÈ
85

CHAPTER (5)- Stability of Simply Supported URM WallsSubjected to Transient Out-of-Plane Forces
l-ater, Yokel and Fattal (1976) performed a similar experimental study to that of Yokel et
al (1971) also at the National Bureau of Standards. The main differences between the
studies where that for the 1976 tests smaller panel were used having steel half round bars
inserted at both top and base boundary conditions. This represented a simply supported
wall at its centerline. Since here the movement of vertical reactions was limited to only
the center joint, the prediction of the F-Â relationship w¿rs greatly simplified.
Experimental F-A relationships were again reported (refer Figure 5.4.2). For this case itwas observed that both the displacement at which instability occurred and the maximum
resistance were reduced in comparison with the Yokel study.
Base and Baker (1973) reported on a series of low overburden force out-of-plane tests.
These were aimed at providing fundamental data and an understanding of the action ofbrickwork under a variety of loading conditions. Here the brickwork specimens were
observed to behave essentially elastically in the un-cracked state. A significant reduction
in bending strength was reported when brickwork beams were tested under simulated
uniform loading as compared with testing under central load over a shorter span. This
was attributed to the increased number of mortar joints within the loading span, thus
increasing the probability of a weak joint.
West et aI (1977) have also performed a series of static out-of-plane tests on wall panels.
Here no applied overburden force was considered so that the cracking load was reported
to be the maximum load the wall could resist. For these tests the top of the wall was
propped against lateral movement and a connection containing a DPC was used at the
base to represent as closely as possible the conditions used in practice. It was reported
that the material used for the DPC and the way in which it was embedded were important
in achieving the full bending strength. \ilhere the shea¡ capacity of the DPC connection
was exceeded the full bending sftength of the wall was not achieved since slip occurred at
the DPC. Further, both vertical and horizontal panels were examined where it was found
that the strength in the two orthogonal directions differed. The overall ratios of strength
in the direction perpendicular to the bed joint to that parallel joint were reported as being
I .2 ro 6.2 with a mean of around 3.
86
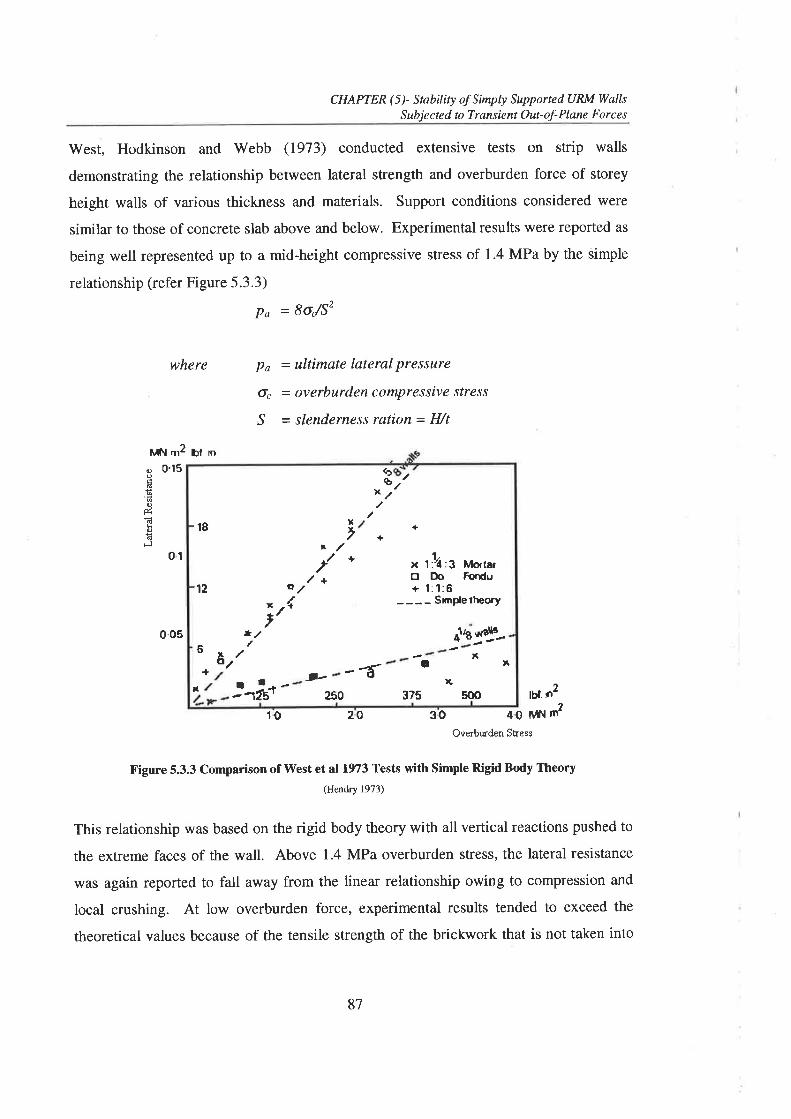
CHAPTER (5)- Stability of Simply Supported URM WallsSubjected to Transient Out-of-Plane Forces
West, Hodkinson and Webb (1973) conducted extensive tests on strip walls
demonstrating the relationship between lateral strength and overburden force of storey
height walls of various thickness and materials. Support conditions considered were
similar to those of concrete slab above and below. Experimental results were reported as
being well represented up to a mid-height compressive stress of 1.4 MPa by the simple
relationship (refer Figure 5.3.3)
Pa = 8o/52
where po = ultimate lateral pressure
6c = ovêrburden compressive stress
S = slenderness ration = II/t
ot
0.os
1bl .,2
10 20 30 40 ÀlÍ{
Overbr.¡rden Stress
t?
Figure 5.3.3 Comparison of Wes 3 et al 1973 Tests with Simple Rigid Body Theory(Hendry 1973)
This relationship was based on the rigid body theory with all vertical reactions pushed to
the extreme faces of the wall. Above 1.4 MPa overburden stress, the lateral resistance
was again reported to fall away from the linear relationship owing to compression and
local crushing. At low overburden force, experimental results tended to exceed the
theoretical values because of the tensile strength of the brickwork that is not taken into
MN nr2 bl rn
0.r5oÉ
.go&EoËÈ
+18+
t
/+
12
I
r
x3?5 500
x
+
f,e j"yx ¡t
bs,/
rfs{
6 xo+ (¡tt-r¡¡,a
250
9/tI
x 1:?4:3 Morrero Do Fmdu+ 1:1:6
---- Srmpletheory
x.a
87
CHAPTER (5)- Stability of Simply Supported URM WallsSubjected to Transient Out-of-Plane Forces
account. It was also reported that the lateral strength of a wall with compression is only
slightly affected by brick and mortar strengths.
Anderson (1994) reported on the most recent series of static tests where 90 lateral load
tests on LIRM walls with various support conditions were undertaken. Here the
behaviour of vertically spanning strip walls was reported to be difficult to predict withpost-cracked rigid body theory considered to be a more satisfactory approach for static
limit state design. Eccentricity of the vertical load due to rotation of the base of the wall
was found to induce a stabilising moment. Consequently it was recommended that the
partial fixity moment due to the self-weight acting at an eccentricity of 0.45 of the wall
thickness be applied at the base of the wall. The mean height at which the bed jointfailed was 0.6 of the vertical span above the base. Failure by sliding was reported at the
DPC for some walls with low levels of applied overburden force.
5.32. Dynamic Tests
In the early 1980's a consortium of Californian engineers called the ABK Joint Venture
(ABK 1984) ca¡ried out research into the post-cracking seismic behaviour of URM wall
panels. The aim of the research was to develop standards for the renovation of URMbuildings in Los Angeles, particularly with respect to wall height-to-thickness ratios
(Kariotis et al 1985, Adham et al 1985). The study examined the one-way behaviour ofeight specimens of varying construction and geometry under a range of gravity loads.
Several dynamic motions were applied at the base and top support, simulating the input
motion from the ground or diaphragm anchorage. The base of the wall was allowed to
displace without rotation and the top of the wall was free to rotate and to move in the
vertical direction without restraint.
It was reported (ABK 1984) that a single horizontal crack typically formed near the mid-
height of the test specimen with another forming nea¡ its base. The stability of the fullycracked URM wall, shaken by less than critical ground motion intensities, was
maintained by gravity load moments applied at the cracked surface. \ühen the center ofgravity of the vertical loads, above the cracked surface, lay within the wall thickness
88

CHAPTER (5)- Stability of Simply Supported URM WaIIsSubjected to Trønsient Out-of-Plane Forces
dimension the gravity load moments were found to provide a restoring moment that
closed the crack upon reversal of the earthquake displacement motion. This ability to
displace without collapse resulted in the walls having a significant reserve capacity above
that of the 'semi-rigid threshold' force. The term 'dynamic stability' was used to
distinguish this type of behaviour from that which might be expected from static
calculations. Correspondingly, a major finding of the study was that neither static elastic
nor 'quasi-static' analysis procedures were completely satisfactory to define the dynamic
and highly nonlhnear response of the post-üacked URM walls'
Like the static F-A relationship, the hysteretic behaviour was found to have a declining
branch and on unloading the hysteretic F-A plot traced back along the loading plot.
As a result of this experimental investigation (ABK 1984) key parameters for predicting
the failure of URM walls subjected to face loading were identif,red. These were the waII
slenderness, the ratio of the applied gravity load to the wall self weight and the peak input
velocities at the base and top of the wall. A further important finding was that although
various phase shifts between the top and bottom excitation were examined, input
velocities simultaneous in time were found to be the critical case. That is, an in-phase
excitation at the top and base of the wall was the critical excitation case.
During the study the effect of vertical ground motion was not considered as it was
thought to not have a significant influence on the dynamic stability. This was explained,
as the frequency band of vertical motions in seismic events is generally not in the critical
frequency band of the horizontal ground motions. That is, the effect of high frequency
vertical motions on the restoring moments will not result in a bias of increasing or
reducing the restoring moment. This is due to the significantly lower frequency of
instability excursions as compared to the typical frequency of vertical seismic motions,
especially as the relative excursion of the center part of the wall approaches instability.
Ba¡iola et al (1990) reported on a series of tests where a gradually increasing excitation
was applied to the base of parapet URM walls. Here it was reported that prior to cracking
89
CHAPTER (5)- Stabiliry of Simply SupportedURM WallsSubjected to Transient Out-of-Plane Forces
the natural frequency of the wall correlated well with simple elastic beam theory. In the
cracked state, however, no unique natural frequency was found as it decreased withincreased displacement response. Also, wall slenderness was not found to have a clear
influence on the peak acceleration required to cause instability. For walls of the same
slenderness wall but with different thickness, the thicker wall appeared to be more stable.
Results of another important dynamic experimental study of out-of-plane URM wall
behaviour was recently published by Lam et al (1995). This study focussed on one-way
bending of parapet walls with the objective of comparing various analytical approaches
with the experimental results. The subject of the experiment was a lm tall, I 10mm thick,
clay brick IJRM wall and was subjected to the El Centro ground motion. Free vibration
tests were also used to identify the frequency response and damping characteristics of the
cantilevered wall. The un-cracked elastic natural frequency was found to be between 5
and l0 Hz depending on the amplitude of vibration. Once the wall was cracked the
rocking frequency was found to decrease from about 4Hz at low amplitude displacements
to a lower frequency limit of approximately lHz at larger displacements. Although the
equivalent viscous damping, (, being a measure of energy loss was observed to vary
slightly (2.67o-3.4%o) with displacement it was reported to be fairly consistently around
37o.
Continuing from their earlier tests Lam et al (1998) have also reported on shaking table
tests on parapet walls of different dimensions using harmonic excitations of varying
amplitude and frequencies. Here the peak displacement of the wall was correlated to the
peak shaking table acceleration and velocity. These relationships were found to be highly
dependent on the excitation frequency so that plotting results associated with different
forcing frequencies produced large scatters (refer Figure 5.3.4). In contrast, a good linear
correlation was obtained between the relative displacement of the wall and the absolute
displacement of the shaking table (refer Figure 5.3.5). Typically, the peak relative
displacement at the top of the parapet wall was reported to be twice the peak absolute
displacement of the table irrespective of the frequency and amplitude of the table
motions. Inspection of the test results further showed that the center of gravity of the
90
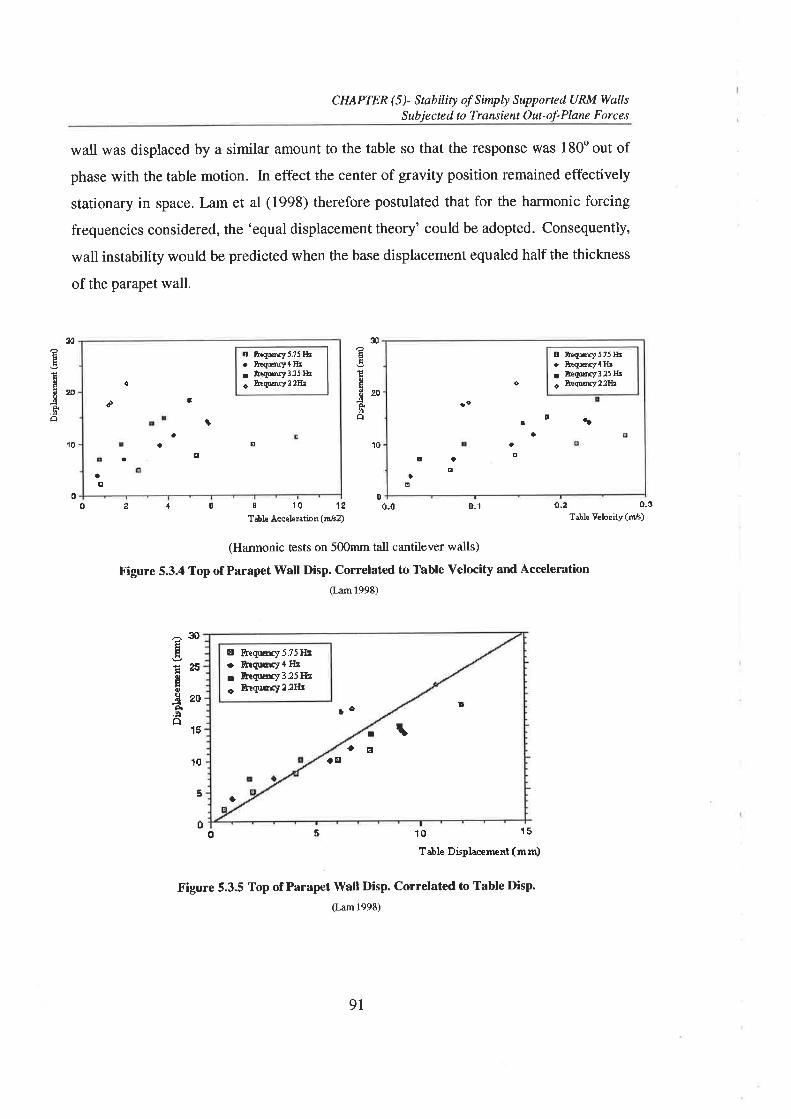
30âd
c
Ë20.5a
304ãË
Ég
Ízo_!A.þâ
CHAPTER (5)- Støbility of Simply Supported URM WallsSubjected to Transient Out-of-Plane Forces
wall was displaced by a similar amount to the table so that the response was 1800 out of
phase with the table motion. In effect the center of gravity position remained effectively
stationary in space. Lam et al (1998) therefore postulated that for the harmonic forcing
frequencies considered, the 'equal displacement theory' could be adopted. Consequently,
wall instability would be predicted when the base displacement equaled half the thickness
of the parapet wall.
10 10
0 04 ú B 10 1¿
Table Acceleratio n (nr¡ts2)0,0 o-1 o.2
T¡bh Vebciiy(¡n/Ð
(Harmonic tests on 500mm tall cantilever walls)
Figure 5.3.4 Top of Parapet \üall Disp. Correlated to Table Velocity and Acceleration(Lam 1998)
10
Ë
10 15
T¡ble Displ¡nertpnt ( m m)
Figure 5.3.5 Top of Parapet Wall Disp. Correlated to Table Disp.
(Lam 1998)
20 o-3
^30ÉÉ
ãasüÉ0-ä eoA.9a
15
05o
E Etqr¡ry5l5Hr. ElqEry 4 H¡¡ Êtgwy3.25IIrc Êt$EEy2tH¡
aE
ê
¡+t
Iga
qa
o &rqu¿Ft535Hr+ &Êq¡{úy4H¡¡ ftr4ffJ31sH¡c fte{ury2ll¡¡
!o
aE
o
qa
+
É
lo
E¡
tE
o &tçnrn¡5f5IIro Êtçttts¡{I&¡ Êtqury3l5IIzo &tEurcyS-?Iù
ûô
I
IE¡
!
fa
!
E
9l
CHAPTER (5)- Stability of Simply Supported URM WqllsSubjected to Transient Out-of-Plane Forces
It was noted, however, that the frequencies used were much higher than the effective
resonant frequency of the parapet wall tested at large displacements. Consequenily,
should excitation frequencies closer to those of the wall's effective resonant frequency at
large displacements have been used, displacement amplifications greater than unity
would have been more likely and the 'equal displacement theory' would not apply.
5.4. Critical Review of Current Analysis Methodologies
As a result of experimental and analytical studies previously carried out, various analysis
methodologies have been developed over the years to analyse the one-way out-of-plane
seismic capacity of URM walls. The following sections critically review these
methodologies highlighting the advantages and limitations of each method.
5.4.1. Quasi-Static Analysis Procedures
The response of a URM wall to earthquake induced base excitations is a complex
dynamic process. Analysis, however, is often simplified by considering an instantaneous
maximum acceleration occurring at a critical snapshot in time. As such, the peak-input
acceleration associated with either the ground motion (PGA) or building response,
depending on the location of the wall within the structure, is often used to represent the
associated inertia force. Displacements are assumed to be small so prior to failure the
induced inertia force is assumed to be uniformly distributed over the height of the wallrelative to the distribution of mass.
Alternatively, it is possible to estimate the wall's critical natural frequency, either in the
cracked or un-cracked state, thus permitting an estimate of the elastic spectral response
acceleration to be determined from an elastic response spectrum. The main limitation
here is that the natural frequency of a URM wall is not unique, as described in Section
5.2.I. In addition, for the cracked wall case where response displacements are relatively
large, in contrast to the uniformly distributed inertia load assumed above a trapezoidal
distributed inertia load is more likely. This is due to the additional triangular inertia force
induced by the vibration of the wall ove¡ the rectangular inertia force resulting from the
motion of the supports.
92
CHAPTER (5)- Snbiliry of Sirnply SupportedURM WallsSubjected to Trqnsient Out-of-Plnn¿ Forces
Regardless of the method used to determine the 'snapshot acceleration' the dynamic
action is represented by a 'quasi-static' type analysis. Earthquake design codes and
standatds typically specify analysis methods based on this 'quasi-static' analysis
philosophy. The two most common methods are: (a) the stress based linear elastic (LE)
and (b) the rigid body (RB) equilibrium analyses. Both are briefly reviewed in this
section.
As described in Section 5.2.3 previous researchers have found that in the un-cracked state
URM walls behave essentially elastically. It is possible therefore to utilise the well
established linear elastic (LE) anatysis methodology to predict at what equivalent lateral
inertia force cracking stresses within a URM wall will be exceeded. The fundamental
principle is to equate the maximum seismically induced moment at a critical section Mu,
to the moment required for the cracking stresses at the leeward face lv[", to be exceeded.
Resistance to cracking is provided by both the flexural tensile strength of the brickwork
fl¡, and the compressive force at the mid-height of the wall from seH-weight and
overburden. Figure 5.4.1 shows a representation of the LE analysis for the prediction of
the cracking acceleration for a simply supported URM wall. Since elastic deformation
prior to cracking in URM walls is generally relatively small the vertical reactions at the
top and base supports are assumed to act at the centerline of the wall.
The current seismic design methodology in Australia (453700-1998) for the vertical one-
way bending of URM walls subjected to transient out-of-plane forces adopts the stress
based LE analysis of the un-cracked section. Here a 'Capacity Reduction Factor' of 0.6
is also used in design to allow for the variability in the flexural tensile sfrength.
93
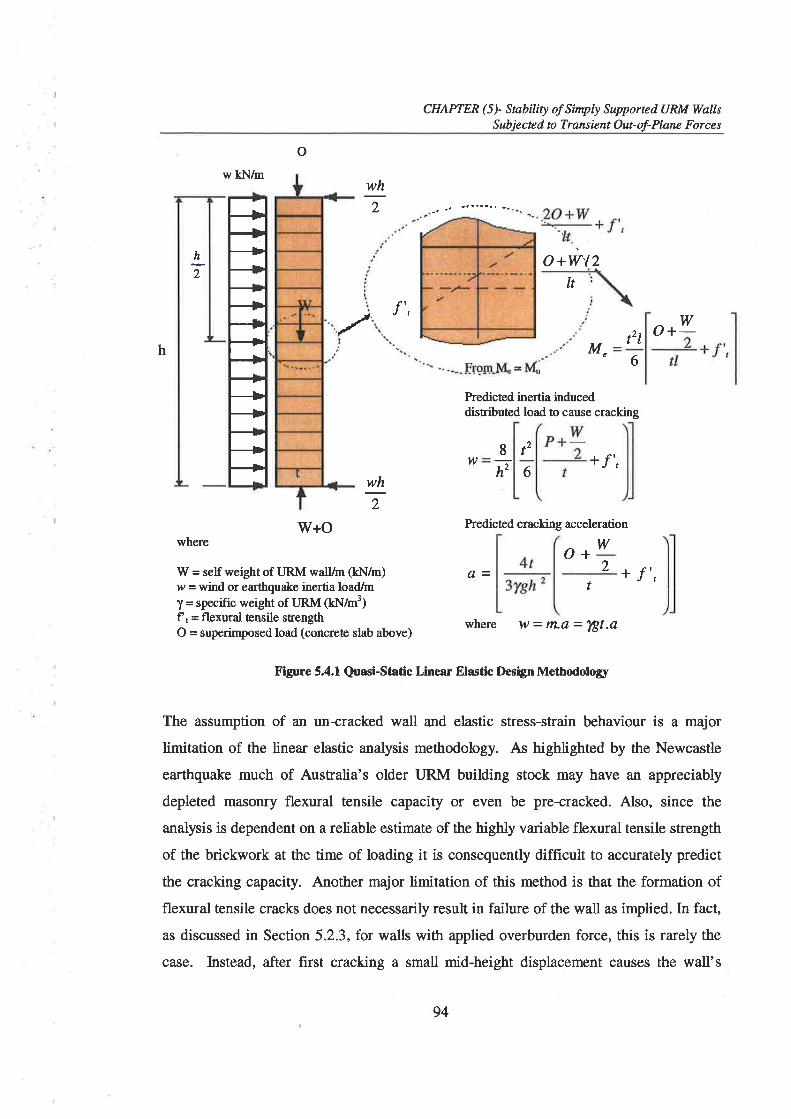
f,f,I{TTTTftrIIf,flrIITTTTIIT
CHAPTER (5)- Snbiliry of Simply Supported URM WallsSubjected to Transient Out-of-Plane Forces
ow kN/m
wh2
h2
O+W2It
r"./' ft o
tr"
w+-h Me
6
Predicæd inertia induceddistributed load to cause cracking
f
Predicted cracking acceleration
8
F t.f"w6
wh2
W+Owhere
W = self weightof URM walUm (kN/m)w = wind or earüquake inertia load/mT = specific weight of URM (ld{/m3)f r = flexural tensile strengthO = superimposed load (concrete slab above)
O+ w2a=
t
where w=m.a-^lgt.a
Figure 5.4.1 Quas¡-Static Linear Elastic Design Methodolory
The assumption of an un-cracked wall and elastic stress-strain behaviour is a major
limitation of the linea¡ elastic anaþis methodology. As highlighted by the Newcastle
earthquake much of Australia's older LJRM building stock may have an appreciably
depleted masonry flexural tensile capacity or even be pre-cracked. Also, since the
analysis is dependent on a reliable estimate of the highly va¡iable flexural tensile strength
of the brickwork at the time of loading it is consequently diff,rcult to accurately predict
the cracking capacity. Another major limitation of this method is that the formation offlexural tensile cracks does not necessarily result in failure of the wall as implied. [n fact,
as discussed in Section 5.2.3, for walls with applied overburden force, this is rarely the
case. Instead, after f,rrst cracking a small mid-height displacement causes the wall's
94
CHAPTER (5)- Stability of Simply Supported URM WallsSubjected to Trønsient Out-of-Plane Forces
neutral axis to be forced in the direction of the compression zone at both mid-height and
vertical support reactions. This neutral-axis shift associated with crack propagation can
lead to a "tip-toe" situation in which the wall is supported on its edges.
The post-cracked seismic performance of an URM wall is therefore more realistically
analysed by the rigid body (RB) equilibrium analysis method, which compares the
overturning moment with the restoring moment taken about the rocking edge of the wall.
The overturning moment is obtained in the same manner as for LE analysis using the
quasi-static methodology, whereas the restoring moment is obtained by consideration of
the forces due to self-weight and any overburden acting on the free body above the mid-
height crack. This is identical to the method described in Section 5.2.1 for determining
the 'rigid threshold resistance' force, R.(1). A major limitation of this method is that it
assumes that the brickwork has an inhnite stiffness. In reality, it is semi-rigid and highly
dependent on its constituent materials. Correspondingly, the real 'semi-rigid resistance
threshold' force, zu(1), can be much lower than R"(1) as it occurs at a larger
displacement where P-A effects are more prominent.
To account for the reduced 'resistance threshold' caused by the semi-rigid behaviour of
URM walls, Priestly (1985) and Paulay (1992) proposed a method of determining the real
non-linear F-Â relationship. This method is based on first principles of beam theory, and
assumes a zero tensile strength for the masonry and simply supported wall at the
centerline. The fundamental approach is based on the assumption that the gradient of the
linear elastic stress diagram at the critical mid-height section, and thus the wall curvature,
is related to the mid-height displacement of the wall. As this relationship is derived
through examination of the stress diagram at the cracking displacement the assumed
modulus and boundary conditions are important considerations.
A finite element model ¡amed the Block-Interface Model has also been developed
(Martini IggT) in an attempt to determine the real static post-cracked F-^ relationship.
Here joints are represented by discontinuum elements so that the elastic properties of the
mortar and associated local effects at the block mortar interface are neglected with the
95
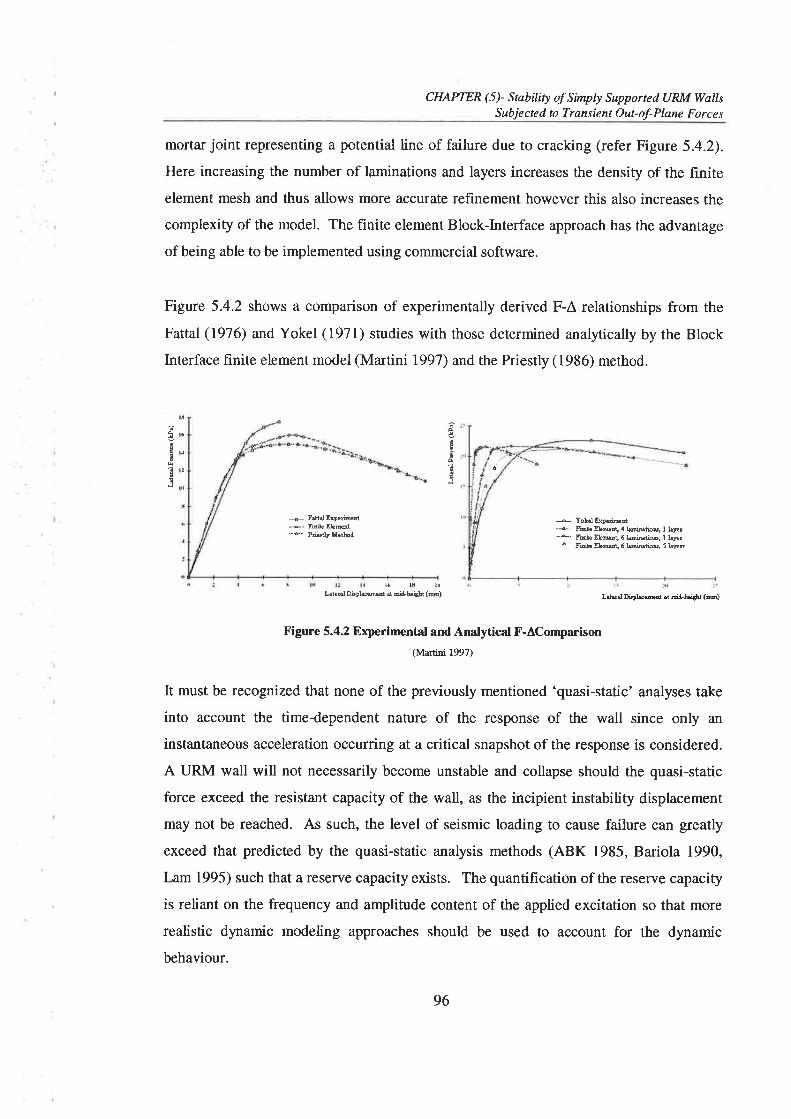
CHAPTER (5)- Stability of Simply SupportedURM WallsS ubj e cte d to Transient O ut- of- Plane F or c e s
mortar joint representing a potential line of failure due to cracking (refer Figure 5.4.2).
Here increasing the number of laminations and layers increases the density of the frnite
element mesh and thus allows more accurate refinement however this also increases the
complexity of the model. The finite element Block-Interface approach has the advantage
of being able to be implemented using commercial software.
Figure 5.4.2 shows a comparison of experimentally derived F-A relationships from the
Fattal (1976) and Yokel (1971) studies with those determined analytically by the BlockInterface finite element model (Martini 1997) and the Priestly (1986) method.
+ FàHål ErDuihül-è- Fifile ELld-{" Prisdyl{rtlod
I
Ë
3
Ilo
:JtarzJtr
+ Yolil E.rüiÐdå- FEil. ELþ!t, ¡l LsiEtios, I l¿Ft-è- fEù€ ElÊEÈ! ó l¡niutiry I l¡r¡ô FEile ELñ.!t, ó lÀniDtios, 5 )¡nr
¡ú JÙ
Lòlerôl Dirph!Ê¡d d Biùheût (m) L.ld¡¡DieDl¡.æd ¡t Ei¡l-luùht (m)
Figure 5.4.2 Experimental and Analytical F-AComparison(Martini 1997)
It must be recognized that none of the previously mentioned 'quasi-static' analyses take
into account the time-dependent nature of the response of the wall since only an
instantaneous acceleration occurring at a critical snapshot of the response is considered.
A URM wall will not necessarily become unstable and collapse should the quasi-static
force exceed the resistant capacity of the wall, as the incipient instability displacement
may not be reached. As such, the level of seismic loading to cause failure can greatly
exceed that predicted by the quasi-static analysis methods (ABK 1985, Bariola 1990,
Lam 1995) such that a reserve capacity exists. The quantification of the reserve capacity
is reliant on the frequency and amplitude content of the applied excitation so that more
realistic dynamic modeling approaches should be used to account for the dynamic
behaviour.
96
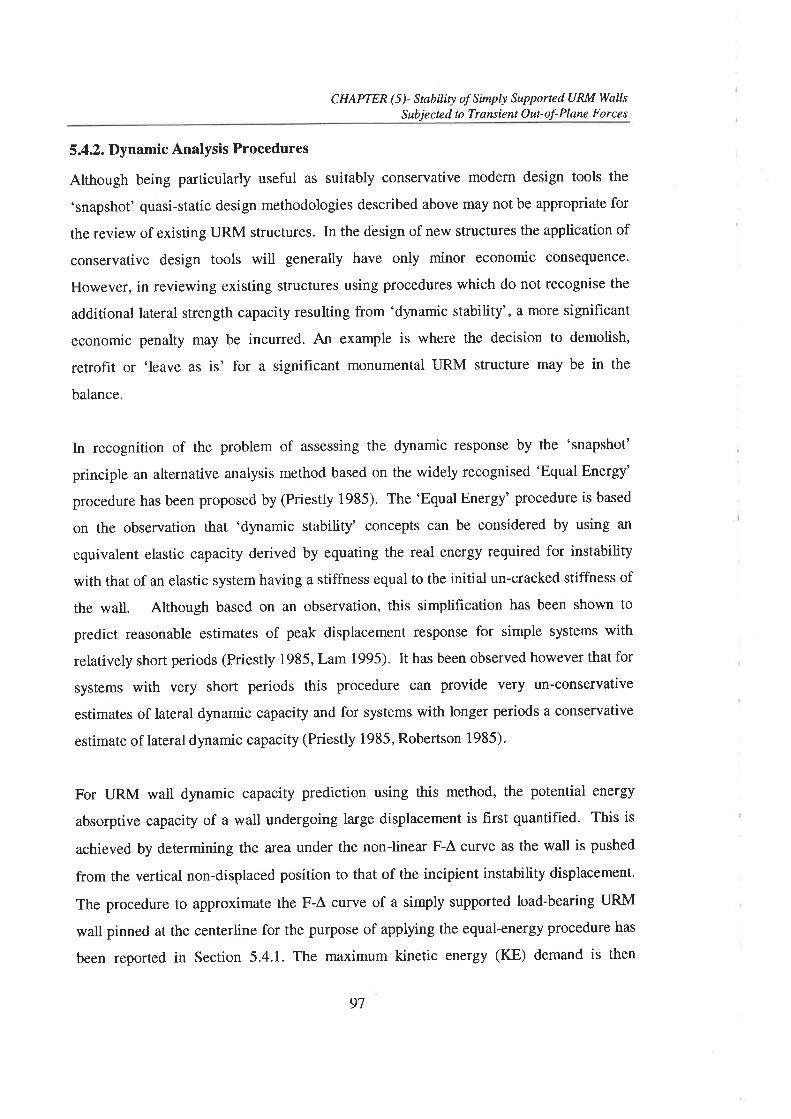
CHAPTER (5)- Stability of Simply Supported URM WaIIsSubjected to Transient Outof-Plane Forces
5.4.2. Dynamic Analysis Procedures
Although being particularly useful as suitably conservative modern design tools the
'snapshot' quasi-static design methodologies described above may not be appropriate for
the review of existing URM structures. In the design of new structures the application of
conservative design tools will generally have only minor economic consequence.
However, in reviewing existing structures using procedures which do not recognise the
additional lateral strength capacity resulting from 'dynamic stability', a more significant
economic penalty may be incurred. An example is where the decision to demolish,
retrofit or 'leave as is' for a significant monumental IJRM structure may be in the
balance.
In recognition of the problem of assessing the dynamic response by the 'snapshot'
principle an alternative analysis method based on the widely recognised 'Equal Energy'
procedure has been proposed by (Priestly 19S5). The 'Equal Energy' procedure is based
on the observation that 'dynamic stability' concepts can be considered by using an
equivalent elastic capacity derived by equating the real energy required for instability
with that of an elastic system having a stiffness equal to the initial un-cracked stiffness of
the wall. Although based on an observation, this simplification has been shown to
predict reasonable estimates of peak displacement response for simple systems with
relatively short periods (Priestly 1985, Lam 1995). It has been observed however that for
systems with very short periods this procedure can provide very un-conservative
estimates of lateral dynamic capacity and for systems with longer periods a conservative
estimate of lateral dynamic capacity (Priestly 1985, Robertson 1985).
For URM wall dynamic capacity prediction using this method, the potential energy
absorptive capacity of a wall undergoing large displacement is first quantified. This is
achieved by determining the area under the non-linear F-À curve as the wall is pushed
from the vertical non-displaced position to that of the incipient instability displacement.
The procedure to approximate the F-Â curve of a simply supported load-bearing URM
wall pinned at the centerline for the purpose of appþing the equal-energy procedure has
been reported in Section 5.4.1. The maximum kinetic energy (KE) demand is then
97

CHAPTER (5)- Stability of Simply Supported URM WaIIsSubjected to Transient Out-of-Plane Forces
derived from the maximum spectral velocity as obtained from an elastic response
spectrum to compare with the potential energy (PE) capacity. Thus, it is assumed that the
wall would remain un-cracked and behave linearly up to the time when the maximum KEis reached (vertical position) and at commencement of the failure half cycle. At this time
the wall is assumed to crack and begin to rock as the PE is increased to absorb the KE.
The abrupt transition from the linear elastic response (in the un-cracked state) to the non-
linear rocking response (in the cracked state) is a major assumption of the equal energy
procedure. In reality, the dynamic behaviour of the wall at the commencement of the
failure half cycle is not always linearly elastic. It has been demonstrated by dynamic tests
(Lam 1995) that the stiffness and natural period of a URM wall can be highly amplitude
dependent even in the un-cracked state. Thus, the "elastic" natural period of vibration ofthe wall, which governs its spectral velocity (and hence its maximum KE) can not be
predicted with certainty. Further, it is possible that the wall may have already cracked
and be responding in-elastically prior to the commencement of the failure half cycle. Asecond major shortcoming of the 'equal energy' method is that ground excitations are
also assumed to have stopped once the failure rocking half cycle has commenced. As aresult the accumulated effects of multiple pulses on the wall during rocking can not be
accounted for as additional input energy into the system within the failure half cycle is
not considered.
Figure 5.4.3 presents a comparison of the predicted URM wall acceleration capacity
utilising the 'equal energy' method with the previously described quasi-static analyses.
As expected the linear elastic anaþis provides the most conservative prediction ofdynamic lateral capacity for moderate to high overburden stress ranges. For lowoverburden stress, however, the rigid body analysis is more conservative. For alloverburden stress the 'Equal Energy' method provides the least conservative prediction
as an allowance is made for 'dynamic stability'. As the effectiveness of the 'equal
energy' observation is highly dependent on the system's un-cracked natural frequency the
prediction is very sensitive to the selection of elastic modulus. Often a realistic modulus
value can result in an extremely un-conservative lateral strength prediction.
98
CHAPTER (5)- Søbility of Simply Supported URM WallsSubjected to Transient Out-of-Plane Forces
2.5
3'oÊ F'=HÉroEi r'lH$0.
40.0
----lr*LINEAR ELASTICRIGID EODY
'.'.'.'.{r'."'."' EQUAL ENERGY
...._,-._..........1
¡i¡¡.....{.ìr.r!\'þnqf ¡''
0.0u 0.05 0.10 0.15 0.20OVEREURDEN STRESS AT TOP OFI¡TALL
Figure 5.4.3 Comparison of Analysis Predictions
As discussed in Section 5.3.2, Lam (1998) has reported that for harmonic excitations of
varying amplitude and relatively high frequencies the center of gravity of a parapet wall
effectively remained stationary in space. Consequently, based on an 'equal-
displacement' methodology, wall instability could only occur when the table
displacement exceeded the incipient instability displacement, which could be related to
the thickness of the wall. It was also highlighted that for forcing frequencies closer to the
natural frequency of the wall at large displacements that significant displacement
amplification was possible so that instability could occur at table displacements less than
the incipient instability displacement thus invalidating the'equal-displacement'
methodology for practical applications. To overcome this shortfall a dynamic
amplification factor was proposed. \ilhile this method is useful for the dynamic analysis
subjected to ha¡monic excitations it is limited for multiple frequency, transient excitations
where random pulse arival will significantly affect the wall response.
The methods described so far have all used a single parameter (acceleration, velocity, or
displacement) to predict the effect of the excitation on the response of a URM wall. As a
result these methods all have limitations for dynamic analysis although the velocity based
dynamic analysis is satisfactory to analyse the response of single pulse excitation and the
equal displacement method is suitable for stationary periodic excitations. Unfortunately,
general, transient excitations can not be accurately represented by a single parameter so
99

CHAPTER(51 Stability of Simply SupportedURM WallsSubjected to Transient Out-of-Plane Forces
that Time History Analysis (THA) procedures are required to take into account the effect
of the frequency content, duration and pulse arrival details of the excitations.
Although researchers (Housner 1963, Yim et al 1980, Hogan 1989) have reported on
analytical studies where explicit mathematical solutions of rigid rocking motion
equations have been derived these are limited for applications where the system can not
readily be idealised. Further, where transient excitations are considered explicit
mathematical representation is not possible. Consequently, to undertake a THA an
approximate numerical evaluation of the response integral must be used. This requires an
assumption to be made on the motion between consecutive time steps. For example,
acceleration may be assumed to be constant or linearly varying thus allowing the basic
integration equations to be developed (Clough & Penzien 1993).
Lam (19958) has reported on the development of specific THA software for the analysis
of the dynamic response of a parapet walls to transient excitations using the Constant
Average Acceleration Integration technique and a rigid bi-linear F-Â relationship. To
minimise computational time an iterative procedure was not included to model damping
but rather an average mass proportional damping coefficient for the response was
developed based on an estimate of the response frequency. Nevertheless, despite the
approximations made in modelling the F-Â and damping properties, results from this
THA have provided reasonable agreement with experimental results. Similar THAtechniques are also currently being developed for the in-plane rocking analysis of URMwalls (Magenes & Calvi 1996:1997, Abrams 1998).
In 1992 Blakie et al reported that a simplified Displacement-based (DB) analysis, which
compared the displacement demand with capacity, might better predict the seismic
capacity of out-of-plane panels. Although approximate, this method has the potential to
account for the dynamic behaviour and thus the walls reserve capacity. Simitar DB
analysis procedures are currently also being developed for the prediction of in-plane
rocking capacity of URM walls (Magenes & Calvi 1996:1997).
100

t
CHAPTER(5)- Stability of Simply SupportedURM WallsSubjected to Transient Out-of-Plane Forces
5.5. Specific Research Focus
Although most URM walls are designed as two-way spanning elements, as a first stage in
the development of a method that may also be applicable as an analysis component of
dynamic two-way behaviour, an understanding of the physical process underlying one-
way dynamic action must first be developed.
While there has been a substantial research effort undertaken on the static loading
behaviour of one-way spanning wall panels, dynamic action has not been as well
examined. Consequently, simple static analysis procedures have been developed which
are capable of predicting cracking and ultimate loads and have been shown to correlate
well with experimental results. In contrast, the dynamic behaviour is not well
understood.
The few dynamic loading experimental studies that have been previously undertaken
have indicated that URM walls have a significant capacity to displace without becoming
unstable. As a result they are often observed to have the capability of sustaining inertia
forces greater than that predicted by 'quasi-static' methods. This is referred to as the
wall's dynamic 'reserve capacity' to rock. Unfortunately, currently available seismic
predictive models have been unable to account for this large displacement post-cracked
behaviour. Where the 'reserve capacity' to rock is overlooked in analysis a conservative
estimate of seismic capacity is made. Although this may be acceptable for the design of
new buildings, it may impose serious economic penalties in the analysis of existing
structures.
In response to the above shortfall a need was apparent for the development of a rational
and simple analysis procedure, encompassing the essence of the dynamic behaviour and
thus accounting for a URM wall's 'reserve capacity' to rock. The development of this
analysis procedure was adopted as the research focus for the final component of this
project.
101

6. OUT-OF.PLANE SHAKB TABLE
TESTING OF SIMPLY SUPPORTBI)
URMWALLS
6.1,. Introduction
With the aim of developing a better understanding of the physical processes governing
the dynamic collapse behaviour of simply supported URM walls a series of shaking table
tests were conducted on the earthquake simulator in the Chapman Structural Testing
Laboratory, University of Adelaide. In this experimental study the wall response to
harmonic, transient and pulse excitations was examined with the effect of wall va¡iables
including thickness, slenderness and the level of overburden stress taken into
consideration. In Chapter 7 the resulting dynamic response data is used to confirm the
reliability of a specifically developed non-linear Time History Analysis (THA) procedure
for modelling the semi-rigid rocking response of URM walls.
To complement the shaking table test data, static push tests and free vibration tests ïvere
also conducted. These complementary tests enabled the non-linear force-displacement
(F-^), frequency-displacement (/-A) and damping-frequency ((fl relationships for the
rocking wall to be investigated. In Chapter 7, these experimentally derived relationships
are used to calibrate the specifically developed non-linear Time History Analysis (THA)
program.
For completeness, material tests were conducted even-though the ultimate behaviour of
face loaded URM walls, at low levels of overburden, have not previously been found to
be particularly dependent on the constituent brickwork material properties. Nevertheless,
these results provide an indication of the masonry quality tested.
102
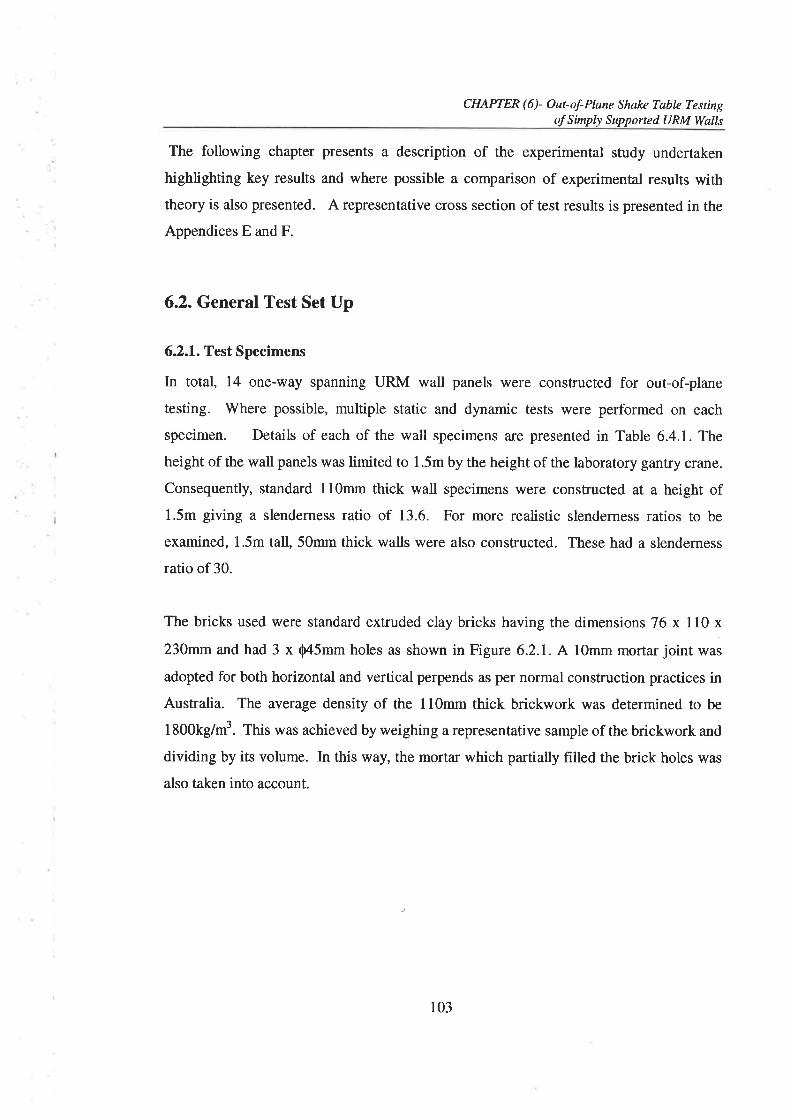
CHAPTER (6)- Out-of-Plane Shake Table Testingof Simply Supported URM Walls
The following chapter presents a description of the experimental study undertaken
highlighting key results and where possible a comparison of experimental results withtheory is also presented. A representative cross section of test results is presented in the
Appendices E and F.
6.2. General Test Set Up
6.2.1. Test Specimens
In total, 14 one-way spanning URM wall panels were constructed for out-of-plane
testing. Where possible, multiple static and dynamic tests were performed on each
specimen. Details of each of the wall specimens are presented in Table 6.4.1. The
height of the wall panels was limited to 1.5m by the height of the laboratory gantry crane.
Consequently, standard 110mm thick wall specimens were constructed at a height of1.5m giving a slenderness ratio of 13.6. For more realistic slenderness ratios to be
examined, 1.5m tall, 50mm thick walls were also constructed. These had a slenderness
ratio of 30.
The bricks used were standard extruded clay bricks having the dimensions 76 x 110 x
230mm and had 3 x Q45mm holes as shown in Figure 6.2.I. A 10mm mortar joint was
adopted for both horizontal and vertical perpends as per normal construction practices in
Australia. The average density of the llOmm thick brickwork was determined to be
1800kg/m3. This was achieved by weighing a representative sample of the brickwork and
dividing by its volume. In this way, the mortar which partially filled the brick holes was
also taken into account.
103
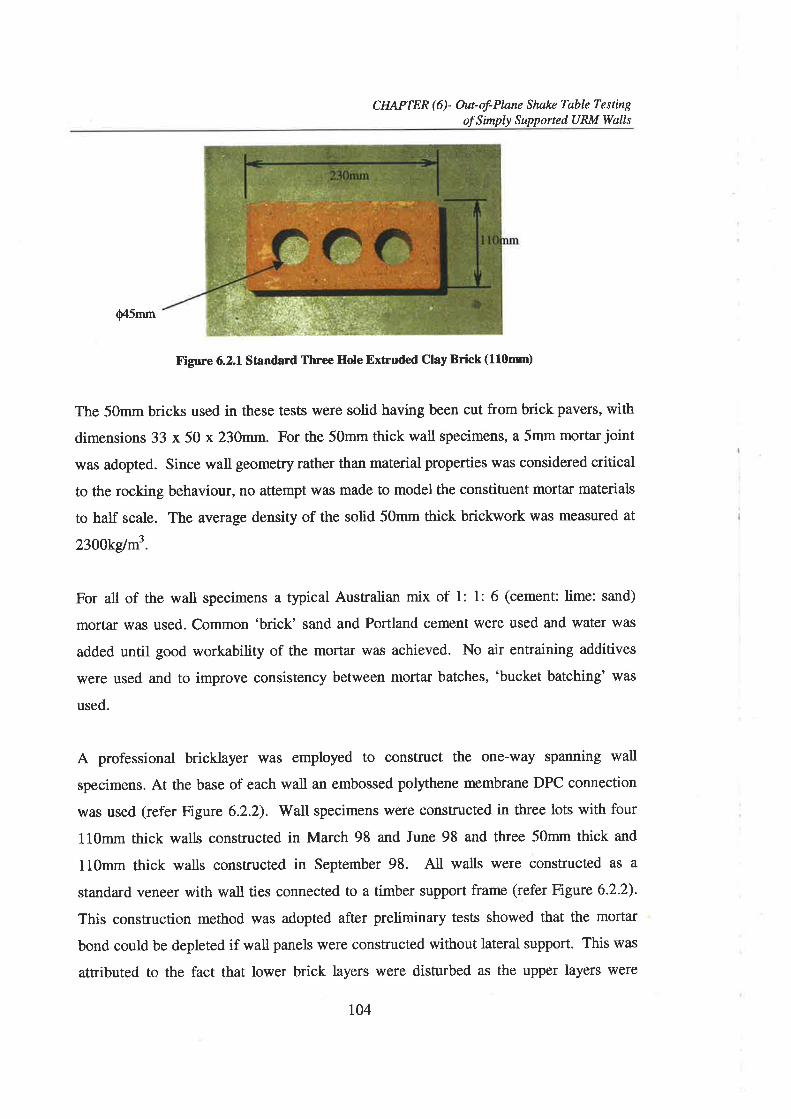
CHAPTER(6)- Out-of-Plane Shake Tøble Testingof Simply SupportedURM Walls
Q45mm
Figure 6.2.1 Ståndard Three Hole Extruded Clay Brick (110mn)
The 50mm bricks used in these tests were solid having been cut from brick pavers, with
dimensions 33 x 50 x 230mm. For the 50mm thick wall specimens, a 5mm mortar joint
was adopted. Since wall geometry rather than material properties w¿ts considered critical
to the rocking behaviour, no attempt was made to model the constituent mortar materials
to half scale. The average density of the solid 50mm thick brickwork was measured at
23}}kstnf .
For all of the wall specimens a typical Australian mix of 1: l: 6 (cement: lime: sand)
mortar was used. Common 'brick' sand and Portland cement were used and water was
added until good workability of the mortff was achieved. No air entraining additives
were used and to improve consistency between mortil batches, 'bucket batching' was
used.
A professional bricklayer was employed to construct the one-way spanning wall
specimens. At the base of each wall an embossed polythene membrane DPC connection
was used (refer Figure 6.2.2). Wall specimens were constructed in three lots with four
110mm thick walls constructed in March 98 and June 98 and three 50mm thick and
110mm thick walls constructed in September 98. All walls \ryere constructed as a
standard veneer with wall ties connected to a timber support frame (refer Figure 6.2.2).
This construction method was adopted after preliminary tests showed that the mortar
bond could be depleted if wall panels \¡/ere constructed without lateral support. This was
attributed to the fact that lower brick layers were disturbed as the upper layers were
r04
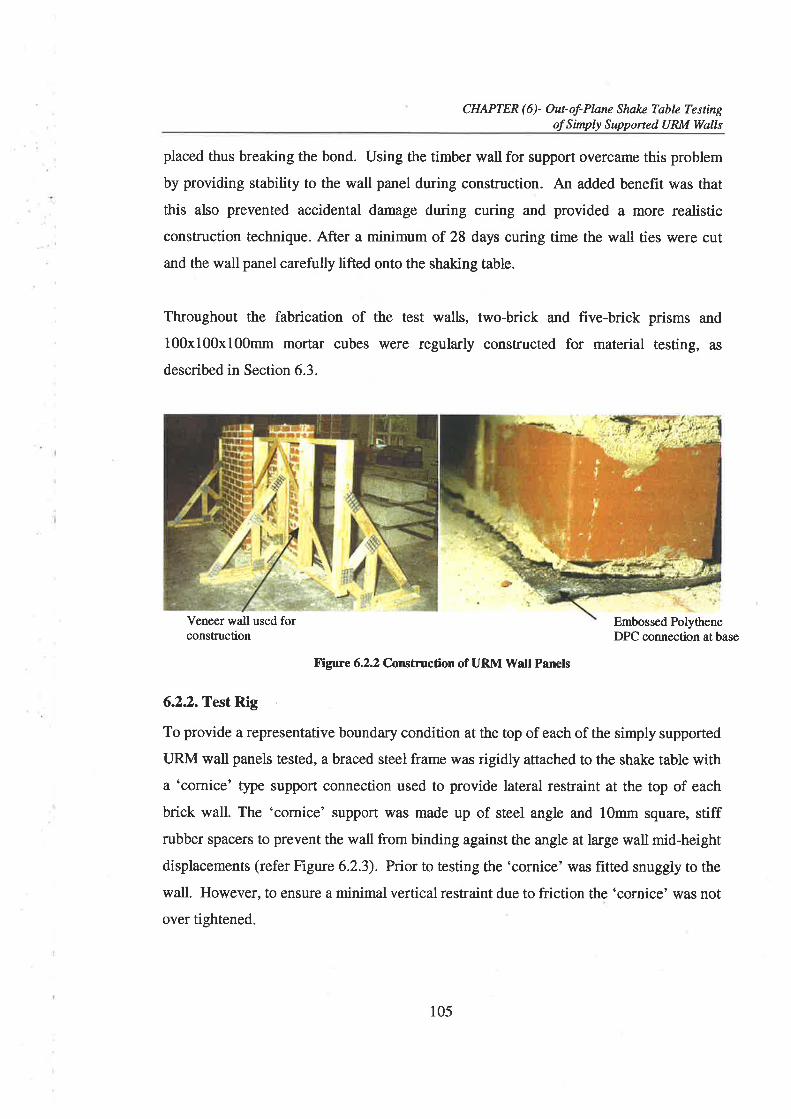
CHAPTER (6)- Ourof-Plnne Shùc Tablz Testingof Simply Supponed URM Walls
placed thus breaking the bond. Using the timber wall for support overcame this problem
by providing stability to the wall panel during construction. An added benefit was that
this also prevented accidental damage during curing and provided a more realistic
construction technique. After a minimum of 28 days curing time the wall ties were cut
and the wall panel carefully lifted onto the shaking table.
Throughout the fabrication of the test walls, two-brick and five-brick prisms and
100x100x100mm mortar cubes were regularly constructed for material testing, as
described in Section 6.3.
Veneer wall used forconstruction
Embossed PolytheneDPC connection at base
Figure 6.2.2 Construction of URM Wall Panels
6.22. Test Rig
To provide a representative boundary condition at the top of each of the simply supported
URM wall panels tested, a braced steel frame was rigidly attached to the shake table witha 'cornice' type support connection used to provide lateral restraint at the top of each
brick wall. The 'cornice' support was made up of steel angle and 10mm square, stiffrubber spacers to prevent the wall from binding against the angle at large wall mid-height
displacements (refer Figure 6.2.3). Prior to testing the 'cornice' was fitted snuggly to the
wall. However, to ensure a minimal vertical restraint due to friction the 'cornice' was not
over tightened.
105

CHAPTER (6)- Ourof-Pløne Shake Table Testingof Simply Supported URM Wqlls
l0mm stiffrubber spacer
AdjusEnentbolts
WallSpecimen
Figure 6.2.3Top 'Cornice' Support Connection
The stiffness of the braced frame was designed to represent as closely as possible the in-
plane stiffness of a URM structural shear wall (refer Figure 6.2.4). As a consequence, any
input excitation provided at the table was also applied approximately in phase at the top
of the wall. This w¿rs confirmed by comparison of the absolute displacements of the table
and top of the braced frame for each of the dynamic tests. Using an impulse free
vibration test the natural frequency of the braced frame was determined to be
approximately 10H2. For most of the tests this was not in the range of dominant driving
frequencies so that the small response amplification recorded at the top support was
neglected. For the relatively high un-cracked wall natural frequency tests, however,
where the mid-height of the wall specimen was excited using a mallet strike, the black
frame natural frequency dominated the response and thus was required to be filtered out.
Also, for harmonic tests completed near the frame's natural frequency of 10Hz
significant amplification of the base excitation was observed at the top support of the test
specimen so that an average input excitation had to be considered.
Preliminary tests showed that it was very difhcult, in practice, to apply an overburden
force at the top of the test walls in a realistic manner using weights supported by a
concrete slab. This method produced large overturning moments at the bearing support
rails of the shaking table, leading to a dangerous rocking action during testing that limited
the inertia forces that could be induced into the wall. To oYercome this problem an
106
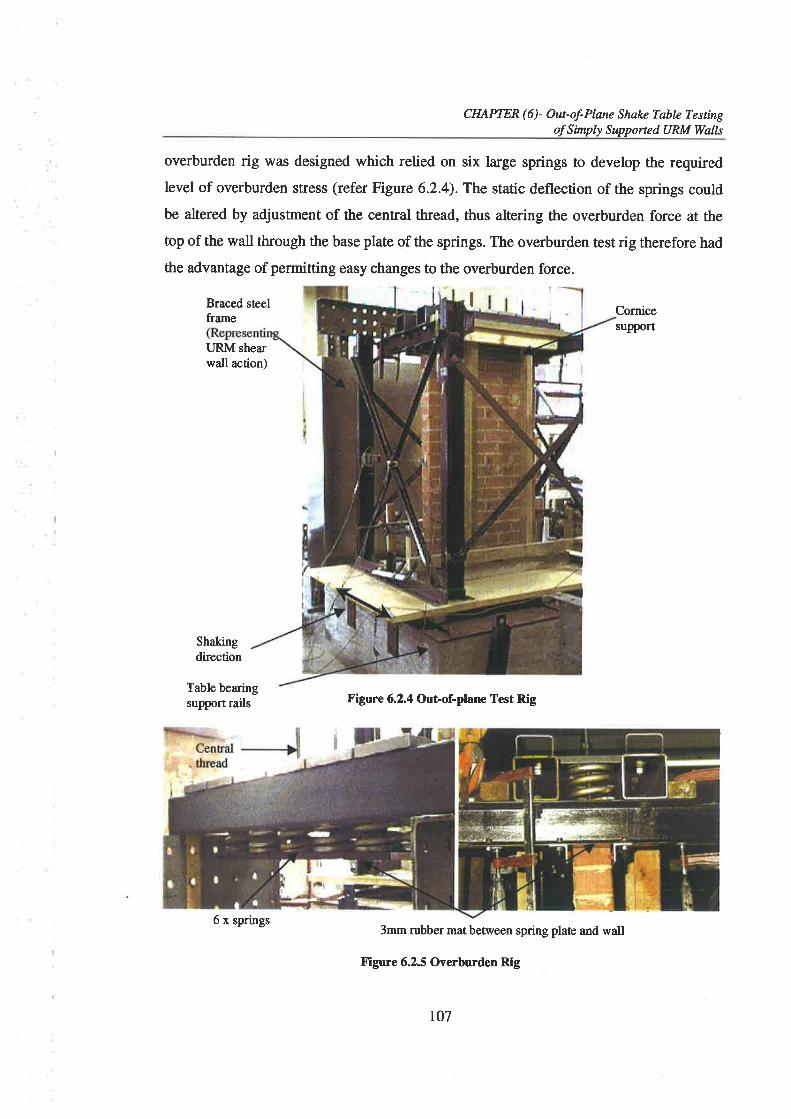
CHAPTER (6)- Out-of-Plnne Shalce Table TestingofSímply Supported URM Walls
overburden rig was designed which relied on six large springs to develop the required
level of overburden stress (refer Figure 6.2.4). The static deflection of the springs could
be altered by adjustment of the central thread, thus altering the overburden force at the
top of the wall through the base plate of the springs. The overburden test rig therefore had
the advantage of permitting easy changes to the overburden force.
Braced steelframe Cornice
support
URM shearwall action)
Shakingdirection
Table bearingsupport rails X'igrrre 6.2.4 Out-of-plane Test Rig
3mm n¡bber mat between spring plate and wall
Figure 6.2.5 Overburden Rig
I
6 x springs
r07
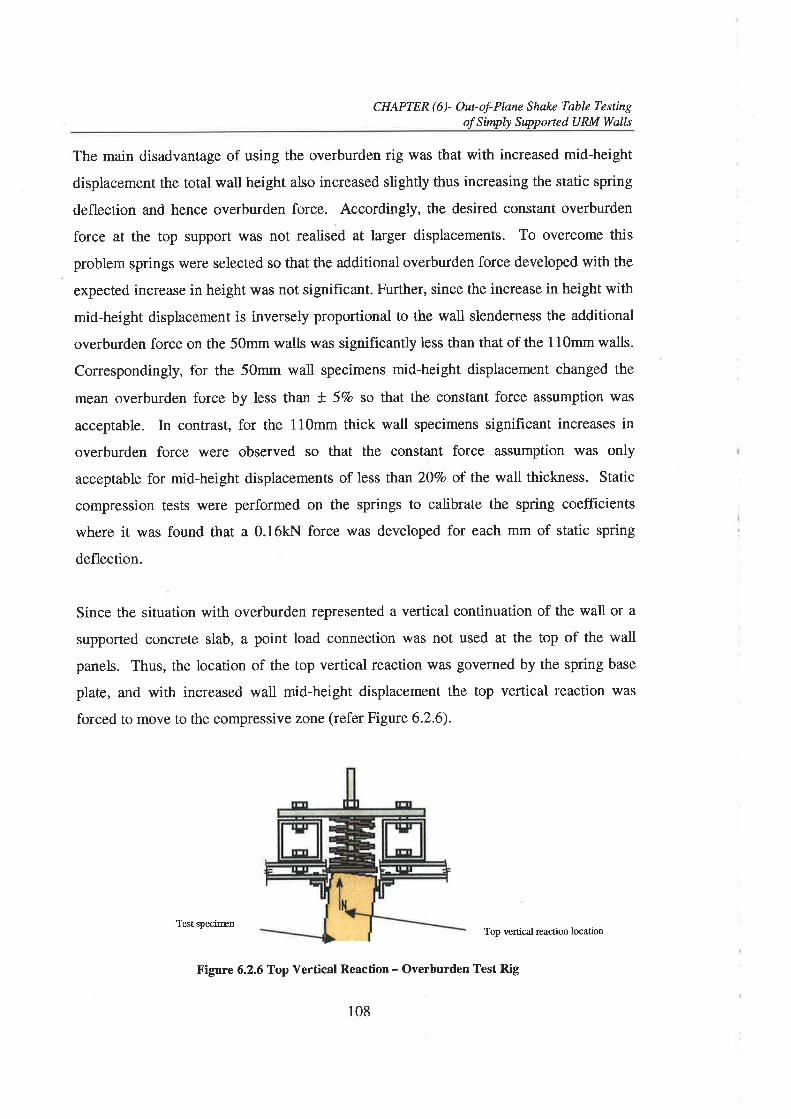
CHAPTER (6)- Out-of-Plane Shake Table Testingof Simply Supported URM WaIIs
The main disadvantage of using the overburden rig was that with increased mid-height
displacement the total wall height also increased slightly thus increasing the static spring
deflection and hence overburden force. Accordingly, the desired constant overburden
force at the top support was not realised at larger displacements. To overcome this
problem springs were selected so that the additional overburden force developed with the
expected increase in height was not signif,rcant. Further, since the increase in height with
mid-height displacement is inversely proportional to the wall slenderness the additional
overburden force on the 50mm walls was significantly less than that of the 110mm walls.
Correspondingly, for the 50mm wall specimens mid-height displacement changed the
mean overburden force by less than ! SVo so that the constant force assumption was
acceptable. In contrast, for the 110mm thick wall specimens significant increases in
overburden force were observed so that the constant force assumption was only
acceptable for mid-height displacements of less than 207o of the wall thickness. Static
compression tests were performed on the springs to calibrate the spring coefficients
where it was found that a 0.16kN force was developed for each mm of static spring
deflection.
Since the situation with overburden represented a vertical continuation of the wall or a
supported concrete slab, a point load connection was not used at the top of the wall
panels. Thus, the location of the top vertical reaction was governed by the spring base
plate, and with increased wall mid-height displacement the top vertical reaction was
forced to move to the compressive zone (refer Figure 6.2.6).
Test çecirren Top vertical reaction location
Figure 6.2.6Top Yertical Reaction - Overburden Test Rig
108
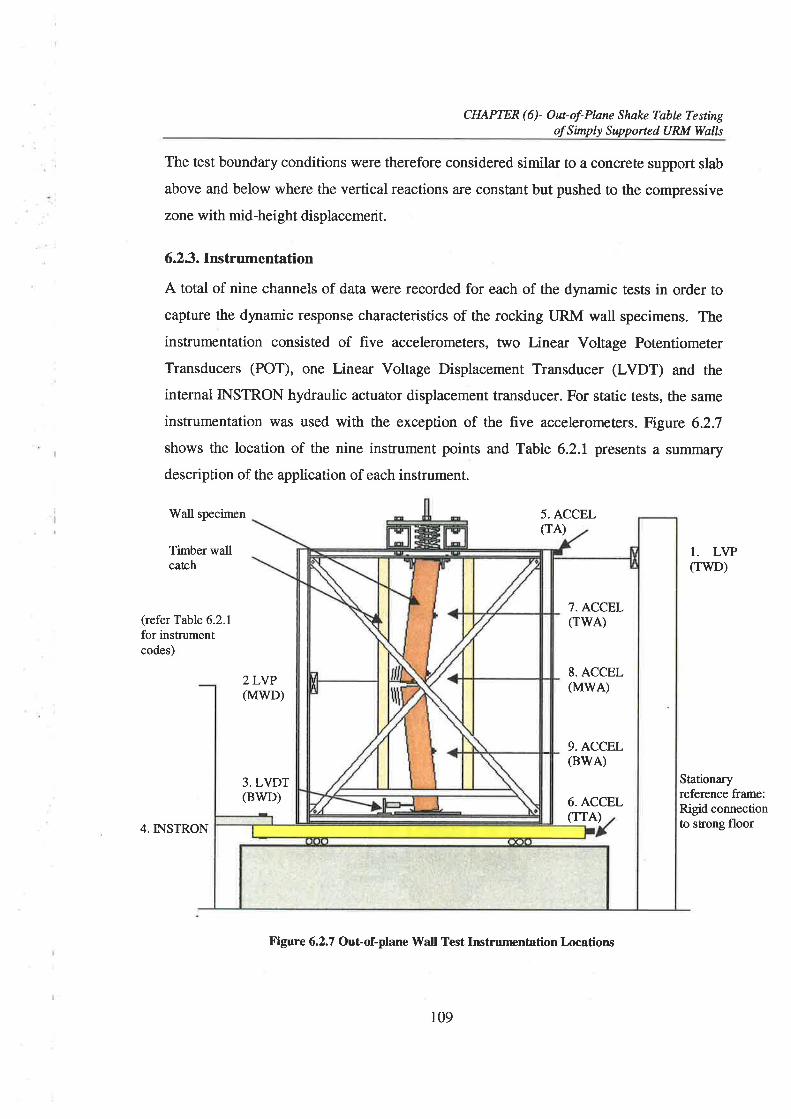
CHAPTER (6)- Outof-Plnne Shakc Tablz Testingof Simply SupponedURM Walls
The test boundary conditions were therefore considered similar to a concrete support slab
above and below where the vertical reactions are constånt but pushed to the compressive
zone with mid-height displacement.
6.23.Instrumentation
A total of nine channels of data were recorded for each of the dynamic tests in order to
capture the dynamic response characteristics of the rocking URM wall specimens. The
instrumentation consisted of five accelerometers, t'wo Linear Voltage Potentiometer
Transducers (POT), one Linear Voltage Displacement Transducer (LVDT) and the
internal INSTRON hydraulic actuator displacement transducer. For static tests, the same
instrumentation was used with the exception of the five accelerometers. Figure 6.2.7
shows the location of the nine instrument points and Table 6.2.1 presents a summary
description of the application of each instrument.
rffall specimen 5. ACCEL(TA)
Timber wallcatch
(refer Table 6.2.1for instrumentcodes)
4.INSTRON
2LYP(MwD)
3. LVDT(BwD)
I. LVP(TrwD)
Stationaryreference frame:Rigid connectionto súong floor
Figure 6.2.7 Out-o[-plane WaIl Test Instrumentation Locations
7. ACCEL(rwA)
8. ACCEL(MwA)
9. ACCEL(BWA)
6. ACCEL(TTA)
109
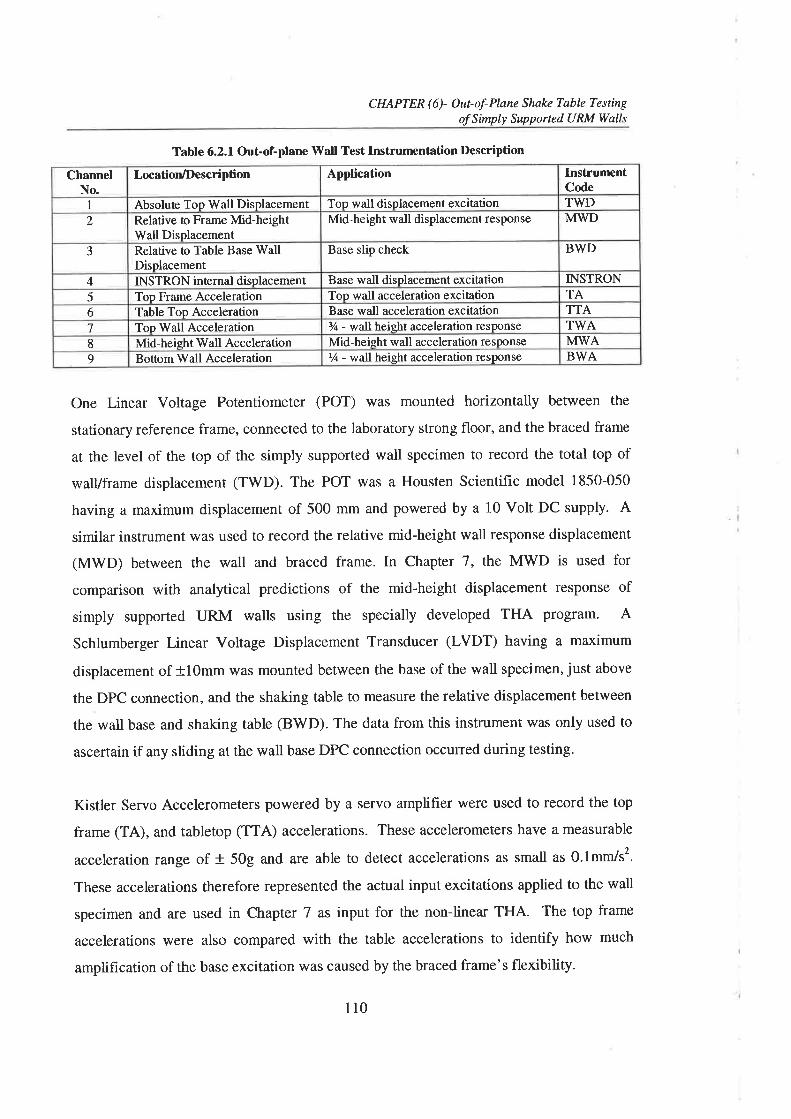
CHAPTER (6)- Out-of-Plane Shake Table TestingofSimply Supported URM Walls
ChannelNo.
Location/Description Application InstrumentCode
I Absolute Top Wall Displacement Top wall displacement excitation TWD2 Relative to Frame Mid-height
tWall DisplacementMid-height wall displacement response MWD
J Relative to Table Base WallDisplacement
Base slip check BWD
4 INSTRON internal displacement Base wall displacement excitation INSTRON5 Top Frame Acceleration Top wall acceleration excitation TA6 Table Top Acceleration Base wall acceleration excitation TTA1 Top Wall Acceleration t/+ - wall height acceleration response TWA8 Mid-heieht V/all Acceleration Mid-height wall acceleration response MWA9 Bottom Wall Acceleration r/¿ - wall height acceleration response BWA
Table 6.2.1 Out-of-plane Wall Test Instrumentation Description
One Linear Voltage Potentiometer (POT) was mounted horizontally between the
stationaty reference frame, connected to the laboratory strong floor, and the braced frame
at the level of the top of the simply supported wall specimen to record the total top of
walVframe displacement (TWD). The POT was a Housten Scientifrc model 1850-050
having a maximum displacement of 500 mm and powered by a 10 Volt DC supply. A
similar instrument was used to record the relative mid-height wall response displacement
(MViD) between the wall and braced frame. In Chapter 7, the MWD is used for
comparison with analytical predictions of the mid-height displacement response of
simply supported URM walls using the specially developed THA program. A
Schlumberger Linear Voltage Displacement Transducer (LVDT) having a maximum
displacement of +1Omm was mounted between the base of the wall specimen, just above
the DPC connection, and the shaking table to measure the relative displacement between
the wall base and shaking table (BWD). The data from this instrument was only used to
ascertain if any sliding at the wall base DPC connection occurred during testing.
Kistler Servo Accelerometers powered by a servo amplifier were used to record the top
frame (TA), and tabletop (TTA) accelerations. These accelerometers have a measurable
acceleration range of + 50g and are able to detect accelerations as small as 0.1mm/s2'
These accelerations therefore represented the actual input excitations applied to the wall
specimen and are used in Chapter 7 as input for the non-linear THA. The top frame
accelerations were also compared with the table accelerations to identify how much
amplification of the base excitation was caused by the braced frame's flexibility.
110
CHAPTER (6)- Ourof-Plane Shake Table Testingof Simply Supported URM Walls
The top (TWA), mid-height (MWA) and bottom (BWA) accelerations were recorded
using the 'Analogue Devices' single chip accelerometer, model ADXLO5 which were
adhered to the face of the wall at the 3/t -, mid - and r/¿ - height respectively. This less
expensive semi-disposable accelerometer was selected, as it was possible that should the
wall collapse these devices could be sacrificed. These accelerometers have a measurable
acceleration range of + 59 and a¡e able to detect accelerations as small as 0.019. Alimitation of this method was due to the accuacy of the accelerometers being reliant on a
horizontal datum. Since the accelerometers were glued to the wall surface they rotated
with the rocking of the wall so that as the wall's mid-height displacement increased the
accuracy of the data from these accelerometers decreased. For most of the criticalresponse however the accuracy was adequate for the purpose of the tests. Comparison ofthe BWA and TWA with the mid-height acceleration response was useful incharacterising the total dynamic acceleration response profile. The mid-height
acceleration response was also later used for comparison with THA predictions.
In a similar fashion to the dynamic tests performed on tlRM connections containing a
DPC membrane, described in Chapter 4,the'Microsoft Windows' based data acquisition
system 'Visual Designer' was used to collect the nine channels of response data. Data
was collected at a period interval of 0.01 seconds (100H2).
Where restoring moments were ¡elatively small, in particular for the non-loadbearing
50mm thick wall specimen, care was taken to ensure that the instrumentation did not
influence the test outcome.
6.3. Material Tests
The material tests undertaken have included bond wrench tests to determine the
brickwork flexural tensile strength, fl1, and compression tests of brickwork prisms and
mortar cubes to determine the masonry's modulus of elasticit), Er* and ultimate
compressive strength, f -, and mortar's compressive strength, f". The following section
presents a brief discussion of these tests and their results.
111

CHAPTER (6)- Out-of-Pbrw Shnke Tablz TestingofSimply Supporte d U RM Walls
63.1. Bond Wrench
The bond wrench test is one of two methods permitted in 453700-1998, Appendix (D) to
determine the flexural tensile strength, f t, of the bond between mortar and brick units
perpendicular to the bed joints. As described in Section 5.2.3, for un-cracked walls with
low levels of overburden, f ¡ is often the critical wall parameter for lateral loading. Here
the un+racked elastic lateral force capacity is greater than the cracked force capacity so
that at first cracking an explosive dynamic instability is possible.
Two bond wrenches were specifically manufactured for this project being for the 11Omm
and the 50mm brick specimens. The bond wrench is used to apply a moment to the joint
to be tested by appþing a load at the end of the lever a¡m. From the known applied
moment, f I can be determined with the assumption of an idealised stress distribution
across the bed joint. To best approximate this idealised stress distribution the bond
wrench design, as shown for the ll0mm brick specimen in Figure 6.3.1, was adopted
from research undertaken by Samarasinghe et al (1998). This bond wrench specification
has since been included in 453700-1998, Appendix (D). To simplify the procedure
strain gauges were adhered to the a¡m of the bond wrench with peak strains calibrated to
the applied force at the loading point. Calibration plots for the two bond wrenches are
presented in Appendix (E).
In order to ascertain if the flexural tensile strengths, determined from the two-brick prism
tests, were representative of the test specimens, bond wrench tests were also completed
on pre-dynamically tested LIRM wall specimens, ¿ls shown in
Figure 6.3.2. For each test specimen three prism and three wall tests were completed.
For the pre-dynamically tested walls the vertical perpends on either side of the test joint
were cut using a masoffy hand saw. Comparison of prism and wall test results showed
that the tested walls generally had a slightþ greater f ,. This was attributed to the wall
test including a vertical perpend in the course below as shown in Figure 6.3.2.
112
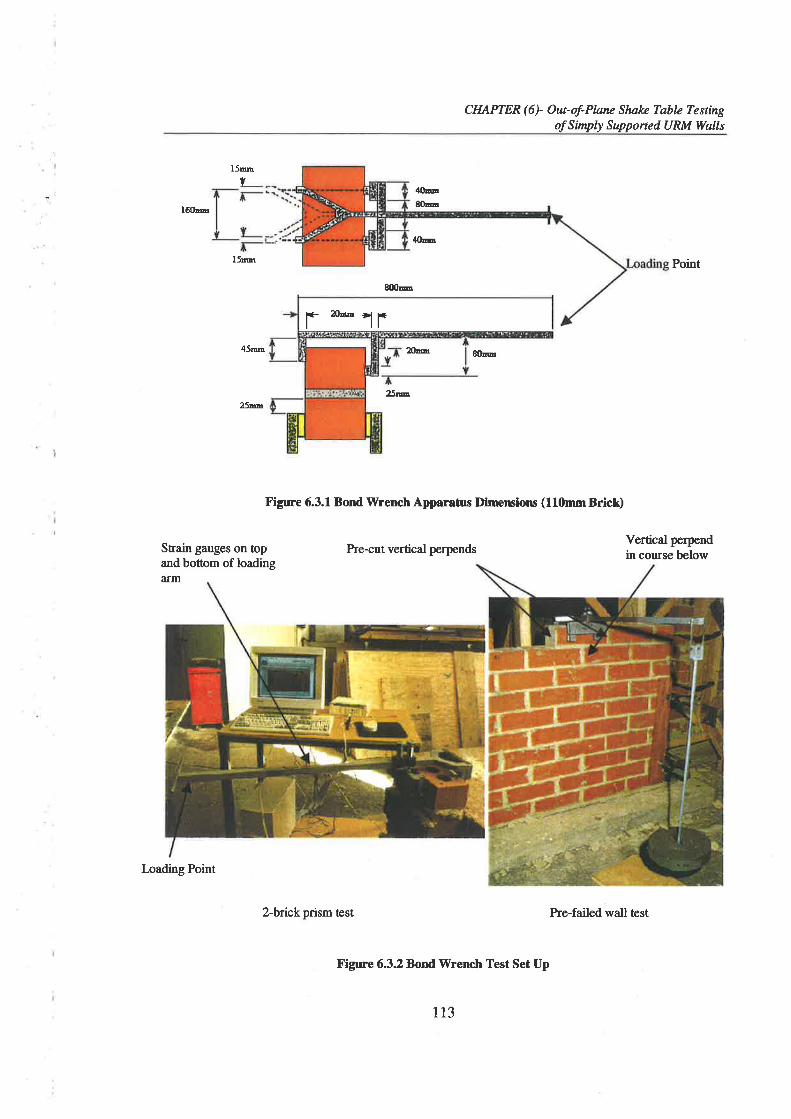
CHAPTER(6)- Out-of-Plan¿ Shake Tqbl¿ Testingof Simply SupponedURM Walls
l5mr
l6U*
l5m
45m
25m
Strain gauges on ûopand botûom of loadingafm
I-oading Point
l* '* lr
¿t0m8Ouu
¡t0lø
flIlu
Point
Vertical perpendin course below
ãÌ- &lzu
25u
X'igure 6.3.1 Bor¡d Wrench Apparatus Dinænsioru (llllmm Brick)
he-cut vertical perpends
2-brick prism æst
Figure 6.3.2 Bond Wrench Test Set Up
713
Pre-failed wall test
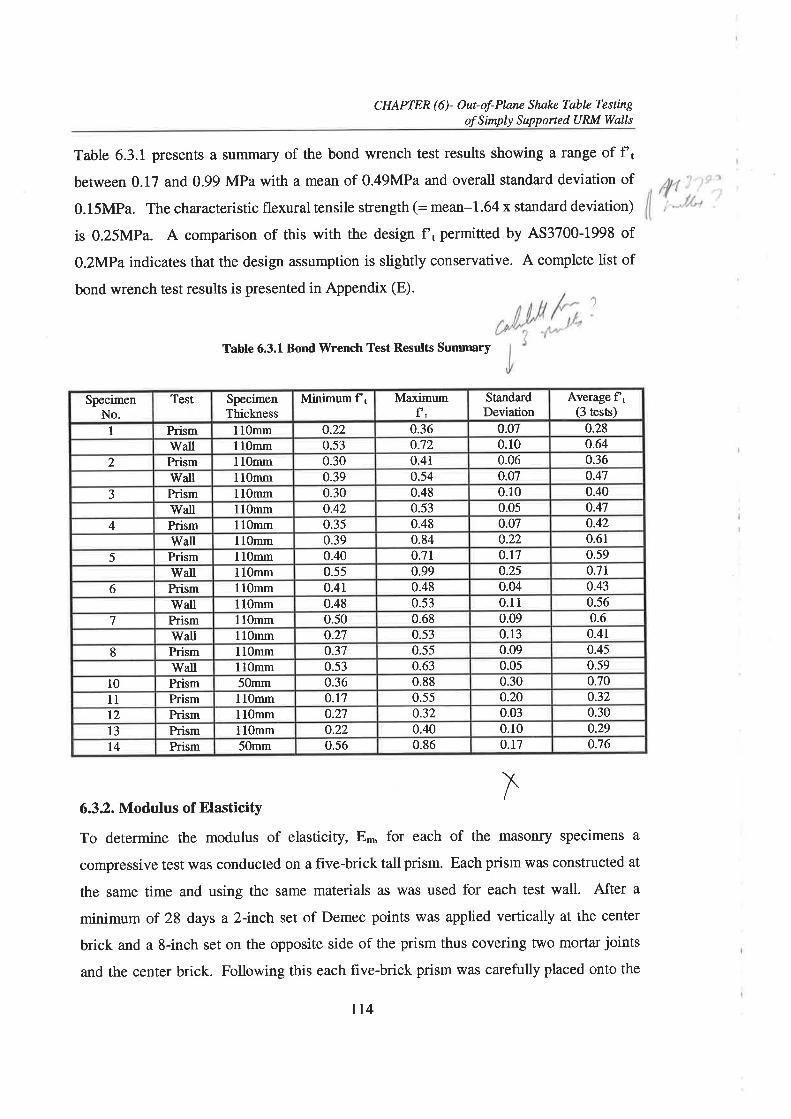
CHAPTER (6)- Out-of-Pbne Shake Table Testingof Simply SupportedURM Walls
Table 6.3.1 presents a summary of the bond wrench test results showing a range of flr
between 0.17 and 0.99 MPa with a mean of 0.49MPa and overall standard deviation of
0.15MPa. The characteristic flexural tensile strength (= mean-1.64 x standard deviation)
is 0.25MPa. A comparison of this with the design fl, permitted by 453700-1998 of
0.2MPa indicates that the design assumption is slightþ conservative. A complete list of
bond wrench test results is presented in Appendix (E).I
X6.32. Modulus of Elasticity
To determine the modulus of elasticity, Er* for each of the masonry specimens a
compressive test was conducted on a five-brick tall prism. Each prism \ryas constructed at
the same time and using the same materials as was used for each test wall. After a
minimum of 28 days a 2-inch set of Demec points was applied vertically at the center
brick and a 8-inch set on the opposite side of the prism thus covering two mortar joints
and the center brick. Following this each hve-brick prism was carefully placed onto the
Tabte 6.3.1 Bond \ilrench Test Resr¡lts Sumrnary
SpecimenNo.
Test SpecimenThiclness
Minimumf . Maximumft
StandardDeviation
Average f,(3 tests)
I Prism 110mm o.22 0.36 0.07 0.28V/all 1lOmm 0.53 0.72 0.10 o.64
2 Prism 110mm 0.30 0.41 0.06 0.36Wall 110mm 0.39 0.54 0.07 0.47
J Prism 110mm 0.30 0.48 0.10 0.40Wall 110mrn 0.42 0.53 0.05 0.47
4 Prism 110mm 0.35 0.48 0.07 o.42V/all l10mm 0.39 0.84 o.22 0.61
5 Prism 110mm 0.40 0.71 o.r7 0.59rWall 110mm 0.5s 0.99 0.25 0.71
6 Prism 110mm 0.41 0.48 0.04 0.43Wall 110mm 0.48 0.53 0.11 0.56
1 Prism 110mm 0.50 0.68 0.09 0.6Wall 110mm 0.27 0.53 0.13 0.41
8 Prism llOmm o.37 0.55 0.09 0.45VfaI 110mm 0.53 0.63 0.05 0.59
10 Prism 5Omm 0.36 0.88 0.30 0.7011 Prism 110mm o.l'l 0.55 0.20 0.32t2 Prism 1l0mm 0.27 o.32 0.03 0.3013 Prism 110mm 0.22 0.40 0.10 0.29l4 Prism 5Omm 0.56 0.86 o.r7 0.76
tr4
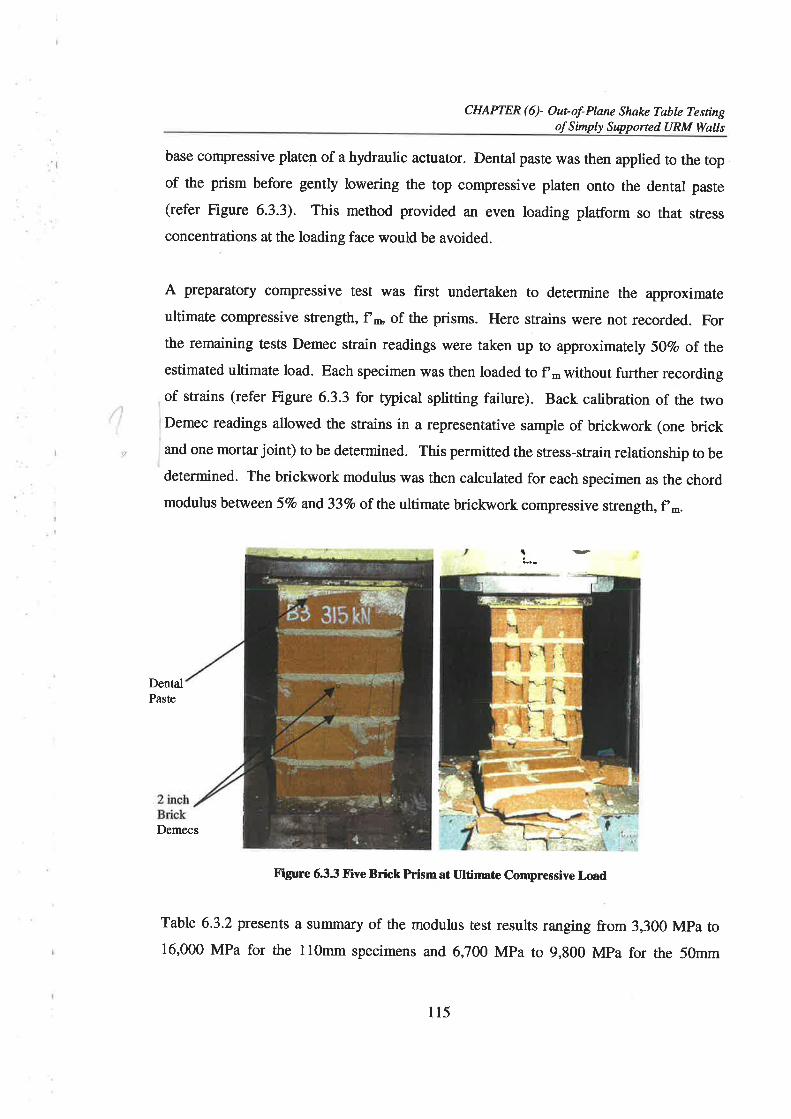
CHAPTER(6)- Out-of-Pløw Shalce Tqble Testingof S imply S upported U RM Walls
base compressive platen of a hydraulic actuator. Dental paste was then applied to the topof the prism before gently lowering the top compressive platen onto the dental paste
(refer Figure 6.3.3). This method provided an even loading platform so that stress
concentrations at the loading face would be avoided.
A preparatory compressive test was first undertaken to determine the approximateultimate compressive stength, f* of the prisms. Here strains wers not recorded. Forthe remaining tests Demec strain readings were taken up to approximately 50Vo of theestimated ultimate load. Each specimen was then loaded to f - without further recordingof strains (refer Figure 6.3.3 for tlpical splitting failure). Back calibration of the twoDemec readings allowed the strains in a representative sample of brickwork (one brickand one mortar joint) to be determined. This permitted the stress-strain relationship to be
determined. The brickwork modulus was then calculated for each specimen as the chordmodulus between 5Vo and 33Vo of the ultimate brickwork compressive strength, f -.
{}
-I
DentalPaste
Demecs
Figure 6.33 Five Brick Prism at Ultirmte Conrpressive Load
Table 6.3.2 presents a summary of the modulus test results ranging from 3,300 MPa to16,000 MPa for the 110mm specimens and 6,700 Mpa to 9,800 Mpa for the 50mm
115

CHAPTER (6)- Ourof-Plane Shake Table Testingof Simply Supported URM Walls
specimens. While the results vaded significantly the modulus values were typically
found to be relatively high as expected of modern masonry. For older masonry
constructed with weak lime mortars it is possible that the modulus values would be
lower, being in the order of 500MPa to l,000MPa (Robinson 1985). A complete list of
compressive test results for the five-brick prisms is presented in Appendix (E).
Table 6.3.2 Brickwork Modulus Test Results
The masonry modulus of elasticity, E,* can be represented by the linear relationship
En -kf-
where k is a constant. Drysdale et al (1994) reported that from previous experimental
studies on clay brick prisms, k generally falls within the range of 2lO to 1670. For the
110mm prismtests k was estimated to be9,400113.4=7OO and is therefore within the
range of previous experimental results. For the 50mm bricks k was estimated to be
8,250126.5=310 and is therefore also in the lower range of the proposed values.
'2(/4 touttk/-
U,r dtn^"/,
Specimen No. SpecimenThiclness
ModulusE- (MPa)
Ultimate CompressiveI-oad (N)
Masonry CompressiveStrength, f'* (MPa)
1 ll0mm 330,000 13
2 llOmm 15,00Q 332,OOO 13.1
3 ll0mm . 3;300 \ 336,000 13.3
4 llOmm i 3,380 ' 333,000 13.1
5 llOmm 16,000 360,000 t4.26 110mm 338,000 13.47 l lOmrn 13,900 313,000 t2.48 llOmm 5,400 245,000 9.711 l10mm 6,600 359,000 14.2t2 110mm 11,600 397,000 t5.7t3 l10mm 397,000 15.7
AVERAGE 110mm 9.400 R ¿ 339,000 13.4
STANDARI)DEVIATION
5,322 ) 41,528 t.g
10 5Omm 9,800 307,000 26.7t4 5Omm 6,700 303,000 26.3
AVERAGE 5Omm 8.250 305,000 26.5
STANDARI)DEVIATION
2,192 2,8U 0.28
116
CHAPTER (6)- Out-of-Plane Shake Table Testingof Simply Supported U RM Walls
6.33. Mortar Compressive Strength
Mortar compressive strength, f ",
is often an important parameter for masonry because ithas an influence on the masonry compressive stress, however, it is typically used more as
a measure of quality control. For each test specimen three standard 100x100x100mm
mortar cubes were produced. After 28 days these were removed from their non-
absorptive casing and tested in compression. The typical failure mode was observed to
be a pyramidal shape. Due to the relatively high lime and sand content of the mortar as
compared to the cement content, the mean f "
of 5.17MPa was quite low compared withmortars of a higher cement content, ranging from 3.56MPa to 7.16MPa. A complete listof mortar cube compressive test results is presented in Appendix (E)
6.4. Out-of-Plane Testing of Simply Supported URM WallsTo explore the out-of-plane dynamic response of simply supported URM walls harmonic,
pulse and transient excitation shaking table tests were conducted. The testing program is
best described by grouping the completed tests into the th¡ee construction lots of March98, June 98 and September 98. For both March 98 and June 98, gradually increasing
harmonic excitation tests were performed on both cracked and un-cracked 110mm thickURM walls. These harmonic tests were aimed at developing an understanding of the
basic physical characteristics governing the dynamic behaviour. Once a basic
understanding of the dynamic behaviour \ryas attained, the September 98 test series was
designed to further investigate the previously identifïed specific physical characteristics
and examine the influence of excitation frequency and amplitude on the wall's dynamic
behaviour. Consequently for the September 98 test series both pulse and real earthquake
transient excitations were used.
To complement the dynamic tests and further explore the important physical
characteristics of the out-of-plane behaviour of simply supported tlRM walls, static push
and free vibration tests were also undertaken for each wall configuration. Table 6.4.1
presents the full testing program undertaken.
tt7
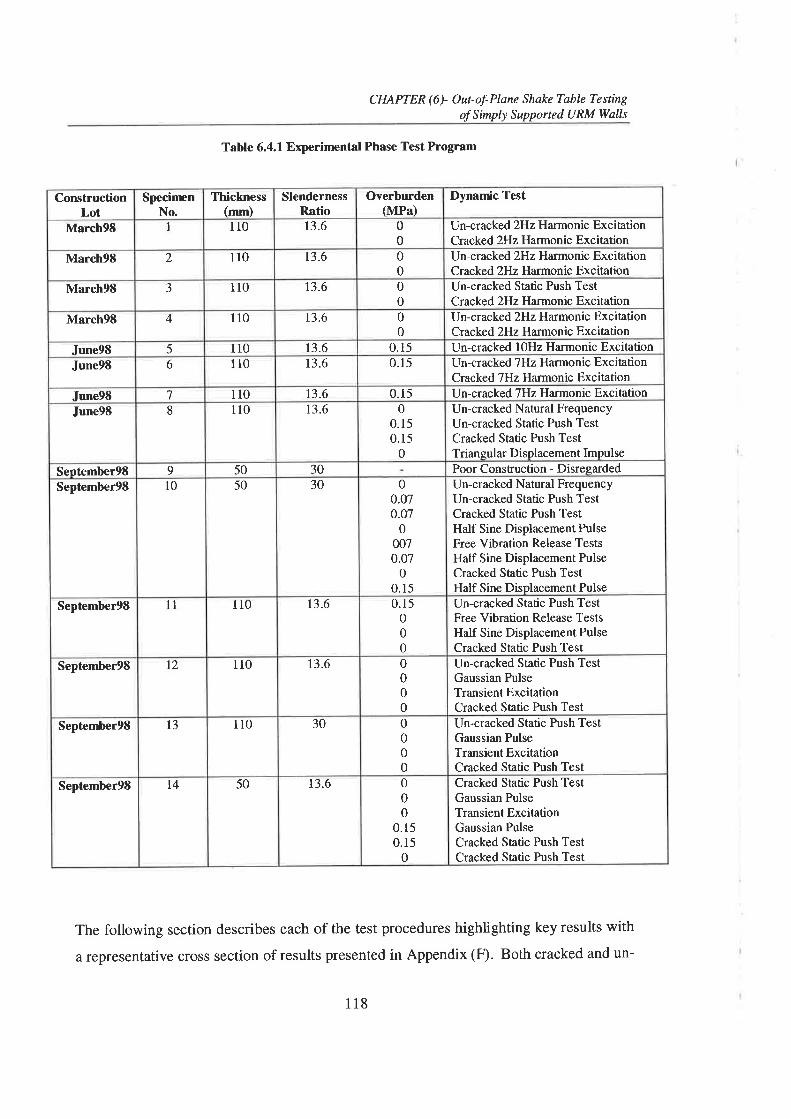
CHAPTER (6)- Out-of-Plane Shake Table TestingofSimply Supported URM Walls
CorutructionLot
SpecinrenNo.
Thickness(mm)
SlendernessRatio
Overburden(MPa)
Dynamic Test
March9S I 110 13.6 00
Un-cracked 2Hz Harmonic ExcitationCracked 2Hz Harmonic Excitation
March9E 2 110 13.6 00
Un-cracked 2Hz Harmonic ExcitationCracked 2Hz Harmonic Excitation
March9S J 110 13.6 00
Un-cracked Static Push TestCracked 2Hz Harmonic Excitation
March93 4 110 13.6 00
Un-cracked 2Hz Harmonic ExcitationCracked 2Hz Harmonic Excitation
June98 5 110 13.6 0.15 Un-cracked l0Hz Harmonic ExcitationJune98 6 110 13.6 0.15 Un-cracked 7Hz Harmonic Excitation
Cracked 7Hz Harmonic ExcitationJune98 7 110 t3.6 0.15 Un-cracked 7Hz Harmonic ExcitationJune98 8 110 13.6 0
0.150.15
0
Un-cracked Natural FrequencyUn-cracked Static Push TestCracked Static Push TestTrianqular Displacement Impulse
Sentember9S 9 50 30 Poor Consfruction - DisregardedSeptember9S l0 50 30 0
0.070.07
00070.07
00.15
Un-cracked Natural FrequencyUn-cracked Static Push TestCracked Static Push TestHalf Sine Displacement PulseFree Vibration Release TestsHalf Sine Displacement PulseCracked Static Push TestHalf Sine Displacement Pulse
Septembe19E ll 110 13.6 0.15000
Un-cracked Static Push TestFree Vibration Release TestsHalf Sine Displacement PulseCracked Static Push Test
September9S l2 110 13.6 0000
Un-cracked Static Push TestGaussian PulseTransient ExcitationCracked Søtic Push Test
September9S t3 110 30 0000
Un-cracked Static Push TestGaussian PulseTransient ExcitationCracked Søtic Push Test
September9S t4 50 13.6 000
0.150.15
0
Cracked Static Push TestGaussian PulseTransient ExcitationGaussian PulseCracked Static Push TestCracked Static Push Test
Table 6.4.1 Experimental Phase Test Program
The following section describes each of the test procedures highlighting key results with
a representative cross section of results presented in Appendix (F). Both cracked and un-
118
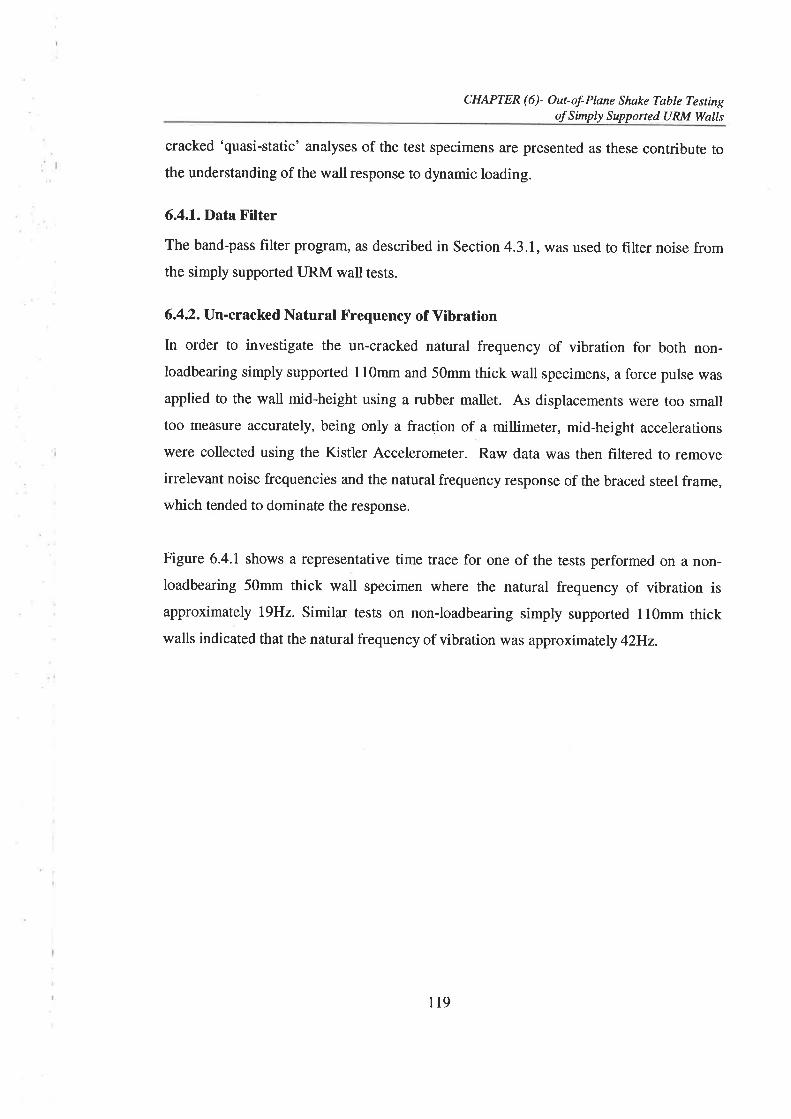
CHAPTER (6)- Out-of-Plane Shake Table Testingof Simply Supported URM WaIIs
cracked 'quasi-static' analyses of the test specimens are presented as these contribute to
the understanding of the wall response to dynamic loading.
6.4.1. Data Filter
The band-pass filter program, as described in Section 4.3.l,was used to filter noise fromthe simply supported tlRM wall tests.
6.42. Un-cracked Natural Frequency of Vibration
In order to investigate the un-cracked natural frequency of vibration for both non-
loadbearing simply supported 11Omm and 50mm thick wall specimens, a force pulse was
applied to the wall mid-height using a rubber mallet. As displacements were too small
too measure accurately, being only a fraction of a millimeter, mid-height accelerations
were collected using the Kistler Accelerometer. Raw data was then filtered to remove
irrelevant noise frequencies and the natural frequencyresponse ofthe braced steel frame,
which tended to dominate the response.
Figure 6.4.1 shows a representative time trace for one of the tests performed on a non-
loadbearing 50mm thick wall specimen where the natural frequency of vibration is
approximately l9Hz. Similar tests on non-loadbearing simply supported ll0mm thickwalls indicated that the natural frequency of vibration was approximately 42H2.
119

CHAPTER (6)- Out-of-Phne Shake Table Testingo1 Simply Supported URM Wølls
LINCRACKED NATIJRAL FREQUENCY - 0MPa OVERBITRDEN 5OmnTHICK WALLFILTERED
ÐF.Edoooo
ñ
0.04
0.03
0.02
0.01
0.00
4.01
4.02
{.03
{.04Tire (Secs)
\T=0-053sI = t8.9llz
T=0.053sI = tï.gllz
T= 0.053wI = tü.gltz
T = 0.05tuæ
Í =L'l'EHz
I
æ
I
T=0.053sf = tE.9l4z
T= 0.053sI = l8.9llz
I=0.054sf = 18.5Ílz
T=0.056sf =l7.EHz
\¿
Figure 6.4.1Un-cracked Nab¡rat Frequency of Vibration 50mm Nonloadbearing \ilall
Unlike the findings of previous researchers (Lam 1995) the elastic natural frequency
appeared to be constant over the exponential decay of the wall's mid-height
displacement. This therefore supports the theory that URM walls in the un-cracked state
behave essentially as an elastically responding material. To further substantiate this a
comparison of the empirically determined un-cracked natural frequency \¡/ith that
predicted analyticaþ by simple elastic beam theory is presented in the following section.
6.4.2.1. Comparßon w¡th Simple Elastic Beatn Theory
From simple beam theory the square of the angular frequency response for a linear
elastic, simply supported beam is given by Equation 6.4.I (Gere & Timonshenco 1990)
âS'
where
,, - oo(E-1.)vr)o = Angular Frequency =2ú,f = Natural FrequencyE-= Elastic Modulusm =Mass = ytT = Material Densityt = Object ThicknessL = Object LengthI = Second Moment of Area =€t1.2
(6.4.1)
120

CHAPTER (6)- Ourof-Plane 5tu1æ Tablc Testingof Simply Supponed URM Walls
Rearranging and substituting into Equation 6.4.2 the natural frequency of an elastic solid
beam can be shown to be:
r t=-71t IT
,l /48v (6.4.2)
Using the experimentally derived E* and y, Equation 6.4.2 predicts the elastic natural
frequency for the 50mm brick wall as,
r
and for 110mm brick wall as,
r
0.05--19l -5"
0.11--ta'1.5'
.4x10e =50H2800)
As these are of the same order as experimentally derived natural frequencies it was
concluded that simple beam theory provides a reasonable prediction of the elastic natural
frequency of vibration for un-cracked simply supported LJRM walls without overburden
force applied.
6.43. Specimen Lateral Capacity Analysis
The predicted lateral acceleration capacity using the 'quasi-static' linear elastic and rigid
body analyses, as described in Chapter 5, are shown in Figure 6.4.2 for l10mm thick
walls and in Figure 6.4.3 for 50mm thick walls. The range of overburden presented is
relevant for Australian masoffy consEuction.
t2t
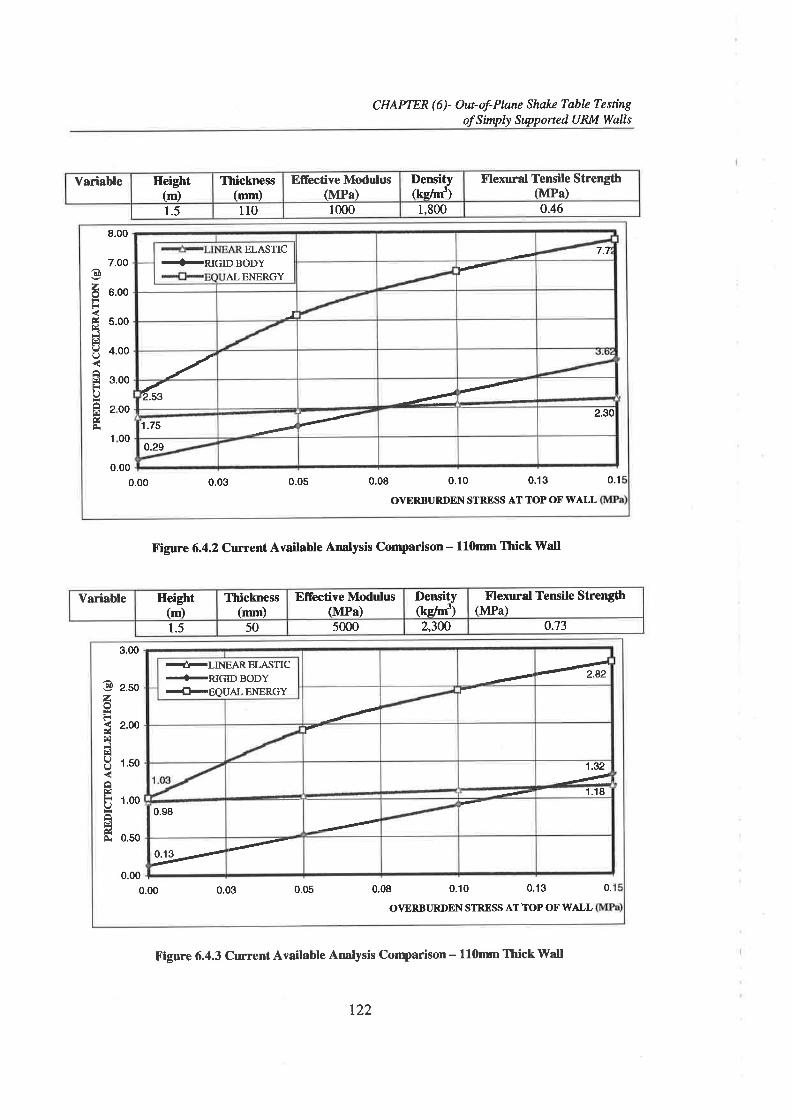
CHAPTER (6)- Out-of-Planc Shoke Tøblc Testingol Simply Supported URM Wolls
Yariable IIeigþt(m)
Thiclsress(mm)
Efiective Modulus(Mpa)
Densityftdm1
Flexural Tensile Strength(Mpa)
1.5 110 1000 1,800 o.46
az¡r&Í¡lFlre(J(.)
ârlbâr¡úÈ
8.00
7.O0
6.00
5.00
4.00
3.00
2 00
1 00
0.000.00 0.03 0.05 0.08 0.10 0.13
OVERBURDEN STRESS AT TOPO['WALL
0.1
ELASTIC+RJGIDBODY
ALENERGY
7.7i
'-
)
-/6 ,.1.75
2.30
0.29
Variable Height(m)
Thickrcss(mm)
Efiective Modutus(MPa)
Deruity(kc/m3)
Flexural Tensile Strength(MPa)
1.5 50 5000 2,300 0.73
Figure 6.4.2 Current Available Analysis Comparison - 110mm Thick l{slt
Figure 6.4.3 Current Available Analysis Conrparison - 110mm Thick VYall
aztiúrlEO
âr¡tiOâriúCr
3.00
2.50
2.OO
1.50
1.00
0.50
0.000.00 0.03 0.05 0.08 0.10 0.'13
OVÐRBTJRDEN STRESS ÀT TOP OF IilALL0.
+|-LINEARELASTIC--_RIGIDBODY#EQUALENERGY
#,¿-
1.32¿aé-
1.18
0.98
1-t-t'
0.13 -rtJ-
r22
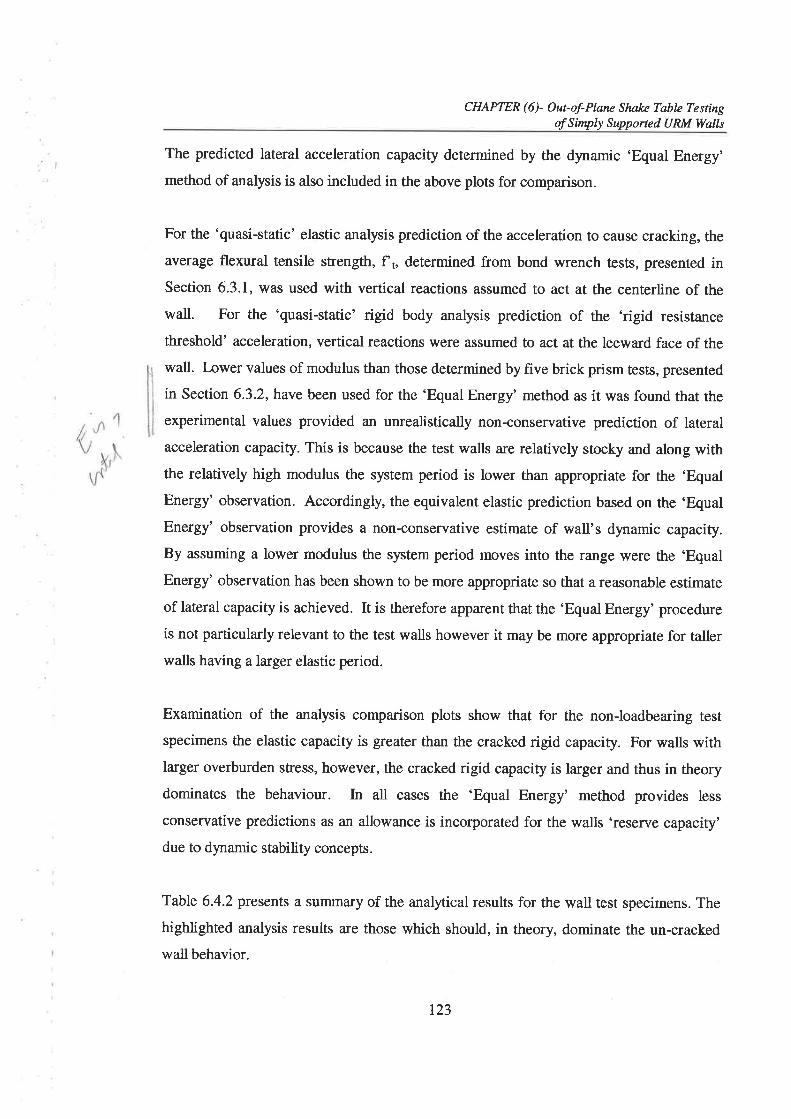
CHAPTER (6)- Out-of-Plane Shake Table Testingof Simply Supported URM Walls
The predicted lateral acceleration capacity determined by the dynamic 'Equal Energy'
method of analysis is also included in the above plots for comparison.
For the 'quasi-static' elastic analysis prediction of the acceleration to cause cracking, the
average flexural tensile strength, fl,, determined from bond wrench tests, presented inSection 6.3.1, was used with vertical reactions assumed to act at the centerline of the
wall. For the 'quasi-static' rigid body analysis prediction of the 'rigid resistance
threshold' acceleration, vertical reactions were assumed to act at the leeward face of the
wall. Lower values of modulus than those determined by five brick prism tests, presented
in Section 6.3.2, have been used for the 'Equal Energy' method as it was found that the
experimental values provided an unrealistically non-conservative prediction of lateral
acceleration capacity. This is because the test walls are relatively stocky and along withthe relatively high modulus the system period is lower than appropriate for the 'Equal
Energy' observation. Accordingly, the equivalent elastic prediction based on the 'EqualEnergy' observation provides a non-conservative estimate of wall's dynamic capacity.
By assuming a lower modulus the system period moves into the range were the 'EqualEnergy' observation has been shown to be more appropriate so that a reasonable estimate
of lateral capacity is achieved. It is therefore apparent that the 'Equal Energy' procedure
is not particularly relevant to the test walls however it may be more appropriate for tallerwalls havin g a lar ger elastic period.
Examination of the analysis comparison plots show that for the non-loadbearing test
specimens the elastic capacity is greater than the cracked rigid capacity. For walls withlarger overburden sftess, however, the cracked rigid capacity is larger and thus in theory
dominates the behaviour. In all cases the 'Equal Energy' method provides less
conservative predictions as an allowance is incorporated for the walls 'reserye capacity'
due to dynamic stability concepts.
Table 6.4.2 presents a summary of the analytical results for the wall test specimens. The
highlighted analysis results are those which should, in theory, dominate the un-cracked
wall behavior.
123
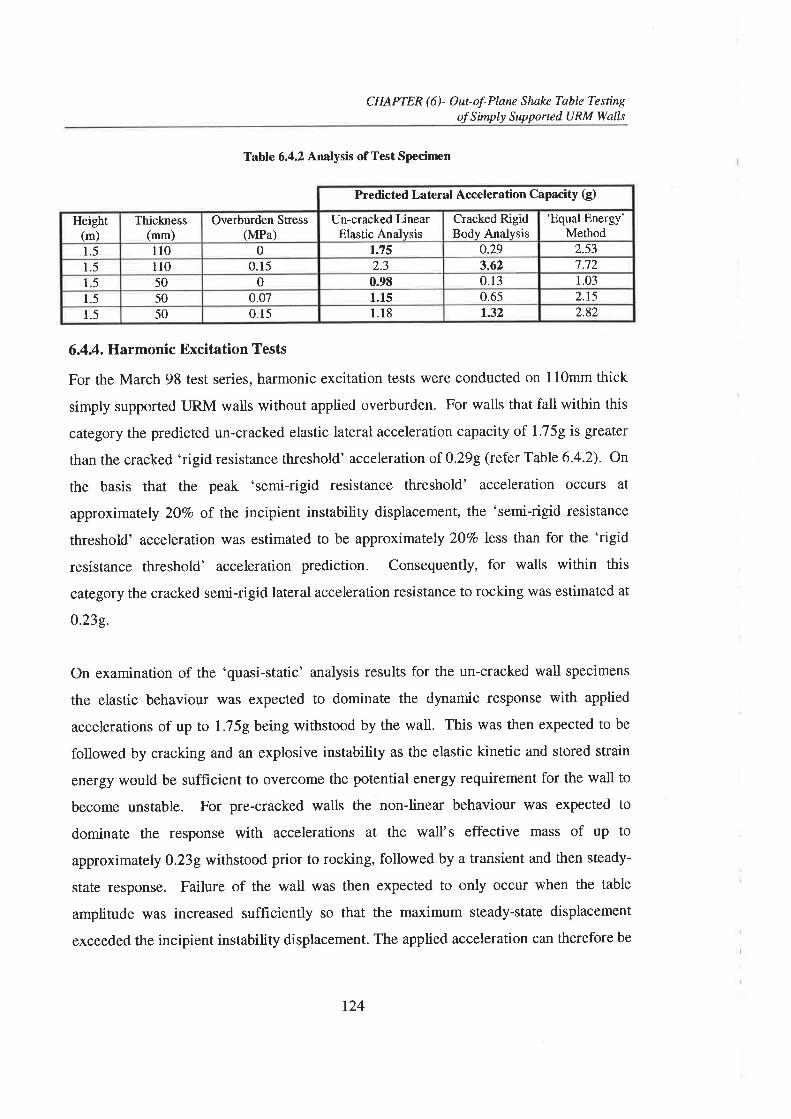
CHAPTER (6)- Out-ol-Plane Shake Table Testíngof Simply Supported URM Walls
Predicted Lateral Acceleration Capacity (g)
Height(m)
Thickness(mm)
Overburden Stress(MPa)
Un-cracked LinearElastic Analysis
Cracked RigidBody Analysis
'Equal Energy'Method
1.5 110 0 1.75 o.29 2.53
1.5 110 0.15 2.3 3.62 7.721.5 50 0 0.9E 0.13 1.03
1.5 50 0.07 1.ls 0.65 2.15
1.5 50 0.15 1.18 1.32 2.82
Table 6.4.2 Analysis of Test Specirnen
6.4.4. Harmonic Excitation Tests
For the March 98 test series, harmonic excitation tests were conducted on 110mm thick
simply supported URM walls without applied overburden. For walls that fall within this
category the predicted un-cracked elastic lateral acceleration capacity of 1.75g is greater
than the cracked 'rigid resistance threshold' acceleration of 0.29g (refer Table 6.4.2). On
the basis that the peak 'semi-rigid resistance threshold' acceleration occurs at
approximately 2OVo of the incipient instability displacement, the 'semi-rigid resistance
threshold' acceleration was estimated to be approximately 207o kess than for the 'rigid
resistance th¡eshold' acceleration prediction. Consequently, for walls within this
category the cracked semi-rigid lateral acceleration resistance to rocking was estimated at
0.239.
On examination of the 'quasi-static' analysis results for the un-cracked wall specimens
the elastic behaviour was expected to dominate the dynamic response with applied
accelerations of up to 1.75g being withstood by the wall. This was then expected to be
followed by cracking and an explosive instability as the elastic kinetic and stored strain
energy would be sufficient to overcome the potential energy requirement for the wall to
become unstable. For pre-cracked walls the non-linear behaviour was expected to
dominate the response with accelerations at the wall's effective mass of up to
approximately 0.239 withstood prior to rocking, followed by a transient and then steady-
state response. Failure of the wall was then expected to only occur when the table
amplitude was increased sufficiently so that the maximum steady-state displacement
exceeded the incipient instability displacement. The applied acceleration can therefore be
t24
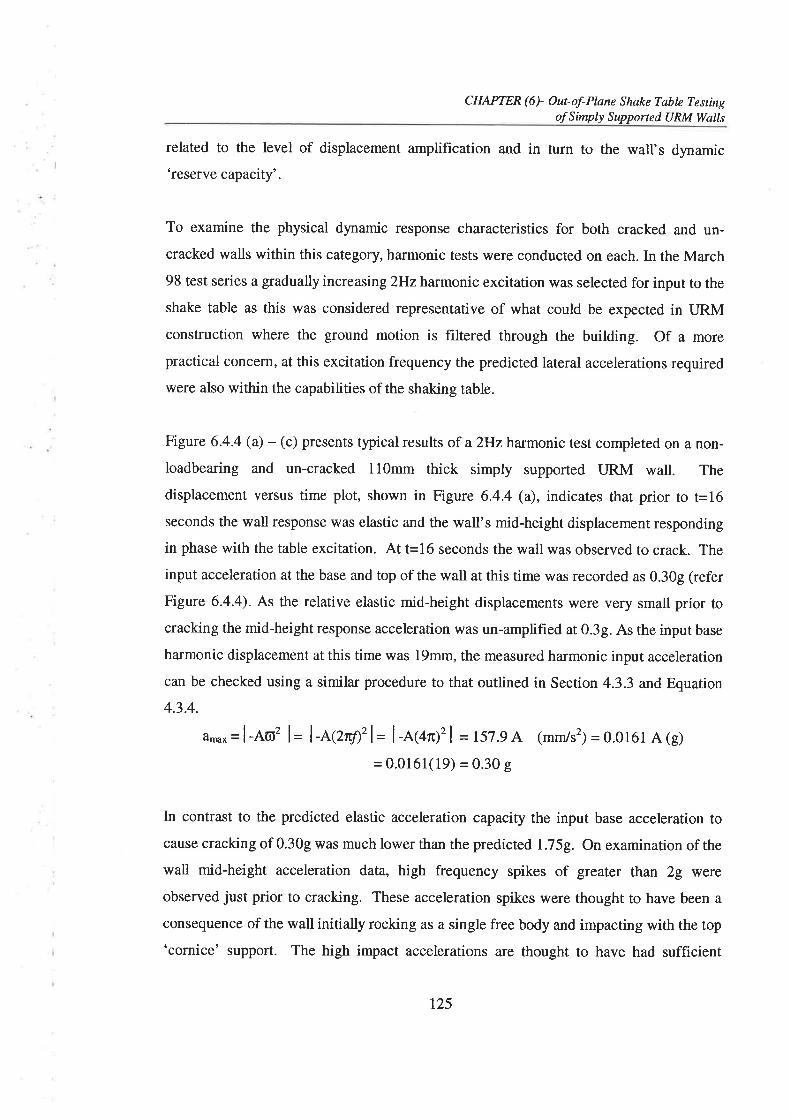
CHAPTER (6)- Out-of-Plane Shake Table Testingof Simply Supported URM Walls
related to the level of displacement amplification and in turn to the wall's dynamic'reserve capacity'.
To examine the physical dynamic response characteristics for both cracked and un-
cracked walls within this category, harmonic tests were conducted on each. In the March98 test series a gradually increasing 2Hzharmonic excitation was selected for input to the
shake table as this was considered representative of what could be expected in URMconstruction where the ground motion is filtered through the building. Of a more
practical concern, at this excitation frequency the predicted lateral accelerations required
were also within the capabilities of the shaking table.
Figure 6.4.4 (a) - (c) presents typical results of a 2Hz harmonic test completed on a non-
loadbearing and un-cracked 110mm thick simply supported URM wall. The
displacement versus time plot, shown in Figure 6.4.4 (a), indicates that prior to t=16
seconds the wall response was elastic and the wall's mid-height displacement responding
in phase with the table excitation. At t=16 seconds the wall was observed to crack. The
input acceleration at the base and top of the wall at this time was recorded as 0.309 (refer
Figure 6.4.4). As the relative elastic mid-height displacements were very small prior to
cracking the mid-height response acceleration was un-amplified at 0.3g. As the input base
ha¡monic displacement at this time was 19mm, the measured harmonic input acceleration
can be checked using a similar procedure to that outlined in Section 4.3.3 and Equation
4.3.4.
ânnx = l-eo' l= l-¡rerrn'l= l-n(+n)21 = ß7.9 A qmm/s2) = 0.0161 A (g)
= 0.0161(19) = 0.30 g
In contrast to the predicted elastic acceleration capacity the input base acceleration to
cause cracking of 0.309 was much lower than the predicted 1.7 59. On examination of the
wall mid-height acceleration data, high frequency spikes of greater than 29 were
observed just prior to cracking. These acceleration spikes were thought to have been a
consequence of the wall initially rocking as a single free body and impacting with the top
'cornice' support. The high impact accelerations are thought to have had sufficient
125
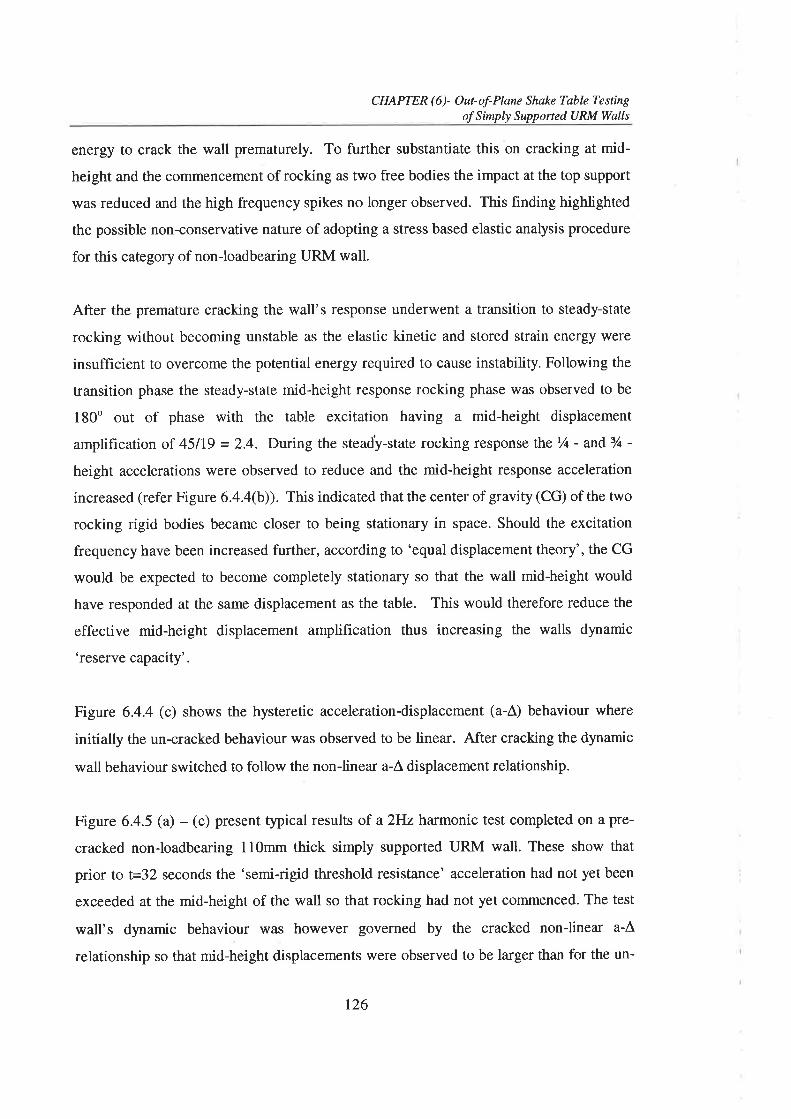
CHAPTER (6)- Out-ol-Plane Shqke Table Testingof Simply Supported URM Walls
energy to crack the wall prematurely. To further substantiate this on cracking at mid-
height and the commencement of rocking as two free bodies the impact at the top support
was reduced and the high frequency spikes no longer observed. This finding highlighted
the possible non-conservative nature of adopting a stress based elastic analysis procedure
for this category of non-loadbearing URM wall.
After the premature cracking the wall's response underwent a transition to steady-state
rocking without becoming unstable as the elastic kinetic and stored strain energy were
insufficient to overcome the potential energy required to cause instability. Following the
transition phase the steady-state mid-height response rocking phase was observed to be
180o out of phase with the table excitation having a mid-height displacement
amplification of 45119 = 2.4. During the steady-state rocking response fhe Vt - and 3/c -
height accelerations were observed to reduce and the mid-height response acceleration
increased (refer Figure 6.4.4(b)). This indicated that the center of gravity (CG) of the two
rocking rigid bodies became closer to being stationary in space. Should the excitation
frequency have been increased further, according to 'equal displacement theory', the CG
would be expected to become completely stationary so that the wall mid-height would
have responded at the same displacement as the table. This would therefore reduce the
effective mid-height displacement amplification thus increasing the walls dynamic
'reserve capacity'.
Figure 6.4.4 (c) shows the hysteretic acceleration-displacement (a-A) behaviour where
initially the un-cracked behaviour was observed to be linear. After cracking the dynamic
wall behaviour switched to follow the non-linear a-À displacement relationship.
Figure 6.a.5 @) - (c) present typical results of a ZHz harmonic test completed on a pre-
cracked non-loadbearing 110mm thick simply supported URM wall. These show that
prior to t=32 seconds the 'semi-rigid threshold resistance' acceleration had not yet been
exceeded at the mid-height of the wall so that rocking had not yet commenced. The test
wall's dynamic behaviour was however governed by the cracked non-linear a-Â
relationship so that mid-height displacements were observed to be larger than for the un-
126
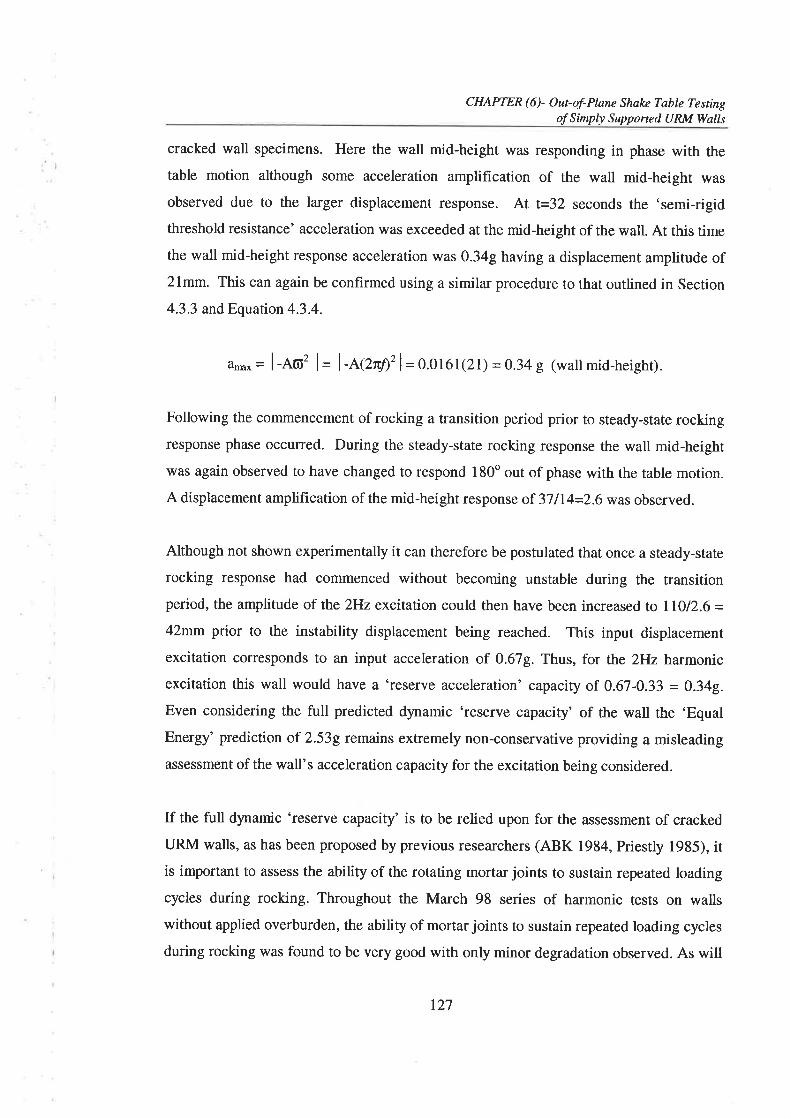
CHAPTER (61 Outof-Plane Shake Table Testingof Simply Supported URM Walls
cracked wall specimens. Here the wall mid-height was responding in phase with the
table motion although some acceleration amplification of the wall mid-height was
observed due to the larger displacement response. At t=32 seconds the 'semi-rigidthreshold resistance' acceleration was exceeded at the mid-height of the wall. At this time
the wall mid-height response acceleration was 0.349 having a displacement amplitude of2lmm. This can again be confirmed using a similar procedure to that outlined in Section
4.3.3 and Equation 4.3.4.
irnnx = l-Ro' l= l-lçzrq¡21= 0.0161 (21) =0.34 g (wall mid-height).
Following the commencement of rocking a transition period prior to steady-state rockingresponse phase occurred. During the steady-state rocking response the wall mid-height
was again observed to have changed to respond 180o out of phase with the table motion.
A displacement amplification of the mid-height respons e of 37114=2.6 was observed.
Although not shown experimentally it can therefore be postulated that once a steady-state
rocking response had commenced without becoming unstable during the t¡ansitionperiod, the amplitude of the 2Hz excitation could then have been increased to ll}12.6 =42mm prior to the instability displacement being reached. This input displacement
excitation corresponds to an input acceleration of 0.679. Thus, for the 2Hz harmonic
excitation this wall would have a 'reserve acceleration' capacity of 0.67-0.33 = 0.34g.Even considering the full predicted dynamic 'reserve capacity' of the wall the 'Equal
Energy' prediction of 2.539 remains extremely non-conservative providing a misleading
assessment of the wall's acceleration capacity for the excitation being considered.
If the full dynamic 'reserve capacity' is to be relied upon for the assessment of cracked
URM walls, as has been proposed by previous researchers (ABK 1984, Priestly 1985), itis important to assess the ability of the rotating mortar joints to sustain repeated loading
cycles during rocking. Throughout the March 98 series of harmonic tests on walls
without applied overburden, the ability of mortar joints to sustain repeated loading cycles
during rocking was found to be very good with only minor degradation observed. As will
127
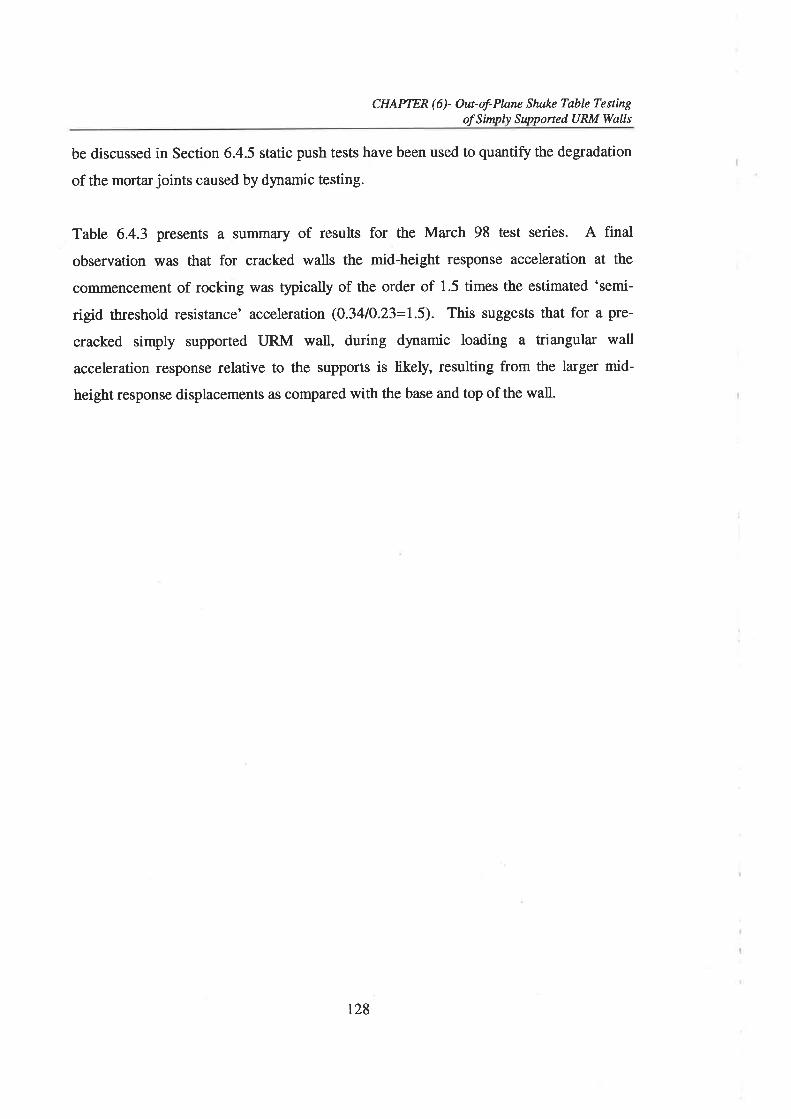
CHAPTER (6)- Out-of-Plane Shake Table Testingof S i¡nplv Swp orted U RM Walls
be discussed in Section 6.4.5 static push tests have been used to quantify the degradation
of the mortar joints caused by dynamic testing.
Table 6.4.3 presents a summary of results for the March 98 test series. A final
observation was that for cracked walls the mid-height response acceleration at the
coilrmencement of rocking w¿rs typically of the order of 1.5 times the estimated 'semi-
rigid threshold resistance' acceleration (0.341O.23=1.5). This suggests that for a pre-
cracked simpty supported IJRM wall, during dynamic loading a triangular wall
acceleration response relative to the supports is likely, resulting from the larger mid-
height response displacements as compared with the base and top of the wall.
t28
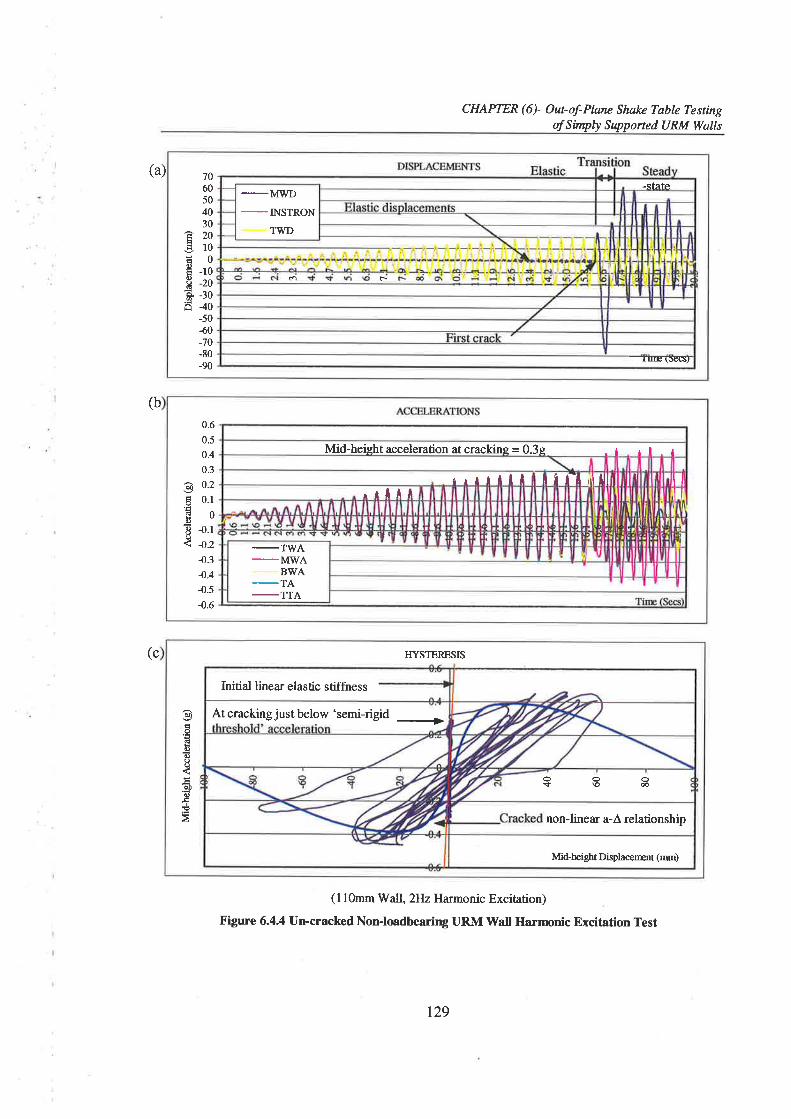
CHAPTER (6)- Out-of-Plan¿ Shak¿ Table Testingof Simply Supponed URM Walls
-stâfe
-INSTRONTWD
o r
rllls(wsr
7060504030
420ëroË0Ê -roË -zoÊ -30i5 ¡o
-50{0-70-80-90
(b
(a)
(c
(l l0mm Wall, 2Hz Ha¡monic Excitation)
Figure 6.4.4 Urrcracked Non-loadbearing URM Wall Harmonic E¡citation Test
0.6
0.5
0.4
0.3
o 0.2
t 0.1.EEOoE ¡.ro< 4.2
4.3444.5{.6
Mid-heieht acceleration at crackinq = 0.3s .t rl I
¡'rllll I t l-t ll lll il.rllI U
-TT/ABWA
-TA-TTA
Initial linea¡ elastic stiffness
At cracking just below 'semi-rigid +
ooô*\oæ
non-linear a-Â relationship
Mid-beigbt Dþlacernt (rnm)
d)
o'Édoooo
Ðo¡¿à
TIYSTERESIS
r29
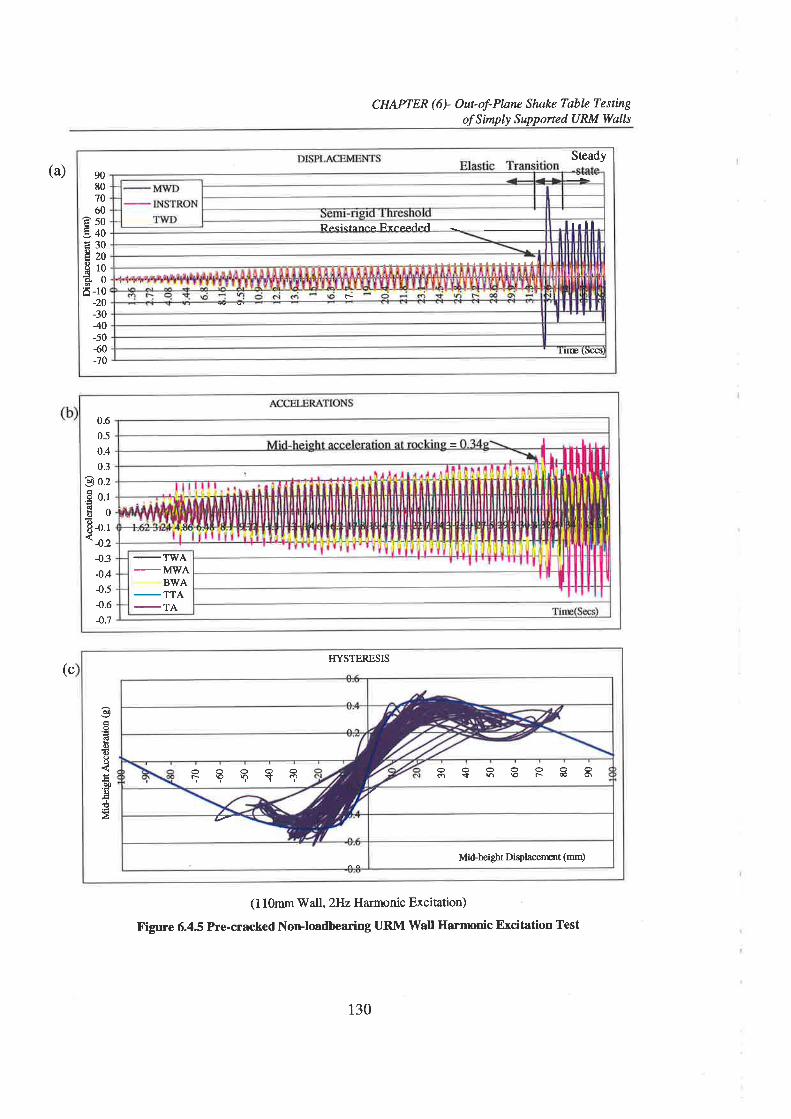
CHAPTER (6)- Ouçof-Pløne Shake Table Tesrtngof Simply SupportedURM Wqlls
(a)Sæady
90807060
450E¿oË30ËzoHroã.0i5-10
_20
-3040-5060_70
I ¡ llResistance F-xce¡¡led
r
r urÉ \ùecs,
-TWABWA
-TIA-TA
0.6
0.5
0.40.3
0.2
0.1
0{.14.24.34.4{.5{.ó4.7
6
oão
(c
(1 l0mm Wall, 2Hz Harmonic Excitation)
Figure 6.4,5 Pre-cracked Norrloadbearing URM \{all Harmonic Excitation Test
ooooooootn\orooo\ooooor91T17
Mid-beight Displacenent (mm)
d)
ôdooao
¡Ðô¿à
ITYSTERESIS
130
CHAPTER (6)- Out-of-Plan¿ Shakc Table Testingof Simply Supponed URM Wølls
\ilallNo
WallCondition
Predicûed 'Quasi-Static'AccelerationCapacity(Refer Table 6.4.2)
ExperinrcntalResults
Comrrcnt
Un-cracked 1.759 A=20mm (O.32e)(032e)
50t2È2.5
Table input at crackinghockingMid-height acceleration response atcrackinglrocking (no amplification)- High frequency spike (l2Hz) >2g prior tocrackingSteady-state response displacementamplifrcation
I Cracked 0.29e (Rigid)0.23g (Semi-rigid)
A=l5mm (0.2ag)A=2lmm(03ae)
4Ol16=2.5
Table input atrockingMid-height response at rocking- No high frequency spikes observedSteady-state response displacementamplification
) Un-cracked 1.75g A=l6mm (O.Z6e)(o.2ee)
Table input at cracking/rockingMid-height acceleration response atcracking/rocking (small amplifrcation)- High frequency spike (lzHz) >2g prior tocracking- Some elastic acceleration amplification- Wall became unstable immediately aftercracking (no steady-state response)
2 Cracked(refer Figure6.4.s)
0.299 (Risid)0.239 (Semi-rigid)
A=l5mm (O.Ue)A=2lmm (0.3ae)
37114=2.6
Table input at rockingMid-height response at rocking- No high frequency spikes observedSûeady-state response displacementamplification
3 Cracked 0.299 (Rigid)0.23g (Semi-rigid)
A=16mm (0.26e)A=22mm(0.35g)
Table input at rockingMid-height response at rocking- No high frequency spikes obsewedMorta¡ drop out prevented steady-stateresponse from occurring
4 Un-cracked(refer Figure6.4.4)
1.75g A=l9mm (0.30g)(0.30e)
45119=2.4
Table input at cracking/rockingMid-height acceleration response atcracking/rocking (no amplification)- High frequency spike (l2Hz) >2g prior tocrackingSteady-stat€ response displacementamplifrcation
4 Cracked 0.299 (Rigid)0.239 (Semi-rigid)
A=13mm (O.zle)A=19mm (0.30g)
35113=2.7
Table input at rockingMid-height response at rocking- No high frequency spikes observedSæady-state response displacementamplification
Table ó.4.3 llùnm Wall, Non-Iædbearing - Ilarnronic Excitation Test Results
l3t

CHAPTER (6)- Out-of-Plane Shake Table Testingof Simply Supported URM Walls
For the June 98 test series, harmonic excitation tests were conducted on 110 mm thick
simply supported URM walls with 0.15 MPa applied overburden using the spring
overburden rig shown in Figure 6.2.5. As described in Section 6.2.2 for mid-height
displacements greater than approximately 2OVo of the wall thickness the additional static
spring deflection caused an unacceptable increase in overburden force at the top of the
wall. Results were therefore only valid for mid-height displacements less than 2OTo of
the wall thickness. For walls within this category the predicted un-cracked elastic lateral
acceleration capacity of 2.3g is less than the cracked 'rigid resistance threshold'
acceleration of 3.629 (refer Table 6.4.2). Estimates of the 'semi-rigid resistance
threshold' acceleration were approximately 20Vo less than for the rigid case where the
resistance to rocking was estimated to be2.9 g.
Accordingly, even for the un-cracked wall the non-linear cracked wall behaviour was
expected to dominate the dynamic response with cracking of the wall not expected to
have significant impact on the dynamic behaviour. Hence, initially elastic behaviour
was expected up to applied accelerations of 2.3 g followed by cracking with a slight
increase in the wall mid-height displacement response. An increase in applied
accelerations up to 2.9 g at the mid-height of the wall was then expected to be applied
prior to a transient then steady-state rocking response. As per the previously described
March 98 cracked wall response, failure was then expected to only occur when the table
amplitude was increased sufficiently so that the maximum steady-state displacement
exceeded the instabitity displacement. This would therefore again be related to the
displacement amplification and in turn to the wall's dynamic 'reSeIVe capacity'.
Thus, to examine the physical dynamic response characteristics of both cracked and un-
cracked walls within this category, harmonic tests were conducted on each wall
specimen. Much higher inertia forces were required for this test series so 7Hz to 10Hz
harmonic table excitations were selected. These were still considered to be representative
of what could be expected in URM construction due to ground motion. However, since
these frequencies were close to the resonant frequency of the braced steel frame some
amplification of the base excitation was observed at the top support.
t32

CHAPTER (6)- Out-of-Plane Shake Table Testingof Simply Supported URM Walls
Figure 6.4.6 (a) - (c) present typical results for aTHz harmonic test of an un{racked 110
mm thick simply supported URM wall. The displacement versus time plot shown inFigure 6.4.6 (a) indicates that prior to t=4.4 seconds the wall response was elastic and the
mid-height response and table excitation were in phase. At t=4.4 seconds the wall was
observed to crack with displacements increasing slightly. However, the mid-height
response and table excitation remained in phase (refer Figure 6.4.7) indicating that
rocking had not yet commenced. The average input acceleration at the time was recorded
as 1.8 g with the mid-height wall acceleration being 2.I g (refer Figure 6.4.6 (b)). Since
the input harmonic displacement at this time was 9mm this can again be confirmed using
a similar procedure to that outlined in Section 4.3.3 and Equation 4.3.4.
âmax = l-Ro' l= l-4zrç¡'l= l-n(t+n)'l = rg34.4 A (mm/s2) = 0.197 A (g)
= 0.197(9) = 1.8 g
Following cracking the 7Hz-table excitation amphtude was further increased until at
t=19.45 seconds the 'semi-rigid threshold resistance' acceleration was exceeded at the
mid-height of the wall. At this time the wall mid-height response acceleration was 4.3g
having displacement amplitude of 22 mm. This can again be checked by the following
calculation,
Írnnx = l-Ro' l= l-1r2nn2l=0.197(22) = 4.3g (wall mid-height).
Following the commencement of rocking a transition period prior to steady-state rocking
response phase occurred. During the steady-state rocking response the wall mid-height
was again observed to have changed to respond 180o out of phase with the table motion.
A displacement amplification of the mid-height response of 2519=2.77 was observed
(refer Figure 6.4.8).
r33
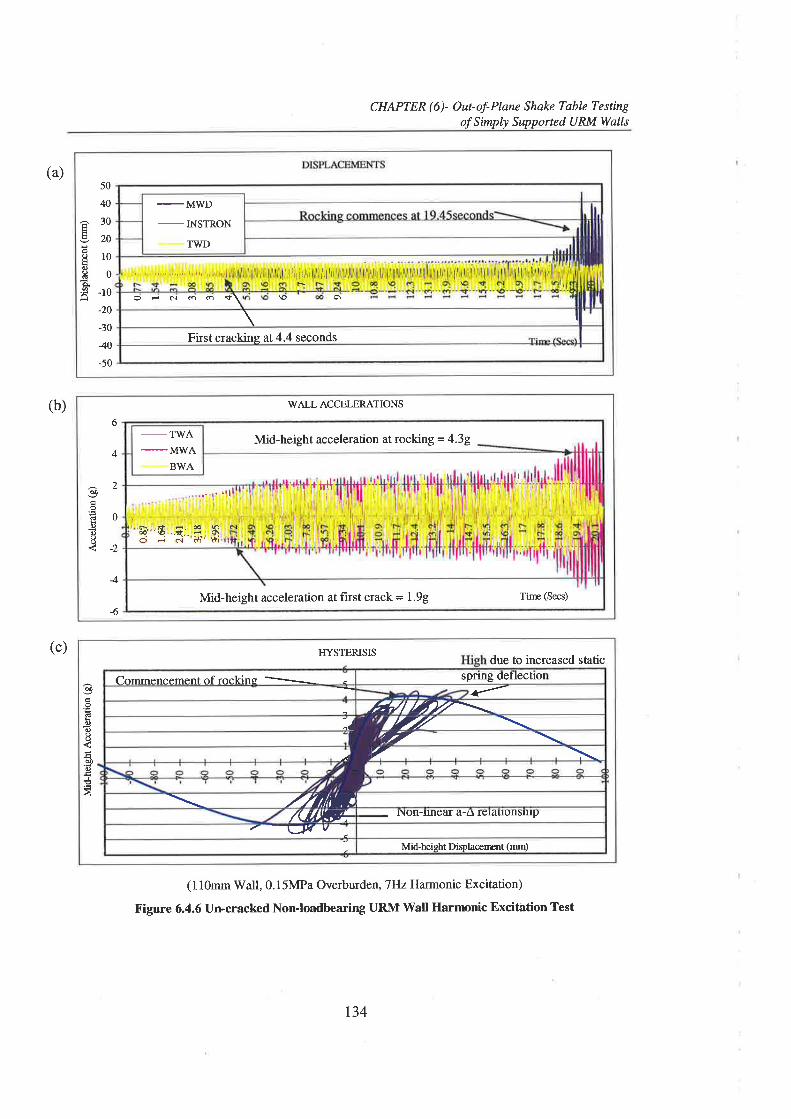
CHAPTER (6)- Out-of-Plane Shqke Table Testingof Simply Supponed URM Walls
-INSTRONTIVD
ojôioo*\
.,"r ',' 1""" ' l't" r" ll',1 lii¡ti¡ll'ì,lliro\\o
First cracking at 4.4 seconds
50
40
â30g20910o!0À.F -loH
:20
-30
40-50
(a)
(b)
(c) HYSTERISISdue to increased static
ôo
É'Ëdooao
doE¿¿
spnng deflechorcommencementof rockins
-
{.H//5V/'\-7rz"¿ -77
,anilnNon-[neaf a-a fera[onsnrPANAæ--WvMid-height Displacerent (mm)
(110mm V/all, 0.15MPa Overburden, 7Hz Harmonic Excitation)
Figure 6.4.6 Un-cracked NonJoadbearing URMWatl Harmonic Excitation Test
WALL ACCELERATIONS
6
4
.,d)
€ooooo
4
4
Mid-height acceleration at rocking = 4.3g-TWA
BWA
rÉ;l Éhoô''\0 rç É ó\d ..i ñ'pl? ,&;
Ti{r' I ¡ |
Mid-height acceleration at fust crack = 1.99 Tine (Secs)
t34
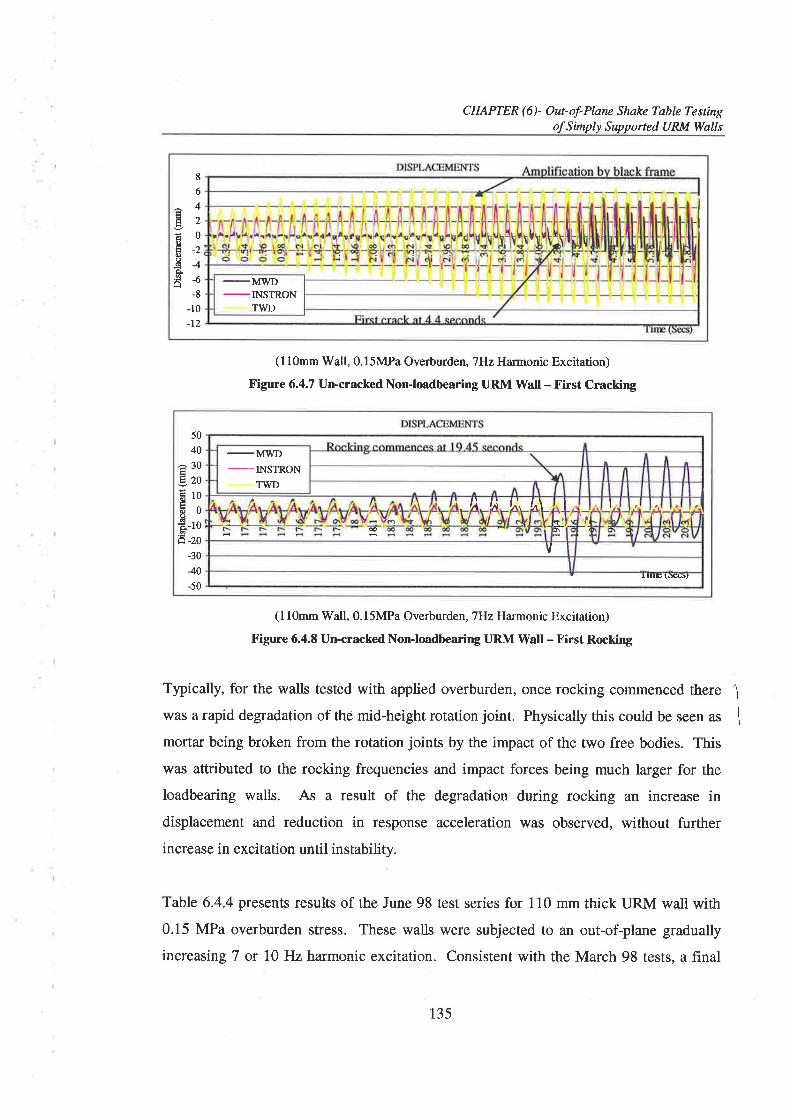
CHAPTER (61 Ourof-Pl"ane Shake Table Testingof Simply Supported URM Walls
-INSTRONTWD
8
6
4la
Ë0Iro-Ë4À¡5 -o
-8-10
-12
(l10mm Wall, 0.l5MPa Overburden, 7Hz Harmonic Excitation)
Figure 6.4.7 Un-cracked NonJoadbearing URM Wall - First Cracking
(l lOmm ÌWall, O.lSMPa Overburden, 7Hz Harmonic Excitation)
Figure 6.4.8 Un-cracked NonJoadbearing URM Wall - First Rocking
Typically, for the walls tested with applied overburden, once rocking commenced there
was a rapid degadation of the mid-height rotation joint. Physically this could be seen as
mortar being broken from the rotation joints by the impact of the two free bodies. This
was attributed to the rocking frequencies and impact forces being much larger for the
loadbearing walls. As a result of the degradation during rocking an increase indisplacement and reduction in response acceleration was observed, without further
increase in excitation until instability.
Table 6.4.4 presents results of the June 98 test series for 110 mm thick IJRM wall with
0.15 MPa overburden stress. These walls were subjected to an out-of-plane gradually
increasing 7 or 10 Hz harmonic excitation. Consistent with the March 98 tests, a final
-MWD-INSTRONTWT)
A '; f, t^\ I I
æ+l¡ I'l'
-1
V
r rnË \ùcct,
50
40
a30E820F10xõ0oÈ-r0â-zo
-30
40-50
135
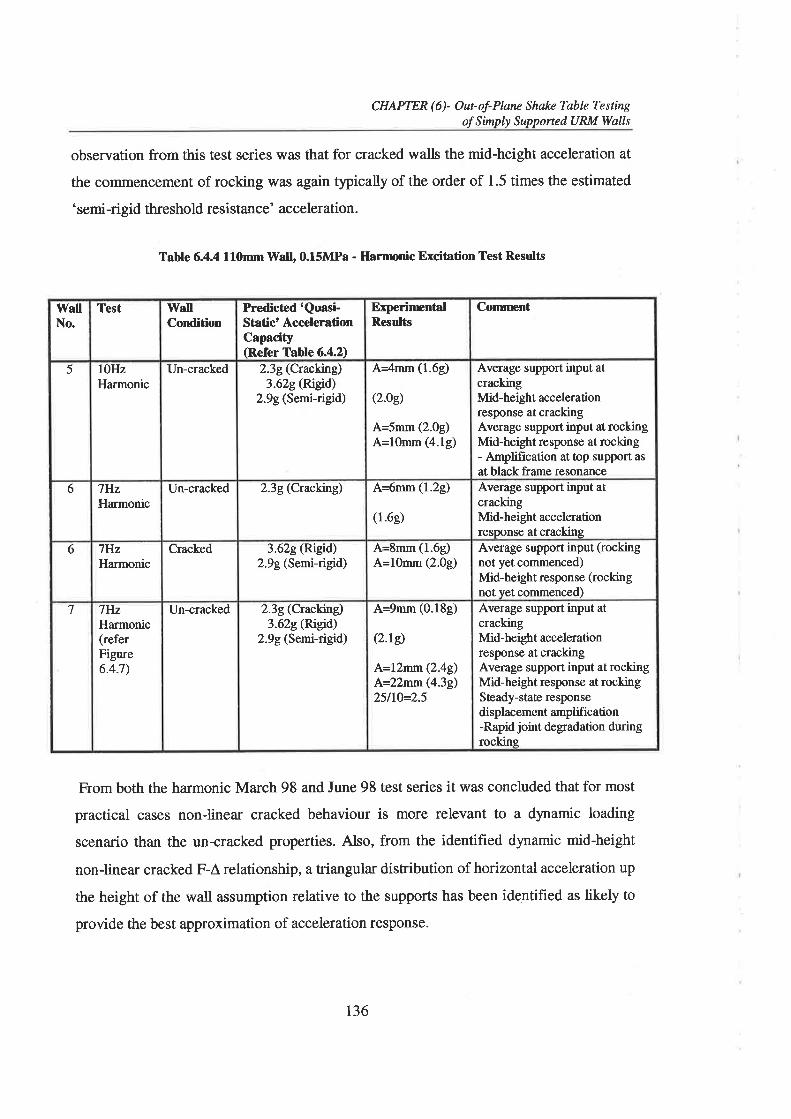
CHAPTER (6)- Out-oÍ-Plnn¿ Shake Table TestingofSimply Supponed URM Walls
observation from this test series was that for cracked walls the mid-height acceleration at
the commencement of rocking was again typically of the order of 1.5 times the estimated
'semi-rigid threshold resistance' acceleration.
Table 6.4.4 ll0mm WaIl, 0.15MPa - Ilarnnnic Excitation Test Results
From both the harmonic March 98 and June 98 test series it was concluded that for most
practical cases non-linea¡ cracked behaviour is more relevant to a dynamic loading
scenario than the un-cracked properties. Also, from the identified dynamic mid-height
non-linear cracked F-A relationship, a fiiangular distribution of horizontal acceleration up
the height of the wall assumption relative to the supports has been identif,red as likely to
provide the best approximation of acceleration response.
WaIlNo
Test WallCondition
Predictcd 'Quasi-Static' AccelerationCa¡ncity(Refer Table 6.4.2)
ExperirrcntalResults
Cornrnent
5 IOHzHarmonic
Un-cracked 2.3g (Cracking)3.62e (Rieid)
2.9g (Semi-rigid)
A4mm (1.69)
(2.0e)
A=5mm (2.0g)A=10mm (4.1g)
Average support input atcrackingMid-height accelerationresponse at crackingAverage support input at rockingMid-height response at rocking- Amplification at top support asat black frame resonance
6 7HzHarmonic
Un-cracked 2.3g (Cracking) A=6mm (1.2g)
(1.6e)
Average support input atcrackingMid-height accelerationresponse at cracking
6 7HzHarmonic
Cracked 3.62e (Rigid)2.9g (Semi-rigid)
A=8mm(1.6g)A=10mm (2.0g)
Average support input (rockingnot yetcommenced)Mid-height response (rockingnot yet commenced)
7 7HzHarmonic(referFigure6.4.7)
Un-cracked 2.3g (Cracking)3.62g (Rieid)
2.9g (Semi-rigid)
A=9mm (0.18g)
(2.re)
A=I2mm(2.4g)A=22nm(4.39)25llO=2.5
Average support input atcrackingMid-height accelerationresponse at crackingAverage support input at rockingMid-height response at rockingSæady-state responsedisplacement amplification-Rapid joint degradation duringrockinq
136
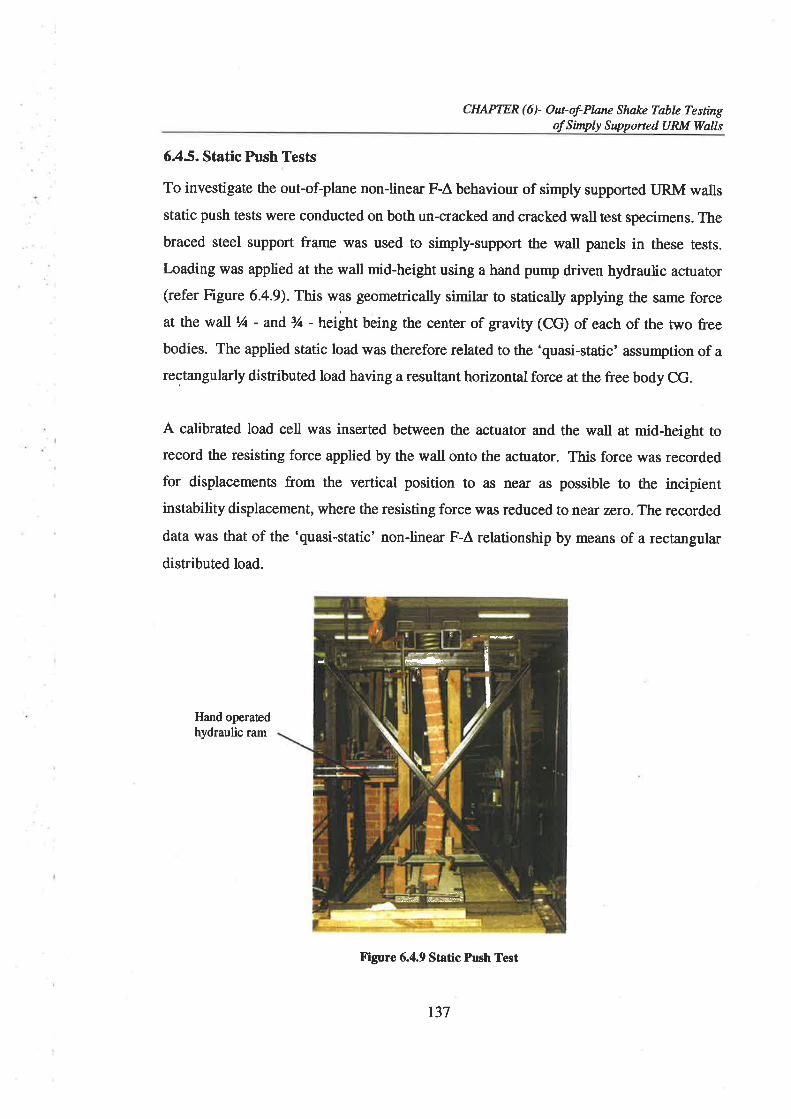
CHAPTER (6)- Out-of-Planz Shalæ Tablc TestingofS inply Supporîed U RM Walls
6.45. Static Push Tests
To investigate the out-of-plane non-linear F-Â behaviour of simply supported URM walls
static push tests were conducted on both un-cracked and cracked wall test specimens. The
braced steel support frame was used to simply-support the wall panels in these tests.
Ioading was applied at the wall mid-height using a hand pump driven hydraulic actuator(refer Figure 6.4.9). This was geometrically similar to statically apptyrng the same force
at the wall r/t - and t/¿ - height being the center of gravity (CG) of each of the two free
bodies. The applied static load was therefore related to the 'quasi-static' assumption of arectangularly distributed load having a resultant horizontal force at the free body CG.
A calibrated load cell was inserted between the actuator and the wall at mid-height to
record the resisting force applied by the wall onto the actuator. This force was recorded
for displacements from the vertical position to as near as possible to the incipientinstability displacement, where the resisting force was reduced to near zero. The recorded
data was that of the 'quasi-static' non-linear F-Â relationship by means of a rectangular
distributed load.
Hand operaædhydraulic ram
Figure 6.4.9 Static Push Test
Iilr¡*
Í--
137
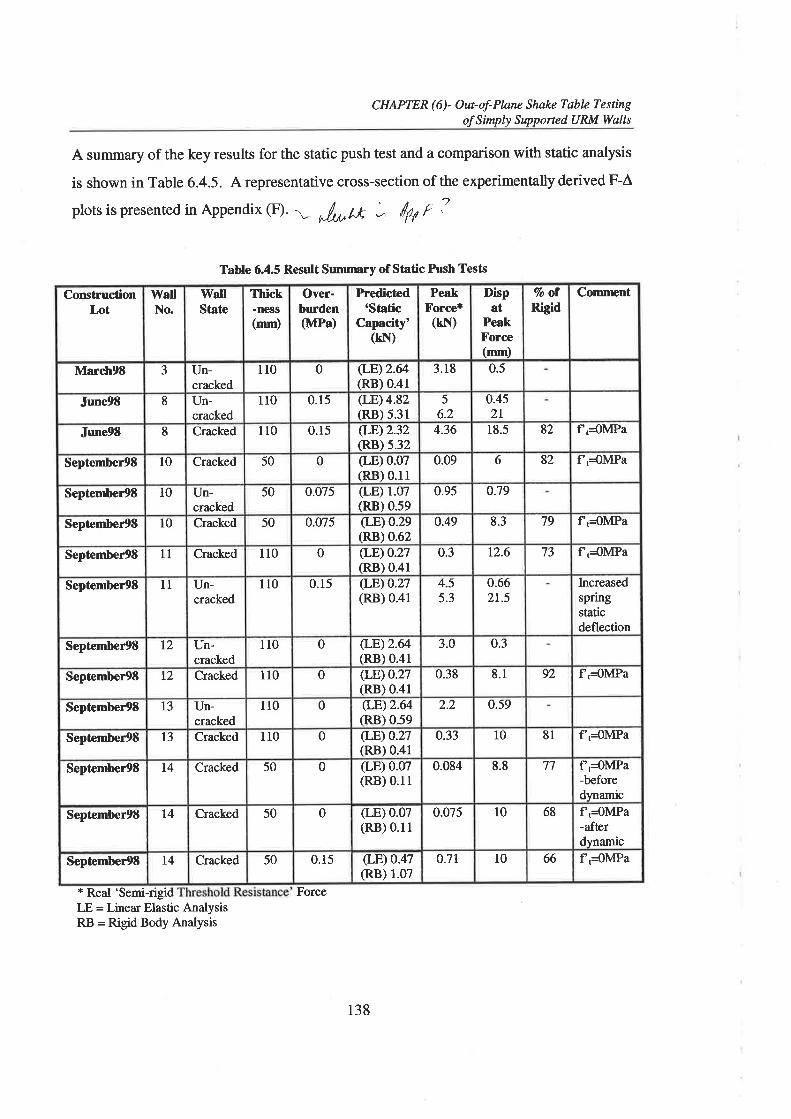
CHAPTER (6)- Outof-Plane Shal<e Table TestingofSimply Supported URM Wqlls
A summary of the key results for the static push test and a comparison with static analysis
is shown in Table 6.4.5. Arepresentative cross-section of the experimentally derived F-A
plots is presented in Appendix (Ð. r- ^/rrt^t -
/f,f F i'
* Real 'Semi-rigrdr F = Linear Elastic AnalysisRB = Rigid Body Analysis
Table 6.4.5 Resr¡lt Sumrmry of Static Push Tests
Force
ConstructionLot
WaIlNo.
WallState
Thick-ness(mm)
Over-burden(MPa)
Predicted'Static
Capacity'(kN)
PeakForce*(kN)
Dispat
PeakForce(mm)
Vo o1Rigid
Conr¡rænt
March93 3 Un-cracked
110 0 (r-B)2.@(Pß) 0.41
3.18 0.5
June98 8 Un-cracked
110 0.15 (rÆ) 4.82(RB) 5.31
56.2
0.452I
June98 8 Cracked 110 0.15 ( F)2.32(RB) 5.32
4.36 18.5 82 f .{MPa
September9S 10 Cracked 50 0 (LE) 0.07ßB) 0.r1
0.09 6 82 f ,{MPa
September9S 10 Un-cracked
50 0.075 (LE) 1.07(Rß) 0.59
0.95 0.79
September9S 10 Cracked 50 0.075 (rÆ) 0.2e(RB) 0.62
o.49 8.3 79 fd)MPa
September9S 1l Cracked 110 0 .rl-ÐO.N(RB) 0.41
0.3 12.6 73 fl,{MPa
September9S l1 Un-cracked
110 0.15 (tÐo.n(RB) 0.41
4.55.3
0.6621.5
Increasedspringstaticdeflection
Sepûembcr98 12 Un-cracked
110 0 .o-Ð2.8ßB) 0.41
3.0 0.3
September9S 12 Cracked 110 0 (LE)O.n(RB) 0.41
0.38 8.1 92 f ,=OMPa
September9S T3 Un-cracked
110 0 (rß)2.64ß.8) 0.59
2.2 0.59
Sepûember98 13 Cracked 110 0 (LF.)0.27(RB) 0.41
0.33 10 81 f ,{MPa
September9S t4 Cracked 50 0 (LE) 0.07(RB) 0.11
0.084 8.8 77 f,=0MPa-beforedynamic
September9E T4 Cracked 50 0 (r-E) 0.07(RB) 0.11
0.075 10 68 f,=0MPa-afærdynamic
September9S t4 Cracked 50 0.15 Q-E)0.47(RB) 1.07
o.7l 10 66 f ,{MPa
138
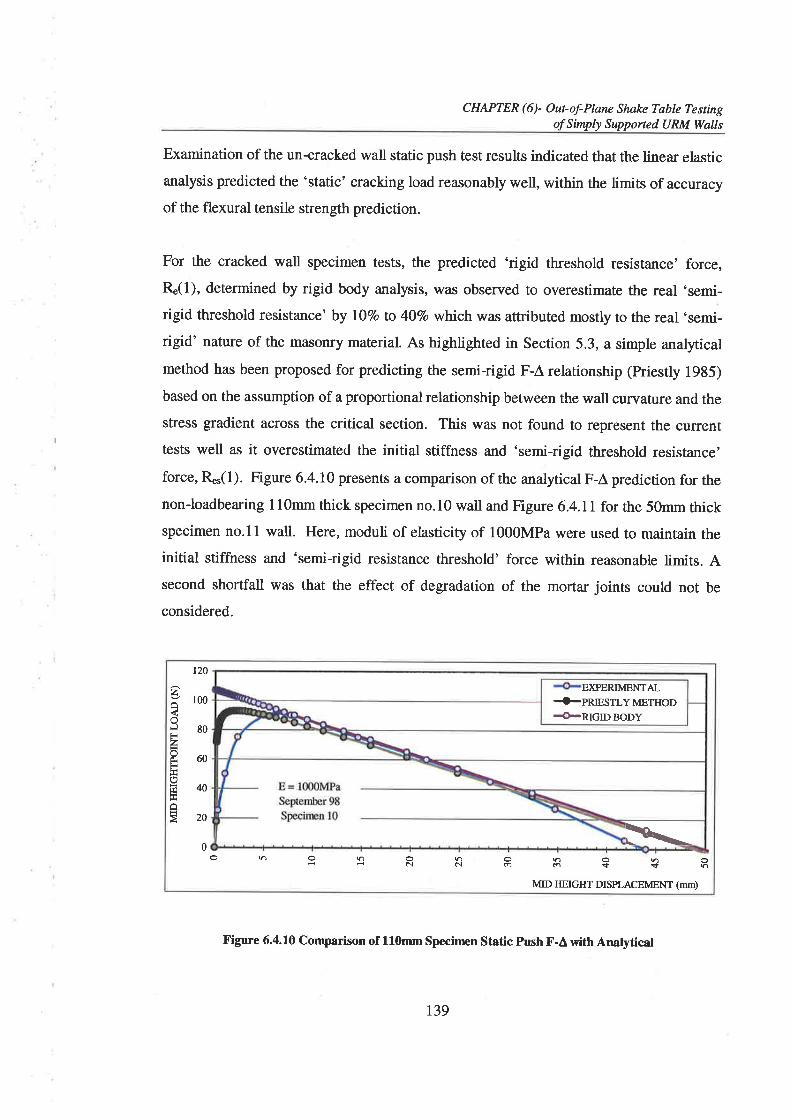
CHAPTER (6)- Outof-Plnne Shakc Tøblc TestingofSimply Supported URM Walls
Examination of the un{racked wall static push test results indicated that the linea¡ elastic
analysis predicted the 'static' cracking load reasonably well, within the limits of accuracy
of the flexural tensile strength prediction.
For the cracked wall specimen tests, the predicted 'rigid threshold resistance' force,
R"(1), determined by rigid body analysis, was observed to overestimate the real 'semi-
rigid threshold resistance' by lÙVo to 4O7o wlnch was attributed mostly to the real 'semi-
rigid' nature of the masonry material. As highlighted in Section 5.3, a simple analytical
method has been proposed for predicting the semi-rigid F-A relationship (Priestþ 1985)
based on the assumption of a proportional relationship between the wall curvature and the
stress gradient across the critical section. This was not found to represent the currenttests well as it overestimated the initial stiffness and 'semi-rigid threshold resistance'
force, R*(1). Figure 6.4.10 presents a comparison of the analytical F-Â prediction for the
non-loadbearing 110mm thick specimen no.10 wall and Figure 6.4.11for the 50mm thickspecimen no.ll wall. Here, moduli of elasticity of 1000MPa were used to maintain the
initial stiffness and 'semi-rigid resistance threshold' force within reasonable limits. Asecond shortfall was that the effect of degradation of the mortar joints could not be
considered.
120
2X r00H
v180
860F
ç,õ40Ê
ÐGERIMENTAL+PRIESTLYMETHoD+-RIGIDBODY
R0nonoÊôtNo nono6rftn
MID IIEIGHT DISPLACEMENT (mm)
Figure 6.4.10 comparison of ll0rnm specimen static Push F-a with anaryticat
r39
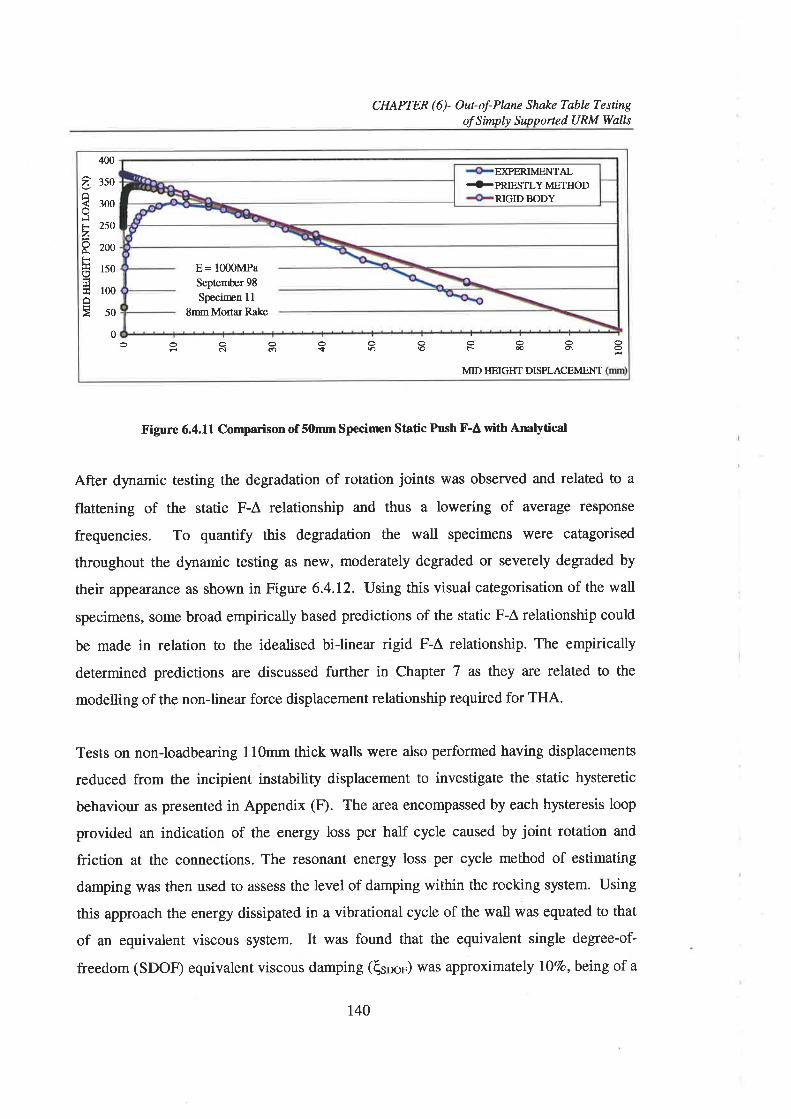
CHAPTER (6)- Ourof-Plane Shake Table TestingofSimply Supported URM Wqlls
2H
JFzô.F
Hu¿
400
350
300
250
200
150
r00
50
0oooeQÉcloçn ooooo\¿)ræo\3
MID HEIGTfT DISPLACEMENT
ÐGERIMENTAL+PRESTLYMETHOD
RIGIDBODY
E= 1000MPaSepternber 98Speciræn ll
SmmMortar Rake
Figure 6.4.11 Comparison of S0mm Specimen Static Push F'A with Anatytical
After dynamic testing the degradation of rotation joints was observed and related to a
flattening of the static F-À relationship and thus a lowering of average response
frequencies. To quantify this degradation the wall specimens were catagorised
throughout the dynamic testing as new, moderately degraded or severely degraded by
their appearance as shown in Figure 6.4.12. Using this visual categorisation of the wall
specimens, some broad empirically based predictions of the static F-Â relationship could
be made in relation to the idealised bi-linear rigid F-A relationship. The empirically
determined predictions are discussed further in Chapter 7 as they are related to the
modelling of the non-linear force displacement relationship required for THA.
Tests on non-loadbearing l lOmm thick walls were also performed having displacements
reduced from the incipient instability displacement to investigate the static hysteretic
behaviour as presented in Appendix (F¡. The area encompassed by each hysteresis loop
provided an indication of the energy loss per half cycle caused by joint rotation and
friction at the connections. The resonant energy loss per cycle method of estimating
damping was then used to assess the level of damping within the rocking system. Using
this approach the energy dissipated in a vibrational cycle of the wall was equated to that
of an equivalent viscous system. It was found that the equivalent single degree-of-
freedom (SDOÐ equivalent viscous damping (6sm") was approximately tÙVo,being of a
140
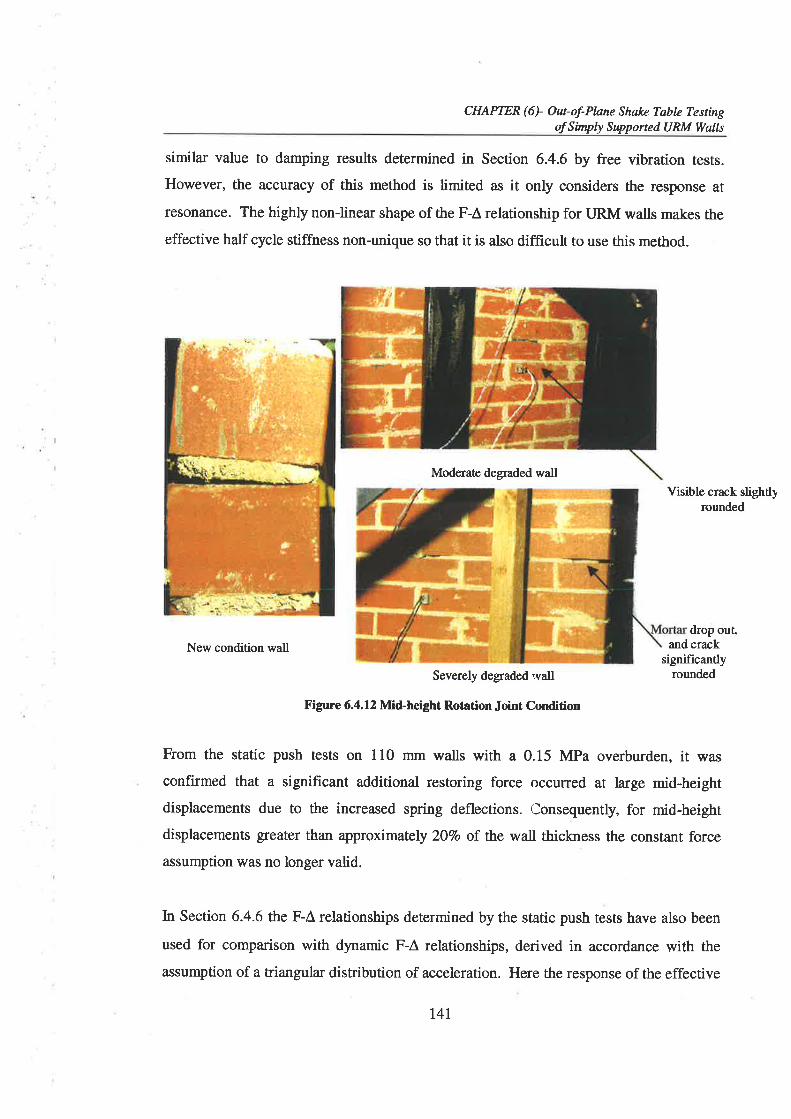
CHAPTER (61 Ourof-Plnne Shake TabI¿ TestingoÍSinply Supported URM Walls
similar value to damping results determined in Section 6.4.6 by free vibration tests.
However, the accuracy of this method is limited as it only considers the response at
resonance. The highly non-linea¡ shape of the F-Â relationship for LIRM walls makes the
effective half cycle stiffness non-unique so that it is also difficult to use this method.
Moderaûe degraded wallVisible crack slightly
rounded
drop outNew condition wall and crack
Severely degraded rvall
Figure 6.4.12 Mid-height Rotation Joint Condition
significantlyrounded
From the static push tests on 110 mm walls with a 0.15 MPa overburden, it was
confirmed that a significant additional restoring force occurred at large mid-height
displacements due to the increased spring deflections. Consequently, for mid-height
displacements greater than approximately 207o of the wall thickness the constant force
assumption \ryas no longer valid.
In Section 6.4.6 the F-À relationships determined by the static push tests have also been
used for comparison with dynamic F-Â relationships, derived in accordance with the
assumption of a uiangula¡ distribution of acceleration. Here the response of the effective
t4r
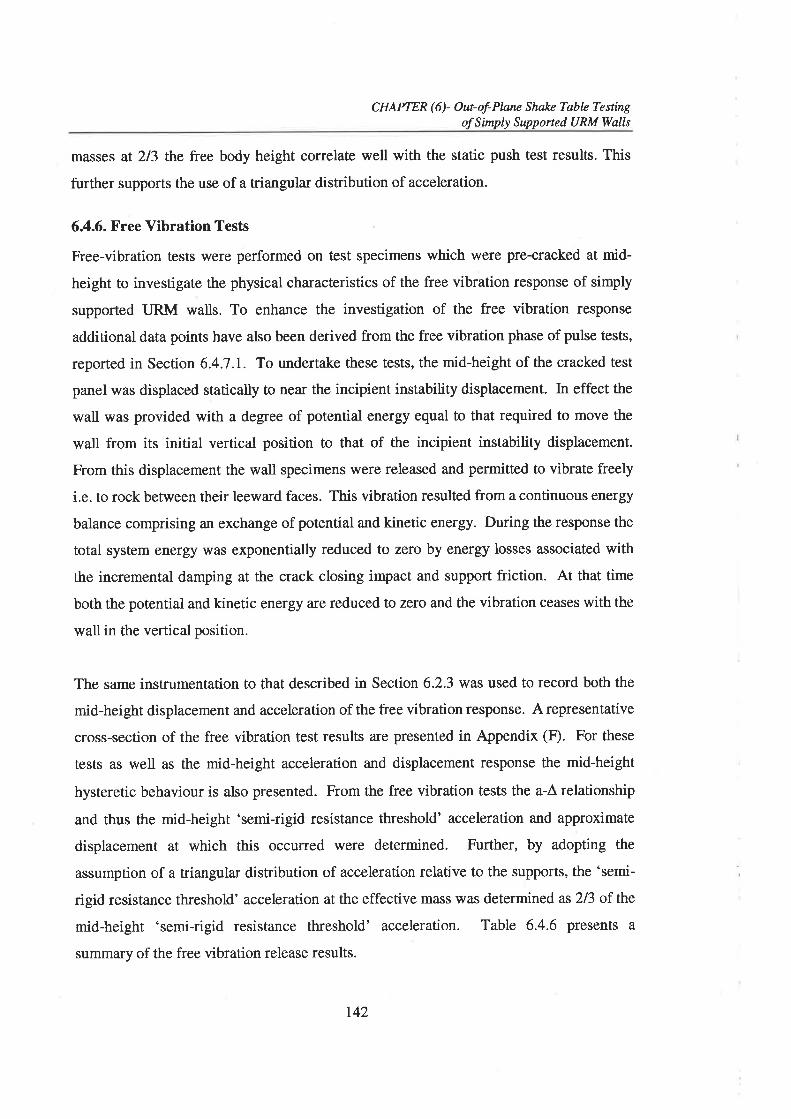
CHAPTER (6)- Ourof-Plane Shøke Tøblc TestingofSimply Supponed URM Walls
masses at 213 the free body height correlate well with the static push test results. This
further supports the use of a triangula¡ distribution of acceleration.
6.4.6. Free Vibration Tests
Free-vibration tests were performed on test specimens which were pre-cracked at mid-
height to investigate the physical characteristics of the free vibration response of simply
supported URM walls. To enhance the investigation of the free vibration response
additional data points have also been derived from the free vibration phase ofpulse tests,
reported in Section 6.4.7.t. To undertake these tests, the mid-height of the cracked test
panel was displaced statically to near the incipient instability displacement. In effect the
wall was provided with a degree of potential energy equal to that required to move the
wall from its initial vertical position to that of the incipient instability displacement.
From this displacement the wall specimens were released and permitted to vibrate freely
i.e. to rock between their leeward faces. This vibration resulted from a continuous energy
balance comprising an exchange of potential and kinetic energy. During the response the
total system energy was exponentially reduced to zero by energy losses associated with
the incremental damping at the crack closing impact and support friction. At that time
both the potential and kinetic energy are reduced to zero and the vibration ceases with the
wall in the vertical position.
The same instrumentation to that described in Section 6.2.3 was used to record both the
mid-height displacement and acceleration of the free vibration response. A representative
cross-section of the free vibration test results are presented in Appendix (F). For these
tests as well as the mid-height acceleration and displacement response the mid-height
hysteretic behaviour is also presented. From the free vibration tests the a-Â relationship
and thus the mid-height 'semi-rigid resistance threshold' acceleration and approximate
displacement at which this occurred were determined. Further, by adopting the
assumption of a triangular distribution of acceleration relative to the supports, the 'semi-
rigid resistance threshold' acceleration at the effective mass was determined as 213 of the
mid-height 'semi-rigid resistance threshold' acceleration. Table 6.4.6 presents a
summary of the free vibration release results.
r42
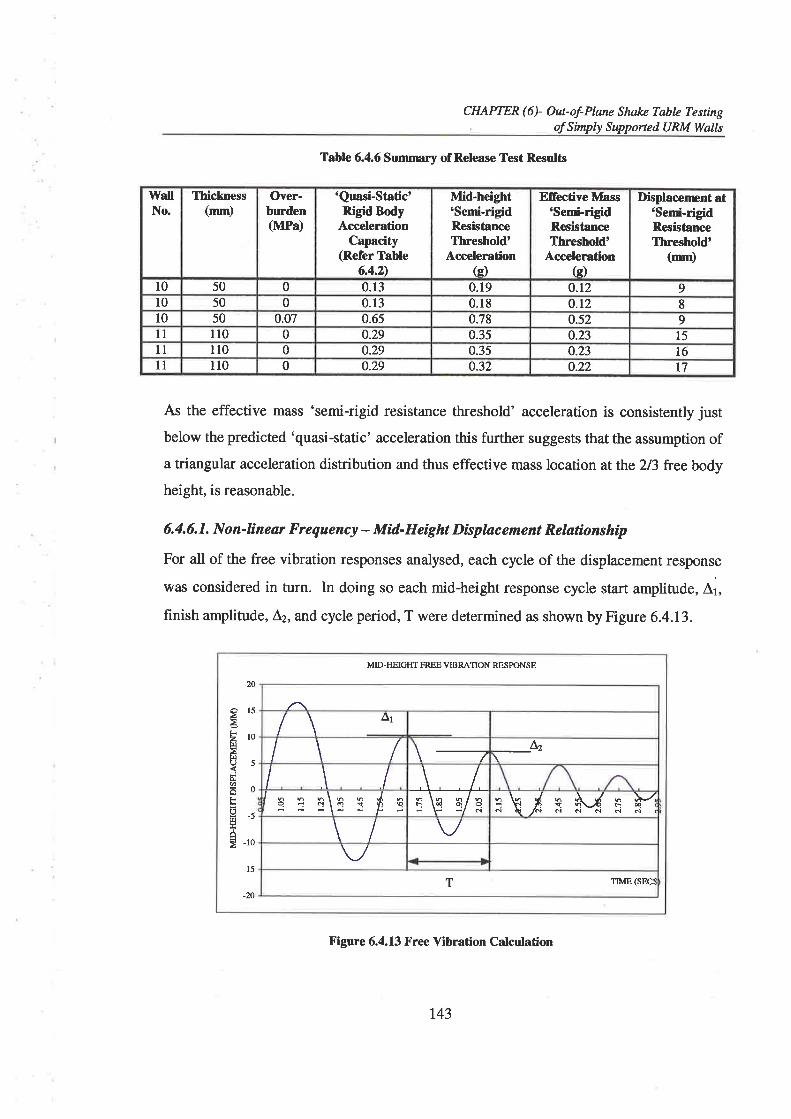
CHAPTER (6)- Ow-of-Plarc Shak¿ Tabl¿ TestingofSirrWIy Supported URM Walls
WallNo
Thichress(mm)
Over-burden(MPa)
'Quasi-Static'RigidBody
AccelerationCapacity
(Refer Table6.4.21
Mid-height6Semi-rigidResistanceThreshold'
Acceleration(c)
Efiective Mass'Senú-rigidRcsistanceThreshold'
AccelerationG)
Displacenrcnt at'SemÍ-rigidResistanceIhreshold'
(mm)
l0 50 0 0.13 0.19 o.r2 910 50 0 0.13 0.18 o.t2 810 50 0.07 0.65 0.78 0.52 9ll ll0 0 0.29 0.35 o.23 l51l ll0 0 0.29 0.35 o.23 t6il 110 0 o.29 0.32 o.22 t7
Table 6.4.6 Summry of Release Test Results
As the effective mass 'semi-rigid resistance threshold' acceleration is consistently just
below the predicted 'quasi-static' acceleration this further suggests that the assumption ofa triangular acceleration distribution and thus effective mass location at the 213 freebody
height, is reasonable.
6,4.6. I. N o n-línear F requency - Mid- H eíght Dísplac eme nt Relationship
For all of the free vibration responses analysed, each cycle of the displacement response
was considered in turn. In doing so each mid-height response cycle start amplitude, Â1,
finish amplitude, Lz, and cycle period, T were determined as shown by Figure 6.4.13.
MID-HEIGITT FREE VIBRATION RESPONSE
20
g15ä2rcE]
E]o5
ã0Fi
f;-sóE -10
-15
-20
t\ A1
I \ L2
l \ I/ - - -\ - - J' O È Nló * S Þ...i ..': -.: l-: : l- ..: +# q\ 'r4 q ù../ F Md\.,/NNNddN(
\ IT TIME (SECS
Figure 6.4.13 Free Vibration Calculation
143

CHAPTER (6)- Out-of-Pbne Shak¿ Tabl¿ TestingoÍSimply Supponed URM Walls
The average cycle amplitude, Au, was determined as,
Lo
and the individual cycle frequency as,
2
r =Yr
Having determined this information for each cycle, the non-linear frequency versus Âo
relationship was plotted including an exponential or logarithmic line of best ht. Figure
6.4.L4 presents this relationship for 50 mm thick specimens at various levels of applied
overburden and Figure 6.4.15 for 110 mm thick walls with no applied overburden. A
comparison of the empirically derived /-Au relationships with an analytical prediction
derived by the comparison of the dynamic equation of motion for a SDOF system and
those for the non-linear rocking system is presented in Chapter 7.
80
7 0
oú e.ozot-< 5.0JÈO8 +.o
ð s.ozFIÞg 2.0
É1.0
0.0
0 5 l0 15 20 25 30 35 40 45
AVERAGE CYCLE MID.IIEIGIIT DISPLACEMENT
50
trNOPRECOMP. NOPRECOMPLogfittr0.075MPa¡ 0.075MPa Exp frttr0.15MPa. 0.l5MPaExp fitEPARAPETEItr
¡
tr
. PARAPET fitsF tr
F Ba
o I o.dlÐh
Figure 6.4.14 50mm Specimen Frequency vs Average Cycle Mid-Height Disp.
144

CHAPTER (6)- Out-of-Plane Shake Tøble Testingof Simply Supponed URM Walls
8.0
7.0
se 6.0zoF-f 5.0EO8 ¿.0l&
tr 3.0zÊlÐfl z.oúI&
1.0
0.00 10 20 30 40 50 60 't0 80 90 r00 110
AVERAGE CYCLE MID HEIGI{I DISPLACEMENT (mm)
ltrNOPRECOMP
INO PRECOMP Log [rt
h"*-r-
Figure 6.4.15 1l0mm Specimen Frequerrcy vs Average Cycle Mid-Height Disp.
6, 4. 6. 2. N o n- lin e ar Dy namic F orc e - Mid- H eight Dß plac e m e nt Relatío ns hip
Rearranging the previously established dynamic relationship (Clough et al1993)
a 2d Etl*
"
where o= cycle angular response frequency
IÇ = average cycle secant stiffness
M" - effective mass of the free body
the average cycle secant stiffness can be written as,
K,=(?-t¡f), M"
Following from this an estimate of the response force can then be determined as
F =Ko 1,"= (Zr{), M " L"
where Â. = displacement of the effective mass
(6.4.3)
t45
(6.4.4)
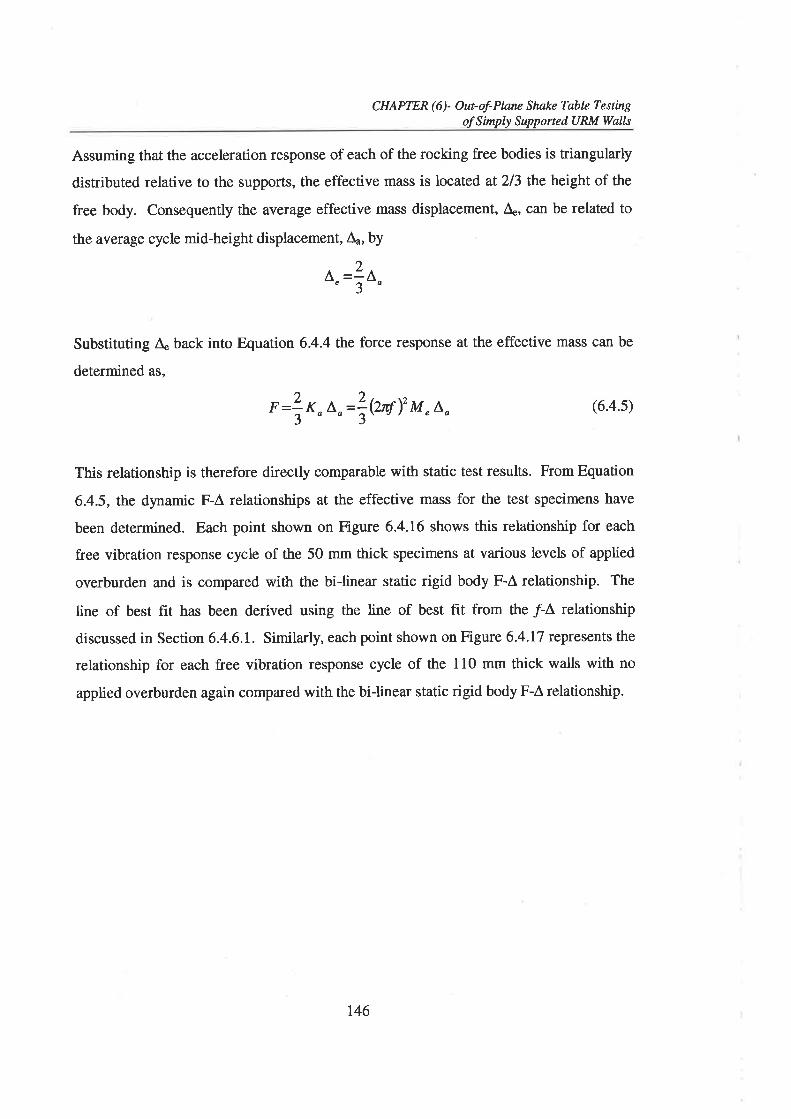
CHAPTER (6)- O*of-Pbne Shakc Table TestingofS imply Supp orted U RM WølIs
Assuming that the acceleration response of each of the rocking free bodies is triangularly
distributed relative to the supports, the effective mass is located at 213 the height of the
free body. Consequently the ayera1e effective mass displacement, Â., can be related to
the average cycle mid-height displacement, Àn, bY
,)o"=ío'
Substituting A" back into Equation 6.4.4 the force response at the effective mass can be
determined as,
, =1*, L"=|Q"f)' M " L^ (6.4.s)
This relationship is therefore directly comparable with static test results. From Equation
6.4.5, the dynamic F-A relationships at the effective mass for the test specimens have
been determined. Each point shown on Figure 6.4.16 shows this relationship for each
free vibration response cycle of the 50 mm thick specimens at various levels of applied
overburden and is compared with the bi-linear static rigid body F-A relationship. The
line of best fit has been derived using the line of best f,rt from the /-Â relationship
discussed in Section 6.4.6.I. Similarly, each point shown on Figure 6.4.17 represents the
relationship for each free vibration response cycle of the 110 mm thick walls with no
applied overburden again compared with the bi-linear static rigid body F-A relationship.
146
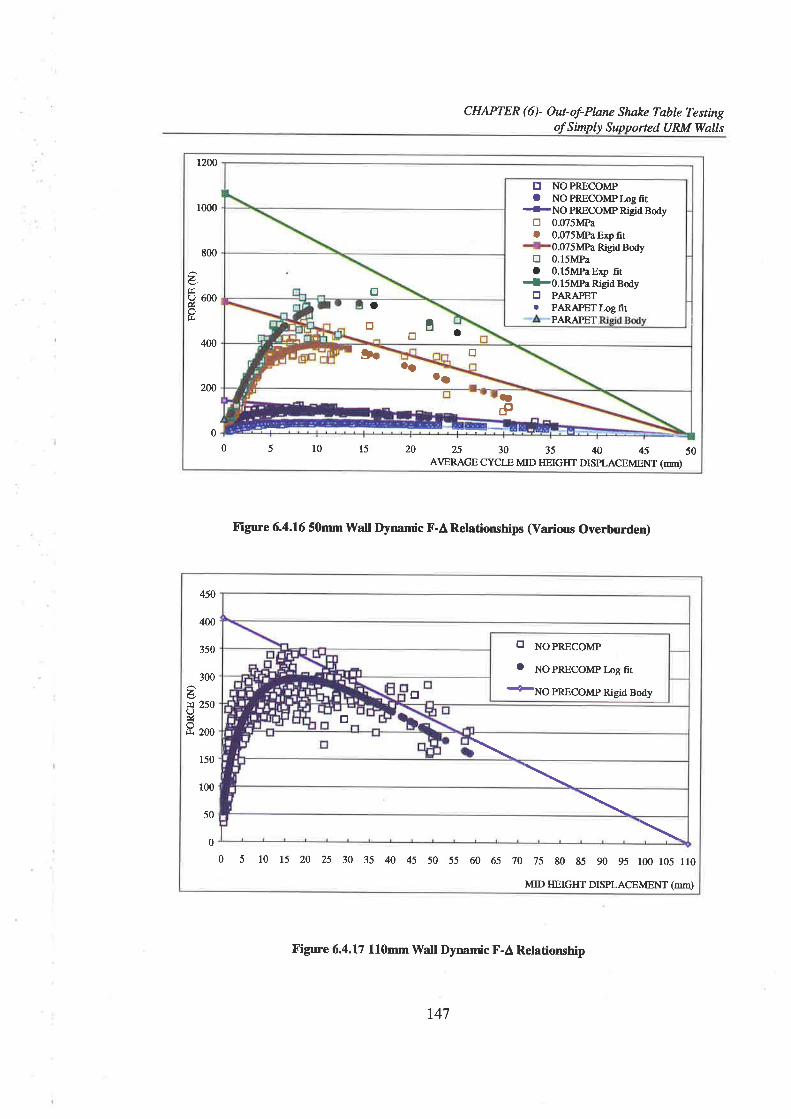
CHAPTER (6)- Out-of-Pløne Shake Tqbl¿ Testingof SimPlY StPPorted URM Walls
tzOfj
r000
arll()úl&
800
600
400
200
00 5 10 15 20 25 30 35 40 45 50
AVERAGE CYCLE MID TIEIGIIT DISPLACEMENT (mn)
tr NOPRECOMPO NOPRECOMPLogfit
{-NOPRECOMPRigidBodytr 0.075MPaO 0.075MPaE4fit
0.075MPa Rigid Bodytr 0.15MPaa O.l5MPaExp fit
t0.l5MPaRigidBodytr PARAPET. PARAPETITgfiT
trtr
trD.l¡
t¡
a a
tra
PARAPET
¡p-n
Figure 6.4.16 50mm Wall Dynamic F-A Relationships (Various Overburden)
Figure 6.4.17 110mm Watl Dynanúc F-A Relationship
450
400
350
300
¿H 250OúÊ zoo
150
100
50
0
0 5 1015202530354045 50556065 70 75 80 85 90 95 100 105 110
MID HEIGIIT DISPLACEMENT (mTn)
tr No pnncorvrp
a nopnncoMPlogñt+No pnscoMp Rigid Bodytr
tr
\
147
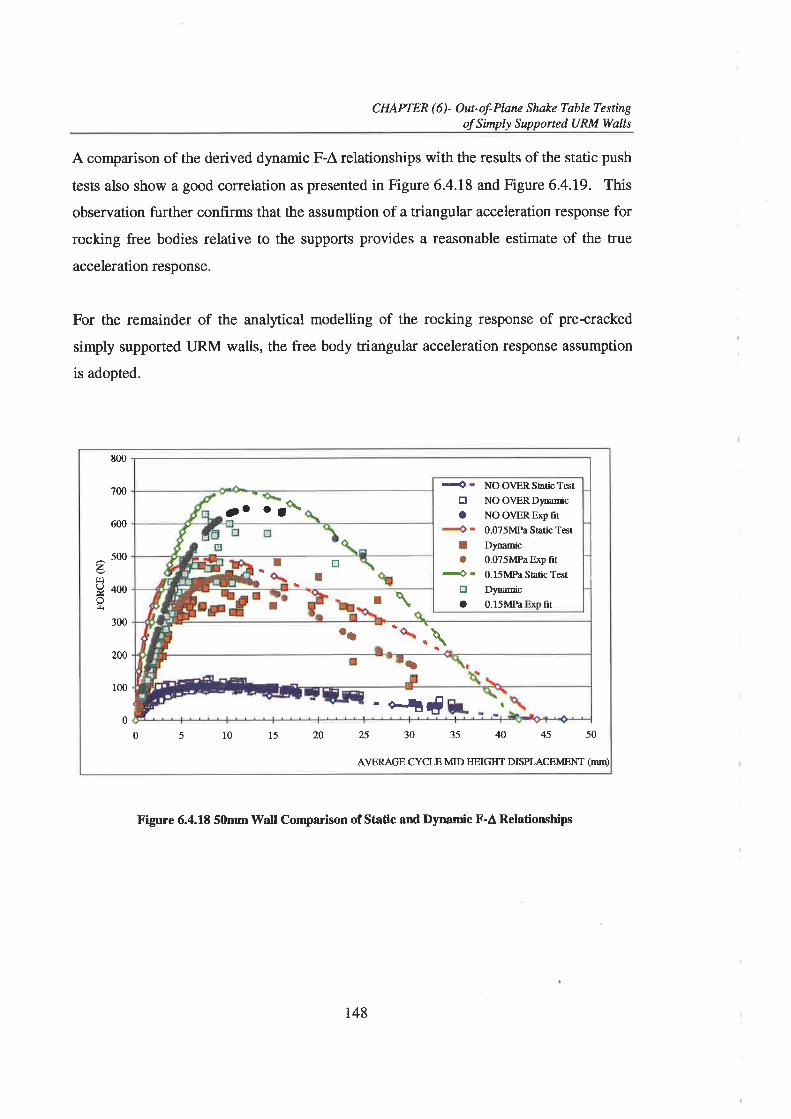
CHAPTER (6)- Ouçof-Pbne Shak¿ Table Testingof Simply SupportedURM Wqlls
A comparison of the derived dynamic F-Â relationships with the results of the static push
tests also show a good correlation as presented in Figure 6.4.18 and Figure 6.4.19. This
observation further confirms that the assumption of a triangular acceleration response for
rocking free bodies relative to the supports provides a reasonable estimate of the true
acceleration response.
For the remainder of the analytical modelling of the rocking response of pre+racked
simply supported LIRM walls, the free body triangular acceleration response assumption
is adopted.
zt¡¡(JÉÍJ.
800
700
600
500
,t00
300
200
100
0
0 5 l0 15 20 25 30 3s 4D 45 50
AYERAGE CYCLE MID IIEIGIIT DISPLACEMENT (MM)
\1o o¡
EI tr
¡
NO OVER St¿tic Test
NO OVERDynamicNO OVERExp frt0.075MPa Static Test
Dynamic0.075MPaExp frt0.l5MPa Static Testnynar¡¡ctr
a
-+
0.l5MPa frr
tra
Ta
I l\
\t.a
a
I
-oË'f
Figure 6.4.1t 50mm Wall Comparison of Static and Dynamic F-A Relatioruhips
148
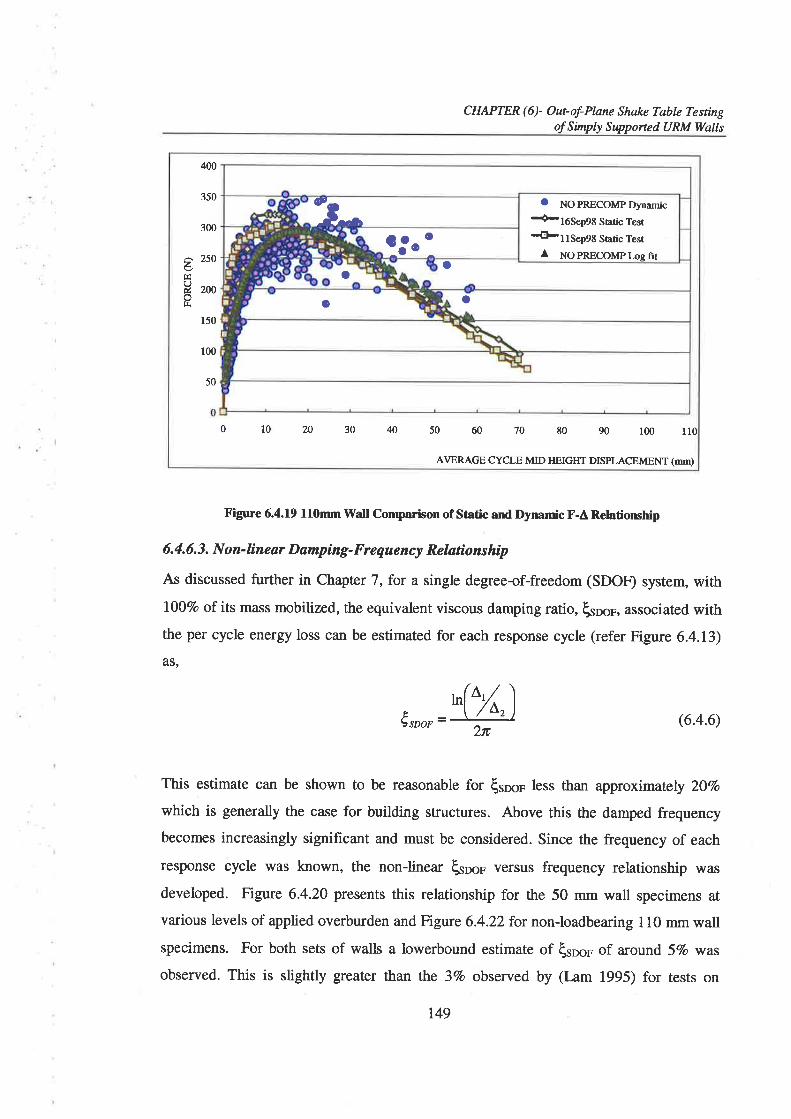
CHAPTER(6)- Ourof-Plnne Shakz Tablz TestingoÍSirnply Supported URM Walls
âÊlUút¡r
400
350
300
250
200
r50
100
50
0 10 20 30 40 50 60 70 80 90 100 r10
AVERAGE CYCLE MIDMIGIIT DISPLACEMENT (mm)
?-*:3':
o NoPRECoMpDynamic+tøSepes Shtic Tesr4l-ttsep98 Static Test
A NOPRECOMPLOEFT
oo
o o
Figure 6.4.19 110mm Wall Comparison of Static and Dynamic F-A Relatioruhip
6.4.6. 3. N on-linear Damping- Frequency Relationship
As discussed further in Chapter 7, for a single degreeof-freedom (SDOÐ system, \ryith
l00%o of its mass mobilized, the equivalent viscous damping ratio, (5¡rep, associated withthe per cycle energy loss can be estimated for each response cycle (refer Figure 6.4.13)âS'
n(t,/^ \Ésoop=# 6.4.6)
This estimate can be shown to be reasonable for €soo" less than approximately ZOVo
which is generally the case for building structures. Above this the damped frequency
becomes increasingly significant and must be considered. Since the frequency of each
response cycle was known, the non-linetr €s¡op versus frequency relationship was
developed. Figure 6.4-20 presents this relationship for the 50 mm wall specimens at
various levels of applied overburden and Figure 6.4.22 for non-loadbearing 110 mm wallspecimens. For both sets of walls a lowerbound estimate of 6soou of a¡ound 5Vo was
observed. This is slightly greater than the 3Vo observed by (tam 1995) for tests on
149
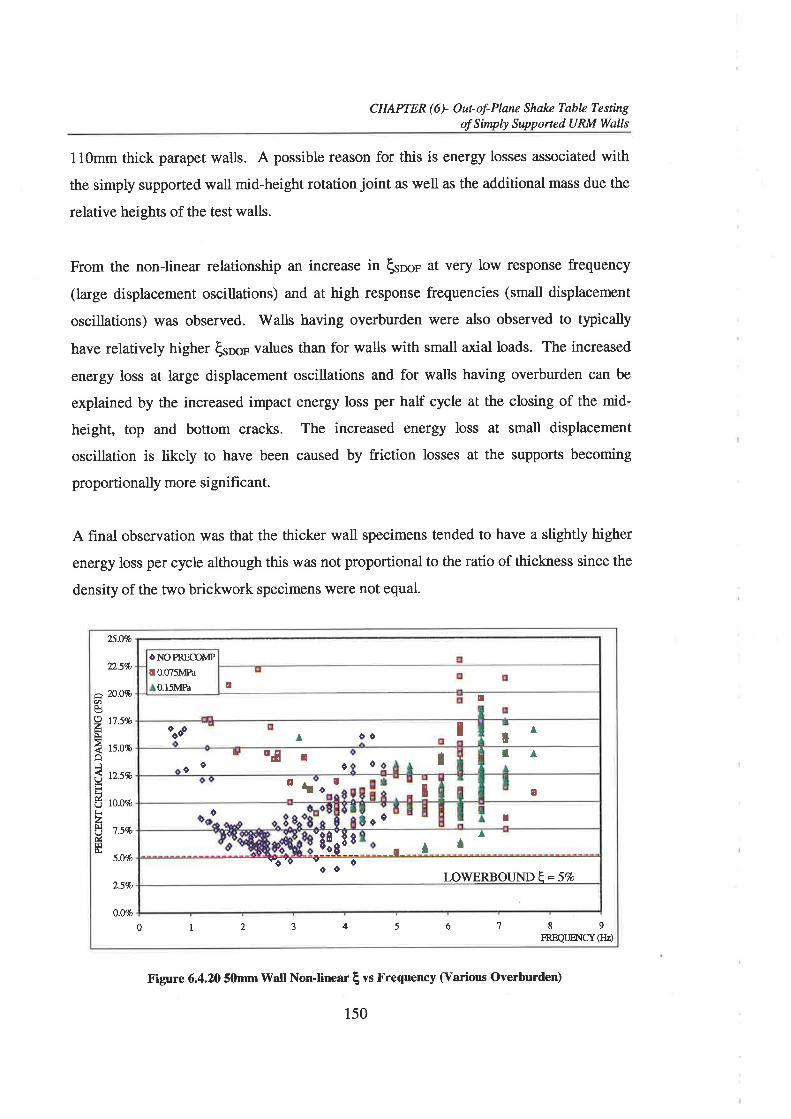
CHAPTER (6)- Ourof-Han¿ Shake Tablz TestingofSimply Supponed U RM Wqlls
l l0mm thick parapet walls. A possible reason for this is energy losses associated with
the simply supported wall mid-height rotation joint as well as the additional mass due the
relative heights of the test walls.
From the non-linear relationship an increase it E -u at very low response frequency
(large displacement oscillations) and at high response frequencies (small displacement
oscillations) was observed. Walls having overburden were also observed to typically
have relatively higher hr¡or values than for walls with small axial loads. The increased
energy loss at large displacement oscillations and for walls having overburden can be
explained by the increased impact energy loss per half cycle at the closing of the mid-
height, top and bottom cracks. The increased energy loss at small displacement
oscillation is likely to have been caused by friction losses at the supports becoming
proportionally more si gnificant.
A final observation was that the thicker wall specimens tended to have a slightly higher
energy loss per cycle although this was not proportional to the ratio of thickness since the
density of the two brickwork specimens were not equal.
âøõzô.
oIOEúc),2f¡lU&t¡l
25.Wo
22.5%
2n.o%
t7s%
15.0'lo
t2.5%
to.uk
7.5%
5.Uk
2.5%
0.Wo
0 I 2 3 4 5 6 7 89FREaUm{CY(Hz)
E0.15MPà
O}¡OPRECIIMP!O.Cr/SMP¿
!
^Itd ¡oo^ l^!Ed Ioo oo
EE
o I"teo !ô
-tfirr ,__E_ ¡l ^
LOWERBOUND E=SVo"o -o
0o o
Figure 6.4.20 s0mm\ilatl NonJinear I vs Frequency (Various Overburden)
150
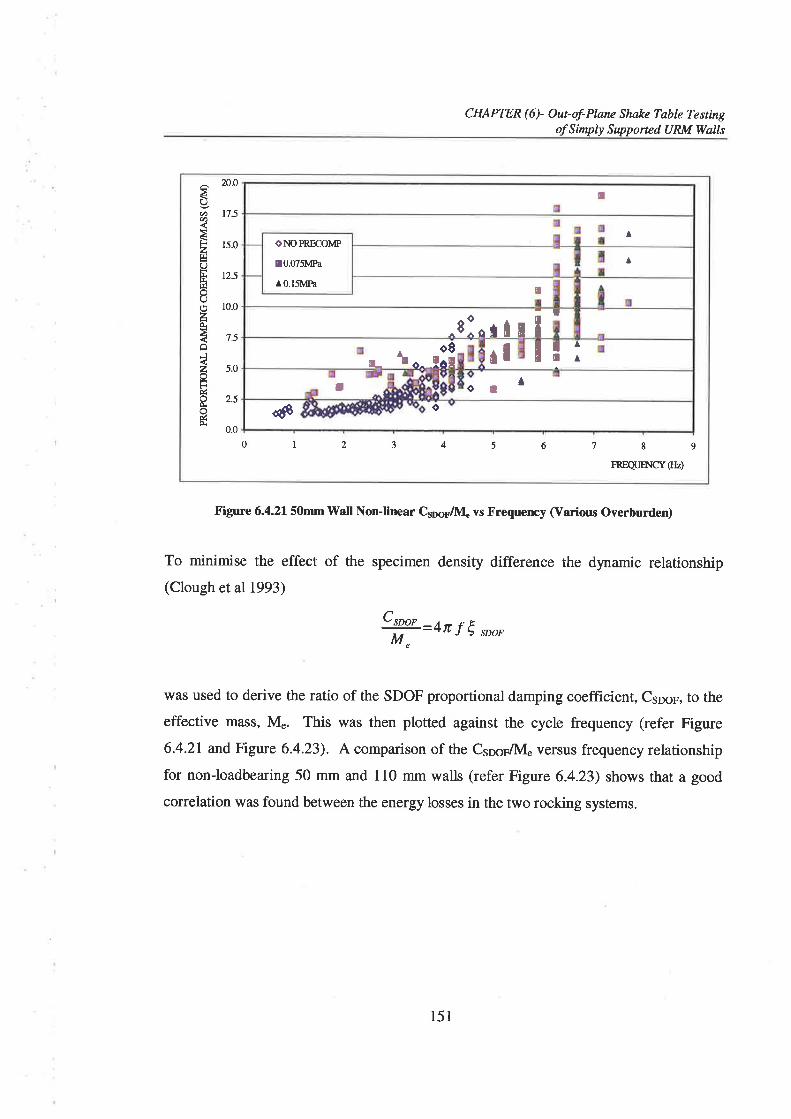
CHAPTER (6)- Out-of-Plønc Shake Table TestingofSimply Supported URM Walls
24.0
17.5
15.0
t2.5
10.0
7.5
5.0
2.5
0.0
I\O;Ø2HC)
Er¡.¡
U(,z.L!,l
zoFúÊúo.
0 1 2 t 4 5 6 7 89FREQ{IE{CY(IIz)
I
OIOPRE@MP
l0.075lvtPa
0.l5Mh
¡¡
f,
^8lol ir¡to8
o^ lal!_ I
A
rl I !J Io !
dp o
To minimise the effect of the specimen density difference the dynamic relationship
(Clough etal1993)
Croo, -4o l6 ,oo,M"
Figure 6.4.21 50mm Wall NonJinear Csnor/t\4 vs Frequency (Yarior¡s OverburdeÐ
was used to derive the ratio of the SDOF proportional damping coefficient, Cs¡op, to the
effective mass, M". This was then plotted against the cycle frequency (refer Figure
6.4.21 and Figure 6.4.23). A comparison of the Csroe/Àft versus frequency relationship
for non-loadbearing 50 mm and 110 mm walls (refer Figure 6.4.23) shows that a good
correlation was found between the energy losses in the two rocking systems.
151
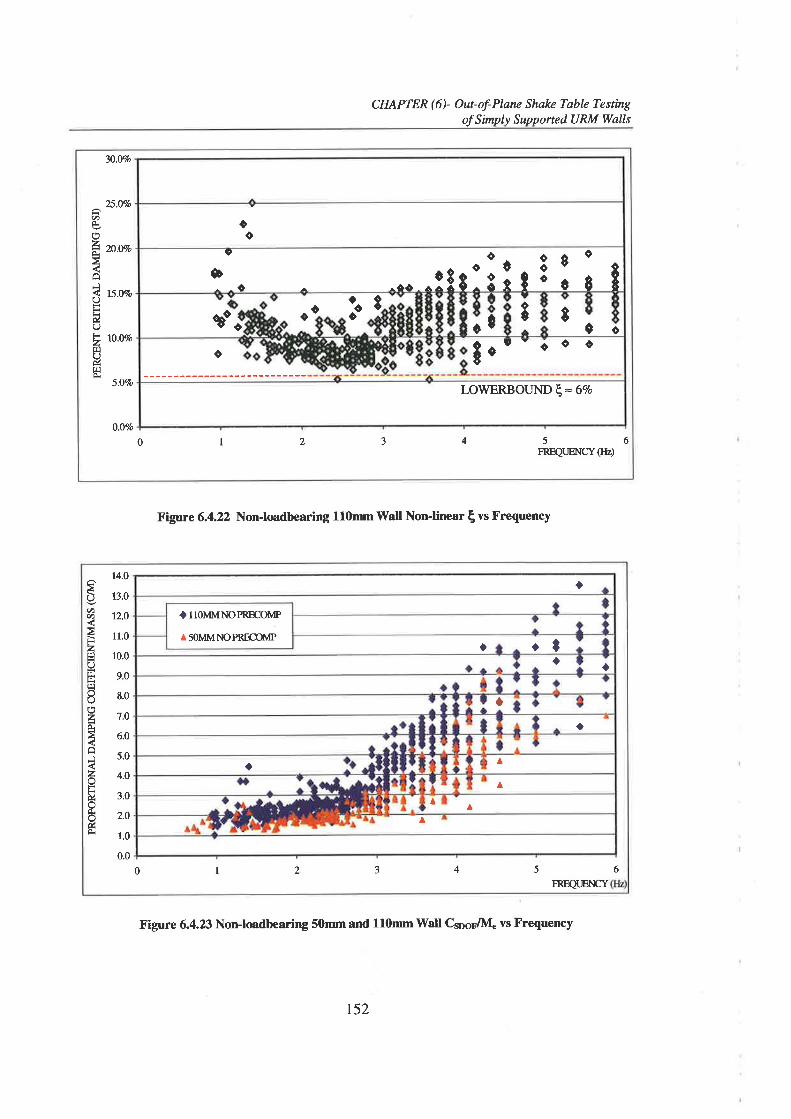
CHAPTER (6)- Outof-Plane Shake Table TestingofSirnply Supported URM Walls
30.v%
25.Wo
2fr.Vo
15.Vo
lO.Mo
5.OVo
0.01o
âv)È.(,zgâc(JFHú(JFz14(JútÐÈ
2 3 4 5FREQIJH{CY(rlz)
60 I
oo
ô^ôô ^:l¡l il I I :;rI
ôo3 8e0 0 o
coo8
tu oo o
0 Eon'õo o
LO\ryERBOUND E= 6Vo
Figure ó.4.22 NonJoadbearing 110nun Wall Non-linear I vs Frequency
Figure 6.4.23 Non-loadbearing 50mm and 1l0mm Wall Cs¡,or/l\¡f. vs Frequency
r4.0
13.0
12.0
lr.0
r0.0
9.0
8.0
7.0
6.0
5.0
4.0
3.0
2.0
1.0
0.0
âà(JU)v)
tszI¡}HOÉÍ¡loU(5zÀ
AJzFtsúÀoúÀ
4 5 6I 2 )0FRE@ENCY
a
.l1OMMNOPRECOMP
^ 50MMÌ.¡OPREOCx\4P ôlo
a I
a
a
AaA
^ ¡^
152
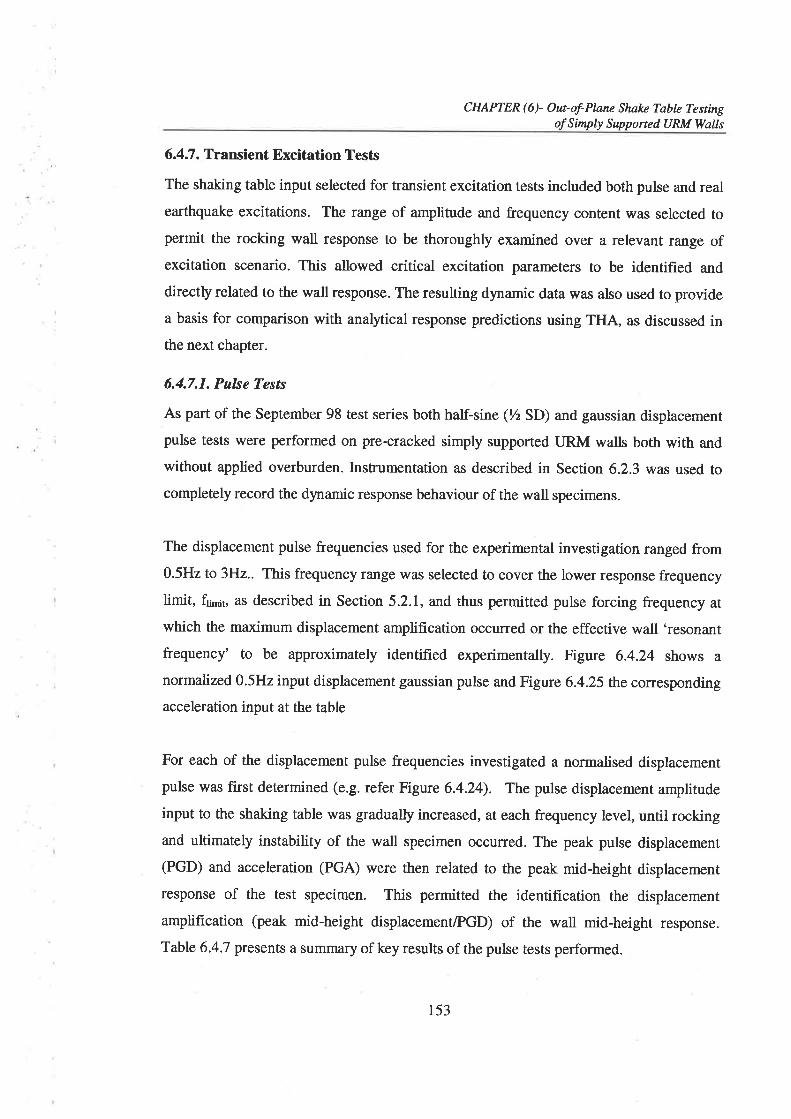
CHAPTER (6)- Out-of-Plnne Shnke Tabl-e Testingof Simply Supported URM Walls
6.4.7. Transient Excitation Tests
The shaking table input selected for transient excitation tests included both pulse and real
earthquake excitations. The range of amplitude and frequency content was selected to
permit the rocking wall response to be thoroughly examined over a relevant range ofexcitation scenario. This allowed critical excitation parameters to be identified and
directly related to the wall response. The resulting dynamic data was also used to provide
a basis for comparison with analytical response predictions using THA, as discussed inthe next chapter.
6.4.7.1. Pulse Tests
As part of the September 98 test series both half-sine (Yz SD) and gaussian displacement
pulse tests were performed on pre-cracked simply supported LJRM walls both with and
without applied overburden. Instrumentation as described in Section 6.2.3 was used to
completely record the dynamic response behaviour of the wall specimens.
The displacement pulse frequencies used for the experimental investigation ranged from0.5Hz to 3H2.. This frequency range was selected to cover the lower response frequency
hmit, f¡,¡1, as described in Section 5.2.I, and thus permitted pulse forcing frequency at
which the maximum displacement amplification occurred or the effective wall 'resonant
frequency' to be approximately identified experimentally. Figure 6.4.24 shows a
normalized 0.5H2 input displacement gaussian pulse and Figure 6.4.25 the corespondingacceleration input at the table
For each of the displacement pulse frequencies investigated a normalised displacement
pulse was first determined (e.g. refer Figure 6.4.24). The pulse displacement amplitude
input to the shaking table was gradually increased, at each frequency level, until rockingand ultimately instability of the wall specimen occurred. The peak pulse displacement
(PGD) and acceleration (PGA) were then related to the peak mid-height displacement
response of the test specimen. This permitted the identification the displacement
amplif,rcation (peak mid-height displacement/PGD) of the wall mid-height response.
Table 6.4.7 presents a summary of key results of the pulse tests performed.
153
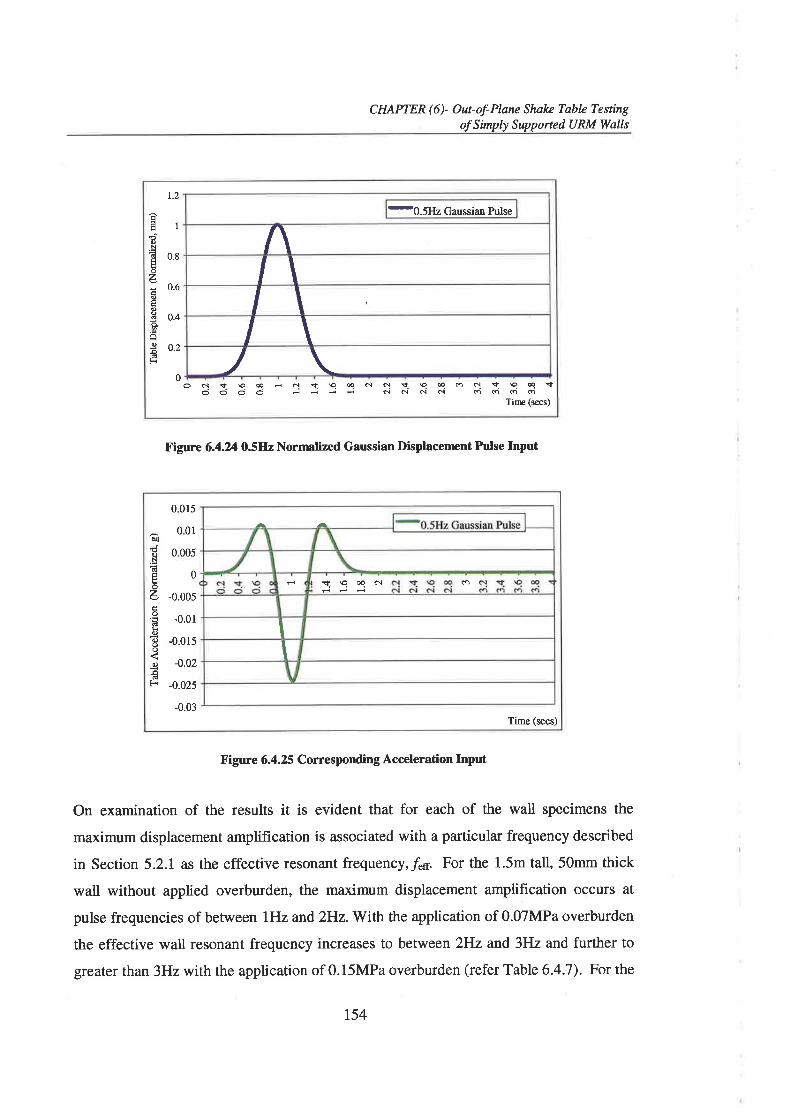
CHAPTER (6)- O*of-Plane Shalce Tablc Testingof Simply SupportedURM WølIs
t.2
eEl<toN! o.s
7, 0.6
troË o.¿oa9 ntFr
0 c) eì a I e - .ì a I oq d c.ì a 9 e ó q a I aq {oooodNddooóo
Tiæ (secs)
-0.5H2 Gaussian Pulse
At\I \I \
/\
Figure 6.4.A O5ftzNornnlized Gaussian Displacenrent Pulse Input
Figure 6.4.25 Conesponding Acceleration Input
On examination of the results it is evident that for each of the ïvall specimens the
maximum displacement amplification is associated with a particular frequency described
in Section 5.2.1 as the effective resonant frequency,/.ç. For the 1.5m tall, 50mm thick
wall without applied overburden, the maximum displacement amplif,rcation occurs at
pulse frequencies of between lHz and 2Hz. With the application of 0.07MPa overburden
the effective wall resonant frequency increases to between 2Hz and 3Hz and further to
greater than 3Hz with the application of 0.15MPa overburden (refer Table 6.4.7). For the
0 0r5
00
0 005
-0.005
-0.01
-0.0r5
4.02
-0.025
-0.03
^
f9oqô{
It
I
0
è¡)
doNËtroaÒ..ÉdooIoo.adF
Tine (secs)
r54
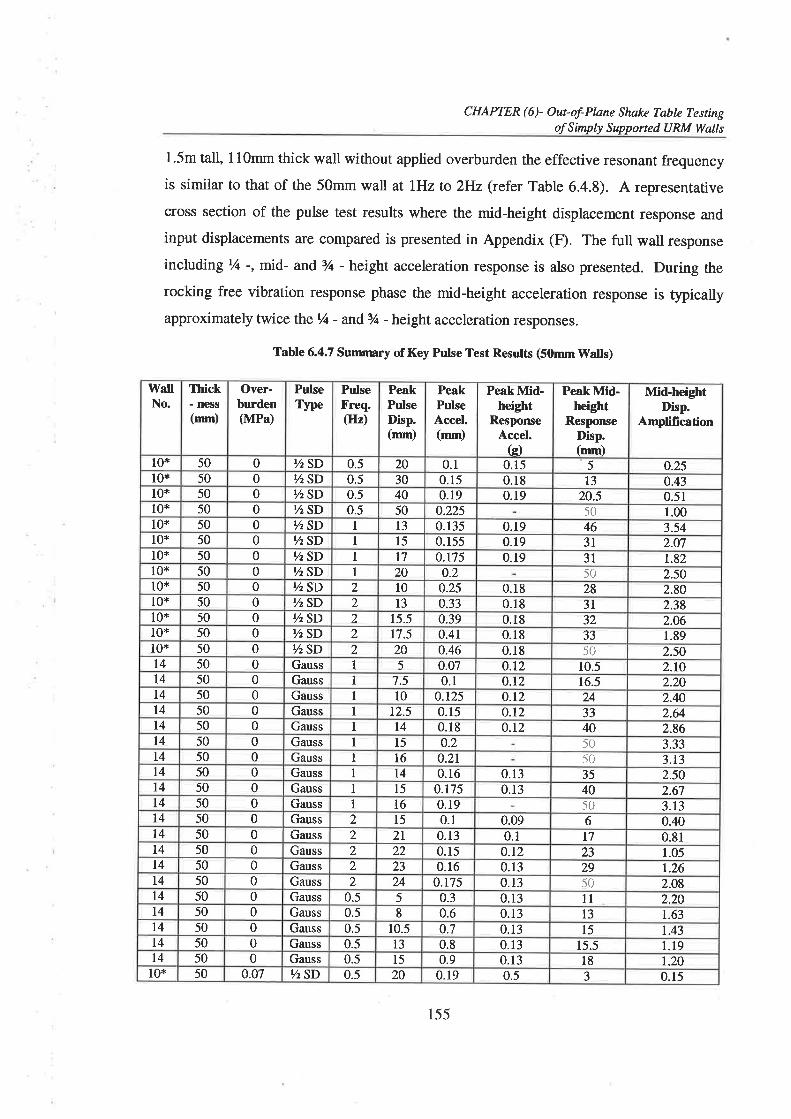
CHAPTER (6)- Outof-Plønc Shalce Table Testingof S imply Supporte d U RM Walls
l.5m tall, 110mm thick wall without applied overburden the effective resonant frequency
is similar to that of the 50mm wall at l}Jz to ZHz (refer Table 6.4.3). A representative
cross section of the pulse test results where the mid-height displacement response and
input displacements are compared is presented in Appendix (F). The full wall response
including t/t -, mid- and 3/¿ - height acceleration response is also presented. During the
rocking free vibration response phase the mid-height acceleration response is typicallyapproximately twice ther/¿ - and3/c - height acceleration responses.
Table6.4.7 Summry of Key Pulse Test Results (S0mmWalls)
WallNo.
Thick- IreSS(mm)
Over-burden(MPa)
PulseType
PulseFreq.(Hz)
PeakPulseDisp.(mm)
PeakPulseAccel.(mm)
PeakMid-height
ResponseAccel.k)
PeakMid-height
ResporueDisp.(mm)
Mid-heightDisp.
Amp[fication
10* 50 0 Y2SD 0.5 20 0.1 0.15 5 0.25l0* 50 0 Y2SD 0.5 30 0.15 0.18 t3 0.43l0* 50 0 Y2SD 0.5 40 0.r9 0.19 20.5 0.5110* 50 0 %sD 0.5 50 0.225 50 1.0010* 50 0 Y2SD I t3 0.135 0.19 46 3.5410* 50 0 Y2SD I l5 0.155 0.19 3t 2.07l0* 50 0 Y2SD I 17 0.175 0.19 3l 1.8210* 50 0 YzSD 1 20 o.2 50 2.s010* 50 0 YzSD 2 10 o.2s 0.18 28 2.80l0* 50 0 YzSD 2 t3 0.33 0.18 3t 2.38l0* 50 0 Y2SD 2 15.5 0.39 0.18 32 2.0610* 50 0 Y2SD 2 r7.5 0.41 0.18 33 1.8910* 50 0 Y2SD 2 20 0.46 0.18 50 2.50t4 50 0 Gauss 1 5 0.07 o.t2 10.5 2.IOl4 50 0 Gauss I 7.5 0.1 o.t2 16.5 2.20t4 50 0 Gauss I l0 0.125 o.t2 24 2.40t4 50 0 Gauss 1 12.5 0.15 o.t2 33 2.64l4 50 0 Gauss 1 t4 0.18 0.r2 40 2.86t4 50 0 Gauss 1 15 0.2 50 3.33I4 50 0 Gauss I T6 o.2l 50 3.13t4 50 0 Gauss I l4 0.16 0.13 35 2.50t4 50 0 Gauss I l5 0.175 0.13 40 2.67l4 50 0 Gauss 1 t6 0.19 50 3.r374 50 0 Gauss 2 15 0.1 0.09 6 0.40l4 50 0 Gauss 2 2l 0.13 0.1 t7 0.81T4 50 0 Gauss 2 22 0.15 0.r2 23 1.05t4 50 0 Gauss 2 23 0.r6 0.13 29 r.26T4 50 0 Gauss 2 u 0.r75 0.13 50 2.08t4 50 0 Gauss 0.5 5 0.3 0.13 11 2.20t4 50 0 Gauss 0.5 8 0.6 0.13 13 1.63t4 50 0 Gauss 0.5 10.5 o.7 0.13 l5 1.43t4 50 0 Gauss 0.5 T3 0.8 0.13 15.5 t.t9t4 50 0 Gauss 0.5 l5 0.9 0.13 18 r.20
10* 50 0.07 t/2SD 0.5 20 0.19 0.5 3 0.15
155
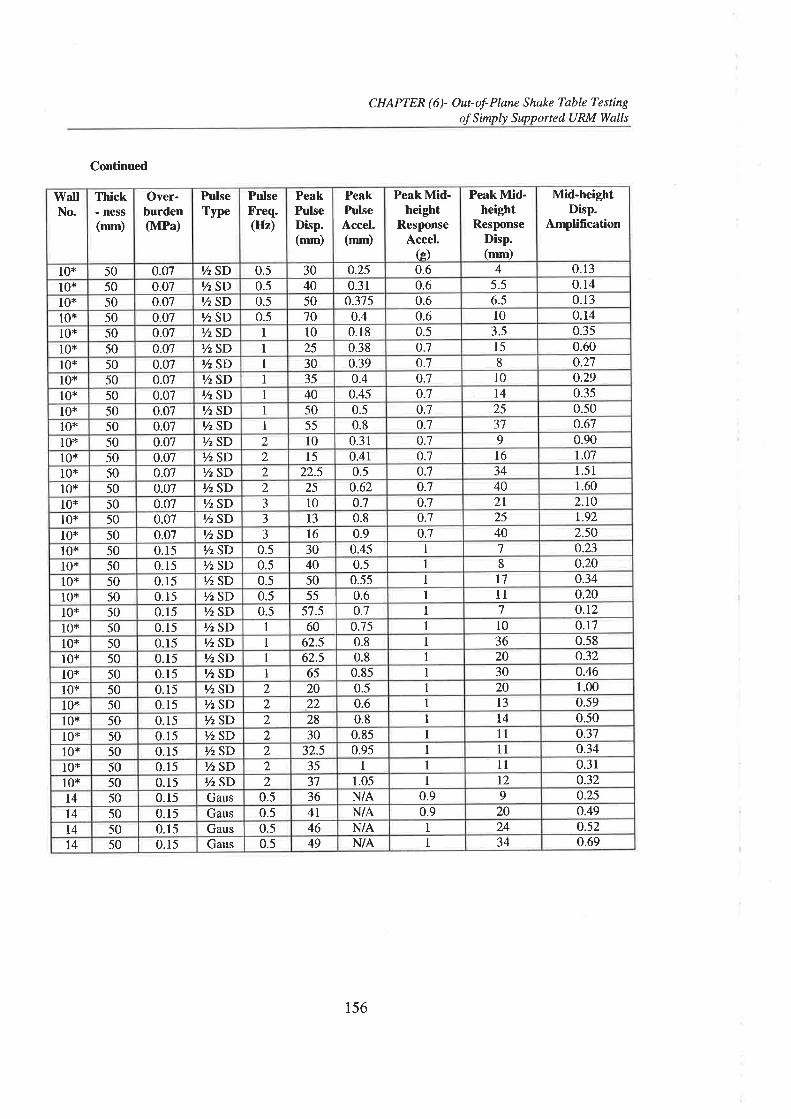
CHAPTER ( 6 )- O ut- of- PIøne Shake Table'le s t ingofSimply Supported URM Walls
Continued
\ilallNo.
Thick- ness(mm)
Over-burden(MPa)
PulseType
PulseFreq.(Hz)
PeakPulseDisp.(mm)
PeakPulseAccel.(mm)
PeakMid-height
ResponseAccel.
G)
PeakMid-height
ResponseDisp.(mm)
Mid-heightDisp.
Amplification
10* 50 0.07 %SD 0.5 30 0.25 0.6 4 0.13l0* 50 0.07 7z SD 0.5 40 0.31 0.6 5.5 0.14l0* 50 0.07 YzSD 0.5 50 0.375 0.6 6.5 0.1310* 50 0.07 7z SD 0.5 'to 0.4 0.6 l0 0.14l0* 50 0.07 7z SD 1 10 0.18 0.5 3.5 0.3510* 50 0.07 Y2SD I 25 0.38 0.7 l5 0.60l0* 50 0.07 lzz SD I 30 0.39 0.7 8 o.2710* 50 0.07 YzSD I 35 0.4 0.7 10 o.2910* 50 0.07 7z SD I 40 0.45 o.7 t4 0.35l0* 50 0.07 7z SD 1 50 0.5 0.7 25 0.5010* 50 0.07 Y2SD I 55 0.8 o.1 37 0.6710* 50 0.07 %SD 2 l0 0.31 0.7 9 0.9010* 50 0.07 YzSD 2 15 0.41 0.1 16 t.o710* 50 0.07 Y2SD 2 22.5 0.5 0;l 34 1.51
l0* 50 0.07 Y2SD 2 25 0.62 0.7 40 1.60
10* 50 0.07 YzSD J 10 0.7 o;l 2l 2.to10* 50 0.07 %SD 3 l3 0.8 0.1 25 r.92l0* 50 0.07 Y2SD J 16 0.9 0.7 40 2.5010* 50 0.15 YzSD 0.5 30 0.45 1 7 o.2310* 50 0.15 YzSD 0.5 40 0.5 I 8 o.2010* 50 0.15 YzSD 0.5 50 0.55 I I7 o.3410* 50 0. r5 t/z SD 0.5 55 0.6 I ll 0.2010* 50 0.15 Y2SD 0.5 57.5 0.7 I 7 o.t210* 50 0.15 Y2SD 1 60 0.15 I l0 0.17
10* 50 0.15 /z SD I 62.5 0.8 I 36 0.5810* 50 0.15 Y2SD I 62.5 0.8 1 20 o.3210* 50 0.15 Y2SD I 65 0.85 I 30 0.4610* 50 0.15 /z SD 2 20 0.5 I 20 1.00
10* 50 0.15 /z SD 2 22 0.6 I l3 0.59
l0* 50 0.15 Y2SD 2 28 0.8 I t4 0.5010* 50 0.15 /z SD 2 30 0.85 I 1l o.3710* 50 0.15 Y2SD 2 32.5 0.95 I ll 0.34l0* 50 0.15 Y2SD 2 35 1 I 1l 0.31
l0* 50 0.15 %SD 2 37 1.05 I t2 0.32t4 50 0.15 Gaus 0.5 36 N/A 0.9 9 o.25t4 50 0.15 Gaus 0.5 4l N/A 0.9 20 o.49l4 50 0.15 Gaus 0.5 46 N/A 1 24 0.52t4 50 0.15 Gaus 0.5 49 N/A I 34 0.69
156
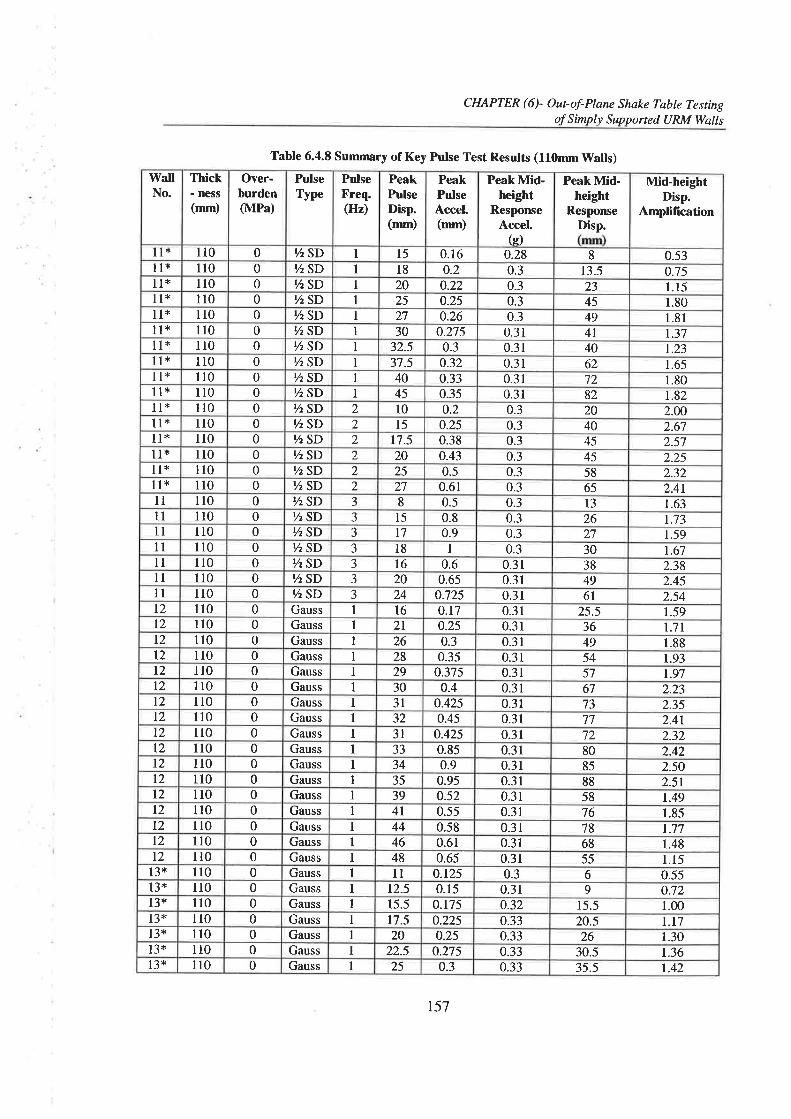
CHAPTER (6)- Out-of-Plane Shake Tøble Testingof Simply Supported URM WaIIs
WallNo.
Thick- ness(nm)
Over-burdenMPa)
PulseType
P¡¡lseFreq.(Hz)
PeakPulseDisp.(mm)
PeakPulseAccel.(mm)
PeakMid-height
ResponseAccel.
(s)
PeakMid-height
ResponseDisp.
Mid-heightDisp.
Amplification
l1r 110 0 7z SD I l5 0.16 0.28 8 0.531l* ll0 0 YzSD I 18 0.2 0.3 13.5 o.751l* ll0 0 YzSD I 20 0.22 0.3 23 l.l5l1r 110 0 /z SD I 25 0.25 0.3 45 1.80l1* 110 0 /z SD I 27 o.26 0.3 49 1.811l* ll0 0 %SD I 30 0.215 0.31 4l 1.371l* ll0 0 %SD I 32.s 0.3 0.31 40 1.23ll* 110 0 /z SD I 37.5 0.32 0.31 62 1.65ll* ll0 0 Y2SD I 40 0.33 0.31 72 1.8011* ll0 0 %SD I 45 0.3s 0.31 82 1.82l1* 110 0 Y2SD 2 l0 o.2 0.3 20 2.AOl1* 110 0 %SD 2 l5 o.25 0.3 40 2.67ll* ll0 0 YzSD 2 17.5 0.38 0.3 45 2.5711* ll0 0 YzSD 2 20 0.43 0.3 45 2.25l1* 110 0 %SD 2 25 0.5 0.3 58 2.32l1* ll0 0 Y2SD 2 27 0.61 0.3 65 2.41l1 ll0 0 YzSD 3 8 0.5 0.3 l3 1.6311 ll0 0 7z SD 3 l5 0.8 0.3 26 t.731l 110 0 Y2SD J t7 0.9 0.3 27 1.59l1 ll0 0 YzSD J l8 I 0.3 30 1.67ll ll0 0 Y2SD J l6 0.6 0.31 38 2.38ll 110 0 %SD J 20 0.65 0.3r 49 2.4511 110 0 %SD 3 24 o.725 0.31 6t 2.54t2 110 0 Gauss I 16 0.17 0.31 25.5 r.59t2 110 0 Gauss I 2t 0.25 0.31 36 t.7rt2 110 0 Gauss I 26 0.3 0.31 49 1.88t2 ll0 0 Gauss I 28 0.35 0.31 54 1.93t2 il0 0 Gauss I 29 0.375 0.31 57 1.97t2 110 0 Gauss I 30 0.4 0.31 67 2.23t2 ll0 0 Causs I 3l 0.425 0.31 73 2.3slz ll0 0 Gauss I 32 0.45 0.31 77 2.41t2 110 0 Gauss I 31 o.425 0.31 72 2.32l2 110 0 Gauss I 33 0.85 0.31 80 2.42l2 ll0 0 Gauss I 34 0.9 0.31 85 2.50T2 110 0 Gauss I 35 0.95 0.31 88 2.5rt2 ll0 0 Gauss I 39 0.52 0.31 58 r.49t2 ll0 0 Gauss I 4l 0.55 0.31 76 1.85t2 110 0 Gauss I 44 0.58 0.31 78 1.17t2 110 0 Gauss I 46 0.61 0.31 68 1.48l2 110 0 Gauss I 48 0.65 0.31 55 1.15l3* 110 0 Gauss I ll 0.125 0.3 6 0.55l3* ll0 0 Gauss I 12.5 0.15 0.31 9 o.7zl3* ll0 0 Gauss I 15.5 0.175 0.32 15.5 1.0013* 110 0 Gauss I 17.5 0.225 0.33 20.5 t.t7l3* ll0 0 Gauss I 20 0.25 0.33 26 1.30l3* 110 0 Gauss I 22.5 0.275 0.33 30.5 1.36l3* 110 0 Gauss I 25 0.3 0.33 35.5 r.42
Table 6.4.8 Sumrmry of Key Pulse Test Results (110mrn Walls)
r57

CHAPTER (6)- Ourof-Pbne Shake Table TestingofSimply Supported URM Walls
WallNo.
Thick- ness(mm)
Over-burden(MPa)
PulseType
PulseFreq.(Hz)
PeakPulseDisp.(mm)
Peakh¡lseAccel.(mm)
PeakMid-height
ResponseAccel.
(s)
PeakMid-height
ResponseDisp.(mm)
Md-heightDisp.
Amplification
13* 110 0 Gauss I n.5 0.325 0.33 40 r.4513+ 110 0 Gauss I 3L 0.35 0.33 45 r.4513* 110 0 Gauss I JJ 0.4 0.33 57 1.73
13+ 110 0 Gauss 1 36 o.45 0.33 65 1.81
13* 110 0 Gauss 1 38 0.5 0.33 55 1.4513* 110 0 Gauss 1 40 0.55 0.33 50 r.25l3* 110 0 Gauss I 42.5 0.6 0.33 45 1.06
13* 110 0 Gauss 1 44 0.65 0.33 44 1.0013* 110 0 Gauss I 45 o.7 0.33 50 1.1 1
13* 110 0 Gauss 0.5 50 0.225 0.33 20 0.4013* 110 0 Gauss 0.5 55 o.25 0.33 24 o.4413* 110 0 Gauss 0.5 60 o.275 0.33 28 o.4713* 110 0 Gauss 0.5 65 0.3 0.33 4l 0.63l3+ 110 0 Gauss 0.5 70 0.35 0.33 85 t.2rl3* 110 0 Gauss 0.5 70 0.4 0.33 7l 1.01
13* 110 0 Gauss 0.5 75 0.45 0.33 76 1.01
l3r 110 0 Gauss 0.5 80 0.5 0.33 74 0.9313* 110 0 Gauss 0.5 82.5 0.55 0.33 95 1.15
13* 110 0 Gauss 0.5 85 0.575 0.33 69 0.8r13* 110 0 Gauss 0.5 87.5 0.6 0.33 85 0.9713* 110 0 Gauss 0.5 90 0.625 0.33 76 0.84
Continued
Presented in Appendix (F)
The results also indicated that the wall thickness had only a small impact on the effective
resonant frequency but the application of overburden significantþ increased the effective
resonant frequency. This can be explained, as a change in the wall thickness does not
alter the average incremental cycle secant stiffness, Kur", and thus the effective resonant
frequency however an increase in overburden does (refer Figure 6.4.26). For a rigid wall
this is because an increase in wall thickness does not alter the negative stiffness value, as
both of the 'rigid resistance' fotce, R.(1), and instability displacement, A¡¡s¡¡6¡¡y, âfe
increased proportionally. The average incremental secant stiffness and effective resonant
frequency therefore remain the same. In contrast, with an increased overburden applied
at the leeward face, as was the case for the test specimens, Ç(1) is reduced as &(1)
increases however Âinsøbiìity does not alter. Thus, the average incrernental cycle secant
stiffness is increased. This is shown in Figure 6.4.14 where higher response frequencies
for the 50mm wall specimens with overburden are obseryed than without. Where an
158
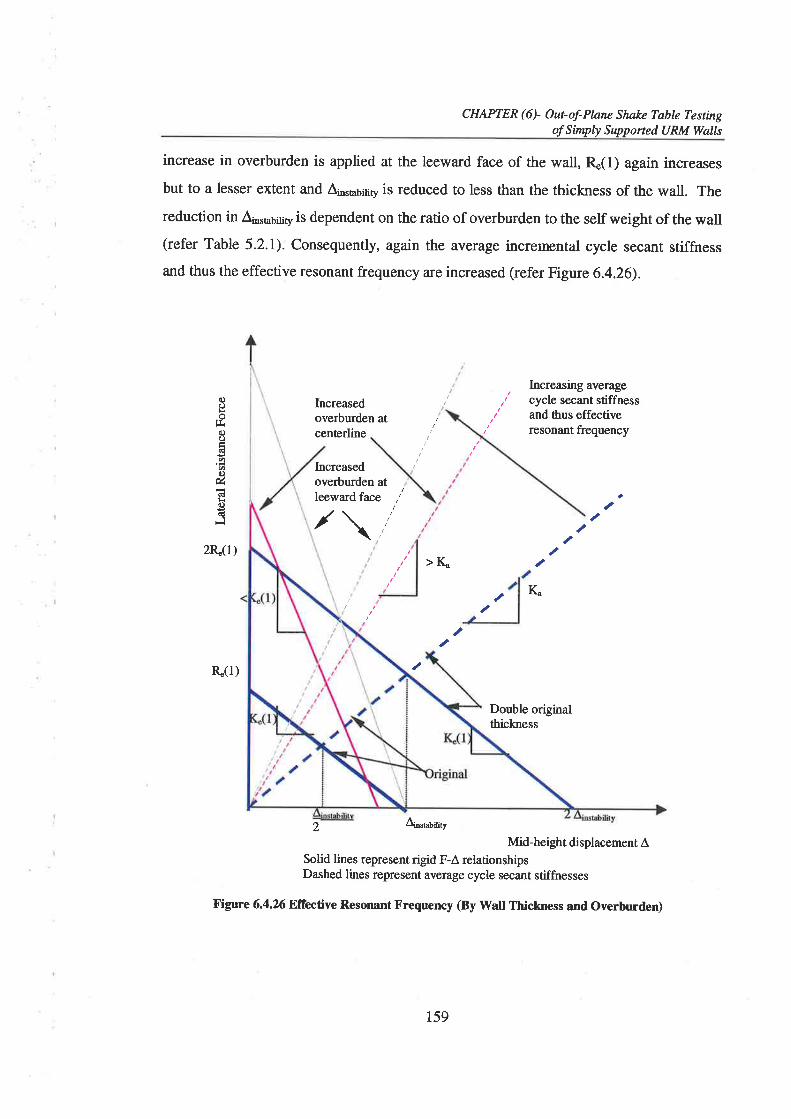
CHAPTER (6)- Out-ol-Plane Shalcc TøbIe Testingof Simply Supported URM WøIls
increase in overburden is applied at the leeward face of the wall, R"(1) again increases
but to a lesser extent and ¡s¡¿61¡t, is reduced to less than the thickness of the wall. The
reduction in A¡.66i¡s, is dependent on the ratio of overburden to the self weight of the wall(refer Table 5.2.1). Consequentþ, again the average incremental cycle secant stiffness
and thus the effective resonant frequency are increased (refer Figure 6.4.26).
oÊ
Í¡r(l)oÉsaøú.)úclÈc(d
tl
Increasedoverburden atcenterline
Increasedoverburden atleeward face ,,'
Increasing ayera5ecycle secant stiffnessand thus effectiveresonant frequency
a
aa/\ ,aa
2R (1)>K u
K.aa,
R.(1)
Double originalthickness
Âinst¿bility
Mid-height displacement ÂSolid lines represent rigid F-Â relationshipsDashed lines represent ayeruge cycle secant stiffnesses
Figure 6.4.26E,frælíve Resonant Frequerrcy (By rvall rhickress and overburdeÐ
aa
2
159
CHAPTER (6)- Outof-Plane Shake Table Testingof Simply Supported URM Walls
Experimentally the range of effective resonant frequency observed is due to the changing
state of the rotation joints with continued testing and degradation of the rotation joints
flattening the F-À relationship. As such, there is a coresponding decrease in the average
incremental cycle secant stiffness and thus the effective resonant frequency of the wall.
6.4.7.2. Real Earthquake Excitation Tests
To complete the investigation into the response of both loadbearing and non-loadbearing
simply supported URM walls to transient excitations, shaking table tests were performed
using real earthquake accelerogram records to drive the shaking table. A comparison of
recorded table accelerations with the original accelerograms has shown a reasonable level
of correlation. Instrumentation as described in Section 6.2.3 was used to capture the
dynamic response behaviour of the wall specimens.
To investigate wall response over a range of excitation, relevant real earthquake scenario
of both 'low frequency large displacement' and 'high frequency small displacement'
excitation were selected. Table 6.4.9 presents a summary of the earthquake excitations
used for investigation. By comparison of the PGD and PGA an indication of the type and
severity of the earthquake can be attained. For instance it can be seen that the Nahanni
aftershock has a relatively high PGA but a small PGD indicating that this earthquake had
a dominant high frequency component. This was determined from the power frequency
spectrum as approximately l.75Hz to 2.25H2. Although traditionally this would
therefore not be expected to impact greatly on ductile structures the large accelerations
would be expected to impact more severely on stiff brittle structures. The Taft, Pacoima
Dam and ElCentro earthquakes typically have higher PGD and similarly large PGA thus
indicating a lower dominant frequency in the range of 0.7H2 to l.lHz.
In a similar fashion to the pulse tests each earthquake excitation was displacement
normalised setting the peak excitation displacement (PGD) to unity. The Vo of the
original excitation could then be related to the PGD input to the table. For each applied
excitation the 7o of the original excitation, was gradually increased until rocking and
ultimately instability of the wall specimen occurred. The peak transient excitation
160
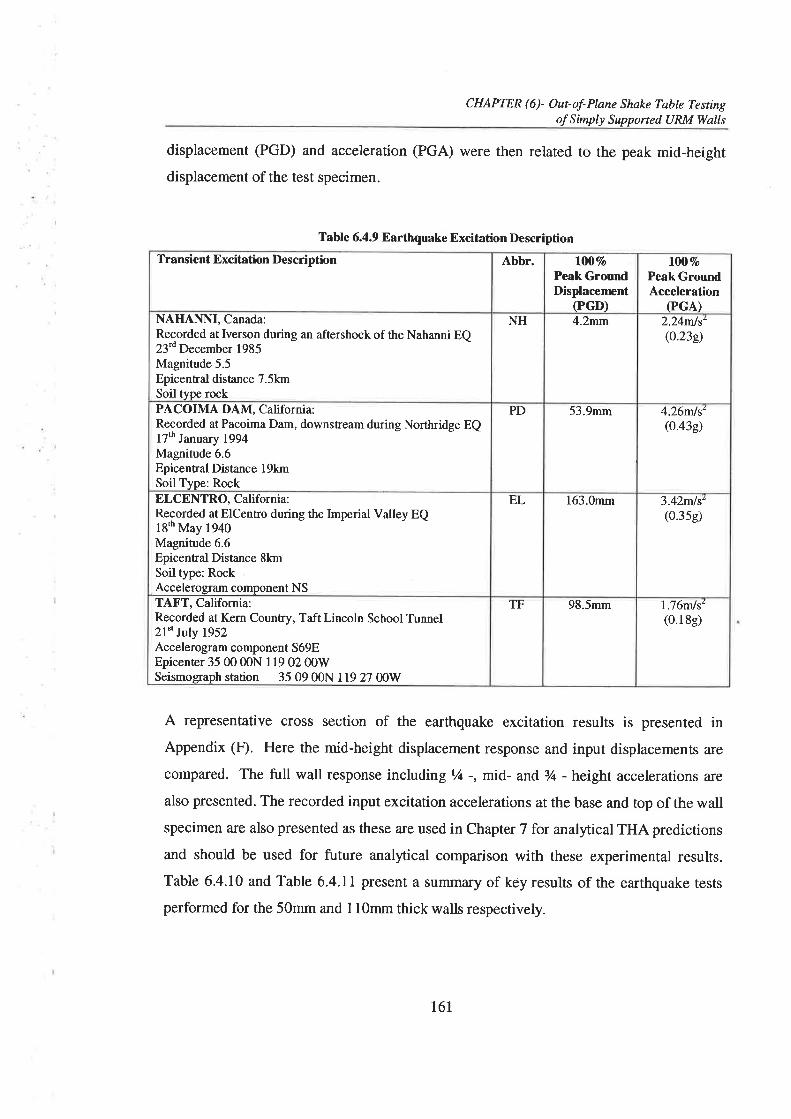
CHAPTER (6)- Out-of-Plane Shake Table Testingof Simply Supported URM Walls
displacement (PGD) and acceleration (PGA) were then related to the peak mid-height
displacement of the test specimen.
Table 6.4.9 Earthquake Excitation Description
A representative cross section of the earthquake excitation results is presented inAppendix (F). Here the mid-height displacement response and input displacements are
compared. The full wall response includingr/¿ -, mid- and 3/n -heigltt accelerations are
also presented. The recorded input excitation accelerations at the base and top of the wall
specimen are also presented as these are used in Chapter 7 for analytical THA predictions
and should be used for future analytical comparison with these experimental results.
Table 6.4.10 and Table 6.4.11present a summa¡y of key results of the earthquake tests
performed for the 50mm and l lOmm thick walls respectively.
Transient Excitation Description Abbr. ItÙVoPeak GroundDisplacenrent
(PGD)
lAOToPeak GroundAcceleration
(PGA)NAHANNI, Canada:Recorded at Iverson during an aftershock of the Nahanni EQ23'd December 1985Magnitude 5.5Epicentral distance 7.5krnSoil type rock
NH 4.2mm 2.24mJs'(o.23e)
PACOIMA DAM, California:Recorded at Pacoima Dam, downsteam during Northridge EQlTth January 1994Magnitude 6.6Epicenral Distance I thnSoil Type: Rock
PD 53.9mm 4.26¡nls'(0.43e)
ELCENTRO, California:Recorded atElCentro during the Imperial Valley EQl8'h May 1940Magnitude 6.6Epicennal Distance 8l¡nSoil rype: RockAccelerogram component NS
EL 163.0mm 3.42m1s"(0.3se)
TAFT, California:Recorded at Kern Counfy, TaftLincoln School Tunnel21"'JDly 1952Accelerogram component S69EEpicenter 35 00 00N I 19 02 00rr)YSeismograph station 35 09 00N ll9 27 ODW
TF 98.5mrn I.76rnls"(0.18e)
161
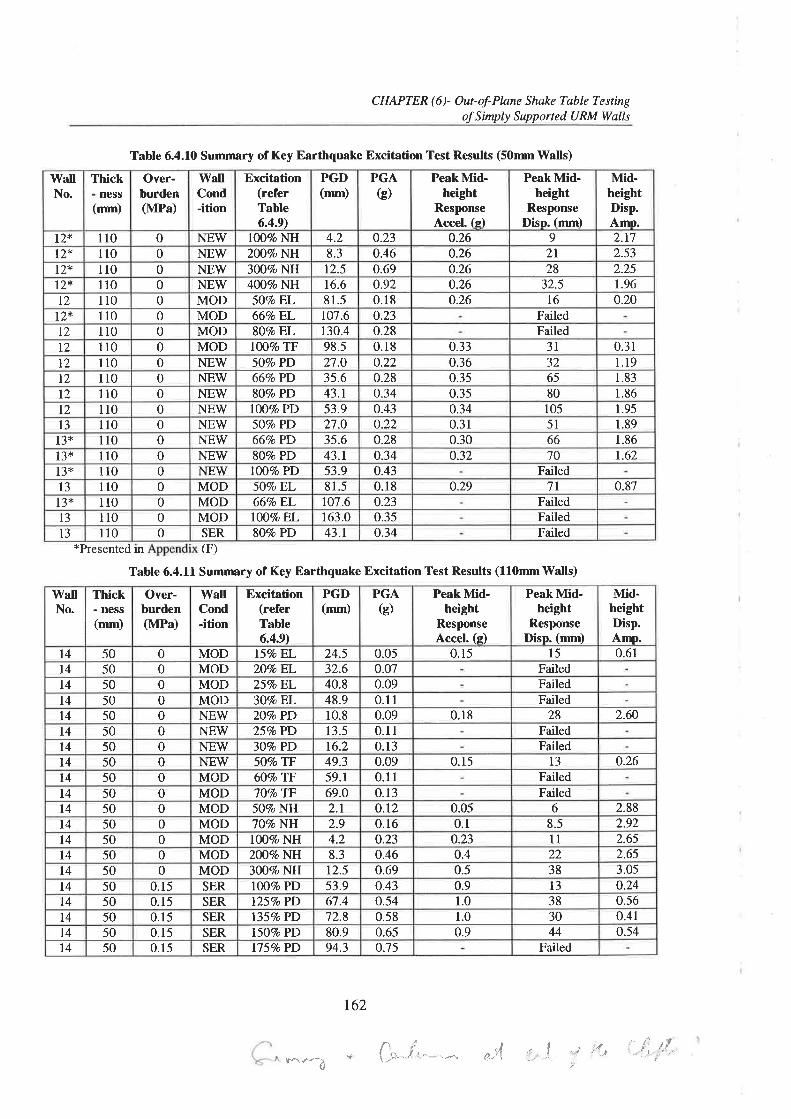
PGD(mm)
PGAG)
PeakMid-height
ResponseAccel. (s)
PeakMid-height
ResponseDisp. (mm)
Mid-heightDisp.Amo.
WallNo.
Thickness
(mm)
Over-burden(MPa)
WâtlCond-ition
Excitation(referTable6.4.9)
2.t7l2* 110 0 NEV/ 1007o NH 4.2 0.23 0.26 90 NEW 200% NH 8.3 0.46 0.26 zt 2.5312" ll00 NEVT 3007o NH 12.5 0.69 0.26 28 2.2512" 110
4007o NH 16.6 0.92 o.26 32.5 1.96l2* 110 0 NEW0.18 0.26 16 0.20t2 110 0 MOD 5OVoEL 81.50.23 Failedl2* 110 0 MOD 66VoEL t01.6
t2 110 0 MOD SOVoEL 130.4 0.28 FailedMOD 1007o TF 98.5 0.18 0.33 3t 0.3rt2 110 0NEV/ 50VoPD 2',1.0 0.22 0.36 32 1.19t2 110 0
66VoPD 35.6 0.28 0.35 65 1.83t2 110 0 NEV/l2 110 0 NEW 8O7oPD 43.1 o.34 0.35 80 1.8612 ll0 0 NEW I00VoPD 53.9 o.43 0.34 105 1.95t3 110 0 NEW 5OVoPD 27.0 o.22 0.31 5l 1.89
0 NEW 667oPD 35.6 0.28 0.30 66 1.86l3* ll0110 0 NEW 8O7oPD 43.1 0.34 0.32 70 t.62l3*
NEìW IOOVoPD s3.9 o.43 Failed13* 110 081.5 0.18 0.29 7I 0.87t3 110 0 MOD 5OVoEL
667oEL r07.6 0.23 Failedl3* 110 0 MOD163.0 0.35 FailedT3 110 0 MOD IOOVoEL
13 110 0 SER SOVoPD 43.1 0.34 Failed
CHAPTER (6)- Ouçol-Plane Shake Tøble Testingof Simply Supported URM Walls
Table 6.4.10 Sumrnary of Key Earthquake Excitation Test Results (50mm Walls)
*Presented rn (F)
Table 6.4.11 Sumnrary of Key Earthquake Excitation Test Results (l10mmWalls)
r62
f' ,? .t - L .,î ' j'ff"{-o. 'f .- \..4 a-l\ '' . r ':' t t i t..''
WallNo.
Thick- ness(mm)
Over-burden(MPa)
WallCond-ition
Excitation(referTable6.4.91
PGD(mm)
PGAG)
PeakMid-height
ResponseAccel. (s)
PeakMid-height
ResponseDisp. (mm)
Mid-heightDisp.Amp.
t4 50 0 MOD l5VoEL 24.5 0.05 0.r5 l5 0.61t4 50 0 MOD 2OVoEL 32.6 0.07 Failedl4 50 0 MOD 25VoEL 40.8 0,09 Failedt4 50 0 MOD 3O7oEL 48.9 0.1l Failedl4 50 0 NEV/ 2OVoPD 10.8 0.09 0.18 28 2.6014 50 0 NEV/ 25VoPD 13.5 0.1I Failedt4 50 0 NEV/ 307oPD 16.2 0.13 Failedt4 50 0 NEV/ 5OVo TF 49.3 0.09 0.15 13 0.26l4 50 0 MOD 60VoTF 59.1 0.11 Failedt4 50 0 MOD TOVoTF 69.0 0.13 Failedt4 50 0 MOD 50% NH 2.1 o.t2 0.05 6 2.88t4 50 0 MOD 70VoNH 2.9 0.16 0.1 8.5 2.92t4 50 0 MOD 100% NH 4.2 0.23 0.23 l1 2.65t4 50 0 MOD 2007¿ NH 8.3 0.46 0.4 22 2.65t4 50 0 MOD 3007o NH 12.5 0.69 0.5 38 3.05t4 50 0.15 SER IOOVoPD 53.9 o.43 0.9 t3 0.24l4 50 0.15 SER I25VoPD 67.4 0.54 1.0 38 0.56t4 50 0.15 SER l35VoPD 72.8 0.58 1.0 30 0.41t4 50 0.15 SER l5OToPD 80.9 0.65 0.9 44 0.54t4 50 0.15 SER l75Vo PD 94.3 0.7s Failed
*'-ì *

7. NON.LINEAR TIME HISTORY
ANALYSIS DBVELOPMENT
7.1. Introduction
Non-linear time-history analysis (THA) based on time-step integration is the most
representative and reliable method of accounting for the time-dependent nature of URM
wall response to applied excitations provided that the non-linear (F-Â) and damping
properties are accurately represented in the analyical model.
Time-stepping procedures have been developed for basic linear single degree-of-freedom
(SDOÐ systems having a known linear stiffness and damping component. This method
relies upon an assumption on the response behaviour between consecutive time steps
which permits the dynamic response to be estimated from the applied excitation. One
such assumption is the 'Newmark' constant acceleration assumption. For the rocking
response of 'semi-rigid' URM walls, since both the stiffness and damping properties are
highly non-linear and because the entire system mass is not mobilized evenly, the
response behaviour does not strictly follow the basic linear SDOF equation of motion.
Consequently, to permit the use of time-stepping procedures by substtution of the linear
SDOF damping and stiffness components with non-linear damping and stiffness
properties, correlation between the non-linea¡ 'semi-rigid' rocking and basic linear SDOF
system equations of motion must be established.
The following chapter presents the development of a specialised non-linear THA
program for the 'semi-rigid' rocking response of simply supported URM walls. This
includes the development of algorithms by comparison of the SDOF and non-linear
rocking equations of motion. Consideration to the various support conditions identihed
for Australian URM construction in Chapter 2 is also provided for in the non-linear THA
163
CHAPTER (7) - Non-Linear Time HistoryAnalysis Development
program. Calibration of the stiffness and damping properties and confîrmation ofanalytical predictions by comparison with experimental results described in Chapter ó are
also presented.
In the past the use of TIIA for the analytical prediction of the 'semi-rigid' rocking
response of simply supported URM walls has been restricted to commercially available
softwa¡e not designed specihcally for URM wall analysis. Consequently these
predictions have been limited and have not been adequately confirmed by experimental
studies. The main advantage of the current THA program is that it has been designed to
specifically take into account the critical non-linear stiffness and damping properties
which have been calibrated using the experimental results presented in Chapter 6. The
effect of various support conditions and degradation of rotation joints on the non-linear
stiffness component was also examined so that analytical comparisons of various realistic
situations are possible.
Although THA has limited application in design, as loading scenarios are diverse, itremains a valuable resea¡ch analysis tool. In Chapter 8 the developed THA program is
used to undertake an in-depth parametric study of the 'semi-rigid' rocking response ofsimply supported URM walls to further investigate the physical parameters whichinfluence URM wall response. Having developed an understanding of these criticalparameters a simplihed analysis procedure is then proposed and its effectiveness assessed
against the more comprehensive THA predictions.
7.2.ßnef Description of Basic Linear SDOF System
To permit the use of time-stepping procedures for the highly non-linear 'semi-rigid'
rocking response of simply supported URM walls an understanding of the development
of the dynamic equation of motion for a basic linear SDOF system is first required. Later
this will be expanded into the development of dynamic equations of motion for the non-
linear 'semi-rigid' rocking of the simply supported URM walls having various support
conditions.
164
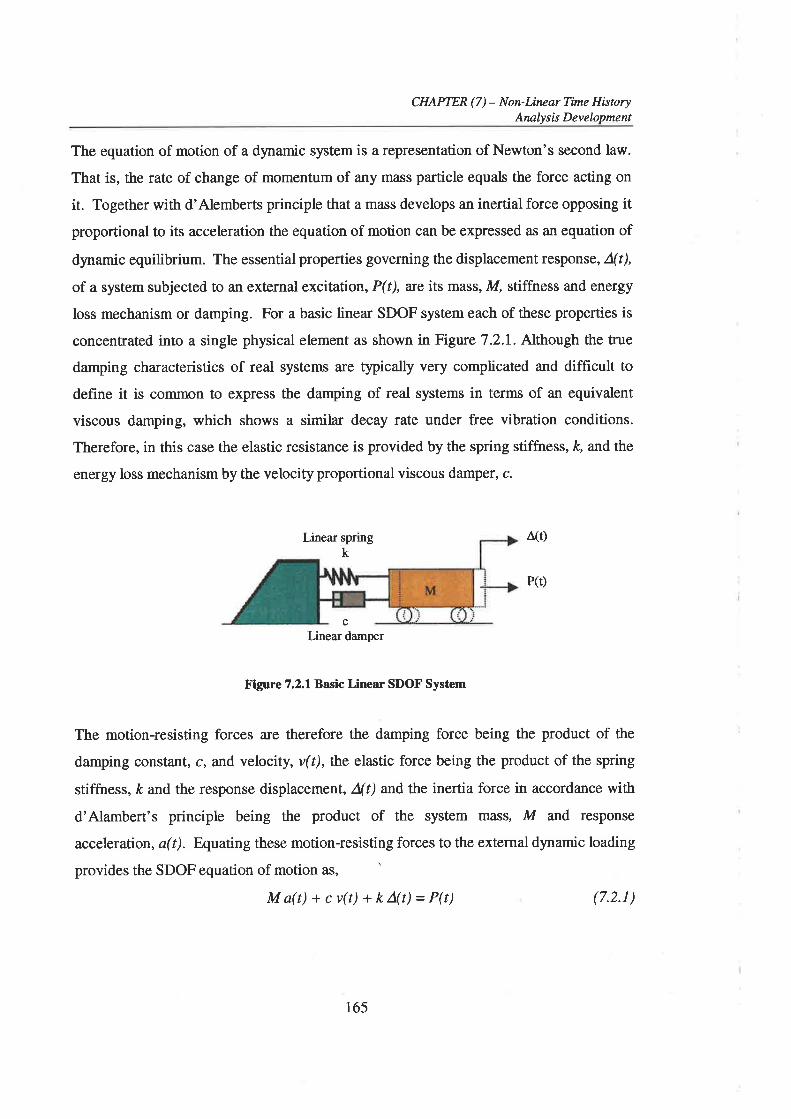
CHAPTER (7) - Non-Linear Time HistoryArwlysis Development
The equation of motion of a dynamic system is a representation of Newton's second law.
That is, the rate of change of momentum of any mass particle equals the force acting on
it. Together with d'Alemberts principle that a mass develops an inertial force opposing itproportional to its acceleration the equation of motion can be expressed as an equation of
dynamic equilibrium. The essential properties governing the displacement response, A(t),
of a system subjected to an external excitation, P(t), are its mass, M stiffness and energy
loss mechanism or damping. For a basic linear SDOF system each of these properties is
concentrated into a single physical element as shown in Figure 7.2.1. Although the true
damping characteristics of real systems are typically very complicated and difficult to
define it is common to express the damping of real systems in terms of an equivalent
viscous damping, which shows a similar decay rate under free vibration conditions.
Therefore, in this case the elastic resistance is provided by the spring stiffness, /<, and the
energy loss mechanism by the velocity proportional viscous damper, c.
Linear springk ^(t)
P(t)
cLinear damper
Figure 7.2.1 B,asic Linea¡ SDOF System
The motion-resisting forces are therefore the damping force being the product of the
damping constant, c, and velocity, v(t), the elastic force being the product of the spring
stiffness, ft and the response displacement, A(t) and the inertia force in accordance with
d'Alambert's principle being the product of the system mass, M and response
acceleration, a(t). Equating these motion-resisting forces to the external dynamic loading
provides the SDOF equation of motion as, \
Ma(t) + cv(t) +kA(t)= P(t) (7.2.1)
165
CHAPTER (7) - Non-Linear Tilne HistoryAnalysis Development
If the loading to be considered is due to ground or support excitation this can be included
by expressing the inertial force in terms of the two acceleration components. By
re¿uranging and substit uting ø,z=!rh" basic linear SDOF system dynamic equation of"Mmotion becomes,
aQ) + -L vlt) + a2 L(t¡ = - a, (t) (7.2.2)
where ú) = un-damped elastic angular natural frequency
By solving the dynamic equation of motion (Equation 7.2.2) it can be shown (Clough and
Penzien 1993) that for an under-critically damped system the critical damping coeff,rcient,
c., is,
cc=2M@=4Mnfwhere/- un-damped elastic natural frequency
(7.2.3)
Therefore by definition the SDOF equivalent viscous damping, 6sno¡, is,
€soor = c/cr= c/4 M nf (7.2.4)
and the SDOF proportional damping coefficient, csDoF,
Csoor=4MnfSnor (7.2.s)
Further to this by substituting zero initial conditions in to the SDOF dynamic equation ofmotion solution it can be shown that for €,spor less than approximately 20Vo,,
r, = 1 ,rrl^'l5soor -fi ",[O* J
where 7ç = peak amplitude at the nù cycle
Ân+r = peak amplitude at the (n+1)ù cycle
(7.2.6)
166

CHAPTER (7) - Non-Linear Time HistoryAnalysis Development
It should be noted that both the SDOF based equations 7.2.4 to 7.2.6 were used to
determine c and ( respectively for the experimental rocking wall in Section 6.4.6.2.
Since for the rocking v/all the system mass is not mobilized evenly as is assumed above a
conversion is required, as will be discussed in Section 7.3.
7.3. Negative Stiffness System Modelled as a Basic Linear SDOF System
In the following discussion a negative stiffness system is dehned as a system having a bi-
linea¡ F-Â relationship (refer Figure 7.3.I) comprising an initial infinite stiffness
component followed by a negative stiffness component. On application of a force to the
negative stiffness system, initially the infînite stiffness governs the behaviour until the
'threshold resistance' force, R.(1), is exceeded. Following this a negative stiffness,
IÇ(1), takes effect so that the force resistive capacity is reduced with increased
displacement. As described in Chapter 5, for 'semi-rigid' rocking the non-linear F-A
relationship has a negative stiffness component. It is thus pertinent to first examine the
modelling of a negative stiffness system as a basic linear SDOF system to determine ifexisting time-stepping procedures can be utilised.
R"(1)Half cycle under consideration
Negative stiffness
K(1)
Âvo DisPlacement Âr"o¡¡¡y
Figure 7.3.1 Negative Stiffness F-Â Relationship
(.)oHoq)oclaØ(,)úc)Ø>¡U)
^(r)
1)+IÇ(1)^(t)
t67
CHAPTER (7) - Non-Lineør Titne HistoryAnalysß Development
For all displacements, ^(t),
greater than zero, at any given time the instantaneous secant
stiffness, Kdt), can be derived as,
K" 1r¡ =Ul)- + K, (1) for L(t) > 0 (7 .3 .t)^(/)
This non-linea¡ instantaneous secant stiffness relationship is then used to derive the non-
linear frequency-displacement ff-L) relationship for the negative stiffness system whichbecomes,
a=2nf= K"(t)(7.3.2)M
Rearranging this and substituting in the non-linear instantaneous secant stiffnessrelationship gives the generic response frequency,
R,(1)
^(r)
+ K"(l)
Mfor L(t) > 0
2n(7.3.3)
Assuming that the entire system mass is evenly mobilized the complete equation ofdynamic equilibrium for the negative stiffness system is derived as,
Ma(t) + cv(r) + R "(1)
+ rK" (1)^(r) = - Ma, (t) for L(t) > 0 (7 .3.4)
By rearranging and substituting the non-linear instantaneous secant stiffness relationship
the equation of dynamic equilibrium for a negative stiffness system subjected to a base
excitation is,
a(t)+#rrrr*K"!)-tç)=-ar(t) for L(t) > 0 (7.3.5)
Thus, by comparison of the dynamic equation of motion for a basic linea¡ SDOF system(Equation 7.2.2) and for the negative stiffness system (Equation 7.3.5) it can be seen that
f
168
CHAPTER (7) - Non-Linear Time HistoryAnalysis Development
a similarity exists provided that the non-linear instantaneous secant stiffness relationship
is substituted for the linear stiffness. Thus by adopting this substitution the time-stepping
procedure can be applied to the negative stiffness system.
7.4. Rigid simply supported object Rocking Response About Mid-
height - Dynamic Equation of Motion
As a second phase in the modelling of the real 'semi-rigid' URM wall rocking response
for illustrative purposes we now consider the idealised simply supported rigid rocking
scenario. Here, as was the case for the negative stiffness system the idealised rigid F-À
curve is comprised of a bi-linear F-A relationship having an initial infinite stiffness
followed by a negative stiffness component due to P-A effects (refer Section 5.2.1). The
defining terms of the bi-linear F-Â curve, the 'rigid resistance threshold' force, R"(1), and
negative stiffness IÇ(1) are functions of the wall geometry and applied overburden at the
top of the simply supported object. Also influencing R.(1) and Ç(1) are the support
conditions as these govern the eccentricity of the vertical reactions.
For the rigid rocking of a simply supported object about it's mid-height it must also be
recognised that during the dynamic response the full system mass is not mobilized
evenly. Consequently, this must be considered when deriving the systems dynamic
equation of motion. As was concluded from the experimental study (Chapter 6) a
triangular acceleration distribution relative to the supports provides a good assessment of
the rocking object's acceleration response and is thus adopted. This therefore impacts on
both the dynamic stiffness and damping components of the dynamic equation of motion.
The following calculation illustrates the derivation of the dynamic equation of motion for
a rigid non-loadbearing simply supported wall rocking about a mid-height crack. This is
further related to the generic dynamic equation of motion for various rigid rocking
objects having other support conditions relevant to Australian masonry construction.
For any rigid rocking object the static bi-linear F-À relationship can be generically
defined as Equation 7.4.1 where R. (1) represents the 'rigid threshold resistance' force,
769
CHAPTER (7) - Non-Linear Time HistoryAnalysis Development
IÇ(1) the negative stiffness component (-R*(1)/Ai"søuiuty) and Fr(t) the evenly distributed'quasi-static' force. Further, the bracketed termrepresents the instantaneous static secant
stiffness, K,(t) at the mid-height displacement Â(t).
(7.4.1)
For a rigid non-loadbearing simply supported wall the static F-A relationship is derived
âS'
-FsQ)--Mo,(t)=[#*K"cl]r'l forL(t)>0
- F rt) - - Ma c Q) = M[f t# -'1)^,,, for A(t) > 0 (7.4.2)
The generic defining terms of the static a-a relationship are therefore,
'Rigid Threshold Resistance' force n "e)=ß#
K "(t)=-49Negative Stiffness
Displacement at static incipient instability Linsøa;tiryK"(t)
'Where the load is applied dynamically the acceleration response also comprises atriangular acceleration component, a-(t), as shown in Figure 7.4.1. The dampingcomponent of the equation of motion will be neglected at this stage but will be discussed
in more detail following the derivation.
170
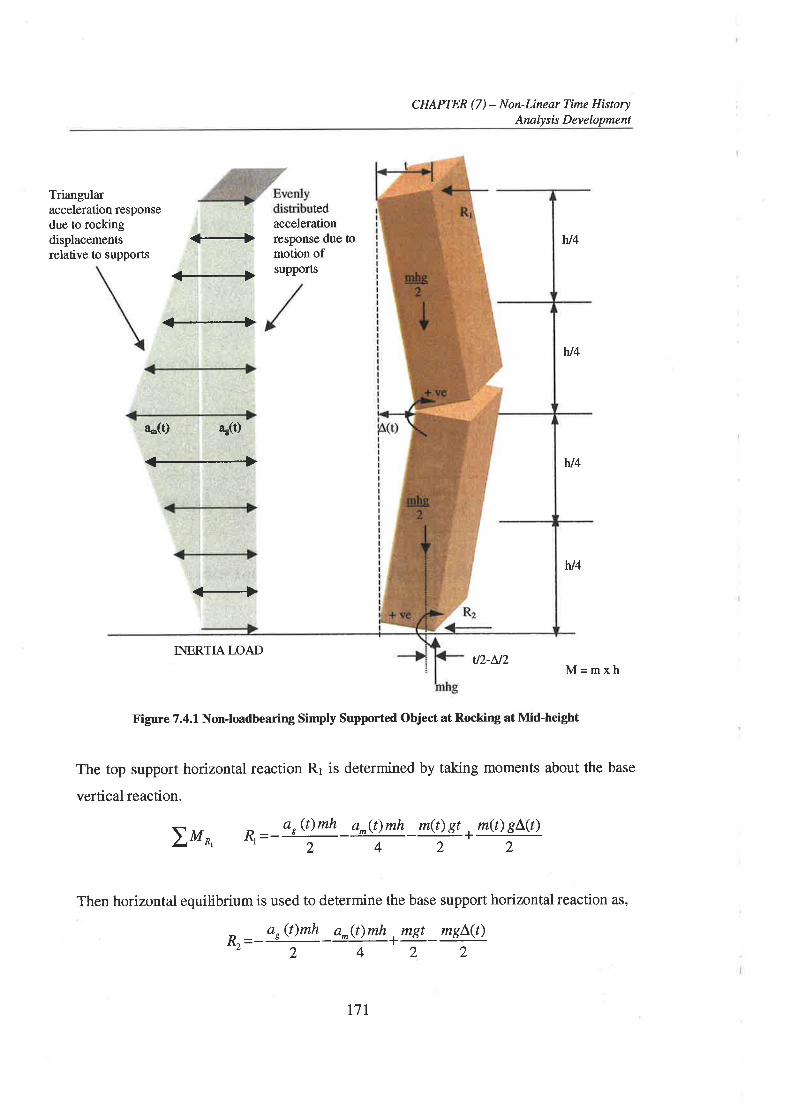
CHAPTER (7) - Non-Linear Time HistoryArnlysis Development
Triangularacceleration responsedue to rockingdisplacementsrelative to supports
t€dacceleration
.(-..Ð responsedueto ht4motion ofsupports
w4
a.(t) Cr0)
-
ht4
ht4
<¡.+
INERTIALOADtÍ2-N2 M=mxh
Figure 7.4.1 NonJmdbearing Simply Supported Object at RocHng at Mid-height
The top support horizontal reaction Rr is determined by taking moments about the base
vertical reaction.
2M ^, R' __ar(t)mh _a^(t)mh _!n(t) gt +m(t) gLG)
2422
Then horizontal equilibrium is used to determine the base support horizontal reaction as,
h a,(t)mh a^(t)mh , mgt mg\(t)nt=-a- 2 - z
777
CHAPTER (7 ) - Non-Linear Time HistoryAnnlysis Developrnent
Now considering the dynamic equilibrium of the top free body, by taking moments about
the mid-height vertical reaction, the mid-height dynamic equation of motion is,
"^ur.}(+h ,]\¡a>=-)",a> ror*(t)>, (7 43)
Writing this in generic terms becomes,
Including the damping component,
"^@*1;[[#. r,rrr]Jnr')=-2o,(t) rora(t)>o (7.4.4)
-̂tt) ,(t) for L(t) > 0 (7.4.5)2
where the proportional damping coefficient has been measured at the effective mass, Mr,of the responding wall.
In order to continue to use the mid-height wall response as in Chapter 6 rather than the
response at the position of the effective mass the damping term must be multiplie dby 213
to compensate for the relative velocities.
The dynamic equation of motion for the rigid non-loadbearing simply supported objectrocking about its mid-height therefore becomes,
a ^
Ø + L* v e) + i(+l#-'] )^,
"^u,.1(ø1,,,, . i(+lh-'] )^r,, =- 1o,,,, for L(t) > O (7 .4.6)
172
CHAPTER (7) - Non-Linear Time HistoryAnalysis Development
This can again be rewritten in generic terms as,
a^(t).i(t\.,v (' ) + i;(H+ r' or )n'
) = - |a,(t) lor L(t) > o (7 .4.7)
and by substituting the instantaneous static secant stiffness, K(t), as,
,, zf r I 'rr\+ 1K"(t) 3 .."^Ø*;ln
" )",rr,r* ZËo(t)=-ia,(t) forL(t)>0 (7.4.8)
Comparing the basic linear SDOF equation of motion (Equation 7.2.2) previously
developed for the system shown in Figure 7.2.1 and the generic dynamic equation of
motion for rigid rocking objects (Equation 7.4.6) it is evident that the following
substitutions can be made to permit the use of time stepping procedures and the mid-
height response of the wall.
l. Substitute the linear SDOF proportional damping with 213 of the experimentally
derived values
2. Substitute the linear stiffness component with the dynamic non-linear instantaneous
secant stiffness, IÇr(t), represented by 312 times the static instantaneous secant
stiffness. This is achieved by applying a factor of 312 to the static F-A relationship.
K^çt¡=1y,ç¡¿
3. Apply a conversion factor of 312 to the applied ground acceleration.
Also from Equation 1.4.7 the theoretical rigid mid-height fA relationship without
K"(t)damping can be derived in accordance with a =2n f = in generic terms as,
M"
l(ffi.*"r,M.f (7.4.e)2n
173
for L(t) > O
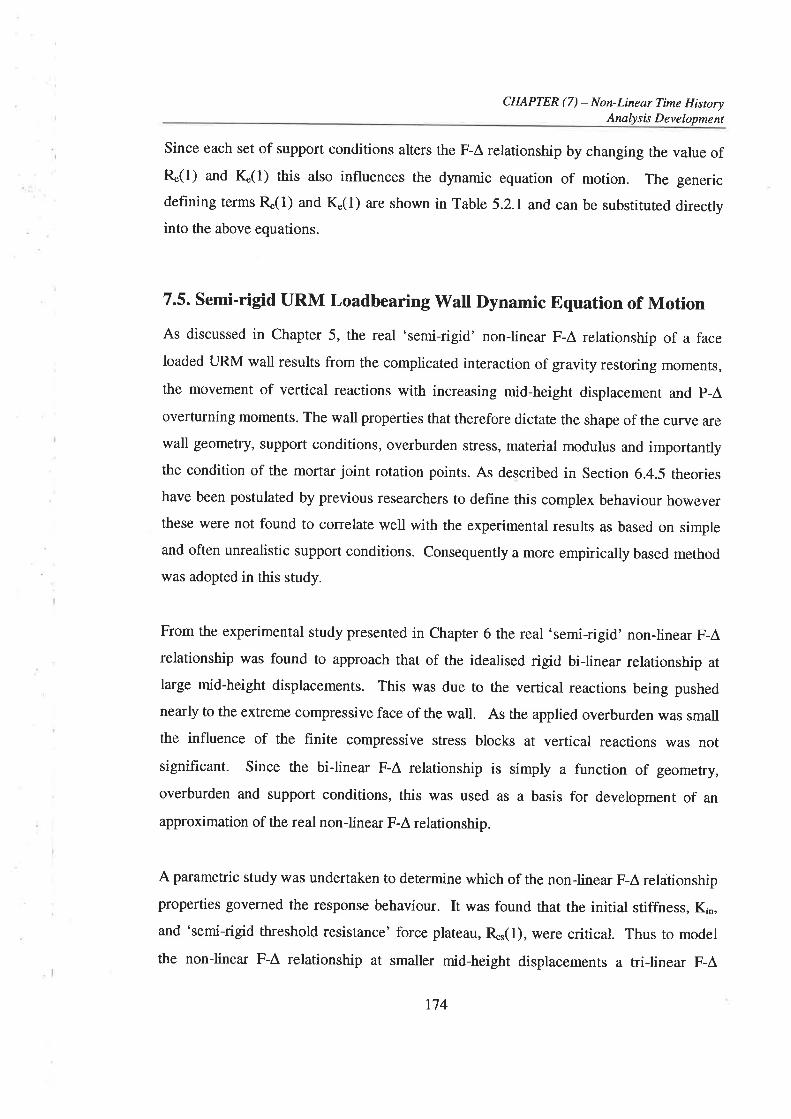
CHAPTER (7) - Non-Linear Time HistoryAnalysß Development
Since each set of support conditions alters the F-Â relationship by changing the value ofR.(1) and Ç(1) this also influences the dynamic equation of motion. The genericdefining terms R"(1) and IÇ(l) are shown in Table 5.2.1 and. can be substituted directlyinto the above equations.
7.5. Semi-rigid URM Loadbearing Wall Dynamic Equation of MotionAs discussed in Chapter 5, the real 'semi-rigid' non-linear F-Â relationship of a face
loaded URM wall results from the complicated interaction of gravity restoring moments,
the movement of vertical reactions with increasing mid-height displacement and p-A
overturning moments. The wall properties that therefore dictate the shape of the curve are
wall geometry, support conditions, overburden stress, material modulus and importantlythe condition of the morta¡ joint rotation points. As described in Section 6.4.5 theories
have been postulated by previous researchers to define this complex behaviour howeve¡these were not found to correlate well with the experimental results as based on simple
and often unrealistic support conditions. Consequently a more empirically based method
was adopted in this study.
From the experimental study presented in Chapter 6 the real 'semi-rigid' non-linear F-Àrelationship was found to approach that of the idealised rigid bi-linear relationship at
large mid-height displacements. This was due to the vertical reactions being pushed
nearly to the extreme compressive face of the wall. As the applied overburden was small
the influence of the hnite compressive stress blocks at vertical reactions was not
significant. Since the bi-linear F-A relationship is simply a function of geometry,
overburden and support conditions, this was used as a basis for development of an
approximation of the real non-linea¡ F-Â relationship.
A parametric study was undertaken to dete¡mine which of the non-linear F-Â relationshipproperties governed the response behaviour. It was found that the initial stiffness, K¡o,
and 'semi-rigid threshold resistance' force plateau, R*(l), were critical. Thus to model
the non-linear F-A relationship at smaller mid-height displacements a tri-linear F-À
174
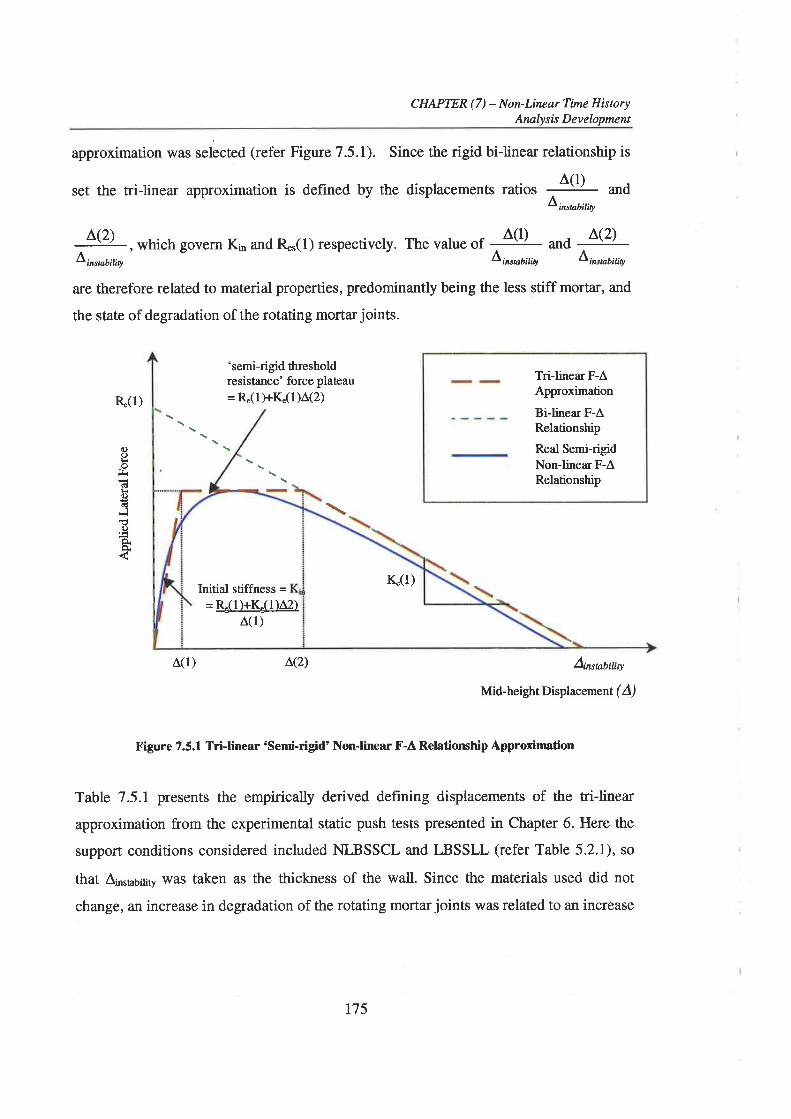
CHAPTER (7) - Non-Linear Time HistoryAnalysis Development
approximation was selected (refer Figure 7.5.1). Since the rigid bi-linear relationship is
set the tri-linear approximation is defined by the displacements ratios , Â(1) *O
Lircøuitity
,L(z) , which govern Kn and zu(1) respectively. The value of , ^(t) -¿ -^(2)-L;nsøtitity Linøaitity Linsnbitig
are therefore related to material properties, predominantly being the less stiff mortar, and
the state of degradation of the rotating mortar joints.
R (1)
'semi-rigid thresholdresistance' force plateau
=R"(1)+K(1)^(2)
^(l)L(2) A¡n5¡aþ¡¡¡¡y
Mid-height Displacement (Á)
Figure 7.5.1 TriJinear 'Semi-rigid' Non-linear F-A Relationship Approxinntion
Table 7.5.1 presents the empirically derived defining displacements of the tri-linear
approximation from the experimental static push tests presented in Chapter 6. Here the
support conditions considered included NLBSSCL and LBSSLL (refer Table 5.2.1), so
that ¡os¡n5¡¡ty wâs taken as the thickness of the wall. Since the materials used did not
change, an increase in degradation of the rotating mortar joints was related to an increase
Tri-linear F-ÂApproximation
Bi-linear F-ARelationship
Real Semi-rigidNon-linea¡ F-ÂRelationship
q)okof¡rcdk()ctr'l!d)
ÈÈ
Initial stiffness == R-11)+ICll)Â2)
^(1)
ç(1)
175
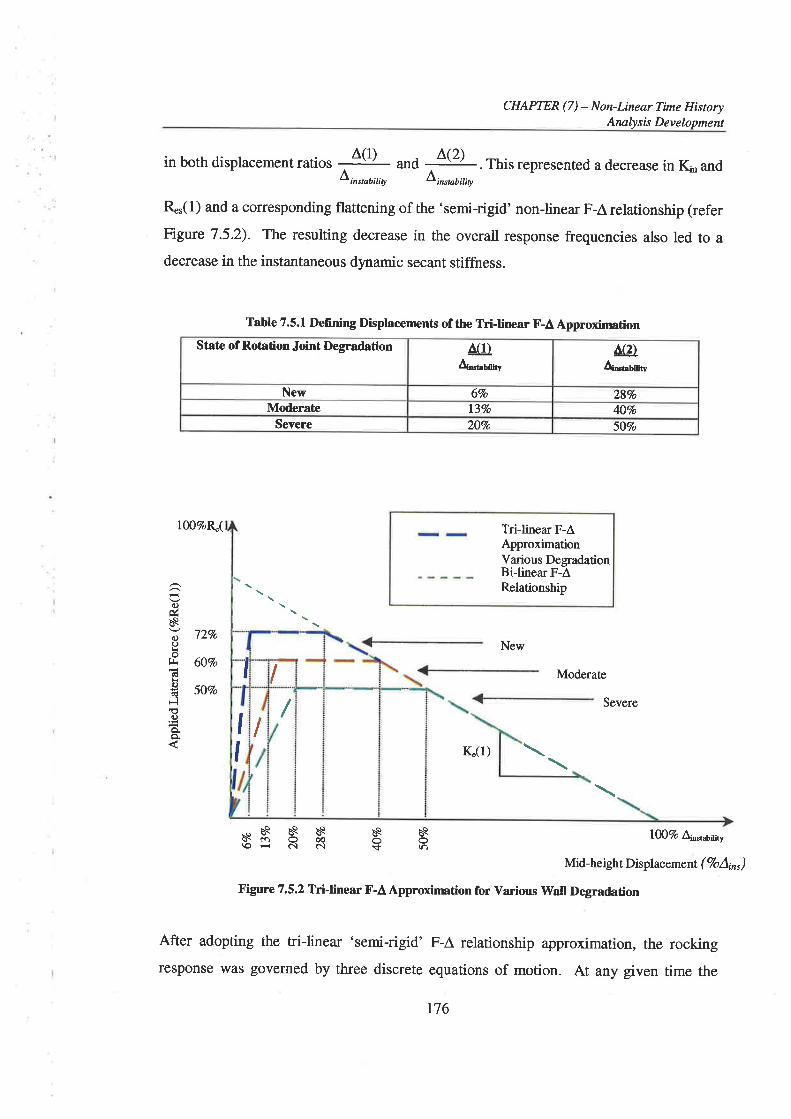
CHAPTER (7) - Non-Lin¿ar Time HistoryArulysß Developmcnt
in both displacement ratios t ^(t) -¿ --^Ø-. This represented a decrease in Ki,r andLinsøuitiry L;nsøuit;ty (
R*(1) and a corresponding flattening of the 'semi-rigid' non-linear F-A relationship (referFigure 7.5.2). The resulting decrease in the overall response frequencies also led to adecrease in the instantaneous dynamic secant stiffness.
Table 7.5.1 Defining Displacenrents of the Tri-linear F-A ApproxirmtionState of Rotation Joint Degradation a(1)
A^t"m.yLA)
4-t UUtt
New 6Vo 28VoModerate l37o 4O7o
Severe 2OVo 5O7o
10O7oR.( Tri-linea¡ F-ÂApproximationVarious DegradationBi-linear F-ÂRelationship
New6O4o
Moderaæ
Severe
K(1)
(1)úèaq)oLo
f¡.ñtc)
sE(¡)ÞrÞr
727o
5OVo
ñs s s\OÈNNñòeOA.+ !ñ
l(X)7o \,65¡1,
Mid-height Displacement ( VoA¡", )Figure 7.5.2 Tri-linear F-A Approximation for Various Wall Degradation
After adopting the tri-linear 'semi-rigid' F-A relationship approximation, the rockingresponse was governed by three discrete equations of motion. At any given time the
I I
II
/I
176
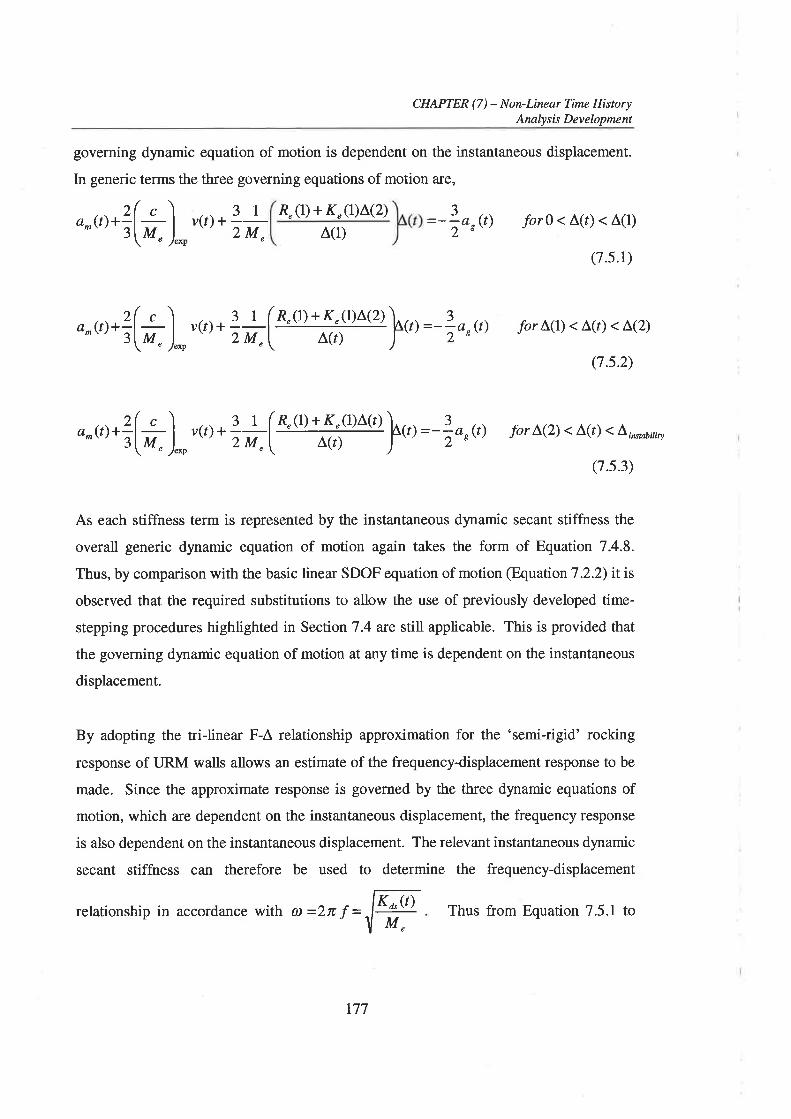
CHAPTER (7) - Non-Linear Time HistoryArnlysis Development
governing dynamic equation of motion is dependent on the instantaneous displacement.
In generic terms the three governing equations of motion are,
R"(1) + K"(I)L(2)
^(1)
J
2
3(t
2
, (r) forl < ^(r)
< A(l)
(7.s.Ð
) ) for L(I) < Â(r) < L(2)
(7.s.2)
for L(2) < Â(r) < Lirctøitity
(7.s.3)
relationship in accordance with @ =21c, = W
As each stiffness term is represented by the instantaneous dynamic secant stiffness the
overall generic dynamic equation of motion again takes the form of Equation 7.4.8.
Thus, by comparison with the basic linear SDOF equation of motion (F,quation 7.2.2) itisobserved that the required substitutions to allow the use of previously developed time-
stepping procedures highlighted in Section 7.4 are still applicable. This is provided that
the governing dynamic equation of motion at any time is dependent on the instantaneous
displacement.
By adopting the tri-linear F-A relationship approximation for the 'semi-rigid' rocking
response of URM walls allows an estimate of the frequency-displacement response to be
made. Since the approximate response is governed by the three dynamic equations of
motion, which are dependent on the instantaneous displacement, the frequency response
is also dependent on the instantaneous displacement. The relevant instantaneous dynamic
secant stiffness can therefore be used to determine the frequency-displacement
177
Thus from Equation 7.5.1 to
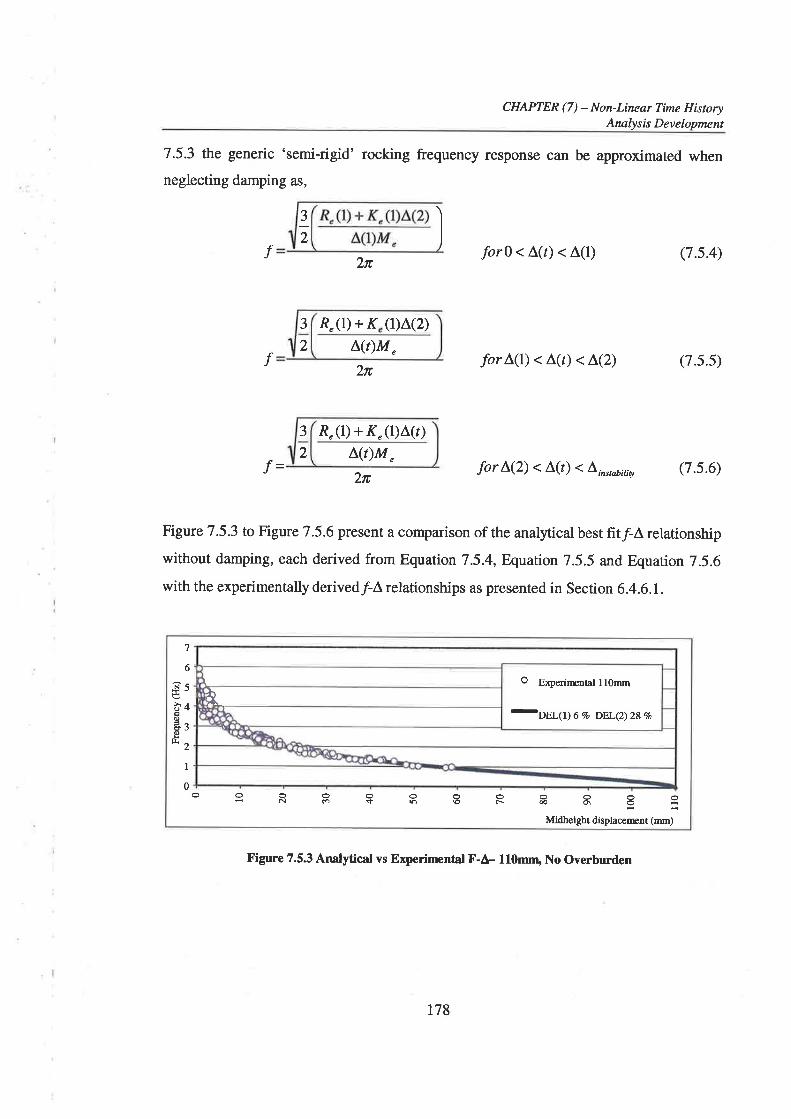
CHAPTER (7) - Non-Linear Time HßtoryAnalysß Developmcnt
7.5.3 the generic 'semi-rigid' rocking frequency response can be approximated when
neglecting damping as,
12r
r
2n
3 R,(1) + K (1)^(2)
forï<^(f)<^(1) (7.s.4)
for L(t) < A(r) < L(2) (7.s.s)2
3
2
L(t)M "
R"(1) + K,(1)^(r)L(t)M
"
2n
f- 2n for L(2) < ^(/)
< L;rcøuinry Q .5.6)
Figure 7 .5.3 to Figure 7.5.6 present a comparison of the analytical best fit/-^ relationship
without damping, each derived from Equation 7.5.4, Equation 7.5.5 and Equation 7.5.6
with the experimentally derivedf relationships as presented in Section 6.4.6.1.
îoÉÐásl!
7
6
5
4
3
2
I0
O ExperirænøI ll0mm
-oet1t¡6 vo DELe)2Bvo
il
o oaoooooNo<tnËÉ aoooæO\c)Midheight displacerrent (mm)
Figure 7.53 Analytical vs Experirnental F-Á- 110mrn, No Overburden
178
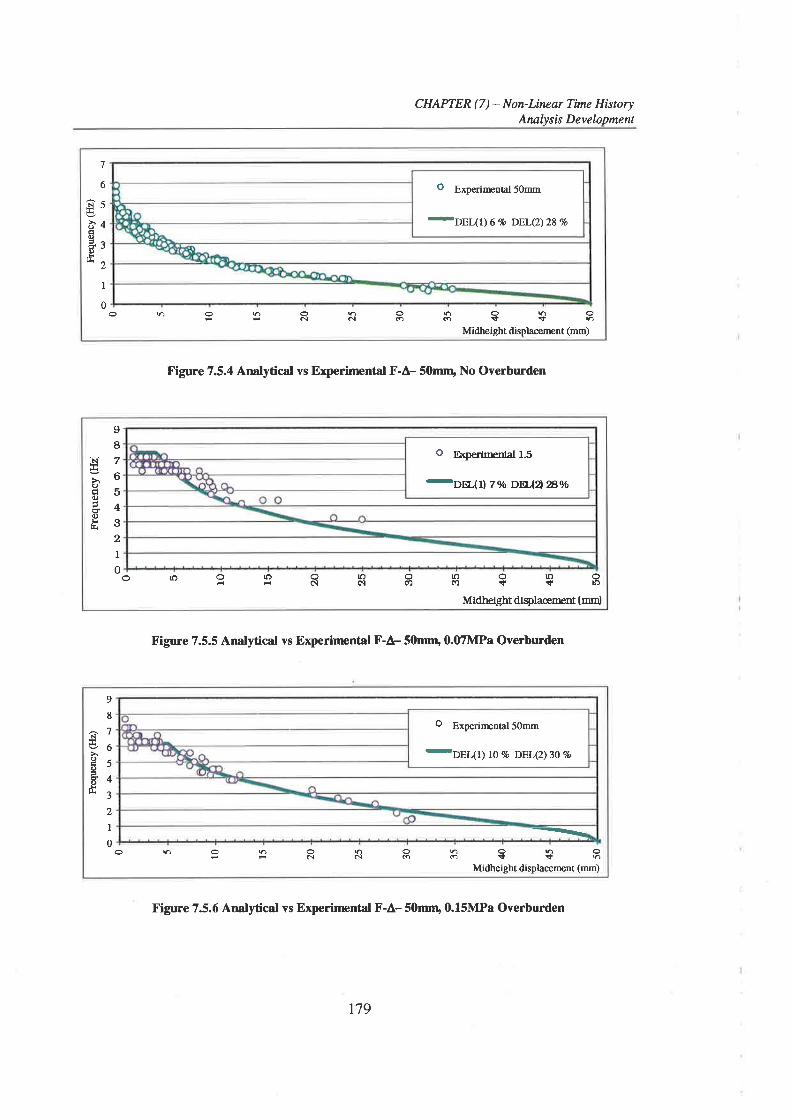
CHAPTER (7) - Non-Linear Timc HistoryAnalysis Development
N
àaoøotL
7
6
5
4
3
2
1
0
o Experiæntal 50mm
-DEL(I)6 % DELe)zBEo
ononoÊclôlm nonoo{snMidheigbt displacement (mm)
Figure 7.5.4 Analytical vs Experimental F-Á- 50mr¡t, No Overburden
'N'
>'oEIru
dc)Lt\
II765432I0
o Þçerlmental r.5
-DE {r) zolo DEr-{22Ít96
o rO otôorootootooÊÊcìN(l)Cl)++loMidherght dlÐlacem¡t ( mm)
Figure 7.5.5 Analytical vs Experirnental F-Á- 50mnr,0.û7MPa Overburden
ñ
oÉoõoÈ
9
8
7
6
5
4
3
2
I0
o Experirental 50mm
-pgr(l) to% DFt (2)3oEo
o ononon ÊNCIOO onoËThMidheight displacemont (mm)
Figure 7.5.6 Anatytical vs Experinrental F-A- 50mnt' 0.15MPa Overburden
t79
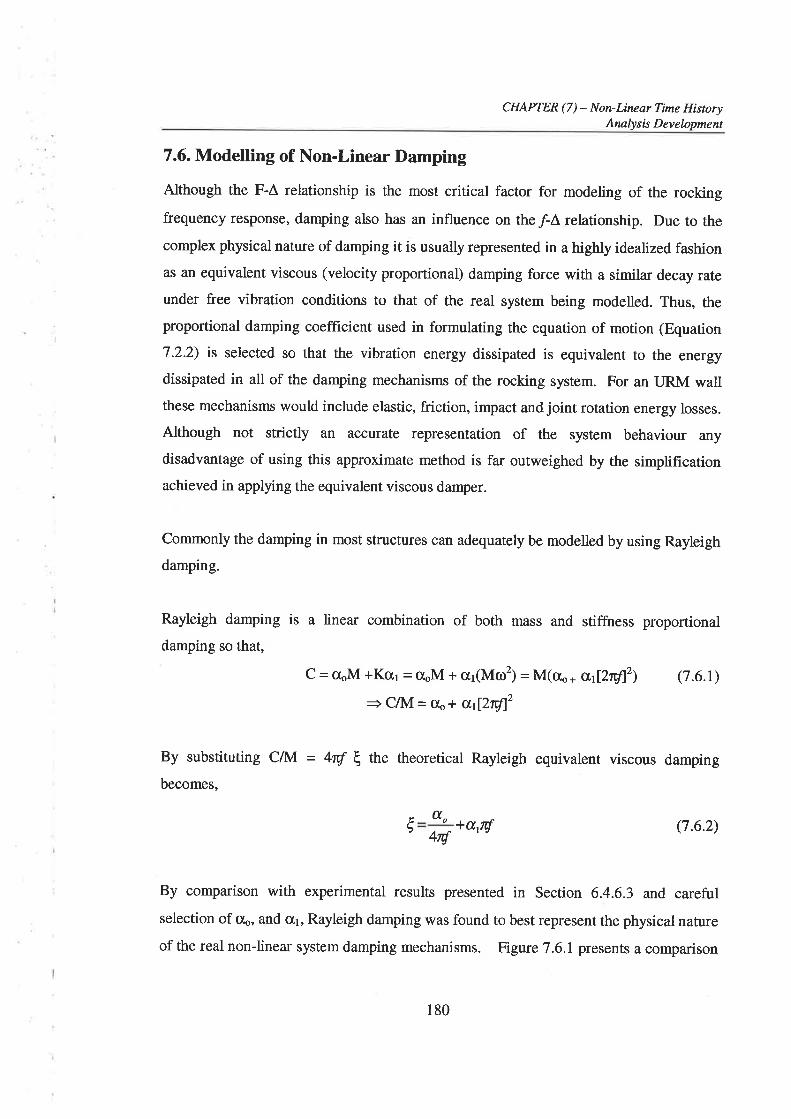
CHAPTER (7) - Non-Lineqr Tilne HistoryAnalysis Development
7.6. Modelling of Non-Linear Damping
Although the F-Â relationship is the most critical factor for modeling of the rocking
frequency response, damping also has an influence on the f relationship. Due to the
complex physical nature of damping it is usually represented in a highly ideahzed fashion
as an equivalent viscous (velocity proportional) damping force with a similar decay rate
under free vibration conditions to that of the real system being modelled. Thus, the
proportional damping coefficient used in formulating the equation of motion (Equation
7.2.2) is selected so that the vibration energy dissipated is equivalent to the energy
dissipated in all of the damping mechanisms of the rocking system. For an URM wallthese mechanisms would include elastic, friction, impact and joint rotation energy losses.
Although not strictly an accurate representation of the system behaviour any
disadvantage of using this approximate method is far outweighed by the simplificationachieved in applying the equivalent viscous damper.
Commonly the damping in most structures can adequately be modelled by using Rayleigh
damping.
Rayleigh damping is a linear combination of both mass and stiffness proportional
damping so that,
C = ooM *Kcr,1 = cloM + crr(Mco2) = M(r,.,* a{2n1l2) (7.6.1)
= C/M = ob+ a[2úf2
By substituting C/l\4 = 4rf I the theoretical Rayleigh equivalent viscous damping
becomes,
Iao
4ú +atÚ (7.6.2)
By comparison with experimental results presented in Section 6.4.6.3 and careful
selection of oo, and o,1, Rayleigh damping was found to best represent the physical nature
of the real non-linear system damping mechanisms. Figure 7.6.1 presents a compa¡ison
180
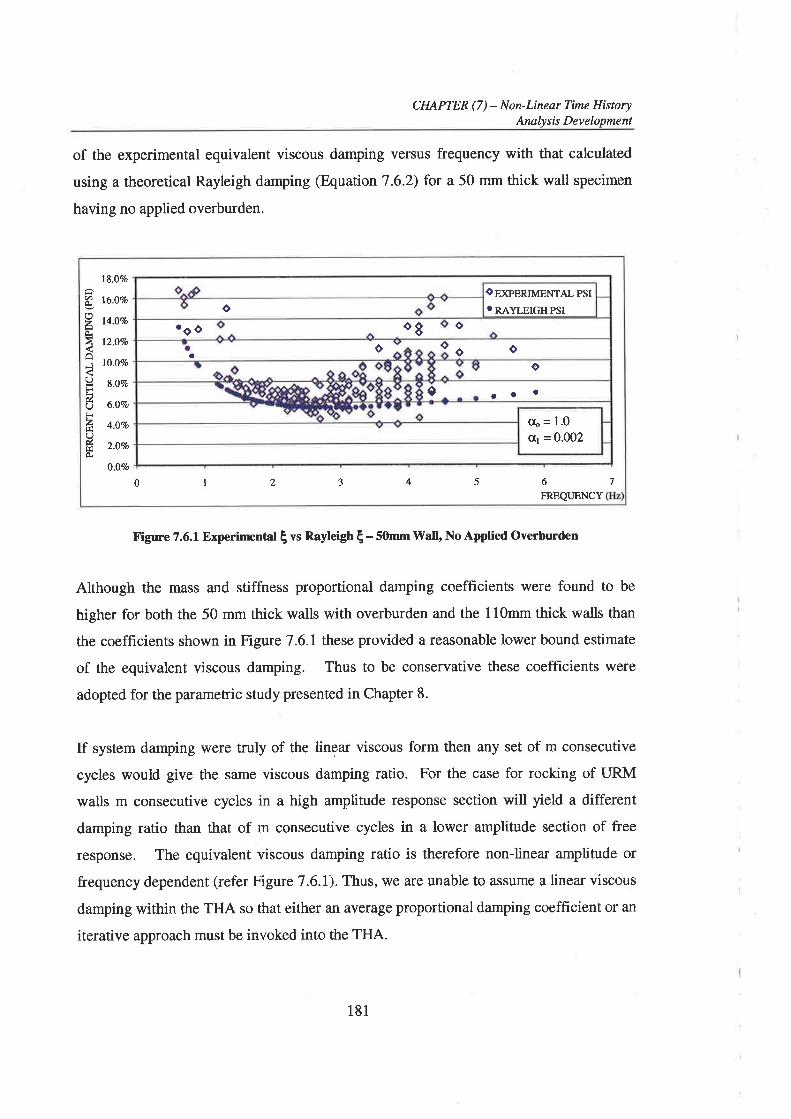
CHAPTER (7) - Non-Lineør Time HistoryAnalysis Development
of the experimental equivalent viscous damping versus frequency with that calculated
using a theoretical Rayleigh damping (Equation 7.6.2) for a 50 mm thick wall specimen
having no applied overburden.
Figure 7.6.1 Experimental I vs Rayleigh | - 50mm \üatl, No Àpplied Overburden
Although the mass and stiffness proportional damping coefficients were found to be
higher for both the 50 mm thick walls with overburden and the 110mm thick walls than
the coefficients shown in Figure 7.6.1 these provided a reasonable lower bound estimate
of the equivalent viscous damping. Thus to be conservative these coeff,rcients were
adopted for the parametric study presented in Chapter 8.
If system damping were truly of the linear viscous form then any set of m consecutive
cycles would give the same viscous damping ratio. For the case for rocking of URM
walls m consecutive cycles in a high amplitude response section will yield a different
damping ratio than that of m consecutive cycles in a lower amplitude section of free
response. The equivalent viscous damping ratio is therefore non-linear amplirude or
frequency dependent (refer Figure 7.6.1). Thus, we are unable to assume a linea¡ viscous
damping within the THA so that either an average proportional damping coefficient or an
iterative approach must be invoked into the THA.
oÐoeRIÀæNTALpSI. RAYLEIGHPSIo
toô ooo ooa
o8
o
e ¡t'
(I¡ = 1.0c[r = 0.002
18.070
16.0lo
14.0%
t2.o%
10.07o
8.O7o
6.07o
4.O%
2.O%
0.ïVo
âØÀzÀ
oI(-)F7,(JFzfIl(Júf!o.
) 3 4 5 6FRBQIJENCY
70 1
181
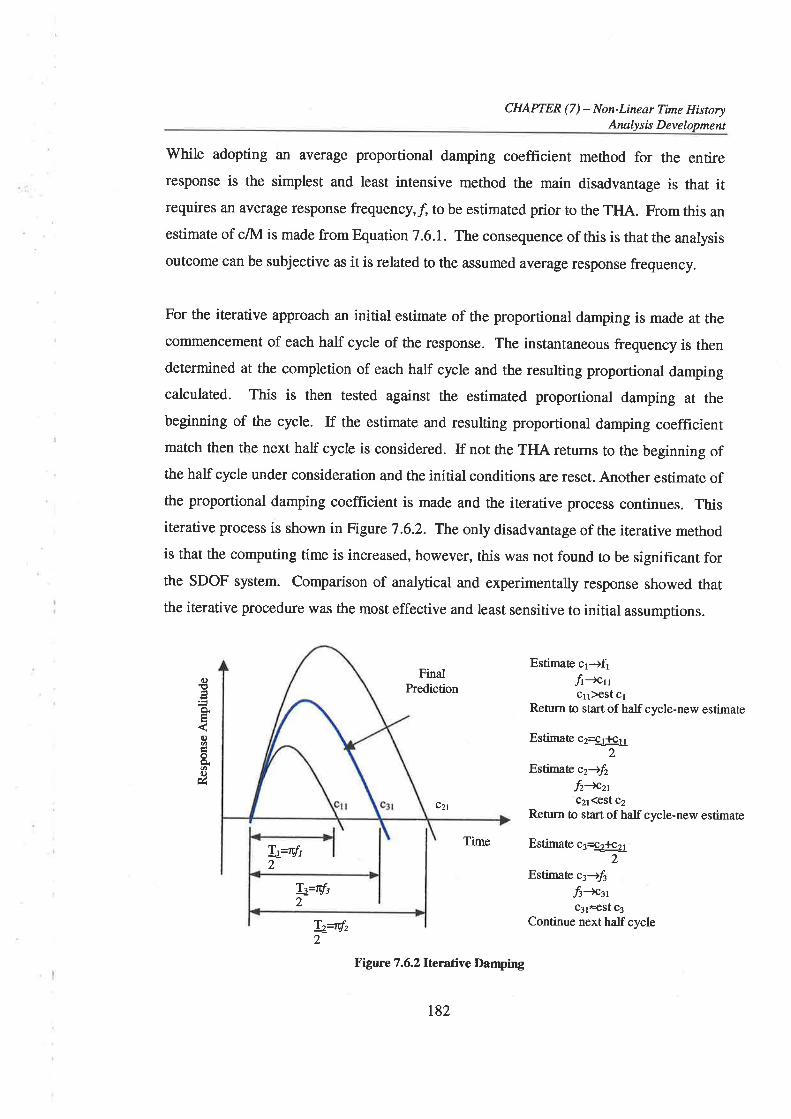
CHAPTER (7) - Non-Lineør Time HistoryAnalysis Development
While adopting an average proportional damping coefñcient method for the entteresponse is the simplest and least intensive method the main disadvantage is that itrequires an average response frequency,f, to be estimated prior to the THA. From this an
estimate of c/lM is made from Equation7.6.l. The consequence of this is that the analysis
outcome can be subjective as it is related to the assumed average response frequency.
For the iterative approach an initial estimate of the proportional damping is made at the
colffnencement of each haH cycle of the response. The instantaneous frequency is then
determined at the completion of each half cycle and the resulting proportional dampingcalculated. This is then tested against the estimated proportional damping at the
beginning of the cycle. If the estimate and resulting proportional damping coefficientmatch then the next half cycle is considered. If not the THA returns to the beginning ofthe half cycle under consideration and the initial conditions are reset. Another estimate ofthe proportional damping coefficient is made and the iterative process continues. Thisiterative process is shown in Figure 7 .6.2. The only disadvantage of the iterative methodis that the computing time is increased, however, this was not found to be significant forthe SDOF system. Comparison of anal¡ical and experimentally response showed thatthe iterative procedure was the most effective and least sensitive to initial assumptions.
()'1'
ÈÊ{q)
&øc)ú
FinalPrediction
ç21
Time
Figure 7.6.2 lterative Damping
Estimate c1-+f¡ft--xnC11)€St C1
Return to start of half cycle-new estimate
Estimaæ cr4r{crr2
Esttmaæ c2+f2Íz*.ztC21(9St C2
Rehrrn to start of half cycle-new estimate
Estimate cs@2
Estimate ca+frfs--xstC314St C3
Continue next half cycle
\acÍt2
T^=ttf,2
LpÍ'2
r82

CHAPTER (7) - Non-Linear Tim¿ HistoryAtwlysis Development
7 .7 . Event Based Time-Stepping Analysis
Since at any time the dynamic response is dependent on the instantaneous displacement
an event based time-stepping analysis was required to distinguish between the governing
dynamic equation of motion. As part of the time-stepping procedure the dynamic
response was considered by conversion of the static non-linear F-Â curve into a 'pseudo
static' F-A relationship. This procedure was based on the constant acceleration
assumption between time steps and takes into account the proportional damping. By
adopting the tri-linear F-A model, the 'pseudo static' F-Â relationship was made up of the
three 'pseudo static' stiffness' being ktsl, ktsp and kts2 (refer Figure 7.7.1). To permit
the use of the time-stepping procedure as described in Section 7 .5 the conversion factor
of 312 was applied to both the input ground acceleration, ac(t) and the three 'pseudo
static' stiffness'.
Re(1)
Re( 1 )+Â(2)Ke( I )+Â( I )ktsp
Re(1ÌrÂ(2)Ke(1
1
^(1) L(2)
Figure 7.7.1 'Pseudo Static' F-A relationship
Âioro¡lity
Mid-height Displacement, Âc)octØØc)úoohol¡r(dÈO
rl
s1
a\
/ITrilinear'pseudo static'
stiffness
ktsp-4M +2pat? ¿t
where dt is the timeincrement
kts 1 =Re( 1 ÞÂ(2)Ke( 1 )+ktsp
^(1)kts2=ke(lþktsp
183
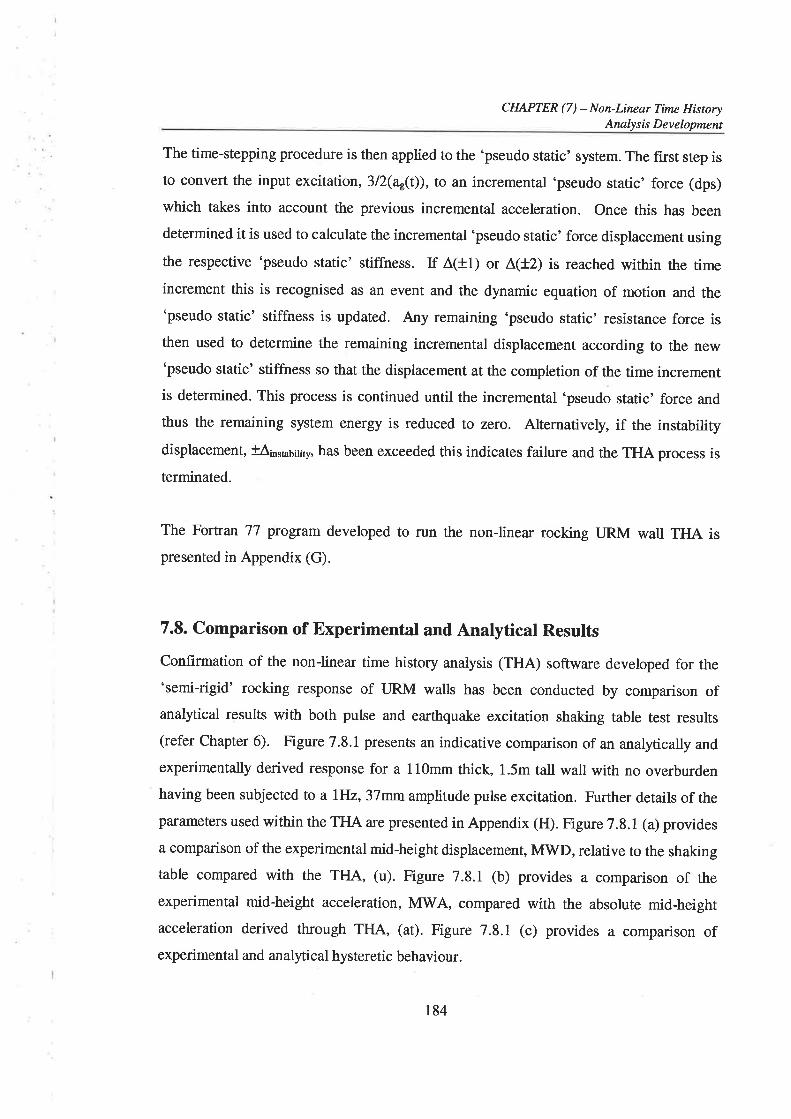
CHAPTER (7) - Non-Linear Time HistoryAnnlysis Development
The time-stepping procedure is then applied to the 'pseudo static' system. The first step isto convert the input excitation, 312(ar(t)), to an incremental'pseudo static' force (dps)
which takes into account the previous incremental acceleration. Once this has been
determined it is used to calculate the incremental 'pseudo static' force displacement using
the respective 'pseudo static' stiffness. If ^(tl)
or ^(+2)
is reached within the time
increment this is recognised as an event and the dynamic equation of motion and the'pseudo static' stiffness is updated. Any remaining 'pseudo static' resistance force isthen used to determine the remaining incremental displacement according to the new'pseudo static' stiffness so that the displacement at the completion of the time incrementis determined. This process is continued until the incremental 'pseudo static' force and
thus the remaining system energy is reduced to zero. Alternatively, if the instabilitydisplacemerìt, *¡s¡¿5¡¡ty, has been exceeded this indicates failure and the THA process is
terminated.
The Fortran 77 program developed to run the non-linear rocking LJRM wall THA ispresented in Appendix (G).
7.8. Comparison of Experimental and Analytical Results
Conhrmation of the non-linear time history analysis (THA) softwa¡e developed for the'semi-rigid' rocking response of URM walls has been conducted by comparison ofanalytical results with both pulse and earthquake excitation shaking table test results(refer Chapter 6). Figure 7.8.1 presents an indicative comparison of an analytically and
experimentally derived response for a 110mm thick, 1.5m tall wall with no overburdenhaving been subjected to a lHz,37mm amplitude pulse excitation. Further details of the
parameters used within the THA are presented in Appendix (H). Figure 7.8.1 (a) provides
a comparison of the experimental mid-height displacement, MWD, relative to the shakingtable compared with the THA, (u). Figure 7.s.1 (b) provides a comparison of the
experimental mid-height acceleration, MrilA, compared with the absolute mid-heightacceleration derived through THA, (at). Figure 7.8.1 (c) provides a comparison ofexperimental and anal¡ical hysteretic behaviour.
184
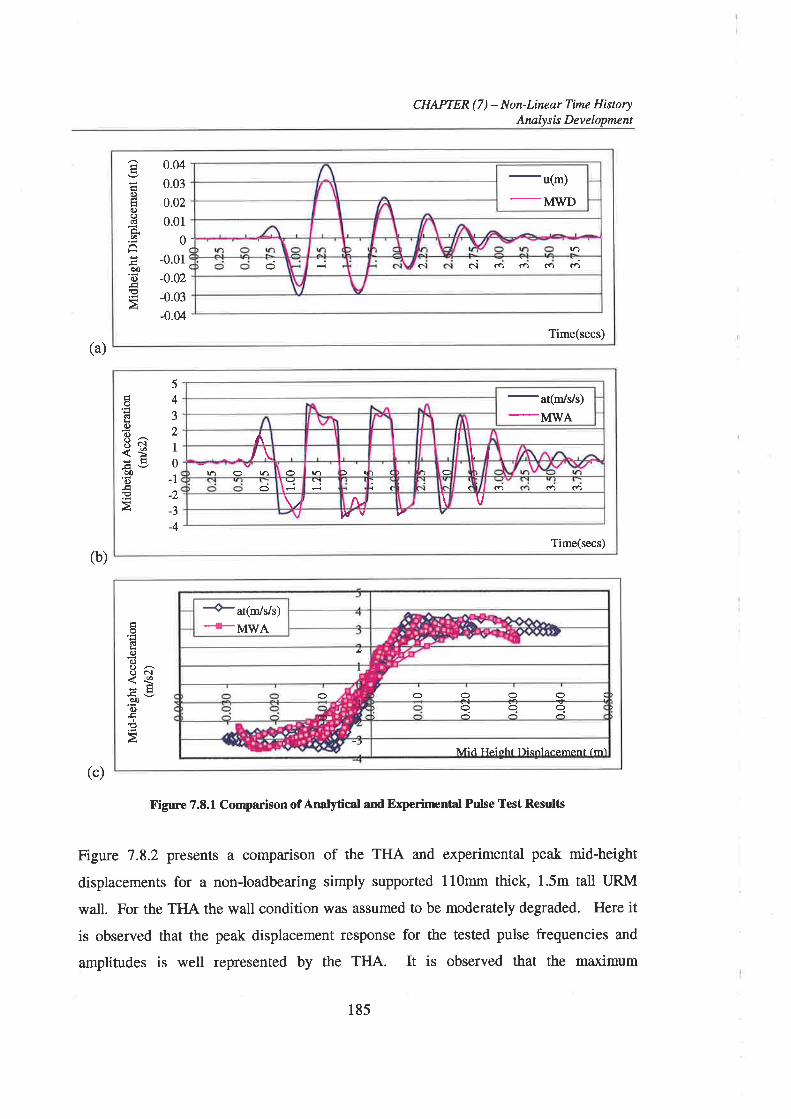
CHAPTER (7) - Non-Linear Timc HistoryAnalysis Development
u(m)
-MWD!ñ
(\ c.l cô ú) c.) c1
0)
q)()(lÈØ
Eèo0).ÉËÀ
0.04
0.03
0.02
0.01
0
-0.01
-0.02
-0.03
-0.04Time(secs)
(a)
(b)
oGIÊoc)()^O C.l
ðo0.)3
*at(m/s/s)+MwA
o O OO(OOO
Mi¿l [Ieioht T']isnlacement fmì
(c)
Figure 7.8.1 Comparison of Analyticat and Experimental Pulse Test Results
Figure 7.8.2 presents a comparison of the THA and experimental peak mid-height
displacements for a non-loadbearing simply supported 110mm thick, 1.5m tall LJRM
wall. For the THA the wall condition was assumed to be moderately degraded. Here itis observed that the peak displacement response for the tested pulse frequencies and
amplitudes is well represented by the THA. It is observed that the maximum
54J,,
I0
-1_1
-3-4
c)
Ra<*t9ÒO
c)¡€à
Time(secs)
-at(m/Vs)-MIWAÁ I
-/\ t.tô ô ) I ) ( c
IC ó CñI N \ V
yqv
185
CHAPTER (7) - Non-Linear Time HistoryArnlysis Development
displacement amplification occurs for pulse frequencies of around lHz to 2Hz. Thus theeffective resonant frequency,fit, for the 110mm thick, 1.5m tall simply supported walls
with no applied overburden is also approximately lHz.
Figure 7.8.2 THA and Experinrental Peak Pulse Mid-height Disp. Response
Figure 7.8.3 presents an indicative comparison of an analytically and experimentally
derived response for a 110mm thick, l.5m tall wall with no overburden having been
subjected to an earthquake excitation representin g 80Vo of the Pacoima Dam earthquake
(refer Table 6.4.9). Further details of the parameters used within the THA are presented
ln Appendix (Ð. Figure 7.8.3 (a), (b) and (c) provide comparisons of mid-heightdisplacement, acceleration and hysteretic behaviour respectively.
ll0
100
90
gBoËq¡
Hzooô.É60gEsooúË40ÐE¿30= 20
l0
0
0 l0 20 30 4 50 60 70 80 90Peak Base Displacernent (mm)
r00 I
Amplifieddisplacements
E
\fl o II1
o
oo - THEOREICAL 0.5FIz Pulse
- TI{EORETICAL lFIz Pulse
- TI{EORETCAL 2IIz Pr¡lse
- THEORETCAL 3.0H2 R¡Ise
troootrEtr
Ð(P I IIz 1/2 Sine Disp pulse
FXP 2llz 1/2 Sine Disp pulseEXP 3I{z 1/2 Sine Disp pulseEXP 0.5 [Iz Gaussian R¡lseÐ(P I tlz Gaussian Pulse
tr
tro
EXP R.¡lse
186
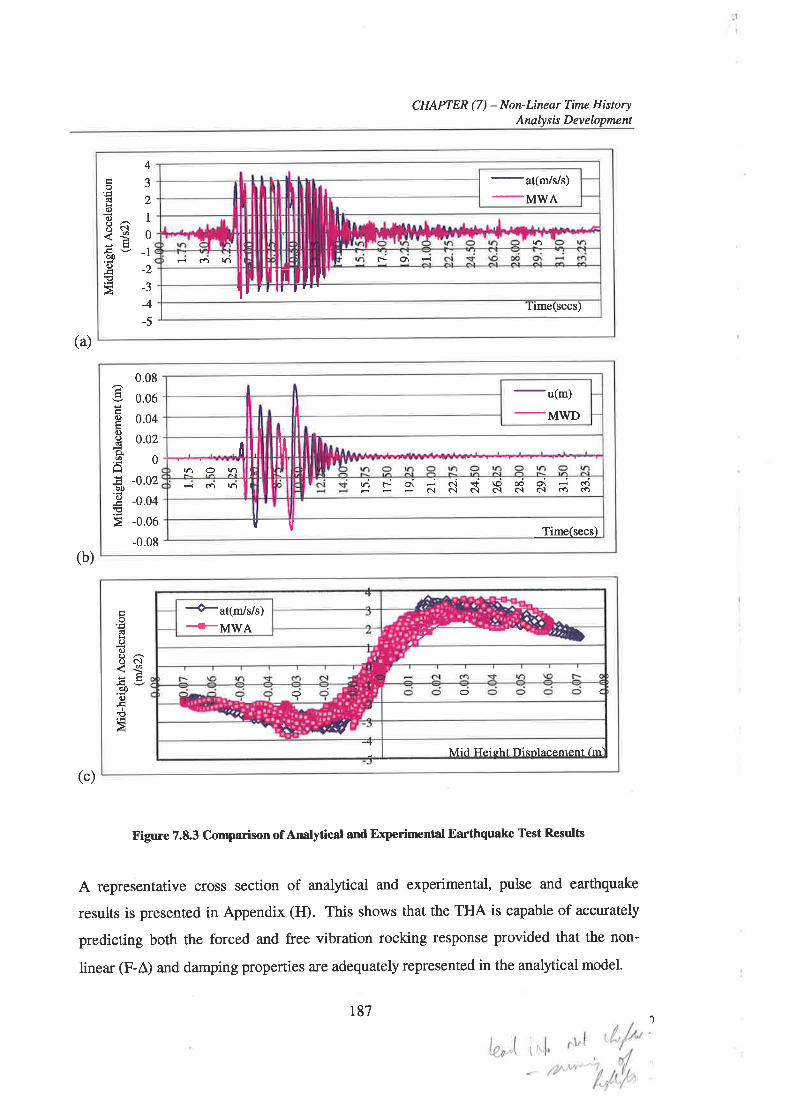
CHAPTER (7) - Non-Lincar Tim¿ HistoryAnalysis Development
-at(r/s/s)-MV/A
lô
O\ Êt,,-Ê CO ìa¡
ilt Itttt rt'lt t t It
Irme(secs)
4É?€)()E^ 1åq o-Èrtr _1ooO^-c -L
4-5
u(ml
-MWDI iltI
(a¡ O ìô Iht--ol\-cl+\c)æO\-ú)J:Êeì(.lNelN(.lcq(.)al !a)
uvTime(secs)
0.08Àg 0.06ËË 0.04
Ë o.o2o,.Ä0Ë -0.02bo
E -o.o¿E> -0.06
-0.08
(a)
(b)
(c)
Figure 7.8.3 Comparison of Analyt¡cåt and Experimental Earthquake Test Resr¡lts
A representative cross section of analytical and experimental, pulse and earthquake
results is presented in Appendix (Ff¡. This shows that the THA is capable of accurately
predicting both the forced and free vibration rocking response provided that the non-
linear (F-À) and damping properties are adequately represented in the analytical model.
,)
.9c!Ê(,)oo^o e.¡
.Ëgè0c)EI€
*at(rn/s/s)+MwA r
O (
-lMid Heisht l)isnlacement fm'
187


8. LINEARISED DISPLACBMENT-BASBD
(DB)ANALYSIS
8.L. Linearised DB Analysis Methodology
The displacement-based (DB) analysis methodology provides a rational means for
determining seismic design actions as an alternative to the more traditional 'quasi-static'
force-based approach. In the DB procedure the dynamic lateral capacity of a structure is
determined on the basis of a comparison of a pre-determined failure displacement with
the displacement demand imposed on the structure by a seismic event.
To simplify the DB analysis procedure for highly non-linear systems the 'substitute
structure' methodology, proposed by Shibata and Sozen (1976), is often adopted. This
involves the substitution of the real structure's stiffness and damping properties with the
linear properties of a characteristic elastic SDOF oscillator. Here the characterising
linear properties are selected so that the linear and real non-linear systems are ftkely to
reach the failure displacement under the same applied excitation. The elastic system's
response to failure, as can be determined from the elastic response spectrum, is therefore
representative of the displacement demand on the real structure.
For elastic perfectly plastic systems (refer Figure 8.1.1) the bi-linear F-À relationship to
the failure displacement is characterised by the elastic stiffness related to the real
structure's secant stiffness at the in-elastic failure displacement (Priestly 7996:1997 ,Iudiet al 1998, Edwards et aI 1999). Thus, the characterising SDOF oscillator stiffness
component is approximated by the lowest secant stiffness analogous with the real
structure's dynamic response and is associated with the lowest feasible response
frequency. Using this characteristic 'substitute structure' property for elastic perfectly
plastic systems and an appropriate level of equivalent viscous damping during the non-
188
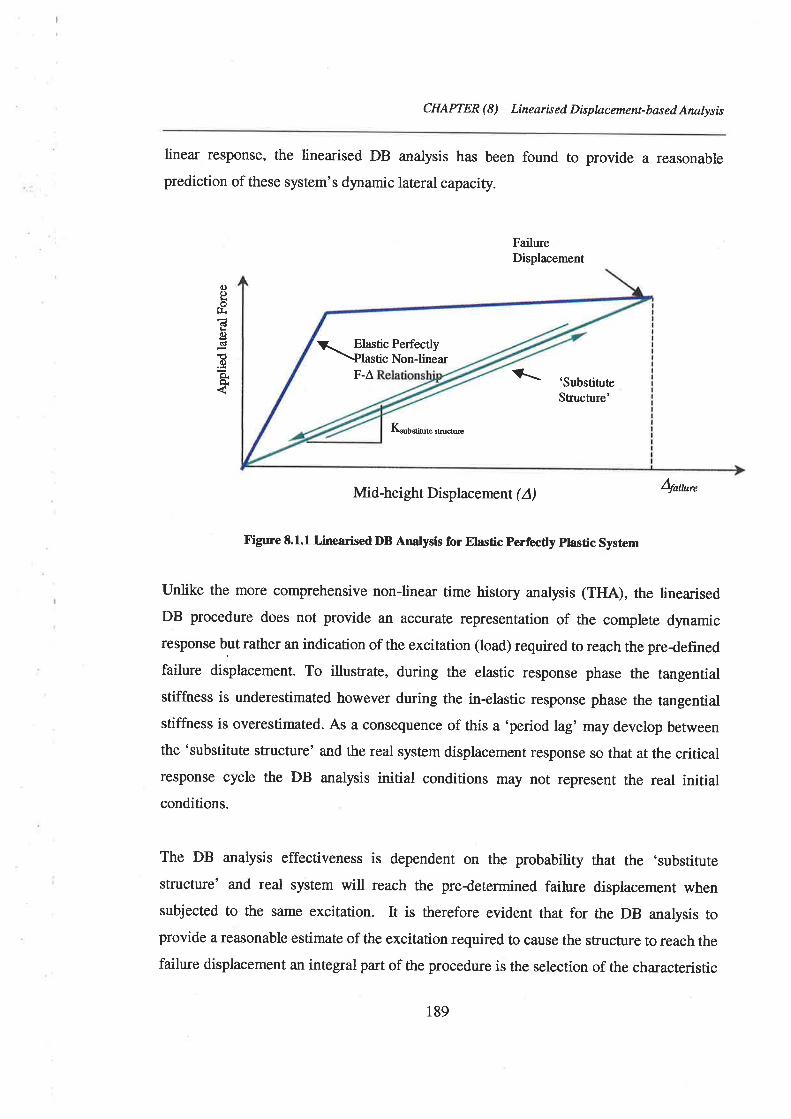
CHAPTER (8) - Linearised Displacement-based Analysis
linear response, the linea¡ised DB analysis has been found to provide a reasonable
prediction of these system's dynamic lateral capacity.
FailureDisplacement
\ 'Substiu¡teSEuch¡re'
Kubgi¡¡æ or¡ua¡rc
Mid-height Displacement ( A) A¡oitrrc
Figure 8.1.1 Lineadsed DB Analysis for Elastic perfectly plastic System
Unlike the more comprehensive non-linear time history analysis (THA), the linea¡isedDB procedure does not provide an accurate representation of the complete dynamicresponse but rather an indication of the excitation (load) required to reach the pre{efinedfailure displacement. To illushate, during the elastic response phase the tangentialstiffrress is underestimated however during the in-elastic response phase the tangentialstiffness is overestimated. As a consequence of this a 'period lag' may deveþ between
the 'substitute structure' and the real system displacement response so that at the criticalresponse cycle the DB analysis initial conditions may not represent the real initialconditions.
The DB analysis effectiveness is dependent on the probability that the 'substitute
structure' and real system will reach the predetermined failure displacement whensubjected to the same excitation. It is therefore evident that for the DB analysis toprovide a reasonable estimate of the excitation required to cause the structure to reach the
failure displacement an integral part of the procedure is the selection of the cha¡acteristic
c)()o
t¡rñtk()dËq)
o¡Þ. F-^
¡.- Elastic Perfectly\Plastic Non-linea¡
189
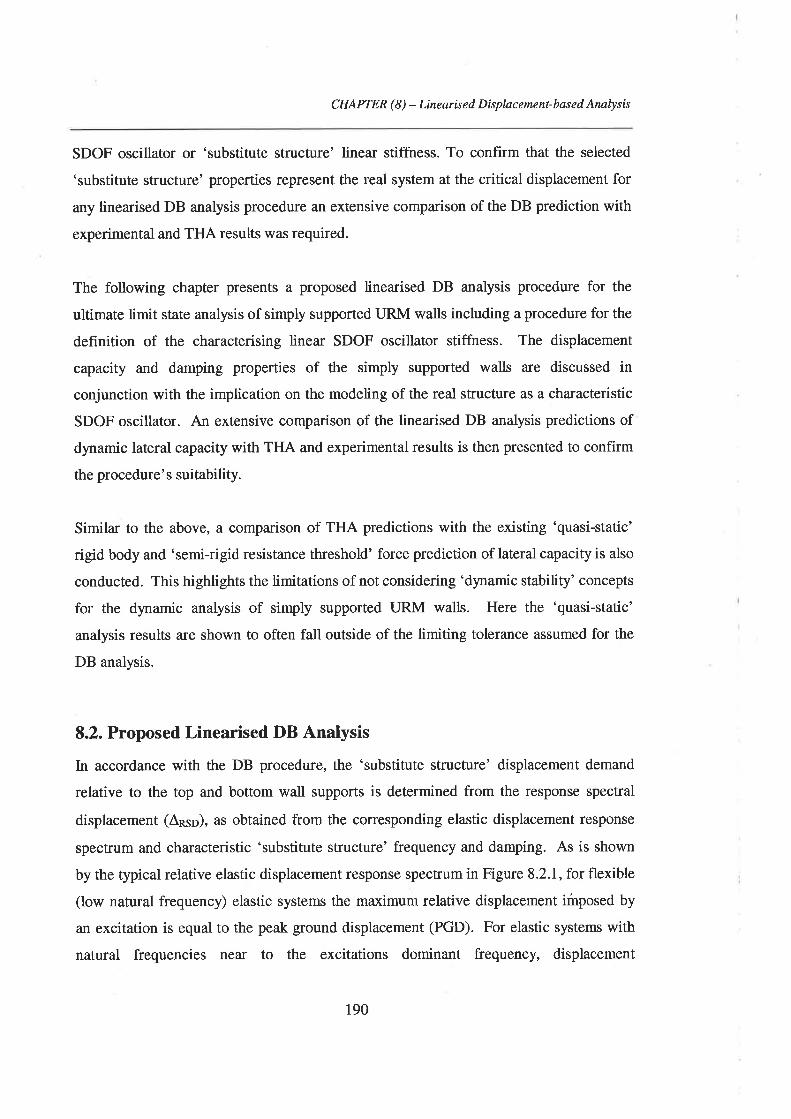
CHAPTER (8) - Linearised Displacement-based Arnlysis
SDOF oscillator or 'substitute structure' Iinear stiffrress. To confirm that the selected
'substitute structure' properties represent the real system at the critical displacement for
any linearised DB analysis procedure an extensive comparison of the DB prediction with
experimental and THA results was required.
The following chapter presents a proposed linearised DB analysis procedure for the
ultimate limit state analysis of simply supported URM walls including a procedure for the
definition of the characterising linear SDOF oscillator stiffness. The displacement
capacity and damping properties of the simply supported walls are discussed in
conjunction with the implication on the modeling of the real structure as a characteristic
SDOF oscillator. An extensive comparison of the linearised DB analysis predictions of
dynamic lateral capacity with THA and experimental results is then presented to confirm
the procedure' s suitability.
Similar to the above, a comparison of THA predictions with the existing 'quasi-static'
rigid body and 'semi-rigid resistance threshold' force prediction of lateral capacity is also
conducted. This highlights the limitations of not considering 'dynamic stability' concepts
for the dynamic analysis of simply supported URM walls. He¡e the 'quasi-static'
analysis results are shown to often fall outside of the limiting tolerance assumed for the
DB anaþis.
8.2. Proposed Linearised DB Analysis
In accordance with the DB procedure, the 'substitute structure' displacement demand
relative to the top and bottom wall supports is determined from the response spectral
displacement (Aps¡), as obtained from the corresponding elastic displacement response
spectrum and characteristic 'substitute structure' frequency and damping. As is shown
by the typical relative elastic displacement response spectrum in Figure 8.2.1, for flexible
(low natural frequency) elastic systems the maximum relative displacement imposed by
an excitation is equal to the peak ground displacement (PGD). For elastic systems with
natural frequencies near to the excitations dominant frequency, displacement
190
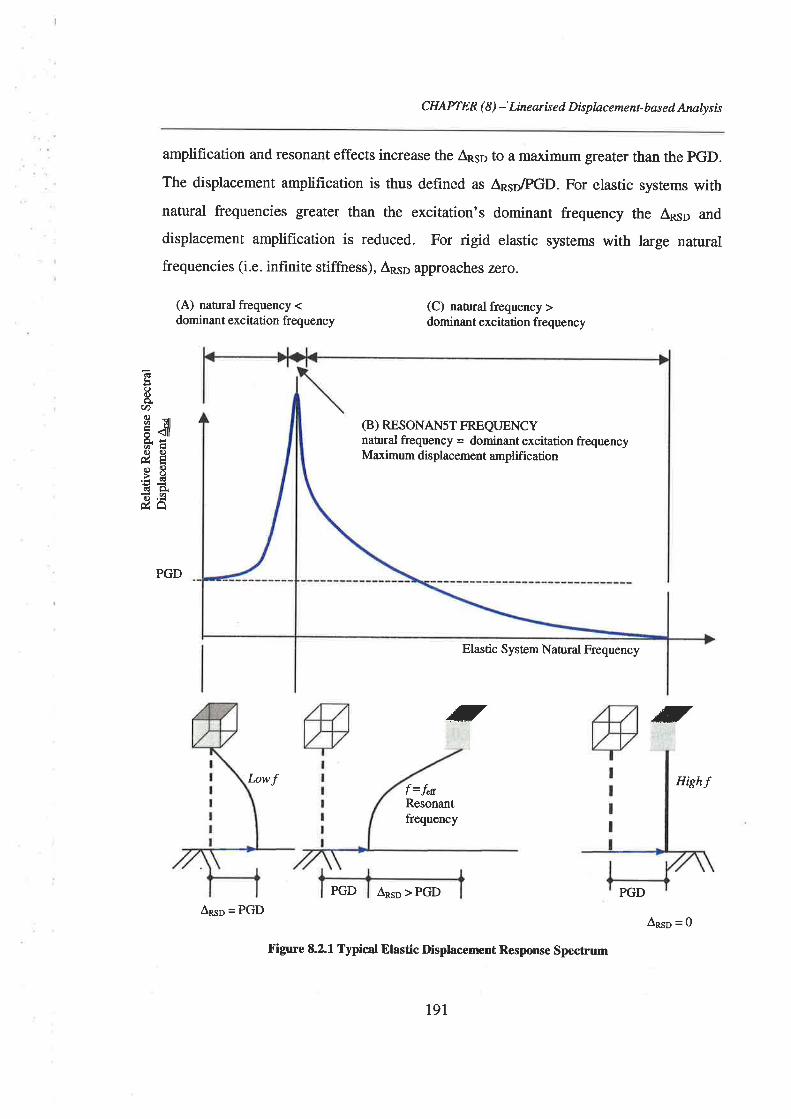
CHAPTER ( 8 ) -' Linearised Displacement- based Analysis
amplification and resonant effects increase the Ânso to a maximum greater than the PGD.
The displacement amplification is thus defined as Ânso,/PGD. For elastic systems withnatural frequencies greater than the excitation's dominant frequency ¡þs ÂRsp and
displacement amplification is reduced. For rigid elastic systems with large natural
frequencies (i.e. infinite stiffness), Ânsp approaches zero.
(tËod)Ê.
U)o-,É
"Tl*Ëo()úÊËË€Àõ.9úÀ
(A) natural frequency <dominant excitation frequency
(C) nan¡ral frequency >dominant excitation frequency
(B ) RESONANsT FREQUENCYnaû¡ral frequency = dominant excitation frequencyMaximum displacement amplification
Elastic System Natural Frequency
.J
PGD
PGD
rJ
In*l Hishff =fæResonantfrequency
PGD^RsD
> PGD
Figure 8.2.1 Typical Elastic Displacenrent Response Spectrum
Åns¡ = PGD
191
Âqso = 0
CHAPTER (8) - Lineørised Displacement-bøsed Arnlysis
This indicates that for ground motions where the dominant frequencies are much greater
than the elastic system's natural frequency the system will be safe from failure provided
that the PGD does not exceed Âinsrau¡iry. On the other hand should the dominant ground
motion frequency be nea¡ that of the natural resonant frequency, the Ans¡ may be
significantly amplified above that of the PGD depending on damping. In this case failure
may occur under excitations with much lower PGD.
THA and shaking table tests have shown the maximum relative mid-height displacement
amplification to be 1.5 to 3.3. This corresponds to a dynamic amplif,rcation of I to 2.2 at
the wall's effective mass, which is the point located at 213 of the free body height from
the point where the wall is stationary. This suggests that during ground motion with
dominant frequencies in the vicinity of the walls resonant frequency the wall will be safe
from overturning provided that the PGD does not exceed 0.3 of the wall thickness
(0.6612.2). For design, safefy factors would also need to be applied.
8.2.1. Derivation of Characteristic SDOF 6Substitute Structure' Stiffness
Provided that the selected SDOF 'substitute structure' stiffness, Kn (refer Figure 8.2.2)
linearly characterises the real structure for response at the incipient instability
displacement the real structure's displacement demand can be determined in accordance
with the relative elastic displacement response spectrum. The selection of Ç6 must
therefore be made so that it is probable that the 'substitute structure' and rocking wall
system will reach their respective displacement capacity under the same excitation.
Unlike the elastic perfectly plastic system presented in Section 8.1, where the lowest
secant stiffness analogous with the real structures dynamic response is used to
characterise the non-linear, this is not appropriate for rocking objects as at the failure or
instability displacement, ¡s65¡¡¡y, the secant stiffness is zero. It was therefore necessary
to develop an alternative procedure for deriving the characterising linear stiffness for
rocking simply supported URM walls.
192
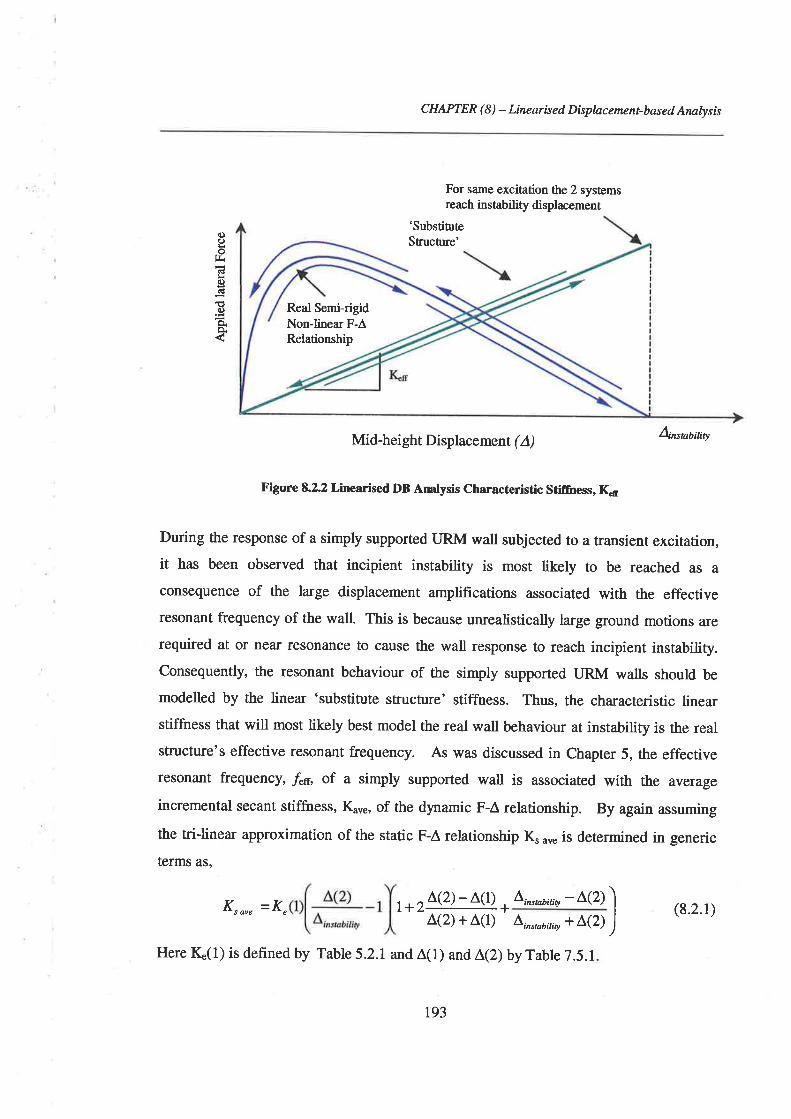
CHAPTER (8) - Linearised Displacement-based Analysis
For same excitation the 2 systemsreach instability displacement
'SubstiûlteSEuch¡re'
Mid-height Displacement ( A)
tr'igure 8.22 Linearised DB Analysis Characteristic StifÊress, K.¡
During the response of a simply supported URM wall subjected to a transient excitation,it has been observed that incipient instability is most likely to be reached as aconsequence of the large displacement amplif,rcations associated with the effectiveresonant frequency of the wall. This is because unrealistically large ground motions are
required at or near resonance to cause the wall response to reach incipient instability.Consequently, the resonant behaviour of the simply supported URM walts should be
modelled by the linea¡ 'substitute structure' stiffness. Thus, the characteristic linearstiffness that will most likely best model the real wall behaviour at instability is the realstructure's effective resonant frequency. As was discussed in Chapter 5, the effectiveresonant frequency, ,Ên of a simply supported wall is associated with the aveÍage
incremental secant stiffrress, K"r", of the dynamic F-Â relationship. By again assuming
the tri-linear approximation of the static F-Â relationship K u"" is determined in generic
terms as,
o()!ol¡.ctkí)ctEIt)o¡Êr
A¡rr¡o6¡¡¿¡y
Krou" =K" r+2LQ)- L(r) +
Liwøøniry - LQ)Â(2) + Â(1) Linsøbitiry + L(2)
Here Ç(1) is dehned by Table 5.2.1andÂ(l) and L(Z)by Tabte 7.5.1
Real Semi-rigidNon-linear F-ÀRelationship
t93
(8.2.1)

CHAPTER (8) - Linearised Displacement-based Arnlysis
As the average dynamic secant stiffness, & ou" = 312 K" un" (again assuming a triangular
acceleration response relative to the wall supports) an estimate of the effective resonant
frequency without considering damping is therefore derived in accordance with
a=2nf=M
3 K,o,"
lqr2 M"
(8.2.2)2n
Since this estimation of/.6 by Equation 8.2.2 does not consider the damping component,
the true effective resonant frequency is expected to be slightly higher than the estimation.
This is confirmed by comparison with THA in Section 8.3.1.
8.22. Simply Supported URM Walls Modelled as a SDOF Oscillator
Prior to DB analysis being applied to a simply supported URM wall the substitutions
required for the modeling of the rocking system as an SDOF oscillator must be
recognised. These substitutions are required as for SDOF oscillator it is assumed that
lÙOVo of the system mass is mobilized whereas for rocking bodies this is not the case. As
a result the effective mass location relative to the supports must be considered.
8.2.2.1. Modelled Displac eme nt Capacity
As discussed in Section 5.2.1, for rigid simply supported objects the instability mid-
height displacement, A¡r¡¿6i¡1y, is considered to have been reached when the resultant
vertical force above the mid-height crack, due to self weight and overburden, is displaced
outside of the back mid-height edge of the wall. The mid-height displacement at which
this occurs is dependent on the support conditions (Table 5.2.1). For simply supported
'semi-rigid' URM walls with relatively low levels of applied overburden the finite
vertical reaction stress blocks a¡e small atlarge mid-height displacements. Consequently,
the rigid incipient instability displacement, ¡s¡¿6i¡¡y, can also be assumed for the analysis
of 'semi-rigid' simply supported URM walls.
âS'e
t94
CHAPTER (8 ) - Linearised Dßplacement-based Analysis
As was discussed in the development of the THA algorithm in Chapter 7, to represent a
simply supported rocking object as an SDOF oscillator a triangular acceleration responseis appropriate relative to the supports. Consequently, the effective masses of the tworocking free bodies are located at the 213 of the free body heights as measured from thesupports. The effective displacement capacity of the modelled SDOF 'substitute
structure', 4r rsøuility, is therefore reduced to 2/3 of the wall's static mid-heightdisplacement capacity so that:
Anmstauitity = 2/3 A¡.¡¿5¡¡1,
8.2.2.2. Modelled Damping Appropriate During Rocking Response
To take into account the reduced response velocity at the effective mass the level ofdamping associated with the elastic displacement response spectrum is taken as 213 thatdetermined experimentally from the mid-height response of the wall. As was presented inSection 6.4.6.3, a lower bound mid-height experimental equivalent viscous damping,
€soo", of approximately 57o was observed for both the 50 mm and 110 mm thick wallspecimens (refer Figure 6.4.20 and Figure 6.4.21). For simplicity and to be slightlyconservative an equivalent viscous damping of 57o for all frequencies was adopted. Theproportional damping coeffltcient, c, therefore varies linearly with frequency. Thecorresponding equivalent viscous damping assumed for the DB analysis to determine theelastic RSD was therefore 3Vo (=2¡3 5Eo¡.
8.3. Effectiveness of the Linearised DB Analysis
To test the effectiveness of the proposed DB analysis for face loaded simply supportedURM walls an extensive analytical study was conducted using the non-linear THAsoftware ROWMANRY presented in Chapter 7. In this study wall configurationsselected for examination included simply supported URM walls l.5m tall, beingrepresentative of the experimental study presented in Chapter 6, 3.3m tall, being acommon height found in Aust¡alian masonry construction and 4.0m tall, as permitted bythe South Australian Housing Code, 1996. For each wall height, wall thickness
195
CHAPTER (8) - Linearised Displacement-based Analysis
considered included 50mm, 110mm and 220mm. Iævels of applied overburden included
0MPa, 0.075MPa, 0.15MPa and 0.25MPa being representative of Australian masonry
construction. For all wall configurations having applied overburden, the top vertical
reaction was assumed to be pushed to the leeward face of the wall so that the mid-height
Ainstability was the thickness of the wall (refer Table 5.2.1) being representative of a
concrete slab above boundary condition. Finally, the three levels of mortar joint
degradation defined in Section 7 .5 were also examined for each of the wall configuration
considered. As the tri-linear F-A approximation is again used Table 7.5.1 presents the
defining displacements Â(1) and A(2) associated with each of the three levels of joint
degradation.
The first stage in testing the effectiveness of the proposed linearised DB analysis
procedure was to determine the estimated effective resonant frequency for each of the
wall configurations based on the average cycle secant stiffness to ¡r¡u6¡¡¡r, without
considering damping in accordance with Equation 8.2.1. Following this, an extensive
THA study using gaussian pulse input was conducted to confi¡m that the estimate of the
effective resonant frequency derived was appropriate. A linearised DB analysis was then
conducted on each of the simply supported wall configuration subjected to the transient
excitations as presented in Table 6.4.9. Here the percentage of the normalised transient
excitations required to cause instability of the simply supported URM wall under
consideration was predicted. As part of the linearised DB analysis procedure the derived
estimate of effective resonant frequency using Equation 8.2.2 was used as the
characteristic 'substitute structure' frequency. As discussed in Section 6.4.7.2 the
earthquake excitations used were selected to provide a representative cross section of
frequency and amplitude contents of plausible ground motions.
Comparison of the DB analysis is then made with results derived using the
comprehensive THA softwa¡e. The following sections present each stage of the study.
196
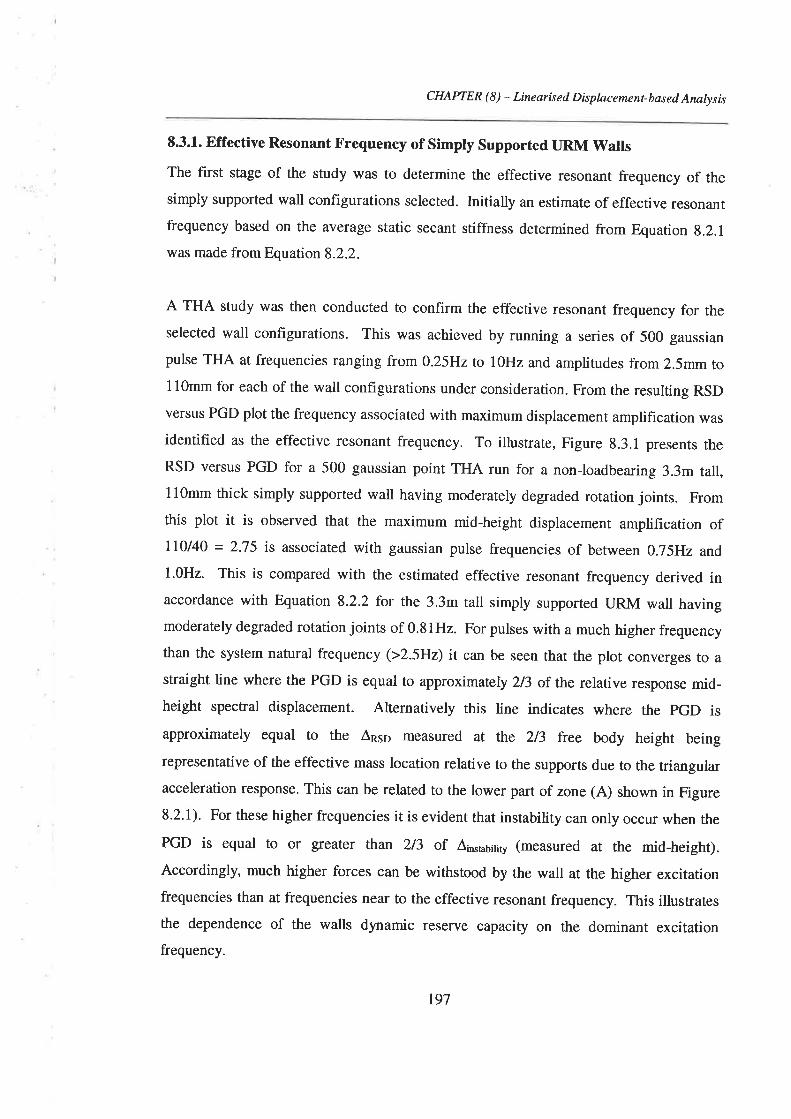
CHAPTER (8) - Linearised Displacement-based Analysis
8.3.1. Effective Resonant Frequency of simpry supported URM wallsThe first stage of the study was to determine the effective resonant frequency of thesimply supported wall configurations selected. Initially an estimate of effective resonantfrequency based on the average static secant stiffness determined from Equation g.2.1
was made from Equation8.2.2.
A THA study was then conducted to confirm the effective resonant frequency for theselected wall configurations. This was achieved by running a series of 500 gaussian
pulse THA at frequencies ranging from 0.25Hzto l}Hz and amplitudes from 2.5mm to11Omm for each of the wall configurations under consideration. From the resulting RSDversus PGD plot the frequency associated with maximum displacement amplification wasidentified as the effective resonant frequency. To illustrate, Figure 8.3.1 presents theRSD versus PGD for a 500 gaussian point THA run for a non-loadbearing 3.3m tall,l lOmm thick simply supported wall having moderately degraded rotation joints. Fromthis plot it is observed that the maximum mid-height displacement amplification oflt0l40 = 2.75 is associated with gaussian pulse frequencies of between 0.75H2 and,
1.0H2. This is compared with the estimated effective resonant frequency derived inaccordance with Equation 8.2.2 for the 3.3m tall simply supported LIRM wall havingmoderately degraded rotation joints of 0.81H2. For pulses with a much higher frequencythan the system natural frequency (>2.5H2) it can be seen that the plot converges to astraight line where the PGD is equal to approximately 213 of the relative response mid-height spectral displacement. Alternatively this line indicates where the pGD is
approximately equal to the Âns¡ measured at the 213 free body height beingrepresentative of the effective mass location relative to the supports due to the triangularacceleration response. This can be related to the lower part of zone (A) shown in Figure8.2.1). For these higher frequencies it is evident that instability can only occur when the
PGD is equal to or greater than 213 of ¡or¡u6¡1, (measured at the mid-height).Accordingly, much higher forces can be withstood by the wall at the higher excitationfrequencies than at frequencies near to the effective resonant frequency. This illustratesthe dependence of the walls dynamic reserve capacity on the dominant excitationfrequency.
r97
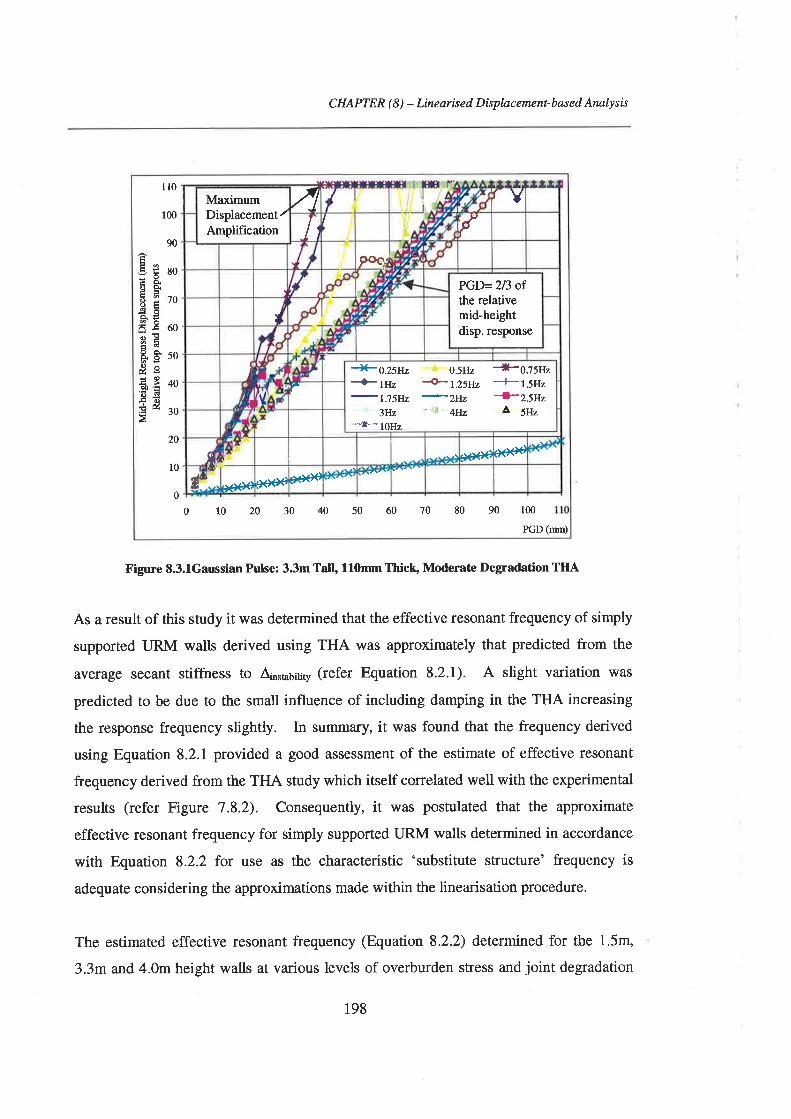
CHAPTER (8) - Linearised Dßplacement-bøsed Analysis
110
r00
90
€Í soEÊó2ioËEÉ8 ¿oo:øáãäsoE:d¡3åË 40
EåË' ,o
20
10
0
0102030405060708090 100
PGD(mrn)
MaximumDisplacement/Amplification
I / rYI I
)
,{
Poc!PGD=2ß ofthe relativemid-heightdisp. response
J
) *o.zsw,1n
-l.75Hz3Hz*:l- loHz
0.5IIz-#t.259"
-zHze''4Hz
*o.lsH"#t.5H"#2.5H"
À sl¡"
1
f âaãl Ðooê
Í Ðêê(; Ðoêê froë'
Figure 8.3.lGaussian Pulse; 33m Tall, 110mm Thicþ Moderate Degradation TIIA
As a result of this study it was determined that the effective resonant frequency of simply
supported URM walls derived using THA was approximately that predicted from the
average secant stiffness to A¡5¡¡5i¡¡y (refer Equation 8.2.1). A slight va.riation was
predicted to be due to the small influence of including damping in the THA increasing
the response frequency slightly. In summary, it was found that the frequency derived
using Equation 8.2.1 provided a good assessment of the estimate of effective resonant
frequency derived from the THA study which itself correlated well with the experimental
results (refer Figure 7.8.2). Consequently, it was postulated that the approximate
effective resonant frequency for simply supported URM walls determined in accordance
with Equatto¡ 8.2.2 for use as the characteristic 'substitute sffucture' frequency is
adequate considering the approximations made within the linearisation procedure.
The estimated effective resonant frequency (Equation 8.2.2) determined for the 1.5m,
3.3m and 4.0m height walls at various levels of overburden stress and joint degradation
198
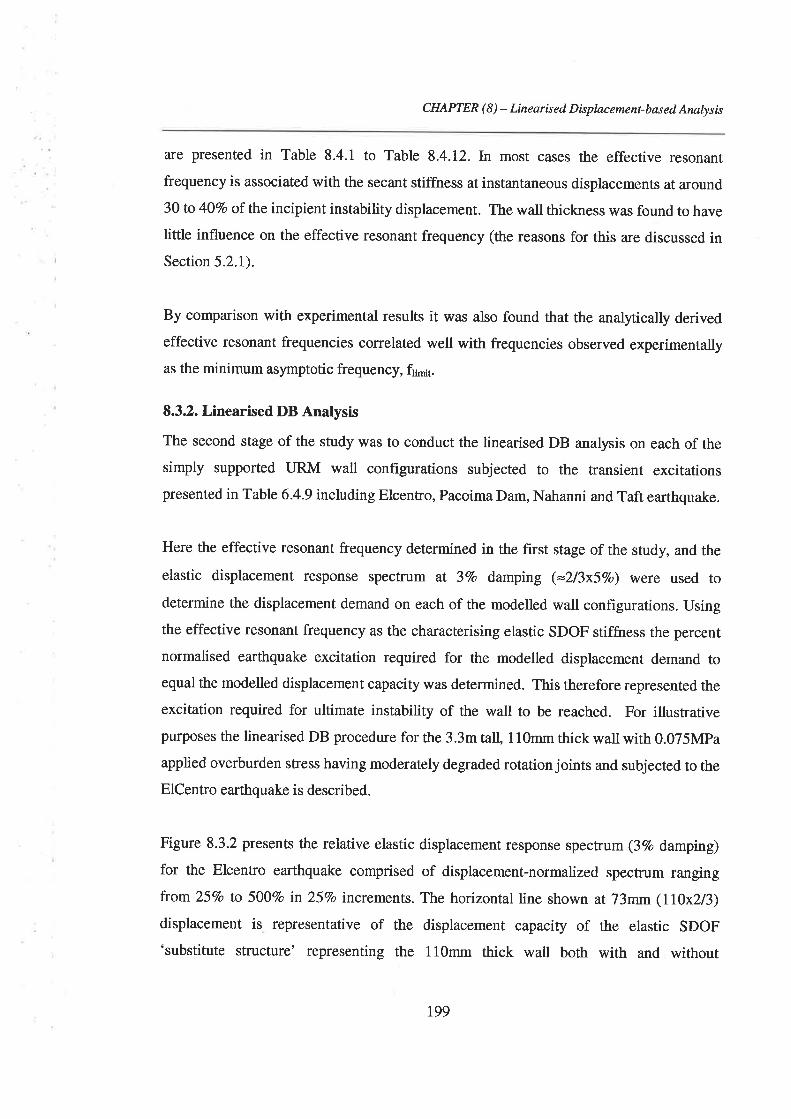
CHAPTER (8) - Linearised Displacement-based Analysis
are presented in Table 8.4.1 to Table 8.4.12. In most cases the effective resonant
frequency is associated with the secant stiffness at instantaneous displacements at around
30 to 40Vo of the incipient instability displacement. The wall thickness was found to have
little influence on the effective resonant frequency (the reasons for this are discussed inSection 5.2.1).
By comparison with experimental results it was also found that the analytically derived
effective resonant frequencies correlated well with frequencies observed experimentally
as the minimum asymptotic frequency, friroit.
8.32. Linearised DB Analysis
The second stage of the study was to conduct the linearised DB analysis on each of the
simply supported tlRM wall configurations subjected to the transient excitationspresented in Table 6.4.9 including Elcentro, Pacoima Dam, Nahanni and Taft earthquake.
Here the effective resonant frequency determined in the fîrst stage of the study, and the
elastic displacement response spectrum at 3Vo damping (=2l3x5%o) were used todetermine the displacement demand on each of the modelled wall configurations. Using
the effective resonant frequency as the cha¡acterising elastic SDOF stiffrress the percent
normalised earthquake excitation required for the modelled displacement demand toequal the modelled displacement capacity was determined. This therefore represented the
excitation required for ultimate instability of the wall to be reached. For illustrativepurposes the linearised DB procedure for the 3.3m tall, 110mm thick wall with 0.075MPa
applied overburden stress having moderately degraded rotation joints and subjected to the
ElCentro earthquake is described.
Figure 8.3.2 presents the relative elastic displacement response specfum (3Vo damping)
for the Elcentro earthquake comprised of displacement-normaltzed spectrum ranging
from 25Vo to 500Vo in 25Vo increments. The horizontal line shown at 73mm (ll0x2l3)displacement is representative of the displacement capacity of the elastic SDOF'substitute structure' representing the 110mm thick wall both with and without
199
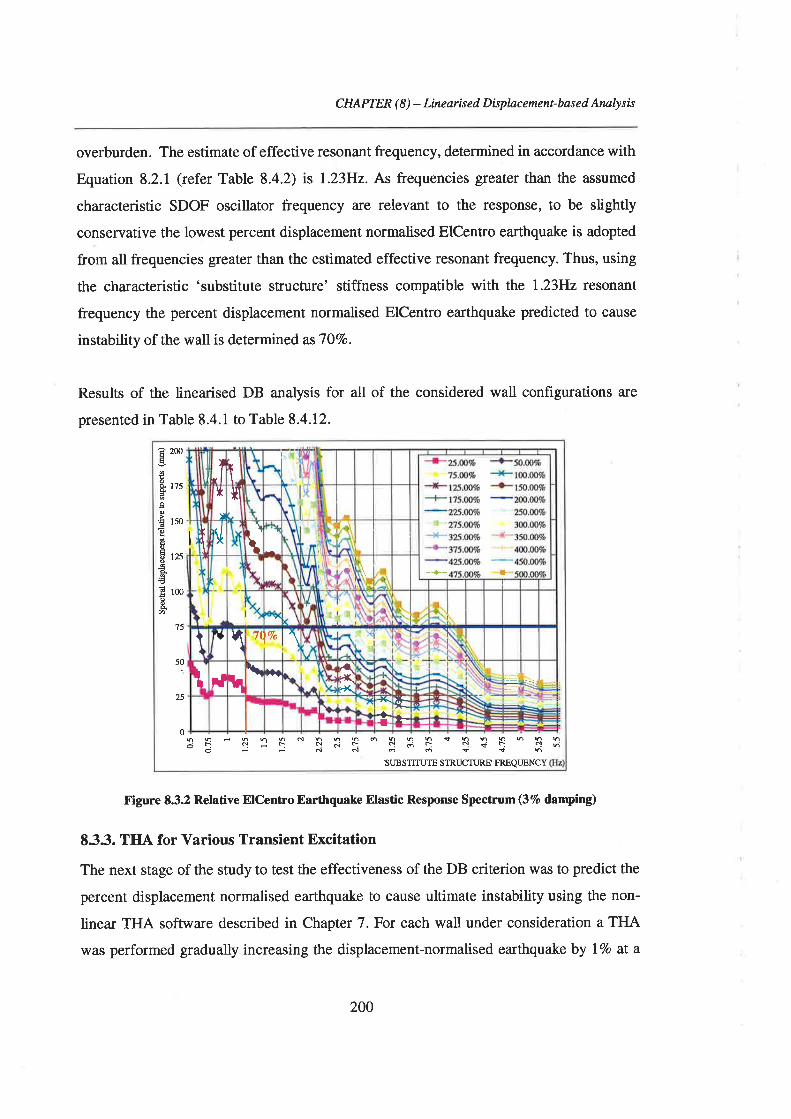
CHAPTER (8) - Linearised Displacement-based Analysis
overburden. The estimate of effective resonant frequency, determined in accordance with
Equation 8.2.1 (refer Table 8.4.2) is l.23Hz. As frequencies gteater than the assumed
characteristic SDOF oscillator frequency are relevant to the response, to be slightly
conservative the lowest percent displacement normalised ElCentro earthquake is adopted
from all frequencies greater than the estimated effective resonant frequency. Thus, using
the characteristic 'substitute structure' stiffness compatible with the l.23Hz resonant
frequency the percent displacement normalised ElCentro earthquake predicted to cause
instability of the wall is determined as 7OVo.
Results of the linearised DB analysis for all of the considered wall conf,rgurations are
presented in Table 8.4.1 to Table 8.4.12.
Figure 8.3.2 Relative ElCentro Earthquake Elastic Response Spectrum (37o damp¡ng)
8.33. TIIA for Various Transient Excitation
The next stage of the study to test the effectiveness of the DB criterion \ryas to predict the
percent displacement normalised earthquake to cause ultimate instability using the non-
linear THA software described in Chapter 7. For each wall under consideration a THA
was performed gradually increasing the displacement-normalised earthquake by l7o at a
ïa
I
ï
-+- +
*t
xt¡
1¿t\b¡
I
t \
1IY I 7Qïo 1
¡I FT Lt\ )aa Ai'l(
P( Ntf.++.
ÊÈ
e 200É
ãft rzs
.s
'ã rtEIH lzs
€E roo
8"
75
50
25
0hhih6hNhhhóhhhthhhhñhJtìcl..jrìclñrì.ìGiìcl+lqviOÉÊddoOçth
'SUBSTITUTE STRUCTIJRE' FREQTJENCY
200

CHAPTER (8) - Lineørised Dßplacernent-based Analysis
time. Figure 8.3.3, Figure 8.3.4 and Figure 8.3.5 present the peak mid-heightdisplacement result, relative to the supports, for the 1.5m, 3.3m and 4m wall respectively
at va¡ious overburden and with moderately degraded bed joints subjected to the ElCentroearthquake. From Figure 8.3.4 it can be observed that for the 3.3m wall with 0.0Z5Mpaapplied overburden stess the THA prediction for ultimate instability is 85Vo of thedisplacement normalised ElCentro earthquake. This compares reasonably well with theDB analysis prediction of 70Vo ElCentro as described in Section 8.3.2. Dampingassumed for all THA was Rayleigh damping with the mass proportional coeff,rcient of 1.0
and stiffness proportional coefficient of 0.002 as these represented the lower bound of theexperimental results presented in Section 6.4.6.3.
ll0100
E90tsY80É8zos60ÉsoÂË40Ð'õ. 30¡Ézo
0
+0MPa{-0.075MPa
0.l5MPaJê0.25MPa
a
0 50 100 150 200 250 300 350 400 4507o Normalised Accelerogram
Figure 8.3.3 THA ElCentro Earthquake: 1.5m Tall, Moderate Degradation
110
100
Ee0YaoEzooR60ås0åûõ830þzo
00 25 50 75 100 t25 150 175 200 225 250
% Normalised Accelerogram
vt t -"
<-OMF¿{-0.075MPa
0.15MPa
-)ts0.25MPara¡'tr tJ
Figure 8.3.4 ElCentro Earthquake: 33m Tall, Moderate Degradation
201

CHAPTER (8) - Linearised Displacement-based Anølysis
110
^100Ëe0ãaoËro-E ooÞ.
É50z,ÆilEso€ro'' 10
0
'ìl" t^ 'I/ : -
0 15 30 45 60 75 90 r05 r20 135 150 165% Normalised Accelerogram
-#OMPa#0.075MPa
0.l5MPa-X-0.25MPa
,t.fl it-
Figure 8.3.5 ElCentro Earthquake: 4.0m Tall, Moderate Degradation
The analysis results for the THA study are presented in Table 8.4.1 to Table 8.4.12.
8.3.4. Comparison of Predictive Model Results
The final stage of the study to test the effectiveness of the DB criterion was to compale
the linearised DB and non-linear THA predictions of the percent displacement
normalised eafthquake to cause ultimate instability as derived in 8.3.2 and 8.3.3
respectively. Figure 8.3.6 graphically presents these comparisons where it is observed
that almost all of the results fall within the bounds of the 1507o tolerance lines. That is,
the linearised DB analysis, using the estimate of effective resonant frequency derived in
accordance with Equation8.2.2 as the characterising 'substitute structure' frequency, will
provide an ultimate instability prediction not more than 1.5 times and or less than2l3 of
that predicted by the more comprehensive non-linear THA. The scatter of results
observed is a function of the linearisation of the real non-linear stiffrress and damping
components of the real rocking wall system.
Further to this comparison, the more traditional 'quasi-static' rigid body prediction of
lateral resistance capacity and the 'semi-rigid resistance threshold' acceleration (refer
Table 8.4.1 to Table 5.4.12) are compared with the THA predictions.
202
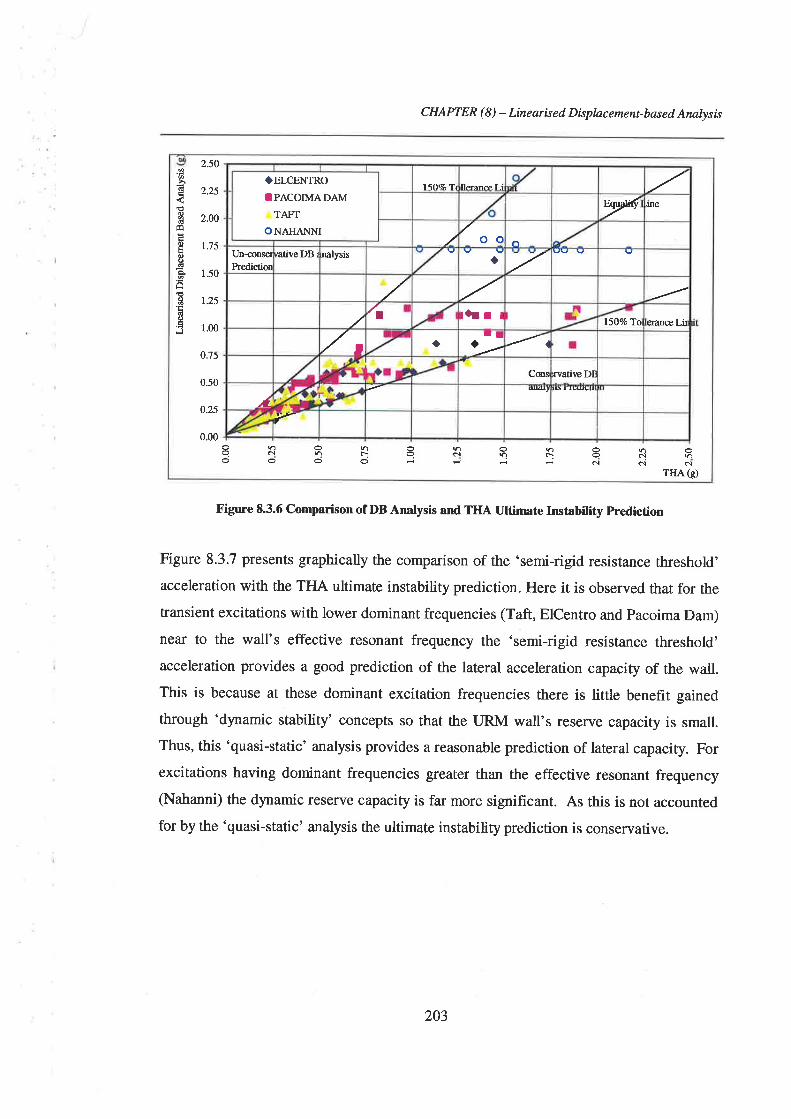
CHAPTER (8) - Linearised Displacement-based Analysis
d
oõÉIoo(È
H
o'ÉdoJ
2.50
2.25
2.00
1.75
1.50
1.25
1.00
0.75
0.50
0.25
0.00Òo el
oono Io o eì oI rì o
elclN
oN
THAG)
.ELCENTROIPACOIMADAM
TAFT
ONAHANM
15O4"'ît llønæI.i w ,me
o o ôUn-conserPredicti@
¡ativeDB r nalysis a -7/r r.¡r r l5Ocr'oTo terance Lir
t arl)/
Cons rvativÊ DI
I
Figure 8.3.6 Comparison of DB Analysis and THA Ultirmte Instability Prediction
Figure 8.3.7 presents graphically the compa.rison of the 'semi-rigid resistance threshold'
acceleration with the THA ultimate instability prediction. Here it is observed that for the
transient excitations with lower dominant frequencies (Taft, ElCentro and Pacoima Dam)
near to the wall's effective resonant frequency the 'semi-rigid resistance threshold'
acceleration provides a good prediction of the lateral acceleration capacity of the wall.This is because at these dominant excitation frequencies there is little benefit gained
through 'dynamic stability' concepts so that the URM wall's reserye capacity is small.
Thus, this 'quasi-static' analysis provides a reasonable prediction oflateral capacity. Forexcitations having dominant frequencies greater than the effective resonant frequency(Nahanni) the dynamic reserve capacity is far more significant. As this is not accounted
for by the 'quasi-static' analysis the ultimate instability prediction is conservative.
203
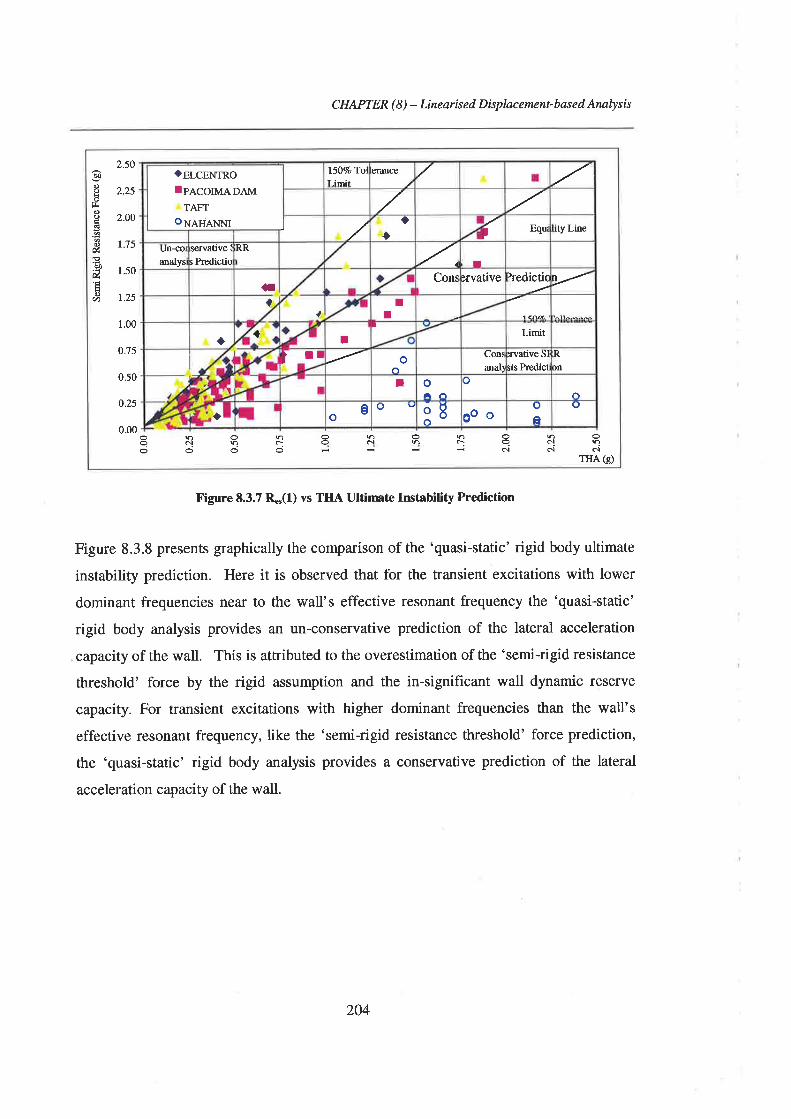
CHAPTER (8) - Linearised Displacement-based Analysis
d)ob
ç¡.os.s.2oúËè0dEo(t)
2.50
2.25
2.00
1.75
1.50
t.25
1.00
0.75
0.s0
0.25
0.00
aeI-cENTRolpeconuRo¡r"t
TAFToNRnnr.INI
l50%oTolT -imit
erance
I ?I I Equ Lity Line
Un-colanalys
servative I
s PredictioRR
a
I
lla
aa
a
Cons )rvative lredictic
II !^lt^--^^
T¡
Limit
ì TT ot.ì
Consa¡al:
:rvative Slris Pr€dict
R)n
I oâôo
ôeo
o oBô ooo
oÊ
(J
onÔnahonanoõñnrôNhroe{nððoo-'iôi ñõi
THAG)
Figure 8.3.7 R*(1) vs THA Ultirnatc Instability Prediction
Figure 8.3.8 presents graphically the comp¿ìrison of the 'quasi-static' rigid body ultimate
instability prediction. Here it is observed that for the transient excitations 'with lower
dominant frequencies near to the wall's effective resonant frequency the 'quasi-static'
rigid body analysis provides an un-conservative prediction of the lateral acceleration
capacity of the wall. This is attributed to the overestimation of the 'semi-rigid resistance
threshold' force by the rigid assumption and ths in-significant wall dynamic reserve
capacity. For transient excitations with higher dominant frequencies than the wall's
effective resonant frequency, like the 'semi-rigid resistance threshold' force prediction,
the 'quasi-static' rigid body analysis provides a conservative prediction of the lateral
acceleration capacify of the wall.
204
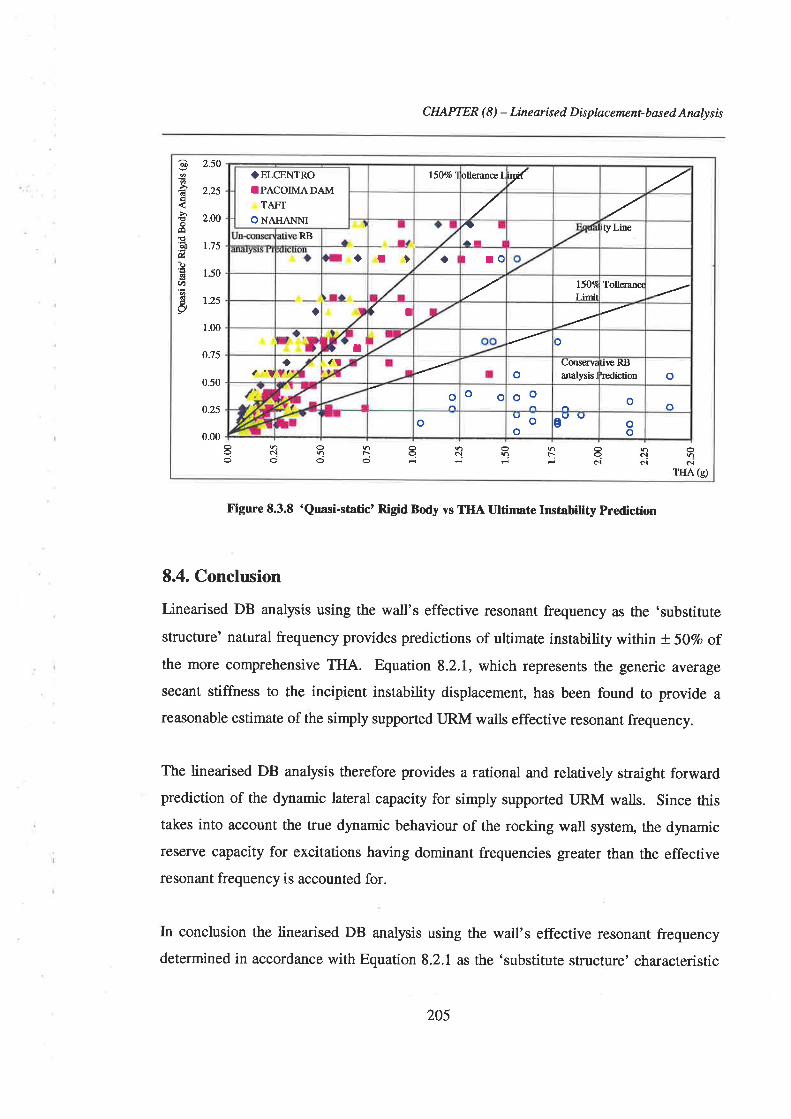
CHAPTER (8) - Lineørised Displacement-based Analysis
€9
õÊ
atoÉËè0ú-a
su)
aa
2.50
2.25
2.00
1.75
1.50
1.25
1.00
0.75
0.50
0.25
0.00ôo cì
ooVlo ¡l
o a cl ou] ì Eelcle.l e{
THAG)
.ELCENTROTPACOIMADAM
TAFTONAHANNI
RB
a
150%1 ollerance I {
I t a
^,AI
ity Line
I Io
o
ßOqtLimit
Tolleranq
ltI o
,'l,) /l
oCmserv¿anatysis J
ive RBTediction o
o oo oo o ôo o
o o" oo
Figure 8.3.8 'Quasi-static' Rigid Body vs THA llltirnate Instability Prediction
8.4. Conclusion
Linearised DB analysis using the wall's effective resonant frequency as the 'substitute
structure' natural frequency provides predictions of ultimate instability \ryithin + 5OVo ofthe more comprehensive THA. Equation 8.2.1, which represents the generic average
secant stiffness to the incipient instability displacement, has been found to provide areasonable estimate of the simply supported IJRM walls effective resonant frequency.
The linearised DB analysis therefore provides a rational and relatively straight forwardprediction of the dynamic lateral capacity for simply supported URM walls. Since this
takes into account the true dynamic behaviour of the rocking wall system, the dynamic
reserve capacity for excitations having dominant frequencies greater than the effectiveresonant frequency is accounted for.
In conclusion the linearised DB analysis using the wall's effective resonant frequency
determined in accordance with Equation 8.2.1 as the 'substitute structure' characteristic
205
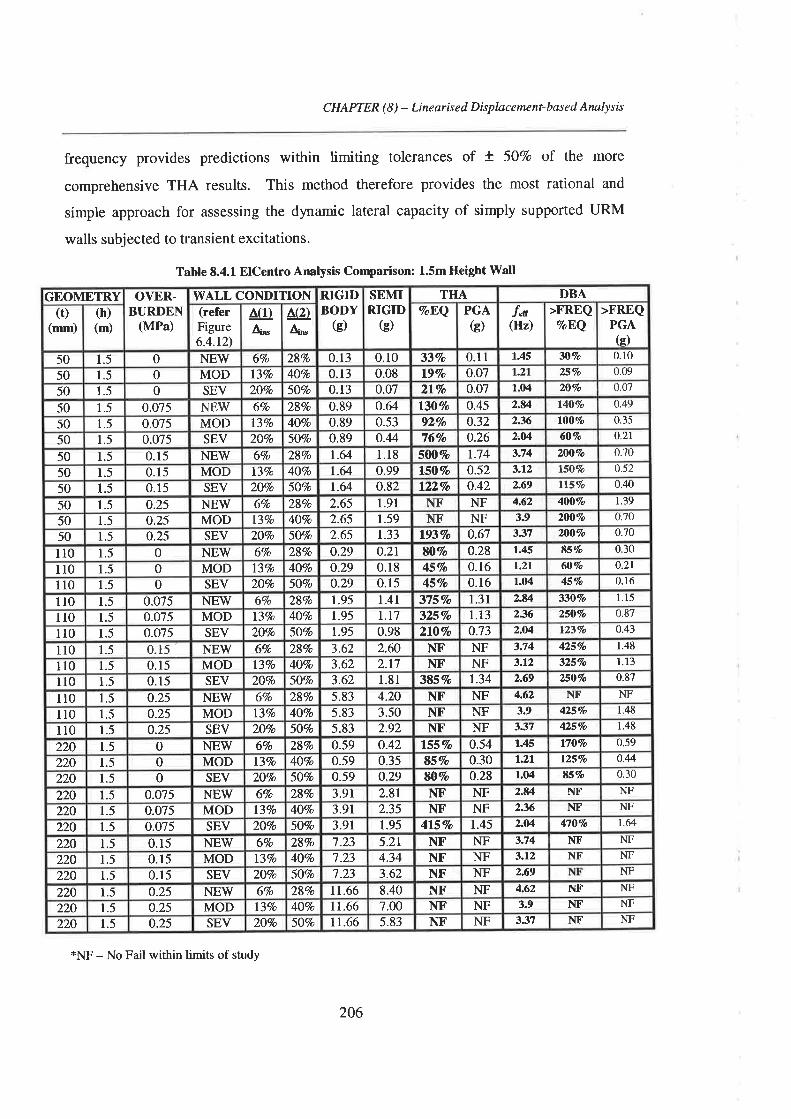
CHAPTER (8) - Linearised Dßpbcement-based Analysis
frequency provides predictions within limiting tolerances of + 50Vo of the more
comprehensive THA results. This method therefore provides the most rational and
simple approach for assessing the dynamic lateral capacity of simply supported URM
walls subjected to transient excitations.
Table 8.4.1 ElCentro Analysis Conrparison: 1.5m Height Wall
GEOMETRY OVER-BURDEN
(MPa)
WALL CONDITION RIGIDBODY
(g)
SEMIRIGID
G)
THA DBA(t)
(mm)(h)(m)
(referFigure6.4.12)
ag)A^
&tA*
ToEQ PGAG)
l*(Hz)
>FREQToEQ
>FREQPGAk)
50 1.5 0 NE}V 67o 287o 0.13 0.10 33Vo 0.11 1.45 307o 0. l0
50 1.5 0 MOD l37o 4OVo 0.13 0.08 197o 0.07 t.2t 25Vo 0.09
50 1.5 0 SEV 2O7o 5O7o 0.13 0.07 217o 0.07 1.04 20Vo 0.07
50 1.5 0.075 NEW 67o 28Vo 0.89 0.64 l3O7o 0.45 2.U l4OTo 0.49
50 1.5 0.075 MOD l3%o 4OVo 0.89 0.53 924o 0.32 2.X lOO9o 0.35
50 1.5 0.075 SEV 2O4o 5O7o 0.89 0.44 767o 0.26 LM 6OVo o.2t
50 1.5 0.15 NEW 6Vo 28Vo 1.64 1.18 5407o 1.14 t.74 2OOTo 0.70
50 1.5 0.15 MOD 13Vo 4OVo 1.64 0.99 LSO4o 0.52 3.r2 lSOTo 0.52
50 1.5 0.15 SEV 2OVo 5OVo 1.64 0.82 lXZ7o 0.42 2.69 ll57o 0.40
50 1.5 0.25 NE}V 6Vo 28Vo 2.65 1.91 NF NF 4.62 4001o 1.39
50 1.5 o.25 MOD l3Vo 4OVo 2.65 1.59 I{F NF 3.9 2OOVo 0.70
50 1.5 o.25 SEV 2OVo 5OVo 2.65 1.33 1939o 0.67 337 2NVo 0.70
110 1.5 0 NEV/ 6Vo 287o o.29 o.2l 80Vo 0.28 1.45 85Vo 0.30
ll0 1.5 0 MOD 13Vo 4OVo 0.29 0.18 457o 0.16 t2r 6OVo 0.21
110 1.5 0 SEV 2O7o 5O7o 0.29 0.15 457o 0.16 1.04 45Vo 0.16
110 1.5 0.075 NEW 67o 28Vo 1.95 l.4l 3757o t.3l 2.U 3tOVo 1. r5
110 1.5 0.075 MOD 13Vo 4O7o 1.95 t.t7 3257o 1.13 2.36 250Vo 0.87
110 1.5 0.075 SEV 2OVo 5OVo 1.95 0.98 2107o 0.73 2.M \23Vo 0.43
110 1.5 0.15 ' NEW 67o 287o 3.62 2.60 Nr. NF 1.74 425Vo 1.48
110 1.5 0.15 MOD 131o 4OVo 3.62 2.17 NF NF 3.12 3257o 1.13
110 1.5 0.15 SEV 2OVo 5OVo 3.62 l.8l 3854o 1.34 2.69 250/o 0.87
110 1.5 0.25 NEV/ 67o 28Vo 5.83 4.20 ¡m NF 4.62 NT' NF
110 1.5 0.25 MOD 137o 4OVo 5.83 3.50 NF NF 3.9 ASTo 1.48
r10 1.5 0.25 SEV 2O7o 5OVo 5.83 2.92 NF NF 337 4254o 1.48
220 1.5 0 NEW 6Vo 28Vo 0.59 o.42 1557o 0.54 1.45 lTOVo 0.59
220 1.5 0 MOD l3Vo 4OVo 0.59 0.35 85Vo 0.30 l.2l 125Vo 0.44
220 1.5 0 SEV ZOVo SOVo 0.59 0.29 N7o 0.28 1.04 85Vo 0.30
220 1.5 0.075 NEW 6Vo 284o 3.91 2.8r NF NF 2.U NT' NF
220 1.5 0.075 MOD I3Vo 404o 3.91 2.35 NF NF 236 NF NF
220 1.5 0.075 SEV 2OVo 5O1o 3.9t 1.95 4l5Vo 1.45 2.M 4707o t.&220 1.5 0. l5 NEW 6Vo 28Vo 7.23 5.2r NF NF 3.74 NT' NF
220 1.5 0.15 MOD 13Vo 4O7o 7.23 4.34 I\F NF 3.12 NT' NF
220 1.5 0.15 SEV 2OVo 5O7o 7.23 3.62 NF NF 2.69 NF
220 1.5 0.25 NEW 61o 28Vo 11.66 8.40 NF NF 4.62 NF NF
220 1.5 0.25 MOD l31o 4OVo 11.66 7.00 NF NF 3.9 NT' NF
220 1.5 0.25 SEV 2OVo SOVo 1r.66 5.83 NF NF 3.37 NT' NF
*NF - No Fail within limits of study
206

CHAPTER (8) - Lineørised Displacernent-based Arnlysis
Table 8.4.2 ElCenho Analysis Conrparison: 3.3m Height Wall
GEOMETRY OVER.BURDEN
0\,rPa)
WALL CONDITION RIGIDBODY
G)
SEMIRIGID
G)
THA DBA(r)
(mm)(h)(m)
(referFigure6.4.12)
a(1)A^
&I4^
VoEQ PGAG)
l"n(Hz)
>FREQloEQ
>FREQPGAk)
50 3.3 0 NE\Y 67o 28Vo 0.06 0.04 2O7o 0.07 0.96 257o 0.0950 3.3 0 MOD 13Vo 4OVo 0.06 0.04 tLVo 0.08 0,81 25Vo 0.(D50 3.3 0 SEV 2OVo 5O7o 0.06 0.03 267o 0.09 t.7 25To 0.0950 3.3 0.075 NEW 6Vo 28Vo o.22 0.r6 327o 0.1I t.46 3O7o 0. r050 3.3 0.075 MOD 13Vo 4OVo 0.22 0.13 27Vo 0.09 t.?.3 25y'o 0.0950 3.3 0.075 SEV 2OVo 5OVo 0.22 0.11 2OVo 0.07 1.0ó 2OVo 0.0750 3.3 0.15 NEW 6Vo 287o o.37 0.27 547o 0.19 1.82 45lo 0.1650 3.3 0.15 MOD 13Vo 4OVo 0.37 0.22 377o 0.13 1.54 357o tJ.12
50 3.3 0.15 SEV 2OVo 5O7o 0.37 0.19 327o 0.11 r33 3O9o 0.r050 3.3 o.25 NEW 6Vo 28Vo 0.58 0.42 93Vo 0.32 2.72 TOVo 0.2450 J.J 0.25 MOD l3Vo 4O7o 0.58 0.35 6Vo 0.23 SOVo o.t750 3.3 o.25 SEV 2O7o 5O7o 0.58 0.29 439o 0.15 L6¿ 4O7o 0.14110 3.3 0 NEW 6Vo 28Vo 0. 13 0.10 457o 0.16 0.96 457o 0. lóll0 3.3 0 MOD l37o 4OVo 0.13 0.08 45Vo 0.16 0.81 451o 0.1óll0 3.3 0 SEV 2OVo 50% 0.13 0.07 457o 0.16 0.7 457o 0. l6110 3.3 0.075 NEW 6Vo 28Vo 0.48 0.34 üVo 0.28 1.46 EOVo 0.28110 3.3 0.075 MOD 137o 4OVo 0.48 o.29 85Vo 0.30 t.?ß 7O7o 0.24ll0 3.3 0.075 SEV ZOVo SOVo 0.48 o.24 5O7o 0.17 1.06 S54o 0.19110 3.3 0.15 NEW 6Vo 28Vo 0.82 0.59 lffiVo 0.56 1.82 lOOTo 0.35110 3.3 0.15 MOD l3Vo 4OVo o.82 0.49 l30Vo 0.45 1.54 917o 0.31ll0 3.3 0.15 SEV ZOVo 5O7o 0.82 0.41 1257o o.44 1.33 EOVo 0.28ll0 3.3 0.25 NEW 67o 28Vo 1.28 0.92 ttsvo 0.78 2.?:2 l5O7o 0.52110 3.3 o.25 MOD l3Vo 4O7o 1.28 0.77 1757o 0.61 1.87 llïVo 0.38110 3.3 0.25 SEV 2OVo 5OVo 1.28 o.& l45Vo 0.51 1.62 9O7o 0.31220 3.3 0 NEW 6Vo 28Vo 0.27 0.19 7íVo 0.26 0;96 9OVo 0.3r220 3.3 0 MOD 137o 4OVo 0.27 0.16 80Vo 0.28 0;81 9{Vo 0.31220 3.3 0 SEV 2O7o 5O7o o.27 0.13 lA07o 0.35 0.7 9OVo 0.31220 3.3 0.075 NEW 6Vo 28Vo 0.95 0.69 16OVo 0.56 1.46 16OVo 0.56220 3.3 0.o75 MOD 13Vo 40Vo 0.95 0.57 lffiVo 0.56 1.23 l25lo 0.44220 3.3 0.075 SEV 2OVo 5OVo 0.95 0.48 l05Vo 0.37 1:06 9X)7o 0.31220 3.3 0. l5 NEW 67o 28Vo 1.64 1.18 3357o l.t7 1.82 2OOVo 0.70220 3.3 0.15 MOD 13Vo 4OVo 1.64 0.98 2757o 0.96 1.54 17SVo 0.61220 3.3 0.15 SEV 2OVo 5OVo 1.64 0.82 2357o 0.82 1.33 17SVo 0.ól220 3.3 0.25 NEIW 6Vo 28Vo 2.55 1.84 4SSVo 1.58 2.X2 3507o 1.22220 3.3 0.25 MOD 13Vo 4OVo 2.55 1.53 SOOVo 1.74 1.87 25O7o 0.87220 3.3 o.25 SEV 2OVo 5OVo 2.s5 1.28 29n7o t.0r 1.62 17íVo 0.61
*NF - No Fail within limits of study
207
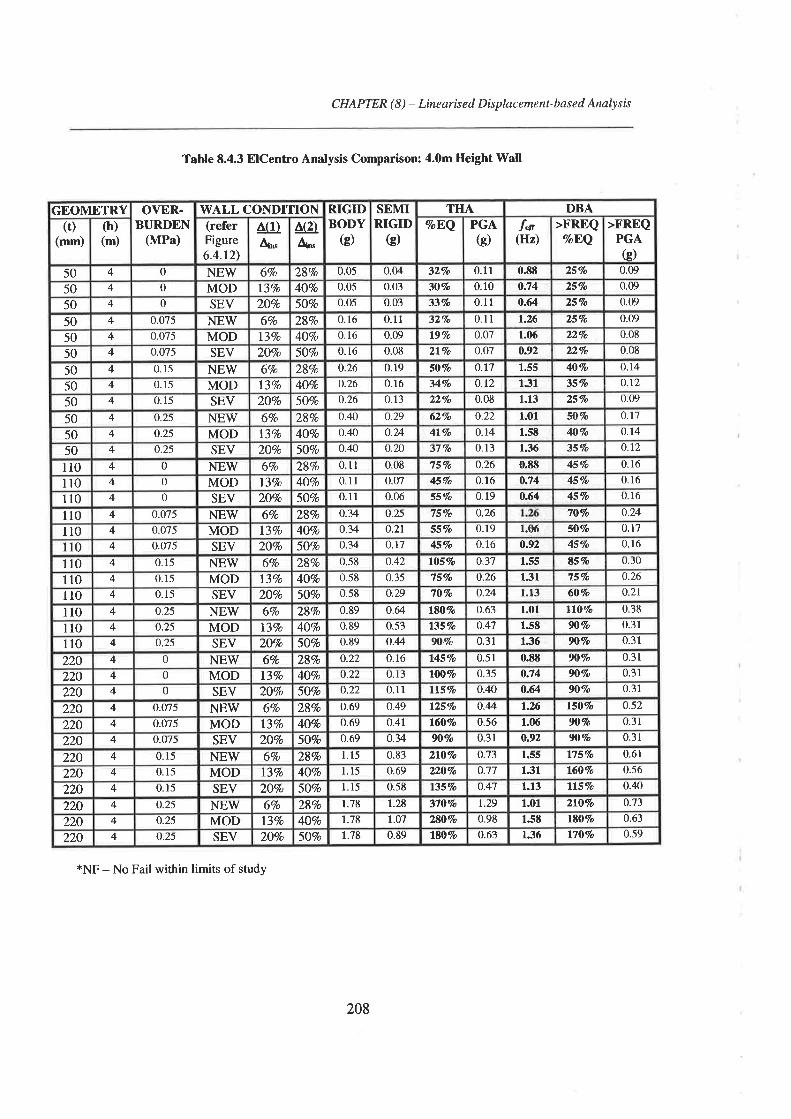
CHAPTER (8) - Linearised Dßplacement-based Analysis
Table 8.4.3 ElCentro Analysis Comparison: 4.0m Height \üall
GEOMETRY OYER-BURDEN
(MPa)
WALL CONDITION RIGIDBODY
G)
SEMIRIGID
G)
THA DBA(t)
(mm)(h)(m)
(referFigure6.4.12\
4ú)A^
AG)4^
VoEQ PGAG)
f*(IIz)
>FREQToEQ
>FREQPGAG)
50 4 0 NEW 6Vo 287o 0.05 o.04 32Vo 0.1r O.EE 254o 0.09
50 4 0 MOD 13Vo 4O7o 0.05 0.03 3O4o 0.10 o.74 259o 0.09
50 4 0 SEV 2O4o 5OVo 0.05 0.03 33Vo 0.n 0.64 25(o 0.09
50 4 0.075 NEW 6Vo 28Vo 0. 16 0.ll 32Vo 0.11 1.26 257o 0.09
50 4 0.075 MOD 137o 4OVo 0.1ó 0.09 L9Vo 0.07 1.06 22Vo 0.08
50 4 0.075 SEV 2OVo 5O7o 0. ló 0.08 2lVo 0.07 0.92 22(o 0.08
50 4 0.15 NEW 6Vo 287o o.26 0.19 5O7o o.t7 1.55 4O9o 0.14
50 4 0.15 MOD l37o 4O7o o.26 0. 16 347o o.t2 1.31 35Vo o.t2
50 4 0. 15 SEV 2OVo 5OVo [J.26 0.13 22Vo 0.08 1.13 251o 0.u,
50 4 o.25 NEW 6Vo 287o 0.4{) o.29 62Vo 0.22 1.01 5O7o 0. 17
50 4 o.25 MOD l3Vo 4OVo 0..!0 0.24 417o 0.14 l.5E 4OVo 0.14
50 4 0.25 SEV 2OVo 5O7o 0.40 o.zo 377o 0.13 1.36 35To 0.12
ll0 4 0 NEW 6Vo 28Vo 0.11 0.08 757o tJ.26 0.8E 45Vo 0. 16
110 4 0 MOD 13Vo 4OVo 0.il 0.07 45Vo 0. l6 0.74 45Vo 0.16
110 4 0 SEV 2OVo 5OVo 0.ll 0.06 55lo 0.19 0.64 457o 0. 16
110 4 0.075 NEW 6Vo 287o 0.34 0.25 757o 0.26 70Vo o.24
110 4 0.075 MOD l3Vo 4OVo 0.34 o.2t 55Vo 0.19 l;06 5O7o 0.17
110 4 0.075 SEV 2OVo 5OVo 0.34 0.17 457o 0.16 0,92 457o 0.16
110 4 0.15 NEW 67o 28Vo 0.5E o.42 lO5Vo 0.37 1.55 ESVo 0.30
ll0 4 0.15 MOD l3Vo 4O7o 0.58 0.35 757o o.26 131 lSVo 0.26
110 4 0. 15 SEV 2OVo 5OVo 0.s8 0.29 TOVo o.24 1.13 60?o 0.21
ll0 4 0.25 NEW 6Vo 287o 0.89 o.g lEïVo 0.63 1.01 IIOVo 0.38
110 4 o.25 MOD l3Vo 4OVo 0.89 0.53 l35Vo o.47 1.sE 9OVo 0.31
110 4 o.25 SEV ZOVo 5O7o 0.89 o.44 9Oio 0.31 136 9O7o 0.31
220 4 0 NE}V 6Vo 281o 0.22 0.16 t457o 0.51 0.8E 9nVo 0.3r
220 4 0 MOD 13Vo 4OVo o.22 0.13 too% 0.35 0.74 9OVo 0.3r
220 4 0 SEV 2OVo 5OVo o.22 0.11 llSVo 0.,1{J 0.64 9O4o 0.31
220 4 0.075 NEW 6Vo 287o 0.69 0.49 l25Vo o.44 1.2Íi lSOlo 0.52
220 4 0.075 MOD 13Vo 4O7o 0.69 0.41 160Vo 0.56 1.06 9OVo 0.31
220 4 0.075 SEV 2OVo 5OVo 0.69 o.34 9O9o 0.3r 0.92 90?o 0.31
220 4 0.15 NEW 6Vo 28Vo l 15 0.83 2to?o o.13 1.55 17SVo 0.61
220 4 0.15 MOD 137o 4OVo 1.15 0.69 2207o 0.77 131 16O7o 0.56
220 4 0. 15 SEV 2OVo 5O7o l.l5 0.58 l35Vo o.47 1.13 llSVo 0.,1O
220 4 o.25 NEW 6Vo 28Vo 1.78 1.28 370Vo 1.29 1.01 2lO7o 0.73
220 4 0.25 MOD 13Vo 4OVo l.7E r.07 2E07o 0.98 l5E IEOVo 0.63
220 4 o.25 SEV 2O7o SOVo 1.78 0.89 lEOTo 0.63 136 lTOVo 0.59
*NF - No Fail within limits of study
208

CHAPTER (8) - Linearised Displacement-based Analysis
Table 8.4.4 Taft Analysis Conrparison: l.5m Height \ilall
GEOMETRY OYER.BURDEN
(MPa)
\ilALL CONDITION RIGIDBODY
G)
SEMIRIGID
G)
THA DBA(r)
(mm)(h)(m)
(referFigure6.4.12)
ag)4*
AQT4^
TIEQ PGAG)
.r"n(Hz)
>FREQloEQ
>FREQPGAk)
50 1.5 o NEIW 6Vo 28Vo 0.13 0.10 72Vo 0.13 1.45 öo"h 0.1450 1.5 0 MOD 13Vo 4OVo 0.13 0.08 58% o.10 1.21 55Uo 0. t050 1.5 0 SEV 20% 50Vo 0.13 0.07 4OUo 0.07 1.04 45% 0.0850 1.5 o.o75 NEI9V 6Vo 28Vo 0.89 o.M NF NF 2.84 190% 0.3450 1.5 0.075 MOD l3Vo 4OVo 0.89 0.53 1360/o o.24 2.36 180ch 0.3250 1.5 0.075 SEV ZOVo 5OVo 0.89 0.44 IOZYo 0.18 2.O4 95"/" o.1750 1.5 o.15 NE}V 6Vo 28Vo '1.64 1.18 NF NF 3.74 410% o.7450 1.5 0.15 MOD 13Vo 4OVo 1.64 0.99 NF NF 3.12 21OUo 0.3850 1.5 0.15 SEV 2OVo 50% 1.64 0.82 19170 0.34 2.69 190% 0.3450 1.5 o.25 NE\ry 6% 28Vo 2.65 1.91 NF NF 4.62 s00% o.9050 1.5 0.25 MOD l37o 4OVo 2.65 1.59 NF NF 3.9 455% 0.8250 1.5 0.25 SEV 2O7o 5O7o 2.65 1.33 NF NF 3.37 31O"/" o.56110 1.5 0 NEW 67o 28Vo 0.29 o.21 155"h 0.28 1.45 190To o.34110 1.5 0 MOD l3Vo 4OVo 0.29 0.18 145Vo o.26 1.21 12OYo o.22110 1.5 0 SEV ?-OVo 5OVo 0.29 0.15 1OO"/" 0.18 1.04 120% o.22ll0 1.5 0.075 NEW 6Vo 28Vo 1.95 1.41 NF NF 2.84 42Ùo/o 0.75ll0 1.5 0.o75 MOD l37o 4OVo 1.95 1-17 4OOUI 0.72 2.36 350% 0.63110 1.5 0.075 SEV 20Vo 5O7o 1.95 0.98 38OYo 0.68 2.O4 2OOe/o 0.36110 1.5 0.15 NE}V 67o 28Vo 3.62 2.60 NF NF 3.74 1000% 1.79110 1.5 o.15 MOD l3Vo 4OVo 3.62 2.11 NF NF 3.12 550o/" o.99ll0 1.5 0.15 SEV 2OVo 5OVo 3.62 1.81 600"h 1.08 2.69 45O7o 0.81110 1.5 o.25 NE\ry 6Vo 28Vo 5.83 4.20 NF NF 4.62 NF NFr10 't.5 0.25 MOD 137o 4OVo 5.83 3.50 NF NF 3.9 NF NF110 1.5 o.25 SEV 2OVo 5OVo 5.83 2.92 NF NF 3.37 TOVo o.13220 1.5 0 NEIW 6Vo 28Vo 0.59 o.42 31OYo 0.56 1.45 390% 0.70220 1.5 0 MOD 13Vo 4OVo 0.59 0.35 290% o.52 1.21 260% 0.47220 1.5 0 SEV 2OVo 50Vo 0.s9 0.29 ZOOYo 0.36 1.04 22O'/o 0.39220 1.5 0.o75 NEW 6% 28% 3.91 2.81 NF NF 2.84 8OO"/" 1.43220 1.5 0.075 MOD 13Vo 4OVo 3.91 2.35 1050% 1.88 2.36 650% 1.17220 1.5 0.075 SEV 2O7o 5O4o 3.91 1.95 725Yo 1.30 2.O4 400% 0.72220 't.5 o.15 NEW 6Vo 28Vo 7.23 5.21 NF NF 3.74 NF NF220 1.5 0.15 MOD 13Vo 4OVo 7.23 4.34 NF NF 3.12 NF NF220 't.5 o.15 SEV 2OVo 5OVo 7.23 3.62 NF NF 2.69 81OYo 1.45220 'L5 o.25 NEW 6Vo 28Vo 11.66 8.40 NF NF 4.62 NF NF220 1.5 0.25 MOD 137o 4OVo 11.66 7.00 NF NF 3.9 NF NF220 1.5 0.25 SEV 2O7o 5OVo 11.66 5.83 NF NF 3.37 NF NF
*NF - No Fail within limits of study
209
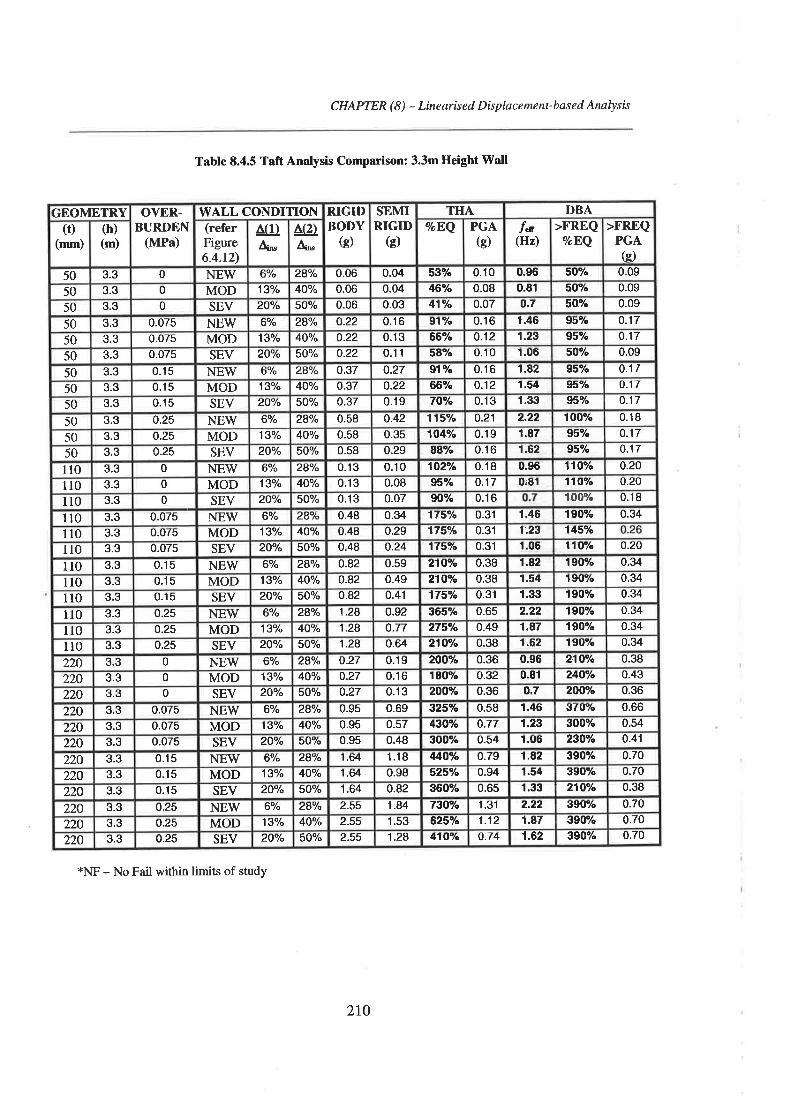
CHAPTER (8) - Linearised Displncement-based Analysis
Table 8.4.5 Taft Analysis Comparison: 3.3m Height Wall
GEOMETRY OVER-BURDEN
(MPa)
WALL CONDITION RIGIDBODY
G)
SEMIRIGID
G)
THA DBA(t)
(mm)(h)(m)
(referFigure6.4.12)
Â(1)A*
ae)A*
loEQ PGAG)
f"n(Hz)
>FREQVoßQ
>FREQPGAk)
50 3.3 0 NEW 6% 28V" 0.ott 0.04 53Vo 0.10 o.96 SOYI 0.09
50 3.3 0 MOD 13% 40% 0.06 0.04 46"/" 0.08 0.81 SOYI 0.09
50 3.3 0 SEV 2O"/o 50% 0.06 0.03 41Yo 0.07 o.7 5O"/" 0.09
50 3.3 0.075 NEV/ 6"/o 24"/" 0.22 0.16 91"/o 0.16 1.46 95% 0.17
50 3.3 0.075 MOD 13"/" 4OYo 0.22 0.13 66% 0.'t2 1.23 95"/o 0.17
50 3.3 0.075 SEV 2O"/o 5Oo/" 0.22 0.11 SAYI 0.10 1.0ö 5OV" 0.09
50 3.3 0.'t5 NEV/ 6% 24"/o 0.37 0.27 91"h 0.16 1.42 95% 0.17
50 3.3 0.15 MOD 13"/o 40% 0.37 o.22 66% 0.12 1.54 95% 0.17
50 3.3 0.15 SEV 2O"/o 5OTo 0.37 0.19 TOYo 0.13 1.33 95"/" o.'17
50 3.3 0.25 NEVT 6% zAV" 0.58 0.42 115"/o o.21 2.22 ro0% 0.'t8
50 3.3 0.25 MOD 13% 40% 0.58 0.35 104?/" 0.19 1.87 95"/o 0.17
50 3.3 0.25 SEV 2O"/" 50% 0.58 0.29 88e/o 0.16 1,62 95"/" 0.17
110 3.3 0 NEW 6"/0 28Y" 0.13 0.10 1O2"/o 0.18 0.96 11Oo/o 0.20
110 3.3 0 MOD 13o/" 40% 0.13 0.08 95% 0.17 0:81 11OYo 0.20
ll0 3.3 0 SEV 2O"/o 50% 0.13 0.07 SOUo 0.16 1,00% 0.18
110 3.3 0.075 NEIW 6% 28"/o 0.48 0.34 17sVo 0.31 1.46 190% 0.34
110 3.3 o.o75 MOD 'l3o/" 40% 0.48 0.29 1750h 0.31 1.23 145Yo
110 3.3 0.075 SEV 20% 50% 0.48 o.24 11sYo 0.31 1.06 11OYo o.20
110 3.3 0.15 NEV/ 60/" 28% 0.82 0.59 21OYo 0.38 1.82 190% 0.34
110 3.3 0.15 MOD 13o/" 40% o.a2 0.49 21O"/o 0.38 1.54 190% 0.34
110 3.3 0.15 SEV 20% 50% 0.82 0.41 175"/o 0.31 1.33 190% 0.34
ll0 3.3 o.25 NEV/ 6o/o 28% 1.28 0.92 365% 0.65 2.22 1 907o 0.34
110 3.3 0.25 MOD 13% 4OVo 't.28 0.77 27sVo 0.49 1.At 190% 0.34
110 3.3 0.25 SEV 20o/" 50% 1.24 o.64 210% 0.38 1.02 190% 0.34
220 3.3 0 NEV/ 6"/o 28Y" o.27 o.19 20O/" 0.36 0.96 21OYo 0.38
220 3.3 0 MOD 13"h 4oo/o 0.27 0.16 189"h o.32 0.81 240% 0.43
220 3.3 0 SEV 2O"/o 50% 0.27 0.13 2OO"/o 0.36 o,t 200% 0.36
220 3.3 0.075 NEW 6o/" 28% o.95 0.69 325o/o 0.58 1.46 370"h 0.66
220 3.3 0.075 MOD 13" 40% 0.95 0.57 ßOU. 0.77 1.23 300% 0.54
220 3.3 0.075 SEV 2OVo SOVI 0.95 0.48 300% 0.54 l.06 230% 0.41
220 3.3 0.15 NEW 6o/" 28% 1.64 1.18 44OYe 0.79 1.42 390% 0.70
220 3.3 0.15 MOD 13"/" 40% 1.64 0.98 525o/o 0.94 1.54 390% 0.70
220 3.3 0.15 SEV 2O"/o 5O"/o 1.64 0.82 360% 0.65 1.33 210% 0.38
220 3.3 o.25 NEIù/ 6o/" 28"/" 2.55 1.84 73OYo 1.31 2.22 390% 0.70
220 3.3 0.25 MOD 13% 40% 2.55 1.53 6250/" 1.12 1.87 3907o 0.70
220 3.3 0.25 SEV 2O"/" 5Oo/" 2.55 1.28 41OYo o.74 1.62 390% 0.70
*NF - No Fail within limits of study
2to
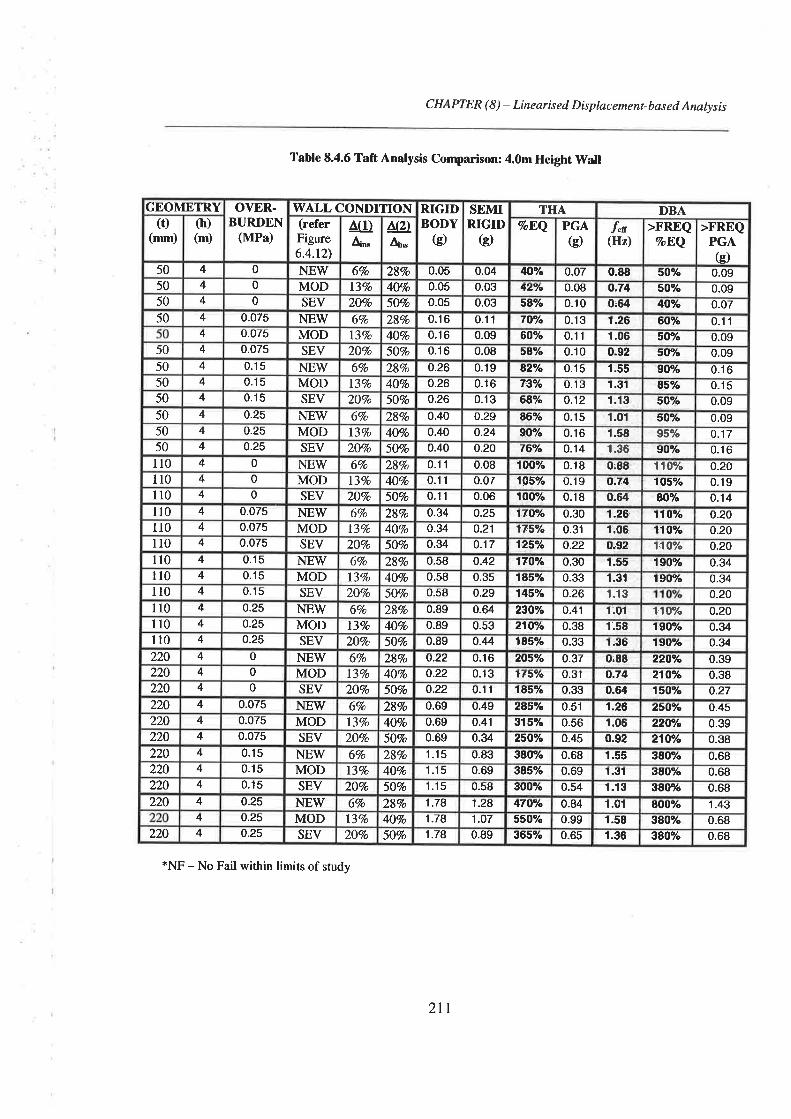
CHAPTER (8) - Linearised Displncement-bøsed Arnlysis
Table 8.4.6 Taft Analysis Comparison: 4.0m Height Wall
GEOMETRY OVER.BURDEN
(MPa)
WALLCONDITION RIGIDBODY
G)
SEMIRIGID
G)
THA DBA(r)
(mm)(h)(m)
(referFigure6.4.12)
AG)A^ ^QlA^
ToEQ PGAG)
f.n(Hz)
>FREQToEQ
>FREQPGAk)
50 4 0 NEW 6Vo 28Vo o.05 0.04 4ïo/o 0.07 o.88 50% 0.0950 4 0 MOD I37o 4OVo 0.05 0.03 4270 0.08 o.74 SOY' 0.0950 4 0 SEV 2OVo SOVo 0.05 0.03 58Uo 0.10 0:64 4g7o 0.0750 4 0.075 NEW 67o 287o 0. t6 0.11 TOYo 0.13 1.2õ 60% 0.11
4 0.075 MOD l3Vo 40Vo 0.16 0.09 60% o.11 1.06 sOVò 0.0950 4 0.075 SEV 2OVo 50Vo 0.16 0.o8 SAYI 0.10 0.92 50o/o 0.0950 4 0.15 NEW 6Vo 28Vo 0.26 0.19 Ez"/o 0.15 1.55 9OYo 0.1650 4 0.15 MOD l3Vo 4O7o o.26 0.16 73% o.t3 1.31 85Yo 0.1550 4 0.15 SEV 2OVo 50Vo 0.26 0.13 6AUo o.12 f.13 5O"/o 0.0950 4 0.25 NEW 6Vo 28Vo 0.40 0.29 86Uö 0.15 1.01 SOYo 0.0950 4 0.25 MOD 13Vo 4OVo 0.40 o.24 9Oe/o 0.16 1.58 95o/" o.'1750 4 0.25 SEV 2OVo 5OVo 0.40 o.20 76"/o 0.14 1.36 9OYo 0.16110 4 0 NEW 6Vo 28Vo 0.11 0.08 100"h 0.18 O¡EE 11'gUo 0.20110 4 o MOD l3Vo 4OVo o.11 0.07 f05% o.19 o.74 1O5e/o 0.19110 4 0 SEV 2OVo 5OVo 0.11 0.06 lOge/o 0.18 O:64 80% 0.14110 4 0.075 NEW 6Vo 28Vo 0.34 0.25 1il.O"/o 0.30 1.2e 11O7o o.20110 4 0.075 MOD l3Vo 4OVo 0.34 o.21 lV5"/o 0.31 1.O6 11O7o 0.20110 4 0.075 SEV 2O7o 5OVo 0.34 0.17 125o/o o.22 0.92 1,100h 0.20ll0 4 0.15 NEW 6Vo 28Vo 0.58 0.42 17Oo/" o.30 1.55 1900h 0.34110 4 0.15 MOD 13Vo 40Vo 0.58 0.35 185c/o 0.33 1.31 19070 0.34110 4 o.15 SEV 2OVo 5OVo 0.58 0.29 145o/o o.26 1 .13 0.20il0 4 o.25 NEW 6Vo 28Vo 0.89 0.64 23O/o o.41 1.01 1'1Oo/e 0.20ll0 4 0.25 MOD l3Vo 4O7o 0.89 0.53 21OUo 0.38 1.58 19O'/o o.34ll0 4 0.25 SEV 2OVo 5OVo o.89 o.44 185Yo 0.33 1.36 r90% 0.34220 4 0 NEW 6Vo 28Vo o.22 0.16 2D5o/o 0.37 O;EE 22OYo 0.39220 4 0 MOD 13Vo 4OVo o.22 0.13 lVSVo 0.31 o.74 21O7o 0.38220 4 0 SEV 2OVo 5O7o 0.22 o.11 185% 0.33 0.64 15O'/o o.27220 4 0.075 NEW 6Vo 287o 0.69 o.49 285e/o 0.51 1.26 25O'/o o.45220 4 0.075 MOD 13Vo 40Vo 0.69 0.41 315"/" o.56 1.06 22OYo 0.39220 4 0.075 SEV 2OVo 50Vo 0.69 0.34 25OYo 0.45 0.92 21Oo/" o.38220 4 0.15 NEW 6Vo 28Vo 1.15 0.83 380% 0.68 f .55 3AO7o 0.68220 4 0.15 MOD 13Vo 407o 1.15 0.69 385% 0.69 1.31 3SO"h 0.68220 4 0.15 SEV 2OVo 5O7o 't. t5 0.58 300"h 0.54 1 .13 38096 o.68220 4 0.25 NEW 6Vo 28Vo 1.78 1.24 47Dch 0.84 1.0t 6OO"/o 1.43
4 0.25 MOD 13Vo 4O7o 1.78 1.O7 550% o.99 1.58 3AOYI 0.68220 4 0.25 SEV 2OVo 5OVo 1.78 0.89 365% 0.65 1.36 38O"/" 0.68
*NF - No Fail within lirnits of study
2tr

CHAPTER (8) - Linearised Displacement-based Analysis
Table 8.4.7 Pacoima Dam Analysis Conrparison: l.5m Height Wall
*NF - No Fail within limits of study
GEOMETRY OVER-BURDEN
(MPa)
WALL CONDITION RIGIDBODY
G)
SEMIRIGID
G)
THÄ DBA(t)
(mm)(h)(m)
(referFigure6.4.12)
4ú)À."
ae)A*
VoßQ PGAG)
Í.n(Hz)
>FREQVoEQ
>FREQPGA
(e)
50 1.5 0 NEW 6"/" 28o/" 0.13 0.10 43Yo 0.19 1.45 SgYo o.22
50 1.5 0 MOD 'l3Yo 4O"/o 0.13 o.08 33% 0.14 1.21 SOYo o.22
50 1.5 0 SEV 20% 50/. 0.13 0.07 48Yo o.21 1.04 35"/o 0.15
50 1.5 0.075 NEVT 6Vo 28o/" 0.89 0.64 118"h 0.51 2.4¿I 100% 0.43
50 1.5 0.075 MOD 13o/" 40% o.89 o.53 97% 0.42 2.36 7O7o 0.30
50 1.5 0.075 SEV 2Oo/" 50y. 0.89 0.44 67Uo o.29 2.O4 65"/c 0.28
50 '1.5 0.15 NEW 6"/o 28% 1.64 1.18 NF NF 3.74 25.O?/" 1.08
50 1.5 0.'t5 MOD 13% 40% 1.64 o.99 136% 0.59 3:12 140e/o 0.61
50 1.5 0.15 SEV 2Oo/" 50% 1.64 o.82 1sOYo 0.5tt 2.69 85"/" 0.37
50 't.5 0.25 NEW 6% 28"/o 2.65 't.91 NF NF 4.62 zfJlJ7o 1.21
50 't.5 0.25 MOD 13% 4Oo/o 2.65 1.59 NF NF 3:9 28OVo 1.21
50 1.5 0.25 SEV 2O"/o 50o/o 2.65 1.33 163% 0.71 3.37 175'h 0.76
ll0 'L5 0 NEW 6"/" 28"/o 0.29 0.2'l 105% 0.46 1.45 115% 0.50
110 1.5 0 MOD 'lSYo 40% 0.29 o.18 I 057c 0.46 1.21 125Vo 0.54
110 '1.5 0 SEV 2Oo/" 50/" 0.29 0.15 7veh 0.30 1.04 75o/o 0.33
110 1.5 0.075 NEW 6"/o 28% 1.95 1.41 340"h 1.48 2.84 22O"/" 0.95
110 1.5 0.075 MOD 13"/o 4OVo 't.95 1.17 28O"/o 1.21 2.3õ 0.65
ll0 1.5 0.075 SEV 20% 50"/" 1.95 0.98 2154/o 0.93 2.O4 13OYo o.56
110 1.5 0.15 NEW 6% 28% 3.62 2.60 NF NF 3.74 NF NF
110 1.5 0.'t5 MOD 13"/" 4O"/o 3.62 2.17 460"/o 2.00 3.12 300% 1.30
110 1.5 o.15 SEV 20% 50"/ 3.62 1.81 430"/" 1.87 2.69 2OO"/o 0.87
110 1.5 o.25 NEW 6Y" 28% 5.83 4.20 NF NF 4,62 NF NF
110 1.5 0.25 MOD 13"/" 40o/o 5.83 3.50 NF NF 3.9 NF NF
ll0 1.5 o.25 SEV 20% 50% 5.83 2.92 NF NF 3.37 4OO7o 't.74
220 1.5 0 NEVT 6Yo 28% 0.59 o.42 325"/" 1.4',1 1.45 225"h 0.98
220 1.5 0 MOD 13% 4Ùo/o 0.59 0.35 225Yo 0.98 1.21 27s%o 1.19
220 't.5 0 SEV 2O"/o 50% 0.59 0.29 135% 0.59 1.O4 14O"/" 0.61
220 1.5 0.075 NEVT 6% 2A7o 3.91 2.81 NF NF 2.44 425"/" 't.84
220 1.5 0.075 MOD 13% 4Oo/o 3.91 2.35 500% 2.17 2.36 28OYo 1.21
220 1.5 0.075 SEV 2O"/o 50o/o 3.91 1.95 43O"/o 1.47 2.Ott 260% 1.13
220 1.5 0.15 NEW 6% 28"/o 7.23 5.2'l NF NF 3.74 NF NF
220 1.5 o.15 MOD 13% 40% 7.23 4.U NF NF 3.12 NF NF
220 1.5 0.15 SEV 2O"/o 500/" 7.23 3.62 600% 2.60 2.69 375"/" 1.63
220 1.5 0.25 NEW 6% 2fj"/o 11.66 8.40 NF NF 4.62 NF NF
220 1.5 o.25 MOD 13% 40% 11.66 7.OO NF NF 3.9 NF NF
220 1.5 0.25 SEV 2Oo/" 50% 11.66 5.83 NF NF 3.37 NF NF
212

CHAPTER (8) - Lineørised Displacement-bøsed Analysis
Table E.4.8 Pacoirm Dam Analysis Conrparison: 3.3m Height Wall
GEOMETRY OVER-BURDEN
(MPa)
1VALL CONDITION RIGIDBODY
G)
SEMIRIGID
G)
THA DBA(t)
(mm)ft)(m)
(referFigure6.4.12)
AG)4* ^(2)A^
ToEQ PGAG)
.f.n(Hz)
>FREQToEQ
>FREQPGAk)
50 3.3 0 NEW 6Vo 28% 0.06 0.04 29"/o 0.13 o.96 35"/o 0.1550 3.3 0 MOD 13o/o 4Oo/" 0.06 0.04 ¿ |"/c o.12 0.81 3Ùo/o 0.1350 3.3 0 SEV 20% 50o/o 0.06 0.03 33Uo 0.14 o.7 SOUI 0.1350 3.3 0.075 NEW 60/" 28"/" 0.22 0.16 4TYo 0.20 1.46 5O!/o 0.2250 3.3 0.075 MOD 13% 4Oo/o o.22 0.13 36"/" o.16 1.23 50"/" o.2250 3.3 o.075 SEV 2Oo/o 5O"/" o.22 0.11 33Yo 0.14 1¡06 35"h 0.1550 3.3 0.15 NEW 6o/" zAVo 0.37 0.27 5BUo 0.25 1.82 6Ðolo 0.2650 3.3 0.15 MOD 13% 40% 0.37 o.22 46"/o 0.20 1.54 55o/o 0.2450 3.3 0.15 SEV 20% 5Oo/" o.37 0.19 49/" 0.21 1.33 50"/" o.2250 3.3 o.25 NEW 6% 28% 0.58 0.42 ATUo 0.38 2.22 607o o.2650 3.3 0.25 MOD 13% 40"/" 0.s8 0.35 63% o.27 1.87 6OVo 0.2650 3.3 o.25 SEV 2oo/o SOVo 0.58 0.29 49"h 0.21 1.62 55"h o.24110 3.3 0 NEW 6% 28% 0.13 0.10 6O."/o 0.35 0:96 7Oe/o 0.30ll0 3.3 0 MOD 13Yo 4Oo/" 0.13 0.08 65% 0.28 o.81 TOYo 0.30110 3.3 0 SEV 2Oo/" 5Oo/" 0.13 0.07 g7o o.22 o,7 70V" 0.30ll0 3.3 o.075 NEV/ 6% 28o/" 0.48 0.34 Í05% 0.46 1.46 l:1Se./o 0.50110 3.3 0.075 MOD 13o/" 40% 0.48 0.29 9.57o 0.41 1.23 1157o 0.50ll0 3.3 0.075 SEV 20% 50% 0.48 o.24 75o/o 0.33 1:06 7Sc/o 0.33110 3.3 0. t5 NEW 6% 28o/o 0.82 0.59 150% 0.69 1.42 135o/o 0.s9110 3.3 0.15 MOD 13o/" 4oo/o 0.82 0.49 1zOYo 0.52 1.54 125Yo 0.54ll0 3.3 0.15 SEV 2O"/o 5Oo/o 0.82 o.41 1OO7o 0.43 1.33 11iYo 0.50110 3.3 0.25 NE}V 6% 28% 't.28 0.92 215o/o 0.93 2.22 135o/o 0.59110 3.3 o.25 MOD 13% 4O"/o 1.28 o.77 ISOYo 0.78 1.87 f3O7o 0.56ll0 3.3 o.25 SEV zOV" 50% 't.28 o.64 1sOUo 0.56 1.62 1sOYo 0.56220 3.3 0 NEIù/ 6V" 284/o o.27 o.19 17O"/o 0.74 o.96 140c/c 0.61220 3.3 0 MOD 13o/o 40o/o o.27 0.16 125o/o o.54 O:81 13Ùo/o o.56220 3.3 0 SEV 20% 50% o.27 0.13 1OsYo 0.46 o.7 11sYo 0.50220 3.3 0.075 NEW 6o/" zAV" 0.95 0.69 ZIOUo 0.91 1.46 220"h 0.95220 3.3 0.075 MOD 13% 4Oo/" 0.95 0.57 2OOo/o 0.87 1.23 14Ùo/o 0.61220 3.3 o.o75 sEv 20o/" 50"Â 0.95 0.48 15Ùo/o 0.65 1.06 150Y" 0.65220 3.3 0.15 NEW 6o/o 28"/" 1.64 1. t8 325Yo 1.41 1.82 2607o 1.13220 3.3 0.15 MOD 134/o 40o/o 1.64 o.98 29OUo 't.26 1.54 26OYo 1.13220 3 o.15 SEV 2Oo/o SOVo 1.64 0.82 190U" o.82 1.33 26lJ7o 1.13220 3.3 o.25 NEW 6/" zAVo 2.55 1.84 435?/o 1.89 2.22 275'/o 1.19220 3.3 0.25 MOD 13"/" 4Oo/o 2.55 1.53 4257o 1.U 1.87 26OVo 1.13220 3.3 0.25 SEV 2Oo/o 5O"/" 2.55 1.28 265% 1.15 1.62 26OYo 1.13
*NF - No Fail wirhin limirs of study
213
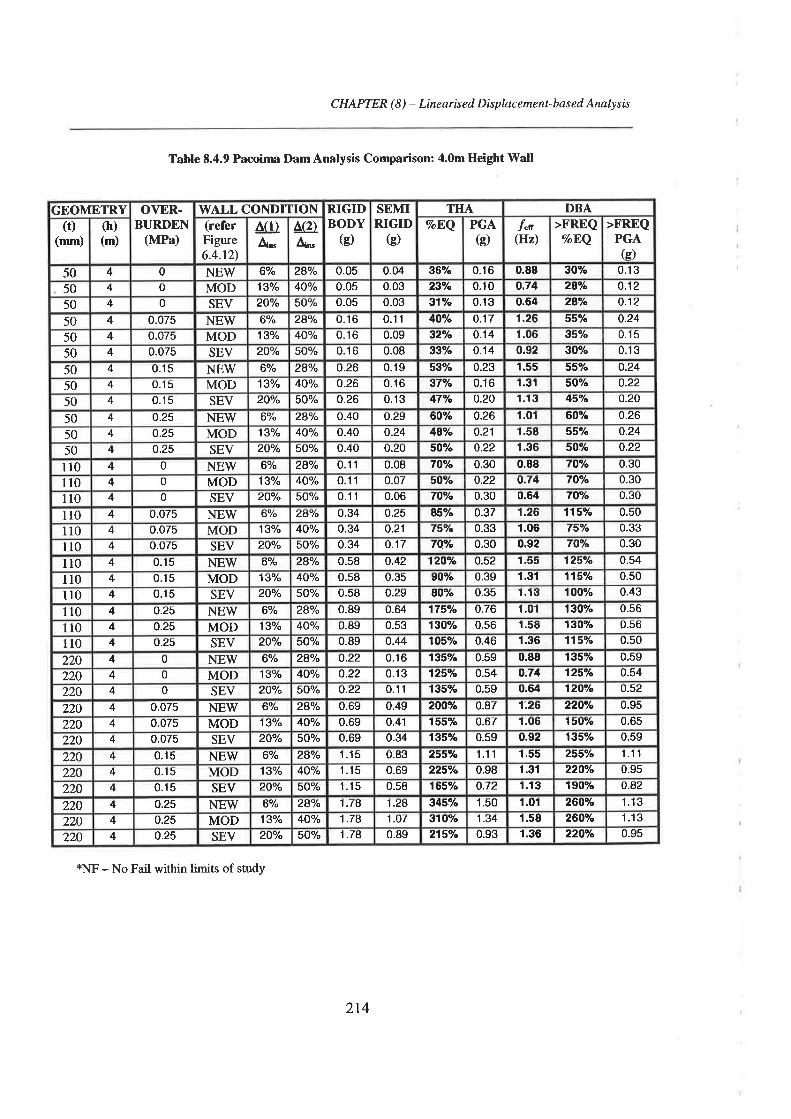
CHAPTER (8) - Linearised Displacement-based AnøIysis
Table 8.4.9 Pacoinra Dam Analysis Conrparison: 4.0m Height Wall
*NF - No Fail within limits of study
GEOMETRY OVER-BURDEN
(MPa)
WALL CONDITION RIGIDBODY
G)
SEMIRIGID
G)
THA DBA(t)
(mm)(h)(m)
(referFigure6.4.12)
^(1)A^a(2)4^
ToEQ PGAG)
f"n(IIz)
>FREQVoEQ
>FREQPGA(e)
50 4 0 NEW 6% 2a% o.05 0.04 36/" 0.16 0.88 SOYI 0.13
50 4 0 MOD 13o/" 40% 0.05 0.03 23"/o 0.10 o.74 zAYo o.12
50 4 0 SEV 2O"/o 50% 0.05 0.03 31% 0.13 0.64 28e/o 0.12
50 4 0.075 NEW 6"/0 28"/o o.1tt 0.11 40"/" 0.17 1.26 55Yo 0.24
50 4 o.075 MOD 13o/" 40% 0.16 0.09 32"/o 0.14 r.oõ 35"fo 0.1 5
50 4 0.075 SEV 2O"/" 50% 0.16 0.08 33"/" 0.14 0.92 3O"/o 0.13
50 4 0.15 NE\M 6"/o 28Y" o.2tt 0.19 53V" 0.23 1.55 55Yo o.24
50 4 o.15 MOD 13o/" 40% o.26 0.16 37Uo 0.1tt t.3t slJ"h 0.22
50 4 0.15 SEV 2O"/o s0% 0.26 0.13 47Vo 0.20 1.13 45Uo 0.20
50 4 0.25 NEVT 6"/" 28% o.40 0.29 60/" 0.26 t.0f 6O"/o 0.26
50 4 o.25 MOD 13"/" 40% 0.40 0.24 48Yo 0.21 1.58 55% 0.24
50 4 0.2s SEV 2O"/o 50% o.40 o.20 5O1" 0.22 1.36 50?/o 0.22
110 4 0 NEW 6% 28% o.11 0.08 70e/" 0.30 0.88 70% 0.30
110 4 0 MOD 13o/" 40% 0.11 0.07 50"h o.22 o.74 70% 0.30
110 4 0 SEV 2O"/o 50% 0.11 0.06 7Oe/o 0.30 0.64 7lJ"h 0.30
ll0 4 0.075 NEW 6o/o 28"/o 0.34 0.25 85"h 0.37 1.26 115"/o 0.50
110 4 0.075 MOD 13% 40% 0.34 o.21 lSYo 0.33 r.06 75% 0.33
110 4 0.075 SEV 2Oo/o 5O"/" 0.34 o.'t7 TQYo 0.30 0.92 TOYo 0.30
110 4 0.15 NEV/ 6Vo 28o/" 0.58 0.42 12O7o 0.52 1.55 125Yo 0.54
110 4 0.15 MOD 13"/" 40% o.58 o.35 99"/o 0.39 1.31 115"/o 0.50
110 4 0.15 SEV 2oo/o 5O"/o 0.58 0.29 80?/o 0.35 1 .13 100% 0.43
r10 4 0.25 NEW 6% 280/ 0.89 0.64 17sch 0.76 1.O1 130"/" 0.56
110 4 o.25 MOD 1sVo 4O"/" 0.89 0.53 130o/o 0.56 1.58 130% 0.56
110 4 o.25 SEV 20"/" 50% 0.89 o.44 105% o.4tt f .36 115% 0.50
220 4 0 NEW 60/" 28"/" o.22 0.16 135e/o 0.59 0.88 135e/o 0.59
220 4 0 MOD 13"/o 40% 0.22 0.13 125Vo 0.54 o.74 125Yo 0.54
220 4 0 SEV 2O"/o 50% o.22 0.11 13s% 0.s9 0.64 12O7o 0.52
220 4 0.075 NEIW 6Y" 2A% o.69 0.49 20O."/" 0.87 1.26 22OYo 0.95
220 4 0.075 MOD 13"/o 40% 0.69 0.41 155% 0.67 1.06 r50% 0.65
220 4 0.075 SEV 2O"/o 5O"/o o.ttg 0.34 135"/o 0.59 0.92 135% 0.59
220 4 0.15 NEV/ 6% 2A% 1.15 0.83 255"/" 1.'t 1 1.55 255% 1.11
220 4 0.15 MOD 13o/o 40o/o 1.15 0.69 225o/o 0.98 1.31 220"/" 0.95
220 4 0.15 SEV 2O"/o 5O"/o 1.15 0.58 165% 0.72 1.13 19OYo o.a2
220 4 o.25 NEW 6o/" 28"/" 1.18 1.24 345"/" 't.50 1.01 260% 1.13
220 4 o.25 MOD 13% 40o/o 1.78 1.07 31Oo/o 't.34 1.58 260% 1.13
220 4 0.25 SEV zOV" 50o/o 1.78 0.89 215V. 0.93 1.36 220"h 0.95
2t4
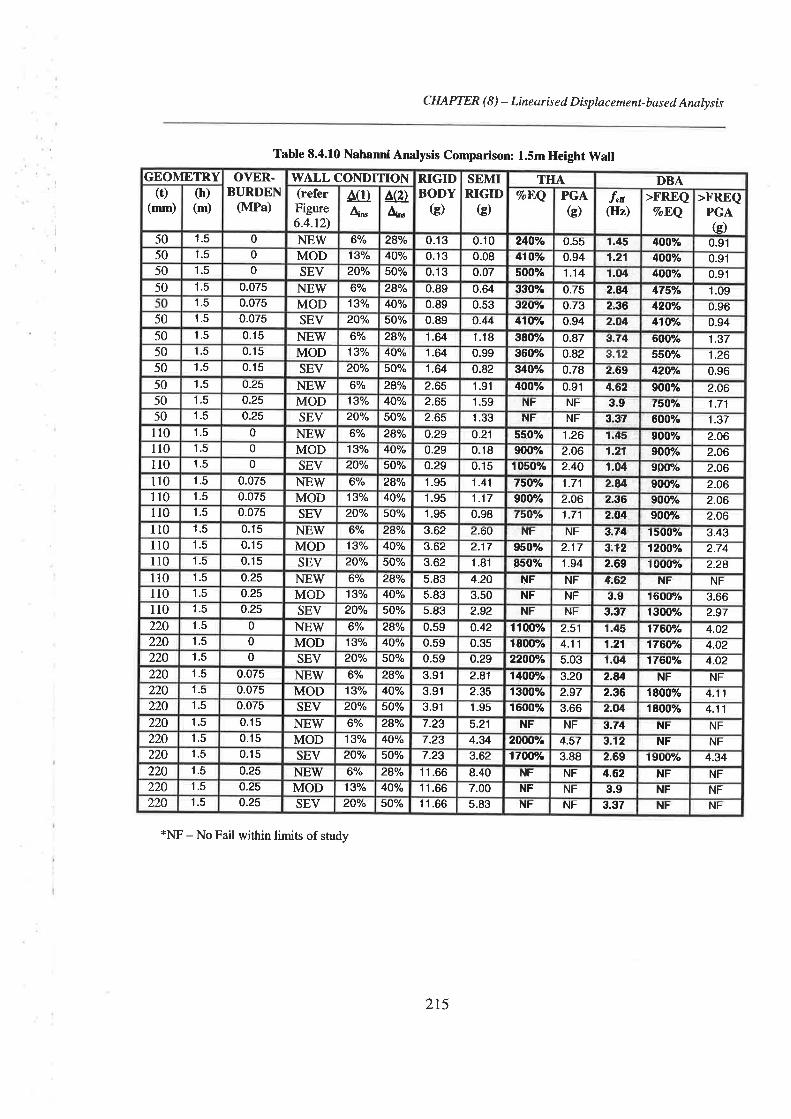
CHAPTER (8) - Linearísed Displacement-based Analysis
Table 8.4.10 Nahanni Analysis Conrparison: l.Sm lleight WaltGEOMETRY OVER.
BURDEN(MPa)
\ryALL CONDITION RIGIDBODY
G)
SEMIRIGID
G)
THA DBA(r)
(mm)(h)(m)
(referFigure6.4.12)
AG)4^
AQ)4^
VoEQ PGAG)
l.n(Hz)
>FREQToEQ
>FREQPGAG)
50 1.5 o NEW 60/o 28Y" 0.13 0.10 24Ùe/o 0.55 1.45 400% 0.9150 1.5 0 MOD 13"/õ 4OV" 0.13 0.08 41Oe/o 0.94 1.21 400?/o 0.9150 1.5 0 SEV 2Oo/" S0o/o o.13 0.07 500% 1.14 1.04 400"h 0.9150 1.5 0.075 NEW 6Yo 28T" 0.89 0.64 33O"/" 0.75 2.84 475"/o 1.09
1.5 0.075 MOD 13o/" 4Ùo/o 0.89 0.53 32OYo 0.73 236 420% 0.9650 1.5 0.075 SEV 20% 50% 0.89 o.44 41och 0.94 2.W 41Oe/o 0.9450 1.5 0.15 NEW 6% 28o/o 1.64 1.18 38OYo 0.87 3.74 6007o 1.3750 1.5 0.15 MOD 13/' 4O"/" 1.64 0.99 360% o.a2 3.1,2 550e/" 1.2650 1.5 0.15 SEV 20% 50% 1.64 o.82 3$OYo 0.78 2.69 420"h 0.9650 1.5 o.25 NETW 6Y" 28o/" 2.65 1.91 4OO"/" 0.91 4:62 900% 2.0650 1.5 0.25 MOD 13Vo 40% 2.65 1.59 NF NF 3.9 750eh 1.7150 1.5 0.25 SEV 20% SOT' 2.65 1.33 NF NF 3.37 6007o 1.37110 1.5 0 NEW 6a/o 28Yo o.29 o.21 55OYo 't.26 1.45 900% 2.06110 't.5 0 MOD 13% 40e/o 0.29 0.18 900% 2.06 1.21 900% 2.06110 1.5 0 SEV zOV" SOY" 0.29 o.15 1050% 2.40 1-04 900e/o 2.06110 1.5 0.075 NEW 6% 28o/o 1.95 1.41 7íOVo 1.71 2.84 900% 2.06110 't.5 o.075 MOD 13% 4Oo/" 1.95 1.17 9OO"/" 2.06 2.36 900% 2.06ll0 1.5 0.075 SEV 2Oo/" 50% 1.95 0.98 7sOYo 1.7'l 2.O4 900% 2.06ll0 1.5 0.f 5 NEW 6"/o 28% 3.62 2.60 NF NF 3.V4 1500% 3.43110 't.5 0.15 MOD 13% 40Yo 3.62 2_'t7 950e/" 2.'t7 3.1.2 1200"/o 2.74ll0 1.5 0.15 SEV 2O"/o s0% 3.62 1.81 E50% 1.94 2.69 lOOO7o 2.24110 1.5 0.25 NEW 6Vo 28% 5.83 4.20 NF NF 4.62 NF NFll0 1.5 o.25 MOD 13% 4Oo/" 5.83 3.50 NF NF 3.9 16O0e/¿ 3.66ll0 1.5 o.25 SEV 2Oo/" 50% s.83 2.92 NF NF 3.37 1300% 2.97220 1.5 0 NEW 6% zAVo 0.59 o.42 11OO/" 2.51 1.45 l76Oo/" 4.02220 1.5 0 MOD 13Vo 40% 0.s9 0.3s IAOOUo 4.'t 1 1.21 17öO7o 4.02220 1.5 0 SEV 2Oo/" 5Oo/" 0.59 o.29 2200yo 5.03 r.04 176OUo 4.O2220 1.5 0.075 NEW 6% 28o/" 3.91 2.81 14OOYI 3.20 2.Vt NF NF220 1.5 0.075 MOD 13"/o 4oo/o 3.91 2.35 r3u¡% 2.97 2.36 1800% 4.11220 1.5 0.075 SEV 20% 50% 3.91 't.95 1600% 3.66 2.O4 IAOOYI 4.11220 1.5 0.15 NEW 6% 28% 7.23 5.21 NF NF 3.74 NF NF220 1.5 0.15 MOD 13"/o 4OV" 7.23 4.U zOltOTo 4.57 3.12 NF NF220 1.5 0.15 SEV 20% 50% 7.23 3.62 1700ch 3.88 2.69 19OOYI 4.34220 1.5 0.25 NEW 6% 28% 11.66 8.40 NF NF 4.62 NF NF220 1.5 o.25 MOD 13y" 4Ùo/o 1 1.66 7.00 NF NF 3.9 NF NF220 1.5 0.25 SEV zOVo 50% 11.66 5.83 NF NF 3.37 NF NF
*NF - No Fail within limits of study
215
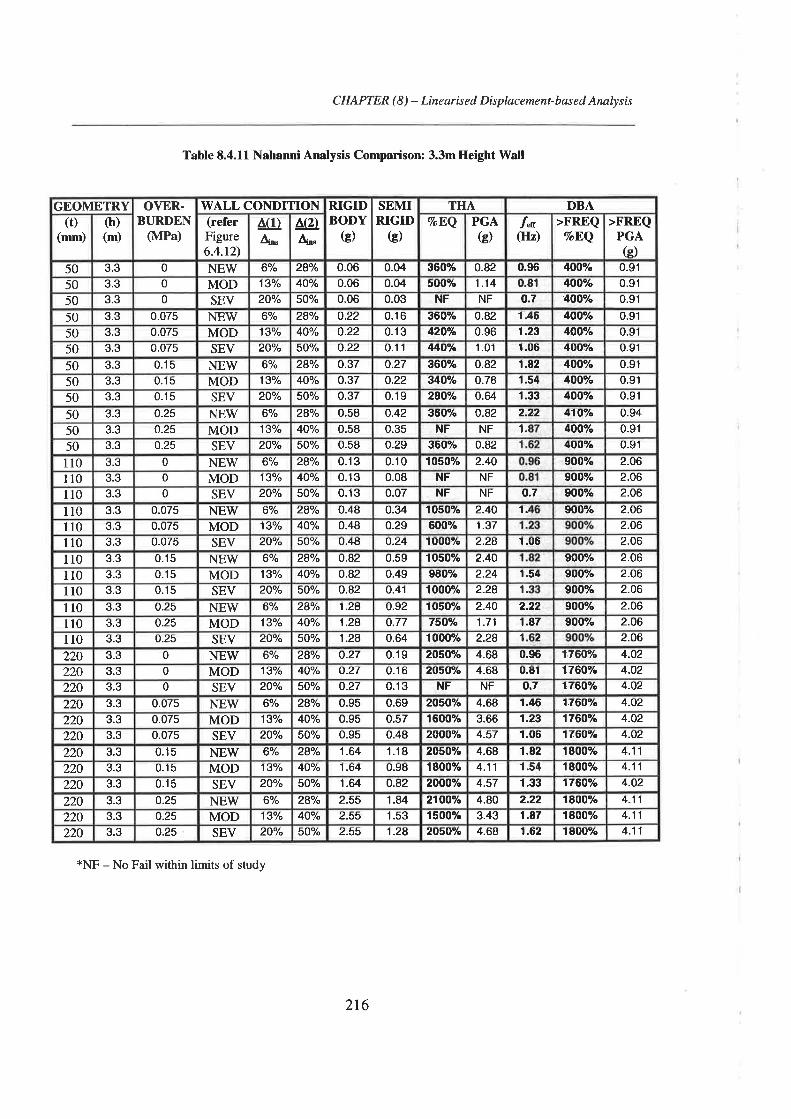
CHAPTER (8) - Linearised Displacement-based Annlysis
Table E.4.11 Nahanni Analysis Conparison: 3.3m lleight \{all
GEOMETRY OYER-BURDEN
(MPa)
WALL CONDITION RIGII)BODY
G)
SEMIRIGII)
(e)
THA DBA(t)
(mm)(h)(m)
(referFigure6.4.12)
A(ÐA^ ^3rA*
VoEQ PGAG)
Í.n(Hz)
>FREQToEQ
>FREQPGAG)
50 3.3 0 NEV/ 6o/o 28o/o 0.06 0.04 360% 0.82 0.96 4OO"/o 0.91
50 3.3 0 MOD 13"/o 4O"/o o.ott o.o4 500% 1.14 O;El 4OO7o 0.9'l
50 3.3 0 SEV 20% 50% 0.06 0.03 NF NF o.7 4OOYI 0.91
50 3.3 0.075 NEV/ 6Yo 28Yo o.22 0.16 360% 0.82 1.46 400"h 0.91
50 3.3 0.075 MOD 'l3Yo 40% o.22 0.13 42O/" 0.96 1.23 4OOe/" o.91
50 3.3 0.075 SEV 20% 50"/o o.22 0.11 44OYo 1.01 1.06 400?/o 0.91
50 3.3 0.15 NEW 6% 28T" 0.37 o.27 360% o.82 1.82 4OO"/o 0.91
50 3.3 0.15 MOD 131" 40% 0.37 0.22 340?/" 0.78 1.54 400% 0.91
50 3.3 0.15 SEV 2OVo 50% o.37 0.19 28o9h 0.64 1.33 4OOUo o.91
50 3.3 0.25 NEV/ 6Y" 28% 0.58 0.42 360% 0.82 2.22 41vch 0.94
50 3.3 0.25 MOD 13o/" 4Oo/" 0.58 0.35 NF NF 1.r 4OOo/o 0.91
50 3.3 0.25 SEV 20% 50% 0.58 0.29 360% 0.82 4OOe/o 0.91
110 3.3 0 NEW 6o/" 28% 0.13 0.10 1050e/o 2.40 t 900e/" 2.06
110 3.3 0 MOD 13"/o 4OYo 0.13 0.08 NF NF 90Oe/o 2.06
ll0 3.3 0 SEV 2O"/" 50% 0.13 0.07 NF NF o.7 900e/o 2.06
110 3.3 0.075 NEW 6% 28% 0.48 0.34 1O5OYI 2-40 1.¡ 9OO9/o 2.06
110 3.3 o.075 MOD 13% 40% 0.48 0.29 600% 1.37 2.06
110 3.3 0.075 SEV 2OV" 5O"/o o.48 o.24 ro00% 2.24 r.06 2.06
110 3.3 0.15 NEW 60/" 24" o.a2 0.59 1050% 2.40 9OOe/o 2.06
110 3.3 0.15 MOD 13% 40o/o 0.82 0.49 980% 2.24 1.54 900% 2.06
ll0 3.3 0.15 SEV 2O"/o 50% o.a2 o.41 1000% 2.28 Lr 9009/o 2.06
110 3.3 o.25 NEV/ 6Vo 24"/o 1.28 0.92 1050% 2.40 2.22 9OOe/" 2.06
110 3.3 0.25 MOD 13% 40% 1.28 0.77 75O"/o 1.71 1.87 900% 2.06
110 3.3 0.25 SEV 2O"/o 50"/" 1.28 0.64 1000% 2.28 1.1 2 2.06
220 3.3 0 NEW 6"/o 24"/o o.27 0.19 2O5O"/" 4.68 0.96 1.76070 4.O2
220 3.3 0 MOD '13"/o 40% o.27 0.16 2O5OVI 4.68 o.E1 1760% 4.02
220 3.3 0 SEV 2Oo/" 50% 0.27 0.13 NF NF o.7 176OUo 4.O2
2ZO 3.3 o.075 NEfW 6o/" 2Bo/" 0.95 0.69 2050% 4.68 L46 176OYo 4.O2
220 3.3 0.075 MOD 13% 40"/" o.95 o.57 1600e/o 3.66 1.23 176O0/" 4.O2
220 3.3 0.075 SEV 20% 50% 0.95 0.48 2OOO"/o 4.57 1.06 17607o 4-O2
220 3.3 0.15 NEV/ 6% 28"/o 1.64 1.18 2O5O"/o 4.68 1.82 1800% 4.11
220 3.3 0.15 MOD 13Vo 4O"/o 1.tt4 o.98 1800% 4.1'l f .54 1800% 4.'t1220 3.3 0.15 SEV 2oo/o 50% 1.64 0.82 2000% 4.57 1.33 17607o 4.O2
220 3.3 0.25 NEW 6o/" 28% 2.55 1.84 2100% 4.80 2.22 1800% 4_11
220 3.3 o.25 MOD 13"/o 4O"/o 2.55 1.53 15007" 3.43 1.87 18000/" 4.'t1220 3.3 0.25 SEV 20% 50% 2.55 1.28 2O5O"/o 4.68 1.62 1600% 4.',t1
*NF - No Fail within limits of study
216
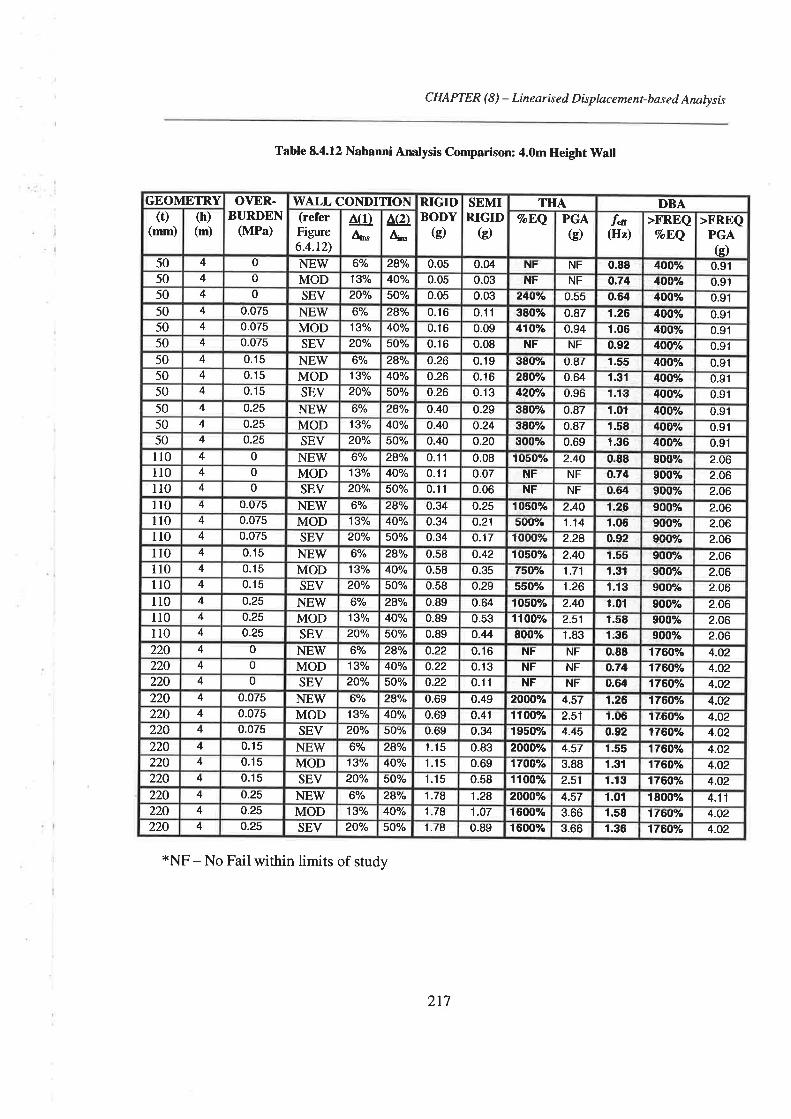
CHAPTER (8) - Linearised Displacement-based Annlysis
Table 8.4.12 Nahanni Analysis Comparison: 4.0m lleight rildl
*NF- No Fail within limits of study
GEOMETRY OVER.BURDEN
(MPa)
WALL CONDITION RIGIDBODY
G)
SEMIRIGID
G)
THA DBA(t)
(mm)(h)(m)
(referFigure6.4.12)
ag)4^ ^(2\4^
ToEQ PGAG)
f.n(Hz)
>FREQVoEQ
>FREQPGAG)
50 4 0 NEW 6% 28% 0.05 0.04 NF NF 0.88 4OOYI 0.9150 4 0 MOD 13Y" 40% o.05 0.03 NF NF o.74 4OOYI 0.9150 4 0 SEV zOVo 50% 0.05 0.03 24O'/o 0.55 0.il 4OO/o 0.9150 4 0.075 NEW 6"/" 28% 0.16 0.11 3E096 o.87 1.26 4OO"/" 0.9150 4 0.075 MOD 13% 4O/o 0.16 0.09 41OYo 0.94 1.06 4g0e/o 0.9150 4 0.075 SEV 20% 50% 0.16 0.08 NF NF o92 4OOTI 0.9150 4 0.15 NEV/ 60/o 28% o.26 0.19 SEO"/o 0.87 1.55 4OOYo 0.9150 4 0.1s MOD 13o/" 4Oo/" 0.26 0.16 26O"/o 0.64 1.31 4OO"/o 0.9150 4 0.15 SEV 20Io 50% o.26 0.13 420o/o o.96 1.13 4OOo/o 0.9150 4 0.25 NEW 6"/o 28% 0.40 0.29 3E07ö o.87 1.01 4OOo/o 0.9150 4 o.25 MOD 13Y" 40io 0.40 o.24 380o/o 0.87 1.58 4OO"/o 0.9150 4 o.25 SEV 2Oo/" 5O"/" 0.40 0.20 3OOe/o 0.69 1.36 4OOo/o 0.91ll0 4 0 NEV/ 6"/o 28"/o 0.11 0.08 fO5O7o 2.40 0.88 900% 2.06110 4 0 MOD 13% 4Oo/" 0.11 o.o7 NF NF 0.74 900% 2.06ll0 4 0 SEV 2Oo/" 5Oo/" 0.11 0.06 NF NF 0.õ4 900% 2.06110 4 0.075 NEW 6/o zAVo 0.34 0.25 r050% 2.40 1.26 90O.e/o 2.06ll0 4 0.075 MOD 13V" 40% 0.34 0.21 SOOYo 1.14 1.06 90070 2.06110 4 0.075 SEV 20% 5Oo/" 0.34 o.17 1000e/o 2.28 o.g2 9POYo 2.06ll0 4 0.'t5 NEIù/ 6o/o 28% o.58 o.42 1050e/o 2.40 r.55 90OYo 2.06ll0 4 0.15 MOD 1sYo 40% 0.58 0.35 759'/o 1.71 1.31 9OO"/" 2.06ll0 4 0. t5 SEV 2OYo 50% 0.58 o.29 55OYo 1.26 l.l3 900% 2.06110 4 0.25 NEW 60/" 28% 0.89 o.64 1O5OYI 2.40 1.01 900% 2.06ll0 4 0.25 MOD 13o/" 4OV" 0.89 0.53 11OOo/o 2.51 r.5E 90OYo 2.06110 4 o.25 SEV 2OYo 50% 0.89 o.44 800% 1.83 1;36 900% 2.06220 4 0 NEW 6% 28o/o 0.22 0. t6 NF NF 0.88 176OY" 4.O2220 4 0 MOD 13% 4Oo/" Q.22 0.13 NF NF o.74 1760e/o 4.O2220 4 0 SEV 2Oo/" 5Oo/" 0.22 0.11 NF NF 0.64 1760eh 4.O2220 4 0.075 NErty 6"/o 28% 0.69 0.49 2000/" 4.57 1.26 176OYo 4.02220 4 0.075 MOD 13o/o 40o/o 0.69 0.41 110070 2.51 r.0õ 17.6OU. 4.02220 4 0.075 SEV 2Oo/" 50% 0.69 0.34 r950% 4.45 o.92 l76Ùyc 4.O2220 4 0.15 NE\ry 6% 28o/" 1.15 0.83 2OOO/o 4.57 1.55 176o0/o 4.02220 4 0.15 MOD 13% 4Oo/o 1.15 0.69 17OOYo 3.88 f .31 176lJ"h 4.O2220 4 0.15 SEV 20% 50% 1.15 0.58 11OOo/c 2.51 1.13 176OYo 4.O2220 4 o.25 NEW 60/" 28% 1-78 1.28 2OOOo/o 4.57 1.01 1800% 4.11220 4 0.25 MOD 13% 4Oo/o 1.78 1.07 1600% 3.66 1.s8 176lJ"h 4.O2220 4 o.25 SEV 2Qo/o 5Oo/" 1.78 0.89 1600% 3.66 1.36 176OYo 4.O2
217
9. SUMMARYAND CONCLUSIONS
This report has presented the findings of an investigation into the weak links in the
seismic load path of unreinforced masonry buildings specifically aimed at Australian
masoffy construction being:
(1) The limited force capacity of connections betvveen floors and walls, in particular the
friction dependent connections containing damp proof course (DPC) membranes and
(2) the out-of-plane failure of walls in the upper stories of URM buildings.
The two prime objectives of this investigation were thus to provide designers with the
appropriate tools to avoid these brittle 'weak link' failure modes in the design of new and
the assessment of existing URM buildings. Once adequate seismic load paths have been
developed and these 'weak links' successfully avoided it is expected that carefully
designed, detailed and constructed regular URM buildings will behave adequately during
moderate intensity earthquakes.
The first of the above objectives was fulfilled by an extensive series of shaking table tests
on URM connections containing DPC membrane typical found in Australian masonry
construction being aimed at providing data on the connections dynamic capacity
applicable (refer Chapter 4). The main purpose of these tests was therefore to evaluate
the connection performance under dynamic loading in order to assess their seismic
integrity. Dynamic friction coefficients determined from these tests were then compared
with quasi-static friction coefficients determined by previous research (Griffith et al
1998) to assess to what extent the quasi-statically determined friction coefficients
represented those which could be expected in seismic events. Here it was found that the
dynamic friction coefficients were not more than 20Vo less than those determined quasi-
218
CHAPTER (9) - Summary and Conclusions
statically. Further with the exception of greased galvanised sheets no connection had afriction coefficient less than the 453700-1998 code prescribed design value of 0.3.
The second of the above objectives was achieved by the development of a simplisticrational analysis procedure for face loaded simply supported IJRM walls for practical
applications which considers the essence of the true dynamic response behaviour. Since
the simplified procedure was required to be both user friendly and readily codified it was
developed from the increasingly popular linea¡ised 'Displacement-based' method.
Various boundary conditions for URM walls are often encountered which can
significantly impact on the \ryall's dynamic behaviour. The analysis procedure thereforeneeded to have the ability of easily accounting for these conditions. Also, with poor
quality masonry, lack of maintenance and poor workmanship arising as major issues fromprevious earthquake reconnaissance documentation, the analysis needed to have the
capability of allowing for rotation joint condition over the life of the wall. Both of these
requirements were taken into account by modifications to the modelled F-A relationship(refer Chapter 8). The following paragraphs briefly describe the steps undertaken to
develop this procedure:
To gain a better understanding of the physical process governing the out-of-plane
behaviour of URM walls an extensive series of out-of-plane static and dynamic tests were
undertaken on one-way spanning wall panels as presented in Chapter 6. Test variablesincluded the level of overburden stress and wall aspect ratio, however, only one set ofboundary conditions was examined. Joint degradation was also examined as pa-rt of the
experimental phase.
A comprehensive THA program was then developed to accurately model the dynamic
wall behaviour, as presented in Chapter 7. Here the rocking wall was modelled as a single
degree of freedom (SDOÐ system having a non-linear spring and frequency dependent
damper. The relationships between the real and SDOF systems were determined by
comparison of the dynamic equations of motion. The modelled non-linear spring and
frequency dependent damper were then calibrated by comparison with experimentally
determined F-Â and /-Ç relationships. Results of the THA were then confirmed by
219

CHAPTER (9) - Summary and Conclusions
comparison with experimental results including free vibration tests, single pulse,
harmonic and transient excitation tests.
Following confirmation of the THA, results were used to undertake parametric studies to
further identify key properties of URM wall behaviour without the expense of continued
experimental testing. In total over two hundred thousand THA were completed as part of
this process.
The simplihed analysis procedure was based on the linearised 'Displacement-based'
procedure, used to predict the input excitation required to force the post-cracked URM
wall to incipient instability (refer Chapter 8). For the simplifred analysis, as most
realistic failures are associated with the large displacement amplifications associated with
resonance, the characteristic 'substitute structure' linear stiffness was related to the
effective resonant frequency of the simply supported wall to permit the wall's resonant
behaviour to be modelled. The effective resonant frequency was in turn related to the
average incremental secant stiffness of the failure half cycle. Damping was related to a
constant lowerbound observed during the experimental phase. As this method linearises
a highly non-linea¡ problem it has an inherent degree of inaccuracy for transient
excitations where a 'period lag' between the modelled linear SDOF oscillator and the real
system. Consequently, the suitability and accuracy of using the simplified method was
determined by comparison with THA and experimental results. Although, as expected
some result scatter was observed the correlation was substantially better than that of a
comparison with 'quasi-static' methods which are currently in use. Therefore, with the
provision of suitable safety factors it appears that the proposed linearised DB procedure
in conjunction with a 'quasi-statically' determined lowerbound force provides an
improved method for assessing the dynamic capacity for the design of new and the
assessment of existing URM buildings.
220


REFERENCES
ABK - A Joint Venture, "Methodology for the Mitigation of Seismic Hazards in ExistingUnreinforced Masonry Buildings: The Methodology", Topical Report 08, 1984
ABRAMS, D., DEMPSTER, 4., "Seismic Analysis of Masonry Buildings", ElsevierScience Ltd., 1998, Paper reference T126-6
ABRAMS, D., P., " Effects of Scale and Loading Rate with tests of Concrete andMasonry Structures", Earthquake Spectra, Journal of the Earthquake EngineeringResearch Institute, Volume 12, No.l, 1996,pp.13-28.
ABRAMS, D., P., "A Lesson læarned From Loma Prieta on Vulnerability of URMConstruction East of the Rockies", Proceedings of the National earthquake Conference,USA, 1993, pp. 143-151
ABRAMS, D., P., "Strength and Behaviour of Unreinforced Masonry Elements",Proceedings of the 10th World Conference on Earthquake Engineering, Rotterdam, 1992,pp.3475-3480.
ABRAMS, D., P., ANGEL, R., UZARSKI, J., "Out-of-Plane Strength of UnreinforcedMasonry Infill Panels", Earthquake Spectra, Vol. 12, No. 4, 1996, pp. 825-844
ABRAMS, D., P., PAVESE, 4., MAGENES, G., CALVI, G., M., "Large Scale SeismicTesting of Unreinforced Brick Masonry Building", Proceedings of the 5th NationalConference on Earthquake Engineering, Vol. 1, 1994, pp.l37 -145
ABRAMS, D., P., TENA-COLUNGA, 4., "Seismic Behaviour of Structures withFlexible Diaphragms", Journal of Structural Engineering, 1996, pp. 439 445.ABRAMS, D., P., PAIJLSON, T., J.," Correlation between Static and Dynamic Responseof Model Masonry Structures", Earthquake Spectra, Journal of the EarthquakeEngineering Research Institute, Volume 6, No.3, 1990, pp.573-591
ABRAMS, P., D., "USA Masonry Today and Seismic Rehabilitation of MasonryBuildings", Proceedings of the 4th Australasian Masonry Conference, Sydney, 1995,pp.1-13
ADHAM, S., 4., "Static and Dynamic Out of Plane Response of Brick Masonry Walls",Proceedings of the 7th International Brick Masonry Conference, Melbourne, 1985,pp.1218-1224
ALCOCER, SERGIO, "June 1999 Mexico Earthquake", National Information Service forEarthquake Engineering, University of California, Berkley,http //www.eerc.berkley.edu/mexico/alcocer.htm, 1999
ANDERSON, C., "Arching Action in Transverse Laterally l¡aded Masonry 'Wall
Panels", The Structural Engineer, Vol. 628, No. 1, 1984, pp.12-23
221
REFERENCES
ANDERSON, C., "Transverse Laterally Loaded Tests on Single l,eaf and Cavity'Walls",cIB 3'd International symposium on wâll structures, vol. l, w*ru*, 1984, pp. gz-tolANICIC, D., STEINMAN, v., "Tensile Strength of Masonry walls as a Factor ofEarthquake Resistance of Masonry Buildings", CIB 3"t International Symposium on Vy'allStructures, YoL2,Warsaw, 1984, pp. 253-267
ANTHOINE,4., MAGONETTE, G., MAGENES, G., "shea¡-compression Testing andAnalysis of Brick Masonry Walls", Proceedings of the 10th European Conference onEarthquake Engineering, Vol. 3, Rotterdam,1995, ppJ657 - 1662
Applied Technology Council "Tentative Provisions For The Development of SeismicRegulations For Buildings", ACT 3-06
AS/NIZS 2904-1995, Damp-proof Courses and Flashings, Standards Australia, Sydney,1995
ASTANEH-ASL, A., MODJTAHEDI, D., McMULLIN, K., SHEN, J., D'AMORE, E.,"Stability of Damaged Steel Moment Frames in Los Angeles", Engineering Structures,Vol.20, No 4-6, 1998, pp. 425432ATC - Applied Technology Council 1988, ATC 3-3-06 "Tentative Provisions for theDevelopment of Seismic Provisions for Buildings", National Bureau of Standa¡ds,Washington, DC
AUSTRALIAN GEOLOGICAL SURVEY ORGANISATION, Earthquake Information,http ://www.bmr. pv.au/geohazards/quakes, 1999
BACHMANN, H., LINDE, P., WENK, T., "capacity Design and Nonrinear DynamicAnalysis of Earthquake Resistant Structures", Proceedings of the lOth EuropeanConference on Earthquake Engineering, Vol. 1, Rotterdam, 1995, pp. lI -20BAKER, L., R., "Pre-cracking of Behaviour of Laterally Loaded Behaviour with In-PlaneRestraints", Proceedings of rhe British ceramic society, No.27, l97B,pp.r29-146BAKER, L., R., "Structural Action of Brickwork Panels Subjected to Wind L,oads",Journal of The Australian Ceramic Society, No. 1, Vol.9, 1973,pp.8-13BAKER, L., R., "Variation in Flexural Strength of Brickwork With Beam and SpanL,oading", Journal of rhe Australian ceramic Society, }¡/.ay 1974, No. 2, vol.l0, pp.2g-31
BARIOLA, J., GINoccHIo, J., F., QUINN, D., "out of Plane seismic Response ofBrick Walls", Proceedings of the 5th North American Masonry Conference, lgg},pp.429-439
BASE, G., D., BAKER, L., R., "Fundamental Properties of structural Brickwork",Journal of The Australian Ceramic Society, No. 1, Vol.9, 1973,pp.l-7BEARD, R., DINNIE, 4., RICHARDS, R., "Movement of Brickwork", Transactions ofthe British Ceramic Society, Vol. 68, No. 2, 1969, pp. 45-96
BEEBY, 4., W., CROOK, R., N., READ, J., 8., "Behaviour of Slender Concrete BlockWalls Under Vertical l-oads", CIB 3'd International Symposium on Wall Structures, Vol.l, Warsaw, 1984, pp. 123-l3O
222
REFERENCES
BEER, F., P., JOHNSTON, E., R., "Mechanics for Engineers - Statics", McGraw HillBook Company, 1987
BELL, D., K., McNAUGHTON, H., DAVIDSON, 8., J., "Seismic Evaluation of an
Unreinforced Masonry Building", Proceedings of the 1998 Technical Seminar of the NewTnalandNational Society of Earthquake Engineering, t998, pp. 175-181
BENEDETTI, D, CARYDIS, P., PEZZOLI, P., I.ShaKing TAbIE TESTS ON 24 SiMPIC
Masonry Buildings", Earthquake Engineering and Structural Dynamics, Yol. 27, 1998,pp.67-90
BENUSKA, K., L., " Loma Prieta Earthquake Reconnaissance Report", EarthquakeSpectra, Journal of the Earthquake Engineering Research Institute, Vol. 6, May 1990,pp.l27-149.
BLAKIE, E., L., SPUR, D., D., "Earthquake Vulnerability of Existing UnreinforcedMasonry Buildings", EQC, Works Consultancy Services, Wellington, 1992
BLONG, R., J., "Domestic Insured l,osses and the Newcastle Earthquake", Proceedingsof the Australian Earthquake Engineering Society Conference, Sydney, Australia, 1992,pp.70-83
BLONG, R., W., "Hazard Micronization of Melbourne", Proceedings of the EarthquakeEngineering and Disaster Reduction Seminar, Australian Earthquake EngineeringSociety, Melbourne , 1993 , pp. 107 -ll7BOLT, 8., 4., "Intraplate Seismicity and Zonation", Bulletin of the New 7'ealandNational Society for Earthquake Engineering, Yol.29, No.4, 1996, pp. 221-227
BOUSSABAH, L, BRUNEAU, M., "Review of the Seismic Performance ofUnreinforced Masonry Walls", Proceedings of the Tenth World Conference onEarthquake Engineering, Madrid, Spain, 1992
BRITISH GEOLOGICAL GROUP (BGS), http ://www. gsrg.nmh.ac.uk, 1999
BROOKS, D., S., "strength and Stability of Brick Masonry'Walls", Research Report No.R30, The University of Adelaide, Department of Civil and Environmental Engineering,1980
BRUNEAU, M., "seismic Evaluation of Unreinforced Masonry Buildings - A State ofthe Art Report", Canadian Journal of Civil Engineering, No. 21,1994,pp.512-539
BRUNEAU, M., "State-of+he-Art Report on Seismic Performance of UnreinforcedMasonry Buildings", American Society of Civil Engineers, Journal of StructuralEngineering, Vol. 120, No. 1,1994,pp.230-251
BRUNEAU, M., YOSHIMURA, K., "Damage to Masonry Buildings Caused by the 1995
Hyogo-ken (Kobe-Japan) Earthquake", Canadian Journal of Civil Engineerin g, Y ol. 23,No.3, 1996,pp.797-807
BUBB, C., T., J., "Earthquake Engineering in Australia - Before Meckering and AfterNewcastle", Bulletin of the New Zealand National Society for Earthquake Engineering,Y ol. 32,No. 1, 1999, pp.l3-20
223

REFERENCES
BUBB, G., "Behaviour of structures - council Buildings", proceedings of theConference on the Newcastle Earthquake, Newcastle, Australia, t990,pp.26-27BUCCINO, F., VITIELLO, E., "Experimental Behaviour and Design Criteria forAnchorage Between Slabs and Brick 'Walls", Proceedings of the 10th EuropeanConference on Earthquake Engineering, Vol. 3, Rotterdam, 1995, pp. 2255 - 2260
CALVI, G., M., KINGSLEY, G., R., MAGENES, G., "Testing of Masonry structures forSeismic Assessment", Earthquake Spectra, Volume 12, No.1, 1996.
CALVI, G., M., PAVESE, 4., "Application of Dynamic Identification Techniques to aBrick Masonry Building Protot¡pe", Proceedings of the 10th European Conference onEarthquake Engineering, Vol. 3, Rotterdam,1995, pp.2413 - 2418CHOPRA, 4., K., "Dynamics of Structures - Theory and Applications to EarthquakeEngineering", Prentice-Hall, I995
CHRISTOPHSEN,4., "Magnitude and Catalogue Completeness Study'', Proceedings ofthe 1999 Technical Seminar of the New Zealand National Society of EarthquakeEngineerin g, 1999, pp. 156-162
CLOUGH, R.,'W., GÜLKAN, P., MANOS, G., C., MAYES, R., L., "SEiSMiC TCStiNg OfSingle-Story Masonry Houses: Part 1", Journal of Structural Engineering, Vol. 116, No.l, 1990, pp.235-256
cLouGH, R., W., GÜLKAN, p., MANOS, G., C., MAYES, R., L., .,Seismic Testing ofSingle-Story Masonry Houses: Part 2", Journal of Structural Engineering, Vol. 116, No.1,1990, pp.257-2274
cLouGH, R., w., PENZIAN, J., "D¡mamics of Structures", second Edition, McGraw-Hill,Inc., 1993
coLE, w., LEV/IS, R., "A Note on the Moisture Expansion of unrestrainedExperimental Brick'Walls", Journal of the Australian Ceramic Society, November, No.3,Vol.10, I974,pp.55
Concrete Masonry Association of Australia and South Australian Clay Brick AssociationIncorporated, "A Guide to Masonry Construction", 1983
CORNELruSSEN, R., D., "Failure of Plastics", Hanser Publishers, 1986
CORTELL, R., "Numerical Analysis and Dynamic Problems with Negative Stiffness",Computers and Structures, Vol.6l, No. 6,1996,pp. 1009-1011
CRANSTON, W., 8., ROBERTS, J., J., " The Structural Behaviour of Concrete Masonry- Reinforced and Unreinforced", The Structural Engineer, No. I I, vol. 54,1976,pp.423-436
CURTIN, W., G., SHAW, G., BECK, J., K., PARKINSON, G., I., "Masonry Fin Walls",The Structural Engineer, Vol. 624, No. 7 , 1984, pp.203-2lO
CURTIN, W., G., SHAW, G., BECK, J., K., BRAY, W., 4., "structural MasonryDesigners Manual", Granada Publishing Limited, Great Britain, 1982
224
REFERENCES
DAVIDSON, 8., J., BRAMMER, D., R., "Cyclic Performance of Nominally ReinforcedMasonry 'Walls", Proceedings of the 1996 Technical Seminar of the New ZealandNational Society of Earthquake Engineering, New Plymouth, 1996, pp. t44-l5lDE VEKEY, R., C., BRIGHT, N., J., LUCKIN, K., R., ARORA, S., K., "ThE RESiSTANCE
of Masonry to Lateral Inading - Research Results on Autoclaved Aerated ConcreteBlockworK', The Structural Engineer, Vol. 644, No. 11, 1986, pp. 332-340
DEANIN, R., D., "Polymer Structure, Properties and Applicationso', Cahners PublishingCompany,1972
DENHAM, D., "lntraplate Earthquakes - rWhy?", Proceedings of the AustralianEanhquake Engineering Society Conference, Sydney, Australia, 1992, pp. 3-6
DEPPE, K., "The Whittier Natrows, California Earthquake of October l, t987 -Evaluation of Strengthened and Un-strengthened Unreinforced Masonry in Los AngeliesCitt'', Earthquake Spectra, Vol. 4, No. 1, 1988, pp. 157-180
DeVITIS, N., PAGE, A., 'W., LAIVRENCE, S., J., "Influence of Age on TheDevelopment of Bond Strength", Proceedings of the 4th Australasian MasonryConference, Sydney, 1995, pp.299 -307
DHANASEKAR, M., "Effect of Central Queensland Sands on the Shear Capacity ofConcrete Masonry Containing Damp Proof Course", Proceedings of the 5ù AustralasianMasonry Conference, Gladstone, Queensland, 1 998, pp. 75-83
DHANASEKAR, M., PAGE, 4.,'W., KLEENMAN, P., 'W., "The Failure of BrickMasonry Under Biaxial Stresses", Proceedings of The Institution of Civil Engineers, Part2,1985, pp.295-313
DHANASEKAR, M., KLEENMAN, P., W., PAGE, 4.,W., "Biaxial Stress-StrainRelationships for Brick Masonry'', American Society of Civil Engineers, Journal ofStructural Engineering, Vol.1 1 1, No.5, 1985, pp.1085-1 100
DOBBINS, J., J., "Problems of Chronology, Decoration, and Urban Design in the Forumat Pompeii", Proceedings of the American Journal of Archeology, Vol. 98, No.4, 1994
DOI{ERTY, K., LAM, N., GRIFFITH, M., 'WILSON, J., "Investigation in the WeakLinks in the Seismic Load Path of Unreinforced Masonry Buildings", Proceedings of the5th Australasian Masonry Conference, Gladstone, Queensland, 1998, pp.115-128
DOHERTY, K., LAM, N., GRIFTITH, M., WLSON, J., "The Modelling of EarthquakeInduced Collapse of Unreinforced Masonry'Walls Combining Force and DisplacementPrincipals", Pioceedings of the 12ù World Conference on Earthquake Engineering,Auckland, New Zealand,2000, Paper 1645
DOHERTY, K., LAM, N., GRIFFITH, M., WILSON, J., "Modelling the CollapseBehaviour of Unreinforced Masonry rWalls During the Newcastle Earthquake",Proceedings of Australian Earthquake Engineering Society, Sydney, 1999
DONALDSON, R., J., "Behaviour of Structures - Patterns of Failure in DomesticBuildings After the 1989 Newcastle Earthquake, Proceedings of the Conference on theNewcastle Earthquake, Newcastle, Australia, 1990, pp.39 -43
225
REFERENCES
DOWRICK, D., J., RHOADES, D., A., "Magnitude of New z,ealandEarthquakes, l90l-1993", Bulletin of the New Zealand National Society for Earthquake Engineering, Vol.31, No.4, 1998, pp. 260-280
DRYSDALE, R., G., ESSAWY, 4., s., "out-of-Plane Bending of concrete Block'Walls", American Society of Civil Engineers, Journal of Structural Engineering, No. 1,Vol. 114, 1988, pp.l2l-133DRYSDALE, R., G., HAMID,4.,4., BAKER, L., R., "Masonry Structures - Behaviourand Design", Prentice Hall,1994EDWARDS, M., LAM, N., WIISON, J., HUTCHINSON, G., "The prediction ofEarthquake Induced Displacement Demand of Buildings in Australia : An IntegratedApproach", Proceedings of the 1999 Technical Semina¡ of the New Zealand NationalSociety of Earthquake Engineering, Rotorua, 1999, pp. 43 -50
ETTER, D., M., "Structured Fortran 77 -For Engineers and Scientists", Second Edition,The Benjamin/Cummings Publishing Company, Inc., 1987
EWING, R., D., "Seismic Performance of [.ow Rise Concrete and Masonry Buildings",Proceedings of the Workshop for the Seismic Performance of t ow Rise Buitdings, State-of-the-art and Research Needs, Illinois, 1980, pp. 66-75
EWING, R., D., KARIOTIS, J., c., JOHNSON, 4., 'w'., "predictions of Stability forUnreinforced Brick Masonry Walls Shaken By Earthquakes", Proceedings of the 7thInternational Brick Masonry Conference, Melbourne, 1 985, pp. 1 1 75- 1 I 83.
EV/ING, R., D., KARIOTIS,I., C, JOHNSON, 4.,'W., "strength Determination andShear Failure Modes of Unreinforced Brick Masonry with L¡w Strength Mortar",Proceedings of the 7th International Brick Masonry Conference, Melbourne, 1985,pp.l327-1337
FAILLA, 4., La MENDOLA, L., PIRRorrA, 4., "Flexural cycric Behaviour ofMasonry Walls Subjected to Horizontal Forces", Proceedings of the 11ù Conference onEarthquake Engineering, Balkema, Rotterdam, 1 998
FARDIS, M., N., "S.O.A. Lecture: læssons l-earnt in Past Earthquakes", Proceedings ofthe 10th European Conference on Earthquake Engineering, Vol. 1, Rotterdam, 1995, pp.779 -788
FATEMI, s., JAMES., c., "The [,ong Beach Earthquake of 1933", National InformationService for Earthquake Engineering, University of California, Berkley,http ://www.eerc.berkley.edu, 1999
GAD, E., DUFFIELD, C., "Investigation into Domestic Brick Veneer Structures WhenSubjected to Lateral [-oading", Proceedings of the Australasian Structural EngineeringConference, Sydney, 1994, pp. 67 3-67 8
GAMBAROTTA, L., LAGOMARSINO, s., "Damage Models for the Seismic Responseof Brick Masonry Shear Walls. Part I: The Mortar Joint Model and its Applications",Earthquake Engineering and Structural Dynamics, Vol. 26, 1997, pp.423439
226
REFERENCES
GAMBAROTTA, L., LAGOMARSINO, S., "Damage Models for the Seismic Responseof Brick Masonry Shear Walls. Part II: The Continuum Model and its Applications",Earthquake Engineering and Structural Dynamics, Vol. 26, 1997, pp.44l 462
GAMBAROTTA, L., LAGOMARSINO, S., MORBIDUCCI, R., "Brittle-DuctileResponse of In-plane Loaded Brick Masonry'!Y'alls", Proceedings of the 10th EuropeanConference on Earthquake Engineering, Vol. 3, Rotterdam, 1995, pp. 1663 - 1668
GERE, J., H., TIMONSHENCO, S., P., "Mechanics of Materials", PWS-Kent PublishingCo., Boston, 1990
GHAZ/J-[ M.,2., RIDDINGTON, J., R., "Simple Test Method For Masonry ShearStrength", Technical Note No. 505, Proceedings of The Institution of Civil EngineersPart 2,Vo1.85, 1988, pp.567 -57 4
GIBSON, G., "An Introduction to Seismology", Proceedings of the Conference on theNewcastle Earthquake, Newcastle, Australia, 1 990, pp.6-8
GLOGAU, O., 4., "Masonry Performance in Earthquakes", Bulletin of the New ZealandNational Society for Earthquake Engineering, Vol.7, No.4, 1974
GRAHAM, K., J., PAGE, 4., 'W., "Testing of Post-Tensioned Hollow Clay Masonry",Proceedings of the 4th Australasian Masonry Conference, Sydney, 1995, pp.228-239
GRAPES, R., DOWNES, G., "The 1855 Vy'airarapa, New Zealand, Earthquake -Analysis of Historical Data", Bulletin of the New Zealand National Society forEarthquake Engineering, Vol. 30, No.4, 1997,pp.271-368
GRIFFITH, M., C., "Performance of Unreinforced Masonry Buildings During theNewcastle Earthquake, Australia", Research Report No. R86, The University ofAdelaide, Department of Civil and Environmental Engineering,l99l
GRIFFpH, M., C., PAGE, A., W., "On the Seismic Capacity of Typical DPC and SlipJoints in Unreinforced Masonry Buildings", Australian Journal of Structural Engineering,Vol. SEl, No. 2,1998, pp.133-140
GUGGISBERG, R., THURLIMANN, 8., "Failure Criterion for Laterally LoadedMasonry Walls", Proceedings of the 5th North American Masonry Conference, Urbana-Champign, 1990, pp. 949-958
GUPTA, 4., K., "Response Spectrum Method in Seismic Analysis and Design ofStructures", B lackwell Scientific Publications, Boston Oxford, ISBN 0-8 6542- 1 1 5 -3
GURLEY, C., "Existing Structures - Requirements and Repairs", Proceedings of theConference on the Newcastle Earthquake, Newcastle, Australia, 1990, pp.l07-113
HAMID, 4., DRYSDALE, R., G., "Flexural Tensile Strength of Concrete BlockMasonry", Journal of Structural Engineering, Vol. I 14, No. 1, 1988, pp. 50-66
HART, G., C., KARIOTIS, J., NOLAND, J.,L., "The Whittier Narrows, CaliforniaEarthquake of October 1, 1987 - Masonry Buildings Performance Survey'', EarthquakeSpectra, Vol.4, No. 1, 1988, pp. 181-195
227
REFERENCES
HASELTINE, 8., A., TUTT, J., N., "The Resistance of Masonry to Lateral Loading -Implications of Research on Design Implications", The Structural Engineer, Vol. 64A,No. 11, 1986, pp. 341-350
HASELTINE,8.,4., WEST, H.,'w'., H., TUTT, J., N., " The Resistance of Brickwork toLateral Loading - Pa¡t 2 - Design of Walls to Resist Lateral L-oads", The StructuralEngineer, 1977, No. 10, Vol.55, pp. 422430HENDRY, 4., W., "The Lateral Strength of Unreinforced Brickwork - Discussion",Structural Engineer, No. 8, Volume 5l,lg73HENDRY, 4., 'W., '"The Lateral Strength of Unreinforced Brickwork", StructuralEngineer, No. 2, Volume 5I,1973HENDRY,4., W., "Structural Brickwork", The MacMillan press Ltd, lgglHJELMSTAD, K., D., WILLIAMSON, E., 8., "D¡mamic stability of structural systemssubjected to Base Excitation", Engineering Structures, vol. 20, No. 4-6,lggg, pp. 425-432,
HOGAN, S., J., "On the Dynamics of Rigid-Block Motion Under Harmonic Forcing",Proceedings of the Royal Society of London,
^425, 1 989, pp. 44247 6
HOUSNER, G., W., "The Behaviour of Inverted Pendulum Structures DuringEarthquakes", Bulletin of the seismological society of America", vol. 53, No.2, 1963,pp.403417
HUTCHINSON, G., WILSON, J., PHAM, L., BILLINGS, I., JURY, R., K[NG, A.,"Developing a Common Australasian Earthquake L,oading Standard", Proceedings of theAustralasian Structural Engineering Conference, Sydney, 1994, pp. 853-857IRISH, J., L., "Earthquake Damage Functions For Australian Houses and the ProbableMaximum Loss for an Insurance Portfolio", Proceedings of the Australian EarthquakeEngineering Society Conference, Sydney, Australia, 1992, pp. 6l -69
JAIN, S., K., MURTY, C., V., R., ARLECAR, J., SINHA, R., GOYAL, A., JAIN, C.,"Some Observations on Engineering Aspects of the Jabalpur Earthquake of 22 May1997 ", EERI S peci al Earthqu ake Report, http ://www.eeri. or g/Reconn/, I gg7
JAMES, C., I{ERNANDEZ,L., "Helena, Montana, 7935-, National Information Servicefor Earthquake Engineering, university of california, Berkley,http //www.eerc.berkle)¡.edu, 1999
JANKULOVSKI, E., PARSANEIAD, S., "Analytical Evaluation of In-Plane Resistanceof Unreinforced Masonry 'Walls", Proceedings of the 4th Australasian MasonryConference, Sydney, 1995, pp.65-70
JOHNSON, M., w., PIEREPIEKARZ, M., R., "seismic strengthening Methods forUnreinforced CMU Partition and Infill Systems", Proceedings of the National EarthquakeConference,1993
JONES, N., P., CROSS, W., B., "Floor and Wall Interaction in Unreinforced MasonryBuildings", Proceedings of the National Earthquake Conference, vol. 1 l, lgg3, pp.2l5-224.
228

REFERENCES
JORDAN, J.,'W., LUDLOW, J., N., TRUEMAN, E.,G., "The Newcastle Earthquake andHeritage Structures", Proceedings of the 5ù National Conference on EngineeringHeritage, Perth, 1990
JUDI, H., DAVIDSON, 8., FENWICK, R., "A Comparison of Force and DisplacementBased Design", Proceedings of the 1998 Technical Seminar of the New Zealand NationalSociety of Earthquake Engineering, 1998, pp. 67 -7 4
KARIOTIS, J., C., EWING, R., D., JOHNSON, 4.,'W., ADHAM, S., 4., "MEthOdOIOgYfor Mitigation of Earthquake Hazards in Unreinforced Brick Masonry Buildings",Proceedings of the 7th International Brick Masonry Conference, Melbourne, 1985,pp.1339-1350
KAUTTO, J., PAGE, 4., W., "The Impact of The Earthquake Loading Code on MasonryHousing", Proceedings of the 4th Australasian Masonry Conference, Sydney, 1995,pp.160-170
KELLY, T., E., "Earthquake Resistance of Unreinforced Masonry Buildings",Proceedings of New Zealand National Society for Earthquake Engineering, 1995, pp. 28-35
KING, 4., "Earthquake Loads and Earthquake Resistant Design of Buildings",Proceedings of the Australian Earthquake Engineering Conference, Perth, 1998
KLOPP, G., M., "seismic Design of Unreinforced Masonry Structures", Ph.D. Thesis,Department of Civil and Environmental Engineering, The University of Adelaide,Australia, 1996
KLOPP, G., M., GRIFtttH, M., C., "D¡mamic Characteristics of Existing MasonryBuildings", Proceedings of the Pacific Conference on Earthquake Engineering, New7.ealand, 199 1, pp1 87 -195.
KLOPP, G., M., GRIFFITH, M., C., "Earthquake Design Requirements for UnreinforcedMasonry Buildings in Australia - 2 Case Studies", Proceedings of the AustralasianStructural En gineerin g Conference, Sydney, 199 4, pp. 84 I -846
KLOPP, G., M., GRIffmH, M., C., "Seismic Analysis of Unreinforced MasonryBuildings in Australia - 2 Case Studies", Australian Journal of Structural Engineering,Vol. SEl, No.2, 1998,pp.lTl-131
KLOPP, G., M., Gruf'fftH, M., C., "Seismic Analysis of Unreinforced MasonryBuildings", Australian Journal of Structural Engineering, VoL SEl, No. 2, 1998, pp.l2l-131
KLOPP, G., M., GRIFFITH, M., C., "Shaking Table Tests of Unreinforced MasonryWall Panels", Australian Journal of Structural Engineering, Vol. SEl, No. 2,1998,pp.1 l3-130
KLOPP, G.,M., GRIFFTTH, M., C., "The Design of Unreinforced Masonry Buildings forEarthquake Induced Forces", Pacific Conference on Earthquake Engineering, Australia,1995, pp.87-96
229
REFERENCES
KLOPP, G., M., GRIFFITH, M., c., "The Earthquake Design of unreinforced MasonryStructures In Areas of Low Seismic Risk", Proceedings of the 3rd National MasonrySeminar, Brisbane Australia, 7994, pp. 19.l -19.9
KLOPP, G., M., GRIFFTTH, M., c., "The Earthquake Design of unreinforced MasonryStructures - Are Existing Period Formulae Suitable", Proceedings of the NationalEarthquake Conference, 1993, pp. I 53 -162
KÖNIG, G., MANN, V/., ÖTES, A., "Experimental Investigations on the Behaviour ofUnreinforced Masonry Walls Under Seismically Induced t oads and læssons Derived",Proceedings of the 9th World Conference on Earthquake Engineering, Tokyo-Kyoto,1988, Vol.8, pp.1 1 l7 -1122
KOO, R., CT{ENG, M., LAM, N., WILSON, J., HUTCHINSON, G., GRIFFITH, M.,"Modelling of the Earthquake Ground Motions Generated by the Newcastle Earthquake",Proceedings of the 1999 Australian Earthquake Engineering Conference, Sydney, 1999KRAV/INKLER, H, " Cyclic Loading Histories for Seismic Experimentation ofStructural Components", Earthquake Spectra, Journal of the Earthquake EngineeringResearch Institute, Volume 12, No.l, 1996, pp.l-11La MENDOLA, L., PAPIA, M., ZINGONE, G., "stability of Masonry \ilalls Subjectedto Seismic Transverse Forces", Journal of Structural Engineering, 1995, pp. l58l-15g7LAFUENTE, M., GENATIOS, c., LORRAIN, M., "Anal5rtical studies of MasonryWalls Subjected to Monotonic Lateral Loads", Proceedings of the 10th EuropeanConference on Earthquake Engineering, Vol. 3, Rotterdam, 1995, pp. 175l - 1755
LAM, N., NURTUG, 4., wILsoN, J., "shaking Table Testing of parapet v/alls withPeriodic and Transient Excitations", Departmental of Civit and EnvironmentalEngineering, The University of Melbourne, Departmental Report No. RR/STRUCT/98,1998
LAM, N., WILSON, J., "Eldmation of the Site Natural Period from a Borehole Record",Australian Journal of Structural engineering, Vol. SEl, No. 3,1999,pp.179-200LAM, N., WLSON, J., CHANDLER, 4., HUTCHISON, G., .,Response SpectrumModelling in Low and Moderate Seismicity Regions Combining Velocity, Displacementand Acceleration Predictions", Earthquake Engineering and Structural Dynamics (underreview)
LAM, N., WILSON, J., EDWARDS, M., HUTCHISON, G., "A Displacement BasedPrediction of the Seismic Hazard for Australia", hoceedings of the 1998 AustralianEarthquake Engineering Conference, Perth, 1998, pp. 20.1-20.5LAM, N., wILSoN, J., HUTCHINSON, G., "Building Ductility Demand: InterplateVersus Intraplate Earthquakes", Earthquake Engineering and Structural Dynamics, Vol.25,1996, pp. 965-985
LAM, N., wILSoN, J., HUTCHINSON, G., "Development of Intraplate ResponseSpectra for Bedrock in Australia", Proceedings of the 1998 Technical Seminar of theNew Zealand National Society of Earthquake Engineering, 1998, pp. 137 -144
230
REFERENCES
LAM, N., WLSON, J., HUTCHINSON, G., "Modelling of an Unreinforced MasonryParapet Wall for Seismic Performance Evaluation Based on Dynamic Testing",Departmental of Civil and Environmental Engineering, The University of Melbourne,Departmental Report No. RR/STRUCT/03/95, 1995
LAM, N., WILSON, J., HUTCHINSON, G., "The Ductility Reduction Factor in theSeismic Design of Buildings", Earthquake Engineering and Structural Dynamics, 27,1998, pp. 749-769
LAM, N., WILSON, J., HUTCHINSON, G., "The Seismic Resistance of UnreinforcedMasonry Cantilever Walls in [,ow Seismicity Areas", Bulletin of The New ZealandNational Society of Earthquake Engineering, Vol. 28, no. 3,1995, pp. 79-195
LAM, N., WILSON, J., HUTCHINSON, G., "Time-History Analysis for Rocking ofRigid Objects Subjected to Base Excitations", Proceedings of the 14th ACMSM, Hobart,Vol. 1, 19958, pp.284-289
LAM, N., \VILSON, J., KOO, R., HUTCHINSON, G., "Determination of EarthquakeResponse Spectra in Low and Moderate Seismicity Regions Using New Methodologies",Proceedings of The Australian Earthquake Engineering Conference, Newcastle,Australia, 1999
LAV/RENCE, S., JProceedings of the 5pp.219-225
LAWRENCE, S., J., "The New 453700 Approach to Lateral Load", Proceedings of the5ù Australasian Masonry Conference, Gladstone, Queensland, 1998, pp.227-237
LAV/RENCE, S., J., "Flexural Strength of Brickwork Normal to and Parallel to The BedJoints", Journal of The Australian Ceramic Society, No. 1, Vol. 1 l,1975, pp. 5-6
LAWRENCE, S., J., "Lateral Loading of Masonry - An Overview", Proceedings to the2nd National Masonry Seminar, Brisbane Australia, 1994, pp.20.l -20.9
LAWRENCE, S., J., "Out of Plane Lateral Load Resistance of Clay Brick Panels",Proceedings of the Australasian Structural Engineering Conference, Sydney, 1994, pp.657 -663
LAWRENCE, S., J., PAGE, 4., W., "Mortar Bond - A Major Research Program",Proceedings of the 4th Australasian Masonry Conference, Sydney,1995,pp.3l-37
LEEDS, D., "Report on Conference on 1971 San Fernando, Ca., Earthquake", AmericanSociety of Civil Engineers, Civil Engineering, Environmental Design and EngineeredConstruction, 197 2, pp. 58-60
LZUNDIA, 8., DONG, W., H., W., REITI{ERMAN, R., "LIRM Building DamagePatterns in the l¡ma Prieta Earthquake: Implications for Improvements in l¡ssEstimation Methodologies", Proceedings of the 5ù National Conference on EarthquakeEngineerin g, 199 4, pp.459468
LIZUNDIA, 8., HOLMES, W., T., "Development of Procedures to Enhance thePerformance of Rehabilitated URM Buildings: A Summary", Proceedings of the 6ù USNational Conference on Earthquake Engineering
rh"Masonry codes and Regulations - Past, Present and Future",Australasian Masonry Conference, Gladstone, Queensland, 1 998,
231
REFERENCES
LOKE, J., Y., o., "Behaviour of Structures - Institutionar', proceedings of theconference on the Newcastle Earthquake, Newcastle, Australia, r990, pp-28-32LOLJRENCO, P., 8., "Computational Strategies for Masonry Structures", Ph.D. Thesis,The Civil Engineering Department, Delft University of Technology, The Netherlands,1996
LovEGRovE, R., "A Discussion of 'Yieldlines' in unreinforced Masonry", TheStructural Engineer, Vol. 66, No.22, 1988, pp. 371-375
MAGENES, G., cALvI, G., M., "cyclic Behaviour of Brick Masonry walls",Proceedings of the 1Oth World Conference on Earthquake Engineering, Rotterdam, 1992,pp.35t7-3522
MAGENES, G., cALvI, G., M., "In-plane seismic Response of Brick Masonry'walls",Earthquake Engineering and structural Dynamics, vol. 26, 1997,pp. 109r-1 I 12
MAGENES, G., CALVI, G., M., "shaking Table Tests on Brick Masonry'walls",Proceedings of the 10th European Conference on Earthquake Engineering, Vol. 3,Rotterdam, 1995, pp. 2419 -2424MAKRIS, N., Roussos, Y., "Rocking Response and overturning of Equipment underHorizontal Pulse Type Motions", Pacific Earthquake Research Center, Berkley,University of California, PEER-98/05
MANFREDT, G., MAZZOLANI, s., MASI, 4., "Review of Existing in ExperimentalTesting of Masonry Structures Subjected to Horizontal Loads", Proceedings of the lOth\vorld conference on Earthquake Engineerin g, Rotterdam, 1992, pp. 3 5 57 -j562MARTINI, K., "Finite Element Studies in the Two-way Out of Plane Failure ofUn¡einforced Masonry", Proceedings of the 6ù US National Conference on EarthquakeEngineering
MARTIM, K., "Research in the Out-of-Plane Behaviour of Unreinforced Masonry",Vir a.EI) 1997
MARTIM, K., "Finite Element Studies in the Out-of-Plane Failure of UnreinforcedMasonry", Proceedings on the International Conference on Computing in Civil andBuilding Engineering, Vol. I, Korea, 1997
MARZAHN, G., "Dry-stacked Masonry in Comparison with Morta¡ Jointed Masomy",I-eipng Annual Civil Engineering Report, No. 2, 1997,pp.353-365
MARZAHN, G., "shear Strength of Grout Dowelled Mason4y'', I-eipng Annual civilEngineering Report, No. 2, 1997,pp.335-351
McCUE, K., "Seismicity and Earthquake Hazard in Australia", Proceedings of theEarthquake Engineering and Disaster Reduction Seminar, Australian EarthquakeEngineering Society, Melbourne, 1993, pp. 9 -14
McCUE, K., "Seismological Aspects of the Newcastle NSV/ Earthquake of 28 December1989", Proceedings of the Conference on the Newcastle Earthquake, Newcastle,Australia, 1990, pp.9-13 .
232
REFERENCES
McGINLEY, W'., M., BORCHELT, J., G., "Friction at the Supports of Clay BrickWalls", Proceedings of the 5th North American Masonry Conference, 1990, pp.1053-1066
McGINLEY, 'W., M., BORCIIELT, J., G., "Influence of Materials on the FrictionDeveloped at the Base of Clay Brick Walls", Proceedings of the 9th IBMAC, Berlin,1991, pp. 292-3OO
MELCHERS, R., E., (Ed) "Newcastle Earthquake Study", The Institution of Engineers,Australia, 1990
MELCHERS, R., E., "On Intra-plate Earthquakes and Existing Buildings", Transactionsof the Institution of Engineers, Civil Engineering, Vol. C836, No.4, 1994,pp.265-271
MELCHERS, R., MORISON, D., "Structural Response to Typical Intra-Plate GroundShaking", Research Report No. 107.02.1995, The University of Newcastle, 1995
MERCER, J., CROSS, W., "Simple, I¡w-Cost Retrofit Procedures for HistoricUnreinforced Masonry Buildings", Elsevier Science Ltd, 1998, Paper reference T126-5
MOORE, T., 4., KOBæTP, J., H., DIRI, J., ARNOLD, C., ..The Whittier NarrOwS,California Earthquake of October 1, 1987 - Prelimina¡yEvaluation of the Performance ofStrengthened Unreinforced Masonry Buildings", Earthquake Spectra, Vol. 4, No. 1,
1988, pp.197-215
MULLINS, P., J., O'CONNER, C., "{Jnreinforced Brick Shear'Walls", hoceedings ofthe 4th Australasian Masonry Conference, Sydney, 1995, pp.7l-80
MUQTARIR, M., "slenderness Effects in Eccentrically Loaded Plain Masonry'Walls",Proceedings of the 5th North American Masonry Conference, Urbana-Champign, 1990,pp.1007-1015.
MURPHY, S., 4., STEWART, M., G., "Analysis of Public Buildings Damaged in the1989 Newcastle Earthquake", Australian Civil Engineering Transactions, Vol. CE35, No.3,1993, pp.187-201
NAWAR, G., ZOURTOS, K., "Planning and Control of Site Quality with Reference toSpecial Masonry", Proceedings of the 3rd National Masonry Seminar, BrisbaneAustralia, L994, pp.1 .l-7 .11.
NEHRP, "Recommended Provisions for the Development of Seismic Regulations forNew Buildings - Part 1 Provisions", National Hazards Reduction Program, FederalEmergency Management Agency, Washington, DC, 1991
NEHRP, "Recommended Provisions for the Development of Seismic Regulations forNew Buildings - Pat 2 Commentary'', National Haza¡ds Reduction Program, FederalEmergency Management Agency, Washington, DC, 1991
NICHOLS, J., M., TOTOEV, Y., Z., "Background to a Study of Damage Mechanics inMasonry Panels Subjected to Cyclic [,oading", Proceedings of the 5ù AustralasianMasonry Conference, Gladstone, Queensland, 1 998, pp. 283 -292
233
REFERENCES
NURTUG, 4., DOHERTY, K., GRIFFITH, M., LAM, N., WILSON, J., ,,Research intothe Seismic Performance of Un¡einforced Masonry Walls", Proceedings of the AustralianEarthquake Engineering Conference, Brisbane, Australia,1997,p. l5-l - 154OH, K., HARRIS, G., "Seismic Behaviour of Floor to 'Wall Horizontal Joints of MasonryBuildings using 1/3 Scale Direct Models", Proceedings of the 5ù North AmericanMasonry Conference, Tllinois, 1990, pp. 8l-92PAGE, A., W., "A Note on the Shear Capacity of Membrane Type Damp Proof Courses",Research Report No. 097.05.1994,The University of Newcastle, 1992
PAGE, 4., W., "Behaviour of Structures - Patterns of Failure", Proceedings of theconference on the Newcastle Earthquake, Newcastle, Australia, r990,pp.39-43PAGE, A., W., "The Design, Detailing and Construction of Masonry - The læssons Fromthe Newcastle Earthquake", Research Report No. 073.03.1992, The University ofNewcastle, 1992
PAGE, 4., w., "The Design, Detailing and construction of Masonry - The læssonsFrom the Newcastle Earthquake", Australian Civil Engineering Transactions, Vol. C834,No.4, 1992,pp.343-353
PAGE, 4., \ry., "The New Australian Standard for Masonry Structures (A53700-1998)",Proceedings of the 5ù Australasian Masonry Conferen"", bludrtone, Queensland, 1998,pp.303-308
PAGE, 4., W., "Un¡einforced Masonry Structures - An Australian Overview",Proceedings of the Pacific Conference on Earthquake Engineering, Australia, 1995, pp.1-16.
PAGE, 4., W., KLEEMAN, P., 'W., STEWART, M., G., MELCI{ERS., R., 8.,"Structural Aspects of the Newcastle Earthquake", The lnstitution of Engineers AustraliaSt¡uctural Engineering Conference, Adelaide, 1990, pp. 305-312PAGE, 4., w., LAWRENCE, s., J., "An Integrated study of Masonry Bond Strength",Proceedings of the 5ù Australasian Masonry Conference, Gladstone, Queensland, 1-998,pp.309-317
PAGE, 4., 'w., "codes overview - connectors and Accessories For MasonryConstruction - Strengthening of Existing Buildings For Earthquakes", Proceedings of the4th Australasian Masonry Conference, Sydney, 1995, pp.97-I02PAGE, 4., w., "The shear capacity of Membrane Type Damp-proof courses inMasonry'', Transactions of the Institution of Engineers, Civil Engineering, 1995, Vol.C837, No.1, pp.29-39
PAGE, 4., w., GRIFFITH, M., c., "seismic Design of connections in unreinforcedMasonry Buildings', Proceedings of the 1998 Structural Engineers World Conference,San Francisco, CA, USA, 1998
PAGE, 4., w., KLEENMAN, P., BRYANT, I., "The Effect of Foundation Hogging andSagging on Masonry Walls", Proceedings of the Australasian Structural EngineeringConference, Sydney, 1994, pp. 665-67 I
234
REFERENCES
PAGE, A., W., LAV/RENCE, S., "Design of Clay Masonry for V/ind and Earthquake",clay Brick and Paver Instifute, 1999,ISBN 0947160 03 5
PARSANEJAD, S., JANKLJLOVSKI, E., "Hysteresis Behaviour of Plain Brick MasonryWalls: An Experimental Investigation", Proceedings of the Australasian StructuralEngineering Conference, Sydney, 1994, pp.679-683.
PAULAY, T., "Simplicity and Confidence in Seismic Design", Proceedings of theAustralian Earthquake Engineering Society Conference, Brisbane, Australia, 1997, pp. 1-| - t-12PAULAY, T., PRIESTLY, M., J., N., "Seismic Design of Reinforced Concrete andMasonry Buildings", J. Wiley, 1992
PEDERSEN, I., "Behaviour of Structures - Major Commercial Buildings", Proceedingsof the Conference on the Newcastle Earthquake, Newcastle, Australia, 1990,pp.21-25
PHAM, L., GRIFFITH, M., C., "Review of Building Performance in RecentEarthquakes", Proceedings of the 4th Australasian Masonry Conference, Sydney, 1995,pp.14-20
PHAM, L., LI, C., Q., "Domestic Construction and Serviceability'', Proceedings of theAustralasian Structural Engineerin g Conference, Sydney, 199 4, pp. 847 -85 1
PHIPPS, M., "Diaphragm and Other Walls of Geometric Cross Section in the UK",Proceedings to the 2nd National Masonry Seminar, Brisbane Australia, 1994, pp.24.1-24.r0.
PHIPPS, M., E., "The Design of Slender Masonry Walls and Columns of GeometricCross-section to Carry Vertical Load", The Structural Engineer, Vol. 65A, No. 12,1987,pp.443447
PHIPPS, M., E., PAGE, A., W., "Developments in Masonry Part 1 -'Walls of GeometricCross-Section", Australian Civil Engineering Transactions, Vol. CE37 .(2),1995, 159-165
PHIPPS, M., E., PAGE, 4., W., "Developments in Masonry Pafi 2 - Reinforced andPrestressed Walling", Australian Civil Engineering Transactions, Vol. C837. (2), 1995,167-174
POMONIS,4., SPENCE, R., J., S., COBURN,4., \V., "Shaking Table Tests on StrongMotion Damageness Upon Reinforced Masonry", Proceedings of the 10th WorldConference on Earthquake Engineering, VoL 6, Rotterdam, 1992, pp. 3533-3538
POTTER, R, J, "Earthquake and Masonry - An Overview", Proceedings of the 3rdNational Masonry Semina¡, Brisbane Australia, 1 994, pp. 1 5. I -l 5. I 1 .
POULOS, H., G., "Relationship Between l¡cal Soil Conditions and Structural Damagein the 1989 Newcastle Earthquake", Australian Civil Engineering Transactions, Vol.C833, No. 3, 1991, pp.l81-188
PRIESTLEY, J., N., "seismic Behaviour of Unreinforced Masonry Walls", Bulletin ofthe New Tnaland National Society for Earthquake Engineering, Vol. 18, No.2, 1985,pp.191-205.
235
REFERENCES
PRIESTLEY, J., N., ROBINSON, L., M., "Discussion - seismic Behaviour ofUn¡einforced Masonry 'Walls", Bulletin of the New Zæaland National Society forEarthquake Engineering, Vol. 19, No. 1, March 1986, pp.65-75.
PRIESTLY, M., J., N., CALVI, G., M., "concepts and procedures for DirectDisplacement-Based Design and Assessment", Workshop on Seismic Design Approachesfor the 21'r Century, Slovenia,lgg7PRIESTLY, N., J., "Displacement-Based Seismic Assessment of Existing ReinforcedConcrete Buildings", Bulletin of the New Zealand National Society for EarthquakeEngineering, Vol.. 29, No.4, 1996,pp.256-271
PUJOL, S., RAMIREZ, J., SARRIA, 4., "Coffee Znne, Columbia, January 25Earthquake, Observations on the Behaviour of L,ow Rise Reinforced ConcreteBuildings", http://www.eeri.org/Reconn/, 1999
RAJAKARUNA, M., P., "Effect of a Damp Proof Course on The Shear Strength ofMasonry", Proceedings of the 15th Australasian Conference on The Mechanics ofStructures and Materials, Melbourne, Victoria, Australia, lg97,pp. 633-637
RAMIREZ, J., PUGLESI, R., "The october 9, 1995 Magnitude 7 .6 Manzanillo, MexicoEarthquake", EERI Special Earthquake Report, http://www.eeri.org/Reconn/,lg95RANGAN, B., v., WARNER, R., F., "Large concrete Buildings", concrete Design andConstruction Series, Longman Group Limited, 1996
REITHERMAN, R., "The Borah Peak, Idaho Earthquake of october zg, lgg3 -Performance of Unreinforced Masonry Buildings in Mackay,Idaho", Earthquake Spectra,Yol.2, No. 1, 1985, pp. 205-224
Report by the Masonry Standards Joint Committee on Building Code Requirements forMasonry Structures (ACI 530-92/ASCE 5-92ÆMS 402-92), Specification for MasonrySüuctures (ACI 530.1-92|ASCE 6-92|TMS 602-92), Commentary on Building CodeRequirements for Masonry Structures (ACI 530-92/ASCE 5-92|TMS 402-92) andCommentary on Specifications for Masonry Structures (ACI 530.1-921ASCE 6-92|TMS602-92),USA, 1gg2
RIDDINGTON, J., R., ruKEs, P., "A Masonry Joint shear strength rest Method",Proceedings of the Institution of Civil Engineers, 104,1994,pp.267-274RIDDINGTON, J., R., GHAZALI, M, 2., "Hypothesis for shear Failure in MasonryJoints", Proceedings of rhe Institution of civil Engineers, part2,l990, pp.89-102RODOLICO, 8., DOI{ERTY, K., LAM, N., GRTFFITH, M., WILSON, J., "SEiSMiCResponse Behaviour of Unreinforced Masonry Slender \ilalls Revealed By ShakingTable Testings and Time-History Analyses", Proceedings of the 16ù AusgalasianConference on Mechanics of Structures and Materials, Sydney,lgggRoMANo, F., GANDUSCIO, s., zNGoNE, G., "Analysis of Masonry walls Subjectto Cyclic L-oads", Proceedings of the 10th European Conference on EarthquakeEngineering, Vol. 3, Rotterdam, 1995, pp. 1675 - 1680
ROSATO, Donald, V., MATTIA, D., P., ROSATO, Dominick, V., ..Designing withComposites and Plastics: A Handbook", Van Nostrand Reinhold, l99l
236
REFERENCES
SAA Earthquake Loading Code, AS2l21, Standards Association of Australia, Sydney,1979
SAA Loading Code, Minimum Design Loads on Structures - Part 4 - Earthquake [¡ads,4S1170.4 - 1993, Standa¡ds Australia, Sydney 1993
SAA Masonry Code 453700-1988, Standa¡ds Australia, Sydney 1988
SAA Masonry Code 453700-1998, Standa¡ds Australia, Sydney 1998
SAA Masonry Code Commentary, 453700 Supplement l, Standards Australia, Sydney,t99lSAA Strengthening Existing Buildings for Earthquake, 453626 - 1998, StandardsAustralia, Sydney 1998
SAMARASINGHE, W., LAWRENCE, S., J., PAGE,4., W., "Investigations of the Bond'Wrench Method of Testing masonry", Proceedings of the 15th Australasian Conferenceon The Mechanics of Structures and Materials, Melbourne, Victoria, Australia, 1997,pp.651-656
SAÀ4AIù\SINGHE, W., LAWRENCE, S., J., PAGE,4.,'W., "Standardising the Bond'Wrench", Proceedings of the 5th Australasian Masonry Conference, Gladstone,Queensland, 1998, pp. 335-344
SAÀ4AIL{SINGHE, W., PAGE, 4., 'W., FIENDRY, 4., 'W., "Behaviour of BrickMasonry Shear'Walls", The Structural Engineer, Vol. 59B, No. 3, 1981, pp. 4348
SCHWARTZ, J.,THURLIMANN, 8., "Design of Masonry'Walls Under Normal Forcewith Swiss STD.SIA Y 17712", Proceedings of the 5th North American MasonryConference, Urbana-Champign, I 990, pp.959 -969
SCRIVENER, J., C., "Masonry Structures - Earthquake Resistant Design andConstruction", Proceedings of the Earthquake Engineering and Disaster ReductionSeminar, Australian Earthquake Engineering Society, Melbourne,1993,pp'39-44
SEAOC - Structural Engineers Association of California, "Recommended Lateral ForceRequirements and Commentary'', Structural Engineers Association of California, LosAngeles, Cahfornia, 197 7
SEISMOLOGY RESEARCH CENTER, Seismology Education, http://www.seis,com.au,1999
SEISUN, M., PARSENEIAD, S., JANKULOVSKI, E., "Experimental Behaviour of ClayBrick Masonry Subject to Compression and Shear", Proceedings of the AustralasianStructural Engineering Conference, Sydney, t994, pp.69 1 -695.
SHELTON, R., H., "Face t oaded Performance of Masonry Veneer Under SeismicAction", Proceedings of the 4th Australasian Masonry Conference, Sydney, 1995,pp.150-159
SHIBATA, 4., SOæN, M., 4., "substitute-Structure Method for Seismic Design inR./C", Journal of the Structural Division, Proceedings of the American Society of CivilEngineers, Vol. 102, No.ST1, 1976
237
REFERENCES
STAITFORD SMITH, B., s., CARTER, C., "Hlpothesis for the shear Failure of BrickWork", American Society of Civil Engineers, Journal of Structural Engineering, Vol.120, No. ST4, 1971, pp. 1055-1062
SOMERS, P., " Northridge Earthquake of January 17 1994: Reconnaissance Report, Vol.2 Unreinforced Masonry Buildings", Earthquake Spectra, Journal of the EarthquakeEngineering Research lnstitute, Vol. I l, 1996, pp.l95 -217 .
SOMERVILLE, M., MccuE, K., SINADINOVSKI, c., "Response SpectraRecommended for Australia", Proceedings of the 1998 Australian EarthquakeEngineering Conference, Perth, 1998, pp. 19.1 - 19.3
South Australian Housing Code 199ó, Department of Housing and Urban Development,Building Standards and Policy Branch Planning Division, ISBN Number 0 7308 4662 g
SPENCE, R., D'AYALA, D., "Damage Assessment and Analysis of the 1997 umbria-Marche Earthquakes", Journal of the International Association for Bridge and StructuralEngineering, SEI Vol.9, No. 3, 1999
suH, N., P., TURNER, 4., P., L., "Elements of the Mechanical Behaviour of solids",Scripta Book Comp any, I97 5
SUTER, G., T., IBRAHIM, K., S., "Shear Resistance of Damp Proof Course Materials inBrick Morta¡ Joints", Proceedings of the 6th Canadian Masonry Symposium, Canada,1992,pp.1 19-130.
TAYLOR-FIRTH, 4., TAYLOR, L, "A Bond Tensile Strength Test for use in Assessingthe Compatibility of Brick/l4ortar Interfaces", Construction and Building Materials, Vol.4, No.2, 1990, pp. 58-63
TENA-COLUNGA, 4., "seismic Evaluation of Unreinforced Masonry Structured withFlexible Diaphragms", Earthquake Spectra, Vol. 8, No 2, 1992, pp305-320.TERCELI, s., SHEPPARD, P., TURNSEK, v., "The Influence of Frequency on theShear Strength and Ductility of Masonry Walls in Dynamic loading Tests", Proceedingsof the lOth World Conference on Earthquake Engineering, Rotterdam, 1992, pp.2ggr-2997
TMOSHENKO, s., V/OINOV/SKY-KRIEGER, s., "Theory of plares and shells",Second Edition, McGraw-Hill Book Company, 1959
TOMAZEVIC, M., "Seismic Design of Masonry Structures", Progress in StructuralEngineering and Materials, Vol. I (l),1997,pp. 88-95
TOMAZEVIC, M., "Simulation of Seismic Behaviour of Masonry Walls and Buildingsby Laboratory Testing", Proceedings of the 10th European Conference on EarthquakeEngineering, Vol. 3, Rotterdam, 1995, pp.2425 -2434TOMAZEVIC, M., LUTMAN, M., \ryEISS, P., "The Influence of rying the walls withSteel Ties on the Seismic Behaviour of Historical Stone and Brick Masonry Buildings",Proceedings of the 10th European Conference on Earthquake Engineering, Vol. 3,Rotterdam, 1995, pp. 2249 -2254
238
REFENZNCES
TOMAZEVIC, M., WEISS, P., "Seismic Behaviour of Plain- and Reinforced-MasonryBuildings", American Society of Civil Engineers, Journal of Structural Engineering, Vol.120, No. 2, 1994, pp. 323-338
UBC, "Uniform Building Code", International Conference of Building Officials,Whinier, California, 1976
VAN DEN BOOM, Th., J., "Experimental Research into Flexural Strength of Masoffy",CIB 3"1International Symposium on Wall Structures, Vol. 1, Warsaw, 1984, pp.9-18
VINTZILEOU, E., "Eurocode 8 - Specific Rules for Masonry Buildings :
Presentation/comments", Proceedings of the 10th European Conference on EarthquakeEngineering, Vol.4, Rotterdam, 1995, pp. 2963 - 2961
WEST, H., W., H., HODGKINSON, H., R., HASELTINE, 8., 4., DE VEKEY, R., C.,"The Resistance of Masonry to Lateral Loading - Research Results on Brickwork andAggregate Blockwork Since 1977", The Structural Engineer, Vol. 644, No. 11, 1986, pp.320-331
WEST, H., W., H., HODGINSKON, H., R., HASELTINE, 8., 4., " The Resistance ofBrickwork to Lateral Loading - Part 1 - Experimental Methods and Results of Tests onSmall Specimens and Full Sized Walls", The Structural Engineer, No. 10, Vol. 55, 1977,pp.4ll42tHODGKINSON, H., R., WEST, W., H., "The Shear Resistance of Some Damp ProofCourse Materials", Proceedings of the British Ceramic Society, No.30, 1982,pp.13-22
V/EST, 'W., H., HODGKINSON, H., R., WEBB, W., F., "The Resistance of Brick Wallsto Lateral Loading", Proceedings of the British Ceramic Society, No.21, t973, pp.l4l-t64WILI{ELM, P., "Earthquake Repairs to the Christ Church Cathedral, Newcastle NSW",Australian Journal of Structural Engineering, Vol. 1, No.1, 1998
WILSON, J., LAM, N., HUTCJINSON, G., "The Capacity of Unreinforced MasonryParapet 'Walls in Domestic Buildings to Withstand Earthquake Induced Loading",Australian Civil Engineering Transactions, Vol. CE.37 , No. 1, 1995, pp.4149'WYAT"[, K., "Restrained Moisture Expansion of Clay Masomy", Journal of theAustralian Ceramic Society, November, No.2, Vol.l2, 1976,pp34-36
WYLLIE, L., "seismic Strengthening of Historic Churches", Proceedings of the 6ú USNational Conference on Earthquake Engineering
YIM, C-S., CHOPRA, 4., K., PENZIAN, J., "Rocking Response of Rigid Blocks toEarthquakes", Earthquake Engineering and Structural Dlmamics', Vol. 8, 1980, pp. 565-587
YOKEL, F., Y., DICKERS, R., D., "Strength of l¡adbearing Masonry Walls", AmericanSociety of Civil Engineers, Journal of Structural Engineering, Vol. 120, No. ST5, 1971,pp. 1593-1608
239
REFERENCES
YOKEL, F., Y., FATTAL, G., "Failure Hypothesis for Masonry Shear'walls", AmericanSociety of Civil Engineers, Journal of Structural Engineering, vol. 120, No. ST3, 1976,pp.5l5-532
YouNG, D., T., soLTAN, E., I., "optimum Design of concrete Masonry Loadbearingand Non-l¡adbearing 'Walls", Proceedings of the 5th North American MasonryConference, Urbana-Champign, I 990, pp.93 7 -9 4g
YTTRUP, P., J., "Design of Earth Masonry rilalls For Lateral L,oads and The hoposedNew Zealand Earth Building Standard", Proceedings of the 4th Australasian MasonryConference, Sydney, 1995,pp.l I 3-1 I 8
YIIXIAN, IfU., "Some Engineering Features of the Tangshan Earthquake", Proceedingsof the 2od US National Conference ón Earthquake Engineãnng,1979ZOUTENBIER, J., "Seisdúc Response of Unreinforced Masonry Buildings", MastersThesis, The University of Canterbury, Christchurch, New Znaland,lgg6ZSEMBERY, s., McNEILLY, T., scRfvENER, J., "A Method for Accurately BatchingMortar", hoceedings of the 4th Australasian Masonry Conference, Sydney, 1995,pp.134-140
240

APPENDIX (A): Band Pass Filter Program ForttanTTCode
PROGRAM filtlC Fourier Transform of single real function
INTEGER n, no, isignREAL del, botd, ûopdREAL a(0: I 63 84), ai(O: I 63 84), afdu(O: I 6384), afdf(O: 1 6384)REAL freq(O:16384)REAL del(0:16384)CHARACTER *50 IG[¡, OFIIß
C
'Write(*,*) " BAND PASS FILTER PROGRAM"\Vrite(*,*) " FILTI.Write(*,*) " FILTERS I COLUMN OF DATA"V/riæ(*,*)V/riæ(+,x) "Type filename of input time domain data file (.csv)"Read(*,'(a)') )GILEV/rite(*,*) "Type filename for filtered data output (.csv)"Read(*,(a)') OFII¡Write(*,*) "Type input data time increment (secs)"Read(*,*) delrWrite(*,*) "Type bottom band pass filter frequency"Read(*,*) botdWrite(*,*) "Type top band pass filter frequency @isplacements)"Read(+,+) topdOpen(30,file=XFllE,staûrs='old',err= I I 0)no=O
CC Here the data array is read from external file XFILE
Do 1k=1,16384Read(30,*,END=2) a(k)ai(k)=a(k)no=no+1
I Continuec
Close(30)2 Continue
n=13 Continue
If(no.gLn)thenn=2*ngoto 3
end ifC Anays are augmented with zeros to get a function of 2
Do 4 k=netl, na(k)=O-0ai(k){.0
241

APPENDD( (A)-Band Pass Filter Forrran hogram
4 ContinueC Transform to frequency domain compleæd giving data(n) array
isign=lcall realft(a,n,isþ)Do 5 k=l,n
afdu(k)=¿(þ)5 Continue
C Frequencies a¡e calculatedDo 6 j-l,n/2Freq$=y'(n*del)
6 ContinueC Frequency domain daø is filæredC acceleration band pass filær frequencies
call genfil(a,freq,n,botd,topd)Do 7 k=l,n
afdf(k)=a(k)7 Continue
C Realft is called to perform the inverseC Eansform of the filtered data
isign = -1ca-ll realft(a,n,isign)Do 8 k=l,ndell(k)-del*ka(k)=2+¿1¡¡7n
8 ContinueC Data ouput
Open(35,file=OFILE,staüls='new',en= 1 20)Write(35,*) "INPUT FILENAME : ",XFILEWrite(35,9) del
9 Format ('SAMPIÆ RATE USED IS =',F6.3,'seconds')Write(35, l0) botd, topd
10 Format (tsand pass filter range',F5.2,' Hz -'+,F5.2,TI2')Wriæ135,*¡ "'Write(3 5, *) "FREQUENCY DOMAIN,,,,,TIME DOMAIN"Writ€(35, *) "No.,Frequency,Data,Data,,Time,Data"Data"Write(35,*) ",,unfilt filt,,,unfilt filt"Write(35, l2) afdu(1),afdf(l ),del( 1),ai( 1),a( l)
l2 Format ('1,0,'"F15.3,',',F15.3,',,',F15.3,',',F15.3,',',F15.3)rWrite(35, I 3) freq(n2),afdu(2),afdf(2),detJ¡(2),u(2),a(2)
l3 Format (2,',F15.3,',',F15.3,','"Fl 5.3,',,',F15.3,',',F15.3+,',',Fll.3)Do 14 k=3,n-1,2
Write(3 5, I 5) Þ,,freq(kÍ2- I l2),afdu(k),afdf(k),del(k), ai(k), a(k)rffrite(35, I 5) k+l,freq(V2- 1/Z),afdu(k+l ),afdf(k+ I ),denG+l )
+ ,ai(k+l),a(k+l)15 Format (I4,',',F15.3,',',F15.3,',',F15.3,',,',F15.3,',',F15.3,',+ ',F15.3)
14 Continuelù[rite1*,*¡ " "Wriæ(*,16) no
16 Forma('Number of inputdata lines =',I10)Write(*,17) n
17 Format('Number of ouþut data lines = ',I10)lVriæ(*, *) "PROGRAM RIJN COMPLETED"
100 Stop
242

APPENDD( (A) - Band Pass Filter Fortran Program
110 Vtrire(*,*) 'ERROR OPENING INPUT FILE"105 Stop120 Wriæ(*,*) "ERROR OPENING OUTPUT FILE"
END
PROGRAM filtlsC Fourier Transform of single real function
INTEGER n, no, isignREAL del, botd, topd, æmpREAL a(0: 1 63 84), ai(O: I 63 84), afdu(0: I 6384), afdf(O: 1 6384)REAL freq(0:16384)REAL dell(O:16384)CHARACTER *50)CITIF, OFTÍ F, TEXT
CìVriæ1*,x¡ " "Wriæ(*,*) ¡---------------Write(t,*) " BAND PASS FILTERPROGRAM"Write(*,*) " FILTI"Write(*,*) " FILTERS I COLUMN OFDATA"Write(*,*)Write(*,*) "Type filename of input time domain data file (.csv)"Read(*,'(a)') )GILE\Yrite(*,*) "Type filename for filæred data output (.csv)"Read(*,'(a)') OFILEWrite(*,*) "Type input daø time increment (secs)"Read(*,*) delWriæ(*,*) "Type bottom band pass filter frequency"Read(*,*) botdWrite(*,*) "Type top band pass filter frequency (Displacemens)"Read(*,*) topdOpen(30,file=XFILE,staülrs='old',err= I 10)no=0
CC Here the data array is read from external file )GILE
Do 20 i=I,8read(*,*) TEXTwrite(*,*) TEXT
20 ContinueDo I k=1,16384
Read(30,*,END=2) temP, a(k)ai(k)=a(k)no=noll
I ContinueC
Close(30)2 Continue
n=l3 Continue
If(no.gt.n)thenn=2*ngoto 3
end if
243

APPENDX (A) - Band Pass Filær Forrran Program
C Arrays are augmented with zeros to get a function of 2Do 4 k=noll, n
a(k)=0.0ai(k){.0
4 ContinueC Transform to frequency domain completed giving data(n) array
isign=lcall realft(a,n,isign)Do 5 k=l,n
afdu(k)=¿(ft)5 Continue
C Frequencies are calculatedDo 6 j-l,nl2Freq()=j(n*del)
6 ContinueC Frequency domain data is filæredC acceleration band pass filter frequencies
call genfil(a,freq,n,botd,topd)Do 7 k=l,n
afdf(k)=¿1¡¡7 Continue
C Realft is called to perform the inverseC hansform of the filtered data
isign = -1call realft(a,n,isigrr)Do 8 k=l,ndell(k)del*ka(k)=2*¿1¡¡¡n
8 ContinueC Data ouÞut
Open(35,fiIe=OFILE,stah¡s='new',err= I 20)Write(35,*) "INPUT FILENAME : ",XFILEWriæ(35,9) del
9 Format ('SAMPll RATE USED IS =',F6.3,'seconds')Vfriþ(35, l0) botd, topd
10 Format (tsand pass frlter range',Fí.2,'Hz -'+,F5.2,TI2',)Wriæ(35,*)'"Write(35,+) "FREQIJENCY DOMAIN,,,,,TIME DOMAIN"Write(35, *) "No.,Frequency,Data,Data,,Time,Daa,Daø"Write(35,*) ",,unfilt filt,,,unfilt filt"Write(35, l2) afdu(l),afdf(l ),dell(l ),ai( l),a(l)
l2 Format ('1,0,'¡l 5.3,',',Fl 5.3,',,',F15.3,',',Fl 5.3,',',Fl 5.3)Write(35,13)freq(nl2),afdu(2),af df (2)dell(2),ai(2),a(2)
l3 Format (2,',F15.3,',',F15.3,','"F15.3,',,',F15.3,',',F15.3+,""F11.3)Do 14 k=3,n-1,2
Write(35, I 5) k,frq(H2-l 12),afdu(k),afdf(k),dell(k),ai(k),a(k)Write(35, l5) k+l,freq(lc/2- l/2),afdu(k+l ),afdf(k+l ),dell(k+ I )
+ ,ai(k+l),a(k+l)l5 Format (I4,',',F15.3,',',F15.3,',',F15.3,',,',F15.3,',',F15.3,',
+ ',F15.3)14 Continue
Wriæ1*'*¡ " "Wriæ(*,16) no
16 Format('Number of input data lines =',I10)
244

APPENDD( (A) - Band Pass Filær Fortran Program
Write(*,17) n17 Format('Number of ouþut data lines =',I10)
Write(*,*) "PROGRAM RUN COMPLETED"100 Stopll0 rWrite(*,*) "ERROR OPENING INPUT FILE"105 Stopl20Write(*,*) "ERROR OPENING OUTPUT FILE'
END
SIJBROUTINE genfilt(data,freq,n,bot"top)INTEGER nREAL daø(n), freq(n/2)
C Data in the frequency domain is filteredDo22i=3,¡-1,2
IF (Freq(i2- I /2).LT.bot- 1.0) TmNdata(i)=0.0daø(i+1)=0.0
ELSEIF (keq(l2-I l2).LT.bot-0.5) THENdata(i)=(2.0* (Freq(tl2- U2)-bot+ 1.0) * *2) *data(i)data(i+l )=(2.0*(Freq(i/2- l/2)-bot+1.0)**2)*data(i+1)
ELSEIF (Freq(tl2-I lZ).LT.bot) TI{ENd ata(i)=((-2.0* (Fteq(il2- I l2)-boÐ * *2)+ I )*data(Ðdata(i+ I )=((-2.O*(Freq(i/2 - | l2)-bot)**2)+ I )*data(i+l )
ELSEIF (Frcq(il2-l lL).LT.top) TmNdata(i)=data(i)data(i+1)dara(i+1)
ELSEIF (Fteq(rl2-l l2).LT.top+0.5) TIIENdata(i)=((-2.0*(Frcq(rl2- I l2)-top)**2)+1 )*data(Ðdata(i+ I )=((- 2.0* (Freq(il2- I 12) -top)**2)+ 1 )
*data(i+ I )ELSEIF (Freq(ú2-l l2)IT.topr 1.0) TIIEN
data(i)=(2.0* (Frcqbfz- il2)-toÞ 1.0)* *2)*data(i)data(i+l )=(2.0*(Freq(i/2- 1/2)+op- 1.0)**2)*data(i+l )
ELSEdata(i)=0.0data(i+l)=0.0
ENDIFData(l)=0.0Data(2){.0
22 ContinueEND
245

APPENDD( (A) - Band Pass Filter Fortran Program
SUBROUTINE realf(daø,n,isþ)INTEGER isign,nREAL data(n)
CU USES fourlINTEGER i,it,i2,i3,i4,n2p3REAL cl,c2,hli,hlr,h2i,h2r,wis,wrsDOUBTE PRECISION theta,wi,\4,pi,r4,pr,wr,wremprhera=3. 1 4 I 5 9 265 3 5897 93 dO/dble(n/2)c1{.5if (isign.eq.l) then
c2=-0.5call four I (daø,n12,+ l)
elsec2=0.5theta=-theta
endifwpr=-2.0d0*sin(O.5d0*the6)* *fwpi=sin(theta)wr=l.OdGrwprwi=wpin2p3=n+3do ll i=2,n14i1=2*i-1i2=il+1i3=n2p3-i2i4=i3+1wfs=sngl(wr)wis=sngl(wi)h lr+ I *(dara(i1 Þdata(i3))h 1 i+ I *(data(i2)-data(i4))h2r =- c2* (data(i2lrd ata(i4 ) )h2i<,2+ (daø(i I )- data(i3 ))data(i I )=h I r+wrs *h2r-wis *h2idata(i2)=h I i+wrs*h2i+wis *h2rdata(i3 )=h I r-wrs *h2r+wis *h2idata(i4)=-h I i+wrs*h2i+wis*h2rwtÊmP=wrwewr*wpr-wi*wpi+wrwi=wi*wpr+wtemp *wpi+wi
1l continueif (isign.eq.l) thenhlrdaa(l)data(l)=hlr+data(2)data(2)=hl¡-¿¿¡¿12¡
elsehlrdaø(1)data( I )=c I *(h lr+daa(2))daø(2)=c I *(h lr-daø(2))call four I (data,nn,- l)
endiffeturnEND
C (C) Copr. 1986-92 Numerical Recþs Softn'are 5lP.
246
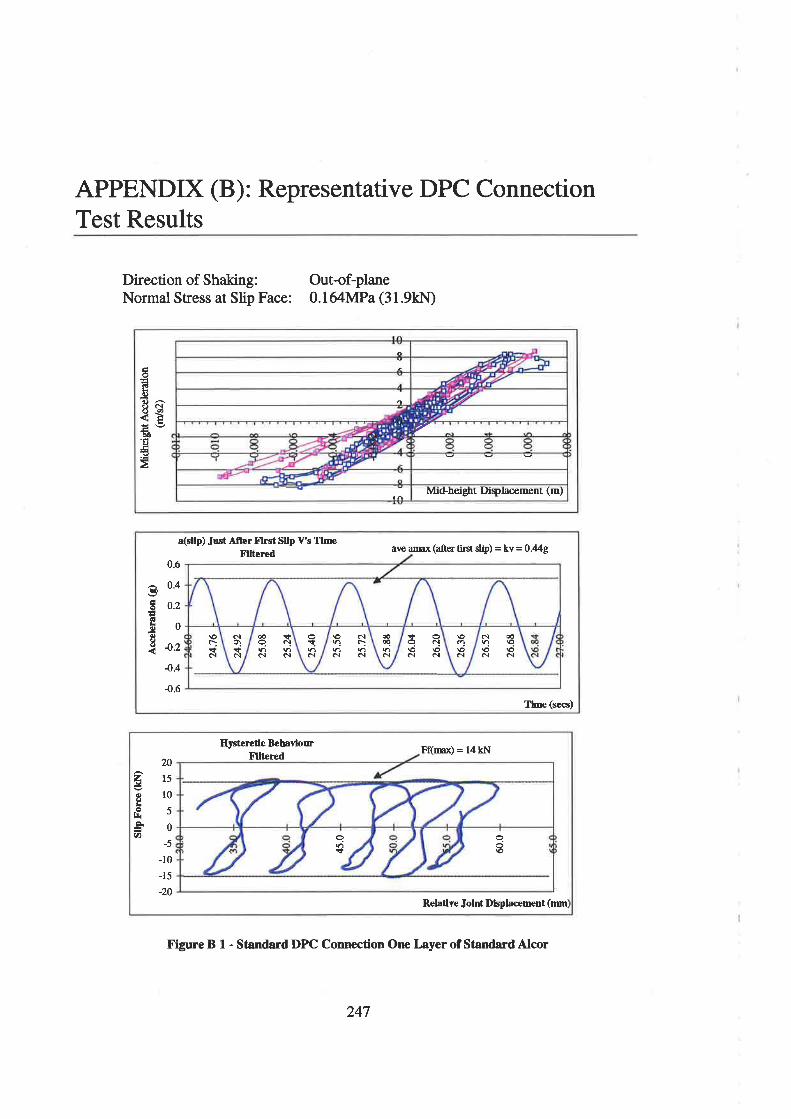
APPENDX (B): Representative DPC ConnectionTest Results
Direction of Shaking:Normal Stress at Slip Face:
Out-of-plane0.164MPa (31.9k1.I)
o'EÉoEaåÉÞoo€=
v
MiGheigÞt Dirylacement (m)
a(slÞ) Jûst Añer Flrst S[p Ys TlmeFlftcrcd ave amax (after first slþ) = kv = Q.{.{g
ào
EOoE
0.ó
0.4
0.2
0
4.2
4.4
4.6Ilme (secs)
æoq
ôl+cl
clq{Næ\}oo¡r; ç;o¡êì
\o clnìô.¡ ô¡
çôON\o\C'ô¡ ôl
\oa\oôl
ô¡æqì9\o \ool ôl
\oIçd
Figure B I - Stândsrd DPC Connection One Layer of Standard Alcor
qÉ
eo\o
Hystercdc Bebavlourf,Ilte¡ed Ff(mx) = 14kì¡
Rebtlve Jolnt Dbpl¡cement (mm)
20
215gËt0o<f¡.åoçt)
-5
-10
-15:20
247
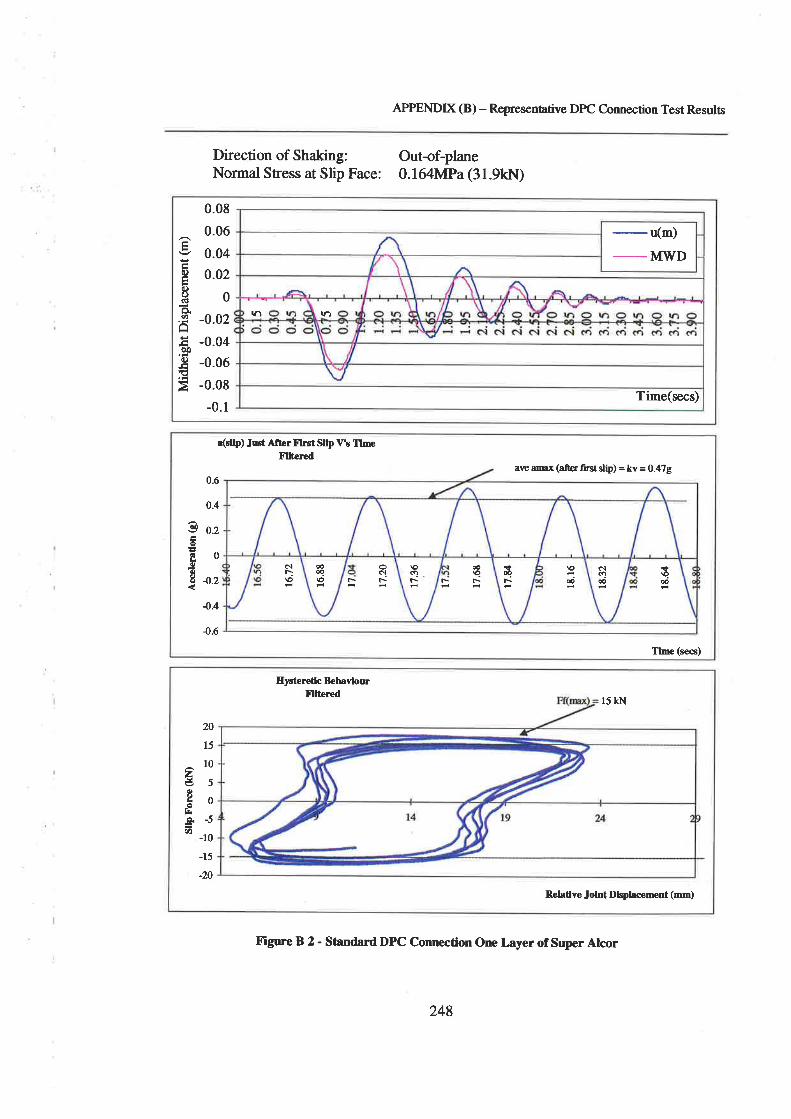
APPENDD( (B) - Representative DPC Connection Test Resuks
Direction of Shaking:Normal Stress at Slip Face:
Outof-plane0.164MPa (31.9kN)
aÉc)E6)C)GI
Èøâè0c)rtà
0.08
0.06
0.04
0.02
0
-0.02
-0.04-0.06-0.08
-0.1
- u(m)
MWD
rô ìn
Time(secs)
¡(sllp) Jûst After Flrst Slp V'r TlmeIlltcrcd
ave amax (afr€r 6rs¡ sùp) = kv - 0.a7g0.ó
0.4
e o.zêEooE
0
4.2
4.4
{.6Thc (secs)
ú09€
þdìrN(ìæ
æIFF-
úñ\o(' Ëæ
êl\\o oc!rr
Eysteredc BehavlourFllt¿rcd
15 kN
Rehlve Jol¡t Dbplacement (mm)
20
15
102é5o!olzo-5ô
_10
-15
:20
Figure B 2 - Ståndard DPC Connection One Layer of Super Alcor
248

APPENDD( (B) - Representative DPIC Connection Test Results
Direction of Shaking:Normal Stress at Slip Face:
Out-of-plane0.164MPa (31.9k1Ð
Absolute DlsplacerentsBebwC.mnectim
tAboveCm€ctionFirst slip bas ocorcd at ll.7
socs
50,10
î30;20oEr0oËoÉlX -lo
-20
-30
40
Thc (secs)
æ!i \oo\ \oY;ó
æIçq
a(slþ) Jus .lfter trlrst Sllp Y's TlmeItttercd ave amx (after frst sùp) = kv - 0.37g
eéêfooI
0.5
040.3
o.2
0.1
0
4.34.4{.5
The (secs)
Eystereüc BehavlourIllte¡ed
Ff(mx) = 12UV
zëoqê
f¡(Êì.
aÀ
Relalve Jolnt Dþlacement (mn)
Figure B 3 - Standard DPC Connection One Layer of Polyfiash
249
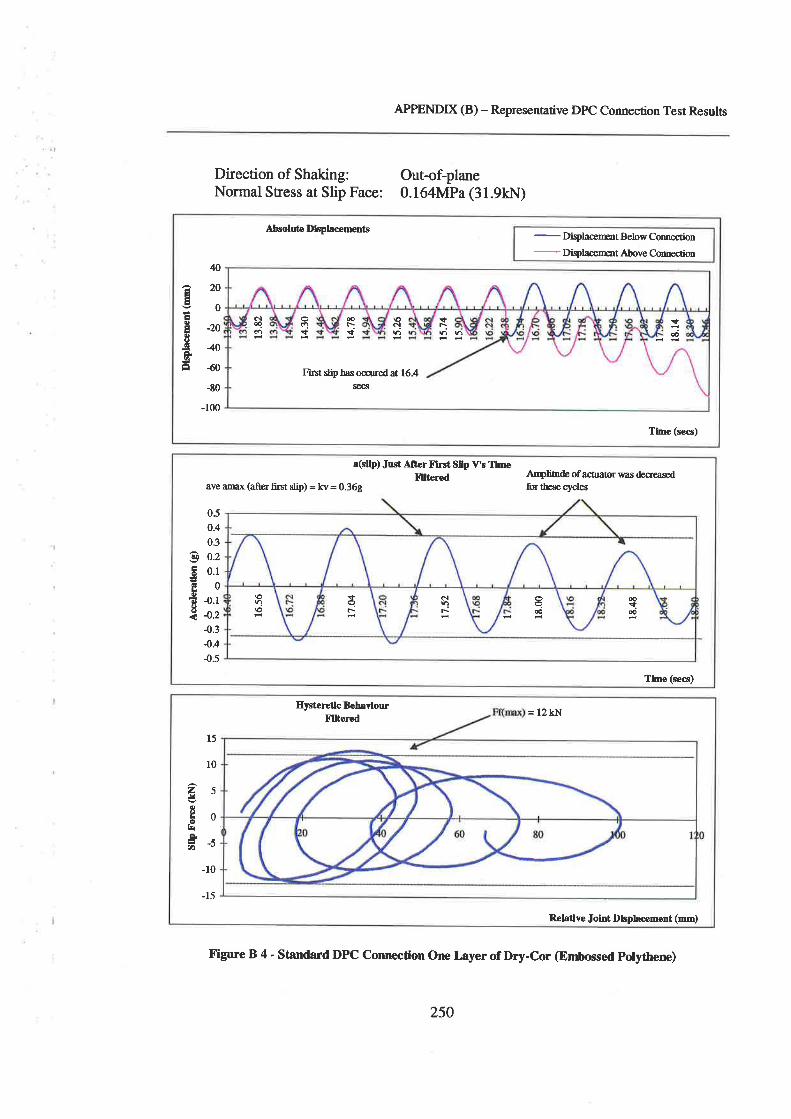
APPENDD( (B) - Represenrarive DPC Connection Test Results
Direction of Shaking:Normal Stess at Slip Face:
Out-of-plane0.164MPa (31.9k1Ð
Abeoluúe ltlsplacementstBelowCo¡neciolt Above Connection
qâ20€oËÊ -zooa940-ãâ{0
{0-100
Tlme (secs)
tct
æ\Éô¡eó
First slip has ooored at 16.4
o6)*\oq
socs
tI
a(slþ) Just mer X'lrct S[p Y's llmeIlltercd
ave arnx (afrer first slip) = þy - 9.36*Aryliur& of actntor c¡as d€€r€asdfu these cycles
19ê
Eo
r
0.5
0.40.3
0.20.1
0{.14.2{.34.44.5
llme (secs)
ët- g€
ô¡nræIÉ
€!.1\o
E¡rtereüc BebavlourIlltered = 12kN
l5
10
z5,¡a
oÊnfaÈ=-5cÀ
-10
-15
Rehüve Jolnt Dþlacement (mm)
Figure B 4 - standard DPC connection one Layer of Dry-cor (Embossed polythene)
250
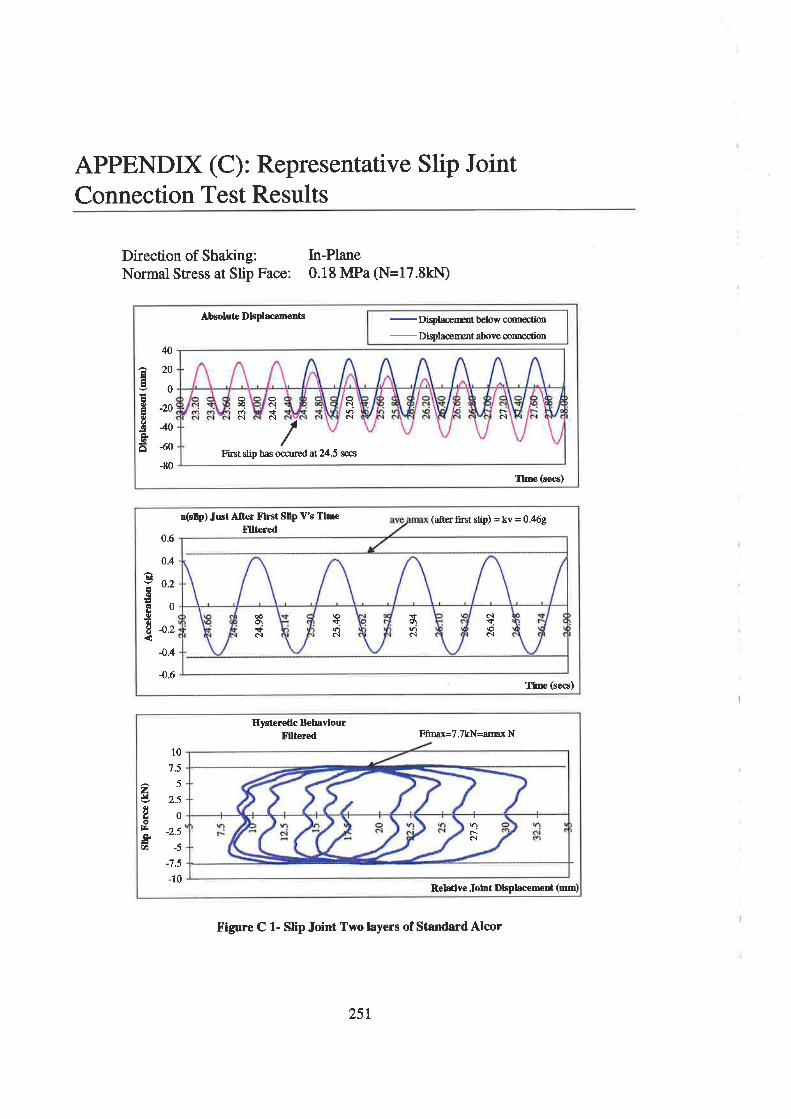
APPENDIX (C): Representative Slip JointConnection Test Results
Direction of Shaking:Normal Stress at Slip Face:
In-Plane0.18 MPa (N=17.81ò[)
Absolute Dlsplacements tbelow cmnection
aboveænædion40
à20goÉ
Ê¿o340Êt
ã60-80
I¡me (secs)
First slip bas ocqrcd at 24.5 secs
c-dæ
ôl
ocì*NoclN
/
a(sllp) Jost Aftcr trlrst Sllp Y's TlreX'lltered
(aft€r first slip) = kv = 0.,169
3É
EOoE
0.6
o.4
0.2
0
4.2
4.4
4.6Tlme (secs)
c¡a\ocì
\f,o\c;cl
\otl(;c¡
æqscì
Hystereüc Bebavlourtr'lltered Ftuax=7.7kN=amax N
Rel¡lve Jotnt Dbpl¡cement (mm)
10
7.5
5zé 2.soËoèI -r(É!çt -5
:7.5
_10
nrN
Figure C 1- Slip Joint Two layers of Standard Alcor
25t
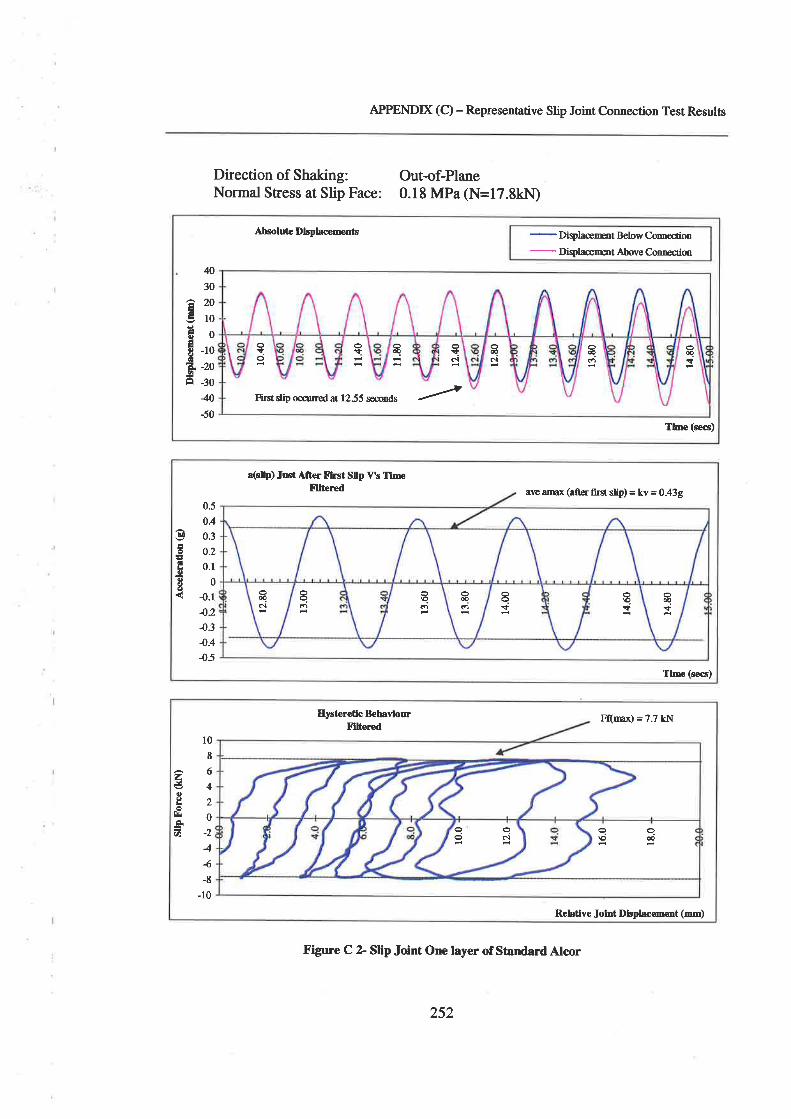
APPENDD( (C) - Representative Slip Joint Connection Test Results
Direction of Shaking:Normal Stress at Slip Face:
Out-of-Plane0.18 MPa (N=17.8k19
Figure C 2 Slip Jt¡int One layer of Standard Alcor
Absolute Dþlæements tBelowComectimtAboveCmrection
40
30
Ãn€roËoE -tott
È -20Ê -30
40-50
the (cccs)
First stip oq¡¡red at 1255 smnds I
ooq oeo
ofo it o!tñoeN
o09t
s(slþ) Ju6t After Ftrst Sllp V's TlmeFtlt€r€d ave amx (afrer firs slip) - kv - 0.439
úEÀo6ooE
0.5
040.3
0.20.r
0
4.14.2{.34.44.5
Ilme (secs)
æÕ¡
e oIoooge Eç
o\os û\f
o ccl ee\oæ
Hystercdc BehavlourXïltercd
F(mx) = 7.7 kll
Relaüve Jol¡t Dbplacement (rm)
10
8
Ãzé4o?,2oþ_v(À :¿
44-8
_10
252
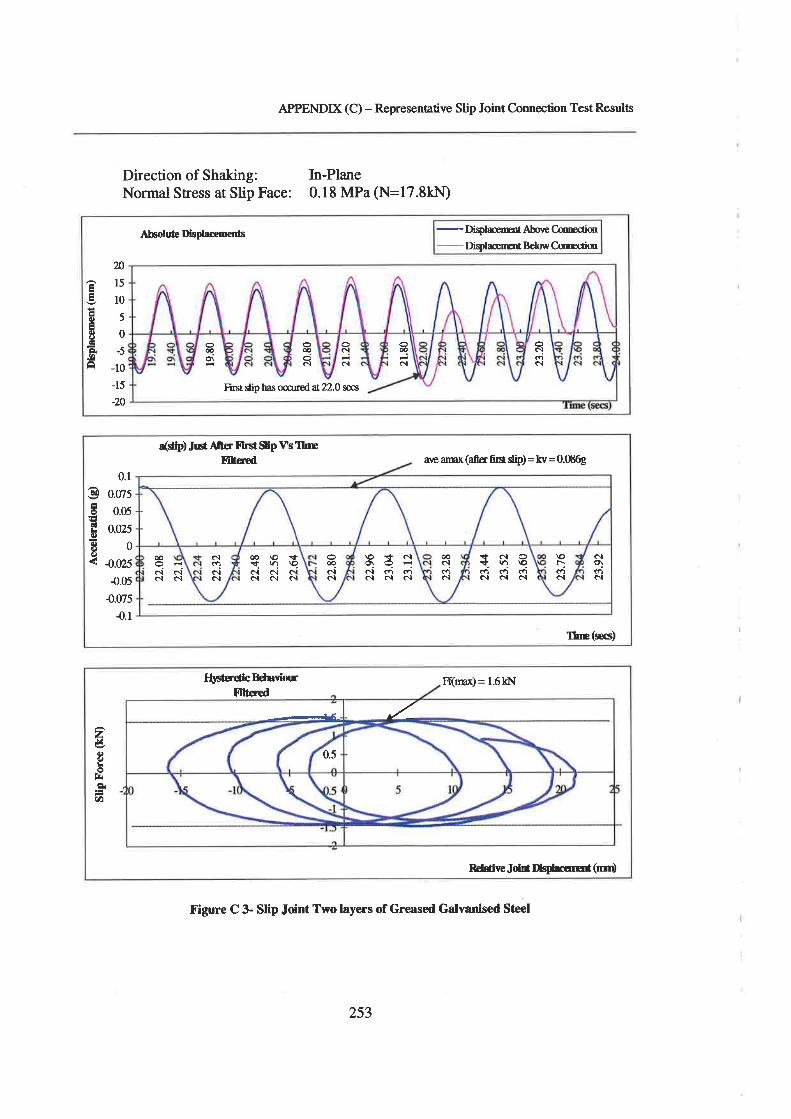
zv oË'
IJO ÞÉ
.a9 ãs 8u
)E
lrz
t î.
t,oa
¡I1 "
Þ ô eFÉ |! fll z U X o I F o E (l a o Þ r, o v) Þ o Þ ô o E
I Þ ô () q, o ¡l o q F ô 2 ø
æE <g ¡úo sl z il -¡ 'æ tl z
20.8
0
21.2
0
21.8
0
ll a I E Èt e g FI 8. É N)
!..) fi
19.8
0
23.2
0
g = EL 6 I 6 E È o ã ô
Dis
plac
emen
t (m
m)
8üåü
ot,ä
tts
I YY
,84
gH EE FT 88 åB 98
â, €, n Þ EI
Fø &l g E ø c ri
ä Þ E ð q Elì ø ø I il ã' il F
(Ð I Sp
Acc
eler
adon
Ò^Þ
e^
95bì
5 ñõ
Hu(
fr(¡O
liu
È ¡l rÉ g
23.7
6
22.3
2
22.8
0
23.2
8
22.9
6
23.0
4
23.1
2
23.4
4
23.5
2
23.6
0
23.9
2
22.4
8
22.5
6
22.6
4
22.0
8
22.1
\
lJr
äãR E
F 1 I t B ð il b, E,
Sltp
For
ce ft
N)
E å 6 g I * Ë E E * I {9
rtt m \ ô o (¡ a v) E tr 9. È d o Þ ô ã q o o ã ô Þ ø (! À o Ë È a ô È v) .D aà
N)
L,I (,
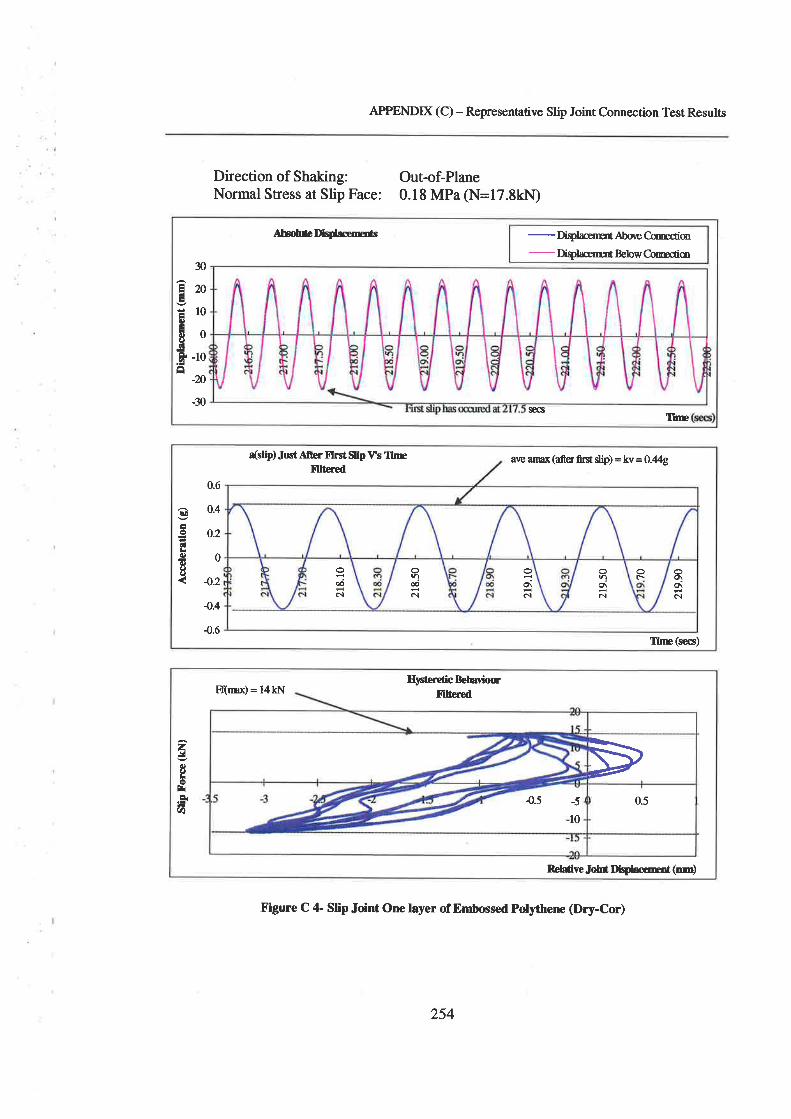
APPENDD( (C) - Representative Slip Joint Connection Test Results
Direction of Shaking:Normal Stress at Slip Face:
Out-of-Plane0.18 MPa (N=17.8kN)
AhohcDl$æm r{boræCæcimBehn,Crrecio
30
ÉnË106)
EUð.â -10â -n
-30 sqt Th
{slip) Jr¡st After flrst Sllp \Is llræfflter€d
aæ amax (aftef frst dip) = kv = Q.{,{g
èo
E
olc)d)è¡(,)
0.6
0.4
0.2
0
4.2
{.4
4.6Ilnrc (secs)
o(ic¡
nûN
ooiôl
F-.no\ôl
Eo\c.l
ryrmx)=14k|¡HysferUflcBehvirur
Illtcred
2!û)IEê?Èv)
Reldive Joiú Dþhernt (m)
-5
l0{.5 0.5
Figure C 4- Slip Joint Orrc layer of Embossed Polythene (Dry-Cor)
254
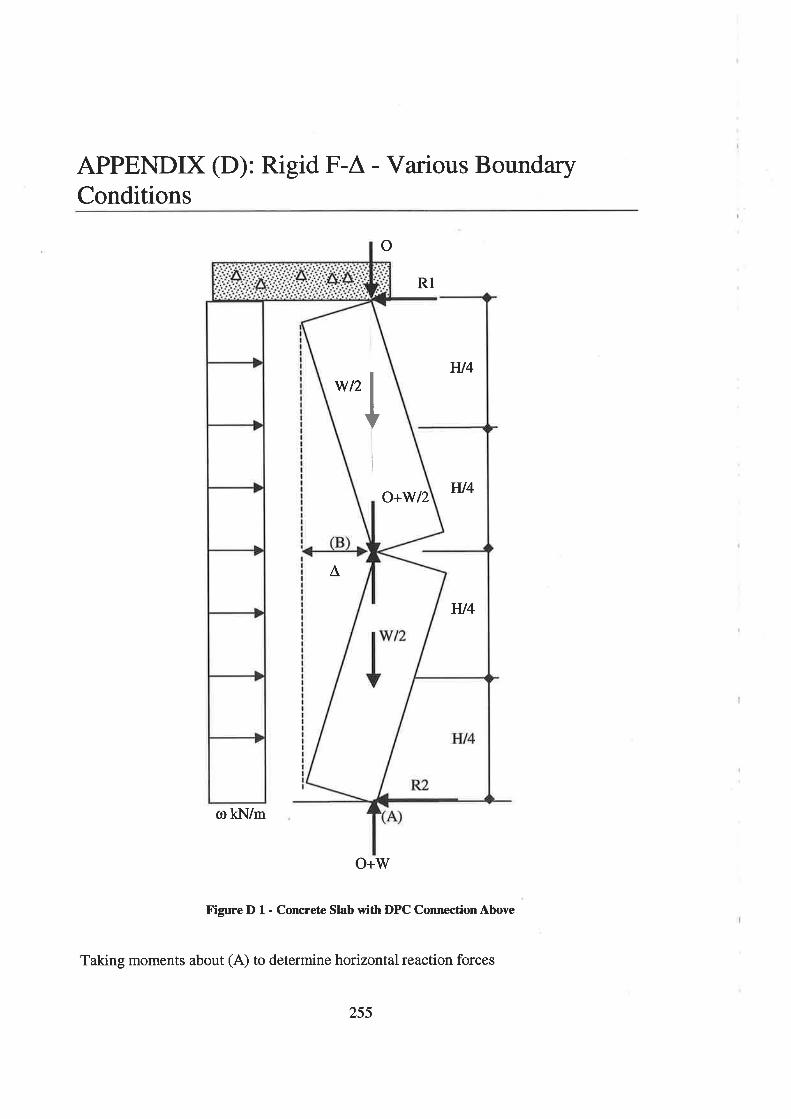
APPENDIX (D): Rigid F-A - Various BoundaryConditions
o
R1
Ht4
w4
w4
co kN/m
O+W
Figure D 1 - Concrete Slab with DPC Connection Above
Taking moments about (A) to determine horizontal reaction forces
^
w12
IO+W12
255

APPENDX (D) - Rigid P-Á - Va¡ious Top C-onnection Types
o=ùh -wlr-Al-^"02 [2 2) ¿
R" =ry-Yú-¡)'22h')
n, =4*w lr-¡)'22h"Taking moments about (B) top free body
Rearranging
08
Maximum resistance occurs when Å=0
ah2 o(, - t)+\(t i) :(i -*n- ^,
,=#(o.T\,.o,
8rf'^* = lrll
w2
O+
)
\ryith the rigid body assumption static instability occurs at a mid height displacement
which causes the mid height reaction to move outside of the thickness of the wall. At this
point or=0
O+ w2
Rearranging
^
o+Y2 _T
o+Y2
t -Âr^)
,ß
256
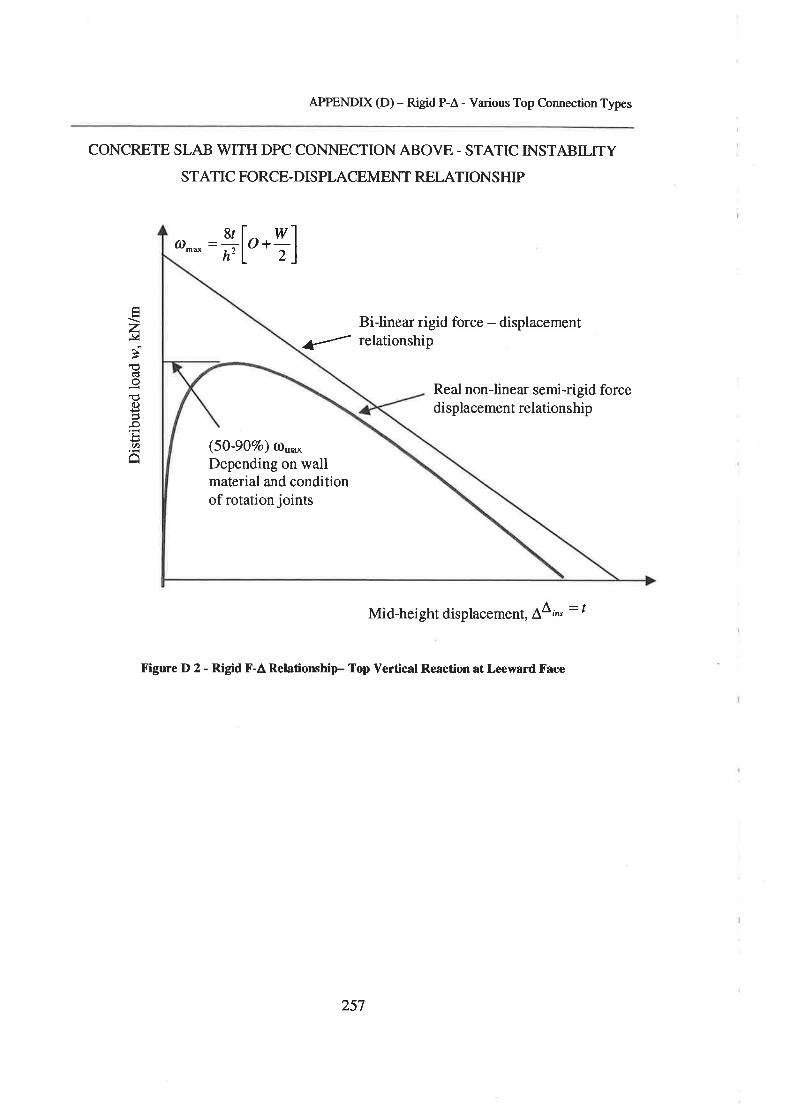
APPENDX (D)- Rigid P-Å - Various Top Connection Types
CONCRETE SLAB \ryITH DPC CONNECTION ABOVE - STATIC INSTABILITY
STATIC FORCE-DISPLACEMENT RELATIONSHIP
8ra^ =f, w2
O+
zJ¿
!(goے)P
=-o¡r(t)
â
Bi-linea¡ rigid force - displacement
{ relationship
Real non-linear semi-rigid forcedisplacement relationship
Mid-height displacement, ÂAi^ = f
Figure D 2 - Rigid F-A Relationship Top Vertical Reaction at Leeward Face
(50-907o) ro"-.Depending on wallmaterial and conditionof rotation joints
257
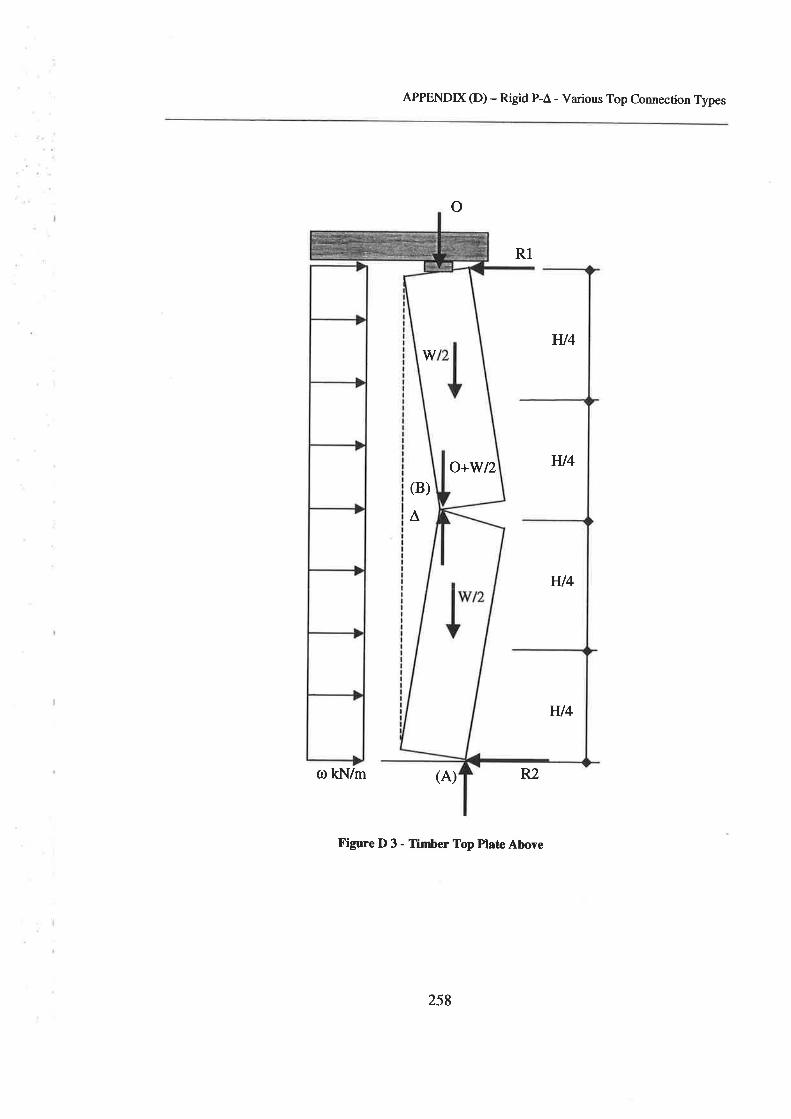
APPENDX (D)- Rigid P-Å - Various Top Connection Types
o
R1
ol kN/m (A) R2
Figure D 3 - Tlmber Top Plate Above
)(B
^
w4
Hl4
w4
Hl4
O+W12
w
258
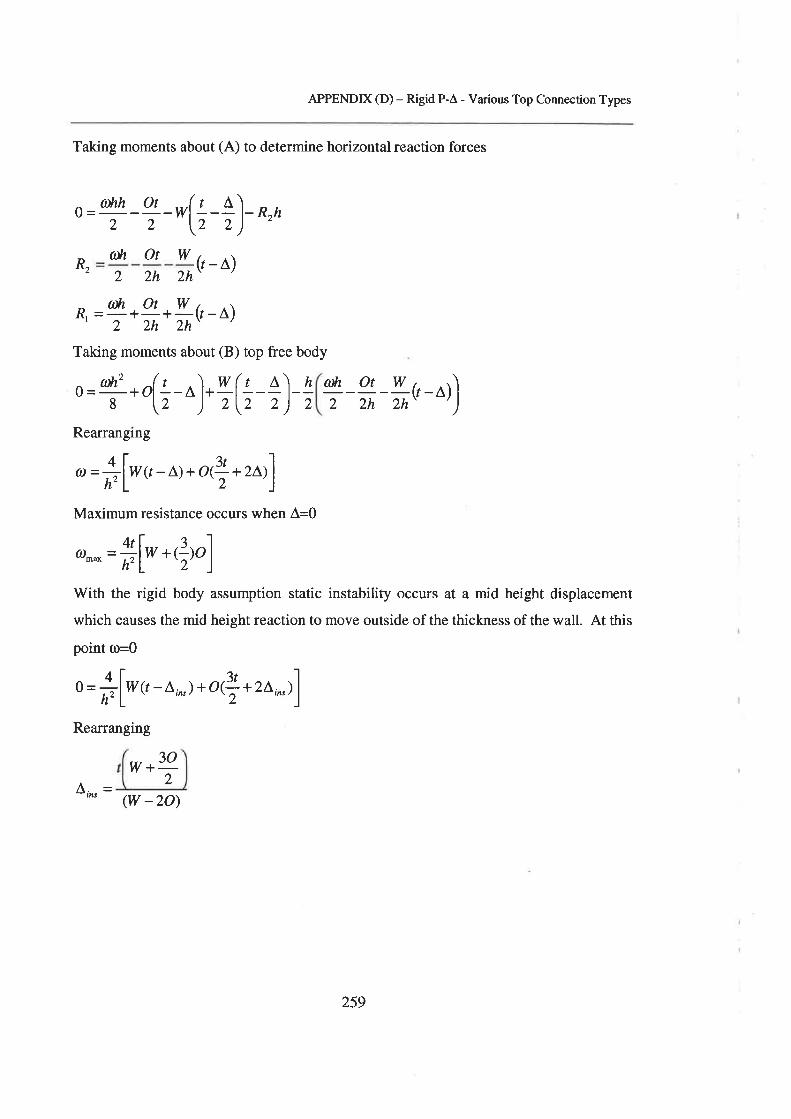
APPENDX (D) - Rigid P-A - Various Top Connection Types
Taking moments about (A) to determine horizontal reaction forces
o=ùh -o' -w22(Ðlt Ot W
(i-+)-.*R2
À1
(r-¡)2 2h2h(Dh Ot W, .\=_+_+_(r_^,12 2h 2h'
Taking moments about (B) top free body
o = @h2 * o( !-- ol*{11 - Al-¿8 [2 ) 212 2) 2
Rearranging
,=þl*r'-^) +o(T+2^)]
Maximum resistance occurs when A=0
eth _Ot _W2 2h2h (r-¡)
0-* =#l*.,},ofWith the rigid body assumption static instability occurs at a mid height displacement
which causes the mid height reaction to move outside of the thickness of the wall. At this
point co=O
o = þl*rt - L,^) + o(T+ za,^ l]
Rearranging
w+92Â,^ = (w -2o)
259
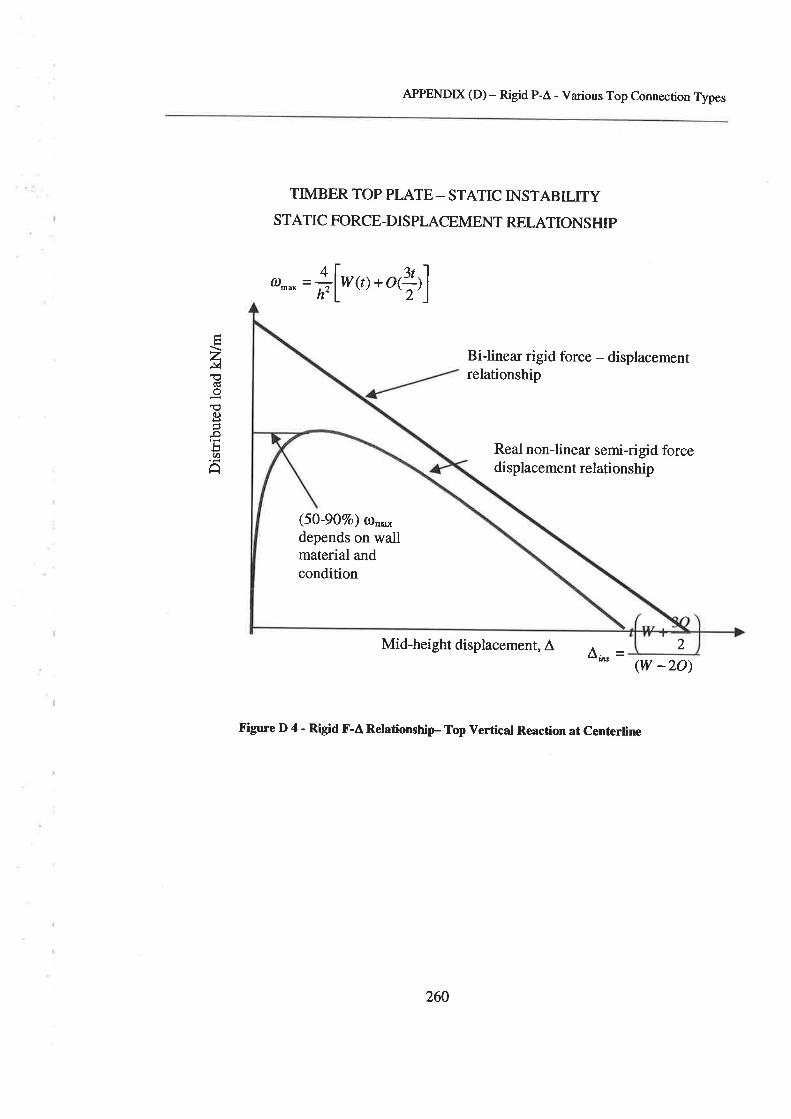
APPENDD( (D) - Rigid P-Â - Various Top Connection T¡res
TMBER TOP PLATE - STATIC INSTABILITYSTATIC FORCE-DISPLACEMENT RELATIONSHIP
@-* = #lrur,.orT',f
z.\4€(!o€c)
-oE.t)A
Bi-linea¡ rigid force - displacementrelationship
Real non-linear semi-rigid forcedi splacement relationship
(w -2o)Mid-height displacement, Â
^ IA
Figure D 4 - Rigid F-a Relationship Top vertical Reaction at centerline
(50-907o) ol,,--depends on wallmaterial andcondition
2
260
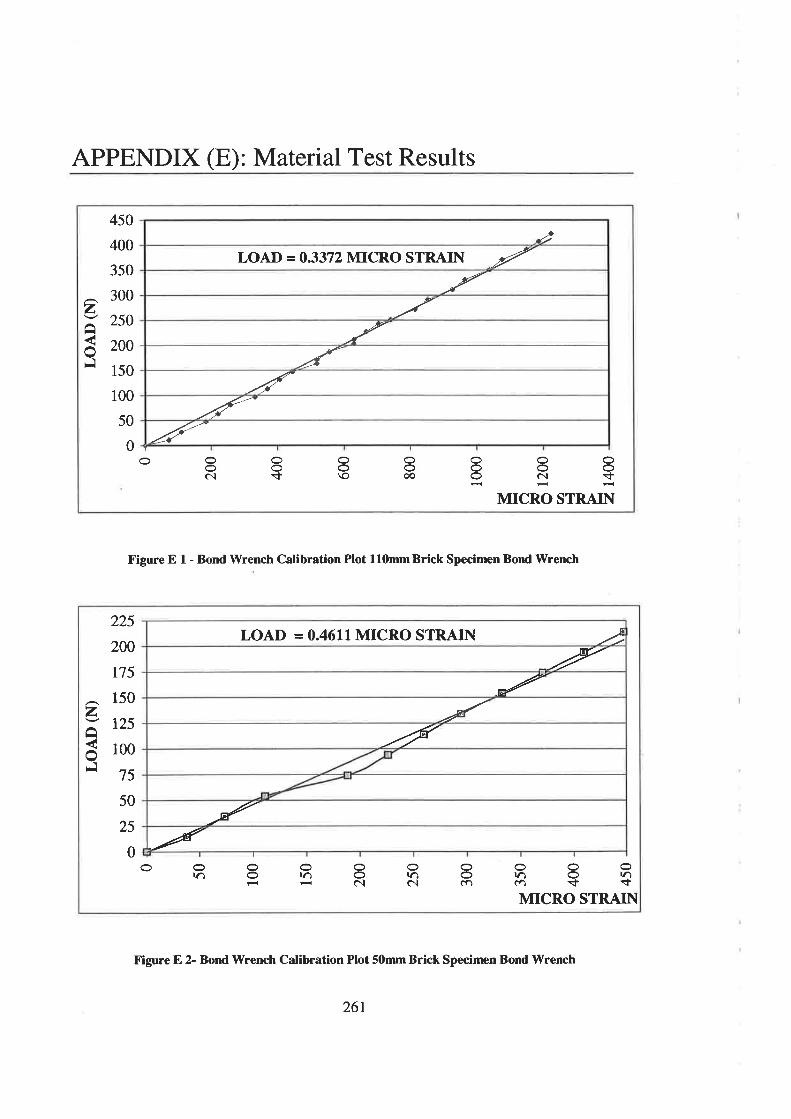
APPENDIX (E): Material Test Results
zâoFl
450
400
350
300
250
200
150
100
50
0OOOOOOOoooooÕoc.ìs\ooooc.ì$
MICRO STRAIN
aJ't
LOAD = 0.3372 MICRO STRAIN /-r_{
/S/f/'
á'
Figure E I - Bond \ilrench Calibration Plot 110mm Brick Specinren Bond \ilrench
Figure E 2- Bond Wrench Calibration Plot 50mmBrick Specimen Bond Wrench
z
225
200
175
150
125
100
75
50
25
0
âoÈ
OOOOOOOOO\nOl.)O\nO\nOlnri Ê C.ì C.ì C.¡ C.¡ É sl'MICRO STRAIN
LOAD -- 0.46II MICRO STRAIN -¿å
áÃ
-tF
4/F
261
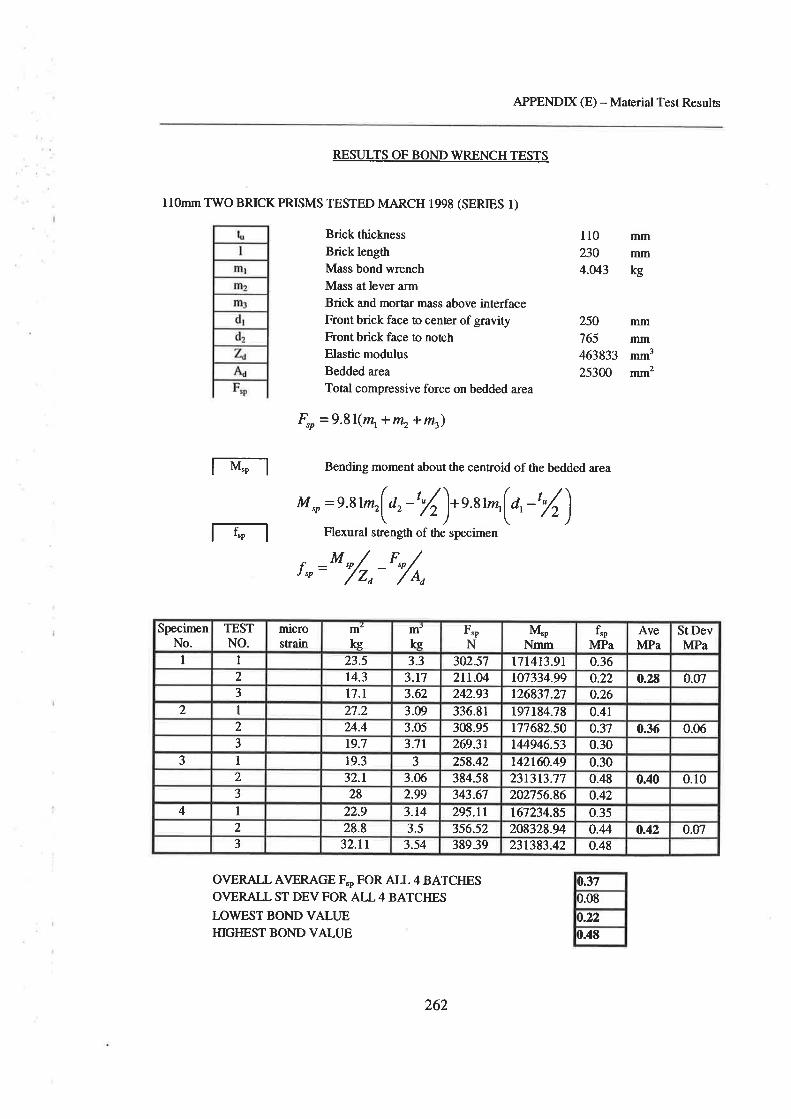
APPENDD( (E) - Maærial Test Results
RESULTS OF BOND WRENCH TESTS
llOmm TwO BRICK PRISMS TESTED MARCH 1998 (SERIES l)
Brick thickressBrick lengthMass bond wrenchMass at lever armBrick and mortar mass above interfaceFront brick face to center of gravityFront brick face to notchElastic modulusBedded a¡eaTotal compressive force on bedded area
F"o =9.81(m"r+ fth+ %)
ll02304.043
2s300
mmmmkg
mmmm
1Illm-mm2
250't65
463833
lT;l Bending moment about rhe cenrroid of the bedded a¡ea
trt
oVERALL AVERAGE F.p FOR N-r- 4 BATCI{ESOVERALL ST DEV FOR ALL 4 BATCITESLOWEST BOND VALI.JEHIG}IEST BOND VALI.]E
¡rI "r =o.zw,(a,-'/)*n tt^(a,-'ú)
Flexural sEength of the specimen
f*=*'/o-'"ú,
0.37D.08
0.220.48
SpecimenNo.
TESTNO.
IIucrostrain
m"kg
m"ke
fspN
MPNmm
f"pMPa
AveMPa
StDevMPa
I I 23.5 3.3 302.57 t7t4t3.9t 0.362 14.3 3.17 ztt.o4 to't334.99 0.22 0.28 0.073 17.t 3.62 242.93 126837.27 o.26
2 I 27.2 3.09 336.81 t97184.78 0.412 24.4 3.05 308.95 177682.50 o.37 0.36 0.063 19.7 3.11 269.31 1M946.53 0.30
3 I 19.3 3 258.42 t42160.49 0.302 32.1 3.06 384.58 231313.77 0.48 0.40 0.103 28 2.99 343.67 202756.86 o.42
4 I 22.9 3.14 295.|t 167234.85 0.3s2 28.8 3.5 356.52 208328.94 0.44 o.42 o.o73 32.1t 3.54 389.39 231383.42 0.48
262
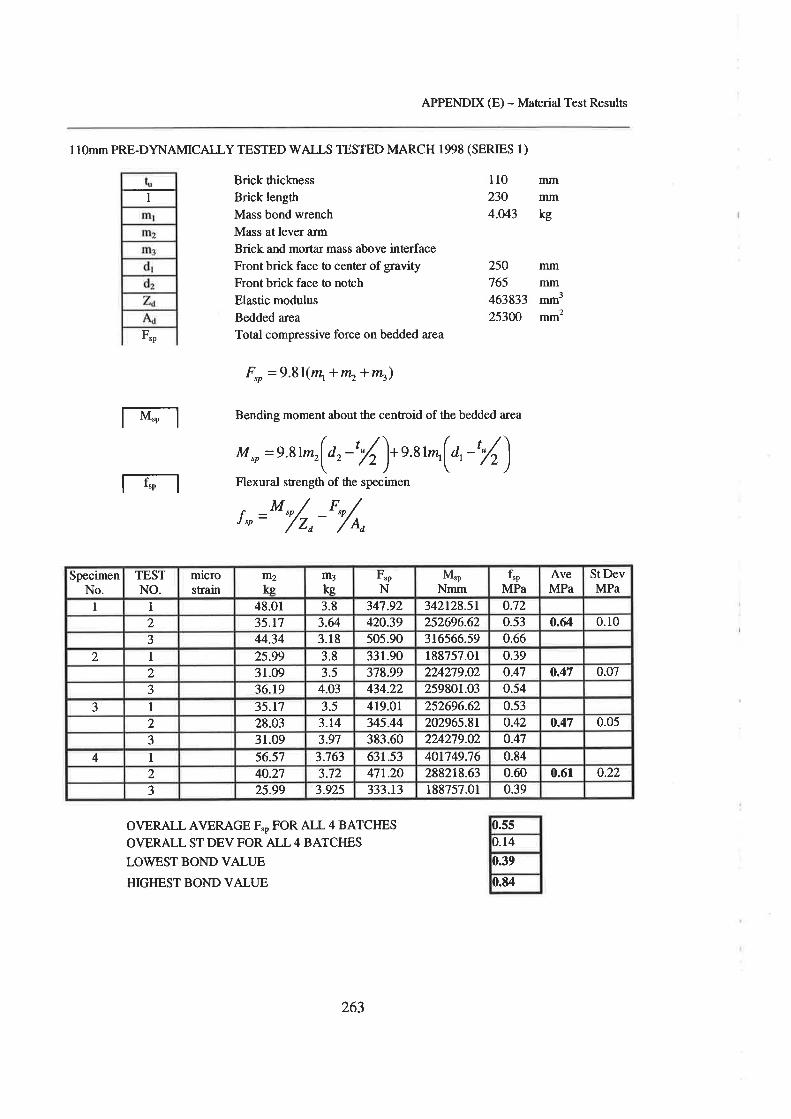
APPENDD( (E) - Maærial TestResults
l10mm PRE-DYNAMICALLY TESTED WALLS TESTED MARCH 1998 (SERIES 1)
I1102304.M3
2$AOfsp
F"o =9.81(mr+ nb+m!)
lT;l Bending moment about the centroid of the bedded a¡ea
Brick thickressBrick lengthMass bond wrenchMass at lever armBrick and mortar mass above inærfaceFront brick face to center of gravþFront brick face to notchElastic modulusBedded areaTotal compressive force on bedded area
250765
Illmmtnkg
mmmm
1mm-mm'
463833
M,p = ssm,(a, -' ú). o .z rrn,(a, -' ú)lTl Flexural süength of the specimen
Í,0=M'/,0-F"o//Ao
SpecimenNo.
TESTNO.
microsÍain
m2ke
lll3ke
FspN
[rfspNmm
fPMPa
AveMPa
St DevMPa
I I 48.01 3.8 347.92 342128.51 0.722 35.17 3.64 420.39 252696.62 0.53 o.g 0.103 44.34 3.18 505.90 316566.59 0.66
2 1 25.99 3.8 331.90 188757.01 0.392 31.09 3.5 378.99 224279.02 0.47 0.47 0.073 36.19 4.O3 434.22 259801.03 0.54
3 I 35.t',l 3.5 419.01 252696.62 0.532 28.03 3.t4 345.44 202965.81 o.42 0.47 0.053 31.09 3.97 383.60 224279.02 o.47
4 I 56.57 3.763 631.53 401749.76 0.842 40.27 3.72 471.20 288218.63 0.60 0.6r 0.223 25.99 3.925 333.r3 188757.01 0.39
OVERALL AVERAGE F"P FOR ALL 4 BATCIIESOVERALL ST DEV FOR ALL 4 BATCTIES
LOWEST BOND VALUEHIGIIEST BOND VALI]E
0.550.14
0.39
D.E4
263
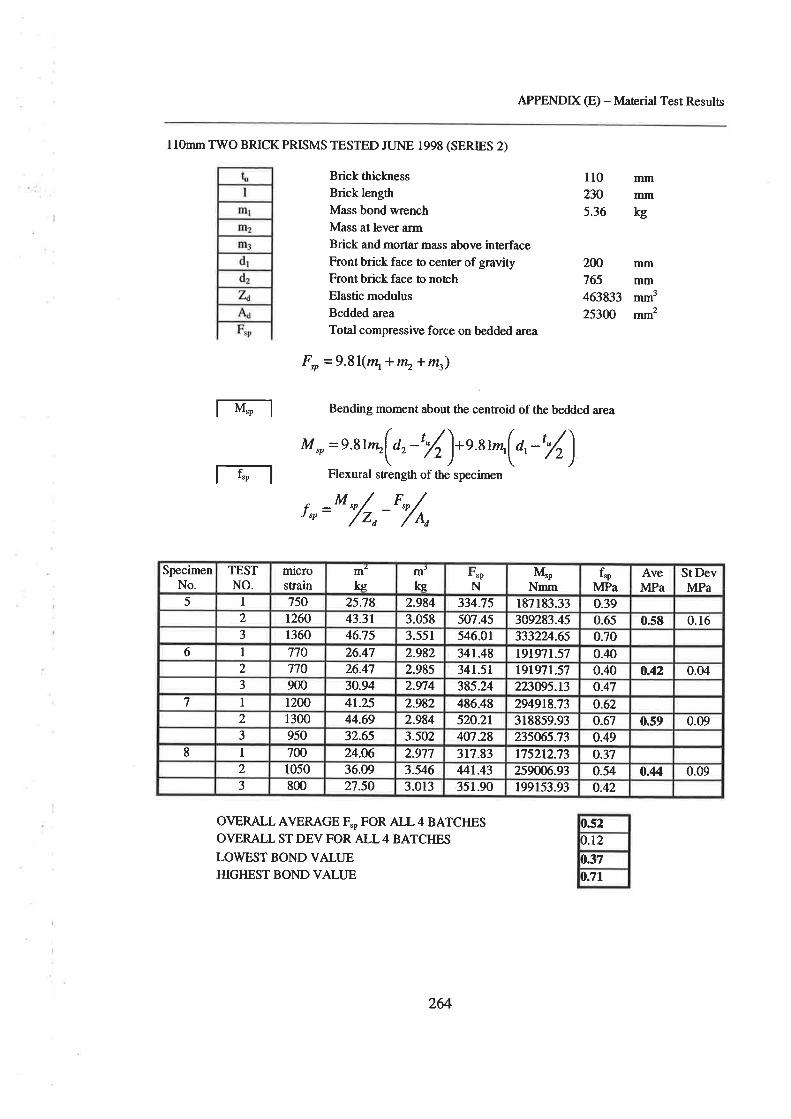
APPENDX (E) - Material Tesr Results
l lOmm TWO BRICK PRISMS TESTED JUNE 1998 (SERIES 2)
Brick thicknessBrick lengthMass bond wrenchMass at lever armBrick and mofar mass above interfaceFrontbrick face to center ofgravityFront brick face to notchElastic modulusBedded areaTotal compressive force on bedded a¡ea
F"r=9.9I(mr+m2+m3)
1102305.36
25300
0.52J.t2ù.37D.7t
fllmfltmkg
mmflrmmm'mm2
2W765463833
li4-;l Bending moment about the centroid of the bedded area
t-_l Flexural strength of the specimen
¡'I "r =o.um,(a,-'/)*, tt (0,-'ú)
r,o=*'/,0-''/n
OVERALL AVERAGE F,P FOR ALL 4 BATC}IESOVERALL STDEV FOR ALL4 BATCI{ESLO\ryESTBOND VALI.JEHIGITEST BOND VALI]E
SpecimenNo.
TESTNO.
nucfosEain
m"kq
m'ke
FspN
MpNmm
fPMPa
AveMPa
StDevMPa
5 I 750 25.78 2.984 334.75 187183.33 0.392 1260 43.31 3.058 507.45 309283.45 0.65 0.s8 0.163 1360 46.75 3.551 546.01 333224.65 o.70
6 I 770 26.47 2.982 341.48 t9r9'n.57 0.402 770 26.47 2.985 341.51 191971.57 0.40 0.42 0.oÍ3 900 30.94 2.974 385.24 223095-13 o.47
7 I t200 41.2s 2.982 486.48 294918.73 o.62) 1300 44.69 2.984 520.21 318859.93 o.67 0.59 0.093 950 32.65 35W 407.28 23565.73 o.49
8 I 700 24.06 2.977 317.83 175212.73 o.372 1050 36.09 3.546 ut.43 259m6..93 0.54 0.44 0.093 800 27.50 3.013 351.90 199153.93 o.42
264
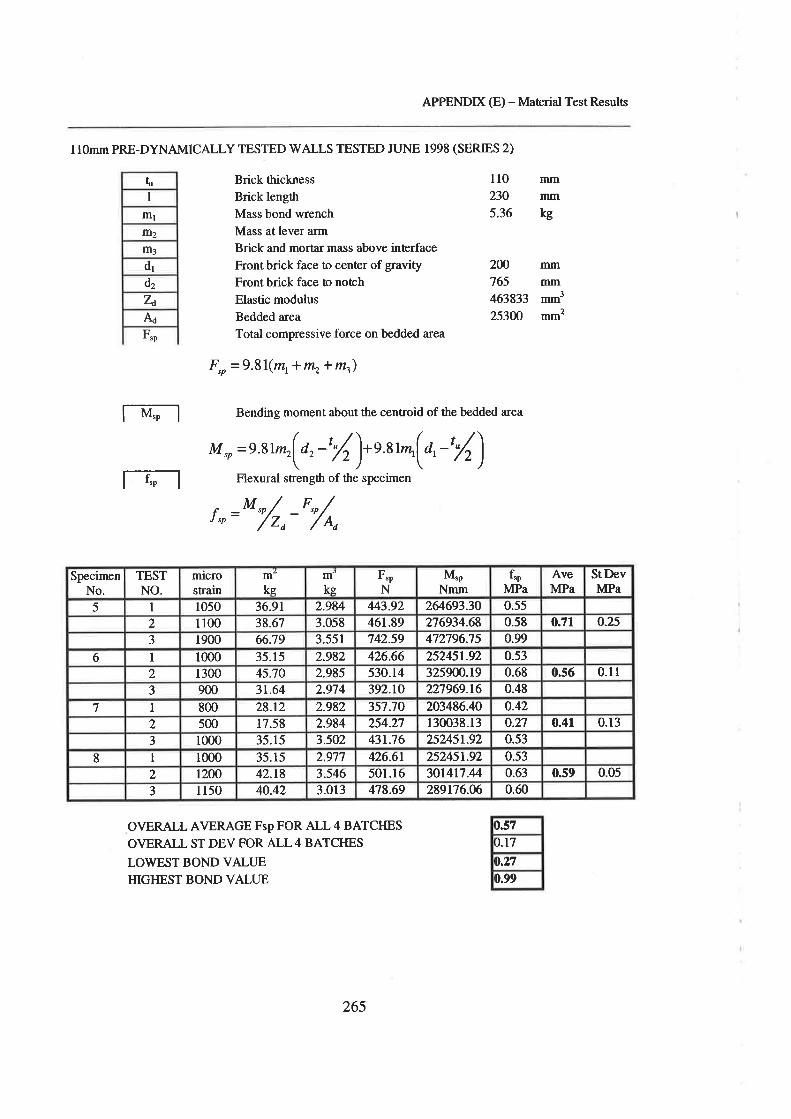
APPENDD( (E) - Material Test Results
tI
lIlllll2IIì3
drdz
Z¿
A'd
l10mm PRE-DYNAMICALLY TESTED TWALLS TESTED JUNE 1998 (SERIES 2)
Brick thicknessBrick lengthMass bond wrenchMass at lever armBrick and mortar mÍrss above interfaceFront brick face to center of gravityFront brick face to notchElastic modulusBedded areaTotal compressive force on bedded area
ll02305.36
2N765
fllmmmkg
IIlmmmmm3
mm2
46383325300
Fsp
F,o =9.81(mr+ mr+ m.)
l-ìrf-;l Bending moment about the centroid of the bedded a¡ea
t--ç-l
OVERALL AVERAGE FspFOR AJ-L4 BATCIIESOVERALL ST DEV FOR ALL 4 BATCTMSLOWEST BOND VALIJEHIGI{EST BOND VALUE
¡1,'I "r = o .zw"(a, -' /)*, rr^(0, -''/)
Flexural sfrength of the specimen
f ,o=*'o/o '"/o,
D.57
t. l7D.27
0.99
SpecimenNo.
TESTNO.
microstrain
m'ke
m'ke
fspN
MpNmm
f"pMPa
AveMPa
StDevMPa
5 I 1050 36.91 2.984 443.92 [email protected] 0.552 1100 38.67 3.058 461.89 276934.68 0.58 0.71 o-25
3 1900 66.79 3.551 742.59 472796.75 0.99
6 1 1000 35.15 2.982 426.66 252451-92 o.532 1300 45.70 2.985 530.14 325W.t9 0.68 0.s6 0.11
3 900 3r.64 2.974 392.tO 227969.16 0.48
7 I 800 28.12 2.982 357.70 203486.40 0.42., 500 17.58 2.984 254.27 130038.13 o.n 0.41 0.133 1000 35.15 3.502 43t.76 25245r.92 0.53
8 1 1000 35.15 2.977 426.61 2s245t.92 0.s32 1200 42.18 3.546 501.16 301417.44 0.63 0.59 0.053 I 150 40.42 3.013 478.69 289t76.06 0.ó0
265
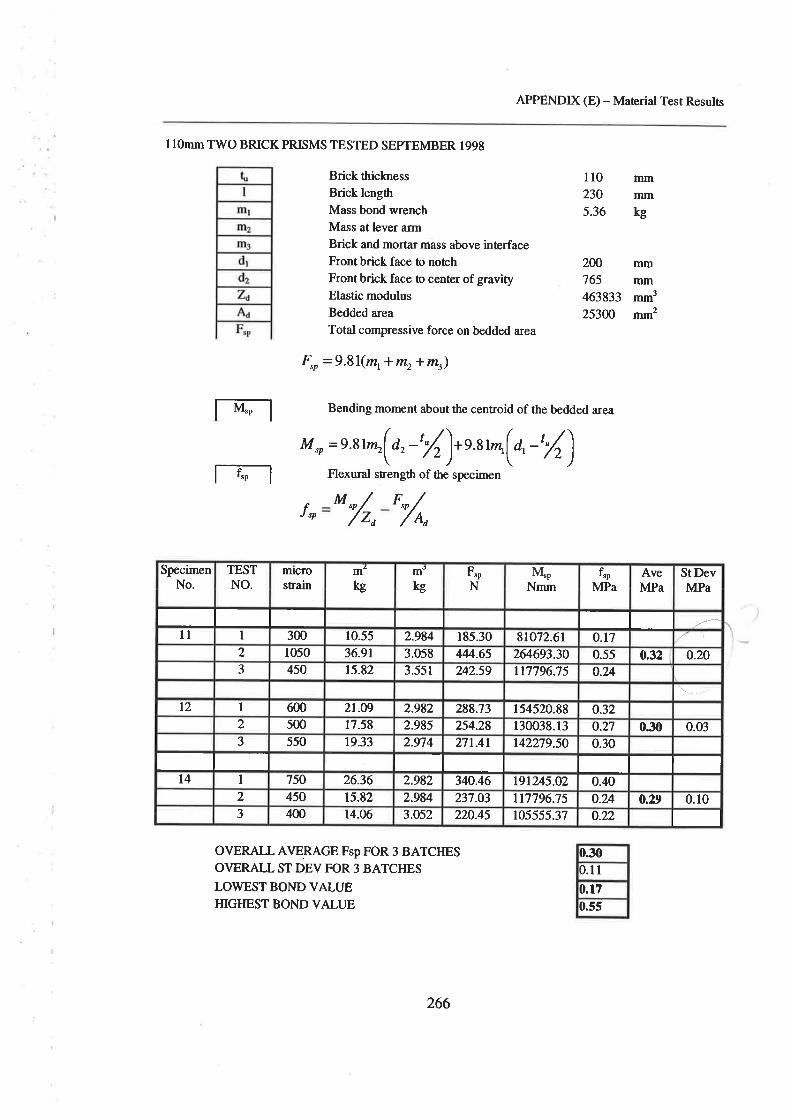
APPENDIX (E) - Material Test Results
1l0mm TWO BRICK PRISMS TESTED SEPTEMBER 1998
Brick thiclnessBrick lengthMass bond wrenchMass at lever armBrick and mortar mass above interfaceFront brick face to notchFront brick face to center of gravityElastic modulusBedded a¡eaTotal compressive force on bedded area
F"o =9.81(mr+ nb+ m3)
Flexural strength of the specimen
ll02305.36
mmlItmkg
2OO mm765 mm463833 mm3
253W mm2
f-M--l
l--r'"-l
Bending moment about the centroid of the bedded area
¡vI "e =o.tua(a,-'/)., rt^(a,-'ú)
r* M "o//ZoF"o '//Ao
SpecimenNo.
TESTNO.
nucrostrain
m'kg
m'kg
psp
NMsp
NmmfrP
MPaAveMPa
StDevMPa
ll I 300 10.55 2.984 185.30 8to72.61 o.l72 1050 36.91 3.058 444.65 264693.30 0.55 0.32 0.203 450 15.82 3.551 242.59 ltj't96.75 o.24
t2 I 600 2r.o9 2S82 288.73 154520.88 o.32I 500 17.58 2.985 254.28 130038.13 0.27 0.30 0.033 550 19.33 2.974 271.41 142279.50 0.30
l4 I 750 26.36 2.982 340.46 t9lu5.o2 0.402 450 t5.82 2.984 237.03 rt1796.75 o.24 0.29 0.103 400 14.06 3.052 220.45 10s555.37 o.22
II
I
rII I
I r IIIrI
OVERALL AVERAGE Fsp FOR 3 BATCIIESOVERALL ST DEV FOR 3 BATCTIESLOWESTBONDVALUEHIGIIEST BOND VALI.]E
0.30).1 I0.tr0.55
266

APPENDIX (E) - Material Test Results
50mm TV/O BRICK PRISMS TESTED SEPTEMBER 1998
Brick thicknessBrick lengthMass bond wrenchMass at lever armBrick and mortår mass above interfaceFront brick face to notchFront brick face to center of gravityElastic modulusBedded areaTotal compressive force on bedded area
F,o =9.81(mr+ nh+ m))
502303.5
nìmmmkg
1925929583311500
mmnìmmm'mm2
l-Çl Bending moment about the centroid of the bedded area
t-?-t¡r
"n = s.tw,(a, -' /)*, rt^(a, -' ú)Flexural stength of the specimen
r,o=*'/o-''/n
fIl3kg
Fsp
N1ylsp
Nmmf"p
MPaAveMPa
St DevMPa
SpecimenNo.
TESTNO
TruCfO
sfrainIIl2kg
0.9 184.16 85680.95 0.8810 I 300 14.3'.1
0.9 184.16 85680.95 0.88 0.70 0.302 300 14.3735047.85 0.363 ll0 5.27 0.9 94.86
55034.60 0.56t3 1 185 8.86 0.9 130.11o.r714.r3 0.9 181.81 84348.50 0.86 0.762 295
295 t4.13 0.9 181.81 84348.50 0.863
OVERALL AVERAGE F,P FOR 2 BATCTIESOVERALL ST DEV FOR 2 BATCIIESLOWEST BOND VALUEHIGTIEST BOND VALUE
0.730.22
0.36D.88
267

APPENDIX (E) - Material Test Results
RESULTS OF MODULUS TESTS
SPECMEN No. (2) - 110mm THICK TESTED MARCH 1998
Estimate Modulus
SPECIMEN No. (3) - 110mm THICK TESTED MARCH 1998
15,000 MPa
3,300 MPa
STRESSMPa
00.99l.982.963.954.945.930.664.37
COMBSTRAIN
00.00000720.00013980.00016880.000203
0.00029110.0003982
Â(comb)
00.Nr24570.0240570.0290400.0349410.0500840.0ó8554
L(2)brick/morta¡
00.0020320.0264t60.034s440.0467360.0650240.o87376
^(1)brick0
0.001280.003840.008960.0192
0.024320.03072
NN
STRATN (2)brick/mortar
00.000010.00013.0.0w17)0.000230.000320.00043
16,600l10,556
STRATN (l)brick
00.00002520.00007s60.00017640.000378
0.00047880.0006048
57o ULTMATE337o ULTIMATE
DEMEC (2)bricl/morta¡
943942930926920911900
DEMEC (1)brick7827817'.|9
775767763758
T]LTIMATE
LOAD(N)0
25000
7s000100000125000150000332000
STRESSMPa
00.991.982.963.954.945.930.664.42
COMBSTRAIN
00.00069350.00079530.00101520.0012560.00r5380.00r697
A(comb)
00.1t92950.1367970.1746190.2161780.2646190.29t954
L(2)bricl/morta¡
00.1137920.13208
0.1706880.2153920.2661920.296672
^(l)brick0
-0.00896-0.00768-0.0064
-0.001280.002560.00768
NN
STRATN (2)briclc/mortar
[email protected],1010.001310.00146
16,80011 1 ,888
STRATN (1)brick
0-0.0n01764-0.0001512-0.000126
-0.00002520.00005040.0001512
SVoIJLTG,ÃATE33VoULTIMATE
DEMEC (2)bricl/morø¡
911855846827805780765
DEMEC (I)brick988995994993989986982
ULTIMATE
LOAD(N)0
25000
100000125000150000336000
Estimate Modulus
268
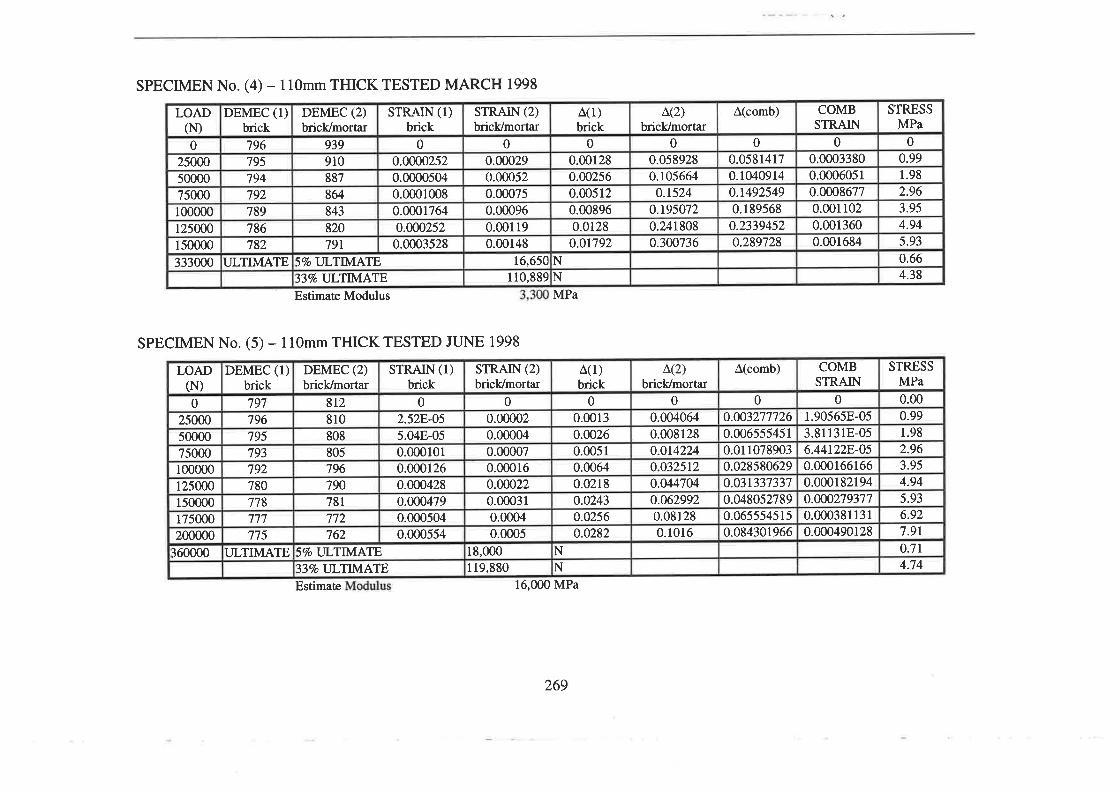
5.930.664.38
STRESSMPa
00.991.982.963.954.94
COMBSTRAIN
00.00033800.00060510.00086770.0011020.0013600.001684
0.14925490. l 895680.23394520.289728
Â(comb)
00.05814170.1040914
L(2)bricl/mortar
00.0589280.105664
0.15240.1950720.2418080.300736
00.001280.002560.005120.008960.0128o.0r792
NN
A(1)brick
0.001190.00148
16,650110,889
STRATN (2)bricl/mortar
00.000290.000520.000750.000960.0001764
0.w2520.0003528
STRAIN (1)brick
00.00002520.00005040.0001008
843820791
5VoULTIJ'VIATE33VaULTIMATE
DEMEC (2)brick/mortar
939910887864
789786782
LILTIMATE
DEMEC (1)brick79679579479275000
100000125000150000333000
(N)LOAD
02500050000
SPECIMEN No. (a) - 110mm THICK TESTED MARCH 1998
Estimate Modulus
SPECMEN No. (5) - 110mm THICK TESTED JUNE 1998
Estimate
MPa
16,000 MPa
STRESSMPa0.000.991.982.963.9s4.945.936.927.91o.7t4.74
COMBSTRAIN
01.90565E-053.81131E-056.441228-050.000166r660.0001821940.w02793770.00038113 r0.000490128
Â(comb)
0o.æ32777260.0065554510.0110789030.0285806290.03t3373370.0480527890.0655545150.084301966
L(2)brick/mortar
00.0040640.0081280.0142240.0325120.0M7040.0629920.081280.10r6
0.00510.00640.02180.02430.02560.0282
NN
A(l)brick
00.00130.0026
18,000
STRAIN (2)brick/morør
00.000020.000040.000070.000160.ñ0220.000310.00040.m05
119,880
0.0005040.000554
STRAIN (1)brick
02.528-055.04E-050.0001010.0001260.0004280.000479
57o ULTIMATE337o ULTMATE
DEMEC (2)bricl/mortar
812810808805796790781772762
777775
T.JLTIMATE
DEMEC (I)brick797796795793792780778150000
175000200000
360000
(N)LOAD
0250005000075000100000r25000
269
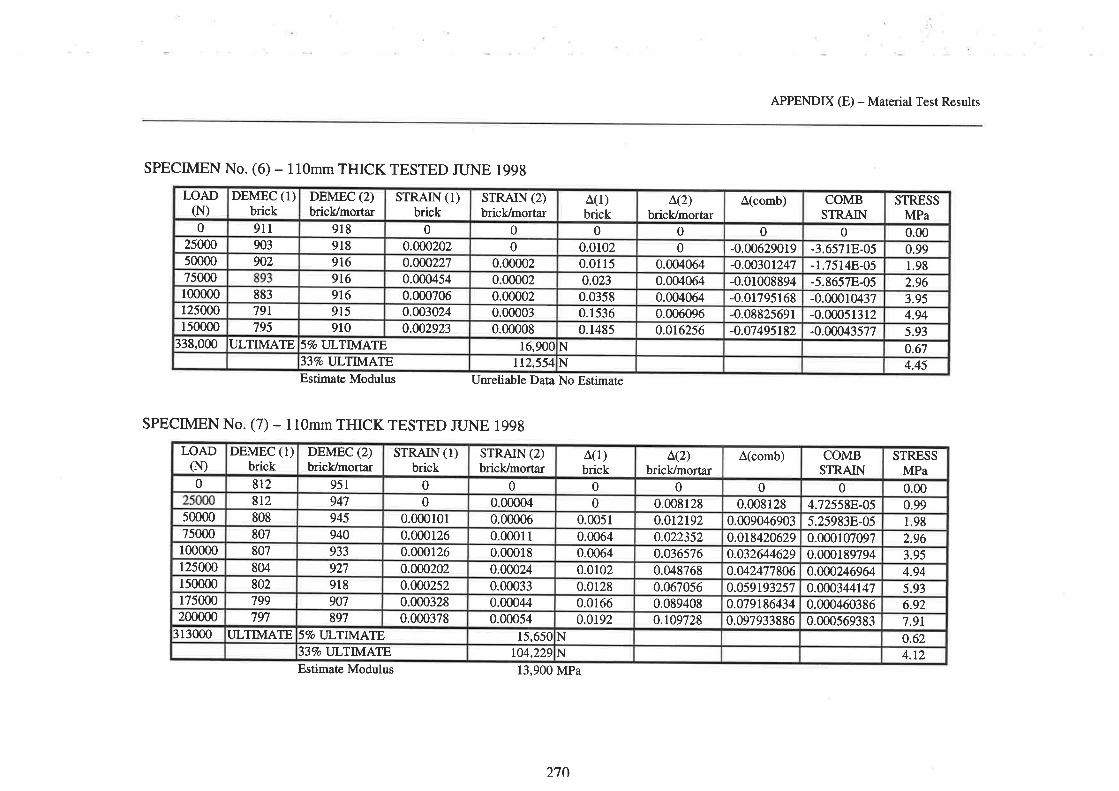
APPENDIX (E) - Maærial Test Results
SPECMEN No. (6) - 110mm THICK TESTED JUNE 1998
Estimaæ Modulus
SPECIMEN No. (7) - 110mm THICK TESTED JUNE 1998
Unreliable Data No Estimate
13,900 MPa
STRESSMPa0.000.991.982.963.954.945.930.674.45
COMBSTRAIN
0-3.6571E-05-1.7514E-05-5.8657E-0s-0.000r0437-0.00051312-0.00043577
Â(comb)
0-0.00629019-0.m.301247-0.01008894-0.01795168-0.08825691-0.07495182
L(2)brick/mortar
00
0.0040640.0040640.0040640.0060960.016256
^(l)brick0
0.01020.01150.023
0.03580.15360.1485
NN
STRATN (2)brick/mortar
00
0.000020.000020.000020.000030.00008
16,9001t2,554
STRATN (l)brick
00.0æ2020.0æ2270.0004540.000706o.æ30240.002923
5VoIULTIJvIATE33VoULTIJvIAT]E
DEMEC (2)bricl/mortar
9189189169r6916915910
DEMEC (l)brick911903902
88379t795
ULTIMATE
LOAD(N)0
250005000075000100000125000150000
338,000
STRESSMPa0.000.991.982.963.9s4.945.936.927.9t0.624.12
COMBSTRAIN
04.725588-055.25983E-050.0001070970.0001897940.0002469640.w03Mt470.0004603860.000569383
Â(comb)
00.008128
0.0090469030.0184206290.0326446290.0424778060.0591932570.0791864340.097933886
L(2)brick/mortar
00.0081280.0t21920.0223520.0365760.0487680.0670560.0894080.109728
^(1)brick00
0.00510.00640.00640.01020.01280.01660.0192
NN
STRAIN (2)brick/morør
00.000040.000060.000r I0.000180.000240.000330.000440.00054
15,650t04,229
STRATN (r)brick
00
0.00010r0.0001260.0001260.0002020.0002520.0003280.000378
57o IJLTIMATE337o ULTMATE
DEMEC (2)bricl/mortar
95r94'.1
945940933927918907897
DEMEC (1)brick8r2812808807807804802799797
ULTIMATE
LOAD(N)0
5000075000100000125000150000175000200000
313000
Estimate Modulus
2',to
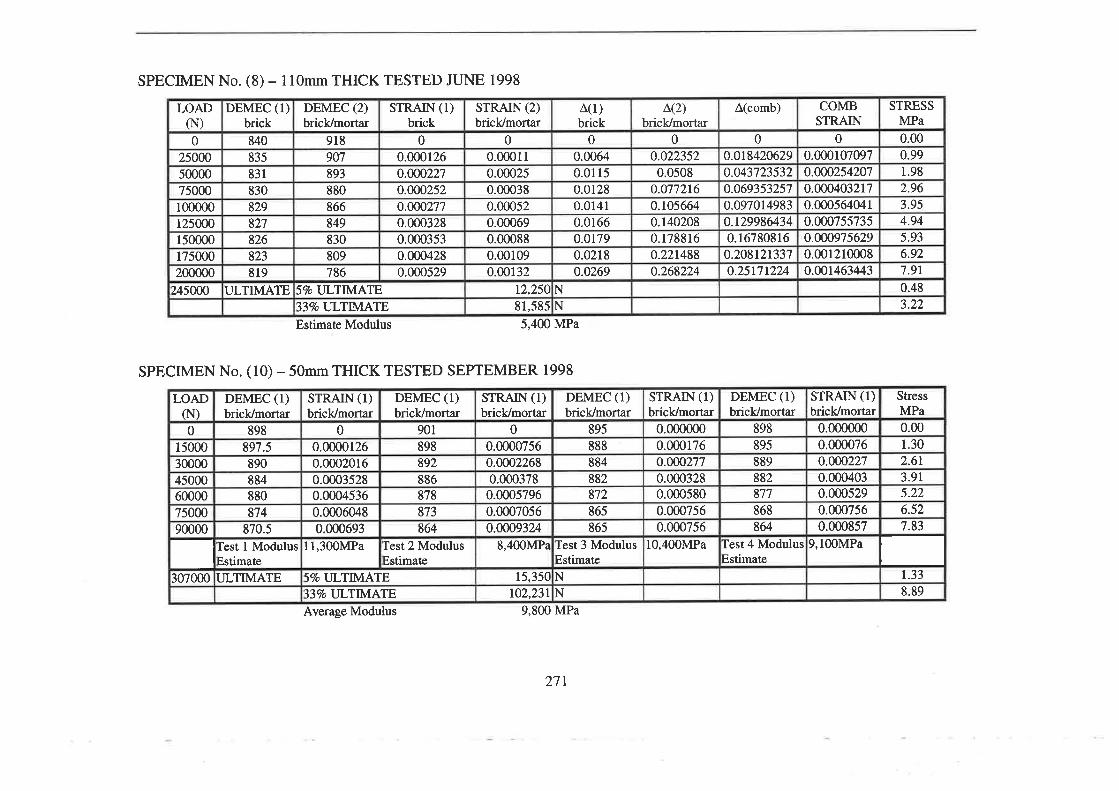
SPECIMEN No. (8) - 110mm THICK TESTED JUNE 1998
Estimaæ Modulus 5,400 MPa
SPECIMEN No. (10) - 50mm THICK TESTED SEPTEMBER 1998
Average Modulus 9,800 MPa
STRESSMPa0.000.991.982.963.954.945.936.927.91
0.483.22
COMBSTRAIN
00.0001070970.000254207o.ooo4032r70.0005640410.0007557350.w09756290.0012100080.o01463443
Â(comb)
00.0184206290.043723532o.0693532570.0970149830.1299864340.16780816
0.2081213370.25t71224
L(2)briclc/morta¡
00.022352
0.0508o.o772160.1056640.1402080.1788160.22t488o.268224
^(l)brick0
0.00640.01l50.01280.01410.0r660.01790.02180.0269
NN
STRAIN (2)briclc/monar
00.000110.000250.000380.000520.000690.000880.001090.00132
t2,25081,585
STRAIN (I)brick
[email protected].æ02770.0003280.0003530.0004280.000529
57o ULTMATE3370 ULTMATE
DEMEC (2)brick/mortar
9r8907893880866849830809786
DEMEC (l)brick84083s831830829827826823819
ULTIMATE
LOAD(N)0
250005000075000100000125000150000175000200000
245000
StressMPa0.001.302.6r3.9rs.226.527.83
1.338.89
STRAIN (1)brick/mortar
0.0000000.0000760.0402270.0004030.0005290.0007560.000857
9,l00MPa
DEMEC (I)briclJmortar
898895889882877868864
Test 4 ModulusEstimate
STRAIN (1)bricl:/mortar
0.0000000.0001760.0002770.0003280.0005800.0007560.000756
10,400MPa
895888884882872865865
Test 3 ModulusEstimate
DEMEC (1)brick/mortar
NN
STRAIN (I)brick/mortar
00.00007560.00022680.000378
0.000s7960.00070560.0009324
8,400MPa
15,350toz,23r
864Iest 2 ModulusEstimate
DEMEC (1)brick/mortar
901898892886878873
0.000693
57o ULTIMATE33% ULTIMATE
STRATN (l)brick/morør
00.0000r260.00020160.00035280.00045360.0006048
11,300MPa
880874
870.5Iest I ModulusEstimate
DEMEC (1)brick/mortar
898897.5890884
ULTIMATE
(N)LOAD
0150003000045000600007500090000
307000I I
271

APPENDIX (E) - Material Test Results
SPECMEN No. (11) - 110mm THICK TESTED SEPTEMBER 1998
Estimate Modulus 6,600 MPa
SPECMEN No. (12) - 110mm THICK TESTED SEPTEMBER 1998
11,600 MPa
STRESSMPa0.000.991.982.963.954.945.930.7r4.73
COMBSTRAIN0.0000000.00016r0.0003430.0005020.0006460.0007950.000909
Â(comb)
0.0000000.0276620.0589940.0862630.1 1 1 1060.1367360.156336
L(2)brick/mortar
0.0000000.0284480.0609600.0894080.115824o.t422400.164592
^(l)brick0.0000000.0012800.0032000.0051210.0076810.0089610.013442
NN
STRAIN (2)bricl/mortar
00.000140.0003
0.000440.000570.0007
0.0008117,950
119,547
STRATN (r)brick
00.0m,02520.000063
0.00010080.00015120.00017640.w2646
5% ULTIMATES3ToIJLTIMATE
DEMEC (2)bricVmorør
901887871
857844831820
DEMEC (I)brick812811
809.5808806805
801.5I.JLTIMATE
LOAD(N)0
25000
100000125000r50000359000
STRESSMPa0.000.991.982.963.954.945.930.785.23
COMBSTRAIN0.0000000.0000540.0001370.0ú2260.00031r0.0003940.000478
Â(comb)
0.0000000.0092100.0235010.0388070.0535s70.0678470.082204
L(2)briclc/mortar
0.0000000.0r r 1760.027432o.ou7040.0629920.0792480.097536
^(1)brick0.0000000.0032000.0064010.00960r0.0153620.0185620.024963
NN
STRATN (2)bricl/morør
00.0000550.0001350.0nn.220.000310.000390.00048
19,8s0132,200
STRATN (t)brick
00.0000630.0001260.0001890.ñ030u0.00036540.0004914
57o ULTMATE33/oULTIJvLAI]E
DEMEC (2)briclc/mortar
914908.5900.5892883875866
DEMEC (l)brick807.5805
802.5800
795.5793788
ULTIMATE
LOAD(N)0
250005000075000II150000397000
Estimate Modulus
).7)
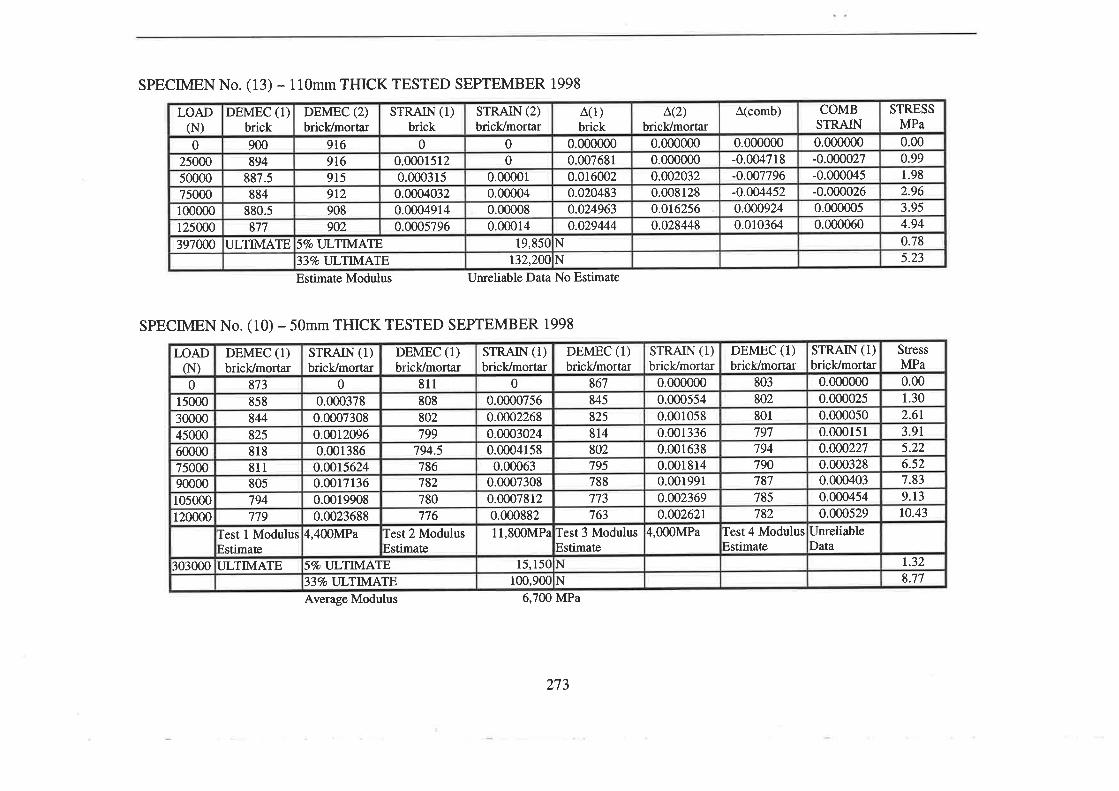
SPECIMEN No. (13) - 110mm THICK TESTED SEPTEMBER 1998
Estimate Modulus Unreliable Data No Estimate
SPECIMEN No. (10) - 50mm THICK TESTED SEPTEMBER 1998
Average Modulus 6,700 MPa
STRESSMPa0.000.991.982.963.954.940.785.23
COMBSTRAIN0.000000-0.000027-0.000045-0.0000260.0000050.000060
À(comb)
0.000000-0.004718-0.007796-o.oo44s20.M9240.010364
L(2)brick/mortar
0.0000000.0000000.0020320.0081280.016256o.028448
^(1)brick0.0000000.0076810.0160020.0204830.0249630.029444
NN
srRArN (2)brick/mortar
00
0.000010.000040.000080.00014
19,850r32,2@
STRATN (1)brick
00.00015120.000315
0.00040320.00049140.0005796
57o ULTIMATE33ToIJLTIvIATE
DEMEC (2)brick/mortar
9t69t6915912908902
DEMEC (I)brick900894
887.5884
880.5877
ULTIMATE
LOAD(N)0
25000500007s000100000125000397000
StressMPa0.001.302.613.915.226.527.839.1310.43
1.328.77
STRATN (1)brick/mortar
0.0000000.0000250.0000500.0001510.0cp2270.0003280.0004030.0004540.000529
UnreliableData
DEMEC (1)bricL/mort¿r
803802801
797794790787785782
Iest 4 ModulusEstimate
STRATN (1)brick/mortar
0.0000000.0005540.0010580.0013360.0016380.0018140.0019910.a023690.002621
4,000MPa
DBMEC (1)bricL/mort¿r
867845825814802795788773763
Test 3 ModulusEstimateNN
STRAIN (1)brick/mort¿r
00.00007560.04022680.04030240.0004158
0.000630.00073080.00078120.00088211,800MPa
r5,150100,900
DEMEC (I)brick/mortar
811808802799
794.5786782780776
Test 2 ModulusEstimate
5VoIJLTNIATE33VoUI-TIIúATE
STRAIN (1)bricVmortar
00.000378
0.00073080.00120960.001386o.oot56240.00171360.00199080.0023688
4,400MPa
DEMEC (I)briclc/mortar
873858844825818811805794779
Test 1 ModulusEstimateULTIMATE
LOADN)0
150003000045000600007500090000105000120000
303000
273

APPENDX (E) - Maærial Test Results
RESULTS OF COMPRESSTVE MORTAR CI]BE TESTS
Series SpecimenNo.
SpecimenThickness
(mm)
Cube Number(l00xl00x100mm)
CompressiveStrength(MPa)
Marchl998 1 ll0 I 5.202 5.02J 6.82
Marchl998 2 110 I 5.882 6.183 5.62
Marchl998 J 110 I 7.161 6.84J 6.42
March1998 4 ll0 I 7.162 6.343 6.r4
June 1998 5 ll0 1 6.022 4.30
June 1998 6 110 I 6.062 4.O4
June 1998 7 ll0 I 4.022 4.98
June 1998 8 110 I 5.062 4.323 4.16
September 1998 l0 50 I 5.002 5.203 s.48
September 1998 l1 ll0 I 4.682 4.223 4.90
Sept€mber 1998 t2 lt0 I 5.282 4.943 5.08
Sepæmber 1998 t3 ll0 I 3.762 4.M3 3.84
September 1998 t4 50 I 4.082 3.563 4.44
AVERAGE 5.17
274
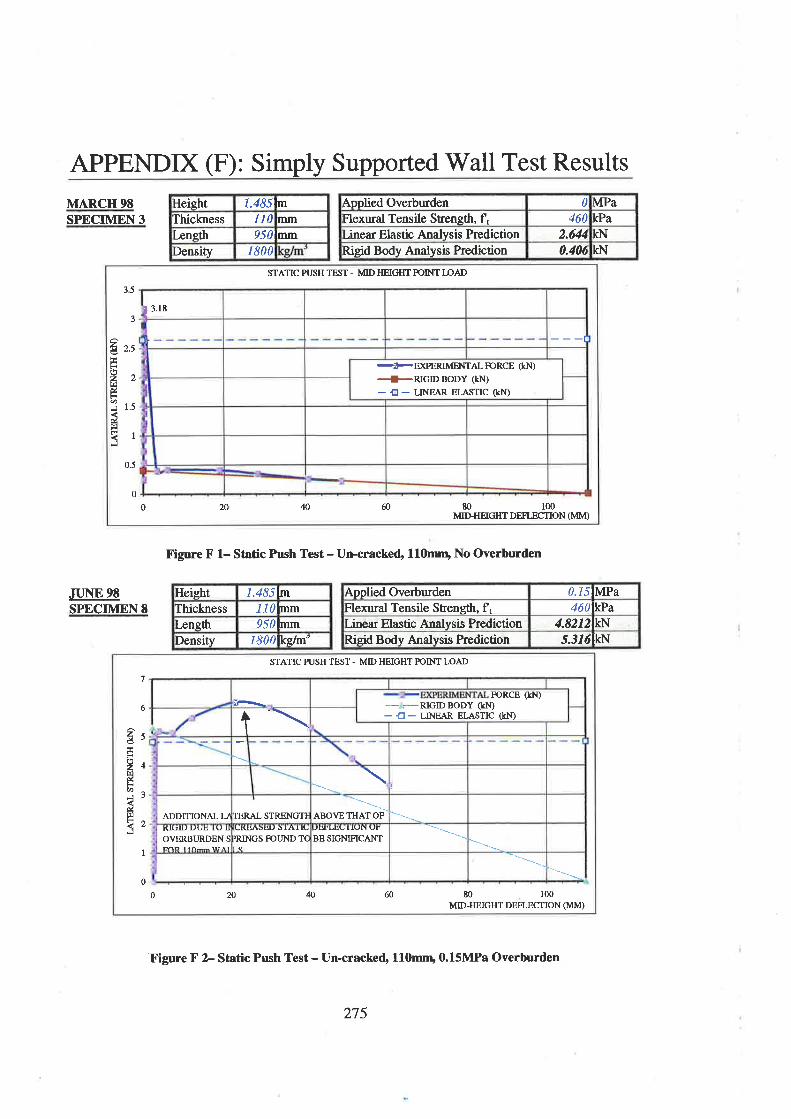
APPENDIX (F): Simply Supported \ü/all Test Results
MARCH 98SPECIMEN 3
JUNE 98SPECIMEN t
Figure F 1- Static Push Test - Un-cracked, 110mn¡ No Overburden
Height t.485tmIhiclness 110bnmLensttr 95rlmmDensity I80?t/r;ghl¡i
'Figure F 2- Static Push Test - Un-cracked, L10mrn' 0.15MPa Overburden
Applied Overburden 0 MPa460 kPaFlexural Tensile Süength, f,
Linear Elastic Analysis Prediction 2.ø4 KN
0.406 KNRieid Bodv Analysis P¡ediction
1.485[mHeightfhiclmess I10hr,m
9501l¡,¡ÍtLængttrDensity 1800
STATIC PUSH TEST _ MID HEIGTIT FOINT IOAD
35
3I 3.18
---i
-FEXPERTMENTAL rcRCE (kN)
'#RIGIDBoDY (kl.t)
- 'tr - LINEAR ELA.STIC ßN)
! r.tE9,Þ.1
É3 r.sdFìIrJ
0.5
0
0 20 Q 60 80 100MIDHEIGHT DEFI-ECTION (lvilvÍ)
Applied Overburden 0.15lMPaFlexural Tensile SEength, f, 46|kPaLinea¡ Elastic Analysis Prediction 4.S212lkr{Risid Bodv Analvsis Prediction 5.3Iólkl.I
STATIC PUSH TEST. MID HEIGHT POINT LOAD
1
6
2ðF5zf¡lúF.Ø¡¿l¡l
I
5
4
3
1
0
0 20 44 60 80 100MID.HEIGHT DBFLECTION (MM)
FORCE (kN)'-TRIGIDBODY (kÐ- Ð _ LINEAR ELASTIC (KN)I
ADDITIONAL II IERAL STRENGTF ABOVETHATOFruUU UUÞ IV üOVERBT]RDEN SlhD rt^--úr^T
!¡@ùÐ ùIAITLIRINGS FOUND TCtc
utrELlrvlì urBE SICNIFICANT
2t5

APPENDD( F : Out-of-plane Simply &tpported WaIl Test Results
ÉIeight l.485lmIhickness lI0lr.urrænsth 950Density 1800[rslm'
JUNE 98SPECIMEN 8
SEPIEMBER9SSPECIMEN 10
Figure F 3. Static Push Test - Cracked, 110mm,O.l5Mpa (Þerbu¡den
Figure F 4- Static Push Test - Cracked" 50mnD No Overburden
Applied Overburden 0.15 MPaFlexural Tensile Stengú" f, 0 kPaLinea¡ Elastic An¿¡lysis Pr,ediction 2.322 KNRigid Body Analysis P¡ediction 5.it6 KN
STATIC PUSH TEST - MID HEIGIIT FOINT LOAI)
6
5
2è9*üzt¡l&FU)¡dHf
4
3
2
I
0 20 40 60 80 100 120
MID-HEIGIIT DEFLECTION (MM)
EXPERJMENTAL K)RCE (KN).+RIGIDBODY (kN)
ADDITIONI/
LLATERAL STRI NGTTIABOVEt-I
rlut vrÃDEFLECTICFOTJNDTO
JIU DUE TL' IIìL]!¡OFOVERBIIRX¡ESIGNIFICANT
ENÐùIÂIIL]N SPRINGS0R f lOnm
WALLS
HeiehtIhichess 50Lengtlr
2300
Applied Overburden 0lMPaFlexural Tensile SEength, f, 0[rPaLinear El¿stic Analysis Prediction 0.07[lkNlieid Body Analysis Prediction 0.1071kr{
STATIC PUSH TEST.MID HEIGITT FOINTI,OAD
l5
0.r2
0.1
0.08
0.06
0.04
0.o2
0
2t9FozB]úF6-lúl¡lFf
0 5 l0 20 25 30 35MIDHEIGIIT DEFLECTTON (MM)
q 45
,/ FORG (kN)
RIGIDBODY (IN)\,
276
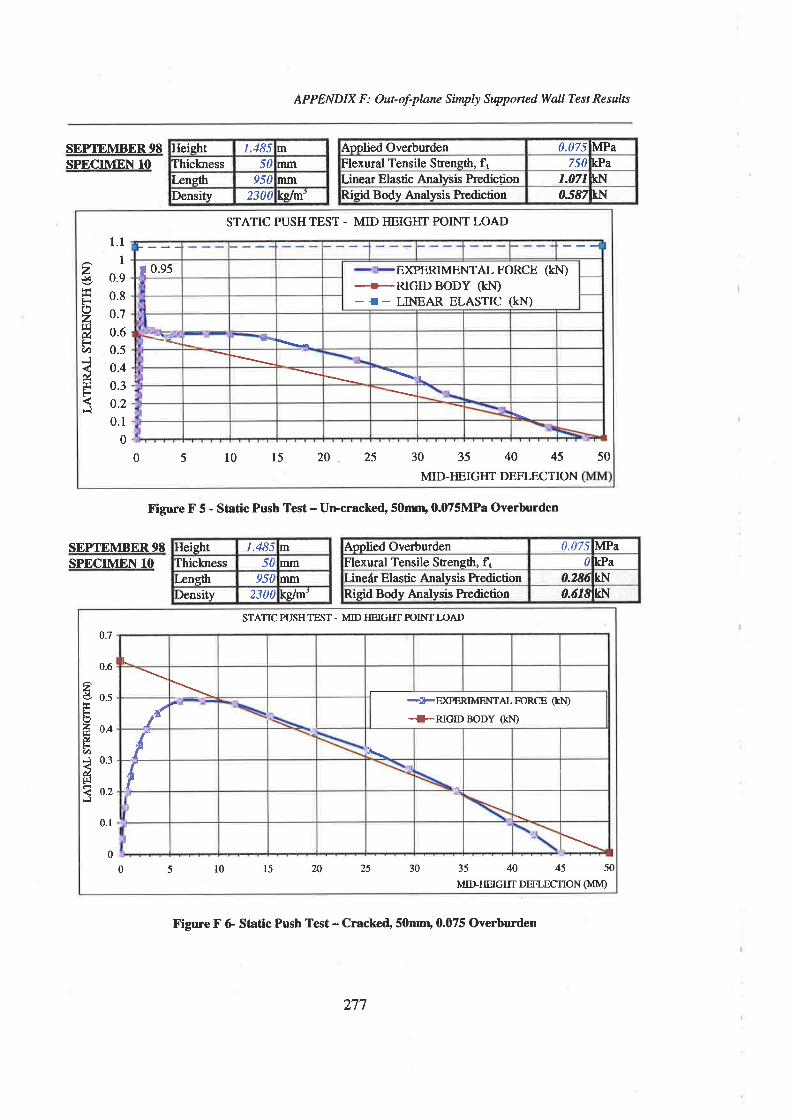
APPENDIX F: Out-of-plane Simply Supponed Woll Test Results
Heisht 1.485 mrnmThiclness 50
Lænsth 950 mmks/ÍfDensity n0a
SEPIEMBER9SSPECIMEN 10
SEPTEMBER93SPECIMEN 10
Figure F 5 - Static Push Test - Urcracked, 50mnu 0.Û75MPa Overburden
Figure F G Static Push Test - Cracked, 50mq 0.075 Overburden
Applied Overburden 0.075llvlPaFlexural Tensile Stensth, f, 750kPaLinear Elastic Analysis Prediction I.07Ilkl.IRisid Bodv Analysis Prediction Ø.587lklr
STATIC PUSHTEST - MID MIGI{T POINT LOAD
zJhzlI]úFU)JúlaFJ
1.1
1
0.90.80.7
0.60.5
0.40.3o.20.1
0
0510152025 30 35 40 45
MID-MIGI{T DEFLECTION50
F--- --i.! 0.9s ÐGERIMENTALFORCE (KN)
+RIGIDBODY (KN)_ I _ LINEAR ELASTTC (KN)
.-a\
L
Heieht 1.485 mIhiclness 50 mm
mmLeneth 950ÞnsiW 2300 ks/n:
Aoolied Overburden 0.075lMPaFlexural Tensile Srength, f, 0[rPaLineár Elastic Analvsis Prediction Ø.28ólkl.IRigid Bodv Analysis Prediction 0.órSlktI
STATIC PUSH TEST - MID HEIGIIT POINT IJOAD
0.7
0.6
2g o.sF
V o.+úF(t)c 0'3
fi< 0.2J
0.1
00 5 t0 l5 20 25 30 35 40 45 50
MID.HEIGTIT DEFLECTION (MM)
L
F -tsEXPERIMENTAL FORG (kl.I)
-+RTGTDBODY (kl.t)f $\.
fr¡
277
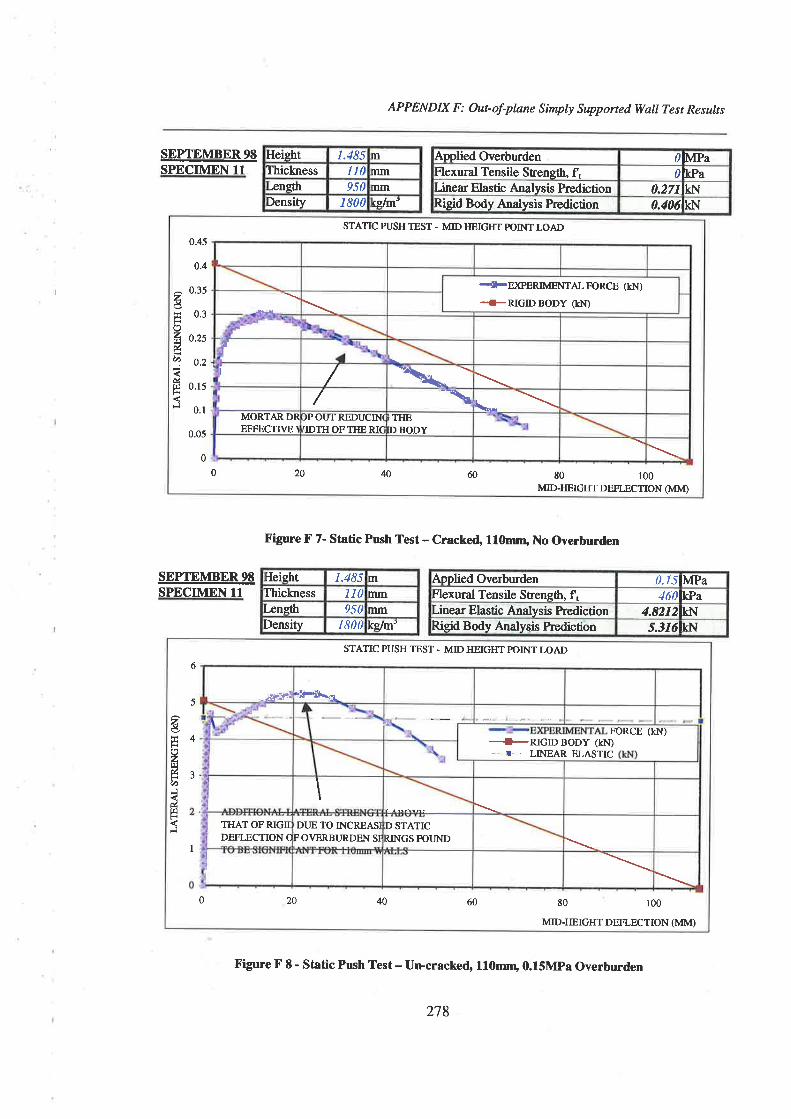
APPENDIX F: Out-of-plane Simply Supponed Wall Test Results
Height 1.48s mThickness 1r0 mmængth 950 nm
DensiW 1800 ks/m'
SEPTEMBER93SPECIMEN 11
SEPTEMBER93SPECIMEN 11
Figure F 7- Static Push Test - Cracked, lfOmnr, No Overburden
Figure F E - Static Push Test - Urrcracked, 110mnr, 0.l5Mpa Overburden
Applied Overburden 0lMPaFlexural Tensile Sfrength, f, 0[PaLinear Elastic Analysis Prediction o.27rlkl.lRigid Body Analysis Prediction 0.4061k1:{
STATIC PUSH TEST - MID HEIGIIT POINT I]OAD0.45
0.4
^ 0.35z,4I 0.3FoÁ o.zsúF
fr o.rs
Fl o.l
0.05
00 20 40 60 E0 100
MID-ITEIGHT DEFLECTION (MM)
-{tsEXPERIMENTAL FORCE (H{)
--+RIGIDBODY (kN)
r/ \* -\
\-\MORTARDREFFECTTVB \
)POUTREDUCIN(.IDTHOFTHE RIC
THEDBODY
ÉIeieht 1.485 mIhiclness 110 mmlæneth 950 filmDensity I 800 ks/m'
Applied Overburden 0.IíllvfPaFlexural Tensile Strength, f, 460lWaLinea¡ Elastic Analysis Prediction 4.82121kt{Rigid Bodv Analysis Prediction 5.3rólkt¡
STATIC PUSH TEST - MID IIEIGIIT POINT LOAD6
5
2F
zf¡ìÉØFI
útÐFs
4
J
I
0 20 40 60 80 100
MID-HEIGHT DEFLECTION (MM)
-$r:!.-:.Hh\¡r
FORCE (kN)--#RTGTDBODY (kN)
r' - LINEAR ELASTIC
\ÏTIAT OF RIGtrDEFLECTION C
DUE TO INCREAS]FOVERBT]RDEN SI
D STATICRINGS FOTJND
I
278
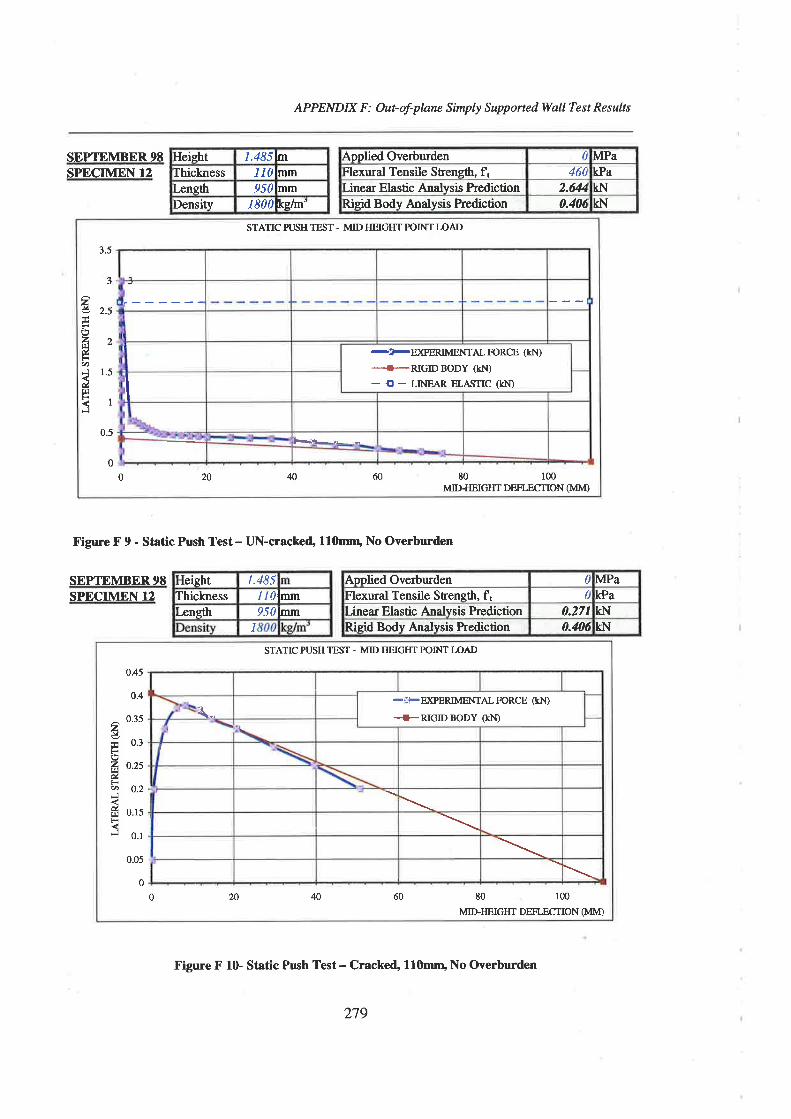
APPENDIX F : Out- of-plnne Simply Supported Wall Test Results
Heisht t.48slmThickress 110k¡l'mtænsttl 950hnmDensity 18007ù;s,lm
SEPIEMBER98SPECIMEN 12
Figure F 9 - Static Push Test- UN-cracke{ 110mm' No Overburden
SEPTEMBER9SSPECIMEN 12
Figure F 10- Static Push Test - Cracked, llûmrn, No Overburden
0 MPaepplied OverburdenFlexural Tensile Srength, f, 460 kPaLinear Elastic Analysis Prediction 2.ø4 KNRieid Bodv Analysis hediction 0.406 KN
STATIC PUSH TEST - MID HEIGTIT POINT LOAD
t.5
3
l-----' ---l
-ì-E)GERJMENTAL FORCE (kN)
---{-RTGTDBODY (kN)
- € - LINEAR ELASTTC (kÐI
t-ù--L*
2€ 2.sEFZJt¡.]ÉFa)¡ 1.5útqt-<
J
0.5
00 20 40 ó0 80 100
MID-HBIGHI DEFLECTION G/rvf)
Heisht 1.485Ihicloess lIlln¡rî
9501l¡¡ÍtLængthI
Aoolied Overburden a MPakPaFlexural Tensile Strength, f, a
Linear Elastic Analysis Prediction 0.271 KN
Risid Bodv AnalYsis Prediction 0.40ó KN
STATIC PUSH TEST - MID HEIGÍIT POINT LOAD
2út-(,zt¡¡dFro,ldt¡tif
0.45
o.4
0.35
0.3
o.25
o.2
0.15
0.1
0.05
0
0 20 40 60 80 100
MID-TIEIGTIT DEFLECTION (MM)
\-, -^:I-Ð0ERIMENTAL FORCE (kN)
--!-RTGTDBODY (kÐ
I
279
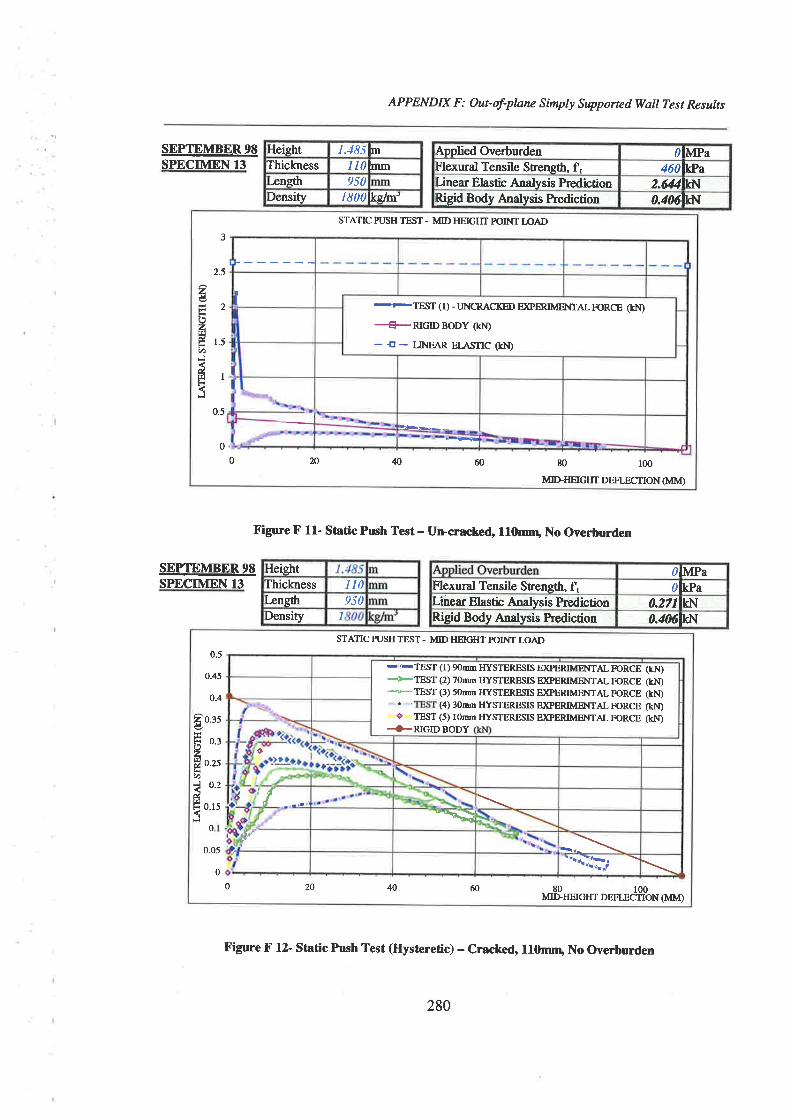
APPENDIX F : Out- of-plane Simply Supponed WaII Test Results
Heieht l.485lmfhickress ll?h¡tmængth 950Density I80Ìks,lm'
SEPTEMBER93SPECIMEN 13
SEPTEMBER93SPECIMEN 13
Figure F 11- Static Push Test - Uncracked, f10mn, No Overburden
Figure F 12- Static Push Test (Hysteretic) - Cracked, ll0rrun, No Overburden
Applied Overburden 0lMPaFlexural Tensile Srengú, f, 460WaLinea¡ Flestic Analysis Prediction 2.64418NRigid Body Analysis P¡ediction 0.'l06lkl-I
STATIC PTJSH TEST - MID HEIGTTT FOINT T.OAI)
5
2.5
2éF<(Jzl¡JÍ r.saâ-.¡
É,f0.5
F------
l : TEST (I) - I]NCRACKED E}PERIMENTAL FoRG (kN)
-{I-RIGIDBODY (kN)
- rr - LINEAR EIASTTC (kN)
=ÞH--
00 2A 4 60 80 100
MIDHEIGTIT DEFLECTION (MM)
HeightIhichess 110L,engtlr 950Density I
0lMPaFlexural Tensile Strengü, ft 0[rPaLinear Elastic Analysis P¡ediction 0.27lkl:{Rigid Body Analysis Prediction 0.4MlkÌ,t
STATIC PUSH TEST - MID HEIGÍTT POINT LOAI)0.5
0.45
o.4
2 o.tsTJ
H o,2po.zsFØc 0.2dH o.rsI
0
0.05
0
0 20 40 60 80 100MII}HEIGHT DEFT.ECTION (MM)
-ôTEST (l) 90úm TIYSTERESIS EKPERIMENTAL FORCE (KÐ+TEST (2) TOmm IIYSTERESIS ÐPBRIMENTAL FORCE (kN)'+TEST (3) sonm I{YSTERESIS Ð{PERIMENTAL FORCE (kN)
(4) 3onn HYSTERESIS EXPERIMENTAL FoRCE (kN)o TEST(5) 10m IIÍSTERESISEXPERIMENTALFORCE (kÐ
+.RIGIDBODY
oa
i ,f-rbì
ñ.ÌI -.\."tìiìl
280
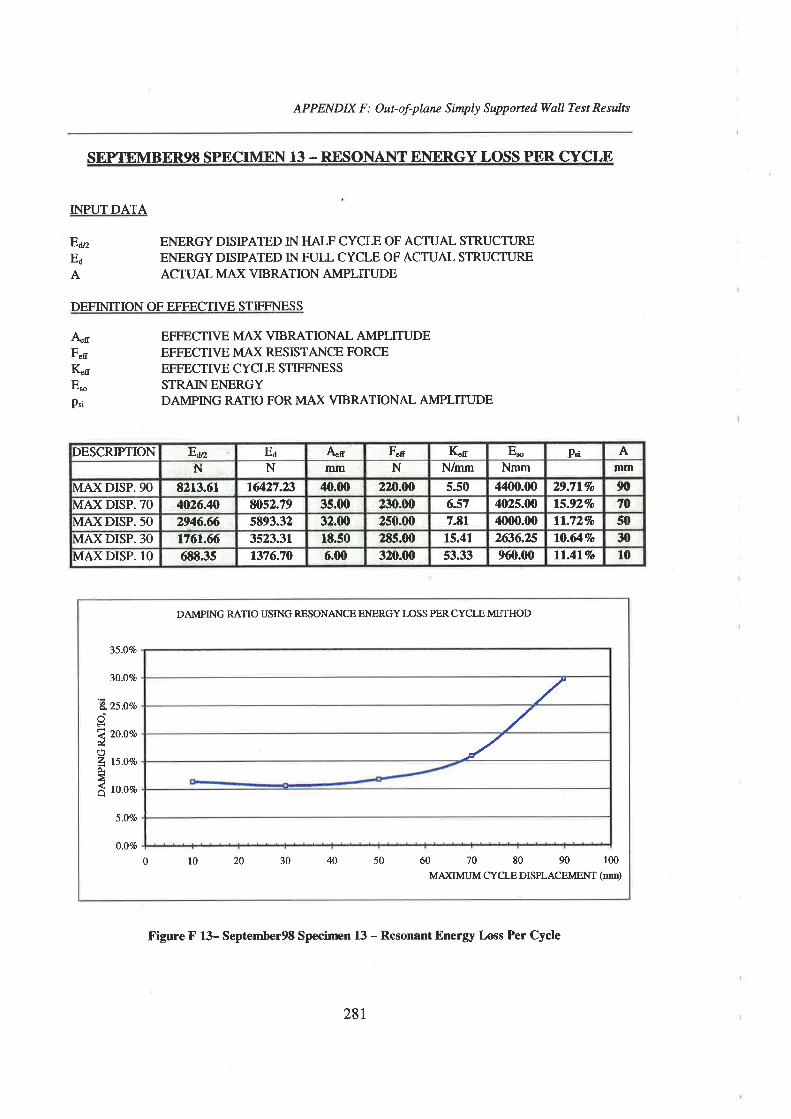
EuzE¿
A
ÀrF"rÇnEro
Pti
AP PENDIX F : Out- of-plane Simply Supp oned Wall Te st Re s ults
SEPIEMBER9E SPECIMEN 13 - RF,SONANT ENERGY LOSS PER CYCLE
INPUTDATA
ENERGY DTSIPATED IN HAIF CYCLE OF ACTUAL STRUCTUREENERGY DISIPATED IN FULL CYCLE OF ACTUAL STRUCTLIREACTUAL MAX VIBRATION AMPLITIJDE
DEFIN]TION OF EFFECTTVE STIFFNESS
EFFECTTVE MAX YIBRATIONAL AMPLITUDEEFFECTIVE MAX RESISTANCE FORCEEFFECTTVE CYCLE STIFFNESSSTRAINENERGYDAMPING RATIO FORMAX VIBRATIONAL AMPLITUDE
Figure F 13- September9S Specirnen 13 - Resonant Energy Loss Per Cycle
DESCRIPTION E¿¡2 E¿ 4n Fn IÇn E- P*i AN N IItm N N/mm Nmm mm
MAXDISP.90 8213.61 16ø'27.23 40.00 220.4O 5.50 44{n.00 29.717o 90MAXDISP. TO 4026.40 wsz.79 35.00 2110.00 6.57 402s.00 15.X27o 70MAXDISP.50 2946.6 5893.32 32.00 2s0.00 7.8r 4{n0.00 l!.72?o 50MAXDISP.30 t761.6 3523.3t 18.50 285.00 15.41 2ß6.?,5 10.Ø7o 30MAXDISP.lO 68835 1376.70 6.00 3z).00 53.33 960.00 ll^.4lVo l0
DAMPING RATIO USING RESONANCE ENERGY LOSS PER CYCLE METHOD
ÀoFú(5zF*H
35.07o
30.O7o
25.01o
2O.07o
15.0%
10.0%
5.0%
0.07o
,/_/
0 l0 20 30 40 50 ó0 70 80 90 r00MÆ(MIJM CYCLE DISPLACEMENT (nm)
281
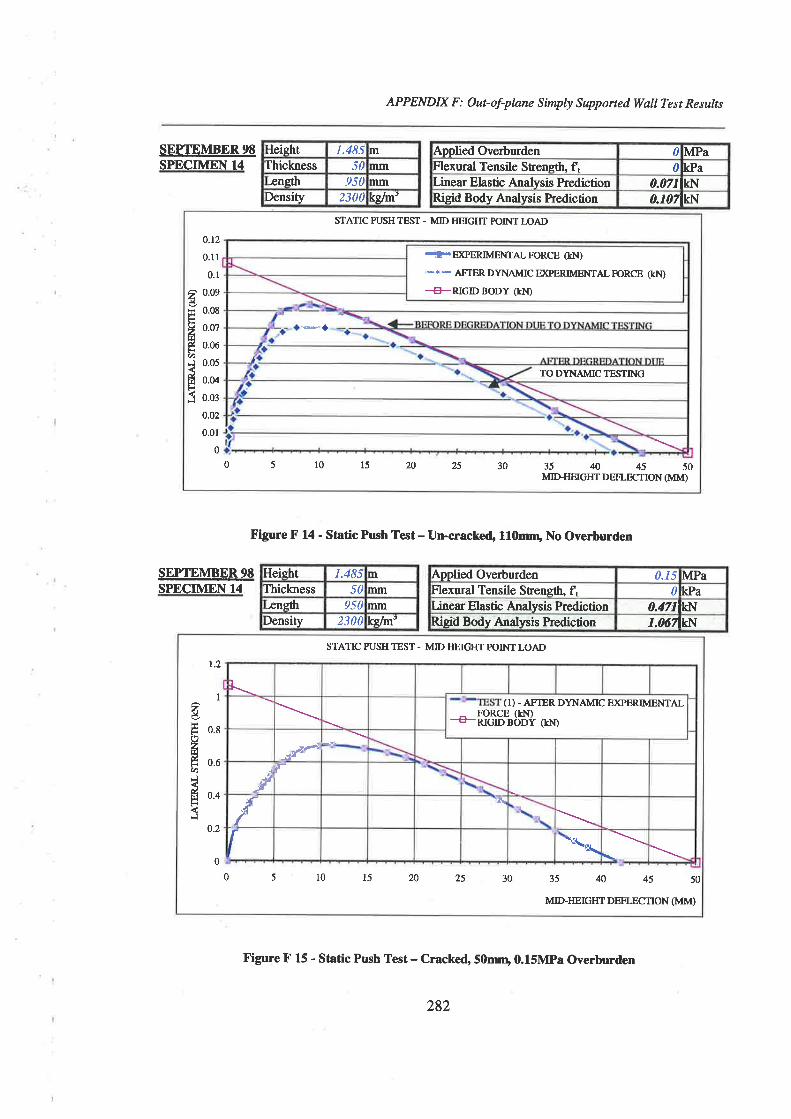
APPENDIX F : Out of-plane Simply Supported Wall Test Results
Heieht 1.485 mIhickness 50 mm.eneth 950 nm
Density x0a kslm'
SEPITMBER9SSPECIMEN 14
SEPTEMBER9ESPECIMEN 14
Figure F 14 - Static Push Test- Un-cracked, 110mn, No Overburden
Figure F 15 - Static Push Test - Cracked, 50mrq 0.15MP¡ Overburden
Applied Overburden 0lMPaFlexural Tensile Strensth, f, 0kPaLinear Elastic Analysis Prediction 0.0711k1.1Rigid BodV Analysis Prediction 0.t07lkt'I
SÎATIC PUSH TEST. MID HEIGTIT POINT I-OAI)
2é,a4FØ,ldt¡¡Hf
o.t2
0.11
0.r
0.@
0.0E
0.07
0.06
0.05
0.04
0.03
0.02
0,01
0
-f-EXPERIMENTAL FORCE (KN)
-. - AI.TEtrI DINAII,ÍIC E,PERIMENTAL FIoRcE (kÐ+FRIGIDBODY (KÐ
TO DYNAMIC TESTING
0 5 10 15 20 25 30 35û4550MID,HEIGIIT DEFLECTION (MM)
Heisht L485 mlhiclness 50 mmængth 950 mm
Density 2300 ksÍn'
Applied Overburden 0.15lMPaFlexural Tensile SEength, f, o[<PaLinear Elastic Analvsis Prediction 0.47rlkl:{Rigid Bodv Analysis Prediction 1.M^kl,I
STATIC PUSH TEST - MID IIEIGTIT POINT LOAD
t.2
I2Éot(']zr¡¡É o.øØ-tt o.tF,l
0.2
0
0 5 10 l5 20 25 30 35 40 45 50
MID-MIGIIT DEFLECNON (MM)
t.-.(1) - AFTER DYNAMIC ÐGERIMENTAL
_ FORCE (kN)?-RIGIDBODY (kN
-FÅ
È-
f -\
t *\
282
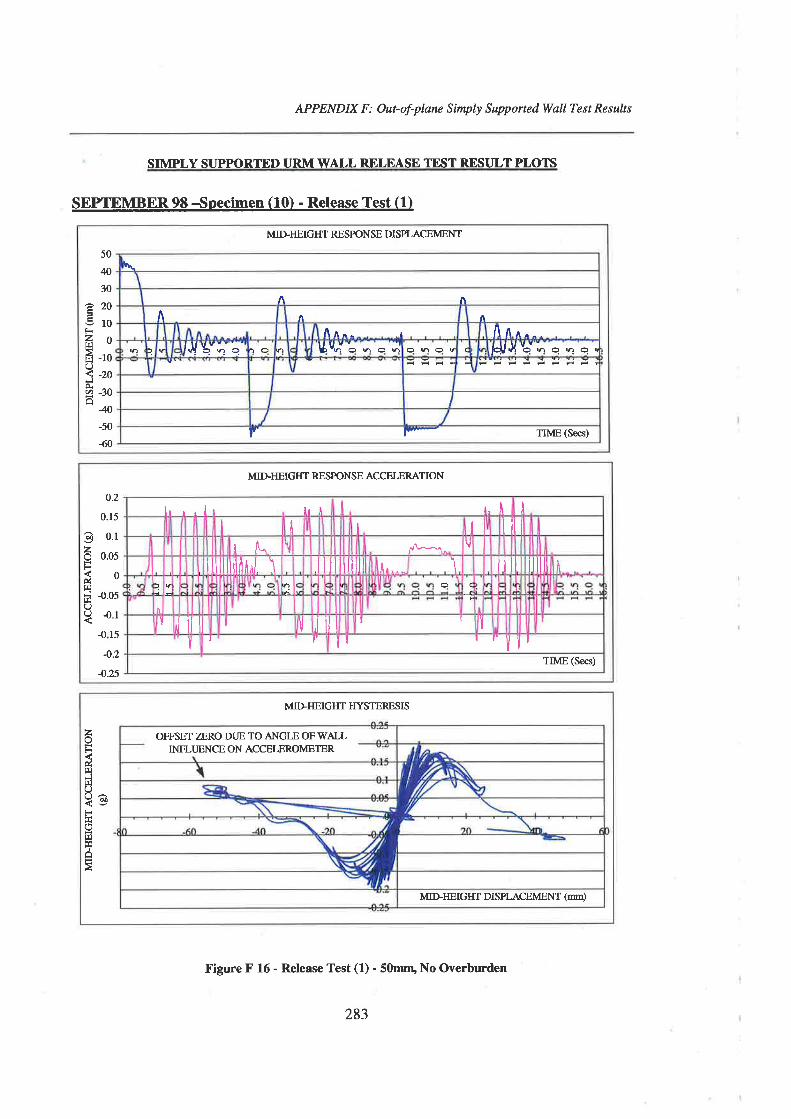
APPENDIX F : Out- of-planc Simply S upported Wall Te st Re sults
MIDIIEIGHT RESPONSE DISPLACEMENT
50
40
30
ê209roFZoÉ -to(J< -20ÈØ¿oâ
40-50
60
\
^f\
^/t
^Ân^^ I l\^^.--/{ bl"r- c'' ìo Bv-'ê - o 'l ohov l"U{"-:n q n q,
I
I
F- l"-. TIME (Secs)
SIMPLY STJPPORTED URM WALL RELEASE ÏEST RESTJLT PLOTS
SEPIEMBER 98 -Specimen (10) - Release Test (1)
MIDHEIGTIT }IYSTERESIS
zoF-
úf¡lJt¡l(J
?oF
f!,{,H
OFFSET Æ,RO DI'E TO ANGLE OFWALLINFLIJENCE ON ACCELEROMETER
MIDHEICTIT DISPLACEMENT (mn)
Figure F 16 - Release Test (1) - 50mnu No Overburden
MII>HEIGHT RESPONSE ACCELERATION
d)
zoF-
út¡lJt!IU
0.2
0.r5
0.1
0.05
0
{.054.1
4154.2
4.25
lr . . I r À¡ À I r, À I
I I I I tlilI /\- ll
Iv
Itlllllllfltñl I ilil il ilIil i, ". .- I ililt iililt H
ñ
4ao
J
I ,lilll ! ,llll I
I I' fr l" lf 'TIME (S€cs)
283

APPENDIX F : Out-of-plnnz Simply Supported WaII Test Results
MIDIIEIGIIT RESPONSE DISPLACEMENT
6050
â40à>30ItoËtoüoS -roÀâ"0
-3040-5060
^a
lt I .Âl^^-. . . . . . . . .r. . . . . -Â-e"--€\ çllJll6'ä o ; .i æ æ ,J K" cìO\\ON ¡v "UL r rOF ÑVÑ ç*n€ I r 'tt--. -a o oqr(þ 6 É È ol N vn€r*
V
TIME (Secs)
SEPTEMBER 98 -Soecimen (1) - Release Test (2)
Figure F 17 - Release Test (2) - 50run, No Overburden
284
MIDI#IGHT RESFONSE ACCELERATION0.25
0.2
o0
zFF
df¡lJE¡(.)U
015
0.1
0.05
0
4.05{.1
4.r54.2
4.25
I l.,L I l,,L t¡ I ¡I i I I illt a
I ililt^r.
\+t
A rt Å¡. I IlK"ä ar\
+.(
I'il I I II |'iil Ê É È É til fFll I I,,tll t' r | , IT I
TïME (Secs)
l4*WN
-
f/ \Y../
MIDHEIGHT DISPLACMENT (mTq)
MIDHEIGIIT TIYSTERESIS
gzoFdt¡lt¡¡U(J
-t¡ltsé
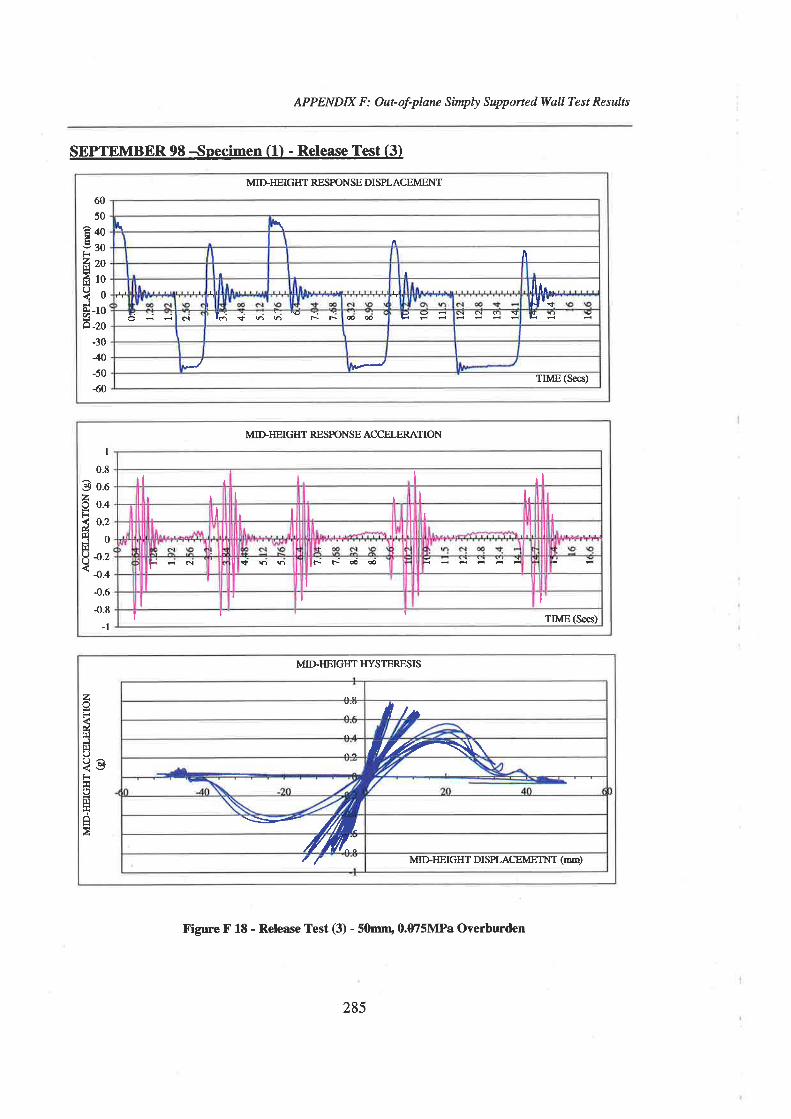
APPENDIX F : Out- of-plane Simply Stryported WaII Test Results
MIDHEIGIIT RESPONSE DISPLACEMENT
60
50
ê¿o930FZzoH
ãro?oJà-r0a_20
-3040-50
60
\ \^ lì
¡ I
r+ A + .lh^-.lJ,i
oÈÈ eì to$hhrr ææ N (r çr Y Fd
TIME (Secs)
SEPTEMBER 9E -'Snecimen (1ì - Release Test (3)
Figure F 18 - Release Test (3) - 50mn,0.t75MPa Overburden
MIDHEIGHT RESPONSE ACCELERATION
I0.8
O o.o
3 o.oF1 0.2úBoÍ!I4.2< 4.4
4.6-0.8
-t
rl I ¡lI I ¡ l,
I I I ¡ I
t--. I lËËdtdt
II I
I ITIME (S€cs)
MIDHEIGIIT ITYSTERESIS
zIF&f!Jr{O9ati
tÐ
LH
ltrtr?\
:-É?- //D-//flr^:
MIDHEIGHT DISPLACEMETNT (MM)
285
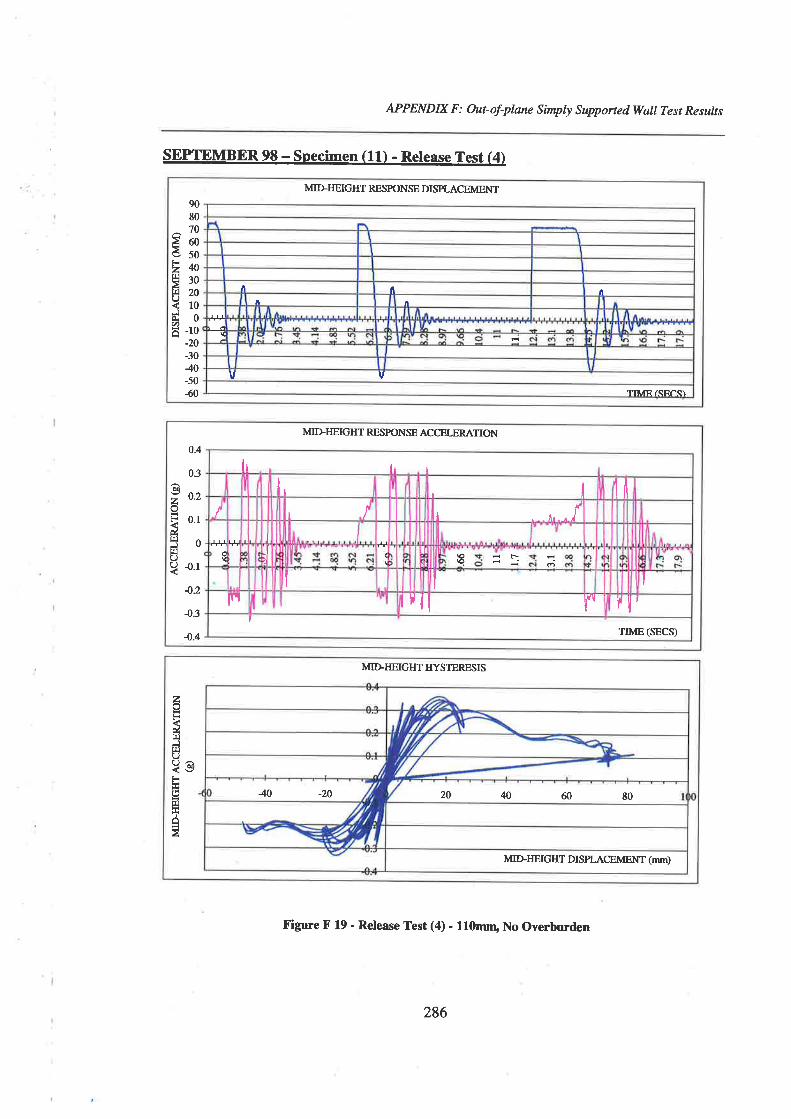
APPENDD( F : Out of-plnne S imply Supp orted WaIl Te s t Re s ults
SEPfEMBER 98 - Specimen (111 - Release Test (4)
Figure F 19 - Release Test (4) - 110mn, No Overburden
MIDHETGHT RESPONSE DISPLACEMENT
gF2Ët¡lUJÀ.t)â
9080706050403020100
-10-20-3040-5050
^ It^l n
.+L----9v
v vTTMF ISFI.SI
MIDHEIGHT RESPONSE ACCF'Í FR{TION
lr lr ¡
II 1l1
/ !I I . r... J
v
t+I
fV€6 I
I
Fl ¡rtl r ïl'TIME (SECS)
I
0.4
0.3
6> 0.2oã o.td3oql(J
? 4.r
4.2
{.3
4.4
40 -20 20 40 60 80
MIDHEIGIIT DISAACEMENT (rnn)
zLkút¡¡JfIJU?oF-
(5rÐ
H
=
MIDIIEIGHT ITYSTERESIS
286
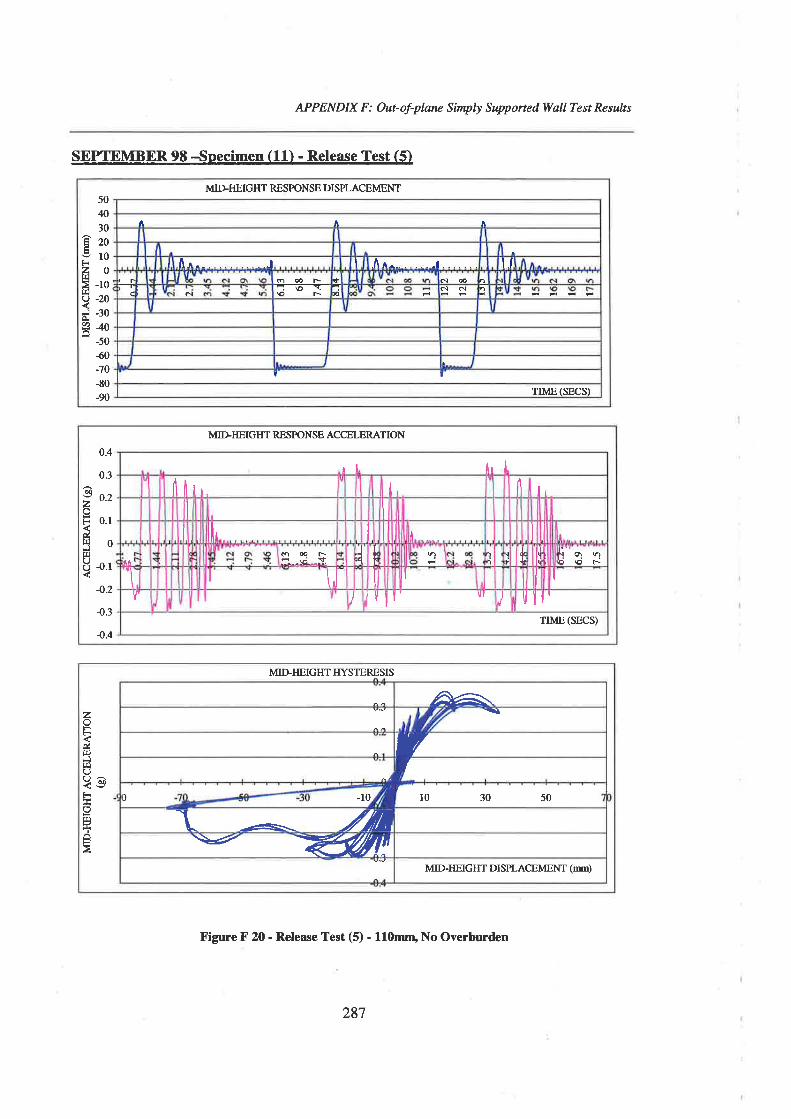
APPENDD( F : Out- of-plme Simply Supported Wall Test Results
MIDI{EIGITT RESFONSE DISPLACEMENT50,t030
€zo910trzof¡ì> _10f¡l220d -30
?4H
-5060-70-80_90
Â^ ^
I .lI¡.^-..... .... ..J I .Ân..-..... - -1 ....... t.tra;a
c c.¡
oæl-T--E---Y-þrü, ô¡€
c¡ ctn
I tTIME(SECS)
SEPTEMBER 9E -Specimen (111 - Release Test (51
Figure F 20 - Release Test (5) - 110mrn, No Overburden
i, l"¡lnil1,.il tI l,l l¡
ll, iIt
óær-,i+ I I II t ll V¡rlì".äd.'\
l \f II I
I
Ir vtIY II' I u lf '
TIME (SECS)
MIDIIETGTÍT RESPONSE ACCELERATION
0.4
0.3
ôe o.2zoF o.rá3otI]8 ¡.r
4.2
{.3
4.4
MIDIIEIGHT ITYSTERESIS
zot-dt¡lJt¡¡U?ots()H.{H
\-l
U^1
I0 -10
It0 30 50
\ Ã /Æ\Z &W
MID'HEIGHT DISPLACEMENT (m)
287
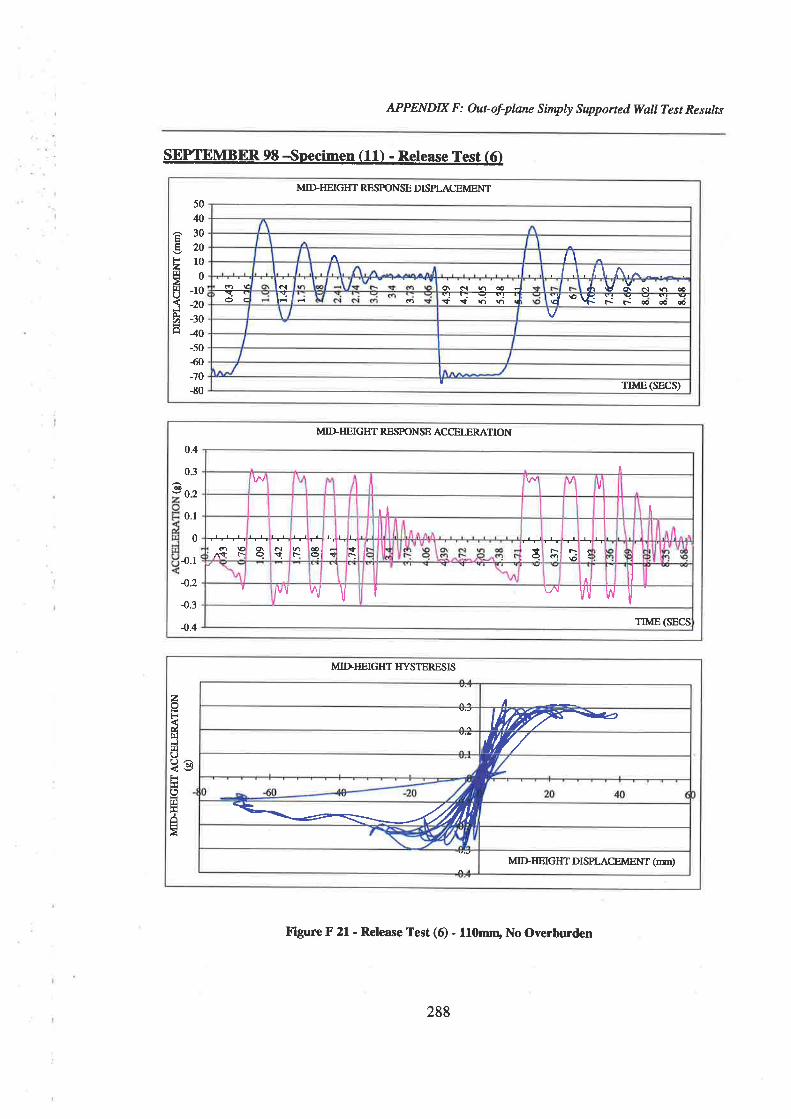
APPENDD( F : Out-of-plnne Simply Supported Wøll Test Results
MIDHEIGIIT RESPONSE DISPI-ACEMENT
5040
â30E920210goàI -r04¿oà¿oã¿o
-5060-70-80
/\O\C:-YToc
oli5 oôô¡aæ-úT<--tl+*qidJ
¿vx. hæ,d '\Ë Ë r æææ
ü TrME(SECS)
SEPIEMBER 98 -,Snecimen (11) - Release Test (6)
MIDIIEIGHT ITYSTERESIS
zoFår¡lFIf¡.1(JUt<(,HÁE
a
^IfrFT(r/
MIDHEIGHT DISPLACEMENT (nrn)
Figure F 21 - Release Test (6) , lfOmrn, No Overburden
MIDHEIGTIT RESFONSE ACCELERAIION
I
o.4
0.3
0.2
0.1
0
4.1
4.2
4.3
4.4
IV
rl t
o\o^1
¡:+
o\o o¡f
+r
r!ûq1
-h!
ç t-!tr I
r¡TF-a I6
-\(
tT
^I IV'l '/V \J liU iltr il '
TIME (SECS
288

APPENDIX F: Out-of-planc Simply Supported Wall Test Results
-INSTRON555045403530
eilÍrs2toEsÉo9-5j -r0à -tsã -zo
_25-30:354045-50-5560
I /ttl I tt,t
/li\^ II
VIn^,- -^-J .l
O\n;ó É1, ll Vi Q I dì l;Å: ^il l^i tL :IJU-lt- |
tt Ittttt tlt
SIMPLY SUPPORTED I]RM \ryALL PULSE TF.ST RESI]LT PLOTS
SEPIEMBER 9E - Specimen (L0l - 05IIz Half Sine Displacement Pulse
WALL ACCELERATIONS
-TWABWA
ozot-áf¡l¡E(J
0.60.50.40.3o.20.1
04.14.2-0.34.44.5
r â
rrr'¡! \vLvul
Figure F 22 - OSHz Half Sine Displacenænt Pulse, 50mm, No Overburden
289
-TABLEA0.3
o.25
0.2
0.15
0.1
0.0s
0
{.054.r
4.15
gvFF
áglJfI¡(J(J
I
I
¡^- -.1 I .l t^ I If Icìe{9 iprx.*ilt u lK q ö'l H i,--*. s q
oÈÈN oËhh c- r oo ?'-l = -¡lrw liTIME (SECS)
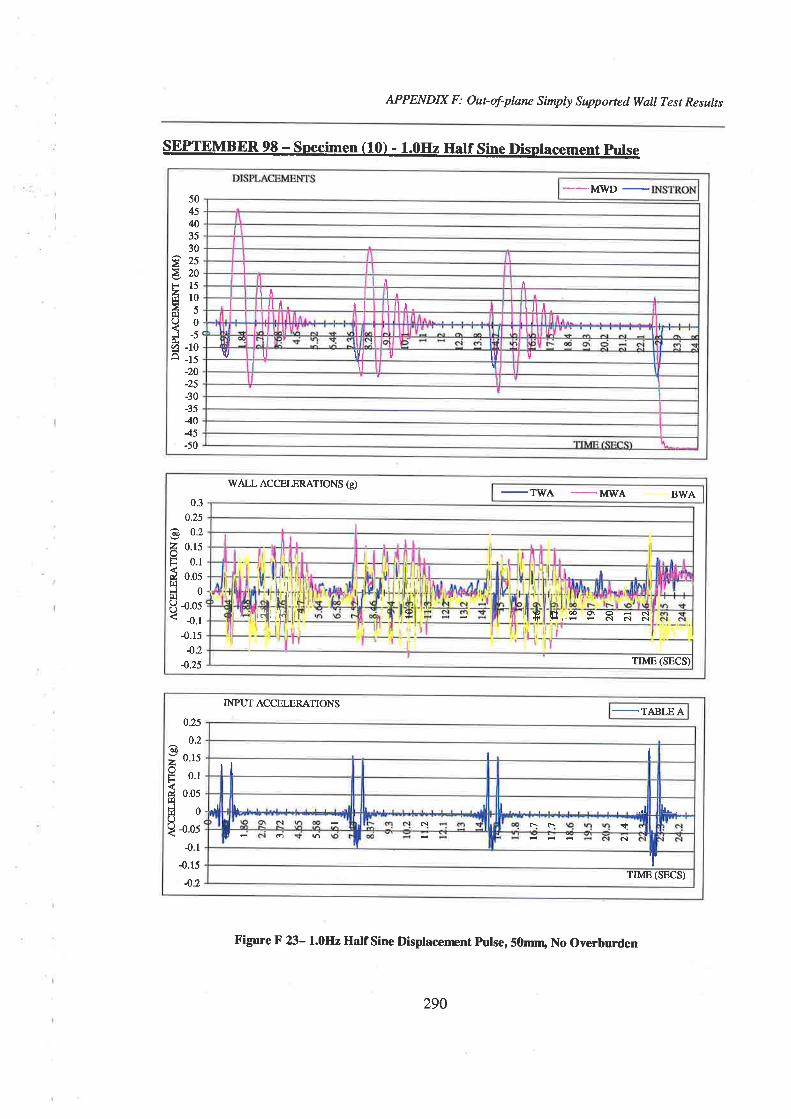
APPENDIX F: Out-of-pløw Simply SupponedWallTest Results
lr rll¡l I ì¡I lt t. tl lllr. Iilr.
l[l U tvl !, tv vÏ I
I
5045403530
9zs¿20F15ãtoà{t¡¡?9d-)I -10a -ts
:20_25
-30-f54045-50
SEPTEMBER 98 - specimen (10) - 1.0H2 Half sine Disolacement pulse
Figure ß 23- l.0Hz Half Sine Displacenrent pulse, 50mÍ¡ No Overburden
WALL ACCELERAIIONS G)BWA
c92FH
át¡l,.1l¡JUU
0.3
0.250.2
0.15
0.1
0.0s0
4.05{.1
4.154.2
4.25
J
¡ I
tJ.
.ll'
a.ï ,tt FNæO\OÊdH-ÈÉe^¡olN
TIME (SECS)
INPIj"T ACCELERATIONS
-TABLEA0.25
0.2
015
0.1
0.05
0
{051
{.1542
è¡)
zFF
úf{JHc.)()
-0
I Itl-t I^ I ...t lL-
o¡ r t- to cì
TTIME (SECS)
290

APPEND IX F : Out- of-plane Simply Supp oned Wøll Te s t Re sults
-INSTRON
DISPLACEMENTS
^I
I rl
I I^
lt
Ët- +
Yñ r; ;ld \o ( þqÊ
Iv vV lt
VUU
TIME (SECS)
25
20
l510âàJ
àYO2<ñ -10
? -rsJà -20
ã¿s-30:35
4045-50-55
SEPTEMBER 98 - Soecimen ((10) - 2.0H2 Half Sine Displacement Pulse
Figure f A - z,OHz Half Sine Displacerrænt Pulse,50mn¡ No Overburden
WALL ACCELERATIONS BWA
è0
zFkdfI¡Jf¡ì(JU
0.4
0.3
0.2
0.1
0
-0.1
4.2
4.3
I e^¡ o\dÉ
T
TIME (SECS)
ft
æ
INPT]T ACCEIÆ,RATIONS
-TABLE A
0.5
0.4
0.3
0.2
0.1
0
4.r4.2{.34.4-0.5
ÐzoFúÍ¡lJqìUO
I
I l. I
Ir I
o\ *I
I
I Tnvß(sgcs)
291
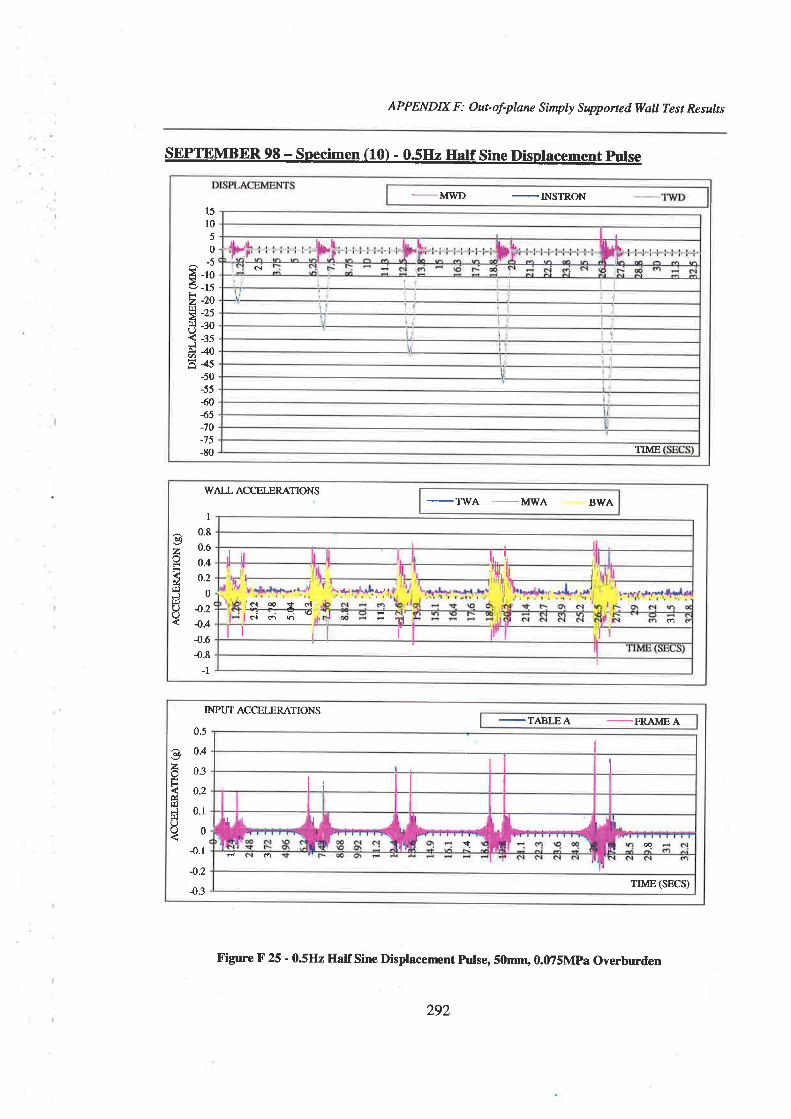
APPENDIX F : Out- of-plane Simply Supported Wall Test Results
-INSTRON1510
50
^-5ã -roô -tsL2 -20
B -rtFì -30< -?5J--ù40ã45
-50-5550{5:7O
-75-80
cq
TIME
SEPTEMBER 98 - specimen (101 - 05Hz Hatf sine Dispracement pulse
Figure F 25 - 05Hz Half sirc Displacenrent pulse,50mnu 0.û75Mpa overburden
_.ITVA BWAWALL ACCELERATIONS
I0.8
ä)
á 0.6
H 0.4Fâ 0.2
3otÐu 4.2()
4.6{.8
-l
Jr ILl,;lSü
'sl e9 r a1':
elohI
É d,rÊ rllI
o
I
INPUT ACCELERATIONS
-TABLEA -FRAMFAè0
zFF
dt¡ìJtI]U(J
0.5
0.4
0.3
0.2
0.r
0
-0.1
4.2
4.3
l¡I t L ) I
L-
É æó
TIME (SECS)
292
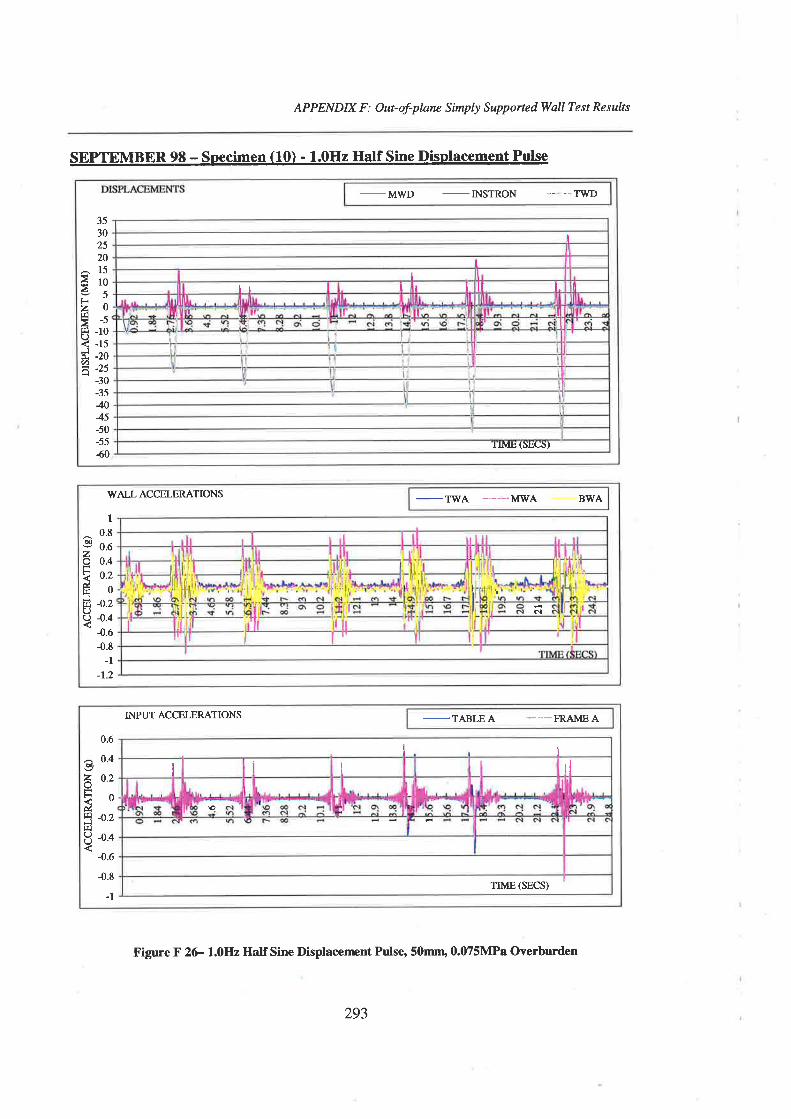
APPENDIX F : Out- of-plane Simply Supp orted WaIl Te st Re sults
-INSTRON - - TWD
J5302520
^15ãro¿:)
h
g-5àtJl -lo(J< _15
d -zo
â -rt-30-354045-50-55ó0
i
Ill t I I lt L I
rrMË, (sbr.-s)
SEPIEMBER 98 - Specimen (10) - 1.0H2 llalf Sine Displacement Pulse
Figure ß 2çl.OHzHalf Sine Displacenænt Pulse, 50mnu 0.075MP4 Overburden
BWAWALL ACCELERATIONS
I
^ 0.8€9 o.ezo 0.4
E 0.,fiod o.z
H.o{.6{.8
-l-1.2
,.
cl
INPUT ACCELERATIONS
-TABLEA
.-FRAMEA
d)
zFdHJç¡¡IO
0.6
0.4
0.2
0
4.2
4.4
-0.6
{.8-1
I
I II
I rl
\o
TIME (SECS)
293
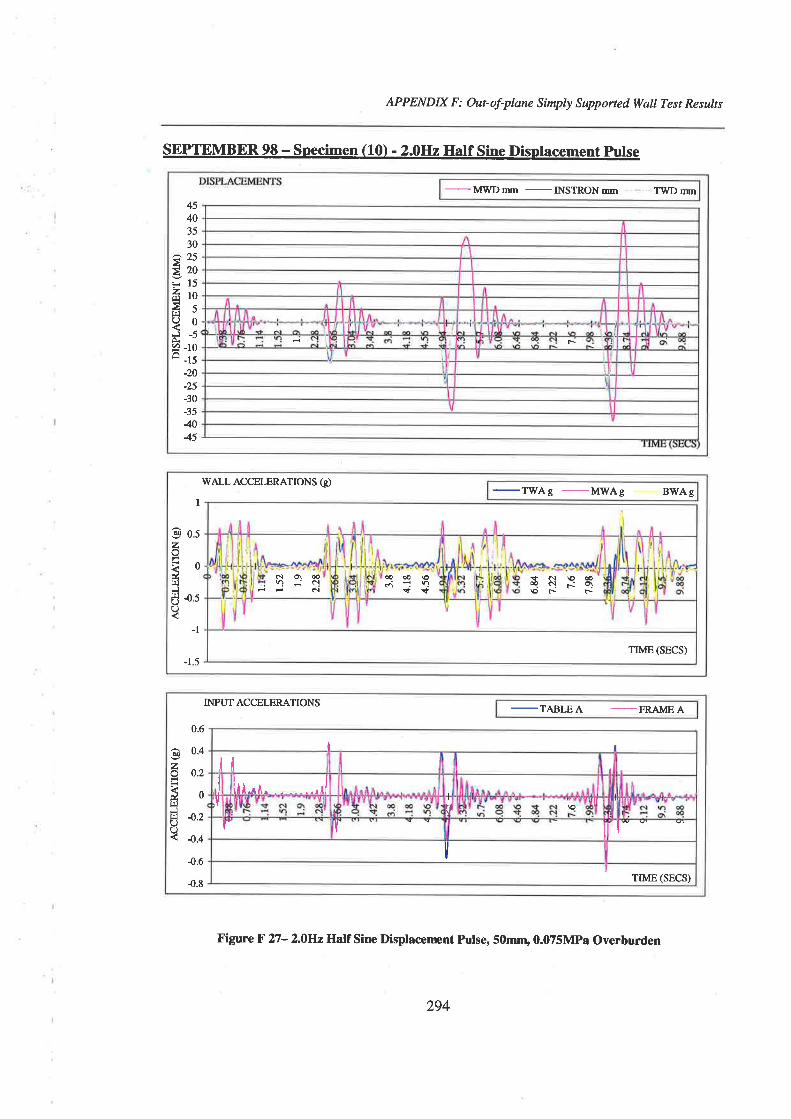
AP PEND IX F : Out- of-p Inne Simply Supp oned WaIl Te st Re sults
-MWDmm -INSTRONT¡n
-' - TWDm
F
45403530
^î<¿>20¡- 15
Étoà<Í¡¡?0d-52 -10ê -ts
-20-25-30-354045
SEPTEMBER 98 - Specimen (101 - 2.0H2 Hatf Sine Disolacement Pulse
WALL ACCEr-ERATTONS G)
-TWAg -MwAg BWAg
I
@oszoEoúrI¡J8{5(.)
-l
-l 5
tlc.¡€æoqqñq\orrææ\odi-1n.+*
ôl o\ oovl.jeìÊN
TIME(SECS)
INPUT ACCFT F'RATIONS
-TABLEA -FRAMEAè0
zFH
úÍ¡lJt¡ì(JU
0.ó
0.4
o.2
0
4.2
4.4
{.6
4.8
I I
ll I
I
uhl'u^ - -. ^^.rl t
il \o
r ï'
ITIME(SECS)
Figure ß 27-2.OHz Half Sine Displacennnt Pulse, 50mnr,0.075Mpa Overburden
294
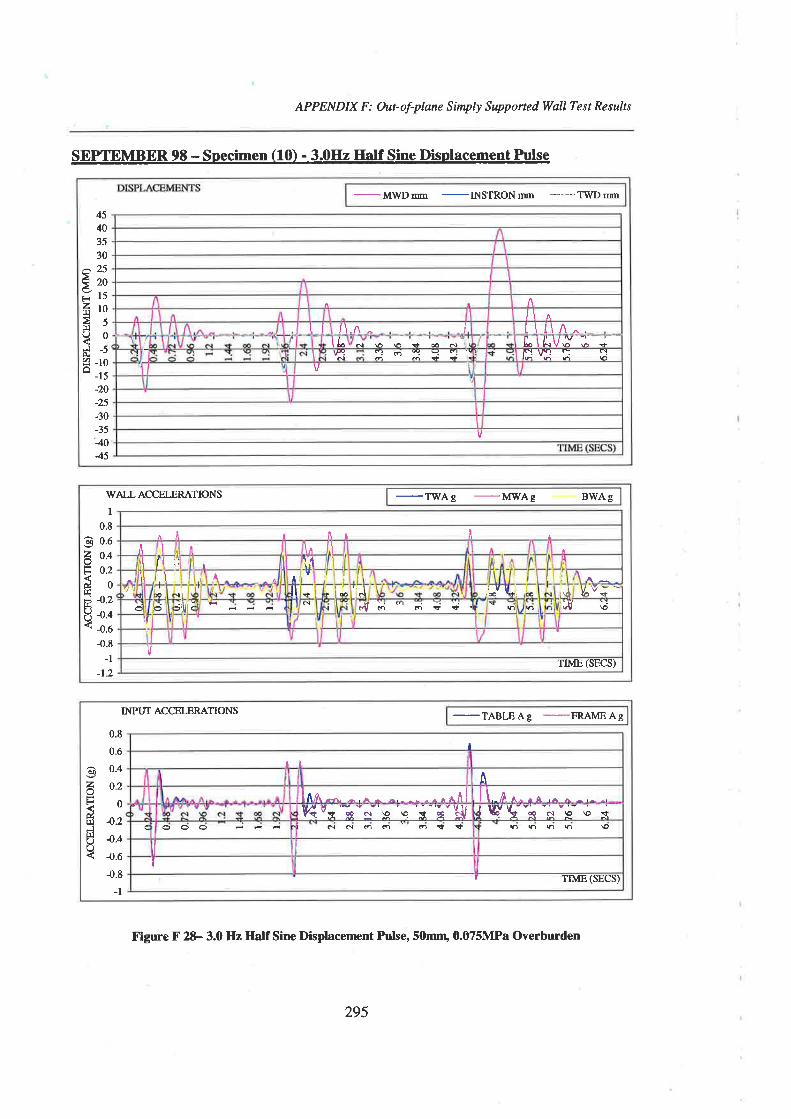
APPEND IX F : Out- of-plane Simply Supp orted Wøll Te st Re s ults
-MWDm -INSTRONnm
'_ __TWDm
45403530
^253roãrsãrot!?0J-5Â.I -roâ -ts
-20:25
-30-35'4045
t̂\ ntl /\.n ^ l t\l\^^.It d 6 6 6alñnYrti!
++!LII"V;" ¿ iFì\¡Q I E!lh h h 6
V
v
SEPIEMBER 98 - Specimen (10) - 3.0H2 Half Sine Displacement Pulse
Figure F 2& 3.0 Hz Half Sine Displacenrent Pulse, S0mrr¡ 0.075MPa Overburden
WALL ACCET.ERATIONS
I0.8
o 0.6
v 0.4
F o.ztofIìEì 4.2H ¡.¿Y ¡.u
-0.8
-l-1.2
-TWAg -MWAgBWAg
^ I ¡ il
iì Ä \¡ I
I ft ;': ¡ 'ìtit '\ ,{ Â À-
a .¡l il rd¿ 'it ,'-v I a j.¿ V"v]--j'l/i¿ N I "{ ;i oçç. "\,t
I
l/TIME (SECS)
INPUT ACCEIÆRATIONS
-TABLEAg -FRAME Ag
0.8
0.6
o o-4
a o'2t<^
ã 4.2J8 q.4(J
4.8-1
I¡t
A
K vs *ç-.-'e 'q -s-'i" LU
ll,-n^^¡a,¡a^,^-,d l4'ç ï ï"e- ü :
ôoo ôlcìoo o{É hhhn\o
ITIME (SECS)
295
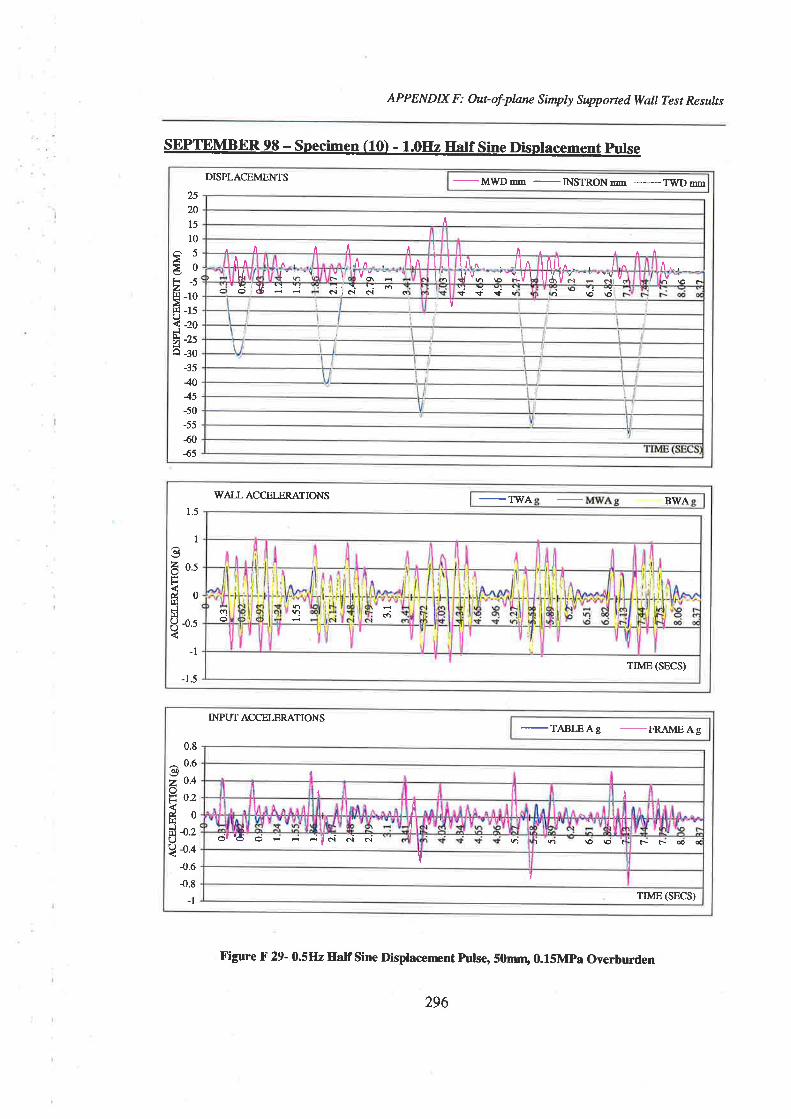
APPENDIX F: Out-of-planc Simply SupportedWall Test Results
-MWDm -INSTRONm
_--ITID mr2520l510
5
0-5
-10-15-20-t{-30354045-50-55
{045
,l
^rÀ Âil I ¡t ¡l¡t
Àr I Ì.nl1n Ul.n . _lln ln,[^ I Ì1 ..H, t' ;-\ r V ô Jlv- ;-fvI llÁl/ i" - -'^.\ v.
F'õjü ...¡ ...: c:, r. r: ocìjcl N ç{!tq
-. I -: -ô9\Otv
àF.214àIrl(JJÀ(hâ
DISPLACEMENTS
SEPTEMBER 98 - specimen (101 - L.0H2 Hatf sine Displacement pulse
Figure ß 29- osHz Half sine Displacenænt hrlse, 50mnr,O.l5Mpa overburden
BWAWALL ACCELERATIONS
1.5
Igé o.tFF4d0t¡lJlllI4.5
-t
-1.5
a)o
ql o
TIME(SECS)
INPUT ACCELERATIONS
-I'ABIÆ Ag
-FRAME Ag
0.8
0.6
0.4
o.2
0
4.24.44.ó4.8
-1
o2zkdt¡lJqlUU
t tlt
of 'ð-o .; ..': .j¡f ñ cr or \o<j't rroodI
T
TIME (SECS)
296

APPENDIX F : Out- of-plnne Simply Supp orted Wall Te st Re sults
SEPIEMBER 98 - Specimen (1.01 - 1.0H2 llalf Sine Displacement Pulse
-MWDm -INSTRONm
*_*_TWDm4540353025
a2o¿1<310t-sãól-sE -ro< -r5d -zo2:25â -¡o
-354045-50-555045-70-75
tt^
tttìJla l n^ n I I Il r
r ILllt/\^-I-yÑ].=*-Y.E".ai I t I I't' t, e
O\cìnaÒ Ê lk Att r o õ ( .ltlÍr- ô õ,(r v F- tf
v
ù
Figure F 30- f.0Hz IIaIf Sine Displacenrcnt Pulse, sOrrun,0.15MPa Overburden
-TWAg -MWAg BWAg
WALL ACCELERATIONS
1.5
I
0.5
0
{.5
-1
-1.5
€9vFr
át4JE(J
I ¡ /1A¡ Itti t /1iil Iflh¡ iil/
ti-+ìl h
I
lr6l:
I'lrT r'l
{ I ïli !rTIME (SECS)rv
-TABLEAg -FRAME Ag
0.4
@ o.zz9oFá, q.zf¡l
d.oú ¡.04.8
-1
-1.2
I,l il I À
Àr I ¡ ,1. ¡.
llr WI fIlr(P tf cl'+¡"- o o ç {l f $f lüi r'n n t{ ? !$." ræ0(
v
I I ITIME (SECS)
0.6
INPIJT ACCELERATIONS
297
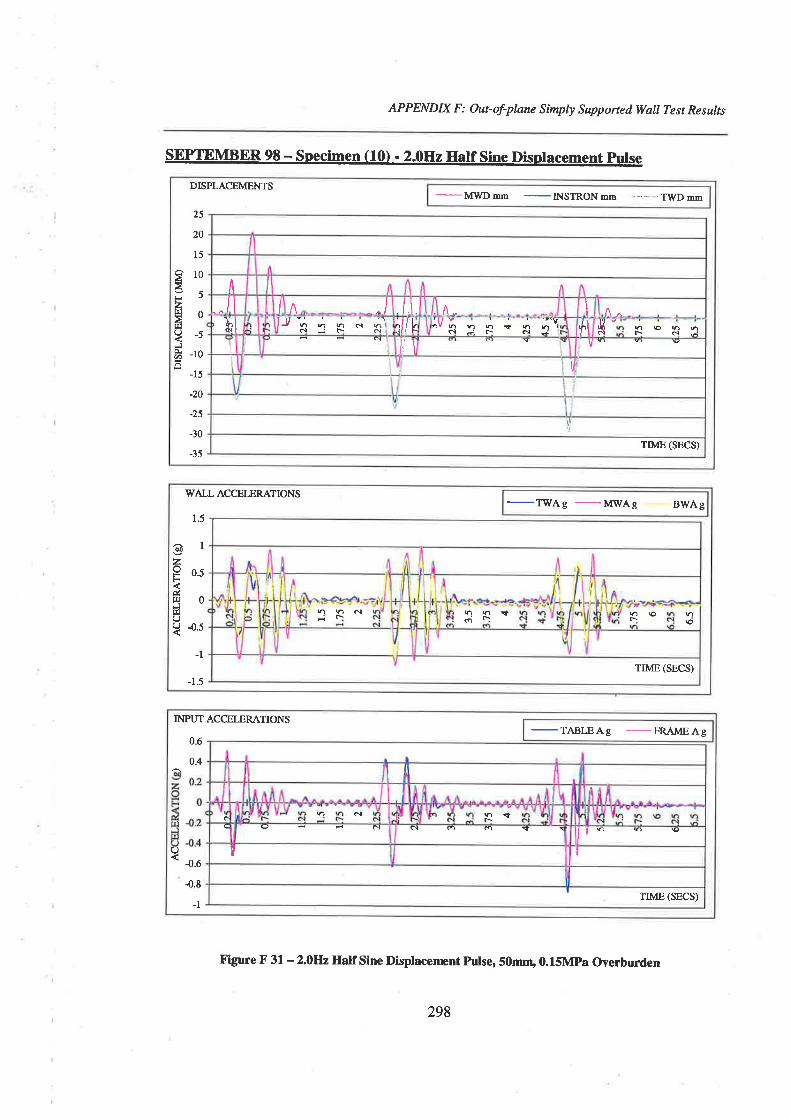
APPENDN F : Out- of-plnne Simply Supported WølI Te s t Re sults
SEPTEMBER 98 - specimen (10ì - 2.0H2 Half sine Dispracement putse
DISPLACEMENTS
-MWDmm
_INSTRONnn --._, .TWDmm
e2FzgEJCLØo
25
20
15
10
5
0
-5
-10
-15
-20
-25
-30
-35
fl
^/t I A ^l I^-
I Â^,ulñl
rJ;;;dit- Nd :ì// Ë ;V r didj Ét ,l{- ;c.¡ F € d,Á
11 l ' v ''\
Vr
TIME (SECS)
WALL ACCELERATIONS
-TWAg -MWAg BWAg
c9vFtsúr¡lJf¡l(J(J
1.5
I
0.5
0
4.5
-l
-1.5
hôtr ttno r \or h\ô
TIME (SECS)
Figure F 31 - 2.0H2 HaIf sine Displacenrcnt pulse, 50mrr,0.15Mpa overburden
298
INPIIT ACCEIÆRATIONS
0.6
o.4
O{ {.0-0.8
-TABIÆAg -FRAMEAg
¡
Co¡ nrtr
O N R o ç fn I
f, I
TIME (SECS)-1

AP PENDIX F : Out- oJ-pløne Simply Supp orte d Wall Te st Re s ults
-II\¡STRONmm
r
30252nt5
^10ãoF. -szE -10É -rs2-?0d-ã2-nÊ -35
445-50-55a65:70
SEPTEMBER 98 - Soecimen (11.1 - 2.0H2 Half Sine Displacement Pulse
Figure F 35- 2.0H2 Half Sine Displacenrent Pulse, 110mrn' No Overburden
-TWAg '-MWAg BWAg
WALL ACCELERATIONS
0.5
0.4
o 0.3
v 0.2ã o.l
Éod 4.1(J
? 4.2{.34.44.5
rr
TIME(SECS)
-TABIÆ Ag
-FRAME AgINPUT ACCELERATIONS
0.6
o.4
0.2
0
42
44
-06
48
€9zot<úf¡¡Jf¡lC)
N¡- \o Éo qr æô¡æ€
I
I)
TIME (SECS)
302
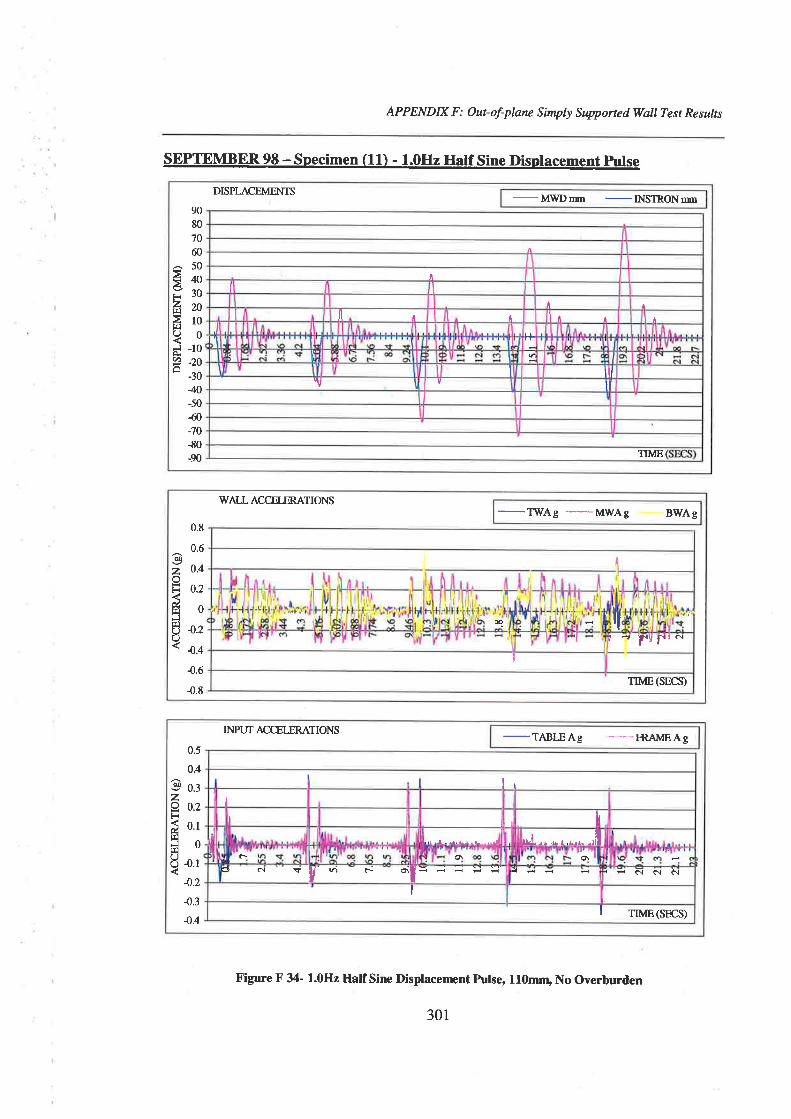
APPENDIX F : Out- of-pløne Simply Supported WaII Test Results
-MWDm -INSTRONm
DISPLACEMENTS
90807060
^50!no;30ãroEro?0dl0? -20ô
-3040-50{0:7O
s0-90
^
tft ,l
^lr t ¡
t-t-
-I ill
ry v I
TIME
SEPTEMBER 98 - specimen (11) - 1.0H2 Hatf sine Displacement Pulse
Figure F 34- 1.0H2 Half Sirrc Displacenænt Pulse, 110mn, No Overburden
301
WAII ACCELERATIONS
-TlYAg -MWAg BWAg
0.8
0.6
0.4
0.2
0
4.2
4.4
4.6
{.8
€9zF<
o¿
3r¡lC)(J
æïf| *r t{yFrN
I
TIME(SECS)
INPUTACCEITRATIONS
-TABLEAg --FRAMEAg
0.5
OA
0.3
0.2
0.1
0
4.1
4.2
4.3
4.4
gzFr
úf4F.lr¡Uc)
l,I i
,t ¡ . -.-' --. .,.d ¿d"-^ .t.,....iltr o\ ô
é È-tclT oif = -ì : :ì :' { ià ñdòì
I
I rnm(srcs)

APPENDDI F : Outof-plane Simply Supported Wall Test Results
-NfwDllm -INSTRONm
DIS
555045û35
9¡oäzst- 2ßÁsãto(J5ÍóØ-\â -lo
-15-?T-25-30-35445
r
SEPIEMBER 98 - Specimen (11) - 1.0H2 rralf Sine Displacement Pulse
Figure F 33- 1.0H2 HaIf Sine Displacenænt Pulse' llûmn¡ No Overburden
-TWAg -MWAg BWAgWALL ACCELERATIONS
t,,
l¡ irr If-r.l ¡
II
H{
f' lf I |Nrl r! 1 Í! TITIME (SECS)
0.4
0.3
o.2
0.1
0
-0.1
4.2
{.34.4
ozI3áfIlJt¡lUU
INPTJT ACCEIÆRATIONS
-TI\BLEAg -FRAMEAg0.3
0.25
0.2
0.15
0.1
0.05
0
4.054.1
4.r54.2
à0
zot-dÍ¡l¡t¡ìUU
I I
rl Ill
1
tl'lü' .ì ñ ì l&; + .r r;' --r di oil HF(I
lllTIME(SECS)
300
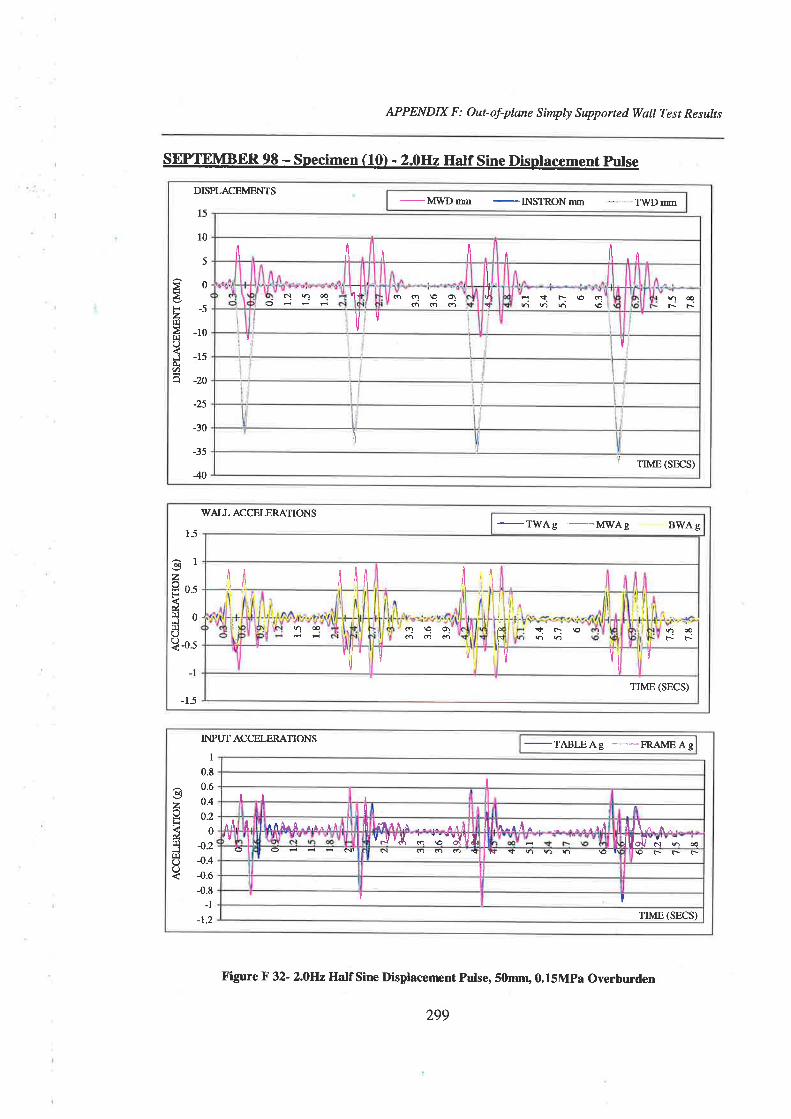
AP PENDIX F : Out- of-plnne Simply Supp orted Wøll Te st Re sults
DISPI-ACEMENTS
-MWDm -INSTRONrm -- .. -TWDmn
Àt<zf¡làl¡,¡C)
JÀ(t)H
15
10
5
0
-5
-10
-15
-20
-25
-30
:35
-40
Âll iili fiit ,A
elhæ 1l oc.l9qóoo ¿I -1 Aì\oGlnnh\o vl0q
rrl/
ll
t I
I:. TIME (SECS)
SEPTEMBER 98 - specimen (10) - 2.0H2 Hatf sine Displacement pulse
Figure ß 32- z.OHz Half Sine Dis¡¡lacenrcnt Pulse, sùrun, 0.l5Mpa Overburden
WALL ACCELERATIONS
-TWAg -MWAg BWAg
¡fl¡Å il t
næ d!9qooo
I'I
t-ld
lr1¡ì\o noqrr
I f I ¡
ìj UI r I T
TIME (SECS)
15
O129 o.sF
áf{0t!(J?¿s
I
-15
INPUT ACCELERATIONS
-TABLEAg -FRAMEAg
è0
zo,kúslJt¡)QC)
I0.80.6
0.4
0.2
04.24.44.6-0.8
-1
-1.2
I¡l I
I¡r l1 t rlìA¡4,¡.¡"rÀ I m ¡1'1À.4 .-.- ^"Â flt ¡r-aÅo .^ --..¡.i f,.|\ .n ¡ ,iY ï_\'ïg ; ;-"JTI Jtt",rl'¡i'; oO
I a Nr N ! Ì1 ç \Ô l, p r r r
ì ITIME (SECS)
299
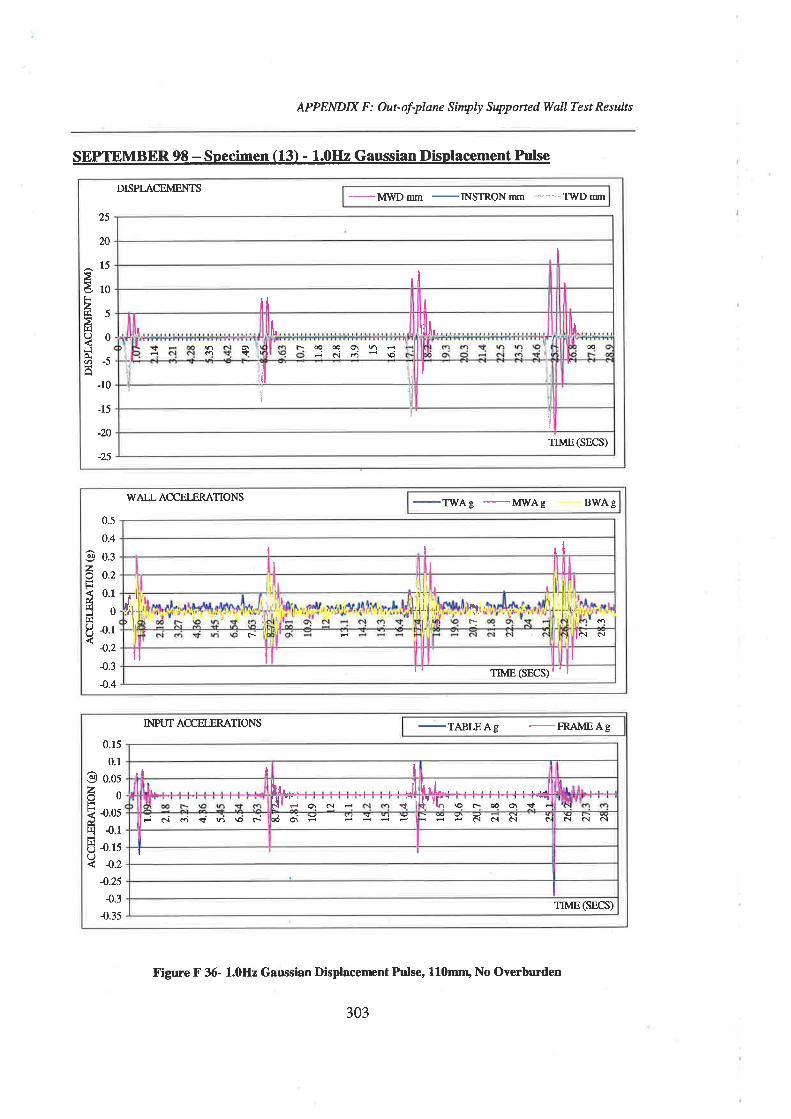
AP PENDD( F : Out- of-plane Simply Supp orted WøII Te s t Re sult s
-MWDmm -INSTRONm *--=-TWDrmDISPLACEMENTS
25
20
^15äroF2f¡¡ 5ar¡l?0JÀØ-)â
_10
-15
-20
-25
I
IilI t tlh i
æT aÉ d \cit- oqçq
iNO
flI
!l
}
¡
TIME(SECS)
SEPIEMBER 98 - Specimen (1.3) - 1.0IIz Gaussian Displacement Pulse
Figure F 36- 1.0H2 Gaussian Displacenrcnt Pulse, 110nur¡ No Overburden
-TWAg -MWAg Bv/AgWAII ACCELERATIONS
II I
¡
F-
Iôl
t:r Ilft, l,
l. Ër| 1'.
lr \lô¡ ñ
Iil I
rnm, lsncs¡r'Il¡
0.5
0.4
O o.¡
é o.zL¡< 0.1ú5of¡ìI ¡.r4' 4.2
4.3
4.4
-TABLEAg -FRAÀ,IEAg
0
4.05{).1
4.154.2
4.254.3
{.35
'l I Ih¡^--. JIl{l: o\e{É ;-i lrll"r
f -!ñFt
OræO\ç.-elóçn\oc- 000\È ÈÈôìclclc ô{ (\ e.l
TIME(SECS)
INPUT ACCELERATIONS
vFiúBÍllU(J
0.r5
0.1
@ o.os
303
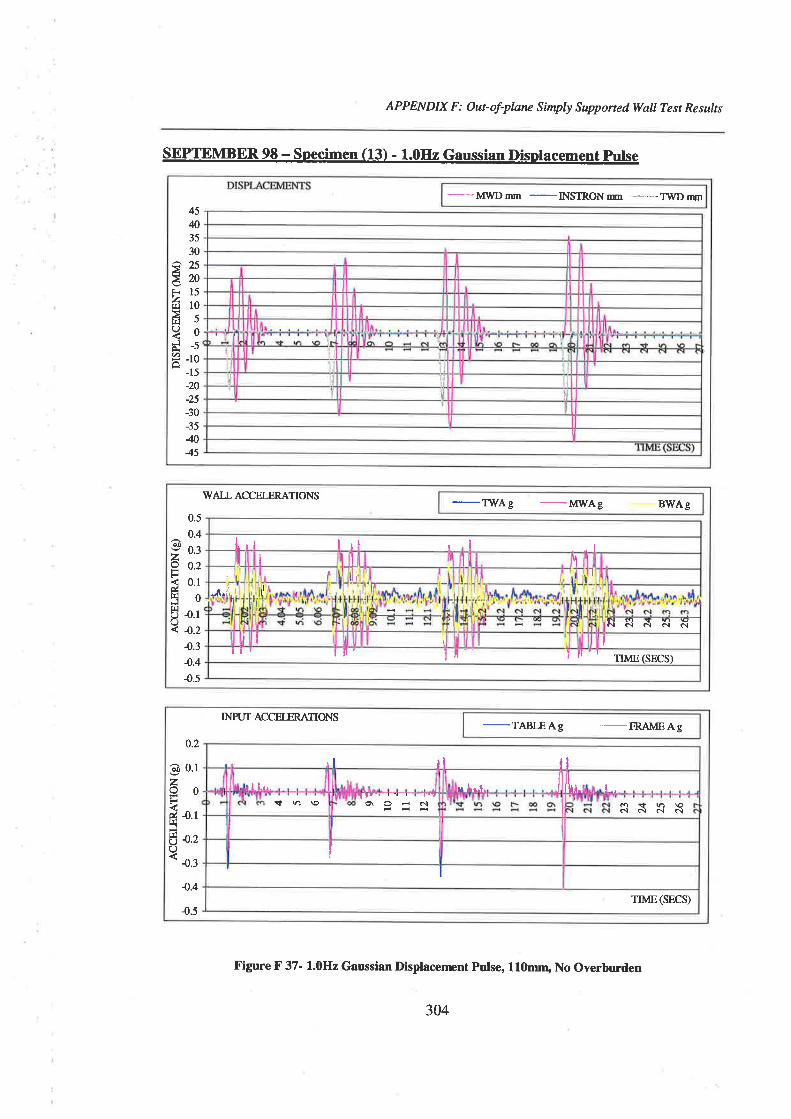
APPENDIX F : Out- of-plane S imply Supported WalI Te st Re s ults
-MWDmm -INSTRONm -----TWDm
45û3530
â25À¿nF15ãroã53:Fr -J
F -roH
-15-m_25
-30_35
445
SEPTTDMBER 98 - specimen (131 - 1.0H2 Gaussian Displacement pulse
Figure F 37- 1.0H2 Gaussian Displacenrent Pulse, 110mrr, No Overburden
\ryALL ACCELERATIONS
-TWAg -MWAgBV/Ag
0.5
0.4
0.3
o.2
0.1
04.14.24.34.44.5
èo
2oFF&3f¡lc)(-)
Irl ,. II II rl
I I-^.i1.'i tf
I NôIeìôINI
ll ' ln' Ir"' I lr ' I TIME (srcs)
INPUT ACCELER,A^TIONSC
-FRAMEAg0.2
o 0.1z9oFd 4.13I ¡.2U< 4.3
4.4
{.5
¡l ¡l tlI l¿^,
{r¡\o 'l tr.r r 1 r
O\OÊ ôì¡ l^.1 / lL^.
^-, Õçn\ocl c.¡ ô¡ N
TTME(SECS)
304
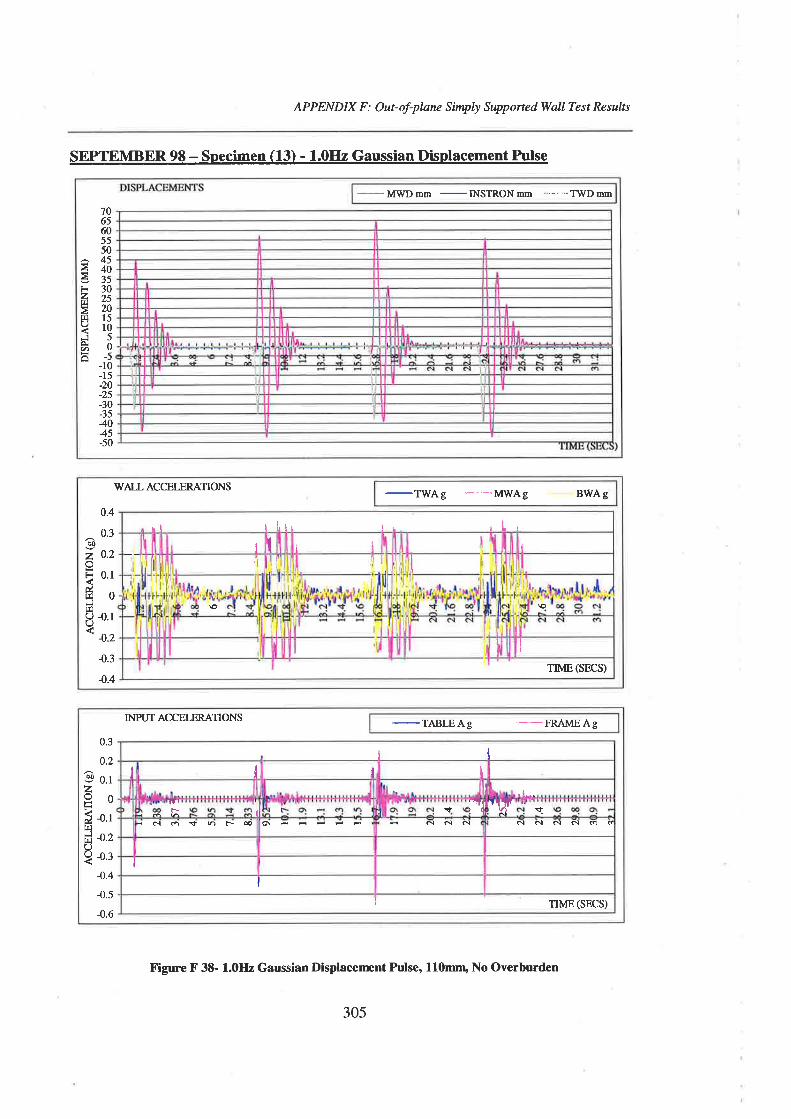
APPEND IX F : Out of-plnne Simply Supp orted WaIl Te st Re sult s
_M.WDmn _INSTRONnn -____TWDmm
706560555045
È40e35F. 30Z1<q2ññ15Yl0J5àoã-s- -10
-15-20-25-30-354045-50
SEPTEMBER 98 - Soecimen (13) - 1.0IIz Gaussian Displacement Pulse
Figure F 38' 1.0H2 Gaussian Displacenænt Pulse, 110mÍL No Overburden
-TWAg -MWAgBWAgV/AII ACGT.ERATIONS
0.4
0.3oz 0.2oE o.t
ßo,lt¡lg {.r'n.2
{.34.4
t l[' trl Ilr
t I I I
I
I
III
I
€ \o
I
TIME(SECS)
INPUT ACCEI.ERATIONS
-TABLEAg -FRAMEAC0.3
0.2
0.r
0
4.1
4.2
4.3
4.4
{.5{.6
4ztrúsr¡lc)O
I
I ¡I I i
TFc- il t i-l "
!-..rlT {re.,¡o{nFæ O\ÈÊÈid e{ ôì e.l cì c.¡ ê.¡ cl o d
I
I
ìTIME(SECS)
305
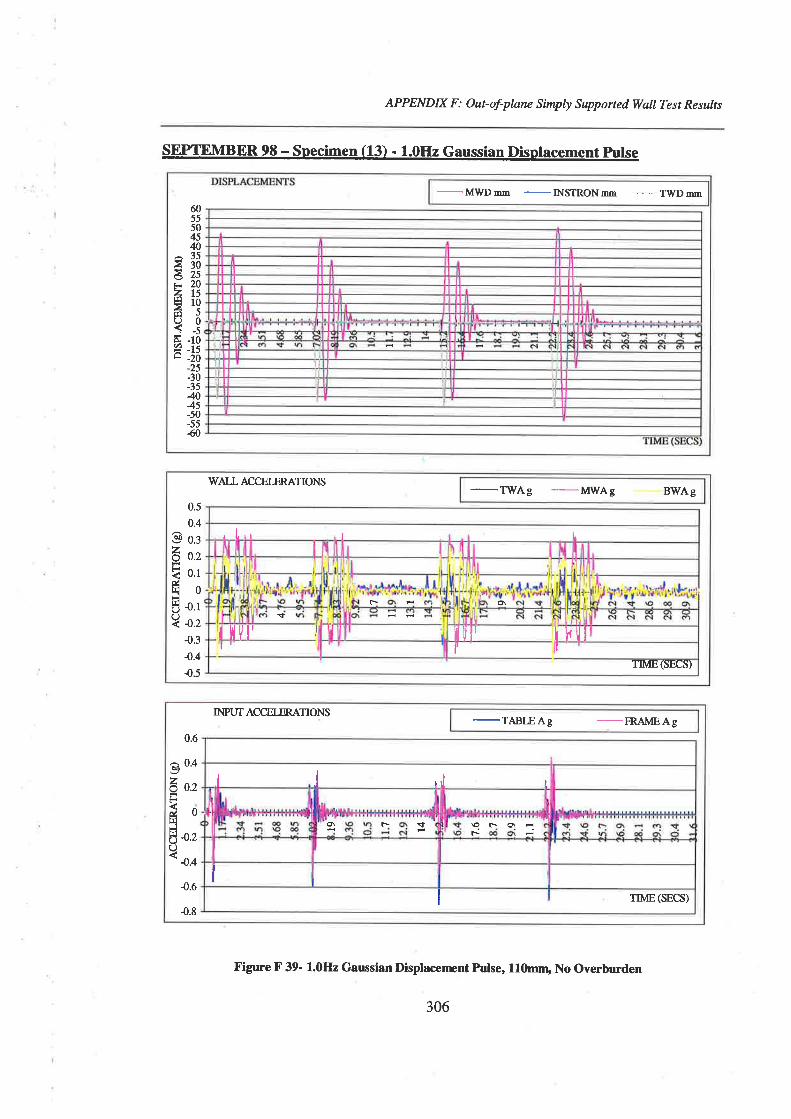
APPENDIX F : Out- of-plane Simply Supp orted WalI Te st Re sults
-MWDmm
_INSTRONmm ____-_T.WDmm
6055504540
^35ãroázss20zt5Erof¡l JOOd -ro? -tsÅ -20
_25-30-354045-50-5550
SEPTEMBER 98 - specimen (13) - 1.0H2 Gaussian Disolacement Pulse
X'igure F 39- 1.0H2 Gaussian Displacenænt Pulse, llùûr¡ No Overburden
WALL ACCELERATIONS
-TWAg -MWAgBWAg
e9zoFúf¡l'-.1fJl(J(J
0.5
0.4
0.3
0.2
0.1
0
{.14.24.34.4{).5
¡ t" rl I L
F-
so\
'l lllJl' rl
II U t', it liUI I
TIME(SECS)
INPUT ACCELERATIONS
-TABLEAg -FRAIT,EAg0.6
o0¿á 0.,tr¿o3E o.zU<4t
4.6
4.8
I I ,J t
o\ tr- T 91..
c- o\
ïïME (SECS)
306
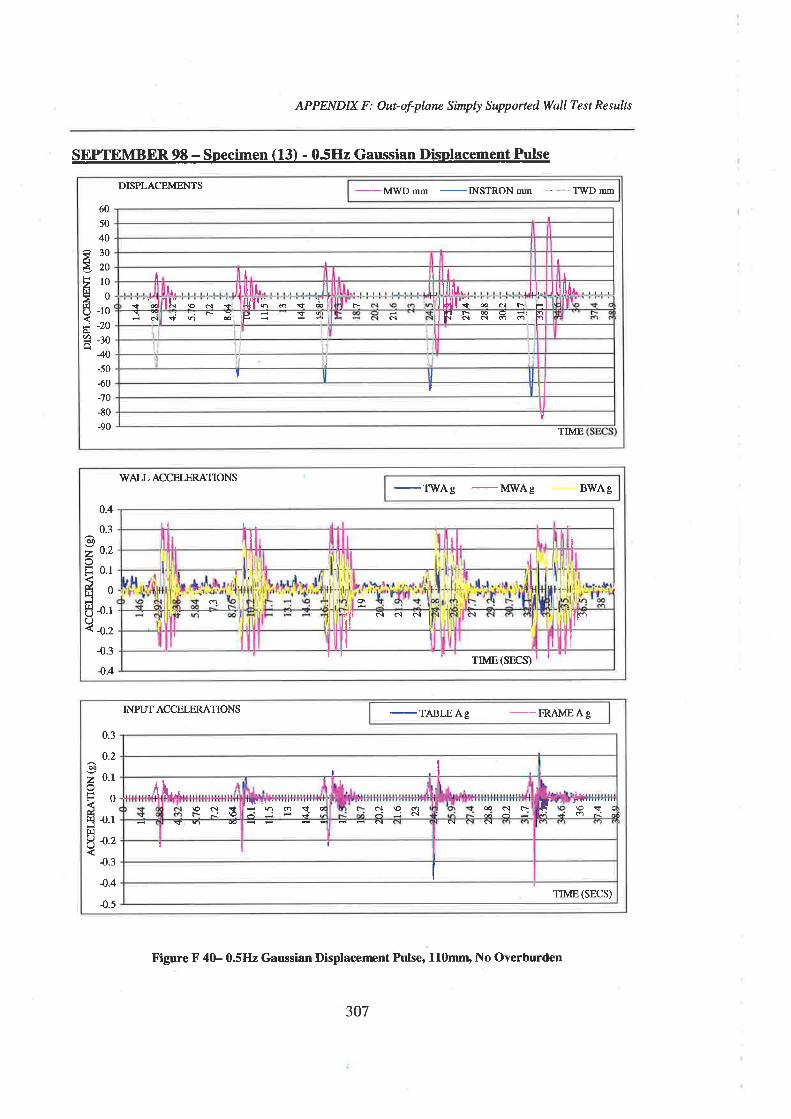
APPENDIX F : Out- of-plane Simply Supported WalI Test Re sults
_MWD mm
-INSTRON
mm -.- -TlyD mm
I
IIl I
.1ilf11". ,, . ,lilth. i. t.l¡. lllflhr
cìtq---1---F IK f9d
:t n æ'¡{t'; o{ ;;I9:Srr) ñ
lHll'; ød rl illñ r æ o r. þlhr d d o o Ì1
I
I
60
5040
e30âto2togoE -roÍ -zoctr2 -c¡â--
_40
-50
{0:70
-80-90
DISPLACEMENTS
TIME
SEPIEMBER 98 - Soecimen (1.3) - 05Hz Gaussian Displacement Pulse
Figure F 40- 0.5H2 Gaussian Displacenænt Pulse, 11ùûn' No Overburden
WAIIACCEI-ERATIONS
-TWAg -MWAgBWAg
0.4
0.36Z o.z
F 0.1
*oFl
I ¡.rO< 4.2
{.34.4
rl I i
I II I
ì¡ì
Io o\
il' ô.t cì ôlfl"'
rnrlSnCS¡l Ill
-T'ABI.EAC -FRAMEAg
III
,{tr,,F ü"o".;io*'^\o el sfr-.'9
'llr!l-.....''.''.''',.'Èho!+o-i--..:Èi,
ôt€o/i -.,: cì F-æeìv
fI
TIME(SECS)
0.3
0.26á o.toÈ-O
E o.tt¡l8 {.2
4.3
4.4
4.5
INPUT ACCELERATIONS
307
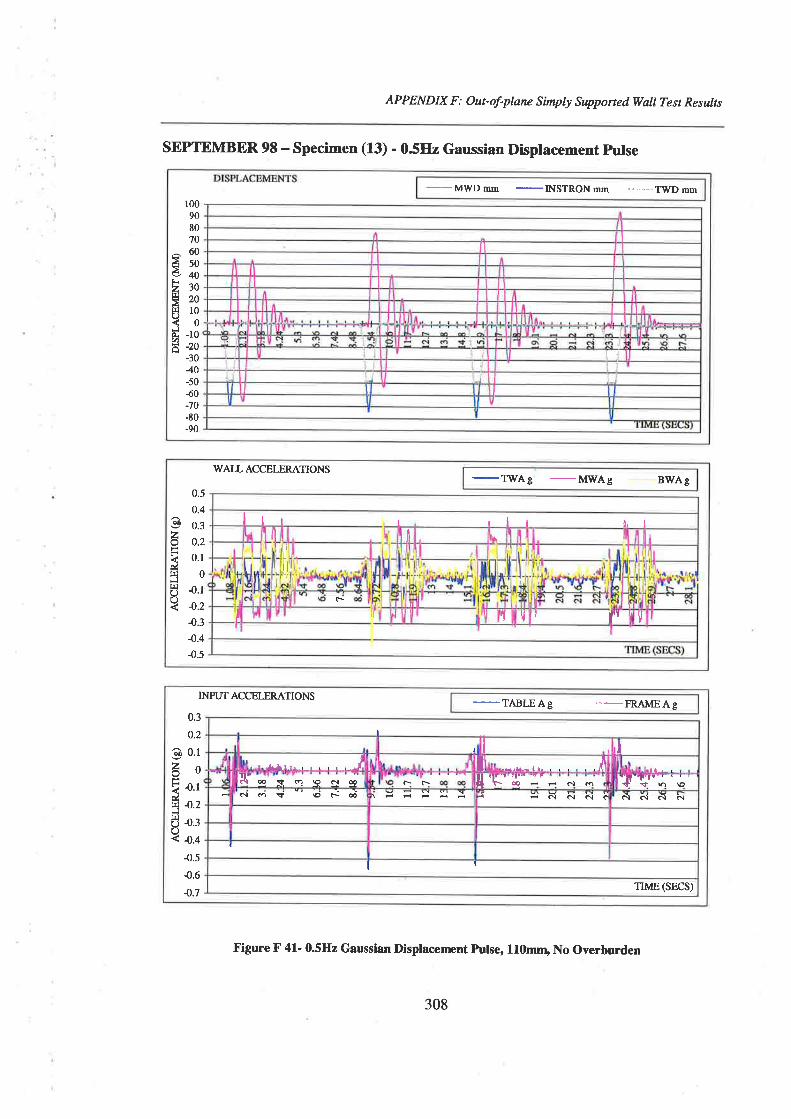
AP PEND IX F : Out- of-planc Simply Supported Wall Te s t Re s ults
-MWD mm
-INSTRON
mm ---'--TWD mm1009080't0
^60Ès03n230Ërot¡¡ l0Vod -roâ -ro
-3040-50{0:7O
-80-90
SEPTEMBER 98 - specimen (13) - 05Hz Gaussian Displacement pulse
Figure F 4f- 05IIz Gaussian Displacenænt Pulse, llùrun, No Overburden
-TWAg -MlgBV/Ag
WAII ACCELERATIONS
lrr rlI ¡, I
F-
ll I I
I I q ì{ I trr l,
0.5
0.4
0.3
0.2
0.1
0
4.14.2{).34.44.5
€9zoH
ú3t¡lOO
INPUT ACCELEKA*TIONS
-TABLEAg -FRAMEAg0.3
0.2
ô 0.1zotsúf4Èt¡lUU
0
4.14.24.34.4{.54.64.7
I
¡ ¡ ,lå.\1a., ,, ,J
R' 09sc¡9c¡ æ ¡- È-
I E¡Lh,¡¡ . .lil
H K''äi' =Êc¡ol¡-' ,r'lf-.F.r'' . 'çtn\o
el(îr\oræ Èôlelô¡e ô¡c¡e.¡ct
I
I f
TItr4E (SECS)
308
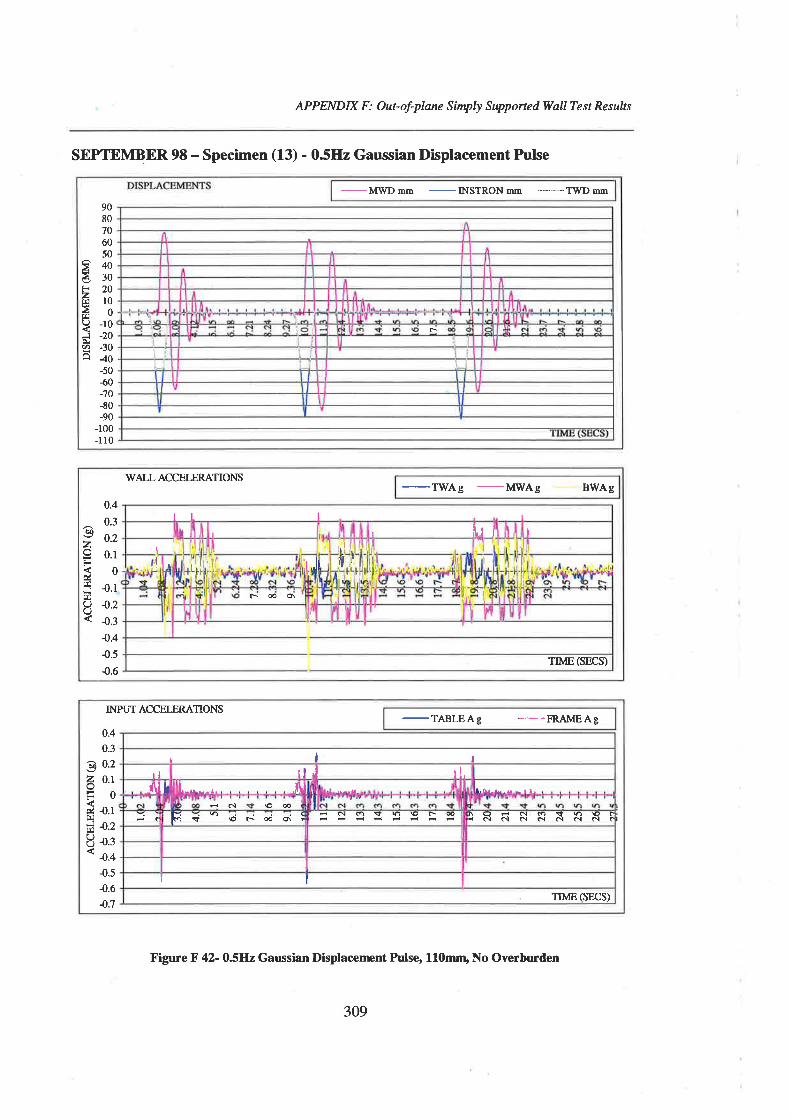
APPENDD( F : Out-of-plane Simply Supported WalI Test Results
-MWDmn -INSTRONmn
-__TWDmm
r
9080706050403020l00
-r0-20-3040-50{0-70-80-90
-100-r r0
eÉãztrl(J
Jo"9H
SEPIT,MBER 9E - Specimen (13) - 05Hz Gaussian Displacement Pulse
V/ALL ACCELERATIONS
-TWAg -lvIWAg BWAg
TIt\tE (SECS)
o.4
0.3
0.2
0.1
0
{.14.2{.34.44.54.6
€9zoFr
d5E¡C)(J
lrl.I tutI
i,ì1 i.l! t:,1
I i ,.11. ü
c- æo\
Figure f 42- O.sHz Gaussian Displacenrent Pulse, 110nnn, No Overburden
INPUT ACCEI-ERATIONS
-TABI-EA FRAMEAg
0.40.3
6 0.2zotsút¡lÞlrdO(J
0.1
04.14.24.34.44.54.64.7
I I Irl it J rl,tut ¡.L-L ù-tl.
o¡ \o æÈ( F+ N I qv r ^aÈdosn9ricìaìddôldôl(
I I
TIME (SECS)
309
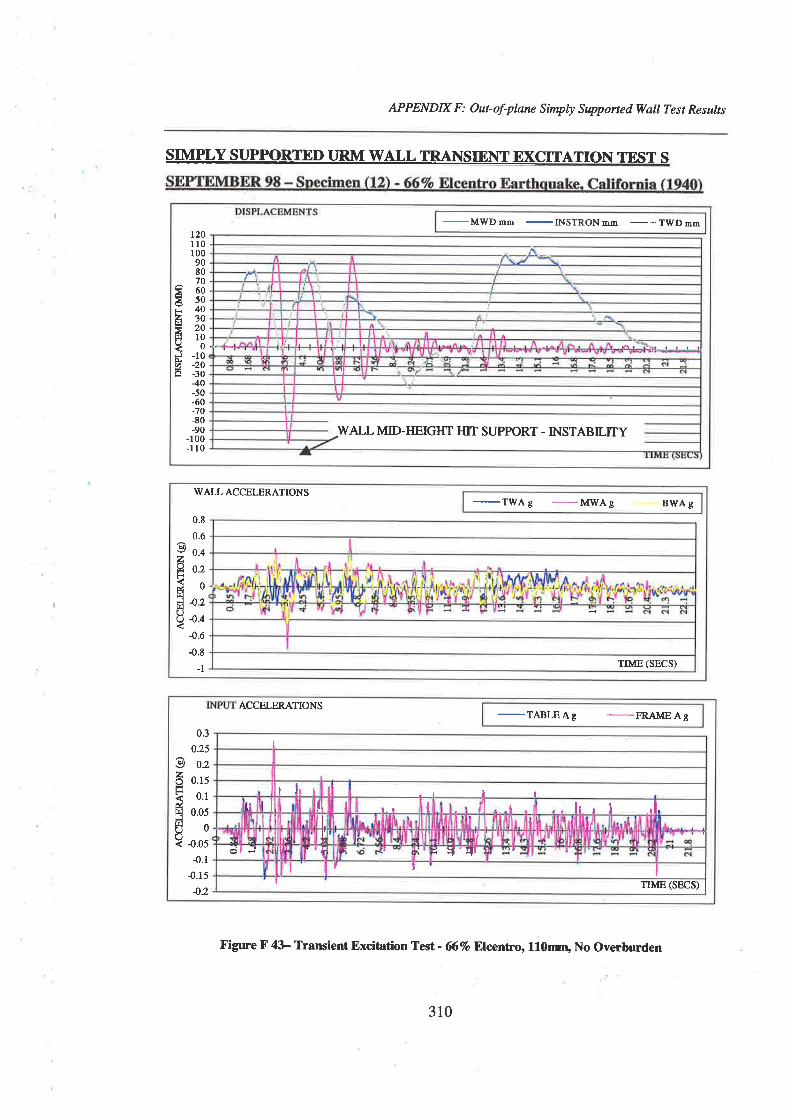
APPENDIX F : Out- of-plane Simply Supported WalI Test Results
SIMPLY SUPPORTTD IIRM WALL TRANSIENT EXCITATION TEST S
Figure F 4! Transient Excitation Test - 667o E;lcentro, 110nrn, No overburden
-MWDmm -INSTRONnn
_--_-TWDmn
STJPPORT.INSTABILITYWALLMID-IIEIGI{T HIT
t20ll0100908070605040302010
0-10-20-3040-50-60-70-80-90
-r00-1 10
âÉ,t<zt¡¡
Ë(J.ltuØ
-TIVA g
-MWA g BWAg
WALL ACCELERATIONS
0.8
0.6
0.4
0.2
0
4.24.44.64.8
-1
ezEúr¡lÈt¡JU(J
TIME (SECS)
ACCELERATIONS
0.3
0.25
O o.z
Z o:sã o.rdI¡t 0.05JBo? o.os
4.14.154.2
-TABIÆAg -FRAMEAgI
I lr r tl¡ tl f I lt I t h ¡ ¡ I t.
ol-i { í ìf -{lI r
It TIME (SECS)
310
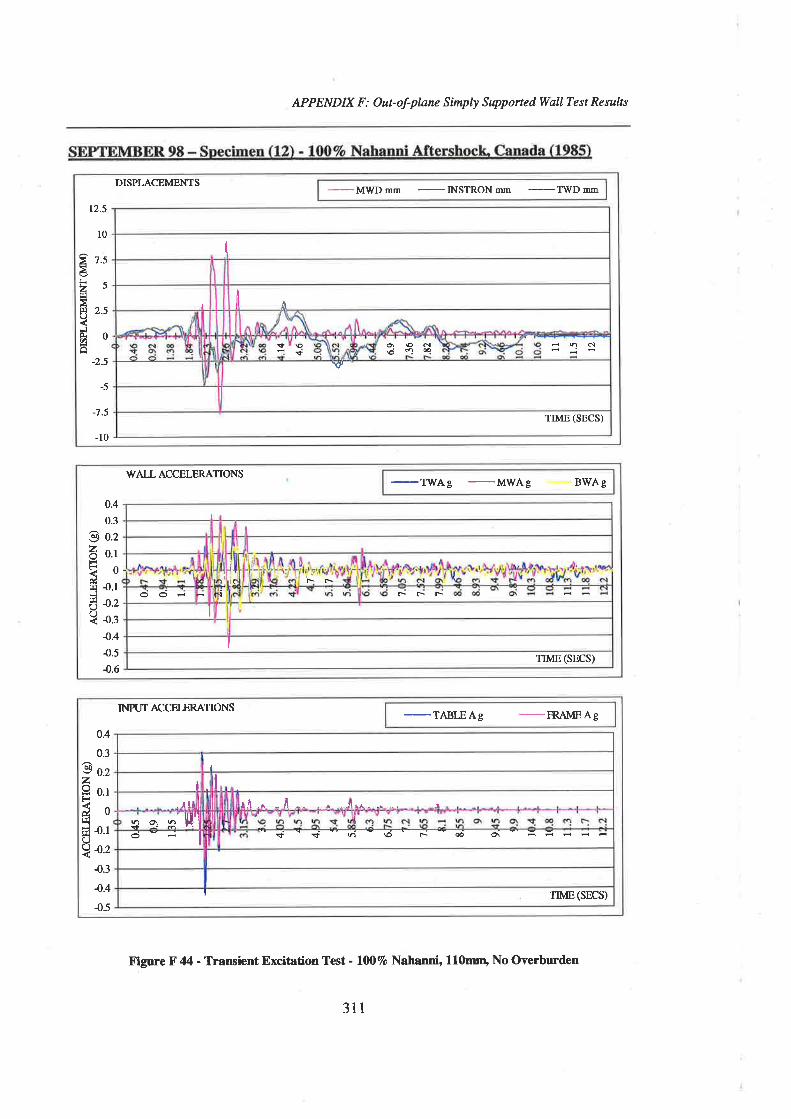
DISPLACEMENTS
-ìr[WD mm
-INSTRON
mm
-TWD
mm
eáFzf¡ì(J
JÀ?H
t2.5
l0
7.5
5
2.5
0
-2.5
-5
-7.5
-10
i
t il {r
ç I{ ô€dErìoq
\(/
TIME (SECS)
APPENDIX F: Out-of-plane Simply Supported WaIl Test Results
X'igure F 44 - Transient Excitation Test - 1ü)7o Nahanni' 110mrrD No Overburden
WALL ACCELERATIONS
-TWAg -MWAgBWAg
6zoF¿3t¡¡O(J
0.4
0.3
0.2
0.1
0
4.14.24.34.44.54.6
I
¡
ÈrrlLi
oo t- c- F-II
ITIME(SECS)
INPUT ACCELERATIONS
-TARr F Ag
-FRAlvfE Ag
0.4
0.3
0.2
0.1
0
{).1
4.2
4.3
4.4
{.5
.:9zFdSfr¡Q(J
II. .it l¡ I
Sh\Ot'.€O\ÉÊçno\hc)È
|ll'lI
TTME(SECS)I
311
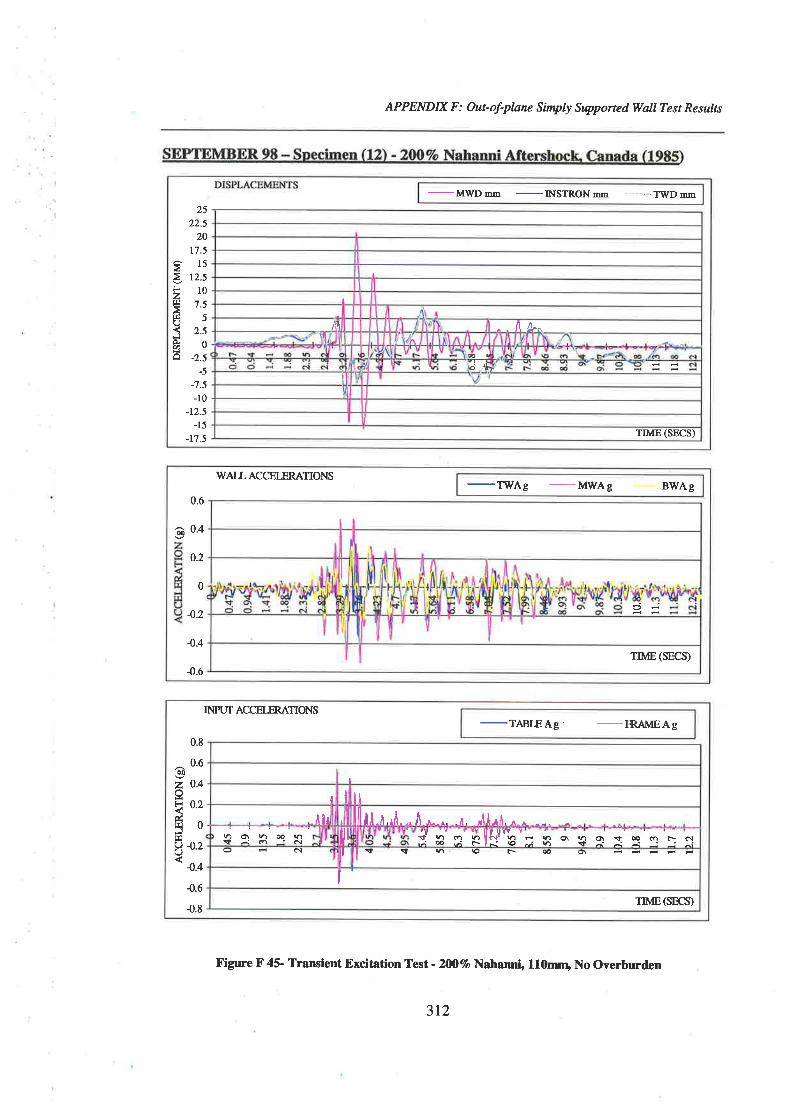
APPENDD( F : Out- of-pluc Simply Supported Wall Test Results
WAIIACCELERATTONS
-TVlAg -MWAgBWAg
0.6
o 0.4
0.2
0
4.2
4.4
4.6
c)È
TIME(SECS)
INPUT ACCELERATIONS
-TABLEAg --FRAIvfEAg0.8
0.6
0.4
0.2
0
4.2
4.4
4.6
{.8
ezIt-d3EI()(J
I
I I ll. ilr ì llll-'r,,À^..Jì *... n. Jl¡1. ^ a -,slsrK lll Ého\ho\ËæmF.c.¡
dir¡ç^'::jj^irl, 'v r rl llf h ó hl¡-i æ çi È-l
tuF¿\.t' hi\oo cì I ÈÈÉÉ-s v I tr æ o\I
I
TrME(SECS)
Figure F 45- Transient Excit¡tion Test- 2NVo Nahonn¡, lllhrrnr, No Overburden
_MWDmm _INSTRONnn ___..TWDm
IF.zgf¡¡UJo.?H
2522.5
20L7.5
15
12.5r0
1.55
2.50
-2.5-5
-7.5-10
-r2.5-15
-17.5
I
/¡t ^./\&-prci ¡(}
I
ITIME (SECS)
312
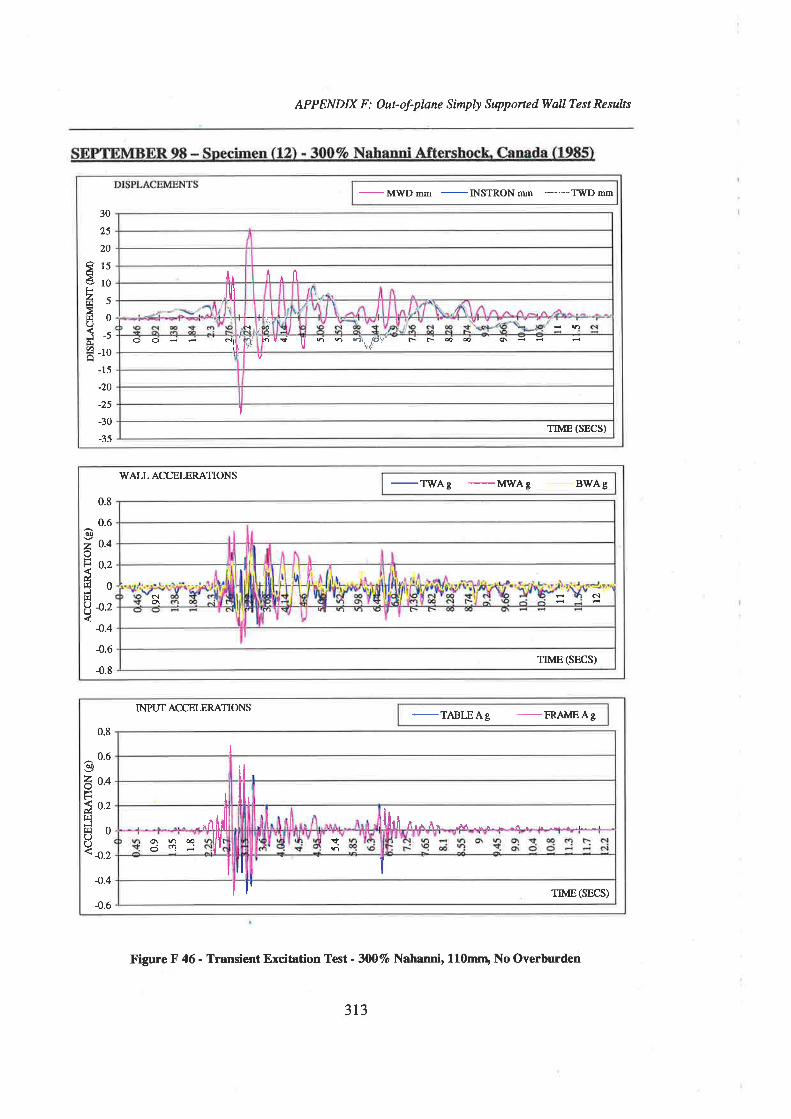
APPENDIX F : Out- of-pløne Simply Supported WølI Test Results
WALL ACCF'I FRATIONS
-TWAg -MWAg BWAg
oo
zot-ú5r¡lC)c)
0.8
0.6
0.4
0.2
0
4.2
4.4
{).6
4.8
eìo¡o\
TIME(SECS)
Figure F 46 - Transient Excitation Tæt - 3û07o Nahanni, 110mn, No Overburden
mm _INSTRONnn -"_-_TWDmm
30
25
20
9ts3rof-Ásño(J
S-so.
É -to-15
-20
_25
-30
-35
[, l1 ¡ fi
ilft
ì +v,
Jo
oôÊÈ 'iI ,xn ls
\/o1, lo\t-\/¡
r r æ Ø q
ITrME (SECS)
INPUT ACCELERATIONS
-TABLEAg -FRAMEAg0.8
^ 0.6€9
é o-qFFS o.zf4!E0c.)< 4.2
4.4
{.6
I
ll,I il
. ^nilllO\næodl-j ur
I
Ill' TIME(SECS)
313
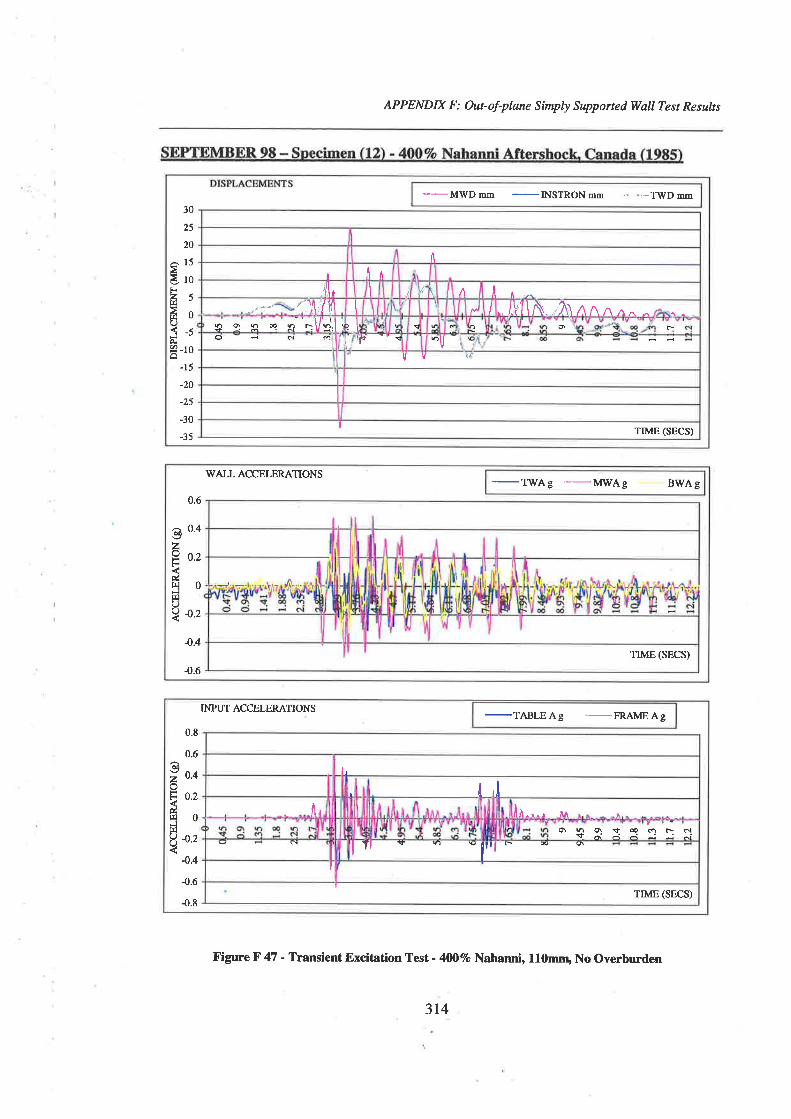
APPENDIX F : Out- of-pløne Simply Supp orte d Wall Te st Re sults
Figure F 47 - Transient Excitation TesJ - 4007o Naharmi, 110mn, No Overburden
_MWDmm _INSTRONnm .. '-_,TWD-m30
25
20
^15äroFãsfrol-sor
É-r0-15
-20
-25
-30
-35
llI iT l
{1, \ t / \ A I:'j'' ''-lll'ifl I
" "l/"il ,høhæ ,lr I ø rd ',f+ .U
llv
I TIME (SECS)
-TWAg -M\ryAg BWAg
WALL ACCELERATIONS
0.6
o 0'4
z9 o.zFú140Jt¡¡U? o.z
{).4
4.6TIME (SECS)
-TABLEAg -FRAMEAg
It
I ,l¡
i, À¡r.,-, MO\hO\rf,æo r c.¡ï rl) r æ q" lt,lïl
TIME (SECS)
0.8
0.66¿0AF o.zd30i:J
8 4.2
4.4
{.6{.8
INPUT ACCELERATIONS
374
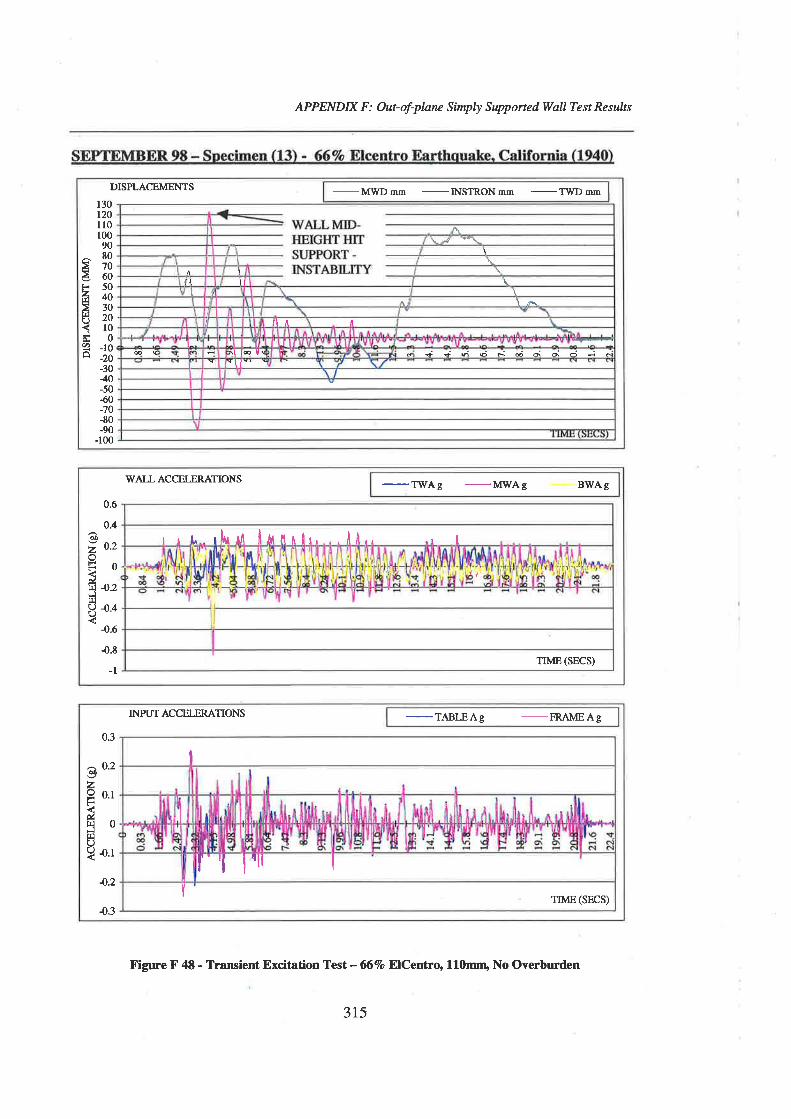
DISPLACEMENTS
130120ll01009080706050403020l00
-10-20-3040-50{0-70-80-90
-100
G.
ÊãzE2r¡l(J
,¡ÉLØo
-MWDmm -INSTRONnn --TVfDmm
l.
il it
¡l i
a( ¡\ l@ l\-U-'
APPENDIX F: Outof-plane Simply Supported Wall Test Results
Figure F ¿|8 - Traruient Excitation Test - 67o E;lCentro, 110mn¡ No Overburden
WALL ACCEIÈR,ATIONS
-TV/Ag -MWAgBWAg
€9zts
dÍÐJt¡lU(J
0.6
0.4
0.2
0
4.2
4.4
4.6
4.8
-l
trL,- ,hrl ttär, lt,..lÅ., ¡l I
TIME (SECS)
INPUTACCELERATIONS
-TABLEAC -FRAMEAg0.3
^ 0.219z9 o.rF
Éof¡l(.)
? o.r
4.2
{.3
I
I
I
[' 'ltll
ITTME (SECS)
315

APPENDD( F : Out- of-plnne Simply Supported Wall Te st Re s ults
-MWDmm -INSTRONñm -TWDmm80
70
60
50È¿oè-302H202Broloâ¡
É -t0-20
-30
-40
-50-60
-70
11il
¡. rA il
I Il/
I {t AJ 1,1iltÀrN,rf æ d þ ;t t¿¡l lllil{I'.ä\*^ä';/'' oq r'\.¡ p -,.{q -\Þ /Êdo* t{il/ fllFì : = = = = : F Ft--6Fã -' ñ K r-" Ë 3
I I
v
TIME (SECS)
Figure F 49- Transient Excitation Tæt - 667o Pacoirm Daq 110mnU No Overburden
WALL ACCELERATIONS
-TWAg -MWAgBWAg
0.4
0.3
0.2
0.1
0
{.1
4.2
{.34.4
ozoFút¡ldU(J
I tt¡Jl I
it I rllllI
I |l
i I s N õ
\ tl'I I
f Til i,II
TIME (SECS)
-TABLEAg -FRAMEAg
INPUT ACCELERATIONS
0.4
0.3
0.2
0.1
0
{.14.2{.34.44.5
€9zoH
drllJr¡(J
?
I
ilt ù.¡<æôl\o
c.ìmtç m
rI
TIME(SECS)
3t6

APPENDIX F : Out- of-plnne Simply Supponed Vlall Te st Results
-MWD
mm
-INSTRON
mm
-TWD
mm
¡ A
,t I t/1 t¡I ill ït
lt/t ilt ht lh,\Þ1 Fll+ì : 16= Y F ì.TuÞffi tì Ë ëì- àà ¡iÊNo{
lvv
TIME (SECS)
80
70
60
50403020
10
0-10-20-30-40-50-60
-70
å2
ãz¡¡lUsÞrØo
Figure F 50- Transient Excitation Test - 807o Pacclirm Darn, 110mn¡, No Overburden
-TWAg -MWAg BWAs
WALL ACCELERATIONS
I I
¡l il¡I
I
ilII
TIME(SECS)
0¿
0.3
o o.zzv 0.1F-fof¡¡d ¿.r(J
? ¡.2{.34.44.5
trNPIJT ACCELERATIONS
-TABIß Ag
-FRAME Ag
LQzot-árqJEU
0.3
o.2
0.1
0
4.1
4.2
4.3
4.4
I
j
1r \oêì o
I
TIME (SECS)
317
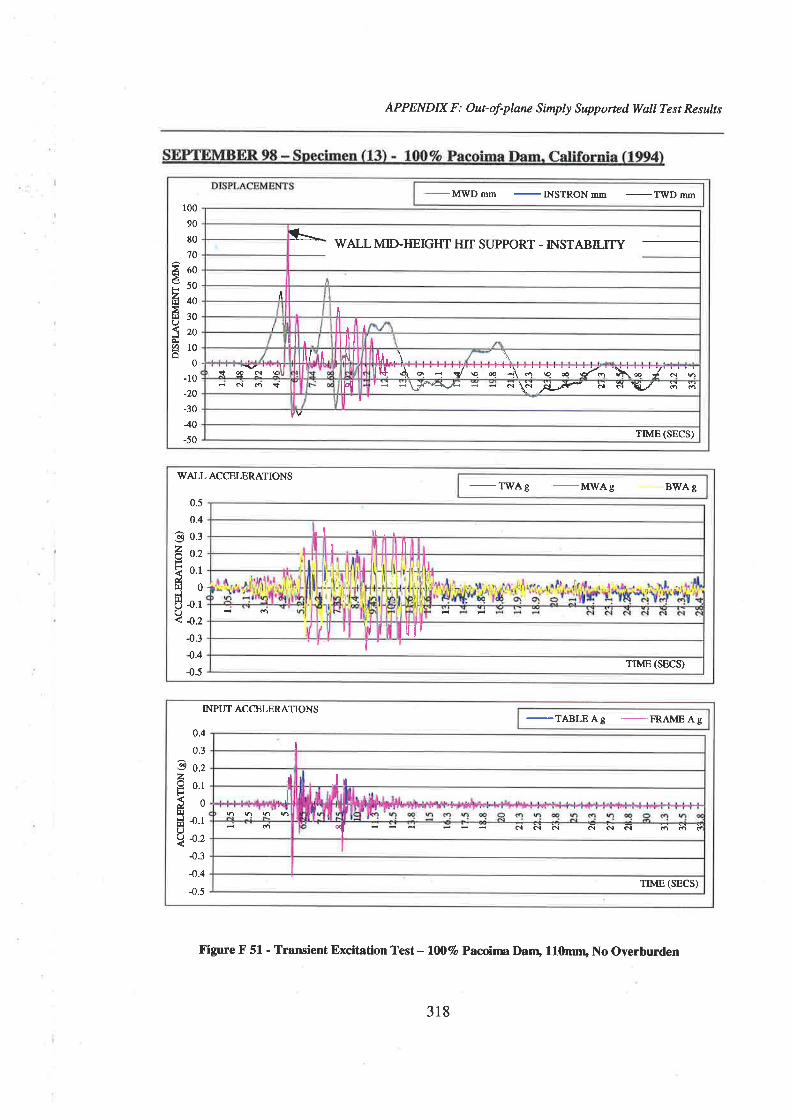
APPENDIX F : Out-of-plane Simply Supported WqlI Test Results
-MWD mm
-INSTRON
mm
-ÎYy'D mm
100
90
80
70
9ooã50ã¿ol'ì 30
iroc.iÉLO!
0
-10_20
-30
40-50
í\WALLMID-IIEIGI{T TIIT STJPPORT - INSTABILITY
tA
rì
I Iil I illl
It/ I |+{t Itl, . \ .\t9Qer_E iJ lq-q "t - 4 ç "q -\. ç'L'ö/-''bi;"/'i";iNñç tþl r ; J\r¡l\zãv/?r = ñ \.r
^r-.,è- N a \L/ àì ¡ä
t
yv
TIME (SECS)
Figure F 51 - Traruient Excitation Test - 1fi)7o Pacoinra Dan¡ 110mn¡ No Overburden
-TWAg -MWAgBWAg
WALL ACCELERATIONS
0.5
0.4
o 0.3
6 o.zFI 0.1drq0!E ¡.r(J< 4.2
-0.3
4.44.5
'l llrI tl
lll'
TIME (SECS)
INPLTT ACCELERATIONS
0.4
0.3
I o.zzI o.tFSoñEl 4.1(J
2 4.24.3
4.44.5
-TABLE Ag
I
¡ lrI
nhhh
1 ddN ddd
TIME (SECS)
318
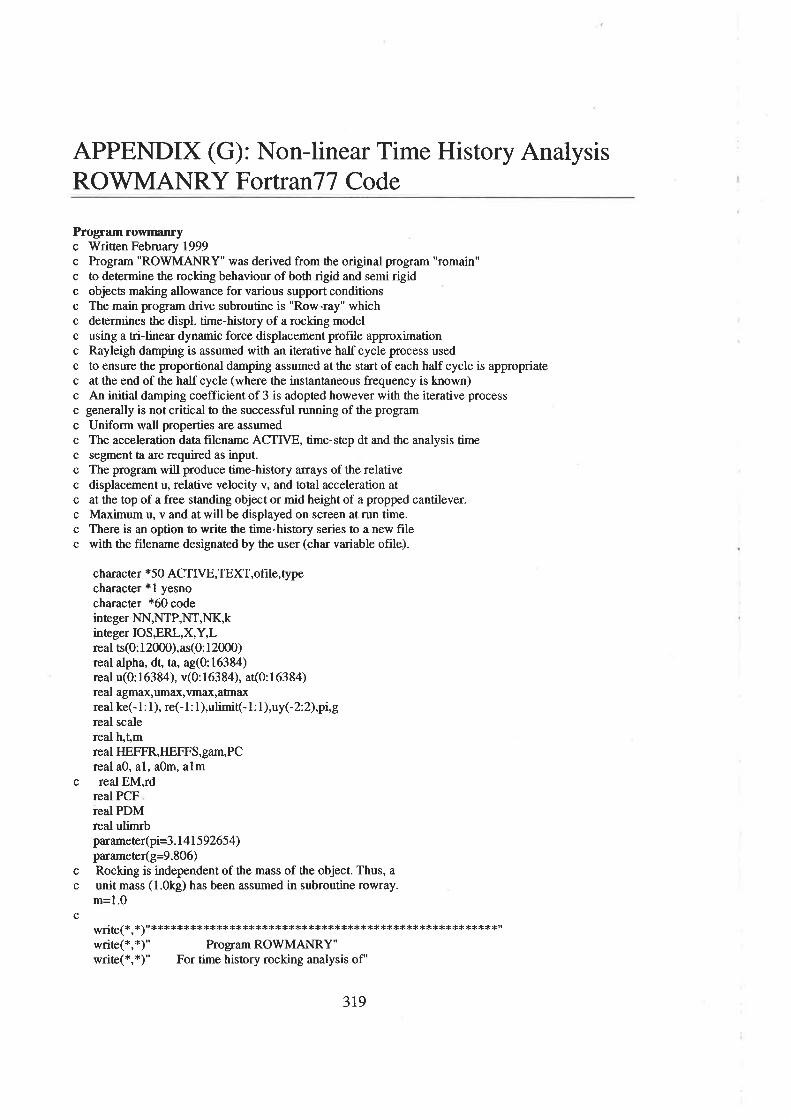
APPENDIX (G): Non-linear Time History AnalysisROWMANRY FortranTT Code
Program rowrnanryc lilriüen February 1999c Program "ROWMANRY" was derived from the original progr¿ìm "romain"c to determine the rocking behaviour of both rigid and semi rigidc objects making allowance for various support conditionsc The main program drive subroutine is "Row-ray" whichc determines the displ. time-history of a rocking modelc using a tri-linear dynamic force displacement profile approximationc Rayleigh damping is assumed with an iterative half cycle process usedc to ensure the proportional damping assumed at the start of each half cycle is appropriatec at the end of the half cycle (where the instantaneous frequency is known)c An initial damping coefficient of 3 is adopted however with the iterative processc generally is not critical to the successful running of the programc Uniform wall properties are assumedc The acceleration data filename ACTIVE, time-step dt and the analysis timec segment ta are required as input.c The program will produce time-history arrays of the relativec displacement u, relative velocity v, and total acceleration atc at the top of a free standing object or mid height of a propped cantilever.c Maximum u, v and at will be displayed on screen at run time.c There is an option to writ€ the time-history series to a new filec with the filename designaæd by the user (char variable ofile)-
character *50 ACTIVE,TEXT,ofile,typecharacter *1 yesnocharacter *60 codeinteger NN,NTP,NT,NK,kinæger IOS,ERL,X,Y,Lreal ts(O: I 2000),as(0: I 2000)real alpha, dt, ta, ag(0:16384)real u(0: 16384), v(0: 16384), at(O: 16384)real agmax,umax,vmax, aÍnaxreal ke(-l: l), re(-1: l),ulirnit(-l: l),uy(-2:2),pi,greal scalereal h,t,mreal HEFFR,ÌIEFFS, gam,PCreal a0, al, aOm, alm
c real EM,rdreal PCFreal PDMreal ulim¡bparameter(pi=3.1 41 59265 4)paramet€r(g=g.806)
c Rocking is independent of the mass of the object. Thus, ac unit mass (l.Okg) has been assumed in subroutine roïvray.
m=I.0c
writel*,*¡"*********************tc************r.*t<t *r.r.******r<*****rrwritel*,*¡" hogram ROTWMANRY"wriæ1*,x¡" For time history rocking analysis of'
3r9

APPENDD( G: N0n-linear Time History Arutysis ROWMANRy FortranTT Code
write(*,*)" Free Standing or Simply Supporæd Objecs"write(*,*)" LatestVersion: FEBRUARy1999"wfitel*,*¡******************************************************nwriæ1*,*¡" Units in length - rL time - secs, "write(*,*)" Force - N, Density - kd^t "write(*,*)" Stress - MPa unless shown otherwise "write(*,*¡" "
c Inpuaing accelerogram daø into ag(t) arraywrite(*,*)"fype filename for accel. data [<= 8 Characters]:"read (*,'(a)')ACTIVEL=INDEX(ACTIVE,')ACTIVE(L:L+4)='.csv'
c wrir€(*,2000) ACTIVE(1:L+4)write(*,*¡ " "write(*,*)" --- FORDEFAIJLT VALUES I I TYPE 0 ---"writelr',*¡ " "write(*,*)"Type scaling factor for ground accel. [1.0]:"read(*,*)scaleif(scale .eq.0.O)then
scale=1.0writel*'x¡ " "writelx,*¡"-- DEFAIJLT SCALINGFACTOR [1.0] ADOPTED -- "writel*,*¡ " '
end if5 write(*,*)"Type time step interval dt [0.01]:"
read(*,*þtif(dt.eq.0.O)then
dt{.01write(*,*) " "write(*,*) "-- DEFAIJLT TIME INCREMENT [0.01] SECS ADOPTED --"wriæ1*'*¡ " "
end ifopen(25,file=ACTIVE,staü¡s='old',iostaFIOS,ere I 000)
c Go passed 8 header lines in datafileERL=ldo l0 k=I,8
read(25,'(a)',iostat=IOS,err= I 0 I O)TEXTERL=ERL+1
l0 continuec read (25,*,iostat=IOS,en=101O)NNc ERL=ERL+I
NN=Odo 20 k=0,16384
read(25, *,iostat=Ios,er=l 0l 0,END=3) ts(k),as(k)NN=NN+las(k)=5salls*asg¡ERI=ERL+l
20 continue3 continue
close(25)wriæ1*'*¡ " "wriæ(*,45) NN
45 format("NUMBER OF DATA POINTS IN INPUT prI F = ",lJ)writel*,*¡ " "
c Data inærpolationcall linter(NN, ts,as,dt"NTP,ag)
320
APPENDIX G: Nùn-Iinear Time History Analysis ROWMANRY FortanTT Code
write(*, *) "Record time is ",rea(NTP)*dt, " seconds"wriæ(*,*)"Type analysis time [Record time]:"read(*,*)taif(ta.eq.0.0)then
ta=eal(NTP)*dtwriæ(*,2010) tawritel*,*¡ " "
2010 forma('-- DEFAULT : IRECORD TIME',F6.3,'secs] ADOPTED -')writelx,x¡ " "
end ifNT=in(taldt)if (NT.gr16384)then
write(*,x)"Required no. of time steps exceed limit of 16384"write(*,*)"Retype longer time step or shorter analysis time"goto 5
elseend ifif(NT.gt.NTP)then
c Augment ag(k>=NTP) with zerosdo 30 k=NTP,NT-l
ag(k)=030 continue
elseend if
4l continuewritel*,*¡"---wriæ1*',*¡" OBJECTRIGIDITYCLASSIFICATION"write(*,*)' Is the object to be analysed either :"writc(*,*)" (Typecorrespondingnumber)"write(x,*¡" "writ€(*,*)"(l) RIGID eg steel library bookshelves"write(*,*)"(2) SEMI RIGID eg simply supported URM wall"wriæ(*,*)" parapetURM wall"writelx,*¡"---read(*,*) Xif(X.ne. 1.AND.X.ne.2)goto 4 1
4 continuec Definition of support conditions
wriæ1*,x¡"WTitC(*,*)" DEFINTTION OFVERTICAL SI.JPPORT CONDITIONS"wriæ1*,*¡" V/hat support conditions exist:"write(*,*)" (Type corresponding number)"writel*,*¡" "write(*,*)"(l) Free standing object, base reaction at LF"write(*,*)"(2) SS non loadbearing, base reaction at LF"write(*,*)"(l) SS loadbearing, top & bottom reactions at CL"wriæ(*,*)"(4) SS loadbearing, top reaction at CL, bottom reaction
+ atthe LF"write(*,*)"(5) SS loadbearing, top & bottom reaction at LF"writel*,*¡" "write(*,*)"where SS = simply supported"write(*,*)" LF = leeward face of object"wriæ1*,*¡" CL = center line of object"
read(*,*) Yif(Y.ne. l.AND.Y.ne.2.AND.Y.ne.3.AND.Y.ne.4.AND.Y.ne.5)goto 4
32t

APPENDIX G: Nùn-linear Time History Anatysis RowMANRy FortranT7 code
cc
c
Inputing structural parametersgam=O.0
wriæ(*,*)"Type total height of the object (m) :"read(*,*)hwriæ(*,*¡"Type total thickness of the object (mm) :"read(*,*)tt=t/1m0.0
cif(Y.ge.3)then
c Loadbearing simply supported requires overburden sfress and densitywriæ(*,*)"Type the overburden stress at top of object (Mpa),'read(*,*)PC
write(*,*)"Type object densiry [1800 kg/m3] :"write(+,x)"[Masonry density approximarely 1500 - 2500 kg/m3]"
read(*,*) gamif(gam.eq.0.0)then
gam=1800.0wriûe1x,x¡ ' "
writelx,*¡"-- DEFAIJLT OBJECT DENSITY [l800kg/m3] ADOPTED --"wriæ1*'*¡ " "
end ifc Calculation ofoverburden stress facûo¡
pCF=2.0*pC* lE6(h*gam+g)else
PC{.0PCF{.0
end ifc
if(Y.eq.1)thentype="Free standing object base reaction at LF"
c Stiffness and resistance acceleration conversion factorsÍIEFFS=1.0HEFFR=I.0writel*,x¡ " "write(*,1)HEFFSwrite(*,2)ruFFRwritelr"*¡ " "
I forma(" Stiffness coefficient (IIEFFS) = ",fl 3)2 forma(" Resistance coefficient (IIEFFR) - ",n 3)
end ifif(Y.eq.2)then
type="Ss non loadbearing G,F)"ÍIEFFS=4.0HEFFR=4.0write(*'r'¡ " "write(*,1)IIEFFSwrite(*,2)IIEFFRwritel*'*¡ " "
end ifif(Y.eq.3)then
type="Ss loadbearing top & bocom (CL)"ÍIEFFS=4.0*(t+pCF)IßFFR=2.0*(1+PCF)wriæ1*'*¡ " "
322
APPENDIX G: N)n-linearTime History Analysis ROWMANRY Fortøn77 Code
write(*,1)HEFFSwriæ(*,2)IIEFFRwritelx,x¡ " "
end ifif(Y.eq.4)then
type="Ss loadbearing top (CL) bouom (LF)"IIEFFS=4.O*(l+PCF)I{EFFR=4.0*( 1+0.7 5 *PCF)write(*'*¡ " "write(*,1)IIEFFSwrite(*,2)HEFFRwriæ1*'x¡ " "
end ifif(Y.eq.5)thentype=" SS loadbearinC top & bottom (LF)"
IIEFFS=4.0*(l+PCF)ffiFFR=4.0*(1+PCF)wriæ1*'x¡ " "wriæ(*,1)IIEFFSwrito(*,2)I{EFFRwritelx'*¡ " "
end ifc Apply SDOF conversion fac0or to ag which does not include the factor
do 60 k=O,NTP-1ag(k)=1'5x¿t1¡¡
60 continuec3000 Continuec Set first half cycle iteration approx proportional damping
alpha=3.0c Set the propofional damping experimental to SDOF conversion factor
PDM=2.0ß.0write(*, +) "Type mass proportional damping coefficienl : "read(*,*)a0
c Modify a0 to fit SDOF modelaOm=PDM*a0write(*, *) "Type stiffnes s proportional damping coefficient. : "read(*,*)al
c Modify al to frt SDOF modelalm=PDM*al
Rigid body complete instability displacement (mm)ulimrb=t* 1 000.0*IIEFFR/I{EFFSSide eccenEicities are t/2 as uniform properties assumedCalculation of the rigid body resistance accelerationre( I )= I . 5 *[IEFFR* g*t/ttre(- 1)=- 1.O*re(1 )Calculation of the rigid body negative stiffnesske(1)=- 1.5*tfrFFS*c/hke(-l)=ke(1)
Completely rigid objecsif(X.eq.1)thenSetting the rocking displacements to a nominally small value (>0)
uY(l)=l.E-4
cc
cc
c
ccc
c
323
APPENDIX G: N0n-linearTirne History Analysis RowMANRy FortanTT code
cc
uy(-l)=l.E-4uY(2)=t.f,-4uy(-2)=l.E-4ulimi(l)=ulimrbulimi(- I )=- | *ulimit( I )
end if
Semi rigid objoctsif(X.eq.2)tben
wriæ1*'*¡ " "write(*,*)"Type disp.rocking expected to commence (mm)"writ€(*,*)"(This disp. dictates the initial rocking stiffness"writelx,*¡" and must be greîrur than zero)"read(+,*)uy(l)uy(l)=uy(1)/1000'0uy(-l)=-1.O*uy(l)write(*'*¡ " "wriæ(*,*)"Type disp. at start negative stiffness (mm)"wriæ(*,*)"(1his disp. dictates the peak rocking resistance',
wriæ(*,*)" plateau as it is the point of inærsection of'wriæ1*,*¡" the semi rigid and rigid body force disp profiles)"read(*,*)uy(2)uY(2)=uY(2)/1000.0uY(-2)=- I .0*uY(2)write(*,*)"Type complere insøbiliry disp (mm) IRIGIDI"u'dte(*,71) ulimrb
Format("I-ess than or equal to 'f6.2," (mm) - RIGID -")read(*,*) ulimi(l)if(ulimit( I ).eq.0.O)thenulimit(l)=ulimrbwriæ1x,*¡ " "\4,rite(*,72) ulimrb
forma('--DEFAULT INSTABILITY DISP|,F6.2,'I mml ADOPTED--')wriæ1*,*¡ " "
end ifulimi( I )=ulimi( I Yl 000.0ulimi(- I )=- | *ulimit( I )
end if
Doing the achral computationscall rowray( l .0, alpha,re, uy,ke,ulimit NTdÇ ag,u, v,at code, aOm+,alm)Finding the maximum out of each arraycall fndmax(NT, I 6384,ag,agmax)call fndmax(NT, I 63 84,u, umax)call fndmax(NT, I 6384,v,vmax)call fndmax(NT, I 6384,at,aunax)
Oupuning the key results ûo screen(system output)write(*,*¡' "wnte(*,22þúeformat("ANALYSIS CONCLUSION : ",a60)
If the code message does not begin with "M" for "Model"go straight to the end of the program.if(icha(code(l : l)).ne.77)goûo I 100write(*,*)"Analysis results summary: "
7l
72
22
cc
c
cc
cc
324

APPENDIX G: N0n-linear Time History Arulysis ROWMANRY FonranTT Code
cc
write(*,21)"Max. rel. displ. = ",umaxwrite(*,21)"Max. rel. velocity = ",\'maxwrite(x,21¡"tax. total accel. = ",atmax
2l format(a21,1x,f9.6)
Setting effective parameters back to originaluy(1)=1000.0*uy(1)uy(2)=1000.0*uY(2)t=t*1000.0
I7
Reporting the time-history ouÞutwriæ(*,*)"Time-history results can be written to a file"write(*,*)"Type y/n to indicaæ if hle is wanûed:"read(*,'(a)')yesnoif(ichar(yesno).eq. 1 1O)goto 30 10write(*,*)"Specify output filename [<= 8 characters]:"read(*,'(a)')OFTÍ FÞINDEX(OFil-E,' ')OFILE(L:L+4)='.csv'wdte(*, *) OFILE( 1 :L+4)
open( I 5,file=ofile,iostat=IOS,ERR=l 020)write(*,*)"Type no. of time steps for every reported results"read(*,*)NKwrite(15,*)'***t *4c**********ll****r<*****'F**************d'**t'********¡** ***** * ** **** * *r. ** * n
write(ls,*)" ProgramROWMANRY"*,rite(15,*)" For ti¡ne hisûory rocking analysis of'wriÞ(I5,*)" Free Sønding or Simply Supported Objects"wriæ(15,*)" Latest Version : FEBRUARY 1999"wriæ115,*¡"*t t<*** ****t<*******r<****t*****************t<****t *r.***1.1c
¡****** **i<* ** * ** * rc * * *rr
wriæ(15,+)"Ouþut filename : ",ofilewriæ( 15, l7)"Accelerogram data from : ",ACTIVEformat(a23,lx,al3)
wriæ(15,18)scaleformat("Accelerogram scaling factor selected - ',f7.3)
write(15,t)'"Echo input datawrite(15,*)"INPUT DATA SUMMARY FOR: "write(15,*)typewrite(Is,*)" "write(15,11)h
format("Height of object = ",f7.3," m")wriæ(15,13)t
format("Object width = ",f7.3," mrn")write(15,9)PCforma("Overburden sEess at top of objec¡ = " ,f7 .3," MPa")write(15,*)" "write( I 5, *) "Tri-linear force disp profile data"wriæ(15,16)uy(l)
format("Disp I selected for initial stiffness = ",f5.2," mm")write(15,26)uy(2)format("Disp 2 selecæd for maximum force plateau = ",f5.2," mm")
wriæ(15,1)HEFFSwrite(15,2)IIEFFRwrite(15,*) " "
18
cc
c
c
lll3
9
l6
26
325
APPENDIX G: N0n-linearTime History Analysis ROWMANRY Fortran7T Code
wriæ( I 5, *) "Proportional damping data"wriæ(15,27)a0
27 format(" Mass proportional damping coeff. = ",f7.4)write(15,28)a1
28 format(" Stiffness proportional damping coeff. = ",17.4)wriæ1t5,*¡" "write(15,*)" "wrire(15,22þodewriæ(15,12) ø, dt
12 forma('Analysis time =',f7.4,'secs time inc =',f5.4,'secs')write( 1 5, *) "Iæ gend :, ag = input ground acceleration "write( I 5, *) ",u = relative displacement"write(I 5,*)",v = relative velocity"write( I 5, *) ",at = total acceleration"write(15,*)" "write( I 5, *)"Time,ag(m/s/s)
+,u(m),v(m/s),at(m/s/s)"c Printing the maximum out of each array
wriæ( 15,42)"Maxim :",agmax,umax,vmax,aÍnax42 format(a6,',',f7 .3,',',f9 .6,',',fl .3,',',f8.4)
write( I 5, *) "Tirne, ag(m/s/s)+,u(m),v(m/s),a(m/s/s),experimental u(m)"
c Printing the time-history ¡uraysdo 40 k{,NT-l,NKwriæ( I 5,5 1 )rea(k) *dt"ag(k),u(k),v(k), at(k)
5 I forma(f6.3,',',f7.3,',',f9.6,',',f7.3,',',f8.4)40 continue
close(15)3010 write(+,*)"Type y/n to continue analysis:"
read(*,'(a)')yesnoif(ichar(yesno).eq. 1 I O)then
goro 100else
c Re-Setting effective parameterst=t/1000.0goto 3000
end if100 wdte(*,*)"Program completed"
stop
Error messages0O0 write(*,1001)"opening file ",ACTWE
l00l format("Error in ",al3,al2)goro ll00
I 0 I 0 wriæ(*, I OO2)"reading fiIe",ACTIVE,ERLgoto I100
1002 format("Error in ",al3,al2,"atline ", i5)1020 wriæ(*,I001)"opening hle ",ofile
goto ll00I 100 \r,rite(*,*)"Program aborted"
stopend
cc1
326
APPENDIX G: N0n-Iinear Time History Analysis ROWMANRY FortranTT Code
cccccccccccc
ccc
Subroutine rowray(mrpcrreruyrkerulimrNTrdtragrufrvratrcoderaOm+,alm)Rowray was originally derived from Rotha including atrilinear static force displacement relationshipIterative half cycle procedure to determine Rayleigh dampingcoefficient for current instantaneous frequencyuy(1) is the initial positive rocking displacementuy(-l) is the initial negative rocking displacementuy(2) is the secondary positive rocking displacementuy(-2) is the secondary negative rocking displacementre(l) is the completely rigid positive rocking resistancere(-1) is the completely rigid negative rocking resistanceke(l) is the rigid body stiffness for +ve rockingke(-l) is the rigid body stiffness for -ve rockingulim(l) is the +ve ultimate displacementulim(-l) is the -ve ultimate displacement
Declaration of parameterscharacter*60 codeinteger NTreal m, pcreal ke(-l:1), re(-1:1), W(2:2), ulim(-l:l)real ag(0:16384),dtreal u(0: 16384), uf(O:16384)real v(0: ló384),at(O: I 6384)Decla¡ation of local variablesinteger Jevenq k, j, p, e, d, X, Yinæger f, I, I, pxreal ry(-1:1)real du, dv, da, a, dag, dpsreal ktsl, ktsp, kts2real fl,f2,f3rcal t0,tl,AJj,t4real pi, plreal alm, aOmreal dpsx, dpsy, nc, jx, jyreal ay, axparameter(pi=3 . I 41 59265 4)
c
cc Initialise conditions
u(0)=0.uf(0)=0.v(0)=0.a{.ag(O)=0.at(O)=0.Jevent=0UYY=O.0tO=O.0tl=0.0t2=0.Oß=0.0t4d).0j{e=0d=0
327
APPENDIX G: NÙn-linear Time History Analysis ROWMANRY FortranT7 Code
c5
c
P=Oxd)y{f{I=1px=Ocode="Model did not rock"
continueif(e.eq.l)thenReset time st€p at start of iteration
I=yend ifif(d.eq.l)thenReset time step at start of iteration
I=xend if
open(unit= l,file='out. dat',status='new')write(I,*) "NT I(=x) pc"write(I,*) NT, I, pc
u(k) is the displ. obtained at the end of each time sæp, anduyy is the displ. calculated and updated within the time step.Time history computation do-loop
do 10 k=I,NT-lif(f.ne.l)then
c Determine pseudo-static force for each time-step exceptc on iteration where returned ûo previous zeroed conditions
dag=¿g1¡¡- ag(k-l)fl = m*dagf2 = m*((4.*v(k-l)/dt)+2.*a)f3 =2. * pc * v(k-l)dps = f2+f3-f1uyy=u(k-l)
elsec Reset flag for refurned ûo previous zeroed conditions
f{end if
Time sæp counter for time between zero crossingst0=0+dtif(dps.eq.0.0)then
u(k)=uYYgoto 25
end ifBEGINEVENT ITERATION:
Determine the dynamic stiffness profile for theparticular proportional damping coefficient
Determine pseudo-static stiffness (Jevent I rocking stiffness)ktsp=(4. *nr(d t* * 2.))+ (2.* pc I dt)
Rocking threshold accelerationry( I )=re( I )+ke( I )*uy(2)+kæp*uy( I )ry(-l)=re( l)+ke(- I )*uy(-2)+ktsp*uy(- l)
Determine Jevent 0 rocking stiffness
c
cccccccc
c
cccccc
c
c
328

APPENDIX G: N0n-Iinear Time History Anølysis ROWMANRY FortranTT Code
cktsl=ry(l)/uy(1)
Determine Jevent 2 rocking stiffnesskts2=ktsprke(1)
write( l,*)"kts 1 ktsp kts2"wriæ(1,*) ktsl, ktsp,kts2
continueNON ROCKING (DISP INCREASING ORDECREASING)
if(Jevent.eq.0)thendu=dps/ktslUYY=uyy+du
POSITIVE DIRECTIONif(dps.gt.0.0)then
ROCKING NOT COMMENCED-NO EVENTif(uyy.lt.uy( I ))then
u(k)=r¡YYSTAGE I ROCKING LEVEL REAC}IED-WITH EVENT
elsedps=kts1*(uyy-uy(l))uyy=uy(1)Jevent=1code="Model rocked within limits"goto 15
end ifNEGATIVE DIRECTION
elseROCKING NOT COMMENCED-NO EVENT
if(uyy. gt.uy(- 1 ))thenu(k)=uYY
STAGE I ROCKING I-EVEL REACMD-ìWITH EVENTelse
dps=kts I *(uyy-uy(- I ))uyy=uy(-l)Jevent=-1code="Model rocked within limits"goto 15
end ifend if
elsePOSITTVE STAGE 1 ROCKING
if(Jevenleq.l)thendudps/ktspuYY=uYY+du
INCREASING DISPLACEMENTif(dps.gt.0.0)then
STAGE 2 ROCKING LEVEL NOT YET REACMDif(uyy.lt.uy(2))then
u(k)=¡Ytelse
STAGE 2 ROCKIN LEVEL REAC}IEDdps=ktsp*(uyy-uy(2))uyy=uy(2)Ievent=2code="Model rocked within limits"goto 15
end if
ccc15c
c
c
c
c
U
c
c
c
c
c
329
APPENDIX G: N0n-linearTirne Hístory Analysis ROWMANRY FortranTT Code
cc
elseDECREASING DISPLACEMENTNOEVENT
if(uyy.gt.uy(l))thenu(k)=uYY
elseWTTH EVENT
dps=ktsp*(uyy-uy(l))uyy=uy(l)Jevent{code="Model rocked within limits"goto 15
end ifend if
end ifNEGATIVE STAGE I ROCKING
if(Jevent.eq.- 1)thendu_Jps/ktspuYY=uYY+du
INCREASING DISPLACEMENTif(dps.lr0.0)then
STAGE 2 ROCKING I.EVEL NOT YET REACTIEDif(uyy.gt.uy(-2))then
u(k)=¡Ytelse
STAGE 2 ROCKING LEVEL REACMDdps=ktsp*(uyy-uy(- 2))uyy=uy(-2)Jevent=-2code="Model rocked within limis"goto 15
end ifelse
DECREASING DISPLACEMENTNOEVENT
if(uyy.ltuy(-l))thenu(k)=¡YY
else\ryTTH EYENT
dps=ktsp*(uyy-uy(- I ))uyy=uy(-l)Jevent=Ocode="Model rocked within limits"goto 15
end ifend if
end ifPOSITIVE STAGE 2 ROCKING
if(Jeventeq.2)thenif(kts2.le.0.0)goro I 000dudps/kts2uYY=uYY+du
INCREASING DISPLACEMENTif(dps.gt.0.0)then
COMPI-ETE INSTABILITY NOT REACHEDif(uyy.lt.ulim( 1))then
c
c
c
c
c
cc
c
c
c
c
330
APPENDIX G: N)n-IinearTime History Analysis ROWMANRY FortranTT Code
u(k)=uYtelse
c COMPLETE INSTABILITY REACÍIEDc Update pc and return to initial conditions
if(px.eq.0)thenpl=pc
end ifc Vary proponional damping to try and achieve convergence
if(px.lt.5O)thenpç=pl -real(px)*O.02+p1
end ifif(px.eq.50)thenpc=pl
end ifif(px.gt.50)thenpc=pl +(real(px)-50.0) *0.02*p I
end ifif(px.eq.101)then
write(*, *) " Iteration limit reached- NO CONVERGENGE "
u(k)=uYYv(k)=O'0at(k)=0'0do 38 l=I'kuf(l)=u(l)
38 continuec Set remaining final displacement store to zero
do 41 l=k+l,NT-luf(l)=0'0v(l)=0'0a(Ð=0'0
4l continuegoto 1000
end ifdps=dpsxj=jxa=axuYY=o'0jevent=Opx=px*1d=1f=1
c write(1,*)"dpsx initial cond at"s write(I,*) dpsx, xc Resta¡t iteration with new predicted proportional damping coefficient
goto 5end if
c DECREASING DISPLACEMENTelse
c NOEVENTif(uyy.gt.uy(2))then
u(k)=uYYc WTTHEVENT
elsedps=kts2*(uyy-uy(2))uyy=uy(2)Jevent=l
331
APPENDIX G: N)n-linear Tíme History Analysis RowMANRy Fortran7T code
code="Model rocked within limits"goto 15
end ifend if
end ifc NEGATWE STAGE 2 ROCKING
if(Jevent.eq.-2)thenif(ks2.Ie.0.0)goro I 000dudps/kts2uyy=uyy+du
c INCREASINGDISPLACEMENTif(dps.lt.0.0)then
c COMPLETE INSTABILITY NOT REACIIEDif(uyy.gt.ulim(- I ))then
u(k)=uYYelse
c COMPI-ETE INSTABILITY REACTIEDc Update pc and return to initial conditions
if(px.eq.0)thenpl=pc
end ifif(px.lt.5O)then
pç=p1 -real(px)*0.02 *p Iend ifif(px.eq.5O)rhenpc=p1
end ifif(px.gt.50)thenpç=p 1+(real(px)-50.0)*0.02*pl
end ifc write(1,*)"Complete instability"
if(px.eq.l0l )thenwrire(*,*)"Ireration limit reached-NO CONVERGENGE"u(k)=uYYv(k){.0at(k)=O'0do 35 l=I,kuf(l)=r¡(l¡
35 continuec Set remaining final displacement store to zero
do 42I=k+l,NT-luf(l)=Q'9v(l)=O'0a(l){.0
42 continuegoto 1000
end ifdps=dpsyj=jva=ayuyy{.0jeventd)px=px+le=lf=1
c write(1,*)"dpsy initial cond at"
332
APPENDIX G: Nln-Iinear Time History Analysis ROWMANRY Fortrøn77 Code
ccccc
c write(l,*) dpsy, yc Restart iteration with new predicted proportional damping coefficient
goto 5end if
c DECREASINGDISPLACEMENTelse
c NOEVENTif(uyy.lt. uy(- 2))then
u(k)-uyyc WITHEVENT
elsedps=ks2*(uyy-uy(-2))uyy=uy(-2)Jevent=-lcode="Model rocked within limits"goto 15
end ifend if
end ifend if
Zero crossings, instantaneous frequency andRayleigh damping
Identify zero crossing from neg to posif(tO.ne.t2)thenif(u(k).gt.0.0.AND.u(k- I ).1e.0.0)then
write(1,*) "neg pos zero cross"tl =dt*u(k- I )(u(k- I )-u(k))t2dt*u(k)/(u(k)-u(k- 1 ))tO=t0-dt+tlj=j+lif(.gt.l)then
if(d.ne.1)thenProvided not prior to first half cycle or reiteration determinesRayleigh damping of compleæd half cycle response
nc=(aOm+a I m*pi*pil(tO* *2))Setting the maximum proportional damping coefficient forFrequency range of interest
if(nc .gt. 10.0)thennc=10.0
end ifwriæ(1,*) "period outcome predicted iteration k"wriæ(1,*) t0, nc, pc, p, k
if(nc.gt. 1. I *pc.OR.nc.lt.0.9*pc.AND.p.lt. 1O(Ð)thenLimit on iterations t0 1000Compares Rayleigh damping with initial predictionff out of the specified bounds a reiteration is requiredwith new predicæd proportional damping coefficient predicted below
wriæ(I,*) "REITERATE - new pc"pc=0.5*nc+0.5*pc
write(1,*) pcReset the initial conditions to the start of the current cycle
dps=dpsyj=jya=ay
c
cc
cc
cc
ccccc
cc
333
APPENDIX G: Nhn-linear Time History Anolysis RowMANRy FortranTT code
c write(1,*)"dps j a"c wrire(l,*) dps, j, a
uyy=O'0jevent{
c Iteration numberp=plle=lf=l
c Restart iteration with new predicæd proportional damping coefficientgoto 5
elsec write(I,*) "PC-NC within limis"
if(p.gt.99)thenc write(*,*)"Iteration limit exceeded"
end ifP=0px=0e=0
c Setting the predicted proportional damping for the next half cyclec to the successful proportional damping of the current half cycle
pc=3.0c Transfer successful iteration to final displacement store
do 20I=I,k-luf(l)=r¡11¡
20 continueend if
end ifelse
c Transfer displacements prior to first half cycle to final disp storedo 2l l=I,k-l
uf(l)=¡1¡¡2l continue
end ifû=A
c Set the initial conditions for the next half cyclec The zero value for the dps depend on the new u(k) location
if(u(k).lt.uy( I ))thendps=ktsl*u(k)
elseif(u(k). lt. uy(2)) then
dps=uy( I )*krs t+(u(k)-uy( I ))*ktspelse
dps=uy( I )*kts I +(uy(2)-uy( I ))*ktspr(u(k)-uy(2))end if
end ifuyy=O'0Jevent=0
c Store the initial conditions for the next half cycledpsx=dpsjx=j-lax=ax=k
c write(l,*) "dpsx jx x k u(k)"c write(I,*) dpsx, jx, x, k, u(k)
goto 15end if
334
APPENDIX G: N0n-linearTime History Analysis ROWMANRY FortanT7 Code
cc
end if
Identify zero crossings from pos to negif(t0.ne.t4)thenif(u(k).lt.0.0.AND.u(k- I ).ge.0.O)then
write(1,*) "pos neg zero crossing"t3dt*u(k- 1)(u(k- 1)-u(k))t4{r*u(k)(u(k)-u(k- 1 ))t0=t0-dt+Bj=j+1if(.gt.l)thenif(e.ne.l)then
Provided not prior to fftst half cycle or reiteration determinesRayleigh damping of compleûed half cycle response
nc=(a0m+a I m*pi*pi(t0* *2))if(nc.gt.10.O)then
nc=10.0end if
write(1,*)"t0 nc pc p k"write(l,*) t0, nc, pc, p, k
if(nc. gt. I . I *pc.OR.nc.lt.0.9 *pc.AND.p.lt. I 000)thenLimit on iterations to 1000Compares Rayleigh damping with initial predictionIf out of the specified bounds a reiteration is requiredwith new predicæd proportional damping coefficient predicæd below
wriæ(l,*) "REITERATE - new pc"pc=0.5*nc+O.5*pc
write(1,*) pcReset the initial conditions to the start of the current cycle
dps=dpsxjjxa=ax
write(1,*)"dps j a"write(l,*) dps, j, a
uyy{.0jevent=O
Iteration numberp=pt_ld=lf=1
write(1,*) "new dps j x d f"write(1,*) dps, j, x, d, f
Resørt iæration with new predicted proportional damping coefficientgoto 5
elsewrite(1,*) "PC-NC within limits"
if(p.eq.100)then, w¡iæ(*,*)"Iteration li¡nit exceeded"
end ifP=0px4d{
The successful predicted proportional damping for the current halfcyclebecomes the fnst approximation for the next haH cycle
pc=3.0Transfer successful iteration to final displacement store
c
cc
cc
cccçc
cc
cc
c
ccc
c
cc
c
335
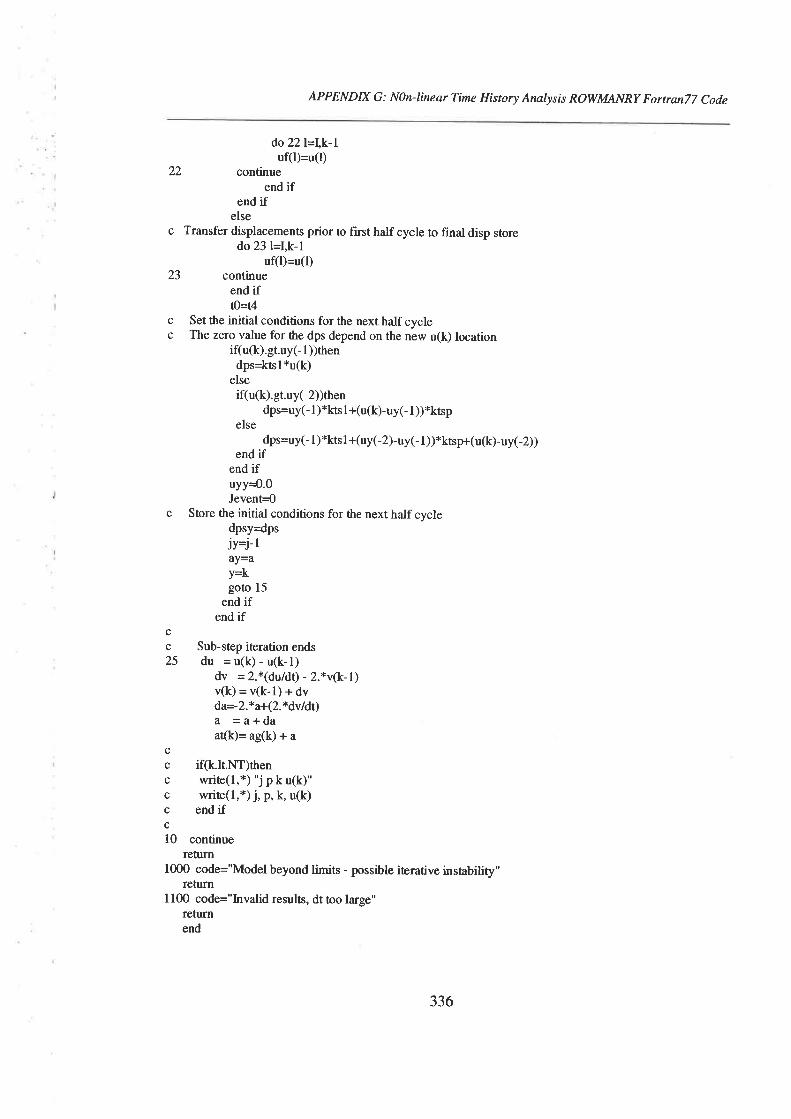
APPENDIY G: N)n-linearTime History Analysis RowMANRy FortranT7 code
do22l-\k-luf(l)=u0)
22 continueend if
end ifelse
c Transfer displacements prior to first half cycle to final disp storedo 23 l=I,k-l
uf(l)=u(l)23 continue
end ift0=t4
c Set the initial conditions for the next half cyclec The zero value for the dps depend on the new u(k) location
if(u(k).gt.uy(- I ))thendps=ktsl*u(k)
elseif(u(k). gt.uy(-2))rhen
dps=uy(- I )*lfs I +(u(k)-uy(- I ))*ktspelse
dps=uy(- I )*kts 1 +(uy(-2)-uy(- I ))*ktspr(u(k)-uyC2))end if
end ifuyy=o'0Jevent=0
c Store the initial conditions for the next half cycledPsY=dPsjy=j-lîY=aY=kgoto 15
end ifend if
Sub-step iteration endsdu =u(k)-u(k-l)
dv = 2.*(du/dt) - 2.*v(k-l)v(k)=v1¡-1¡*¿'ttda=-2.*a+(2.*dv/dt)a =a+daat(k)= ¿g(lç¡ .r u
if(k.lt.NT)thenwrite(1,*)'Jpku(k)"wrire(I,*) j, p, k, u(k)
end if
10 continuereturn
1000 code="Model beyond timits - possible iterative instability"feturn
I100 code="Invalid results, dtûoo large"feturnend
cc25
cccccc
336

APPENDIX G: N)n-linearTirne History Analysis ROWMANRY FortranT7 Code
cccc
subroutine frrdnnx(Nrdin¡x,max)c Subroutine to hnd the absolute max. value of ac single dimension ilray xc decla¡ation of parameters
inæger N,dimreal x(O:dim),max
c decla¡ation of local va¡iablesinteger Imaxd).do l0 I=0,N-l
if(ab s(x(I)). ge.abs(max))thenmax=abs(x(t))
elseend if
10 continuereturnend
subroutine linter(NNTTTA,DT,NG'G)This subroutine interpolates linearly between uneven sample points.The interpolated data are then generated at a specified sample inærval
declaration of parametersinægerNN,NGreal T(0: 1 2000),4(0: 12000),DT,G(0: 163 84)declaration of local variablesinteger J,Kreal S
NG=int((T(NN- 1 )-T(0))/DT)+ IG(0)=A(0)J{do 50 K=l,NG-1
55 if(K*DT.lt.T(J+1))thens=K*DT_T(J)G(K)=A(J)+S*(A(J+ I )-A(J))(T(J+ 1 )-T(J))elseJd+lgoto55end if
50 continuerehlfnend
c
JJI

338
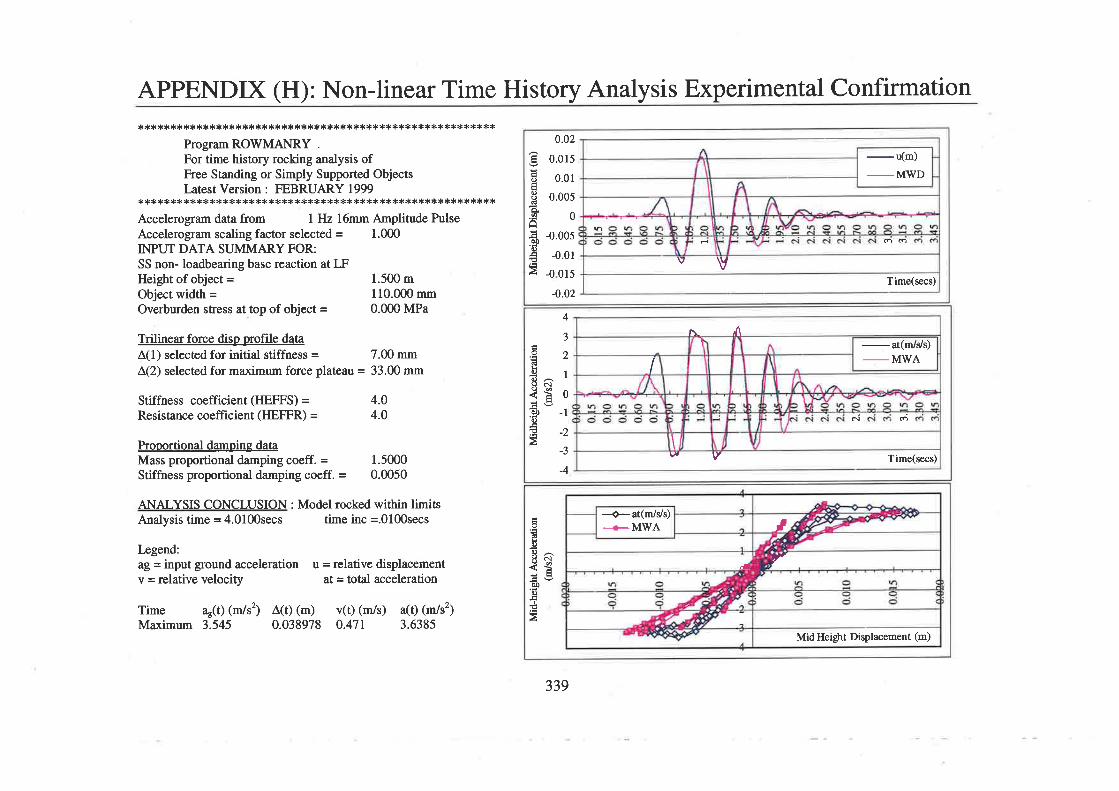
-u(m)_MWD
o o
v \yTime(secs)
0.02
0.015
0.01
0.005
0
-0.00s
-0.01
-0 015
-0.02
ooodè
t-¡
èooÊ€À
4
3
Ot
l¿1O^^Qd<È u
.$ -lo€-t
= -J
-4
t\Á
-at(trì/VÐ-MWA
óN
Time(secs)V
-J_
I
\
I
;doooo,
ôdÐo^!t ñ'ã<EVè0o¡JÀ
rr
Mid Height Displacement (m)
+-at(m/Js)_+MrilA
/
APPENDIX (H): Non-linear Time History Analysis Experimental Confirmationt *t(**********{c*r!*t ***t :ß:ß********{.**********************
Program ROWMANRY .
For time history rocking analysis ofFree Standing or Simply Supported ObjectsLatest Version : FEBRUARY 1999
***********r<**:1.:t<***********t *********************1.***r<*Accelerogram data from I Hz 16mm Amplitude PulseAccelerogram scaling factor selected = 1.000INPUT DATA SUMMARY FOR:SS non- loadbearing base reaction at LFHeight ofobject = 1.500 mObject width = 110.000 mmOverburden stress at top of object = 0.000 MPa
Trilinear force disp profile dataÂ(1) selecæd for initial stiffness = 7.00 mmÂ(2) selected for mædmum force plateau = 33.00 mm
Stiffness coefficient (IIEI'FS) =Resistance coefficient (ÌIEFFR) =
Prooortional damping dataMass proportional damping coeff. =Stiffness proportional damping coeff. =
I-egend:aB = input ground accelerationv = relative velocity
1.50000.0050
u = relative displacementat = total acceleration
v(t) (m/s) a(t) (m/s2)0.471 3.6385
4.04.0
ANALYSIS CONCLUSION : Model rocked within limitsAnalysis time = 4.0l00secs time inc =.0100secs
Time q(t) (m/s2) ^(t)
(m)Maximum 3.545 0.038978
339
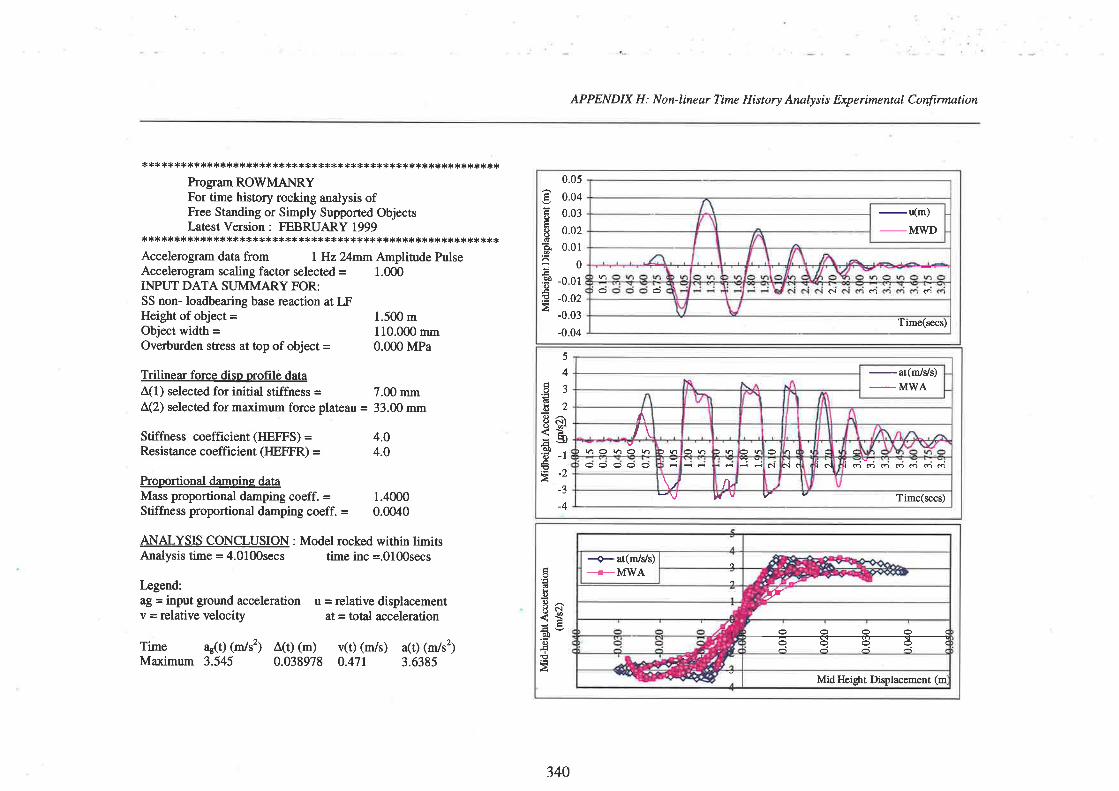
AP PENDIX H : N on- Iine ar Time History Analy sis Exp erime ntal C onfirmation
*** *** * **** **** ***** ******* ***d< **** *** ** **** *** ****** **
Program ROWMANRYFor time history rocking analysis ofFree Standing or Simply Supported ObjectsLatest Version : FEBRUARY 1999
*********+****:ß********+***********t ********+t***{.*t(***Accelerogram data from I Hz 24mm Amplitude PulseAccelerogram scaling factor selected = 1.000INPUT DATA SUMMARY FOR:SS non- loadbearing base reaction at LFHeightofobject= 1.500mObject widrh = 110.000 mmOverburden stress at ûop of object = 0.000 MPa
Trilinear force disp orofilé dataÂ(1) selected for initial stiffness = 7.00 mmÀ(2) selecæd for maximum force plateau = 33.00 mm
Stiffness coefficient (IIE¡PS) =Resistance coefficient (IIEI,¡'R) =
Proportional damoine dataMass proportional damping coeff. =Stiffness proportional damping coeff. =
Iægend:aB = input ground accelerationv = relative velocity
1.40000.0040
u = relative displacementat = ùotal acceleration
v(t) (m/Ð a(Ð (m/s2)0.471 3.638s
4.04.0
ANALYSIS CONCLUSION : Model rocked within limitsAnalysis time = 4.0l00secs time inc =.0100secs
Time ar(t) (m/s2)Maximum 3.545 ^(t)
(m)0.038978
-u(m)_MWD
omel
Time(secs)
0.05
0.040.03
0.02
0.01
0
-0.01
-0.02
-0.03
-0.04
ëooodo.
H2è¡)
à
5
4ÔJ
EoALõ^8gl;sdo -l-=>-L
-3
-4
- ar(Íilvs)
-MWA
lmooomom
vJv Time(secs)
¡clN(Ôì
3V>h
^,
3hbn
Á/\
)hohoh
.5doõ-!ì ?.¡'<*
Ávè¡!o
troooo(oooo(-iâ-iA
MidHeight Displacement (m'
+at(m/Vs)+MWA
340
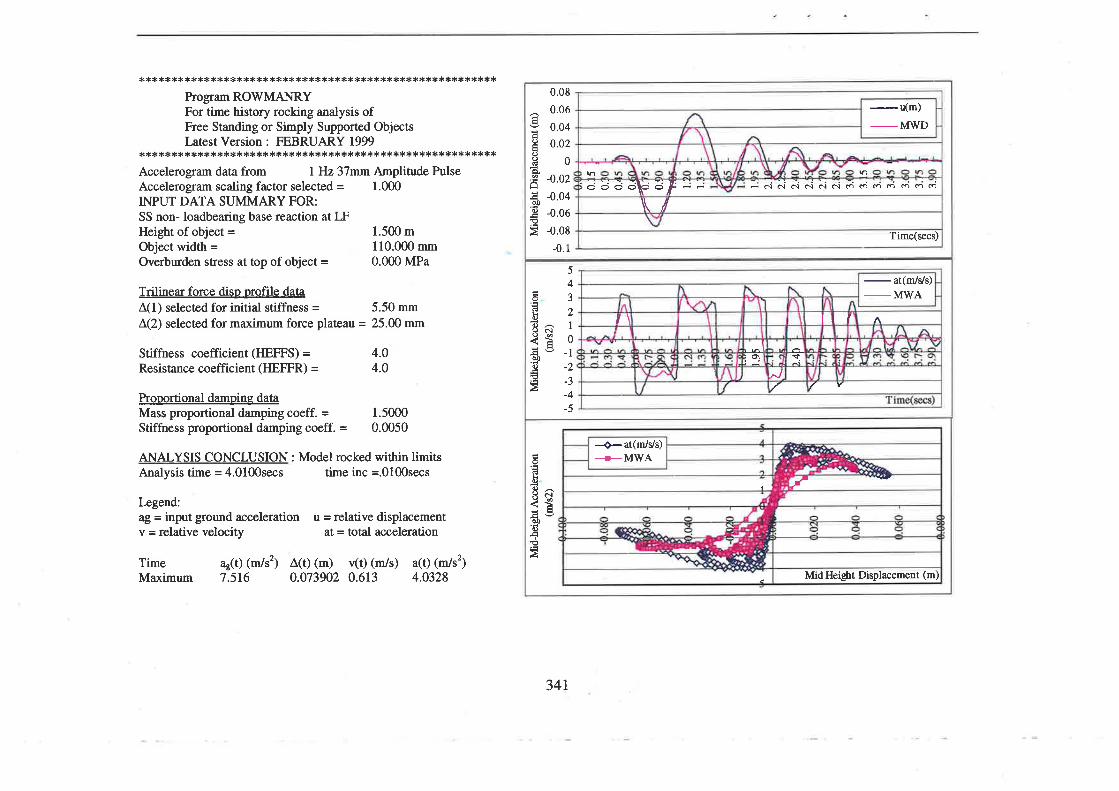
*****************:ß******:le*****d.**'r*************+*i.{.**t {.
Program ROWMANRYFor time history rocking analysis ofFree Sønding or Simply Supported ObjectsLatest Version : FEBRUARY 1999
**'r **** * *** ** *** * **** *** * **** * *** ********* ***{c *<*{.** **t<:1.
Accelerogram data from I Hz37nm Amplitude PulseAccelerogram scaling factor selected = 1.000INPUT DATA SUMMARY FOR:SS non- loadbearing base reaction at LFHeightofobject= 1.500mObject width = 110.000 mmOverburden sEess at top of object = 0.000 MPa
Trilinear force diso orofile dataÂ(1) selected for initial stiffness = J.50 mmÂ(2) selecæd for maximum force plateau = 25.00 mm
Stiffness coefficient (IIEFFS) =Resistance coefficient (IIEFFR) =
4.04.0
Prooonional dampine dataMass proportional damping coeff. =Stiffness proportional damping coeff. =
Legend:ag = input ground accelerationv = relative velocity
1.50000.00s0
u = relative displacementat = total acceleration
ANALYSIS CONCLUSION: Model rocked within limitsAnalysis time = 4.0100secs time inc =.0100secs
Time ar(t) (m/s2)Maximum 7.516
) a(Ð (m/s2)4.0328^(t)
(m)0.073902
(m/sv(r)0.613
oo(gÞ.
f-l
Ò0o
À
0.08
0.06
0.04
0.02
0
-0.02
-0,04
-0.06
-0.08
-0.1
ÊÊ ÉelClô.¡Ncleloomóooo;JðèèÌr"f\\/
-¡(m)-MV|/D
Time(secs)
54
OJd1BLo^lONåÉ 0Ëë -t4'õ -)
-4-5
-
at(mj/si/s)
-MWAtt I
Tl.¿)o\ì
t\
döo^!ì ñ'ì*JÈ¡
ot)o¡
i
MidHeigbt Dsplacement (m)
+at(m/ds)----+-M\ilA
I
34r
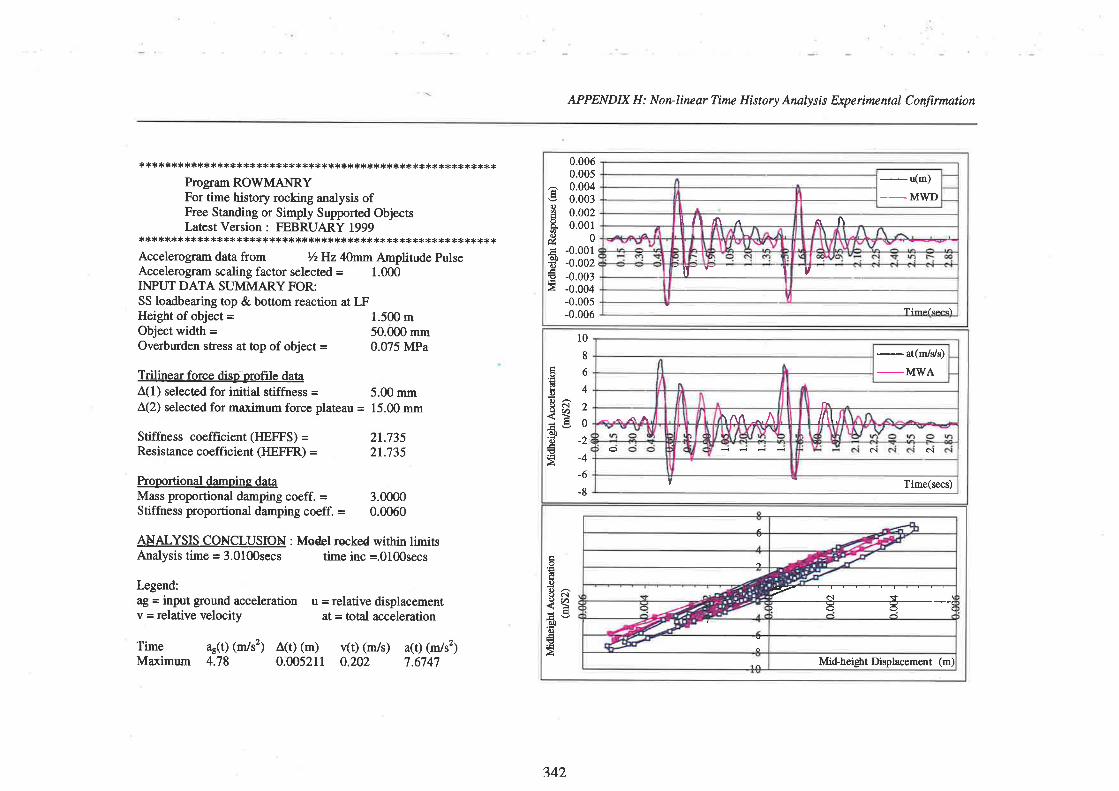
APPENDIX H: Non-linear Time History Analysis Experimental Confirmation
*** ***** *** * *************+*** ***:r:ß******+* **** **** *****Program ROWMANRYFor time history rocking analysis ofFree Standing or Simply Supported ObjectsLatest Version : FEBRUARY 1999
*'ß* *t<.** ********:ß**************t* ****** ** ***** **** **** **
Accelerogram data from YzHz 4Ùmm Amplitude PulseAccelerogram scaling factor selected = 1.000INPUT DATA SUMMARY FOR:SS loadbearing top & bottom reaction at LFHeight of object = 1.500 mObject width = 50.000 mrnOverburden stress at úop of object = 0.075 MPa
Trilinear force diso profile dataÂ(1) selecæd for initial stiffness = 5.00 mrnÂ(2) selected for mærimum force plateau = 15.00 mm
Stiffness coefficient(IlE¡fs) = 21.735Resistance coefficient (HEFFR) = 21.735
Proportional damoine dataMass proportional damping coeff. =Stiffness proportional damping coeff. =
Iægend:ag = input ground accelerationv = relative velocity
3.00000.0060
u = relative displacementat = total acceleration
AÀIALYSIS CONCLUSION : Model rscked within limitsAnalysis time = 3.0l00secs time inc =.0100secs
Time as(t) (m/s2)Maximum 4.78
v(t) (m/s) a(t) (m/s2)0.202 7.6747^(t)
(m)0.005211
gts
eo
-éà0o
5
0.0060.0050.0040.0030.0020.00r
0-0.00r-0.002-0.003-0.004-0.00s-0.006
-(m)_ MWD
.r l\
v
nllÍ\ ^
-lr v- I
10
8
8oË¿Ea oo6-iËlìo¡)'Þ -2
È-4-6
-8
il\t l
elel
\AA..A
- at(m/srs)
-MWA
Time(secs)v
éo€oo^qd9u)
c¡o
ÀMid-heigþt Displacement (m)
142
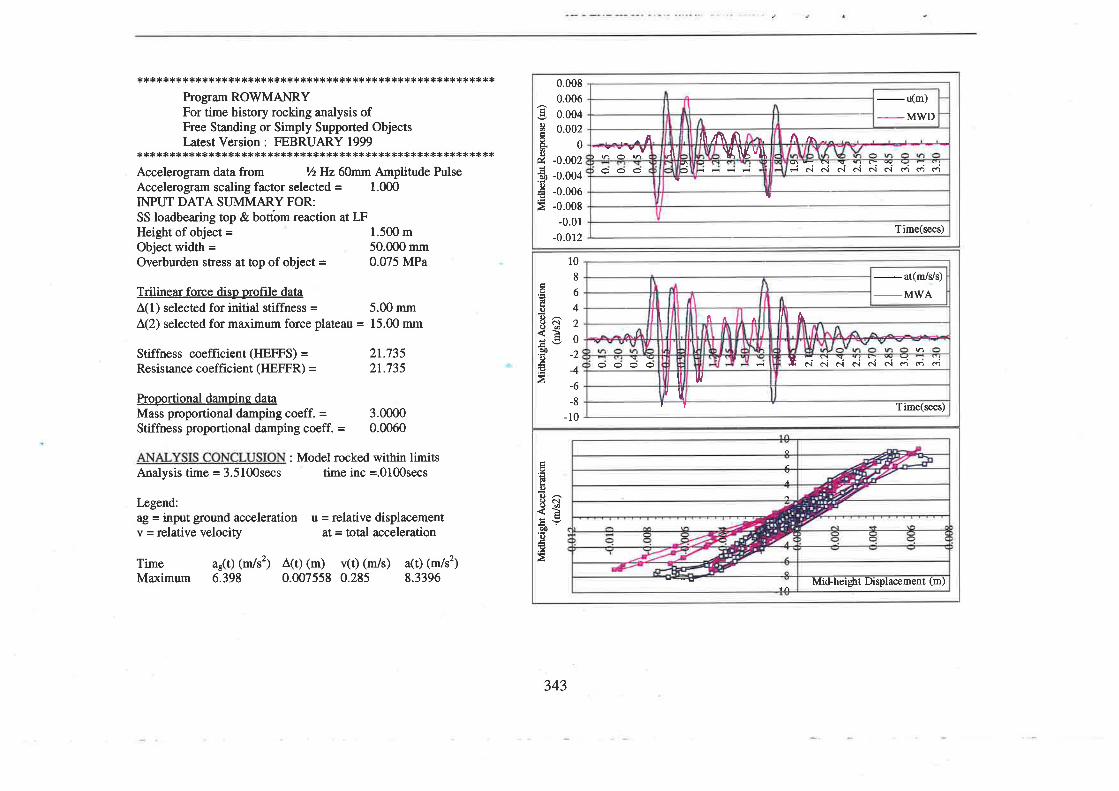
*********{.*******{c***'1.************1.*,1.{.*******{<*t<t **1.*r.d.
Program ROWMANRYFor time history rocking analysis ofFree Standing or Simply Suppoted ObjectsLatest Version : FEBRUARY 1999
**¡lc*¡lc**t(******t *********rl.**+*****{.******{<*{<*1!***1 1.****:tc
Accelerogram data from r/zHz 60mm Amplitude PulseAccelerogram scaling factor selected = 1.000INPUT DATA SUMMARY FOR:SS loadbearing top & bottom reaction at LFHeightofobject= 1.500mObject width = 50.000 mmOverburden sEess at top of object = 0.075 MPa
Trilinear force disp Eofile dataÅ(1) selecæd for initial stiffness = J.00 mmÂ(2) selecæd for maximum force plaûeau = 15.00 mrn
Stiffness coefficient (HEFFS) =Resistance coefficient (HEffR) =
Prooortional dampine dataMass proportional damping coeff. =Stiffness proportional damping coeff. =
2r.73521.735
3.00000.0060
: Model rocked within limits' time inc =.0100secs
u = relative displacementat = total acceleration
^(t) (m) v(r) (m/s) a(t) (m/s2)
0.007558 0.285 8.3396
Analysis time = 3.5100secs
Legend:aB = input ground accelerationv = relative velocity
Time ar(Ð (m/s2)Maximum 6.398
343
0.0080.0060.0040.002
0-0.002-0.004-0.00ó-0.008
-0.01
-o.012
1'o
eo&d)o,éÀ
_(m)
-MWDÂ rrr--qF (r Y q¡ r--ieiõiÕiõiõiñú;riri
{
Time(secs)
\1,ì\ÉvuJIA
ooo
l08
É€6db4Ec 2
Íè od.É
-8_10
-at(m/Ys)-MWAA
IññÀñi¡ñã¿à¡
rr Time(secs)
II
t/
f\ ,r
ilYU
l
oôoo
É'5doO^od<èË.,11oùoÉ
Mid-height Dsplacement (m)

APPENDIX H: Non-linear Time History Analysis Eryerimental Confirmation
'1.**********1ê**************t **{<*************************Program ROWMANRYFor time history rocking analysis ofFreæ Sønding or Simply Supported ObjectsLatest Version : FEBRUARY 1999
*** ***** *** **:N.** ******** ********* +**X:N.* *** ******** *****Accelerogram data from I Hz 30mrn Amplitude PulseAccelerogram scaling factor selected = 1.000INPUTDATA SUMMARYFOR:SS loadbea¡ing top & bottom reaction at LFHeightofobject= t.500mObject width = 50.000 mmOverburden shess at top of object = 0.075 MPa
Trilinea¡ force disp orofile dataÂ(1) selected for initial stiffness = 415 nrnrtÂ(2) selected for maximum force plateau = 14.00 mm
Stiffness coefficient (IIEFPS) =Resistance coefficient (I{EFFR) =
Proportional damoine dataMass proportional damping coeff. =Stiffness proportional damping coeff. =
Iægend:ag = input ground accelerationv = relative velocity
3.00000.0060
u = relative displacementat = ûotal acceleration
v(t) (m/s) a(Ð (m/s2)0.283 9.4s62
2t.73521.735
ANALYSIS CONCLUSION : Model rocked within limitsAnalysis time = 2.0100secs time inc =.0100secs
TimeMaximum
ae(t) (rn/s2)5.839 ^(t)
(m)0.0087r8
0.010.0080.0060.0040.002
0-0.002-0.004-0.00ó-0.008
-0.01
Þc(l)Eo)()(úo-.ao.9)q)
p
-u(m)-
fvfvvD
^
r - \¿r-;
Tine(secs)
rOoo
)tl //\ I
rb// å,&ð"¡
^ ocI
l()
o
108
q6'ã4s^ 28g 0
Íè'2B-4€-6Ë-8
_10
-12
- at(mirs/s)
_MWA
V
VTime(secs)
I
lll r
Å[^.
5dÐ
8ñåçÞeEà
14¿.
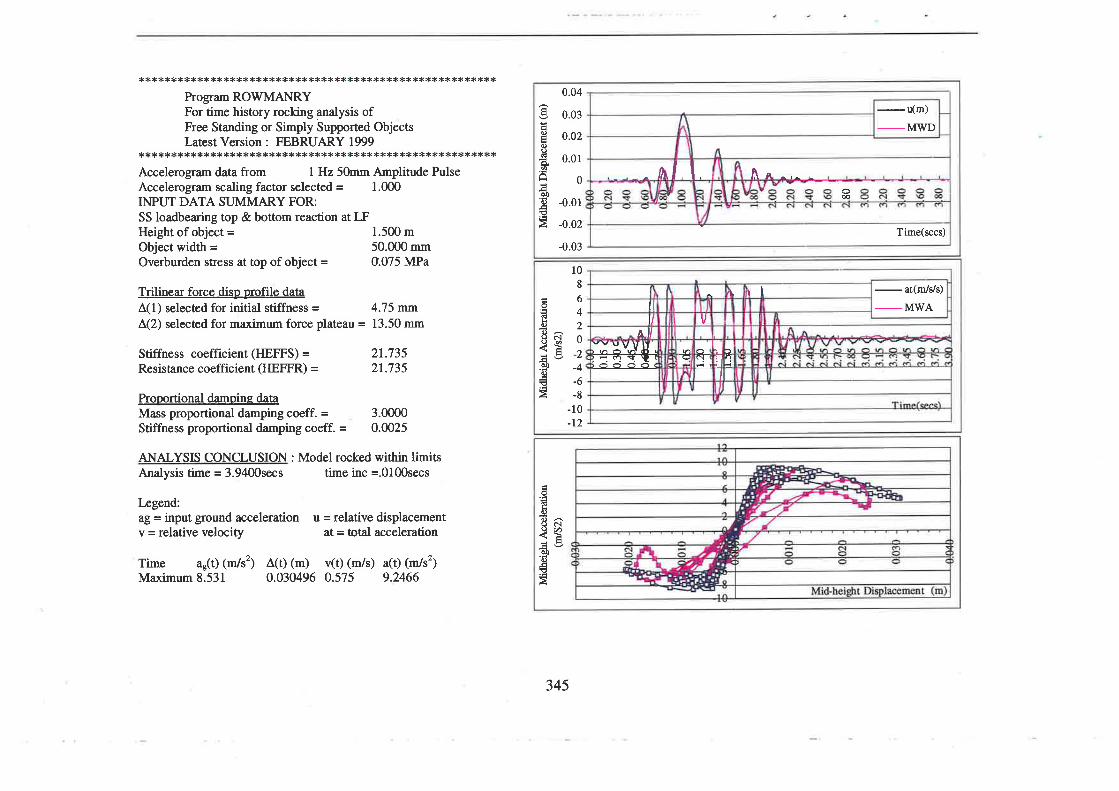
******t **1.*******+******t *+t<************t<******'F*têrêt ***Program ROWMANRYFor time history rocking analysis ofFree Standing or Simply Supported ObjectsLatest Version : FEBRUARY 1999
,1.'1.***t(********{.**d<***{<**t<**t *******'1.***r!*{<*******1.*****
Accelerogram data from I Hz 50mm Amplitude PulseAccelerogram scaling factor selected = 1.000INPUT DATA SIJMMARY FOR:SS loadbearing top & bottom reaction at LFHeightofobject= 1.500mObject width = 50.000 mmOverburden stress at top of object = O.075 MPa
Trilinear force disp orofile dataÀ(1) selected for initial stiffness = 4.75 mmÂ(2) selecæd for maximum force plateau = 13.50 mm
Stiffness coefficient (HEFFS) =Resistance coefficient (IIEfpR) =
Prooortional damoine dataMass propofional damping coeff. =Stiffness proportional damping coeff. =
Iægend:aB = input ground accelerationv = relative velocity
3.00000.0025
u = relative displacementat = total acceleration
^(Ð (m) v(Ð (m/s) a(t) (m/s2)
0.030496 0.575 9.2466
21.73521.735
ANALYSIS CONCLUSION : Model rocked within limitsAnalysis time = 3.9400secs time inc =.0l00secs
Time ar(Ð (m/s2)Maximum 8.531
-(m)-MWD
À n, ^,-æ
Time(secs)
0.04
ë 0.03ËÊ o.o2ooE o.ol
äoÁèoÐ -0.01
= -0.02
-0.03
l08
c65(̂€'-ÞzO^8g 0<l'-ë -¿
B-4€-6E-8
-10-12
-at(m/Ys)-MWA
tl\
ñLrl1
V
a__]NI'j,
illt
â.l,
Ëës+
od{)o^ONa) .ò
èDoÉÀ
345
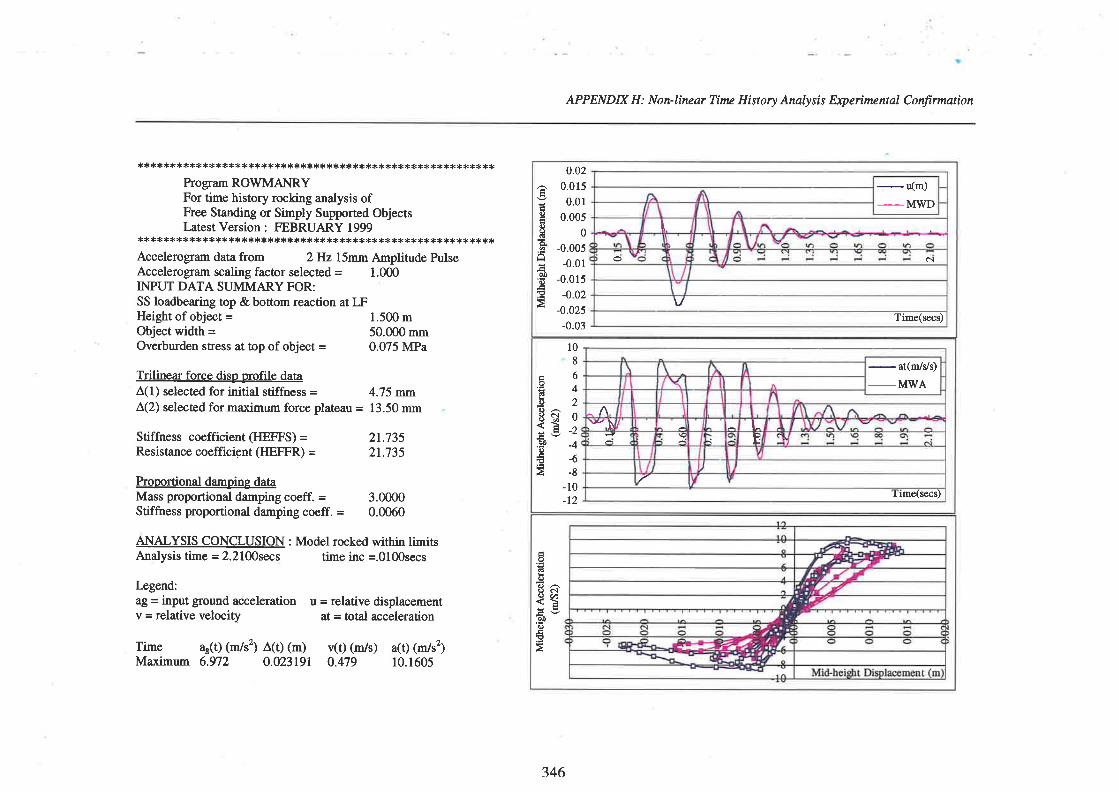
APPEN DIX H : Non- linear Tirne History Analy sis Exp e rtmcntal C onfirmation
*** **** *+** ************* ********* ***** +*** **** **** *****Program ROTWMANRYFor time history rocking analysis ofFree Standing or Simply Supported ObjectsLatest Version : FEBRUARY 1999
*** ****:t*** *** ** ** ** ***+ ***** ******** *******'ßi. **** * ****Accelerogram data from 2Hz l5mm Amplitude PulseAccelerogram scaling factor selected = 1.000INPUT DATA SUMMARY FOR:SS loadbearing top & bottom reaction at LFHeightofobject = 1.500 mObject width = 50.000 mmOverburden stress at top of object = 0.075 MPa
Trilinear force disp profile dataÂ(1) selected for initial stiffness = {.75 mmÂ(2) selected for manimum force plateau = 13.50 mm
Prooortional damoing dataMass proportional damping coeff. = 3.0000Stiffness proportional damping coeff. = 0.0060
ANALYSIS CONCLUSION : Model rocked within limitsAnalysis time = 2.2100secs time inc =.0100secs
Stiffness coefficient (IIEFFS) =Resistance coefficient (IIEnfR) =
Iægend:aB = input ground accelerationv = relative velocity
Time ar(t) (m/s2) ^(t)
(m)Maximum 6.972 0.023191
21.73521.735
u = relative displacementat = ûotal acceleration
v(t) (m/s) a(Ð (m/s2)0.479 10.1605
-(n)-MWD
c-l
vTime(secs)
t
o
0.020.0r50.01
0.0050
-0.005-0.0r
-0.0r5-0 02
-0.025-0.03
âøoooGÈâ2è¡)o
108
a6'iã46b?O^8S 0<t.30 -4o€-6
=-8 -10-12
-at(m/Vs)_MWA
I ime(secs)
IE\I
A.*.\
Ðo^AN9u)
c)oãtÀ
?46
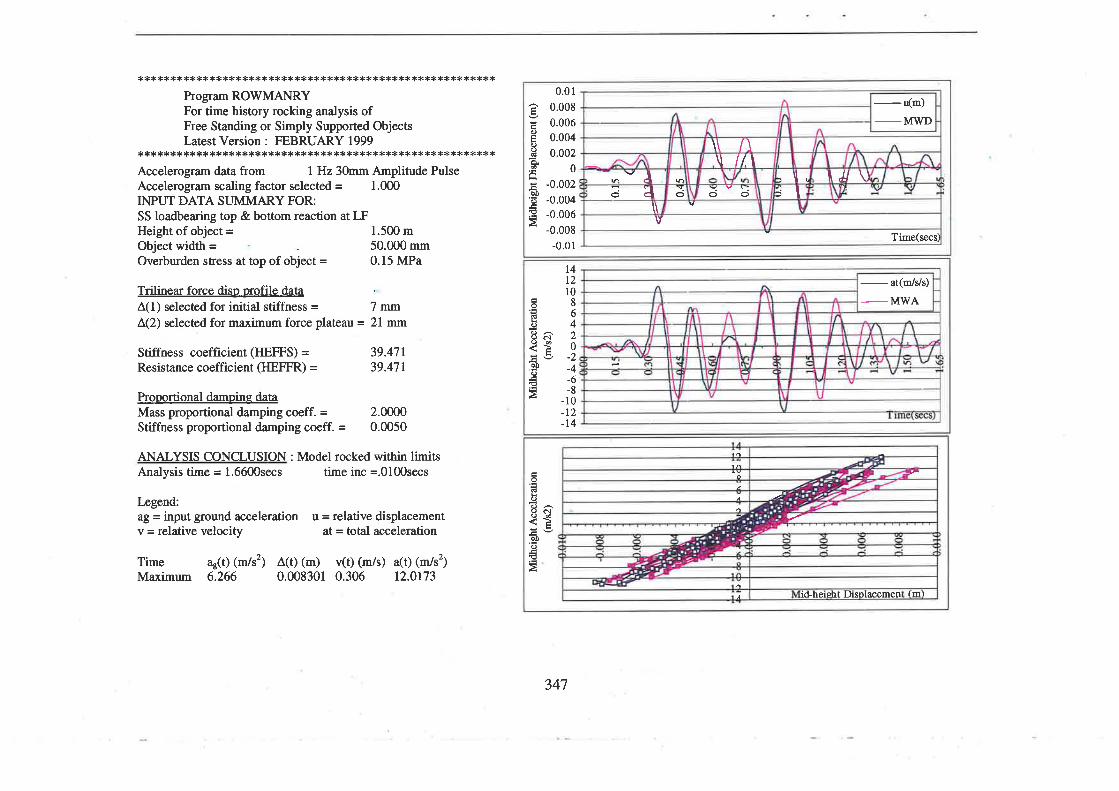
*** **{r* ***{. * *{<** *** * **{. *1.*r<** +*** ** ** ***** **** *ts:lc * ***ic*
Program ROWMANRYFor time history rocking analysis ofFree Standing or Simply Supported ObjectsLatest Version : FEBRUARY 1999
**********:*:1.**:1.:1.*rß**t(**********¡1.*r¡**t ,1.*****+********r<t *Accelerogram data from I Hz 30mm Amplitude PulseAccelerogram scaling factor selected = 1.000INPUT DATA SUMMARY FOR:SS loadbearing top & bottom reaction at LFHeightofobject= 1.500mObject width = 50.000 mmOverburden shess at top of object = 0.15 MPa
Trilinear force diso nrofile dataÂ(1) selecæd for initial stiffness = 7 mmÂ(2) selecæd for maximwn force plateau = 2l mm
Stiffness coefficient (HEFFS) =Resistance coefficient (IIEFFR) =
Propgrtional dampine dataMass proportional damping coeff. =Stiffness proportional damping coeff. =
Iægend:aB = input ground accelerationv = relative velocity
2.00000.00s0
u = relative displacementat = total acceleration
^(Ð (m) v(t) (m/s) a(t) (m/s2)
0.008301 0.306 12.0173
39.47t39.47r
ANALYSIS CONCLUSION : Model rocked within limitsAnalysis time = 1.6600secs time inc =.0l00secs
Time ar(Ð (m/s2)Maximum 6.266
0.010.0080.0060.0040.002
0-0.002-0.004-0.006-0.008
-0.01
ooodo.
è0o
À
-(m)_MWD
Time(secs)
tJ/ u\)3I
\\/\\ /ltoo
V !
.l3ä\\
t4l2r088'Ë6
b4O^()d t
d'õ -1¿= -OÈ-BÁ -lo
-12-14
- at(m/s/s)
-MWA
ô
oO^a ô^¡<ìàt)o
fmlid-heidit Llisolacemen
zI
347
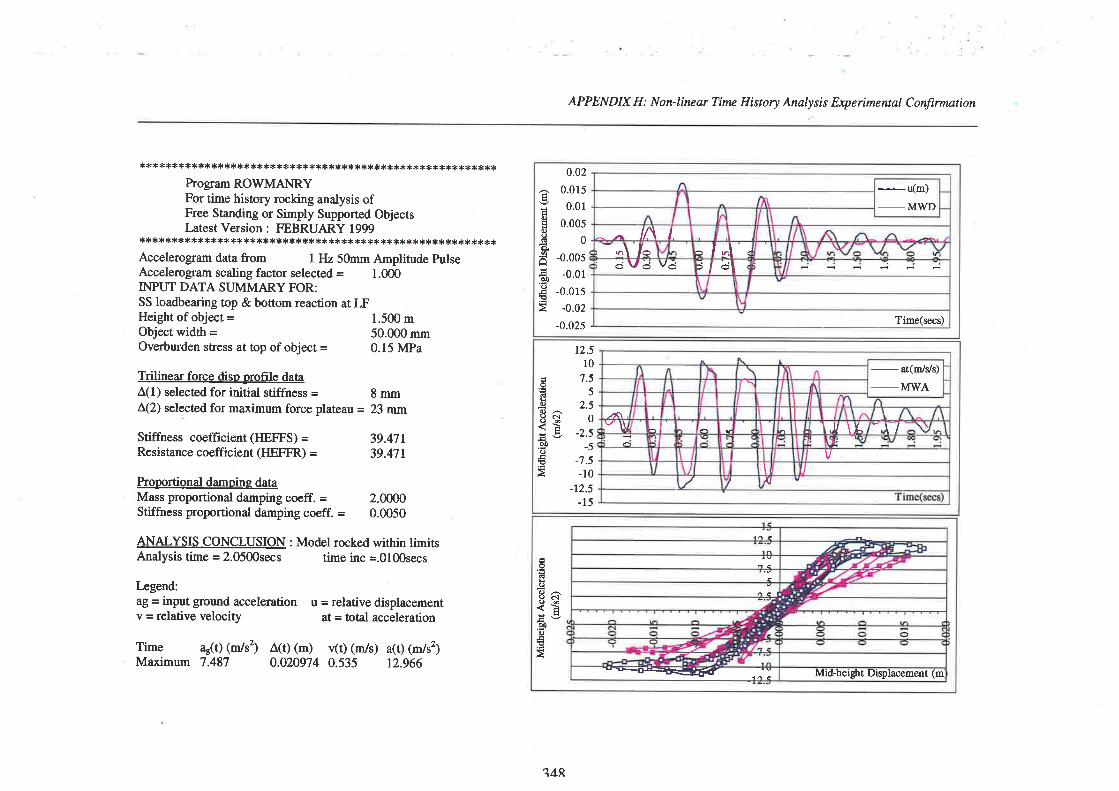
AP P EN D IX H : N on- line ør Time H i s t ory Analy s i s Exp e rime nt al C onfi rmat ion
*1.t ************{.********************:F******************Program ROWMANRYFor time history rocking analysis ofFree Standing or Sirnply Supported ObjectsLatest Version: FEBRUARY 1999
************:F************:¡:t i.***************+***{.***,tc*,ß*Accelerogram data from I Hz 50mm Amplitude PulseAccelerogram scaling factor selected = 1.000IMUT DATA SUMMARY FOR:SS loadbearing top & bottom reaction at LFHeightofobject= 1.500mobject width = 50.000 mmOverburden shess at top of object = 0.15 MPa
Trilinea¡ force diso profile dataÂ(l) selecæd for initial stiffness = 8 mmÂ(2) selected for maximum force plateau = 23 nrn
Stiffness coefficient (IIEFFS) =Resistance coefficient (IIEFFR) =
39.47139.471
ANALYSIS CONCLUSION : Model rocked within limitsAnalysis time = 2.0500secs time inc =.0100secs
Proportional damoine datåMass proportional damping coeff. =Stiffness proportional damping coeff. =
Iægend:aB = input ground accelerationv = relative velocity
2.00000.0050
u = relative displacementat = total acceleration
^(t) (m) v(Ð (m/s) a(0 (m/s2)
0.020974 0.535 12.966Time ag(t) (m/s')Maximum 7.487
gÉtsoo6tè
H
clo
0.02
0.015
0.0r0.005
0
-0.00s
-0.01
-0.015
-0.02
-0.02s
-u(m)-MWD
I
Time(secs)
)
o l-l (rÍèl;/At
; c;\/d v¿
o'!doO^9N<tc)o,4€À
12.5l0
7.55
2.50
-2.5-5
-7.5-10
-12.5-15
- ar(m/Vs)
_MWA
V
Ãt
-Jt,Jl \L
\I
t*\
Y\\
GoO^a c.¡<l.$C)
ÀMid-heigþt Displacement (m--Fos:ËÈJf+tÚz
?4R
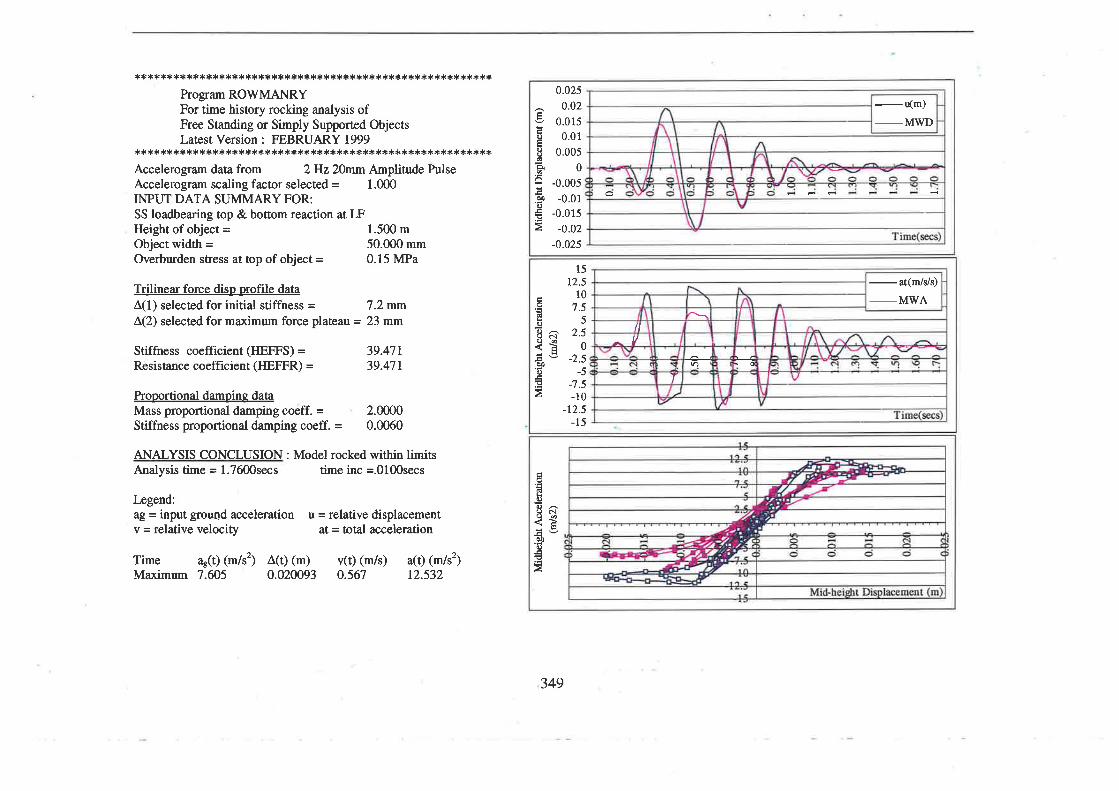
****{.*!.1.'**{<r.*************t ******************************Program ROV/MANRYFor time hisory rocking analysis ofFree Standing or Simply Supporæd ObjectsLatest Version : FEBRUARY 1999
********:t ***********{.r.************dc*****ds****:1.*¡lc***t :k**
Accelerogram data from 2Hzã0rll.n Amplitude PulseAccelerogram scaling factor selected = 1.000INPUT DATA SUMMARY FOR:SS loadbea¡ing top & bottom reaction at LFHeight ofobject = 1.500 mObject widrh = 50.000 mmOverburden súess at top of object = 0.15 MPa
Trilinear force disp profile dataÂ(1) selecæd for initial stiffness = 7.2 mmÂ(2) selected for maximum force plateau = 23 mm
Stiffness coefficient (IIEFFS) =Resistance coefficient (IIEFFR) =
hooortional dampine dataMass proportional damping coeff. =Stiffness proportional damping coeff. =
Iægend:aB = input grouqd accelerationv = relative velocity
2.00000.0060
u = relative displacementat = total acceleration
39.47139.47t
v(t) (m/s) a(Ð (m/s'?)0.567 12.532
ANALYSIS CONCLUSION: Model rocked within lirnitsAnalysis time = 1.7600secs time inc =.0100secs
Time ae(t) (m/st)Maximum 7.605 ^(t)
(m)0.020093
oõodÀA¡o0o
0.0250.02
0.0150.01
0.0050
-0.005-0.0r
-0.0r5-0.02
-0.025
-¡(m)-MWD
É
doO^oñOøi<è.9o-éEÀ
1512.5
107.5
52.5
0-2.5
-5-'7.5-10
-12.5-15
-
at(rrils/s)
-MWA
T
II
^U
doO^8g<èE-c)o,é€À
349

APPENDIX H: Non-linear Time History Analysis Eryerimental Confinnntion
*************************r.*'*:t *:t *********1.**'F****+*t****Program ROWMANRYFor time history rocking analysis ofFree Standing or Simply Supporæd ObjectsLatest Version : FEBRUARY 1999
{.****¡ß*+********************************:**.***t<**t t *****Accelerogram data from 807o Pacioma Dam E/QAccelerogram scaling factor selected = 1.000INPUT DATA STJMMARY FOR:SS non- loadbearing base reaction at LFHeightofobject= 1.500mObject width = 110.000 mmOverburden stress at top of object = 0.000 MPa
Trilinear force diso nrofile dataÂ(1) selecæd for initial stiffness = 15.00 mmÂ(2) selecæd for maximum force plateau = 35.00 mm
Stiffness coefficient (HEFFS) =Resistance coefficient (IIEFFR) =
4.04.0
hoportional damoine daøMass proportional damping coeff. =Stiffness proportional damping coeff. =
lægend:aB = input ground accelerationv = relative velocity
1.0000.0030
u = relative displacementat = total acceleration
ANALYSIS CONCLUSION : Model rocked within limitsAnalysis tirne = 34.9600secs tirne inc =.0l00secs
Time ag(t) (m/s2)Maximum 3.545 ^(t)
(m) v(t) (m/s)0.038978 0.471
a(t) (m/s2)3.6385
0.08
0.06
0.04
0.02
0
-0.02
-0.04
-0.06
-0.08
goÁooñ=H
è¡)o€À
omçra¡È-æe.¡ (\ Cl C^l€ÀÉÈelcî iô
-(m)-MWD
I
Time(secs)
4
3Éo1dblO^8S n<è -:s-1à0O^
-4-5
- at(m.i/Vs)
-MWA
T
é'.ÉdÐo^!ì ñ'<*
!vc)oãÀ
t,
(
Mid Height Displacement (m.
a(n/Vs)---r-MWA
?sfl
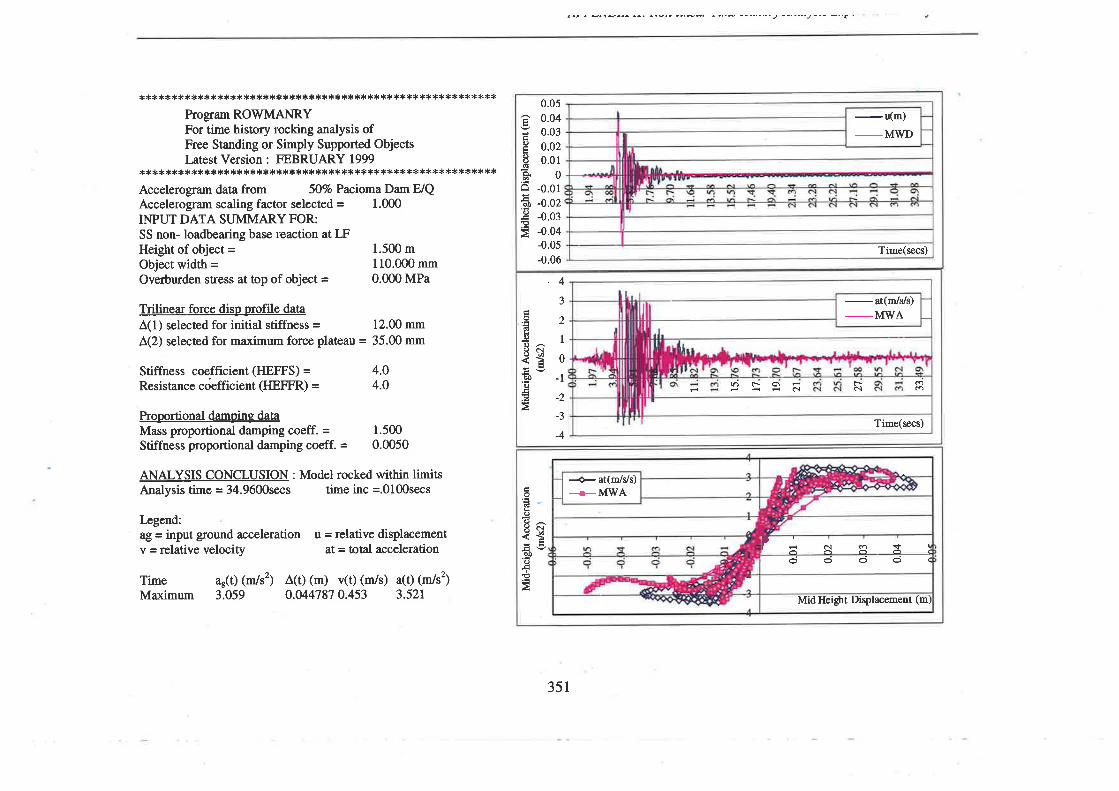
******.i;ffiiåüffiåi*++' ***1'*"'F{<*¡
For time history rocking analysis ofFree Standing or Simply Supponed ObjectsLatest Version : FEBRUARY 1999
*,1ê******{<*****,1.*******{<**:*:N<{.***********{<**t rlÊ*******'tr(X{<
Accelerogram data from 507o Pacioma Dam E/QAccelerogram scaling factor selected = 1.000INPUT DATA SIJMMARY FOR:SS non- loadbearing base reaction at LFHeightofobject= 1.500mObject width = 110.000 mmOverburden sfress at top of object = 0.000 MPa
Trilinear force disp profile dat¿A(1) selected for initial stiffness = 12.00 mmÂ(2) selected for maximum force plateau = 35.00 mm
Stiffness coefficient (IIEFFS) =Resistance coefficient (HEFFR) =
4.04.0
ANALYSIS CONCLUSION : Model rocked within limitsAnalysis time = 34.9600secs time inc =.0100secs
Prooortional damoins dataMass proportional damping coeff. =Stiffness proportional damping coeff. =
Legend:ag = input ground accelerationv = relative velocity
1.5000.0050
u = relative displacementat = total acceleration
^(t) (m) v(t) (n/s) a(t) (m/s2)
0.044787 0.453 3.52rTime ar(t) (m/s2)Maximum 3.059
Time(secs)
-u(m)-M\ryD
0.050.040.030.020.01
0-0.01-0.02-0.03-0.04-0.05-0.06
oÉoodot-l-éqf)oÉ
-43
oadÐlO^
åÉ o
d-toErJ _,,à
-3
-4
-at(m/Vs)-MWA
ómt-ôlFAicì
Time(secs)
oË*oe^üçl<É¡vc)oÉ
À
l=oooo (
MidHeight Displacement (m,
+at(n¡lJs)_r-MWA
351
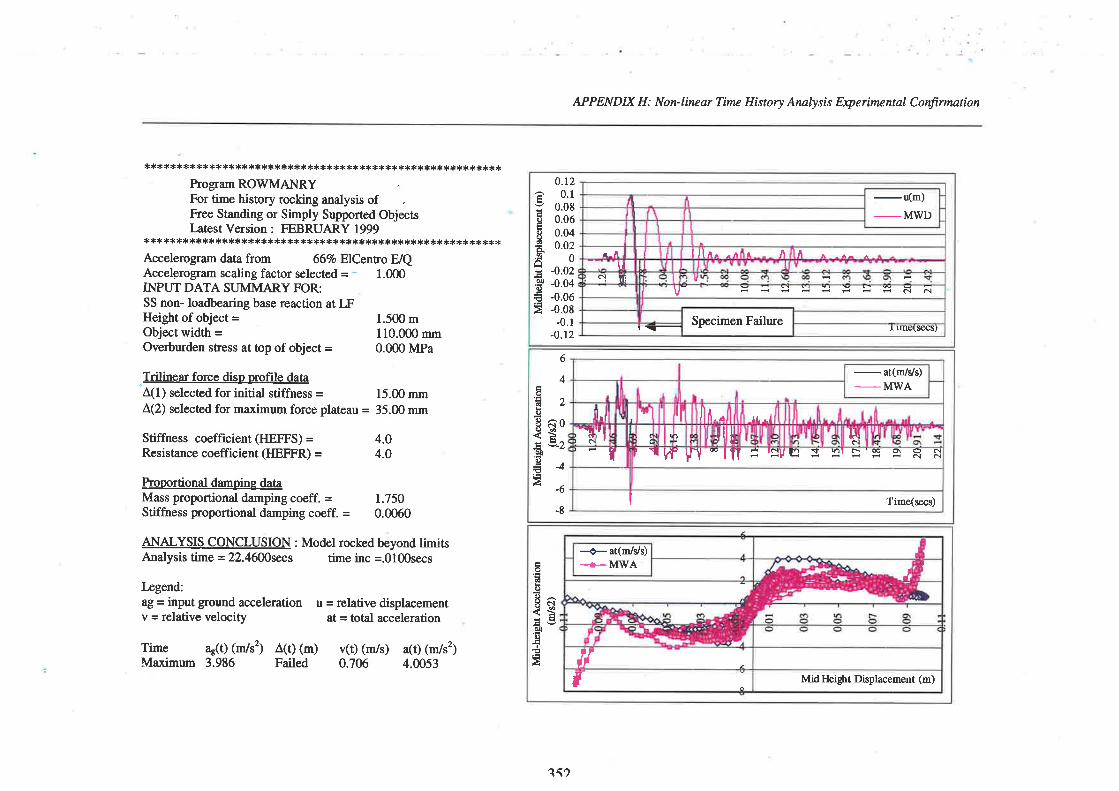
APPENDIX H: Non-linear Time History Analysis Experimentøl Confirmation
*** ******* ***** {< **** *{.*********** **** *****:ß*** *********
hogram RO\ryMANRYFor time history rocking analysis ofFree Standing or Simply Supported ObjectsLatest Version : FEBRUARY 1999
*** ******** ************* ***.*:t **** **** ***** **t(* *********Accelerogram data from 667o ElCentro E/QAccelerogram scaling factor.selected = ' 1.000INPUT DATA SUMMARYFOR:SS non- loadbearing base reaction at LFHeightofobject= 1.500mObject widrh = 110.000 rnmOverburden súess at top of object = 0.000 MPa
*Trilinear force diso orofile dataÂ(l) selected for initial stiffness = 15.00 mmÂ(2) selected for maximum force plateau = 35.00 mm
Stiffness coefficient (HEffS) =Resistance coefficient (IIEFFR) =
hooortional dampine dataMass proportional damping coeff. =Stiffness p,roportional damping coeff. =
Iægend:48 = input ground accelerationv = relative velocity
1.7500.0060
u = relative displacementat = total acceleration
4.04.O
ANALYSIS CONCLUSION : Model rocked beyond limitsAnalysis time = 22.4600sæ,s time inc =.0100secs
Time ag(t) (n/s2)Maximum 3.986 ^(t)
(m)Failed
v(t) (m/s)0.706
a(t) (m/s2)4.0053
?Éooodô.oèooÉÀ
0.t20.1
0.080.060.040.02
0-0.02-0.04-0.06-0.08
-0.1-0.12
-u(m)_MU¡D
ñ
v-
r rme(socs,
t^
Specimen Failure
I ll a ^ - r
t._
^l ucl l?
Ê5dÒooo
E,1¡oÉÀ
6
4
2
ñ0Lz
-4
-6
-8
. at(m/vs)_MWA
7 Tr,rf ll|rï *|fl = fsvf! : 3r:'= 3 R N
I Time(secs)
Itô-u,.1
tt..
IIIrl
ìI
T
((
r
.lir-Trdrc
Ê
6oe^EçI<*¡vèoo
-1Å
I
Mid Heigþt Displacement (m)
)
J.
+at(n/Vs)--¡-MWA
tfr
a\t
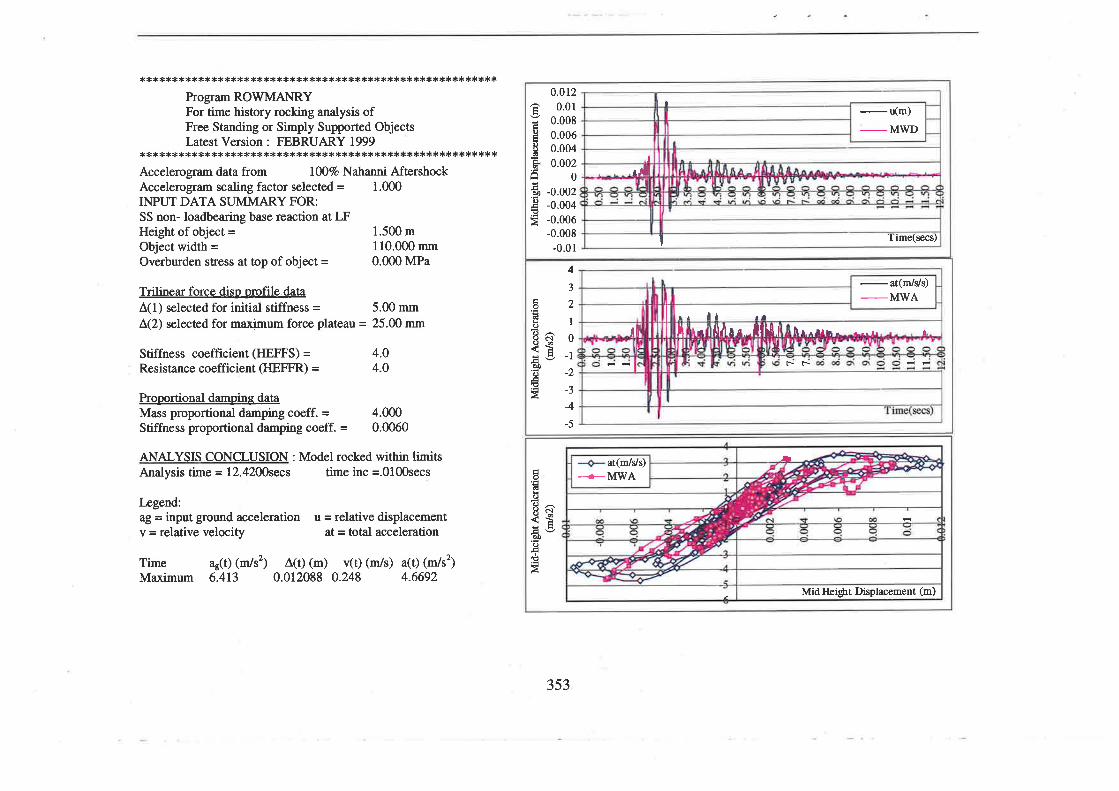
*t<***{e*************:***t :***:1.******{<*******************rc*
Program ROWMANRYFor time history rocking analysis ofFree Standing or Simply Supported ObjectsLatest Version : FEBRUARY 1999
**rr***1.*:{ê*:1.***rs***t t {.*******r<r<******t+**{<*r<t!**********+Accelerogram data from 1007o Nahanni AftershockAccelerogram scaling factor selected = 1.000INPUT DATA SUMMARY FOR:SS non- loadbearing base reaction at LFHeightofobject= 1.500mObject width = 110.000 mmOverburden stress at top of object = 0.000 MPa
Trilinear force diso orofile dataÅ(1) selected for initial stiffness = J.00 mmÂ(2) selecæd for maximum force plateau = 25.00 mm
Stiffness coefficient (IIEITS) =Resistance coefficient (HEffR) =
4.04.0
Proportional damoine dataMass proportional damping coeff. =Stiffness proportional damping coeff. =
Iægend:aB = input ground accelerationv = relative velocity
4.0000.0060
u = relative displacementat = total acceleration
ANALYSIS CONCLUSION: Model rocked within limitsAnalysis time = 12.4200secs time inc =.0100secs
Time ae(t) (Ír/s2) ^(t)
(m) v(r) (m/s) a(t) (m/s2)Maximum 6.413 0.012088 0.248 4.6692
5oEoo(Ë
H¡èf)oÉÀ
0.0r20.01
0.0080.0060.0040.002
0-0.002-0.004-0.006-0.008
-0.01
I
-(m)-M\IrD
I Time(secs)
IrJü
4
3é^aL
ËrEç o
Íè-r.9a-L
E-3-4
-5
ô[,r -¡r¡ -
f--F-
[iI¡.Il$llrt ra¡¡ lf -at(Inj/Vs)-MWA
til
É.5ñoHal*!vdoÉJ
D
Mid Heigþt Displacement (m)
at(m/Vs)--r-MWA
353

354