HAIR GROWTH HERO Natural Solutions For Healthy, Happy Hair Restoration
Upload
khangminh22Category
view
0download
0
Group & Organization Management37(6) 785 –822
© The Author(s) 2012Reprints and permission:
sagepub.com/journalsPermissions.navDOI: 10.1177/1059601112470405
http://gom.sagepub.com
470405 GOM37610.1177/1059601112470405Group & Organization ManagementSalanova et al.2012© The Author(s) 2011
1Universitat Jaume I, Castellón, Spain
Corresponding Author:Marisa Salanova, Department of Social Psychology, Universitat Jaume I. Av. Sos Baynat, s/n. 12071. Castellón, Spain Email: [email protected]
We Need a Hero! Toward a Validation of the Healthy and Resilient Organization (HERO) Model
Marisa Salanova1, Susana Llorens1, Eva Cifre1, and Isabel M. Martínez1
Abstract
Two studies were conducted to validate the so-called HEalthy and Resil-ient Organization (HERO) Model. Results from Study 1 provided validity and psychometric support for a new measure designed to assess HEROs composed by semistructured interviews with the CEOs of 14 companies as well as questionnaires for their stakeholders (710 employees, 84 work-units, their immediate supervisors, and 860 customers). In Study 2, SEM (using data aggregated at the work-unit level, which consisted of 303 teams and their supervisors from 43 companies) showed that healthy employees fully medi-ated the positive relationship between healthy organizational resources and practices, and healthy organizational outcomes (assessed by supervisors). Moreover, regression analyses (at the organizational level, with 2,098 cus-tomers) showed that employees’ excellent performance positively predicts customer loyalty and satisfaction with the company.
Keywords
healthy and resilient organizations, healthy resources and practices, healthy employees and teams, healthy outcomes
786 Group & Organization Management 37(6)
Modern organizations need healthy and motivated employees to survive and prosper during changing times. Employees and teams are an organization’s most valuable asset and retaining them will become increasingly important in the future. Whether an employee chooses to remain in an organization or not is quite related to whether this employee perceives the organization as having a healthy environment. Healthy implies that (a) organizations are focused on caring about the health of both employees/teams and the organization as a whole, that is to say, its effectiveness, survival, and future development. It also implies that (b) it is possible to distinguish between healthy and unhealthy organizations, that is, certain ways of structuring and managing their work processes lead to healthier outcomes than others (DeJoy, Wilson, Vanden-berg, McGrath-Higgins, & Griffin-Blake, 2010; Wilson, DeJoy, Vanderberg, Richardson, & McGrath, 2004).
The definition of Healthy Organization put forward by Cooper and Cartwright (1994) is still particularly interesting for our understanding; being as characterized by both financial success (profitability) and a physi-cally and psychologically healthy workforce that is able to maintain a healthy and satisfying work environment and organizational culture, par-ticularly during periods of turbulences and changes. From our point of view, it is in situations of turbulence, crisis, and abrupt changes where Healthy Organizations could become more resilient as well. In these sce-narios, such organizations not only survive these critical periods but also learn and become even stronger by learning “lessons” from the crisis (Elliot & Macpherson, 2010).
The concept of HEalthy and Resilient Organizations (HERO) emerges in the current world context of economic crisis and financial turmoil referring to organizations that survive and adapt to the crisis and may even become stron-ger and more resilient than they were before undergoing these negative expe-riences. However, although this topic is attractive for management studies, most of them are based on the job stress tradition and concentrate on toxic (rather than healthy) organizations (Bell, Quick, & Cycyota, 2002). Moreover, research is conducted at the individual level of analysis without taking into consideration the relevance of focusing on a more collective level, such as the group and/or organizational levels (DeJoy et al., 2010; Wilson et al., 2004) and there are no heuristic or theoretical models that incorporate results on HEROs considering those multiple levels of analysis (individuals, groups, and orga-nizations). Also, due to the great number of disciplines involved (i.e., human resources management, job stress, occupational safety and health, and orga-nizational behavior), findings are fragmented and it is difficult to connect them to each other (Wilson et al., 2004). Finally, there is a lack of empirical
Salanova et al. 787
and practice-based evidence with which to measure HEROs both quantita-tively and qualitatively.
So far, the main goal of this article is to extend knowledge about healthy organizations determining theoretical relationships among the main dimen-sions (higher order factors) of a HERO. After first providing theoretical sup-port for developing and testing higher order factors, we present the psychometric properties of the designed measures and empirical tests of the hypotheses of the study. Besides, the study is developed on collective levels of analysis (group and organization) and on combining qualitative and quan-titative methodologies.
The HERO ModelIn 2004 Wilson et al. already stressed that there was clearly a need for a direct and systematic test of a comprehensive model of healthy work organi-zations. They attempted to develop and test heuristic models of healthy organizations that included the employees’ health as well as variables refer-ring to the organizational context (e.g., work demands, social environment). Generally speaking, their results provided support for the healthy organization model that reformulated later (DeJoy et al., 2010), where work characteristics influence psychological work adjustment factors that ultimately affect employees’ well-being, and performance. The 2004 study meant an important first systematic step toward understanding how organizational practices are related to employees’ health. However, as the authors themselves stated, it had several limitations and, as far as we know, they are still present, namely, (a) data were collected from the same respondents using the same measure instruments, thus making common method variance a potential bias; and (b) constructs were tested at the individual level when the underlying con-ceptual premises of a healthy organization suggest the need to examine the model at the collective level of analysis. In the present study, we extend healthy organization research by using data collected from different respon-dents such as CEOs, supervisors, employees, and customers in the same study as well as by using qualitative and quantitative methodologies to col-lect the data (interviews and questionnaires). Finally, we conducted the analysis at the individual but also at the collective levels of analysis (group and organization) using internal (by employees, supervisors, and CEOs) as well external criteria (by customers).
During times of crisis and turmoil, these organizations develop a kind of strength that enables them to become resilient, being able to learn from adversity and emerge stronger. Resilience may be viewed not only as an
788 Group & Organization Management 37(6)
individual trait but also as a social factor (existing in teams or groups; Bennett, Aden, Broome, Mitchell, & Rigdon, 2010). We understand that in the study of healthy organizations, a more collective concept of resilience is needed. Tillement, Cholez, and Reverdy (2009, p. 231) defined organizational resil-ience as the ability to manage disturbances of the normal workflow and to recover a dynamically stable state that allows the organization’s goals of pro-duction and safety to be achieved. More recently, Gilbreath (2012) studied what organizational and personal factors can modify the effects of the work environment, like a kind of actions that can be taken to create healthier work environments and healthier employees. According to Lengnick-Hall, Beck, and Lengnick-Hall (2011), an aggregated organizational resilience refers to the capacity of a team/organization to (a) maintain positive adjustment under challenging conditions, (b) bounce back from untoward events, and (c) main-tain desirable functions and outcomes in the midst of strain.
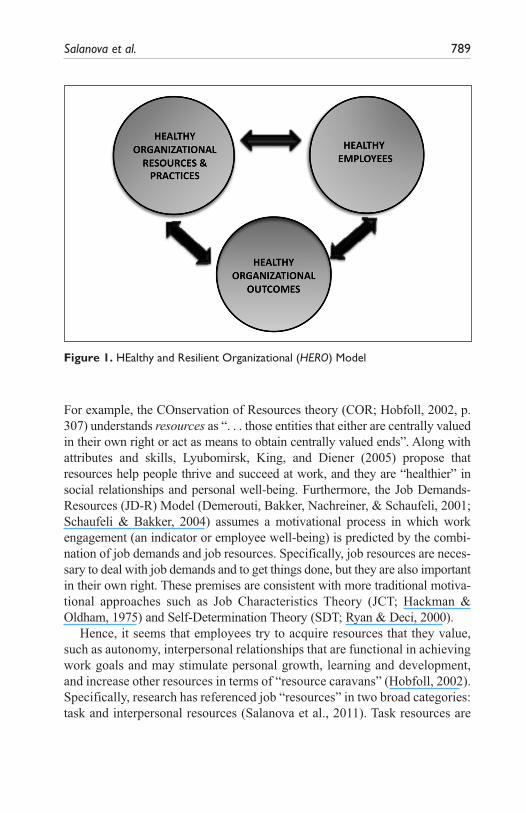
We understand HEROs to be those organizations that make systematic, planned, and proactive efforts to improve employees’ and organizational pro-cesses and outcomes (Salanova, 2008, 2009; Salanova, Cifre, Llorens, Martinez, & Lorente, 2011). These efforts involve carrying out healthy organizational resources and practices aimed at improving the work environment at the levels of (a) the task (autonomy, feedback), (b) the interpersonal (social relationships, transformational leadership), and (c) the organization (HR practices), especially during turbulence and times of change. The so-called HERO Model is made up of three main interrelated components: (a) healthy organizational resources and practices—HORP, (b) healthy employees, and (c) healthy organizational out-comes. After reviewing the previous literature discussed earlier, we propose three basic interrelated components of a HERO, which are described in the fol-lowing lines (see Figure 1). Accordingly, we expect:
Hypothesis 1: A HERO will be composed of three main positively intercorrelated dimensions (HORP, healthy employees, and healthy outcomes). Particularly, we expect the fit of a second-order factor model composed by three dimensions to be better compared to a model that assumes that all the scales refer to one underlying gen-eral, undifferentiated dimension.
Healthy Organizational Resources and Practices (HORP)Research on HR management and occupational health psychology provides much of the basis for identifying specific dimensions within HORP and how they are connected to healthy employees and healthy organizational outcomes.
Salanova et al. 789
For example, the COnservation of Resources theory (COR; Hobfoll, 2002, p. 307) understands resources as “. . . those entities that either are centrally valued in their own right or act as means to obtain centrally valued ends”. Along with attributes and skills, Lyubomirsk, King, and Diener (2005) propose that resources help people thrive and succeed at work, and they are “healthier” in social relationships and personal well-being. Furthermore, the Job Demands-Resources (JD-R) Model (Demerouti, Bakker, Nachreiner, & Schaufeli, 2001; Schaufeli & Bakker, 2004) assumes a motivational process in which work engagement (an indicator or employee well-being) is predicted by the combi-nation of job demands and job resources. Specifically, job resources are neces-sary to deal with job demands and to get things done, but they are also important in their own right. These premises are consistent with more traditional motiva-tional approaches such as Job Characteristics Theory (JCT; Hackman & Oldham, 1975) and Self-Determination Theory (SDT; Ryan & Deci, 2000).
Hence, it seems that employees try to acquire resources that they value, such as autonomy, interpersonal relationships that are functional in achieving work goals and may stimulate personal growth, learning and development, and increase other resources in terms of “resource caravans” (Hobfoll, 2002). Specifically, research has referenced job “resources” in two broad categories: task and interpersonal resources (Salanova et al., 2011). Task resources are
Figure 1. HEalthy and Resilient Organizational (HERO) Model
790 Group & Organization Management 37(6)
the closest to employees’ work activity, as they are related to the characteris-tics of the tasks themselves (task clarity, autonomy, feedback), which encour-age the employee in connection with the work done, and feelings of pride and enjoyment emerge. Interpersonal resources refer to the people who employ-ees work with and for, such as coworkers, supervisors, and customers and increase the connections employees have with the people they work for and with. Moreover, companies promote these job resources through healthy organizational practices such as “planned human resource deployments and activities intended to enable an organization to achieve its goals” (Wright & McMahan, 1992, p. 298). Organizations develop these specific practices from HRM to increase resources of their employees and of the organization as a whole. Examples are job (re-)design by empowerment; giving opportuni-ties for job crafting, work training, and career development; creating open channels for communication, or work–life balance programs.
From the HERO Model, we propose that the perception of task and interper-sonal resources could be shared by members of the same team (shared beliefs) and enhanced through different kinds of healthy organizational practices hav-ing the potential to promote healthy employees and teams by increasing their perceived and shared resources at the team or the organizational level.
Healthy Employees (and Teams)Healthy employees and teams have positive psychological resources with which to feel good and positive at work. Personal resources are positive self-evaluations that are linked to resilience and refer to individuals’ sense of their ability to control and have an impact on the environment (Hobfoll, Johnson, Ennis, & Jackson, 2003). Research has shown their pivotal role in the predic-tion of employee well-being. For example, Xanthopoulou, Bakker, Demerouti, and Schaufeli (2009) found that psychological resources such as self-efficacy, mental and emotional competences, organizational-based self-esteem, and optimism are positively associated to well-being. Furthermore, the studies of positive psychological capital (PsyCap) by Luthans and colleagues show that PsyCap (i.e., positive resources of efficacy, hope, optimism, and resilience) is related with psychological well-being at work (Avey, Luthans, Smith, & Palmer, 2010), being connected to desirable outcomes such as performance over time (Luthans, Avey, Avolio, & Peterson, 2010; Peterson, Luthans, Avolio, Walumbwa, & Zheng, 2011).
There is evidence in favor of the idea that some (task and interpersonal) job resources predict employee well-being such as work engagement and job satis-faction (i.e., healthy employees) and job performance (healthy organizational
Salanova et al. 791
outcomes; e.g., Bakker, Demerouti, & Brummelhuis, 2012; Gruman & Saks, 2012; Lyubomirsky, King, & Diener, 2005; Salanova, Agut, & Peiró, 2005). Recent meta-analytic studies showed the strength of the relationships between (task and interpersonal) job resources (i.e., job control, feedback, social sup-port) and work engagement, on one hand, and work engagement and healthy organizational outcomes (i.e., organizational commitment and job perfor-mance) on the other (Christian, Garza, & Slaughter, 2011; Halbesleben, 2010).
More interestingly some studies have shown that the relation between job satisfaction (a classical measure of employee well-being) and job perfor-mance is stronger when both are studied at the collective level of analysis (i.e., groups and organizations). This shows the importance of studying both constructs at the collective level of analysis when research is focused on col-lective constructs (Whitman, Van Rooy, & Viswesvaran, 2010), which is the case of the current study. In that sense, also recently it was stressed the impor-tance to conduct studies on PsyCap at the collective levels of analyses. So far, Walumbwa, Luthans, Avey, and Oke (2011), found a significant relationship between both their collective psychological capital and trust with their group-level performance and citizenship behavior. Luthans and colleagues stressed that future work on the PsyCap of teams and even at the organizational, com-munity, regional, and country levels is needed.
Finally in the case of work engagement, for example, Salanova and her col-leagues also showed that work engagement at the team level is positively related to group health (less group anxiety) and group performance (Salanova, Llorens, Cifre, Martínez, & Schaufeli, 2003; Torrente, Salanova, Llorens, & Schaufeli, 2012) and that organizational resources and work engagement (at the team level) predicted service climate, which in turn predicted employee performance and customer loyalty as assessed by customers (Salanova et al., 2005). As argued by Schaufeli (2012), although still scarce, research on collective engagement looks promising and should be considered in future agenda.
So far, in the current study we include both cognitive (perceived collective efficacy and resilience) and affective (team work engagement) resources (together with shared beliefs of task and interpersonal team resources). Finally, based on the premises of HERO, we try to understand how these perceived shared resources are related to healthy organizational outcomes such as team (in-role and extrarole) performance.
Healthy Organizational OutcomesExcellence is an important indicator of Healthy Organizational Outcomes. In fact, some meanings of healthy organizations have been based on this con-

792 Group & Organization Management 37(6)
cept, such as that of Corbett (2004, p. 125), who defined them as “organiza-tions which adopt a strategic focus on excellence, attain great results and become healthy organizations, as their leaders understand the dynamic rela-tionship and the balance that exists between employees, customers, and stakeholders”. However, these definitions neglect other key questions like social responsibility and customer satisfaction and loyalty, which we think are very important to understand the essence of a healthy organization, espe-cially in an international market where the economic structure is changing from a product-based economy to a service-based economy. We understand that a HERO has positive relations as a whole with its extraorganizational environment, with the local community and with society in general, and also with their customers. This is achieved through cooperation among partners in the production chain and with the support of other companies and outside organizations (social responsibility).
On the other hand, there is a growing body of literature that shows that managerial variables, particularly in small and medium-sized enterprises (SMEs), may set the tone for customer satisfaction and financial performance (Schneider, Ehrhart, Mayer, Saltz, & Niles-Jolly, 2005) as indicators of healthy organizational outcomes in the HERO Model. For instance, a recent study showed that managers’ performance and satisfaction was positively related to customers’ satisfaction and the interaction of both variables affects employ-ees’ performance and employees’ satisfaction (Netemeyer, Maxham, & Lichtenstein, 2010). In this sense, most of the studies suggest a relationship between employees’ well-being and service quality (He, Li, & Lai, 2012).
The literature has put forward the so-called “mirror of satisfaction” concept to describe the relation between job satisfaction of service employees and cus-tomer satisfaction, claiming that satisfied employees perform their work better and contribute to increasing levels of customer satisfaction. Vermeeren, Kuipers, and Steijn (2012) showed that when employees are more satisfied with their jobs, customers perceive more empathy in the employees. Also these authors show that customers are more satisfied with public service when they deal with organizations in which employees are more satisfied with their jobs. Also, Evanschitzky, Groening, Mittal, and Wunderlich (2011) show that improving employee satisfaction not only increases the average customer sat-isfaction score but also nearly doubles the impact of customer satisfaction on customer purchase intentions. Additionally, findings show that when bound-ary employee units self-perceive their units as highly competent (high reli-ability, high assurance, and high empathy), customers’ evaluations of levels of service quality are higher (Gracia, Cifre, & Grau, 2010). Furthermore, Gracia, Salanova, Grau, and Cifre (2012) showed that collective work
Salanova et al. 793
engagement predicted the service quality assessed by customers through rela-tional service competence.
Therefore, at this point it can be concluded that research supports the rela-tionship between various indicators of HORP, healthy employees, and healthy organizational outcomes, such as work engagement, job performance, orga-nizational commitment, and excellent results (healthy organizational out-comes). In the current study we take a step forward in this research by considering the study of HEROs at the collective level of analysis, as pro-posed by Whitman et al. (2010). Thus, to test the next two hypotheses, we conducted the analysis at a collective level: the work-unit level of analysis (by employees’ and supervisors’ ratings) and at the organizational level (by customers). Based on the literature review, we expect that:
Hypothesis 2: HORP (assessed by employees by aggregating data at the work-unit level) will be significant and positively related to healthy organizational outcomes (as assessed by immediate super-visors) that are fully mediated by healthy employees. Specifically, we expect that (a) HORP will be significantly and positively related to healthy employees (Hypothesis 2a); (b) healthy employees will be significantly and positively related to healthy organizational outcomes (Hypothesis 2b); and (c) HORP will be significantly and positively related to healthy organizational outcomes through healthy employ-ees (Hypothesis 2c).
Hypothesis 3: Customers’ perception concerning employees’ excellent job performance and empathy is a significant predictor of customer loyalty and customers’ satisfaction. Specifically, we expect that (a) employees’ excellent job performance will be significantly and positively related to customers’ satisfaction and loyalty (Hypothesis 3a); and (b) employees’ empathy will be significantly and positively related to customers’ satisfaction and loyalty (Hypothesis 3b).
MethodSamples and Procedures
Study 1 was the validation of the HERO Model (Hypothesis 1) using data at individual level. Fourteen—from initially 35—SMEs participated in the study: 72% service companies (education, commerce, scientific and technical activities, financial activities, tourism, entertainment activities, and nongov-ernmental organizations), 14% industry (manufacturing activities) and 14%
794 Group & Organization Management 37(6)
construction sector. Study included different samples: (a) 14 CEOs partici-pated in the interviews; (b) 710 employees (52% men; 69% permanent con-tract; mean of 7 years working in the company, SD = 6.22) distributed over the 84 work-units (mean of 8.7 team members, SD = 6.2; range from 2 to 44 mem-bers), who answered the questionnaire thinking about each work-unit; (c) 75 supervisors (52% men; mean of 82% permanent work contracts, and 14 years working in the company, SD = 5.88) answered the questionnaire thinking about each work-unit; and (d) 860 customers from these organizations.
In Study 2, the theoretical model was tested using data aggregated at the work-unit for employees and supervisors (Hypotheses 2) and organization levels for customers (Hypotheses 3). Forty-three (from initially 64) compa-nies participated in the study: 73% service companies (health, prevention, education, cleaning, trade, hotels, recreational activities, and consultancy companies), 22% industry (manufacturing companies) and 5% construction sector. Different sources of information participated: (a) 1,484 employees (51% men, 86% permanent contract, mean of 6 years working in the com-pany, SD = 4.90) distributed over the 303 work units (mean of 8.5 team mem-bers, SD = 6.8; range from 2 to 33 members); (b) 303 immediate supervisors (50% men, 91% permanent contracts, mean of 11 years working in the com-pany, SD = 8.42), who answered the questionnaire thinking about each super-vised work-unit. Only one supervisor per work-unit (the more immediate) filled in the questionnaire; (c) 2,098 customers completed a questionnaire on organizational issues.
Procedure for Study 1 and 2. Companies were selected by convenience and participation was voluntary. The initial contact was through CEOs by phone or personally. After accepting the participation, two trained researchers con-ducted 14 (for Study 1; 2008-2009) and 43 (for Study 2; 2010-2011) voice-recorded interviews (only one interview by company). The interviews were approximately 45 min long (SD = 15), ranging from 30 to 60 min. At the end of the interview the work-units with their main supervisors and customers were identified to administer the questionnaires.
Employees and their immediate supervisors completed the questionnaire with the work-unit and the organization as a whole as their main referents. The questionnaires (30 min to administer) were distributed and collected at the company by the researchers. Only employees with a tenure in the com-pany of at least 4 months participated in the study to ensure they had time to settle into their job and the organization (Feldman, 1988). The customer (individuals and companies) responses were (a) randomly selected from a list provided by the companies, and (b) collected by the researcher in person (for services companies) or by phone (industry and construction). In all cases, confidentiality was guaranteed.
Salanova et al. 795
Measures
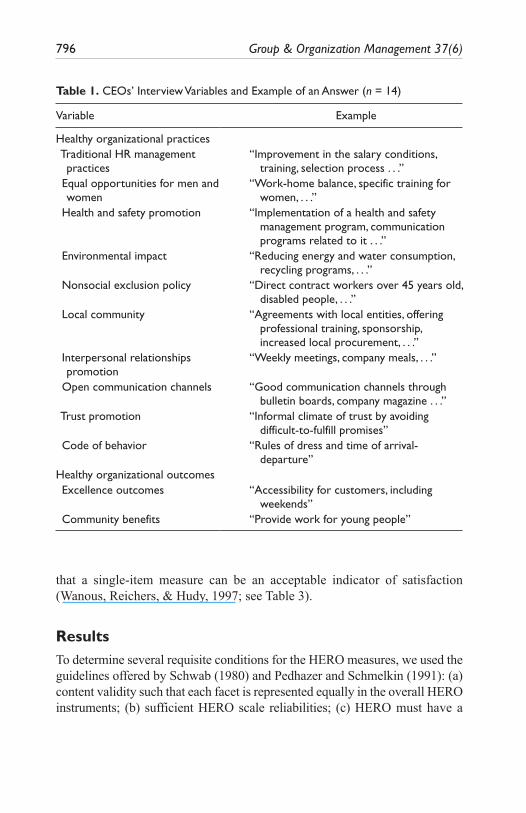
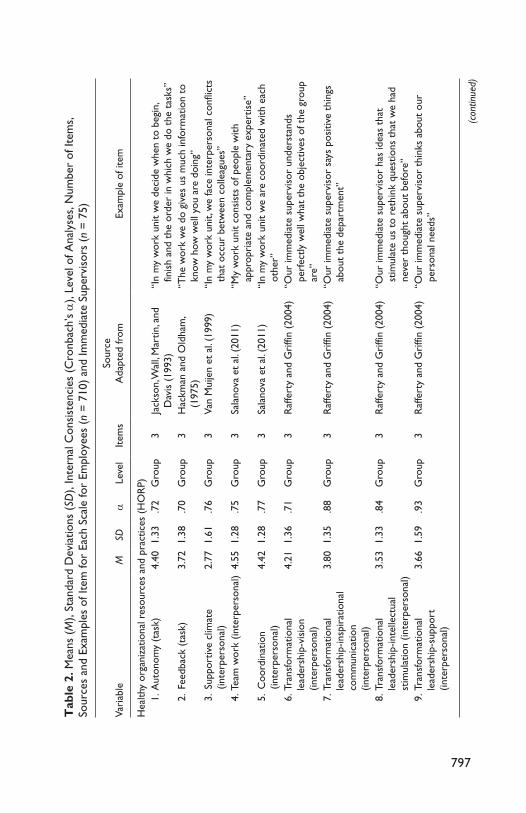
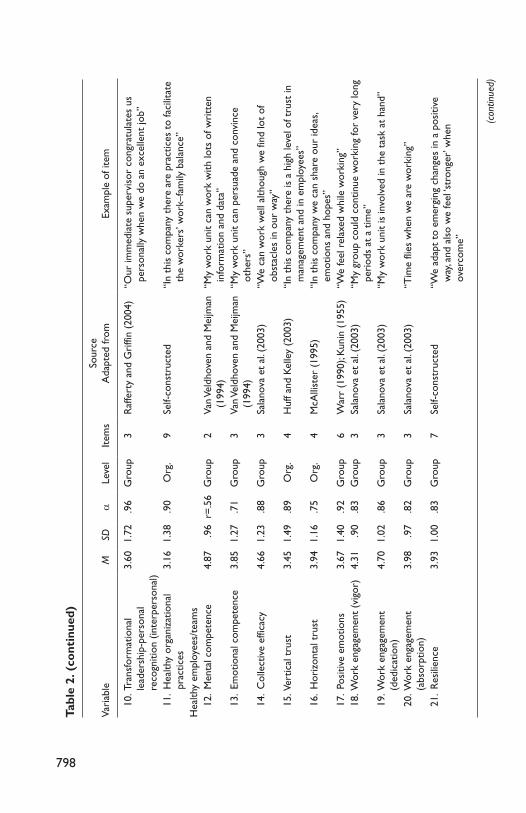
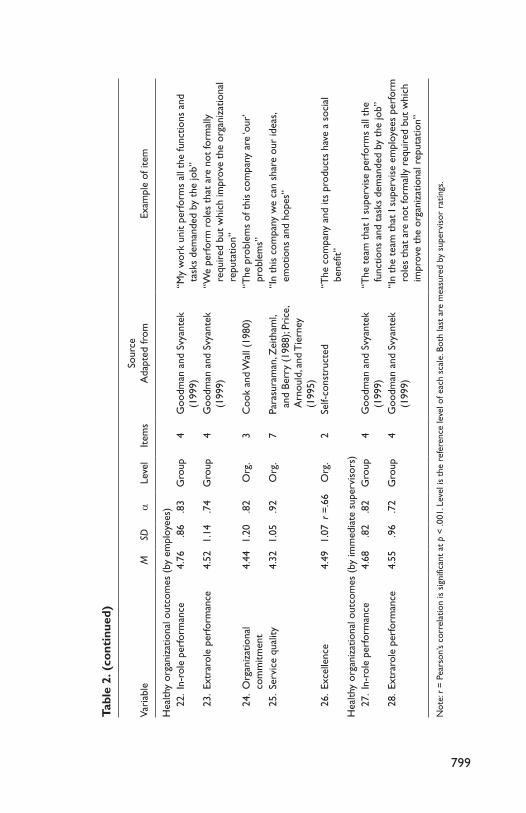
Interview Measures. The semistructured interviews with CEOs covered topics related to (a) HORP and (b) healthy organizational outcomes by open-ended questions focused on the researchers’ agenda. Interviews were ana-lyzed by using a system of content analysis of different categories performed by two independent, trained coders1 with the aim of creating a mutually exclusive system of categories that was both reliable and valid (Weick, 1985). HORP were categorized according to the EQUAL European Project (2004). Healthy organizational outcomes included both the number of cases of excellent quality on products and services (excellence) and the positive rela-tionships with the organizational environment and community (commu-nity benefits), respectively. Coders scored both the amount of practices (n practices and outcomes per category) and its quality on a Likert-type scale from 0 (low quality) to 6 (high quality). Finally, coders made a global judgment and appraised the degree to which they considered that the com-pany was carrying out important global healthy organizational practices from 0 (unimportant healthy practices) to 6 (very important healthy prac-tices; see Table 1).Employee/Work-Unit scales. Questionnaires included 26 validated scales/subscales referring to HORP (11 scales), healthy employees (10 scales), and healthy organizational outcomes (5 scales). We adapted and reworded them so that in all the cases the referent was the collective: the organization (i.e., “In this company”) or the work-unit (i.e., “My work unit”). Respondents answered using a 7-point Likert-type scale from 0 (never) to 6 (always; see Table 2 for more details).Immediate Supervisor Scales. In Study 2 (see Table 2) two scales for team performance were assessed by six items, adapted from Goodman and Svyan-tek’s scales (1999). In-role performance (three items; e.g., “The team that I supervise achieves its work goals”) and extrarole performance (three items; e.g., “In the team that I supervise employees help each other when somebody is overloaded”). The supervisors answered using a 7-point Likert-type scale ranging from 0 (totally disagree) to 6 (totally agree).Customer Scales. Four aspects of healthy organizational outcomes were measured. Excellent job performance (four items), empathy (three items), and customer loyalty (two items) were scored on a 7-point Likert-type scale ranging from 0 (never) to 6 (always). Customer satisfaction was measured with an item using a 7-point face rating scale (Kunin, 1955), which allows the emotional dimension of satisfaction to be tested. Previous research suggested
796 Group & Organization Management 37(6)
Table 1. CEOs’ Interview Variables and Example of an Answer (n = 14)
Variable Example
Healthy organizational practices Traditional HR management
practices“Improvement in the salary conditions,
training, selection process . . .” Equal opportunities for men and
women“Work-home balance, specific training for
women, . . .” Health and safety promotion “Implementation of a health and safety
management program, communication programs related to it . . .”
Environmental impact “Reducing energy and water consumption, recycling programs, . . .”
Nonsocial exclusion policy “Direct contract workers over 45 years old, disabled people, . . .”
Local community “Agreements with local entities, offering professional training, sponsorship, increased local procurement, . . .”
Interpersonal relationships promotion
“Weekly meetings, company meals, . . .”
Open communication channels “Good communication channels through bulletin boards, company magazine . . .”
Trust promotion “Informal climate of trust by avoiding difficult-to-fulfill promises”
Code of behavior “Rules of dress and time of arrival-departure”
Healthy organizational outcomes Excellence outcomes “Accessibility for customers, including
weekends” Community benefits “Provide work for young people”
that a single-item measure can be an acceptable indicator of satisfaction (Wanous, Reichers, & Hudy, 1997; see Table 3).
ResultsTo determine several requisite conditions for the HERO measures, we used the guidelines offered by Schwab (1980) and Pedhazer and Schmelkin (1991): (a) content validity such that each facet is represented equally in the overall HERO instruments; (b) sufficient HERO scale reliabilities; (c) HERO must have a
797
Tab
le 2
. Mea
ns (
M),
Stan
dard
Dev
iatio
ns (
SD),
Inte
rnal
Con
sist
enci
es (
Cro
nbac
h’s α
), Le
vel o
f Ana
lyse
s, N
umbe
r of
Item
s,
Sour
ces
and
Exam
ples
of I
tem
for
Each
Sca
le fo
r Em
ploy
ees
(n =
710
) an
d Im
med
iate
Sup
ervi
sors
(n
= 7
5)
Vari
able
MSD
αLe
vel
Item
sSo
urce
Ada
pted
from
Exam
ple
of it
em
Hea
lthy
orga
niza
tiona
l res
ourc
es a
nd p
ract
ices
(H
OR
P)
1. A
uton
omy
(tas
k)4.
401.
33.7
2G
roup
3Ja
ckso
n, W
all,
Mar
tin, a
nd
Dav
is (
1993
)“I
n m
y w
ork
unit
we
deci
de w
hen
to b
egin
, fin
ish
and
the
orde
r in
whi
ch w
e do
the
tas
ks”
2
. Fe
edba
ck (
task
)3.
721.
38.7
0G
roup
3H
ackm
an a
nd O
ldha
m,
(197
5)“T
he w
ork
we
do g
ives
us
muc
h in
form
atio
n to
kn
ow h
ow w
ell y
ou a
re d
oing
”
3.
Supp
ortiv
e cl
imat
e (in
terp
erso
nal)
2.77
1.61
.76
Gro
up3
Van
Mui
jen
et a
l. (1
999)
“In
my
wor
k un
it, w
e fa
ce in
terp
erso
nal c
onfli
cts
that
occ
ur b
etw
een
colle
ague
s”
4. T
eam
wor
k (in
terp
erso
nal)
4.55
1.28
.75
Gro
up3
Sala
nova
et
al. (
2011
)“M
y w
ork
unit
cons
ists
of p
eopl
e w
ith
appr
opri
ate
and
com
plem
enta
ry e
xper
tise”
5
. C
oord
inat
ion
(inte
rper
sona
l)4.
421.
28.7
7G
roup
3Sa
lano
va e
t al
. (20
11)
“In
my
wor
k un
it w
e ar
e co
ordi
nate
d w
ith e
ach
othe
r”
6. T
rans
form
atio
nal
lead
ersh
ip-v
isio
n (in
terp
erso
nal)
4.21
1.36
.71
Gro
up3
Raf
fert
y an
d G
riffi
n (2
004)
“Our
imm
edia
te s
uper
viso
r un
ders
tand
s pe
rfec
tly w
ell w
hat
the
obje
ctiv
es o
f the
gro
up
are”
7
. Tra
nsfo
rmat
iona
l le
ader
ship
-insp
irat
iona
l co
mm
unic
atio
n (in
terp
erso
nal)
3.80
1.35
.88
Gro
up3
Raf
fert
y an
d G
riffi
n (2
004)
“Our
imm
edia
te s
uper
viso
r sa
ys p
ositi
ve t
hing
s ab
out
the
depa
rtm
ent”
8
. Tra
nsfo
rmat
iona
l le
ader
ship
-inte
llect
ual
stim
ulat
ion
(inte
rper
sona
l)
3.53
1.33
.84
Gro
up3
Raf
fert
y an
d G
riffi
n (2
004)
“Our
imm
edia
te s
uper
viso
r ha
s id
eas
that
st
imul
ate
us t
o re
thin
k qu
estio
ns t
hat
we
had
neve
r th
ough
t ab
out
befo
re”
9
. Tra
nsfo
rmat
iona
l le
ader
ship
-sup
port
(in
terp
erso
nal)
3.66
1.59
.93
Gro
up3
Raf
fert
y an
d G
riffi
n (2
004)
“Our
imm
edia
te s
uper
viso
r th
inks
abo
ut o
ur
pers
onal
nee
ds”
(con
tinue
d)
798
Vari
able
MSD
αLe
vel
Item
sSo
urce
Ada
pted
from
Exam
ple
of it
em
10
. Tra
nsfo
rmat
iona
l le
ader
ship
-per
sona
l re
cogn
ition
(in
terp
erso
nal)
3.60
1.72
.96
Gro
up3
Raf
fert
y an
d G
riffi
n (2
004)
“Our
imm
edia
te s
uper
viso
r co
ngra
tula
tes
us
pers
onal
ly w
hen
we
do a
n ex
celle
nt jo
b”
11
. H
ealth
y or
gani
zatio
nal
prac
tices
3.16
1.38
.90
Org
.9
Self-
cons
truc
ted
“In
this
com
pany
the
re a
re p
ract
ices
to
faci
litat
e th
e w
orke
rs’ w
ork–
fam
ily b
alan
ce”
Hea
lthy
empl
oyee
s/te
ams
12
. M
enta
l com
pete
nce
4.87
.96
r=.5
6G
roup
2Va
n Ve
ldho
ven
and
Mei
jman
(1
994)
“My
wor
k un
it ca
n w
ork
with
lots
of w
ritt
en
info
rmat
ion
and
data
”
13.
Emot
iona
l com
pete
nce
3.85
1.27
.71
Gro
up3
Van
Veld
hove
n an
d M
eijm
an
(199
4)“M
y w
ork
unit
can
pers
uade
and
con
vinc
e ot
hers
”
14.
Col
lect
ive
effic
acy
4.66
1.23
.88
Gro
up3
Sala
nova
et
al. (
2003
)“W
e ca
n w
ork
wel
l alth
ough
we
find
lot
of
obst
acle
s in
our
way
”
15. V
ertic
al t
rust
3.45
1.49
.89
Org
.4
Huf
f and
Kel
ley
(200
3)“I
n th
is c
ompa
ny t
here
is a
hig
h le
vel o
f tru
st in
m
anag
emen
t an
d in
em
ploy
ees”
16
. H
oriz
onta
l tru
st3.
941.
16.7
5O
rg.
4M
cAlli
ster
(19
95)
“In
this
com
pany
we
can
shar
e ou
r id
eas,
emot
ions
and
hop
es”
17
. Po
sitiv
e em
otio
ns3.
671.
40.9
2G
roup
6W
arr
(199
0); K
unin
(19
55)
“We
feel
rel
axed
whi
le w
orki
ng”
18
. Wor
k en
gage
men
t (v
igor
)4.
31.9
0.8
3G
roup
3Sa
lano
va e
t al
. (20
03)
“My
grou
p co
uld
cont
inue
wor
king
for
very
long
pe
riod
s at
a t
ime”
19
. Wor
k en
gage
men
t (d
edic
atio
n)4.
701.
02.8
6G
roup
3Sa
lano
va e
t al
. (20
03)
“My
wor
k un
it is
invo
lved
in t
he t
ask
at h
and”
20
. Wor
k en
gage
men
t (a
bsor
ptio
n)3.
98.9
7.8
2G
roup
3Sa
lano
va e
t al
. (20
03)
“Tim
e fli
es w
hen
we
are
wor
king
”
21
. R
esili
ence
3.93
1.00
.83
Gro
up7
Self-
cons
truc
ted
“We
adap
t to
em
ergi
ng c
hang
es in
a p
ositi
ve
way
, and
als
o w
e fe
el ‘s
tron
ger’
whe
n ov
erco
me”
(con
tinue
d)
Tabl
e 2.
(co
ntin
ued)
799
(con
tinue
d)
Vari
able
MSD
αLe
vel
Item
sSo
urce
Ada
pted
from
Exam
ple
of it
em
Hea
lthy
orga
niza
tiona
l out
com
es (
by e
mpl
oyee
s)
22.
In-r
ole
perf
orm
ance
4.76
.86
.83
Gro
up4
Goo
dman
and
Svy
ante
k (1
999)
“My
wor
k un
it pe
rfor
ms
all t
he fu
nctio
ns a
nd
task
s de
man
ded
by t
he jo
b”
23.
Extr
arol
e pe
rfor
man
ce4.
521.
14.7
4G
roup
4G
oodm
an a
nd S
vyan
tek
(199
9)“W
e pe
rfor
m r
oles
tha
t ar
e no
t fo
rmal
ly
requ
ired
but
whi
ch im
prov
e th
e or
gani
zatio
nal
repu
tatio
n”
24.
Org
aniz
atio
nal
com
mitm
ent
4.44
1.20
.82
Org
.3
Coo
k an
d W
all (
1980
)“T
he p
robl
ems
of t
his
com
pany
are
‘our
’ pr
oble
ms”
25
. Se
rvic
e qu
ality
4.32
1.05
.92
Org
.7
Para
sura
man
, Zei
tham
l, an
d Be
rry
(198
8); P
rice
, A
rnou
ld, a
nd T
iern
ey
(199
5)
“In
this
com
pany
we
can
shar
e ou
r id
eas,
emot
ions
and
hop
es”
26
. Ex
celle
nce
4.49
1.07
r =
.66
Org
.2
Self-
cons
truc
ted
“The
com
pany
and
its
prod
ucts
hav
e a
soci
al
bene
fit”
Hea
lthy
orga
niza
tiona
l out
com
es (
by im
med
iate
sup
ervi
sors
)
27.
In-r
ole
perf
orm
ance
4.68
.82
.82
Gro
up4
Goo
dman
and
Svy
ante
k (1
999)
“The
tea
m t
hat
I sup
ervi
se p
erfo
rms
all t
he
func
tions
and
tas
ks d
eman
ded
by t
he jo
b”
28.
Extr
arol
e pe
rfor
man
ce4.
55.9
6.7
2G
roup
4G
oodm
an a
nd S
vyan
tek
(199
9)“I
n th
e te
am t
hat
I sup
ervi
se e
mpl
oyee
s pe
rfor
m
role
s th
at a
re n
ot fo
rmal
ly r
equi
red
but
whi
ch
impr
ove
the
orga
niza
tiona
l rep
utat
ion”
Not
e: r
= P
ears
on’s
corr
elat
ion
is s
igni
fican
t at
p <
.001
. Lev
el is
the
ref
eren
ce le
vel o
f eac
h sc
ale.
Bot
h la
st a
re m
easu
red
by s
uper
viso
r ra
tings
.
Tabl
e 2.
(co
ntin
ued)

800 Group & Organization Management 37(6)
multidimensional three-factor structure; (d) empirical validity with appropri-ate outcome constructs (e.g., in-role and extrarole performance at the team level); and, (e) prediction of variance at the team level in these outcomes (i.e., in-role and extrarole performance).
Study 1: ValidationInterview Validation. We calculated the average-measure Intraclass Correla-tion Coefficients (ICC), which applies the Spearman-Brown correction (Wuensch, 2007), to test the reliability of the different coders of the inter-views. Results show a high level of intercoder agreement (90%), considering the ICC indices. Five of the 10 healthy organizational practices exceed 3 points (the average point) on the 0 to 6 measurement scale. From the high-est to the lowest quality, these practices are related to (a) traditional HR man-agement, (b) health and safety, (c) job insertion, (d) environmental impact, and (e) internal communication programs. Results concerning healthy orga-nizational outcomes show that both categories (excellence vs. community benefits) are quite similar in all the organizations, with scores below the mean of the scale, that is, the organizations do not clearly offer healthy out-comes. In conclusion, content analysis of the interview shows both intercoder reliability and validity (by means of triangulation with the theory) and con-firms the categories proposed by the HERO Model (Stemler, 2001).
Table 3. Means (M), Standard Deviations (SD), Internal Consistencies (Cronbach’s α), Correlations, Sources, and an Example of the Items for Customers (n = 860)
Variable M SD α 1 2 3Source
Adapted from Example of item
1. Employee excellent job performance
3.96 1.34 .87 - Price et al. (1995) “In this company, employees do more than usual for customers”
2. Employee empathy
4.27 1.29 .90 .81** - Parasuraman et al. (1988)
“In this company, employees know the specific needs of each customer”
3. Customer loyalty
4.99 1.19 r = .71** .57** .62** - Martínez-Tur, Ramos, Peiró, and Buades (2001)
“I will recommend this company to other people”
4. Customer satisfaction
4.74 1.10 - .66** .68** .69** Kunin (1955) “Please indicate how satisfied you are with the service received in this company” (mono-item)
**p < .01.
Salanova et al. 801
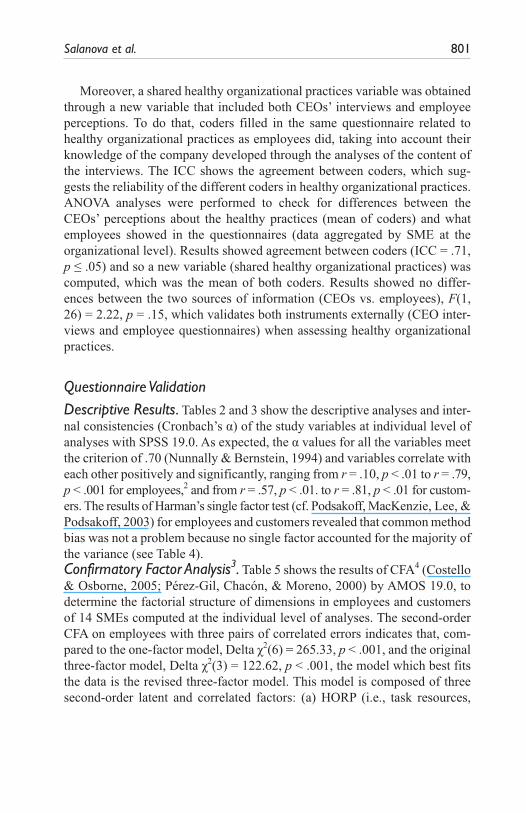
Moreover, a shared healthy organizational practices variable was obtained through a new variable that included both CEOs’ interviews and employee perceptions. To do that, coders filled in the same questionnaire related to healthy organizational practices as employees did, taking into account their knowledge of the company developed through the analyses of the content of the interviews. The ICC shows the agreement between coders, which sug-gests the reliability of the different coders in healthy organizational practices. ANOVA analyses were performed to check for differences between the CEOs’ perceptions about the healthy practices (mean of coders) and what employees showed in the questionnaires (data aggregated by SME at the organizational level). Results showed agreement between coders (ICC = .71, p ≤ .05) and so a new variable (shared healthy organizational practices) was computed, which was the mean of both coders. Results showed no differ-ences between the two sources of information (CEOs vs. employees), F(1, 26) = 2.22, p = .15, which validates both instruments externally (CEO inter-views and employee questionnaires) when assessing healthy organizational practices.
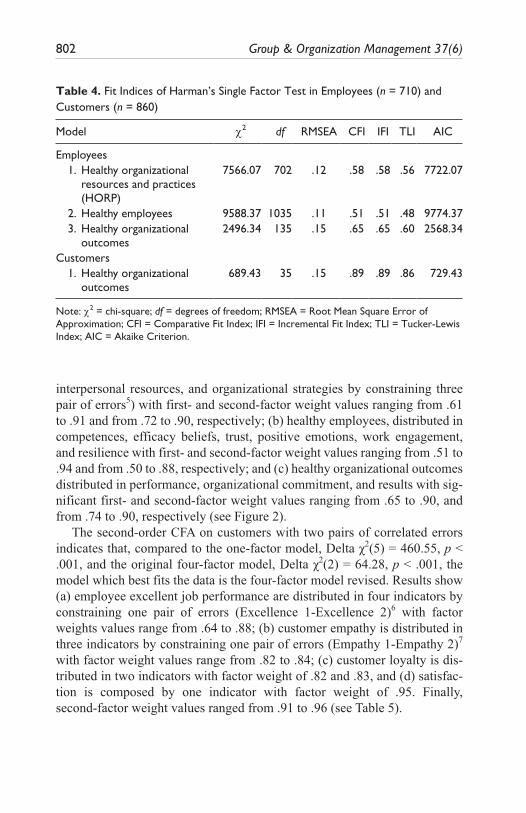
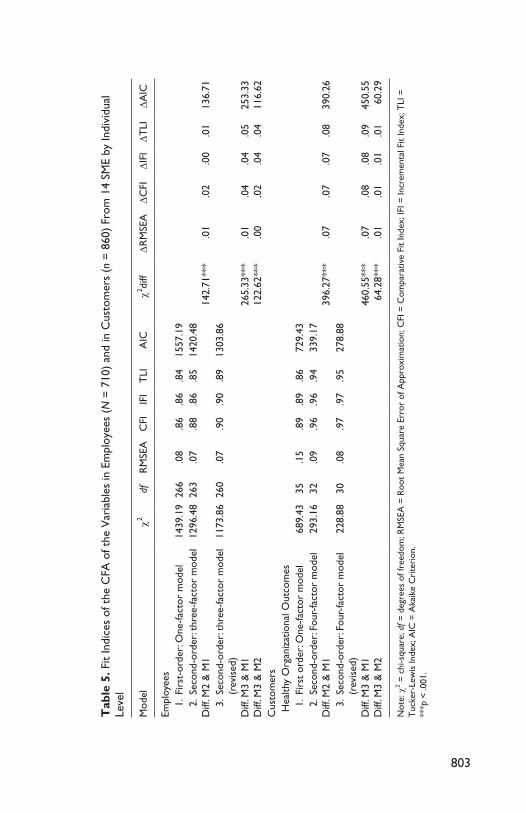
Questionnaire ValidationDescriptive Results. Tables 2 and 3 show the descriptive analyses and inter-nal consistencies (Cronbach’s α) of the study variables at individual level of analyses with SPSS 19.0. As expected, the α values for all the variables meet the criterion of .70 (Nunnally & Bernstein, 1994) and variables correlate with each other positively and significantly, ranging from r = .10, p < .01 to r = .79, p < .001 for employees,2 and from r = .57, p < .01. to r = .81, p < .01 for custom-ers. The results of Harman’s single factor test (cf. Podsakoff, MacKenzie, Lee, & Podsakoff, 2003) for employees and customers revealed that common method bias was not a problem because no single factor accounted for the majority of the variance (see Table 4).Confirmatory Factor Analysis3. Table 5 shows the results of CFA4 (Costello & Osborne, 2005; Pérez-Gil, Chacón, & Moreno, 2000) by AMOS 19.0, to determine the factorial structure of dimensions in employees and customers of 14 SMEs computed at the individual level of analyses. The second-order CFA on employees with three pairs of correlated errors indicates that, com-pared to the one-factor model, Delta χ2(6) = 265.33, p < .001, and the original three-factor model, Delta χ2(3) = 122.62, p < .001, the model which best fits the data is the revised three-factor model. This model is composed of three second-order latent and correlated factors: (a) HORP (i.e., task resources,
802 Group & Organization Management 37(6)
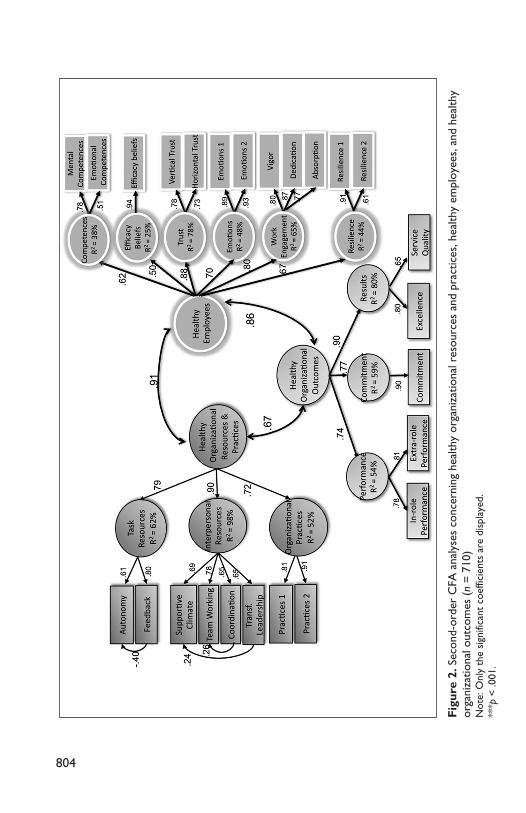
interpersonal resources, and organizational strategies by constraining three pair of errors5) with first- and second-factor weight values ranging from .61 to .91 and from .72 to .90, respectively; (b) healthy employees, distributed in competences, efficacy beliefs, trust, positive emotions, work engagement, and resilience with first- and second-factor weight values ranging from .51 to .94 and from .50 to .88, respectively; and (c) healthy organizational outcomes distributed in performance, organizational commitment, and results with sig-nificant first- and second-factor weight values ranging from .65 to .90, and from .74 to .90, respectively (see Figure 2).
The second-order CFA on customers with two pairs of correlated errors indicates that, compared to the one-factor model, Delta χ2(5) = 460.55, p < .001, and the original four-factor model, Delta χ2(2) = 64.28, p < .001, the model which best fits the data is the four-factor model revised. Results show (a) employee excellent job performance are distributed in four indicators by constraining one pair of errors (Excellence 1-Excellence 2)6 with factor weights values range from .64 to .88; (b) customer empathy is distributed in three indicators by constraining one pair of errors (Empathy 1-Empathy 2)7 with factor weight values range from .82 to .84; (c) customer loyalty is dis-tributed in two indicators with factor weight of .82 and .83, and (d) satisfac-tion is composed by one indicator with factor weight of .95. Finally, second-factor weight values ranged from .91 to .96 (see Table 5).
Table 4. Fit Indices of Harman’s Single Factor Test in Employees (n = 710) and Customers (n = 860)
Model χ2 df RMSEA CFI IFI TLI AIC
Employees 1. Healthy organizational
resources and practices (HORP)
7566.07 702 .12 .58 .58 .56 7722.07
2. Healthy employees 9588.37 1035 .11 .51 .51 .48 9774.37 3. Healthy organizational
outcomes2496.34 135 .15 .65 .65 .60 2568.34
Customers 1. Healthy organizational
outcomes689.43 35 .15 .89 .89 .86 729.43
Note: χ2 = chi-square; df = degrees of freedom; RMSEA = Root Mean Square Error of Approximation; CFI = Comparative Fit Index; IFI = Incremental Fit Index; TLI = Tucker-Lewis Index; AIC = Akaike Criterion.
803
Tab
le 5
. Fit
Indi
ces
of t
he C
FA o
f the
Var
iabl
es in
Em
ploy
ees
(N =
710
) an
d in
Cus
tom
ers
(n =
860
) Fr
om 1
4 SM
E by
Indi
vidu
al
Leve
l
Mod
elχ2
dfR
MSE
AC
FIIF
IT
LIA
ICχ2 di
ffΔR
MSE
AΔC
FIΔI
FIΔT
LIΔA
IC
Empl
oyee
s
1.
Fir
st-o
rder
: One
-fact
or m
odel
1439
.19
266
.08
.86
.86
.84
1557
.19
2. S
econ
d-or
der:
thre
e-fa
ctor
mod
elD
iff. M
2 &
M1
1296
.48
263
.07
.88
.86
.85
1420
.48
142.
71**
*.0
1.0
2.0
0.0
113
6.71
3.
Sec
ond-
orde
r: th
ree-
fact
or m
odel
(r
evis
ed)
Diff
. M3
& M
1D
iff. M
3 &
M2
1173
.86
260
.07
.90
.90
.89
1303
.86
265.
33**
*12
2.62
***
.01
.00
.04
.02
.04
.04
.05
.04
253.
3311
6.62
Cus
tom
ers
Hea
lthy
Org
aniz
atio
nal O
utco
mes
1.
Fir
st o
rder
: One
-fact
or m
odel
689.
4335
.15
.89
.89
.86
729.
43
2.
Sec
ond-
orde
r: Fo
ur-fa
ctor
mod
elD
iff. M
2 &
M1
293.
1632
.09
.96
.96
.94
339.
1739
6.27
***
.07
.07
.07
.08
390.
26
3. S
econ
d-or
der:
Four
-fact
or m
odel
(r
evis
ed)
Diff
. M3
& M
1D
iff. M
3 &
M2
228.
8830
.08
.97
.97
.95
278.
88
460.
55**
*64
.28*
**.0
7.0
1.0
8.0
1.0
8.0
1.0
9.0
145
0.55
60.2
9
Not
e: χ
2 = c
hi-s
quar
e; d
f = d
egre
es o
f fre
edom
; RM
SEA
= R
oot
Mea
n Sq
uare
Err
or o
f App
roxi
mat
ion;
CFI
= C
ompa
rativ
e Fi
t In
dex;
IFI =
Incr
emen
tal F
it In
dex;
TLI
=
Tuc
ker-
Lew
is In
dex;
AIC
= A
kaik
e C
rite
rion
.**
*p <
.001
.
804
Fig
ure
2. S
econ
d-or
der
CFA
ana
lyse
s co
ncer
ning
hea
lthy
orga
niza
tiona
l res
ourc
es a
nd p
ract
ices
, hea
lthy
empl
oyee
s, a
nd h
ealth
y or
gani
zatio
nal o
utco
mes
(n
= 7
10)
Not
e: O
nly
the
sign
ifica
nt c
oeffi
cien
ts a
re d
ispl
ayed
.**
*p <
.001
.
Salanova et al. 805
Our data give evidence for reliability and convergent validity for latent variables since (a) Composite Reliability (CR) and Analyses of Variance Extracted (AVE) are higher than 0.7 and 0.5, respectively, for all second latent factors for employees (CR ranges from .846 to .852; AVE ranges from .500 to .651) and customers (CR ranges from .816 to 1.00; AVE ranges from .632 to .902). Furthermore, all factor loadings for employees and customers are highly significant since the regression weights are significantly different from zero at the .001 level (two-tailed). Results also show evidence for the discriminant validity in second latent factors for employees and for custom-ers (100%). Thus the squared correlations of any pair of latent variables (ranged from .30 to .50 for employees and from .32 to .65 for customers) were lower than the AVEs (ranged from .55 to.71 for employees and from .57 to .81 for customers; Fornell & Larcker, 1981).
Study 2: Testing Hypotheses at the Team and Organizational Levels of AnalysisTo test the theoretical model, scales for employees and customers were aggregated at the work-unit (n = 303) and at the organization (n = 43) levels, respectively (e.g., Bliese, 2000). Results show a mean ICC
1 of .13 (ranging
from .06 for collective efficacy to .24 for transformational leadership) for employees and of .10 (ranging from .06 for customer satisfaction to .08 for excellent job performance). Also, a one-way ANOVA supports the validity of aggregation: (a) HORP, and healthy employees, mean = 1.75, from 1.18 for team efficacy, p < .05, to 2.59 for transformation leadership, p < .001, among employees; and (b) healthy organizational outcomes, mean = 5.21, from 3.80 for customer loyalty to 5.96 for customer satisfaction and excel-lent job performance, p < .001, among customers. In conclusion, overall aggregation results indicated within-group/organization agreement and between-teams/organizations discrimination.
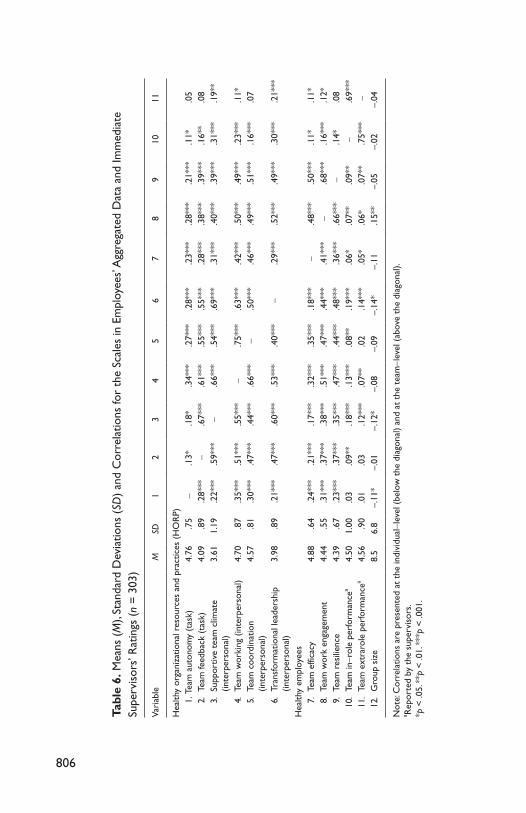
Table 6 shows the descriptive analyses for the scales in employees’ aggre-gated data at work-unit level (HORP as well as healthy employees) and immediate supervisors’ ratings (team in-role and extrarole performance). In accordance with previous CFA we computed transformational leadership and work engagement as composite scales (cf. Schaufeli, Bakker, & Salanova, 2006). Only the scales referring to the team (not to the organization) were considered in the SEM analyses. The patterns of correlations are as expected (see Table 6)
Table 7 shows the results of the SEM analyses8 to test Hypothesis 2 using the within-work-unit level by the aggregated database from employees’ and
806
Tabl
e 6.
Mea
ns (
M),
Stan
dard
Dev
iatio
ns (
SD)
and
Cor
rela
tions
for
the
Scal
es in
Em
ploy
ees’
Agg
rega
ted
Dat
a an
d Im
med
iate
Su
perv
isor
s’ R
atin
gs (
n =
303
)
Vari
able
MSD
12
34
56
78
910
11
Hea
lthy
orga
niza
tiona
l res
ourc
es a
nd p
ract
ices
(H
OR
P)
1. T
eam
aut
onom
y (t
ask)
4.76
.75
-.1
3*.1
8*.3
4***
.27*
**.2
8***
.23*
**.2
8***
.21*
**.1
1*.0
5
2. Te
am fe
edba
ck (
task
)4.
09.8
9.2
8***
-.6
7***
.61*
**.5
5***
.55*
**.2
8***
.38*
**.3
9***
.16*
*.0
8
3. Su
ppor
tive
team
clim
ate
(inte
rper
sona
l)3.
611.
19.2
2***
.59*
**-
.66*
**.5
4***
.69*
**.3
1***
.40*
**.3
9***
.31*
**.1
9**
4. Te
am w
orki
ng (
inte
rper
sona
l)4.
70.8
7.3
5***
.51*
**.5
5***
-.7
5***
.63*
**.4
2***
.50*
**.4
9***
.23*
**.1
1*
5. Te
am c
oord
inat
ion
(inte
rper
sona
l)4.
57.8
1.3
0***
.47*
**.4
4***
.66*
**-
.50*
**.4
6***
.49*
**.5
1***
.16*
**.0
7
6. Tr
ansf
orm
atio
nal l
eade
rshi
p (in
terp
erso
nal)
3.98
.89
.21*
**.4
7***
.60*
**.5
3***
.40*
**-
.29*
**.5
2***
.49*
**.3
0***
.21*
**
Hea
lthy
empl
oyee
s
7. Te
am e
ffica
cy4.
88.6
4.2
4***
.21*
**.1
7***
.32*
**.3
5***
.18*
**-
.48*
**.5
0***
.11*
.11*
8. Te
am w
ork
enga
gem
ent
4.44
.55
.31*
**.3
7***
.38*
**.5
1***
.47*
**.4
4***
.41*
**-
.68*
**.1
6***
.12*
9. Te
am r
esili
ence
4.39
.67
.23*
**.3
7***
.35*
**.4
7***
.44*
**.4
8***
.36*
**.6
6***
-.1
4*.0
8
10. Te
am in-r
ole
perf
orm
ance
a4.
501.
00.0
3.0
9**
.18*
**.1
3***
.08*
*.1
9***
.06*
.07*
*.0
9**
-.6
9***
11. Te
am e
xtra
role
per
form
ance
a4.
56.9
0.0
1.0
3.1
2***
.07*
*.0
2.1
4***
.05*
.06*
.07*
*.7
5***
-
12. G
roup
siz
e8.
56.
8–.
11*
–.01
–.12
*–.
08–.
09–.
14*
–.11
.15*
*–.
05–.
02–.
04
Not
e: C
orre
latio
ns a
re p
rese
nted
at
the
indi
vidu
al-l
evel
(be
low
the
dia
gona
l) an
d at
the
tea
m-l
evel
(ab
ove
the
diag
onal
).a R
epor
ted
by t
he s
uper
viso
rs.
*p <
.05.
**p
< .0
1. *
**p
< .0
01.
Salanova et al. 807
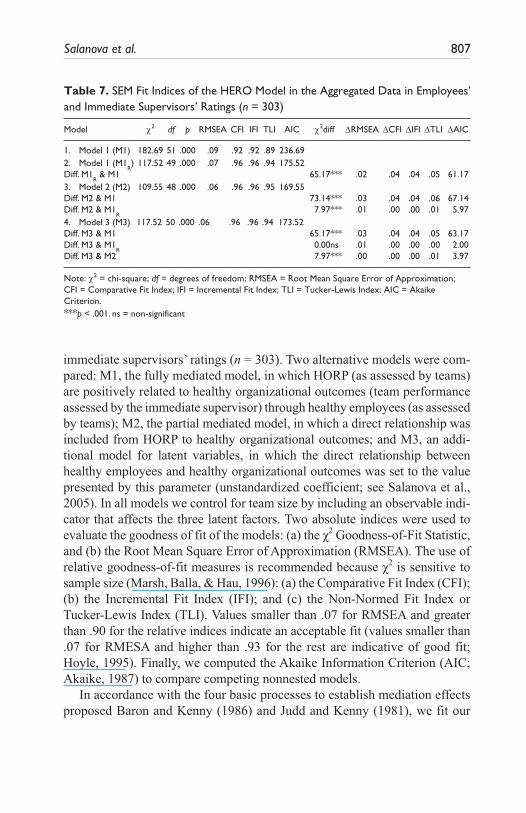
immediate supervisors’ ratings (n = 303). Two alternative models were com-pared: M1, the fully mediated model, in which HORP (as assessed by teams) are positively related to healthy organizational outcomes (team performance assessed by the immediate supervisor) through healthy employees (as assessed by teams); M2, the partial mediated model, in which a direct relationship was included from HORP to healthy organizational outcomes; and M3, an addi-tional model for latent variables, in which the direct relationship between healthy employees and healthy organizational outcomes was set to the value presented by this parameter (unstandardized coefficient; see Salanova et al., 2005). In all models we control for team size by including an observable indi-cator that affects the three latent factors. Two absolute indices were used to evaluate the goodness of fit of the models: (a) the χ2 Goodness-of-Fit Statistic, and (b) the Root Mean Square Error of Approximation (RMSEA). The use of relative goodness-of-fit measures is recommended because χ2 is sensitive to sample size (Marsh, Balla, & Hau, 1996): (a) the Comparative Fit Index (CFI); (b) the Incremental Fit Index (IFI); and (c) the Non-Normed Fit Index or Tucker-Lewis Index (TLI). Values smaller than .07 for RMSEA and greater than .90 for the relative indices indicate an acceptable fit (values smaller than .07 for RMESA and higher than .93 for the rest are indicative of good fit; Hoyle, 1995). Finally, we computed the Akaike Information Criterion (AIC; Akaike, 1987) to compare competing nonnested models.
In accordance with the four basic processes to establish mediation effects proposed Baron and Kenny (1986) and Judd and Kenny (1981), we fit our
Table 7. SEM Fit Indices of the HERO Model in the Aggregated Data in Employees’ and Immediate Supervisors’ Ratings (n = 303)
Model χ2 df p RMSEA CFI IFI TLI AIC χ2diff ΔRMSEA ΔCFI ΔIFI ΔTLI ΔAIC
1. Model 1 (M1) 182.69 51 .000 .09 .92 .92 .89 236.69 2. Model 1 (M1
R)
Diff. M1R & M1
117.52 49 .000 .07 .96 .96 .94 175.5265.17*** .02 .04 .04 .05 61.17
3. Model 2 (M2)Diff. M2 & M1Diff. M2 & M1
R
109.55 48 .000 .06 .96 .96 .95 169.5573.14***7.97***
.03
.01.04.00
.04
.00.06.01
67.145.97
4. Model 3 (M3)Diff. M3 & M1Diff. M3 & M1
RDiff. M3 & M2
117.52 50 .000 .06 .96 .96 .94 173.5265.17***0.00ns7.97***
.03
.01
.00
.04
.00
.00
.04
.00
.00
.05
.00
.01
63.172.003.97
Note: χ2 = chi-square; df = degrees of freedom; RMSEA = Root Mean Square Error of Approximation; CFI = Comparative Fit Index; IFI = Incremental Fit Index; TLI = Tucker-Lewis Index; AIC = Akaike Criterion.***p < .001. ns = non-significant
808 Group & Organization Management 37(6)
proposed fully mediated model (M1)9 to the data by controlling for team size. Results indicate that our M1 fits the data reasonably well. A review of the modification indices reveals that this model could be improved by including two pair of correlated errors,10 Delta χ2(2) = 65.17, p < .001, thus giving rise to the so-called M1 revised (M1
R) model. Furthermore, chi-square difference
tests between M1R and the M2 (the Partial Mediation Model)11 also shows a
significant difference between both models, Delta χ2(1) = 7.97, p < .001. Concerning the mediation process, the conditions by Baron and Kenny (1986) were met: (a) HORP are positive and significantly related to supervi-sor’s team performance perception, β = .27, p < .001; (b) healthy teams are positive and significantly related to supervisor’s team performance, β = .18, p < .01; but (c) the relationship between HORP and team performance became significant, β = .09, p < .01 when it is controlled by the effect of healthy employees and (d) the relationship among healthy teams and healthy organi-zational outcomes became also nonsignificant when it is controlled by HORP, β = –.02, p = .82. So far, healthy teams fully mediate between HORP and team performance as assessed by the supervisors.
An additional model (M3) was fit to the data to get more support to con-sider the full mediation of healthy teams between HORP and team perfor-mance. For this, the resulting unstandardized coefficient for the relationship between healthy employees and healthy organizational outcomes in M1
R was
fixed to the value presented by this parameter (unstandardized coefficient) of the M1
R. All fit indices met the criteria, and significant differences were
obtained between M3 and M1, Delta χ2(1) = 65.17, p < .001, and M2, Delta χ2(2) = 7.97, p < .001, which give evidence that the influence of HORP on team in-role and extrarole performance was fully mediated by healthy teams.
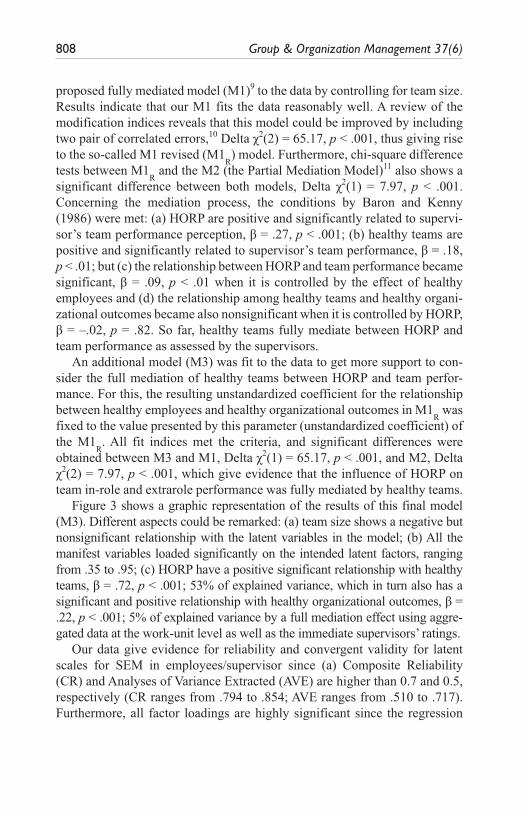
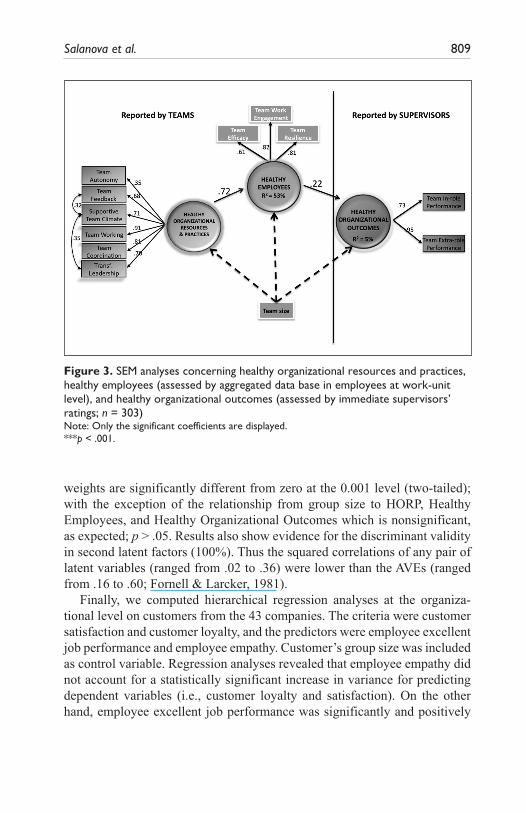
Figure 3 shows a graphic representation of the results of this final model (M3). Different aspects could be remarked: (a) team size shows a negative but nonsignificant relationship with the latent variables in the model; (b) All the manifest variables loaded significantly on the intended latent factors, ranging from .35 to .95; (c) HORP have a positive significant relationship with healthy teams, β = .72, p < .001; 53% of explained variance, which in turn also has a significant and positive relationship with healthy organizational outcomes, β = .22, p < .001; 5% of explained variance by a full mediation effect using aggre-gated data at the work-unit level as well as the immediate supervisors’ ratings.
Our data give evidence for reliability and convergent validity for latent scales for SEM in employees/supervisor since (a) Composite Reliability (CR) and Analyses of Variance Extracted (AVE) are higher than 0.7 and 0.5, respectively (CR ranges from .794 to .854; AVE ranges from .510 to .717). Furthermore, all factor loadings are highly significant since the regression
Salanova et al. 809
weights are significantly different from zero at the 0.001 level (two-tailed); with the exception of the relationship from group size to HORP, Healthy Employees, and Healthy Organizational Outcomes which is nonsignificant, as expected; p > .05. Results also show evidence for the discriminant validity in second latent factors (100%). Thus the squared correlations of any pair of latent variables (ranged from .02 to .36) were lower than the AVEs (ranged from .16 to .60; Fornell & Larcker, 1981).
Finally, we computed hierarchical regression analyses at the organiza-tional level on customers from the 43 companies. The criteria were customer satisfaction and customer loyalty, and the predictors were employee excellent job performance and employee empathy. Customer’s group size was included as control variable. Regression analyses revealed that employee empathy did not account for a statistically significant increase in variance for predicting dependent variables (i.e., customer loyalty and satisfaction). On the other hand, employee excellent job performance was significantly and positively
Figure 3. SEM analyses concerning healthy organizational resources and practices, healthy employees (assessed by aggregated data base in employees at work-unit level), and healthy organizational outcomes (assessed by immediate supervisors’ ratings; n = 303)Note: Only the significant coefficients are displayed.***p < .001.

810 Group & Organization Management 37(6)
related to customer loyalty, β = .61, p < .05, and customer satisfaction, β = .50, p < .05. In sum, results showed that employee excellent job performance is a good predictor of customer loyalty and customer satisfaction. Customer’s group size had not significantly associated with either loyalty or customer satisfaction.
DiscussionThe current study contributes to our understanding of the systematic and interactive relationships among the three main dimensions of a HERO, that is, (a) HORP that influence the development of (b) healthy employees and (c) healthy organizational outcomes. To capture the essence of those organi-zations, and to overcome previous methodological limitations, a methodol-ogy to test HERO was proposed that took into account different points of view of each organization as different key sources of information, that is, CEOs, employees working in groups, immediate supervisors, and customers. To collect these data, different measures were used for qualitative and quan-titative evaluations (interviews and questionnaires), which allowed the per-ceptions of CEOs, employees, immediate supervisors, and customers to be tested using data aggregated at the work-unit and organizational levels of analysis and the supervisors’ ratings.
The current research offers evidence in favor of (a) the convergent and discriminant validity of the qualitative and quantitative measures developed to test the different scales included in the HERO Model by intercoder agree-ment on the CEOs’ interviews and second-order CFA for scales on employees and customers, respectively (Hypothesis 1); (b) the specific relationship among the three components of the HERO Model, that is, HORP, healthy employees (teams), and healthy organizational outcomes computed by SEM in the data set about employees aggregated at the work-unit level and from immediate supervisors’ ratings (Hypotheses 2a, 2b, 2c), and (c) the specific relationship among service quality perceptions by customers computed by regression analyses in the data set aggregated at the organizational level on customers (Hypotheses 3a, 3b).
About the Construct Validity and Psychometric Properties of the HERO Model’s ScalesOur study shows that healthy organizational practices have a good level of intercoder agreement (90%) and the best-scored practices had mainly to do with classical aspects of Organization Management, such as traditional HR

Salanova et al. 811
management strategies, health and safety, nonsocial exclusion, environmental impact, and good communication practices. However, some more innovative healthy organizational practices, such as equal opportunities or involvement in the local community, are still underdeveloped. These results are not unex-pected, considering the sample in which the study was performed. Our organi-zations were mainly SMEs and such companies do not usually have a large number of organizational resources available to be allocated to the Human Resources Management area, so they devote them to the traditional aspects of Organization Management, most of them complying with a compulsory local or general law. Still on the subject of healthy organizational practices, it is interesting to note that both CEOs and employees agree on the existence of healthy organizational practices within each SME. This is one of the strong points about the validity of the two self-constructed tools. Finally, healthy organizational outcome variables show a high rate of intercoder agreement as regards the fact that CEOs consider that their organizations obtain a below-average score on healthy organizational outcomes (excellence and benefits to their community). It seems that more work is needed to make them aware of how important these healthy organizational outcomes are to their companies.
Focusing on the validation of the questionnaires on samples of employees and customers, the different second-order CFA on HORP, healthy employees, and healthy organizational outcomes confirm their psychometric properties in both samples. Specifically, Cronbach’s α coefficient supported the internal validity and the reliability of the instruments in employees and customers. Construct validity was also supported by the second-order CFA tested in employees and customers, respectively. Particularly in employees, second-order CFA showed evidence in favor of the expected structure of HEROs, which should be measured by three potentially core dimensions: (a) HORP, which involved the scales of task and interpersonal resources as well as organi-zational practices; (b) healthy employees, tested by measuring different scales which refer to team competences, team efficacy beliefs, team trust, team posi-tive emotions, team work engagement, and team resilience, and (c) healthy organizational outcomes, measured by job performance, organizational com-mitment, and healthy results. Based on customers, CFA again showed that an important dimension of a HERO, that is, service quality, as assessed by their customers, is composed of four main dimensions: customers’ perception of employee excellent job performance, and employee empathy, customer loy-alty, and customer satisfaction. All in all, previous results support the value of the employees’ and customers’ questionnaires as an effective way to mea-sure HEROs.

812 Group & Organization Management 37(6)
About the Structural Relationships of the HERO Model (at the Team Level)
Regarding Hypothesis 2, results of SEM with data aggregated at the work-unit level of analysis on employees’ and immediate supervisors’ ratings revealed that, as expected, (a) the three elements which compose the HERO Model, that is, HORP, healthy employees/teams, and healthy organizational outcomes, were positively related (Hypotheses 2a and 2b), and (b) healthy organizational practices and resources were significantly and positively related to healthy organizational outcomes through healthy employees/teams, thereby giving evidence supporting Hypothesis 2c.
These results are in line with previous research, in which those relationships were confirmed in a fragmented and disconnected way (i.e., not considering all the “collective” variables together in the same model). More specifically, results extend previous research conducted at the individual level of analysis, in the sense that HORP are positively related to employee well-being and healthy organizational outcomes (e.g., job performance; Halbesleben, 2010; Lyubomirsky et al., 2005; Salanova et al., 2005; for example).
However, in the present study we go one step further, since the relationships among the variables in the HERO Model have all been tested together and at the team level and taking into account the immediate supervisors’ ratings on team performance following the prescriptions of focusing on a more collective level of analysis (Wilson et al., 2004). It seems that shared beliefs about healthy employee/team variables (team efficacy, team work engagement, team resil-ience) and, consequently, healthy organizational outcomes (team in- and extrarole performance) are better only when groups share beliefs that compa-nies offer task and interpersonal resources and are implementing healthy team practices. Organizations must invest in organizational resources in order that work-units feel better since this is positively related to a better team perfor-mance. Overall, results support our Hypotheses 2 (a, b, c) and we can say that one of the research questions of the present study has been achieved.
Regarding Hypothesis 3 findings showed that (a) employee excellent job performance significantly predicted customer loyalty and customer satisfac-tion; that is, the better excellent job performance among employees was, the more customer loyalty and customer satisfaction there was, thus giving evi-dence to support Hypothesis 3a; (b) employees’ empathy was not significantly related to customer loyalty and to customer satisfaction, thereby not providing evidence in favor of Hypothesis 3b. These results are partially consistent with previous findings (Salanova et al., 2005). All in all, results among customers show evidence of the influence of customers’ perceptions of employee
Salanova et al. 813
behaviors (excellent performance) on customer loyalty, which is crucial for companies seeking to remain competitive and obtain profits. On the other hand, customers’ perceptions of employee behaviors (excellent performance) affect customers’ satisfaction, which is considered to be a service quality indicator—something that is very relevant for companies to be able to survive and prosper in a context of continuing social and economic change. Results concerning customers at the organizational level of analysis are a step further in the study of HEROs since not only is the internal point of view (from CEOs and employ-ees) taken into account to determine the healthiest and most resilient level in the organization but also the external view from customers’ perceptions.
Theoretical and Practical ImplicationsAt the theoretical level, the present findings extend the body of knowledge about HEROs. First, the theoretical heuristic model of HERO has been tested empirically through a comprehensive model that includes different key meth-odologies of collecting data (i.e., interviews and questionnaires) and different key informants to study positive organizations based on different perception of work-units (i.e., employees), immediate supervisors’ ratings on work-units, and the organization (from the customers’ and CEOs’ points of views) as a whole. This methodology has proved to be robust and valid using different analyses at different levels (i.e., work-unit and organizational measures), mul-tiple informants, and assessing multiple areas of a HERO (i.e., healthy orga-nizational practices and resources, healthy employees, and healthy organizational outcomes). Overall, the research gaps concerning healthy and resilient models highlighted by previous research (Wilson et al., 2004) have been filled in the present study since we have provided evidence in favor of a heuristic and theoretical model that integrates results on HEROs. Finally, this model is grounded not only on research about job stress but also on HRM, organizational behavior, and positive occupational health psychology at collective levels of analysis as well as on combining qualitative and quan-titative measures of the components of HEROs.
From a practical perspective, our findings facilitate a robust and validated methodology not only for measuring HEROs but also for identifying them through validated indicators using different sources of information from the organization. Moreover, our findings also highlight the relevance of improv-ing managerial practices and resources within SMEs since it is important not only to generate positive work environments but also to enhance healthy employees and teams as well as to understand better some healthy conse-quences for organizations, customers, and society in general.

814 Group & Organization Management 37(6)
It is also very important to note that not only researchers but also practitio-ners could base their practices on the use of these instruments to assess and promote HEROs. They could also use the Model as a valid reference for both assessment and intervention in organizations to increase and develop their lev-els of health and resilience among companies over time. The same methodol-ogy could be used in other settings such as other countries and occupational sectors to classify HEROs according to a more general reference, either by using different qualitative and quantitative instruments (interviews and ques-tionnaires, respectively) or by asking different key informants to assess the company as a whole. In this sense, this multimethod approach allows organi-zations to be classified from the healthiest, most resilient organizations to the least healthy and resilient ones, according to different indicators/criteria (i.e., HORP, healthy employees, and healthy organizational outcomes) obtained from different key informants.
Limitations and Further ResearchSome limitations to our study should be noted and discussed. The first one is that some data were obtained by self-report measures without any external criteria to validate the measures. However, in the case of the interview, valid-ity of the HORP and healthy organizational outcomes were obtained by trian-gulation with the theory (HERO Model). Moreover, in the case of the questionnaires, not only individual but also aggregated shared perceptions of teams and organizations (i.e., intersubjectivity) have been considered for agreement in different scales and measures. Furthermore, in-role and extrarole performance were assessed by considering the immediate supervi-sors’ ratings on the work-unit. The use of these aggregated data at the team and organizational levels of analysis and the use of the immediate supervi-sors’ ratings on the team could minimize the method common variance bias (which has been shown not to be a problem in our study).
The second limitation is its cross-sectional nature, which precludes any sound conclusion about the causality of the variables that were studied. However, as expected, an important relationship among the variables in the model has been obtained. It would be interesting to test the HERO Model using multiple organizations (not only SMEs) in longitudinal studies to explore the existence of positive gain spirals over time across HORP, healthy employees, and healthy outcomes over time.
The third limitation is that it was not possible to compute multilevel analy-ses. Further analyses conducted by testing an intercept-only model using multilevel methodology (Hox, 2010) reveal that there is no great influence of
Salanova et al. 815
interorganizational variability on supervisors’ ratings for the dependent vari-ables. However, our study has other strengths such as performing the data analyses at the collective level (work-unit and organizational levels) as well as taking into account the perception of immediate supervisors’ rating on work-unit, as recommended recently by Whitman et al. (2010). Further anal-yses with a wider sample should be performed to confirm these findings using multilevel analyses to explore cross-level effects at the organization and team levels.
Final NoteHEROs should be a strategic priority for management in modern groups and organizations, and even more so in periods of economic crisis and turmoil, as in the current times. We have provided reliable and valid empirical and practical-based evidence for the development and validation of a HEROs Model that might help applied researchers and managers to offer a better service to CEOs, employees and teams, immediate supervisors and custom-ers, as well as citizens and society as a whole, from the innovation, improve-ment, and expansion of health at work.
Declaration of Conflicting Interests
The author(s) declared no potential conflicts of interest with respect to the research, authorship, and/or publication of this article.
Funding
The author(s) disclosed receipt of the following financial support for the research, authorship, and/or publication of this article: This research was supported by Spanish Ministry of Economy and Competitiveness (PSI2011-22400).
Notes
1. Details about these procedures can be requested from the first author. 2. Due to the length of the correlation matrix for employees, it has not been included
in the article, but available from the first author on request. 3. Our data for employees and customers reveal that the sample is accurate for com-
puting CFA (MacCallum, Widaman, Zhang, & Hong, 1999; Preacher & MacCal-lum, 2002).
4. To avoid unidentified problems, the variance of feedback, efficacy beliefs and commitment for employees, and employees’ satisfaction for customers were constrained using the formula (1-alpha) * variance2 (Stephenson & Holbert, 2003).
816 Group & Organization Management 37(6)
5. Autonomy-feedback (too much feedback could be related to excessive task clar-ity and lack of perceived control); supportive climate-transformational leadership (both scales refer to supportive social atmosphere); team working-coordination (both are related to working together in teams).
6. Excellence 1-Excellence 2: both items refer to the feelings of customers about the employees’ excellent performance makes feel like a special people.
7. Empathy1-Empathy 2: both items concern the employees’ ability to perceive and understand the needs of customers.
8. Sample is accurate for computing SEM analyses. Results show that for a power of .80, df = 50, we need a sample of 214 observations to carry out the SEM (we have 303 observations/teams; MacCallum, Browne, & Sugawara, 1996). Further ICCs’ (intercept-only model using multilevel methodology) conducted on supervisors for the dependent variables were 0.08 for in-role as well as for extrarole performance. It concludes that there were no extreme differences (variance) between organizations that could be biasing the results (Hox, 2010).
9. To avoid unidentified problems, the variance of extrarole performance was con-strained using the formula (1-alpha) * variance2 (Stephenson & Holbert, 2003).
10. Correlated errors among team climate support with team feedback and team transformational leadership (all scales refer to supportive social atmosphere).
11. To avoid unidentified problems, the variance of extrarole performance was con-strained using the formula (1-alpha) * variance2 (Stephenson & Holbert, 2003).
References
Akaike, H. (1987). Factor analysis and AIC. Psychometrika, 52, 317-332.Avey, J. B., Luthans, F., Smith, R. M., & Palmer, N. F. (2010). Impact of positive
psychological capital on employee well-being over time. Journal of Occupational Health Psychology, 15, 17-28.
Bakker, A. B., Demerouti, E., & Brummelhuis, L. (2012). Work engagement, perfor-mance, and active learning: The role of conscientiousness. Journal of Vocational Behavior, 80, 555-564.
Baron, R. M., & Kenny, D. A. (1986). The moderator–mediator variable distinction in social psychological research: Conceptual, strategic and statistical considerations. Journal of Personality and Social Psychology, 51, 1173-1182.
Bell, M. P., Quick, J. C., & Cycyota, C. S. (2002). Assessment and prevention of sexual harassment of employees: An applied guide to creating healthy organiza-tions. International Journal of Selection and Assessment, 10, 160-167.
Bennett, J. B., Aden, C. A., Broome, K., Mitchell, K., & Rigdon, W. D. (2010). Team resilience for young restaurant workers: Research-to-practice adaptation and assessment. Journal of Occupational Health Psychology, 15, 223-236.
Salanova et al. 817
Bliese, P. D. (2000). Within-group agreement, non-independence, and reliability: Implications for data aggregation and analysis. In K. J. Klein & S. W. J. Kozlowski (Eds.), Multilevel theory, research, and methods in organizations (pp. 349-381). San Francisco, CA: Jossey-Bass.
Christian, M. S., Garza, A. S., & Slaughter, J. E. (2011). Work engagement: A quanti-tative review and test of its relations with task and contextual. Personnel Psychol-ogy, 64, 89-136.
Cook, J., & Wall, T. (1980). New work attitude measures of trust, organisational com-mitment and personal need non-fulfillment. Journal of Occupational Psychology, 53, 39-52.
Cooper, C. L., & Cartwright, S. (1994). Healthy mind; Healthy organization-A proac-tive approach to occupational stress. Human Relations, 47, 455-471.
Corbett, D. (2004). Excellence in Canada: Healthy organizations—Achieve results by acting responsibly. Journal of Business Ethics, 55, 125-133.
Costello, A. B., & Osborne, J. W. (2005). Best practices in exploratory factor analysis: Four recommendations for getting the most from your analysis. Practical Assess-ment, Research & Evaluation, 10. Retrieved from http://pareonline.net/getvn.asp?v=10&n=7
DeJoy, D. M., Wilson, M. G., Vandenberg, R. J., McGrath-Higgins, A. L., & Griffin-Blake, C. S. (2010). Assessing the impact of healthy work organization interven-tion. Journal of Occupational and Organizational Psychology, 83, 139-165.
Demerouti, E., Bakker, A. B., Nachreiner, F., & Schaufeli, W. B. (2001). The job demands-resources model of burnout. Journal of Applied Psychology, 86, 499-512.
Elliott, D., & Macpherson, A. (2010). Policy and practice: Recursive learning from crisis. Group & Organization Management, 35, 572-605.
EQUAL European Project. (2004). Retrieved from http://ec.europa.eu/employment _social/equal/index_en.cfm
Evanschitzky, H., Groening, C., Mittal, V., & Wunderlich, M. 2011. How employer and employee satisfaction affect customer satisfaction: An application to fran-chise services. Journal of Service Research, 14, 136-148.
Feldman, D. C. (1988). Managing careers in organization. Gleenview, IL: Scott, Foresman.
Fornell, C., & Larcker, D. F. (1981). Evaluating structural equation models with unob-servable variables and measurement error. Journal of Marketing Research, 18, 39-50.
Gilbreath, B. (2012). Educating managers to create healthy workplaces. Journal of Management Education, 36, 166-190.
Goodman, S. A., & Svyantek, D. (1999). Person-organization fit and contextual per-formance: Do shared values matter. Journal of Vocational Behavior, 55, 254-275.
818 Group & Organization Management 37(6)
Gracia, E., Cifre, C., & Grau, R. (2010). Service quality: The key role of service climate and service behavior of boundary employee units. Group & Organization Management, 35, 276-298.
Gracia, E., Salanova, M., Grau, R., & Cifre, E. (2012, January). How to enhance service quality through organizational facilitators, collective work engagement, and relational service competence. European Journal of Work and Organizational Psychology, 1-26. doi:10.1080/1359432X.2011.628793
Gruman, J., & Saks, A. (2011). Performance management and employee engagement. Human Resource Management Review, 21, 123-136.
Hackman, J. R., & Oldham, G. R. (1975). Development of the job diagnostic survey. Journal of Applied Psychology, 60, 159-170.
Halbesleben, J. R. B. (2010). A meta-analysis of work engagement: Relationships with burnout, demands, resources and consequences. In A. Bakker & M. Leiter (Eds.), Work engagement: Recent developments in theory and research (pp. 102-117). New York, NY: Psychology Press.
He, Y., Li, W., & Lai, K. K. (2012). Service climate, employee commitment and cus-tomer satisfaction. International Journal of Contemporary Hospitality Manage-ment, 23, 592-607.
Hobfoll, S. E. (2002). Social and psychological resources and adaptation. Review of General Psychology, 6, 307-324.
Hobfoll, S. E., Johnson, R. J., Ennis, N., & Jackson, A. P. (2003). Resource loss, resource gain, and emotional outcomes among inner city women. Journal of Per-sonality and Social Psychology, 84, 632-643.
Hox, J. (2010). Multilevel analyses: Techniques and applications. Mahwah, NJ: Lawrence Erlbaum.
Hoyle, R. H. (1995). The structural equation modeling approach: Basic concepts and fundamental issues. In R. H. Hoyle (Ed.), Structural equation modeling, Con-cepts, issues and applications (pp. 1-15). Thousand Oaks, CA: SAGE.
Huff, L., & Kelley, L. (2003). Levels of organizational trust in individualist versus collectivist societies: A seven-nation study. Organization Science, 14, 81-90.
Jackson, P. R., Wall, T. D., Martin, R., & Davis, K. (1993). New measures of job control, cognitive demand and production responsibility. Journal of Applied Psy-chology, 78, 753-762.
Judd, C. M., & Kenny, D. A. (1981). Process analysis: Estimating mediation in treat-ment evaluations. Evaluation Review, 5, 602-619.
Kunin, T. (1955). The construction of a new type of attitude measure. Personnel Psy-chology, 8, 65-67.
Lengnick-Hall, C. A., Beck, T. E., & Lengnick-Hall, M. L. (2011). Developing a capacity for organizational resilience through strategic human resource manage-ment. Human Resource Management Review, 21, 243-255.
Salanova et al. 819
Luthans, F., Avey, J. B., Avolio, B. J., & Peterson, S. J. (2010). The development and resulting performance impact of positive psychological capital. Human Resource Development Quarterly, 21, 41-67.
Lyubomirsky, S., King, L., & Diener, E. (2005). The benefits of frequent positive affect: Does happiness lead to success? Psychological Bulletin, 131, 803-855.
MacCallum, R. C., Browne, M. W., & Sugawara, H. M. (1996). Power analysis and determination of sample size for covariance structure modeling. Psychological Methods, 2, 130-149.
MacCallum, R. C., Widaman, K. F., Zhang, S., & Hong, S. (1999). Sample size in factor analysis. Psychological Methods, 4, 84-99.
Marsh, H. W., Balla, J. R., & Hau, K. T. (1996). An evaluation of Incremental Fit Indi-ces: A clarification of mathematical and empirical properties. In G. A. Marcoulides, & R. E. Schumacker (Eds.), Advanced structural equation modeling, issues and techniques (pp. 315-353). Mahwah, NJ: Lawrence Erlbaum.
Martínez-Tur, V., Ramos, J., Peiró, J. M., & Buades, E. (2001). Relationships among perceived justice, customers’ satisfaction, and behavioral intentions: The moder-ating role of gender. Psychological Reports, 88, 805-811.
McAllister, D. J. (1995). Affect and Cognition based trust as foundations for interper-sonal cooperation in organizations. Academy of Management Journal, 38, 24-59.
Netemeyer, R. G., Maxham, J., & Lichtenstein, D. (2010). Store manager attitudes and behaviors: Effects on store employees, customers, and store performance variables. Journal of Applied Psychology, 95, 530-545.
Nunnally, J. C., & Bernstein, I. H. (1994). Psychometric theory (3rd ed.). New York, NY: McGraw-Hill.
Parasuraman, A., Zeithaml, V., & Berry, L. L. (1988). SERVQUAL: A multiple-item scale for measuring consumer perceptions of service quality. Journal of Retailing, 64, 12-40.
Pedhazer, E. J., & Schmelkin, L. P. (1991). Measurement, design and analysis: An integrated approach. Hillsdale, NJ: Erlbaum.
Pérez-Gil, J. A., Chacón, S., & Moreno, R. (2000). Construct validity: The use of explor-atory-confirmatory factorial analyses to evidence validity. Psicothema, 12, 442-446.
Peterson, S. J., Luthans, F., Avolio, B. J., Walumbwa, F. O., & Zheng, Z. (2011). Psychological capital and employee performance: A latent growth modeling approach. Personnel Psychology, 64, 427-450.
Podsakoff, P. M., MacKenzie, S. M., Lee, J., & Podsakoff, N. P. (2003). Common method variance in behavioral research: A critical review of the literature and recommended remedies. Journal of Applied Psychology, 88, 879-903.
Preacher, K. J., & MacCallum, R. C. (2002). Exploratory factor analysis in behavior genetics research: Factor recovery with small sample sizes. Behavior Genetics, 32, 153-161.
820 Group & Organization Management 37(6)
Price, L. L., Arnould, E. J., & Tierney, P. (1995). Going to extremes: Managing service encounters and assessing provider performance. Journal of Marketing, 59, 83-97.
Rafferty, A. E., & Griffin, M. A. (2004). Dimensions of transformational leadership: Conceptual and empirical extensions. Leadership Quarterly, 15, 329-354.
Ryan, R. M., & Deci, E. L. (2000). Self-determination theory and the facilitation of intrinsic motivation, social development, and well-being. American Psychologist, 55, 68-78.
Salanova, M. (2008). Organizaciones saludables y desarrollo de recursos humanos [Healthy organizations and human resource development]. Estudios Financieros, 303, 179-214.
Salanova, M. (2009). Organizaciones saludables, organizaciones resilientes [Healthy orga-nizations, resilient organizations]. Gestión Práctica de Riesgos Laborales, 58, 18-23.
Salanova, M., Agut, S., & Peiro, J. M. (2005). Linking organizational facilitators and work engagement to extra-role performance and customer loyalty: The mediation of service climate. Journal of Applied Psychology, 90, 1217-27.
Salanova, M., Cifre, E., Llorens, S., Martínez, I. M., & Lorente, L. (2011). Psychoso-cial risks and positive factors among construction workers. In R. Burke, S. Clarke, & C. Cooper (Eds.), Occupational health and safety: Psychological and behav-ioral challenges (pp. 295-322). Surrey, UK: Gower.
Salanova, M., Llorens, S., Cifre, E., Martínez, I. M., & Schaufeli, W. B. (2003). Per-ceived collective efficacy, subjective well-being and task performance among electronic work groups: An experimental study. Small Group Research, 34, 43-73.
Schaufeli, W. B. (2012). Work engagement. What do we know and where do we go? Romanian Journal of Applied Psychology, 14, 3-10.
Schaufeli, W.B. & Bakker, A. (2004). Job demands, job resources, and their relation-ship with burnout and engagement: a multi-sample study. Journal of Organiza-tional Behavior, 25, 293-315.
Schaufeli, W. B., Bakker, A. B., & Salanova, M. (2006). The measurement of work engagement with a short questionnaire. Educational and Psychological Measure-ment, 66, 701-716.
Schneider, B., Ehrhart, M. G., Mayer, D. M., Saltz, J. L., & Niles-Jolly, K. (2005). Understanding organization-customer links in service settings. Academy of Man-agement Journal, 48, 1017-1032.
Schwab, D. P. (1980). Construct validity in organizational behavior. Research in Organizational Behavior, 2, 3-43.
Stemler, S. (2001). An overview of content analysis. Practical Assessment, Research & Evaluation, 7. Retrieved from http://PAREonline.net/getvn.asp?v=7&n=17
Stephenson, M. T., & Holbert, R. L. (2003). A Monte Carlo simulation of observable- versus latentvariable structural equation modeling techniques. Communication Research, 30, 332-354.
Salanova et al. 821
Tillement, S., Cholez, C., & Reverdy, T. (2009). Assessing organizational resilience: An interactionist approach. Management, 12, 230-265.
Torrente, P., Salanova, M., Llorens, S., & Schaufeli, W. B. (2012). Teams make it work: How team work engagement mediates between social resources and perfor-mance in teams. Psicothema, 24, 106-112.
Van Muijen, J. J., Kopman, P., De Witte, K., De Cock, G., Susanj, Z., Lemoine, F., & Turnipseed, D. (1999). Organizational culture: The FOCUS questionnaire. Euro-pean Journal of Work and Organizational Psychology, 8, 551-568.
Van Veldhoven, M., & Meijman, T. F. (1994). Measuring psychosocial workload by means of a questionnaire: Questionnaire on the experience and evaluation of work VBBA. Amsterdam, Netherlands: NIA.
Vermeeren, B., Kuipers, B., & Steijn, B. (2012). Two faces of the satisfaction mirror: A study of work environment, job satisfaction, and customer satisfaction in Dutch municipalities. Review of Public Personnel Administration, 31, 171-189.
Walumbwa, F. O., Luthans, F., Avey, J. B., & Oke, A. 2011. Authentically leading groups: The mediating role of collective psychological capital and trust. Journal of Organizational Behavior, 32, 4-24.
Wanous, J. P., Reichers, A. E., & Hudy, M. J. (1997). Overall job satisfaction: How good are single-item measures? Journal of Applied Psychology, 82, 247-252.
Warr, P. (1990). The measurement of well-being and other aspects of mental health. Journal of Occupational Psychology, 63, 193-210.
Weick, K. E. (1985). Systematic observational methods. In G. Lindzey & E. Aronson (Eds.), The handbook of social psychology bulletin (Vol. 1, pp. 567-634). Hillsdale, NJ: LEA.
Whitman, D. S., Van Rooy, D. L., & Viswesvaran, C. (2010). Satisfaction, citizenship behaviors, and performance in work units: A meta-analysis of collective construct relations. Personnel Psychology, 63, 41-81.
Wilson, M. G., DeJoy, D. M., Vanderberg, R. J., Richardson, H. A., & McGrath, A. L. (2004). Work characteristics and employee health and well-being: Test of a model of healthy work organization. Journal of Occupational and Organizational Psy-chology, 77, 565-588.
Wright, P. M., & McMahan, C. G. (1992). Theoretical perspectives for strategic human resource management. Journal of Management, 18, 295-320.
Wuensch, K. L. (2007). Inter-judge agreement. Retrieved from http://core.ecu.edu/psyc/wuenschk/docs30/InterRater.doc
Xanthopoulou, D., Bakker, A. B., Demerouti, E., & Schaufeli, W. B. (2009). Recipro-cal relationships between job resources, personal resources, and work engage-ment. Journal of Vocational Behavior, 74, 235-244.
822 Group & Organization Management 37(6)
Bios
Marisa Salanova is full professor of social psychology, specialized in Positive Organizational Psychology at Universitat Jaume I, Castellón, Spain. She is director of the WoNT (Work & Organization Network) Research Team at that University (http://www.wont.uji.es). Her research interests are positive organizational psychol-ogy, happiness at work, work and team engagement, positive emotions, self-efficacy and healthy and resilient organizations.
Susana Llorens is associate professor of social psychology at Universitat Jaume I, Castellón, Spain. Her research interests are positive organizational psychology, engagement, justice, emotional intelligence and confidence. She is research coordina-tor of WoNT Research Team at that University (http://www.wont.uji.es).
Eva Cifre is associate professor of social psychology at Universitat Jaume I, Castellón, Spain. Her research interests are gender and emotions. She is director of MPAGER (Multidimensional Psychological Approach to Gender and Emotion Regu-lation at that University (http://www.uji.es/CA/ocit/e@/05304/?codi=262).
Isabel M. Martinez is associate professor of social psychology at Universitat Jaume I, Castellón, Spain. Her research interests are group dynamics, occupational health, and coping. She is consultancy coordinator of WoNT Research Team at that University (http://www.wont.uji.es).
The author has requested enhancement of the downloaded file. All in-text references underlined in blue are linked to publications on ResearchGate.The author has requested enhancement of the downloaded file. All in-text references underlined in blue are linked to publications on ResearchGate.
Copyright © 2022 FDOKUMEN